GROUP ANNUAL RESULTS - Telkom SA SOC LIMITED Group Annual Results for the year ended 31 March 2014 1...
60
TELKOM SA SOC LIMITED Group Annual Results for the year ended 31 March 2014 I GROUP ANNUAL RESULTS FOR THE YEAR ENDED 31 MARCH 2014 2014 The information contained in this document is also available on Telkom’s investor relations website www.telkom.co.za/ir
Transcript of GROUP ANNUAL RESULTS - Telkom SA SOC LIMITED Group Annual Results for the year ended 31 March 2014 1...

TELKOM SA SOC LIMITED Group Annual Results for the year ended 31 March 2014
I
GROUP ANNUAL RESULTS
FOR THE YEAR ENDED 31 MARCH 2014
2014The information contained in this document is also available on Telkom’s investor relations website www.telkom.co.za/ir
GROUP ANNUAL RESULTS PRESENTATION
O1 Overview
O2 Financial overview
O3 Prospects
O4 Conclusion
05 Questions and answers
Telkom SA SOC Limited (Registration number 1991/005476/30)JSE share code: TKG ISIN: ZAE000044897
Group Company SecretaryXoliswa Mpongoshe
Transfer secretariesComputershare Investor Services (Proprietary) LimitedPO Box 61051, Marshalltown, 2107
SponsorThe Standard Bank of South Africa LimitedStandard Bank Centre5 Simmonds Street, Johannesburg, 2001
DirectorsJA Mabuza (Chairman), SN Maseko (Group Chief Executive Officer), JH Schindehütte (Chief Financial Officer), S Botha, Dr CA Fynn, N Kapila, I Kgaboesele, K Kweyama, L Maasdorp, K Mzondeki, F Petersen, LL Von Zeuner
CONTENTS
TELKOM SA SOC LIMITED Group Annual Results for the year ended 31 March 2014
1
Overview Sipho Maseko: Group Chief Executive Officer
01
Notes:
Notes:
2014
Group Annual ResultsFor the year ended 31 march 2014

TELKOM SA SOC LIMITED Group Annual Results for the year ended 31 March 2014
2
Seamlessly connecting South Africans to a better life
3
01
• Roll out of largest fibre network in Africa – 147 000km
• Enabler of VDSL – high speed broadband services
• Almost 400 000 homes passed and 475 144 active ports March 2014
• Building the largest Wi-Fi network in South Africa
• Approximately 2 426 on air Wi-Fi hotspots
Fibre Mobile Wi-Fi
• LTE rollout gaining momentum – 1 183 LTE sites integrated
• Achieving speeds of up to 80Mbps • Data traffic increasing exponentially –
89% year-on-year
Financial highlights
BEPS at 285cps, 6%*
Operating expenses
2,1%* (8,2% in real terms)
Revenue is flat,
1% at R32,5bn
HEPS at 388cps, 35%*
EBITDA 3,8%* to R8,4bn
Free cash flow generated,
remains strong at R1,2 billion*
01
4 * Excluding once-off items.
Notes:
Notes:

TELKOM SA SOC LIMITED Group Annual Results for the year ended 31 March 2014
3
Our early turnaround efforts bear fruit
• Initial phase of cost transformation successful
• Good progress in correcting market distortions and regulatory imbalance with government and regulator
• Strengthen our balance sheet ‒ Inventory ‒ Property, plant and equipment ‒ Curtailment of post-retirement medical aid liability for
in-service staff ‒ Long-term debt
• MTN South Africa/mobile agreement
• Strengthening Telkom Enterprise
01
5
We have started the journey to improve customer service
6
01 • Product rationalisation
• Improve service and consistency in end-to-end delivery of products and services
• Focus on IT systems – Business process management
• Rebuilding the brand
• Improved our rating in the Ask Afrika Orange Index and won MyBroadband Fixed and Mobile broadband provider for 2013
Notes:
Notes:

TELKOM SA SOC LIMITED Group Annual Results for the year ended 31 March 2014
4
Telkom consumer: data gaining traction with fixed-line voice under pressure
Key highlights: • Mobile continues to track
favourably against targets
• Data revenue growth:
‒ Fixed: +5,4%
‒ Mobile: +73%
• Growth in traffic volumes year on year – voice (60%) and data (89%)
• Improved customer service – Ask Afrika Orange Index and MyBroadband
Number of LTE sites integrated
1 183
ADSL subscribers increase
6,5%
1,8 million mobile subscribers
800k mobile data subscribers
Key focus areas:
• Accelerating broadband penetration
• Enriching content and value added services
• Optimising our voice portfolio
• Exploiting convergence opportunities
• Driving a lower cost-structure by exploiting synergies through integrating fixed and mobile
01
7
Telkom has 2 426 Wi-Fi hotspots on air across the country
Telkom enterprise: Business IT revenue growth and retention of key client accounts
ytivitcennoc dnabdaorb edivorp ot tnemnrevog htiw derentraPand interactive learning management systems in 1 650 schools across the country
8
01 Key highlights: Telkom Business mobile
increased revenues ~281% as convergence strategy gains momentum
Business IT services revenue increased 69,3%
40% growth in metro-ethernet revenues
Increased internet revenues ~9%
Strong and trusted relationships with key enterprise customers
High bandwidth products grew
55%
Business Mobile Customers
grew by 78%
Key focus areas: Building a solutions-based
business through vertical clusters
Offering converged solutions, leveraging off fixed-line, mobile and data centre services capabilities
Consolidating product suite and focus on fibre and high bandwidth products
Notes:
Notes:
TELKOM SA SOC LIMITED Group Annual Results for the year ended 31 March 2014
5
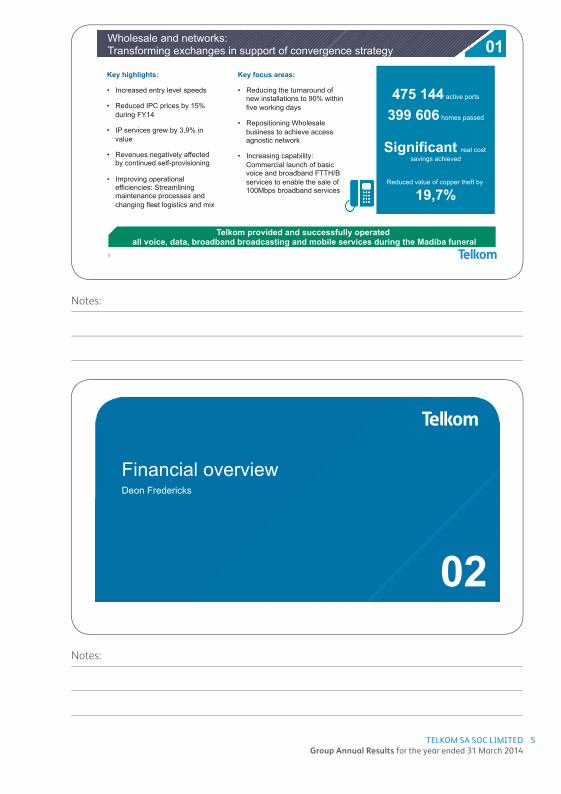
Wholesale and networks: Transforming exchanges in support of convergence strategy
Telkom provided and successfully operated all voice, data, broadband broadcasting and mobile services during the Madiba funeral
9
01 Key highlights:
• Increased entry level speeds
• Reduced IPC prices by 15% during FY14
• IP services grew by 3,9% in value
• Revenues negatively affected by continued self-provisioning
• Improving operational efficiencies: Streamlining maintenance processes and changing fleet logistics and mix
475 144 active ports
399 606 homes passed
Significant real cost savings achieved
Reduced value of copper theft by
19,7%
Key focus areas:
• Reducing the turnaround of new installations to 90% within five working days
• Repositioning Wholesale business to achieve access agnostic network
• Increasing capability: Commercial launch of basic voice and broadband FTTH/B services to enable the sale of 100Mbps broadband services
Financial overview Deon Fredericks
02
Notes:
Notes:

TELKOM SA SOC LIMITED Group Annual Results for the year ended 31 March 2014
6
F2014 results in perspective
• Challenging operating environment ‒ Impact by regulations and requirements ‒ Industry consolidation and competition ‒ Significant pace of technological evolution
• Challenging economic environment
• Customers demand ‘more for less’
• Traditional voice under significant pressure and considered commodity
• Good growth in data dissipated by lower tariffs being driven down by fierce competitive service offerings
• Cost pressures as CPI increases exceed the targeted band of 6%
• Three-year agreement signed with labour at average 6,8%
• Fuel and electricity prices
• Increasing interest rate cycle
02 A tough operating environment
12
F2014 achievements
• Stabilised and consolidated ‒ Revenue flat ‒ Increased EBITDA excluding once off items by 3,8%
• Improving Mobile EBITDA loss by 20% to R1,3 billion
• Focussed on cost efficiencies ‒ Critical appointments ‒ Improved business processes:
782 less vehicles and 10 800 less km 46% reduction in bad debt SG&A expenditure down 7,5%
• Remove volatility in earnings ‒ Implemented hedge accounting effective
1 October 2013
• Curtailed loss making activities – iWay
• Strengthened our balance sheet ‒ Inventory ‒ Property, plant and equipment ‒ Post-retirement medical aid liability by R4 billion ‒ Long-term debt
• NGN roll out gathered momentum ‒ 400 000 homes passed ‒ >475 000 active ports
• Remained lowly geared despite significant cash flows: ‒ R878 million PRMAL curtailment payment ‒ R710 million VERP payment ‒ R6,5 billion capex (12% increase)
02 A sound foundation for a challenging future
13
Notes:
Notes:

TELKOM SA SOC LIMITED Group Annual Results for the year ended 31 March 2014
7
Results impacted by some significant once-offs 02
13
Mar 2014#
Rm Mar 2013*
Rm
%
Operating revenue 32 483 32 143 1,1
Net revenue 26 041 26 134 (0,4)
Operating expenses 18 150 18 543 2,1
EBITDA 8 370 8 061 3,8
Depreciation and impairments 5 937 6 180 3,9
Capital investment 6 458 5 768 (12,0)
Free cash flow 1 145 2 022 (43,4)
•
Data: R 10 981m – 33,8% (2013: 33,6%)
Subsidiaries, CPE sales and other: R 3 757m – 11,6% (2013: 8,7%)
Voice and interconnection: R 17 745m – 54,6% (2013: 57,7%)
Year on year revenue increase
Year on year revenue decline
Declining voice minutes, but increase in data and handset sales
14
54,6% 33,8%
1,,6%
34,5%
1,7% (4,3%)
02
Notes:
Notes:

TELKOM SA SOC LIMITED Group Annual Results for the year ended 31 March 2014
8
18 548
8 591 7 743
1 597
17 745
7 934 7 812
1 508
Total voice and interconnection
Voice utilisation Voice subscriptions Interconnection
2013 2014
Voice revenues strained
15
02
0,9% (7,6%)
(4,3%)
(5,6%)
38 902 44 328 47 125
2012 2013 2014
Data volumes continue to gain traction
16
02
6,3%
Subs
crib
ers
50%
827 091 870 505
926 944
2012 2013 2014
ADSL
Managed data network sites Traffic volumes in TBytes
6,5%
0 5 000
10 000 15 000 20 000 25 000 30 000
Mar 2011 Mar 2012 Mar 2013 Mar 2014
ADSL Total
Notes:
Notes:

TELKOM SA SOC LIMITED Group Annual Results for the year ended 31 March 2014
9
Realising cost efficiencies
17
02
Excluding the curtailment gain in the current year and the Competition Commission fine and voluntary severance packages in the prior year.
18 543
9 563
5 059
2 996 925
18 150
9 306
4 682 3 110
1 052
Total Operating expenses (excl depreciation)
Employee expenses SG&A Service fees Operating leases
2013 2014
(13,7%)
7,5% (3,8%)
2,7%
2,1%
NGN investment drives growth in capital expenditure 02
18
Mar 2014 Rm
Mar 2013 Rm
%
Total capital expenditure 6 458 5 768 (12,0)
Group capital expenditure excluding mobile 5 090 4 220 (20,6)
Converting access network to IP (NGN) 2 439 1 232 (98,0)
Maintaining/enhancing existing telecoms and IT networks
2 651 2 988 11,3
Mobile 1 368 1 548 11,6
Notes:
Notes:

TELKOM SA SOC LIMITED Group Annual Results for the year ended 31 March 2014
10
Maintained strong cash balances despite increased capital investment 02
19
Mar 2014 Rm
Mar 2013 Rm %
Cash flow from operating activities 6 366 7 472 (14,8)
Capital investments (6 370) (5 627) (13,2)
Reduction in term debt (2 583) (731) (253,4)
Cash at end of period 1 841 2 381 (22,7)
Discretionary investments 3 016 4 713 (36,0)
Net debt to EBITDA ratio: 0,3x.
Prospects
03
Notes:
Notes:

TELKOM SA SOC LIMITED Group Annual Results for the year ended 31 March 2014
11
Financial guidance 03
21
F2014 A
F2015
F2016
Revenue +1,1% Stabilise to grow
Stabilise to grow
EBITDA margin 25,8% 26% – 27% 27% – 28%
Capex to revenue 19,9% 14% – 17% 14% – 17%
Net Debt to EBITDA 0,3 ≤1 ≤1
The above have not been reviewed or reported on by the external auditors of the Company.
Our dividend policy going forward Dividends are considered on an annual basis based on the financial performance of the Group, with reference to financial performance of the Group, operating environment, growth opportunities, as well as debt and cash flow levels.
Our intention is to reinstate the dividend in 2015.
De-risking mobile and strengthening enterprise
• MTN will take over financial and operational responsibility for the roll-out and operation of Telkom’s RAN
• Bilateral roaming agreement will enable customers of either party to roam on both networks and have full access to capacity and coverage of both networks
• Parties’ independent networks will be configured, such that use of parties’ network assets will provide greater efficiencies, improved quality of service and coverage for customers
• The arrangements will optimise usage of the Parties’ respective RANs but leave all other areas unaffected: retail and wholesale mobile services, marketing, distribution network, client service infrastructure and billing activities
• Support growth beyond core business of connectivity by expanding into ICT services
• Proposed transaction is funded from our balance sheet and enables the realisation of synergies
• Significant opportunity to increase and leverage off respective client base
• Maintain BCX as a separate operational entity within Telkom
• Reverse-integrate Cybernest into BCX and retain BCX key management skills
• Addresses both revenues and costs ‒ BCX skills and certifications are aligned to
Telkom’s strategy for future growth
03 Telkom and Business Connexion MTN SA and Telkom Mobile
23
Notes:
Notes:

TELKOM SA SOC LIMITED Group Annual Results for the year ended 31 March 2014
12
We are on track, while challenges remain
23
03
Deliver superior customer experience
Resolve Mobile – remove uncertainty and curtail future opex and capex
Disciplined capital allocation with greater emphasis on productivity and returns
Improve efficiency – cost base, execution
Find revenue growth – to secure future
Improved our rating as shown by external surveys
MTN SA/Mobile proposed agreement begins to address uncertainty
Strict funding model in place
Initial efficiency measures produce benefits, significant room for further reductions
Business Connexion, explore content and VAS
What we said What we did
We want to ‘Own the digital home’
• We will improve customer experience, with a dedicated office focusing on process improvements
• Deliver a sustainable, winning mobile proposition
• Develop and deliver a plan to accelerate and extend NGN
• Stimulate demand with content and value added services
• Transform our Go-to-Market strategies, with a particular focus on channel optimisation
• Optimise contact centres with one point of contact and more self-help facilities
• Deliver simple and compelling bundles and converged products
24
03
Notes:
Notes:

TELKOM SA SOC LIMITED Group Annual Results for the year ended 31 March 2014
13
Installing fibre to the home
25
03
Lead in enterprise, business and government
• Develop vertical go-to-market and solutions capability for large, corporate and Government business
• Grow into adjacent IT markets through organic growth, partnerships and acquisitions.
• Improve our offer to SMEs with lower cost products, simple bundled solutions and better targeted channels to market
• Establish ourselves as Government’s lead partner for the provision of e-Services and e-platforms
• Aggressively migrate our business customers to fibre-based products
• Manage voice decline and technology transitions to IP based networks • Achieve sustainability in Mobile services to the Business Market
26
03
Notes:
Notes:
TELKOM SA SOC LIMITED Group Annual Results for the year ended 31 March 2014
14
Pre-eminent in wholesale
• Secure deals with MCOs and other OLOs and ISPs to grow and defend our fixed infrastructure business
• Define more competitive pricing and broadband offers • Migrate from legacy to scalable metro ethernet products….and define strategy for next
generation product pipeline for OLOs and MCOs
• Strengthen wholesale sales and business development capabilities • Define wholesale/retail and network operating model boundaries and transfer pricing
model
• Develop adjacent growth areas that can be done in partnership such as wholesale content delivery, voice, infrastructure, and international growth
27
03
Realising our strategy will involve focus and discipline in executing
Seamlessly connecting South Africans to a better life • Centre of the digital home • Lead in business, enterprise and government • Pre-eminent in wholesale
Enabled by: • People and organisational capabilities • An invincible network • The right technologies and solutions • A competitive cost base and efficiency • A sustainable regulatory stance • Partnerships in non-core and adjacent activities that build our converged proposition
28
03
Notes:
Notes:

TELKOM SA SOC LIMITED Group Annual Results for the year ended 31 March 2014
15
Conclusion
04
We have three fundamental goals to reposition the business for growth
30
04
Reposition the business to achieve long-term commercial sustainability
Reposition commercially to generate sustainable revenue streams Implement new operating models that support commercial directions – that are efficient and responsive
Fulfill key role in transforming South African telecommunications economy
Dedicated to being South Africa’s network, and to create an open and even access environment
Stabilise our operations to achieve growth in the long term Implementing efficiency drives is necessary but not sufficient
Notes:
Notes:
TELKOM SA SOC LIMITED Group Annual Results for the year ended 31 March 2014
16
Questions and answers
05 Notes:

TELKOM SA SOC LIMITED Group Annual Results for the year ended 31 March 2014
17
GROUP ANNUAL RESULTS
FOR THE YEAR ENDED 31 MARCH 2014
2014The information contained in this document is also available on Telkom’s investor relations website www.telkom.co.za/ir
SPECIAL NOTE REGARDING FORWARD-LOOKING STATEMENTS 19
GROUP SALIENT FEATURES 20
KEY INDICATORS 21
OVERVIEW 22
OPERATIONAL DATA 24
FINANCIAL PERFORMANCE 25
Telkom SA SOC Limited (Registration number 1991/005476/30)JSE share code: TKG ISIN: ZAE000044897
Group Company SecretaryXoliswa Mpongoshe
Transfer secretariesComputershare Investor Services (Proprietary) LimitedPO Box 61051, Marshalltown, 2107
SponsorThe Standard Bank of South Africa LimitedStandard Bank Centre5 Simmonds Street, Johannesburg, 2001
DirectorsJA Mabuza (Chairman), SN Maseko (Group Chief Executive Officer), JH Schindehütte (Chief Financial Officer), S Botha, Dr CA Fynn, N Kapila, I Kgaboesele, K Kweyama, L Maasdorp, K Mzondeki, F Petersen, LL Von Zeuner
CONTENTS

TELKOM SA SOC LIMITED Group Annual Results for the year ended 31 March 2014
19
SPECIAL NOTE REGARDING FORWARD-LOOKING STATEMENTS
Many of the statements included in this document, as well as oral statements that may be made by us or by officers, directors or employees acting on behalf of us, constitute or are based on forward-looking statements.
All statements, other than statements of historical facts, including, among others, statements regarding our convergence and other strategies, future financial position and plans, objectives, capital expenditures, projected costs and anticipated cost savings and financing plans, as well as projected levels of growth in the communications market, are forward looking statements. Forward-looking statements can generally be identified by the use of terminology such as “may”, “will”, “should”, “expect”, “envisage”, “intend”, “plan”, “project”, “estimate”, “anticipate”, “believe”, “hope”, “can”, “is designed to” or similar phrases, although the absence of such words does not necessarily mean that a statement is not forward looking. These forward-looking statements involve a number of known and unknown risks, uncertainties and other factors that could cause our actual results and outcomes to be materially different from historical results or from any future results expressed or implied by such forward-looking statements. Among the factors that could cause our actual results or outcomes to differ materially from our expectations including but not limited to those risks identified in Telkom’s most recent annual report which are available on Telkom’s website at www.telkom.co.za/ir.
We caution you not to place undue reliance on these forward looking statements. All written and oral forward-looking statements attributable to us, or persons acting on our behalf, are qualified in their entirety by these cautionary statements. Moreover, unless we are required by law to update these statements, we will not necessarily update any of these statements after the date of this document, either to conform them to actual results or to changes in our expectations.
The information contained in this document is also available on Telkom’s investor relations website www.telkom.co.za/ir.
Telkom SA SOC Limited is listed on the JSE Limited. Information may be accessed on Reuters under the symbols TKGJ.J and on Bloomberg under the symbol TKG.SJ. Information contained on Reuters and Bloomberg is provided by a third party and is not incorporated by reference herein. Telkom has not approved or verified such information and does not accept any liability for the accuracy of such information.
TELKOM SA SOC LIMITED Group Annual Results for the year ended 31 March 2014
20
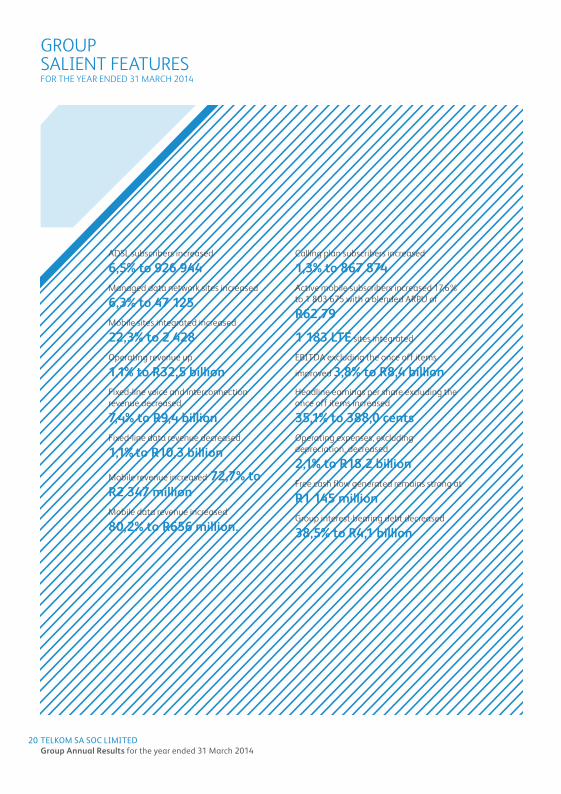
GROUP SALIENT FEATURESFOR THE YEAR ENDED 31 MARCH 2014
ADSL subscribers increased
6,5% to 926 944Managed data network sites increased
6,3% to 47 125Mobile sites integrated increased
22,3% to 2 428Operating revenue up
1,1% to R32,5 billionFixed-line voice and interconnection revenue decreased
7,4% to R9,4 billionFixed-line data revenue decreased
1,1% to R10,3 billion
Mobile revenue increased 72,7% to R2 347 millionMobile data revenue increased
80,2% to R656 million.
Calling plan subscribers increased
1,3% to 867 874Active mobile subscribers increased 17,6% to 1 803 675 with a blended ARPU of
R62,79
1 183 LTE sites integrated
EBITDA excluding the once off items
improved 3,8% to R8,4 billionHeadline earnings per share excluding the once off items increased
35,1% to 388,0 centsOperating expenses, excluding depreciation, decreased
2,1% to R18,2 billionFree cash flow generated remains strong at
R1 145 millionGroup interest-bearing debt decreased
38,5% to R4,1 billion

TELKOM SA SOC LIMITED Group Annual Results for the year ended 31 March 2014
21
KEY INDICATORS
(ZAR million)
Return on invested capital(%)
Free cash flow (ZAR million)
Revenue from mobile operations (ZAR million)
Mobile EBITDA loss(ZAR million)
Revenue generating mobile subscribers(Thousand)
ADSL subscribers(Thousands)
March 2014March 2013
7
6
5
4
3
2
1
0
4,6
6,5
March 2014March 2013
2 500
2 000
1 500
1 000
500
0
2 022
1 145
March 2014March 2013
1 000
800
600
400
200
0
871927
March 2014March 2013
2 500
2 000
1 500
1 000
500
0
1 359
2 347
March 2014March 2013
2 000
1 500
1 000
500
0
1 675
1 334
March 2014March 2013
2 000
1 500
1 000
500
0
1 534
1 804
EBITDAOperating revenue
March 2014March 2013
35 000
30 000
25 000
20 000
15 000
10 000
5 000
0
8 061 8 370
32 48332 143
HEPSBEPS
March 2014March 2013
400
350
300
250
200
150
100
50
0
268,5285,2 287,1
388,0
All indicators below exclude the R2 169 million net curtailment gain and R246 million related tax benefit on the R878 million settlement in March 2014, as well as the R12 billion impairment of assets, R592 million Competition Commission provision and R434 million voluntary severance and early retirement cost in March 2013.
TELKOM SA SOC LIMITED Group Annual Results for the year ended 31 March 2014
22
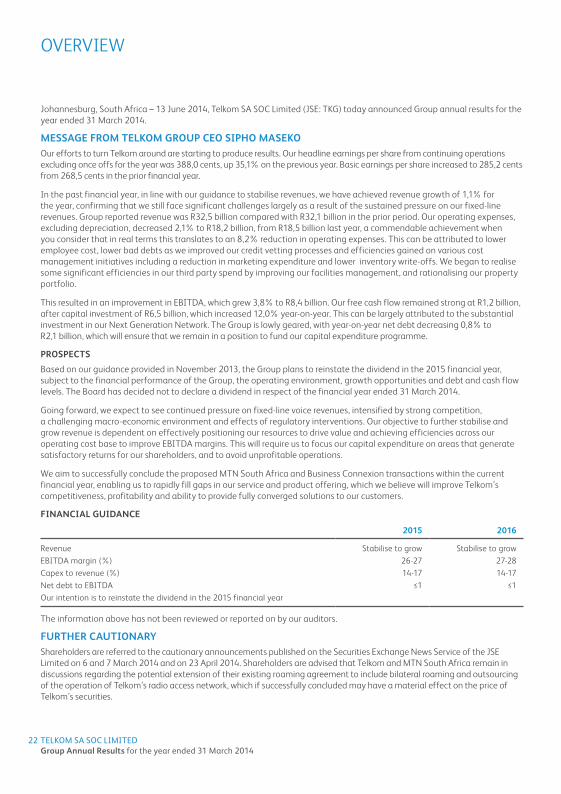
Johannesburg, South Africa – 13 June 2014, Telkom SA SOC Limited (JSE: TKG) today announced Group annual results for the year ended 31 March 2014.
MESSAGE FROM TELKOM GROUP CEO SIPHO MASEKOOur efforts to turn Telkom around are starting to produce results. Our headline earnings per share from continuing operations excluding once offs for the year was 388,0 cents, up 35,1% on the previous year. Basic earnings per share increased to 285,2 cents from 268,5 cents in the prior financial year.
In the past financial year, in line with our guidance to stabilise revenues, we have achieved revenue growth of 1,1% for the year, confirming that we still face significant challenges largely as a result of the sustained pressure on our fixed-line revenues. Group reported revenue was R32,5 billion compared with R32,1 billion in the prior period. Our operating expenses, excluding depreciation, decreased 2,1% to R18,2 billion, from R18,5 billion last year, a commendable achievement when you consider that in real terms this translates to an 8,2% reduction in operating expenses. This can be attributed to lower employee cost, lower bad debts as we improved our credit vetting processes and efficiencies gained on various cost management initiatives including a reduction in marketing expenditure and lower inventory write-offs. We began to realise some significant efficiencies in our third party spend by improving our facilities management, and rationalising our property portfolio.
This resulted in an improvement in EBITDA, which grew 3,8% to R8,4 billion. Our free cash flow remained strong at R1,2 billion, after capital investment of R6,5 billion, which increased 12,0% year-on-year. This can be largely attributed to the substantial investment in our Next Generation Network. The Group is lowly geared, with year-on-year net debt decreasing 0,8% to R2,1 billion, which will ensure that we remain in a position to fund our capital expenditure programme.
PROSPECTS
Based on our guidance provided in November 2013, the Group plans to reinstate the dividend in the 2015 financial year, subject to the financial performance of the Group, the operating environment, growth opportunities and debt and cash flow levels. The Board has decided not to declare a dividend in respect of the financial year ended 31 March 2014.
Going forward, we expect to see continued pressure on fixed-line voice revenues, intensified by strong competition, a challenging macro-economic environment and effects of regulatory interventions. Our objective to further stabilise and grow revenue is dependent on effectively positioning our resources to drive value and achieving efficiencies across our operating cost base to improve EBITDA margins. This will require us to focus our capital expenditure on areas that generate satisfactory returns for our shareholders, and to avoid unprofitable operations.
We aim to successfully conclude the proposed MTN South Africa and Business Connexion transactions within the current financial year, enabling us to rapidly fill gaps in our service and product offering, which we believe will improve Telkom’s competitiveness, profitability and ability to provide fully converged solutions to our customers.
FINANCIAL GUIDANCE
2015 2016
Revenue Stabilise to grow Stabilise to growEBITDA margin (%) 26-27 27-28Capex to revenue (%) 14-17 14-17Net debt to EBITDA ≤1 ≤1Our intention is to reinstate the dividend in the 2015 financial year
The information above has not been reviewed or reported on by our auditors.
FURTHER CAUTIONARYShareholders are referred to the cautionary announcements published on the Securities Exchange News Service of the JSE Limited on 6 and 7 March 2014 and on 23 April 2014. Shareholders are advised that Telkom and MTN South Africa remain in discussions regarding the potential extension of their existing roaming agreement to include bilateral roaming and outsourcing of the operation of Telkom’s radio access network, which if successfully concluded may have a material effect on the price of Telkom’s securities.
OVERVIEW

TELKOM SA SOC LIMITED Group Annual Results for the year ended 31 March 2014
23
Accordingly, shareholders are advised to continue to exercise caution when dealing in Telkom securities until a further announcement in this regard is made.
RESULTS FROM OPERATIONSThe Group recorded a profit after tax of R4 billion. This is significantly higher than the previous year and was driven by:• aR2169millionnetcurtailmentgainrecognisedonthepost-retirementmedicalaidliabilityandR246millionrelated
tax benefit on the R878 million settlement;• theR12billionassetimpairmentincludedinthe2013financialyear;• R592millionprovisionfortheCompetitionCommissionfinesincludedintheprioryear;and• R434millionvoluntaryseveranceandearlyretirementcostincludedintheprioryear.
As we reported at our interim results, the company reassessed the underlying assumptions used to determine the value of the post-retirement medical aid liability for qualifying employees. The growth assumption for the subsidisation amount at retirement was capped at 0% and employees were offered a settlement calculated at the economic value of their liability. This curtailment and subsequent settlement was the main contributor to a net non-cash gain of approximately R2 169 million and a reduction in the post-retirement medical aid liability.
The once-off items above are not part of the results from core operations for the year under review and have therefore been excluded from the discussion below.
The Group recorded a profit after tax of R1 577 million (2013: R1 494 million) and EBITDA of R8 370 million (2013: R8 061 million).
The changes from our transformation process are starting to positively impact our financial performance. However, we still face significant challenges in our fixed-line voice and mobile business, including fixed-to-mobile substitution and being the fourth entrant into a highly competitive mobile market. Our net revenue decreased by 0,4%, driven by a continued decline in fixed voice revenue, partially offset by lower payments to mobile operators which resulted from the reduction in mobile termination rates. We recorded promising growth of 80,2% in mobile data revenue and 69,3% in IT Business services revenue. Data revenue now constitutes approximately 33,8% of Group revenue which increased 1,7% from the prior reporting period. Data volumes, however, were negatively impacted by an increasingly competitive pricing landscape.
We managed to reduce operating cost by 2,1%. This reduction was largely driven by lower full time and part time employee costs and bonus payments, lower bad debts from improved credit vetting systems, and savings on materials and maintenance from efficiencies gained from various cost management initiatives. In addition, we reduced marketing expenditure and managed to limit inventory write-offs.
The Group generated strong cash flows, resulting in a healthy capital structure. In addition, interest bearing debt decreased 38,5% to R4,1 billion at 31 March 2014.
REPORT STRUCTUREIn line with the Group’s convergence strategy, key performance indicators are measured and evaluated on a Group-wide basis. The Group therefore consists of one operating segment.
However, this report provides further details of the fixed-line business which offers fixed-line access and data communication services through Telkom South Africa, and the mobile business which offers mobile voice services, data services and handset sales through Telkom Mobile. The contribution of the subsidiaries, Trudon and Swiftnet, are also shown separately. The Telkom category represents Telkom Company’s contribution to the Group including consolidation entries.
The comparative information for March 2013 has been restated as a result of the adoption of IAS 19R, the amendment to IAS 16, the reclassification of iWayAfrica as a discontinued operation and to account for the change in accounting policy regarding the Cell Captive. Refer to note 2.1 in the condensed consolidated provisional financial statements.
In addition the following items have been reclassified to provide more relevant disclosure:• DirectcostofR373millionandcostofsalesofR1176millionhavebeenreclassifiedfromselling,generaland
administrative expenses to direct cost and cost of sales, respectively.• SundryrevenueofR128millionhasbeenreclassifiedfromselling,generalandadministrativeexpensestootherincome.• MotorinsuranceschemeexpensesofR84million,previouslyincludedinservicefees,hasbeenreclassifiedtoemployee
expenses.
TELKOM SA SOC LIMITED Group Annual Results for the year ended 31 March 2014
24
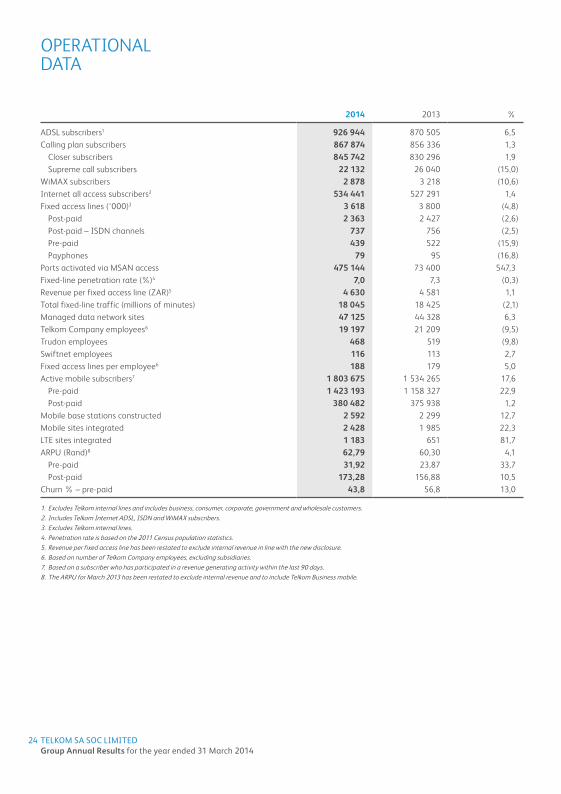
2014 2013 %
ADSL subscribers1 926 944 870 505 6,5Calling plan subscribers 867 874 856 336 1,3
Closer subscribers 845 742 830 296 1,9Supreme call subscribers 22 132 26 040 (15,0)
WiMAX subscribers 2 878 3 218 (10,6)Internet all access subscribers2 534 441 527 291 1,4Fixed access lines (‘000)3 3 618 3 800 (4,8)
Post-paid 2 363 2 427 (2,6)Post-paid – ISDN channels 737 756 (2,5)Pre-paid 439 522 (15,9)Payphones 79 95 (16,8)
Ports activated via MSAN access 475 144 73 400 547,3Fixed-line penetration rate (%)4 7,0 7,3 (0,3)Revenue per fixed access line (ZAR)5 4 630 4 581 1,1Total fixed-line traffic (millions of minutes) 18 045 18 425 (2,1)Managed data network sites 47 125 44 328 6,3Telkom Company employees6 19 197 21 209 (9,5)Trudon employees 468 519 (9,8)Swiftnet employees 116 113 2,7Fixed access lines per employee6 188 179 5,0Active mobile subscribers7 1 803 675 1 534 265 17,6
Pre-paid 1 423 193 1 158 327 22,9Post-paid 380 482 375 938 1,2
Mobile base stations constructed 2 592 2 299 12,7Mobile sites integrated 2 428 1 985 22,3LTE sites integrated 1 183 651 81,7ARPU (Rand)8 62,79 60,30 4,1
Pre-paid 31,92 23,87 33,7Post-paid 173,28 156,88 10,5
Churn % – pre-paid 43,8 56,8 13,0
1. Excludes Telkom internal lines and includes business, consumer, corporate, government and wholesale customers.2. Includes Telkom Internet ADSL, ISDN and WiMAX subscribers.3. Excludes Telkom internal lines.4. Penetration rate is based on the 2011 Census population statistics.5. Revenue per fixed access line has been restated to exclude internal revenue in line with the new disclosure.6. Based on number of Telkom Company employees, excluding subsidiaries.7. Based on a subscriber who has participated in a revenue generating activity within the last 90 days.8. The ARPU for March 2013 has been restated to exclude internal revenue and to include Telkom Business mobile.
OPERATIONAL DATA

TELKOM SA SOC LIMITED Group Annual Results for the year ended 31 March 2014
25
FINANCIAL PERFORMANCE
GROUP OPERATING REVENUEIn ZAR millions 2014 2013 %
Voice and subscriptions 16 237 16 951 (4,2)Fixed-line usage 7 934 8 591 (7,6)Fixed-line subscriptions 7 812 7 743 0,9Mobile voice and subscriptions 491 617 (20,4)
Interconnection 1 508 1 597 (5,6)Fixed-line domestic 458 562 (18,5)Fixed-line international 971 959 1,3Mobile interconnection 79 76 3,9
Data 10 981 10 801 1,7Data connectivity 5 544 5 595 (0,9)Leased line facilities 1 789 1 963 (8,9)Internet access and related services 1 676 1 617 3,6Managed data network services 919 1 005 (8,6)Multi-media services 50 52 (3,8)Mobile data 656 364 80,2IT Business services 347 205 69,3
Customer premises equipment sales and rentals 2 186 1 333 64,0Sales 307 327 (6,1)Rentals 758 704 7,7Mobile handset and equipment sales 1 121 302 271,2
Other 367 227 61,7Trudon 1 112 1 140 (2,5)Swiftnet 92 94 (2,1)
Total 32 483 32 143 1,1
Group operating revenue increased 1,1% to R32 483 million (2013: R32 143 million), driven by higher mobile handset and equipment sales, growth in mobile data and IT Business services data revenue, offset by a decline in voice revenue.
Fixed-line voice usage revenue continued on a downward trend, decreasing 7,6% to R7 934 million (2013: R8 591 million). This can be attributed to a 2,1% decline in voice minutes, resulting from fixed-to-mobile substitution, with a decrease of approximately R190 million relating to the pass through of reduced mobile termination rates to fixed-line customers. In addition, fixed-line voice usage was impacted by a decline in number of lines of 4,8%. The number of business lines decreased due to the consolidation of branches and brands as well as the trend of medium sized business to reduce the number of services to save costs, including the move from standalone offices into multi-tenant office parks.
Fixed-line subscriptions revenue grew 0,9% to R7 812 million (2013: R7 743 million) as a result of average line rental tariff increases of 6%.
While revenue from our mobile operations grew 72,7%, mobile voice and subscriber revenue decreased 20,4%. This can be attributed to the expiry of bulk hybrid contracts and a clean-up of our debtors’ book which has resulted in an improved quality of our customer base. The decrease in post-paid voice revenue was partially offset by higher pre-paid voice and subscriptions revenue, supported by an increase in subscribers and ARPU. Mobile interconnection revenue increased slightly by 3,9%.
Fixed-line domestic interconnection revenue decreased 18,5% to R458 million (2013: R562 million), primarily driven by the reduction in fixed termination rates.
The 1,3% increase in fixed-line international interconnection revenue to R971 million (2013: R959 million) was driven by higher switched hubbing revenue. However, this was partially offset by a reduction in volumes of international outgoing calls by mobile operators.

TELKOM SA SOC LIMITED Group Annual Results for the year ended 31 March 2014
26
Revenue from data connectivity services decreased 0,9% to R5 544 million (2013: R5 595 million), caused by a decline in Diginet and Megalines revenue, due to increased competition and migration to Metro Ethernet services. This was partially offset by an increase in Metro Ethernet services revenue. ADSL revenue increased as a result of a 6,5% increase in ADSL subscribers to 926 944 (2013: 870 505).
With continued self-provisioning by other licenced operators, revenue from mobile leased line facilities remained under pressure and declined 8,9% to R1 789 million (2013: R1 963 million).
Higher internet and IP Connect revenue was supported by a 3,6% increase in internet access and related services revenue.
Managed data network services revenue decreased 8,6% to R919 million (2013: R1 005 million) which was caused by a reclassification of revenue to IT services revenue of approximately R62 million from 1 April 2013, discounts offered to customers and the migration of customers to lower cost solutions. We increased the number of sites by 6,3% to 47 125 (2013: 44 328).
In line with our strategy to focus on data, we offered enticing data deals and promotional products which led to an increase in data subscribers, and a 80,2% increase in mobile data revenue to R656 million (2013: R364 million).
We made some key strategic wins in the IT market during the year which boosted our IT Business services data revenue which increased 69,3% to R347 million (2013: R205 million).
A strategic decision was made to discontinue sales of PC and gaming equipment, which caused a 6,1% decline in customer premises equipment sales to R307 million (2013: R327 million). Despite this, our rentals increased 7,7% to R758 million (2013: R704 million) due to increased uptake in next generation equipment rentals and higher tariffs.
Mobile handset and equipment sales revenue increased 271,2%, driven by higher bulk sales to dealers and a sharp increase in smartphone and tablet sales.
Other revenue increased 61,7% to R367 million (2013: R227 million) as we recognised higher revenue from expired cards and higher co-location revenue generated from an increase in the number of sites.
GROUP OTHER INCOME
In ZAR millions 2014 2013 %
Telkom 446 432 3,2Trudon 31 34 (8,8)Swiftnet 2 4 (50,0)
Total 479 470 1,9
Other income includes profit on the disposal of property, plant and equipment as well as interest received from debtors and sundry income.
Restatements and reclassifications of comparative information.Sundry revenue of R128 million previously included in selling, general and administrative expenses was reallocated to other income.
GROUP DIRECT EXPENSES
In ZAR millions 2014 2013 %
Payments to other operators 3 944 4 460 11,6Direct cost 560 373 (50,1)Cost of sales 1 938 1 176 (64,8)
Total 6 442 6 009 (7,2)
The increase in direct expenses was a result of an increase in mobile equipment sales and higher subscriber acquisition cost, which was partly offset by a decrease in mobile termination rates.
FINANCIAL PERFORMANCE (CONTINUED)

TELKOM SA SOC LIMITED Group Annual Results for the year ended 31 March 2014
27
Telkom direct expensesIn ZAR millions 2014 2013 %
Payments to other operators 3 920 4 434 11,6Mobile network operators 2 308 2 901 20,4International network operators 946 904 (4,6)Fixed-line network operators 338 368 8,2Data commitments 328 261 (25,7)
Direct cost 560 373 (50,1)Cost of sales 1 616 856 (88,8)
Total 6 096 5 663 (7,6)
Payment to other operators decreased 11,6% as a result of a reduction in mobile termination rates which was moderately offset by higher data commitments.
Direct cost grew 50,1% following an increase in mobile sales acquisition costs relating to an increase in active mobile subscribers.
The 88,8% increase in cost of sales is largely attributed to the increase in cost of mobile handsets and tablets sold.
GROUP OPERATING EXPENSES
In ZAR millions 2014 2013 %
Employee expenses1 9 306 9 563 2,7Selling, general and administrative expenses2,3 4 682 5 059 7,5Service fees1 3 110 2 996 (3,8)Operating leases 1 052 925 (13,7)Depreciation, amortisation, impairments and write-offs4 5 937 6 180 3,9
Total 24 087 24 723 2,6
Restatements and reclassifications of comparative information1. Motor insurance scheme expenses of R84 million, previous included in service fees have been reclassified to employee expenses. In addition employee expenses have
increased by R144 million as a result if the adoption of IAS 19R and we have excluded the voluntary severance and early retirement cost of R434 million.2. Sundry revenue of R128 million previously included in other expenses was reallocated to other income.3. The provision for the Competition Commission fine of R592 million are excluded from the results above and R1 229 million of direct cost and cost of sales are reclassified
as direct expenses.4. The R12 billion impairment has been excluded from the results and impairments and write-offs have increased by R25 million due to the amendment to IAS 16.
Group operating expenses decreased by 2,6% to R24 087 million (2013: R24 723 million) in the year ended 31 March 2014, primarily due to depreciation savings resulting from the R12 billion impairment in the prior year and lower bad debts.

TELKOM SA SOC LIMITED Group Annual Results for the year ended 31 March 2014
28
Group operating expenditure contributionIn ZAR millions 2014 2013 %
Telkom 23 704 24 319 2,5Trudon 294 322 8,7Swiftnet 89 82 (8,5)
Total 24 087 24 723 2,6
Telkom operating expenditureIn ZAR millions 2014 2013 %
Employee expenses1 9 037 9 287 2,7Salaries and wages 7 103 7 285 2,5Benefits1 2 315 2 479 6,6Workforce reduction expenses2 75 43 (74,4)Employee related expenses capitalised (456) (520) (12,3)
Selling, general and administrative expenses3,4,5 4 695 5 050 7,0Materials and maintenance 3 020 3 104 2,7Marketing3 799 856 6,7Bad debts 170 315 46,0Other4,5 706 775 8,9
Service fees1 3 096 2 984 (3,8)Property management 1 741 1 659 (4,9)Consultants, security and other1 1 355 1 325 (2,3)
Operating leases 1 004 880 (14,1)Buildings 455 385 (18,2)Equipment 35 35 –Vehicles 514 460 (11,7)
Depreciation, amortisation, impairments and write-offs6 5 872 6 118 4,0Depreciation 4 588 5 044 9,0Amortisation 652 873 25,3Impairment and write-offs6 632 201 (214,4)
Total 23 704 24 319 2,5
Restatements and reclassifications of comparative information1. Motor insurance scheme expenses of R84 million, previous included in service fees have been reclassified to employee expenses. In addition benefits have increased by
R144 million as a result if the adoption of IAS 19R and R276 million relating to voluntary severance packages.2. Voluntary severance and early retirement cost of R710 million excluded.3. Market research expenses of R81 million has been reallocated from marketing expenses to other expenses.4. Sundry revenue of R128 million previously included in other expenses was reallocated to other income.5. The provision for the Competition Commission fine of R592 million is excluded from the results above and R1 229 million of direct cost and cost of sales are reclassified
as direct expenses.6. The R12 billion impairment has been excluded from the results and impairments and write-offs have increased by R25 million due to the amendment to IAS 16.
FINANCIAL PERFORMANCE (CONTINUED)

TELKOM SA SOC LIMITED Group Annual Results for the year ended 31 March 2014
29
Employee expenses were 2,7% lower due to lower full time salary cost as headcount decreased by 9,5%. Part time employee costs, lower provision for bonus and lower overtime also contributed to the decrease. This was negated by a 6,8% average salary increase for bargaining unit employees, a 3,6% average salary increase for management employees and a R103 million curtailment loss on the retirement fund in the 2014 financial year. The curtailment loss relates to the impact on plan assets as a result of the closing of the voluntary severance and early retirement packages offered in the 2013 financial year.
Selling, general and administrative expenses decreased 7,0% to R4 695 million (2013: R5 050 million), as a result of lower bad debts which decreased 46,0% due to improved credit vetting, lower materials and maintenance expenses, resulting from various cost saving initiatives, lower inventory write-offs and marketing expenses. This, however, was partly offset by higher licence fees.
Space optimisation projects, repairs and renovation of mobile buildings and masts and higher electricity costs led to a 4,9% increase in property management expenses. Consultants, security and other service fees increased 2,3%, which was driven by higher costs incurred relating to the Company’s transformation programme.
Building leases increased 18,2% as a result of annual escalations and an increase in the number of mobile sites acquired. The 11,7% increase in vehicle leases was mainly attributed to a cost to terminate 500 vehicles early, which saw a decrease in number of vehicles to 6 066 (2013: 6 848).
Depreciation decreased 4,0% to R5 872 million (2013: R6 118 million). This decline relates to the R12 billion impairment of the asset base in March 2013. However, this was partially offset by accelerated depreciation from reviewing the useful lives of new connections installed to customer premises and a 60,8% increase in depreciation of our mobile assets. The increase in mobile depreciation is driven by the continued expansion of the mobile network.
Impairment and write-offs increased significantly to R632 million (2013: R201 million). With effect from 1 April 2013, Telkom adopted an amendment to IAS 16, property, plant and equipment (PPE) which clarifies that spare parts previously included in inventory be classified as PPE if they meet the definition of PPE. Consequently, certain legacy and technologically aged items were reclassified to PPE from inventory. An impairment was recognised regarding these assets in line with the requirements of IFRS.
Mobile operating expenditureTelkom Mobile, details of operating expenditure are provided below.
In ZAR millions 2014 2013 %
Payments to other operators 482 482 –Direct cost 461 294 (56,8)Cost of sales 1 056 416 (153,8)Employee expenses 359 333 (7,8)Selling, general and administrative expenses 988 1 077 8,3Service fees 144 245 41,2Operating leases 220 187 (17,6)Depreciation, amortisation, impairments and write-offs 598 372 (60,8)
Total 4 308 3 406 (26,5)

TELKOM SA SOC LIMITED Group Annual Results for the year ended 31 March 2014
30
EBITDA
In ZAR millions 2014 2013 %
Telkom 7 797 7 474 4,3EBITDA margin (%) 24,9 24,2 0,7Trudon 573 580 (1,2)EBITDA margin (%) 51,5 50,9 0,6Swiftnet – 7 (100,0)EBITDA margin (%) – 7,4 (7,4)
Total 8 370 8 061 3,8
INVESTMENT INCOME
Investment income consists of interest received on short-term investments and bank accounts. Investment income decreased by 36,9% to R176 million (2013: R279 million) as a result of lower cash balances held by the Group.
FINANCE CHARGES AND FAIR VALUE MOVEMENTS
Finance charges include interest paid on local and foreign borrowings, amortised discounts on bonds and commercial paper bills, fair value gains and losses on financial instruments and foreign exchange gains and losses on foreign currency denominated transactions and balances.
Foreign exchange and fair value gains decreased 20,4% to R344 million (2013: R432 million). This decrease was caused by lower fair value gains on derivatives due to the implementation of hedge accounting effective 1 October 2013 and partially offset by higher fair value gains realised on the underlying assets held by the Cell Captive. Interest expense decreased 3,0% to R636 million (2013: R656 million) as a result of a 38,5% decrease in interest bearing debt from 31 March 2014 and lower interest rates.
CONSOLIDATED STATEMENT OF FINANCIAL POSITION
The Group’s capital structure remains strong. Net debt, including financial assets and liabilities, decreased 0,8% to R2 108 million from R2 125 million as at 31 March 2013, resulting in a net debt to EBITDA ratio of 0,3 times. On 31 March 2014, the Group had cash balances, including other financial assets and liabilities, of R1 930 million (2013: R4 461 million).
Current liabilities decreased in the year ended 31 March 2014 as we settled the R2,0 billion syndicated loan.
FREE CASH FLOW
In ZAR millions 2014 2013 %
Cash generated from operations before dividends paid as reported 6 490 7 649 (15,2)Add back: Payment to Competition Commission 291 – –Add back: Payment to insurer for post-retirement medical aid 878 – –Add back: Voluntary severance and early retirement cost 710 – –Less: Taxation refund received (854)
Normalised cash generated from operations before dividends paid 7 515 7 649 (1,8)Cash paid for capital expenditure (6 370) (5 627) (13,2)
Free cash flow 1 145 2 022 (43,4)
FINANCIAL PERFORMANCE (CONTINUED)

TELKOM SA SOC LIMITED Group Annual Results for the year ended 31 March 2014
31
Free cash flow decreased 43,4% to R1 145 million (2013: R2 022 million) as a result of an increase in foreign payments as a result of the weakening of the Rand against the major currencies and a 13,2% increase in our capital expenditure.
GROUP CAPITAL EXPENDITURE
Our capital expenditure programme is aligned to our strategy to build our Next Generation Network and grow mobile and converged service offerings.
Group capital expenditure, which includes spend on intangible assets, increased 12,0% to R6 458 million (2013: R5 768 million) and represents 19,9% of Group operating revenue (2013: 17,9%).
In ZAR millions 2014 2013 %
Baseline 1 837 2 057 10,7Network evolution 2 439 1 232 (98,0)Mobile 1 368 1 548 11,6Sustenance 198 310 36,1Effectiveness and efficiency 162 121 (33,9)Support 357 377 5,3Other 27 26 (3,8)Trudon 45 63 28,6Swiftnet 25 34 26,5
Total 6 458 5 768 (12,0)
Baseline capital expenditure of R1 837 million (2013: R2 057 million) consists largely of the deployment of technologies to support the growing data services business, links to the mobile cellular operators and access line deployment in selected high growth commercial and business areas. The reduction in expenditure for the year is due to the provision of ADSL and Metro Ethernet services under the Next Generation Network programme, included in the network evolution category.
Expenditure on network evolution of R2 439 million (2013: R1 232 million) related to the continued rollout of the Next Generation Network programme which aims to modernise the legacy voice network, provide high speed broadband in selected areas and to address the associated operational and business support systems. The expenditure on this programme has increased as it accelerates beyond the initial phase.
Mobile capital expenditure decreased 11,6% to R1 368 million (2013: R1 548 million), due to the shift to a more concentrated rollout in the four major metropolitan areas.
The sustenance category expenditure of R198 million (2013: R310 million) was largely linked to the replacement of obsolete power systems as well as the replacement and modernisation of the access and core network.
The increase in the effectiveness and efficiency category to R162 million (2013: R121 million) was as a result of the movement of staff from leased buildings to owned buildings and various IT efficiency projects.
The support capital expenditure of R357 million (2013: R377 million) is primarily related to rebranding Telkom stores during the year, the provision of new buildings and building extensions in support of network growth and building compliance upgrades. This capital expenditure decreased 5,3% because a number of projects which were started in previous years were completed.

GROUP ANNUAL FINANCIAL STATEMENTSFOR THE YEAR ENDED 31 MARCH 2014
2014 The information contained in this document is also available on Telkom’s investor relations website www.telkom.co.za/ir
32 TELKOM SA SOC LIMITED Group Annual Results for the year ended 31 March 2014

CONDENSED CONSOLIDATED PROVISIONAL STATEMENT OF PROFIT OR LOSS AND OTHER COMPREHENSIVE INCOME 34
CONDENSED CONSOLIDATED PROVISIONAL STATEMENT OF FINANCIAL POSITION 35
CONDENSED CONSOLIDATED PROVISIONAL STATEMENT OF CHANGES IN EQUITY 36
CONDENSED CONSOLIDATED PROVISIONAL STATEMENT OF CASH FLOWS 37
NOTES TO THE CONDENSED CONSOLIDATED PROVISIONAL ANNUAL FINANCIAL STATEMENTS 38
CONTENTS
AUDITORS
This summarised report is extracted from audited information, but is not itself audited. The annual financial statements were audited by Ernst & Young Inc. who expressed an unmodified opinion thereon. The audited annual financial statements and the auditor’s report thereon are available for inspection at the Company’s registered office. The directors take full responsibility for the preparation of the preliminary, provisional or abridged report and the financial information has been correctly extracted from the underlying annual financial statements.
BOARD APPROVAL
The condensed consolidated provisional annual financial statements were authorised for issue by the Board of Directors of Telkom (Board) on 12 June 2014.
PREPARER AND SUPERVISOR OF CONDENSED CONSOLIDATED PROVISIONAL ANNUAL FINANCIAL STATEMENTS
These condensed consolidated provisional annual financial statements were prepared by Mr Robin Coode (Group Executive Accounting) and supervised by Mr Deon Fredericks (Acting Chief Financial Officer).
TELKOM SA SOC LIMITED Group Annual Results for the year ended 31 March 2014
34
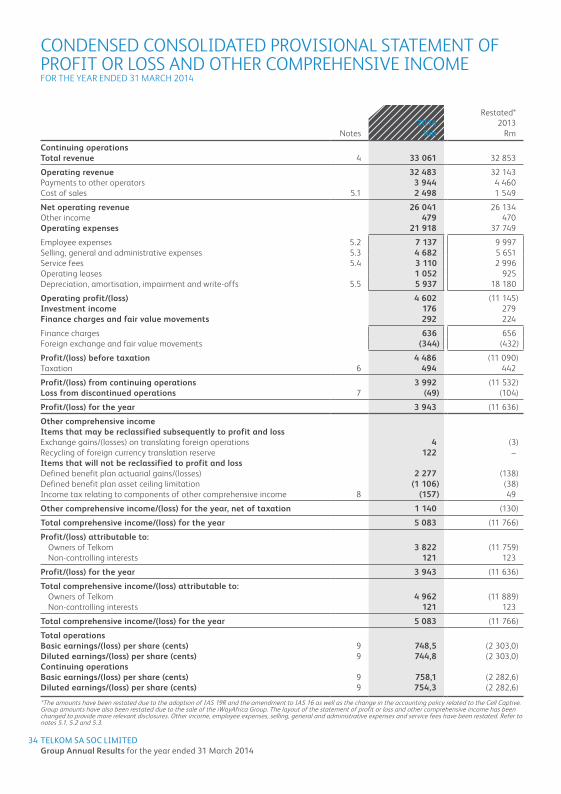
CONDENSED CONSOLIDATED PROVISIONAL STATEMENT OF PROFIT OR LOSS AND OTHER COMPREHENSIVE INCOMEFOR THE YEAR ENDED 31 MARCH 2014
Restated*2014 2013
Notes Rm Rm
Continuing operationsTotal revenue 4 33 061 32 853
Operating revenue 32 483 32 143Payments to other operators 3 944 4 460Cost of sales 5.1 2 498 1 549
Net operating revenue 26 041 26 134Other income 479 470Operating expenses 21 918 37 749
Employee expenses 5.2 7 137 9 997Selling, general and administrative expenses 5.3 4 682 5 651Service fees 5.4 3 110 2 996Operating leases 1 052 925Depreciation, amortisation, impairment and write-offs 5.5 5 937 18 180
Operating profit/(loss) 4 602 (11 145)Investment income 176 279Finance charges and fair value movements 292 224
Finance charges 636 656Foreign exchange and fair value movements (344) (432)
Profit/(loss) before taxation 4 486 (11 090)Taxation 6 494 442
Profit/(loss) from continuing operations 3 992 (11 532)Loss from discontinued operations 7 (49) (104)
Profit/(loss) for the year 3 943 (11 636)
Other comprehensive incomeItems that may be reclassified subsequently to profit and lossExchange gains/(losses) on translating foreign operations 4 (3)Recycling of foreign currency translation reserve 122 –Items that will not be reclassified to profit and lossDefined benefit plan actuarial gains/(losses) 2 277 (138)Defined benefit plan asset ceiling limitation (1 106) (38)Income tax relating to components of other comprehensive income 8 (157) 49
Other comprehensive income/(loss) for the year, net of taxation 1 140 (130)
Total comprehensive income/(loss) for the year 5 083 (11 766)
Profit/(loss) attributable to:Owners of Telkom 3 822 (11 759)Non-controlling interests 121 123
Profit/(loss) for the year 3 943 (11 636)
Total comprehensive income/(loss) attributable to:Owners of Telkom 4 962 (11 889)Non-controlling interests 121 123
Total comprehensive income/(loss) for the year 5 083 (11 766)
Total operationsBasic earnings/(loss) per share (cents) 9 748,5 (2 303,0)Diluted earnings/(loss) per share (cents) 9 744,8 (2 303,0)Continuing operationsBasic earnings/(loss) per share (cents) 9 758,1 (2 282,6)Diluted earnings/(loss) per share (cents) 9 754,3 (2 282,6)
*The amounts have been restated due to the adoption of IAS 19R and the amendment to IAS 16 as well as the change in the accounting policy related to the Cell Captive. Group amounts have also been restated due to the sale of the iWayAfrica Group. The layout of the statement of profit or loss and other comprehensive income has been changed to provide more relevant disclosures. Other income, employee expenses, selling, general and administrative expenses and service fees have been restated. Refer to notes 5.1, 5.2 and 5.3.

TELKOM SA SOC LIMITED Group Annual Results for the year ended 31 March 2014
35
CONDENSED CONSOLIDATED PROVISIONAL STATEMENT OF FINANCIAL POSITIONAT 31 MARCH 2014
Restated* Restated*2014 2013 2012
Notes Rm Rm Rm
ASSETSNon-current assets 31 039 30 353 42 714
Property, plant and equipment 25 123 24 881 36 507 Intangible assets 2 833 2 581 3 555 Other investments 2 759 2 499 2 260 Deferred expenses 35 50 47 Other financial assets 74 83 48 Finance lease receivables 202 219 244 Deferred taxation 13 40 53
Current assets 8 366 11 222 9 825
Inventories 646 760 617 Income tax receivable 8 16 26 Current portion of finance lease receivables 118 131 128 Trade and other receivables 5 565 5 797 5 692 Other financial assets 187 2 134 2 195 Cash and cash equivalents 11 1 842 2 384 1 167
Total assets 39 405 41 575 52 539
EQUITY AND LIABILITIESEquity attributable to owners of the parent 22 771 17 798 29 687
Share capital 5 208 5 208 5 208 Treasury shares (771) (771) (771)Share-based compensation reserve 11 – – Non-distributable reserves 2 580 2 164 1 887 Retained earnings 15 743 11 197 23 363
Non-controlling interests 377 379 434
Total equity 23 148 18 177 30 121 Non-current liabilities 6 156 10 270 12 715
Interest-bearing debt 13 3 775 3 899 5 897 Other financial liabilities – 12 26 Employee related provisions 14 1 388 5 152 4 885 Non-employee related provisions 14 108 238 36 Deferred revenue 869 952 1 132 Deferred taxation 16 17 739
Current liabilities 10 101 13 128 9 703
Trade and other payables 5 119 4 659 4 285 Shareholders for dividend 21 22 23 Current portion of interest-bearing debt 13 321 2 758 1 289 Current portion of employee related provisions 14 1 597 2 605 1 652 Current portion of non-employee related provisions 14 731 786 240 Current portion of deferred revenue 1 431 1 740 1 995 Income tax payable 782 501 87 Current portion of other financial liabilities 98 54 129 Credit facilities utilised 11 1 3 3
Total liabilities 16 257 23 398 22 418
Total equity and liabilities 39 405 41 575 52 539
*The amounts have been restated due to the adoption of IAS 19R, amendment to IAS 16 as well as the change in the accounting policy related to the Cell Captive.
TELKOM SA SOC LIMITED Group Annual Results for the year ended 31 March 2014
36
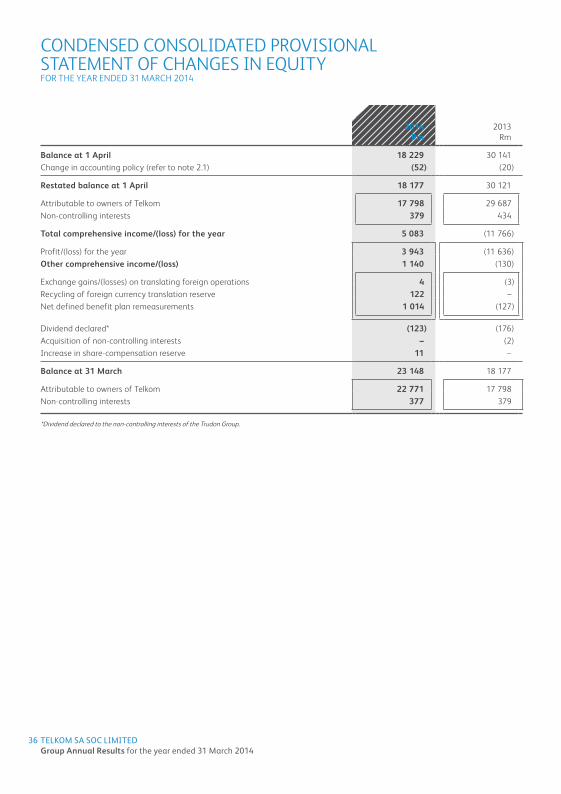
2014 2013Rm Rm
Balance at 1 April 18 229 30 141 Change in accounting policy (refer to note 2.1) (52) (20)
Restated balance at 1 April 18 177 30 121
Attributable to owners of Telkom 17 798 29 687 Non-controlling interests 379 434
Total comprehensive income/(loss) for the year 5 083 (11 766)
Profit/(loss) for the year 3 943 (11 636)Other comprehensive income/(loss) 1 140 (130)
Exchange gains/(losses) on translating foreign operations 4 (3)Recycling of foreign currency translation reserve 122 –Net defined benefit plan remeasurements 1 014 (127)
Dividend declared* (123) (176)Acquisition of non-controlling interests – (2)Increase in share-compensation reserve 11 –
Balance at 31 March 23 148 18 177
Attributable to owners of Telkom 22 771 17 798 Non-controlling interests 377 379
*Dividend declared to the non-controlling interests of the Trudon Group.
CONDENSED CONSOLIDATED PROVISIONALSTATEMENT OF CHANGES IN EQUITYFOR THE YEAR ENDED 31 MARCH 2014
TELKOM SA SOC LIMITED Group Annual Results for the year ended 31 March 2014
37
2014 2013Note Rm Rm
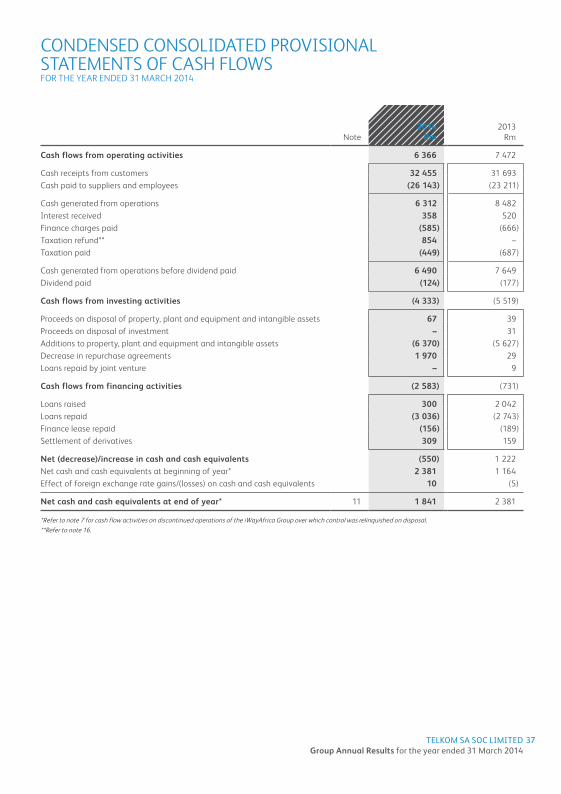
Cash flows from operating activities 6 366 7 472
Cash receipts from customers 32 455 31 693 Cash paid to suppliers and employees (26 143) (23 211)
Cash generated from operations 6 312 8 482 Interest received 358 520 Finance charges paid (585) (666)Taxation refund** 854 –Taxation paid (449) (687)
Cash generated from operations before dividend paid 6 490 7 649 Dividend paid (124) (177)
Cash flows from investing activities (4 333) (5 519)
Proceeds on disposal of property, plant and equipment and intangible assets 67 39 Proceeds on disposal of investment – 31 Additions to property, plant and equipment and intangible assets (6 370) (5 627)Decrease in repurchase agreements 1 970 29 Loans repaid by joint venture – 9
Cash flows from financing activities (2 583) (731)
Loans raised 300 2 042 Loans repaid (3 036) (2 743)Finance lease repaid (156) (189)Settlement of derivatives 309 159
Net (decrease)/increase in cash and cash equivalents (550) 1 222 Net cash and cash equivalents at beginning of year* 2 381 1 164 Effect of foreign exchange rate gains/(losses) on cash and cash equivalents 10 (5)
Net cash and cash equivalents at end of year* 11 1 841 2 381
*Refer to note 7 for cash flow activities on discontinued operations of the iWayAfrica Group over which control was relinquished on disposal.**Refer to note 16.
CONDENSED CONSOLIDATED PROVISIONAL STATEMENTS OF CASH FLOWSFOR THE YEAR ENDED 31 MARCH 2014

TELKOM SA SOC LIMITED Group Annual Results for the year ended 31 March 2014
38
1. CORPORATE INFORMATIONTelkom SA SOC Limited (Telkom) is a Company incorporated and domiciled in the Republic of South Africa (South Africa) whose shares are publicly traded. The main objective of Telkom, its subsidiaries and associate (the Group) is to supply telecommunication, multimedia, technology, information and other related information technology services to Telkom’s customers, as well as mobile communication services, in South Africa.
2. BASIS OF PREPARATION AND ACCOUNTING POLICIESBasis of preparationThe condensed consolidated provisional annual financial statements have been prepared in accordance with IAS 34 Interim Financial Reporting and in compliance with the Listings Requirements of the JSE Limited and the South African Companies Act, 2008.
The condensed consolidated provisional annual financial statements are presented in South African Rand, which is the Group’s functional currency. All financial information presented in Rand has been rounded off to the nearest million.
The condensed consolidated provisional annual financial statements are prepared on the historical cost basis, with the exception of certain financial instruments initially (and sometimes subsequently) measured at fair value. Details of the Group’s significant accounting policies are set out below and are consistent with those applied in the previous financial year except for the following:• IAS16(amendment)Property,PlantandEquipment:ClassificationofServiceEquipment• IAS19REmployeeBenefits• IFRS10 Consolidation of Cell Captive
Significant accounting judgements, estimates and assumptionsIn preparing these condensed consolidated provisional annual financial statements, the significant judgements made by management in applying the Group’s accounting policies and the key sources of estimation uncertainty were consistent with those applied to the consolidated financial statements for the year ended 31 March 2013 with the exception of the curtailment to the Post-retirement Medical Aid liability, hedge accounting, taxation, the employee share scheme and government grants.
Significant accounting policiesThe condensed consolidated provisional annual financial statements have been prepared in accordance with the accounting policies adopted in the Group’s last annual financial statements for the year ended 31 March 2013, except for the adoption of the amendments, new standards described below and the application of fair value hedge accounting.
2.1 Adoption of new standards and amendmentsIAS 16 (amendment) Property, Plant and Equipment: Classification of Service EquipmentThe amendment clarifies that spare parts and servicing equipment are classified as property, plant and equipment rather than inventory when they meet the definition of property, plant and equipment. Previously the Group classified strategic spare parts which were not considered as major parts, as inventory.
Following the amendment, the Group reclassified spare parts with a carrying amount of R357 million (31 March 2012: R352 million) from inventory to property, plant and equipment. The useful lives of the spare parts have been estimated to be approximately five years.
IAS 19R Employee BenefitsIAS 19R Employee Benefits prescribes a number of changes to the accounting for employee benefits. As a result of adopting the revised standard, the Group has changed it’s accounting policy with respect to the basis for determining the income or expense related to the Group’s defined benefit plans. These adjustments were made on a retrospective basis.
The standard replaces the interest cost on the defined benefit obligation and the expected return on plan assets with a net interest cost based on the net defined benefit asset or liability and the discount rate, measured at the beginning of the year. This has increased profit or loss charge as the discount rate applied to assets is lower than the expected return on assets. This has no effect on total comprehensive income as the increased charge in profit or loss is offset by a credit in other comprehensive income relating to the actuarial gains and losses and asset limitations.
NOTES TO THE CONDENSED CONSOLIDATED PROVISIONAL ANNUAL FINANCIAL STATEMENTSFOR THE YEAR ENDED 31 MARCH 2014
TELKOM SA SOC LIMITED Group Annual Results for the year ended 31 March 2014
39
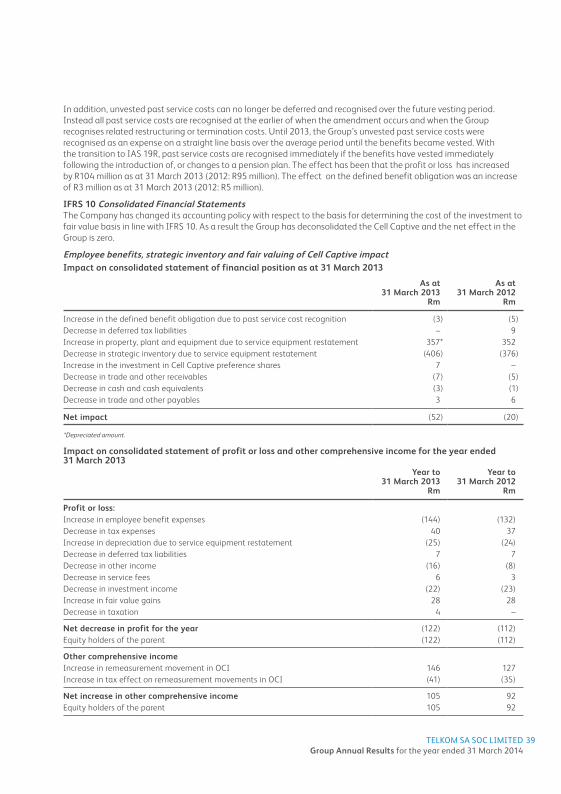
In addition, unvested past service costs can no longer be deferred and recognised over the future vesting period. Instead all past service costs are recognised at the earlier of when the amendment occurs and when the Group recognises related restructuring or termination costs. Until 2013, the Group’s unvested past service costs were recognised as an expense on a straight line basis over the average period until the benefits became vested. With the transition to IAS 19R, past service costs are recognised immediately if the benefits have vested immediately following the introduction of, or changes to a pension plan. The effect has been that the profit or loss has increased by R104 million as at 31 March 2013 (2012: R95 million). The effect on the defined benefit obligation was an increase of R3 million as at 31 March 2013 (2012: R5 million).
IFRS 10 Consolidated Financial StatementsThe Company has changed its accounting policy with respect to the basis for determining the cost of the investment to fair value basis in line with IFRS 10. As a result the Group has deconsolidated the Cell Captive and the net effect in the Group is zero.
Employee benefits, strategic inventory and fair valuing of Cell Captive impactImpact on consolidated statement of financial position as at 31 March 2013
As at31 March 2013
Rm
As at31 March 2012
Rm
Increase in the defined benefit obligation due to past service cost recognition (3) (5)Decrease in deferred tax liabilities – 9 Increase in property, plant and equipment due to service equipment restatement 357* 352 Decrease in strategic inventory due to service equipment restatement (406) (376)Increase in the investment in Cell Captive preference shares 7 –Decrease in trade and other receivables (7) (5)Decrease in cash and cash equivalents (3) (1)Decrease in trade and other payables 3 6
Net impact (52) (20)
*Depreciated amount.
Impact on consolidated statement of profit or loss and other comprehensive income for the year ended 31 March 2013
Year to31 March 2013
Rm
Year to31 March 2012
Rm
Profit or loss:Increase in employee benefit expenses (144) (132)Decrease in tax expenses 40 37 Increase in depreciation due to service equipment restatement (25) (24)Decrease in deferred tax liabilities 7 7 Decrease in other income (16) (8)Decrease in service fees 6 3Decrease in investment income (22) (23)Increase in fair value gains 28 28Decrease in taxation 4 –
Net decrease in profit for the year (122) (112)Equity holders of the parent (122) (112)
Other comprehensive incomeIncrease in remeasurement movement in OCI 146 127Increase in tax effect on remeasurement movements in OCI (41) (35)
Net increase in other comprehensive income 105 92Equity holders of the parent 105 92
TELKOM SA SOC LIMITED Group Annual Results for the year ended 31 March 2014
40
2. BASIS OF PREPARATION AND ACCOUNTING POLICIES (continued)2.1 Adoption of new standards and amendments (continued)
There was no material impact on the Group’s consolidated statement of cash flows. The basic and diluted earnings per share moved from a loss of 2 276,2 cents as previously reported to a loss of 2 303,0 cents for the year ended 31 March 2013. The headline earnings and diluted headline earnings per share moved from 87,0 cents as previously reported to 60,1 cents for the year ended 31 March 2013.
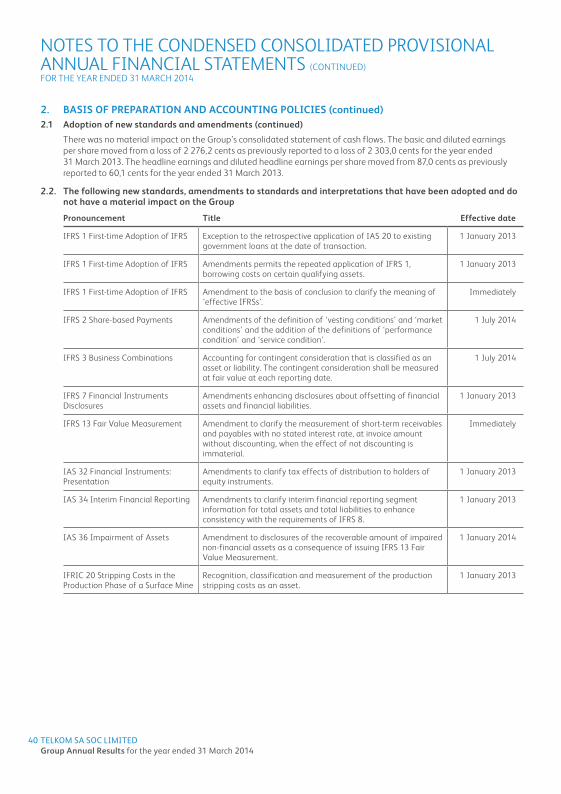
2.2. The following new standards, amendments to standards and interpretations that have been adopted and do not have a material impact on the Group
Pronouncement Title Effective date
IFRS 1 First-time Adoption of IFRS Exception to the retrospective application of IAS 20 to existing government loans at the date of transaction.
1 January 2013
IFRS 1 First-time Adoption of IFRS Amendments permits the repeated application of IFRS 1, borrowing costs on certain qualifying assets.
1 January 2013
IFRS 1 First-time Adoption of IFRS Amendment to the basis of conclusion to clarify the meaning of ‘effective IFRSs’.
Immediately
IFRS 2 Share-based Payments Amendments of the definition of ‘vesting conditions’ and ‘market conditions’ and the addition of the definitions of ‘performance condition’ and ‘service condition’.
1 July 2014
IFRS 3 Business Combinations Accounting for contingent consideration that is classified as an asset or liability. The contingent consideration shall be measured at fair value at each reporting date.
1 July 2014
IFRS 7 Financial Instruments Disclosures
Amendments enhancing disclosures about offsetting of financial assets and financial liabilities.
1 January 2013
IFRS 13 Fair Value Measurement Amendment to clarify the measurement of short-term receivables and payables with no stated interest rate, at invoice amount without discounting, when the effect of not discounting is immaterial.
Immediately
IAS 32 Financial Instruments: Presentation
Amendments to clarify tax effects of distribution to holders of equity instruments.
1 January 2013
IAS 34 Interim Financial Reporting Amendments to clarify interim financial reporting segment information for total assets and total liabilities to enhance consistency with the requirements of IFRS 8.
1 January 2013
IAS 36 Impairment of Assets Amendment to disclosures of the recoverable amount of impaired non-financial assets as a consequence of issuing IFRS 13 Fair Value Measurement.
1 January 2014
IFRIC 20 Stripping Costs in the Production Phase of a Surface Mine
Recognition, classification and measurement of the production stripping costs as an asset.
1 January 2013
NOTES TO THE CONDENSED CONSOLIDATED PROVISIONAL ANNUAL FINANCIAL STATEMENTS (CONTINUED)FOR THE YEAR ENDED 31 MARCH 2014
TELKOM SA SOC LIMITED Group Annual Results for the year ended 31 March 2014
41
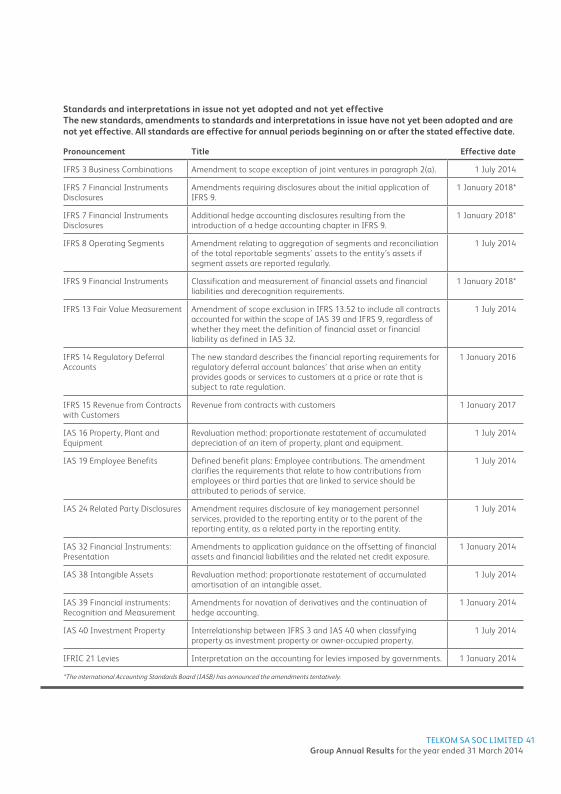
Standards and interpretations in issue not yet adopted and not yet effectiveThe new standards, amendments to standards and interpretations in issue have not yet been adopted and are not yet effective. All standards are effective for annual periods beginning on or after the stated effective date.
Pronouncement Title Effective date
IFRS 3 Business Combinations Amendment to scope exception of joint ventures in paragraph 2(a). 1 July 2014
IFRS 7 Financial Instruments Disclosures
Amendments requiring disclosures about the initial application of IFRS 9.
1 January 2018*
IFRS 7 Financial Instruments Disclosures
Additional hedge accounting disclosures resulting from the introduction of a hedge accounting chapter in IFRS 9.
1 January 2018*
IFRS 8 Operating Segments Amendment relating to aggregation of segments and reconciliation of the total reportable segments’ assets to the entity’s assets if segment assets are reported regularly.
1 July 2014
IFRS 9 Financial Instruments Classification and measurement of financial assets and financial liabilities and derecognition requirements.
1 January 2018*
IFRS 13 Fair Value Measurement Amendment of scope exclusion in IFRS 13.52 to include all contracts accounted for within the scope of IAS 39 and IFRS 9, regardless of whether they meet the definition of financial asset or financial liability as defined in IAS 32.
1 July 2014
IFRS 14 Regulatory Deferral Accounts
The new standard describes the financial reporting requirements for regulatory deferral account balances’ that arise when an entity provides goods or services to customers at a price or rate that is subject to rate regulation.
1 January 2016
IFRS 15 Revenue from Contracts with Customers
Revenue from contracts with customers 1 January 2017
IAS 16 Property, Plant and Equipment
Revaluation method: proportionate restatement of accumulated depreciation of an item of property, plant and equipment.
1 July 2014
IAS 19 Employee Benefits Defined benefit plans: Employee contributions. The amendment clarifies the requirements that relate to how contributions from employees or third parties that are linked to service should be attributed to periods of service.
1 July 2014
IAS 24 Related Party Disclosures Amendment requires disclosure of key management personnel services, provided to the reporting entity or to the parent of the reporting entity, as a related party in the reporting entity.
1 July 2014
IAS 32 Financial Instruments: Presentation
Amendments to application guidance on the offsetting of financial assets and financial liabilities and the related net credit exposure.
1 January 2014
IAS 38 Intangible Assets Revaluation method: proportionate restatement of accumulated amortisation of an intangible asset.
1 July 2014
IAS 39 Financial instruments: Recognition and Measurement
Amendments for novation of derivatives and the continuation of hedge accounting.
1 January 2014
IAS 40 Investment Property Interrelationship between IFRS 3 and IAS 40 when classifying property as investment property or owner-occupied property.
1 July 2014
IFRIC 21 Levies Interpretation on the accounting for levies imposed by governments. 1 January 2014
*The international Accounting Standards Board (IASB) has announced the amendments tentatively.

TELKOM SA SOC LIMITED Group Annual Results for the year ended 31 March 2014
42
3. SEGMENT INFORMATIONThe Executive Committee (Chief operating decision maker) manages the business on a combined basis. This reflects the financial information reviewed by the Executive Committee when making decisions about performance and resource allocation and is consistent with the manner in which the Telkom network generates revenue, ie on a combined basis. As a result, Telkom has a single operating and reporting segment. No Group geographical information is provided as the majority of the Group’s operations are carried out in South Africa.
The Telkom segment provides fixed-line access, fixed-line usage, data communications services (through Telkom and Cybernest), mobile voice and data services and handset sales.
Restated2014 2013
Rm Rm
4. TOTAL REVENUE 33 061 32 853
Operating revenue 32 483 32 143Other income (excluding profit on disposal of property, plant and equipment, intangible assets, investments and profit on disposal of subsidiary) 402 431Investment income 176 279
Operating revenue increased due to higher mobile handset and equipment sales, growth in mobile and IT Business services data revenue, offset by a decline in voice revenue.Change in comparativeOther income has increased by R128 million as it was reclassified from selling and administrative expenses to sundry income.This is income in nature and it is more appropriate to report this income under the other income category instead of being offset against selling, general and administration expenditure.
5. OPERATING EXPENSES 5.1 Cost of sales 2 498 1 549
The increase in the cost of sales is mainly due to increased customer premises equipment sales.Change in comparativesIn order to achieve a more relevant presentation a decision was made to reclassify items from selling, general and administrative expenses to cost of sales. Refer to note 5.3.
5.2 Employee expenses* 7 137 9 997 The decrease in employee expenses is mainly due to a net curtailment gain of R2,2 billion related to the post-retirement medical aid benefit that has been reduced. The average salary increase and the adoption of IAS 19R adversely impacted employee expenses.Change in comparativesOther benefits increased by R84 million due to the reclassification of employee vehicle insurance expense from security and other expenses (under service fees). These are short-term employee benefits derived from employment with Telkom and has therefore been reclassified accordingly to provide more relevant disclosure.
*Restated due to the adoption of IAS 19R (refer note 2.1).
NOTES TO THE CONDENSED CONSOLIDATED PROVISIONAL ANNUAL FINANCIAL STATEMENTS (CONTINUED)FOR THE YEAR ENDED 31 MARCH 2014

TELKOM SA SOC LIMITED Group Annual Results for the year ended 31 March 2014
43
Restated2014 2013
Rm Rm
5.3 Selling, general and administrative expenses 4 682 5 651 The decrease in selling, general and administrative expenses is mainly due to a decrease in maintenance and material expenses, lower bad debts and the Competition Commission fine that was accounted for in 2013.
Included in selling, general and administrative expenses is a net loss of R29 million on the disposal of the iWayAfrica Group. This net loss includes foreign exchange losses of R122 million and disposal costs of R6 million. This relates to the cumulative amount of foreign exchange differences previously recognised in other comprehensive income, now realised in profit or loss due to the disposal of the iWayAfrica Group.
Change in comparativesSelling, general and administrative expenses have decreased by R1 549 million, due to the reclassification of expenses to cost of sales. In addition, sundry income of R128 million was reclassified to other income. This was done in order to provide more relevant disclosure.
5.4 Service fees 3 110 2 996 The increase in service fees is driven by costs relating to the transformation process, higher utilities and maintenance costs on Telkom properties.
Change in comparativeService fees decreased by R84 million due to the reclassification of employee vehicle insurance expenses to employee expenses. These are short-term employee benefits derived from employment with Telkom and has therefore been reclassified accordingly to provide more relevant disclosure. Refer to note 5.2.
5.5 Depreciation, amortisation, impairment and write-offs 5 937 18 180
Depreciation of property, plant and equipment 4 616 5 097 Amortisation of intangible assets 689 906 Impairment of property, plant and equipment and intangible assets 392 12 000 Write-offs of property, plant and equipment and intangible assets 240 177
Depreciation and amortisation decreased as a result of a lower asset base after a R12 billion impairment of assets in March 2013, partially offset by accelerated depreciation emanating from the review of the useful lives of drop wires installed at customer premises. The impairment at year end relates to property, plant and equipment that was reclassified from inventories following a change in the accounting policy.
6. TAXATION 494 442
South African normal company taxation 625 1 101 Deferred taxation (131) (659)
Normal tax decreased mainly as a result of employee related provisions that realised during the current year. Deferred tax income decreased due to the deferred tax asset which is limited to zero. During 2013 the full deferred tax opening balance was limited through the statement of profit or loss.

TELKOM SA SOC LIMITED Group Annual Results for the year ended 31 March 2014
44
2014 2013Rm Rm
7. DISCONTINUED OPERATIONPan African business, iWayAfrica and Africa Online MauritiusOn 20 December 2013, Telkom sold the Pan African business, iWayAfrica and Africa Online Mauritius, through a private sale to Gondwana International Networks.iWayAfrica was formed as the result of the amalgamation of MWEB Africa and Africa Online in 2007 when MWEB Africa was purchased by Telkom. The iWayAfrica business operates in eight countries on the continent offering terrestrial wireless and VSAT services to business and residential markets, as well as via its channel partners in many other countries on the continent.Telkom’s investment in iWayAfrica was already fully impaired at 31 March 2012. Gondwana took over the assets and liabilities (including amounts owed by Telkom) for a nominal consideration.Analysis of the results of the discontinued operations:Revenue* 240 403 Expenses* (289) (496)
Loss before taxation of the discontinued operations (49) (93)Taxation – (11)
Loss after taxation of the discontinued operations (49) (104)
*Revenue comprises operating revenue, other income and investment income. Expenses comprise operating expenses and finance charges.
The net cash flows attributable to the operating, investing and financing activities of discontinued operations:Operating cash flows (38) –
Total cash outflow* (38) –
*Cash flows included for 2014 are up to December 2013. At 20 December 2013, on the disposal date, iWayAfrica had R48 million cash on hand.
Restated2014 2013
Rm Rm
8. TAXATION EFFECTS OF OTHER COMPREHENSIVE INCOMETax effects relating to each component of other comprehensive incomeExchange gains/(losses) on translating foreign operations 4 (3)Recycling of foreign currency translation reserve 122 –
Net foreign currency translation gains/(losses) for foreign operations 126 (3)
Defined benefit plan actuarial gains/(losses)* 2 277 (138)Tax effect of defined benefit plan actuarial gains/(losses)* (306) 39
Net defined benefit plan actuarial gains/(losses)* 1 971 (99)
Defined benefit plan asset ceiling limitation (1 106) (38)Tax effect of defined benefit plan asset ceiling limitation 149 10
Net defined benefit plan asset ceiling limitation (957) (28)
Other comprehensive income/(loss) for the year before taxation 1 297 (179)Tax effect of other comprehensive income/(loss) for the year (157) 49
Other comprehensive income/(loss) for the year, net of taxation 1 140 (130)
*Restated due to the adoption of IAS 19R.
NOTES TO THE CONDENSED CONSOLIDATED PROVISIONAL ANNUAL FINANCIAL STATEMENTS (CONTINUED)FOR THE YEAR ENDED 31 MARCH 2014

TELKOM SA SOC LIMITED Group Annual Results for the year ended 31 March 2014
45
Restated2014 2013
Rm Rm
9. EARNINGS PER SHARETotal operationsBasic earnings/(loss) per share (cents) 748,5 (2 303,0)Diluted earnings/(loss) per share (cents) 744,8 (2 303,0)Headline earnings per share (cents)* 851,4 60,1 Diluted headline earnings per share (cents)* 847,1 60,1 Continuing operationsBasic earnings/(loss) per share (cents) 758,1 (2 282,6)Diluted earnings/(loss) per share (cents) 754,3 (2 282,6)Headline earnings per share (cents)* 861,0 86,2 Diluted headline earnings per share (cents)* 856,6 86,2 Discontinued operationBasic loss per share (cents) (9,6) (20,4)Diluted loss per share (cents) (9,5) (20,4)Headline loss per share (cents)* (9,6) (26,1)Diluted headline loss per share (cents)* (9,5) (26,1)
Reconciliation of weighted average number of ordinary shares: Number of shares Number of shares
Ordinary shares in issue 520 783 900 520 783 900 Weighted average number of treasury shares (10 190 084) (10 190 084)
Weighted average number of shares outstanding 510 593 816 510 593 816
Reconciliation of diluted weighted average number of ordinary sharesWeighted average number of shares outstanding 510 593 816 510 593 816 Expected future vesting of shares 2 587 629 –
Diluted weighted average number of shares outstanding 513 181 445 510 593 816
*The disclosure of headline earnings is a requirement of the JSE Limited and is not a recognised measure under IFRS. It has been calculated in accordance with the South African Institute of Chartered Accountants’ circular 2/2013 issued in this regard.

TELKOM SA SOC LIMITED Group Annual Results for the year ended 31 March 2014
46
Restated2014 2013
Rm Rm
9. EARNINGS PER SHARE (continued)Total operationsReconciliation between earnings and headline earnings***Profit/(loss) for the year 3 943 (11 636)Non-controlling interests (121) (123)
Profit/(loss) attributable to Owners of Telkom 3 822 (11 759)Profit on disposal of property, plant and equipment and intangible assets (77) (39)Loss on disposal of subsidiary 23 –Impairment loss on property, plant and equipment and intangible assets** 392 12 000Profit on disposal of joint venture – (30)Write-offs of property, plant and equipment and intangible assets 240 178Taxation effects (53) (43)
Headline earnings 4 347 307
Continuing operationsReconciliation between earnings and headline earnings***Profit/(loss) from continuing operations 3 992 (11 532)Non-controlling interests (121) (123)
Profit/(loss) attributable to Owners of Telkom 3 871 (11 655)Profit on disposal of property, plant and equipment and intangible assets (77) (39)Loss on disposal of subsidiary 23 –Impairment loss on property, plant and equipment and intangible assets** 392 12 000Write-offs of property, plant and equipment and intangible assets 240 177Taxation effects (53) (43)
Headline earnings 4 396 440
Discontinued operationReconciliation between earnings and headline earnings***Loss from discontinued operation (49) (104)
Loss attributable to owners of Telkom (49) (104)Profit on disposal of joint venture – (30)Write-offs of property, plant and equipment and intangible assets – 1
Headline loss (49) (133)
* Net of taxation.**The impairment resulted in deferred taxation consequences that were not recognised in the statement of financial position.***The amounts have been restated due to the adoption of IAS 19R and the amendment to IAS 16 as well as the sale of the iWayAfrica Group.
NOTES TO THE CONDENSED CONSOLIDATED PROVISIONAL ANNUAL FINANCIAL STATEMENTS (CONTINUED)FOR THE YEAR ENDED 31 MARCH 2014

TELKOM SA SOC LIMITED Group Annual Results for the year ended 31 March 2014
47
2014 2013Rm Rm
10. CAPITAL ADDITIONS AND DISPOSALSProperty, plant and equipment
Additions 5 695 4 807 Disposals (17) (22)
Intangible assets Additions 763 961 Disposals – (1)
A major portion of additions to property, plant and equipment relates to the expansion of existing networks and the next generation network. Intangible assets additions mainly relate to software.
Restated2014 2013
Rm Rm
11. NET CASH AND CASH EQUIVALENTS 1 841 2 381
Cash shown as current assets 1 842 2 384
Cash and bank balances 193 231 Short-term deposits 1 649 2 153
Credit facilities utilised (1) (3)
The decrease in cash and cash equivalents is mainly due to the repayment of the syndicated loan of R2 billion. This was partly offset by the utilisation of repurchase agreements.
12. FINANCIAL RISK MANAGEMENTExposure to continuously changing market conditions has made management of financial risk critical for the Group. Treasury policies, risk limits and control procedures are continuously monitored by the Board of Directors through its Audit Committee and Risk Committee.
The condensed consolidated provisional annual financial statements do not include all financial risk management information and disclosures required in the annual financial statements, and should be read in conjunction with the Group’s annual financial statements as at 31 March 2014. The Group enters into derivative transaction as hedging instruments from the current financial year.
12.1 Liquidity risk
Liquidity risk is the risk that the Group will not be able to meet its financial obligations as they fall due. The Group is exposed to liquidity risk as a result of uncertain cash flows as well as capital commitments of the Group.
Liquidity risk is managed by the Group’s Treasury team in accordance with policies and guidelines formulated by the Group’s executive committee. In terms of its borrowing requirements the Group ensures that sufficient facilities exist to meet its immediate obligations.
Compared to the 2013 financial year-end, there was no material change in the contractual undiscounted cash out flows for financial liabilities.
12.2 Fair value of financial instruments
The carrying amount of financial instruments approximate fair value, with the exception of interest-bearing debt (at amortised cost) which has a fair value of R4 752 million (2013: R7 661 million) and a carrying amount of R4 096 million (2013: R6 657 million) (refer to note 13).

TELKOM SA SOC LIMITED Group Annual Results for the year ended 31 March 2014
48
12. FINANCIAL RISK MANAGEMENT (continued)12.2 Fair Value of financial instruments (continued)
Valuation techniques and assumptions applied for the purposes of measuring fair value
Type of financial instrumentFair value at
31 March 2014 Valuation technique Significant inputs
Receivables, bank balances, repurchase agreements, and other liquid funds, payables and accruals, credit facilities utilised and shareholders for dividends
R4 783 million Undiscounted future estimated cash flows due to short-term maturities of these instruments
Probability of default
Derivatives R163 million Discounted cash flows Yield curvesMarket interest rateMarket foreign currency rate
Borrowings R4 752 million Discounted cash flows and quoted bond prices
Market interest rate
Market foreign currency rate
The estimated net fair values as at the reporting date, have been determined using available market information and appropriate valuation methodologies as outlined below. This value is not necessarily indicative of the amounts that the Group could realise in the normal course of business.
Derivatives are recognised at fair value. The fair values of derivatives are determined using quoted prices or, where such prices are not available, a discounted cash flow analysis is used. These amounts reflect the approximate values of the net derivative position at the reporting date. The fair values of listed investments are based on quoted market prices.
The fair values of the borrowings disclosed above are based on quoted prices or, where such prices are not available, the expected future payments discounted at market interest rates. As a result they differ from carrying values.
The fair value of receivables, bank balances, repurchase agreements and other liquid funds, payables and accruals, approximate their carrying amount due to the short-term maturities of these instruments.
12.3 Fair value hierarchy
The table below analyses financial instruments carried at fair value and amortised cost, by valuation method.
The different levels have been defined as follows:(a) Quoted prices in active markets for identical assets or liabilities (level 1).(b) Inputs other than quoted prices, that are observable for the asset or liability (level 2).(c) Inputs for the asset or liability that are not based on observable market data (level 3).
The following table presents the Group’s assets and liabilities that are measured at fair value and amortised cost:
Total Level 1 Level 2 Level 32014 Rm Rm Rm Rm
Assets measured at fair valueForward exchange contracts 139 – 139 – Investment in Cell Captive preference shares 2 755 2 755 – – Firm commitments 4 – 4 – Cross currency swaps 118 – 118 –
Liabilities measured at fair valueForward exchange contracts (61) – (61) – Firm commitments (37) – (37) –
Liabilities measured at amortised costInterest-bearing debt (4 752) (3 445) (1 307) –
NOTES TO THE CONDENSED CONSOLIDATED PROVISIONAL ANNUAL FINANCIAL STATEMENTS (CONTINUED)FOR THE YEAR ENDED 31 MARCH 2014

TELKOM SA SOC LIMITED Group Annual Results for the year ended 31 March 2014
49
Total Level 1 Level 2 Level 32013 Rm Rm Rm Rm
Assets measured at fair valueForward exchange contracts 132 – 132 – Investment in Cell Captive preference shares 2 496 595 1 901 – Transfer to level 1* – 1 901 (1 901) – Cross currency swaps 105 – 105 –
Liabilities measured at fair valueInterest rate swaps (51) – (51) – Forward exchange contracts (15) – (15) –
Liabilities measured at amortised costInterest-bearing debt (7 661) (3 882) (3 779) –
The fair value of the financial assets and financial liabilities are sensitive to exchange rate and interest rate movements. The Rand depreciated against major currencies for the financial year resulting in unrealised fair value gains. The volatility of the exchange rates also had an impact on the fair values of these instruments.
*During the 2013 financial year, the Investment in Cell Captive’s preference shares with a market value of R1 901 million was transferred from fair value level 2 to fair value level 1. The reason for the transfer is that the prices for each of the assets held in the absolute return investment portfolio were obtained from recognised market sources.
2014 2013Rm Rm
13. INTEREST-BEARING DEBTNon-current interest-bearing debt 3 775 3 899
Local debt 2 815 2 730 Foreign debt 307 456 Finance leases 653 713
Current portion of interest-bearing debt 321 2 758
Local debt – 2 494 Foreign debt 236 207 Finance leases 85 57
The Company repaid the syndicated loan of R2 billion out of available cash during the reporting period.
The current portion of interest-bearing debt of R321 million (nominal) is expected to be repaid from available operational cash flow and/or the issue of new debt instruments.
Management believes that sufficient funding facilities will be available at the date of repayment.

TELKOM SA SOC LIMITED Group Annual Results for the year ended 31 March 2014
50
Restated2014 2013
Rm Rm
14. PROVISIONSNon-current portion of provisions 1 496 5 390
Employee related 1 388 5 152Non-employee related 108 238
Current portion of provisions 2 328 3 391
Employee related 1 597 2 605Non-employee related 731 786
The decrease in non-current employee related provisions is mainly due to the effect of the net curtailment gain of R2,2 billion recognised on the post-retirement medical aid benefit. Telkom allowed eligible employees the option to transfer their post-retirement medical aid benefit to an insurer The Company curtailed the medical cap increase to 0% for active members due to rising operational costs and affordability. Of the 9 302 eligible employees, 7 654 employees exercised their option to transfer their benefit to an insurer.Non-employee related provisions decreased due to the partial payment of the fine imposed by the Competition Commission.The reduction of the current portion of employee related provisions is attributable to the post-retirement medical aid curtailment and decreased bonus provision due to lower headcount.
2014 2013Rm Rm
15. COMMITMENTSCapital commitments authorised 5 055 7 542
Commitments against authorised capital expenditure 1 132 2 855Authorised capital expenditure not yet contracted 3 923 4 687
Capital commitments are largely attributable to purchases of property, plant and equipment and software.
16. CONTINGENCIESCONTINGENT LIABILITIESCompetition mattersCompetition Commission Multiple Complaints ReferralIn 2009 the Competition Commission (CC) referred complaints against Telkom by MWeb and IS as well as the Internet Service Providers’ Association, MWeb, IS and Verizon respectively, to the CT (the Multiple Complaints Referral). Telkom and the CC signed a settlement agreement on 14 June 2013, in settlement of the Multiple Complaints Referral. In terms of this settlement agreement, Telkom admitted that its conduct during the complaint period amounted to a contravention of sections 8(c)(margin squeeze) and 8(d)(iii)(bundling and tying) of the Competition Act. In terms of the settlement agreement, Telkom has agreed to pay an administrative penalty of R200 million, payable in three equal instalments, payable in 2013, 2014 and 2015. Telkom furthermore committed to certain price reductions in the 2014, 2015 and 2016 financial years as well as to certain behavioural remedies.
NOTES TO THE CONDENSED CONSOLIDATED PROVISIONAL ANNUAL FINANCIAL STATEMENTS (CONTINUED)FOR THE YEAR ENDED 31 MARCH 2014

TELKOM SA SOC LIMITED Group Annual Results for the year ended 31 March 2014
51
Matters before ICASAPhutuma Networks (Pty) Ltd (Phutuma)Phutuma filed a complaint against Telkom at ICASA’s Complaints and Compliance Committee (the CCC) in February 2010. The matter was ultimately heard during May 2014, during which Phutuma withdrew its complaint at the CCC. The CCC intimated that it would recommend to ICASA that certain regulatory issues should be addressed by ICASA. Phutuma’s complaint at the CCC is thus finalised.
End-user and Service Charter Regulations Allegations have been made at the CCC regarding Telkom’s alleged non-compliance with the requirements of the End-user and Service Charter Regulations relating to the clearance of reported faults. A hearing has taken place and, the CCC has ruled that Telkom is not in breach of the regulations and recommend that ICASA review the regulations which, as they stand, are not capable of implementation. Telkom, however, has already initiated administrative review proceedings seeking to set-aside the applicability of the Regulations since the CCC ruling is not binding on ICASA and the risk remains for similar referrals. The review application has not been finalised as yet.
Telkom/ICASA, Neotel and CCCNeotel requested Telkom to provide access to Telkom’s local loop in November 2010 in terms of the Electronic Communications Facilities Leasing Regulations of 2010. Telkom declined the request and Neotel submitted a formal complaint to ICASA. ICASA referred the complaint to the CCC, which made an order (the CCC Order), directing Telkom to provide Neotel access to Telkom’s local loop. Telkom launched an interim relief application (for an order that the CCC Order not be implemented pending the review application) and a review application in the High Court to review and set aside the CCC Order. The parties have since agreed to a court order by consent in terms of which Telkom withdrew its application for interim relief and ICASA in turn undertook not to implement the CCC Order pending the outcome of Telkom’s application for review. No date has been set down as yet for the hearing of the review application.
Supplier disputeRadio Surveillance Security Services (Pty) Ltd (RSSS)RSSS served two summonses on Telkom for the sums of R215 661 866 (including VAT) and R9 913 782 (including VAT) respectively but Telkom has settled the lesser amount. Telkom is defending the larger claim and has filed a plea and counterclaim for R22 million. Pleadings have closed and preparation for trial is under way.
High CourtPhutuma Networks (Pty) Ltd (Phutuma)In August 2009 Phutuma served a summons on Telkom, claiming for damages arising from a tender published by Telkom in November 2007 for the outsourcing of the Telex and Gentex services and for the provision of a solution to support the maritime industry requirements. Phutuma has claimed damages of R3 730 433 545, alternatively R5 513 876 290, and further alternatively R1 771 683 580 plus interest at 15,5% per annum to date of payment from April 2008, alternatively from 30 April 2009 being the date of a notice in terms of Act 40 of 2002, further alternatively from date of service of this summons plus legal costs. At the hearing of the matter the court granted absolution from the instance plus costs. Phutuma has filed a notice of appeal against the judgement but has not yet set down its application for leave to appeal.
African Pre-paid Services Nigeria Limited (APSN) v Multi-Links: Arbitration matterMulti-Links Telecommunications (MLT), a previously wholly owned subsidiary of Telkom in Nigeria, concluded a Super Dealer Agreement (SDA) with African Pre-paid Services (APS). APS ceded and assigned all of its rights and obligations in terms of the SDA to African Pre-paid Services Nigeria (APSN). APSN cancelled the SDA on the basis of an alleged repudiation by MLT of the agreement and APSN launched arbitration proceedings in South Africa against MLT claiming damages (9 claims) in the total sum of USD481 199 101. MLT defended the matter and filed a counterclaim in the amount of USD123 million. Telkom sold its shareholding in MLT to HIP Oils Topco Limited (HIP Oils). In terms of an indemnity contained in the Sale and Purchase agreement between Telkom and HIP Oils, Telkom is liable for all amounts in excess of USD10 million in respect of the claim between APSN and MLT. APSN has since reduced its claim to USD457 million. MLT has obtained a High Court order to stay the arbitation hearing pending the outcome of the damages action instituted by Telkom and MLT against Blue Label Telecoms, APSN and others.

TELKOM SA SOC LIMITED Group Annual Results for the year ended 31 March 2014
52
16. CONTINGENCIES (continued)CONTINGENT LIABILITIES (continued)OtherHIP Oils Topco Ltd (HIP Oils)With the sale of Telkom’s shares in Multi-Links to HIP Oils, Telkom provided a taxation indemnity and a “creditors” indemnity to HIP Oils and Multi-Links where such liability or obligation was incurred prior to 3 October 2011 and to the extent that such liability exceeded the amounts set out in Schedule 4 (the creditors list) to the Sale and Purchase Agreement. Telkom has undertaken to indemnify any actual or contingent liabilities, obligations or other indebtedness of any nature owed or owing to trade, financial and other creditors of Multi-Links where such liability, obligation or other indebtedness was incurred and not disclosed to HIP Oils prior to the completion date. Multi-Links and HIP Oils ceded the balance of the proceeds of their claim which was instituted against Blue Label Telecoms and others by Multi-Links, to Telkom, in terms of an out and out cession, which balance will be determined after consideration of all amounts due by Telkom to Multi-Links and vice versa.
Tax mattersTelkom received an assessment from SARS in respect of the 2010 year of assessment to which Telkom has objected.
The Group is regularly subject to an evaluation, by tax authorities, of its direct and indirect tax filings. The consequence of such reviews is that disputes can arise with tax authorities over the interpretation or application of certain tax rules applicable to the Group’s business. These disputes may not necessarily be resolved in a manner that is favourable to the Group. Additionally, the resolution of the disputes could result in an obligation to the Group.
CONTINGENT ASSETSHigh CourtFormer Senior Executive of TelkomIn April 2013 Telkom issued a summons against a former senior executive of Telkom, claiming an amount of USD6 million, for damages suffered as a result of certain irregularities. The matter arises from the former executive’s conduct whilst at Multi-Links. The matter is being defended and is set down for hearing on 2 September 2014.
Blue Label Telecoms Limited and five othersIn May 2013 Telkom (and Multi-Links Telecommunications, Nigeria) issued a summons against Blue Label Telecoms Limited, certain subsidiaries of Blue Label and certain individuals, including a former senior executive of Telkom, claiming an amount of USD528 071 116. The claim is for damages suffered by Telkom arising out of a Super Dealer Agreement (SDA) concluded between African Pre-paid Services (Pty) Ltd (a subsidiary of Blue Label) and Multi-Links as well as for a breach of fiduciary duties owed to Telkom and Multi-Links. In October 2013, HIP Oils (the holding company of Multi-Links) and Multi-Links ceded the balance of proceeds of its claim against Blue Label and others to Telkom by way of a cession, which balance will be determined after consideration of monies due by Telkom and itself under the Share Sale Agreement concluded between Telkom and HIP Oils. In November 2013 APSN filed its plea and a counterclaim for damages against Telkom for USD451 million or so much of it as APSN does not recover from Multi-Links arising from Telkom’s alleged unlawful interference in the contractual relationship between APSN and Multi-Links causing Multi-Links to repudiate the SDA. APSN also filed a counterclaim against Multi-Links for USD457 million. Both Telkom and Multi-Links have opposed the counterclaim.
Multi-Links (MLT)Telkom is claiming an amount of USD20,9 million from MLT in respect of amounts due by MLT to Telkom with regards to the provision of resources, legal costs and an interest free loan. In October 2013, MLT signed an out and out cession of its claim against Blue Label and five other defendants in favour of Telkom, which made provision for the payment of monies due by MLT to Telkom and vice versa from the proceeds of any monies recovered in the Blue Label action, by way of an accounting and deduction process.
Tax mattersAs noted in the 2013 consolidated annual financial statements, the 2012 tax return was submitted and has since then been provisionally assessed. In 2014 a similar transaction arose, however the 2014 tax return has not been submitted. Since the tax treatment of the loss arising in 2012 and 2014 is based on a specific set of circumstances and a complex legislative environment, the contingent asset will only be recognised once the matter has been resolved with SARS. The outcome of the SARS process, will determine the recognition of the tax refund of R854 million in relation to 2012, currently included in trade and other payables.
NOTES TO THE CONDENSED CONSOLIDATED PROVISIONAL ANNUAL FINANCIAL STATEMENTS (CONTINUED)FOR THE YEAR ENDED 31 MARCH 2014

TELKOM SA SOC LIMITED Group Annual Results for the year ended 31 March 2014
53
2014 2013Rm Rm
17. RELATED PARTIESDetails of material transactions and balances with related parties were as follows:With shareholders:Government of South AfricaRelated party balancesTrade receivables 456 446Related party transactionsRevenue (3 307) (3 017)
Individually significant revenue* (1 322) (1 345)
City of Cape Town (45) (66)Department of Correctional Services (90) (93)Department of Health: Gauteng (51) (50)Department of Justice (114) (118)South African National Defence Force (72) (72)South African Police Services (597) (601)South African Revenue Services (38) (42)S.I.T.A. (Pty) Ltd (206) (195)South African Post Office (52) (50)Department of Internal Affairs (57) (58)
Collectively significant revenue** (1 985) (1 672)
At 31 March 2014, the Government of South Africa held 39,8% (2013: 39,8%) of Telkom’s shares and the Public Investment Corporation held 13,5% (2013: 11,7%) of Telkom’s shares.With entities under common controlMajor public entitiesRelated party balancesTrade receivables 35 48Trade payables (1) –
Revenue** (253) (260)Expenses 250 237
Individually significant expenses 236 223
89 96Eskom 136 127South African Broadcasting Corporation 11 –
Collectively significant expenses 14 14
*The nature of the individually and collectively significant revenue consists mostly of data revenue.**Restated.
Related party transactions
South African Post Office

TELKOM SA SOC LIMITED Group Annual Results for the year ended 31 March 2014
54
NOTES TO THE CONDENSED CONSOLIDATED PROVISIONAL ANNUAL FINANCIAL STATEMENTS (CONTINUED)FOR THE YEAR ENDED 31 MARCH 2014
2014 2013Rm Rm
Rent received (49) (43)
Individually significant rent received: South African Post Office (43) (39)Collectively significant rent received (6) (4)
Rent paid 29 26
Individually significant rent paid: 19 17Collectively significant rent paid 10 9
Key management personnel compensation: (Including directors and prescribed officers’ emoluments)Related party transactionsShort-term employee benefits 139 189Post-employment benefits 10 10Termination benefits 2 24Equity compensation benefits 6
Financial assistance to Executive DirectorDuring the period under review, the shareholders at an annual general meeting approved a share scheme which inter alia provides for financial assistance to top management to purchase Telkom shares. A loan in the amount of approximately R6 million was paid to the CFO to purchase Telkom's shares during the current financial year. However, the granting of the loan was inconsistent with the provisions of the Companies Act, making the transaction null and void. The Board acknowledged that it could not ratify the granting of the loan and was obligated to claim the approximately R6 million back from the CFO. The loan was paid back in full by the CFO to Telkom on 16 January 2014.Terms and conditions of transactions with related partiesOutstanding balances at the year-end are unsecured, interest free and settlement occurs in cash. There have been no guarantees provided or received for related party receivables or payables.
18. SIGNIFICANT EVENTSResults of the Telkom annual general meeting regarding directors re-appointmentsAll Board members were re-elected as per the annual general meeting ordinary resolutions with the exception of Mr J Molobela who withdrew his nomination to be re-elected as director with effect from 27 September 2013. Mr B du Plessis did not stand for re-election for the Board.
Suspension of Chief Financial OfficerShareholders are advised that Mr Jacques Schindehütte, the Chief Financial Officer of Telkom SA SOC Ltd, (Telkom) has been suspended by the Board of Directors of Telkom (the Board) effective 24 October 2013, pending the finalisation of a disciplinary process. The suspension follows the findings of an investigation by an independent law firm, commissioned by the Board, following receipt of certain allegations levelled against Mr Schindehütte by an anonymous whistleblower. A disciplinary process was instituted against Mr Schindehütte, which is still ongoing.
Mr Deon Fredericks has been acting as Chief Financial Officer of Telkom with effect from 24 October 2013.
Employee Forfeitable Share Plan (Employee FSP)A new forfeitable share plan was approved at the annual general meeting per special resolution where no more than 5% of Telkom’s amount of issued shares will be allocated to employees.
South African Post Office
17. RELATED PARTIES (continued)

TELKOM SA SOC LIMITED Group Annual Results for the year ended 31 March 2014
55
Post-retirement Medical Aid curtailmentTelkom announced during August 2013 that eligible employees have the option to transfer their post-retirement medical aid benefit to an insurer. The Company curtailed the medical cap increase to 0% as from 1 October 2013 for active members due to revenue remaining under pressure, rising operational costs and affordability. Of the 9 302 eligible employees 7 654 employees exercised their option to transfer their benefit to an insurer on 11 October 2013. The approximate net curtailment gain recognised was R2,2 billion.
Appointment of Chief Information OfficerTelkom announced on 21 October 2013 that Mr L De Villiers has been appointed as Chief Information Officer with effect from 1 November 2013.
Appointment of Chief Marketing OfficerTelkom announced on 15 November 2013 that Mr V Scarcella has been appointed as Chief Marketing Officer with effect from 1 February 2014.
Appointment of Chief Procurement OfficerTelkom announced on 5 December 2013 that Mr IM Russel has been appointed as Chief Procurement Officer with effect from 1 February 2014.
Appointment of Chief Technology OfficerTelkom announced on 15 February 2014 that Mr AN Samuels has been appointed as Chief Technology Officer with effect from 13 February 2014.
Appointment of Chief Risk OfficerTelkom announced on 1 April 2014 that Adv GJ Rasethaba has been appointed as Chief Risk Officer with immediate effect.
Fair value hedge accountingThe Group implemented fair value hedge accounting for foreign currency risk hedging instruments from 1 October 2013 in an attempt to mitigate earnings volatility.
MTN and Telkom radio access network (RAN) assets transactionOn 7 March 2014, Telkom announced it signed a heads of agreement with MTN South Africa to take over financial and operational responsibility for the roll-out and operation of Telkom’s RAN. The parties will conclude reciprocal roaming agreements to enable customers of either party to roam on the network of the other party. The telecoms industry, in both South Africa and globally, are facing an unprecedented shift from traditional voice towards data. In order to meet this demand the parties have entered into the proposed transaction. Telkom will be able to provide its customers with effective access to the latest state of the art networks without having to incur the significant capital expenditure needed to achieve such national coverage. As a result of the proposed transaction, the range of services available to customers will increase, the customer experience will be enhanced and significant scale efficiencies, beneficial to both parties and their customers, would be realised.
The proposed transaction is subject to conclusion by the parties of various binding commercial agreements to give effect to the proposed transaction, and various other approvals, including approvals by regulatory authorities as may be required for the implementation of the proposed transaction.

TELKOM SA SOC LIMITED Group Annual Results for the year ended 31 March 2014
56
19. SUBSEQUENT EVENTSRestructuring of the organisation
The Company has been experiencing significant challenges as manifested in the financial underperformance. The Company continues to experience declining revenues and increasing costs to serve customers. This makes for an unsustainable financial position.
In response to these challenges Telkom has undertaken a thorough review and investigation into all operations and processes which entailed, among others, looking at issues such as cost drivers and the effectiveness of the organisational structure. By flattening the organisational structure or reducing the number of layers in the structure, Telkom aims to facilitate speedy decision-making and be as close to customers as possible. Telkom aims to manage employee costs down to be competitive in different areas of business.
Telkom identified flattening and delayering its structure as a critical action. Telkom has undertaken a consultation process in line with section 189 and 189(a) of the Labour Relation Act to carry out the proposed delayering.
Acquisition of Business Connexion (BCX)
Telkom announced its firm intention to make an offer regarding the possible acquisition of BCX. The Company has embarked on a strategy to improve performance and restore profitability. One of the key considerations of this strategy is to grow beyond its core business of connectivity by expanding into IT services.
BCX is a leading player in the South African IT services market with strong capabilities in Managed IT Infrastructure, including Data Centres. This proposed acquisition enables Telkom’s scale expansion into IT services and helps reinforce the company’s core connectivity business. Telkom believes that this combination will create a leading ICT company in South Africa with unrivalled capabilities throughout the country.
The proposed acquisition is in line with the global trend of IT and Telecoms convergence that is driving the development of rapidly changing products and services and re-shaping the overall ICT and Telecoms business landscape. This convergence trend has seen many traditional IT companies merge with telecommunications companies and is fundamental to the strategies of trailblasing companies such as Google, Apple and Amazon. This is the beginning of the process and there are a number of key milestones to attain and work to be done, including approval by the Competition Authorities and the Regulator.
Additional funding
The Company has secured a R1 billion loan to extend its debt maturity profile.
Other matters
The directors are not aware of any other matter or circumstance since the financial year ended 31 March 2014 and the date of this report, or otherwise dealt with in the financial statements, which significantly affects the financial position of the Group and the results of its operations.
NOTES TO THE CONDENSED CONSOLIDATED PROVISIONAL ANNUAL FINANCIAL STATEMENTS (CONTINUED)FOR THE YEAR ENDED 31 MARCH 2014

9 2 8

www.telkom.co.za