Group Annual Report 2014
254
2014 Annual Report
-
Upload
dvb-bank-se -
Category
Investor Relations
-
view
148 -
download
4
Transcript of Group Annual Report 2014

2014Annual Report

DVB Bank SE | Group Annual Report 2014
Contents
Group management report 46 – 167
47 Fundamental information about the Group
47 A unique business model
50 Competitive strengths setting DVB apart
50 Strategic goals and implementation
52 Commercial planning and management system
54 Report on the economic position
54 Macroeconomic environment
56 Financial position and performance
72 Remuneration
76 Development of the business divisions
76 Shipping Finance
88 Aviation Finance
100 Offshore Finance
108 Land Transport Finance
120 Financial Institutions
124 Corporate Finance
130 Investment Management
137 Report on material events after the reporting date
138 Report on expected developments, opportunities and risks
138 Report on expected developments
142 Report on opportunities and risks
167 Explanatory disclosures under takeover law
167 Report of the Board of Managing Directors
on relations with affiliated companies
Consolidated financial statements 168 – 236
169 Income statement
169 Appropriation of profits
170 Statement of comprehensive income
171 Statement of financial position
172 Statement of changes in equity
173 Cash flow statement
174 Segment report
175 Notes
Audit opinion 237
Further information 238 – 248
238 DVB worldwide
240 Key words
242 Glossary
246 Abbreviations
248 Imprint
U3 Key figures at a glance
U4 Events 2014
About us 01 – 45
01 The Company
02 ”It´s all about expertise”
10 Letter to our shareholders and business partners
13 The Board of Managing Directors
14 Report of the Supervisory Board
19 The Supervisory Board
20 Corporate Governance Report 2014
30 Sustainability
30 Compliance
31 Clients
32 Employees
41 Environmental responsibility
41 Social responsibility
42 The DVB share
42 Equity markets and the DVB share
Reference to the internet
Legal notice
Further information
Symbols

DVB Bank SE | Group Annual Report 2014
Key figures at a glance
€ mn 2014 2013 %
Earnings data
Net interest income 215.9 243.0 –11.2
Allowance for credit losses –62.4 –87.9 –29.0
Net interest income after allowance for credit losses 153.5 155.1 –1.0
Net fee and commission income 108.5 128.7 –15.7
Results from investments in companies accounted for using the equity method 12.4 5.1 –
Net other operating income/expenses 30.1 –4.1 –
Net income 304.5 284.8 6.9
General administrative expenses –187.7 –178.8 5.0
Consolidated net income before IAS 39 and taxes 116.8 106.0 10.2
Net result from financial instruments in accordance with IAS 39 –12.8 18.2 –
Consolidated net income before taxes 104.0 124.2 –16.3
Key financial indicators
Return on equity (before taxes, %) 8.1 10.3 –2.2 pp
Cost/income ratio (%) 53.0 45.7 7.3 pp
Economic Value Added (€ million) 28.5 22.8 25.0
Key items from the statement of financial position
Business volume 26,215.0 24,576.6 6.7
Customer lending volume 23,310.2 20,757.6 12.3
Total assets 24,510.8 23,363.4 4.9
Loans and advances to customers 20,633.0 18,900.9 9.2
Deposits from customers 7,097.0 6,113.6 16.1
Securitised liabilities 11,305.8 11,134.5 1.5
Subordinated liabilities 487.2 363.7 34.0
Equity 1,437.4 1,399.3 2.7
Total capital in accordance with the Capital Requirements Regulation
Common equity tier 1 1,222.0 – –
Additional tier 1 0.0 – –
Tier 2 capital 186.6 – –
Modified available capital 1,408.6 – –
Capital ratios – Basel III (%)
Common equity tier 1 ratio 18.7 – –
Additional tier 1 ratio 18.7 – –
Total capital ratio 21.6 – –
Staff by business division
Transport Finance/Investment Management 304 302 0.7
Service areas 221 213 3.8
LogPay Financial Services 56 52 7.7
Total active staff 581 567 2.5
Rating 2014 2013 2011
Standard & Poor’s
Long-term counterparty credit rating A+ A+ A+
Short-term credit rating A-1 A-1 A-1
Outlook stable stable stable
Fitch Ratings1)
Long-term issuer default rating A+ A+ A+
Short-term issuer default rating F1+ F1+ F1+
1) Within the scope of the German Co-operative Financial Services Network’s rating

DVB Bank SE | Group Annual Report 2014
Events 2014
12 JuneAnnual General Meeting at Deutsche Nationalbibliothek in Frankfurt/Main – with 96.67% of capital represented at the meeting, shareholders approved all proposed resolutions with a majority close to 100% (including a dividend of €0.60 per no-par value share).
21–23 SeptemberISTAT Europe Conference in Istanbul – Mr Bertrand Grabowski, Member of the Board of Managing Directors, chaired the ”Air-craft Finance” panel discussion, while Mr Paul da Vall, Aviation Investment Management, chaired the appraisers’ panel on ”Valuation trends for different aircraft types”.
1 OctoberClient breakfast in the Port of Hamburg – At the ’Hafen-Klub Ham-burg’ Mr Felix Ulbricht was introduced as the new Global Head of DVB’s Container, Car Carrier, Intermodal Ferry Group department. Mr Bedranowsky emphasised in his speech that DVB wanted to focus more strongly on the German market in the future.
4 NovemberPlacement of DVB’s fifth senior unsecured benchmark bond – with this five-year, €500 million bond, DVB underscored its strong position on the capital markets whilst diversifying its international investor base.
6–7 November15th Annual Asia Pacific Airfinance Conference – Mr Grabowski chaired the first conference day, and Mr David Goring-Thomas, Global Head of Aviation Finance, moderated a discussion on ”Arranging, syndicating or clubbing”.
8 DecemberGTF Awards Winner in London – DVB’s Land Transport Finance division wins ”Rail Finance Innovator of the Year” and ”Rail Finance Deal of the Year – Europe”.
10 MarchMove of DVB’s Dutch branch to Amsterdam – opening of the Bank’s new offices at WTC Schiphol, which are now easier to reach for the Bank’s clients.
25 MarchAnnual Accounts Press and Analyst Conference – Mr Wolfgang F. Driese, Chairman of the Board of Managing Directors, and Mr Ralf Bedranowsky, Member of the Board of Managing Direc-tors, presented the consolidated financial statements for 2013, outlined the situation on the international transport markets and talked about targets and perspectives.
9 AprilClient reception in Hamburg – Shipping & Offshore Research outlined current and future trends in the shipping industry.
8 MayClient event in Korea – together with Shipping and Aviation Research colleagues, Mr Driese and Mr Geir Sjurseth, Head of the Offshore Finance division, welcomed about 100 guests; their presentation focused on drivers and expected changes in future market structures.
14 MayClient reception in Greece – Shipping & Offshore Research informed participants about the cyclicality of the shipping industry, yard capacities and the future of bulk shipping.

DVB Bank SE | Group Annual Report 2014
Anhang 1
UN T E RNE HMEN F IN A N Z- UND A K T IE NM Ä RK T E KON Z E RNL AGE BE RICH T KON Z E RN A B SCHLUS S
The leading specialist in international transport finance
At DVB, we make deals work. This means striving to seek and develop intelligent and appropriate solutions that meet and even exceed our clients’ needs and expectations. We go the extra mile to constantly and thoroughly research and study our industry. Often, this leads us to challenge conventional wisdom when offering our focused range of financing services.
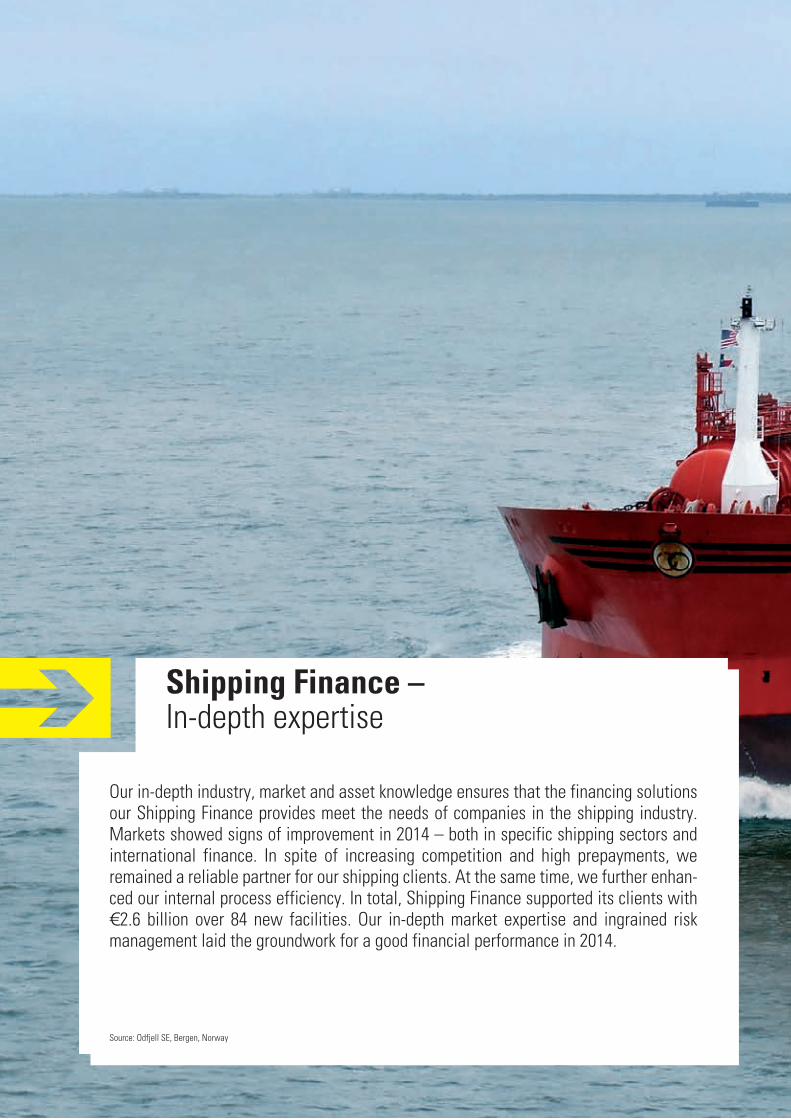
Shipping Finance – In-depth expertise
Our in-depth industry, market and asset knowledge ensures that the financing solutions our Shipping Finance provides meet the needs of companies in the shipping industry. Markets showed signs of improvement in 2014 – both in specific shipping sectors and international finance. In spite of increasing competition and high prepayments, we remained a reliable partner for our shipping clients. At the same time, we further enhan-ced our internal process efficiency. In total, Shipping Finance supported its clients with €2.6 billion over 84 new facilities. Our in-depth market expertise and ingrained risk management laid the groundwork for a good financial performance in 2014.
Source: Odfjell SE, Bergen, Norway


Aviation Finance – Integrated platform solutions
Although banks and capital markets flooded most segments of the air finance market with liquidity in 2014, our Aviation Finance successfully offered advisory services and loans in all areas of the DVB Aviation platform. Clients trust us to find the best solution for their financing needs because of our cross-platform commercial activities, excellent research and long-standing experience. Demand for our services rose during the second half of the year, resulting in 61 new structured lending transactions with a volume of €2.3 billion. Once again, we served a client base that was highly diversified in terms of credit standing and geographic location with a good mix of new and used aircraft finan-cings – and we preserved our market leadership.
Photograph by Bert van Leeuwen, Head of Aviation Research, DVB Bank SE, Amsterdam, The Netherlands


Land Transport Finance – Consistent client franchise
New rolling stock investments in land transport markets remained below pre-crisis levels in 2014, albeit with regional differences. Our Land Transport Finance team serviced clients in Europe, North America and Australia in a consistent fashion with research, advisory and financing activities. Our clearly-defined set-up, cycle-neutral strategy and continuous dialogue with clients continued to pay off in 2014, with 17 new transactions and an aggregate volume of €562.5 million. In November 2014, the trade magazine ”Global Transport Finance” recognised our activities with its renowned ”Rail Finance Innovator of the Year” and ”Rail Finance Deal of the Year (Europe)” awards. To us, this is evidence that the market appreciates our sustainable specialisation and focus.
Photograph by Wouter Radstake, Head of Land Transport Research, DVB Bank SE, Frankfurt/Main


Offshore Finance – Highly specialised industry
After a good start, the specialised offshore markets began to feel the effects of falling oil prices towards the end of 2014. Also global exploration and production spending did not reach the high growth rates registered in previous years. However, as our Offshore Finance team constantly expands its know-how and expertise, our specialists continued to successfully offer advisory services and financings for equipment integral to offshore drilling, exploration, production and field maintenance to a heterogeneous client base. The loan portfolio developed favourably as we stayed true to our conservative risk approach. Against a more challenging market environment during the second half of 2014, the team closed 25 new transactions totalling €804.0 million.
Photograph by Harald M. Valderhaug, Skjongholmen, Norway


10
DVB Bank SE | Group Annual Report 2014
Letter to our shareholders and business partners
Net interest income before allowance for credit losses fell by 11.2%. This was attributable to three reasons: firstly, €13.2 million in costs incurred as a result of the high liquidity reserves; secondly, additional risk costs of €27.6 million which burdened net interest income, and thirdly, a lower average lending volume.
Net fee and commission income also failed to fully match the previous year’s figure, whereby commission income from the Investment Management business and the capital markets activities showed a negative development.
General administrative expenses rose by 5.0% during the past year, once again largely due to increasing regulatory expenses. During the course of the year, we needed to hire eight additional employees for related duties, incurring costs of approximately €0.7 million p.a.). The European Central Bank’s AQR and stress test led to an estimated €2.6 million in expenses paid to third parties, for which we had recognised €1.7 million in provisions in 2013. We estimate total regulatory costs for 2014 to be close to €30 million – roughly one-third of consolidated net income before taxes. At present, there is no end in sight.
Compared to the previous year, Investment Management made a significant contribution to net other operating income and expenses. Specifically, we were able to very successfully exit an investment in the cruise business that we held for several years.
Ladies and Gentlemen,
We have made it – the European Central Bank’s Asset Quality Review (AQR) and stress test. Needless to say, we had no doubts that we would pass. But it’s still rewarding to get ’official’ approval that the quality of our shipping finance portfolio (the only one that was audited) is on a different level compared to some other German institutions. Having gone through a special audit instructed by the German supervisory authority, the regular examinations carried out by our external auditors and the test conducted by the European Central Bank, we would now like to return our focus to our Bank’s core tasks: advising and financing our clients.
We achieved more – more new business (also with new clients), €6.3 billion in Transport Finance volume, a 34.0% increase. Like-wise, we were able to further improve net interest margins generated, in line with our planning and without any compromise in terms of our risk exposure.
We were flooded, just like the markets – with liquidity. As a result, around 32% of our lending book (both scheduled redemp-tions and early repayments) has been repaid since mid-2013. As a consequence, we started into 2014 with excess liquidity of €2 billion and a lower lending volume than we had planned. Significant efforts – and money – were required to generate additional new business and to reduce the liquidity inventory by the end of the year.
We have reached a bottom – in the shipping segments burdened by excess capacity with charter rates and vessel values having stabilised on a low level, albeit subject to some volatility during the course of the year. This also reduced the need to recognise allowance for credit losses and impairments in our credit and investment management business.
We have reached our targets for 2014 to a large extent.
Consolidated net income before IAS 39 and taxes amounted to €116.8 million – up 10.2%. The increase was driven by two factors: a marked increase in net other operating income and expenses, to €30.1 million (largely comprising contributions from Invest-ment Management), and lower allowance for credit losses (decrease of €25.5 million).
Wolfgang F. Driese, CEO and Chairman of the Board of Managing Directors

11
DVB Bank SE | Group Annual Report 2014
A BOU T U S
COMPANY
GROUP M A N AGE MEN T RE P OR T
C ONSOL IDAT ED F IN A NCI A L S TA ME MEN T S
AUDI T OP INION
Ralf Bedranowsky, Member of the Board of Managing Directors
Letter to our shareholders and business partners
Looking at non-operating results, we once again had to deal with the impact of IAS 39. For instance, the IAS 39 accounting rules prohibit the recognition of certain economic hedging relationships related to non-financial assets and/or in connection with cross-currency swaps used for hedging purposes. This leads to so-called accounting mismatches – a year-on-year change in the amount of €31.0 million. Even though we adhere to our Group policy of hedging our commercial foreign exchange and interest rate risks, these accounting rules burdened our consolidated income before taxes – compared to the previous year – by €20.2 million.
We already clearly voiced our significant concerns regarding the viability of such accounting rules in the past. Similar to regulatory issues, we believe that from today’s perspective, developments increasingly go into the wrong direction. In fact, this triggers additional volatility in our income statement which cannot be managed commercially – and which is virtually impossible to explain. We believe that transparency, reconciliation and com-parability for shareholders and investors are being sacrificed in this process.
Final judgement of our results for the year is up to our share-holders, to whom we propose to distribute an unchanged dividend of €0.60 per share, equivalent to a dividend yield of 2.43%.
As the Bank’s management team, we assess the results for the year as quite satisfactory. This is because we are fully aware of the work that has been done – in spite of an extreme additional burden caused by the ECB test, which went on for nine months and affected the majority of Head Office departments as well as Shipping & Offshore Credit. It was impossible to anticipate the considerable new business volume, the remarkable reduction of our risk exposure in the lending business, and our ability to acquire new business partners under these circumstances.
As in the previous years, Aviation Finance contributed very strongly to the Bank’s performance, and the cost of risk in the aviation industry remained at minimum – an excellent outcome given the overall turbulences in the markets since 2008. Land Transport Finance and Offshore Finance divisions significantly contributed to these good results for the year, once again high-lighting their position as robust stabilisers of our business model. Before cost of risk, Shipping Finance is also back on track to returning to the performance of its good years. A diversified, global transport asset finance provider is well supported by several pillars – including (and especially) during turbulent times.
We have to extend our heartfelt thanks to our staff, for their performance and commitment. They are our key asset, they are the foundation of our strengths, and they make us unique – vis-à-vis our competitors, and especially in our clients’ appreciation.
Bertrand Grabowski, Member of the Board of Managing Directors

12
DVB Bank SE | Group Annual Report 2014
Letter to our shareholders and business partners
In our straightforward endeavours to satisfy our clients and shareholders, the main skill in our activities will be to find the right balance between market volatility, the regulatory environ-ment, and potential ’black-swan’ events which might face us unexpectedly.
We were sustainably successful in the past – and we are confident that we will continue to steer a successful course in the future.
Yours sincerely,
Outlook and forecast
Global trade will continue to grow throughout 2015 – and so will transport volumes. This much is certain.
We will continue to pursue our path:
• resolving remaining exposures subject to higher risk, especially in Shipping Finance;
• acquiring new clients for the Bank; • continuing to grow in our core business of advising on, and
financing the transport asset classes we cover; and• growing and strengthening profit contributions from the
Investment Management business and capital markets activities.
You can take this as a given.Wolfgang F. DrieseCEO & Chairman of the Board of Managing Directors
Ralf BedranowskyMember of the Board of Managing Directors
Bertrand GrabowskiMember of the Board of Managing Directors
Frankfurt/Main, March 2015DVB Bank SE

13
DVB Bank SE | Group Annual Report 2014
A BOU T U S
COMPANY
GROUP M A N AGE MEN T RE P OR T
C ONSOL IDAT ED F IN A NCI A L S TA ME MEN T S
AUDI T OP INION
The Board of Managing Directors (since 1 January 2015)
Wolfgang F. Driese CEO and Chairman of the Board of Managing Directors and bank director – Born 1949 in Berlin, Germany
Client areas in business divisions:Shipping & Offshore Credit, Aviation Credit Land Transport CreditShipping & Offshore Research Aviation ResearchLand Transport ResearchFinancial Institutions Strategic Management & RestructuringClient areas in affiliates: ITF International Transport Finance Suisse AG LogPay Financial Services GmbHProduct/service areas:Group Compliance Office Group ControllingGroup Corporate Communications Group Human ResourcesGroup LegalGroup Risk Management
Chairman of the Supervisory Board: DVB Bank America N.V., Willemstad, CuraçaoChairman of the Board of Directors: DVB Group Merchant Bank (Asia) Ltd, SingaporeDVB Holding (US) Inc., New York, USA DVB Transport (US) LLC, New York, USAMember of the Board of Directors: DVB Transport Finance Ltd, London, United KingdomDVB Capital Markets LLC, New York, USAChairman of the Board of Directors: ITF International Transport Finance Suisse AG, Zurich, SwitzerlandDVB Invest (Suisse) AG, Zurich, Switzerland
Ralf Bedranowsky Member of the Board of Managing Directors and bank directorBorn 1958 in Berlin, Germany
Client areas in business divisions:Shipping FinanceOffshore FinanceDVB Corporate FinanceShipping & Intermodal Investment ManagementShipping Execution ManagementClient areas in affiliates:DVB Capital Markets LLCProduct/service areas:Business Process SupportGroup FinanceInformation TechnologyTransaction and Loan Services
Chairman of the Board of Directors: DVB Capital Markets LLC, New York, USA Member of the Board of Directors: DVB Holding (US) Inc., New York, USADVB Transport (US) LLC, New York, USA
Bertrand Grabowski Member of the Board of Managing Directors and bank directorBorn 1956 in Guerche-de-Bretagne, France
Client areas in business divisions:Aviation FinanceAviation Asset ManagementAviation Financial ConsultencyAviation Investment ManagementLand Transport FinanceClient areas in affiliates:DVB Transport Finance LtdTES Holdings Ltd (40% shareholding) Product/service areas:Group AuditGroup Treasury
Chairman of the Board of Directors:DVB Transport Finance Ltd, London, United KingdomMember of the Board of Directors:DVB Transport (US) LLC, New York, USADVB Capital Markets LLC, New York, USA DVB Holding (US) Inc., New York, USA Non-Executive Director:Bravo Passenger Solutions Pte. Ltd, Singapore (since 30 May 2014)

14
DVB Bank SE | Group Annual Report 2014
Report of the Supervisory Board
In 2014, the entire Supervisory Board once again engaged itself, in depth and on an ongoing basis, with developments on the international transport markets and the risk management of individual transport finance portfolios – in particular, with the persistently difficult market conditions in some segments of maritime shipping. Moreover, we advised the Board of Managing Directors with respect to the Bank’s strategic direction, the operative corporate planning derived therefrom, and its imple-mentation. An additional focal point in the Supervisory Board’s work was to monitor the implementation of the legal changes resulting from the minimum equity requirements and regulatory standards set out in the Basel III regime for banks and securities firms (the CRD IV package).
Co-operation with the Board of Managing Directors
The 2014 business year was once again characterised by numer-ous legal and regulatory changes; the processes and requirements of the Comprehensive Assessment carried out by the European Central Bank were particularly important to DVB. The Supervisory Board supported the Board of Managing Directors with the implementation of its strategic objectives, monitored compliance with all legal and regulatory provisions, and offered advice.
In 2014, key topics of discussion were again DVB’s business and financial performance in a partly challenging environment (par-ticularly in parts of the shipping industry), developments on the international transport markets, as well as the Bank’s activities in managing risk, liquidity, and capital. During Supervisory Board meetings, the Board of Managing Directors comprehensively informed us on the development of strategic parameters of DVB’s business model, resulting adjustments to future business policy, as well as on company management and planning (includ-ing the planning parameters for the Bank’s financial resources, budgeted results, liquidity and human resources), on Corporate Governance issues as well as on events, results and transactions that were and still are important to DVB.
Dear shareholders,
From a macroeconomic perspective, the world economy’s devel-opment showed a very uneven picture in 2014. While the US economy managed to recover, growth figures in the euro zone were very heterogeneous. Japan’s economy continued to be under pressure, while China recorded relatively solid growth rates according to Western standards. However, the growth rates lacked the momentum to absorb millions of Chinese workers entering the labour market every year. Facing the still weak demand in industrialised countries, the Chinese economy loses momentum. This brings oil prices and other commodity markets under pressure – which is not helpful for Asia or any other countries where China has recently emerged as a strong buying power. Central banks tend to react to such momentum weakness by flooding markets with liquidity. Imbalances in terms of income distribution have reached a level where negative repercussions on demand structures are inevitable.
During 2014, DVB was confronted with ongoing difficulties in a number of segments of the maritime shipping industry, trans-lating into a persistent oversupply, amongst other things. In the aviation industry, the benefits of our long-lasting efforts in the US could be reaped, while markets in Europe and Asia continued to struggle with their own difficulties. However, the falling oil prices will lead to record results in the aviation industry through-out 2015, across all regions.
Compared to its international competitors, DVB again succeeded in generating a stable performance on the transport finance markets, which was reflected in solid results. We would like to express our sincere thanks and appreciation to the Board of Managing Directors and all members of staff for their good per-formance, and the pleasing results achieved.
The Supervisory Board, jointly with its committees, has fulfilled the obligations imposed on it by law, the Memorandum and Articles of Association, and the Bank’s Internal Regulations throughout the past business year. The Supervisory Board’s focus was on giving detailed advice to the Board of Managing Directors, the continuous supervision of the Company’s manage-ment as well as decisions on transactions and issues requiring approval. The Supervisory Board and its committees were also consulted by the Board of Managing Directors on decisions of fundamental importance, in good time.

15
DVB Bank SE | Group Annual Report 2014
A BOU T U S
COMPANY
GROUP M A N AGE MEN T RE P OR T
C ONSOL IDAT ED F IN A NCI A L S TA ME MEN T S
AUDI T OP INION
Report of the Supervisory Board
Wolfgang Köhler Deputy Chairman of the Supervisory Board
Frank WesthoffChairman of the Supervisory Board
Adnan Mohammed Martin Wolfert
Prof Dr h.c. Stephan Götzl Anders Ingebrigtsen Dr Klaus Nittinger
Ivo Monhemius

16
DVB Bank SE | Group Annual Report 2014
Report of the Supervisory Board
The constituting Supervisory Board meeting was held on 12 June 2014 immediately after the Annual General Meeting, in accordance with the Bank’s Memorandum and Articles of Association.
The Supervisory Board meeting on 29 September 2014 was held in DVB’s new premises in Amsterdam. Mr Ralf Bedranowsky – whose responsibilities on the Board of Managing Directors include the Shipping Finance division – reported on recent developments in Shipping Finance, the current structure of the Shipping Finance portfolio, the risk situation in the various maritime shipping market segments, based on up-to-date research documents, as well as on recent developments in the Bank’s Corporate Finance segment. The Supervisory Board was then informed in detail about the new regulatory requirements. The Head of Group Compliance presented the 2014 Compliance Report.
The last Supervisory Board meeting during the year under review took place on 27 November 2014. Besides the Supervisory Board committees’ reports and the report of the Board of Managing Directors concerning DVB’s current business development, dis-cussions focused on the Bank’s short-term and long-term strategic direction. The Supervisory Board approved the planning for the business year 2015, and discussed the medium-term planning until 2019 with the Board of Managing Directors.
There were no members of the Supervisory Board who attended less than half of meetings during the period under review. There were no conflicts of interest which would have required disclo-sure during the year under review.
Supervisory Board Committees
During its four meetings, the Credit and Risk Committee ful-filled all duties incumbent upon it by law, and the Internal Regulations without undue delay. This included a continuous and careful analysis of all exposures subject to reporting requirements. In addition, the Credit and Risk Committee was involved in approving loan exposures, where such approval was required, by way of circulation. During the meetings, detailed portfolio analyses were used to discuss the structure and per-formance of the loan portfolio as well as risk issues (business, market price, liquidity, and equity investment risks, as well as operational risks). Regarding the loan portfolio, the value perfor-mance of financed transport assets, risk management measures taken, and the specific analysis of individual non-performing exposures were particularly important.
In addition, the Committee members intensively discussed the Bank’s overall risk appetite, as well as DVB’s sub-risk strategies, and supported the Supervisory Board in monitoring these strategies. Discussions on the credit risk strategy formed a focal point of deliberations. Furthermore, the members of the Supervisory Board extensively exchanged their views on the
Both the Audit Committee and the Credit and Risk Committee discussed, reviewed and monitored in detail DVB’s risk situation, risk management, and the respective control mechanisms within the Bank during its meetings. The Board of Managing Directors informed the Supervisory Board in detail during such meetings. The minutes of the Credit and Risk Committee meetings as well as of the Audit Committee meetings were made available to all Supervisory Board members. The Supervisory Board was informed about current events and transactions of fundamental importance without undue delay; subsequent decisions were taken after intense consultation and discussion.
Mr Wolfgang Driese, CEO and Chairman of the Board of Managing Directors, and Mr Frank Westhoff, Chairman of the Supervisory Board, held regular discussions which focused on issues specific to the Bank, and on decisions to be made, in a timely and com-prehensive manner. The Board of Managing Directors informed the entire Supervisory Board in writing of important develop-ments between Supervisory Board meetings, thus permitting the Supervisory Board members to exercise their control function at any time. Any resolutions that were necessary were adopted between Supervisory Board meetings by way of circulation.
The Supervisory Board’s activities and co-operation with the Board of Managing Directors were always characterised by mutual trust, and by open and constructive discussions.
Meetings of the Supervisory Board
The Supervisory Board met during five scheduled plenary meet-ings in 2014. During these meetings, it regularly discussed the Bank’s business development in great detail. The Board of Man-aging Directors gave a detailed account of the sector-specific and macroeconomic environment on the international transport markets, as well as on the specific risk situation concerning ships, aircraft and rolling stock.
Main issues during the meeting on 7 March 2014 were a review of the accounting and financial reporting processes of DVB Bank SE as part of the single-entity financial reporting pur-suant to the German Commercial Code (HGB), business develop-ment during the first months of 2014, as well as an extensive report by Mr Bertrand Grabowski – whose responsibilities on the Board of Managing Directors include the Aviation Finance division – on the current business development, outlook and risk situation of the aviation industry.
At the meeting on 27 March 2014, the Supervisory Board dis-cussed the consolidated financial statements 2013 in accordance with IFRS with the auditors, and approved the consolidated financial statements as recommended by the Audit Committee. The Head of Internal Audit presented her extensive annual report, and informed the Supervisory Board on the involvement of Internal Audit in current projects, as well as on the co-operation with DZ BANK’s Internal Audit.

17
DVB Bank SE | Group Annual Report 2014
A BOU T U S
COMPANY
GROUP M A N AGE MEN T RE P OR T
C ONSOL IDAT ED F IN A NCI A L S TA ME MEN T S
AUDI T OP INION
Report of the Supervisory Board
strategies for managing business, market, liquidity and equity investment risks, as well as on the outsourcing strategy contem-plated by the Board of Managing Directors. After intensive discussions, the Committee decided to amend the existing lend-ing policies.
The Board of Managing Directors kept the members of the Com-mittee continuously informed about non-performing exposures and those subject to particular risks, and also about unusual events in the lending business. It informed the Committee, with-out delay, about assets controlled by DVB.
The Audit Committee held four meetings during the year under review. During the first meeting, the members of the Committee discussed its future duties and their execution or implementation. In subsequent meetings, the Committee analysed the 2013 single-entity and consolidated financial statements with the external auditors. The members of the Committee also discussed the audit reports and the audit findings, while monitoring the corre-sponding measures taken by the Board of Managing Directors. In addition, the Committee intensively discussed the so-called SAD lists (summary of unadjusted audit differences identified by the external auditors) in connection with the different financial statements and made recommendations to the Board of Manag-ing Directors. The members of the Audit Committee undertook the necessary independence reviews of external auditors and made a recommendation to the plenary meeting of the Super-visory Board regarding the appointment of the external auditors.
During the meeting on 27 July 2014, the interim consolidated financial statements were discussed with the external auditors, and the effects of the ECB’s Comprehensive Assessment were acknowledged. In addition, the Head of Internal Audit presented a concept for the future co-operation with the Audit Committee. After her presentation, appropriate reporting lines were estab-lished.
The Nomination Committee held four meetings during the period under review. Besides the obligations incumbent upon it by law and the Bank’s Memorandum and Articles of Association, during 2014 the Committee concerned itself intensively with personnel matters regarding the Board of Managing Directors and made recommendations to the plenary meeting of the Supervisory Board in this context. The Committee also prepared objectives for the promotion of the under-represented gender on the Supervisory Board, and resolved a strategy to achieve such objectives. Moreover, the Committee prepared a job description for future members of the Supervisory Board and discussed next steps in the efficiency review of the Supervisory Board and its members as well as in the performance review of the Board of Managing Directors and DVB’s risk takers.
The Remuneration Control Committee held three meetings during the period under review. The Committee’s members discussed the legal and regulatory requirements regarding the remuneration of members of the Board of Managing Directors and other employees in great detail, and monitored their imple-mentation. Both DVB’s remuneration strategy and remuneration principles were extensively discussed with the Bank’s Remuner-ation Officer. Furthermore, the Committee was kept informed by the Board of Managing Directors, always in good time, of the conclusion of employment contracts with executive staff, where the annual remuneration was in excess of a set threshold.
The Chairmen of the Committees kept the entire Supervisory Board informed on topics dealt with by the Committees, to the extent that such issues were fundamentally important, or were also discussed in the plenary meetings of the Supervisory Board.
DVB’s Corporate Governance
Implementation of the recommendations of the German Corpo-rate Governance Code was discussed in depth during the Super-visory Board meeting in November 2014. Together with the Board of Managing Directors, the Supervisory Board has issued the thirteenth Declaration of Compliance in accordance with section 161 of the German Public Limited Companies Act (refer-ring to the German Corporate Governance Code as amended on 24 June 2014) which was published in the German Federal Gazette and on DVB’s website on 5 December 2014.
All Declarations of Compliance issued by DVB since 2002 are available for download from our website
www.dvbbank.com > Investors > Corporate Governance > Declarations of Compliance.
The Supervisory Board has determined that, according to its own assessment, a sufficient number of independent members served as Supervisory Board members. Dr Klaus held the position of financial expert on the Supervisory Board until his retirement on 31 October 2014. Prof Dr Götzl assumed this position on 1 November 2014.
Training and continuous professional development
DVB continued to support Supervisory Board members during the period under review with respect to training or continuous pro-fessional development (CPD) measures, covering various topical areas, helping the Supervisory Board members to perform their duties. The rights and duties of a Supervisory Board member were explained to the new members (who were appointed to the Supervisory Board on 12 June 2014) in a separate informational session. Additionally, a workshop for all members of the Super-visory Board was held in September 2014, providing important news on changes to the Bank’s regulatory environment.
18
DVB Bank SE | Group Annual Report 2014
Report of the Supervisory Board
The Board of Managing Directors has prepared and submitted the mandatory report on business relationships with affiliated companies during the business year 2014. This report has been examined and certified without qualification by the external auditors, as follows: ”Having duly examined and assessed this report in accordance with professional standards, we confirm that the report is free from factual misrepresentations, and that the company did not pay any excessive consideration with regard to the transactions identified in the report.” The Super-visory Board reviewed the mandatory report on business relation-ships with affiliated companies. Following this review and sub-sequent examination, the Supervisory Board approved the results of the audit of the financial statements. More specifically, the Supervisory Board had no objections regarding the declaration made by the Board of Managing Directors pursuant to section 312 (3) of the German Public Limited Companies Act.
Frankfurt/Main, 26 March 2015For the Supervisory Board
Frank WesthoffChairman
Co-operation with external auditors for the 2014 consolidated financial statements
The consolidated financial statements and the group management report for the 2014 business year have been examined, follow-ing an audit of the accounting records, and certified without qualification, by Ernst & Young GmbH Wirtschaftsprüfungs-gesellschaft, Stuttgart, the external auditors appointed by the General Meeting. The Chairman of the Supervisory Board obtained information on the scope of the audit in advance, and discussed focal points with the auditors, in detail. The auditors’ reports were distributed to the Supervisory Board in good time before the meeting held on 26 March 2015, during which the financial statements were discussed. The auditors who certified the consolidated financial statements took part in this meeting. During this meeting, they gave a detailed account of their audit and provided detailed answers to our questions regarding focal points of the audit.
The consolidated financial statements and group management report for the 2014 business year were reviewed and discussed by the Supervisory Board. No objections were raised and the consolidated financial statements prepared by the Board of Managing Directors were approved.

19
DVB Bank SE | Group Annual Report 2014
A BOU T U S
COMPANY
GROUP M A N AGE MEN T RE P OR T
C ONSOL IDAT ED F IN A NCI A L S TA ME MEN T S
AUDI T OP INION
The Supervisory Board (since 1 January 2015)
Supervisory Board Shareholder representatives Frank Westhoff Chairman Member since 30 June 2006 Wolfgang Köhler Deputy Chairman since 1 November 2014 Member since 21 September 2009 Prof Dr h.c. Stephan Götzl Member since 10 June 2009 Anders Ingebrigtsen Member since 12 June 2014 Dr Klaus Nittinger Member since 10 June 2009
Employee representatives Adnan Mohammed Member since 13 February 2013 Ivo Monhemius Member since 12 June 2014 Martin Wolfert Member since 7 October 2008
Supervisory Board Committees
Credit and Risk Committee Frank Westhoff Chairman Anders Ingebrigtsen Martin Wolfert
Audit Committee* Prof Dr h.c. Stephan Götzl Chairman Wolfgang Köhler Ivo Monhemius
Nomination Committee** Frank Westhoff Chairman Wolfgang Köhler Adnan Mohammed
Remuneration Control Committee** Frank Westhoff Chairman Wolfgang Köhler Adnan Mohammed
* Established with effect from 14 February 2014** Established with effect from 7 March 2014
20
DVB Bank SE | Group Annual Report 2014
The Corporate Governance Report 2014 in accordance with section 3.10 of the German Corporate Governance Code,
the Corporate Governance Statement in accordance with section 289a of the HGB, the Declarations of Compliance, explanations concerning the Bank’s governance system, as well as the Memorandum and Articles of Association of DVB Bank SE, in their current version, are available on our website: www.dvbbank.com > Investors > Corporate Governance.
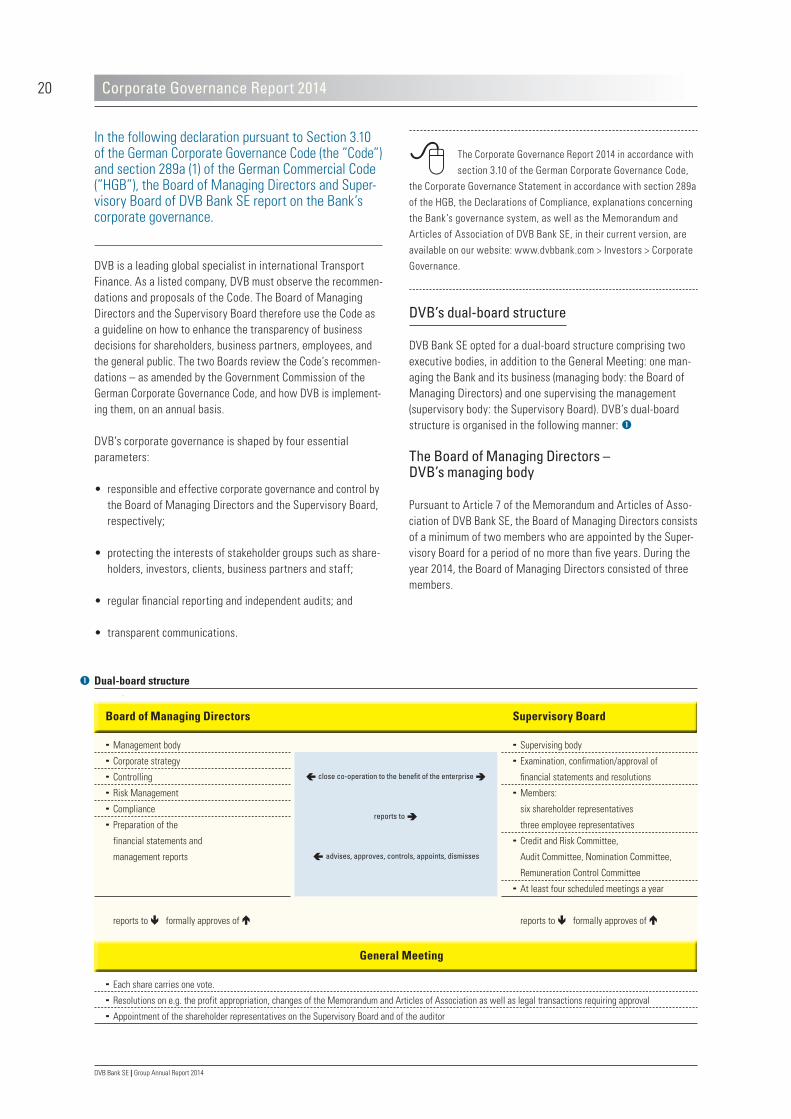
DVB’s dual-board structure
DVB Bank SE opted for a dual-board structure comprising two executive bodies, in addition to the General Meeting: one man-aging the Bank and its business (managing body: the Board of Managing Directors) and one supervising the management (supervisory body: the Supervisory Board). DVB’s dual-board structure is organised in the following manner:
The Board of Managing Directors – DVB’s managing body
Pursuant to Article 7 of the Memorandum and Articles of Asso-ciation of DVB Bank SE, the Board of Managing Directors consists of a minimum of two members who are appointed by the Super-visory Board for a period of no more than five years. During the year 2014, the Board of Managing Directors consisted of three members.
In the following declaration pursuant to Section 3.10 of the German Corporate Governance Code (the ”Code”) and section 289a (1) of the German Commercial Code (”HGB”), the Board of Managing Directors and Super-visory Board of DVB Bank SE report on the Bank’s corporate governance.
DVB is a leading global specialist in international Transport Finance. As a listed company, DVB must observe the recommen-dations and proposals of the Code. The Board of Managing Directors and the Supervisory Board therefore use the Code as a guideline on how to enhance the transparency of business decisions for shareholders, business partners, employees, and the general public. The two Boards review the Code’s recommen-dations – as amended by the Government Commission of the German Corporate Governance Code, and how DVB is implement-ing them, on an annual basis.
DVB’s corporate governance is shaped by four essential parameters:
• responsible and effective corporate governance and control by the Board of Managing Directors and the Supervisory Board, respectively;
• protecting the interests of stakeholder groups such as share-holders, investors, clients, business partners and staff;
• regular financial reporting and independent audits; and
• transparent communications.
Corporate Governance Report 2014
Dual-board structure
Board of Managing Directors
Management body
Corporate strategy
Controlling
Risk Management
Compliance
Preparation of the
financial statements and
management reports
reports to formally approves of
close co-operation to the benefit of the enterprise
reports to
advises, approves, controls, appoints, dismisses
Supervisory Board
Supervising body
Examination, confirmation/approval of
financial statements and resolutions
Members:
six shareholder representatives
three employee representatives
Credit and Risk Committee,
Audit Committee, Nomination Committee,
Remuneration Control Committee
At least four scheduled meetings a year
reports to formally approves of
General Meeting
Each share carries one vote.
Resolutions on e.g. the profit appropriation, changes of the Memorandum and Articles of Association as well as legal transactions requiring approval
Appointment of the shareholder representatives on the Supervisory Board and of the auditor
21
DVB Bank SE | Group Annual Report 2014
A BOU T U S
COMPANY
GROUP M A N AGE MEN T RE P OR T
C ONSOL IDAT ED F IN A NCI A L S TA ME MEN T S
AUDI T OP INION
The Supervisory Board selects those candidates for appointment as member of the Board of Managing Directors who are most suitable in the context of the Bank’s business model: specific expertise in the transport finance business is decisive, whereas criteria such as gender or nationality are less relevant for the sus-tainable promotion of the Bank’s business model (section 5.1.2 (1) sentence 2 of the Code).
Reappointments, for no more than five years per term, are permitted. In principle, the term of office of a member of the Board of Managing Director ends when reaching the age of 65. In exceptional cases, this term of office may be extended twice, by one year each.
The Board of Managing Directors manages the business in the Company’s best interests, and in order to achieve a sustained increase in its value. In doing so, the Board of Managing Directors considers the interests of shareholders, investors, clients, and business partners as well as those of the Bank’s employees. DVB’s business model and its strategic position in the relevant global transport markets is determined and refined by the Board of Managing Directors in co-ordination with the Supervisory Board. In addition, the members of the Board of Managing Directors ensure that the Company is managed in accordance with legal regulations, the Memorandum and Articles of Association, and the Internal Regulations. Moreover, the Board of Managing Directors directs the parent company – DVB Bank SE – and the DVB Group, using efficient management tools. Specifically, these include financial controls, risk management, and compliance.
Regarding the members of the Board of Managing Directors, no conflicts of interest pursuant to section 4.3 of the Code occurred during the 2014 business year.
More information on the composition of the Board of Managing Directors and the distribution of responsibilities amongst its members is available on page 13 of this annual report.
The Supervisory Board – DVB’s supervisory body
Pursuant to Article 11 (1) of the Memorandum and Articles of Association of DVB Bank SE, the Supervisory Board consists of total of nine members, comprising six shareholder representatives and three employee representatives. On 1 November 2014, Dr Peter Klaus retired from the Supervisory Board, for personal reasons. The vacancy should be filled at DVB’s Annual General Meeting 2015. The current members of the Supervisory Board are appointed for the period until the conclusion of the General Meeting that passes a resolution on the formal approval for the
fourth financial year following the commencement of their term of office (section 11 (2) of the Memorandum and Articles of Association). This will be the Annual General Meeting to be held in 2018. Reappointments are permissible.
In accordance with section 5.4.3 of the Code, since the Annual General Meeting 2014, Supervisory Board elections have been conducted individually for each member. Within the scope of proposals for election to be submitted to the Annual General Meeting, DVB will disclose each candidate’s personal or business relations with DVB, its executive bodies, or a major shareholder in DVB, as well as proposals for election to the function of Chairman of the Supervisory Board.
With regard to the election of Supervisory Board members it shall be ensured in principle that any such candidate will not attain the age of 70 years during their term of office as a member of the Supervisory Board. In special cases, however, this threshold may be exceeded by one year, in which case the term of office of the respective Supervisory Board member will end upon the close of the Annual General Meeting held after that member’s 71st birthday. Former members of the Board of Managing Directors may only be elected to the Supervisory Board after a period of two years has elapsed since their retirement from the Board of Managing Directors, unless their election is proposed by a shareholder holding a stake exceeding 25% of the voting rights of DVB Bank SE.
The Supervisory Board continually advises and supervises the Board of Managing Directors in its management of the business. It is involved in every major business decision. Transactions that require Supervisory Board approval, pursuant to Article 18 of the Memorandum and Articles of Association, include the purchase and sale of companies, the conclusion of inter-company agree-ments and the development of new (or the discontinuation of existing) business segments, to the extent that the relevant measure has material importance for DVB Group. In addition, the Supervisory Board is responsible for the appointment and removal of members of the Board of Managing Directors.
The Supervisory Board conducts its business in accordance with its Internal Regulations. It is directed by the Chairman of the Supervisory Board, who sets the agenda for each meeting, chairs the plenary meetings, and signs the meeting minutes. The Internal Regulations of the Supervisory Board also provide for various methods of casting votes; for each poll, the Chairman of the Supervisory Board selects the most appropriate method from amongst these options.
Corporate Governance Report 2014

22
DVB Bank SE | Group Annual Report 2014
• The Nomination Committee consists of three Supervisory Board members. The Committee’s tasks are defined by law (section 25d of the German Banking Act) and in the Internal Regulations for the Nomination Committee. The Committee is responsible selecting candidates for appointment to the Board of Managing Directors, including preparing resolutions for the conclusion, extension or termination of contracts with the members of the Board of Managing Directors, and regarding their remuneration; the resolutions are passed by the plenary meeting of the Supervisory Board. The Committee also prepares objectives for the promotion of the under- represented gender on the Supervisory Board, and conceiving a strategy to achieve such objectives. It carries out a review of the structure, size, composition and performance of the Board of Managing Directors and the Supervisory Board at least once a year, examining the skills, professional aptitude and experience of individual members of the Board of Man-aging Directors and of the Supervisory Board. In this context, the Committee also reviews the principles adhered to by the Board of Managing Directors in identifying and appointing individuals to the Company’s upper management level.
• The Remuneration Control Committee consist of the Chairman of the Supervisory Board, one shareholder representative and one employee representative to the Supervisory Board. The Committee’s tasks include monitoring whether remuner-ation systems for the Board of Managing Directors and for the Bank’s employees are appropriate; the Committee supports the Board of Managing Directors in determining the specifi-cations of such remuneration systems. Moreover, the Remu-neration Control Committee prepares Supervisory Board resolutions concerning the remuneration of the Board of Managing Directors, focusing in particular on the impact of planned resolutions on the Company’s risks and risk manage-ment.
No committee has been established for the preparation of Super-visory Board meetings. Preparations for these meetings – in terms of topics and organisation – take place in direct communication between the Chairman of the Supervisory Board and the Board of Managing Directors. The Bank intends to adhere to this well-established practice in the future.
During 2014, the Supervisory Board formed four committees, the Credit and Risk Committee, the Audit Committee, the Nomi-nation Committee and the Remuneration Control Committee.
• The members of the Credit and Risk Committee are elected by the Supervisory Board from amongst its members. The Committee convenes at least four times per year. The Com-mittee’s tasks include advising the Supervisory Board on topics such as the Company’s overall propensity to accept risk, and on its risk strategy. The Committee also supports the Com-pany with the related monitoring and implementation. More-over, it monitors terms and conditions in the lending business and examines whether these are in line with the Company’s risk structure. Moreover, the Credit and Risk Committee discusses the incentives provided for in the remuneration system, and reviews whether these incentives take the structure of DVB’s risk, capital and liquidity into account. It also deals with all DVB Group exposures which must be sub-mitted to the Supervisory Board for acknowledgement or approval, as well as all major loans and loans subject to higher risks. Where required, the Committee approves any such loans. Moreover, the Board of Managing Directors coordinates the lending policies with the Credit and Risk Committee, and keeps the members of the Committee informed on a regular basis about problem loans, exposures subject to higher risk, and unusual events related to the lending business.
• The Audit Committee, which comprises three members, supports the Supervisory Board particularly with regard to monitoring the accounting and financial reporting process, the effectiveness of the risk management system, the internal control system, and Internal Audit. The Committee monitors the audit of the financial statements, focusing in particular on ensuring the independence of external auditors and on the swift resolution of any deficiencies determined by the external auditors, by way of suitable measures.
Corporate Governance Report 2014

23
DVB Bank SE | Group Annual Report 2014
A BOU T U S
COMPANY
GROUP M A N AGE MEN T RE P OR T
C ONSOL IDAT ED F IN A NCI A L S TA ME MEN T S
AUDI T OP INION
Communications between the managing body and the super-visory body are generally structured as follows: between sched-uled Supervisory Board meetings, the Chairman of the Board of Managing Directors informs the Chairman of the Supervisory Board – regularly, without delay and always up to date – on the Bank’s strategy, planning and business development, on risk management and the Bank’s risk situation, compliance, as well as on important decisions to be made, and on significant issues. During its meetings, the supervisory body is kept informed, regularly and comprehensively, on developments of strategic parameters pertaining to DVB’s business model, resulting adjust-ments to future business policy, as well as on corporate govern-ance and planning (including financial planning, comprising the planning of DVB’s financial position and financial performance, and human resources planning). Moreover, Committee members receive more detailed information concerning their respective areas of responsibility.
For further information, please refer to the Report of the Supervisory Board (on pages 14 –18 of this annual report), which also gives a detailed description of the work of the Supervisory Board and the focal issues discussed during 2014, as well as the processes of communication and coor-dination between the Board of Managing Directors and the Supervisory Board. The current composition of the Super-visory Board, and of its committees, is shown on page 19 of this annual report.
Remuneration report
Pursuant to section 16 of the German Regulation on Remuneration in Financial Institutions, DVB is obliged to disclose information regarding its remuneration policy and practice. DVB’s disclosure duties as a bank, as defined in section 1 of the KWG, are based solely on Article 450 of the Regulation 575/2013/EU (Capital Requirements Regulation – CRR) which requires that the Bank discloses certain quantitative and qualitative details for groups of employees whose activity has a material impact on the Bank’s risk profile (”risk takers”).
The remuneration chapter of the group management report (pages 72–75) provides a detailed overview and explanations concerning the legal principles of DVB’s remuneration system.
Remuneration of the Board of Managing Directors
Total expenses for the remuneration of the Board of Managing Directors, former members of the Board of Managing Directors and their surviving dependants, as well as the Supervisory Board amounted to €4.1 million (2013: €3.8 million).
The HGB requires companies to disclose personalised remunera-tion (and remuneration components) of members of the Board of Managing Directors in the financial statements and consolidated financial statements. Pursuant to sections 286 (5) and 314 (2) sentence 2 of the HGB, a company may waive such personalised disclosure of executive remuneration if the General Meeting adopts a resolution to that effect, with a qualified majority vote of no less than three-quarters of the share capital represented during the passing of the relevant resolution. By virtue of a reso-lution passed by the Annual General Meeting held on 9 June 2011 (agenda item no. 5), with the requisite majority of the share capital represented, DVB Bank SE has opted to waive the person-alised disclosure of remuneration paid to members of the Board of Managing Directors for a period of five years.
Corporate Governance Report 2014
24
DVB Bank SE | Group Annual Report 2014
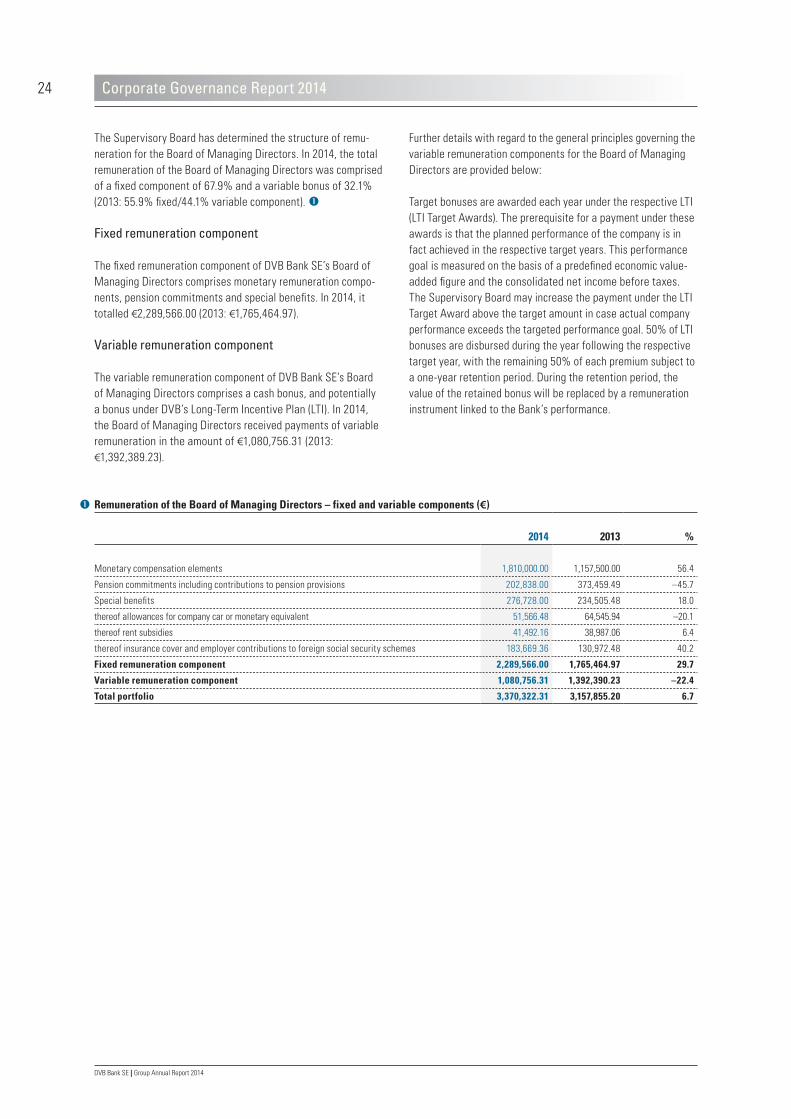
Further details with regard to the general principles governing the variable remuneration components for the Board of Managing Directors are provided below:
Target bonuses are awarded each year under the respective LTI (LTI Target Awards). The prerequisite for a payment under these awards is that the planned performance of the company is in fact achieved in the respective target years. This performance goal is measured on the basis of a predefined economic value-added figure and the consolidated net income before taxes. The Supervisory Board may increase the payment under the LTI Target Award above the target amount in case actual company performance exceeds the targeted performance goal. 50% of LTI bonuses are disbursed during the year following the respective target year, with the remaining 50% of each premium subject to a one-year retention period. During the retention period, the value of the retained bonus will be replaced by a remuneration instrument linked to the Bank’s performance.
The Supervisory Board has determined the structure of remu-neration for the Board of Managing Directors. In 2014, the total remuneration of the Board of Managing Directors was comprised of a fixed component of 67.9% and a variable bonus of 32.1% (2013: 55.9% fixed/44.1% variable component).
Fixed remuneration component
The fixed remuneration component of DVB Bank SE’s Board of Managing Directors comprises monetary remuneration compo-nents, pension commitments and special benefits. In 2014, it totalled €2,289,566.00 (2013: €1,765,464.97).
Variable remuneration component
The variable remuneration component of DVB Bank SE’s Board of Managing Directors comprises a cash bonus, and potentially a bonus under DVB’s Long-Term Incentive Plan (LTI). In 2014, the Board of Managing Directors received payments of variable remuneration in the amount of €1,080,756.31 (2013: €1,392,389.23).
Corporate Governance Report 2014
Remuneration of the Board of Managing Directors – fixed and variable components (€)
2014 2013 %
Monetary compensation elements 1,810,000.00 1,157,500.00 56.4
Pension commitments including contributions to pension provisions 202,838.00 373,459.49 –45.7
Special benefits 276,728.00 234,505.48 18.0
thereof allowances for company car or monetary equivalent 51,566.48 64,545.94 –20.1
thereof rent subsidies 41,492.16 38,987.06 6.4
thereof insurance cover and employer contributions to foreign social security schemes 183,669.36 130,972.48 40.2
Fixed remuneration component 2,289,566.00 1,765,464.97 29.7
Variable remuneration component 1,080,756.31 1,392,390.23 –22.4
Total portfolio 3,370,322.31 3,157,855.20 6.7

25
DVB Bank SE | Group Annual Report 2014
A BOU T U S
COMPANY
GROUP M A N AGE MEN T RE P OR T
C ONSOL IDAT ED F IN A NCI A L S TA ME MEN T S
AUDI T OP INION
The cash bonus payments paid to members of the Board of Managing Directors are determined on the basis of agreements on operational targets. These objectives, which are agreed upon between the Supervisory Board and the respective member of the Board of Managing Directors, are related to objective criteria for the relevant financial year (referring to financial indicators such as Economic Value Added and consolidated net income before taxes) as well as to the personal performance of each individual member of the Board of Managing Directors.
The amount of the bonus depends on the (measurable) extent to which the targets were achieved. The cash bonus for the business year 2014 will be awarded in four tranches: 40% during 2015, and three tranches of 20% each, awarded during the following business years 2016 to 2018.
Each deferred bonus tranche is subject to a malus process prior to disbursement, whereby the relevant risk situation and profita-bility at the respective point in time, compliance with internal guidelines (such as compliance guidelines or lending guidelines) as well as the member’s personal conduct are taken into account. For any deferred bonus tranche, this malus process cannot lead to an increase; however, it may reduce the amount and may even lead to the tranche being cancelled altogether.
In addition, for all award tranches, 50% of each tranche is sub-ject to an additional one-year retention period. This means that these parts will not be disbursed immediately. During the retention period, the value of the retained amounts will be replaced by a remuneration instrument linked to the Bank’s performance.
The prerequisite for payment of the two variable remuneration components is, in each case, that no notice of termination has been given with regard to the employment relationship with the member of the Board of Managing Directors concerned as at the time of payment. The sole exception would be where a Board member retires from office for reasons of age, or due to non-renewal of a contract.
In the event of measures taken by the German Federal Financial Supervisory Authority or any other competent bank supervisory authority – especially under the so-called Single Supervisory Mechanism of the European Central Bank – no claims can be asserted under contractual stipulations which would contradict the measures taken by supervisors.
Examples for such supervisory measures include the following:
• The supervisory authority restricts the aggregate amount of variable remuneration components (e.g. pursuant to section 45 (2) sentence 1 no. 5a of the KWG) or voids them in their entirety, or issues a corresponding instruction to this effect.
• The supervisory authority restricts of prohibits the disburse-ment of variable remuneration components (e.g. pursuant to section 45 (2) sentence 1 no. 6 of the KWG).
• The supervisory authority orders that claims on granting variable remuneration components are to be voided, in whole or in part (e.g. pursuant to section 45 (5) sentences 5 et seq. of the KWG).
Remuneration of the Supervisory Board
The Annual General Meeting of DVB Bank SE held on 12 June 2014 (agenda item 11) adopted new rules for the remuneration of the Supervisory Board, as set out in Article 19 (1) and (2) of the Memorandum and Articles of Association of DVB Bank SE. Accordingly,
• the Chairman of the Supervisory Board receives €40,000.00;
• members of the Supervisory Board receive €30,000.00;
• the members of Supervisory Board committees receive the following additional amounts:
− members of the Credit and Risk Committee receive €10,000.00;
− members of the Audit Committee receive €7,500.00;
− members of the Nomination Committee receive €3,750.00; and
− members of the Remuneration Control Committee receive €3,750.00.
The remuneration is paid on the 1 July of each year. Where said remuneration is subject to value-added tax, this tax shall be paid in addition to the remuneration (Article 19 (3) of the Memorandum and Articles of Association). Further details, such as the reim-bursement of travelling expenses and other cash expenses, daily allowances and similar issues, are governed by Article 19 (4) of the Memorandum and Articles of Association.
Corporate Governance Report 2014
26
DVB Bank SE | Group Annual Report 2014
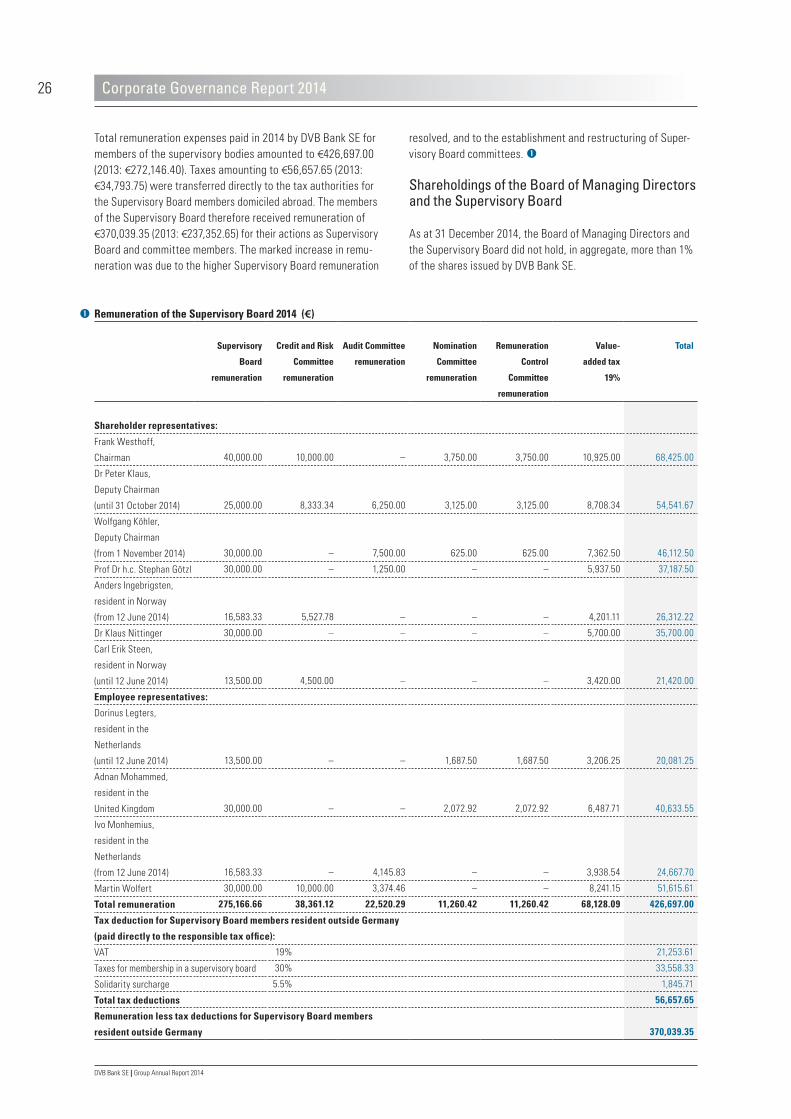
resolved, and to the establishment and restructuring of Super-visory Board committees.
Shareholdings of the Board of Managing Directors and the Supervisory Board
As at 31 December 2014, the Board of Managing Directors and the Supervisory Board did not hold, in aggregate, more than 1% of the shares issued by DVB Bank SE.
Total remuneration expenses paid in 2014 by DVB Bank SE for members of the supervisory bodies amounted to €426,697.00 (2013: €272,146.40). Taxes amounting to €56,657.65 (2013: €34,793.75) were transferred directly to the tax authorities for the Supervisory Board members domiciled abroad. The members of the Supervisory Board therefore received remuneration of €370,039.35 (2013: €237,352.65) for their actions as Supervisory Board and committee members. The marked increase in remu-neration was due to the higher Supervisory Board remuneration
Corporate Governance Report 2014
Remuneration of the Supervisory Board 2014 (€)
Supervisory
Board
remuneration
Credit and Risk
Committee
remuneration
Audit Committee
remuneration
Nomination
Committee
remuneration
Remuneration
Control
Committee
remuneration
Value-
added tax
19%
Total
Shareholder representatives:
Frank Westhoff,
Chairman 40,000.00 10,000.00 – 3,750.00 3,750.00 10,925.00 68,425.00
Dr Peter Klaus,
Deputy Chairman
(until 31 October 2014) 25,000.00 8,333.34 6,250.00 3,125.00 3,125.00 8,708.34 54,541.67
Wolfgang Köhler,
Deputy Chairman
(from 1 November 2014) 30,000.00 – 7,500.00 625.00 625.00 7,362.50 46,112.50
Prof Dr h.c. Stephan Götzl 30,000.00 – 1,250.00 – – 5,937.50 37,187.50
Anders Ingebrigsten,
resident in Norway
(from 12 June 2014) 16,583.33 5,527.78 – – – 4,201.11 26,312.22
Dr Klaus Nittinger 30,000.00 – – – – 5,700.00 35,700.00
Carl Erik Steen,
resident in Norway
(until 12 June 2014) 13,500.00 4,500.00 – – – 3,420.00 21,420.00
Employee representatives:
Dorinus Legters,
resident in the
Netherlands
(until 12 June 2014) 13,500.00 – – 1,687.50 1,687.50 3,206.25 20,081.25
Adnan Mohammed,
resident in the
United Kingdom 30,000.00 – – 2,072.92 2,072.92 6,487.71 40,633.55
Ivo Monhemius,
resident in the
Netherlands
(from 12 June 2014) 16,583.33 – 4,145.83 – – 3,938.54 24,667.70
Martin Wolfert 30,000.00 10,000.00 3,374.46 – – 8,241.15 51,615.61
Total remuneration 275,166.66 38,361.12 22,520.29 11,260.42 11,260.42 68,128.09 426,697.00
Tax deduction for Supervisory Board members resident outside Germany
(paid directly to the responsible tax office):
VAT 19% 21,253.61
Taxes for membership in a supervisory board 30% 33,558.33
Solidarity surcharge 5.5% 1,845.71
Total tax deductions 56,657.65
Remuneration less tax deductions for Supervisory Board members
resident outside Germany 370,039.35

27
DVB Bank SE | Group Annual Report 2014
A BOU T U S
COMPANY
GROUP M A N AGE MEN T RE P OR T
C ONSOL IDAT ED F IN A NCI A L S TA ME MEN T S
AUDI T OP INION
General Meeting – protecting shareholders’ interests
DVB’s shareholders exercise their rights prior to or during the General Meeting, as provided by law or in the Memorandum and Articles of Association. The Annual General Meeting of DVB Bank SE takes place during the first six months after the end of each financial year (Article 21 of the Memorandum and Articles of Association). Shareholders’ regular duties include:
• accepting the financial statements confirmed by the Super-visory Board and the consolidated financial statements approved by the Supervisory Board;
• passing resolutions on the appropriation of distributable profit;• passing resolutions on the formal approval of the members of
the Board of Managing Directors and the Supervisory Board;• electing shareholders’ representatives to the Supervisory
Board; and • passing a resolution on the appointment of the external
auditors.
The invitation to the General Meeting of DVB Bank SE, including the agenda, is published in the German Federal Gazette. It is additionally sent to shareholders via their custodian banks. In addition, the convening notice and agenda can easily be accessed via the Bank’s website as soon as the General Meeting has been convened. For easy reference, a summary agenda is also provided there.
www.dvbbank.com > Investors > General Meeting
The website also contains information on shareholder rights pursuant to sections 122 (2), 126 (1), 127, 131 (1) of the German Public Limited Companies Act (”AktG”). The Bank offers the additional service of allowing shareholders to appoint one of the proxies named by DVB to exercise their voting rights at the General Meeting. Pursuant to section 134 (3) sentence 4 of the AktG, DVB provides a proxy form which can be used for electronic transmission of a proxy by fax or e-mail.
The Company’s Memorandum and Articles of Association do not currently provide for the casting of votes by post.
More information on the topics discussed during the Annual General Meeting 2014 is available in the chapter ”DVB share” on page 44 of this annual report.
Regular financial reporting and independent audits
Financial reports provide shareholders and the general public with regular information about DVB’s financial position and per-formance. DVB publishes two annual reports for each concluded business year. The annual report of DVB Bank SE comprises the Bank’s financial statements in accordance with the HGB, whilst DVB Group’s annual report contains its IFRS consolidated financial statements. Both sets of financial statements are prepared by the Board of Managing Directors. They are subjected to a review by the independent external auditors appointed at the Annual General Meeting before being confirmed (single-entity financial statements) by, or receiving final approval (consolidated financial statements) from the Supervisory Board.
The single-entity report of DVB Bank SE is only published on the Bank’s website, in German. The Group Annual Report is available for download from DVB’s website in both English and German.
These reports are expected to be available on DVB’s web-site www.dvbbank.com, under Investors > Publications >
Financial reports at the end of March/beginning of April 2015.
During the year, DVB also publishes a half-yearly financial report that includes condensed consolidated financial statements and interim management statements during the first and second half of the year, covering key financial data for the first three months and nine months of the business year, respectively. All these financial reports are prepared according to IFRS.
The Annual General Meeting on 12 June 2014 appointed Ernst & Young GmbH Wirtschaftsprüfungsgesellschaft, Stuttgart, as auditors for the 2014 business year. Their mandate covers the audit of the single-entity financial statements and the consoli-dated financial statements prepared by DVB for the 2014 business year, as well as any review of the condensed financial statements and the interim management report (pursuant to sections 37w (5) and 37y no. 2 of the German Securities Trading Act (WpHG)) as at 30 June 2014; and interim consolidated financial statements (pursuant to section 340i (4) of the HGB) prepared prior to the Annual General Meeting held in 2015.
Corporate Governance Report 2014

28
DVB Bank SE | Group Annual Report 2014
Risk management
DVB’s Board of Managing Directors has established an adequate and viable risk management system that fulfils the Bank’s own commercial needs and complies with legal requirements. With the methods, models, organisational rules and IT systems imple-mented, DVB is able to recognise material risks at an early stage, and to respond appropriately by taking suitable measures. The suitability and effectiveness of DVB’s risk management system are regularly reviewed by internal and external auditors.
DVB operates a Group-wide risk management system, which complies with all statutory and regulatory requirements. This risk management system comprises adequate provisions and measures with respect to risk strategy, risk-bearing capacity, risk management, and risk monitoring, plus a multi-level frame-work for the early detection of risks. In addition to the structural and procedural organisation, these measures also apply to the processes for identifying, assessing, managing, monitoring and communicating the risks.
DVB’s (narrowly-defined) risk management system distinguishes between operative and strategic risk management. The Bank defines operative risk management as the implementation of the risk strategy by the various business divisions, as prescribed by the Board of Managing Directors. In addition to defining risk policy guidelines, strategic risk management also coordinates and supports operative risk management processes by cross-divisional committees.
The risk control function – which is independent from risk management in the narrower sense – comprises the identification, quantification, limitation and monitoring of risks, plus risk reporting. A DVB Group Risk Report is submitted to the entire Board of Managing Directors and the Supervisory Board on a quarterly basis, informing the two Boards about the Group’s risk exposure. Furthermore, DVB has installed reporting systems for all relevant types of risk. This ensures that the risks are transparent at all times to the authorised persons with respon-sibility for those risks.
For more details regarding risk management, please refer to the report on opportunities and risks on pages 142–146 of this annual report.
Management tools
The key tools employed to manage the business are financial controlling, the risk management system, and the compliance function.
Financial controlling
The Board of Managing Directors has an extensive set of controls at its disposal: it uses them for value-driven and integrated overall management of the Bank – taking into account both income and risk parameters. From an ex-ante point of view, the key task is to distinguish beneficial options from disadvantageous ones – with a focus on the transparent and consistent design of target systems, alternatives, and forecasts. Ex-post analyses, in contrast, are carried out within the framework of a systematic cycle of planning, management and control. This means identi-fying concrete measures and management options that are specifically designed to meet the requirements of the respective management areas.
The information gained through analysing risk-adjusted profitabil-ity provides transparency regarding the value created throughout the Group, and in the various units managed. The metric used internally to assess the performance of each unit is economic value added (EVA™). The indicator measures the performance generated on the risk capital invested. Risk-adjusted profitability data is a key input factor for allocating capital and resources within the enterprise.
All of DVB’s divisions and areas are covered by a uniform value-driven management system. Besides income, risk is another key dimension of all ex-ante and ex-post analyses.
In essence, the Group’s focus is on achieving defined income and cost targets, whilst maintaining its risk-bearing capacity and ensuring compliance with regulatory requirements. In addition to the strategic plan and a detailed one-year plan, the standardised toolbox also provides for regular projections of full-year results carried out over the course of the year. The periodic management information system is built on top of an integrated data ware-house, with ad-hoc studies and analyses used as required.
DVB’s tools for measuring risk-adjusted profitability are also integrated in the ”Integrated risk and capital management system used throughout the DZ BANK Group”.
Corporate Governance Report 2014

29
DVB Bank SE | Group Annual Report 2014
A BOU T U S
COMPANY
GROUP M A N AGE MEN T RE P OR T
C ONSOL IDAT ED F IN A NCI A L S TA ME MEN T S
AUDI T OP INION
Compliance
DVB defines compliance as adherence to the law and the Com-pany’s Memorandum and Articles of Association, as well as compliance with internal rules and regulations and voluntary obligations. The Compliance Office has been mandated by the Board of Managing Directors to ensure that regulatory compliance is implemented throughout the Group. Thus, the scope of the function includes – but is not limited to – money laundering prevention, prevention of market abuse or market manipulation, data protection, conflicts of interest, anti-corruption, and com-pliance with the Markets in Financial Instruments Directive. In accordance with section 33 (1) sentence 2 no. 5 of the WpHG, the Head of Compliance submits a Compliance Report to the Board of Managing Directors and the Supervisory Board, at least once a year. This report complies with the requirements pursuant to sections 31 et seq. of the WpHG, the MaComp (Minimum Requirements for the Compliance Function and Additional Requirements Governing Rules of Conduct, Organisation and Transparency pursuant to sections 31 et seq. of the WpHG), as well as sectino AT 4.4.2 of the MaRisk (Minimum Requirements for Risk Management in Banks).
Sustainable conduct – both commercially and socially – is a key element of DVB’s corporate culture. To ensure a professional, uniform and exemplary standard of conduct throughout the Group, the Board of Managing Directors developed a Code of Conduct at the beginning of 2010 (which was extended in 2012). The values enshrined in this Code of Conduct must be observed vis-à-vis our clients and business partners as well as all fellow employees.
The Code of Conduct outlines DVB’s mission statement based on four core values:
• We offer our clients professional expertise on transport markets and transport assets – throughout all market cycles.
• We support our clients around the world with tailor-made financing solutions and services. Our products meet all relevant legal and ethical standards.
• Entrepreneurial vision and strength guides our every thought and action.
• We create a working environment for all DVB staff that promotes expertise, creativity, dedication, teamwork and variety.
In this way, the Code of Conduct is also designed to manage ethical and legal challenges arising during day-to-day work, providing guidance in the event of any conflicts.
The Code of Conduct is available on www.dvbbank.com, via the footer in the lower part of the page (in the
Compliance section).
Compliance staff have been appointed in each of the Bank’s locations, directly reporting in this capacity to the Head of Com-pliance. Where possible, automated monitoring systems have been implemented, which ensure that any potential breaches are automatically alerted to the central function in Frankfurt/Main. The local Compliance Officers must additionally escalate any potential breach of internal policies/procedures as well as external rules and regulations.
All staff attend regular trainings on compliance-related topics. DVB has partnered with an external provider to conduct web-based training sessions. Specifically, mandatory webinars were carried out focused on money laundering prevention, operational risk, data protection and security, conflicts of interest, and the Code of Conduct. In addition, the Bank has conducted regional follow-up group trainings on anti-money laundering and anti-corruption measures where it uses a training video covering the topics, provided information concerning special regional require-ments, and offered the opportunity to discuss the key learnings.
Corporate Governance Report 2014

30
DVB Bank SE | Group Annual Report 2014
Compliance
Compliance training
Our employees receive regular, mandatory training on the follow-ing issues:
• Prevention of money laundering and fraud • Code of Conduct • Operational Risk Management• Data security• Handling conflicts of interest
In 2014, the ambitious target of a training ratio of 100% amongst employees for whom participation was compulsory was met.
Ethics
A new development in the field of compliance is emphasis on the conduct of senior managers in financial institutions. Specifi-cally, regulators are looking for managers to ensure that any risk of treating clients unfairly has been identified, mitigated, and necessary enhancements implemented. This is driven by experi-ence during the recent crisis where clients may have not have been sold adequate products, or received information or disclo-sures. The expectation is that senior managers have full over-sight of all activities of the respective units – not just the busi-ness unit that they may be directly responsible for.
DVB has recognised the importance of ensuring that senior managers accept this responsibility, and are accountable for their actions. In addition to existing policies and procedures – notably, our Code of Conduct – DVB has initiated a specific training programme for senior executives, established custom-ised management information packages, and commenced assessing its business to identify any areas of concern. The Bank will be addressing these proactively. Additionally, the Board of Managing Directors has approved a full-time position to implement this programme at the Bank’s London branch, and we are looking to apply the lessons learned at other entities.
In 2014, DVB once again achieved good results on the international transport markets, thanks to its focused business model. Our main objective throughout every market situation is to secure and enhance the business model for the long term.
Securing the business model for the long term
In order to continually and successfully apply our focused business model in cyclical and even in slumping markets, it is crucial that we proactively identify all the risks that we are exposed to. We use Controlling, Risk Management and Compliance to ensure that all legal, regulatory and statutory requirements are being met. Compliance is responsible for preventing money laundering, market abuse or manipulation, ensuring data protection, handling conflicts of interest, and compliance with the Markets in Finan-cial Instruments Directive as well as with the new requirements set out in the MaRisk. All employees receive compliance training on a regular basis to ensure that everyone is aware of and familiar with defined responsibilities and requirements.
Fostering fair and transparent competition is a cornerstone of our business philosophy, which is underpinned by clearly defined and strict compliance guidelines:
• Rules to promote fair competition (Conflict of Interest Policy) • Rules to prevent corruption (Anti-Corruption and Bribery Policy) • Guidelines relating to accepting gifts and benefits
(Gifts and Gratuities Policy) • Procedure for reporting any irregularities (Whistleblowing
Policy)
The Board of Managing Directors implemented a Code of Conduct in spring 2010 in order to secure and deepen employee awareness of, and understanding for, compliant and ethically faultless conduct. We are proud of our experienced and effective team, which maintains exemplary standards of conduct towards clients and investors.
The Code of Conduct is available on our website www.dvbbank.com, via the footer in the lower part of the
page (in the ”Compliance” section).

31
DVB Bank SE | Group Annual Report 2014
Clients
Client distribution and client loyalty
At the end of 2014, DVB’s global client base comprised 608 clients or client groups (previous year: 632). Most of our clients are domiciled in Europe (47.7%), followed by North America (18.8%) and Asia (17.1%). Our clients and client groups are distributed across our business divisions as follows:
• Shipping Finance accounts for 46.1% of clients (previous year: 46.9%);
• Aviation Finance accounts for 25.2% of clients (previous year: 25.2%);
• Offshore Finance accounts for 8.4% of clients (previous year: 8.2%);
• Land Transport Finance accounts for 7.4% of clients (previous year: 7.4%);
• ITF Suisse accounts for 7.1% of clients (previous year: 6.6%);
• Investment Management accounts for 2.1% of clients (previous year: 2.1%);
• Portfolios no longer in line with the Bank’s strategy (which are being phased out, or wound down) account for 3.8% of clients (previous year: 3.6%).
DVB pursues a cycle-neutral business model: this is why the Bank has remained a reliable partner to its clients, continuing to provide financing and advice even in a market environment that continues to be challenging. This strengthens trust and deepens the intensity of our client relationships for the long term.
Accordingly, we support our Transport Finance and Investment Management clients with their financing projects on a long-term basis: as at 31 December 2014, 51.6% of our clients had been using our range of services for more than five years. Of our client relationships in the Transport Finance and Investment Manage-ment business divisions, we have maintained
• 8.4% for less than one year,• 20.9% for between one to three years,• 19.1% for between three to five years,• 36.2% for between five to ten years,• 9.7% for between ten to 15 years, and• 5.7% for 15 years and longer.
Whilst the average length of client relationships differs between the business divisions, it is worth noting that Investment Man-agement only commenced operations in 2001. Offshore Finance has only existed as an independent division since the beginning of 2013; the division covers the offshore financing activities previously handled by Shipping Finance.
Transactions
Our commitment to transport finance and to a number of trans-actions was once again awarded during 2014, as follows:
• Rail Finance Innovator of the Year (Global Transport Finance, December 2014)
• Rail Finance Deal of the Year – Europe (Global Transport Finance, December 2014)
%60
50
40
30
20
10
0
Less than 1 year
1 to 3 years
3 to 5 years
5 to 10 years
10 to 15 years
15 years and longer
Shipping Finance Aviation Finance Offshore Finance Land Transport Finance Investment Management
Length of client relationship by business division
8.8 8.0 7.15.5
22.0 25.1
4.0
22.0
19.9 17.5
24.3
10.1
24.2
35.8
29.9
37.9 39.4
48.3
9.5 10.0
3.0
24.2
0.0
4.0
9.5
0.0
15.2
0.0
12.1
22.7
GROUP M A N AGE MEN T RE P OR T
C ONSOL IDAT ED F IN A NCI A L S TA ME MEN T S
AUDI T OP INIONA BOU T U S
SUSTAINABILITY

32
DVB Bank SE | Group Annual Report 2014
Employees
Rising staff numbers over recent years were largely due to a significant increase in workload, in response to greater legal and regulatory requirements that had to be absorbed by addi-tional staff. This trend prevailed during 2014, affecting staffing levels in the service areas in particular: at 221 employees, the number was 3.8% higher than in the previous year (year-end 2013: 213 employees).
Staff numbers
Development of the personnel structure
After staff levels had risen by nine employees (1.6%) during 2013, the year under review saw an increase in the number of active employees by 14 (2.5%) to 581 staff. This figure does not reflect the twenty employees with inactive employment relation-ships, in particular the non-working phase of semi-retirement, maternity or parental leave. The staffing numbers for the years 2010–2014 shown here also include employees of the LogPay Financial Services GmbH subsidiary.
Staff levels 2010 – 2014
600
500
400
300
200
100
0
5
508
2010
7
548
2011
9
558
2012
7
567
2013
20
581
2014
Staff members in the active phase of employment Staff members in the passive phase of employment
Number of
staff members
Transport Finance/Investment Management 304 (+2 staff)
Service areas 221 (+8 staff)
LogPay Financial Services 56 (+4 staff)
Distribution of 581 employees by business division

33
DVB Bank SE | Group Annual Report 2014
Employees
Nationalities and work at international locations
DVB’s business model is international in every conceivable way. Diversity management has thus been a part of day-to-day life at DVB for quite some time. Once again, this was evident in the
structure of our team: DVB Group’s employees hailed from a total of 39 different countries in the year under review, and there are 30 different nationalities represented within our core Transport Finance business.
Nationalities 2014
Group Transport Finance/ Investment Management
Number % Number %
German 244 42.0 50 16.4
Dutch 77 13.3 61 20.1
British 69 11.9 47 15.5
Singaporean 39 6.7 31 10.2
US-American 29 5.0 21 6.8
Greek 22 3.8 19 6.3
Norwegian 20 3.4 17 5.6
32 additional nationalities within DVB 81 13.9 – –
23 additional nationalities in Transport Finance/Investment Management – – 58 19.1
Total 581 100.0 304 100.0
GROUP M A N AGE MEN T RE P OR T
C ONSOL IDAT ED F IN A NCI A L S TA ME MEN T S
AUDI T OP INIONA BOU T U S
SUSTAINABILITY
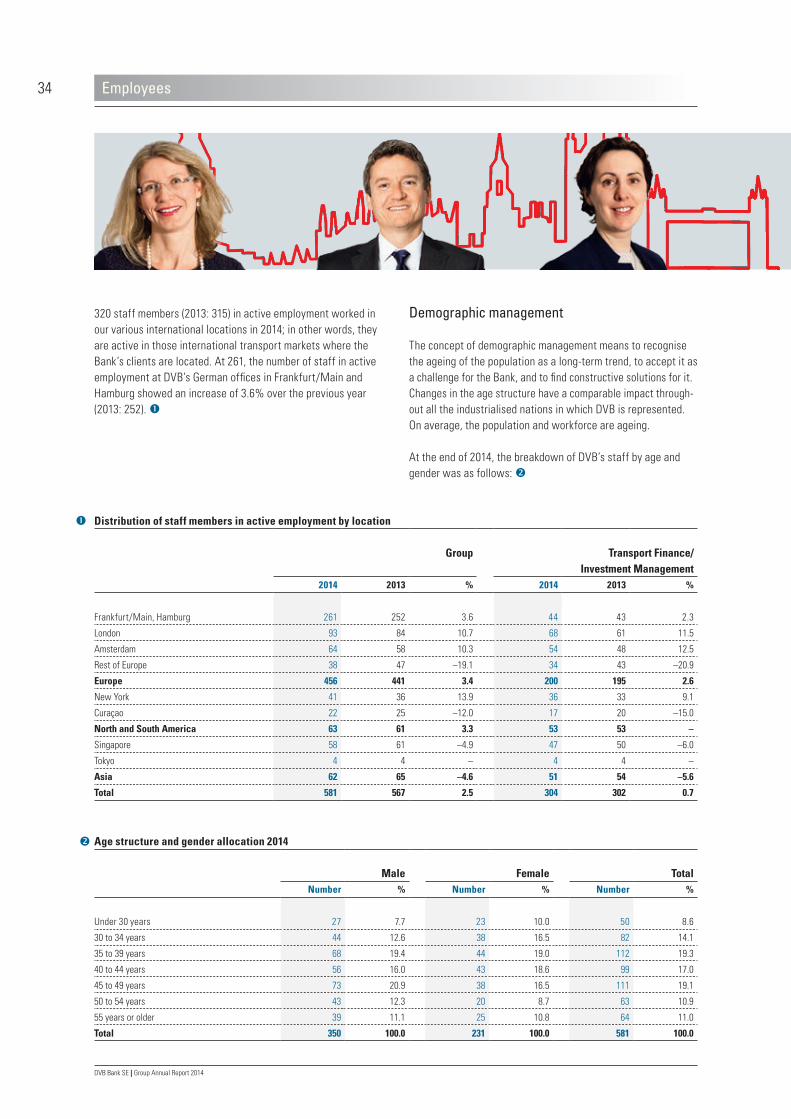
34
DVB Bank SE | Group Annual Report 2014
Employees
Demographic management
The concept of demographic management means to recognise the ageing of the population as a long-term trend, to accept it as a challenge for the Bank, and to find constructive solutions for it. Changes in the age structure have a comparable impact through-out all the industrialised nations in which DVB is represented. On average, the population and workforce are ageing.
At the end of 2014, the breakdown of DVB’s staff by age and gender was as follows:
320 staff members (2013: 315) in active employment worked in our various international locations in 2014; in other words, they are active in those international transport markets where the Bank’s clients are located. At 261, the number of staff in active employment at DVB’s German offices in Frankfurt/Main and Hamburg showed an increase of 3.6% over the previous year (2013: 252).
Distribution of staff members in active employment by location
Group Transport Finance/ Investment Management
2014 2013 % 2014 2013 %
Frankfurt/Main, Hamburg 261 252 3.6 44 43 2.3
London 93 84 10.7 68 61 11.5
Amsterdam 64 58 10.3 54 48 12.5
Rest of Europe 38 47 –19.1 34 43 –20.9
Europe 456 441 3.4 200 195 2.6
New York 41 36 13.9 36 33 9.1
Curaçao 22 25 –12.0 17 20 –15.0
North and South America 63 61 3.3 53 53 –
Singapore 58 61 –4.9 47 50 –6.0
Tokyo 4 4 – 4 4 –
Asia 62 65 –4.6 51 54 –5.6
Total 581 567 2.5 304 302 0.7
Age structure and gender allocation 2014
Male Female TotalNumber % Number % Number %
Under 30 years 27 7.7 23 10.0 50 8.6
30 to 34 years 44 12.6 38 16.5 82 14.1
35 to 39 years 68 19.4 44 19.0 112 19.3
40 to 44 years 56 16.0 43 18.6 99 17.0
45 to 49 years 73 20.9 38 16.5 111 19.1
50 to 54 years 43 12.3 20 8.7 63 10.9
55 years or older 39 11.1 25 10.8 64 11.0
Total 350 100.0 231 100.0 581 100.0

35
DVB Bank SE | Group Annual Report 2014
Employees
Of the total of 581 employees, 350 were men and 231 were women, as at the end of 2014 (2013: 567 employees comprising 342 men and 225 women).
• 21.9% of employees were 50 years or older (previous year: 21.7%).
• 36.1% of employees were between 40 and 50 years of age (previous year: 36.5%).
• 33.4% of employees were between 30 and 40 years of age (previous year: 34.2%).
• 8.6% of employees were younger than 30 years (previous year: 7.6%).
Given the heavy workloads and the new challenges that con-stantly arise, we are confronting the question of how DVB can motivate these experienced employees for the long term, and secure their loyalty to DVB. This is where our in-house training concept comes in: by establishing a variety of learning options, and integrating them in our corporate environment, we secure the readiness and commitment of our employees.
Staff loyalty
DVB relies on a very loyal workforce: at 31 December 2014, 367 employees (63.2% of the overall workforce) had been work-ing for DVB for more than five years (2013: 385 employees or 67.9%).
Staff loyalty, measured in terms of the length of employment
Male Female Total2014 Number % Number % Number %
Less than 5 years 122 34.9 92 39.8 214 36.8
More than 5 years 127 36.3 72 31.2 199 34.3
More than 10 years 53 15.1 27 11.7 80 13.8
More than 15 years 22 6.3 17 7.4 39 6.7
More than 20 years 13 3.7 13 5.6 26 4.5
More than 25 years 7 2.0 7 3.0 14 2.4
More than 30 years 6 1.7 3 1.3 9 1.5
Total 350 100.0 231 100.0 581 100.0
GROUP M A N AGE MEN T RE P OR T
C ONSOL IDAT ED F IN A NCI A L S TA ME MEN T S
AUDI T OP INIONA BOU T U S
SUSTAINABILITY

36
DVB Bank SE | Group Annual Report 2014
Employees
Professional experience of our staff
Experience in transport finance – or in the global transport industry in general – is one of the key indicators that character-ises the vast expertise of our employees. In DVB’s core business (Shipping Finance, Aviation Finance, Offshore Finance, Land Transport Finance, Corporate Finance, Investment Management and ITF Suisse) our employees had an average of 13.2 years of relevant industry-specific experience during the year under review. Of these employees, 37.6% had more than 15, and 20.5% more than 20 years’ of relevant experience.
Diversity at management levels
At 31 December 2014, the two top management levels below the Board of Managing Directors comprised 109 executives who either reported directly to the Board of Managing Directors or worked as team leaders. Women held 27 (24.8%) of these execu-tive positions, with men accounting for the remaining 82 (75.2%). The share of female executives was up 12.5% year-on-year (2013: 106 employees on the two top management levels; 24 positions held by women equalling 22.6%).
Relevant professional experience
2014 2013Average relevant
professional
experience
(years)
Employees with
more than ten years’
transport finance
experience
(%)
Average relevant
professional
experience
(years)
Employees with
more than ten years’
transport finance
experience
(%)
Shipping Finance 11.7 50.5 12.7 60.4
Aviation Finance 14.2 64.0 14.3 63.3
Offshore Finance 15.3 70.0 13.5 63.6
Land Transport Finance 15.2 71.4 16.1 73.3
Corporate Finance 11.0 54.5 10.1 50.0
Investment Management 16.1 73.7 14.9 63.6
ITF Suisse 15.2 66.7 14.5 75.0
Total 13.2 58.5 13.5 62.4

37
DVB Bank SE | Group Annual Report 2014
Employees
Work/life balance
One of the goals of our human resources policies is to preserve employee job satisfaction and engagement. To achieve this goal, we have created an environment that makes it possible to reconcile work and family responsibilities. Flexibility is a corner-stone of achieving a work/life balance.
Therefore, DVB encourages flexible working hours and part-time arrangements wherever possible and viable. The number of part-time workers rose from 58 to 61 by the end of the year under review, accounting for a total of 10.5% of DVB’s workforce (comprising 50 female and eleven male employees – previous year: 10.2%, comprising 46 female and twelve male employees). Other options, such as parental leave or semi-retirement, are regulated through in-house agreements.
Number of part-time and full-time employees
2014 2013Male Female Total Male Female Total
Employees with flexible working hours
Part-time employees 11 50 61 12 46 58
Full-time employees 339 181 520 330 179 509
Total 350 231 581 342 225 567
Employees on sabbatical leave – – – – – –
Employees in semi-retirement (active) 4 – 4 5 1 6
Employees in semi-retirement (passive) 5 2 7 – – –
GROUP M A N AGE MEN T RE P OR T
C ONSOL IDAT ED F IN A NCI A L S TA ME MEN T S
AUDI T OP INIONA BOU T U S
SUSTAINABILITY

38
DVB Bank SE | Group Annual Report 2014
Employees
Annual employee reviews are one of our key development instruments: they provide a platform for open dialogue between manager and employee, regarding the employee’s skills, expertise and potential for development. For this purpose, Group Human Resources provides managers with a discussion guideline that is deliberately kept lean. The guideline serves as an orientation for structuring the discussion, leaving scope for further discussion issues. Development measures planned for the employee are noted in the guideline, and are implemented by manager and employee, with support provided by Group Human Resources.
The range of development measures is wide – including, for instance, learning from colleagues, learning from feedback, or participation in internal and external training courses. We have been conducting in-house trainings on presentation skills, nego-tiation techniques and project management, amongst others, in order to provide staff and managers with targeted tools and techniques, to help them in their day-to-day work. It is important for us to offer development measures that are made-to-measure and fit the Bank’s and the individual employee’s needs.
Besides the employee review, the determination of the bonus has been deliberately set up as a separate process. Determining bonuses is based on achieving explicit quantitative or qualitative targets that have been mutually agreed between employees and their managers.
We have been successfully conducting our trainee programme for many years. The roughly 18-month programme covers all the major aspects of our Transport Finance business, including rela-tionship management and loan management.
Sustainable human resources management
Our human resources work focused on two main areas during 2014. Thanks to largely stable staffing levels, one focal area was the integration of employees who joined DVB since 2013, as well as those colleagues who moved locations within DVB. Another key aspect of our work was to support managers in pro-moting staff within their area of responsibility, and to enhance their qualification.
Recruitment
To fill open positions, we first look for experienced specialists, be it for Transport Finance or for one of our service areas. Accord-ingly, we generally recruit personnel with the help of recruit-ment consultants. Fortunately, we have increasingly been able to fill positions through referrals from our own employees, or through unsolicited applications. No recruitment measures are necessary for our trainee programme, as there are plenty of qualified candidates who apply directly.
DVB’s focus on diversity is also reflected in our recruitment activities: to the extent possible within the scope of staff selec-tion, we strive to promote a heterogeneous personnel structure at all of DVB’s office locations, in terms of nationality, age and gender.
Personnel development
DVB’s business environment constantly gives rise to new and complex issues that our organisation has to deal with. The goal of human resources development is to equip managers and staff with the skills to deal with these challenges.

39
DVB Bank SE | Group Annual Report 2014
GROUP M A N AGE MEN T RE P OR T
C ONSOL IDAT ED F IN A NCI A L S TA ME MEN T S
AUDI T OP INIONA BOU T U S
SUSTAINABILITY
Employees
Leadership
DVB’s characteristically dynamic approach is embedded in our concept of leadership. Our executive staff need to respond and make decisions quickly and flexibly. DVB’s flat hierarchies help decision-makers to respond quickly, precisely and in a targeted manner, even to complex issues or transactions.
Managers, as well as the members of the Board of Managing Directors, are also always accessible under our open-door policy in order to engender internal transparency and an open exchange. Being receptive to new ideas and challenging of opinions is at the heart of our concept of management.
In an enterprise with a manageable number of employees such as DVB, we believe it is more productive to promote a personal approach, offering a high degree of autonomy rather than a top-down management style. Given this background, employee management, training and development are not administered centrally, and instead are primarily the responsibility of managers. Group Human Resources also provides support.
In concrete terms, this means that we are supporting our man-agers with hands-on tools to analyse the need for development, to structure employee review discussions, as well as with train-ing proposals and customised advice.
Executive development
DVB conducted a Management Survey amongst all its Senior Vice Presidents and Managing Directors in 2011. The results of this survey showed that the ongoing professional development of management staff is a key aspect of our human resources work. For instance, those surveyed expressed their desire for proactive Human Resources development and for new develop-ment perspectives, including outside traditional careers.
Our aim is not to centralise the work that managers are respon-sible for in overseeing, training and developing employees, but rather to better equip those managers for their management duties. That is why we developed a training package for managers, to enable them to deploy our development tools in a targeted manner. Encompassing all executive staff below the Board of Managing Directors, the first course took place in 2013, in co-operation with an international business school.
The course, which covered several days, focused on the follow-ing core topics, and on ways and means to implement them in practice:
• giving and receiving feedback;• discovering talents and promoting them;• coaching employees; • working on one’s own career development.
Based on positive feedback from participants, and with the support from the Board of Managing Directors, we expanded this initiative to the next management level. Another training is scheduled for early 2015.
We see these initiatives as key milestones on the way to quali-fying our management team, to develop a corporate culture of open feedback, and to establish a joint vision of management.

40
DVB Bank SE | Group Annual Report 2014
Employees
We also assign great importance to a healthy diet of our staff: DVB has handed over the operation of its employee restaurants in Frankfurt/Main and Amsterdam to external service providers.
Environmentally friendly travel policies
DVB’s Travel Policy stipulates that employees should ideally opt for public transit for business trips, and to get to work every day. We assist in getting job tickets whenever possible and practicable. In order to limit plane trips to those that are truly necessary, DVB believes in using phone and video conferences whenever possible and practical for meetings. These can be convened at all office locations, using state-of-the-art conference technology.
Collaborating with the works councils
In 2014, we were once again able to swiftly confront new chal-lenges and develop pragmatic solutions. This was only possible thanks to the good co-operation that took place with the SE Works Council, as well as with local Works Councils in Germany and the Netherlands.
Health and safety at the workplace
Promoting the health of our employees at the workplace is a top priority. We established the Committee for Occupational Health and Safety to be responsible for the creation, maintenance and development of safe and ergonomic workplaces, as well as the identification of potential risks and the prevention of accidents and work-related health problems. We contribute to a comfortable working environment with modern and high-quality office facili-ties that foster effective work.
Occupational health consulting is carried out by an external provider in Frankfurt/Main. This company supports the Bank in occupational safety, accident prevention and all other health and safety issues. At a local level, Health and Safety Officers are responsible for risk assessment and management as part of occupational safety and for enacting measures to prevent work-related health problems.
We offer employees at all of our offices a thorough health check-up, and provide assistance with vaccinations when necessary. To protect our employees in the event of illness, disability or accident, we make an extensive insurance programme available at each of our offices, further supplemented by global policies.

41
DVB Bank SE | Group Annual Report 2014
Environmental responsibility
We are partners of AfB gemeinnützige GmbH, the first non-profit IT systems house specialising in collecting/compiling, wiping and remarketing used equipment. Through this co-operation, we managed to avoid creating more than three tonnes of electronic scrap in 2014 and saved considerable amounts of energy, gas and solid material. In total, AfB received 305 IT devices from DVB. These devices were wiped (data destruction certificate) and 96% recycled. This helped us reduce our ecological footprint:
By partnering with AfB, we assume responsibility – environ-mentally and socially, since half of AfB’s workforce have a disa-bility. The number and quality of IT equipment pieces we hand over to AfB created another job for a disabled employee.
Reuseable after refurbishment
Raw materialsw extraction through recycling
Total volume
Quantity % kg Quantity % kg Quantity kg
PC 20 100 195 0 0 0 20 195
Notebook 28 76 50 9 24 16 37 66
Flat screen 19 100 112 0 0 0 19 112
Miscellaneous1) 226 99 2,959 3 1 9 229 2,968
Total 293 96 3,316 12 4 25 305 3,341
1) Excluding data carriers, software and accessories
5. Social responsibility
Social responsibility matters! Therefore, we support internation-ally active charities through donations on a regular basis.
We promote a variety of causes, helping people to help them-selves, including at Christmas, sustainable project work and education programmes for children and young people. In 2014, our donation therefore went to the Voluntary Service Overseas, an international and independent charity, whose volunteers work with local organisations in developing countries and help improve health and education services and secure livelihoods.
We also engage in projects for equal educational and personal development opportunities, irrespective of social or cultural backgrounds. In 2014, we made another donation to the ISTAT (International Society of Transport Aircraft Trading) Foundation Roundtable Program, which supports a variety of charities all over the globe, providing scholarships and grants to students in aviation-related fields in the amount of US$400,000.
Iron equivalent Energy CO2 equivalentkg kWh kg
PC 2,920 4,611 1,292
Notebook 1,464 5,390 2,058
Flat screen 682 2,291 667
Total 5,066 12,292 4,017
GROUP M A N AGE MEN T RE P OR T
C ONSOL IDAT ED F IN A NCI A L S TA ME MEN T S
AUDI T OP INIONA BOU T U S
SUSTAINABILITY

42
DVB Bank SE | Group Annual Report 2014
Equity markets and the DVB share
DVB’s share price was once again encouragingly stable
Despite the volatility seen on equity markets throughout the year, DVB’s share price proved to be satisfactorily robust under the described market conditions, exhibiting remarkable stability. This performance is attributable to the ongoing and similarly stable development of the Bank’s business, and also to the narrow market in which the shares trade, due to the low free float.
Over the course of 2014, the volatility of DVB shares was mod-erate. The highest price for the year of €25.35 was touched on 21 March 2014. The lowest price of €24.25 was recorded on 13 June 2014. The year-end share price was €24.65. Accordingly, the Bank’s market capitalisation was €1.1 billion at the end of 2014.
The shares of DVB Bank SE (WKN: 804550, ISIN: DE0008045501) are listed in on the Frankfurt Stock Exchange in the General Standard. Since the capital increase conducted in 2008, the share capital pursuant to the Memorandum and Articles of Association amounted to €118,791,945.12 and is divided into 46,467,370 notional no-par value shares.
Equities markets on both sides of the Atlantic fail to break free, despite registering all-time highs.
Vivid development in the equity markets
Equity markets on both sides of the Atlantic showed dynamic performance during the first half of 2014. Having remained close to 9,400 index points during the first quarter of the year, the German blue-chip DAX index broke through the 10,000-point level during the second quarter, driven by a strong outlook for the eurozone economy and by the ECB’s expansive monetary policy. However, the rally came to an abrupt end at the beginning of the second half of the year: unexpectedly weak economic data from Germany, Europe, and the emerging markets – together with rising geopolitical tension – dampened the investment climate. In this environment the DAX lost considerable ground, falling to around 8,500 points by mid-October 2014. The index then recovered during November, reaching a new all-time high of 10,087 points.
Against the background of a government crisis in Greece, with fears of renewed escalation of the euro debt crisis, the DAX then surrendered parts of its gains towards the year-end, closing the year at 9,806 points, up 2.7% for the year. The Dow Jones Indus-trial Index also finished 2014 with a clear rise, at 17,823 points, it was up 7.5% on year-end 2013. Japan’s Nikkei-225 Stock Average Index meanwhile ended the year at 17,451 points, up 7.1% year-on-year.
It was not all positive – a number of European exchanges closed 2014 with significant year-on-year losses:
• The FTSE 100 (Financial Times Stock Exchange Index, London Stock Exchange) was down 2.7%, to 6,566 points.
• The CAC 40 (the French benchmark index, NYSE Euronext Paris) dropped 0.5% to 4,273 points.
• However, in Italy the FTSE MIB Index (Financial Times Stock Exchange, Milano Italia Borsa) gained 0.4% and closed at 19,185 points.
Chinese equity markets showed a distinctly positive performance in 2014 – the most important indices, the SH COMP (Shanghai Stock Exchange Composite Index) and CSI 300 (China Securities Index) were up 52.9% and 51.6% year-on-year, respectively.
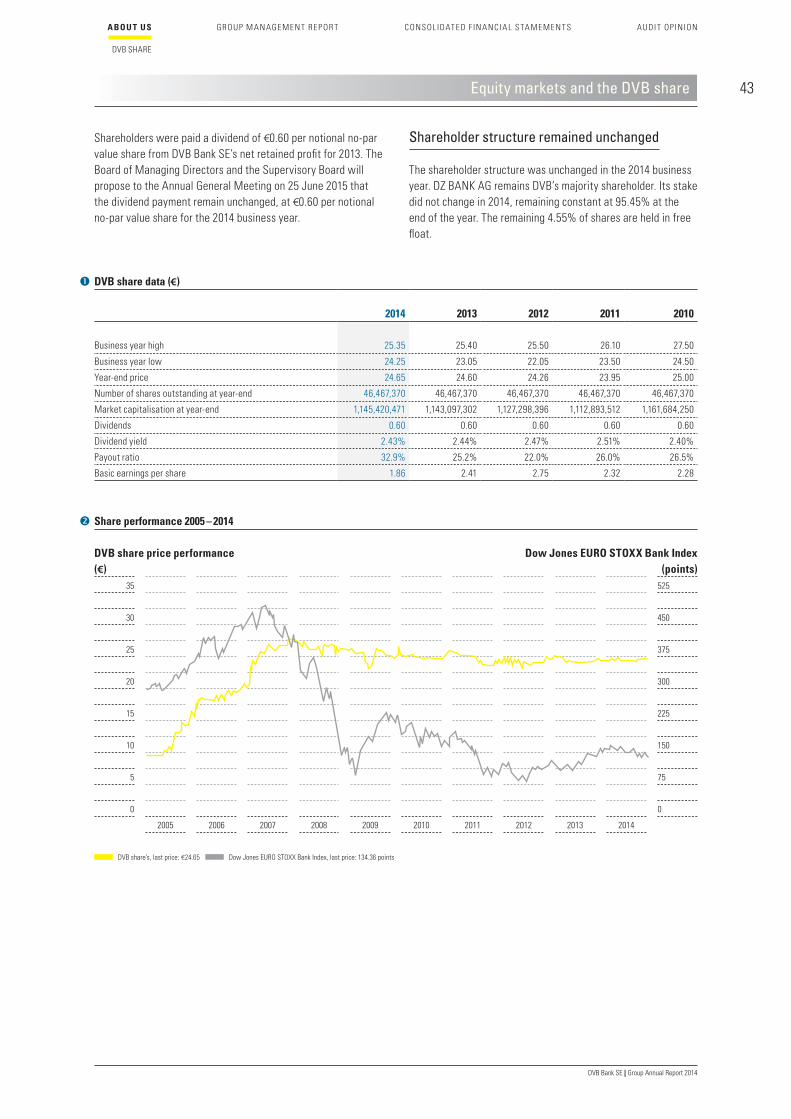
43
DVB Bank SE | Group Annual Report 2014
GROUP M A N AGE MEN T RE P OR T
C ONSOL IDAT ED F IN A NCI A L S TA ME MEN T S
AUDI T OP INIONA BOU T U S
DVB SHARE
Equity markets and the DVB share
Shareholders were paid a dividend of €0.60 per notional no-par value share from DVB Bank SE’s net retained profit for 2013. The Board of Managing Directors and the Supervisory Board will propose to the Annual General Meeting on 25 June 2015 that the dividend payment remain unchanged, at €0.60 per notional no-par value share for the 2014 business year.
Shareholder structure remained unchanged
The shareholder structure was unchanged in the 2014 business year. DZ BANK AG remains DVB’s majority shareholder. Its stake did not change in 2014, remaining constant at 95.45% at the end of the year. The remaining 4.55% of shares are held in free float.
DVB share data (€)
2014
2013
2012
2011
2010
Business year high 25.35 25.40 25.50 26.10 27.50
Business year low 24.25 23.05 22.05 23.50 24.50
Year-end price 24.65 24.60 24.26 23.95 25.00
Number of shares outstanding at year-end 46,467,370 46,467,370 46,467,370 46,467,370 46,467,370
Market capitalisation at year-end 1,145,420,471 1,143,097,302 1,127,298,396 1,112,893,512 1,161,684,250
Dividends 0.60 0.60 0.60 0.60 0.60
Dividend yield 2.43% 2.44% 2.47% 2.51% 2.40%
Payout ratio 32.9% 25.2% 22.0% 26.0% 26.5%
Basic earnings per share 1.86 2.41 2.75 2.32 2.28
DVB share’s, last price: €24.65 Dow Jones EURO STOXX Bank Index, last price: 134.36 points
Share performance 2005 – 2014 DVB share price performance Dow Jones EURO STOXX Bank Index (€) (points)
35
30
25
20
15
10
5
0
2005 2006 2007 2008 2009 2010 2011 2012 2013 2014
525
450
375
300
225
150
75
0

44
DVB Bank SE | Group Annual Report 2014
Equity markets and the DVB share
Transparent communications
Our Investor Relations team strives to provide comprehensive information on business developments and investor relations activities.
Therefore, the Bank regularly publishes information relevant to shareholders and the general public, in addition to its annual reports.
• DVB published an ad-hoc disclosure regarding the Bank’s reviewed but not approved consolidated financial statements 2013 on 25 March 2014.
• The Bank published an ad-hoc disclosure regarding substan-tial income from the sale of a profit participation loan on 12 December 2014.
These ad-hoc disclosures are available for download on DVB’s website www.dvbbank.com under > Investors
> Publications> Ad-hoc disclosures.
• As a listed public company, DVB Bank SE is obliged to issue an annual Declaration of Compliance, in which the Board of Managing Directors and the Supervisory Board provide details on their compliance with the recommendations of the German Corporate Governance Code, and give reasons for any devia-tions. DVB published its 13th Declaration of Compliance on 5 December 2014. The declaration covers the years 2014 and 2015, and is available on the Bank’s website.
All Declarations of Compliance issued by DVB since 2002 are available for download from its website
www.dvbbank.com> Investors > Corporate Governance > Declaration of Compliance.
• DVB actively uses the internet for all relevant publications to ensure that information is provided to shareholders and the public in a timely, concurrent and comprehensive manner. The Bank’s website is the point of contact frequently used by interested financial markets participants. It is continuously adapted to the growing needs of DVB’s stakeholders.
Shareholders and the General Meeting
On 12 June 2014, DVB Bank SE held its 27. Annual General Meeting since 1988 at company headquarters in Frankfurt/Main. On 2 May 2014, the agenda was published on time in the German Federal Gazette and on our website, and distributed in a media bundle throughout Europe as required.
Item one on the agenda was the acceptance of the financial statements confirmed by the Supervisory Board and the approved consolidated financial statements. Agenda items 2 to 12 contained the following resolutions proposed by the Board of Managing Directors and/or the Supervisory Board:
• the appropriation of net retained profit for the 2013 business year;
• the formal approval of the members of the Board of Managing Directors and the Supervisory Board for the 2013 financial year;
• the election of new members to the Supervisory Board;• the appointment of external auditors for the 2014 fiscal year;• the authorisation of higher variable remuneration in accordance
with section 25a (5) sentence 5 of the German Banking Act;• the cancellation of the existing authorisation to purchase
treasury shares, pursuant to section 71 (1) no. 7 of the German Public Limited Companies Act (AktG), and on the granting of a new authorisation to purchase treasury shares pursuant to section 71 (1) no. 7 of the AktG;
• amendments to Article 4 (2) and (3) of the Company’s Memo-randum and Articles of Association;
• changes to the remuneration of the Supervisory Board members and the corresponding amendments to Article 19 (1) and (2) of the Company’s Memorandum and Articles of Association; and
• further amendments to the Company’s Memorandum and Articles of Association.
In the general debate, shareholders and shareholder representa-tives asked numerous in-depth questions about agenda items and specific topics relating to the situation on the transport markets and the Bank’s business development.
Given that DZ BANK currently has a 95.45% stake in the Bank’s share capital, voting results and attendance have been stable for many years now. In the final vote, 96.67% of the shares entitled to vote were represented. Shareholders and shareholder repre-sentatives approved the individual resolution proposals with a clear majority of between 99.98% and 99.99%. It should be noted in particular that our shareholders voted in favour of the dividend distribution of €0.60 per notional no-par value share that has remained unchanged since 2008, confirming the stable dividend policy of the Board of Managing Directors and the Supervisory Board.
In-depth information is available on our website: www.dvbbank.com > Investors > General meeting.

45
DVB Bank SE | Group Annual Report 2014
GROUP M A N AGE MEN T RE P OR T
C ONSOL IDAT ED F IN A NCI A L S TA ME MEN T S
AUDI T OP INIONA BOU T U S
DVB SHARE
Equity markets and the DVB share
• DVB compiles the scheduled dates of material recurring events and publications in the financial calendar, which is published on the Bank’s website in good time, and is permanently made available there. This allows all those interested to be informed without undue delay.
All relevant dates and events for the 2015 business year are published on www.dvbbank.com > Investors >
Financial calendar.
• Since 2008, DVB has also provided a dedicated information service: the Bank’s Investor Relations newsletter, ”Perfor-mance”. This is designed to actively relay target group- specific information about DVB’s performance and its business divisions.
• The Bank also published 18 research videos, in which experts explain the mega trends in the shipping, aviation, offshore and land transport markets. With these webcasts, DVB further strengthens its position as the leading specialist in inter-national transport finance, and gives vivid proof of its long-standing experience and know-how of markets and assets.
The market analyses can be found on DVB’s website www.dvbbank.com > Media > Videos.
• The Bank uses the social media communications channels Twitter (short messages), YouTube (video clips) and Slideshare (presentations and reports) as a targeted means to bring DVB’s communications products close to its stakeholders, and to encourage interaction with them.
DVB’s website www.dvbbank.com > Media > Social media provides a transparent overview of the Bank’s social media
activities.
• Within the scope of both regular and ad-hoc events – including the Annual General Meeting, the Annual Accounts Press and Analyst Conference, as well as follow-up rating discussions, road shows and one-on-one meetings – DVB maintains a continuous, direct and intensive dialogue with shareholders, rating and bank analysts, and with financial journalists.

DVB Bank SE | Group Annual Report 2014
Group management report
47 Fundamental information about the Group
47 A unique business model
50 Competitive strengths setting DVB apart
50 Strategic goals and implementation
52 Commercial planning and management system
54 Report on the economic position
54 Macroeconomic environment
56 Financial position and performance
72 Remuneration
76 Development of the business divisions
76 Shipping Finance
88 Aviation Finance
100 Offshore Finance
108 Land Transport Finance
120 Financial Institutions
124 Corporate Finance
130 Investment Management
137 Report on material events after the reporting date
138 Report on expected developments, opportunities and risks
138 Report on expected developments
142 Report on opportunities and risks
167 Explanatory disclosures under takeover law
167 Report of the Board of Managing Directors on relations
with affiliated companies
Earnings development 2010 – 2014
€ mn350
300
250
200
150
100
50
0
277.1
100.9
2010
332.7
143.3
2011
341.2
157.2
2012
284.8
106.0
2013
304.5
116.8
2014
Total income (before IAS 39) Consolidated net income before IAS 39 and taxes
+10.2%
+6.9%

47
DVB Bank SE | Group Annual Report 2014
C ONSOL IDAT ED F IN A NCI A L S TA ME MEN T S
AUDI T OP INIONA B OU T US
A unique business model
The DVB Group is referred to in this report either as ”DVB” or the ”DVB Group”, whereas the parent European public limited-liability company (Societas Europaea) is referred to by its registered name ”DVB Bank SE”.
The leading specialist in international transport finance – DVB’s mission statement captures both the Bank’s real accomplishments and its vision of the future. DVB’s business model is character-ised by four key aspects:
• It has a clearly defined focus.• It features a unique specialisation.• It is geared towards a cycle-neutral approach.• It is international in scope.
Clearly-defined focus of the business model
DVB enjoys a unique position, thanks to its strategic focus on the international transport market, with the submarkets of shipping, aviation, offshore production, and land transport. The Bank’s business model is built to reflect this segmentation, comprising the four divisions of Shipping Finance, Aviation Finance, Offshore Finance and Land Transport Finance.
Unique specialisation of the business model
As a highly-specialised niche provider, DVB offers its more than 600 clients and client groups from the international transport sector a broad range of customised solutions. DVB has continu-ously enhanced its core skills and areas of expertise over recent years. The Bank’s financial services can largely be allocated to seven value-adding areas. DVB’s Asset & Market Research prepares in-depth analyses of transport assets and markets. Leveraging this business intelligence in its four Transport Finance divisions – Shipping Finance, Aviation Finance, Offshore Finance and Land Transport Finance – the Bank supports clients in the key product areas of Structured Asset Financing, Asset Manage-ment, Client Account, Risk Distribution, Corporate Finance Solutions, Private Equity Sourcing & Investments, and Loan Participations.
Structured Asset Financing
Drawing on its Structured Asset Finance core service, the Bank’s four Transport Finance divisions Shipping Finance, Aviation Finance, Offshore Finance and Land Transport Finance offer financing solutions relating to transport assets. In addition to traditional asset finance, we offer our clients tailor-made struc-tured solutions for complex financing projects, often covering multiple jurisdictions.
Structured Asset Financing
Asset Management
Client Account Risk Distribution
Corporate Finance Solutions Private Equity Sourcing & Investments
Loan Participations
Unique specialisation
Asset & Market Research
Shipping Finance Aviation Finance Offshore Finance Land Transport Finance
GROUP M A N AGE M E N T R E P OR T
FUNDAMENTAL INFORMATION ABOUT THE GROUP
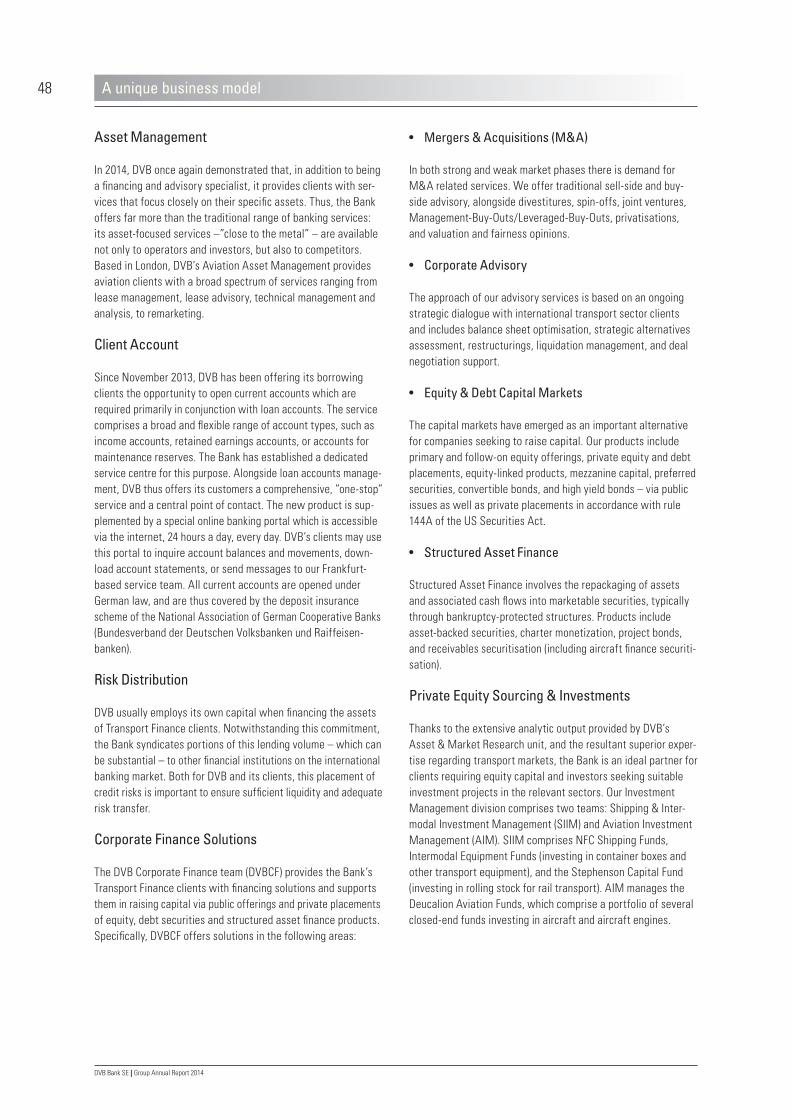
48
DVB Bank SE | Group Annual Report 2014
A unique business model
Asset Management
In 2014, DVB once again demonstrated that, in addition to being a financing and advisory specialist, it provides clients with ser-vices that focus closely on their specific assets. Thus, the Bank offers far more than the traditional range of banking services: its asset-focused services –”close to the metal” – are available not only to operators and investors, but also to competitors. Based in London, DVB’s Aviation Asset Management provides aviation clients with a broad spectrum of services ranging from lease management, lease advisory, technical management and analysis, to remarketing.
Client Account
Since November 2013, DVB has been offering its borrowing clients the opportunity to open current accounts which are required primarily in conjunction with loan accounts. The service comprises a broad and flexible range of account types, such as income accounts, retained earnings accounts, or accounts for maintenance reserves. The Bank has established a dedicated service centre for this purpose. Alongside loan accounts manage-ment, DVB thus offers its customers a comprehensive, ”one-stop” service and a central point of contact. The new product is sup-plemented by a special online banking portal which is accessible via the internet, 24 hours a day, every day. DVB’s clients may use this portal to inquire account balances and movements, down-load account statements, or send messages to our Frankfurt-based service team. All current accounts are opened under German law, and are thus covered by the deposit insurance scheme of the National Association of German Cooperative Banks (Bundesverband der Deutschen Volksbanken und Raiffeisen-banken).
Risk Distribution
DVB usually employs its own capital when financing the assets of Transport Finance clients. Notwithstanding this commitment, the Bank syndicates portions of this lending volume – which can be substantial – to other financial institutions on the international banking market. Both for DVB and its clients, this placement of credit risks is important to ensure sufficient liquidity and adequate risk transfer.
Corporate Finance Solutions
The DVB Corporate Finance team (DVBCF) provides the Bank’s Transport Finance clients with financing solutions and supports them in raising capital via public offerings and private placements of equity, debt securities and structured asset finance products. Specifically, DVBCF offers solutions in the following areas:
• Mergers & Acquisitions (M&A)
In both strong and weak market phases there is demand for M&A related services. We offer traditional sell-side and buy-side advisory, alongside divestitures, spin-offs, joint ventures, Management-Buy-Outs/Leveraged-Buy-Outs, privatisations, and valuation and fairness opinions.
• Corporate Advisory
The approach of our advisory services is based on an ongoing strategic dialogue with international transport sector clients and includes balance sheet optimisation, strategic alternatives assessment, restructurings, liquidation management, and deal negotiation support.
• Equity & Debt Capital Markets
The capital markets have emerged as an important alternative for companies seeking to raise capital. Our products include primary and follow-on equity offerings, private equity and debt placements, equity-linked products, mezzanine capital, preferred securities, convertible bonds, and high yield bonds – via public issues as well as private placements in accordance with rule 144A of the US Securities Act.
• Structured Asset Finance
Structured Asset Finance involves the repackaging of assets and associated cash flows into marketable securities, typically through bankruptcy-protected structures. Products include asset-backed securities, charter monetization, project bonds, and receivables securitisation (including aircraft finance securiti-sation).
Private Equity Sourcing & Investments
Thanks to the extensive analytic output provided by DVB’s Asset & Market Research unit, and the resultant superior exper-tise regarding transport markets, the Bank is an ideal partner for clients requiring equity capital and investors seeking suitable investment projects in the relevant sectors. Our Investment Management division comprises two teams: Shipping & Inter-modal Investment Management (SIIM) and Aviation Investment Management (AIM). SIIM comprises NFC Shipping Funds, Intermodal Equipment Funds (investing in container boxes and other transport equipment), and the Stephenson Capital Fund (investing in rolling stock for rail transport). AIM manages the Deucalion Aviation Funds, which comprise a portfolio of several closed-end funds investing in aircraft and aircraft engines.

49
DVB Bank SE | Group Annual Report 2014
C ONSOL IDAT ED F IN A NCI A L S TA ME MEN T S
AUDI T OP INIONA B OU T US
A unique business model
Loan Participations
DVB’s wholly-owned, Zurich-based subsidiary ITF International Transport Finance Suisse AG was established in 2007. ITF Suisse actively participates in the international interbank market for senior asset-based lending, in the Group’s strategic target seg-ments of Shipping Finance, Aviation Finance, Offshore Finance, and Land Transport Finance.
Asset & Market Research
DVB’s Asset & Market Research unit provides the basis for the activities of the Bank’s business divisions, leveraging the teams long-standing research know-how to provide financing products and advisory services, as well as optimising the raising of equity finance.
Cycle-neutral orientation of the business model
As an advisor and finance provider to the international transport sector, DVB itself has become a part of this industry. Hence, the Bank is active in a sector that weathers crises, and remains on a long-term growth path. However, the transport markets are characterised by a high degree of cyclicality, with recurring market sequences and intervals that typically follow a certain pattern. As a market insider, DVB knows this market ”rhythm” in detail, and has designed its business model with a proactive stance and a cycle-neutral approach.
This cycle-neutral approach provided DVB with a variety of business opportunities throughout 2014, despite a market environment that continued to be challenging in some maritime shipping segments.
International profile of the business model
With offices in eleven locations (as at 1 January 2015) – Frankfurt/Main, Amsterdam, Athens, Hamburg, London, Oslo and Zurich (Europe), New York and Curaçao (Americas), as well as in Singapore and Tokyo (Asia) – DVB’s business divisions Shipping Finance, Aviation Finance, Offshore Finance, Land Transport Finance, Financial Institutions, Corporate Finance, Investment Management and ITF Suisse have a worldwide presence in the transport markets and their various segments. This global presence in key transport locations enables the Bank to take into account the international dimension as well as the local specifics of the markets in which its clients operate.
The following overview illustrates the legal structure of the DVB Group, including the parent company DVB Bank SE, with its registered office in Frankfurt/Main, the Group’s material, fully-consolidated subsidiaries (shown in yellow shading), and its branches and representative offices (shown in blue shading).
Subsidiaries of DVB (each 100%)
DVB Holding (US) Inc., New York, USA
DVB Capital Markets LLC, New York, USA
DVB Transport (US) LLC, New York, USA
DVB Bank America N.V., Willemstad, Curaçao
DVB Group Merchant Bank (Asia) Ltd, Singapore
DVB Transport Finance Ltd, London, United Kingdom
DVB Transport Finance Ltd, Tokyo Branch, Tokyo, Japan
DVB Holding GmbH, Frankfurt/Main, Germany
ITF International Transport Finance Suisse AG, Zurich, Switzerland
LogPay Financial Services GmbH, Eschborn, Germany
LogPay Transport Services GmbH, Eschborn, Germany
Branches and representative offices of DVB
DVB Bank SE, Amsterdam Branch, The Netherlands
DVB Bank SE, London Branch, United Kingdom
DVB Bank SE, Nordic Branch, Oslo, Norway
DVB Bank SE, Singapore Branch, Singapore
DVB Bank SE, Representative Office Greece, Athens, Greece
DVB Bank SE, Hamburg Office, Germany
DVB’s legal structure (updated as at 1 January 2015)
GROUP M A N AGE M E N T R E P OR T
FUNDAMENTAL INFORMATION ABOUT THE GROUP
50
DVB Bank SE | Group Annual Report 2014
Competitive strengths setting DVB apart
Strategic goals and implementation
• Asset & Market Research – sophisticated, renowned and award-winning
• Credit portfolio – diversified by multiple criteria and categories
• Risk management – consistent and forward-thinking
• Funding – maturity-matched
• Own funds – strong capital base
Over the course of many years, these ten competitive strengths have developed into success factors for DVB, which is thus able to weather the challenges posed by cyclical transport markets, to the benefit of a demanding clientele.
• We expect a significant contribution from our Investment Management activities.
• We focus on additional service offers for our clients, with a particular focus on the capital markets business.
• We continuously expand our funding sources, as well as funding tools and structures.
• We strive to deliver stable results for the 2015 business year, which should be above the 2014 results.
DVB differentiates itself from other market participants through the following competitive strengths which characterise the Bank, and which DVB consistently implements and deploys on the international transport finance markets:
• Business model – clearly focused, distinctively specialised, cycle-neutral and international in scope
• Business policy – conservative and sustainable
• Organisation – transparent structures, swift information flow and prompt decision-making
• Human resources – highly specialised and experienced
• Products & services – customised and beyond the typical scope of banking
Despite the continued difficult market environment in some maritime shipping segments during 2014, DVB maintained its focus on selected transport markets, and its organisational structure. The Bank strives to further expand this competitive position, through a continued efficiency enhancement of the products and services it offers.
Specifically, DVB will pursue the following objectives during 2015:
• We keep on working intensely on reducing our risk positions in parts of our shipping lending business.
• We will further reinforce our ”new clients” approach, particu-larly in our Shipping Finance division.

51
DVB Bank SE | Group Annual Report 2014
C ONSOL IDAT ED F IN A NCI A L S TA ME MEN T S
AUDI T OP INIONA B OU T US
Strategic goals and implementation
Enhancing process efficiency – the Unity project
DVB’s Transport Finance divisions offer a vast range of products and services, whereby structured lending is at the core of the client relationship. Some primary performance indicators in the Shipping Finance, Offshore Finance and Aviation Finance divisions have diverged widely over recent years, reflecting a deterioration in the industry, especially maritime shipping markets, which negatively affected the cost/income ratio in Shipping Finance.
In order to maintain the Bank’s leading position in a constantly changing market environment, DVB launched the Unity project in 2012. Its objectives can be detailed as follows:
• The performance indicators of the Shipping Finance, Offshore Finance and Aviation Finance divisions will converge.
• Process efficiency in Shipping Finance and Offshore Finance will be enhanced.
• A new organisational model, designed to optimise the struc-ture of client-facing and service teams, will be implemented in Shipping Finance and Offshore Finance.
The Bank successfully realised these changes during the sched-uled two-year implementation period until the end of 2014. Specifically, the following results were achieved:
• Cost reduction – Unity has delivered the cost savings required to achieve the target reduction in the cost/income ratio for Shipping Finance and Offshore Finance.
• Market coverage – Unity has enabled a sustained optimal market coverage with an economic cost base.
• Alignment – A further degree of alignment has been achieved between the divisions, through the centralising of the European credit team, centralising of the European loan administration for Shipping Finance in Transaction and Loan Services, and the introduction of the successfully-established Aviation Transaction Manager role to the Shipping Finance and Off-shore Finance divisions.
• Execution efficiency – Through a multitude of improvement initiatives and process enhancement activities – in addition to the centralisation and creation of the European hub in Amsterdam, these measures have culminated in enabling the organisation to make a significant step forward in produc-tivity and overall efficiency.
Strengthening DVB’s brand profile
DVB will take further steps to enhance its unique brand profile in terms of asset know-how and special asset services. To this end, the Bank will pursue the following strategies:
• DVB will enhance client satisfaction, and will communicate the progress made.
• Being a part of the global transport industry, DVB will further intensify its contacts with the global transport industry – in all areas and on all levels.
• DVB sharpens its profile at key international transport industry conferences and events, a presence that the Bank expanded significantly during 2014.
• DVB publishes editorial articles, in a targeted manner and in trade media that are relevant for its clients – often accompa-nied by advertising, thus avoiding unnecessary scattering.
• DVB presents the Bank’s success story to investors – in round-table discussions, one-on-one meetings and via road-shows. In this way the Bank will build the foundation for capital market transactions in euros and – increasingly – in US dollars.
• DVB wins renowned prizes recognising its sustained pres-ence on, and its commitment to, the transport markets. In 2014, the Bank’s Land Transport Finance team won two awards from trade magazine Global Transport Finance: ”Rail Finance Innovator of the Year” and ”Rail Finance Deal of the Year – Europe”.
GROUP M A N AGE M E N T R E P OR T
FUNDAMENTAL INFORMATION ABOUT THE GROUP

52
DVB Bank SE | Group Annual Report 2014
Commercial planning and management system
DVB’s strategy process is fully integrated into the strategic planning process of the DZ BANK Group, and coordinated with that process in terms of timing. The annual strategy and plan-ning process commences in late spring; it concludes in November of each year, with the submission of all strategies and planning documents to the Supervisory Board, for information and/or approval.
During the months of April and May, the Bank compiles a set of current information concerning the economic environment, competitors’ behaviour, price and market trends, as well as the Bank’s strengths, weaknesses and market share – also compris-ing its own targets and planned measures.
A review of the medium-term financial and capital planning is carried out in parallel, on the basis of the information described, using a comprehensive and integrated planning model which provides a full set of projections based on numerous input parameters. This process incorporates the deliberations and requirements of the Board of Managing Directors, as well as the expectations and assumptions of the top management level below the Board.
In addition, a macroeconomic model is applied, which helps to estimate the impact of any changes in economic conditions on the Bank’s key planning parameters and success factors. This macroeconomic model is also used to estimate the effect of such changes in the Bank’s environment upon its risk positions. Moreover, DVB needs to assess the impact of macroeconomic scenarios (as defined by regulatory authorities, for example), and to apply such scenarios to the specific characteristics of its business.
Key determining factors for DVB’s growth and success are the volume of originated new business, the interest margins gener-ated on new business, the amount of commissions generated on new transactions, and the changes in the risk profile. These parameters are in the focus of any planning deliberations.
Operative planning for the subsequent year takes place in the autumn of each year, based on a projection and incorporating the strategic planning. A ”counter-current” method is employed for the purposes of operative planning.
Targets set by the Board of Managing Directors can be derived from the medium-term planning (which has been revised by the time operative planning takes place) and used by the business units for their individual projections. These are consolidated and assessed; a second round of planning may be required to revise such individual plans. This process is supported by a web-based planning tool. If need be, medium-term planning will be read-justed using the results of the operative planning process.
This section describes DVB’s commercial planning and man-agement system, as well as its risk-adjusted performance measurement system.
The Board of Managing Directors manages the Bank by focusing on the globally-active business divisions Shipping Finance, Avia-tion Finance, Offshore Finance, Land Transport Finance, Invest-ment Management and ITF Suisse, as well as on other service functions. Logically, management hierarchy and the structure of the entire internal reporting system are geared towards this divisional business model. In view of the growing international regulatory requirements, the Bank has also deployed this divisional management model on a regional basis, for its sales offices.
Strategy and planning process
DVB carries out a revolving annual strategy and planning process, which includes a revision of the following components:
• Strategic planning is geared towards a five-year horizon. It consists of an analysis of the economic environment, of market and competitive trends, the Bank’s strengths and weaknesses, and of a medium-term financial and capital planning derived from these input factors.
• Against the background of this multi-year planning, a more detailed operative one-year plan is worked out, which is one of the contributing factors to the Bank’s individual target-setting system (management by objectives).
• The monthly internal reporting compares one-year projections to actual results, analysing any deviations.
• In addition, full-year projections are implemented during the second half of each year; these may be used for fine-tuning and as a basis for the planning of future periods.
The Bank’s business strategy forms the fundamental basis for its risk strategies (in particular, the credit risk strategy), which refer to the business strategy in numerous respects.
53
DVB Bank SE | Group Annual Report 2014
C ONSOL IDAT ED F IN A NCI A L S TA ME MEN T S
AUDI T OP INIONA B OU T US
Commercial planning and management system
Key performance indicators
DVB’s objective is to achieve a sustained increase in the Com-pany’s value. To this end, we have consistently developed and fine-tuned our management and control systems. Having imple-mented our EVA™ concept back in 2008, we have a toolbox at our disposal that permits a comprehensive, value-driven man-agement of the Group and of all divisions. This system supports the creation of enterprise value and ensures Group-wide trans-parency on all levels.
The risk-adjusted Economic Value Added (EVA™) parameter is a key indicator used for the management and assessment of the Bank’s business. EVA™ represents residual profit; it expresses net profit (as an absolute amount) after deduction of costs for risk capital employed. The figure is calculated by deducting risk capital costs from consolidated net income before IAS 39 and taxes. An EVA™ figure greater than zero represents a positive value contribution.
In addition, DVB employs two classic indicators for the assess-ment of efficiency and performance: the cost/income ratio (CIR), and the return on equity (ROE).
The CIR is used to assess efficiency. It compares general admin-istrative expenses to the income generated before allowance for credit losses. It is calculated as follows: general administra-tive expenses are divided by the total of net interest income before allowance for credit losses, net fee and commission income, net result from financial instruments in accordance with IAS 39, results from investments in companies accounted for using the equity method, and net other operating income/expenses.
ROE, the traditional profitability indicator, shows net income before taxes in relation to share capital and is calculated as fol-lows: consolidated net income before taxes attributable to DVB’s shareholders is divided by the total of weighted capital (issued share capital, capital reserve, retained earnings excluding fund for general banking risks, non-controlling interests and deferred taxes, as well as before appropriation of consolidated net income). If the indicator is disclosed for parts of the Group, the issued share capital is shown in proportion to the used risk capital.
Except for ROE, the indicators described apply uniformly to all company divisions and are calculated on the same basis.
Furthermore, DVB complies with regulatory capital ratios and, where applicable, capital limits within DZ BANK Group.
At present, DVB does not employ non-financial indicators for managing the Company.
Regular reporting/management reporting
Company management is evident in the regular reporting system. DVB has a monthly reporting system in place, which applies uniform structures to the Group and its divisions. The technical platform employed for this purpose permits separate reports to be generated at every level and for each unit. The reports pub-lished on a monthly basis and used by senior management focus on the Group, its strategic business divisions and – in some cases – on individual departments and teams. The reports gen-erally have the same structure; they incorporate a uniform profit contribution analysis scheme and the same key financial indica-tors. As a rule, the reports include year-on-year and target/actual comparisons. The top management reporting package (the Management Report) also contains comments, analyses and assessments of current developments, deviations from projections, and the degree of target achievement. The report is addressed to the Board of Managing Directors, but is made available – simultaneously and in full – to the entire management team. In addition, regular reports are prepared which cover indi-vidual business divisions in greater detail; ad-hoc analyses are carried out frequently in order to analyse specific issues. Based on this internal reporting system, the Board of Managing Directors gives a report on the Group’s current economic development to the Supervisory Board during each meeting.
Precalculations
DVB has defined minimum requirements for the profitability of new business; these are based on the same principles as those applied to measuring performance (minimum EVA™). The Bank uses a special tool to calculate profitability prior to entering into an exposure; the results of this precalculation are a key basis for decisions and must be presented for each lending decision.
Technical infrastructure
DVB employs uniform, Group-wide SAP systems for accounting, valuation, consolidation and financial reporting, as well as for data inventory and reporting. A smaller online analytical pro-cessing database is used for the planning process and its pres-entation.
GROUP M A N AGE M E N T R E P OR T
FUNDAMENTAL INFORMATION ABOUT THE GROUP

54
DVB Bank SE | Group Annual Report 2014
Macroeconomic environment
Developments on the financial markets
DVB conducts its funding activities on the international financial markets through a multitude of instruments. In this context, the Bank focuses on Germany, the other German-speaking countries and Northern Europe, and is looking to further raise its inter-national profile. That is why developments on the international financial markets are very important for DVB’s liabilities.
Key developments on the financial markets during 2014 can be summarised as follows:
As in the previous year, the European Central Bank (ECB) main-tained its expansive monetary policy for the euro zone throughout 2014, against the background of low (and still falling) inflation, combined with a weak economy. Moreover, inflationary pressure within the euro zone eased further, thanks to falling crude oil prices. In this environment, the ECB cut its key interest rates further in June and September 2014, to counter a serious risk of inflation being too low on a sustained basis. Specifically, the ECB cut its main refinancing rate for commercial banks within the euro zone by a total of 20 basis points, to 0.05%. To stimulate euro zone lending, the central bank set a negative rate of –0.2% for overnight deposits, thus charging a penalty rate for funds deposited with the ECB for the first time.
These interest rate cuts were accompanied by two further special monetary policy measures:
• in June, the ECB introduced longer-term refinancing operations (TLTROs), over a window of two years (until 2016), aimed at improving bank lending to the non-financial private sector in the euro zone. Through this scheme, banks may raise funds for maturities of up to four years, subject to certain conditions.
• In September 2014, the ECB resolved two new purchase programmes for ABS issues and covered bonds, which were launched during the fourth quarter.
At the end of the year, ECB President Mario Draghi announced that the ECB has been examining the viability and effect of more extensive monetary policy measures, including broad-based purchases of sovereign bonds.
The US Federal Reserve (Fed) exited its third major bond-pur-chasing programme in 2014 (”Quantitative Easing 3” or QE3), having gradually reduced the volume of monthly purchases of long-term US Treasury bonds (originally US$85 billion a month) since December 2013. Against the background of a steadily improving environment for the entire US economy, the Fed ceased its monthly bond purchases altogether in October. The Fed did not make any changes to key interest rates, keeping the target Fed Funds rate unchanged between 0% and 0.25%.
Judging by global activity indicators, the global economy clearly lost momentum during the year under review. Besides the impact of the European sovereign debt crisis, which is still evident, global economic growth was burdened by the fallout from geopolitical conflicts.
At the same time, the global economy was supported by the upswing in the US economy, with decreasing inflation and falling unemployment, as well as continued strong expansion momen-tum in the Asian region.
Developments on the international transport markets
We analyse developments on DVB’s core markets, in detail, in the market analyses provided by Shipping Finance (pages 76–77), Aviation Finance (pages 88 –90), Offshore Finance (pages 100 –101), Land Transport Finance (pages 108–109), as well as in the chapters on Financial Institutions (pages 120–121), Corporate Finance (pages 124 –125) and Investment Management (page 131 and 134). Reference is made to these explanations.
Development of oil prices
Global oil prices are a key operating cost factor for companies of the transport sector. Oil price trends significantly strengthen or weaken the profitability of transport enterprises such as shipping companies or airlines.
The market for crude oil and oil products was characterised by extensive excess capacity during 2014. Despite the conflicts affecting the most important oil production areas in Arab coun-tries and Russia, falling demand met excess supply. This caused prices of the key crude oil grades to collapse, strengthening the profitability of many transport companies:
• The spot price for the key European Brent (London) grade closed the year at US$55.27 per barrel on 31 December 2014 – a 49.7% decline from the end of the previous year (US$109.95 per barrel). Also on a yearly average, prices for this key grade were down 8.8% year-on-year.
• The spot price for the US-traded West Texas Intermediate grade also fell significantly, by 45.6% to US$53.45 on 31 December 2014 (31 December 2013: US$98.17 per barrel). Looking at the average for the year, prices were down 4.9% year-on-year.
55
DVB Bank SE | Group Annual Report 2014
C ONSOL IDAT ED F IN A NCI A L S TA ME MEN T S
AUDI T OP INIONA B OU T US
Macroeconomic environment
Developments on the equity markets, and of the DVB share price
Equity markets on both sides of the Atlantic showed dynamic performance during the first half of 2014. Having remained close to 9,400 index points during the first quarter of the year, the German blue-chip index DAX exceeded the 10,000-point level during the second quarter, driven by a strong outlook for the euro zone economy and by the ECB’s expansive monetary policy. However, the rally in the DAX came to an abrupt end at the beginning of the second half of the year: unexpectedly weak economic data from Germany, Europe, and the emerging markets – together with rising geopolitical tension – dampened the invest-ment climate. In this environment the DAX lost considerable ground, falling to around 8,500 points by mid-October 2014. The index then recovered during November, reaching a new record of 10,087 points. Against the background of a government crisis in Greece, with fears of renewed escalation of the European sovereign debt crisis, the DAX surrendered parts of its gains towards the year-end, closing the year at 9,806 index points, up 2.7% for the year. The Dow Jones Industrial Average index also posted marked gains during 2014, closing the year at 17,823 index points (up 7.5%).
Despite the volatility seen on equity markets throughout the year, the DVB share price was once again gratifyingly stable. This performance is attributable to the ongoing stable development of the Bank’s business, and also to the narrow market in which the shares trade, due to the low free float. The DVB share price was only exposed to moderate fluctuations during the course of 2014, reaching its high for the year of €25.35 on 21 March 2014. The lowest price of €24.25 was recorded on 13 June 2014. At the year-end, the DVB share was quoted at €24.65, equivalent to a market capitalisation of €1.1 billion.
The shares of DVB Bank SE (WKN: 804550, ISIN: DE0008045501) are listed in on the Frankfurt Stock Exchange in the General Standard. Since the capital increase conducted in 2008, the share capital pursuant to the Memorandum and Articles of Association amounted to €118,791,945.12 and is divided into 46,467,370 notional no-par value shares.
Euro/US dollar exchange rate developments
DVB’s income from its international Transport Finance and Advisory businesses is mostly US dollar-denominated, whereas its costs and funding are largely denominated in euros. Accord-ingly, the development of the euro/US dollar exchange rate is extremely important for the Bank.
The euro lost significant value against the US dollar during the course of 2014: having traded above the US$1.3790 level during the first half of the year, the single European currency dropped markedly during the second half. The year-end euro/US dollar rate of 1.2140 was 16.5 US cents below the previous year’s closing level, mainly on account of diverging monetary policies pursued by the Fed and the ECB. Whilst the Fed exited its pur-chasing programme for long-term US Treasuries, on the back of promising economic data, thus triggering speculation regarding an end to its low interest rate policy, the ECB adopted a clearly more expansive monetary policy stance for the euro zone. As a result, markets anticipated a continuation of the ECB’s expansive monetary policy for 2015 – for example, by way of ongoing and extensive purchases of sovereign bonds.
DVB’s ratings
Since December 2011, DVB Bank SE has consistently been rated ”A+/A-1/stable” by ratings agency Standard & Poor’s (S&P). The ratings assigned by FitchRatings to the German Cooperative Financial Services Network also remained unchanged in 2014, at ”A+/F1+”.
GROUP M A N AGE M E N T R E P OR T
REPORT ON THE ECONOMIC POSITION

56
DVB Bank SE | Group Annual Report 2014
Financial position and performance
Figures in the Group management report and in the con-solidated financial statements including notes are rounded pursuant to standard business principles. This may result in slight differences when aggregating figures and calculating percentages.
• Allowance for credit losses declined by 29.0%, or €25.5 million, to €62.4 million (2013: €87.9 million). Specific allowance for credit losses was recognised in the amount of €75.8 million (2013: €90.0 million), and portfolio-based allow-ance for credit losses in the amount of €13.4 million was released. No provisions were recognised (2013: release of portfolio-based allowance for credit losses in the amount of €1.0 million; provisions of €0.1 million were released).
• Net interest income after allowance for credit losses declined by 1.0%, to €153.5 million (2013: €155.1 million), despite lower allowance for credit losses – due to three reasons.
– The high level of liquidity reserves, caused by unexpected, early loan repayments burdened net interest income by €13.2 million.
– Net interest income included additional risk costs of €27.6 million for vessels which are under the Bank’s control, as part of restructuring measures.
– Finally, net interest income was also burdened by a lower average lending volume.
• Net fee and commission income, which primarily includes fees and commissions from the lending business, as well as asset management and Corporate Finance advisory fees, declined to €108.5 million, down 15.7% year-on-year (2013: €128.7 million).
• In the context of the Bank’s Investment Management activi-ties, subsidiary DVB Bank America N.V. sold its participation in a loan agreement with profit-sharing, as well as its legal position under an investment advisory and investment man-agement agreement; this yielded other operating income of approximately €22 million. As a result, net other operating income/expenses rose to €30.1 million (2013: –€4.1 million).
Consolidated net income before IAS 39 and taxes improved by 10.2% over the previous year, from €106.0 million to €116.8 million, driven by two main factors: a strong increase in net other operating income and expenses, to €30.1 million – which largely com-prises contributions from Investment Management – and the markedly lower allowance for credit losses, which was reduced by €25.5 million.
DVB’s particular strengths were once again clearly visible during the business year under review:
• a consistent strategic focus on financing transport assets;
• a highly diversified credit portfolio collateralised by the financed transport assets;
• DVB’s core risk management skills providing the basis for the Bank’s lending business;
• matched-maturity funding;
• a strong capital base through own funds;
• highly qualified and experienced staff.
Financial assessment of business performance in 2014
DVB assesses its 2014 financial performance by way of the following key financial indicators:
• Besides the markedly higher consolidated net income before IAS 39 and taxes, net income before IAS 39 also increased – by 6.9%, to €304.5 million (2013: €284.8 million).
• Net interest income decreased by 11.2%, to €215.9 million. DVB closed 187 new transactions, representing a volume of €6.3 billion, in the Transport Finance divisions – Shipping Finance, Aviation Finance, Offshore Finance and Land Trans-port Finance (2013: 173 new deals representing a volume of €4.7 billion). Based on a generally cycle-neutral lending policy, DVB continued to successfully implement its tried-and-tested strategy of pricing exposures in line with the risks involved. It achieved an average gross interest margin of 260 basis points on new Transport Finance business (2013: 300 basis points).

57
DVB Bank SE | Group Annual Report 2014
C ONSOL IDAT ED F IN A NCI A L S TA ME MEN T S
AUDI T OP INIONA B OU T US
Financial position and performance
• Non-operating net result from financial instruments in accordance with IAS 39 – which is always volatile – swung to –€12.8 million, down €31.0 million (2013: €18.2 million). The IAS 39 accounting rules prevent the recognition of certain economic hedge relationships related to non-financial assets and/or in connection with hedges using cross-currency swaps, thus leading to accounting mismatches.
• Reflecting the IAS 39 result, consolidated net income before taxes showed a 16.3% decline, to €104.0 million (2013: €124.2 million). Net income including IAS 39 also decreased accordingly, to €291.7 million, down 3.7% (2013: €303.0 million).
• The key strategic indicators which DVB Group uses to man-age its business reflected the business performance: return on equity before taxes stood at 8.1% (2013: 10.3%), whilst the cost/income ratio was 53.0% (2013: 45.7%) and risk-adjusted Economic Value Added (EVATM) totalled €28.5 million (2013: €22.8 million)
• At €26.2 billion, the volume of business in 2014 was up 6.5% on the previous year (2013: €24.6 billion). Besides total assets of €24.5 billion (2013: €23.4 billion), the figure also includes irrevocable loan commitments of €1.7 billion (2013: €1.2 billion).
Financial performance
DVB’s income after IAS 39 declined by 3.7% in 2014, from €303.0 million to €291.7 million.
Net interest income after allowance for credit losses
Net interest income after allowance for credit losses declined by 1.0%, from €155.1 million to €153.5 million, due to three reasons.
• The high level of liquidity reserves, caused by unexpected, early loan repayments burdened net interest income by €13.2 million.
• In addition, net interest income included additional risk costs of €27.6 million.
• Finally, net interest income was also burdened by a lower average lending volume.
Net interest income declined by 11.2%, to €215.9 million (2013: €243.0 million).
Financial performance (€ mn)
2014
20131)
%
Interest income 807.0 816.3 –1.1
Current income 89.9 126.2 –28.8
Interest and similar income 896.9 942.5 –4.8
Interest expenses –681.0 –699.5 –2.6
Net interest income 215.9 243.0 –11.2
Allowance for credit losses –62.4 –87.9 –29.0
Net interest income after allowance for credit losses 153.5 155.1 –1.0
Fee and commission income 114.8 134.4 –14.6
Fee and commission expenses –6.3 –5.7 10.5
Net fee and commission income 108.5 128.7 –15.7
Result from investments in companies accounted for using the equity method 12.4 5.1 –
Net other operating income/expenses 30.1 –4.1 –
Net result from financial instruments in accordance with IAS 39 –12.8 18.2 –
Net income 291.7 303.0 –3.7
1) Retrospective application of IFRS 10 resulted in an adjustment of the previous year’s figures. For a more detailed explanation, please refer to the Notes from page 176 onwards.
GROUP M A N AGE M E N T R E P OR T
REPORT ON THE ECONOMIC POSITION

58
DVB Bank SE | Group Annual Report 2014
Average gross interest margins on new business developed as follows in 2014:
Interest expenses declined by 2.6%, to €681.0 million (2013: €701.8 million), comprising:
• €554.1 million (–3.5% year-on-year; 2013: €574.3 million) in refinancing costs for the Transport Finance lending business;
• €110.8 million (+1.3% year-on-year; 2013: €109.4 million) in expenses for operating leases which also includes €27.6 million (2013: €23.6 million) in risk costs for vessels under the Bank’s control, as part of restructuring measures.
• €16.1 million (+1.9% year-on-year; 2013: €15.8 million) in expenses for subordinated capital.
Net interest income in the material business segments
Net interest income in the material business segments developed as follows:
• Shipping Finance: down 15.3%, to €78.0 million (2013: €92.1 million);
• Aviation Finance: up 1.0%, to €89.7 million (2013: €88.8 million);
• Offshore Finance: down 15.4%, to €26.3 million (2013: €31.1 million);
• Land Transport Finance: up 12.8%, to €16.7 million (2013: €14.8 million);
• Investment Management: down significantly, to –€13.3 million (2013: €6.0 million).
Consolidated interest income and interest expenses
The aggregate of consolidated interest and similar income decreased by 4.8%, from €942.5 million to €896.9 million, and was composed of the following items:
• €779.4 million (–0.8% year-on-year; 2013: €785.6 million) was generated almost exclusively from loans to international transport clients;
• €16.8 million (–36.1% year-on-year; 2013: €26.3 million) from finance leases;
• €10.8 million (+96.4% year-on-year; 2013: €5.5 million) from bonds and other fixed-income securities;
• €88.7 million (–27.8% year-on-year; 2013: €122.9 million) in current income from operating leases, derived largely from those funds managed by the Investment Management division which must be consolidated;
• €1.2 million (–45.5% year-on-year; 2013: €2.2 million) in current income from equity investments and other investment securities (such as joint ventures).
Basis points 2014 2013 2012 2011 2010
Shipping Finance1) 269 316 345 295 333
Aviation Finance 250 284 380 325 338
Offshore Finance 271 330 359 331 324
Land Transport Finance 238 250 281 280 218
ITF Suisse 228 292 308 283 292
1) The figures for the years 2010-2012 diverge from those stated in the Annual Report 2012, due to the separation of DVB’s Offshore financing activities from the Shipping Finance segment, to establish a stand-alone Offshore Finance division, effective 1 January 2013.
Financial position and performance

59
DVB Bank SE | Group Annual Report 2014
C ONSOL IDAT ED F IN A NCI A L S TA ME MEN T S
AUDI T OP INIONA B OU T US
Allowance for credit losses
Net allowance for credit losses declined by 29.0%, from –€87.9 million to –€62.4 million.
Allowance for credit losses comprised specific as well as port-folio-based allowance for credit losses, and provisions. Specific allowance for credit losses, which is recognised in income, was lower than in the previous year, at €75.8 million (2013: €90.0 million). Specific allowance of €13.4 million was released. No provisions were recognised (2013: release of portfolio-based allowance for credit losses in the amount of €1.0 million; provi-sions of €0.1 million released).
The following tables show the development, broken down by business division, for 2014 and 2013: (see table on page 60)
€ mn 2014 20131) %
Additions –147.2 –154.4 –4.7
Reversals 83.5 69.4 20.3
Direct write-offs –8.6 –9.6 –10.4
Recoveries on loans and
advances previously written off 9.9 6.7 47.8
Net allowance
for credit losses –62.4 –87.9 –29.0
1) Retrospective application of IFRS 10 resulted in an adjustment of the previous year’s figures. For a more detailed explanation, please refer to the Notes from page 176 onwards.
Allowance for credit losses by business division 2014 (€ mn)
Additions
Reversals
Direct write-offs
Recoveries on loans and
advances previously written off
Total
Shipping Finance –88.5 43.5 –7.4 2.7 –49.7
Aviation Finance –11.0 5.1 – 4.1 –1.8
Offshore Finance – – – – –
Land Transport Finance –1.3 1.3 – – 0.0
Investment Management –7.4 2.4 – – –5.0
ITF Suisse –13.1 0.1 –0.6 0.1 –13.5
Business no longer in line with DVB’s strategy –12.2 4.0 – 3.0 –5.2
Other 0.0 – –0.6 0.0 –0.6
Total specific allowance for credit losses –133.5 56.4 –8.6 9.9 –75.8
Shipping Finance –7.3 18.4 – – 11.1
Aviation Finance –3.7 5.3 – – 1.6
Offshore Finance –0.7 0.7 – – 0.0
Land Transport Finance –0.4 0.1 – – –0.3
Investment Management – – – – –
ITF Suisse –1.1 2.6 – – 1.5
Business no longer in line with DVB’s strategy –0.5 – – – –0.5
Other 0.0 0.0 – – 0.0
Total portfolio-based allowance for credit losses –13.7 27.1 – – 13.4
Total provisions – – – – –
Total –147.2 83.5 –8.6 9.9 –62.4
”Business no longer in line with DVB’s strategy” includes the D-Marketing unit and the Transport Infrastructure Finance portfolio.”Other” includes the Treasury and DVB LogPay.
GROUP M A N AGE M E N T R E P OR T
REPORT ON THE ECONOMIC POSITION
Financial position and performance
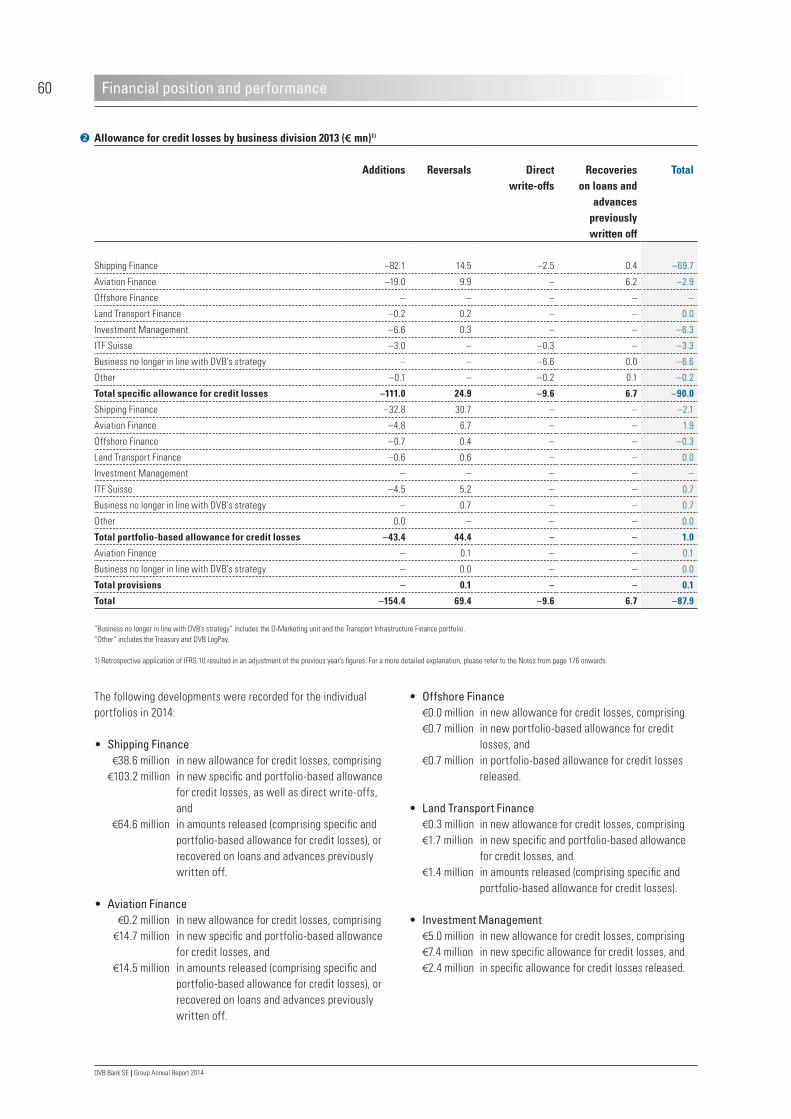
60
DVB Bank SE | Group Annual Report 2014
• Offshore Finance €0.0 million in new allowance for credit losses, comprising €0.7 million in new portfolio-based allowance for credit
losses, and €0.7 million in portfolio-based allowance for credit losses
released.
• Land Transport Finance €0.3 million in new allowance for credit losses, comprising €1.7 million in new specific and portfolio-based allowance
for credit losses, and €1.4 million in amounts released (comprising specific and
portfolio-based allowance for credit losses).
• Investment Management €5.0 million in new allowance for credit losses, comprising €7.4 million in new specific allowance for credit losses, and €2.4 million in specific allowance for credit losses released.
The following developments were recorded for the individual portfolios in 2014:
• Shipping Finance €38.6 million in new allowance for credit losses, comprising €103.2 million in new specific and portfolio-based allowance
for credit losses, as well as direct write-offs, and
€64.6 million in amounts released (comprising specific and portfolio-based allowance for credit losses), or recovered on loans and advances previously written off.
• Aviation Finance €0.2 million in new allowance for credit losses, comprising €14.7 million in new specific and portfolio-based allowance
for credit losses, and €14.5 million in amounts released (comprising specific and
portfolio-based allowance for credit losses), or recovered on loans and advances previously written off.
Allowance for credit losses by business division 2013 (€ mn)1)
Additions
Reversals
Direct write-offs
Recoveries on loans and
advances previously written off
Total
Shipping Finance –82.1 14.5 –2.5 0.4 –69.7
Aviation Finance –19.0 9.9 – 6.2 –2.9
Offshore Finance – – – – –
Land Transport Finance –0.2 0.2 – – 0.0
Investment Management –6.6 0.3 – – –6.3
ITF Suisse –3.0 – –0.3 – –3.3
Business no longer in line with DVB’s strategy – – –6.6 0.0 –6.6
Other –0.1 – –0.2 0.1 –0.2
Total specific allowance for credit losses –111.0 24.9 –9.6 6.7 –90.0
Shipping Finance –32.8 30.7 – – –2.1
Aviation Finance –4.8 6.7 – – 1.9
Offshore Finance –0.7 0.4 – – –0.3
Land Transport Finance –0.6 0.6 – – 0.0
Investment Management – – – – –
ITF Suisse –4.5 5.2 – – 0.7
Business no longer in line with DVB’s strategy – 0.7 – – 0.7
Other 0.0 – – – 0.0
Total portfolio-based allowance for credit losses –43.4 44.4 – – 1.0
Aviation Finance – 0.1 – – 0.1
Business no longer in line with DVB’s strategy – 0.0 – – 0.0
Total provisions – 0.1 – – 0.1
Total –154.4 69.4 –9.6 6.7 –87.9
”Business no longer in line with DVB’s strategy” includes the D-Marketing unit and the Transport Infrastructure Finance portfolio.”Other” includes the Treasury and DVB LogPay.
1) Retrospective application of IFRS 10 resulted in an adjustment of the previous year’s figures. For a more detailed explanation, please refer to the Notes from page 176 onwards.
Financial position and performance

61
DVB Bank SE | Group Annual Report 2014
C ONSOL IDAT ED F IN A NCI A L S TA ME MEN T S
AUDI T OP INIONA B OU T US
• ITF Suisse subsidiary €12.0 million in new allowance for credit losses, comprising €14.8 million in new specific and portfolio-based allowance
for credit losses, as well as direct write-offs, and
€2.8 million in amounts released (comprising specific and portfolio-based allowance for credit losses), or recovered on loans and advances previously written off.
Total allowance for credit losses (composed of specific and portfolio-based allowance for credit losses, and provisions) increased by 7.0% as at 31 December 2014, from €204.6 million to €219.0 million, comprising mainly the following items:
€121.9 million for the Shipping Finance portfolio;
€41.7 million for the Aviation Finance portfolio;
€19.0 million for the ITF Suisse portfolio;
€16.6 million for the Investment Management portfolio;
€16.0 million for business that is no longer in line with DVB’s strategy;
€1.9 million for the Land Transport portfolio;
€1.5 million for the Offshore Finance portfolio.
For details on the development of allowance for credit losses please see the report on opportunities and risks (pages 158–160). It portrays the changes by business division and region, among other things.
As in the previous year, no country risk provisions were required. The Structured Asset Financing’s credit exposures of DVB’s Shipping Finance, Aviation Finance, Offshore Finance and Land Transport Finance business divisions are almost exclusively collateralised by the transport assets we finance; thus, at only 0.8% in terms of net risk exposure, the share of commitments that involve a high degree of country risk was once again very low, and in line with the previous year.
Net fee and commission income
Consolidated net fee and commission income, which primarily includes fees and commissions from lending business, asset management and Corporate Finance advisory fees, amounted to €108.5 million (2013: €128.7 million, down 15.7%).
Broken down by business division, net fee and commission income developed as follows:
• Shipping Finance: down 8.2%, to €41.3 million (2013: €45.0 million);
• Aviation Finance: down 11.4%, to €34.2 million (2013: €38.6 million);
• Offshore Finance: down 2.1%, to €18.6 million (2013: €19.0 million);
• Land Transport Finance: up 12.5%, to €7.2 million (2013: €6.4 million);
• Investment Management: down significantly, to –€0.8 million (2013: €7.5 million).
Total fee and commission income declined to €114.8 million (2013: €134.4 million, down 14.6%). A 7.2% decline was seen in fee and commission income generated in the lending business – to €93.0 million, as a result of lower commitment commissions achievable on the market during the course of the year. Other fee and commission income decreased by 43.4%, to €16.4 million (2013: €29.0 million).
Fee and commission expenses of €6.3 million (2013: €5.7 million, up 10.5%) included, in particular, €1.6 million in expenses for payment transactions and €0.8 million in expenses for the lending business.
Result from investments in companies accounted for using the equity method
Results from investments accounting for using the equity method rose from €5.1 million to €12.4 million.
Net other operating income/expenses
Net other operating income/expenses rose from –€4.1 million to €30.1 million. Other operating income was up 81.1%, from €39.6 million to €71.7 million. In the context of the Bank’s Invest-ment Management activities, subsidiary DVB Bank America N.V. sold its participation in a loan agreement with profit-sharing, as well as its legal position under an investment advisory and investment management agreement.
Other operating expenses declined by 4.8%, to €41.6 million (2013: €43.7 million).
GROUP M A N AGE M E N T R E P OR T
REPORT ON THE ECONOMIC POSITION
Financial position and performance

62
DVB Bank SE | Group Annual Report 2014
Consolidated net income before IAS 39 and taxes
Consolidated net income before IAS 39 and taxes rose by 10.2%, from €106.0 million to €116.8 million.
Consolidated net income before taxes
Consolidated net income before taxes declined by 16.3%, from €124.2 million to €104.0 million.
Net income from financial instruments in accordance with IAS 39 swung from €18.2 million to –€12.8 million. Strong volatility in the interest rate and foreign exchange markets throughout 2014 was reflected in the following items:
• The trading result amounted to €9.4 million (2013: €2.9 million), including standalone derivatives in the trading portfolio.
• Conversely, the hedge result (hedge accounting) was down to –€11.2 million (2013: –€2.2 million); this figure comprises underlying transactions and derivatives with effective hedge relationships.
• The result from derivatives entered into without intention to trade changed from €16.2 million to –€11.9 million.
• The result from investment securities amounted to €0.9 million (2013: €1.3 million).
General administrative expenses
General administrative expenses were up 5.0%, to €187.7 million.
Staff expenses
Staff expenses of €108.9 million were up 3.0% year-on-year (2013: €105.7 million), due to a 3.2% increase in wages and salaries, to €95.5 million.
Staffing levels developed as follows:
The number of employees rose by 14 (+2.5%), to 581 persons at the 2014 year-end. With 304 employees, staff levels in our core Transport Finance and Investment Management business divisions during 2014 showed an increase of two over the previous year’s level (2013: 302 employees). With 221 employees, staffing levels in the products and service units rose by eight staff members (+3.8% compared to the year-end 2013), predominantly due to new tasks imposed by regulatory requirements. The number of employees at DVB’s LogPay Financial Services GmbH subsidiary increased by 7.7% to 56 staff members (year-end 2013: 52 employ-ees).
Non-staff expenses
At €74.3 million, non-staff expenses were up 8.8% on the previous year (2013: €68.3 million), mainly comprising the following items:
• advisory expenses of €25.0 million (2013: €23.6 million), which break down as follows:
– €8.6 million for legal and audit expenses (including €2.6 million for the audit of the financial state-ments and other advisory services); as well as
– €16.4 million for other advisory services (including IT consultancy expenses);
• ancillary labour costs of €18.2 million (2013: €17.5 million);
• occupancy expenses of €8.3 million (2013: €7.3 million); as well as
• contributions and fees of €9.1 million (2013: €6.4 million), particularly for the bank levy and the deposit insurance scheme of the National Association of German Cooperative Banks (Bundesverband der Deutschen Volksbanken und Raiffeisen-banken).
Depreciation, amortisation, impairment and write-ups
Net depreciation, amortisation, impairment and write-ups declined by 6.3%, from €4.8 million to €4.5 million.
€ mn 2014 20131) %
Consolidated net income
before IAS 39 and taxes 116.8 106.0 10.2
Trading result 9.4 2.9 –
Hedge result –11.2 –2.2 –
Result from the application
of the fair value option 0.0 0.0 –
Result from derivatives entered
into without intention to trade –11.9 16.2 –
Result from
investment securities 0.9 1.3 –30.8
Net result from financial
instruments in accordance
with IAS 39 –12.8 18.2 –
Consolidated net income
before taxes 104.0 124.2 –16.3
1) Retrospective application of IFRS 10 resulted in an adjustment of the previous year’s figures. For a more detailed explanation, please refer to the Notes from page 176 onwards.
Financial position and performance

63
DVB Bank SE | Group Annual Report 2014
C ONSOL IDAT ED F IN A NCI A L S TA ME MEN T S
AUDI T OP INIONA B OU T US
Development of consolidated net income
Consolidated net income declined by 23.6%, from €111.1 million to €84.9 million.
Consolidated net income before taxes (€104.0 million) was subject to an income tax burden of €19.1 million, including current taxes in the amount of €15.9 million and deferred income taxes of €3.2 million.
Accordingly, consolidated net income totalled €84.9 million (2013: €110.6 million). Consolidated net income attributable to non-controlling interests changed to €0.0 million (2013: –€0.5 million). This reflects the share of results economically attributable to non-controlling shareholders in consolidated entities. Consoli-dated net income attributable to shareholders of DVB was down 23.6%, from €111.1 million to €84.9 million.
Distributable profit and appropriation of profits
Distributable profit remained stable, at €27.9 million. €57.0 million (–31.5% year-on-year; 2013: €83.2 million) was transferred from current operations to retained earnings.
DVB Bank SE’s Annual General Meeting, which will be held on 25 June 2015, will be proposed to pay a dividend of €0.60 per notional no-par value share for the 2014 business year, to be paid from DVB Bank SE’s net retained profit. This represents a dividend yield of 2.43% based on the year-end share price of €24.65.
€ mn 2014 20131) %
Consolidated net income 84.9 110.6 –23.2
Profit carried forward 0.0 0.0 –
Consolidated net income
attributable to non-controlling
interests 0.0 0.5 –
Transfer to retained earnings –57.0 –83.2 –31.5
Distributable profit 27.9 27.9 –
1) Retrospective application of IFRS 10 resulted in an adjustment of the previous year’s figures. For a more detailed explanation, please refer to the Notes from page 176 onwards.
€ mn 2014 20131) %
Consolidated
net income before taxes 104.0 124.2 –16.3
Income taxes –19.1 –13.6 40.4
Consolidated net income 84.9 110.6 –23.2
thereof: consolidated
net income attributable
to non-controlling interests 0.0 –0.5 –
thereof: consolidated
net income attributable
to shareholders of DVB 84.9 111.1 –23.6
1) Retrospective application of IFRS 10 resulted in an adjustment of the previous year’s figures. For a more detailed explanation, please refer to the Notes from page 176 onwards.
GROUP M A N AGE M E N T R E P OR T
REPORT ON THE ECONOMIC POSITION
Financial position and performance

64
DVB Bank SE | Group Annual Report 2014
Development of own funds
Own funds as defined by the Capital Requirements Regulation (CRR) totalled €1,408.6 million.
Common equity tier 1 capital totalled €1,222.0 million. Reserves amounted to €1,327.3 million. Subordinated liabilities totalled €270.0 million. Tier 2 capital totalled €186.6 million.
The Bank had adequate own funds – as defined by the CRR – available throughout 2014. Moreover, it complied with regulatory capital requirements pursuant to Article 72 in conjunction with Article 25 of Regulation 575/2013/EU (CRR) at all times during the year under review.
Financial position
DVB’s total assets rose by a total of 4.7%, to €24.5 billion (2013: €23.4 billion).
Liabilities on the statement of financial position
Deposits from other banks were down 18.4%, from €3.8 billion to €3.1 billion. Deposits from customers increased by 16.4%, from €6.1 billion to €7.1 billion. Securitised liabilities rose by 1.8%, from €11.1 billion to €11.3 billion as at the reporting date, whilst subordinated liabilities increased by 25.0%, to €0.5 billion (2013: €0.4 billion).
Total liabilities were denominated in the following currencies:
Own funds as defined by the CRR (€ mn)1)
2014
Paid-up capital instruments 118.8
Capital reserve plus other reserves eligible for inclusion 1,327.3
Deductions from common equity tier 1 capital –472.8
Transitional provisions regarding common equity tier 1 capital 248.7
Common equity tier 1 capital 1,222.0
Transitional provisions regarding additional tier 1 capital –160.0
Transfer of shortfall to common equity tier 1 capital 160.0
Additional tier 1 capital 0.0
Subordinated liabilities 270.0
Transitional provisions regarding tier 2 capital –83.4
Tier 2 capital 186.6
Modified available equity2) 1,408.6
1) Due to legal changes, this breakdown of own funds cannot be compared to the previous year’s values, which were calculated in accordance with the German Banking Act. No reference values in accordance with the CRR are available as at 31 December 2013.
2) Taking into consideration reserves and transfers to reserves from net income
€ bn 2014 2013 %
Swiss franc 0.1 0.1 –
Euro 12.1 11.3 7.1
Japanese yen 0.0 0.0 –
Norwegian krone 0.0 0.0 –
US dollar 9.8 10.0 –2.0
Total 22.0 21.4 2.8
Financial position and performance

65
DVB Bank SE | Group Annual Report 2014
C ONSOL IDAT ED F IN A NCI A L S TA ME MEN T S
AUDI T OP INIONA B OU T US
To ensure compliance with the Basel I floor rule pursuant to Article 500 of the CRR, which was once again extended, DVB raised subordinated funds in the amount of €115.0 million in September 2014. The Bank raised an additional €150.0 million in subordinated liabilities in January 2015.
DVB discloses capital ratios determined in accordance with the Basel III regime (Advanced Approach) and after appropriation of profits; on this basis, the common equity tier 1 ratio amounted to 18.7% whilst the total capital ratio was 21.6%.
DVB’s capitalisation remained above the minimum requirements stipulated by the CRR at all times during the year under review. Its capital ratios were always significantly higher than the require-ments set out in Article 92 (1) of the CRR, as well as Article 465 (1) of the CRR in conjunction with section 23 of the German Solvency Regulation.
Key Group management indicators
The Bank employs three financial indicators to assess and manage its business: return on equity before taxes (ROE), the cost/income ratio (CIR) and the risk-adjusted Economic Value Added (EVA™).
The ROE (before taxes) calculated in accordance with International Financial Reporting Standards declined by 2.2 percentage points, from 10.3% to 8.1%. The ROE was calculated as follows: consoli-dated net income before taxes attributable to DVB’s shareholders of €104.0 million was divided by the total of the weighted capital (issued share capital, capital reserve and retained earnings, excluding the fund for general banking risks, non-controlling interests and deferred taxes, and before appropriation of con-solidated net income) of €1,280.0 million.
The CIR in accordance with IFRS stood at 53.0% (2013: 45.7%). The CIR is calculated as follows: the general administrative expenses figure of €187.7 million was divided by €354.1 million (being the total of net interest income (before allowance for credit losses), net fee and commission income, net result from financial instruments in accordance with IAS 39, results from investments in companies accounted for using the equity method and net other operating income/expenses).
Risk-adjusted EVA™, which has major importance for the man-agement and assessment of the Bank’s business, was up 25.0% in 2014, to €28.5 million (2013: €22.8 million). EVA™ represents residual profit; it expresses net profit (as an absolute amount) after deduction of costs for risk capital employed. The figure was calculated by deducting risk capital costs of €88.3 million from consolidated net income before IAS 39 and taxes of €116.8 million.
Capital ratios after appropriation of profits (Basel III)1)
2014
Common equity tier 1 ratio 18.7
Additional tier 1 ratio 18.7
Total capital ratio 21.6
1) Due to legal changes, this breakdown of own funds cannot be compared to the previous year’s values, which were calculated in accordance with the German Banking Act. No reference values in accordance with the CRR are available as at 31 December 2013.
Management indicators
2014
20131)
2012
2011
2010
Return on equity before taxes 8.1% 10.3% 12.9% 14.0% 13.9%
Cost/income ratio 53.0% 45.7% 46.5% 47.8% 49.0%
Economic Value Added €28.5 million €22.8 million €67.9 million €66.8 million €23.8 million
1) Retrospective application of IFRS 10 resulted in an adjustment of the previous year’s figures. For a more detailed explanation, please refer to the Notes from page 176 onwards.
GROUP M A N AGE M E N T R E P OR T
REPORT ON THE ECONOMIC POSITION
Financial position and performance

66
DVB Bank SE | Group Annual Report 2014
Funding activities: DVB extended its euro benchmark curve, broadening the investor base
DVB has emphasised matched-maturity funding for many years – a goal the Bank consistently adhered to in 2014 as well.
DVB continued to broaden its investor base throughout 2014, through the placement of promissory note loans, bonds and the ship covered bonds outside the Volksbanken Raiffeisenbanken cooperative financial network. In detail, funding consisted of the following amounts and instruments:
• placement of promissory note loans in an aggregate amount of €1.2 billion;
• issue of senior unsecured bearer bonds totalling €0.8 billion under the Debt Issuance Programme. This included DVB’s fifth euro benchmark issue (€500.0 million) as well as a €75.0 million subordinated bearer bond;
• a €75.0 million ship covered bond issue.
Refinancing
The Frankfurt-based Group Treasury is responsible for securing refinancing throughout the Group. The unit also manages DVB’s trading activities at a centralised level, and hedges the market risk exposure of direct and indirect subsidiaries, thus indemnify-ing these entities against market risks. DVB conducts trading activities in risk management products for its own positions and on behalf of its clients. It does so in order to hedge against market risk exposure from the customer lending business, and to hedge profit contributions – which are predominantly generated in currencies other than the euro – against exchange rate fluctua-tions. With a diversified range of funding products, Group Treasury targets a broad spectrum of domestic and international investors. The product range represents an attractive offer to existing and new investors.
Liquidity profile
€ bn6
5
4
3
2
1
0
2015
2016
2017
2018
2019
2020
2021
2022
2023
2024
2025
> 2025
∞
Assets Liabilities
Financial position and performance

67
DVB Bank SE | Group Annual Report 2014
C ONSOL IDAT ED F IN A NCI A L S TA ME MEN T S
AUDI T OP INIONA B OU T US
Refinancing volume – maturity breakdown
As in the previous years, we adhered to our principle of matched-maturity funding in 2014. Thanks to this conservative approach, we already complied with future structural liquidity requirements under the Basel III regime which are currently being discussed (Liquidity Coverage Ratio and Net Stable Funding Ratio).
At year-end, the funding base included 94.5% long-term funds (20131): 95.7%). The structure of the funding mix is analysed as follows:
• 51.6% unsecured bearer bonds (2013: 52.0%);
• 38.3% promissory note loans/long-term deposits (2013: 40.9%);
• 2.4% ship covered bonds (2013: 3.5%);
• 2.2% interest-bearing equity as defined by the KWG (2013: 1.5%).
Short-term funding only accounts for 5.5% (20131): 4.3%) and mainly comprises short-term deposits from clients as well as cash collateral received for interest rate and foreign exchange derivatives entered into for hedging purposes. In addition, DVB holds short-term bank deposits which are exclusively used for fine-tuning purposes.
1) The figures shown here for the previous year differ from those published previously, since cash collateral was retrospectively included as a means of short-term funding for the first time.
Refinancing volume – structure of refinancing vehicles
A structural comparison of the individual refinancing vehicles portrays the following scenario: unsecured bearer dept securities (long-term bond issues under the medium-term note programme) rose by 6.8%, to €11.0 billion (2013: €10.3 billion). Long-term promissory note loans and term deposits were unchanged, at €8.1 billion. The volume of outstanding ship covered bonds declined by 24.4%, to €0.5 billion (2013: €0.7 billion). Driven by an inflow of cash collateral, the level of short-term funding increased to €1.2 billion (2013: €0.9 billion).
Structure of refinancing vehicles
€ bn12
10
8
6
4
2
0
+45.8%
0.3 0.5
Interest-bearing equity
as defined by the KWG
+34.7%
0.9 1.2
Short-term deposits
from other banks/clients
–24.4%
0.7 0.5
Ship covered bonds
0.0%
8.1 8.1
Promissory note
loans/long-term deposits
+6.8%
10.3 11.0
Unsecured
bearer bonds
2013 2014
GROUP M A N AGE M E N T R E P OR T
REPORT ON THE ECONOMIC POSITION
Financial position and performance

68
DVB Bank SE | Group Annual Report 2014
Nominal volume of customer lending by business division
DVB’s nominal volume of customer lending (comprising loans and advances to customers, guarantees and indemnities, irrevo-cable loan commitments and derivatives) includes structured asset finance in Transport Finance, the fund management activi-ties in Investment Management, the activities on the interbank market of our subsidiary ITF Suisse and the exposures no longer in line with DVB’s strategy held by Transport Infrastructure and D-Marketing. Customer lending rose by 12.0%, to €23.3 billion (2013: €20.8 billion). This was distributed across the business divisions as follows:
Net assets
Business volume
At €26.2 billion, the volume of business in 2014 was 6.5% higher than the previous year (2013: €24.6 billion). Besides total assets of €24.5 billion, the figure also includes irrevocable loan commit-ments of €1.7 billion.
Lending volume over time
Lending volume of €25.9 billion was up 16.1% on the previous year.
Loans and advances to banks rose from €0.2 billion to €1.5 billion. Loans and advances to customers increased by 9.0%, to €20.6 billion (2013: €18.9 billion). The volume of securities (includ-ing equity investments) totalled €0.5 billion (2013: €0.7 billion). Financial guarantee contracts from guarantees were slightly higher year-on-year, to €0.3 billion (2013: €0.2 billion). Contingent liabilities from irrevocable loan commitments rose to €1.7 billion (2013: €1.2 billion). As in previous years, DVB employed derivative instruments for hedging purposes, offering them (to a limited extent) to its clients as well. The volume of these derivatives held rose from €1.1 billion to €1.3 billion.
€ bn 2014 20131) %
Loans and advances to banks 1.5 0.2 –
Loans and advances
to customers 20.6 18.9 9.0
Securities
(including equity investments) 0.5 0.7 –28.6
Financial guarantee contracts
from guarantees 0.3 0.2 50.0
Contingent liabilities from
irrevocable loan commitments 1.7 1.2 41.7
Derivatives 1.3 1.1 18.2
Lending volume 25.9 22.3 16.1
1) Retrospective application of IFRS 10 resulted in an adjustment of the previous year’s figures. For a more detailed explanation, please refer to the Notes from page 176 onwards.
Shipping Finance 43.3% (–1.0 pp)
Aviation Finance 30.5% (–0.3 pp)
Offshore Finance 9.9% (+0.3 pp)
Land Transport Finance 8.6% (+0.9 pp)
ITF Suisse 4.3% (+0.5 pp)
Investment Management 2.6% (+0.2 pp)
Business no longer in line with DVB’s strategy 0.8% (–0.6 pp)
Customer lending by business division
Financial position and performance
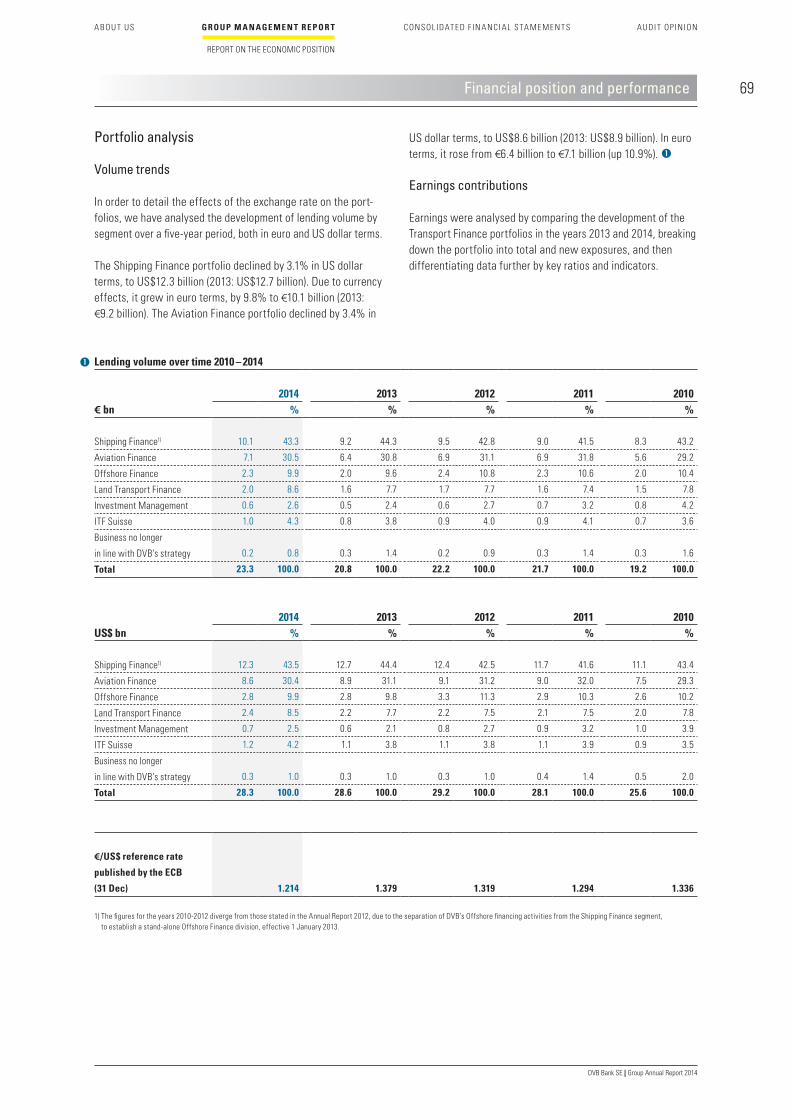
69
DVB Bank SE | Group Annual Report 2014
C ONSOL IDAT ED F IN A NCI A L S TA ME MEN T S
AUDI T OP INIONA B OU T US
Portfolio analysis
Volume trends
In order to detail the effects of the exchange rate on the port-folios, we have analysed the development of lending volume by segment over a five-year period, both in euro and US dollar terms.
The Shipping Finance portfolio declined by 3.1% in US dollar terms, to US$12.3 billion (2013: US$12.7 billion). Due to currency effects, it grew in euro terms, by 9.8% to €10.1 billion (2013: €9.2 billion). The Aviation Finance portfolio declined by 3.4% in
US dollar terms, to US$8.6 billion (2013: US$8.9 billion). In euro terms, it rose from €6.4 billion to €7.1 billion (up 10.9%).
Earnings contributions
Earnings were analysed by comparing the development of the Transport Finance portfolios in the years 2013 and 2014, breaking down the portfolio into total and new exposures, and then differentiating data further by key ratios and indicators.
Lending volume over time 2010 – 2014
2014 2013 2012 2011 2010€ bn % % % % %
Shipping Finance1) 10.1 43.3 9.2 44.3 9.5 42.8 9.0 41.5 8.3 43.2
Aviation Finance 7.1 30.5 6.4 30.8 6.9 31.1 6.9 31.8 5.6 29.2
Offshore Finance 2.3 9.9 2.0 9.6 2.4 10.8 2.3 10.6 2.0 10.4
Land Transport Finance 2.0 8.6 1.6 7.7 1.7 7.7 1.6 7.4 1.5 7.8
Investment Management 0.6 2.6 0.5 2.4 0.6 2.7 0.7 3.2 0.8 4.2
ITF Suisse 1.0 4.3 0.8 3.8 0.9 4.0 0.9 4.1 0.7 3.6
Business no longer
in line with DVB’s strategy 0.2 0.8 0.3 1.4 0.2 0.9 0.3 1.4 0.3 1.6
Total 23.3 100.0 20.8 100.0 22.2 100.0 21.7 100.0 19.2 100.0
2014 2013 2012 2011 2010US$ bn % % % % %
Shipping Finance1) 12.3 43.5 12.7 44.4 12.4 42.5 11.7 41.6 11.1 43.4
Aviation Finance 8.6 30.4 8.9 31.1 9.1 31.2 9.0 32.0 7.5 29.3
Offshore Finance 2.8 9.9 2.8 9.8 3.3 11.3 2.9 10.3 2.6 10.2
Land Transport Finance 2.4 8.5 2.2 7.7 2.2 7.5 2.1 7.5 2.0 7.8
Investment Management 0.7 2.5 0.6 2.1 0.8 2.7 0.9 3.2 1.0 3.9
ITF Suisse 1.2 4.2 1.1 3.8 1.1 3.8 1.1 3.9 0.9 3.5
Business no longer
in line with DVB’s strategy 0.3 1.0 0.3 1.0 0.3 1.0 0.4 1.4 0.5 2.0
Total 28.3 100.0 28.6 100.0 29.2 100.0 28.1 100.0 25.6 100.0
€/US$ reference rate
published by the ECB
(31 Dec)
1.214
1.379
1.319
1.294
1.336
1) The figures for the years 2010-2012 diverge from those stated in the Annual Report 2012, due to the separation of DVB’s Offshore financing activities from the Shipping Finance segment, to establish a stand-alone Offshore Finance division, effective 1 January 2013.
GROUP M A N AGE M E N T R E P OR T
REPORT ON THE ECONOMIC POSITION
Financial position and performance
70
DVB Bank SE | Group Annual Report 2014
asset, and is quoted as a percentage. The lower the LTV ratio percentage, the lower the Bank’s potential risk exposure in the event of the borrower’s default (in which case the lender would need to realise collateral). The ratio for the overall portfolio improved, falling by 5.9 percentage points, to 66.7% (2013: 72.6%). The development of LTV ratios in the various Transport Finance portfolios showed a differentiated development: whilst in Shipping Finance, the LTV ratio declined by 8.8 percentage points, to 68.2%, in Aviation Finance, it increased by 0.1 percentage points, to 70.9%, in Offshore Finance, it rose by 0.4 percentage points, to 54.4%, and in Land Transport Finance, it was up by 2.5 percentage points, to 72.6%.
The development of the CIR in the four Transport Finance divisions also showed a mixed picture. It was up by 1.2 percentage points in Shipping Finance, to 32.9%, up by 1.2 percentage points in Offshore Finance, to 11.3%, and up by 0.4 percentage points in Land Transport Finance, to 16.1%. In Aviation Finance, the CIR was down by 0.1 percentage points, to 15.6%. The CIR in Invest-ment Management rose by 29.1 percentage points, to 59.6%.
Likewise, the development of ROE differed. It was up by a marked 9.9 percentage points in Shipping Finance, to 12.3%, up by 8.5 percentage points in Aviation Finance, to 65.9%, and up by 3.4 percentage points in Land Transport Finance, to 66.7%. In Offshore Finance, ROE was down by 43.1 percentage points, to 138.9%. ROE in Investment Management fell by 8.5 percentage points, to 1.5%.
It should be noted that the ROE and CIR indicators are deter-mined excluding overheads; hence, they are not comparable to the ratios for the entire Bank.
New business
187 new Transport Finance transactions, representing a volume (final take) of €6.3 billion, were concluded during 2014 (2013: 173 new deals with a volume of €4.7 billion). New business vol-umes in the Transport Finance divisions developed as follows:
• new business in Shipping Finance rose from €2.0 billion to €2.6 billion;
• new business in Aviation Finance rose from €1.8 billion to €2.3 billion;
• new business in Offshore Finance rose from €0.5 billion to €0.8 billion; and
• new business in Land Transport Finance rose from €0.4 billion to €0.6 billion.
DVB played a leading role in 84.4% (2013: 84.2%) of the new deals in the four Transport Finance divisions. At 260 basis points, the gross average interest margin for new Transport Finance business decreased year-on-year (2013: 300 basis points).
Taking into account the total volume of DVB’s new business, including Investment Management and the business activities of ITF Suisse, 213 new transactions with an aggregate volume of €6.8 billion (2013: 195 new deals with an aggregate volume of €5.0 billion) were concluded, achieving an average margin of 256 basis points (2013: 298 basis points).
Total portfolio
The LTV ratio expresses the relation between loans granted and the market value of the financed transport assets. It represents the ratio of the loan amount to the market value of the financed
Financial position and performance

71
DVB Bank SE | Group Annual Report 2014
C ONSOL IDAT ED F IN A NCI A L S TA ME MEN T S
AUDI T OP INIONA B OU T US
Earnings contributions (€ mn)
Shipping
Finance
Aviation
Finance
Offshore
Finance
Land Transport
Finance
Investment
Management
ITF Suisse Total
2014 2013 2014 2013 2014 2013 2014 2013 2014 2013 2014 2013 2014 2013 %
Total portfolio
Customer lending 10,121.6 9,202.5 7,081.2 6,414.5 2,277.2 1,991.7 1,954.9 1,611.4 612.6 462.1 1,012.4 822.7 23,059.9 20,504.9 12.5
Loans and advances
to customers 9,318.9 8,585.7 6,720.8 6,219.4 1,895.6 1,783.5 1,672.3 1,427.6 600.4 458.0 888.6 728.8 21,096.6 19,203.0 9.9
Loan commitments,
guarantees
and indemnities 802.7 616.8 360.4 195.1 381.6 208.2 282.6 183.8 12.2 4.1 123.8 93.9 1,963.3 1,301.9 50.8
Number of
customers (primary
obligor groups) 280 298 153 160 51 52 45 47 13 13 43 42 585 612 –4.4
Leading role (%) 89.1 87.0 85.5 86.5 78.1 73.6 63.5 67.5 95.1 94.4 7.2 6.6 81.3 81.0 0.3 pp
Average loan-
to-value ratio (%) 68.2 77.0 70.9 70.8 54.4 54.0 72.6 70.1 n.a. n.a. 78.6 84.3 66.7 72.6 –5.9 pp
CIR (%)1) 32.9 31.7 15.6 15.7 11.3 10.1 16.1 15.7 59.6 30.5 − − 53.0 45.7 7.3 pp
ROE (%)2) 12.3 2.4 65.9 57.4 138.9 182.0 66.7 63.3 1.5 10.0 − − 8.1 10.3 –2.2 pp
New business
Number of
new transactions 84 85 61 48 25 24 17 16 15 13 11 9 213 195 9.2
Underwritten 2,710.9 2,083.3 2,348.5 1,765.6 804 508.3 562.5 434.7 215.0 62.5 342.8 181.0 6,983.7 5,035.4 38.7
Syndicated 113.3 50.9 24.7 8.1 − − − − − − − − 138.0 59.0 −
Final take 2,597.6 2,032.4 2,323.8 1,757.5 804 508.3 562.5 434.7 215.0 62.5 342.8 181.0 6,845.7 4,976.4 37.6
Leading role (%) 88.0 87.1 90.4 91.1 79.8 66.6 47.4 63.2 45.0 29.0 0.0 − 79.0 80.5 –1.5 pp
Average gross
interest margin (bp) 269 316 250 284 271 330 238 250 200 200 228 292 256 298 –42
1) Determined in accordance with IFRS – excluding the allocation of overhead expenses and before allowance for credit losses2) Determined in accordance with IFRS – excluding the allocation of overhead expenses, after allowance for credit losses, and before taxes
GROUP M A N AGE M E N T R E P OR T
REPORT ON THE ECONOMIC POSITION
Financial position and performance

72
DVB Bank SE | Group Annual Report 2014
Remuneration
Frameworks and principles
The remuneration of employees is a key staff management tool for DVB. The objectives of DVB Group’s remuneration structure are:
• to motivate each member of staff to sustainably implement the targets derived from company strategy (and, therefore, the individual targets pertaining to divisions, departments and teams), and thus to make a personal contribution towards achieving the Company’s strategic objectives;
• to reward staff performance without giving incentives for taking on undesired risk;
• to attract, motivate and retain talented employees for the Bank.
To achieve these objectives, DVB offers a fixed salary, plus – if applicable – a variable remuneration component, which is in a reasonable proportion to the fixed remuneration, and must not exceed it. (For specific employee groups, the variable remunera-tion must not exceed twice the fixed remuneration.)
During the course of regular management discussions with employees, managers discuss individual performance (covering all aspects of skills and performance). They assess any need for development derived from this analysis, and agree upon suitable support measures such as professional or personal training.
Depending on national customs, the DVB Group grants non-cash ancillary payments in addition to the salary.
Regulatory requirements for remuneration systems
With the revised German Regulation on Remuneration of Finan-cial Institutions (referred to in this section as the ”Regulation”) which came into effect on 16 December 2013, the German Fed-eral Ministry of Finance has detailed the requirements for remu-neration systems implemented by financial institutions, in the context of the German Banking Act. The Regulation applies to all employees of DVB, at all locations.
In particular, the Board of Managing Directors is responsible for compliance with the requirements pursuant to the Regulation by subordinated enterprises, to which neither section 64b of the German Act on the Supervision of Insurance Companies is applicable, in conjunction with the Regulation on Remuneration in Insurance Companies, nor section 37 of the German Capital Investment Act in conjunction with Annex II to Directive 2011/61/EU of the European Parliament and of the Council of 8 June 2011 on Alternative Investment Fund Managers and amending Directives 2003/41/EC and 2009/65/EC and Regula-tions 1060/2009/EC and 1095/2010/EU (O.J. EC No. L 174; 01 Jul 2011, p. 1).
DVB Bank SE and its affiliated companies together constitute the companies of the DVB Group. Intermediary companies without any operational activities of their own serve merely to optimise the Group’s organisational or economic structure.
The Company’s remuneration systems are based on a remunera-tion strategy that sets out uniform guidelines for Group-wide remuneration management. Subordinated enterprises compliance with the requirements of the Regulation is ascertained through uniform, Group-wide regulations governing the remuneration strategy, remuneration systems, and annual targets.

73
DVB Bank SE | Group Annual Report 2014
C ONSOL IDAT ED F IN A NCI A L S TA ME MEN T S
AUDI T OP INIONA B OU T US
Remuneration
General requirements of the Regulation
The following legal requirements apply, and have been incorpo-rated in DVB Group’s remuneration systems:
• Senior management is responsible for the appropriate struc-ture of employees’ remuneration systems.
• The supervisory body is responsible for the appropriate structure of senior management’s remuneration systems.
• The structure of the remuneration systems and the remuner-ation strategy must be aligned with the Company’s strategic objectives.
• Remuneration must be appropriate. – There must be no incentive to enter into excessive risks. – There must be no significant dependence on variable
remuneration. – Variable remuneration must provide an effective
behavioural incentive. – Negative contributions to success must impact on the
amount of remuneration. – Severance payments must not remain unchanged in the
event of negative individual contributions to success, or misconduct.
– The remuneration of control units and organisational units under control must not be materially measured using the same parameters if there is any risk of a conflict of interest.
• A guaranteed variable remuneration is only permissible upon commencement of employment, and for a maximum of one year. A corresponding guarantee is restricted in the event that (regulatory) requirements governing capital and liquidity cannot be met.
• In principle, variable remuneration is capped at 100% (or 200%) of the respective fixed remuneration.
• Determining the total amount of the variable remuneration must
– take into account the institution’s risk-bearing capacity, multi-year capital planning and financial performance;
– ensure the institution’s ability to maintain or restore ade-quate capitalisation and liquidity; and
– guarantee that the institution’s ability to maintain or restore the combined capital buffer requirements in accordance with section 10i of the German Banking Act is not compro-mised.
• The risk orientation of the remuneration must not be restricted or neutralised by way of hedging or other counter-measures. Appropriate compliance structures are mandatory.
• The control units’ staff receives an appropriate remuneration, whereby the emphasis lies on fixed remuneration.
• Remuneration of members of the Board of Managing Directors must be in line with performance and duties, and may not exceed a normal level unless there are special reasons. The assessment basis for variable remuneration components must extend over several years.
• Sufficient information must be made available about the remuneration systems.
• The institution shall set out principles governing the remu-neration systems in its organisational guidelines.
• Certain disclosure requirements must be observed.
• The Supervisory Board must be informed at least once a year about the remuneration systems and has a right to obtain information from senior management.
• A Remuneration Control Committee must be established.
GROUP M A N AGE M E N T R E P OR T
REPORT ON THE ECONOMIC POSITION

74
DVB Bank SE | Group Annual Report 2014
DVB’s remuneration systems
DVB applies a consistent remuneration system.
The remuneration of tariff employees in Germany is governed by the collective wage agreements for private and public-sector banks. As a rule, the remuneration of employees covered by col-lective wage agreements comprises 13 fixed monthly salaries (incl. special payments in accordance with Section 10 of the collective wage agreements for private banks) and a variable share. Outside Germany, employees in similar functions and positions receive a discretionary bonus, which is based on the same rules.
Non-tariff employees in Germany and comparable staff outside Germany receive a fixed, contractually agreed annual salary. In addition, a variable remuneration is granted on the basis of defined criteria. The variable remuneration is paid in April of each year for the previous year.
This structure and the corresponding bonus regulations apply to all entities within the DVB Group. The objective of the remuner-ation systems is to adequately honour employee performance and to provide effective incentives. They are structured so as to fulfil the applicable regulatory requirements.
The Remuneration Control Committee of the Supervisory Board, in cooperation with the Remuneration Officer, reviews whether DVB’s remuneration systems are appropriate, on an annual basis.
The variable remuneration component for members of the Board of Managing Directors is determined by the Supervisory Board; it is partly disbursed immediately and partly deferred, with retention periods applicable as well. DVB’s remuneration system thus ensures that legal requirements regarding sustainability are fulfilled, and that negative performance contributions are taken into account.
Specific requirements of the Regulation
Since DVB is a significant institution, as defined by the Regula-tion, the following principles also apply:
• For the purposes of determining variable remuneration, – targets set for risk takers must incorporate the overall
performance of the institution, the organisational unit and the individual;
– individual performance for risk takers must also be meas-ured on the basis of non-financial parameters;
– remuneration parameters have to be used to determine the overall performance; these take into account the objective of long-term success, in particular the risks incurred, their duration, and capital and liquidity costs;
– at least 40% of the variable remuneration for risk-takers must be spread over a minimum three-year period where remuneration must not be vested faster than on a pro rata temporis basis;
– at least 60% of the variable remuneration for members of the Board of Managing Directors and risk takers among first-level management must be deferred;
– at least 50% of the cash bonus and at least 50% of the deferral at least must depend on the institution’s sustain-able performance, and feature a withholding period;
– negative contributions to results must reduce the amount of the variable remuneration;
• Extended disclosure obligations must be observed;
• Special provisions apply for discretionary pension benefits.
Organisation and responsibilities
DVB’s Remuneration Strategy is reviewed (and adjusted if neces-sary) at least once a year. Especially in the case of any change to the business or risk strategy, the remuneration strategy and the structure of the remuneration systems must be reviewed and adjusted if necessary.
As a first step, the consistency of the remuneration strategy with the Bank’s business strategy is ascertained in coordination with Controlling. The remuneration strategy is then adopted by DVB’s Board of Managing Directors, in its capacity as the Group’s management body; finally, it is submitted to the Supervisory Board’s Remuneration Control Committee for information, and discussed if necessary.
Remuneration

75
DVB Bank SE | Group Annual Report 2014
C ONSOL IDAT ED F IN A NCI A L S TA ME MEN T S
AUDI T OP INIONA B OU T US
Remuneration system for risk takers
The definition of the term ”risk takers” was updated on the basis of amendments to the Regulation as at 16 December 2013, and the technical standards defined by the European Banking Authority.
Within the identified business divisions, all divisional heads are defined as risk takers. Further employees have been identified as risk takers below the (functional) level of divisional heads, in particular the heads of regional business units with a significant business volume.
The disbursement of bonus payments has been modified in accordance with the Regulation: only 20% of the bonus achieved will be paid out directly in the following year. The remaining 80% of the bonus will be deferred over a period of up to four years, taking into account the deferral and retention periods. All amounts deferred are linked to the long-term performance of DVB and, where applicable, the relevant business unit. Negative performance contributions are also taken into account when determining the bonus as well as the pro-rata deferral – which may lead to the variable remuneration being reduced or refused.
In the event of any material changes to the organisational structure (such as the creation or merger of divisions), DVB will review whether the number and definition of risk takers need to be changed.
Long-Term Incentive Plan
The Long-Term Incentive Plan (LTIP) is an additional (potential) component of the remuneration system. It is a growth-oriented component with a strong long-term focus. Two LTIP schemes are currently active, potentially resulting in payments.
With the LTIP, employees participate in DVB’s long-term and sustained success. At the same time, the three-year waiting period ties them to the company and its success. The Bank intends to launch further LTIPs.
Remuneration Officer
Pursuant to section 15 of the Regulation, DVB appointed a Remuneration Officer. The Officer’s duties and procedures are documented in the organisational guidelines.
Remuneration Control Committee
Pursuant to section 15 of the Regulation, DVB established a Remuneration Control Committee. The Committee’s duties and procedures are documented in its internal regulations.
Disclosure
Pursuant to section 16 of the Regulation, DVB is obliged to disclose information regarding its remuneration policy and practice. DVB’s disclosure duties, as a bank subject to Regulation 575/2013/EU (Capital Requirements Regulation – CRR), as defined in section 1 of the KWG, are based solely on Article 450 of the CRR which requires that the Bank discloses certain quan-titative and qualitative details for groups of employees whose activity has a material impact on the Bank’s risk profile (”risk takers”).
We will comply with this disclosure duty in a separate report, which will be made available on our website
www.dvbbank.com > Investors > Corporate Governance during the second quarter of 2015.
GROUP M A N AGE M E N T R E P OR T
REPORT ON THE ECONOMIC POSITION
Remuneration

76
DVB Bank SE | Group Annual Report 2014
Shipping Finance
saw a decline in tonnage. As a result, charter and freight rates – as well as asset values – remained under pressure.
Container ships
In 2014, global sea container transport volumes increased by approximately 5% (2013: approximately 4%). Liner operators continued to adopt a cautious stance when chartering tonnage in 2014, which is reflected in the development of time charter rates. The Clarksons time charter rate index for container carriers, which has been calculated since 1993, remained steady at 47 index points on a monthly basis throughout the year 2014 (average 2013: 46 index points). The business environment for container shipping deteriorated significantly since the global financial crisis in 2008–2009. The container vessel time charter index still averaged 92 index points during 2008 – but, triggered by the collapse of Lehman Brothers in September 2008, it tumbled to an average of just 35 index points for 2009. Having recovered to average 51 index points for 2010 and 63 index points for 2011, the index value has fallen back to an annual average of 42 index points to 47 index points between 2012 and 2014.
2014 has been characterised by a cautious improvement in market conditions – for most shipping sectors and the financial markets. Despite the increased financing competition and client prepayment levels, we have maintained support for our clients by working in part-nership with them, whilst applying our in-depth market expertise, and an ingrained risk management approach, in order to sustain a firm financial performance for the year.
Shipping Finance – Market review
Sections of maritime shipping continued to be characterised by excess capacity during 2014. This mainly affected container carriers, crude oil tankers and dry bulk carriers – measured in terms of transport volumes and services, these are the three most important segments in maritime shipping. The persistent excess capacity was caused by the fact that rising demand was countered by even stronger supply growth, due to new tonnage pushing onto the market although the crude oil tanker segment
60,000
50,000
40,000
30,000
20,000
10,000
0
Dec 2004
Dec 2005
Dec 2006
Dec 2007
Dec 2008
Dec 2009
Dec 2010
Dec 2011
Dec 2012
Dec 2013
Dec 2014
210
175
140
105
70
35
0
Feedermax 725 TEU Handymax 1,700 TEU Sub-Panamax 2,750 TEU Panamax 4,400 TEU Time Charter Rate Index Source: Clarkson Research Services Ltd, January 2015
Container subsector charter rates
Time charter rate Time charter rate (US$/day) index (points)

77
DVB Bank SE | Group Annual Report 2014
C ONSOL IDAT ED F IN A NCI A L S TA ME MEN T S
AUDI T OP INIONA B OU T US
Shipping Finance
Crude oil tankers
As per the International Energy Agency’s mid-term 2015 report, world oil demand grew 1.1% year-on-year. Demand from emerg-ing markets remained higher, while energy demand in Europe and the Americas declined. Despite positive developments in demand for tanker shipping, and fleet oversupply has eased during 2014 while ordering has also been slowing down, the recorded influx of vessels delivered during 2009–2011 still maintains pressure on the crude tanker market.
Dry bulk carriers
The year started with huge optimism for a much awaited recovery in the dry bulk market, especially after the positivity of 2013. Unfortunately, as cautioned by DVB in its multiple reports, it was a false hope and the year ended in despair. The global macro-economic picture was not much supportive with downward revisions made to gross domestic product (GDP) growth rates for almost all major economies except the US and India. GDP growth in China, the biggest driver of dry bulk market, is expected to slow down to 7.4% during 2014. Preliminary figures indicated that overall dry bulk demand grew at a robust pace of 4.6% although it was significantly lower than the 9.0% growth seen in 2013. At the same time, the dry bulk fleet grew by 7% leading to further deterioration of demand-supply fundamentals. As a result, the Baltic Exchange Dry Index (BDI) – the freight rate index for the transportation of dry bulk goods – continued to slide lower throughout the year. The year started on 2 January 2014 at 2,113 points which was also the high point of the year. The BDI closed out the year on 24 December 2014, the last day of index
quotation, at a mere 782 points. This was very close to the low point of the year of 723 points reached on 22 July 2014. Due to the positivity at the beginning of the year, the average for the BDI for the whole of 2014 was 1,105 points. In spite of all the negative sentiment near the year end, the whole year was not much worse than 2013 in earning terms. The dry bulk market has struggled to remain profitable on a sustained basis since 2008. The extent of the current shipping crisis is illustrated by a comparison of yearly BDI averages: after 6,413 index points for 2008, the BDI fell to an average of just 2,617 index points in 2009. An average level of 2,758 index points for 2010 was followed by further decreases in 2011 (1,549 index points) and 2012 (920 index points). There was some respite in 2013 where the BDI averaged 1,206 index points over the year. Unfortunately, the troubles of the dry bulk market continue to be driven by supply in spite of improving demand fundamentals.
Thus, vessel values once again failed to recover, and even faced further downward pressure for some asset types. Given the importance of these three market segments for world transpor-tation volumes, the fact that container, crude oil and bulk carriers represented less than 60% of DVB Group’s broadly-diversified Shipping Finance portfolio made the exposure quite balanced.
Further details on shipping market developments in 2014 can be found on DVB’s website www.dvbbank.com >
Business & Expertise > Shipping Finance > Markets.
GROUP M A N AGE M E N T R E P OR T
DEVELOPMENT OF THE BUSINESS DIVISIONS

78
DVB Bank SE | Group Annual Report 2014
Shipping Finance
• Corporate Finance Solutions, supporting our clients in identify-ing new and diverse sources of funds in the capital markets, and accessing those funds on favourable terms; as well as providing M&A and restructuring advice as well as arranging debt and equity financings;
• Private Equity Sourcing & Investments via Shipping & Inter-modal Investment Management, managing investment in shipping companies and assets; and
• Asset & Market Research, with a core focus on the shipping market, producing high-quality independent research to support our strategy and activities.
Since 1 January 2014 the Shipping Finance division has consisted of three sector teams: the Container, Car Carrier, Intermodal & Ferry Group, the Tanker Group (through the combination of the Chemical, LPG & Product Tanker Group with the Crude Oil & LNG Tanker Group to realise synergy benefits), and the Dry Bulk Group. The Cruise Group portfolio will be run down, meaning that DVB no longer originates new business in this sector. The three existing client coverage teams are strategically located in Amsterdam, Athens, Hamburg, London, New York, Oslo/Bergen and Singapore.
Shipping Finance – Strategy
DVB’s shipping client base consists of both public and private companies varying from large multinational enterprises to smaller single-purpose asset-owning companies. It also comprises financial investors with established track records in the shipping sphere. To these clients, our Shipping Finance division offers specialised financing solutions based on our in-depth knowledge of the assets, sectors and industry drivers. During 2014, the business division has pursued its strategic objectives of
• enhancing the quality of its client base and portfolio through its ongoing critical approach to client selection and risk management; and
• utilising the core of asset-secured lending together with an understanding of corporate credit, and thus developing financing solutions that draw upon a broader product tool kit. This enables Shipping Finance to offer clients a seamless one-stop shop and further improve sustainable revenue diversifi-cation.
Accordingly, our Shipping Finance clients can today readily draw upon the following range of products in order to fulfil their differing requirements:
• Structured Asset Financing, comprising traditional asset-/project-based financing – mostly post-delivery financings with full recourse to a substantial obligor;
• Risk Distribution, syndicating portions of the lending volume to other financial institutions on the international banking market;
Shipping Finance – Three global sectors
1 Container, Car Carrier, Intermodal & Ferry Group (container vessels, container boxes, car carriers, reffers, ferries and RoRo’s)
2 Tanker Group (crude oil and LNG1) tankers as well as chemical, specialist, LPG2), product and asphalt/bitumen tankers)
3 Dry Bulk Group (dry cargo, combination and bulk carriers)
1) Liquefied Natural Gas 2) Liquefied Petroleum Gas

79
DVB Bank SE | Group Annual Report 2014
C ONSOL IDAT ED F IN A NCI A L S TA ME MEN T S
AUDI T OP INIONA B OU T US
Shipping Finance
DVB launched the ”Unity” project in 2012, in order to enhance process efficiency in the Shipping Finance and Offshore Finance business. The principle aim of Unity was to implement a mode of operation that would enable a greater alignment between the key performance indicators of the Aviation Finance, Shipping Finance and Offshore Finance divisions. The Unity project was successfully completed at the end of 2014. As a result, a Euro-pean hub was created in Amsterdam, to centralise the European credit team, and in London, to centralise the Shipping Finance and Offshore Finance loan administration in Transaction & Loan Services. Also execution managers and transaction managers were introduced who support the client coverage teams in Europe and individually focus on managing our clients’ transactions.
Our in-depth industry, market and asset knowledge shapes the strategy and activities we pursue in Shipping Finance. The Ship-ping & Offshore Research department supports and enhances this course: it provides valuable, up-to-date market intelligence, and produces high-quality, independent research – all of which enable DVB to anticipate market changes and adjust the business segment and portfolio strategy in a flexible and timely fashion. This focus on research underpins our sector-oriented client coverage teams working in unison. As a result, our relationship managers have a profound understanding of our clients’ strategic financing needs, in addition to specific sector asset, industry driver and value chain knowledge.
Risk management is central to Shipping Finance’s client selection strategy and extension of loans. DVB’s risk management plat-form constantly monitors and proactively manages risk whilst continuously strengthening its early warning and risk manage-ment policies and procedures for its €10.1 billion portfolio of shipping loans. The Bank has significant expertise with restruc-turing and work-out situations. Those cases have been success-fully managed by the Strategic Management and Restructuring Team, which reports directly to the Chairman of the Board of Managing Directors and which is aligned with the Shipping Credit department.
A prerequisite for DVB’s continued success is co-operation amongst a team of professionals with a multi-disciplined back-ground. As well as staff experienced in banking and structured finance, Shipping Finance employs individuals with specific ship-ping industry expertise gathered from a prior background with shipping companies, lessors, ship management companies, sale and purchase/chartering brokers, manufactures and export credit agencies. An asset-based focus, market knowledge, coupled with our commitment to long-term relationships, bring us closer to our clients and solidify our reputation as a trusted partner in Shipping Finance.
GROUP M A N AGE M E N T R E P OR T
DEVELOPMENT OF THE BUSINESS DIVISIONS

80
DVB Bank SE | Group Annual Report 2014
Shipping Finance
Total loan portfolio
In 2014 the euro-based Shipping Finance customer lending volume increased by 9.8%, to €10.1 billion (previous year: €9.2 billion). Due to the fact that 93.3% of its customer lending is denomi-nated in US dollars though, a year-on-year comparison in US dollar terms reflects the business development of Shipping Finance more accurately. Here the loan portfolio decreased by 3.1%, to US$12.3 billion (previous year: US$12.7 billion). Despite very strong loan production the portfolio shrank because of higher pre- and repayments amounting to 32%. The granularity of the Shipping Finance portfolio was good, with the average lending exposure per client standing at €36.1 million (€30.9 million in 2013). The number of clients where exposure exceeded €50 million totalled 64 at year-end 2014 versus 56 clients at year-end 2013.
Shipping Finance – Portfolio analysis
DVB is known as a leading arranger, underwriter and provider of asset-based capital in shipping finance. During a year of increased bank and capital market liquidity in most segments resulting in increased prepayments, DVB has maintained its lending volumes whilst undertaking a prudent risk posture.
Tankers 43.4%
thereof:
13.0% Crude oil tankers
11.3% Product tankers
10.7% Gas tankers
8.4% Chemical tankers
Bulk carriers 25.4%
Container carriers 16.8%
Container boxes 3.7%
Cruise ships 3.0%
Ferries/
passenger vessels 2.9%
Others 4.8%
thereof:
3.1% Car carriers
0.5% General cargo
0.1% Reefers
0.1% Roll-on/Roll-off vessels
1.0% Miscellaneous
Shipping Finance portfolio by vessel type
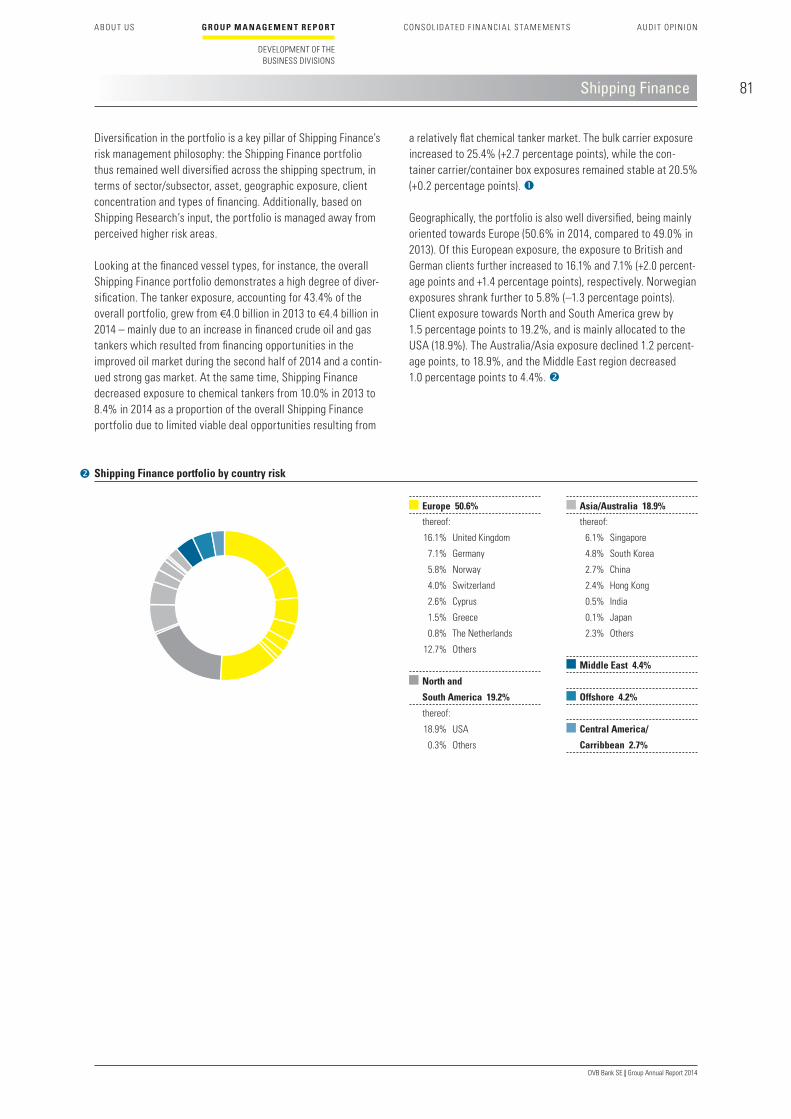
81
DVB Bank SE | Group Annual Report 2014
C ONSOL IDAT ED F IN A NCI A L S TA ME MEN T S
AUDI T OP INIONA B OU T US
Shipping Finance
Diversification in the portfolio is a key pillar of Shipping Finance’s risk management philosophy: the Shipping Finance portfolio thus remained well diversified across the shipping spectrum, in terms of sector/subsector, asset, geographic exposure, client concentration and types of financing. Additionally, based on Shipping Research’s input, the portfolio is managed away from perceived higher risk areas.
Looking at the financed vessel types, for instance, the overall Shipping Finance portfolio demonstrates a high degree of diver-sification. The tanker exposure, accounting for 43.4% of the overall portfolio, grew from €4.0 billion in 2013 to €4.4 billion in 2014 – mainly due to an increase in financed crude oil and gas tankers which resulted from financing opportunities in the improved oil market during the second half of 2014 and a contin-ued strong gas market. At the same time, Shipping Finance decreased exposure to chemical tankers from 10.0% in 2013 to 8.4% in 2014 as a proportion of the overall Shipping Finance portfolio due to limited viable deal opportunities resulting from
a relatively flat chemical tanker market. The bulk carrier exposure increased to 25.4% (+2.7 percentage points), while the con-tainer carrier/container box exposures remained stable at 20.5% (+0.2 percentage points).
Geographically, the portfolio is also well diversified, being mainly oriented towards Europe (50.6% in 2014, compared to 49.0% in 2013). Of this European exposure, the exposure to British and German clients further increased to 16.1% and 7.1% (+2.0 percent-age points and +1.4 percentage points), respectively. Norwegian exposures shrank further to 5.8% (–1.3 percentage points). Client exposure towards North and South America grew by 1.5 percentage points to 19.2%, and is mainly allocated to the USA (18.9%). The Australia/Asia exposure declined 1.2 percent-age points, to 18.9%, and the Middle East region decreased 1.0 percentage points to 4.4%.
Europe 50.6%
thereof:
16.1% United Kingdom
7.1% Germany
5.8% Norway
4.0% Switzerland
2.6% Cyprus
1.5% Greece
0.8% The Netherlands
12.7% Others
North and
South America 19.2%
thereof:
18.9% USA
0.3% Others
Asia/Australia 18.9%
thereof:
6.1% Singapore
4.8% South Korea
2.7% China
2.4% Hong Kong
0.5% India
0.1% Japan
2.3% Others
Middle East 4.4%
Offshore 4.2%
Central America/
Carribbean 2.7%
Shipping Finance portfolio by country risk
GROUP M A N AGE M E N T R E P OR T
DEVELOPMENT OF THE BUSINESS DIVISIONS
82
DVB Bank SE | Group Annual Report 2014
Shipping Finance
• Oceanus – Sole arranger of a syndicated facility (with Export Credit Agency – ECA – support) for the financing of four newbuilding LNG carriers ordered by Oceanus, a joint venture holding company owned 14.3% by George Economou and 85.7% by the US private equity firm Matlin Patterson. The facility consists of a commercial tranche, a KEXIM funded tranche and a KEXIM guaranteed tranche. The Oceanus deal is unique: it was the first transaction whereby the ECAs in Korea accepted no fixed employment for LNG carriers from the draw-down of the transaction.
• D8 Product Tanker Investment – Arranger and co-ordinator of a club deal for a post-delivery senior debt financing of the first eight LR2 product tankers (out of total 30 new building LR1/2 product tankers) ordered by D8 Product Tanker Invest-ment LLC – a Navig8 joint venture company. DVB’s Shipping & Intermodal Investment Management has invested 6.15% as part of the joint venture and Navig8 is one of our Tanker Group’s longest standing clients.
• Caravel – DVB in its capacity as Facility Agent and Security Trustee was mandated by AM Nomikos to lead a sizeable, high-profile transaction for Caravel. The transaction was in relation to the financing of five vessels, namely one Supramax bulk carrier built in Japan in 2012 and four newbuilding Ultra-max bulk carriers currently under construction in China, with deliveries in 2015. This transaction enables us to further strengthen our excellent relationship with an internationally recognised shipowner and one of the most prominent names in Greek shipping.
New business
Loan portfolio development
During 2014, Shipping Finance realised 84 new transactions with shipping clients representing a strong new final-take volume of €2.6 billion (previous year: 85 new transactions with a final-take volume of €2.0 billion). New financings in 2014 were well diver-sified by client and obligor, as well as by vessel type. Almost half (48.2%) of new business was for the financing of tankers, with an almost even share of between gas (LPG and LNG) and crude oil tankers (17.9% and 17.7%, respectively). This slightly biased weighting towards the tanker segment – which only accounted for 32.8% of new financings in 2013 – is due to improved conditions in the crude oil tanker market during the second half of 2014 and a continuously strong gas market. Although the bulk and container markets are still problematic, there are signs of improvement on the horizon. Some of our clients were ready to place new orders – mostly for new and more fuel-efficient assets, at low prices. Thus, bulk carrier new busi-ness grew to 27.6% from 24.7% in 2013, and the container carrier/container box origination decreased to 19% from 25.4% in 2013.
We concluded these new deals with both established and first-time clients. Some significant 2014 transaction highlights were:

83
DVB Bank SE | Group Annual Report 2014
C ONSOL IDAT ED F IN A NCI A L S TA ME MEN T S
AUDI T OP INIONA B OU T US
Shipping Finance
Deal of the Year 2014
China Shipping Container Lines (CSCL) is the seventh-largest container liner operator globally. Listed in Shanghai and Hong Kong, CSCL is controlled by China Shipping Group, which is the second-largest shipping conglomerate in China and wholly-owned by the Chinese government. CSCL started as a coastal and short-sea liner service provider in 1997, and developed steadily through continuous organic growth to become a world container shipping giant. Today, CSCL domestic and international liner services cover more than 100 countries whilst maintaining a strong cornerstone footing in the domestic market. China Shipping Group and its subsidiaries – including CSCL – are amongst DVB’s key clients.
In September 2014, our Shipping Finance division structured and lead-arranged a senior debt post-delivery financing facility for CSCL to finance 70% of two 19,000 TEU new building container vessels. The vessel deliveries were scheduled for November and December 2014. The entire facility is 95% covered by K-sure with full repayment in twelve years. Whilst DVB acts as facility co-ordinator, arranger, facility agent and ECA agent in the trans-action, we invited Credit Suisse to join as arranger and under-writer of 50% of the facility. In addition, this ECA-covered trans-action is evidence of ongoing good co-operation between DVB and DZ BANK’s export finance team.
The vessels themselves have an overall length of 400 metres each, and beam of 59 metres – thus making them the largest container vessels ever built. These vessels were ordered in 2013 at lower cost than CSCL’s competitors. As shipping lines reach for economies of scale, there is an industry-wide shift to larger vessels. The financed vessels consume 20% less fuel than com-mon 10,000 TEU container vessels currently afloat. The move towards larger and more fuel-efficient vessels is also being driven by expanded alliances that allow liners to boost yields by sharing share space on each other’s vessels. The 19,000 TEU vessels provide CSCL and its alliance partners with the necessary assets to operate in the current, highly competitive market envi-ronment.
This is the second high-profile transaction we lead-arranged for CSCL, after the syndicated container box sale-and-lease-back facility in December 2012. The successful closing of the recent transaction further strengthened our close relationship with CSCL and its parent company China Shipping Group. In addition, it enhances our sound track record as a leading shipping financier in Asia as we were mandated amidst strong competition from international banks including Citigroup, Bank of America, DNB, BNP Paribas, Australia and New Zealand Banking Group, etc.
Shipping Finance – Deal of the Year 2014
GROUP M A N AGE M E N T R E P OR T
DEVELOPMENT OF THE BUSINESS DIVISIONS

84
DVB Bank SE | Group Annual Report 2014
Shipping Finance
Risk management
Shipping Finance has built a strong risk culture, which starts with our client-facing relationship managers and continues through each stage (including Shipping & Offshore Credit, Shipping & Offshore Research and Credit Committee assessments) until a new commitment is granted and continues thereafter throughout the term of the relevant exposure through constant vigilance, thorough loan management and continuous monitoring of the overall portfolio health.
At the heart of our consideration for each new exposure is the New Deal Committee, which meets to discuss each possible new transaction at an early stage, with a view to spotting risk and structural deficiencies – finally arriving at a consensus, be it positive or negative. The committee comprises the Member of the Board of Managing Directors responsible for Shipping Finance and Offshore Finance, the Head of Shipping & Offshore Credit and the Head of Shipping & Offshore Research. The research department is fully involved in the credit process, providing market research, commentary and research on all the technical aspects of the respective assets, in order to flag any possible negative effects on the tradability and value of the assets under consideration for financing. Only those transactions authorised by the New Deal Committee will move to the next stage, being presented to Shipping & Offshore Credit Committee. Over certain thresholds, some deals will require further approval from the Board of Managing Directors and (in few cases) from the Super-visory Board’s Credit and Risk Committee.
Once a transaction has been booked, it is monitored for any required action on an ongoing basis by the respective relationship manager and credit officer, and through the review and stress test process. Frequent client calls take place with the obligatory involvement of credit officers in order to further elevate the risk dialogue with our clients. We undertake the stress testing procedure (stressing probability of default and valuations) on a quarterly basis, with the results feeding into discussion with clients. In addition, there are continuous event-driven rating updates and reviews of the portfolio to refresh ratings and values.
Earnings contributions
Despite the positive development of new business, net interest income was down 15.3%, to €78.0 million (previous year: €92.1 million), as a result of risk-adequate, yet much lower inter-est margins (2014: 269 basis points; 2013: 316 basis points). The need to recognise impairments reduced thanks to slowly stabilis-ing market conditions in some segments of the maritime shipping industry. Allowance for credit losses thus amounted to €37.8 million, a decrease of 49.5%. Total allowance for credit losses in Shipping Finance was €122.0 million in 2014, compared to €131.7 million at the end of 2013. This level of provisioning still represents a necessary cushion for potential losses. Due to lower allowance for credit losses and slightly decreased admin-istrative expenses, results and net segment income before taxes both went up to €85.6 million and €38.5 million, respectively.
Extract from Shipping Finance’s segment report
€ mn 2014 2013 %
Net interest income1) 78.0 92.1 –15.3
Allowance for credit losses1) –37.8 –74.9 –49.5
Net interest income after
allowance for credit losses 40.2 17.2 –
Net fee and
commission income 41.3 45.0 –8.2
Results (excluding
the IAS 39 result)1) 85.6 44.1 94.1
General
administrative expenses2) –37.4 –38.6 –3.1
Net segment income
before taxes 38.5 9.5 –
1) The retrospective first-time application of IFRS 10 led to an adjustment of the previous year’s figure.
2) Only those costs are allocated to DVB’s operating business divisions for which they are directly responsible. General costs of operations, overheads, or, for example IT costs, are not allocated to the operating business divisions.

85
DVB Bank SE | Group Annual Report 2014
C ONSOL IDAT ED F IN A NCI A L S TA ME MEN T S
AUDI T OP INIONA B OU T US
Shipping Finance
The Strategic Management & Restructuring Team of restructur-ing and work-out specialists is fully involved in the stress testing of the portfolio. If appropriate, an exposure is taken on to Early Warning List, Closely Monitored List, or Watch List reporting. In addition to the rigid call report discipline in place, the ongoing management of risk is aided by a full portfolio review by Shipping Finance senior management, to proactively identify concrete actions to be taken. The Strategic Management & Restructuring Team provided dedicated support on all stressed/distressed loans, and managed all exposures on the Watch List report.
The above-mentioned protocols are geared towards flagging possible problems early, and allocating adequate resources to assess, quantify, qualify and formulate an appropriate and swift response. In 2014 we have taken swift action in response to any covenant breaches (value maintenance clauses and otherwise). The vessel values were monitored diligently to establish impend-ing VMC breaches quickly. To further illustrate the point: during 2014 a total of 36 transactions had a VMC breach. Of those, twelve transactions were repaired, 19 transactions were waived, and five still had an outstanding value maintenance clause breach. The total funds required to repair the outstanding value maintenance clause breaches equal €15.6 million. At the end of 2014, 3.3% of the loan portfolio was on the Closely Monitored List (2013: 4.3%). 11.0% of the portfolio was on the Watch List (2013: 11.6%), and 1.9% of the portfolio was classified as special credits (2013: 2.3%) subject to close monitoring and a formal monthly review. Moreover, 5.1% of the portfolio is being dis-cussed by the Early-Warning Risk Management Forum.
The loan-to-value ratio, one key metric of loan performance, developed in Shipping Finance as follows: the average ratio at the end of 2014 was 68.2% compared to 77.0% at the end of 2013.
With DVB’s risk management infrastructure, Shipping Finance will continue to take whatever steps are necessary to safeguard its position as a secured lender in all cases.
Shipping Finance – Outlook 2015
Market outlook 2015
In 2015, excess supply is expected to persist for the three major maritime shipping segments, since the increase in capacity is set to once again outpace demand growth. We expect to see an increase in deliveries this year which will add to the pressure being faced by container, crude oil tanker and dry bulk markets.
The outlook for container shipping demand is jittery, with 2015 unlikely to mimic the double-digit demand growth seen in 2003–2008. The Asia-Europe trade route, which is the largest cash generator for liner operators and thus the most important trade route, faces uncertainty over trade prospects amid bearish eco-nomic news in both Asia and Europe. The 18-nation euro zone is hovering on the brink of recession with the euro at a multi-year low against Asian currencies. China’s economy is slowing – though it is still above 7%, according to 2015 forecasts – but crucially for liners, new export orders are contracting and manu-facturers are looking inward to the domestic market. Given the general uncertainty, liners will be wary of chartering in tonnage, specifically Post Panamax and smaller ships, for long periods of time. The uncertainty surrounding Panamax and smaller tonnage is compounded by Panama Canal’s expansion, expected to be completed early 2016. The expansion will result in Panamax vessels being cascaded out on Asia-East coast US routes by Super Post Panamax and larger vessels. As a result, time charter rates of smaller tonnage are expected to remain around low levels for most of 2015. The weak market situation during 2015 will be exacerbated by the supply of new larger capacity vessels coming into service which were ordered in previous years. The new built Super Post Panamax and smaller VLCS are expected to be deployed not only in long-haul routes but also in medium-haul routes such as Asia-Middle East. Liners will remain focused on lowering their unit slot costs on all possible routes by moving in larger ships and cascading out smaller ships. However, barriers such as port restrictions and need for frequent port calls in short-haul trades will limit deployment of larger vessels in all trade routes and provide marginal relief to owners of smaller tonnage. It is to be noted that in case of smaller tonnage the
GROUP M A N AGE M E N T R E P OR T
DEVELOPMENT OF THE BUSINESS DIVISIONS

86
DVB Bank SE | Group Annual Report 2014
Shipping Finance
markets rose, demand from Europe and the Americas declined. Despite slippage of some scheduled deliveries, the low scrapping rate combined with new deliveries continued to be a setback with the increase in capacity exceeding the growth in demand. The tonnage expansion during the past half decade has reduced the average age of the fleet tremendously that 63% of the current fleet is younger than ten years of age. Even though the ordering decreased in the past couple of years, oversupply is expected to continue for 2015. The excess in crude tanker supply will maintain pressure on freight and time charter rates as well as on crude tanker asset values. Freight rates continued to show great volatility, especially during the last quarter of the year. This is most likely to be repeated in 2015. Despite the slowing down in ordering activities, fleet oversupply remains one of the causes that will keep freight rates under pressure. Asset values have slightly increased during 2014, and it is expected to increase marginally in the coming year.
The outlook for the dry bulk market remains challenging, with an anticipated decline in demand as the Chinese economy rebalances and at the same time an acceleration in the new-builds entering the market. The scheduled deliveries for 2015 stand at close to 76 million dwt followed by another 60 million dwt in 2016. This is the highest number of newbuild deliveries scheduled to enter the market since 2012. Although there will be slippage, a substantial amount of tonnage is still likely to enter the market. Coupled with slowing demand, we do not expect the fortunes of dry bulk owners to improve substantially, seasonal spikes notwithstanding. The ratio of capacity on order to aggregate existing fleet capacity – measured in dwt – increased from 18.5% in 2013 to 21.1% in 2014 (see chart ). In this con-text, it is worth noting that there is significant upsizing across all subsectors with bigger and more fuel-efficient designs within
combined impact of low contracting, high levels of scrapping and trade growth had resulted in brief periods of positive sentiment for certain smaller segments in 2014, a phenomenon likely to repeat in 2015. For instance, new regions for Panamax tonnage include trade routes to/from West Africa where ports can now accommodate gearless tonnage as well as Chinese coastal trades. At the end of 2014 and in early 2015, the ratio of capacity on order to aggregate existing fleet capacity – measured in Twenty-foot Equivalent Units (TEU) – was 18%. In other words, the total order backlog for new container carriers was equivalent to 18% of the existing fleet (see chart ). Given the low average age of the worldwide container carrier fleet – 70.6% of the aggregate TEU capacity is younger than ten years – the potential for scrapping is lower than in other maritime shipping segments. Also with bunker prices at relatively low levels, owners of older fuel-inefficient tonnage will postpone their demolition plans. Hence, scrapping is not expected to provide any significant relief on the supply side.
The tanker market is currently experiencing a temporary ’rebound’, benefitting by the low oil price which is leading to contango, stocking up of oil reserves and use of tankers as floating storage which eventually is leading to a stronger demand for crude tankers than supported by fundamentals. This temporary situation will decrease with an increase in oil prices and should therefore be considered as a temporary chock to the fundamental supply demand balance. Nevertheless, although fleet oversupply has eased during 2014 while ordering of new vessels has been slow-ing down and deliveries have decreased, the recorded influx of vessels delivered during the economic boom still maintains pressure on the crude tanker market. According to the Inter-national Energy Agency, world crude oil demand increased by nearly 1% over the last year. Whilst imports from emerging
Ratio of capacity on order to aggregate existing fleetContainer vessels Current 18,210,300
(capacity in TEU) Ordered 3,279,500 18.0%
Crude oil tankers Current 390,700
(capacity in 000’s dwt) Ordered 50,100 9.3%
Bulk carriers Current 731,600
(capacity in 000’s dwt) Ordered 154,000 21.1%
Source: DVB Shipping Research, December 2014
Ship orders – ratio of order backlog to existing fleet capacity

87
DVB Bank SE | Group Annual Report 2014
C ONSOL IDAT ED F IN A NCI A L S TA ME MEN T S
AUDI T OP INIONA B OU T US
Shipping Finance
the Ultramax and Newcastlemax segments continuing to attract the most interest. It remains to be seen if these more expensive vessels will be able to give the expected return on equity to the owners, especially given the current low-price environment which is expected to persist in the near term. The average age of the dry bulk fleet is 9.5 years, with more than 70% of the vessels less than ten years of age. Possibly reducing demand, persistent oversupply of young tonnage coupled with a large orderbook is likely to keep the overall asset values and earnings low during 2015. We do expect some improvement in the second half due to seasonality.
Portfolio outlook 2015
During 2014 we have seen an influx of increased liquidity from banks (including regional banks) and the capital markets. The tendency for many of our competitors remains towards a ”flight to quality” and a focus on corporate-based lending which has caused pressure on pricing and other terms. We anticipate this will continue into 2015.
DVB continues to experience a healthy level of demand for its risk capital and services. Shipping Finance will continue to utilise its expertise to steer deployment of our resources – a theme which will continue into 2015. It is this expertise that will guide our decisions on where to employ our risk-weighted assets going forward. We will continue to pursue our strategy of enhancing our client base, and being a partner of choice for clients when developing financial solutions to meet their needs. Therefore, each of the sector groups will continue to focus on predetermined reputable clients and prospects covering the top 20 companies in each segment.
In its Structured Asset Finance activity for 2015, Shipping Finance targets further modest growth, whilst maintaining the quality of loan assets and without compromising the risk-reward profile. As a result, we will still continue to consider more project-related transactions, conservatively structured and with cash flow visi-bility – these deals will be pursued on a selective basis to main-tain our lending franchise. The average loan margin of such business may indeed decline further, based on continuing cost-of-liquidity improvements and an expectation of increased com-petition persisting throughout the year. However, we are confident of an increasing level of demand for our shipping services, most notably our advisory and capital markets services, that will further strengthen our franchise.
Into 2015, Shipping Finance will further optimise its resources and continue to monitor its risk positions relentlessly. The busi-ness division continues to strive to be a strategic partner to its clients for the mutual benefit to the Bank and its clients.
GROUP M A N AGE M E N T R E P OR T
DEVELOPMENT OF THE BUSINESS DIVISIONS

88
DVB Bank SE | Group Annual Report 2014
Aviation Finance
of 4.1% average annual growth in demand for air connectivity during the coming 20 years. Even air cargo made a comeback during 2014, with a growth in revenue tonne kilometres of 4.4% (previous year: 1.4%). In terms of the 2014 financial results, the International Air Transport Association adjusted its projections upwards from US$18 billion net profit in June to US$19.9 billion in the adjusted December outlook. Clearly, the main driver for this improvement was the fairly spectacular drop in the price of crude oil. Longer term, airlines should benefit from a low oil price environment but short term several carriers reported – sometimes significant – book losses on their fuel hedges.
Despite traffic growth figures and the aggregated financial results looking strong, not all airlines are doing well. Traditional European flag carriers continued to feel the pressure of strong Middle Eastern competitors and from local low-cost carriers. Cost reduction programmes proved difficult to implement and some flag carriers seem to fundamentally review their business models. North America had a banner year, with airline consoli-dation resulting in only a limited number of major carriers sur-viving. These clearly control the market. Despite existence of a
Against the background of heightened competition across the capital spectrum, the Aviation Finance division was up to the challenge, and posted sound financial results. A good performance in 2014 was based upon the completion of €2.3 billion of new structured lending business, and contained valuable contributions from our advisory and aircraft asset management businesses.
Aviation Finance – Market review
Traffic growth and airline profitability
After an already positive previous year, the state of the commer-cial aviation industry remained strong in 2014. Despite economic uncertainties, political unrest and unfortunately some tragic incidents, the industry once more enjoyed relatively strong traffic growth. The International Air Transport Association reported a 5.9% growth in total revenue passenger kilometres for 2014 on a year-on-year basis. This compares favourably to its projections
Traffic growth per region
Year-on-year Regional order booktraffic growth as % of regional(%) in-service fleet
15
12
9
6
3
0
6.7
0.3
Africa
7.1
5.4
Asia/Pacific
5.8
2.0
Europe
6.4
0.1
Latin America
12.6
11.0
Middle East
2.4 2.7
North America
5.9
4.5
Total
100
80
60
40
20
0
Total freight tonne kilometres 2014 vs. 2013 Total revenue passenger kilometres 2014 vs. 2013
Regionla jet backlog as % of in-service fleet Source: International Air Transport Association, February 2015
19.7
55.2 53.7 45.2
92.8
43.4
59.6
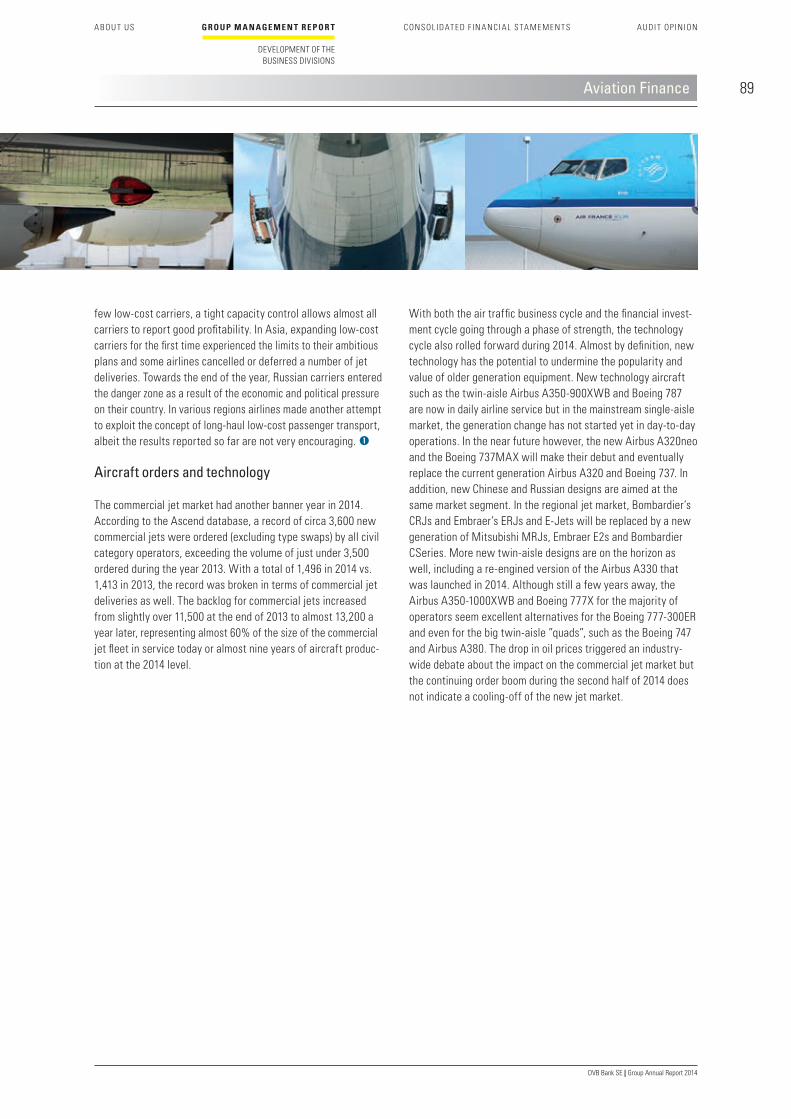
89
DVB Bank SE | Group Annual Report 2014
C ONSOL IDAT ED F IN A NCI A L S TA ME MEN T S
AUDI T OP INIONA B OU T US
Aviation Finance
few low-cost carriers, a tight capacity control allows almost all carriers to report good profitability. In Asia, expanding low-cost carriers for the first time experienced the limits to their ambitious plans and some airlines cancelled or deferred a number of jet deliveries. Towards the end of the year, Russian carriers entered the danger zone as a result of the economic and political pressure on their country. In various regions airlines made another attempt to exploit the concept of long-haul low-cost passenger transport, albeit the results reported so far are not very encouraging.
Aircraft orders and technology
The commercial jet market had another banner year in 2014. According to the Ascend database, a record of circa 3,600 new commercial jets were ordered (excluding type swaps) by all civil category operators, exceeding the volume of just under 3,500 ordered during the year 2013. With a total of 1,496 in 2014 vs. 1,413 in 2013, the record was broken in terms of commercial jet deliveries as well. The backlog for commercial jets increased from slightly over 11,500 at the end of 2013 to almost 13,200 a year later, representing almost 60% of the size of the commercial jet fleet in service today or almost nine years of aircraft produc-tion at the 2014 level.
With both the air traffic business cycle and the financial invest-ment cycle going through a phase of strength, the technology cycle also rolled forward during 2014. Almost by definition, new technology has the potential to undermine the popularity and value of older generation equipment. New technology aircraft such as the twin-aisle Airbus A350-900XWB and Boeing 787 are now in daily airline service but in the mainstream single-aisle market, the generation change has not started yet in day-to-day operations. In the near future however, the new Airbus A320neo and the Boeing 737MAX will make their debut and eventually replace the current generation Airbus A320 and Boeing 737. In addition, new Chinese and Russian designs are aimed at the same market segment. In the regional jet market, Bombardier’s CRJs and Embraer’s ERJs and E-Jets will be replaced by a new generation of Mitsubishi MRJs, Embraer E2s and Bombardier CSeries. More new twin-aisle designs are on the horizon as well, including a re-engined version of the Airbus A330 that was launched in 2014. Although still a few years away, the Airbus A350-1000XWB and Boeing 777X for the majority of operators seem excellent alternatives for the Boeing 777-300ER and even for the big twin-aisle ”quads”, such as the Boeing 747 and Airbus A380. The drop in oil prices triggered an industry-wide debate about the impact on the commercial jet market but the continuing order boom during the second half of 2014 does not indicate a cooling-off of the new jet market.
GROUP M A N AGE M E N T R E P OR T
DEVELOPMENT OF THE BUSINESS DIVISIONS

90
DVB Bank SE | Group Annual Report 2014
Aviation Finance
Aviation Finance – Strategy
DVB features a unique Aviation Finance platform, which has been meticulously built with a view to being a constant provider of aviation capital and services during different economic cycles. This strategy is a true reflection of our Aviation Finance mission statement: ”As a hybrid institution, we provide our cus-tomers with the most efficient blend of capital and services at any period in time and at any point along the industry cycle”.
Today, DVB is one of the largest providers worldwide of recourse and non-recourse commercial debt to passenger and cargo air-lines, and to aircraft lessors, with a total loan exposure standing at €7.1 billion, financing 696 aircraft and 50 spare engines. We view the continuing development of our asset-based lending activity as a way of further (and profitably) expanding our busi-ness in the sector. Specifically, we consider our willingness to finance used equipment, and to assume residual value risk on the sales proceeds of aircraft, as a competitive advantage. As such, DVB will continue to adopt a proactive approach to main-taining and growing its portfolio, in line with well-established lending guidelines and principles.
Used equipment
The used equipment market prospered during 2014 as well. Demand for older aircraft was stimulated by the long lead times for new planes. Mid-life aircraft and even aircraft part-out pro-jects continued to be increasingly popular with investors and financiers looking for yield and higher interest margins, respec-tively. What may have helped the popularity of used aircraft was the fact that many top-tier airlines no longer shied away from adding used aircraft to the fleet. During the year 2014 lease rates of mid-life popular single-aisle aircraft, such as a ten-year old Airbus A320 or a Boeing 737-800 increased by about 15%. Similar age twin-aisle aircraft showed varying results: Boeing 777-200ER lease rates dropped up to 4%; however, the Airbus A330-300 saw lease rates increase by 20% or more over the same period. Large freighter aircraft such as the Boeing 747-400F suffered and lost over 20%. Aircraft values generally showed more moderate changes. Ten-year old Airbus A320s recovered about 2–3%, while the Boeing 737-800 was fairly stable. The same can be said about twin-aisle values, except for the Boeing 747-400 Freighter that dropped in value by at least 25%.
Further details on aviation market developments in 2014 can be found on DVB’s website www.dvbbank.com >
Business & Expertise > Aviation Finance > Markets.
Aviation Finance – Integrated Platform Solutions

91
DVB Bank SE | Group Annual Report 2014
C ONSOL IDAT ED F IN A NCI A L S TA ME MEN T S
AUDI T OP INIONA B OU T US
Aviation Finance
In order to build on this core business, Aviation Finance main-tains a strong network of relationships with clients and industry partners, who perceive DVB as a bank that understands their business and assets, whilst possessing the expertise to provide value-added financial solutions. Our scope of products and ser-vices is positioned to offer a ”cradle-to-grave” approach to air-craft and related equipment, ranging from, at one end of the life spectrum, providing pre-delivery finance for aircraft still to be delivered, to a tear-down solution for aircraft and spare engines, at the other end. Within this spectrum DVB provides a range of finance, advisory, research and asset management services, following the lifecycle of aero equipment.
Our Aviation Finance clients can today readily draw upon the following range of expertise, in order to fulfil their differing requirements:
• Structured Asset Financing, comprising recourse and non-recourse lending and all related activities, including structuring, arranging, underwriting and loan agency;
• Private Equity Sourcing & Investments, via the Aviation Invest-ment Management team, managing the Deucalion Aviation Funds (aircraft, aero engines, airline equity, asset-backed bonds, etc.);
• Aviation Asset Management, providing third-party aircraft remarketing, lease management as well as technical and general consultancy services;
• Advisory Services, including arranging debt and equity financings, sale-and-lease-back transactions and providing M&A and restructuring advice; and
• Asset & Market Research, with a core focus on the equipment market, producing high-quality independent research to support our strategy and activities.
A prerequisite for DVB’s success is co-operation amongst a team of professionals with a multi-disciplined background. As well as staff experienced in banking and structured finance, Aviation Finance employs individuals with very specific aviation industry expertise, gathered from prior backgrounds with airlines, manu-facturers, aircraft/engine lessors and asset managers.
The biggest differentiator between DVB and its competitors is the fact that Aviation Finance offers far more than the tradi-tional range of banking services. We provide the best choice of structures and services ”at the crossroads of money and metal”, supported by a strong research team. Our aim is to ensure that these distinctive features are fully recognised and valued by our clients and prospects. In the past few years, DVB’s activities have been externally recognised with several industry awards. Into 2015, and indeed beyond, Aviation Finance will further optimise its resources and continue to monitor its risk positions relentlessly. It has available capital for new business, as well as a platform and staff skill sets to which others can only aspire. The Division has consistently demonstrated the achievement of its goal of a cycle-neutral business model: one which will enable DVB to be equally active (and therefore profitable) in a market downturn as in an upturn. What Aviation Finance now strives for is to further increase efficiency across the board, for the mutual benefit of the Bank and its clients, and thus to stay ahead of the competition.
GROUP M A N AGE M E N T R E P OR T
DEVELOPMENT OF THE BUSINESS DIVISIONS

92
DVB Bank SE | Group Annual Report 2014
Aviation Finance
Total loan portfolio
At the end of 2014, the Aviation Finance portfolio stood at €7.1 billion, representing a 10.9% increase from the level of €6.4 billion at the end of 2013. The portfolio was, however, 99.0% US dollar-denominated: in US dollar terms the portfolio size actually decreased by 3.4% during the year from US$8.9 billion at the end of 2013 to US$8.6 billion at the end of 2014, driven by the impact of significant loan prepayments during the year. In line with DVB’s business model, the portfolio is 99.8% collater-alised.
Focusing on the manufacturers, our portfolio shows a slight bias towards the financing of Boeing-manufactured equipment, at 52.4% (previous year: 50.6%) of the portfolio, with Airbus aircraft standing at 41.3% (previous year: 43.6%), while other (mainly Embraer and ATR-manufactured) equipment amounts to 6.3% (previous year: 5.7%).
Narrowbody aircraft remain the dominant aircraft class at 51.3% of the portfolio, up from the 2013 level of 49.4%, with the pro-portion of widebody aircraft standing at 34.3% (2013: 36.8%). The balance of new business in 2014 was comparatively in favour of narrowbody aircraft transactions (at 44.4%, versus widebody at 33.8%), which in turn is a function of where we have observed/originated the better transaction-by-transaction risk-reward profiles. In general we do expect (and indeed target) that narrowbody aircraft will be the majority class: our strategy is to favour aircraft in this class, since they represent the most liquid aircraft type from a security perspective (i.e. ease of remarketing to other operators). The portfolio breakdown saw the proportions of financed freighter aircraft and regional jets reduce slightly to 8.0% and 4.7% respectively, while the share of turboprop aircraft – a new class, following our decision in 2013 to selectively target the financing of such aircraft – stands at 1.7%.
Aviation Finance – Portfolio analysis
DVB is a market leader in commercial and asset-based financing for aircraft and related equipment. Aviation Finance does not provide export credit loans, and, as such, we consider that each dollar we loan is ”in demand” commercial finance. The Bank has remained consistently active through industry cycles, and has thereby proved a reliable partner to its clients in difficult times.
Reputation drives success
The air finance market in 2014 was certainly not short of bank and capital market liquidity in most segments. The financing of new equipment remained comparably ”easy”, given the healthy appetite for such (new) assets from all providers. The stellar credits among the airline and leasing companies had plentiful options to secure their funding requirements, be it for new or used equipment, and – building on the trend of the previous year – a growing number of borrowers/issuers were able to take advan-tage of the capital markets, both public and private. For others though it was harder work to secure their aircraft financing/refinancing needs, in particular for used equipment, or to raise financing for pre-delivery payments (PDP).
DVB’s Aviation Finance division was active across the board, although the focus of our origination activity was – as always – to identify those situations where our lending was deemed rela-tively scarce, and hence more valuable to our clients. After a fairly slow start to the year, demand for our services increased steadily to an incredible end of year, when for the last two months alone of 2014 we closed new loan business of over US$1 billion, to cap an excellent year. There is no doubt that the foundation of our continued success is our track record built over many years of activity, which encourages clients to come to DVB to secure their requirements, when an assured and efficient delivery of funds is of paramount importance.

93
DVB Bank SE | Group Annual Report 2014
C ONSOL IDAT ED F IN A NCI A L S TA ME MEN T S
AUDI T OP INIONA B OU T US
Aviation Finance
Risk is also geographically well diversified, with a healthy balance between Europe, the Middle East and Africa, at 39.3% of the portfolio, and the Americas, at 32.3%. Client exposure in Asia and Australia/Oceania has increased, reaching 26.2% in 2014 (previous year: 22.1%): this region has historically been under-represented in our portfolio – a reflection of both client profile and the competitive landscape – but in recent years this has been clearly changing.
In terms of the vintage of aircraft financed, 44.1% of the portfolio is three years old or less and 63.3% of the portfolio is less than six years old. Whilst Aviation Finance is experienced in financing aircraft across the full age spectrum, and indeed this is often a competitive edge, generally younger aircraft (as well as narrow-body aircraft) are more readily sold or leased in case of need (i.e. a client default). So this age profile of the portfolio repre-sents a very solid base.
The Aviation Finance portfolio is also well diversified by client, with 51.3% being airlines, 44.3% operating lessors and 4.4% logistics companies. A total of 153 aviation clients equates to an average lending exposure of €46.3 million per client. There are 52 clients for whom our committed exposure is in excess of €50.0 million.
Narrowbody pax 51.3%
thereof:
26.8% Boeing/McDonnell Douglas
24.5% Airbus
Widebody pax 34.3%
thereof:
18.2% Boeing/McDonnell Douglas
16.1% Airbus
Freighters 8.0%
thereof:
7.4% Boeing/McDonnell Douglas
0.6% Airbus
Regional jets 4.7%
thereof:
4.1% Embraer
0.5% Bombardier
0.1% Airbus
Turboprops 1.7%
thereof:
1.6% ATR
0.1% Bombardier
Aviation Finance portfolio by aircraft type
Europe 35.1%
North America 27.4%
Asia 24.9%
South and Central America 4.9%
Middle East/Africa 4.2%
Offshore 2.2%
Australia/Oceania 1.3%
Aviation Finance portfolio by country risk
GROUP M A N AGE M E N T R E P OR T
DEVELOPMENT OF THE BUSINESS DIVISIONS

94
DVB Bank SE | Group Annual Report 2014
Aviation Finance
Some of the 2014 transaction highlights were:
• United Airlines – Arranger of a bilateral term loan facility to finance one new Boeing 787-9 aircraft. Based on the strength of our relationship with the airline, we were able to secure this mandate for what was the only commercial bank financing which United Airlines undertook in 2014 for this attractive new generation widebodied aircraft. Other aircraft were financed in the US capital markets.
• Several lessor clients – Arranger and underwriter of a variety of limited recourse financings. These included: for AWAS, one new A330-300 aircraft on lease to Air Asia X; for Oman Brunei Investment Company, two B737-900ER aircraft on lease to Oman Air; and for Merx Aviation Finance, one B777-200LRF on lease to Lan Cargo.
• SAS – Arranger and agent of a PDP financing in respect of six A320neo and two A330-300 aircraft which will be deliv-ered in the period 2015 to 2017. We believe this transaction to be the first ever PDP financing involving A320neos with Leap-X1A engines. Other PDP financings were concluded for Air Europa (two B737-800s), Intrepid Aviation (two A330-300s) and Norwegian Air Shuttle (one B787-8 and three B737-800s).
New business
Loan portfolio development
During 2014 Aviation Finance realised 61 new lending transactions with aviation clients, comprising a strong new final-take volume of €2.3 billion – a significant increase over 2013’s volume of €1.8 billion – with a good mix of new and used aircraft financings, for a diversified group of clients in terms of geographical location and credit standing.
New business was concluded with established clients such as Aircastle, AWAS, Jazeera Airways, Lion Air and SAS. In addition, DVB attracted eight new clients, including BoComm Leasing, Elix Aviation Capital, MG Aviation and Minsheng Financial Leas-ing. DVB acted as arranger and/or agent bank (i.e. leading role) in all of its newly acquired business transactions. New financings in 2014 were well diversified by client and obligor, as well as by aircraft type. 58.4% of new business was for the financing of Boeing equipment (new and used aircraft), with Airbus equipment standing at 32.2%: this is a slightly unusual weighting towards Boeing equipment, and we typically expect the split between Airbus and Boeing aircraft to be about even. In line with our new lending policy to finance certain turboprop aircraft, we completed our first three new transactions in this asset class for an aggre-gate financing volume of approximately €123 million.

95
DVB Bank SE | Group Annual Report 2014
C ONSOL IDAT ED F IN A NCI A L S TA ME MEN T S
AUDI T OP INIONA B OU T US
Aviation Finance
Deal of the Year 2014
We have, however, selected a mandate from Apollo Aviation Group (Apollo) as the most important Aviation Finance deal con-cluded in the year:
On 12 August 2014, DVB closed its third senior debt portfolio financing facility for Sciens Aviation Special Opportunities Invest-ment Fund II (SASOF II). SASOF II, a closed-ended fund, was launched, and is managed by, Apollo after raising US$595 million from a diverse group of investors in 2013. SASOF II’s objective is to invest in aircraft and aircraft engines, primarily mid-/end-of-life equipment, with the intention to lease and eventually part-out these assets. Apollo has had a very good track record in this space over the past few years.
The US$129.4 million financing was arranged and co-underwrit-ten by DVB and Goldman Sachs on a 50:50 basis, and is secured by a pool of 13 aircraft consisting of Airbus A319s/A320s/A321s, A330s and Boeing 737-700s/800s on operating lease to a diverse group of eight airlines based in the US, Europe and Asia. DVB acted as Administrative Agent. The transaction was a fol-low-on to two Apollo/SASOF II facilities we had solely under-
written and closed within the past year: a US$102.7 million, 13-aircraft portfolio financing closed in November 2013, and a US$71.8 million nine-aircraft portfolio financing closed in April 2014. Unlike the two earlier-term financings, this latest facility was structured as a short-term, twelve-month ”bridge”, with a term-out option, which would give Apollo the flexibility to con-sider and pursue certain capital market refinancing options for some or all of the aircraft without incurring significant prepay-ment penalties.
The three facilities arranged by DVB financed in total 35 aircraft, making us the largest lender to SASOF II, which is testimony to our excellent relationship with Apollo. DVB is a natural financing partner for Apollo-managed funds, given their focus on mid-/end-of-life equipment, and in view of our ability (through the Aviation Asset Management team) to analyse and project the physical condition, maintenance cash position and any lessor contribu-tions for each aircraft until lease maturity. The due diligence Aviation Asset Management performed on the three portfolios provided us with a better understanding of Apollo’s business model; in turn, we were able to structure and tailor a deal which worked well for both the client and for DVB.
Aviation Finance – Deal of the Year 2014
GROUP M A N AGE M E N T R E P OR T
DEVELOPMENT OF THE BUSINESS DIVISIONS

96
DVB Bank SE | Group Annual Report 2014
Aviation Finance
Earnings contributions
The significantly lower average interest margin, in comparison to the prior year, of 250 basis points (2013: 284 basis points) was largely a reflection of the generally falling cost of liquidity during the year, though this was amplified by competitive pres-sure experienced in some segments of the market. Nevertheless, Aviation Finance was able to slightly increase net interest income to €89.7 million (2013: €88.8 million). Allowance for credit losses was a minimal amount of €–0.4 million (2013: net release of €1.1 million). Also taking into consideration the euro/US-dollar exchange rate development, total allowance for credit losses in Aviation Finance stood at €41.7 million in 2014, com-pared to €41.3 million at the end of 2013. We believe that this level of allowance for credit losses provides a necessary and adequate cushion against possible losses. Net fee and commis-sion income, at €34.2 million declined from the 2013 level of €38.6 million, and was the result of competitive pressure. This resulted in results decreasing by 4.4%, and net segment income before taxes by 4.7%.
Aviation services
The success of Aviation Finance in 2014 contained strong contri-butions from our ”aviation services” activities, i.e. those which are non-balance sheet-consuming. The Aviation Asset Manage-ment (AAM) and Advisory teams have continued to enhance the reputation of DVB’s aviation business as the ”leading aviation merchant bank”. These teams were engaged in a wide range of mandates, each leading to healthy ”non-risk” fee earnings. Some of the highlights were:
• During 2014 AAM managed 155 aircraft for third parties – 73 aircraft under lease management, 51 aircraft under techni-cal management and 31 aircraft under remarketing contracts – and continues to be one of the key players in today’s industry for aircraft asset management services.
• AAM managed major aircraft sale programmes during the year, most notably the sale of 16 aircraft on behalf of Philippine Airlines and two aircraft on behalf of Air New Zealand, as part of their respective fleet management plans.
• On behalf of third party owners, AAM leased five aircraft to a Mexican carrier on behalf of Republic Airways in US, two aircraft on behalf of Sahaab Leasing in the Middle East, and two aircraft into Brazil following their re-delivery from Australia.
• The Advisory team arranged junior debt for Korean Air to finance a portfolio of six used aircraft.
• Advisory was appointed by a Middle Eastern carrier to arrange PDP financing for its new B787-8 aircraft.
The commitment by DVB to patiently develop its service capa-bility and resources is expected to yield further rewards in the coming period, as a key component of DVB’s cycle-neutral business approach.
Extract from Aviation Finance’s segment report
€ mn 2014 2013 %
Net interest income 89.7 88.8 1.0
Allowance for credit losses –0.4 1.1 –
Net interest income after
allowance for credit losses 89.3 89.9 –0.7
Net fee and
commission income 34.2 38.6 –11.4
Results (excluding
the IAS 39 result) 122.7 128.4 –4.4
General administrative
expenses1) –19.3 –20.0 –3.5
Net segment income
before taxes 103.4 108.5 –4.7
1) Only those costs are allocated to DVB’s operating business divisions for which they are directly responsible. General costs of operations, overheads or, for example IT costs, are not allocated to the operating business divisions.

97
DVB Bank SE | Group Annual Report 2014
C ONSOL IDAT ED F IN A NCI A L S TA ME MEN T S
AUDI T OP INIONA B OU T US
Aviation Finance
Risk management
A lot of hard work to build a profitable loan portfolio can be undone as a result of loan losses in the business. With this factor in mind, Aviation Finance has built a strong risk culture over many years, which starts with our client-facing relationship managers and continues through each stage (including Aviation Credit, Aviation Research and the Credit Committee) until a new com-mitment is granted, and continues thereafter throughout the term of the relevant exposure. At the heart of our consideration for each new exposure is the Deal Committee, which meets to discuss – at an early stage – possible new transactions, with a view to spotting risk and structural deficiencies, finally arriving at a consensus, be it posi-tive or negative. The committee comprises all teams of Aviation Finance, and includes the Member of the Board of Managing Directors responsible for Aviation Finance, the Head of Industry, the Heads of Aviation Credit, Aviation Research and Aviation Asset Management, and each Regional Head of Aviation Finance. As a tribute to its efficiency, the failure (or decline) rate at the Deal Committee is significant, a tribute to our culture of risk selectivity and consensus-building. Only those transactions authorised by the Deal Committee will move to the next stage, and subsequently be presented to the Divisional and/or Group Credit Committee for approval. Transactions exceeding a certain exposure threshold do also need to be presented to the Super-visory Board’s Credit and Risk Committee for approval.
Once a transaction has been booked, it is monitored for any required action on an ongoing basis by the respective relationship manager and credit officer, and through the review and stress test processes. If appropriate, an exposure is taken on to Early Warning List, Closely Monitored List, or Watch List reporting. The ongoing management of risk is aided by a rigid call report discipline and through a regular full portfolio review by Aviation Finance senior management, to proactively identify concrete actions to be taken.
The Aviation platform has been built in such a manner as to be optimally prepared for a downturn and to deal with any stress scenarios in the loan portfolio, including restructurings and air-craft repossessions. The management quality of such ”stressed” transactions is clearly enhanced by our dedicated Aviation Special Projects team, which takes responsibility, working along-side Aviation Credit, for relevant work-out cases. The team may also be supported by AAM and/or TES Aviation Group as aircraft/engine asset managers.
During 2014, we had a small number of transactions requiring restructuring or remedial action. However, under the leadership of Aviation Special Projects, we have been able to conclude loan amendments and restructurings, successfully mitigating losses otherwise anticipated for future years.
In general, we believe that our proactive approach to risk man-agement gives us excellent visibility over potential trouble spots within the loan portfolio, and we remain alert to opportunities to conclude ”defensive” new financings, where we can simulta-neously improve our risk position on existing exposure to a client, through cross-collateralisation for example. In all cases, Aviation Finance will continue to take whatever steps necessary to safe-guard its position as a secured lender.
GROUP M A N AGE M E N T R E P OR T
DEVELOPMENT OF THE BUSINESS DIVISIONS

98
DVB Bank SE | Group Annual Report 2014
Aviation Finance
Maybe more relevant for aircraft investors and financiers will be the impact on the equipment market, especially in terms of air-craft tradability and value stability. At the end of 2014, the ratio of capacity on order to aggregate existing fleet capacity was 59.7% (13,173 aircraft – see chart ). For the time being, it looks like this very low oil price may be a temporary anomaly without consequences for the viability of the new generation of fuel-efficient jetliners. We believe the production cost of the new generation aircraft, such as the Airbus A320neo, Boeing 737MAX and Embraer E-Jets E2 should not be much different compared to ”old” generation planes. Therefore, we do not see negative implications for the viability of the new aircraft types. With the fuel-cost savings offered by the new technology jets, what may be needed is a reduction in the lease rate premiums the new technology aircraft initially seemed able to attract. However, new technology aircraft continue to offer superior performance characteristics as well as better environmental characteristics and a ”built-in” insurance against fuel price increases.
Short term, used aircraft may benefit from the lower fuel price as there will be less pressure to replace them. The abundant availability of liquidity for aircraft investments seems another factor that will support used equipment values during 2015. For ”mainstream” Boeing 737NGs and Airbus A320/321s we expect the strong market to continue in 2015. Even undervalued aircraft like the Airbus A319 or Boeing 737-700 may find some opportun-istic operators. We believe there is less optimism for most used widebodies, such as the Airbus A330-200, Boeing 777-200ER and obviously the ”quads”. Overall 2015 should still bring pros-perity to aircraft lessors and investors. Our concerns are focused on the later years. If fuel returns to more normal levels, the impact of the generation change may start to hit during the sec-ond half of the decade in what we fear will be more than the usual cyclical downturn for the out-of-production generation aircraft.
Aviation Finance – Outlook 2015
Market outlook 2015
The interaction of three business cycles will determine the state of the commercial jet market; the airline market cycle (demand and supply of transport capacity), the financial cycle (demand and supply of liquidity) and the aircraft technology cycle (intro-duction of new, superior aircraft designs). Some observers say that during 2014, it was as good as it will get in commercial aviation. However, without any major external shock, 2015 should be another good year for our industry. The outlook for the global economy remains that of an uneven recovery, with the Interna-tional Monetary Fund forecasting a modest 3.5% growth for the world economy, despite the positive impulses of the lower oil price and the depreciation of the euro and the yen. Risks include geopolitical tensions, stagnation of growth in advanced econo-mies and a decline in growth of emerging markets. The Interna-tional Monetary Fund expresses concerns that markets are underpricing risks, taking into account the uncertainties of the macroeconomy.
Based on the above, the International Air Transport Association expects that the net (post-tax) profitability of the global airlines will increase further, from US$19,9 billion in 2014 to US$25 billion in 2015. This does not imply all airlines are doing well. Around year-end 2014 and the first weeks of 2015, a number of well-known airline names disappeared into bankruptcy. Even flag carriers that were once stellar credits are coming under severe pressure. After taking write-offs for fuel hedges, most airlines will benefit from the low oil price. According to the US Energy Information Administration, crude oil (West Texas Intermediate) should only modestly increase to on average US$55 per barrel in 2015 and US$71 per barrel in 2016.
Ratio of capacity on order to aggregate exisiting fleetAircraft In service 22,062
(western-built jets) Ordered 13,173 59.7%
Source: Ascend, January 2015
Aircraft orders – ratio of order backlog to existing fleet capacity

99
DVB Bank SE | Group Annual Report 2014
C ONSOL IDAT ED F IN A NCI A L S TA ME MEN T S
AUDI T OP INIONA B OU T US
Aviation Finance
Portfolio outlook 2015
DVB is one of the few consistently active players in global air finance, unlike some of our competitors, who come and go through the industry cycles. We are in a period of the cycle where there is no shortage of liquidity chasing investment in, or financing of, aircraft assets, since providers of capital have been lured to the sector by the expectation of a superior ”risk-versus-reward” balance versus competing applications for their liquidity. This means greater competition for a long-term player like DVB. Nevertheless, the tendency of many of our competitors remains towards a ”flight-to-quality”, and as such, pressure on pricing and other terms will be limited to certain client/equipment com-binations only, some of them away from DVB’s core franchise. The result is that in some segments of our Structured Asset Financing activity, competition remains limited.
We do not expect there to be any shortage of liquidity to finance the new aircraft delivery requirements, though it is good that we now see a more level playing field given the significant increase in the cost of export credit agency-supported debt, which has driven more borrowers to consider what is on offer in the com-mercial banking market. More specifically, liquidity should remain abundant for the US airlines and the public lessors, in view of the sustained interest from the US capital markets, and for many of the Asian, European and Middle Eastern ”flag” and ”mega” carriers, based on their continued deep access to the commercial banking market. We do, however, expect there to be continuing funding challenges in the used/second-hand equipment market, which presents a clear opportunity for DVB, given that the used market is a core activity and strength of Aviation Finance.
DVB continues to experience a healthy level of demand for its risk capital and services. The need to carefully select how Aviation Finance will deploy its resources will persist in the year ahead. Making the right decisions, particularly on where and how to deploy risk-weighted assets, will be the key to achieving another profitable period. Aviation Finance has assembled a team that boasts a wealth of experience and multi-disciplined backgrounds; in short, a team which is more than capable of ensuring that good decisions will be made and delivering on a promise of per-formance.
The Bank will be open for business throughout 2015 and beyond, but will use its deep knowledge of the underlying assets to avoid hidden risks often seen in transactions. Our cycle-neutral approach, allied to a discipline that balances commercial pressure with the requirement to maintain a quality portfolio, will be the key ingredients ensuring that Aviation Finance enjoys continued success.
As mentioned, current demand for the Bank’s capital and services is good: indeed we have entered 2015 with a strong pipeline. In its Structured Asset Financing activity for 2015, Aviation Finance targets further modest portfolio growth, whilst – more crucially – maintaining the quality of loan assets, and without compromising the risk-reward profile. In 2014, our average net loan margin was stable, even increasing in some areas, and we expect this to continue through 2015, notwithstanding the aforementioned competition. Finally, we are confident of an increasing level of demand for our aviation services, most notably advisory and asset management. Our strong reputation in these activities is evenly distributed across all client categories: airlines, lessors and investors alike.
GROUP M A N AGE M E N T R E P OR T
DEVELOPMENT OF THE BUSINESS DIVISIONS

100
DVB Bank SE | Group Annual Report 2014
Offshore Finance
As expected, global exploration and production spending (E&P Capex) – the key demand driver for offshore assets – slowed down from the high levels witnessed over the past few years, with a modest increase of 3.5% in 2014. Growth in offshore E&P spending was slightly higher at close to 5%.
The lower E&P Capex growth rate in 2014 was notably the result of oil and gas companies’ cash flow constraints, related to the fact that E&P spending followed a continuing increasing trend since 2011, while oil and gas prices remained stable. The drop in oil price in the second half of the year exacerbated the cost-cutting efforts of oil and gas companies.
Lower E&P spending started to affect primarily offshore activities associated to the early stages of offshore field developments such as seismic and exploration activities. Drilling programmes were delayed or cancelled, resulting in lower demand for rigs. This progressively filtered through to offshore support vessels. Meanwhile, on the supply side, the numerous orders placed dur-ing the past few years started to be delivered. Despite slippage of scheduled deliveries later into 2014 and 2015, fleet growth was higher than 5% for some asset types such as jack-ups, drill-ships and platform supply vessels.
By continuing to develop our know-how and expertise in 2014, we were able to finance offshore vessels, drill-ing rigs and other highly specialised offshore equipment integral to exploration, production and field mainte-nance. In light of this, the Offshore Finance division has been successful, with 2014 representing a very satisfactory year irrespective of tougher market con-ditions in the second half.
Offshore Finance – Market review
After several years of relatively stable oil prices, volatility returned to the market. While the offshore markets fared well for most of the year, the decline in oil price started to have an impact towards the end of the year. In 2014, world oil demand increased by 1.1%. Meanwhile, world oil supply was boosted by oil production from unconventional fields in North America which witnessed a 6% increase year-on-year. Offshore oil production, which accounts for 29% of crude oil production, grew by 2.5% to 25.3 million barrels per day in 2014. Lower than expected world oil demand, combined with underestimation of oil supply in North America contributed to trigger a decrease in oil price, which deepened as the Organisation of the Petroleum Exporting Countries openly refused to adjust supply to protect the oil price from sliding.
40
30
20
10
0
–10
26
2005
25
2006
16
2007
24
2008
–4
2009
4
2010
7
2011
14
2012
10
2013
5
2014
Offshore E&P Capex year-on-year growth
Year-on-year growth(%)
Source: Rystad Energy, January 2015

101
DVB Bank SE | Group Annual Report 2014
C ONSOL IDAT ED F IN A NCI A L S TA ME MEN T S
AUDI T OP INIONA B OU T US
Offshore Finance
While at the start of the year most asset types were still bene-fitting from employments contracted when the oil price was still high, as the year progressed competition for employment increased, leading to a decrease in fleet utilisation for all asset types. Day rates came under pressure and decreased to differ-ent extents depending on region of operation and asset type, ranging on average from a 10% to 35% decrease.
Further details on offshore market developments in 2014 can be found on DVB’s website www.dvbbank.com >
Business & Expertise > Offshore Finance > Markets.
Offshore Finance – Strategy
When DVB decided to separate its existing offshore financing franchise from Shipping Finance into a separate business division at the start of 2013, it was not only with the clear intention of capitalising on the offshore sector’s growth potential; the Bank also intended to further enhance its visibility in the market and to tackle the ever changing and challenging market conditions, thereby ensuring that a market-leading position is maintained. Today, DVB’s Offshore Finance division is well positioned to pro-vide tailor-made financings to companies that primarily own and operate offshore support vessels (platform supply vessels and anchor-handling tug and supply vessels), subsea and construction vessels, seismic vessels, accommodation units, drilling units (jack-ups, semi-submersibles, drillships), and Floating Production Storage & Offloading (FPSO) units. Similar to Shipping Finance, these clients are public and private companies varying from large multinational enterprises to smaller single-purpose asset-owning entities, as well as experienced financial investors within the offshore sphere. Given the complexity of the offshore industry – it is highly fragmented, specialised and capital inten-sive, with high entrance barriers – we only target clients with a high level of technical and operational expertise, and a proven track-record in the market.
The Offshore Finance division is run on a few basic principles; namely, an in-depth knowledge of the offshore industry together with an ability to respond quickly to a changing market environ-ment, proximity to clients, maintaining and developing highly qualified staff, as well as a flat hierarchy. These principles con-tinue to shape the Offshore Finance division and the way the business is steered.
Firstly, our asset-based focus – coupled with our commitment to long-term client relationships – translates into a broad and profound coverage, enabling us to amass in-depth knowledge – of the assets we finance, of our clients, and about value-chains and networks in the distinct offshore sectors. Our front-line staff and decision-makers continue to be supported by the Bank’s Shipping & Offshore Research department which pro-vides valuable, up-to-date and high-quality market intelligence. This expert knowledge allows us to recognise and understand developments in particular subsectors and the general market quickly enough to act proactively, and flexibly adjust the business segment and portfolio strategy when required. Furthermore, it brings us closer to our clients, solidifying our reputation as a trusted partner in the offshore industry.
Secondly, we also offer our clients a geographical proximity. Contrary to the shipping industry, the offshore hubs are more geographically condensed. With offices in Hamburg, New York, Oslo/Bergen and Singapore, DVB’s relationship managers service our offshore client base in all offshore hubs where they have earned a high market reputation for tailoring financial solutions to meet our clients’ specific business requirements. This has resulted in Offshore Finance being mandated to act as Mandated Lead Arranger and Agent on large syndicated loans as well as for the smaller bilateral transactions integral to the offshore industry.
Thirdly, great effort has been put into attracting, retaining and developing the best offshore finance professionals. Our relation-ship managers and researchers are technically proficient, and
GROUP M A N AGE M E N T R E P OR T
DEVELOPMENT OF THE BUSINESS DIVISIONS

102
DVB Bank SE | Group Annual Report 2014
Offshore Finance
Thus, our Offshore Finance clients can today readily draw upon the following range of expertise in order to fulfill their differing requirements:
• Structured Asset Financing, comprising traditional asset-/project-based financing – mostly post-delivery finance with full recourse to a substantial obligor;
• Risk Distribution, syndicating portions of the lending volume to other financial institutions on the international banking market;
• Corporate Finance Solutions, supporting our clients in the identification of new and diverse sources of funds in the capital markets, and accessing those funds on favourable terms; as well as providing M&A and restructuring advice as well as arranging debt and equity financings;
• Private Equity Sourcing & Investments, via Shipping & Inter-modal Investment Management, managing investment in off-shore companies and assets; and
• Asset & Market Research, with a core focus on the offshore market, producing high-quality independent research to support our strategy and activities.
Offshore Finance – Portfolio analysis
Thanks to our industry-specific expertise, our Offshore Finance division has been able to consistently offer its clients integrated financing solutions. In 2014, the loan portfolio developed favorably and thus generated solid financial results, while constantly maintaining a conservative risk approach.
Total loan portfolio
Offshore Finance serves 51 offshore customers in all global off-shore hubs. In 2014, the portfolio comprised 246 assets with a total exposure of €2.3 billion (previous year: 250 assets with a volume of €2.0 billion). Due to the fact that 88.0% of customer lending is denominated in US dollars, a year-on-year comparison in US dollar terms reflects the business development of Offshore Finance more accurately. Here the loan portfolio remained stable at US$2.8 billion (previous year: US$2.8 billion), despite heavy re- and prepayments on the portfolio amounting to 34%. The average lending exposure per client stood at €44.7 million (an increase of 16.7% from €38.3 million in 2013). The number of clients whose exposure exceeded €50 million totaled 15 at year-end 2014 (15 clients at year-end 2013).
possess experience that is both broad and deep. There is also strong support from execution and transaction managers, who provide an individual focus on managing our client’s transactions through internal processes and approvals. In addition, our highly specialised credit department, with its in-depth knowledge of the offshore and shipping industries, adds value to DVB’s long standing brand and track record of offshore financing activities.
Fourthly, DVB continues to maintain a flat hierarchy with no more than two organisational layers between client point of contact and top management. Although the offshore franchise was separated from Shipping Finance in 2013, the underlying credit principles remain the same and the respective divisions con-tinue to answer to the same New Deal Committee and Credit Committee. However, the overall separation makes it easier to differentiate the two different businesses for all value-added purposes, including that of reporting and controlling.
In 2012 DVB launched the ”Unity” project, in order to enhance process efficiency in the Shipping Finance and Offshore Finance business. The principle aim of Unity was to implement a mode of operation that would enable a greater alignment between the key performance indicators of the Aviation Finance, Shipping Finance and Offshore Finance divisions. The Unity project was successfully completed at the end of 2014. As a result, a Euro-pean hub was created in Amsterdam to centralise the European Credit team, and in London to centralise the Shipping Finance and Offshore Finance loan administration in Transaction & Loan Services. Also, execution managers and transaction managers were introduced who support the client coverage teams in Europe and individually focus on managing our clients’ transactions.
During 2014 the Offshore Finance division has pursued strategic objectives of
• enhancing the quality of its client base and portfolio through an ongoing critical approach to client selection and risk man-agement; and
• utilising the core of asset-secured lending, together with an understanding of corporate credit, and thus developing financing solutions that draw upon a broader product tool kit. This enables Offshore Finance to offer clients a seamless one-stop shop and further improve sustainable revenue diversification.

103
DVB Bank SE | Group Annual Report 2014
C ONSOL IDAT ED F IN A NCI A L S TA ME MEN T S
AUDI T OP INIONA B OU T US
Offshore Finance
Since granularity in the portfolio is the key pillar of our risk management philosophy, the Offshore Finance customer lending volume – which is 100% collateralised – is not only diversified from an exposure amount perspective but also highly diversified across the offshore spectrum itself. Looking at the financed vessel types, for instance, the platform supply vessel exposure accounts for the largest share of 25.6%. At the same time, Offshore Finance reduced its exposure to anchor handlers from 30.9% in 2013 to 24.6% in 2014, partly on the back of reduced drilling demand and a more strategically selective approach to this sector. The share of rigs and offshore construction vessels in the portfolio grew to 15.1% and 10.0% in 2014 (previous year: 9.2% and 4.8%, respectively) on the basis of conservative terms and conditions and underlying charter contracts to reputable counterparties.
Geographically, the portfolio also shows a high level of diversi-fication, while clearly reflecting the regional hubs of the global offshore industry and the new drilling and field activities that have taken place in these regions. Exposure to Europe increased from 54.8% to 56.4%, favouring Norway which has seen a sig-nificant growth in the number of new oil finds, investments and production. The Middle East and Asia/Pacific exposures declined from 25.6% to 18.9%, mainly due to loan repayments. The Americas increased marginally, from 11.2% to 13.0%, mainly caused by opportunities for new deal generation in these regions.
Platform supply vessels 25.6%
Anchor handlers 24.6%
Rigs 15.1%
Offshore construction vessels 10.0%
Multi-function service vessels 5.9%
Seismic survey vessels 4.9%
Drillships 3.1%
FPSO 1.4%
Others 9.4%
Offshore Finance portfolio by vessel type
Europe 56.4%
thereof:
40.0% Norway
5.0% Denmark
3.7% France
0.9% Cyprus
6.8% Others
Asia/Australia 15.7%
thereof:
8.0% India
4.6% Singapore
1.0% Japan
2.1% Others
North and South America 13.0%
thereof:
7.3% Brazil
5.2% USA
0.5% Others
Offshore 8.6%
thereof:
5.3% Bahamas
3.3% Bermuda
Middle East/Africa 3.2%
Central America/Carribbean 3.1%
Offshore Finance portfolio by country risk
GROUP M A N AGE M E N T R E P OR T
DEVELOPMENT OF THE BUSINESS DIVISIONS

104
DVB Bank SE | Group Annual Report 2014
Offshore Finance
Most of these transactions were bilateral, reflecting the more fragmented offshore support vessel market where transaction amounts in general are smaller than in the drilling and FPSO sectors. The interest in club deals, involving at least one other bank, has been growing, while participation in larger syndicates has declined. Offshore Finance is tracking some 130 companies worldwide. About half of these market participants are either directly or indirectly part of DVB’s existing client base, but we enjoy good relations and close contacts with far more offshore enterprises, also actively discussing and positioning ourselves to execute corporate finance services.
Some of the DVB credit-approved transaction highlights during 2014 include:
• DOF Subsea – DVB acted as Mandated Lead Arranger and Underwriter on the senior secured term loan for refinancing of the 2008-built offshore construction vessel ”Skandi Seven”. The vessel is on long-term charter to Subsea 7, one of the largest and most integrated subsea companies in the world.
• Toisa – DVB will provide a senior term loan to Toisa Limited secured by a DP3 offshore construction vessel (Toisa Perseus) and a DP2 well testing vessel, both initially working in Mexico on time charters to Grupo Diavaz.
• Petroserv – DVB participated in a senior secured facility divided into the a commercial term loan, a non-amortising revolver and a Norwegian ECA term loan. The proceeds are being used to refinance existing indebtedness, including a facility in which DVB also participates.
New business
Loan portfolio development
Over the recent years, the credit quality of the Offshore Finance portfolio has increased significantly. We enjoy a larger spread across top clients and have been able to add about 20 new clients in the last four years. In 2014, Offshore Finance closed 25 new loan finance and guarantee transactions at an average new business margin of 271 basis points and totaling €804.0 million (previous year: 24 transactions with a new business margin of 330 basis points and totaling €508.3 million). The new loan pro-duction numbers were countered by high pre- and repayments. Prepayments hit the drilling sector in particular, prompted by thriving bond markets and brisk appetite from investors seeking incremental yields and finding the offshore sector a compelling and growing industry.
In terms of diversification, our new transactions – with estab-lished and new clients – were spread across offshore support vessels as well as subsea and drilling equipment, with platform supply vessels accounting for 21.0% (–5.4 percentage points) of the new business volume, followed by anchor handlers with 17.5% (–20.2 percentage points) and rigs with 4.4% (–8.0 percentage points). This shift resulted from large prepayments involving these asset types. A new asset type – offshore construction vessels – made its first appearance in the 2014 new business portfolio, accounting for 17.2%. An important objective is to achieve a more diversified mix of transactions, all pertaining to a high level of equipment complexity, employment cover and cor-porate recourse. More than half of new business was executed in Europe (mainly Norway), while 28.7% emanated from the Americas and the Far East.

105
DVB Bank SE | Group Annual Report 2014
C ONSOL IDAT ED F IN A NCI A L S TA ME MEN T S
AUDI T OP INIONA B OU T US
Offshore Finance
Deal of the Year 2014
On 31 March, DVB (acting as Agent) together with participating lenders Swedbank, ABN Amro, KEXIM and GIEK/EKN Norway signed a six-year senior loan agreement alongside a similar junior loan agreement, thus cementing a DVB structured transaction involving commercial, ECA and junior lenders. The purpose of the loans was to assist long-term DVB client Songa Offshore in part-financing the first two (of a series of four) new generation, harsh environment, semi-submersible drilling rigs, all of which were to be built at South Korean shipyard DSME, with estimated delivery during 2015. The rigs have already obtained long-term drilling charters with the Norwegian oil company Statoil (each drilling contract is eight-year firm with additional twelve years of options). The deal was very challenging to conclude, due to many moving parts, including certain cost overruns in relation to yard-outages of Songa’s five-unit existing fleet causing a serious liquidity squeeze, and initial downgrading by Songa Offshore rating agencies. Yet it was ultimately brought together through equity contributions from Songa’s majority shareholder Fredrik Mohn, increased charter rates by Statoil, a willingness by the commer-cial lenders to underwrite a larger loan amount than initially intended, alongside a continued push by DVB towards both ECA providers and the junior loan provider.
The successful closing of the transaction – and by extension the key assistance provided by DVB – has allowed Songa Offshore to continue its quest for change from being an owner/operator of primarily older drilling equipment to being the leading drilling operator and partner of Statoil on the Norwegian Continental Shelf.
Earnings contributions
In 2014, Offshore Finance experienced a good year in terms of profitability, capitalising on attractive opportunities but was also impacted by an increase in loan prepayments caused by many large listed companies refinancing in the international bond markets (predominantly in Oslo and New York). Against this back-ground, net interest income was down 15.4%, to €26.3 million (previous year: €31.1 million), as a result of risk-adequate, yet declining interest margins (2014: 271 basis points; 2013: 330 basis points). No allowance for credit losses had to be recognised. Total allowance for credit losses in Offshore Finance was €1.5 million (previous year: €1.3 million). This increase is solely caused by exchange rate effects. The level of provisioning represents a necessary cushion for potential losses. Net fee and commission income remained at a stable level of €18.6 million (previous year: €19.0 million). Overall, results and net segment income before taxes both decreased by 9.5% and 9.8%, respectively.
Offshore Finance – Deal of the Year 2014
GROUP M A N AGE M E N T R E P OR T
DEVELOPMENT OF THE BUSINESS DIVISIONS

106
DVB Bank SE | Group Annual Report 2014
Offshore Finance
Once a transaction has been booked, it is monitored for any required action on an ongoing basis by the respective relation-ship manager and credit officer, and through the review and stress test process. Frequent client calls take place with the obligatory involvement of credit officers in order to further elevate the risk dialogue with our clients. The stress testing procedure (stressing probability of default and valuations) is undertaken on a quarterly basis, with the results feeding into discussion with clients. In addition, there are continuous event-driven rating updates and reviews of the portfolio to refresh ratings and values. The Strategic Management & Restructuring Team of restructuring and work-out specialists is fully involved in the stress testing of the portfolio. If appropriate, an exposure is taken on to the Early Warning List, the Closely Monitored List, or Watch List reporting. In addition to the rigid call report discipline in place, the ongoing management of risk is supported by a full portfolio review from the Offshore Finance senior management, to proactively identify concrete actions to be taken. The Strategic Management & Restructuring Team provides dedicated support on all stressed/distressed loans, and manages all exposures on the Watch List report.
The above-mentioned protocols are geared towards early flagging of possible problems, and allocating adequate resources to assess, quantify, qualify and formulate an appropriate and swift response. With DVB’s risk management infrastructure, Offshore Finance will continue to take whatever steps are necessary to safeguard its position as a secured lender in all cases.
During 2014 no value maintenance clause breaches occurred in the Offshore Finance portfolio, and provisions for critical expo-sures were not needed. At the end of 2014, no loans were on the Closely Monitored List (2013: 3.5%). Some 1.9% of the port-folio was on the Watch List (2013: 2.0%) and no loans were classified as ”special credits” requiring close monitoring and a formal monthly review. Finally, 2.4% of the portfolio is being discussed by the Early-Warning Risk Management Forum. All of this monitoring materially decreases the likelihood of unpleasant surprises. To further illustrate the point: the loan-to-value ratio, one key metric of loan performance, has remained relatively constant over the last few years, currently standing at 54.4% (previous year: 54.0%). In total, 96.1% of the portfolio has a loan-to-value ratio below 60%.
DVB’s risk management infrastructure, its special offshore approach, and Offshore Research’s market know-how and tech-nical expertise, provide the Bank with exclusive positioning in the market, and is a source of lasting competitive advantage.
Risk management
Offshore Finance has built a strong risk culture, which starts with our client-facing relationship managers and continues through each stage (including Shipping & Offshore Credit, Shipping & Offshore Research and Credit Committee assessments) until a new commitment is granted, and continues thereafter throughout the term of the relevant exposure through constant vigilance, thorough loan management and continuous monitoring of the overall portfolio health.
At the heart of our consideration for each new exposure is the New Deal Committee, which meets to discuss each possible new transaction at an early stage, with a view to spotting risk and structural deficiencies – finally arriving at a consensus, be it positive or negative. The committee comprises the Member of the Board of Managing Directors responsible for Shipping Finance and Offshore Finance and the Head of Shipping & Offshore Credit. Shipping & Offshore Research is fully involved in the credit pro-cess, providing market research, commentary and research on all the technical aspects of the respective assets, in order to flag any possible negative effects on the tradability and value of the assets under consideration for financing. Only those trans-actions authorised by the New Deal Committee will move to the next stage, and will subsequently be presented to the Shipping & Offshore Credit Committee. Over certain thresholds, some deals will require further approval of the Board of Managing Directors – and in a few cases, the Supervisory Board’s Credit and Risk Committee.
Extract from Offshore Finance’s segment report
€ mn 2014 2013 %
Net interest income 26.3 31.1 –15.4
Allowance for credit losses 0.0 –0.5 –
Net interest income after
allowance for credit losses 26.3 30.6 –14.1
Net fee and
commission income 18.6 19.0 –2.1
Results (excluding
the IAS 39 result) 44.9 49.6 –9.5
General administrative
expenses1) –5.1 –5.1 –
Net segment income
before taxes 40.3 44.7 –9.8
1) Only those costs are allocated to DVB’s operating business divisions for which they are directly responsible. General costs of operations, overheads, or, for example IT costs, are not allocated to the operating business divisions.

107
DVB Bank SE | Group Annual Report 2014
C ONSOL IDAT ED F IN A NCI A L S TA ME MEN T S
AUDI T OP INIONA B OU T US
Offshore Finance
Offshore Finance – Outlook 2015
Market outlook 2015
The low oil price environment prevailing at the end of 2014 and the beginning of 2015 is having a negative impact on E&P spending, with oil and gas companies cutting costs even more than expected. While we expect the oil market to remain demand driven in 2015, we see upward potential from the US$40–50/bbl oil price level observed at the start of the year. Although a slowdown in E&P spending was expected for 2014, the extent of the reduction in spending was greater than anticipated. As a consequence, demand for all offshore asset types is expected to be even lower than previously forecasted. Demand in regions with comparatively higher oil price breakevens such as the North Sea, West Africa or Brazil is likely to be more affected than lower-cost regions such as the Middle East. Drilling units and anchor handling units are expected to suffer the most as explo-ration activities continue to be postponed or cancelled.
Meanwhile, large orders were placed in previous years on the back of higher demand growth assumptions. Fleet growth is thus expected to outpace demand growth in 2015 for most offshore sectors. Competition is anticipated to be strongest in the sectors with large order books such as jack-ups, floaters and platform supply vessels.
In order to mitigate the influx of new tonnage in the fleet, ship-owners are to take supply adjustment measures, such as scrap-ping or idling of older units, as well as delaying of new deliveries. However, these supply adjustment measures will not be sufficient to match the decrease in demand, hence fleet utilisation is still expected to decrease. This will put downward pressure on day rates and asset values. Older assets are expected to suffer the most, as they will compete with more sophisticated units which will settle for lower day rates to maintain utilisation.
Portfolio outlook 2015
An important driver for the offshore industry is the oil companies’ exploration and production spending, which in 2013 was already falling in terms of gross numbers. This reduction in spending continued throughout 2014, and accelerated with the sharp reduction in the oil price during the second half of 2014 and first quarter of 2015.
Against this background, Offshore Finance’s future agenda is:
• Being among the world’s highest ranking and most integrated providers of debt financing, advisory services, participant/underwriter of bond issues, as well as market, industry and product intelligence;
• Having a market presence in those regions of the world where the major owners are based;
• Enjoying a high level of reputation and visibility in global off-shore hubs and forums, and being recognised as a financial solutions-oriented lender with the highest level of business integrity;
• Adequately expanding the existing loan portfolio by financing modern and diversified assets, all based on a conservative but acceptable loan-to-value ratio and repayment mainly through fixed cash flow/employment;
• Fully securing loans, both by the assets mentioned and assignments of charter hire etc.; and
• Focusing more on the arranging and leading roles of offshore transactions, ideally concluded as bilateral or club deal trans-actions, rather than a pure participating role.
The Offshore Finance portfolio is expected to grow modestly in the coming year, during which the Bank will apply a cautious approach when assessing the relevant market segments and new finance transactions. The offshore market is well entertained by the banking industry and other energy specialty financiers, as well as other capital markets sources. We expect some down-ward pressure on loan margins for tier-one clients but the level of loan prepayments and refinancing caused by the capital markets such as high-yield bonds will slow down.
Furthermore, we fully expect 2015 to offer good opportunities for full-recourse transactions, structured debt financings, advi-sory and capital markets business tailor-made for current mar-ket conditions. Getting into the year, we will strive to further optimise our resources, enhance the credit quality of the portfolio, and continue to monitor our risk positions relentlessly. This can partly be achieved by doing business with existing clients, and by sourcing business opportunities within a target group of new clients. The Division will continue to strengthen its capabilities of providing added-value services in order to diversify and increase its non-lending and non-capital binding revenues. This will confirm us as a long-term strategic partner, for the mutual benefit of the Bank and our clients.
GROUP M A N AGE M E N T R E P OR T
DEVELOPMENT OF THE BUSINESS DIVISIONS

108
DVB Bank SE | Group Annual Report 2014
Land Transport Finance
large acquisition transactions showed the attractiveness of the European rolling stock leasing business, also to foreign investors. The challenging situation of the rail freight market was again reason enough for a sustained and healthy aversion to placing (speculative) orders. Planned standard gauge freight car deliveries were still at a level half of the replacement need. New locomotive deliveries slightly increased, to 62.8% of the replacement need. 24.7% of these locomotives were destined for leasing companies, leading to an increasing market share of the locomotive lessors.
Rail freight – North America
The number of carloads increased significantly by 3.7% and intermodal transport was again thriving with a growth of 5.4% according to the Association of American Railroads. In Canada and the US, total carloads were still down 9.6% from the 2006 record level, but the intermodal business achieved a new record at 12.2% more shipments compared to the pre-recession record level of 2006. Coal is to blame for most of the carload decline in the US – the 22.0% lower level compared to its peak in 2008 is predominantly due to reduced demand from coal-fired power plants resulting from lower natural gas prices and more stringent environmental regulations. Locomotive manufacturers built 40.2% more locomotives above the replacement need, thereby reaching the pre-crisis levels of 2006 and 2007. Freight car manufacturers still have a full tank car order book for the next two and a half years, due to the oil exploration boom and expected stricter tank car regulations that will mandate safer tank cars in flammable liquids service, although the exact new rules have not been set yet.
In a market environment characterised by economic conditions which were not always positive, our Land Transport Finance division was active throughout 2014 on all our target markets, and once again achieved very good results. To us, this is a clear signal that our sustained specialisation and focus continues to be recognised and appreciated by the market.
Land Transport Finance – Market review
2014 gave a positive picture across the board: the most recent – preliminary – statistics indicate strong growth in the North American and Australian rail markets and slow growth in the European rail market, following the GDP development on these continents. Equipment orders more or less followed the same pattern, although a slower growth path led to significantly lower rail freight rolling stock investments in Australia. Lease rates and utilisation rates went up in North America, but stayed flat in Europe and Australia. Compared to other transportation modes, the rail business experiences some headwinds from higher costs of infrastructure usage and the introduction of new regulations and taxes, although rail is the least polluting of all transport modes.
Rail freight – Europe
Although full-year statistics are lacking, company results do suggest that 2014 was another year on the road of recovery. However, the rail freight business was still 5.5% below its peak in 2007. On the merger and acquisition front, the incumbent rail-way companies kept fairly quiet. Only Poland-based PKP Cargo acquired 80% of Czech Republic-based Advanced World Transport, one of the largest privately owned railway companies. Some

109
DVB Bank SE | Group Annual Report 2014
C ONSOL IDAT ED F IN A NCI A L S TA ME MEN T S
AUDI T OP INIONA B OU T US
Land Transport Finance
Rail freight – Australia
For their reporting year 2013/2014 (ending on 30 June 2014), Australia’s two largest nationwide operating rail freight com-panies reported on average a year-on-year increase of 6.4% in moved tonnage, especially because of growth in the transport of coal, iron ore and steel. However, less other freight commodities were transported. In its financial year 2013/2014, the Australian Rail Track Corporation reported a year-on-year increase of 1.8% in volume on the interstate network. Coal volumes in the Hunter Valley continued to grow with 8.7%.
Passenger rail – Europe
Statistics from Destatis in Germany and the rail regulator UTK in Poland show that there was a slight increase of 0.9% of passen-ger train kilometres for the first three quarters of 2014 compared with 2013. For the same period, the Office of Rail Regulation in the UK reported an increase of 0.7% in timetabled passenger train kilometres. This reflects the improved economic develop-ment. Especially at the end of the year, there was considerably more open-access, commercial passenger train competition to
be seen in the Czech Republic, Slovakia, Romania and France, all performed by existing companies. However, Ostseeland-Verkehr GmbH had to cease its intercity trains in Germany because of fierce competition by the newly introduced long-distance bus services.
Passenger rail – North America
For the third year in a row, the American Public Transportation Association recorded a ridership increase across the board in the US. Amtrak carried 0.2% more passengers in its 2014 fiscal year that ended 30 September 2014, the most the railroad has ever carried since its creation in 1971. ’All Aboard Florida’, the first privately-owned intercity passenger rail project in the US in modern times, announced it will start operating via existing rail infrastructure in Florida in 2016.
Further details on land transport market developments in 2014 can be found on DVB’s website www.dvbbank.com >
Business & Expertise > Land Transport Finance > Markets.
100,000
80,000
60,000
40,000
20,000
0
77,000
2006
63,156
2007
60,145
2008
22,004
2009
16,628
2010
47,346
2011
58,902
2012
52,879
2013
67,027
2014
85,612
2015f*
US freight car deliveries
Units
*2015 figures forecasted Source: Rail Theory Forecasts, January 2015
GROUP M A N AGE M E N T R E P OR T
DEVELOPMENT OF THE BUSINESS DIVISIONS
110
DVB Bank SE | Group Annual Report 2014
Land Transport Finance
Supported by the factors outlined above, and thanks to the consistent dialogue and close co-operation with our clients, we once again successfully originated new business throughout 2014. We aim to further expand our market presence in our three mature target regions. In a rail sector that is increasingly global, we are in a position to offer synergy effects to our clients. At the same time, the diverging momentum in the three regions further helps to diversify our portfolio.
Our relationship managers in Frankfurt/Main and New York continued to support our clients throughout 2014, working with them to originate tailor-made financing solutions. We will main-tain this regional team structure. Clients and our financing partners continued to appreciate our specialist focus on asset finance and related services. They value the commitment and know-how of all our team members, which translates into a real competitive advantage for us. Our Land Transport Research supports us, with strategic and operational intelligence, in every loan approval and risk decision we take. In the context of key projects, our Research also provides market analysis directly to clients. Collaboration with the Bank’s other service teams is increasingly important, especially with DVB Corporate Finance and the Financial Institutions team. We successfully acquired Corporate Finance mandates in Europe and North America during the year under review. Moreover, we took on board various new approaches as well as some very promising projects that we intend to develop into new business in the years ahead.
Land Transport Finance – Strategy
Our internationally unique Land Transport Finance platform forms a sound and competent base for our leading market position. Our business model encompasses research, advisory and financing activities on the international transport markets – specifically in the three developed core regions of Europe, North America and Australia. Once again, during 2014 we were one of the few financiers that consistently supported market participants – reliably, and across regions. This business approach has proven very positive for our clients as well as for the Bank.
From a strategic perspective, our Transport Finance business is focused on our strengths, relying on material asset-finance principles as matter of course. The following aspects are derived from our business model and represent key success factors, both individually and in combination with each other:
Internal factors Market factors
• The flat hierarchy within DVB,
which allows for short and direct
decision-making processes;
• Our flexibility and ability to quickly
act on the markets we cover;
• the conservative risk approach,
which benefits us considerably
for credit assessment and in
managing our exposure;
• our detailed and profound
knowledge of markets, financed
assets, clients, trends, and
current and expected transport
asset performance;
• the consistent and reliable
responsibility taken by the
Land Transport Finance team
for transaction execution;
• our commitment and creativity
in structuring transactions for
clients;
• our cost discipline and careful
consideration of the risk-return
ratio.
• the close integration with DVB
Corporate Finance and Advisory,
to optimise the range of products
and services we offer to our
clients.

111
DVB Bank SE | Group Annual Report 2014
C ONSOL IDAT ED F IN A NCI A L S TA ME MEN T S
AUDI T OP INIONA B OU T US
Land Transport Finance
Overall, our Land Transport Finance clients can readily draw upon the following range of specialised products and services, in order to fulfil their differing requirements:
• Structured Asset Financing, providing asset-based lending, secured by rolling stock, by means of various financing struc-tures, be it of a shorter nature (such as bridging facilities) or complex, structured mid- to long-term asset financing solutions;
• Risk Distribution, syndicating portions of the lending volume to other financial institutions on the international banking market;
• Corporate Finance Solutions, supporting our clients in the identification of new and diverse sources of funds in the capital markets, and accessing those funds on favourable terms; as well as providing M&A and restructuring advice as well as arranging debt and equity financings;
• Private Equity Sourcing & Investments, via the Shipping & Intermodal Investment Management team, managing the Stephenson Capital Funds (invests in rolling stock);
• Asset & Market Research, supporting our strategy and financing activities with a core focus on the land transport market.
We still firmly believe that the clearly advanced maturity of the markets we cover is a positive aspect. We recognise the growing cyclicality of the market segments: thanks to our research we are able to better identify new business opportunities. Our clearly defined set-up in the asset finance world, and our cycle-neutral strategy, have both yielded good results over the past years. The continuity of our market approach and our proven competence keep paying off.
Despite various challenges, we see good opportunities in the markets we cover: we will master future developments with flexibility and broad-based know-how. Against this background, we are confident that we will continue to command a prominent position in the Land Transport Finance markets, to the benefit of our clients, the diversification of our portfolio – and ultimately, for the Bank’s profitability.
Land Transport Finance – Mission Statement
We value our client relationships highly. The goal is to increase our client franchise as the leading financing partner in the rail asset markets in our core regions. Based on our
• unique understanding of the market,• business focus,• a continuous capacity to execute transactions, and• flexibility,
we offer added value by
• advising on intelligent asset finance solutions; and• taking on appropriate risk exposures that capitalise on
the cyclical nature of the underlying sectors.
GROUP M A N AGE M E N T R E P OR T
DEVELOPMENT OF THE BUSINESS DIVISIONS

112
DVB Bank SE | Group Annual Report 2014
Land Transport Finance
collateral has the extra benefit of high operational and technical efficiency. This makes the asset class attractive, even in the event of potential collateral recovery if fleets are repossessed or remarketed/redeployed.
The portfolio share of locomotives rose to 20.2% (2013: 14.9%), whilst the share of regional trainsets remained stable, at 15.4% (2013: 15.5%). The market for road assets is still saturated in many segments, given the size of existing fleets. The portfolio share of road vehicles declined to 8.7% (2013: 9.4%), due to repayments.
Due to some larger-sized transactions during 2014, the average lending exposure per client moved up to €43.4 million (2013: €34.3 million). With 13 clients (2013: 10 clients) having exposures in excess of €50 million. We do not perceive any indications for elevated cluster risk.
Land Transport Finance – Portfolio Analysis
Total loan portfolio
Total customer lending amounted to €2.0 billion at the end of 2014 (2013: €1.6 billion). 54.6% of the lending exposure was to European clients (down 2.6 percentage points), whilst loans to clients domiciled in North America accounted for 41.2% (up 3.4 percentage points year-on-year). Accounting for 2.9% of the total portfolio, lending to Australian clients was marginally lower than in the previous year (down 0.6 percentage points). Clients from Central America had a 1.3% share, down 0.2 percentage points year-on-year.
In respect of the overall portfolio, 91.3% of the transactions (2013: 90.2%) related to rail assets. 54.6% of the rail portfolio was attributable to the freight car asset class (2013: 58.2%). Not only is this high percentage unproblematic, it is in fact desired: thanks to their granularity, freight cars are an asset class with an excellent risk profile – moreover, one that is diversified in many ways, by borrower, lessee, rail car type, vintage and region. While being a rather ”low-tech” vehicle – having no self-propul-sion or signalling equipment – the freight car as equipment and
On rail 91.3%
thereof:
54.6% Freight cars
20.2% Locomotives
15.4% Regional passenger train sets
0.9% Passenger coaches
0.2% City/commuter traffic
On road 8.7%
thereof:
8.4% Container chasis
0.3% Tank container
Land Transport Finance portfolio by asset type
Europe 54.6%
North America 41.2%
Australia/Occeania 2.9%
Cental America 1.3%
Land Transport Finance portfolio by country risk

113
DVB Bank SE | Group Annual Report 2014
C ONSOL IDAT ED F IN A NCI A L S TA ME MEN T S
AUDI T OP INIONA B OU T US
Land Transport Finance
New business
Loan portfolio development
During 2014, our Land Transport Finance business developed very favourably. Land Transport Finance was thus able to close 17 new transactions with a total volume of €562.5 million (2013: 16 transactions with a volume of €434.7 million) in Europe and North America. Our new business volume was thus once again clearly above the average established over several years. Essen-tially, it was based on three economic scenarios:
• the need to refinance existing loans for rolling stock;
• a slightly increased propensity to invest, especially in the North American rail market, and
• replacement investments of fleet owners in their rolling stock.
During 2014, new rolling stock investments were once again below the levels seen prior to the economic crisis – particularly in Europe. The US, however, saw a recovery in new orders for freight cars, not least due to the energy boom triggered by frack-ing of shale oil. Some larger-sized fleet disposals by lessors – or even company sales – were observed during the course of the year – in some cases in order to realise higher values, to imple-ment strategic changes, or to faciliate succession arrangements. On this basis, we once again concentrated on financings in the primary markets. We also closed one secondary market trans-action.
As in the previous year, the lending transactions we closed suc-cessfully were all secured by first-ranked collateral. Specifically, we arranged and participated in bilateral loans and larger-sized credit facilities on the basis of club deals. We also entered into non-recourse transactions with special purpose entities and successfully structured solutions for operating leases. Within the scope of non-recourse transactions, we also assumed implied exposures to the funded rolling stock ourselves.
We worked closely with Land Transport Research regarding all transactions, jointly assessing the projected performance of the relevant transport assets, the specific features of the type of asset, the current supply and demand situation, future market movements and external trends. These analyses also incorporated regulatory aspects and expected technical changes, since they also determine the potential for remarketing on the secondary market, as well as future lease rates.
GROUP M A N AGE M E N T R E P OR T
DEVELOPMENT OF THE BUSINESS DIVISIONS

114
DVB Bank SE | Group Annual Report 2014
Land Transport Finance
• Facility Agent and sole lender in a long-term, asset-based amortising loan, as part of a multi-tranche transaction for the acquisition of used freight cars. The transaction enabled this key American client to further diversify its leasing fleet of standard freight cars in an important industrial segment.
• Facility Agent and Security Agent as well as co-lender of a long-term credit facility secured by first-ranking collateral, within the scope of a bank club deal, to finance the construc-tion and initial leases of modern multi-system locomotives in Europe. This transaction was ground-breaking since it facili-tated the establishment of a new locomotive leasing company, in co-operation with a strong international equity investor.
In November 2014, DVB’s Land Transport Finance team once again received two significant awards from ”Global Transport Finance”, a renowned international trade publication:
• Rail Finance Innovator of the Year • Rail Finance Deal of the Year (Europe)
New business we originated during 2014 exclusively consisted of rail asset transactions, with no transactions for rail-related vehicles.
• Financings of new or used freight cars and of new locomotives constituted the backbone of rail asset finance: at 51.7%, freight car financings continued to account for the largest share of new Land Transport Finance business, in line with the Bank’s strategy, followed by transactions involving loco-motives (36.4%). 11.9% of new business volume related to passenger train sets, reflecting the rising importance and momentum of this growing European rail transport segment.
• There were no financings of rail-related transport assets or container chassis during 2014. Notwithstanding the planned further diversification of the Land Transport Finance portfolio by boosting the share of this market segment, its actual port-folio share declined due to repayments.
Some key Land Transport Finance transactions entered into in 2014 are:
• Co-arranger and Security Agent of a bank club deal for the leading European lessor of passenger train sets and locomo-tives. This involved a large-sized amortising credit facility to finance the purchase of 35 brand-new Stadler Flirt electrical train sets (Electric Multiple Units or ”EMUs”). The transaction permitted the client to strengthen its market position, and to offer the lessee an operating lease structure providing relief in terms of balance-sheet usage.

115
DVB Bank SE | Group Annual Report 2014
C ONSOL IDAT ED F IN A NCI A L S TA ME MEN T S
AUDI T OP INIONA B OU T US
Land Transport Finance
Deal of the year 2014
The Florida East Coast Railway (FECR) founded in 1895 is a 351-mile freight rail line located along the east coast of Florida. It is the exclusive rail provider for Port Miami, Port Everglades, and Port of Palm Beach. FECR connects to the national railroad network in Jacksonville, Florida, and provides carload and door-to-door intermodal solutions across North America to customers who demand cost-effective and premium-quality service.
FECR entered into an agreement to purchase 24 GE ES44C4 Evolution Series Tier 3 locomotives from GE Transportation in January 2014. DVB was able to provide the financing for this equipment in June. We closed the transaction in October 2014 as the sole arranger and lender in a fully amortising loan, that included three separate delivery dates prior to year-end.
The GE ES44C4 is the latest Evolution Series locomotive offered by General Electric, providing lower maintenance costs and fuel savings. Furthermore, these locomotives are being built as ”LNG-ready”, allowing optionality between the use of diesel or natural gas as fuel, further reducing costs for the railroad. FECR was the first railroad to be selected by the Federal Railroad Adminis-tration for testing of the LNG fuel, ahead of any Class I railroad.
With this successful transaction, DVB once again proved its capacity to combine client relationship management with the assessment of a fleet of innovative assets, and its execution capability.
Land Transport Finance – Deal of the Year 2014
GROUP M A N AGE M E N T R E P OR T
DEVELOPMENT OF THE BUSINESS DIVISIONS

116
DVB Bank SE | Group Annual Report 2014
Land Transport Finance
Earnings contributions
In an environment that was once again challenging, total income again increased – compared to the successful results of the previous year – by 12.7% to €23.9 million (previous year: €21.2 million). Net interest income after allowance for credit losses rose slightly by 12.2%, to €16.6 million (previous year: €14.8 million). The fact that allowance for credit losses for Land Transport Finance only increased slightly was positive and note-worthy. Given the relatively low market cyclicality of rail assets, transactions in Land Transport Finance are generally less prone to risks than financings in other transport sectors. Total allowance for credit losses in Land Transport Finance as at 31 December 2014 therefore amounted to a minimal €1.9 million (previous year: €1.6 million). Moreover, net commission income rose from €6.4 million to €7.2 million, up 12.5%. The segment result before taxes amounted to €20.0 million, a 11.7% increase on the previous year’s result of €17.9 million.
Extract from the segment report for Land Transport Finance
€ mn 2014 2013 %
Net interest income 16.7 14.8 12.8
Allowance for credit losses –0.1 0.0 –
Net interest income after
allowance for credit losses 16.6 14.8 12.2
Net fee and
commission income 7.2 6.4 12.5
Results (excluding
the IAS 39 result) 23.9 21.2 12.7
General
administrative expenses1) –3.9 –3.3 18.2
Segment result before taxes 20.0 17.9 11.7
1) Only those costs are allocated to DVB’s operating business divisions for which they are directly responsible. General costs of operations, overheads or, for example, IT costs are not allocated to the operating business divisions.
117
DVB Bank SE | Group Annual Report 2014
C ONSOL IDAT ED F IN A NCI A L S TA ME MEN T S
AUDI T OP INIONA B OU T US
Land Transport Finance
Risk management
99.3% of the Land Transport Finance portfolio is collateralised by assets (previous year: 99.1%); other collateral accounts for an unchanged 0.4% of the total volume, while unsecured business was below the previous year’s level, at 0.3% (previous year: 0.5%). There was little change in the risk situation in our target markets of Europe, Australia and North America during 2014.
Being acutely aware of risks is a material element of our work when entering into a transaction, as well as when monitoring existing exposures. Our credit approval process, which may include up to three levels, includes an extensive analysis of each new exposure regarding the risk factors it may be exposed to. All potential new transactions are first discussed in weekly Deal Committee meetings, attended by the responsible member of the Board of Managing Directors, the entire Land Transport Finance team as well as Land Transport Credit and Land Transport Research. Transactions that are given the ”green light” in these meetings are then finalised in negotiations with the client, and – if approved – submitted to the entire Board of Managing Directors for approval. Where required by the Land Transport Finance lending policy, new transactions also need to be approved by the Supervisory Board’s Credit Committee. Decisions on new exposures always require an independent opinion from Land Transport Research.
Furthermore, once a new transaction has been booked, the port-folio is constantly reviewed and categorised by risk class. During phases of increased risk relevance, the portfolio is run through the early warning system (with finance projects tagged green, amber, or red), with higher risk deals added to the Closely Moni-tored List or the Early Warning List, and ultimately – where and when required for critical transactions – placed onto the Watch List.
The risk levels within our portfolio – due to the higher intrinsic stability of the land transport markets compared to other sectors – are comparatively low. This was evident in 2014, too:
• Thanks to tight and pre-emptive internal risk control man-agement, the improved market environment, and due to our moderate appetite for risk, we only needed to assign a small number of clients to higher risk groups.
• Only a minimal addition to allowance for credit losses (amounting to €0.1 million) was required for Land Transport Finance exposures at the 2014 year end.
• One transaction that had been restructured several years ago finally provided a payoff – the sale of the underlying freight car fleet not only allowed for repayment and yielded excess proceeds, it also allowed for a reversal of the allowance for credit losses recognised at the time.
• We recognised allowance for credit losses in a minor amount for a mid-sized transaction, following the initiation of insol-vency proceedings for a remote parent entity of the borrower. Since the borrower has continued to perform on its contrac-tually-agreed debt service obligations, we do not see any need for further measures at this point. The amount recog-nised only slightly exceeds the allowance for credit losses previously reversed for Land Transport Finance during the course of the year.
As in the previous year, there were signs of a plateau forming in the rail transport segment as a whole, with increases in asset values in some asset sectors roughly exceeding losses in others. The outlook for the North American market was positive. On average, the renewal lease rates for rolling stock leasing in North America were slightly higher than the terms for maturing transactions, whilst in Europe they were stable on average. Fleet utilisation was unchanged, providing grounds for hope that the market will soon be past the trough. There was increased lessor demand for still-available chassis portfolios in North America and stable demand from lessees.
GROUP M A N AGE M E N T R E P OR T
DEVELOPMENT OF THE BUSINESS DIVISIONS

118
DVB Bank SE | Group Annual Report 2014
Land Transport Finance
retrofitting, reassigning or scrapping tank cars for hauling flammable liquids (with new regulations expected in 2015 after the tragic accident in Lac-Mégantic, Canada, in 2013), installing positive train control systems and increasing train staff and locomotive capacity will be predominant themes in 2015. The latter will be a challenge, since only one manufacturer is able to offer Tier 4 emission-compliant main-line diesel freight loco-motives.
For Europe, Progtrans expects a 1.3% rail freight performance (tonne-km) growth p.a. between 2015 and 2050 and SCI Verkehr of only 1.1% p.a. up to 2022. Specific for Germany, Intraplan Consult and Ralf Katzenberger are a bit more positive, with an expected rail freight growth of 2.9% (tonne-km) and a rail pas-senger growth of 1.6% (passenger-km) in Germany in 2015. The International Union of combined Road-Rail transport companies has stated a slightly positive business outlook for intermodal transport up to 30 September 2015.
In North America, transportation intelligence firm FTR reports a backlog of almost 125,000 freight cars to be built. This could take up to one and a half years to accomplish. Freight car pro-duction has seen uncertainty creep into its boom – with the open questions on shale oil production and capital expenditure – not to mention the still-to-come new federal regulations on crude oil and ethanol tank cars.
Since by far the majority of the coal and iron ore is transported by rail from the mines to the ports, the Australian rail freight performance is closely linked to the development of coal and iron ore exports. The Australian Bureau of Resources and Energy Economics forecasts iron ore volumes to increase by 12.8% per cent in the business year ending on 30 June 2015. The projections for metallurgical coal suggest a growth by 2.4% and for thermal coal by 1.1%. It is to be seen whether the Chinese import duties on coal can be offset by the weakening of the Australian dollar.
Land Transport Finance – Outlook 2015
Market outlook 2015
Judging by the projected economic growth rates of the geo-graphic areas Land Transport Finance is active in and the general positive correlation between economic development and rail freight and rail passenger volumes, 2015 is likely to be a year of various stages of growth for DVB’s key land transport segments. The International Monetary Fund forecasts a gross domestic product growth of 1.2% in the euro zone, 2.3% in Canada, 3.2% in Mexico, 3.6% in the US, and the Reserve Bank of Australia gives a range of 2–3% for Australia.
Transport price, lease rate and utilisation rate increases can be expected across the board. Railroading will still be a loss-making business for many of the railway companies in Europe, but could again turn out to be profitable in Australia and North America. Still quite a few Central and Eastern European governments will have their ailing rail freight companies for sale. Judging on com-pany information, more open-access competition on the passen-ger market is to be expected in France, Germany, Slovakia and Sweden. Germany-based rail consultant SCI Verkehr expects the European rail market – which is still the largest in the world – to annually grow by 3.2% (Western Europe) and 2.2% (Eastern Europe) between 2014 and 2018, the North American by 3.3% and the Australian by 0.6%. About a quarter of the respective rail market investments will be in new rolling stock. In Europe, except for train set deliveries, new rolling stock deliveries will likely continue to be very far off from replacement needs, since existing equipment has to be (and will be) utilised first. The focus with freight car investments in Europe will be on silencing wagons to avoid railway companies to be penalised for noise (three countries in Europe already do so and Switzerland has posed a ban on noisy wagons to be used as from 2020 with Germany likely to follow). The trend in Australia will be to con-centrate on better utilisation of equipment. In North America

119
DVB Bank SE | Group Annual Report 2014
C ONSOL IDAT ED F IN A NCI A L S TA ME MEN T S
AUDI T OP INIONA B OU T US
Land Transport Finance
Portfolio outlook 2015
Structured asset financing remains our core business. We have started the new year with a satisfactory transaction pipeline in all our core markets, and anticipate a positive business develop-ment. At the same time, we envisage some challenges ahead. On the one hand, the propensity to invest in new rolling stock in European and Australian land transport markets still falls short of precrisis levels. On the other hand, the much cheaper liquidity available on the financial markets increasingly leads market par-ticipants to refinance existing exposures.
We expect the following trends to determine land transport finance markets during 2015:
• Demand for asset-based finance in Europe will remain intact for freight cars and locomotives in particular. Long-term financings for passenger train sets are expected to be increasingly covered by new financing models involving the public sector.
• In North America, we identify an increasing need for new freight car purchases. This is expected to stimulate market momentum.
• Demand for new rolling stock in Australia – such as new locomotives and efficient railcar fleets for transporting raw materials – is currently weakening.
• We also see good opportunities for advisory mandates, increasingly for capital market transactions.
We are generally optimistic with regard to the development of our high-quality portfolio, with rail assets set to remain the division’s strongest pillar in 2015. Strategically important transactions are expected to materialise in this segment in the years to come.
In spite of persistent economic weakness in some markets, we anticipate low risks for our portfolio. Our business is supported in principle by the inherent long-term stability of the land trans-port sector. Portfolio management remains a top priority in our business. We will adhere to our policy of maintaining tight risk analysis, to prevent such risks in our business that have materi-alised as a consequence of increased cyclicality in the land transport markets, and due to macroeconomic changes. For 2015, we expect the composition of our portfolio – by regions, clients, and market segments – to develop consistently, therefore remaining largely unchanged at current diversification levels. Given that the economic outlook for North America is still brighter than for Europe and Australia, we are confident that we will be able to expand the share of portfolio exposures there.
Lending and other services provided within the scope of our Land Transport Finance platform will remain in demand during the forecast period. Our long-term client relationships have proven to be very sustainable in our business. We enjoy an excellent market reputation – whereby we are seen time and again as a reference bank – and continue to retain a clear focus on our core business. These factors remain crucially important, especially during challenging times. Therefore, we are con-vinced that we will be able to preserve our leading position in the market during 2015.
GROUP M A N AGE M E N T R E P OR T
DEVELOPMENT OF THE BUSINESS DIVISIONS

120
DVB Bank SE | Group Annual Report 2014
Financial Institutions
finance volumes increased to their highest level since 2008, with the total volume of syndicated loans in shipping and off-shore markets reaching €34.1 billion. This reflects a 5% increase on 2013. Of this amount, however, traditional shipping loans were significantly higher in volume terms, at €27 billion, with volumes for offshore at €7 billion.
As was the case in 2013, lenders active in shipping and offshore finance continued to target top-tier clients; however during 2014 we saw ticket sizes increasing. The two-tier market we saw in 2013, with top names commanding significantly lower pricing and more aggressive structures remained intact during 2014. Regional disparity further increased pricing differences, with top Asian and US companies commanding significantly lower pricing than seen in other regions.
During 2014 some traditional shipping and offshore lenders returned to the market. This resulted in lenders taking some underwriting capacity for investment grade clients and project style financings in offshore, which were oversubscribed. Club and bilateral deals, however, remained the focus for lenders, especially for relationship clients. The impact of the European Central Bank’s asset quality review and stress tests did affect lending, especially amongst German banks. These institutions continued to seek innovative ways to reduce their shipping port-folios during 2014. A reduction in the oil price also led to some banks reviewing their offshore portfolios towards the last quarter of 2014 and taking a more cautious approach to this sector.
DVB’s skills and expertise as an arranger and syndica-tor means that clients can rely on DVB to place their financing requirements. During 2014, the Financial Institutions team, responsible for all third-party finan-cial institution relationships and sell-down efforts, continued to successfully raise bank debt for trans-actions across DVB’s four Transport Finance divisions.
Financial Institutions – Market review
Global syndicated loan volume increased to €3.8 trillion in 2014, representing a 22.6% increase on 2013 figures of €3.1 trillion. The 2014 figure is the highest annual volume since 2007, reflecting improved liquidity in the bank market. By region, syndicated loan volume in Europe/Middle East/Africa increased the most by 57.1% to €1.1 trillion (previous year €0.7 trillion). In North and South America, the volume grew to €2.1 trillion (previous year: €1.8 trillion). In Asia/Pacific the loan volume remained constant at €0.6 trillion.
The syndicated deal volume in transportation finance (including shipping, aviation, offshore, and rail asset finance) increased by 11.1% to €59.9 billion in 2014, compared to €53.9 billion in 2013.
During 2014, improved liquidity has meant that ship financing banks have continued to increase their activity in shipping and offshore, albeit selectively. As a result, syndicated marine
4.0
3.0
2.0
1.0
0.0
0.7
0.5
1.0
2010
0.9
0.6
1.6
2011
0.6
0.6
1.4
2012
0.7
0.6
1.8
2013
1.1
0.6
2.1
2014
North and South America Asia/Pacific Europe/Middle East/Africa Source: Dealogic, January 2015
Global syndicated loan volume per year
€ trillion

121
DVB Bank SE | Group Annual Report 2014
C ONSOL IDAT ED F IN A NCI A L S TA ME MEN T S
AUDI T OP INIONA B OU T US
Financial Institutions
Government lending and guarantees via export finance houses, together with bonds, still supported the ship finance market in 2014 together with capital market products. The funding gap caused by lenders which exited or ceased their activities as from 2008 was still to be felt, especially for clients with weaker balance sheets. Private equity also continued to increase its share of shipping portfolios during 2014. This was more focused on strategic participations in joint ventures with shipowners rather than the acquisition of distressed loans in the secondary market or the acquisition of portfolios from lenders exiting shipping.
Aircraft financing continued to see an abundance of liquidity in 2014, fuelled by increased competition on opportunities from new and existing lenders. This resulted in reduced pricing levels, advance levels increasing and some loan covenant deterioration, notably for top-tier airlines and aircraft lessors. However, trans-actions involving non-investment grade borrowers, mature aircraft and non-recourse residual value risk have continued to remain challenging for most lenders.
In addition to commercial bank debt, aircraft financing also relied on sources such as capital markets and (to a lesser extent) export credit financing, which also contributed to increased liquidity in the market. The enhanced equipment trust certificates, asset-backed securities and corporate bond market remained buoyant in North America and offered qualifying airlines/lessors a com-petitive funding alternative to the traditional commercial bank debt, adding to the pressure on pricing.
In the rail industry, liquidity was available in abundance; though lenders remained relatively tight on limited recourse deals – banks still being very selective when lending on an rail asset finance basis – most of the banks showed an increased interest in either (quasi) public finance character deals (e.g. European passenger rail initiatives) or transactions with more corporate lending flavour (e.g. on-balance-sheet financings or larger port-folio deals). The market was also influenced by the capital markets and asset-based structures (primarily in the US). Again, during 2014, a number of new institutions looked at the sector, a few of which had left the scene during financial crisis, and came into some rail deals.
Financial Institutions – Strategy
During 2014, the Financial Institutions team supported DVB’s core business activities in Shipping Finance, Aviation Finance, Offshore Finance and Land Transport Finance. Strong relation-ships with other institutions ensured that sufficient third-party bank debt liquidity was identified, thus adequately transferring risk from DVB’s lending book.
The key drivers that Financial Institutions has used to formulate its successful strategy are the following:
• Maintaining and expanding relationships with financial institutions;
• Developing and maintaining a good understanding of each financial institution’s risk appetite and requirements;
• Ensuring close co-operation with DVB’s global transport finance network, research and advisory teams
• Providing competitive pricing structures based on up-to-date information; access to global networks and ad-hoc analysis;
• Empowering effective management and monitoring of the syndication process; deploying a personalised, bespoke approach towards the banking partners;
• Understanding the wider economic conditions and how they affect transportation financing.
GROUP M A N AGE M E N T R E P OR T
DEVELOPMENT OF THE BUSINESS DIVISIONS
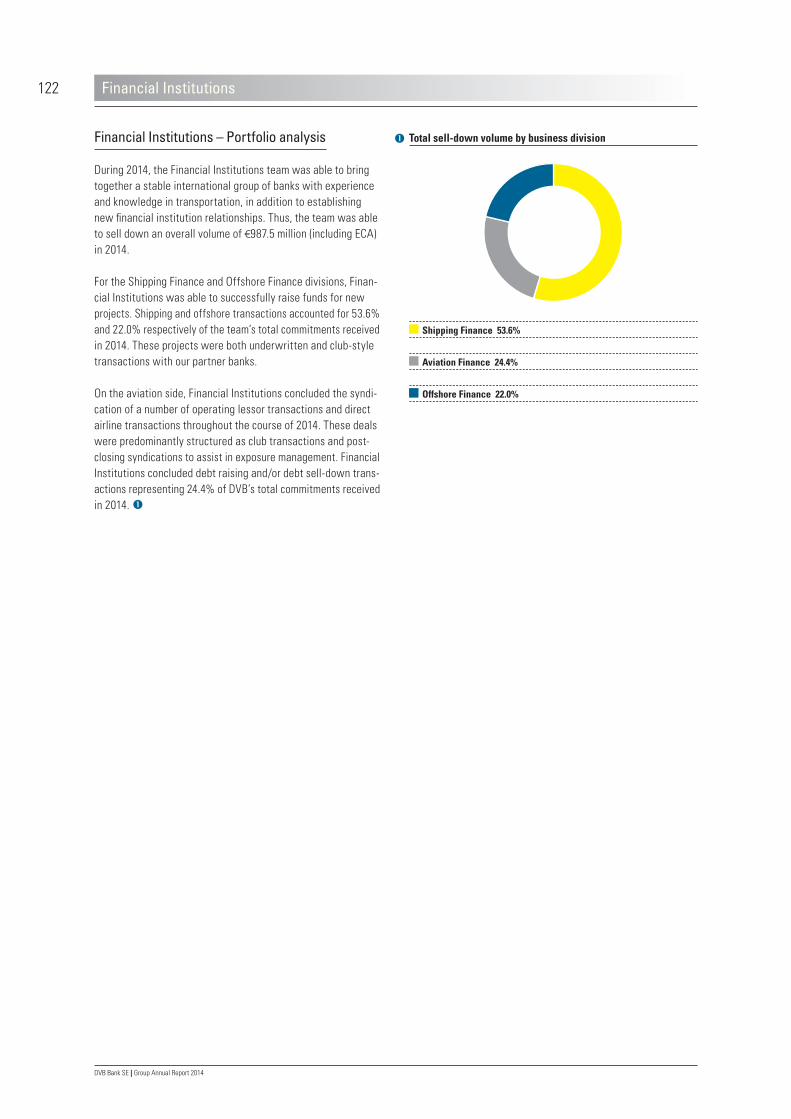
122
DVB Bank SE | Group Annual Report 2014
Financial Institutions
Financial Institutions – Portfolio analysis
During 2014, the Financial Institutions team was able to bring together a stable international group of banks with experience and knowledge in transportation, in addition to establishing new financial institution relationships. Thus, the team was able to sell down an overall volume of €987.5 million (including ECA) in 2014.
For the Shipping Finance and Offshore Finance divisions, Finan-cial Institutions was able to successfully raise funds for new projects. Shipping and offshore transactions accounted for 53.6% and 22.0% respectively of the team’s total commitments received in 2014. These projects were both underwritten and club-style transactions with our partner banks.
On the aviation side, Financial Institutions concluded the syndi-cation of a number of operating lessor transactions and direct airline transactions throughout the course of 2014. These deals were predominantly structured as club transactions and post-closing syndications to assist in exposure management. Financial Institutions concluded debt raising and/or debt sell-down trans-actions representing 24.4% of DVB’s total commitments received in 2014.
Shipping Finance 53.6%
Aviation Finance 24.4%
Offshore Finance 22.0%
Total sell-down volume by business division
123
DVB Bank SE | Group Annual Report 2014
C ONSOL IDAT ED F IN A NCI A L S TA ME MEN T S
AUDI T OP INIONA B OU T US
Financial Institutions
Financial Institutions – Market and portfolio outlook 2015
During 2015, we expect adequate liquidity to persist supporting strong shipping and offshore transactions. We do not anticipate that many new banks will be actively looking at these sectors but some lenders which had exited may start to look at the shipping and offshore sectors on a selective basis. Traditional shipping and offshore banks may increase their activities and exposures during 2015 as a result of having managed their distressed loans. The impact of the European Central Bank’s asset quality review, stress tests in 2014 and further Basel III capital and leverage ratio requirements will continue to impact certain lenders’ appetite for new business. Nonetheless, an abundance of cheaper liquidity at some banks, notably well-capitalised Asian lenders, will result in margins, tenors and terms converging towards pre-crisis levels for top-tier shipowners with strong balance sheets and the right assets, and the same is true in aviation. Moreover, we anticipate more refinancing activity for these names. Offshore finance will likely feel the impact of a declining oil price. This will result in a more cautious approach towards this sector, which could mean less aggressive structures and higher pricing for offshore deals than witnessed in 2014.
Aviation financing is likely to continue to be supported through an availability of US dollar mainly supplied from the capital markets, enhanced equipment trust certificates, asset-backed securities, bond issuance and bank debt market while being less reliant on ECA-supported deals. The latter will continue to decline as a result of new ECA credit rating requirements which make these products less competitive for all but investment grade borrowers. Rating requirements may limit the spread of debt capital market products into Asia in particular where commercial bank debt and tax equity (Japanese Operating Leases with Call Options) are likely to remain popular with airlines and lessors.
DVB expects some further opportunities for rail transactions in 2015. Some institutions view rail as a fairly stable sector and therefore could increase their exposure, as a means of diversify-ing their existing asset class and overall portfolio. With capacity in the bank debt market somewhat uncertain, liquidity will be at a higher level than that seen in 2014. Further, it is our expectation that the capital markets, inclusive of asset-backed securities, will be available – thereby providing additional liquidity to the rail asset finance marketplace. Liquidity will concentrate on transactions involving younger assets, larger portfolios, strong lessors, publicly-owned borrowers, and in some cases or countries still with a stronger focus on domestic home markets.
The Financial Institutions team anticipates for 2015 that there will be higher levels overall of available debt for shipping, aviation and offshore than those seen during the previous year. We expect to see more competition from lenders active in these sectors, given the further improvement in liquidity, but conversely greater opportunities to club, book build and potentially under-write as a growing number of lenders focusing on investment grade borrowers will enter the transportation markets in 2015. The Financial Institutions team will continue to assist all the sectors within DVB in raising liquidity whilst maintaining, enhanc-ing and developing existing and new relationships with financial institutions globally.
GROUP M A N AGE M E N T R E P OR T
DEVELOPMENT OF THE BUSINESS DIVISIONS

124
DVB Bank SE | Group Annual Report 2014
Corporate Finance
High yield bond market
The high yield bond market finished 2014 flat compared to 2013 in terms of issuance volume repeating prior year’s record (€435 billion globally). High yield corporate bonds in currencies other than the US dollar grew by over 20% to nearly €107 billion equivalent. However, a pronounced decline in the price of oil and geopolitical instability have led credit spreads to widen by over 150 basis points from their lows reached in June 2014, leading to increased investor selectivity and slowdown in new issuance in the latter part of 2014. While this cyclicality has negatively affected many credits exposed to oil and gas explo-ration and production activity, and emerging market risks, higher-quality borrowers maintain market access.
In the transportation sector, recent bond issues denominated in euro, Norwegian kronor or British pound included transactions by Hapag-Lloyd, TUI, Bibby Offshore, Polarcus and Norwegian Air Shuttle. AerCap, Fly Leasing, Intrepid Aviation, StarBulk Carriers, Scorpio Tankers, Scorpio Bulkers and drillers Oro Negro and Deep Sea Metro/Golden Close Maritime were among credits that successfully tapped the US dollar bond market in the second half of 2014. Innovative new products were introduced, particu-larly in the shipping sector, including perpetual preferred stock, baby bonds, and Term Loan Bs, which expanded the range of financing options for shipowners.
DVB Corporate Finance (DVBCF) is an established investment banking franchise within DVB, providing best-in-class advisory and financial services to cor-porate clients on a global basis. As an independent financial advisor, DVBCF offers a complete range of financial products including Mergers & Acquisitions, Corporate Advisory, Equity & Debt Capital Markets, and Structured Asset Finance.
Our services are based on long-term relationships with corporate clients, in-depth industry expertise across all transportation sectors, and strong professional skills: the objective is to provide integrated financial solutions. The team is comprised of about 15 seasoned professionals with comprehensive experience gained from a wide variety of backgrounds including bulge bracket investment banks and boutique shops, with offices in New York, London, and Oslo where proximity to key industry players provides a significant advantage. Our clients are international corporations as well as institutional investors (including private equity firms and hedge funds).
Corporate Finance – Market analysis
Mergers & acquisitions (M&A)
Over the past year, there was a surge in global M&A activity with total deal flow growing at the fastest pace since 2000 primarily due to favourable market conditions. As the business cycle of the advanced economies is generally perceived to be approach-ing its final expansionary stages, capacity is tightening and the ability to grow earnings organically remains more limited, while companies’ willingness to take on risk has improved. In addition, companies are holding significant amounts of excess cash and also enjoy access to debt for leveraging investments in the credit markets. In the transportation sector, consolidation and merger activity continued as management teams took a measured approach and focused on addressing overcapacity, fragmentation, and strengthening of the core business. Global M&A volume reached €3.0 trillion in 2014, up 25.0% year on year compared to €2.4 trillion in 2013, and the third-highest full-year volume on record, while global M&A revenue was €17.3 billion, up 11.6% compared to €15.5 billion in 2013, and the highest since 2008. Within transportation, shipping and offshore M&A activity focused mainly on distressed situations. The dry bulk segment was particularly active with a number of large deals, including the mergers of Star Bulk and Excel Maritime in August and Knightsbridge with Golden Ocean in October.
Historical high yield bond issuance billion
500
400
300
200
100
0
309.8
57.6
2010
258.5
48.2
2011
382.0
46.0
2012
410.0
96.0
2013
391.0
117.0
2014
US$ € Source: Offering Memorandums, DVBCF, January 2015

125
DVB Bank SE | Group Annual Report 2014
C ONSOL IDAT ED F IN A NCI A L S TA ME MEN T S
AUDI T OP INIONA B OU T US
Corporate Finance
Securitisation market
Securitisation, commonly referred to as asset-backed securities or ABS, is a form of non-recourse structured asset finance that involves the repackaging of assets and associated cash flows into marketable securities. Bankruptcy-remote structures and the sole reliance on the assets for repayment are key features of ABS. Driven by strong underlying performance and improving industry fundamentals, ABS backed by aircraft, containers and railcars have seen steady improvement from issuance lows experienced during the recession years from 2007 to 2009. For investors, operating asset deals gave more prepayment certainty, provided more stable average lives, and offered diversity from traditional consumer-related ABS, which were at the epicenter of the financial crises. For issuers, ABS can provide an efficient and low-cost funding alternative to other credit products, and enhance asset-liability management strategies.
Following a robust 2013, operating asset ABS issuance volume in 2014 reached near-record highs, driven by a resurgence in aircraft-backed deals and the introduction of new issuers to the market overall. The increase in issuance slate and credit trends supported secondary market trading volumes, which helped drive spread compression to all-in record tight coupons on new issue execution. Successful transactions were introduced by both first-time and repeat issuers in all transportation sectors, including Jetscape, Apollo, and Avolon in aviation, Buss and Dong Fang in containers, and Flagship Rail and American Railcar in land transport.
Equity capital markets
Despite the S&P 500 ending 2014 with a robust 14% gain and a record of €79 billion of capital raised in initial public offerings (IPOs), the equity markets displayed a high degree of volatility towards the second half of the year, with the S&P reaching a low of 1,860 in October and later climbing back to 2,090 in December. A number of problems contributed to the large movements, including geopolitical issues, fear of market overvaluation, uncertainty regarding the Federal Reserve’s decision on the future direction of US interest rate, a sharp drop in commodity prices, and overall global economic weakness. The significant decline in oil price in particular became a major concern as the benchmark West Texas Intermediate crude oil price dropped by 50% relative to the US dollar, triggering major sell-offs in energy-related equities. In addition, the strength of European recovery and geopolitical tension once again became issues causing the euro to fall by more than 10% and the Russian ruble by more than 45% against the US dollar over the past year.
Access to the equity market for general shipping and offshore energy companies became challenging following the decline in oil price. However, seasoned issuers and companies in aviation and rail sectors still have abundant supply of capital. Well-known IPOs in 2014 included companies such as Hoegh LNG Partners, GasLog Partners, Nordic American Offshore, Avolon, and Virgin America. Particularly in Shipping and Offshore, of the five US IPOs completed in 2014, four were structured as master limited partnerships or a full payout model, indicating investors’ emphasis on yield, which was a notable trend throughout the year.
8,000
6,000
4,000
2,000
0
369
400
2010
1,560
290
1,489
2011
550
400
2,596
2012
519
1,770
3,500
2013
1,001
3,199
2,081
2014
Container Aircraft Railcar Source: Bloomberg, ABS Alert and Offering Memorandums, January 2015
Historical ABS issuance by asset type
US$
GROUP M A N AGE M E N T R E P OR T
DEVELOPMENT OF THE BUSINESS DIVISIONS

126
DVB Bank SE | Group Annual Report 2014
Corporate Finance
Another key initiative by DVBCF in 2015 will be the further devel-opment of its securities sales and distribution resources by increasing its institutional placement capability to support the origination of new deals. This approach will enable DVBCF to con-tinue its trend of upgraded roles, in particular joint-lead positions in larger capital markets issuances, and facilitate improved positioning to collaborate with other banks on the distribution of securities, both debt and equity. With the hiring of senior sales professionals specifically for distribution, DVBCF will further develop institutional investor relationships.
Going forward, DVBCF aims to provide one-stop shop solutions to DVB clients across all transportation sectors, with its offering of core financial products supplemented by new products in development – including structured asset finance/securitisation, public and private debt capital markets, and institutional cover-age and distribution. In a weak market, distress restructuring, recapitalisations, and liquidation management can be additional products; while in a strong market, public and private equity raises and joint ventures will become more of the focus.
Corporate Finance – Strategy
DVBCF is a Bank-wide resource that renders strategic and finan-cial advisory services to corporate clients. The objective is to increase non-capital binding revenue, enhance cross-selling of DVB’s products and services, and contribute to sustainable bottom-line growth of the DVB franchise. By leveraging DVB’s specialised industry focus and deep knowledge of transportation assets and asset-based lending, DVBCF co-ordinates closely with relationship managers to develop trusted strategic dialogues at the Chief Executive Officer/Chief Financial Officer level and deliver tailor-made financial solutions. While DVBCF’s traditional activities have included mergers and acquisitions, advisory services, and private placements, the team is enhancing its debt capital markets and structured asset finance capabilities as an extension of DVB’s core loan business.
As traditional bank lending continues to be scarce and capacity is limited, the capital markets have emerged as an important source of funding for corporations particularly as the markets gain familiarity with the transportation sector. DVB’s strong network of corporate clients and lending relationships provide an ample opportunity to gain a foothold into the capital markets. Accordingly, DVBCF, acting through its broker-dealer DVB Capital Markets LLC in New York, continues to gain momentum by taking on larger roles in prominent capital markets transactions.
In 2014, DVBCF substantially expanded its debt capital markets origination, structuring, and execution resources by recruiting product specialists focused on corporate bonds and structured asset finance products such as securitisation, thereby creating a dynamic platform for growth and expansion. The initiative to develop the debt capital markets platform will continue in 2015 with the co-operation and support of key middle and back office teams within DVB to build up the infrastructure and processing capabilities to deliver the products. We believe this strategy will allow DVB to provide integrated debt financing solutions for its corporate clients, to further enhance DVB’s brand recognition, and to compete with the larger banking franchises in the trans-port industry.

127
DVB Bank SE | Group Annual Report 2014
C ONSOL IDAT ED F IN A NCI A L S TA ME MEN T S
AUDI T OP INIONA B OU T US
Corporate Finance
Corporate Finance – Portfolio analysis
Total portfolio
Historically, DVBCF has derived significant business from the Bank’s Shipping Finance division. This is why income and expenses from Corporate Finance activities are still allocated to the Shipping Finance segment and shown as part of the Shipping Finance segment result.
Yet in recent years there has been a broader focus on all business divisions across the Bank. So in 2014, DVBCF generated 50.7% of its total revenue from Shipping Finance, 31.7% from Aviation Finance, 16.9% from Offshore Finance and 0.7% from Land Transport Finance, compared to 49.5% from Shipping Finance, 39.8% from Offshore Finance, 6.1% from Land Transport Finance and 4.6% from Aviation Finance in 2013, demonstrating the diversity of revenue streams and enhanced co-operation with all relationship teams. The growing collaboration with Aviation Finance and Land Transport Finance, with a particular focus on structured asset finance/securitisations, has resulted in a more robust pipeline for DVBCF. Several large air and land transport transactions have already been identified for the first quarter of 2015.
With respect to the revenues derived from our various products in 2014, Equity & Debt Capital Markets and Structured Asset Finance accounted for 53.5% of total revenue, while Corporate Advisory and M&A accounted for 46.5%. In 2013, Equity & Debt Capital Markets and Structured Asset Finance represented 44.1% of total revenue, while Corporate Advisory and M&A accounted for 55.9%. Depending on market conditions, the split between the four products can vary. As DVBCF capital markets capabilities continue to grow, we anticipate their contribution rising to approximately 60% in the near to mid-term.
Shipping Finance 50.7%
thereof:
25.8% Container, Car Carrier, Intermodal & Ferry Group
13.5% Tanker Group
11.4% Dry Bulk Group
Aviation Finance 31.7%
Offshore Finance 16.9%
Land Transport Finance 0.7%
Global revenue breakdown by business division in 2014
GROUP M A N AGE M E N T R E P OR T
DEVELOPMENT OF THE BUSINESS DIVISIONS

128
DVB Bank SE | Group Annual Report 2014
Corporate Finance
bankruptcy-remote special purpose entity. Placed into the US institutional 144A market, the transaction included a number of firsts, including the first aircraft ABS comprised solely of the Embraer E-Jet family of regional aircraft, and the first to include time-tranched sequential pay senior securities together with a high-yield subordinated tranche since before the financial crisis. The offering included two subclasses of single-A rated notes, a class of BBB-rated notes, and a subordinated BB rated class, with the investment grade notes benefiting from a ”liquidity facility” from DVB to support the timely payment of interest. The deal successfully launched and priced in December 2014.
This transaction represented a significant co-operation between Aviation Finance and DVBCF by providing an important client with a tailor-made integrated financing solution that combines loan and debt capital markets products.
Deal of the Year 2014
DVBCF was a lead manager and bookrunner on a number of innovative asset-backed securities offerings in 2014, including Joint Bookrunner on Jetscape Aviation Group Ltd’s debut ABS issuance. The mandate was a result of a co-ordinated effort between the New York Aviation Finance and DVBCF teams. Aviation Finance has had a long-standing deep relationship with Jetscape since its foundation, and provided the introduction to develop a financing solution for its portfolio of E-Jets, while DVBCF provided structuring and marketing advice following an initial pitch in May 2014.
The offering consisted of senior and subordinated classes of notes that relied solely on cash flows derived from rental and disposition proceeds of 21 aircraft ring-fenced in a newly formed,
Corporate Finance – Deal of the Year 2014

129
DVB Bank SE | Group Annual Report 2014
C ONSOL IDAT ED F IN A NCI A L S TA ME MEN T S
AUDI T OP INIONA B OU T US
Corporate Finance
Corporate Finance – Market and portfolio outlook 2015
With continued low interest rates and oil prices dropping to five-year lows, the significant volatility observed in the markets is expected to persist in 2015. In the transportation sector, the slowing down of global economic growth (and particularly in China), oversupply in certain sectors, and geopolitical instability in the euro zone will continue to weigh upon the sector.
In shipping, we expect M&A activity and associated financing requirements to continue as larger players with diversified fleets and contracted employment will weather the downturn better – to the extent that they preserve cash flows and maintain liquidity. Smaller shipowners will face pressure due to lack of scale, and continued low charter rates will eventually persuade some to find pooling partners and/or joint ventures, while some others will merge. Opportunistic institutional investors with cash will continue to look for distressed situations and work with manage-ment teams on differentiating investment stories. IPOs will be challenging, as depressed asset values will bring down the valuation of new shares, and illiquidity in shipping stocks may provide a disincentive to investors. Other private equity and institutional investors already invested in shipping may by neces-sity seek alternatives to the IPO market to secure their exit strategy. Nonetheless, seasoned regular issuers will have little difficulty accessing capital markets, and aviation and land transport companies will opportunistically continue to access the ABS/securitisation market.
In 2015, the overall equity market is expected to move upwards and remain open to issuers as economic activity picks up, with potential market corrections occurring throughout the year. Companies sensitive to the decline in oil prices such as drilling contractors, as well as the owners of offshore support vessels, will likely continue to trade at depressed prices – with M&A activity anticipated to increase. Those businesses that benefit from the low oil price environment such as airlines are expected to enjoy large gains and full access to equity capital. In the debt capital markets, despite volatility, corporate bonds and institu-tional term loans continue to gain importance among corporate borrowers, including DVB’s core transportation sectors. In the euro zone, bonds and debt securities are expected to reach 21% of the total corporate debt by 2018 (up from 10% in 2008), while in the US, bonds and debt securities are expected to account for 53% of total corporate debt, up from 36% in 2008. Looking ahead to 2015, we see continued growth in transport-related, operating asset ABS and project roughly €6 billion in gross new issuance, although influential factors such as the pace of global economic recovery, the impact of the Federal Reserve ”normalis-ing” monetary policy via the termination of quantitative easing, and a changing regulatory environment will all provide uncertainty.
Going forward, DVBCF will continue to work closely with relation-ship managers across all business divisions to identify capital structure challenges and balance sheet optimisation opportunities. It will complement the financing requirements, whether for new assets or refinancing, with a complete package of bank debt and other instruments, and thus provide integrated financial solutions for clients. Enhanced product offerings, particularly in the debt capital markets, will supplement such initiatives and contribute to higher revenue generation.
GROUP M A N AGE M E N T R E P OR T
DEVELOPMENT OF THE BUSINESS DIVISIONS
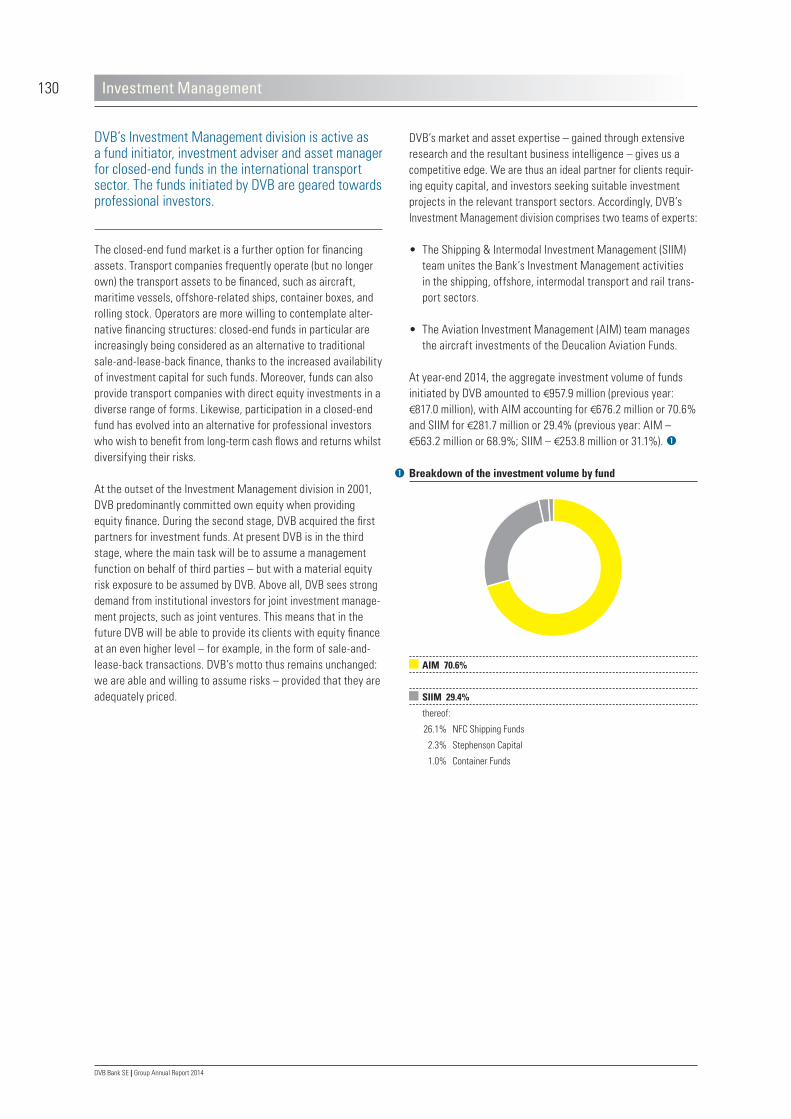
130
DVB Bank SE | Group Annual Report 2014
Investment Management
DVB’s market and asset expertise – gained through extensive research and the resultant business intelligence – gives us a competitive edge. We are thus an ideal partner for clients requir-ing equity capital, and investors seeking suitable investment projects in the relevant transport sectors. Accordingly, DVB’s Investment Management division comprises two teams of experts:
• The Shipping & Intermodal Investment Management (SIIM) team unites the Bank’s Investment Management activities in the shipping, offshore, intermodal transport and rail trans-port sectors.
• The Aviation Investment Management (AIM) team manages the aircraft investments of the Deucalion Aviation Funds.
At year-end 2014, the aggregate investment volume of funds initiated by DVB amounted to €957.9 million (previous year: €817.0 million), with AIM accounting for €676.2 million or 70.6% and SIIM for €281.7 million or 29.4% (previous year: AIM – €563.2 million or 68.9%; SIIM – €253.8 million or 31.1%).
DVB’s Investment Management division is active as a fund initiator, investment adviser and asset manager for closed-end funds in the international transport sector. The funds initiated by DVB are geared towards professional investors.
The closed-end fund market is a further option for financing assets. Transport companies frequently operate (but no longer own) the transport assets to be financed, such as aircraft, maritime vessels, offshore-related ships, container boxes, and rolling stock. Operators are more willing to contemplate alter-native financing structures: closed-end funds in particular are increasingly being considered as an alternative to traditional sale-and-lease-back finance, thanks to the increased availability of investment capital for such funds. Moreover, funds can also provide transport companies with direct equity investments in a diverse range of forms. Likewise, participation in a closed-end fund has evolved into an alternative for professional investors who wish to benefit from long-term cash flows and returns whilst diversifying their risks.
At the outset of the Investment Management division in 2001, DVB predominantly committed own equity when providing equity finance. During the second stage, DVB acquired the first partners for investment funds. At present DVB is in the third stage, where the main task will be to assume a management function on behalf of third parties – but with a material equity risk exposure to be assumed by DVB. Above all, DVB sees strong demand from institutional investors for joint investment manage-ment projects, such as joint ventures. This means that in the future DVB will be able to provide its clients with equity finance at an even higher level – for example, in the form of sale-and-lease-back transactions. DVB’s motto thus remains unchanged: we are able and willing to assume risks – provided that they are adequately priced.
AIM 70.6%
SIIM 29.4%
thereof:
26.1% NFC Shipping Funds
2.3% Stephenson Capital
1.0% Container Funds
Breakdown of the investment volume by fund
131
DVB Bank SE | Group Annual Report 2014
C ONSOL IDAT ED F IN A NCI A L S TA ME MEN T S
AUDI T OP INIONA B OU T US
Investment Management
Shipping & Intermodal Investment Management
Since 2009, Shipping & Intermodal Investment Management has comprised all of DVB’s shipping, intermodal, cruise and rail funds. In total, SIIM has had more than €3.0 billion in assets under management, across a wide range of assets. The shipping investment management activity started as equity-related invest-ments with a joint venture partner in 1999, and was previously known as NFC Shipping Funds. The intermodal investment man-agement was set up by DVB at the end of 2006, and consists now of one fund, which acts as the investment vehicle through which DVB and private investors jointly invest in intermodal equipment. The cruise investment management activity that started in 2007 has been fully divested in 2014. The rail invest-ment management activity has been active since 2007 with the establishment of Stephenson Capital Funds. It is set up as a joint venture with a leasing company and invests in railcars, which are managed by our joint venture partner.
SIIM – Market review
In 2014, asset values in the main shipping market segments were mostly at mid-cycle levels. Certain sectors appeared to sustain their recovery trend, and for example in the case of product tankers the modest upward trend continued in 2014. The more specialised niches of the shipping market showed a mixed picture in 2014, with stable or improving earnings and prospects in certain niches (such as chemical tankers and larger-size LPG carriers) but also with a slowdown or reverse of the recovery trend in certain other niches (such as feeder container vessels). The niche markets in which SIIM is present have done relatively well in 2014.
The development of the freight and charter markets in 2014 for the main sectors was quite diverse, with earnings of bulk carriers losing ground compared to the previous year, while those of crude and product tankers showed more stability or recovery.
During previous years, many charterers, major oil companies and traders in particular, pushed for low fuel consumption and eco-design vessels, stimulating newbuilding activity in a market that was already long on tonnage for several years to come. Overall, this situation – in combination with considerable availa-bility of private and public equity – has contributed to the signif-icant newbuilding order books in some sectors of the shipping market. So, continuing supply-side pressure is expected to affect earnings for several years to come. It should also be noted that the savings of eco-design vessels are directly connected to fuel prices and therefore the financial merits of eco-design vessels are far less pronounced under low oil price scenarios.
For container boxes, the competition among leasing companies remained intense during 2014 with resulting low running yields achievable on major liner companies. Many players diversified their asset base, however, finding it difficult to sustain earnings levels from various and small niche markets.
GROUP M A N AGE M E N T R E P OR T
DEVELOPMENT OF THE BUSINESS DIVISIONS
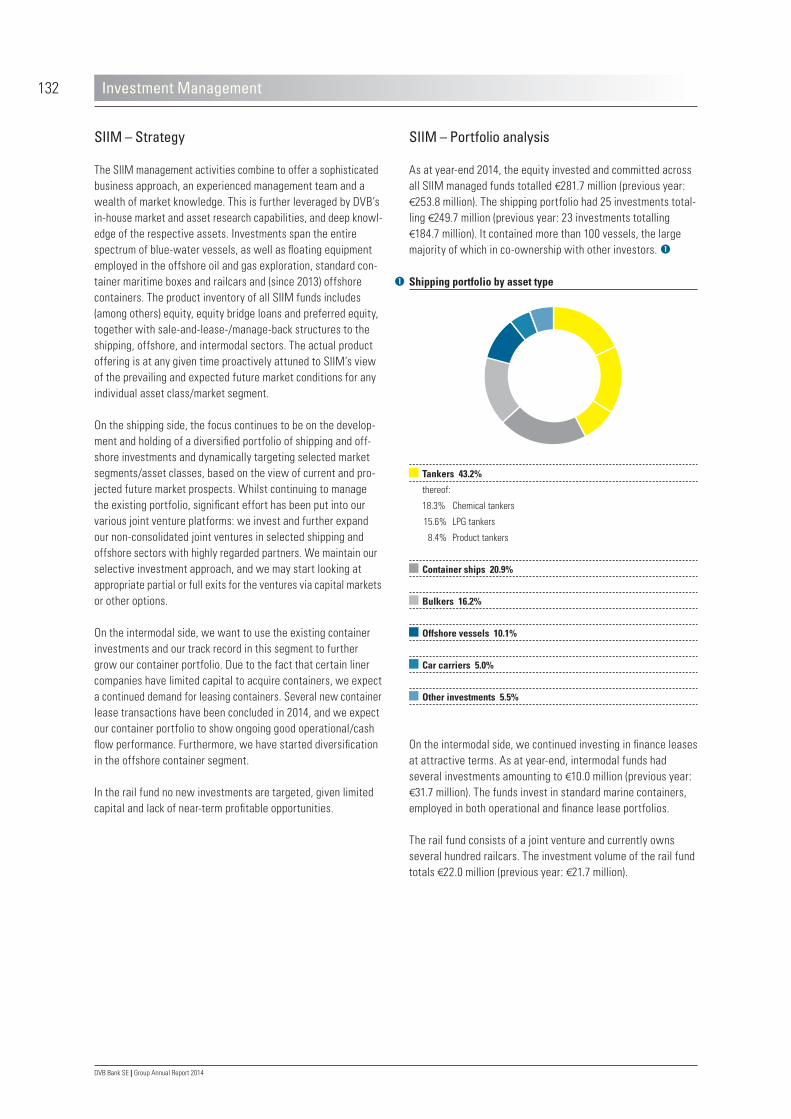
132
DVB Bank SE | Group Annual Report 2014
Investment Management
SIIM – Portfolio analysis
As at year-end 2014, the equity invested and committed across all SIIM managed funds totalled €281.7 million (previous year: €253.8 million). The shipping portfolio had 25 investments total-ling €249.7 million (previous year: 23 investments totalling €184.7 million). It contained more than 100 vessels, the large majority of which in co-ownership with other investors.
On the intermodal side, we continued investing in finance leases at attractive terms. As at year-end, intermodal funds had several investments amounting to €10.0 million (previous year: €31.7 million). The funds invest in standard marine containers, employed in both operational and finance lease portfolios.
The rail fund consists of a joint venture and currently owns several hundred railcars. The investment volume of the rail fund totals €22.0 million (previous year: €21.7 million).
SIIM – Strategy
The SIIM management activities combine to offer a sophisticated business approach, an experienced management team and a wealth of market knowledge. This is further leveraged by DVB’s in-house market and asset research capabilities, and deep knowl-edge of the respective assets. Investments span the entire spectrum of blue-water vessels, as well as floating equipment employed in the offshore oil and gas exploration, standard con-tainer maritime boxes and railcars and (since 2013) offshore containers. The product inventory of all SIIM funds includes (among others) equity, equity bridge loans and preferred equity, together with sale-and-lease-/manage-back structures to the shipping, offshore, and intermodal sectors. The actual product offering is at any given time proactively attuned to SIIM’s view of the prevailing and expected future market conditions for any individual asset class/market segment.
On the shipping side, the focus continues to be on the develop-ment and holding of a diversified portfolio of shipping and off-shore investments and dynamically targeting selected market segments/asset classes, based on the view of current and pro-jected future market prospects. Whilst continuing to manage the existing portfolio, significant effort has been put into our various joint venture platforms: we invest and further expand our non-consolidated joint ventures in selected shipping and offshore sectors with highly regarded partners. We maintain our selective investment approach, and we may start looking at appropriate partial or full exits for the ventures via capital markets or other options.
On the intermodal side, we want to use the existing container investments and our track record in this segment to further grow our container portfolio. Due to the fact that certain liner companies have limited capital to acquire containers, we expect a continued demand for leasing containers. Several new container lease transactions have been concluded in 2014, and we expect our container portfolio to show ongoing good operational/cash flow performance. Furthermore, we have started diversification in the offshore container segment.
In the rail fund no new investments are targeted, given limited capital and lack of near-term profitable opportunities.
Tankers 43.2%
thereof:
18.3% Chemical tankers
15.6% LPG tankers
8.4% Product tankers
Container ships 20.9%
Bulkers 16.2%
Offshore vessels 10.1%
Car carriers 5.0%
Other investments 5.5%
Shipping portfolio by asset type

133
DVB Bank SE | Group Annual Report 2014
C ONSOL IDAT ED F IN A NCI A L S TA ME MEN T S
AUDI T OP INIONA B OU T US
Investment Management
As mentioned, the cruise fund was successfully divested in 2014 and no new investments are envisaged in this sector.
SIIM’s risk management in the portfolio is devoted to continu-ously monitoring the health and performance of our investments. It profits from the invaluable knowledge, detailed industry insight, and technical expertise that we derive from our Shipping & Off-shore Research as well as from our commercial activity, holding frequent and proactive meetings with our counterparties. Each investment is routinely subject to quarterly checks and valuations, such as the monitoring of value maintenance clauses and other debt covenants, the request for updated valuations from a pre-selected list of reputable brokers, detailed investor reporting, and quarterly budget forecasts. On a semi-annual basis, we run asset impairment tests and discounted cash flow analyses. On an annual basis, our funds and special purpose companies are independently audited. A number of those procedures are esca-lated further, with thorough monthly checks for investments classified as Early Warning, Closely Monitored or Watch List cases. Nonetheless, no provisions for impairments in the SIIM portfolio were necessary in 2014 (previous year: €5.2 million).
SIIM – Market and portfolio outlook 2015
For 2015, we do not expect the overall shipping market to show significant upward movement compared to today’s levels. For several sectors, asset values are at (or slightly below) mid-cycle levels, and we do not foresee further huge corrections. Thus, our focus continues to be on carefully selected segments, in which a combination of factors such as low order books or high entry barriers help underpin good performance, together with the established track records of our chosen partners. Phasing-in of capital adequacy requirements by various regulatory authorities will continue to contribute to restricting the availability of capital from traditional sources. From an equity investment perspective, the market is still at a very interesting entry point, while sus-tained appetite from private equity firms (after making significant inroads in the market during previous years) remains to be seen.
For our intermodal investments, due to the fact that certain liner companies continue to have limited capital to acquire containers, we expect continued demand for leasing containers – and that our remaining container portfolio (supported by a diversified group of lessees) will show ongoing good operational and cash flow performance.
While always maintaining the focus and discipline necessary to closely monitor and manage the existing portfolio, SIIM will aim to build up and further strengthen a non-consolidated portfolio of investments with attractive risk-weighted target yield, pursuing a dynamic approach based on the position of the individual seg-ments in their respective value/earnings cycles at any time. At the same time, we anticipate exit opportunities for those invest-ments which have reached appropriate target values.
GROUP M A N AGE M E N T R E P OR T
DEVELOPMENT OF THE BUSINESS DIVISIONS

134
DVB Bank SE | Group Annual Report 2014
Investment Management
The aircraft manufacturing market continued to outperform as orders are being recorded faster than the increasing production rates, with both Boeing and Airbus boasting record order books. Reinforced by low interest rates, the availability of export credit finance, and access to capital markets, airlines have opted for new aircraft as the fuel efficiency and maintenance savings out-weighed the increased cost of ownership.
Aircraft lessors had another year of consistently good operating results. Demand for aircraft, both for replacement and for growth, has pushed the lessors’ market share near to 50% of the global fleet. During the year, leasing companies were able to raise low-cost liquidity through the capital markets as investors flocked to the geographic and asset diversification offered by leasing portfolios. Leasing companies remain well positioned for growth; however, some concern remains on lessors’ book values of older assets, demonstrated by the impairments several lessors took during the course of 2014.
The aircraft leasing market, in which Deucalion is most active, proved to be robust during 2014. The new aircraft space remained highly competitive, with new sources of money entering the market. New aircraft fleets were still liquid, easy to finance and catered to airlines seeking cost efficiencies. During the year, Deucalion has once again been most active in the mid-life space, which is less crowded but remains competitive amongst several established players. While the used market requires increased management time, it provides higher potential for return if air-craft are acquired at the right price, and residual value risks are both carefully evaluated and fully priced in.
Opportunities in the aircraft disassembly and piece part material market were still to be found, yet this continued to be a compli-cated sector requiring very high-quality partnerships for optimum risk management. The first wave of early-build next-generation aircraft were being retired, causing an influx of piece part mate-rial for certain airframe and engine types and oversupply in a number of asset classes. The market continued to be dominated by several large maintenance, repair and operations companies, and Deucalion has been active in opening relationships with these typically large consumers of used material. During the year, Deucalion has entered into several contracts with these entities, to mitigate risk in a volatile and difficult to predict market.
Aviation Investment Management
Established in 2001, DVB’s Aviation Investment Management team acts as the fund manager and the investment adviser to the Deucalion Aviation Funds (Deucalion), which consist of a series of actively managed closed-end funds. These funds are the investment vehicles through which institutional investors and DVB invest together in aviation related assets. At the end of 2014, Deucalion had more than €1.7 billion in assets under man-agement, across a wide range of aviation investments, including aircraft and engines on operating lease, airframe and engine piece part material and airline equity investments. As advisers to the funds, AIM’s senior investment managers (based in London, New York and Singapore) are responsible for sourcing and man-aging aviation investments. Each of the funds has an independent board of directors. DVB is not represented on any of these boards and does not control any of the funds.
AIM – Market review
During 2014, the global aviation industry continued its positive growth trend, largely in line with the stronger global economic performance and improvements to world trade. Increasing pas-senger demand, continued capacity discipline, lower jet fuel prices, and increased focus on cost control helped the global aviation industry report a year-on-year increase in profits. Yet, challenges remain, as the industry recovery has been imbalanced between world regions due to structural shifts in the industry driven largely by the expansion of low-cost and Middle Eastern carriers, government regulation and continued malaise in the air cargo market. North America continued its strong performance with rising yields, using the opportunity to strengthen balance sheets through aggressive deleveraging. European airlines, still feeling the effects of a weakened euro-zone economy, experienced improved operating conditions albeit struggling from regulatory costs and a highly competitive open aviation area compared to their global peers. Asia/Pacific airlines began to feel the pres-sure of continued capacity growth amidst weakening local cur-rencies, despite continued passenger demand.

135
DVB Bank SE | Group Annual Report 2014
C ONSOL IDAT ED F IN A NCI A L S TA ME MEN T S
AUDI T OP INIONA B OU T US
Investment Management
AIM – Strategy
AIM has positioned itself as a value investor across the aviation sector, with an emphasis on the acquisition of physical aircraft and engine assets. Leveraging DVB’s in-house market and asset research capabilities and deep knowledge of the aviation assets, AIM has consistently been able to achieve attractive returns in the market. The funds are generally opportunity-driven, with a focus on the investment’s liquidity and management of residual values, seeking to optimise returns throughout an asset’s eco-nomic life.
AIM – Portfolio analysis
The primary focus of the funds is the acquisition of aircraft and engine assets through direct equity investments. The core target areas of Deucalion’s investment strategy are aircraft on long-term operating lease, aircraft on last operating leases which will be parted out at lease expiry, and aircraft for direct tear-down. The funds also have current investments in aircraft engines, airline equity and cargo aircraft – as well as from time to time investing in secured aircraft bonds and mezzanine loan invest-ments on an opportunistic basis.
Deucalion remained active in the market during 2014, acquiring or entering into binding Letters of Intent for 14 commercial jet aircraft for a total transaction equity value of approximately €182.3 million. (2013: 28 aircraft acquired for €371 million). Of these 14 aircraft, six are on long-term operating leases and eight are part of the last-lease strategy (2013: five on long-term operat-ing leases; eight part of the last-lease strategy and 15 for direct teardown). During the year, Deucalion also sold three leased engines and five engines and one airframe for disassembly (2013: three aircraft and four spare engines sold).
The aircraft acquired on long-term operating leases consisted of three A319-100s, one A321-200, one A330-300 and one B737-800 aircraft. These aircraft, on lease with an Asian flag carrier, a prominent European low-cost operator and a European charter airline, form part of Deucalion’s strategy to acquire attractive current technology aircraft with robust lease economics where AIM believes there could be upside in residual values or trading scenarios with leases attached.
The aircraft acquired on last operating leases consisted of eight A320-200s. AIM continues to see opportunity in the end-of-life space through maximising the maintenance value of the aircraft and extracting value through negotiation of contracted return conditions.
One of the Deucalion funds remained a shareholder in Malaysian low-cost airline operator AirAsia, an equity investment made in 2003 prior to the initial public offering in 2004. The majority of the fund’s shareholding in AirAsia was sold in 2006 and 2007, and the holding is now very modest. The weighted average share price when the shares were launched in the November 2004 initial public offering was 1.23 Malaysian ringgit (€0.25); they closed 2014 at 2.72 Malaysian ringgit (€0.64).
The year 2014 further exemplified Deucalion’s opportunistic investment approach, which seeks to maximise return by way of active trading, extracting utility through careful management of the aircraft’s maintenance value and understanding of the disassembly piece part market.
As at year-end 2014, the overall equity invested across all Deucalion funds totaled €676.2 million and was provided by six institutional investors located in Europe, North America and Asia (previous year: €563.2 million by five institutional investors). The asset portfolio continues to perform as expected; however, a couple of investments have required increased management time, especially Deucalion’s investment in the air cargo market. The return on equity on all realised investments in 2014 contin-ued to be positive.
GROUP M A N AGE M E N T R E P OR T
DEVELOPMENT OF THE BUSINESS DIVISIONS

136
DVB Bank SE | Group Annual Report 2014
Investment Management
with each board led by a director possessing significant aircraft and aviation industry experience. Where relevant, an asset may be taken to an Early Warning, Closely Monitored or Watch List, depending upon the nature of the risk, actual or perceived, which implies more regular monitoring and typically involves the imple-mentation of key action plans. As at year-end 2014, only one investment was on the Watch List – and there were none on either of the Early Warning or Closely Monitored Lists. For 2014, AIM thus reported allowances for credit losses amounting to €5.1 million for DVB’s investment in the funds (2013: €1.1 million).
AIM – Market and portfolio outlook 2015
For 2015, AIM expects the aviation market to remain relatively robust as operators will benefit from low oil prices and a high level of new aircraft deliveries; however, there will be challenges in certain regions where yields will be stressed by increased capacity.
The funds are well positioned to take advantage of current market conditions and will continue to leverage the extensive aviation asset expertise, asset research capability and airline relation-ships within DVB. They will promote the investment philosophy of opportunistically investing in and managing aviation assets, with disciplined and rigorous attention not only to the risks today, but structuring investments with an eye on the future.
AIM expects to see a strong increase in Deucalion’s volume of funds under management during 2015, principally through increased ownership of aircraft on operating lease. Although investor appetite – and therefore competition – for the funds will not likely lessen in 2015, DVB’s knowledge of the industry, the strength of its aviation platform, and its asset-based approach provide the funds with a truly unique asset-focused platform to take advantage of the current market conditions with a well-informed and researched view of the future. Whilst aviation remains a volatile and cyclical industry, in its capacity as invest-ment adviser to the funds AIM will remain focused and disciplined, sourcing the best risk/reward opportunities by making full use of its unique combination of money and metal expertise – and also by taking the opportunity of selling existing portfolio assets at a profit.
At year-end 2014, the portfolio remains well diversified by lease maturity, aircraft/asset type, geography and counterparty. The aggregate portfolio across all funds consists of Airbus aircraft (55.0% in 2014 vs. 50.3% in 2013), Boeing aircraft (39.9% in 2014 vs. 40.2% in 2013) and other investments (5.1% in 2014 vs. 9.5% in 2013). The greatest share of the funds’ aircraft portfolio is made up of passenger narrowbodies (35.1% in 2014 vs. 32.4% in 2013), passenger widebodies (29.6% in 2014 vs. 27.1% in 2013), as well as aircraft and engines in disassembly (25.8% in 2014 vs. 29.0% in 2013).
Risk management is a key focus for Deucalion, and AIM is pro-active in mitigating known risks in current investments. DVB’s expertise in aviation ensures direct access to specialists that provide macro- and micro-views, analyses and tools to compre-hensively monitor aircraft technical issues, aircraft values and trends, as well as airline and counterparty credit risk. Each investment is subject to at least monthly compliance checks, quarterly valuations, detailed investor reporting, semi-annual impairment tests, annual independent auditing and regular pro-active meetings with lessees or the ultimate risk counterparties. In addition, all funds have an independent board of directors –
Passenger narrowbody 35.1%
Passenger widebody 29.6%
Disassembly 25.8%
thereof:
22.3% Widebody
3.,1% Engines
0.4% Narrowbody
Freighter widebody 7.4%
Other 2.1%
Portfolio by asset type

137
DVB Bank SE | Group Annual Report 2014
C ONSOL IDAT ED F IN A NCI A L S TA ME MEN T S
AUDI T OP INIONA B OU T US
Report on material events after the reporting date
DVB Bank SE established its Singapore Branch in 2014. The branch office commenced operations with effect from 1 January 2015. All loans and other services agreed upon from 1 January 2015 onwards have been, and will be, entered into by DVB Bank SE, Singapore Branch. DVB Merchant Bank (Asia) Ltd, Singapore, will continue to handle existing business.
As a consequence of the Bank’s (now concluded) Unity Plus project, DVB’s branch office in Bergen, Norway, was transferred to Oslo, effective 1 February 2015.
A fully consolidated subsidiary of DVB Bank SE holds a participa-tion in Wizz Air Holdings Plc. In the initial public offering (IPO) of said company 80% of this shareholding was sold. For DVB Group this leads to income from the sale of financial instruments of approximately €43 million.
The Board of Managing Directors and Supervisory Board will propose to DVB Bank SE’s Annual General Meeting, which will be held on 25 June 2015, to pay a dividend of €0.60 per notional no-par value share.
There were no other issues of material importance for the assessment of the results of operations, net assets, and financial position of DVB Bank SE and the DVB Group after the end of the 2014 business year. Statements made in the report on expected developments have been confirmed by the development of busi-ness during the first months of the 2015 business year.
GROUP M A N AGE M E N T R E P OR T
REPORT ON MATERIAL EVENTS AFTER THE REPORTING DATE

138
DVB Bank SE | Group Annual Report 2014
Report on expected developments
The euro zone suffers from a lack of growth. Whether the ECB’s extended programme to buy sovereign bonds and other securi-ties in the amount of €60 billion per month – as announced in January 2015 – will in fact counteract this weakness remains to be seen. The programme – with an aggregate size of €1.14 trillion – will run until September 2016; its objective is to maintain price stability, in order to counteract a drawn-out phase of low inflation rates whilst inducing investment across Europe. From today’s perspective, growth in aggregate economic output in the euro zone will continue to be slow, and expectations for any acceler-ation of economic momentum remain weak. Given that global economic growth is likely to be moderate, it is fair to expect a lack of key impulses for exports. The conflict between Russia and Ukraine has additionally burdened the economic outlook; corporate investments are thus set to remain subdued. Demand will also be burdened by companies’ efforts to achieve higher equity ratios, as well as private households striving to boost their reserves. The current low level of investments is particularly due to the overall macroeconomic environment: whilst there are signs of initial economic reforms in the countries affected by the euro crisis, the momentum of reformist policies has fallen short of the levels seen at the height of the euro crisis in 2012. Given this weakness in terms of political reforms, companies’ expected returns are set to remain low – whilst investment incentives for the private sector are likely to stagnate. Moreover, problems affecting the banking sectors of some countries will lead to unfavourable financing terms, thus placing an additional burden upon the economy. We therefore expect euro zone growth rates to show mixed developments.
Supported by a series of government measures, the growth momentum in China is set to remain high during the forecast period, even though a steady decline of growth rates is expected on an annual basis. According to experts, the main threat to the Chinese economy is a sudden collapse of the property sector, which plays a major role in China and has been supported by an extraordinary rate of credit expansion to date. Home prices already showed a slight decline in 2014. Even government stimulus in terms of fiscal and monetary policy – including additional invest-ments in rail networks and public housing construction, tax breaks for small businesses and lower short-term funding costs – have failed to stabilise the market, raising the probability for continued price volatility throughout 2015.
Judging by global activity indicators, the global econ-omy lost momentum over recent months. Whilst the forecast recovery continued in the United States and the United Kingdom, it failed to gain a footing in the euro zone – contrary to expectations at the beginning of 2014. Economic developments in the emerging markets also show a mixed picture. The forecast for 2015 thus remains subdued.
Economic environment
The steady increase in global crude oil supply pushed prices for crude oil products to levels that provide moderate incentives to economic growth in many regions across the globe. Given that oil prices are set to fall further, the global economy is likely to show some moderate growth during 2015. Growth in Europe and Japan is expected to accelerate further: however, whilst in Europe growth rates will remain relatively weak, in Japan they are likely to marginally exceed trend growth.
We anticipate the following parameters to influence economic developments during 2015:
• the handling of geopolitical crises and their impact on the global economy, due to international sanctions;
• the development of crude oil prices;
• the development of euro zone prices and inflation;
• the development of corporate investments and the financial situation of private households; and
• the stability of the Chinese property market.
Economic recovery in the US is expected to continue. This assump-tion is backed, in particular, by the current economic policy framework, a recovery on the labour market that is gradually becoming visible, and the lower indebtedness of private house-holds. It is thus fair to expect a continuation of the recovery in certain areas of industrial production (which is already visible), commercial property construction, new orders received, and private consumption. Against this background, the Fed is likely to maintain its monetary policy until the end of the forecast period, and to significantly reduce its stimulative policy measures given the continued economic recovery.

139
DVB Bank SE | Group Annual Report 2014
C ONSOL IDAT ED F IN A NCI A L S TA ME MEN T S
AUDI T OP INIONA B OU T US
Report on expected developments
The outlook for those emerging market economies exporting raw materials is subdued, as a lack of momentum in global industrial production lowers the likelihood of rising commodity prices. In this context, the development of crude oil prices is crucially important. This market has been burdened with massive excess capacity since 2014. Despite serious conflicts affecting the most important oil production areas in Arab countries and Russia, weakening demand met excess supply. Following market rules, this has caused prices of the key crude oil grades to col-lapse. During 2015, this price decline will further strengthen the profitability of many transport companies. Faced with this excess supply, the International Energy Agency (IEA) once again low-ered its demand estimates for OPEC-produced crude oil in 2015. According to the IEA, OPEC member countries – which together account for more than one-third of global crude oil supply – are expected to produce around 1.4 million barrels of crude oil in excess of demand, every single day. Any agreement amongst the members of this oil-producing cartel to scale back production is set to be fragile, however, since key members such as Iran and Saudi Arabia have different views; moreover, some countries fear hard-to-sustain losses of income, should production be curtailed. This effect is further accelerated by increasing crude oil supply from the US, thanks to fracking.
The report on expected developments contains forward-looking statements, including statements concerning the future development of the DVB Group for the year 2015. In designing the Group Management Report, we have strived to provide a comprehensive yet clearly-structured and easy to read overview. Hence, for each division we have first out-lined business developments during 2014, directly followed by a detailed forecast of market and portfolio developments for the year 2015.
The following parts of the texts therefore constitute an integral part of the Report on expected developments:
– Shipping Finance outlook (pages 85–87);– Aviation Finance outlook (pages 98–99);– Offshore Finance outlook (page 107);– Land Transport Finance outlook (pages 118–119);– Financial Institutions outlook (page 123); – Corporate Finance outlook (page 129);– Investment Management outlook (page 133 and 136).
As usual, any assessments and forecasts contained herein will always be subject to the risk of erroneous perception or judgement errors, and may thus turn out to be incorrect. By their very nature, any deliberations regarding developments or events in the future are based on conjecture rather than precise predictions. Actual future developments may there-fore diverge from expectations, not least as a result of fluc-tuations in capital market prices, exchange rates or interest rates, or similar causes of uncertainty; or due to fundamental changes in the economic environment. Although we believe the forward-looking statements to be realistic, DVB cannot accept any responsibility that they will actually materialise, for the reasons outlined above. We do not intend to update any of the forward-looking statements made in this report.
GROUP M A N AGE M E N T R E P OR T
REPORT ON EXPECTED DEVELOPMENTS, OPPORTUNITIES AND RISKS

140
DVB Bank SE | Group Annual Report 2014
Report on expected developments
DVB will continue to support its Transport Finance clients with new financings during the forecast period 2015; as in the previous year, the Bank intends to achieve an appropriate risk/return profile in new business.
Given the prevailing difficulties on some maritime shipping mar-kets, the Shipping Finance portfolio in particular may be subject to burdens during 2015. Charter rates and vessel values have stabilised on a low level in 2014, albeit subject to some volatility during the course of the year. In DVB’s view, it will be quite some time before the bottoming out we have observed will turn around, and charter rates as well as asset values start to gain in value. As to when the marked excess capacity persistent in some market segments will be subside and supply and demand on the transport markets return to a state of equilibrium yet remains to be seen.
Thanks to our proprietary research know-how, differentiated risk management skills and expertise in executing transactions and managing assets, in 2015 we expect the maritime shipping markets to be affected by distortions to a lesser extent than other banks.
Financial position
As forecast in the Group Management Report 2013, DVB suc-ceeded during 2014 in further broadening its investor base and to mainly raise funding outside the Volksbanken Raiffeisenbanken co-operative financial network.
We expect to maintain a comfortable funding basis throughout the forecast period 2015. DVB’s integration in the German Cooperative Financial Services Network will remain an important factor during 2015: the liquid German co-operative banking sector would allow us to cover our funding requirements, at prevailing market terms, at all times. At the same time, we shall continue to strive for a continuous broadening of our investor base in 2015 – for instance, by placing promissory note loans and issuing bonds outside the cooperative financial network.
Financial outlook for DVB
DVB’s business model has proven to be stress-resistant and resilient indeed during cyclical downturn phases. As forecast, this was also evident during the 2014 business year.
DVB will continue to adhere to its general policy in the future, providing only asset-based financings collateralised by the financed transport assets. DVB’s cycle-neutral lending policy is a key advantage of the Bank’s business approach. In this context, the following aspects will remain decisive when making lending decisions:
• the quality and value of the transport asset concerned; • the credit quality of borrower and operator; • the cash flows to be generated by the borrower using the
transport assets, which will be available for repaying the loan; and
• the remarketability of the financed assets.
Especially in the economic environment outlined above, we will continue placing great emphasis in 2015 on offering our clients the focused range of financing solutions, advisory and other ser-vices – in a diligent and risk-aware manner. This provides us with the opportunity of maintaining our market share, or even further increasing it in a selective manner, and to further strengthen DVB’s brand amongst clients and business partners.
Financial performance
As forecast in the Group Management Report 2013, during 2014 DVB succeeded in entering into new transactions in its Shipping Finance, Aviation Finance, Offshore Finance, and Land Transport Finance divisions. Based on a generally cycle-neutral lending policy, DVB continued to successfully implement its tried-and-tested strategy of pricing exposures in line with the risks involved. As a consequence of the prevailing difficult situation in some maritime shipping market segments (as correctly forecast for 2014), the Shipping Finance portfolio experienced burdens which required the recognition of allowance for credit losses in the amount of €37.8 million – albeit at a clearly lower level (–51.0%) compared to the previous year (2013: €74.1 million).

141
DVB Bank SE | Group Annual Report 2014
C ONSOL IDAT ED F IN A NCI A L S TA ME MEN T S
AUDI T OP INIONA B OU T US
Report on expected developments
Summary assessment of the outlook for 2014, and trend forecast for 2015
The Bank employs three financial indicators to assess and manage its business: return on equity before taxes (ROE), the cost/income ratio (CIR) and the risk-adjusted Economic Value Added (EVA™).
Assessment of the outlook for 2014
At the year-end 2014, the CIR of 53.0% was above the target range of below 50% forecast in the Group Management Report 2013. Whilst general administrative expenses increased by 5.0%, to €187.7 million, the income ratio (comprising net interest income before allowance for credit losses, net fee and commission income, net result from financial instruments in accordance with IAS 39, result from investments in companies accounted for using the equity method, and net other operating income/expenses) declined from €390.9 million to €354.1 million at the end of 2014. This change reflected the negative impact of a swing in the volatile, non-operating result from financial instruments in accordance with IAS 39, which burdened results.
At 8.1%, the actual ROE in 2014 was outside the forecast target corridor of between 10% and 12%. This was due to the fact that consolidated net income before taxes attributable to DVB’s share-holders declined by €20.2 million (or 16.3%), to €104.0 million whilst the aggregate weighted capital rose by €76.5 million (or 6.4%), to €1,280.0 million.
Trend forecast for 2015
DVB has reiterated a target return on equity (before taxes) of between 8% and 12% for the 2015 forecast period; the target range for the CIR is between 48% and 52%. Since EVA™ reflects both income and the risk situation, any forecast is subject to significant uncertainty. Looking at the persistently difficult situa-tion in some of the sub-markets DVB covers, we expect to gen-erate EVA™ in a positive, single-digit million euro amount in 2015. The situation could improve during subsequent years.
In summary, we believe that transport and financial market developments are subject to a plethora of unpredictable factors that are beyond the control of market participants. Therefore, DVB is not in a position to make any forecasts on concrete figures or other financial data beyond this trend indication.
DVB Group’s financial management indicators
2015 2014Forecast for 2015,
at the end of 2014
Actual result Forecast for 2014,
at the end of 2013
ROE before taxes 8 – 12% 8.1% 10 – 12%
CIR 48 – 52% 53.0% < 50%
EVA™ Positive, single-digit
million euro amount
€ 28,5 million
No forecast issued
GROUP M A N AGE M E N T R E P OR T
REPORT ON EXPECTED DEVELOPMENTS, OPPORTUNITIES AND RISKS

142
DVB Bank SE | Group Annual Report 2014
Report on opportunities and risks
to recognise material risks at an early stage, and to respond appropriately by taking suitable measures. The suitability and effectiveness of DVB’s risk management system are regularly reviewed by internal and external auditors.
Notwithstanding the fundamental suitability of the risk manage-ment system, circumstances are conceivable where risks are not identified in good time, or an adequate, comprehensive response is not possible. The methods and models used to measure risks are appropriate for managing DVB’s business. Despite due care taken in developing models, and regular reviews, however, there may be scenarios where actual losses (or liquidity needs) exceed the values forecasted by risk models and stress scenarios.
The report on opportunities and risks presented below pro-vides a breakdown of DVB’s Transport Finance sub-portfolios by collateralisation structure and loan-to-value (LTV) range under ”Portfolio management and control”, on pages 151 to 153. Due to the fact that all material subsidiaries of the DVB Group are integrated into DVB’s divisional risk management system which incorporates the lending activities of affiliated enterprises, the portfolio values analysed reflect nominal values of the DVB Group portfolio, in accordance with regu-latory rules.
Exploiting business opportunities whilst assuming risks in a targeted and controlled manner, to generate returns which are adequate in view of the risks taken – these are key elements of DVB’s management strategy.
Principles of risk management
DVB defines risks as unfavourable future developments which may have a detrimental effect on the Bank’s financial position, financial performance, or liquidity. In this context, the Bank dif-ferentiates between counterparty credit risk, operational risk, market price risk, business risk, as well as liquidity and equity investment risk. DVB’s business model requires the ability to identify, measure, assess, manage, monitor and communicate risks. As a guiding principle for all of its business activities, the Bank assumes risk only to the extent required to achieve the objectives of its business policy.
To implement these principles, the Board of Managing Directors has defined risk strategies – observing the business strategy – for the material risks the Bank is exposed to. Each of these sub-risk strategies comprises the key business activities exposed to risk, the risk management objectives (including guidelines for assuming and avoiding risks), and the measures designed to achieve these objectives.
Moreover, DVB’s Board of Managing Directors – as the respon-sible body – has established an adequate and viable risk manage-ment system that fulfils the Bank’s own commercial needs and complies with legal requirements. With the methods, models, organisational rules and IT systems implemented, DVB is able
Group Risk Management principles
Shipping Finance
Aviation Finance
Offshore Finance
Land Transport Finance
Investment Mangement
ITF Suisse
Treasury
Credit risk
Operational risk
Market price risk
Business risk
Equity investment risk
Liquidity risk
Internal Audit
Financial Controlling
Group Risk Management
Market Risk Control
Compliance Office
Risk management and risk control Strategic level
Board of Managing Directors
Risk & Governance Committee
Group Credit Committee Watch List Committees Asset Liability Committee Audit Committee OpRisk Committee Steering Committees New Product Circle
Operational level
Risk Management Type of risk Risk Controlling

143
DVB Bank SE | Group Annual Report 2014
C ONSOL IDAT ED F IN A NCI A L S TA ME MEN T S
AUDI T OP INIONA B OU T US
Report on opportunities and risks
Organisation of the risk management process
Structural organisation
DVB operates a Group-wide risk management system, which complies with all statutory and regulatory requirements. This risk management system comprises adequate provisions and measures with respect to risk strategy, risk-bearing capacity, risk management, and risk monitoring, plus a multi-level frame-work for the early detection of risks. In addition to the structural and procedural organisation, these measures also apply to the processes for identifying, assessing, managing, monitoring and communicating the risks. The chart below illustrates the func-tional separation of DVB’s risk management (in the narrower sense) and risk control processes:
A distinction is made between ’operative’ and ’strategic’ risk management. DVB defines operative risk management as the implementation of the risk strategy by the various business divi-sions, as prescribed by the Board of Managing Directors. In addi-tion to defining risk policy guidelines, strategic risk management also coordinates and supports operative risk management pro-cesses by cross-divisional committees.
The risk control function – which is independent from risk manage-ment in the narrower sense (i.e. operative risk management) – comprises the identification, quantification, limitation and moni-toring of risks, plus risk reporting. The detailed quarterly ”DVB Group Risk Report”, which is submitted to the entire Board of Managing Directors, executive staff and the Supervisory Board, provides a detailed view of the Bank’s risk situation. Furthermore, the Bank has implemented reporting systems for all relevant types of risk. This ensures that the risks are transparent at all times to the authorised persons with responsibility for those risks.
Accounting/financial reporting
DVB’s accounting department ensures that the Bank’s accounting and financial reporting comply with applicable rules, particularly with German commercial law. For this reason, the Bank has established a risk management system that manages, monitors and controls the accounting function. This internal control sys-tem is designed to counter operational risks by ensuring that employees’ actions, the technologies deployed, and the design of workflows are geared towards compliance with applicable legal rules. Based on legal rules for consolidated financial report-
ing, and taking into account the regulations set out in the Group Accounting Manual, DVB has implemented Group-wide processes that provide for efficient risk management and effective control of Group accounting and financial reporting. These processes access common data processing and database systems. Within the scope of its audit function, Internal Audit is actively involved in these processes.
Accounting and financial reporting comprises qualitative and quantitative details regarding DVB Group entities and subgroups: these details are not only required for preparing statutory reports, but also provide the basis for the internal management of DVB Group’s operating divisions. For this reason, binding pro-cedures have been established for the recording and controlling of data. To make sure that the financial reporting systems are commercially viable, the data are processed in an automated manner, using adequate IT systems. DVB has implemented extensive control mechanisms to ensure the quality of process-ing, and thus to reduce operational risks. For instance, input and output data used within accounting systems are subject to numerous manual and automatic checks. Moreover, accounting and consolidation entries are duly recorded and checked. The availability of human and technical resources required for accounting and financial reporting processes is ensured through adequate business continuity concepts, which are continuously refined and regularly verified using appropriate tests. A Group Accounting Manual, continuously updated, documents the uniform application of accounting policies in writing. External audit firms examine the contents of this manual, and the related compliance of DVB staff involved in accounting and financial reporting pro-cesses, within the scope of statutory audits.
The Bank uses external appraisers to assist in determining the amount of pension provisions. Moreover, appraisers are engaged to determine the collateral values of vessels, aircraft, offshore supply vessels and platforms, rail and road assets. The Bank’s operational guidelines contain a list of eligible appraisers. Introduced processes are continuously reviewed regarding their appropriateness, and with respect to the impact of new products or facts, or regulatory changes. To safeguard the high level of quality of DVB’s accounting systems, the Bank properly trains those staff members entrusted with financial reporting duties, in line with their individual needs, regarding the legal framework and the IT systems used. When implementing legal changes, external consultants and auditors are involved at an early stage, to enhance the quality and efficiency of financial reporting.
GROUP M A N AGE M E N T R E P OR T
REPORT ON EXPECTED DEVELOPMENTS, OPPORTUNITIES AND RISKS

144
DVB Bank SE | Group Annual Report 2014
Capacity to carry and sustain risk/risk capital
To determine DVB’s economic capital adequacy, the Bank analyses its risk-bearing capacity by comparing aggregate risk cover (less a capital buffer) to the risk capital requirement. Taking aggre-gate risk cover as a basis, and being aware of the capital buffer, the Board of Managing Directors sets maximum loss thresholds for the business year, at the end of the preceding year. These thresholds constitute limits for risk capital requirements. The aggregate risk cover comprises the Bank’s equity and quasi-equity items; it is fully reviewed and updated each month. For this reason, aggregate risk cover is subject to fluctuations throughout the year.
The purpose of the capital buffer is to account for imprecision in measuring risks, and to cover those risks that are not measured within the framework of risk capital requirements, and which are thus not managed via risk limits (maximum loss thresholds). For instance, this applies to risks from pension obligations, which arise from interest rate and longevity risks from direct pension commitments to active or former members of staff. DVB uses expert opinions, scenario analyses or models to quantify the various components of the capital buffer. As at 31 December 2014, the capital buffer amounted to €138 million (2013: €31 million).
The development of DVB’s aggregate risk cover and risk capital over recent years is shown below:
Risk inventory and suitability check
At the end of each business year, DVB regularly carries out a risk inventory. The purpose of this exercise is to identify all types of risk that are relevant to the Bank, and to assess their materiality. Where required, DVB also performs a risk inventory during the course of a business year: the objective being to be able to recognise any material changes to the Bank’s risk profile where necessary. The Bank analyses the materiality of all types of risk which may occur in principle, given DVB’s business activities, and evaluates those types of risk classified as material, to deter-mine to what extent risk concentrations exist.
The Bank also conducts a suitability check at the DVB Group level, examining the suitability of all risk measurement methods for all risk types classified as material. Where required, appro-priate measures are taken to adapt the management toolbox.
Risk inventories and suitability checks are harmonised in terms of content and timing. The results of the regular risk inventory and suitability check provide the basis for managing risks during the subsequent business year. If the results of an event-driven risk inventory indicate that risk management systems need to be adjusted immediately, such changes are implemented during the current business year.
€ mn2,000
1,600
1,200
800
400
0
1,821
28.7
523
2009
1,697
33.9
575
2010
1,408
42.6
600
2011
63.6
1,109
705
2012
67.2
1,546
969
2013
61.8
1,600
990
Q1 2014
62.8
1,575
990
Q2 2014
1,642
53.6
880
Q3 2014
59.7
1,473
880
Q4 2014
63.2
1,529
967
2015
%75
60
45
30
15
0
Risk-bearing capacity (aggregate risk cover) Risk capital Risk capital/risk-bearing capacity (%)
Development of risk-bearing potential
Report on opportunities and risks

145
DVB Bank SE | Group Annual Report 2014
C ONSOL IDAT ED F IN A NCI A L S TA ME MEN T S
AUDI T OP INIONA B OU T US
The €73 million decline in the aggregate risk cover, compared to the end of last year, was largely due to higher deferred tax assets, a higher capital buffer, and a gap between expected losses and existing impairments. Profit retention and higher subordinated liabilities only offset these reducing factors in part.
The Board of Managing Directors set the maximum risk threshold (risk capital) for 2015 at €967 million (2014: €990 million), taking into account correlation effects. Risk capital is distributed across individual types of risk as follows:
Toward the end of 2014 there were only minor shifts in the allo-cation of risk capital limits between the various types of risk. Specifically, the limit for equity investment risk was increased by €10 million, to €130 million, due to additional investments, with the credit risk limit reduced accordingly. There were no other shifts at a risk type level during the year, except for credit risk limits on a divisional level. The aggregate risk capital limit was reduced from €990 million to €880 million in July 2014, within the framework of strategic dialogue with DZ BANK AG. When determining the level of risk capital, the Bank considers correlation effects deduced from empirical market data, taking into account correlations among the various types of risk.
Monitoring the Bank’s risk-bearing capacity, DVB also consid-ered additional stress tests, to safeguard the Bank’s continued existence even in an extremely unfavourable market environ-ment.
Stress tests are generally calculated against the background of a scenario horizon between one and two years, taking into account both economic scenarios as well as historical situations particularly relevant to DVB’s business model and portfolios. In addition, the Bank conducts an annual inverse stress test to analyse which extreme changes in market conditions might threaten DVB’s risk-bearing capacity in the short term.
The economic stress-testing concept covers all of DVB’s material loss risks. In principle, stress tests are based on methods and procedures used to determine the Bank’s risk-bearing capacity.
The economic stress test scenarios translate potential crises affecting macroeconomic parameters and market prices into changes to the aggregate risk cover and risk capital requirements. This facilitates a comprehensive and consistent analysis of the chain of effects caused by external economic developments on the Bank’s risk-bearing capacity.
Risk capital (€ mn)
2015 2014 Risk capital
limit
Risk capital
limit
Amount utilised
at year-end
Average
utilisation
Credit risk 738 650 543 514
Market price risk 120 120 71 77
Operational risk 65 65 60 60
Business risk 53 50 38 36
Equity investment risk 120 130 128 96
Correlation effects –129 –135 –115 –101
Total 967 880 725 681
GROUP M A N AGE M E N T R E P OR T
REPORT ON EXPECTED DEVELOPMENTS, OPPORTUNITIES AND RISKS
Report on opportunities and risks

146
DVB Bank SE | Group Annual Report 2014
DVB raised €150 million in subordinated liabilities in January 2015. This reduced the utilisation of risk capital in the 12-month macro-economic scenario to 86%.
The Bank uses internal models to measure credit risks and market price risks. Loss exposure associated with operational risk is measured using the Basic Indicator Approach under the CRR. DVB uses a value-at-risk (VaR) approach to measure business risk and equity investment risk. Although liquidity risk is also moni-tored and checked continuously, it is not managed through risk capital, but by means of plans for liquidity flows, cash flow fore-casts and stress scenarios.
DVB has implemented a threshold concept as an early warning mechanism for the economic stresstest: thresholds values are being monitored, as part of ongoing reporting, for scenarios covering multiple types of risk as well as for stress tests covering specific types of risk. These early-warning signals trigger various risk management processes, in order to be able to respond to potential threats indicated at an early stage.
The stress tests are updated quarterly – especially concerning euro/US dollar exchange rate fluctuations, as one of DVB’s material risk drivers – and are adopted by the Risk & Governance Committee, or by DVB’s entire Board of Managing Directors. The Bank’s aggregate risk cover fully covered expected and unex-pected losses under all stress scenarios throughout 2014.
Aggregate risk cover (€ mn)
Historical
stress
scenario
Macro-
economic
stress
scenario
(12 months)
Macro-
economic
stress
scenario
(24 months)
Aggregate risk cover (31 December 2014) 1,473 1,473 1,473
Change in aggregate risk cover (ARC) under the respective stress scenario –138 –227 –31
Stressed aggregate risk cover (31 December 2014) 1,335 1,246 1,442
Unexpected loss 1,058 1,209 978
Unexpected loss/stressed ARC (%) 79.2% 97.0% 67.8%
Report on opportunities and risks
147
DVB Bank SE | Group Annual Report 2014
C ONSOL IDAT ED F IN A NCI A L S TA ME MEN T S
AUDI T OP INIONA B OU T US
Types of risk
Credit risk
With respect to individual transactions and clients, credit risk is managed and limited by setting corresponding limits, on the basis of cautious lending principles and sector-specific lending policies. These specify in particular that each transaction must be collateralised by valuable assets (aircraft, ships etc.). At a portfolio level, the Bank allocates the volume of risk capital approved by the Board of Managing Directors to the various business divisions. Determining and managing country risks is relevant given the international emphasis of our transport asset lending business. Hence, DVB plans and limits country risks within the scope of the overall management of the Bank, and in accordance with the annual country limit planning system of DZ BANK Group.
Internal Rating Model and Credit Portfolio Model
Given the dominant position of credit risk in its business, DVB has developed an internal statistical and mathematical rating model (IRM) for its Transport Finance portfolios. The model complies with the ”Advanced Approach” requirements under the CRR. In addition to the probability of default (”PD”) associated with a given client, the Bank determines the expected loss given default (”LGD”) for the unsecured portion of a loan and the anticipated extent of the claim at the time of default (exposure at default, ”EAD”). The use of the Advanced Approach means that all types of collateral (such as aircraft and ship mortgages, indemnities) are eligible to reduce exposures. For this purpose, DVB is in a position to provide evidence for expected realisation proceeds on the basis of proprietary time series.
The counterparty rating is based on a multi-level statistical system, developed from a pool of externally-rated companies for which all relevant financial reporting data was available. Assigning the internal rating to the external rating classes enables us to use external default probabilities. The assessment of the future collateral value of financed assets is fundamental to determining the potentially impaired proportion of a specific lending exposure (the LGD) in the Bank’s asset-based lending business. The method used for this purpose determines the future collateral value of an asset on the basis of simulation calculations. In addition to external valuations (expert opinions) and market data, DVB also leverages the expertise of its in-house market specialists in assessing specific collateral.
To ensure model adequacy, the Bank conducts an annual review to validate the risk parameters PD and LGD both quantitatively and qualitatively. Due to the prevailing high volatility that was evident on international transport markets, DVB decided to maintain the more frequent update of the asset valuation model’s market data (introduced in 2009) during 2014, and will continue to do so until international transport markets have stabilised.
In addition to determining regulatory capital adequacy, the Bank also uses IRM results as an integral instrument for management of the entire Bank. For example, the results of the ratings are taken into consideration in determining lending authorities, and the standard risk costs – which are also calculated using the model – are an integral part of the estimate with respect to individual transactions, for calculating the minimum margin.
At the beginning of 2013, DVB successfully introduced a credit portfolio model (CPM) tailored to the Transport Finance business. Specifically, this model incorporates the asset-based collaterali-sation of financing structures as well as potential risk concen-tration or diversification. During the course of 2013, the Bank implemented another credit portfolio model for the Treasury portfolio: this model is mainly geared to compute the potential risk exposure inherent in derivatives, money-market and foreign exchange transactions entered into with other banks, and of sovereign securities. When designing this model, a particular focus was also on potential risk concentration and diversification effects. Both models compute a value-at-risk figure for the respective portfolio, incorporating default risk as well as migration risk, on the basis of a 99.9% confidence interval and a one-year holding period. These models replaced the IRM previously used to determine economic capital. Calculations employ key parameters used for the regulatory model (asset value/LGD, PD, EAD).
The Bank will continue to analyse its credit portfolio model dur-ing 2015, a process that will lead to further adjustments to the modeling approach, and parameter estimates.
Portfolio management and control
DVB has organised its portfolio management and control pro-cesses on two levels. Group Risk Management is responsible for developing and implementing portfolio management tools and methodology, and for preparing various analyses of the Group’s overall portfolio (reporting pursuant to the requirements of the MaRisk). On a divisional level, each Transport Finance division is responsible for analysing and managing their respective portfolios within the framework set by the Board of Managing Directors, and with a view to mitigating risk by way of diversification. In doing so, they rely on the support provided by the Bank’s in-house research teams.
GROUP M A N AGE M E N T R E P OR T
REPORT ON EXPECTED DEVELOPMENTS, OPPORTUNITIES AND RISKS
Report on opportunities and risks

148
DVB Bank SE | Group Annual Report 2014
Structural analysis of the credit portfolio
The lending volume is calculated in line with DVB’s internal portfolio management criteria. Lending volumes are broken down by nature of instruments exposed to credit risk: traditional credit risk, securities business, as well as derivatives and money mar-ket business. The quantitative credit portfolio details disclosed below for the overall credit portfolio show DVB’s maximum credit risk exposure. The risk exposure is disclosed on the basis of gross lending volumes, i.e. without taking into account credit-risk mitigation techniques and also before allowance for credit losses. The volumes included correspond to the nominal amount of loans, irrevocable loan commitments and financial guarantees, and to market values of banking book investment securities as well as derivatives.
The following diagram maps gross lending volume – used for Group-internal management purposes – to individual items on the statement of financial position. Any divergence between data used for internal management purposes and figures shown in external financial reporting is largely attributable to differences in the scope of consolidation, different definitions of lending volume, as well as differences in the amounts recognised and/or carried.
The proprietary database application OASIS (Object Finance Administration and Security Information System) is a state-of-the-art management information system used for the analysis and management of DVB’s loan portfolios. In addition to compiling all quantitative and qualitative data covering every Transport Finance exposure, OASIS also captures the legal and economic risk structures: it thus provides all the data required to manage the portfolio. Moreover, the database represents the core source of information for the IRM and CPM. Data entry is subject to the principle of dual control throughout the system. Because it is integrated into the loan approval and loan administration pro-cesses, OASIS helps significantly to minimise operational risks. The Bank continuously develops the OASIS system, to keep it in line with constantly growing requirements.
Various data sources – such as SAP, OASIS and IRM/CPM – are compiled in a data warehouse, where the data can be ana-lysed quickly, via pre-defined reports or ad-hoc analyses. In January 2013, the Basel Committee on Banking Supervision (BCBS) published principles for effective risk data aggregation and risk reporting (BCBS 239). DVB has launched a project in order to be able to comply with these more extensive reporting requirements.
Gross lending volumes 2014 (€ mn)
31 Dec 2014Lending volume
for internal reporting purposes
Consolidation
Recognition/ measurement
Other
IFRS- Group
Traditional lending business (loans, commitments
and other non-derivative off-balance sheet assets) 24,716.1 64.6 118.4 453.9 25,353.0
Securities 304.8 –10.2 – 4.4 299.0
Derivative financial instruments 1,019.9 –1.6 –513.4 – 504.9
Total 26,040.8 52.8 –395.0 458.3 26,156.9
Gross lending volumes 2013 (€ mn)
31 Dec 2013Lending volume
for internal reporting purposes
Consolidation
Recognition/ measurement
Other
IFRS- Group
Traditional lending business (loans, commitments
and other non-derivative off-balance sheet assets) 22,790.5 –7.9 136.2 116.4 23,035.2
Securities 523.3 –46.6 –2.0 0.3 475.0
Derivative financial instruments 936.7 –1.7 – – 935.0
Total 24,250.5 –56.2 134.2 116.7 24,445.2
Report on opportunities and risks

149
DVB Bank SE | Group Annual Report 2014
C ONSOL IDAT ED F IN A NCI A L S TA ME MEN T S
AUDI T OP INIONA B OU T US
The lending volume, as shown in the internal reporting systems and reconciled to consolidated financial statements in accordance with IFRS, is reported in the following items of the statement of financial position:
Gross lending volumes (IFRS Group – € mn)
31 Dec 2014 31 Dec 2013 %
Cash and balances with the central bank; loans and advances to banks 1,667.1 2,252.8 –26.0
Loans and advances to customers; leases 21,712.8 19,343.7 12.2
thereof: loans and advances to customers carried at cost 20,782.9 18,896.9 10.0
thereof: loans and advances to customers measured at fair value 0.0 0.0 –
thereof: leases 929.9 446.8 –
Non-derivative trading assets – – –
Financial guarantee contracts, contingent liabilities and other commitments 1,973.1 1,438.7 37.1
thereof: financial guarantee contracts from guarantees 268.9 225.5 19.2
thereof: contingent liabilities from irrevocable loan commitments 1,704.2 1,213.2 40.5
Traditional lending business (loans, commitments
and other non-derivative off-balance sheet assets) 25,353.0 23,035.2 10.1
Equities and other non-fixed-income securities; bonds 299.0 475.0 –37.1
thereof: measured at fair value 286.7 429.1 –33.2
thereof: at cost 12.3 45.9 –73.2
Securities 299.0 475.0 –37.1
Derivative financial instruments with positive fair values 504.9 935.0 –46.0
thereof: trading assets 88.2 345.0 –74.4
thereof: hedging instruments 416.7 590.0 –29.4
Derivative financial instruments 504.9 935.0 –46.0
Carrying amount (IFRS) 26,156.9 24,445.2 7.0
GROUP M A N AGE M E N T R E P OR T
REPORT ON EXPECTED DEVELOPMENTS, OPPORTUNITIES AND RISKS
Report on opportunities and risks

150
DVB Bank SE | Group Annual Report 2014
Lending volume, 81.1% of which is denominated in US dollars (2013: 76.8%), was up by 7.0%. Adjusted for exchange rate effects, it declined by 2.9%. The decrease in lending volume was largely attributable to reduced investments of excess liquidity with Deutsche Bundesbank.
The following three tables provide an overview of credit risk concentration and maximum credit risk exposure, broken down by DVB’s business divisions , geographical regions and residual terms . The Other row aggregates Group Treasury, the business of LogPay Financial Services GmbH, and business that is no longer in line with DVB’s strategy.
Credit risk concentration and maximum credit risk exposure by business division (lending volume – € mn)
Loans, commitments and
other non-derivative
off-balance sheet assets
Securities
Derivative financial instruments
and money-market trading
2014 2013 2014 2013 2014 2013
Shipping Finance 10,071.5 9,073.8 19.9 89.7 30.3 39.0
Aviation Finance 7,072.7 6,410.7 – – 8.5 3.8
Offshore Finance 2,259.4 1,953.3 – 15.2 17.8 23.2
Land Transport Finance 1,954.8 1,611.2 – – 0.1 0.2
Investment Management 612.6 462.1 – – – 0.0
ITF Suisse 1,012.4 822.7 – – 0.0 0.0
Other 1,732.6 2,456.6 284.9 418.4 963.3 870.5
Total 24,716.0 22,790.4 304.8 523.3 1,020.0 936.7
Credit risk concentration and maximum credit risk exposure by region (lending volume – € mn)
Loans, commitments and
other non-derivative
off-balance sheet assets
Securities
Derivative financial instruments
and money-market trading
2014 2013 2014 2013 2014 2013
Europe 12,204.8 11,471.1 284.9 433.6 996.1 902.7
North America 5,377.5 5,028.4 – – 4.1 6.7
Asia 4,074.6 3,509.6 19.9 57.1 13.2 17.8
Middle East/Africa 880.8 987.3 – – 0.8 1.2
South America 1,197.1 909.9 – – 5.7 8.1
Offshore 810.1 687.3 – 32.6 0.1 0.2
Australia/New Zealand 171.1 196.8 – – – 0.0
Total 24,716.0 22,790.4 304.8 523.3 1,020.0 936.7
Credit risk concentration and maximum credit risk exposure by residual term (lending volume – € mn)
Loans, commitments and
other non-derivative
off-balance sheet assets
Securities
Derivative financial instruments
and money-market trading
2014 2013 2014 2013 2014 2013
≤ 1 year 3,771.2 4,073.3 174.1 201.3 31.4 83.3
> 1 year ≤ 5 years 11,777.1 10,686.2 130.7 322.0 384.8 488.7
> 5 years 9,167.7 8,030.9 – 0.0 603.8 364.7
Total 24,716.0 22,790.4 304.8 523.3 1,020.0 936.7
Report on opportunities and risks

151
DVB Bank SE | Group Annual Report 2014
C ONSOL IDAT ED F IN A NCI A L S TA ME MEN T S
AUDI T OP INIONA B OU T US
The overview breaks down the volume of collateral for the total portfolio by collateral type, and by the type of instrument exposed to credit risk. Collateral for traditional lending, securi-ties business, and for derivatives and money-market business is shown before applying any netting agreements. Collateralisation details are based on market values, with a 40% haircut having been applied – except for financial collateral, which was included without deduction.
Besides effects induced by exchange rate movements, the increase in collateral values also reflected a recovery of market values in Shipping Finance.
The following section provides an overview of the structure of DVB’s loan portfolios, together with collateralisation develop-ments.
DVB’s Shipping Finance portfolio, which is largely denominated in US dollars (93.3%), grew by 9.8%, to €10.1 billion. The euro weakened in a volatile development, falling 12.0% against the US dollar during the course of the year. Adjusting for exchange rate fluctuations, the Shipping Finance portfolio size decreased by 2.3%.
The chart below provides a breakdown of exposures secured by mortgages, by LTV range (where loan amounts have been allo-cated to LTV classes proportionally), as well as exposures cov-ered by other forms of collateral, and unsecured exposures:
99.1% of the portfolio (€10,030.3 million) is secured by mortgages on ships; only €91.3 million is secured by other forms of collateral. As in the previous year, there were no uncollateralised exposures at the reporting date.
Collateral values for the entire portfolio, by collateral type1) (€ mn)
Traditional lending business Securities business Derivatives and
money-market business
2014 2013 2014 2013 2014 2013
Land charges, mortgages, registered liens 18,928.2 16,471.9 – 55.7 40.3 46.8
Transfers of ownership, assignments,
pledges of receivables 546.7 366.7 – – – –
Financial collateral – – – – 92.5 520.5
Total 19,474.9 16,838.6 – 55.7 132.8 567.3
1) The collateral values shown were included up to the amount of the corresponding lending volume, except for financial collateral, which was included without deduction.
87.3% (+4.4 pp) in LTV ≤ 60%
6.1% (–3.3 pp) in LTV > 60 ≤ 80%
2.4% (–1.1 pp) in LTV > 80 ≤ 100%
3.3% (–0.7 pp) in LTV > 100%
0.9% (+0.7 pp) Other collateral
Shipping Finance portfolio – LTV classes
GROUP M A N AGE M E N T R E P OR T
REPORT ON EXPECTED DEVELOPMENTS, OPPORTUNITIES AND RISKS
Report on opportunities and risks

152
DVB Bank SE | Group Annual Report 2014
The Bank’s Offshore Finance portfolio, which is largely denomi-nated in US dollars (88.0%), rose by 15.0% to €2.3 billion. Adjust-ing for exchange rate fluctuations, the portfolio size increased by 2.7%.
The chart below provides a breakdown of exposures secured by mortgages, by LTV range (loan amounts have been allocated to LTV classes proportionately):
100.0% of the lending volume (€2,277.2 million) is secured by ship mortgages. Lending volume of €2,188.2 billion has an LTV ratio not exceeding 60%.
At the end of 2014, the overall Aviation Finance portfolio stood at €7.1 billion (end-2013: €6.4 billion). This portfolio is also pre-dominantly denominated in US dollars (99.0%). Adjusting for exchange rate fluctuations, the portfolio size decreased by 2.7%.
The Aviation Finance portfolio also reflects the strict enforcement of the Bank’s lending standards characterised by conservative collateralisation structures, as shown in the following chart:
99.7% of the lending volume (€7,063.0 million) is secured by mortgages on aircraft. Lending volume of €5,973.4 billion has an LTV ratio not exceeding 60%. Only €9.7 million is secured by other forms of collateral, and exposures of €8.5 million are uncollater-alised.
84.4% (+0.8 pp) in LTV ≤ 60%
13.5% (–0.7 pp) in LTV > 60 ≤ 80%
1.5% (–0.2 pp) in LTV > 80 ≤ 100%
0.4% (0.0 pp) in LTV > 100%
0.1% (+0.1 pp) Other collateral
0.1% (0.0 pp) Uncollateralised
Aviation Finance portfolio – LTV classes
96.1% (–1.0 pp) in LTV ≤ 60%
3.6% (+1.1 pp) in LTV > 60 ≤ 80%
0.3% (–0.1 pp) in LTV > 80 ≤ 100%
Offshore Finance portfolio – LTV classes
Report on opportunities and risks

153
DVB Bank SE | Group Annual Report 2014
C ONSOL IDAT ED F IN A NCI A L S TA ME MEN T S
AUDI T OP INIONA B OU T US
DVB’s Land Transport Finance portfolio, 51.4% of which is denomi-nated in euros, and 42.8% in US dollars, grew by 25.0% year-on-year, to €2.0 billion. Adjusting for exchange rate fluctuations, the portfolio size increased by 14.7%. The LTV breakdown of the Land Transport Finance portfolio developed as follows:
99.3% of the lending volume (€1,942.1 million) is secured by mortgages, with €1,596.1 million having an LTV ratio not exceeding 60%. Only €7.0 million of the portfolio is secured by other forms of collateral, and exposures of €5.8 million are uncollateralised.
DVB integrated Loan Participations as a new product into its business model in mid-2007, establishing ITF Suisse, based in Zurich, for this purpose. ITF Suisse is participating in non-complex transactions fulfilling strict lending policy requirements. The vol-ume of this segment rose to €1,012.4 million in 2014 (up 23.1% year-on-year). Adjusting for exchange rate fluctuations, the portfolio size increased by 8.7%. Despite the persistent troubles in some maritime shipping sectors, the average LTV ratio improved during 2014. Hence, the share of financings having an LTV ratio not exceeding 60% rose by 4.7 percentage points, to 82.8%, or €837.8 million.
81.6% (–1.7 pp) in LTV ≤ 60%
15.5% (+1.3 pp) in LTV > 60 ≤ 80%
2.2% (+0.7 pp) in LTV > 80 ≤ 100%
0.0% (–0.1 pp) in LTV > 100%
0.4% (0.0 pp) Other collateral
0.3% (–0.2 pp) Uncollateralised
Land Transport Finance portfolio – LTV classes
82.8% (+4.7 pp) in LTV ≤ 60%
6.7% (–3.4 pp) in LTV > 60 ≤ 80%
2.6% (–1.6 pp) in LTV > 80 ≤ 100%
7.9% (+0.3 pp) in LTV > 100%
ITF Suisse portfolio – LTV classes
GROUP M A N AGE M E N T R E P OR T
REPORT ON EXPECTED DEVELOPMENTS, OPPORTUNITIES AND RISKS
Report on opportunities and risks
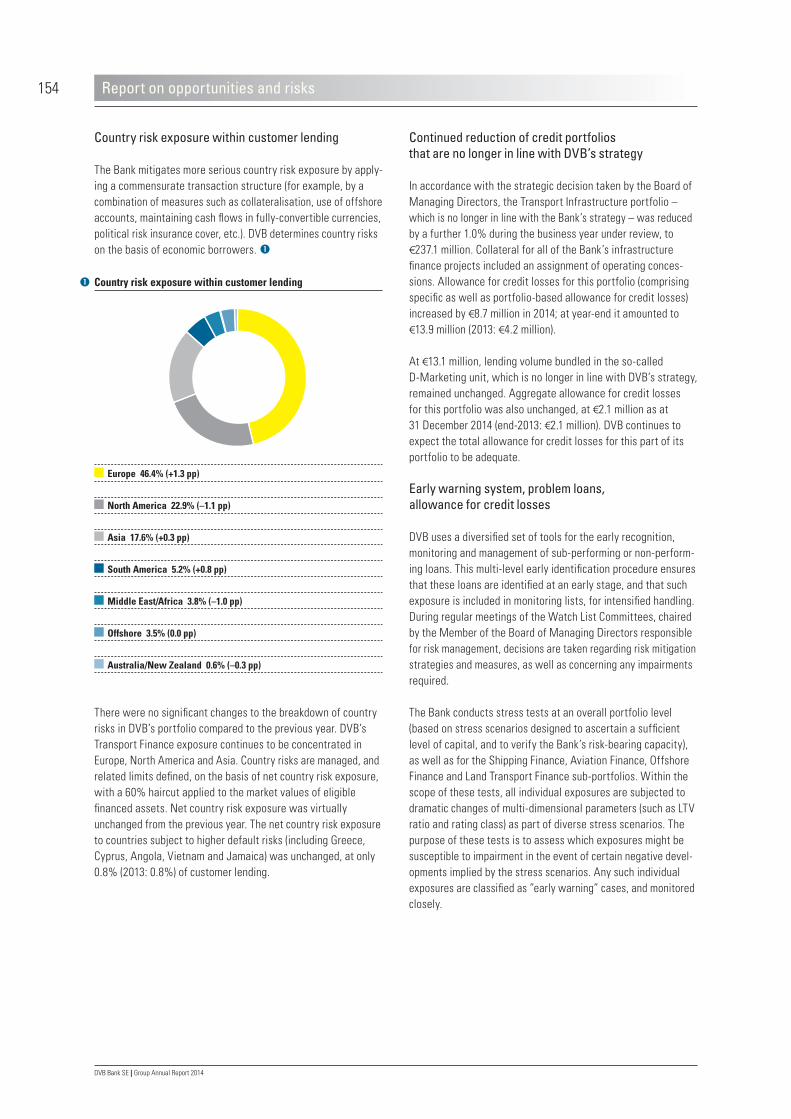
154
DVB Bank SE | Group Annual Report 2014
Continued reduction of credit portfolios that are no longer in line with DVB’s strategy
In accordance with the strategic decision taken by the Board of Managing Directors, the Transport Infrastructure portfolio – which is no longer in line with the Bank’s strategy – was reduced by a further 1.0% during the business year under review, to €237.1 million. Collateral for all of the Bank’s infrastructure finance projects included an assignment of operating conces-sions. Allowance for credit losses for this portfolio (comprising specific as well as portfolio-based allowance for credit losses) increased by €8.7 million in 2014; at year-end it amounted to €13.9 million (2013: €4.2 million).
At €13.1 million, lending volume bundled in the so-called D-Marketing unit, which is no longer in line with DVB’s strategy, remained unchanged. Aggregate allowance for credit losses for this portfolio was also unchanged, at €2.1 million as at 31 December 2014 (end-2013: €2.1 million). DVB continues to expect the total allowance for credit losses for this part of its portfolio to be adequate.
Early warning system, problem loans, allowance for credit losses
DVB uses a diversified set of tools for the early recognition, monitoring and management of sub-performing or non-perform-ing loans. This multi-level early identification procedure ensures that these loans are identified at an early stage, and that such exposure is included in monitoring lists, for intensified handling. During regular meetings of the Watch List Committees, chaired by the Member of the Board of Managing Directors responsible for risk management, decisions are taken regarding risk mitigation strategies and measures, as well as concerning any impairments required.
The Bank conducts stress tests at an overall portfolio level (based on stress scenarios designed to ascertain a sufficient level of capital, and to verify the Bank’s risk-bearing capacity), as well as for the Shipping Finance, Aviation Finance, Offshore Finance and Land Transport Finance sub-portfolios. Within the scope of these tests, all individual exposures are subjected to dramatic changes of multi-dimensional parameters (such as LTV ratio and rating class) as part of diverse stress scenarios. The purpose of these tests is to assess which exposures might be susceptible to impairment in the event of certain negative devel-opments implied by the stress scenarios. Any such individual exposures are classified as ”early warning” cases, and monitored closely.
Country risk exposure within customer lending
The Bank mitigates more serious country risk exposure by apply-ing a commensurate transaction structure (for example, by a combination of measures such as collateralisation, use of offshore accounts, maintaining cash flows in fully-convertible currencies, political risk insurance cover, etc.). DVB determines country risks on the basis of economic borrowers.
There were no significant changes to the breakdown of country risks in DVB’s portfolio compared to the previous year. DVB’s Transport Finance exposure continues to be concentrated in Europe, North America and Asia. Country risks are managed, and related limits defined, on the basis of net country risk exposure, with a 60% haircut applied to the market values of eligible financed assets. Net country risk exposure was virtually unchanged from the previous year. The net country risk exposure to countries subject to higher default risks (including Greece, Cyprus, Angola, Vietnam and Jamaica) was unchanged, at only 0.8% (2013: 0.8%) of customer lending.
Report on opportunities and risks
Europe 46.4% (+1.3 pp)
North America 22.9% (–1.1 pp)
Asia 17.6% (+0.3 pp)
South America 5.2% (+0.8 pp)
Middle East/Africa 3.8% (–1.0 pp)
Offshore 3.5% (0.0 pp)
Australia/New Zealand 0.6% (–0.3 pp)
Country risk exposure within customer lending

155
DVB Bank SE | Group Annual Report 2014
C ONSOL IDAT ED F IN A NCI A L S TA ME MEN T S
AUDI T OP INIONA B OU T US
The Bank has defined the scope of non-performing loans (NPLs) in line with the new guidelines promulgated by the European Banking Association (EBA) on ”Forbearance and Non-Performing Exposures”. Besides exposures that are more than 90 days over-due, the NPL portfolio comprises all exposures that are in default or impaired, regardless of whether interest and principal pay-ments are being made for such exposures. The EBA guidelines also provide for a ”good conduct” period of at least 12 months for renegotiated NPL exposures: NPL exposures to which none of these three criteria applies nonetheless remain part of the NPL portfolio during this period. Having applied a simplified NPL definition in the previous year (90 days past due, in default or impaired), DVB fully implemented the new definition in 2014.
NPL in the DVB Group amounted to an aggregate nominal value of €1,782.5 million at the end of 2014 (2013: €1,407.2 million). This equates to an NPL ratio of 6.8% (2013: 5.9%) in relation to total lending volume.
The following tables indicate the non-impaired, non-overdue lending volume as a portion of the overall portfolio, broken down by business division and region.
Lending volume that is neither impaired nor past due continues to account for the dominant share of the portfolio, at 94.5% (2013: 94.7%).
Non-impaired, non-overdue lending volume by business division (€ mn)
Total portfolio Non-impaired,
non-overdue portfolio
2014 2013 2014 2013
Shipping Finance 10,121.6 9,202.5 9,176.9 8,246.4
Aviation Finance 7,081.2 6,414.5 6,995.8 6,333.1
Offshore Finance 2,277.2 1,991.7 2,270.8 1,907.9
Land Transport Finance 1,954.9 1,611.5 1,905.2 1,604.2
Investment Management 612.6 462.1 450.0 402.3
ITF Suisse 1,012.4 822.7 918.1 790.4
Other 2,980.9 3,745.4 2,902.8 3,720.4
Total 26,040.8 24,250.4 24,619.6 23,004.7
Non-impaired, non-overdue lending volume by region (€ mn)
Total portfolio Non-impaired,
non-overdue portfolio
2014 2013 2014 2013
Europe 13,485.8 12,807.4 12,394.6 11,868.3
North America 5,381.6 5,035.1 5,189.9 4,977.2
Asia 4,107.6 3,584.4 4,058.4 3,409.4
Middle East/Africa 881.6 988.5 878.1 962.0
South America 1,202.9 918.0 1,130.0 904.6
Offshore 810.2 720.2 797.5 686.8
Australia/New Zealand 171.1 196.8 171.1 196.4
Total 26,040.8 24,250.4 24,619.6 23,004.7
GROUP M A N AGE M E N T R E P OR T
REPORT ON EXPECTED DEVELOPMENTS, OPPORTUNITIES AND RISKS
Report on opportunities and risks
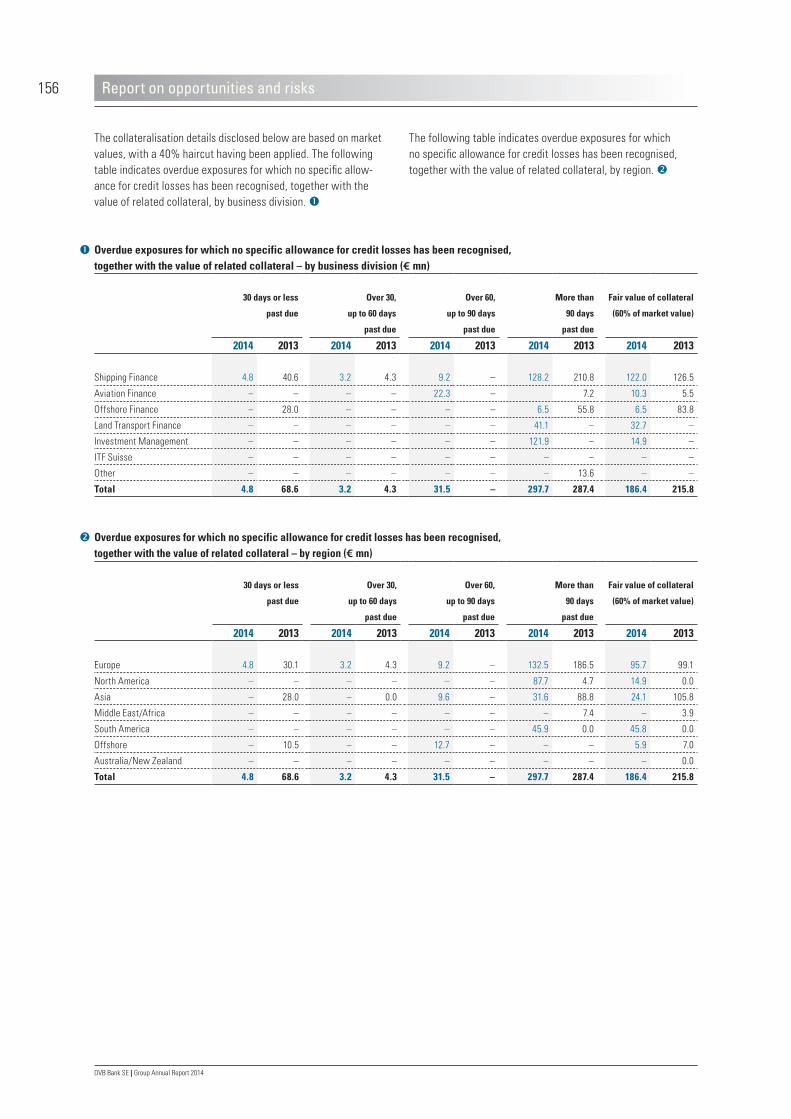
156
DVB Bank SE | Group Annual Report 2014
The following table indicates overdue exposures for which no specific allowance for credit losses has been recognised, together with the value of related collateral, by region.
The collateralisation details disclosed below are based on market values, with a 40% haircut having been applied. The following table indicates overdue exposures for which no specific allow-ance for credit losses has been recognised, together with the value of related collateral, by business division.
Overdue exposures for which no specific allowance for credit losses has been recognised, together with the value of related collateral – by business division (€ mn)
30 days or less
past due
Over 30,
up to 60 days
past due
Over 60,
up to 90 days
past due
More than
90 days
past due
Fair value of collateral
(60% of market value)
2014 2013 2014 2013 2014 2013 2014 2013 2014 2013
Shipping Finance 4.8 40.6 3.2 4.3 9.2 – 128.2 210.8 122.0 126.5
Aviation Finance – – – – 22.3 – 7.2 10.3 5.5
Offshore Finance – 28.0 – – – – 6.5 55.8 6.5 83.8
Land Transport Finance – – – – – – 41.1 – 32.7 –
Investment Management – – – – – – 121.9 – 14.9 –
ITF Suisse – – – – – – – – – –
Other – – – – – – – 13.6 – –
Total 4.8 68.6 3.2 4.3 31.5 – 297.7 287.4 186.4 215.8
Overdue exposures for which no specific allowance for credit losses has been recognised, together with the value of related collateral – by region (€ mn)
30 days or less
past due
Over 30,
up to 60 days
past due
Over 60,
up to 90 days
past due
More than
90 days
past due
Fair value of collateral
(60% of market value)
2014 2013 2014 2013 2014 2013 2014 2013 2014 2013
Europe 4.8 30.1 3.2 4.3 9.2 – 132.5 186.5 95.7 99.1
North America – – – – – – 87.7 4.7 14.9 0.0
Asia – 28.0 – 0.0 9.6 – 31.6 88.8 24.1 105.8
Middle East/Africa – – – – – – – 7.4 – 3.9
South America – – – – – – 45.9 0.0 45.8 0.0
Offshore – 10.5 – – 12.7 – – – 5.9 7.0
Australia/New Zealand – – – – – – – – – 0.0
Total 4.8 68.6 3.2 4.3 31.5 – 297.7 287.4 186.4 215.8
Report on opportunities and risks

157
DVB Bank SE | Group Annual Report 2014
C ONSOL IDAT ED F IN A NCI A L S TA ME MEN T S
AUDI T OP INIONA B OU T US
The forbourne exposure as at 31 December 2014 was deter-mined, for the first time, in line with the rules and regulations on ”Forbearance and Non-Performing Exposures”, as published by the European Banking Association (EBA). Forbourne exposure comprises exposures where contractually-agreed terms were restructured in favour of borrowers, as a result of their financial difficulties. Aggregate forbourne exposure amounted to €1,466.1 million, consisting of €981.3 million in non-performing loans (NPLs) and €484.8 million in performing loans.
The following two tables indicate the lending volume for which specific allowance for credit losses has been recognised, together with related collateral, by business division and region, respectively.
Lending volume for which specific allowance for credit losses has been recognised and related collateral – by business division (€ mn)
Amount before
specific allowance
Specific
allowance
Amount after
specific allowance
Fair value of collateral
(60% of market value)
2014 2013 2014 2013 2014 2013 2014 2013
Shipping Finance 799.2 700.4 –102.2 –102.2 697.0 598.2 351.4 328.5
Aviation Finance 63.2 74.3 –33.3 –32.1 29.9 42.2 41.2 50.9
Offshore Finance – 0.0 – 0.0 – 0.0 – 0.0
Land Transport Finance 8.6 7.2 –1.2 –1.2 7.4 6.0 8.5 4.0
Investment Management 40.6 59.8 –16.6 –15.5 24.0 44.3 – 0.0
ITF Suisse 94.3 32.3 –16.6 –3.0 77.7 29.3 30.1 10.3
Other 78.1 11.4 –14.0 –4.7 64.1 6.7 2.7 2.7
Total 1,084.0 885.4 –183.9 –158.7 900.1 726.7 433.9 396.4
Lending volume for which specific allowance for credit losses has been recognised and related collateral – by region (€ mn)
Amount before
specific allowance
Specific
allowance
Amount after
specific allowance
Fair value of collateral
(60% of market value)
2014 2013 2014 2013 2014 2013 2014 2013
Europe 941.5 718.2 –143.9 –102.8 797.6 615.4 406.8 334.6
North America 104.0 53.2 –25.3 –21.2 78.7 32.0 14.1 17.8
Asia 8.0 58.3 –4.2 –13.1 3.8 45.2 3.9 18.5
Middle East/Africa 3.5 19.1 –2.0 –2.0 1.5 17.1 – 9.1
South America 27.0 13.4 –8.5 –1.5 18.5 11.9 9.1 12.2
Offshore – 22.8 – –17.7 – 5.1 – 3.8
Australia/New Zealand – 0.4 – –0.4 – 0.0 – 0.4
Total 1,084.0 885.4 –183.9 –158.7 900.1 726.7 433.9 396.4
GROUP M A N AGE M E N T R E P OR T
REPORT ON EXPECTED DEVELOPMENTS, OPPORTUNITIES AND RISKS
Report on opportunities and risks

158
DVB Bank SE | Group Annual Report 2014
The following four tables illustrate the development of the allowance for credit losses for the business years 2013 and 2014, by business division and region. For this purpose, allowance for credit losses – which is determined in accordance with IFRS – is broken down into specific allowance for credit losses, portfolio-based allowance for credit losses, and provisions.
In the breakdown by business division and region, the ”Business no longer in line with DVB’s strategy” item includes allowance for credit losses in the portfolio of D-Marketing and the Trans-port Infrastructure Finance portfolio. The ”Other” item contains allowance for credit losses in the portfolios of Treasury and DVB LogPay.
Taking into account the fair value of collateral (60% of market value), 48.2% (2013: 54.6%) of the impaired portfolio (based on the amount after specific allowance for credit losses) is duly collateralised.
On the reporting date, DVB held €146.6 million (2013: €160.3 million) in property and equipment as a result of restruc-turing measures. The Bank intends to sell or lease these assets, taking into consideration the relevant market situation and leveraging the know-how of DVB’s asset management teams.
Allowance for credit losses by business division – 2014 (€ mn)1)
Allowance
for credit
losses
as at
1 Jan 2014
Additions
Utilisation
Reversals
Changes
resulting from
exchange rate
fluctuations,
and other
adjustments
Balance
as at
31 Dec 2014
Direct
write-offs
Recoveries
on loans
and
advances
previously
written off
Shipping Finance 103.0 88.5 –56.1 –43.5 10.3 102.2 7.4 2.7
Aviation Finance 32.1 11.0 –9.4 –5.1 4.7 33.3 – 4.1
Offshore Finance – – – – – – – –
Land Transport Finance 1.2 1.3 – –1.3 0.0 1.2 – –
Investment Management 15.5 7.4 –6.1 –2.4 2.2 16.6 – –
ITF Suisse 3.0 13.1 – –0.1 0.6 16.6 0.6 0.1
Business no longer in line
with DVB’s strategy 4.6 12.2 –4.0 1.0 13.8 – 3.0
Other 0.1 0.0 – – – 0.1 0.6 0.0
Total specific allowance
for credit losses 159.5 133.5 –71.6 –56.4 18.8 183.8 8.6 9.9
Shipping Finance 28.7 7.3 – –18.4 2.2 19.8 – –
Aviation Finance 9.2 3.7 – –5.3 0.8 8.4 – –
Offshore Finance 1.3 0.7 – –0.7 0.2 1.5 – –
Land Transport Finance 0.3 0.4 – –0.1 0.0 0.6 – –
Investment Management – – – – – – – –
ITF Suisse 3.7 1.1 – –2.6 0.3 2.5 – –
Business no longer in line
with DVB’s strategy 1.7 0.5 – – – 2.2 – –
Other 0.1 0.0 – 0.0 – 0.1 – –
Total portfolio-based allowance
for credit losses 45.0 13.7 – –27.1 3.5 35.1 – –
Total impairments and allowances 204.5 147.2 –71.6 –83.5 22.3 218.9 8.6 9.9
Business no longer in line with DVB’s strategy 0.1 – – – – 0.1 – –
Total provisions 0.1 – – – – 0.1 – –
Total allowance for credit losses 204.6 147.2 –71.6 –83.5 22.3 219.0 8.6 9.9
1) Retrospective application of IFRS 10 resulted in an adjustment of the previous year’s figure (31 December 2013) and hence, of values as at 1 January 2014. For more detailed explanations, please refer to the Notes from page 176 onwards.
Report on opportunities and risks

159
DVB Bank SE | Group Annual Report 2014
C ONSOL IDAT ED F IN A NCI A L S TA ME MEN T S
AUDI T OP INIONA B OU T US
Allowance for credit losses by business division – 2013 (€ mn)1)
Allowance
for credit
losses
as at
1 Jan 2013
Additions
Utilisation
Reversals
Changes
resulting from
exchange rate
fluctuations,
and other
adjustments
Balance
as at
31 Dec 2013
Direct
write-offs
Recoveries
on loans
and
advances
previously
written off
Shipping Finance 57.7 82.1 –19.3 –14.5 –3.0 103.0 2.5 0.4
Aviation Finance 26.2 19.0 –1.9 –9.9 –1.3 32.1 – 6.2
Offshore Finance – – – – – – – –
Land Transport Finance 1.1 0.2 – –0.2 0.1 1.2 – –
Investment Management 9.7 6.6 – –0.3 –0.5 15.5 – –
ITF Suisse 1.7 3.1 –1.7 – –0.1 3.0 0.3 –
Business no longer in line
with DVB’s strategy 6.8 – –2.2 – – 4.6 6.6 0.0
Other 0.0 0.1 – – – 0.1 0.2 0.1
Total specific allowance
for credit losses 103.2 111.0 –25.1 –24.9 –4.9 159.5 9.6 6.7
Shipping Finance 26.6 32.8 – –30.7 – 28.7 – –
Aviation Finance 11.1 4.8 – –6.7 – 9.2 – –
Offshore Finance 1.0 0.7 – –0.4 – 1.3 – –
Land Transport Finance 0.4 0.6 – –0.7 – 0.3 – –
Investment Management – – – – – – – –
ITF Suisse 4.4 4.5 – –5.2 – 3.7 – –
Business no longer in line
with DVB’s strategy 2.4 – – –0.7 – 1.7 – –
Other 0.1 0.0 – – – 0.1 – –
Total portfolio-based allowance
for credit losses 46.0 43.4 – –44.4 0.0 45.0 9.6 6.7
Total impairments and allowances 149.2 154.4 –25.1 –69.3 –4.9 204.5 – –
Aviation Finance 0.1 – – –0.1 – – – –
Business no longer in line with DVB’s strategy 0.1 – – 0.0 – 0.1 – –
Total provisions 0.2 – – –0.1 – 0.1 – –
Total allowance for credit losses 149.4 154.4 –25.1 –69.4 –4.9 204.6 9.6 6.7
1) Retrospective application of IFRS 10 resulted in an adjustment of the previous year’s figure (31 December 2013) and hence, of values as at 1 January 2014. For more detailed explanations, please refer to the Notes from page 176 onwards.
GROUP M A N AGE M E N T R E P OR T
REPORT ON EXPECTED DEVELOPMENTS, OPPORTUNITIES AND RISKS
Report on opportunities and risks
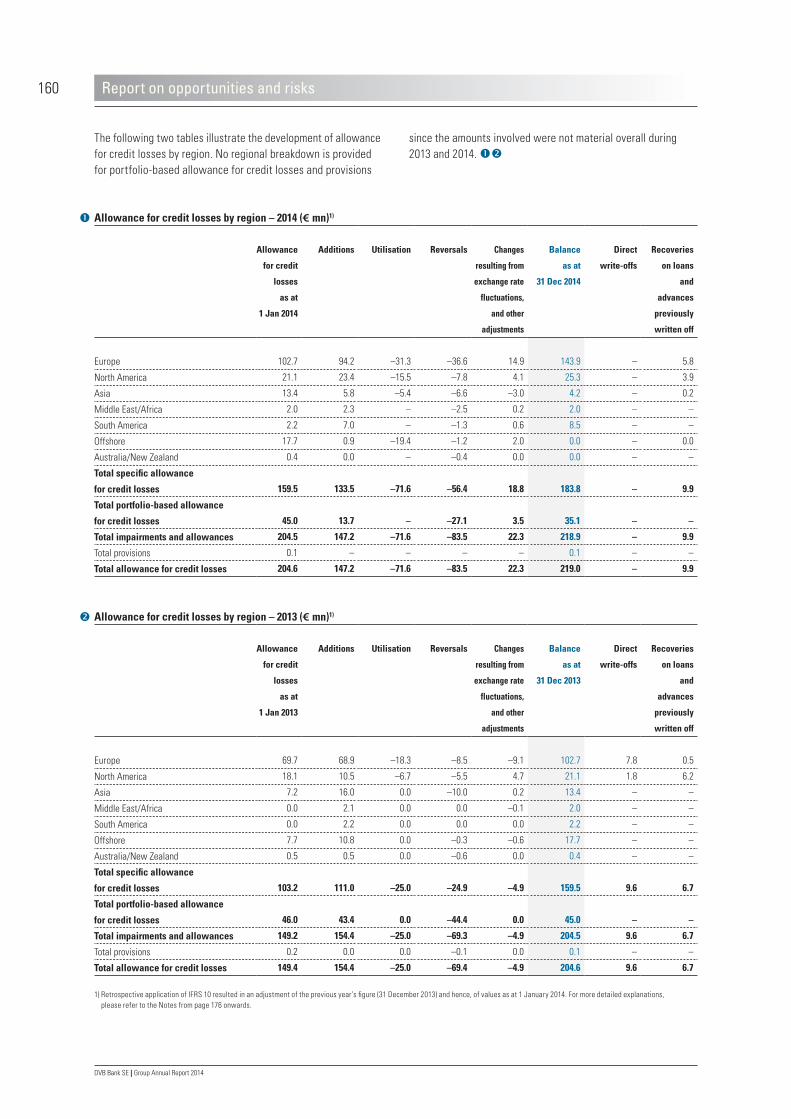
160
DVB Bank SE | Group Annual Report 2014
since the amounts involved were not material overall during 2013 and 2014.
The following two tables illustrate the development of allowance for credit losses by region. No regional breakdown is provided for portfolio-based allowance for credit losses and provisions
Allowance for credit losses by region – 2014 (€ mn)1)
Allowance
for credit
losses
as at
1 Jan 2014
Additions
Utilisation
Reversals
Changes
resulting from
exchange rate
fluctuations,
and other
adjustments
Balance
as at
31 Dec 2014
Direct
write-offs
Recoveries
on loans
and
advances
previously
written off
Europe 102.7 94.2 –31.3 –36.6 14.9 143.9 – 5.8
North America 21.1 23.4 –15.5 –7.8 4.1 25.3 – 3.9
Asia 13.4 5.8 –5.4 –6.6 –3.0 4.2 – 0.2
Middle East/Africa 2.0 2.3 – –2.5 0.2 2.0 – –
South America 2.2 7.0 – –1.3 0.6 8.5 – –
Offshore 17.7 0.9 –19.4 –1.2 2.0 0.0 – 0.0
Australia/New Zealand 0.4 0.0 – –0.4 0.0 0.0 – –
Total specific allowance
for credit losses 159.5 133.5 –71.6 –56.4 18.8 183.8 – 9.9
Total portfolio-based allowance
for credit losses 45.0 13.7 – –27.1 3.5 35.1 – –
Total impairments and allowances 204.5 147.2 –71.6 –83.5 22.3 218.9 – 9.9
Total provisions 0.1 – – – – 0.1 – –
Total allowance for credit losses 204.6 147.2 –71.6 –83.5 22.3 219.0 – 9.9
Allowance for credit losses by region – 2013 (€ mn)1)
Allowance
for credit
losses
as at
1 Jan 2013
Additions
Utilisation
Reversals
Changes
resulting from
exchange rate
fluctuations,
and other
adjustments
Balance
as at
31 Dec 2013
Direct
write-offs
Recoveries
on loans
and
advances
previously
written off
Europe 69.7 68.9 –18.3 –8.5 –9.1 102.7 7.8 0.5
North America 18.1 10.5 –6.7 –5.5 4.7 21.1 1.8 6.2
Asia 7.2 16.0 0.0 –10.0 0.2 13.4 – –
Middle East/Africa 0.0 2.1 0.0 0.0 –0.1 2.0 – –
South America 0.0 2.2 0.0 0.0 0.0 2.2 – –
Offshore 7.7 10.8 0.0 –0.3 –0.6 17.7 – –
Australia/New Zealand 0.5 0.5 0.0 –0.6 0.0 0.4 – –
Total specific allowance
for credit losses 103.2 111.0 –25.0 –24.9 –4.9 159.5 9.6 6.7
Total portfolio-based allowance
for credit losses 46.0 43.4 0.0 –44.4 0.0 45.0 – –
Total impairments and allowances 149.2 154.4 –25.0 –69.3 –4.9 204.5 9.6 6.7
Total provisions 0.2 0.0 0.0 –0.1 0.0 0.1 – –
Total allowance for credit losses 149.4 154.4 –25.0 –69.4 –4.9 204.6 9.6 6.7
1) Retrospective application of IFRS 10 resulted in an adjustment of the previous year’s figure (31 December 2013) and hence, of values as at 1 January 2014. For more detailed explanations, please refer to the Notes from page 176 onwards.
Report on opportunities and risks

161
DVB Bank SE | Group Annual Report 2014
C ONSOL IDAT ED F IN A NCI A L S TA ME MEN T S
AUDI T OP INIONA B OU T US
ECB’s Comprehensive Assessment
As a subsidiary of DZ BANK AG, DVB’s credit portfolios were included in the Asset Quality Review of DZ BANK Group (based on data as at 31 December 2013), whereby the ECB focused on auditing shipping finance portfolios in particular. Based on a so-called stricter regulatory approach, the audit identified additional impairments for DVB’s Shipping Finance portfolio. These adjust-ments were exclusively due to the methodology applied by the ECB, which diverges from the applicable accounting standard (IAS 39). Accordingly, the Asset Quality Review did not give rise to any relevant need for adjustments to the Bank’s accounting and financial reporting system. Moreover, the adjustments exclusively related to exposures that DVB had already included in the monitoring lists of DVB’s early warning system. To the extent possible within the measurement ranges permitted under IAS 39, the affected exposures were written down accordingly in 2014.
The results of the Comprehensive Assessment for DZ BANK Group have been published by the ECB and are available on the following website:
www.bankingsupervision.europa.eu/banking/ comprehensive/html/index.en.html
Operational risk
Monitoring and managing operational risks largely comprises the development of a methodology for identifying, quantifying and managing risk, and maintaining an adequate risk reporting system. In view of DVB’s moderately complex – yet highly trans-parent – processes, the so-called Basic Indicator Approach is deemed appropriate. A central OpRisk Committee was estab-lished for this purpose, as well as the function of a decentralised OpRisk Manager for each of DVB’s worldwide locations.
The tools DVB has implemented to manage operational risk are scenario-based self-assessments, carried out at least once a year in respect of each location, on a divisional or departmental level, plus the loss database – where losses incurred due to operational risks are recorded. Within the specifications of DZ BANK Group, DVB also compiles risk indicators that conform to the requirements of the standard approach within the scope of DZ BANK Group procedures. Quarterly reports containing the results are submitted to the Board of Managing Directors and the OpRisk Committee; where appropriate, this is supported by ad-hoc reporting.
DVB has devised and implemented business continuity plans to minimise such operational risks in particular which may be caused by external disruptions to business processes, and to the Bank’s services. These plans are ”risk-oriented”; they provide for numerous measures designed to restore key workflows and services within a reasonable amount of time, and with appropriate quality. The viability of business continuity plans is revised period-ically.
Going forward, the Risk & Governance Committee will be dealing with the constantly-changing legal and regulatory requirements for operating a bank. From DVB’s perspective, increasing regula-tory requirements are a growing source of risk.
GROUP M A N AGE M E N T R E P OR T
REPORT ON EXPECTED DEVELOPMENTS, OPPORTUNITIES AND RISKS
Report on opportunities and risks

162
DVB Bank SE | Group Annual Report 2014
implemented in the previous year due to an increasing number of outliers discovered in backtesting. New outliers discovered in November did not require a renewed upscaling of market risk parameters.
Risk Control, which is responsible for monitoring market price risks, has direct access to the trading and settlement systems, allowing it to observe whether limits are being observed. The market price risks incurred are therefore subject to constant measurement and limit monitoring through Risk Control, which reports to the Board of Managing Directors on a daily basis. The risk positions are managed on the basis of limits approved by the Board of Managing Directors, which are in turn derived from the risk capital approved by the Board. Besides daily VaR (based on a one-day holding period and a 99.0% confidence level), the Bank also determines VaR based on a one-year holding period and a confidence level of 99.9%; the results are compared to risk capital and taken into account when determining usage of aggregate risk capital.
In addition, DVB determines market price risks using a monthly stress test, based on an entire interest rate cycle. The Bank regularly discusses the calculations applied to such stress tests in the Asset/Liability Committee (ALCO). This is designed to ensure a timely reaction to developments. The results of monthly stress testing are also used as a parameter when determining market price risk limits for 2015. In addition to two stress scenar-ios based on a historical simulation using a ten-year observation period and a ten-day holding period, a separate scenario used specifically maps market price developments during the most recent financial markets crisis. Moreover, an an additional hypo-thetical scenario was developed. This is based on an extensive analysis of long-term market parameters, considering both potential changes in market parameters and DVB’s specific exposures. The scenario derived in this manner does not incorpo-rate any risk-offsetting effects; it thus represents a worst-case scenario.
Market price risk
Group Treasury is responsible for managing market price risks in both the banking and the trading books. The Asset and Liability Committee (ALCO) meets on a monthly basis, to review the mar-ket risk exposure for the entire Bank and to reach fundamental agreements on risk orientation. Market price risks are deter-mined for both DVB’s trading book and the banking book on the basis of the same VaR procedure. Using this VaR method, the maximum loss that may arise due to market price risks during a holding period of one day is quantified at a confidence level of 99.0 % on the basis of a historical simulation. The effectiveness of the VaR method is assured by means of a back-testing proce-dure. During this back-testing procedure, the gains and losses of the positions in the trading book and the banking book are calculated on a daily basis, using real market price changes, and are compared with the values determined by the VaR method. Moreover, the Bank carries out an annual adequacy check for liquidity risks, which includes an in-depth review of the risk model. Furthermore, DVB analyses whether and which risks are material within the scope of an annual risk inventory.
In principle, DVB neutralises interest rate risks through interest rate swaps, which are used to transform assets and liabilities with fixed interest rates into variable-rate positions. DVB endeav-ours to maintain a neutral currency position, and hence uses cross-currency swaps or foreign exchange swaps to hedge against foreign exchange risks. Therefore, DVB’s market price risk exposure tends to be insignificant.
The development of market risk in 2014 was primarily driven by fluctuations in the present-value USD foreign exchange exposure, which slightly decreased market risk during the course of the year. A more pronounced decline during the second quarter was due to an adjustment of how internal foreign-currency postings are mapped. In addition, the Bank was able to reverse a scaling-up of market risk parameters at the mid-year point; this had been
4
3
2
1
0
January
February
March
April
May
June
July
August
September
October
November
December
VaR total VaR Equity (equity risk) VaR FX (currency risk) VaR IR (interest risk) VaR limit
Daily VaR 2014
€ mn
Report on opportunities and risks

163
DVB Bank SE | Group Annual Report 2014
C ONSOL IDAT ED F IN A NCI A L S TA ME MEN T S
AUDI T OP INIONA B OU T US
Business risk
DVB’s business policy is defined by the entire Board of Manag-ing Directors, within the scope of closed-door strategy meet-ings. The policy is then discussed and agreed upon with the Supervisory Board, in accordance with the Memorandum and Articles of Association and the respective internal regulations. DVB has allocated risk capital for business risk since 2011, measuring risk exposure using a VaR approach with a 99.9% confidence level, based on the volatility of monthly profits.
Liquidity risk
DVB’s liquidity risks are centrally analysed and managed on the basis of Group Treasury guidelines laid down by the Board of Managing Directors. Group Treasury, which reports to both the ALCO and the entire Board of Managing Directors, assumes responsibility for this process. Decisions on major refinancing projects are made by the ALCO. Anticipated cash flows are cal-culated, aggregated and offset by transactions on the money and capital markets, on the basis of continuously updated plans for liquidity flows and cash flow forecasts. These are prepared using SAP data and state-of-the-art asset/liability management software. The position limit system, designed to match the ratio set out in the Liquidity Principle in accordance with the German Banking Act, ensures that timely and appropriate corrective measures can be taken. The latest software generation provides us with a state-of-the-art tool that fully complies with all require-ments for a modern liquidity risk measurement environment. This application’s functionality fulfils both the requirements under the MaRisk and the Bank’s internal needs for managing and reporting on liquidity risks.
Risk Control is responsible for monitoring liquidity risk; for this purpose, it carries out analyses independently from Group Treasury. In addition to multiple base cases, the analyses include various stress scenarios including worst-case assumptions with regard to liquidity. All cash flows from DVB’s existing business are taken into account, plus simulated cash flows from pending loan commitments and the Bank’s budgeted new business. The
results of these daily analyses are aggregated in a report, which is included in the daily reporting package to the entire Board of Managing Directors. The stress tests applied include specific stress factors which have a negative effect upon the Bank’s liquidity. Specifically, the Bank simulates a short-term increase in liquidity needs resulting from an early drawdown of credit lines, as well as a reduction in cash inflows, due to borrower defaults or lower repayments. In addition, DVB simulates market-induced changes such as interest rate or exchange rate fluctua-tions. The Bank regularly review the underlying assumptions for the scenarios used, adjusting them if appropriate. In the event of an anticipated liquidity shortage, Risk Control triggers a defined escalation procedure, in coordination with Group Treasury. Should the measures taken by Group Treasury within the scope of the initial escalation level prove insufficient, the Risk & Governance Committee is informed in a second escalation level, in order to take appropriate countermeasures.
Against this background, DVB’s integration into the German Cooperative Financial Services Network once again proved to be a key factor during 2014, as the highly liquid German cooper-ative banking sector permitted the Bank to cover funding require-ments with these partners, at prevailing market terms, at all times. This enables DVB to maintain a comfortable funding basis in the stress of a crisis.
DVB has reflected this situation in its stress scenarios, which are based on the Bank’s integration in the German Cooperative Financial Services Network to a large extent. Stress tests were defined in accordance with new regulatory requirements. Assum-ing a going concern, these require sufficient liquidity reserves for a one-month ”survival period”, even under stress conditions. If the liquidity run-off profile indicates a shortage of liquidity reserves, counter-measures to improve liquidity must be taken without delay. The Bank has implemented an escalation proce-dure for this purpose, which is monitored by Risk Control on a daily basis. In compliance with these requirements, DVB main-tains a liquidity reserve comprising €255 million in highly liquid securities.
VaR in the banking business (€ 000’s)
Currency
risk
Interest
risk
Equity
risk
Offsetting
effect1)
Total
31 Dec 2013 2,206.0 1,153.5 900.7 –1,737.2 2,523.0
Average 789.3 505.9 537.8 –727.5 1,105.5
Minimum 124.4 137.4 422.6 –192.4 492.0
Maximum 2,595.5 1,257.2 898.4 –2,064.3 2,686.8
31 Dec 2014 303.2 457.8 439.4 –598.2 602.2
1) Offsetting effects between currency, interest rate and equity risks
GROUP M A N AGE M E N T R E P OR T
REPORT ON EXPECTED DEVELOPMENTS, OPPORTUNITIES AND RISKS
Report on opportunities and risks

164
DVB Bank SE | Group Annual Report 2014
Opportunities available to DVB
DVB has a unique and clearly focused business model: to arrange and provide structured finance, advisory services and investment management services to the Bank’s clients who are active in the international transport markets. Notwithstanding the cyclicality of these markets, the transport business overall is benefiting from a long-term growth trend. Thanks to its profile as a renowned specialist for financing and advisory services to the international transport industry, there are manifold opportu-nities available to DVB – even in the still challenging market environment in certain maritime shipping sectors – which the Bank intends to use.
• DVB diversified its Transport Finance portfolios at an early stage – by various criteria, and according to different catego-ries. Exposures are diversified by multiple criteria and diverse categories, including asset type, vintage, manufacturer, region, borrower, user and asset employment. Leveraging the Bank’s broadly diversified and well collateralised portfolios, DVB is generally in a position to seize profitable opportunities, even during downturn phases.
• Against the background of tight refinancing and a restricted capital base, in conjunction with higher refinancing risks, competitors have adopted a clearly more restrictive lending policy; some have stopped lending altogether. In particular, this applies to banks and investors who exposed themselves to the transport finance business opportunistically, in a posi-tive market environment.
Besides conducting its own stress tests, DVB is integrated into DZ BANK’s liquidity risk measurement process. DVB obtains stress test results determined by DZ BANK on a daily basis; these results are counted towards the liquidity limit set by DZ BANK. Any shortfall below the minimum limit will trigger an escalation process designed to remedy such transgression at short notice.
Moreover, DVB carries out an annual adequacy check for liquidity risks, which includes an in-depth review of the risk model; it also analyses whether and which risks are material within the scope of an annual risk inventory.
DVB consistently adhered to regulatory liquidity principles throughout 2014. Its liquidity indicator – the ratio of available cash and cash equivalents to payment obligations due – aver-aged 1.98 (2013: 2.48) during the year, and was once again clearly above the minimum regulatory level of 1.00.
Equity investment risk
DVB Bank SE’s material subsidiaries, whose business activities are fully integrated in DVB Group’s risk management process, are included in the consolidated financial statements. Equity investments that need not be consolidated are shown under equity investment risk. Potential losses from such investments are estimated using a VaR approach with a 99.9% confidence level, whereby value fluctuations of assets financed through the investments are used as risk drivers for the volatility of carrying amounts. DVB will continue to work on further development of its risk model in 2015, in order to further improve the parameter estimates used as a basis for calculating risk capital.
4
3
2
1
0
January
February
March
April
May
June
July
August
September
October
November
December
Development of the liquidity indicator Regulatory minimum ratio
Liquidity ordinance 2014
Report on opportunities and risks

165
DVB Bank SE | Group Annual Report 2014
C ONSOL IDAT ED F IN A NCI A L S TA ME MEN T S
AUDI T OP INIONA B OU T US
• In contrast, the strategy adopted by DVB is cycle-neutral: this is why the Bank has remained a reliable partner to its clients, continuing to provide financing and advice even during a diffi-cult environment in certain segments. This will further inten-sify client relationships, bolstering long-term trust, and will also attract new clients. In the prevailing market environment, this sustainable strategy provides DVB with a substantial competitive edge.
• DVB has the opportunity to further expand the advisory and other services it offers, and to increasingly offer them to clients, banks, and investors. This provides the opportunity of exploring potential sources of income which are not linked to credit, and which are virtually risk-neutral.
• The Bank decided at an early stage to develop and implement an Internal Rating Model (IRM), covering all four Transport Finance divisions, which complies with the requirements of the Advanced Approach under Basel II. This provides DVB with an advantage over various competitors, as it enables the Bank to manage its financing volume on a selective and risk-aware basis. The Credit Portfolio Model implemented in 2013 enables the Bank to identify and measure concentration and migration risks, and thus to optimise the risk structure of its portfolios.
Applying the structure of a SWOT analysis, DVB Group’s key strengths, weaknesses, opportunities, and threats are summa-rised as follows:
SWOT Analysis
Strengths
Unique business model with a clear focus, cycle-neutral business approach,
and a global presence in all key transport markets
Conservative and sustainable business policy
Flat hierarchies, high degree of flexibility, lean decision-making
Highly qualified, experienced staff
Customised products and services, high level of client service,
as well as close contacts to manufacturers and leasing companies
Extensive market and asset expertise
Credit portfolio diversified by various criteria and categories
Advanced risk management and pricing systems
Matched-maturity funding
Strong capital base through own funds
Opportunities
Realisation of margins in line with risks taken
Expansion of anti-cyclical Investment Management activities
Building new client relationships
Numerous initiatives taken to broaden the product portfolio
and enhance cross-selling
Funding available through access to the extensive liquidity offered
by the German Cooperative Financial Services Network
Expanding the advisory and other services offered to clients, banks,
and investors
Boosting DVB’s reputation as a reliable partner to the
international transport industry
Weaknesses
Higher liquidity costs, compared to most competitors
Direct relationship between the Bank’s business development
and GDP growth
At present, an almost exclusive focus on senior secured financings
Relatively high sector exposure
Global presence requires high staff resources
High staff costs due to high levels of employee qualification in terms
of academic expertise and experience
No material client deposits
Exposure to the euro/US dollar exchange rate, with an impact on
growth and results
Threats
Distortions on the money and capital markets, in the broadest sense
Decline in transport asset values, in various market segments
High level of early repayments, which have a negative impact
on the net interest margin
Fallout of the global financial markets crisis and of the
sovereign debt crisis in Europe
Indebtedness of certain industrial nations and emerging markets
Unanticipated rise of the US dollar against the euro
Further government support for DVB’s direct competitors
and increasing regulatory requirements
Volatility of crude oil prices
GROUP M A N AGE M E N T R E P OR T
REPORT ON EXPECTED DEVELOPMENTS, OPPORTUNITIES AND RISKS
Report on opportunities and risks

166
DVB Bank SE | Group Annual Report 2014
DVB’s business remained within the Bank’s economic risk-bearing capacity throughout 2014. The overall risk capital limit was adhered to at all times during the business year under review. The Bank’s ability to meet its payment obligations was never compromised during the period under review.
From today’s perspective, DVB believes that:
• it will continue to have access to sufficient liquidity throughout the 2015 business year;
• the Bank will comply with regulatory solvency requirements; and
• the Bank’s risk profile will continue to remain in line with its economic risk-bearing capacity.
Hence, there are no indications for any threats to DVB’s continued existence.
Conclusion
DVB has an adequate and viable system for managing opportu-nities and risks that fulfils the Bank’s own commercial needs and complies with legal and regulatory requirements. Managing opportunities and risks is an integral part of the Group-wide strategic planning process. Risk management is based on the risk strategies adopted by the Board of Managing Directors.
Given its high importance for DVB’s continued existence, and the extensive legal and regulatory requirements the Bank needs to comply with, risk management needs to be performed to a very high degree of detail and involving a wide scope of the Bank’s organisation. Managing opportunities is based on a qualitative approach, and is closely related to the strategic planning process.
Given the methods, models and organisational rules implemented, DVB is able to recognise material opportunities and risks at an early stage, and to respond appropriately by taking suitable measures. This applies in particular to the early detection of risks that may threaten the Bank’s existence.
The results determined using risk models are used to determine DVB’s business policy. The powerful risk management instru-ments applied are continuously fine-tuned and developed further. Considering the limit system geared toward the Bank’s risk-bearing capacity, a meaningful early warning system, extensive stress testing and a swift, flexible internal reporting system, senior management is in a position to take take targeted counter-measures when needed, at any time.
Report on opportunities and risks

167
DVB Bank SE | Group Annual Report 2014
C ONSOL IDAT ED F IN A NCI A L S TA ME MEN T S
AUDI T OP INIONA B OU T US
Explanatory disclosures under takeover law
Report of the Board of Managing Directors on relations with affiliated companies
Disclosures pursuant to section 315 (4) no. 6 of the German Commercial Code (HGB)
Please refer to sections 84 and 85 of the German Public Limited Companies Act (AktG) and Article 7 (3) of the Bank’s Memorandum and Articles of Association regarding the appointment and removal of Members of the Board of Managing Directors. Pursuant to sections 133 and 179 of the AktG, amendments to the Memo-randum and Articles of Association of DVB Bank SE are resolved by the Annual General Meeting.
Pursuant to sections 15 and 18 of the AktG , DVB Bank SE is affiliated to DZ BANK AG Deutsche Zentral-Genossenschafts-bank, Frankfurt/Main, and its Group companies. As at 31 December 2014, DVB Bank SE has been included in the con-solidated financial statements of DZ BANK Deutsche Zentral-Genossenschaftsbank, Frankfurt/Main.
Disclosures pursuant to section 315 (2) and (4) of the HGB
The provisions of sections 315 (2) no.3 and (4) nos. 2, 4, 5, 8 and 9 of the HGB are not applicable to DVB Bank SE in 2014.
Information regarding the provisions of sections 315 (4) nos. 1, 3 and 7 of the HGB are available in the Notes, on page 211–212.
In accordance with section 312 (3) of the AktG, the Board of Managing Directors has disclosed to the Supervisory Board the extent of the relationship with affiliated companies, declaring: ”Our Company received adequate consideration for all legal trans-actions and measures as described in the report on relationships with affiliated companies, according to the circumstances known to us at the time such legal transactions were concluded or such measures were taken or omitted, and was not prejudiced by such acts or omissions.”
GROUP M A N AGE M E N T R E P OR T
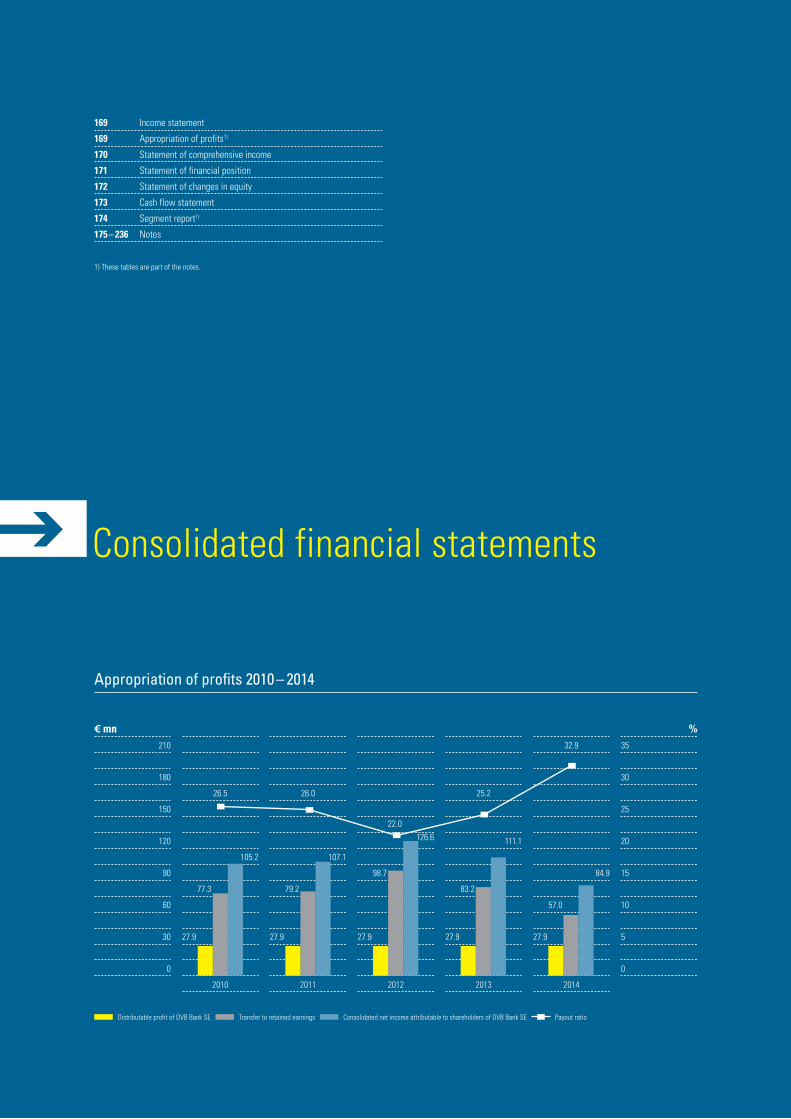
DVB Bank SE | Group Annual Report 2014
Consolidated financial statements
169 Income statement
169 Appropriation of profits1)
170 Statement of comprehensive income
171 Statement of financial position
172 Statement of changes in equity
173 Cash flow statement
174 Segment report1)
175 – 236 Notes
1) These tables are part of the notes.
€ mn210
180
150
120
90
60
30
0
26.5
105.2
77.3
27.9
2010
26.0
107.1
79.2
27.9
2011
22.0 126.6
98.7
27.9
2012
25.2
111.1
83.2
27.9
2013
32.9
84.9
57.0
27.9
2014
%35
30
25
20
15
10
5
0
Distributable profit of DVB Bank SE Transfer to retained earnings Consolidated net income attributable to shareholders of DVB Bank SE Payout ratio
Appropriation of profits 2010 – 2014

169
A B OU T US
GROUP M A N AGE MEN T RE P OR T
AUDI T OP INION
DVB Bank SE | Group Annual Report 2014
C ONSOL IDAT E D F IN A NC I A L S TA M E M E N T S
Income statement
€ mn
Note
1 Jan 2014 – 31 Dec 2014
1 Jan 2013 – 31 Dec 2013
%
Income statement
Interest income1) 896.9 942.5 –4.8
Interest expenses1) –681.0 –699.5 –2.6
Net interest income1) (15) 215.9 243.0 –11.2
Allowance for credit losses1) (16) –62.4 –87.9 –29.0
Net interest income after allowance for credit losses1) 153.5 155.1 –1.0
Fee and commission income 114.8 134.4 –14.6
Fee and commission expenses –6.3 –5.7 10.5
Net fee and commission income (17) 108.5 128.7 –15.7
Results from investments in companies
accounted for using the equity method
(18)
12.4
5.1
–
General administrative expenses (19) –187.7 –178.8 5.0
Net other operating income/expenses (20) 30.1 –4.1 –
Consolidated net income before IAS 39 and taxes1) 116.8 106.0 10.2
Trading result1) (21.1) 9.4 2.9 –
Hedge result (21.2) –11.2 –2.2 –
Result from derivatives entered into without intention to trade (21.3) –11.9 16.2 –
Result from investment securities (21.4) 0.9 1.3 –30.8
Net result from financial instruments in accordance with IAS 391) (21) –12.8 18.2 –
Consolidated net income before taxes1) 104.0 124.2 –16.3
Income taxes (22) –19.1 –13.6 40.4
Consolidated net income1) 84.9 110.6 –23.2
thereof: consolidated net income attributable to non-controlling interests 0.0 –0.5 –
thereof: consolidated net income attributable to shareholders of DVB Bank SE1) 84.9 111.1 –23.6
Earnings per share
Average number of shares issued 45,617,144 45,960,673 –0.7
Basic earnings per share (€ )1) 1.86 2.42 –23.1
Diluted earnings per share (€ )1) 1.86 2.42 –23.1
1) Retrospective application of IFRS 10 resulted in an adjustment of the previous year’s figure (see note for the respective item).
Appropriation of profits
€ mn
1 Jan 2014 – 31 Dec 2014
1 Jan 2013 – 31 Dec 2013
%
Consolidated net income (after taxes)1) 84.9 110.6 –23.2
Consolidated net income attributable to non-controlling interests 0.0 0.5 –
Transfer to retained earnings1) –57.0 –83.2 –31.5
Distributable profit 27.9 27.9 –
1) Retrospective application of IFRS 10 resulted in an adjustment of the previous year’s figure (see note for the respective item).
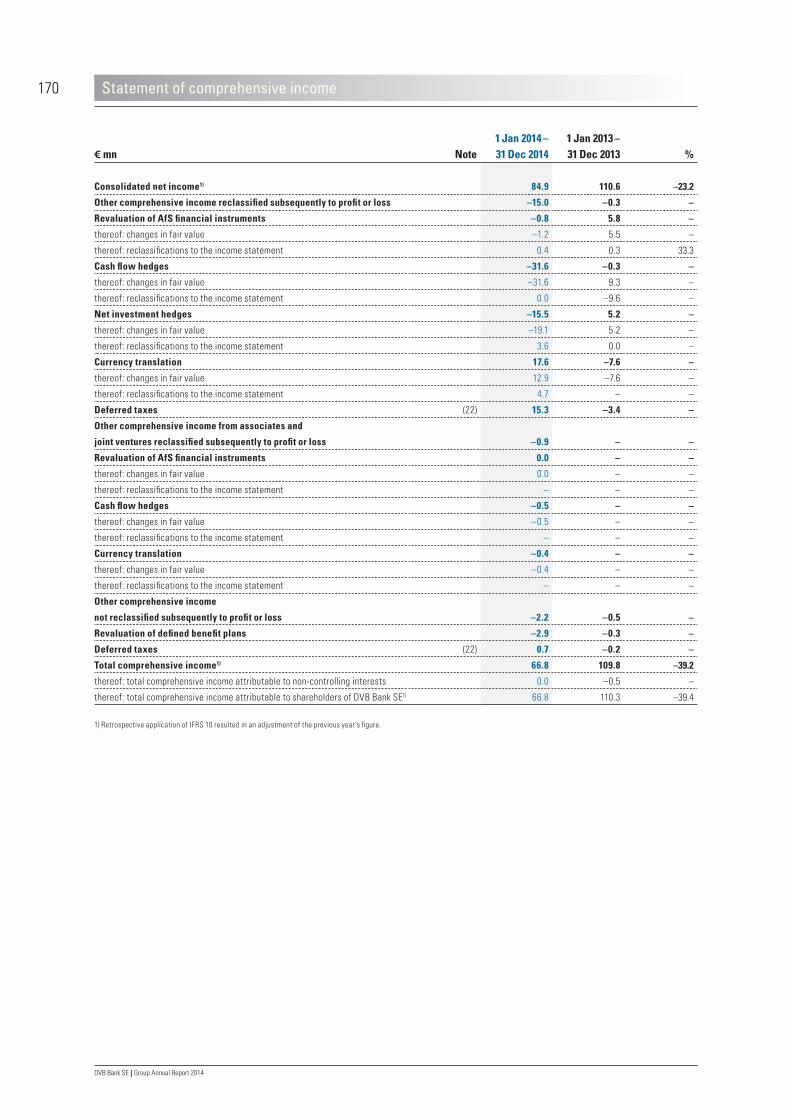
170
DVB Bank SE | Group Annual Report 2014
Statement of comprehensive income
€ mn
Note
1 Jan 2014 – 31 Dec 2014
1 Jan 2013 – 31 Dec 2013
%
Consolidated net income1) 84.9 110.6 –23.2
Other comprehensive income reclassified subsequently to profit or loss –15.0 –0.3 –
Revaluation of AfS financial instruments –0.8 5.8 –
thereof: changes in fair value –1.2 5.5 –
thereof: reclassifications to the income statement 0.4 0.3 33.3
Cash flow hedges –31.6 –0.3 –
thereof: changes in fair value –31.6 9.3 –
thereof: reclassifications to the income statement 0.0 –9.6 –
Net investment hedges –15.5 5.2 –
thereof: changes in fair value –19.1 5.2 –
thereof: reclassifications to the income statement 3.6 0.0 –
Currency translation 17.6 –7.6 –
thereof: changes in fair value 12.9 –7.6 –
thereof: reclassifications to the income statement 4.7 – –
Deferred taxes (22) 15.3 –3.4 –
Other comprehensive income from associates and
joint ventures reclassified subsequently to profit or loss –0.9 – –
Revaluation of AfS financial instruments 0.0 – –
thereof: changes in fair value 0.0 – –
thereof: reclassifications to the income statement – – –
Cash flow hedges –0.5 – –
thereof: changes in fair value –0.5 – –
thereof: reclassifications to the income statement – – –
Currency translation –0.4 – –
thereof: changes in fair value –0.4 – –
thereof: reclassifications to the income statement – – –
Other comprehensive income
not reclassified subsequently to profit or loss –2.2 –0.5 –
Revaluation of defined benefit plans –2.9 –0.3 –
Deferred taxes (22) 0.7 –0.2 –
Total comprehensive income1) 66.8 109.8 –39.2
thereof: total comprehensive income attributable to non-controlling interests 0.0 –0.5 –
thereof: total comprehensive income attributable to shareholders of DVB Bank SE1) 66.8 110.3 –39.4
1) Retrospective application of IFRS 10 resulted in an adjustment of the previous year’s figure.
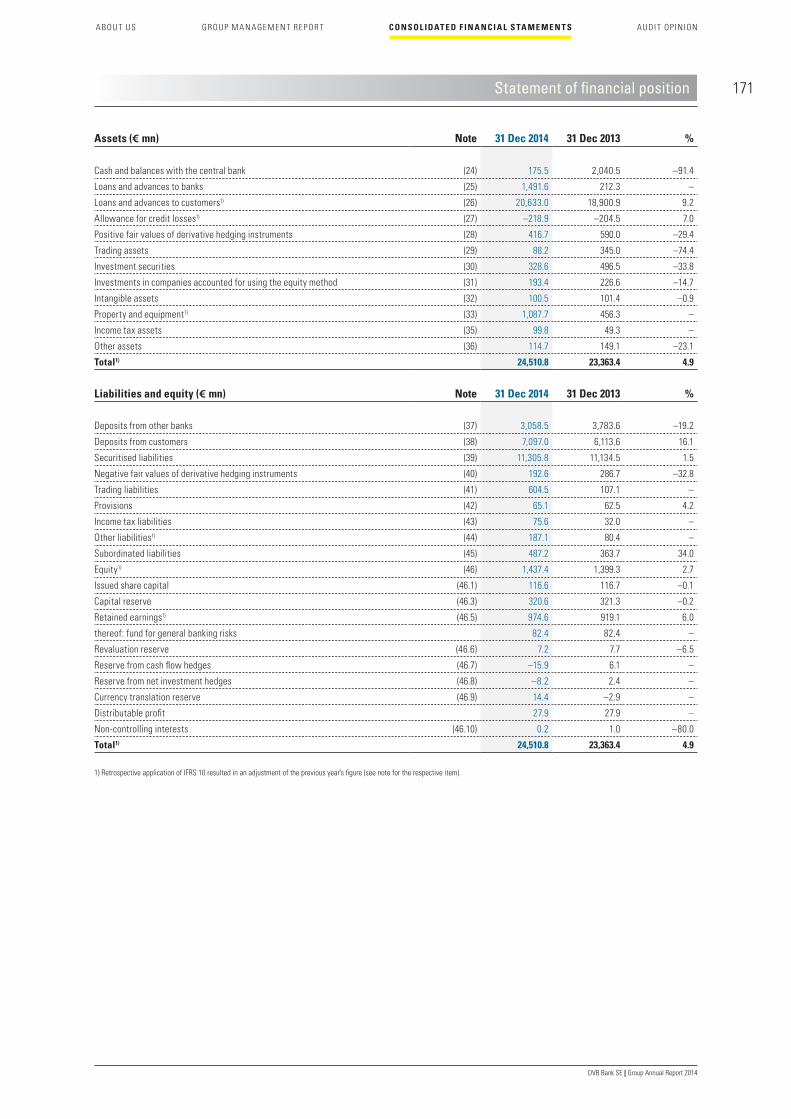
171
A B OU T US
GROUP M A N AGE MEN T RE P OR T
AUDI T OP INION
DVB Bank SE | Group Annual Report 2014
C ONSOL IDAT E D F IN A NC I A L S TA M E M E N T S
Statement of financial position
Assets (€ mn) Note 31 Dec 2014 31 Dec 2013 %
Cash and balances with the central bank (24) 175.5 2,040.5 –91.4
Loans and advances to banks (25) 1,491.6 212.3 –
Loans and advances to customers1) (26) 20,633.0 18,900.9 9.2
Allowance for credit losses1) (27) –218.9 –204.5 7.0
Positive fair values of derivative hedging instruments (28) 416.7 590.0 –29.4
Trading assets (29) 88.2 345.0 –74.4
Investment securities (30) 328.6 496.5 –33.8
Investments in companies accounted for using the equity method (31) 193.4 226.6 –14.7
Intangible assets (32) 100.5 101.4 –0.9
Property and equipment1) (33) 1,087.7 456.3 –
Income tax assets (35) 99.8 49.3 –
Other assets (36) 114.7 149.1 –23.1
Total1) 24,510.8 23,363.4 4.9
Liabilities and equity (€ mn) Note 31 Dec 2014 31 Dec 2013 %
Deposits from other banks (37) 3,058.5 3,783.6 –19.2
Deposits from customers (38) 7,097.0 6,113.6 16.1
Securitised liabilities (39) 11,305.8 11,134.5 1.5
Negative fair values of derivative hedging instruments (40) 192.6 286.7 –32.8
Trading liabilities (41) 604.5 107.1 –
Provisions (42) 65.1 62.5 4.2
Income tax liabilities (43) 75.6 32.0 –
Other liabilities1) (44) 187.1 80.4 –
Subordinated liabilities (45) 487.2 363.7 34.0
Equity1) (46) 1,437.4 1,399.3 2.7
Issued share capital (46.1) 116.6 116.7 –0.1
Capital reserve (46.3) 320.6 321.3 –0.2
Retained earnings1) (46.5) 974.6 919.1 6.0
thereof: fund for general banking risks 82.4 82.4 –
Revaluation reserve (46.6) 7.2 7.7 –6.5
Reserve from cash flow hedges (46.7) –15.9 6.1 –
Reserve from net investment hedges (46.8) –8.2 2.4 –
Currency translation reserve (46.9) 14.4 –2.9 –
Distributable profit 27.9 27.9 –
Non-controlling interests (46.10) 0.2 1.0 –80.0
Total1) 24,510.8 23,363.4 4.9
1) Retrospective application of IFRS 10 resulted in an adjustment of the previous year’s figure (see note for the respective item).
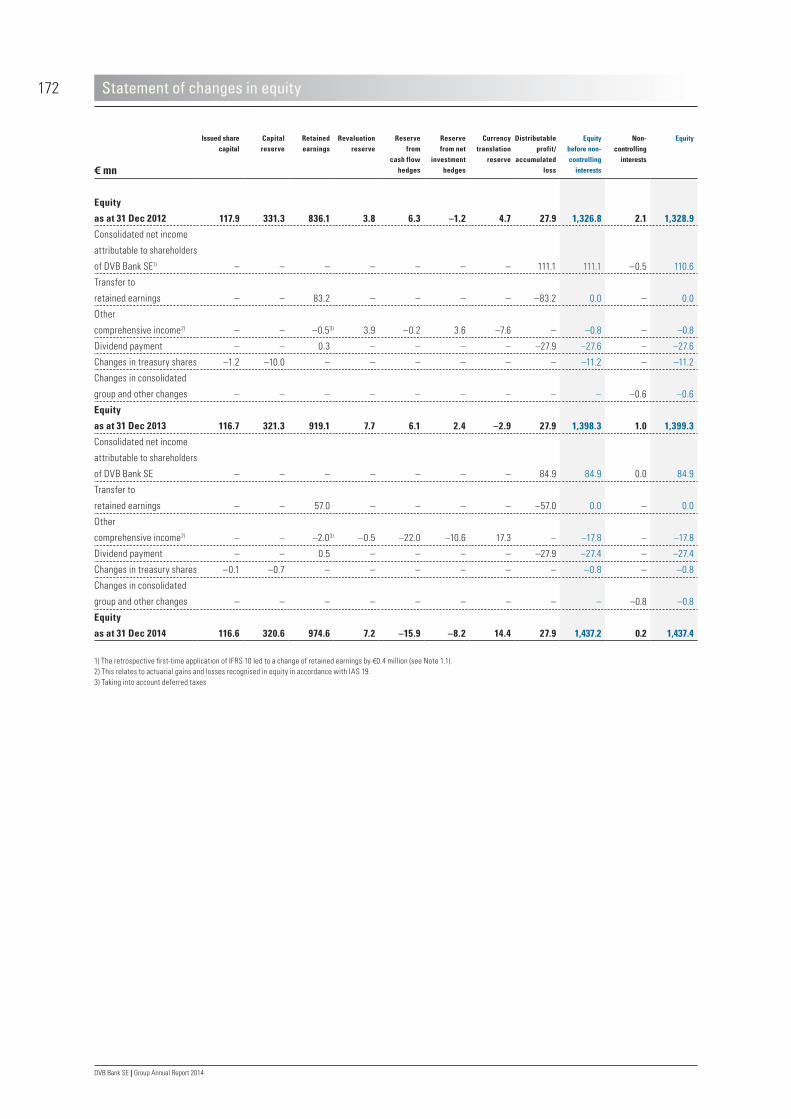
172
DVB Bank SE | Group Annual Report 2014
Statement of changes in equity
€ mn
Issued share capital
Capital reserve
Retained earnings
Revaluation reserve
Reserve from
cash flow hedges
Reserve from net
investment hedges
Currency translation
reserve
Distributable profit/
accumulated loss
Equity before non-controlling
interests
Non-controlling
interests
Equity
Equity
as at 31 Dec 2012 117.9 331.3 836.1 3.8 6.3 –1.2 4.7 27.9 1,326.8 2.1 1,328.9
Consolidated net income
attributable to shareholders
of DVB Bank SE1) – – – – – – – 111.1 111.1 –0.5 110.6
Transfer to
retained earnings – – 83.2 – – – – –83.2 0.0 – 0.0
Other
comprehensive income2) – – –0.53) 3.9 –0.2 3.6 –7.6 – –0.8 – –0.8
Dividend payment – – 0.3 – – – – –27.9 –27.6 – –27.6
Changes in treasury shares –1.2 –10.0 – – – – – – –11.2 – –11.2
Changes in consolidated
group and other changes – – – – – – – – – –0.6 –0.6
Equity
as at 31 Dec 2013 116.7 321.3 919.1 7.7 6.1 2.4 –2.9 27.9 1,398.3 1.0 1,399.3
Consolidated net income
attributable to shareholders
of DVB Bank SE – – – – – – – 84.9 84.9 0.0 84.9
Transfer to
retained earnings – – 57.0 – – – – –57.0 0.0 – 0.0
Other
comprehensive income2) – – –2.03) –0.5 –22.0 –10.6 17.3 – –17.8 – –17.8
Dividend payment – – 0.5 – – – – –27.9 –27.4 – –27.4
Changes in treasury shares –0.1 –0.7 – – – – – – –0.8 – –0.8
Changes in consolidated
group and other changes – – – – – – – – – –0.8 –0.8
Equity
as at 31 Dec 2014 116.6 320.6 974.6 7.2 –15.9 –8.2 14.4 27.9 1,437.2 0.2 1,437.4
1) The retrospective first-time application of IFRS 10 led to a change of retained earnings by €0.4 million (see Note 1.1).2) This relates to actuarial gains and losses recognised in equity in accordance with IAS 19.3) Taking into account deferred taxes

173
A B OU T US
GROUP M A N AGE MEN T RE P OR T
AUDI T OP INION
DVB Bank SE | Group Annual Report 2014
C ONSOL IDAT E D F IN A NC I A L S TA M E M E N T S
Cash flow statement
Cash and cash equivalents correspond to the item ”Cash and balances with the central bank” included in the statement of financial position. The changes in cash and cash equivalents are presented in the cash flow statement. Cash and balances with the central bank do not include financial investments with a remaining maturity of more than three months as at the date of acquisition.
The changes in the balance of cash and cash equivalents are presented in the cash flow statement, separately for operating,
investing and financing activities. Cash flows from operating activities include cash flows resulting from revenue-generating and other activities of the Group that cannot be allocated to investing or financing activities. Cash inflows and outflows in connection with the acquisition and the disposal of non-current assets are attributed to investing activities. Cash flows from financing activities include cash flows from transactions with equity holders as well as from other borrowings to finance the Bank’s business operations.
€ mn 31 Dec 2014 31 Dec 2013
Consolidated net income before taxes1) 104.0 124.2
Non-cash items included in the profit for the period and reconciliation
to cash flow from operating activities
Depreciation, impairment and write-ups of loans and advances, property and equipment, and investment securities1) 168.3 92.4
Increase/decrease in provisions 46.2 –29.4
Other non-cash income/expenses – –
thereof: hedge accounting 503.0 45.6
thereof: other changes from the fair value measurement of financial instruments 752.4 –255.7
Gains/losses on disposal of investment securities, and property and equipment –0.9 –6.7
Other adjustments –228.3 –247.6
Subtotal1) 1,344.7 –277.2
Changes in assets and liabilities from operating activities
Loans and advances to banks –1,242.0 251.7
Loans and advances to customers1) –1,832.2 844.2
Leased assets –179.6 220.9
Other assets from operating activities 26.0 –89.6
Deposits from other banks1) –978.9 –920.4
Deposits from customers 544.4 1,073.2
Securitised liabilities 132.0 –256.9
Other liabilities from operating activities 56.8 10.1
Interest and dividends received 896.9 943.6
Interest paid –681.0 –701.0
Income taxes paid –15.8 –19.5
Cash flow from operating activities1) –1,928.7 1,079.1
Changes from additions (–) and disposals (+) of property and equipment1) –38.5 186.0
Changes from additions (–) and disposals (+) of investment securities 220.5 –92.8
Effects of changes in consolidated group
thereof: cash proceeds from the disposal of consolidated companies 8.2 33.2
thereof: cash payments to acquire consolidated companies –30.3 –
Net change resulting from other investing activities –1.5 –4.4
Cash flow from investing activities1) 158.4 122.0
Cash proceeds from additions to equity (capital increases, sale of treasury shares, etc.) –0.7 –11.2
Cash payments to owners and non-controlling shareholders (dividends) –27.7 –27.7
Net change resulting from other financing activities1) –66.3 8.7
Cash flow from financing activities1) –94.7 –30.2
Net change in cash and cash equivalents (total of the three cash flow items) –1,865.0 1,170.9
Cash and cash equivalents at beginning of period 2,040.5 869.6
Cash and cash equivalents at end of period1) 175.5 2,040.5
1) Retrospective application of IFRS 10 resulted in an adjustment of the previous year’s figure.

174
DVB Bank SE | Group Annual Report 2014
Segment report
Group
Shipping Finance
Aviation Finance
Offshore Finance
Land Transport
Finance
Investment Management
Treasury
Other
Reconcili- ation/con- solidation
€ mn 2014 2013 2014 2013 2014 2013 2014 2013 2014 2013 2014 2013 2014 2013 2014 2013 2014 2013
Net interest
income1) 215.9 243.0 78.0 92.1 89.7 88.8 26.3 31.1 16.7 14.8 –13.3 6.0 –25.5 7.1 10.5 10.3 33.5 –7.3
Allowance for
credit losses1) –62.4 –87.9 –37.8 –74.9 –0.4 1.1 0.0 –0.5 –0.1 0.0 –5.1 –6.2 0.0 0.0 –17.7 –9.0 –1.3 1.6
Net interest
income after
allowance for
credit losses1) 153.5 155.1 40.2 17.2 89.3 89.9 26.3 30.6 16.6 14.8 –18.4 –0.2 –25.5 7.1 –7.2 1.3 32.2 –5.5
Net fee and
commission
income 108.5 128.7 41.3 45.0 34.2 38.6 18.6 19.0 7.2 6.4 –0.8 7.5 –0.3 –0.2 13.4 13.6 –5.0 –1.3
Results from
investments
in companies
accounted
for using the
equity method 12.4 5.1 – – – – – – – – 14.3 3.5 – – –1.8 1.6 0.0 0.1
Net other oper-
ating income/
expenses 30.1 –4.1 4.1 –18.1 –0.8 –0.1 0.0 0.0 0.1 0.0 23.5 7.6 0.0 0.0 –2.3 8.3 5.5 –1.9
Results1) 304.5 284.8 85.6 44.1 122.7 128.4 44.9 49.6 23.9 21.2 18.6 18.4 –25.8 6.9 2.1 24.8 32.7 –8.6
Staff expenses –108.9 –105.7 –28.7 –30.3 –15.1 –15.7 –4.0 –3.9 –3.1 –2.8 –9.7 –9.9 –1.3 –1.3 –38.7 –34.8 –8.4 –6.9
Non-staff
expenses –74.3 –68.3 –8.7 –8.3 –4.1 –4.3 –1.1 –1.1 –0.8 –0.5 –4.1 –4.9 –0.6 –0.7 –35.1 –30.6 –19.8 –18.0
Depreciation,
amortisation,
impairment
and write-ups –4.5 –4.8 0.0 0.0 0.0 0.0 0.0 –0.1 0.0 0.0 0.0 0.0 0.0 0.0 –4.3 –4.1 –0.1 –0.6
General
administrative
expenses –187.7 –178.8 –37.4 –38.6 –19.3 –20.0 –5.1 –5.1 –3.9 –3.3 –13.8 –14.8 –1.9 –2.0 –78.1 –69.5 –28.3 –25.5
Consolidated
net income
before IAS 39
and taxes1) 116.8 106.0 48.2 5.5 103.4 108.4 39.8 44.5 20.0 17.9 4.8 3.6 –27.7 4.9 –76.0 –44.7 4.4 –34.2
Net result
from financial
instruments in
accordance
with IAS 391) –12.8 18.2 –9.7 4.0 0.1 0.1 0.5 0.2 0.0 0.0 –0.4 23.8 –0.8 –11.6 –1.4 0.0 –1.0 1.7
Consolidated
net income
before taxes1) 104.0 124.2 38.5 9.5 103.5 108.5 40.3 44.7 20.0 17.9 4.4 27.4 –28.5 –6.7 –77.4 –44.7 3.4 –32.5
Cost/income
ratio1)2) (%) 53.0 45.7 32.9 31.4 15.6 15.7 11.3 10.1 16.1 15.7 59.6 30.5 – – – – – –
Return on
equity1) 3) (%) 8.1 10.3 12.3 2.5 65.9 57.4 138.9 182.0 66.7 63.3 1.5 10.0 – – – – – –
Lending
volume1) 4) 26,040.8 24,253.6 10,121.6 9,205.7 7,081.2 6,414.5 2,277.2 1,991.7 1,954.9 1,611.4 612.6 462.1 2,706.8 3,456.7 1,286.5 1,102.5 – –
1) Retrospective application of IFRS 10 resulted in an adjustment of the previous year’s figure.2) Excluding allowance for credit losses3) Before taxes4) In line with the internal management system

175
A B OU T US
GROUP M A N AGE MEN T RE P OR T
C ONSOL IDAT E D F IN A NC I A L S TA M E M E N T S
NOTES
AUDI T OP INION
DVB Bank SE | Group Annual Report 2014
Basis of accounting 176
Notes to accounting policies applied 176 – 190
176 1 General accounting policies
188 2 Cash and balances with the central bank
188 3 Loans and advances to banks and customers;
allowance for credit losses
188 4 Trading assets and trading liabilities
188 5 Investment securities
188 6 Investments in companies accounted for using the equity method
189 7 Intangible assets
189 8 Property and equipment
190 9 Current and deferred taxes
190 10 Deposits from customers and other banks
190 11 Securitised liabilities
190 12 Provisions
190 13 Subordinated liabilities
190 14 Equity
Notes to the income statement 191 – 198
191 15 Net interest income
191 16 Allowance for credit losses
191 17 Net fee and commission income
192 18 Result from investments in companies
accounted for using the equity method
192 19 General administrative expenses
193 20 Net other operating income/expenses
194 21 Net result from financial instruments in accordance with IAS 39
195 22 Income taxes
196 23 Segment reporting
Notes to the statement of financial position 199 – 212
199 24 Cash and balances with the central bank
199 25 Loans and advances to banks
199 26 Loans and advances to customers
200 27 Allowance for credit losses
201 28 Positive market value of derivative hedging instruments
201 29 Trading assets
201 30 Investment securities
201 31 Investments in companies accounted for using the equity method
202 32 Intangible assets
202 33 Property and equipment
202 34 Statement of changes in non-current assets
204 35 Income tax assets
204 36 Other assets
205 37 Deposits from other banks
206 38 Deposits from customers
206 39 Securitised liabilities
206 40 Negative fair values of derivative hedging instruments
206 41 Trading liabilities
207 42 Provisions
211 43 Income tax liabilities
211 44 Other liabilities
211 45 Subordinated liabilities
211 46 Equity
Notes to financial instruments 213 – 220
213 47 Classes and categories of financial instruments
214 48 Financial assets and liabilities offset/not offset
215 49 Determination of fair values of financial instruments
218 50 Unrecognised differences upon initial recognition
218 51 Earnings contributions of financial instruments
by measurement categories
219 52 Allowance for credit losses by classes
219 53 Risks arising from the use of financial instruments
219 54 Maturity groupings of derivative financial instruments
220 55 Maturity groupings of non-derivative financial instruments
Other disclosures 221 – 235
221 56 Equity capital management
221 57 Subordinated assets
222 58 Disclosures on the ship covered bonds
pursuant to section 28 of the Pfandbrief Act (PfandBG)
224 59 Disclosures on the aircraft covered bonds
pursuant to section 28 of the PfandBG
226 60 List of shareholdings
231 61 Disclosures on structured entities
232 62 Financial guarantee contracts, contingent liabilities
and other commitments
232 63 Average number of employees
232 64 Related party disclosures
235 65 Declaration of Compliance pursuant to section 161 of the AktG
235 66 Financial statements of DVB Bank SE
Responsibility statement 236
Contents of the notes

176
DVB Bank SE | Group Annual Report 2014
Basis of accounting
Notes to accounting policies applied
The business year corresponds to the calendar year. Unless otherwise indicated, all amounts are stated in millions of euros (€ mn or € million). Figures are rounded pursuant to standard business principles. This may result in slight differences when aggregating figures and calculating percentages.
On 4 March 2015, these consolidated financial statements were signed by the Board of Managing Directors and released to be submitted to the Supervisory Board.
IFRS 10, IFRS 11 and IFRS 12 replace the previous rules set out in IAS 27, IAS 31 and SIC-12 related to the determination of the scope of consolidation in IFRS consolidated financial statements. In this context, IFRS 10 is the central standard replacing the corresponding rules included in IAS 27 in connection with SIC-12. This creates a uniform concept of control which has to be applied to all companies, including special purpose entities. In future, IAS 27 will only include guidance on separate financial statements prepared under IFRS. IFRS 11 applies to the inclusion of joint ventures in consolidated financial statements and replaces the rules included in IAS 31 in connection with SIC-13. The previous option to include joint ventures by way of proportionate consoli-dation is revoked. In future, joint ventures will be included in the consolidated financial statements by using the equity method only. IFRS 12 summarises all disclosures to be made in the notes with respect to subsidiaries, joint ventures, associates and unconsolidated structured companies. The amended standards will be applied for the first time in the business year 2014. This has material consequences primarily for disclosures according to IFRS 12. The change regarding the consolidation of joint ventures will have no impact as these are already accounted for using the equity method. The application of IFRS 10 does not have a significant impact on the consolidated financial statements.
The amendments to IFRS 10, IFRS 11 and IFRS 12 – Transition Guidance include clarifications and transition relief. Above all, the amendments clarified that the decision whether or not the first-time application of IFRS 10 affect the consolidated group has to be made at the beginning of the relevant reporting period.
For the business year 2014, the consolidated financial statements of DVB Bank SE were prepared in accordance with International Financial Reporting Standards (IFRS) and the additional require-ments of German commercial law under section 315a (1) of the German Commercial Code (HGB), pursuant to Regulation (EC) No. 1606/2002 of the European Parliament and of the Council of 19 July 2002. IFRS encompasses the individual standards called IFRS, as well as the International Accounting Standards (IAS) and the interpretations of the International Financial Reporting Interpretations Committee (IFRIC) and the Standing Interpretations Committee (SIC). The standards relevant to the consolidated financial statements are those published by the International Accounting Standards Board (IASB) and adopted by the European Union until 31 December 2014.
For the companies included in the IFRS consolidated financial statements, the following accounting policies were applied on a consistent and uniform basis, with the exceptions outlined below.
1 General accounting policies
1.1 Accounting standards applied for the first time in the reporting period
The consolidated financial statements of DVB take into account for the first time the following revised versions and amendments to accounting standards, the following new interpretation as well as the following improvements to IFRSs:
• IFRS 10 – Consolidated Financial Statements• IFRS 11 – Joint Arrangements• IFRS 12 – Disclosure of Interests in Other Entities• IAS 27 – Separate Financial Statements• IAS 28 – Investments in Associates and Joint Ventures• Amendments to IFRS 10, IFRS 11 and IFRS 12 –
Transition Guidance• Amendments to IFRS 10, IFRS 11 and IFRS 12 –
Investment Entities• Amendments to IFRS 32 – Offsetting Financial Assets and
Financial Liabilities• Amendments to IAS 39 – Financial Instruments: Novation of
Derivatives and Continuation of Hedge Accounting
177
A B OU T US
GROUP M A N AGE MEN T RE P OR T
C ONSOL IDAT E D F IN A NC I A L S TA M E M E N T S
NOTES
AUDI T OP INION
DVB Bank SE | Group Annual Report 2014
Notes to accounting policies applied
The first-time application of IFRS 10 had the effect that Best Shipping LLC as well as Mile Shipping LLC (both with registered office on the Marshall Islands) are no longer part of the DVB Group’s scope of consolidation since DVB no longer has control due to a lack of power over these companies in accordance with IFRS 10. The result from the first-time application amounts to €0.4 million and was largely attributed to net interest income after allowance for credit losses. The previous year’s figures have been adjusted due to retrospective application.
The amendments to IAS 32 substantiate the existing rules for offsetting financial instruments and clarify the definition of the required legally enforceable right. It was also clarified that the gross settlement method meets the criteria set out in IAS 32 if particular requirements are fulfilled. The condition for this is that default and liquidity risks are eliminated and receivables and liabilities are processed in a single settlement procedure. The Group applies the amendments retrospectively from the business year 2014.
The amendments to IAS 39 – Financial Instruments: Novation of Derivatives and Continuation of Hedge Accounting provide relief with respect to accounting for hedges. Pursuant to the amend-ment, a designated hedging relationship is not required to be discontinued upon novation of a derivative when the novation meets certain criteria. Above all, this applies to novations made in connection with the transition to a central counterparty and within the framework of legal or regulatory requirements. The Group applies the amendments retrospectively for the first time for business years beginning on or after 1 January 2014.
The other revised and amended standards set out above do not have a significant impact on DVB’s consolidated financial statements.
1.2 Amendments to IFRS not yet applied
DVB elected not to apply early, as permitted, the following revised and amended standards, and new or revised interpretations and improvements to IFRSs, which have been endorsed by the EU. This relates to the following new financial reporting standards:
• Amendments to IAS 19 – Employee Benefits• IFRIC 21 – Levies • Improvements to the International Financial Reporting
Standards, 2010–2012 Cycle• Improvements to the International Financial Reporting
Standards, 2011–2013 Cycle
The amendments to IAS 19 – Employee Benefits govern the accounting for components of direct pension commitments. It is possible to recognise cost components that depend directly on the service period directly through profit or loss in the current period. The amendments are required to be applied for business years beginning on or after 1 July 2014.
The interpretation IFRIC 21 – Levies clarifies when obligations regarding levies that are imposed by government agencies and are not within the scope of another specific standard have to be reported in the financial statements. The activity which triggers the payment of a levy pursuant to applicable legislation is iden-tified as the obligating event that gives rise to the recognition of a liability. Economic compulsion and the going concern principle do not represent an obligating event. The standard is required to be applied for companies within the EU for business years beginning on or after 17 June 2014.
The other revised and amended standards set out above do not have a significant impact on DVB’s consolidated financial statements.
1.3 Amendments to IFRS not yet endorsed
The EU has not yet endorsed the following new and revised accounting standards, amendments to accounting standards and interpretations as issued by the IASB:
• IFRS 9 – Financial Instruments (2013)• IFRS 14 – Regulatory Deferral Accounts• IFRS 15 – Revenue from Contracts with Customers• Amendments to IFRS 10 and IAS 28 – Sale or Contribution of
Assets between an Investor and its Associate or Joint Venture • Amendments to IFRS 11 – Accounting for Acquisitions of
Interests in Joint Operations• Amendments to IAS 16 and IAS 38 – Clarification of
Acceptable Methods of Depreciation and Amortisation• Annual Improvements to IFRSs 2012–2014 Cycle
In July 2014, the IASB issued the final version of IFRS 9. IFRS 9 includes fundamentally revised rules with respect to the account-ing for financial instruments which affects classification and measurement, the determination of impairment and the recogni-tion of hedging relationships. Subject to EU endorsement, the amendments are required to be applied for business years beginning on or after 1 January 2018. First-time application is generally made retrospectively.
178
DVB Bank SE | Group Annual Report 2014
In accordance with IFRS 15, revenue has to be recognised when the customer obtains control over the contractual goods and services and can obtain benefits from these goods and services. The transfer of material risks and rewards is no longer the deci-sive factor. The analysis of the effects on the consolidated financial statements has yet to be completed. The standard is required to be applied for business years beginning on or after 1 January 2017.
The Amendments to IFRS 10 and IAS 28 – Sale or Contribution of Assets between an Investor and its Associate or Joint Venture eliminate an inconsistency between IFRS 10 and IAS 28. The amendments in future will permit the recognition of the full gains or losses by an investor when the contribution of a subsidiary to a joint venture or an associate involving loss of control of such subsidiary represents a business within the meaning of IFRS 3. However, if this is not the case, only the pro-rata gain or loss is recognised in the amount of the share held by the other investors. The amendments are required to be applied for business years beginning on or after 1 January 2016.
The Amendments to IFRS 11 – Accounting for Acquisitions of Interests in Joint Operations clarifies that the principles for the accounting for business combinations have to be applied to acquisitions of interests in joint ventures which represent a business within the meaning of IFRS 3, except for those principles that conflict with the guidance set out in IFRS 11. This approach does not apply when the reporting entity and the investors in such entity are subject to joint control of the same parent com-pany. The amendments are required to be applied for business years beginning on or after 1 January 2016.
The objective of the Amendments to IAS 16 and IAS 38 – Clarifi-cation of Acceptable Methods of Depreciation and Amortisation is to clarify which methods are appropriate for the depreciation of property, plant and equipment and the amortisation of intan-gible assets. In general, depreciation and amortisation have to be recognised in a manner that reflects the consumption of the expected future economic benefits generated by an asset. Firstly, it is clarified that a reduction in selling prices may be an indication to recognise a special write-down for the assets necessary for production. Secondly, the determination of an appropriate amorti-sation method for intangible assets has to take into consideration a predominant limiting factor for use of the asset (e.g. time limits, limits in relation to the number of produced units). The amend-ments are required to be applied for business years beginning on or after 1 January 2016.
Within the context of implementing IFRS 9, especially all financial assets will be reclassified, which necessitates an assessment to be carried out for the business models of the portfolios as well as for the contractual cash flow characteristics of the individual financial assets. In contrast, there have been only immaterial changes to the classification of financial liabilities. In accordance with IFRS 9, deviating from IAS 39, any changes in the fair value of financial liabilities accounted for under the fair value option resulting from changes in credit risk have to be recognised in other comprehensive income.
Moreover, the determination of impairment gains or losses for financial assets was revised significantly through the publication of IFRS 9. Instead of recognising only incurred losses, expected losses have to be recognised in the form of impairment losses as well. A distinction is made whether the expected loss refers to the entire lifetime of the financial instrument or reflects expected losses for the next twelve months only. If the credit quality of the recognised asset had deteriorated substantially since initial recognition, the expected losses for the entire life-time have to be taken into account.
Within the scope of hedge accounting, IFRS 9 more strongly focuses on economic risk management. Firstly, individual risk components may also be hedged for non-financial hedged items. Secondly, quantitative thresholds used as evidence of prospective or retrospective effectiveness have been abolished. Instead, evidence is based on qualitative criteria of the corresponding risk management strategy. Hedging relationships are only dis-continued when the objective of risk management also changes.
Due to the significance of IFRS 9 for the recognition of financial instruments in the statements of financial position of banks and the substantial changes to IAS 39, there will be material changes also for DVB. As a result of the conservative business model and the presentation of hedging relationships being already strongly based on economic substance, the major transitional effects will primarily result from the changed approach to determine impaiment gains and losses.
The rules set out in IFRS 15 – Revenue from Contracts with Customers will replace in future the contents of both IAS 18 – Revenue and IAS 11 – Construction Contracts as well as the related interpretations IFRIC 13 – Customer Loyalty Programmes, IFRIC 15 – Agreements for the Construction of Real Estate, IFRIC 18 – Transfers of Assets from Customers and SIC 31 – Revenue – Barter Transactions involving Advertising Services. The objective is to achieve convergence with US GAAP rules.
Notes to accounting policies applied
179
A B OU T US
GROUP M A N AGE MEN T RE P OR T
C ONSOL IDAT E D F IN A NC I A L S TA M E M E N T S
NOTES
AUDI T OP INION
DVB Bank SE | Group Annual Report 2014
The application of the other standards and amendments set out above as well as of the new interpretation does not have any material consequences for DVB’s consolidated financial state-ments. The application of the listed standards is subject to EU endorsement.
1.4 Group of consolidated companies and consolidation methods
1.4.1 Consolidated group
The group of consolidated companies of DVB Bank SE com-prises all subsidiaries which the Company directly or indirectly controls within the meaning of IFRS 10. This currently includes DVB Holding GmbH, Frankfurt/Main, DVB Holding (US) Inc., New York, DVB Transport Finance Ltd, London, DVB Group Merchant Bank (Asia) Ltd, Singapore, DVB Bank America N.V., Curaçao, ITF International Transport Finance Suisse AG, Zurich, LogPay Financial Services GmbH, Eschborn, as well as these companies’ own subsidiaries. DVB Bank SE’s share in these sub-sidiaries’ capital amounts to 100% each.
Subsidiaries are initially consolidated on the date on which the Group acquires control over the subsidiary within the meaning of IFRS 10; they are deconsolidated on the date on which the Group no longer controls the subsidiary. DVB controls a company when it has direct or indirect power over a company and is, thus, exposed to significant variable returns from the company and has the ability to use its power over the investee to affect the amount of such returns. The assessment of whether DVB controls a company involves judgements which have to take into account all relevant facts and circumstances. This applies in particular to principal-agent relationships which require judgement as to whether DVB or other parties with decision-making rights is either a principal (with direct control) or an agent (exercising control as agent for other parties).
In addition to a direct investment in an entity’s equity and the associated control via voting rights, control of funds whose management does not consist of DVB employees may be obtained by the fact that decisions are regularly taken on the basis of proposals made by DVB’s Investment Management. The objective of such advisory services is to generate variable returns from the funds.
If the DVB Group holds 20% to 50% of the voting rights in a company, DVB does not have control, but a significant influence is assumed. Significant influence is the possibility to participate in the financial and operating policy decisions of the investee without having control of the investee. Companies where the DVB Group has significant influence are classified as associates.
The assessment of whether DVB has the possibility to exercise significant influence over a company takes into account factors other than voting rights, such as representation on the board of directors, participation in policy-making processes as well as material transactions entered into with the investee. Based on such factors, significant influence may exist even if the DVB holds less than 20% of the voting rights.
DVB decided, in view of the contractual arrangements, that the Group has the possibility to exercise significant influence over Epic Pantheon International Gas Shipping Ltd, despite an owner-ship percentage of less than 20%, and includes this company in its consolidated financial statements as an associate.
A joint venture is deemed to exist in case of a 50% shareholding in a company. A joint venture is a joint arrangement whereby the parties have joint control of the arrangement and have rights to the net assets of the arrangement.
Due to lack of materiality, the Bank does not disclose its non-controlling interests in the amount of €0.2 million (previous year: €0.9 million).
Notes to accounting policies applied

180
DVB Bank SE | Group Annual Report 2014
1.4.2 Consolidation methods
Consolidation is based on IFRS 3 in connection with IFRS 10 by offsetting the Company’s share in net assets acquired (measured initially at fair value) and the cost of the business combination. Any excess of the cost of the business combination over the Group’s share in net assets acquired is capitalised as goodwill and tested for impairment annually, or earlier if there are indica-tions that an impairment might have occurred. Goodwill may not be amortised over its expected useful life under IFRS. Any receivables and liabilities, as well as expenses and revenue occurring between Group companies, are eliminated. Intragroup profits are offset. For administrative reasons, as a deviation from DVB Group’s reporting date of 31 December 2014, the financial statements of the subsidiary Deucalion Engine Leasing (Ireland) Ltd prepared as at 30 November 2014 were used for the Group’s consolidated financial statements.
In accordance with IAS 28 (2011), interests in joint ventures and investments in associates are generally included in the consoli-dated financial statements at the relevant share in equity (using the equity method).
The financial statements of companies accounted for using the equity method were prepared as at the reporting date of DVB, with 14 (previous year: twelve) exceptions.
1.5 Currency translation
The functional currency of the companies included in the DVB Group is mainly the euro. At the DVB Group, the functional currency is the currency in which profit or loss from operating activities is usually retained, and in which performance is moni-tored and managed with respect to currency risks.
The assets and liabilities of a company included in the consoli-dated financial statements with a functional currency other than the euro are translated to euro using the closing rate on the balance sheet date, while such company’s equity is translated at the historical exchange rate. The translation of expenses and income is based on average exchange rates. Differences resulting from the translation from the functional currency to the report-ing currency (euro) are recognised in the currency translation reserve.
During the year under review, DVB initially consolidated 26 sub-sidiaries (previous year: eight), while a total of 15 subsidiaries (previous year: 26) were deconsolidated. In addition, three (pre-vious year: six) newly-established companies were included in the group of consolidated companies using the equity method, while three (previous year: nine) such companies were decon-solidated.
As of 1 October 2014, the fully-consolidated fund Deucalion Ltd acquired another 50% of the equity interests in MD Aviation Capital Pte Ltd, thus increasing its share to 100%. MD Aviation Capital Pte Ltd is an aircraft fund with its registered office in Singapore which has several special purpose entities owning a total of 16 aircraft that are leased to international airlines under operating leases. Within the scope of initial consolidation, the remeasurement of the shares in MD Aviation Capital Pte Ltd led to an increase of €8.8 million which was recognised as income in net other operating income/expenses (so-called bargain pur-chase). In addition, the remeasured aircraft and the non-current liabilities were recognised in the consolidated statement of finan-cial position in the amount of €493.8 million and €369.7 million, respectively, within the scope of initial consolidation. Since the date of initial consolidation (1 October 2014), revenue from the operating leases for the aircraft in the amount of €14.5 million was recorded in DVB’s net interest income. Overall, the aircraft fund has contributed earnings before taxes in the amount of €3.0 million to DVB’s consolidated net income before taxes.
In the business year 2014, 15 companies were excluded from the group of consolidated companies of the DVB Group as a result of the termination of business activities as well as due to liqui-dation or sale. This resulted in a result from deconsolidation of €8.5 million (previous year: €6.2 million), of which €6.3 million related to the deconsolidation of Nedship Scheepvaarthuis B.V. in Rotterdam, Netherlands. Income and expenses from the sale of the company shares were recorded in net other operating income/expenses.
Pursuant to section 264 (3) of the HGB, LogPay Financial Services GmbH, Eschborn, which is included in the consolidated financial statements, as well as LogPay Transport Services GmbH, Eschborn, elect not to publish annual financial statements as at 31 December 2014 in accordance with section 325 HGB.
Notes to accounting policies applied

181
A B OU T US
GROUP M A N AGE MEN T RE P OR T
C ONSOL IDAT E D F IN A NC I A L S TA M E M E N T S
NOTES
AUDI T OP INION
DVB Bank SE | Group Annual Report 2014
The following companies accounted for using the equity method have a functional currency other than the Group currency:
• 8F Leasing S.A., Contern, Luxembourg• A330 Parts Ltd, Newark, USA• AerCap Partners I Ltd, Shannon, Ireland• AerCap Partners II Ltd, Shannon, Ireland• D8 Product Tankers I Ltd, Singapore• D8 Product Tankers Investments LLC, Majuro, Marshall Islands• Deucalion MC Engine Leasing Ltd, Dublin, Ireland• Epic Pantheon International Gas Shipping Ltd, Tortola,
British Virgin Islands• Global Offshore Services B.V., Amsterdam, Netherlands• Herakleitos 3050 LLC, Majuro, Marshall Islands• Intermodal Investment Fund II LLC, Majuro, Marshall Islands• Intermodal Investment Fund IV LLC, Majuro, Marshall Islands• KCM Bulkers Ltd, Tortola, British Virgin Islands• Kotani JV Co. B.V., Amsterdam, Netherlands• Modex Holding Ltd, Tortola, British Virgin Islands• MON A300 Leasing Ltd, George Town, Cayman Islands• MON Engine Parts Inc., Newark, USA• MS Oceana Schifffahrtsgesellschaft mbH & Co. KG, Hamburg,
Germany• MS Octavia Schifffahrtsgesellschaft mbH & Co. KG, Hamburg,
Germany• TES Holdings Ltd, Bridgend, Wales, United Kingdom
Under IFRS, monetary assets and liabilities denominated in a foreign currency, as well as non-monetary items measured at fair value and denominated in a foreign currency, are translated at the spot exchange rate on the balance sheet date. Forward currency contracts are measured using the current forward rate. Currency translation differences related to monetary assets and liabilities are recognised in profit or loss. Non-monetary assets and liabilities measured at amortised cost are translated at the transaction rate.
1.6 Financial instruments in accordance with IAS 39
Financial instruments within the scope of IAS 39 must be allo-cated upon initial recognition to one of the measurement cate-gories stipulated in IAS 39 according to their specific character-istics and, if appropriate, their intended use.
The following categories are used in the consolidated financial statements:
1.6.1 Financial assets at fair value through profit or loss
This category is divided into the two subcategories ”Financial assets held for trading” and ”Financial assets designated as at fair value through profit or loss”.
1.6.1.1 Financial assets held for trading
All non-derivative assets acquired primarily for the purpose of short-term resale are allocated to this category upon initial recognition. In addition, all derivative financial instruments with positive fair values that are not part of a designated and effective hedging relationship are also classified as ”held for trading”. Changes in the fair value occurring between two balance sheet dates are recognised in the trading result.
1.6.1.2 Financial assets designated as at fair value through profit or loss
In line with the fair value option, as modified by the IASB in 2005, all financial assets whose measurement would otherwise result in accounting mismatches and that are measured at fair value, or which include an embedded derivative which would be required to be separated, may be allocated to this category. In the consolidated financial statements, this category was exclu-sively used to eliminate accounting mismatches resulting from interest rate risks, which could not be covered by a hedging relationship in accordance with IAS 39. Changes in the fair value of financial assets designated as at fair value through profit or loss occurring between two balance sheet dates are recognised in profit or loss in the ”Result from the application of the fair value option”. Financial assets designated as at fair value through profit or loss are reported in the item of the statement of financial position to which they would have been allocated if the fair value option had not been applied.
Notes to accounting policies applied

182
DVB Bank SE | Group Annual Report 2014
1.6.5 Financial liabilities at fair value through profit or loss
This category is divided into the two subcategories ”Financial liabilities held for trading” and ”Financial liabilities designated as at fair value through profit or loss”.
1.6.5.1 Financial liabilities held for trading
All non-derivative liabilities entered into primarily for the pur-pose of discharging them through short-term repurchase are irrevocably allocated to this category upon initial recognition. As at the balance sheet date, DVB did not have any non-derivative financial liabilities held for trading. In addition, all derivative financial instruments with negative fair values that are not part of a designated and effective hedging relationship are also clas-sified as ”held for trading”. Changes in the fair value occurring between two balance sheet dates are recognised in the trading result.
1.6.5.2 Financial liabilities designated as at fair value through profit or loss
All financial liabilities whose measurement would otherwise result in accounting mismatches, and that are measured at fair value or which include an embedded derivative which would be required to be separated, may be allocated to this category. In the consolidated financial statements, this category was exclu-sively used to eliminate accounting mismatches resulting from interest rate risks, which could not be covered by a hedging relationship in accordance with IAS 39. Changes in the fair value of financial liabilities designated as at fair value through profit or loss occurring between two balance sheet dates are recog-nised in profit or loss in the result from the application of the fair value option. Financial liabilities designated as at fair value through profit or loss are reported in the item of the statement of financial position to which they would have been allocated, if the fair value option had not been applied.
The change in the fair value of liabilities designated as at fair value through profit or loss attributable to changes with respect to DVB’s credit risk is determined in accordance with the method described in IFRS 7.10(a)(i). For this purpose, changes on the basis of the full fair value are compared with the changes in value in the case of constant credit spreads. The difference corresponds to the change in the fair value attributable to the change in credit risk.
The change in the fair value of assets designated as at fair value through profit or loss attributable to changes in credit risk is determined in accordance with the method described in IFRS 7.9(c)(i). For this purpose, changes on the basis of the full fair value are compared with the changes in value in the case of constant credit spreads. The difference corresponds to the change in the fair value attributable to the change in credit risk. The maximum credit risk exposure corresponds to the carrying amount. During the two previous business years, DVB did not report any assets designated as at fair value through profit or loss.
1.6.2 Held-to-maturity investments
The category ”Held-to-maturity investments” is currently not used by DVB.
1.6.3 Loans and receivables
Generally, all non-derivative financial assets with fixed or determinable payments that are not quoted in an active market should be allocated to the category ”Loans and receivables”. DVB classifies loans extended to debtors and receivables acquired on the secondary market as ”Loans and receivables”. Items of this category are measured at amortised cost using the effective interest method. Accordingly, premiums and discounts are amortised over the term of the assets. Commitment fees received are recognised as deferred income until disbursement of the loans, and subsequently amortised in the same way as premiums and discounts. Amortised premiums, discounts and commitment fees are recognised by DVB as interest income.
1.6.4 Available-for-sale financial assets
All financial assets that cannot be allocated to one of the above-mentioned financial asset categories have to be classi-fied as ”Available-for-sale financial assets”. They are measured at fair value. Changes in the fair value occurring between two balance sheet dates have to be recognised in a revaluation reserve directly in equity until the relevant assets are realised. To the extent that a negative revaluation reserve exists as at the bal-ance sheet date, an impairment test is carried out to determine whether impairment has occurred. In this case, the accumulated negative revaluation reserve is derecognised and transferred to the income statement.
Notes to accounting policies applied

183
A B OU T US
GROUP M A N AGE MEN T RE P OR T
C ONSOL IDAT E D F IN A NC I A L S TA M E M E N T S
NOTES
AUDI T OP INION
DVB Bank SE | Group Annual Report 2014
1.6.6 Other liabilities
All financial liabilities within the scope of IAS 39 that were not allocated to one of the above-mentioned financial liability cate-gories have to be classified as other liabilities. Other liabilities are measured at amortised cost using the effective interest method. Accordingly, premiums and discounts are amortised over the term of the assets and recognised as interest expense.
Other liabilities also comprise financial guarantee contracts. They are measured upon initial recognition at fair value which generally corresponds to the present value of the guarantee commission received. Liabilities from financial guarantee contracts are sub-sequently measured at the greater value of a provision recorded in accordance with IAS 37 or the fair value at the date of initial recognition, less any subsequently recognised amortisation in accordance with IAS 18. Financial guarantee contracts are pre-sented on a net basis, with the recognised liability netted with the receivable from the guarantee commissions.
1.6.7 Classes of financial instruments
In order to comply with the disclosure requirements of IFRS 7, which clarifies the significance of financial instruments for an entity’s financial position and performance, DVB classifies financial instruments as follows:
1.6.7.1 Classes of financial assets
– Financial assets measured at fair value
The class of financial assets measured at fair value includes financial assets of the following IAS 39 categories:
• Financial instruments at fair value through profit or loss with the subcategories ”Financial assets held for trading” and ”Financial assets designated as at fair value through profit or loss”
• Financial assets available for sale
Financial assets of the category ”Financial assets available for sale” whose fair value cannot be reliably determined are not included in that class. Therefore, they are measured at cost and are allocated to the class of ”Financial assets measured at amortised cost”.
Apart from the financial assets of the categories mentioned, this class also comprises the positive fair values of derivative hedging instruments values, which are accounted for as assets and also measured at fair value.
– Financial assets measured at amortised cost
The class of ”Financial assets measured at amortised cost” includes financial assets of the category ”Loans and receivables” as well as available-for-sale financial assets whose fair value cannot be determined reliably.
– Other financial assets
The class of ”Other financial assets” exclusively consists of receivables from finance leases where DVB is the lessor.
1.6.7.2 Classes of financial liabilities
– Financial liabilities measured at fair value
The class of ”Financial liabilities measured at fair value” includes financial liabilities of the following IAS 39 category: Financial instruments measured at fair value through profit or loss with the subcategories ”Financial liabilities held for trad-ing” and ”Financial instruments designated as at fair value through profit or loss”.
Apart from the financial liabilities of the category mentioned, this class also comprises the negative fair values of derivative hedging instruments values, which are accounted for as liabilities.
– Financial liabilities measured at amortised cost
The class of ”Financial liabilities measured at amortised cost” comprises the other financial liabilities within the scope of IAS 39.
– Other financial liabilities
The class of ”Other financial liabilities” consists of liabilities from finance leases where DVB is the lessee, liabilities from irrevocable loan commitments and liabilities from financial guarantee contracts.
Notes to accounting policies applied
184
DVB Bank SE | Group Annual Report 2014
In order to determine the actual amount of the impairment of financial instruments of the category ”Loans and receivables” and of receivables from finance leases, the carrying amount as at the balance sheet date is compared with the present value of expected future cash flows. The original effective interest rate of the corresponding asset has to be used as the discount rate. The original effective interest rate is the rate that exactly dis-counts initially expected future cash payments or receipts over the expected life of the financial instrument or, when appropriate, a shorter period to the carrying amount of the financial asset or financial liability.
If individual financial instruments are insignificant when consid-ered separately, or if no impairment as at the balance sheet date could be determined on an individual basis, such assets are tested for impairment on a portfolio basis together with other similarly insignificant assets or assets not individually impaired.
Uncollectable loans and advances for which no specific valuation allowances were recognised are written off directly. Recoveries on loans and advances previously written off are recognised through profit or loss. If a default is certain for an impaired financial asset, any allowance recognised for this asset is derecognised against the relevant financial asset and reported as utilisation.
For financial instruments of the category ”Available-for-sale financial assets”, which are measured at fair value, it has to be examined whether there is objective evidence of impairment in the case of a cumulative negative revaluation reserve. In case of impairment, the negative revaluation reserve for the financial instrument concerned must be fully derecognised from equity, and recognised in profit or loss. Impairment losses of equity instruments measured at cost are deducted directly from the carrying amount of the financial assets concerned and recog-nised in the income statement.
If it is established during an impairment test that the reasons for an impairment previously recognised in profit or loss no longer exist, the relevant impairment loss is reversed. For assets measured at amortised cost, this reversal is limited to such amortised cost which would have resulted had no impairment occurred. Reversals of impairment losses recognised in profit or loss are not permitted for equity instruments.
1.6.8 Recognition and derecognition of financial instruments
Derivative financial instruments are recognised on the trade date. Non-derivative financial instruments are recognised on the settlement date. Changes in the fair value occurring between the trade date and the settlement date are recognised in accord-ance with the classification of the financial instruments.
All financial instruments are measured at fair value upon initial recognition. Differences between transaction prices and fair values (day 1 profit) are recognised through profit or loss upon first-time recognition, to the extent that the valuation techniques used to determine the fair value are primarily based on observable inputs. If the fair value is derived from transaction prices and also is used as a measurement reference in subsequent periods, the fair value changes are only recognised in profit or loss when these changes are attributable to changes of observable market data. Upon initial recognition, any unrecognised differences that can be attributed to changes of unobservable market data are amortised and recognised as income over the term of the relevant financial instruments.
Financial assets are derecognised when there are no longer any rights to receive payments in future, or when such rights have been transferred to third parties and DVB does not retain any substantial risks and rewards with regard to the financial assets. Financial liabilities are derecognised when there is no further payment obligation, i. e. when the obligation is paid, deleted or has expired.
1.6.9 Impairment, and reversals of impairment losses of financial instruments
If there are objective indications for an impairment of financial assets, an impairment test is performed in accordance with the provisions set out in IAS 39. Among others, the following factors are used as objective indications for an impairment of debt instru-ments: delinquency in interest or principal payments, payment defaults, breaches of material contractual terms in connection with the provision of collateral, certain restructuring measures by customers, impending insolvency, a deterioration of the credit rating within a reporting period by more than two grades or below a defined level, as well as other factors. Objective indications for an impairment of equity instruments are, among others, a sustainable decrease of the financial performance or losses incurred on a prolonged basis as well as the diminution of equity that entail a significant or prolonged decline in the fair value.
Notes to accounting policies applied

185
A B OU T US
GROUP M A N AGE MEN T RE P OR T
C ONSOL IDAT E D F IN A NC I A L S TA M E M E N T S
NOTES
AUDI T OP INION
DVB Bank SE | Group Annual Report 2014
1.7 Embedded derivatives
In accordance with IAS 39, derivative financial instruments embedded in non-derivative financial instruments (embedded derivatives) have to be separated from the host contract and accounted for and measured separately, when
• their economic characteristics and risks are not closely related with the economic characteristics and risks of the host contract;
• a separate instrument with the same terms would meet the definition of a derivative; and
• the entire instrument is not measured at fair value through profit or loss.
If these requirements for the separation of the embedded deriv-ative are not met, the embedded derivative may not be separated from the host contract. At DVB, there are currently no embedded derivatives which are required to be separated.
1.8 Hedge accounting
Within the framework of DVB’s risk management strategy, the Company enters into various derivatives for the purpose of hedging against interest rate and foreign currency risks. IAS 39 contains specific regulations to report these economic hedging relationships in financial statements. The aim of these provisions is to eliminate accounting mismatches between the hedged items and the derivative hedging instruments used. In accordance with IAS 39, there are three different types of hedging relation-ships: fair value hedges, cash flow hedges and hedges of a net investment in a foreign operation. The designation of these hedging relationships depends on meeting the strict requirements defined in IAS 39.
1.8.1 Fair value hedges
The purpose of fair value hedges is to offset changes in the value of the hedged item by offsetting changes in the fair value of the hedging instrument. This means that the changes in the fair value of the hedged item attributable to the hedged item itself, as well as the offsetting changes in the fair value of the hedging instrument, are recognised in the income statement. Hedged items of the category ”Loans and receivables” are measured at amortised cost in line with the general measure-
ment principles of this category. The amortised cost is adjusted subsequently by the fair value change attributable to the hedged risk. Hedged items of the category ”Available-for-sale financial instruments” are measured at fair value. Only the fair value changes that deviate from the amount of the hedged change in the market value are recognised directly in equity in the revaluation reserve.
In the case of fully effective hedging relationships, the fair value changes recognised in the income statement offset each other completely during the term of the hedging relationship. The changes in the fair value recognised in the carrying amount of the hedged items have to be amortised through profit or loss by no later than the time the hedging relationship is terminated. If and when the hedging relationship is terminated by means of selling the hedged item, the cumulative results from remeasure-ment attributable to the hedged risk are recognised in profit or loss at that time.
DVB designates hedging relationships in order to hedge the fair value of fixed-rate loans and advances to customers, loan com-mitments, fixed-income securities, fixed-rate liabilities from refinancing activities as well as foreign currency risks related to financial assets and liabilities. Hedging instruments are primarily interest rate swaps. Interest expenses and interest income from hedged items, as well as from the hedging instruments, are recognised in net interest income.
1.8.2 Cash flow hedges
The changes in uncertain future cash flows from hedged items are to be hedged by offsetting changes in cash flows from hedging instruments (cash flow hedges).
Within the scope of accounting for cash flow hedges, the hedging instruments are measured at fair value. Changes in the fair value attributable to the effective portion of the hedging relation-ship have to be recognised directly in equity in the reserve for cash flow hedges. Changes in the fair value attributable to the ineffective portion of the hedging relationship have to be recog-nised in the trading result. Changes in the fair value or the cash flows of the hedged items have to be recognised in accordance with the general principles of the relevant measurement category. After the termination of a cash flow hedge relationship, the changes in value that have been previously recognised directly in equity will be recognised in profit or loss simultaneously as and when the previously hedged items affect profit or loss.
Notes to accounting policies applied

186
DVB Bank SE | Group Annual Report 2014
The following critical assumptions and estimates, as well as uncertainties inherent in the accounting policies, are essential to understand the underlying financial reporting risks and the effects that these estimates, assumptions and uncertainties may have on the consolidated financial statements. They are based on historical experience, together with other factors such as projections – as well as expectations and forecasts of future events considered likely in view of the current circumstances.
1.9.1 Fair value of financial assets and financial liabilities
The determination of fair values of financial assets and financial liabilities is subject to estimation uncertainties if no prices are available on active markets for the relevant financial instruments. Estimation uncertainties occur above all when the fair values are determined using valuation techniques which are based on significant unobservable measurement parameters. The assump-tions and valuation techniques used to determine fair values when market values were not available are set out in Note 49.
1.9.2 Property and equipment, and intangible assets
The recognition of items of property and equipment, intangible assets and goodwill is subject to the use of estimates for deter-mining the fair value at the acquisition date, especially in the case of assets acquired in a business combination. In addition, the expected useful life of these assets has to be estimated. The determination of the fair values of assets and liabilities is based on management judgements, which were made using all existing information in accordance with the IFRS standards.
In order to determine impairments of property and equipment items, and of intangible assets, estimates are made which relate, among other things, to the cause, timing, and amount of the impairment. The identification of impairment indicators, the estimation of future cash flows and the determination of fair values for assets (or groups of assets) requires management to make significant judgements concerning the identification and validation of impairment indicators, expected cash flows, appli-cable discount rates, relevant useful lives and residual values.
Changes in the fair value of hedging instruments used in cash flow hedges are recognised directly in equity, to the extent that such changes relate to the effective portion of the hedging relationship, or in the hedge result, to the extent that such changes relate to the ineffective portion of the hedge.
At DVB, cash flow hedge relationships are designated to hedge foreign currency risk from interest and fee and commission pay-ments as well as from committed staff and non-staff expenses, each denominated in foreign currencies. Each of the hedged cash flows is expected to occur in the following business year. Hedging instruments exclusively are forward currency contracts.
1.8.3 Net investment hedges
The translation risk from equity investments with a foreign functional currency is hedged through net investment hedges. Gains and losses of the hedging instruments are reported as a separate component of equity until the sale or disposal of the equity investment, to the extent that such gains or losses relate to the effective portion of the hedging relationship. The ineffec-tive portion is recognised in the income statement in the hedge result.
1.8.4 Effectiveness test
Within the scope of the prospective effectiveness test required under IAS 39, a sensitivity analysis is performed on the basis of the so-called basis point value method. The test of retrospective effectiveness is performed using the so-called dollar-offset method. Under this method, the cumulative changes in the fair value of the hedged items attributable to the hedged risk are compared with the changes in the fair value of the hedging instruments. If the changes in the fair values of the hedging instruments and the hedged items offset each other within the range of 80% to 125%, as defined in IAS 39, the hedging relation-ship is regarded as effective. Since 1 September 2013, the test of retrospective effectiveness for all newly designated hedging relationships has been generally carried out using a regression analysis.
1.9 Accounting estimates
The presentation of the financial position and performance in the consolidated financial statements depends on recognition and measurement methods, as well as assumptions and estimates which are the basis for the preparation of consolidated financial statements. If recognition and measurement under IAS/IFRS required the use of assumptions and estimates, these were made in accordance with the relevant standards.
Notes to accounting policies applied
187
A B OU T US
GROUP M A N AGE MEN T RE P OR T
C ONSOL IDAT E D F IN A NC I A L S TA M E M E N T S
NOTES
AUDI T OP INION
DVB Bank SE | Group Annual Report 2014
Impairment is based on a number of factors. We typically con-sider changes in current competitive conditions, expectations of growth, increased cost of capital, changes in the future availa-bility of financing, technological obsolescence, discontinuance of services, current replacement costs and other changes in cir-cumstances that indicate the existence of an impairment. The relevant recoverable amount (determined as the higher of fair value less costs to sell and value in use) is typically determined using a discounted cash flow method which incorporates reason-able market participant assumptions.
1.9.3 Allowance for credit losses and loan loss provisions (risk provisioning)
Uncertainties related to the evaluation of risks in the lending business result, in terms of amount and reason, from assumptions and estimates made by decision-makers. Assumptions and esti-mates made relate, among other things, to the current and future macroeconomic development as well as the financial performance of individual borrowers. Assumptions and estimates also relate to the historical and current development of the proceeds from the realisation of collateral, assumed realisation periods, as well as final credit default losses, taking into account the structure and quality of the Bank’s loan portfolios.
1.9.4 Income tax assets and income tax liabilities
The determination of deferred income tax assets and liabilities is based on estimates of the future taxable profit of the taxable entities. These estimates above all impact the assessment of the realisability of deferred tax assets. In addition, judgements have to be made with regard to income tax-related matters in the context of calculating current income tax assets and income tax liabilities as at the date of preparing the financial statements under commercial law.
1.9.5 Provisions and contingent liabilities
Provisions are recognised if the Group has a present obligation from a past event which is likely to result in an outflow of eco-nomic resources that can be reliably estimated. This present obligation is a liability of uncertain timing and amount. Provisions are determined on the basis of best estimates. Non-current provisions are subject to discounting.
Recognition and measurement of provisions and the amount of contingent liabilities related to pending litigation involve, to a considerable extent, judgements made by the Group. Judgement is necessary in assessing the likelihood that a pending claim will succeed, or a liability will arise, and to quantify the possible amount of the final settlement. We record provisions for liabilities when a loss contingency is considered to exist, and when a loss is considered probable and can be reliably estimated. Because of the inherent uncertainties in this evaluation process, actual losses may be different from the originally estimated amount of the provision. Significant estimates are also involved in the determination of provisions related to taxes and legal risks.
The measurement of pension provisions is based on the projected unit credit method for defined benefit plans, as defined in IAS 19. The measurement of the benefit obligation is based on various estimates and assumptions, in particular assumptions with regard to the long-term salary and pension trend as well as the average life expectancy. The assumptions related to salary and pension trends rely on the development observed in the past, and take into account labour market trends. The bases for the estimate of the average life expectancy are recognised biometric calculation parameters (mortality tables by Prof Dr Klaus Heubeck, mortality tables of ”Finance Norway” as well as ”Dutch table – AG Prognosetafel 2014”).
The interest rate used to discount the future payment obliga-tions is the market rate for risk-free, long-term investments with a similar term. The expected long-term performance of the current plan assets is determined depending on the fund structure, taking historical experience into account.
1.9.6 Non-current assets held for sale
These assets are measured at the lower of their carrying amount or fair value less costs to sell and are classified as ”non-current assets held for sale”. They are no longer subject to amortisation. In general, impairment losses are recognised only when the fair value less costs to sell is below the carrying amount. In case of a subsequent increase in the fair value less costs to sell, the impairment loss previously recognised has to be reversed. The reversal of impairment losses is restricted to the impairment losses previously recognised for the assets concerned.
Notes to accounting policies applied
188
DVB Bank SE | Group Annual Report 2014
the fair value is determined using generally accepted measure-ment methods. Financial instruments without option character-istics were exclusively measured in accordance with the so-called discounted cash flow (DCF) method. Under the DCF method, the expected future cash flows are discounted using the market interest rate applicable at the measurement date. Derivative financial instruments with an option feature are measured on the basis of the Black-Scholes model.
5 Investment securities
Investment securities include bonds and other fixed-income securities, equities and other non-fixed-income securities, as well as other shareholdings not accounted for using the equity method.
Investment securities are measured in accordance with the rel-evant measurement category. Investment securities of the cate-gory ”Financial assets available for sale” are measured at fair value. The fair value of financial instruments which are listed on an active market is determined on the basis of quoted market prices. If such a quoted market price is not available, the instru-ments are measured using methods such as the discounted cash flow method. Fair value changes of instruments included in this category are generally recognised directly in equity in the reval-uation reserve. If the fair value of individual equity instruments cannot be reliably determined, they are measured at cost.
Investment securities of the category ”Loans and receivables” – especially small quantities of bearer bonds not listed in an active market – are measured at amortised cost.
Impairment losses on financial assets are calculated based on the provisions of IAS 39 applicable to the relevant financial assets category or based on the accounting standards relevant for the financial assets concerned and are directly deducted from the carrying amount of the related financial assets.
6 Investments in companies accounted for using the equity method
Investments in associates and interests in joint ventures are recognised in the consolidated statement of financial position at cost when the significant influence arises, or upon formation. In subsequent years, the carrying amount is adjusted by taking into account the prorata changes in equity of the company concerned. The pro-rata share in net profit of the investee is recognised in the income statement in the result from investments in companies accounted for using the equity method.
2 Cash and balances with the central bank
This item includes cash on hand and the balances held at the central bank. Measurement is based on nominal values.
3 Loans and advances to banks and customers; allowance for credit losses
Loans and advances to customers and banks mainly include advances and loans extended to customers and banks, as well as receivables from money market transactions. Loans and advances are generally measured at amortised cost. If the cor-responding prerequisites are met, individual loans and advances to customers are measured at fair value under the fair value option. In this case, changes in the fair value are reported in the result from the application of the fair value option. During the two previous business years, DVB did not report any loans and advances to customers designated as at fair value through profit or loss. If the loans and advances were designated as hedged items in effective fair value hedges, the carrying amount includes fair value changes attributable to the hedged risk.
The allowance for credit losses related to loans and advances to banks and to customers is deducted from the relevant assets’ carrying amount and reported as a separate line item in the statement of financial position. Additions to and reversals of allowances for credit losses related to loans and advances to banks and to customers are recorded in the income statement under the item ”Allowance for credit losses”.
DVB’s risk provisioning measures also comprise changes in pro-visions for loan commitments, other provisions for the lending business and liabilities from financial guarantee contracts. Addi-tions to and reversals of these items are also recognised in the income statement in the item ”Allowance for credit losses”.
4 Trading assets and trading liabilities
Financial assets and liabilities held for trading mainly include interest and currency derivatives with positive and negative fair values which are not used as derivative hedging instruments under hedge accounting. Trading assets and trading liabilities are measured at fair value. Changes in the fair value are recog-nised in net trading income.
If a quoted market price was available for derivative financial instruments listed in an active market, such market price was used as the basis for the determination of the fair value. For derivative financial instruments not quoted in an active market,
Notes to accounting policies applied

189
A B OU T US
GROUP M A N AGE MEN T RE P OR T
C ONSOL IDAT E D F IN A NC I A L S TA M E M E N T S
NOTES
AUDI T OP INION
DVB Bank SE | Group Annual Report 2014
If there are indications of an impairment of the interests held in a company accounted for using the equity method, an impair-ment test is performed and, if necessary, the carrying amount of the interests is written down. Impairment losses are reversed if the underlying reasons for an impairment loss cease to exist, up to the amount of the original carrying amount. Impairment losses and reversals of impairment losses are recognised in the income statement item ”Result from investments in companies accounted for using the equity method”.
7 Intangible assets
Intangible assets mainly comprise goodwill. In addition, purchased and internally generated intangible assets are capitalised if the recognition criteria set out in IAS 38 are met. In accordance with IFRS 3 in connection with IAS 38, goodwill is not subject to amortisation, but is tested for impairment at least annually pursuant to IAS 36. Other intangible assets are amortised on a straight-line basis over the expected economic life, which ranges from three to eight years. Subsequent measurement for items of property and equipment is based on their cost less any accu-mulated amortisation and any accumulated impairment losses, according to the amortised cost model mentioned in IAS 38.
8 Property and equipment
Property and equipment includes land and buildings, assets held under operating leases (including but not limited to ships, air-craft, aircraft engines and shipping containers), leasehold improvements as well as operating and office equipment. Items of property and equipment are initially recognised at cost. The cost includes the purchase price as well as transaction costs in the form of fees/commissions paid and capitalised borrowing costs in accordance with IAS 23. Subsequent measurement for items of property and equipment is based on their cost less any accumulated depreciation and any accumulated impairment losses, according to the cost model mentioned in IAS 16. The useful lives of items of property and equipment are as follows.
Asset category Useful life Depreciation method
Land and buildings 50 years straight-line depreciation
Operating and
office equipment
3 to 15 years
straight-line depreciation
Leased assets 0.5 to 25 years straight-line depreciation
Leasehold improvements 2 to 10 years straight-line depreciation
8.1 Leasing
In accordance with IAS 17, a lease is classified as an operating lease if it does not transfer to the lessee substantially all the risks and rewards incidental to ownership. In contrast, a lease is classified as a finance lease if it transfers substantially all risks and rewards to the lessee.
8.1.1 The Group as lessor
If beneficial ownership of the leased asset remains with DVB, the lease is classified as an operating lease. The leased assets are carried at cost less any depreciation accumulated over the useful life. If there is a guaranteed residual value for the leased asset at the end of the lease term, the asset is depreciated on a straight-line basis over the term of the lease down to the guar-anteed residual value.
Revenue generated from leases is recognised on a straight-line basis over the lease term and reported in net interest income, unless another amortisation procedure is appropriate.
If almost all risks and rewards incidental to ownership of the leased asset are transferred to the lessee (finance lease), DVB recognises a receivable due from the lessee. This receivable is measured at the amount of the net investment in the lease at the time the lease is concluded. Received lease payments are divided into an interest element, which is recognised in profit or loss, and a capital portion. Income is recognised on an accrual basis as interest income.
8.1.2 The Group as lessee
The main area where DVB is the lessee within the context of operating leases is the use of office buildings and cars. The lease payments under operating leases are recognised in general administrative expenses. The expense is determined by analogy with a lease payment on a systematic basis which is represent-ative of the time pattern of the user’s benefit.
8.2 Impairment of intangible assets, and property and equipment, and reversals of impairment losses
Intangible assets, and property and equipment, are tested for impairment at least annually. Opinions prepared by external experts are predominantly used as a basis to determine the value of property and equipment. If the recoverable amount determined on this basis has fallen below amortised cost, or below cost less any accumulated depreciation and any accumu-lated impairment losses, as the case may be, as at the balance sheet date, a write-down for impairment is made.
Notes to accounting policies applied

190
DVB Bank SE | Group Annual Report 2014
In the past, DVB Bank SE offered its employees in Germany, Norway and the Netherlands defined benefit plans for post-employment benefits. At present, such plans are only offered to newly hired employees in the US. The amount of the benefit committments is based on the remuneration and the length of service of the relevant employee in the Group. A portion of the benefit committments is covered by reinsurance policies.
The pension committments can be distinguished with regard to the base amount, which is granted for a number of years of service, and the top-up amount, which applies when the period of service exceeds 25 years. They additionally include a com-mitment for benefits to surviving dependants (widow(er)s and orphans) as well as for benefits in the case of invalidity.
The defined benefit obligations are measured in accordance with IAS 19, taking into account expected salary and pension increases using the projected unit credit method. Actuarial gains and losses are recognised directly in equity when they occur.
The other provisions are measured in accordance with IAS 37, using the best estimate of the expected future expenses required to settle the obligation.
13 Subordinated liabilities
The item ”Subordinated liabilities” includes subordinated loans from banks, subordinated bearer bonds issued by DVB Bank SE, profit-participation rights and silent partnership contributions. The liabilities are measured at amortised cost using the effective interest method.
14 Equity
Equity represents the residual interest in the assets of a company after deducting all of its liabilities. At the DVB Group, it com-prises issued share capital, the capital reserve and retained earnings as well as specific reserves resulting from the application of IAS 39 in order to temporarily recognise certain gains or losses from remeasurement. This mainly includes the revaluation reserve for available-for-sale financial instruments as well as the reserve for cash flow hedges. The individual components of the treasury shares held by DVB Bank SE are deducted from equity using the so-called par value method. Gains and losses arising from transactions with treasury shares are recognised directly in equity.
If it is established during an impairment test that the reasons for an impairment previously recognised in profit or loss no longer exists, the relevant impairment loss is reversed, except if goodwill is concerned.
9 Current and deferred taxes
Current and deferred taxes are accounted for pursuant to the provisions of IAS 12 – Income Taxes. Accordingly, deferred taxes have to be recognised for differences in the carrying amounts of assets and liabilities in the IFRS statement of financial position and the tax base, to the extent that such differences will reverse in future. Deferred income tax assets on tax loss carryforwards are recognised when the timing and the amount of their recover-ability in the future can be reliably determined.
10 Deposits from customers and other banks
Deposits from customers mainly comprise customer deposits and promissory note loans held by customers. The item ”Deposits from other banks” includes borrowings from other banks, money market placements as well as promissory note loans held by banks.
The deposits are measured at amortised cost on the basis of the original effective interest rate. If there are accounting mis-matches, individual deposits from customers and other banks are measured at fair value under the fair value option. In this case, changes in the fair value are reported in the result from the application of the fair value option. During the two previous business years, DVB did not report any deposits from customers and other banks designated as at fair value through profit or loss.
11 Securitised liabilities
The item ”Securitised liabilities” includes in particular bearer bonds and covered bonds (Pfandbriefe) issued by DVB Bank SE. Items of this category are generally measured at amortised cost, which is determined using the effective interest method.
12 Provisions
This item includes defined benefit pension obligations, provisions for early retirement, partial retirement and jubilee payments, as well as restructuring provisions and other provisions.
Notes to accounting policies applied

191
A B OU T US
GROUP M A N AGE MEN T RE P OR T
C ONSOL IDAT E D F IN A NC I A L S TA M E M E N T S
NOTES
AUDI T OP INION
DVB Bank SE | Group Annual Report 2014
15 Net interest income
Net interest income can be broken down as follows in the year under review:
The transfer of the reserve for cash flow hedges to the income statement due to the receipt of hedged interest payments denom-inated in foreign currency resulted in income of €0.7 million (previous year: expense of €8.1 million), which is reported in the item ”Interest income from lending and money market trans-actions”. This compares with a correspondingly higher interest expense from US dollar loans.
In the business year under review, interest income from financial instruments not measured at fair value through profit or loss amounted to €677.3 million (previous year: €697.7 million), and interest expense amounted to €531.9 million (previous year: €553.3 million). Net interest income includes interest income in the amount of €19.6 million (previous year: €11.0 million) attributable to impaired loans and advances.
16 Allowance for credit losses
The allowance for credit losses changed as follows:
The distribution of the allowance for credit losses by business division is outlined in the group management report in the dis-cussion of financial position and performance (see pages 59–60).
17 Net fee and commission income
Net fee and commission income can be broken down as follows in the year under review:
Notes to the income statement
€ mn 2014 2013 %
Interest income
from lending and
money market transactions 779.4 785.6 –0.8
from bonds and
other fixed-income securities 10.8 5.5 96.4
from finance leases 16.8 26.3 –36.1
Current income
from operating leases1) 88.7 122.9 –27.8
from equity investments and
other investment securities 1.2 2.2 –45.5
Interest income 896.9 942.5 –4.8
Interest expenses
for deposits 289.0 293.8 –1.6
for securitised liabilities 265.1 280.5 –5.5
for subordinated liabilities 16.1 15.8 1.9
from operating leases1) 110.8 109.4 1.3
Interest expenses 681.0 699.5 –2.6
Net interest income 215.9 243.0 –11.2
1) The retrospective first-time application of IFRS 10 in the reporting year led to a reduction of the previous year’s figures for current income from operating leases by €1.1 million and for expenses for operating leases by €2.3 million (see Note 1.1).
€ mn 2014 2013 %
Additions1) –147.2 –154.4 –4.7
Reversals 83.5 69.4 20.3
Direct write-offs –8.6 –9.6 –10.4
Recoveries on loans
and advances previously
written-off 9.9 6.7 47.8
Total –62.4 –87.9 –29.0
1) The retrospective first-time application of IFRS 10 in the reporting year led to an increase of the previous year’s figure for additions to the allowance for credit losses of €0.8 million (see Note 1.1).
€ mn 2014 2013 %
Fee and commission income
from payment transactions 1.2 1.2 –
from guarantees
and indemnities 4.2 4.0 5.0
from the lending business 93.0 100.2 –7.2
Other fee and
commission income 16.4 29.0 –43.4
Fee and commission income 114.8 134.4 –14.6
Fee and commission expenses
from the securities business 0.0 0.0 –
from payment transactions –1.6 –1.0 60.0
from guarantees
and indemnities 0.0 0.0 –
from the lending business –0.8 –1.5 –46.7
Other fee and
commission expenses –3.6 –3.2 12.5
Fee and
commission expenses –6.3 –5.7 10.5
Net fee
and commission income 108.5 128.7 –15.7

192
DVB Bank SE | Group Annual Report 2014
19 General administrative expenses
General administrative expenses were as follows in the year under review:
To the extent that interest for irrevocable loan commitments was received, such interest was recognised as a liability during the term of the loan commitment and released to interest income over the term of the underlying loan, using the effective interest method. Interest on commitments for roll-over loans with interest rates fixed over a short period of time was recognised as income at the date of payment, and shown as fee and commission income from lending business.
Fee and commission income from financial instruments not meas-ured at fair value through profit or loss amounted to €93.0 million in the business year (previous year: €100.0 million); fee and commission expenses amounted to €–0.8 million (previous year: €–1.5 million).
The transfer of the reserve for cash flow hedges to the income statement due to the receipt of hedged fee and commission pay-ments denominated in foreign currencies resulted in an expense of €–0.2 million (previous year: income of €4.3 million), which is reported in the item ”Other fee and commission income”.
18 Result from investments in companies accounted for using the equity method
The result from investments accounted for using the equity method can be broken down as follows in the year under review:
Notes to the income statement
€ mn 2014 2013 %
Results from joint ventures
accounted for using the
equity method 9.8 1.3 –
Results from associates
accounted for using
the equity method 2.6 3.8 –31.6
Total 12.4 5.1 –
€ mn 2014 2013 %
Wages and salaries –95.5 –92.5 3.2
Social security contributions –8.6 –7.4 16.2
Expenses for pensions and
other employee benefits –4.8 –5.8 –17.2
Staff expenses –108.9 –105.7 3.0
Expenses for temporary staff –2.1 –2.0 5.0
Contributions and fees –9.1 –6.4 42.2
Legal and auditing fees –8.6 –8.9 –3.4
Other advisory services
(incl. IT advisory) –16.4 –14.7 11.6
IT costs –4.9 –4.3 14.0
Occupancy costs –8.3 –7.3 13.7
Procurement of information –1.9 –1.9 –
Public relations –0.4 –0.6 –33.3
Ancillary labour costs –18.2 –17.5 4.0
Other non-staff expenses –4.4 –4.7 –6.4
Non-staff expenses –74.3 –68.3 8.8
Property and equipment,
and investment property –2.1 –1.8 16.7
Intangible assets –2.4 –3.0 –20.0
Total depreciation,
amortisation, impairment
and write-ups –4.5 –4.8 –6.3
Total general
administrative expenses –187.7 –178.8 5.0

193
A B OU T US
GROUP M A N AGE MEN T RE P OR T
C ONSOL IDAT E D F IN A NC I A L S TA M E M E N T S
NOTES
AUDI T OP INION
DVB Bank SE | Group Annual Report 2014
The line item ”expenses for pensions and other employee benefits” includes payments from defined contribution plans in the amount of €–1.4 million (previous year: €–2.8 million).
As a result of the payment of hedged interest payments denom-inated in foreign currency, the transfer of the hedging reserve for cash flow hedges to the income statement led to an expense of €–0.9 million (previous year: income of €2.8 million). Of that amount, €–0.5 million relate to staff expenses and €–0.4 million to other non-staff expenses.
In the year under review, minimum lease payments under operat-ing leases in the amount of €7.1 million (previous year: €5.7 million) were recognised as expenses. There were no contingent rents and sublease payments. Legal and auditing fees included fees for auditors in the amount of €2.6 million (previous year: €1.6 million). These fees were comprised of the following individual items:
20 Net other operating income/expenses
Net other operating income/expenses were as follows:
Notes to the income statement
€ mn 2014 2013 %
Auditing fees 1.9 0.9 –
Other attestation services 0.4 0.4 –
Other advisory services 0.3 0.3 –
Total fees 2.6 1.6 62.5
€ mn 2014 2013 %
Income
from the disposal of
property and equipment 0.0 5.4 –
from rents 0.1 0.6 –83.3
from deconsolidation 10.0 8.6 16.3
from the reversal of provisions 1.9 2.6 –26.9
from recovery of taxes
not related to income 1.0 1.5 –33.3
in relation to the sale of a loan 26.7 0.0 –
from miscellaneous
other income 21.4 11.3 89.4
from invoices reimbursed 10.6 9.6 10.4
Other operating income 71.7 39.6 81.1
Expenses
from deconsolidation –5.7 –2.4 –
from additions to provisions –0.7 –5.0 –86.0
for taxes not related to income –0.2 –0.1 –
from invoices to be reimbursed –10.2 –10.0 2.0
in relation to the sale of a loan –4.0 0.0 –
from miscellaneous
other expenses –20.8 –26.1 –20.3
Other operating expenses –41.6 –43.6 –4.6
Net other operating
income/expenses 30.1 –4.0 –
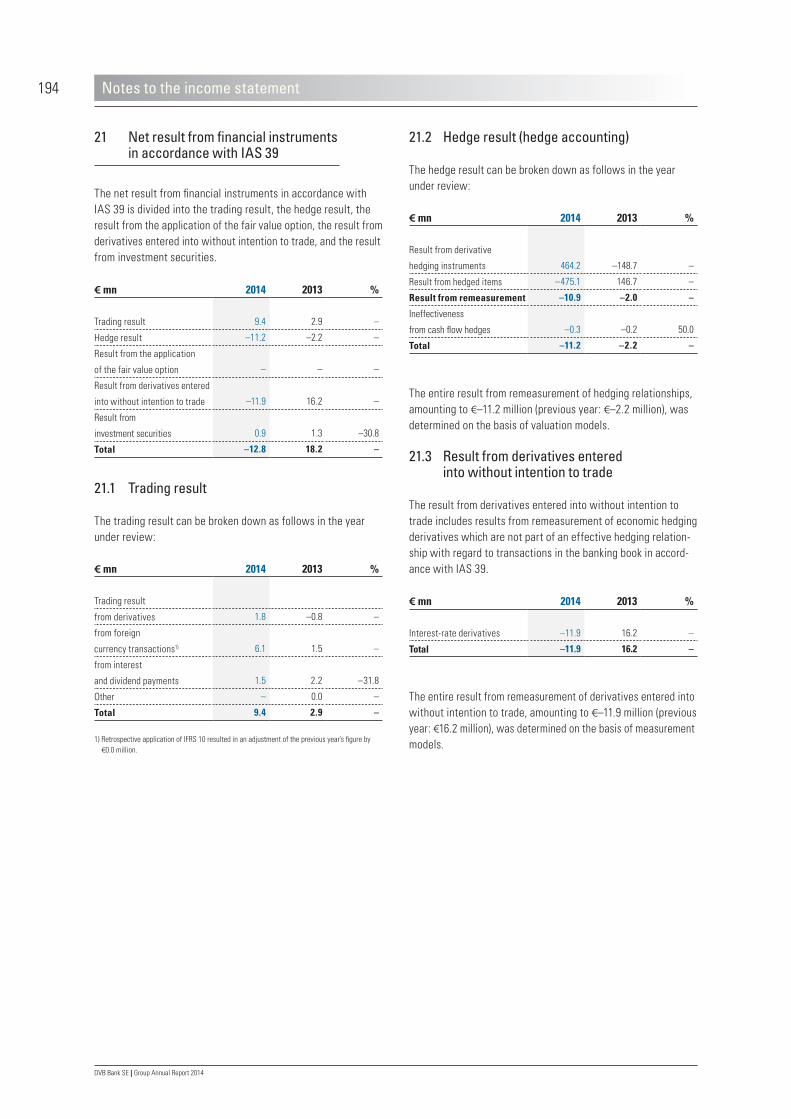
194
DVB Bank SE | Group Annual Report 2014
21.2 Hedge result (hedge accounting)
The hedge result can be broken down as follows in the year under review:
The entire result from remeasurement of hedging relationships, amounting to €–11.2 million (previous year: €–2.2 million), was determined on the basis of valuation models.
21.3 Result from derivatives entered into without intention to trade
The result from derivatives entered into without intention to trade includes results from remeasurement of economic hedging derivatives which are not part of an effective hedging relation-ship with regard to transactions in the banking book in accord-ance with IAS 39.
The entire result from remeasurement of derivatives entered into without intention to trade, amounting to €–11.9 million (previous year: €16.2 million), was determined on the basis of measurement models.
21 Net result from financial instruments in accordance with IAS 39
The net result from financial instruments in accordance with IAS 39 is divided into the trading result, the hedge result, the result from the application of the fair value option, the result from derivatives entered into without intention to trade, and the result from investment securities.
21.1 Trading result
The trading result can be broken down as follows in the year under review:
€ mn 2014 2013 %
Result from derivative
hedging instruments 464.2 –148.7 –
Result from hedged items –475.1 146.7 –
Result from remeasurement –10.9 –2.0 –
Ineffectiveness
from cash flow hedges –0.3 –0.2 50.0
Total –11.2 –2.2 –
€ mn 2014 2013 %
Interest-rate derivatives –11.9 16.2 –
Total –11.9 16.2 –
€ mn 2014 2013 %
Trading result 9.4 2.9 –
Hedge result –11.2 –2.2 –
Result from the application
of the fair value option – – –
Result from derivatives entered
into without intention to trade –11.9 16.2 –
Result from
investment securities 0.9 1.3 –30.8
Total –12.8 18.2 –
€ mn 2014 2013 %
Trading result
from derivatives 1.8 –0.8 –
from foreign
currency transactions1) 6.1 1.5 –
from interest
and dividend payments 1.5 2.2 –31.8
Other – 0.0 –
Total 9.4 2.9 –
1) Retrospective application of IFRS 10 resulted in an adjustment of the previous year’s figure by €0.0 million.
Notes to the income statement
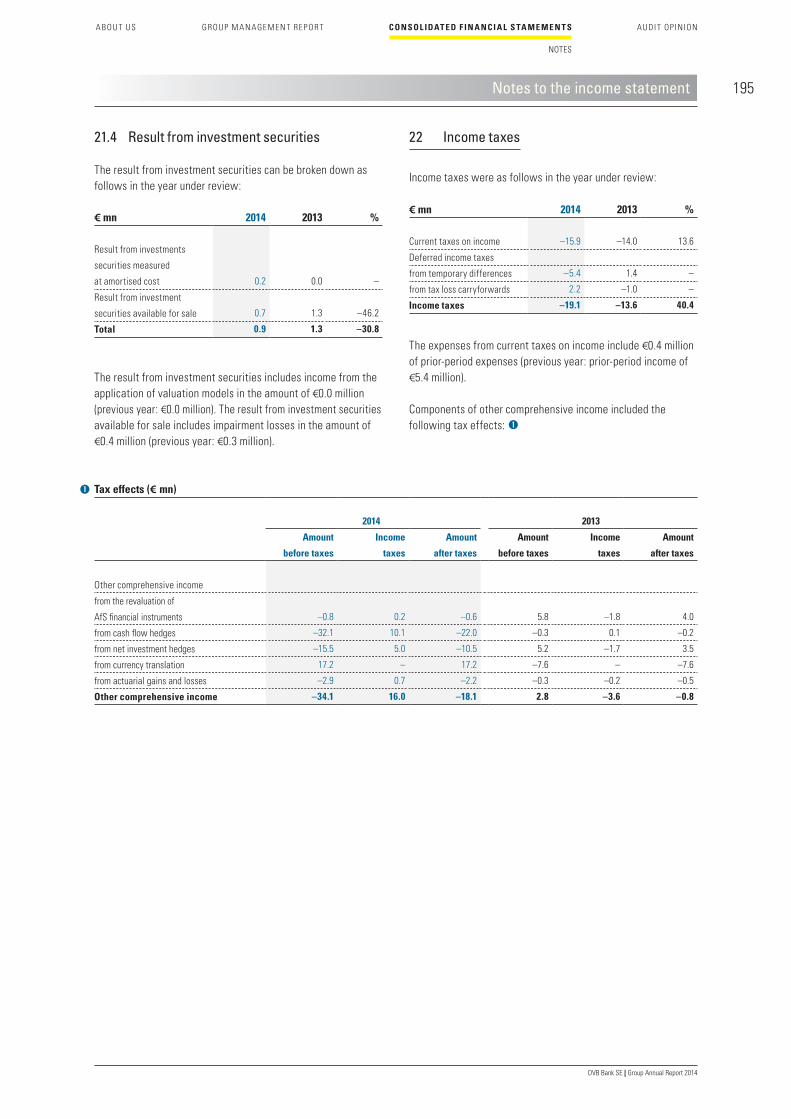
195
A B OU T US
GROUP M A N AGE MEN T RE P OR T
C ONSOL IDAT E D F IN A NC I A L S TA M E M E N T S
NOTES
AUDI T OP INION
DVB Bank SE | Group Annual Report 2014
21.4 Result from investment securities
The result from investment securities can be broken down as follows in the year under review:
The result from investment securities includes income from the application of valuation models in the amount of €0.0 million (previous year: €0.0 million). The result from investment securities available for sale includes impairment losses in the amount of €0.4 million (previous year: €0.3 million).
22 Income taxes
Income taxes were as follows in the year under review:
The expenses from current taxes on income include €0.4 million of prior-period expenses (previous year: prior-period income of €5.4 million).
Components of other comprehensive income included the following tax effects:
€ mn 2014 2013 %
Result from investments
securities measured
at amortised cost 0.2 0.0 –
Result from investment
securities available for sale 0.7 1.3 –46.2
Total 0.9 1.3 –30.8
Tax effects (€ mn)
2014 2013
Amount
before taxes
Income
taxes
Amount
after taxes
Amount
before taxes
Income
taxes
Amount
after taxes
Other comprehensive income
from the revaluation of
AfS financial instruments –0.8 0.2 –0.6 5.8 –1.8 4.0
from cash flow hedges –32.1 10.1 –22.0 –0.3 0.1 –0.2
from net investment hedges –15.5 5.0 –10.5 5.2 –1.7 3.5
from currency translation 17.2 – 17.2 –7.6 – –7.6
from actuarial gains and losses –2.9 0.7 –2.2 –0.3 –0.2 –0.5
Other comprehensive income –34.1 16.0 –18.1 2.8 –3.6 –0.8
€ mn 2014 2013 %
Current taxes on income –15.9 –14.0 13.6
Deferred income taxes
from temporary differences –5.4 1.4 –
from tax loss carryforwards 2.2 –1.0 –
Income taxes –19.1 –13.6 40.4
Notes to the income statement

196
DVB Bank SE | Group Annual Report 2014
23 Segment reporting
23.1 General information on segment reporting
The segment report illustrates how the individual business divisions contribute to the DVB Group’s earnings. The segment report is based on the internal management reporting system, and accordingly complies with the requirements of IFRS 8 –Operating Segments. IFRS 8 requires that segment information shall be presented on the basis of internal management report-ing as regularly used by the ”chief operating decision maker” to make a decision on the allocation of resources to the segments and to assess performance. The function of chief operating decision maker is performed by the Board of Managing Directors of DVB.
23.2 Segmentation, reconciliation and consolidation
DVB focuses on its core segments Shipping Finance, Aviation Finance, Offshore Finance, Land Transport Finance and Investment Management. The active Group Treasury segment is additionally reported. The other segments which are not individually report-able as well as the internal Service Centre segment are summa-rised under ”Other segments”. Amounts from consolidation adjustments as well as reconciliation items for Group reporting purposes are reported under ”Reconciliation/consolidation”.
The segments Shipping Finance, Aviation Finance, Offshore Finance and Land Transport Finance include the business with traditionally collateralised loans and customised structured financings (Structured Asset Financing) as well as advisory ser-vices (Advisory Services). Each segment has its own research, risk management and work-out functions. The Investment Management segment comprises all fund management activities as well as transactions in which the Group holds an equity investment in companies. The Group Treasury segment shows income and expenses from liquidity, interest and capital structure management.
The following reconciliation shows the relationship between the expected tax expense and the current tax expense:
The expected tax rate for the Group is composed of the corpo-rate income tax rate of 15.0%, which is currently applicable in Germany, plus a solidarity surcharge of 5.5%, as well as the average trade tax assessment rate of 460% applicable for Frankfurt/Main. The expected Group tax rate, based on these rates, is 31.9%.
Deferred tax expenses of €–5.4 million are attributable to the recognition or reversal of temporary differences (previous year: €1.4 million).
€ mn 2014 2013 %
Consolidated net income
before income taxes
(consolidated net income
before taxes) 104.0 123.8 –16.0
Tax rate in the Group (%) 31.9 31.9 –
Expected taxes on income –33.2 –39.5 –15.9
Tax rate differences with
regard to earnings components
that are subject to taxation in
other countries 12.9 19.2 –32.8
Tax reductions due to
tax-exempt income 4.7 3.1 51.6
Current tax amounts
of the prior period 1.4 5.4 –74.1
Additional taxes due to
non-deductible expenses –4.6 –1.8 –
Other effects –0.3 – –
Tax effects 14.1 25.9 –45.6
Current taxes –15.9 –14.0 13.6
Deferred taxes –3.2 0.4 –
Reported income taxes –19.1 –13.6 40.4
Notes to the income statement

197
A B OU T US
GROUP M A N AGE MEN T RE P OR T
C ONSOL IDAT E D F IN A NC I A L S TA M E M E N T S
NOTES
AUDI T OP INION
DVB Bank SE | Group Annual Report 2014
The other, smaller-scale activities of the Group, such as the sub-sidiary ITF Suisse as well as the D-Marketing and the Transport Infrastructure Finance portfolios (which are no longer in line with our strategy), are summarised in the column ”Other segments”. In addition, this segment includes those investments that are not allocated to a specific operating segment. Moreover, this segment includes the central support and management functions as well as significant overheads which the Bank does not allocate to the operating entities, as we believe that these overheads cannot be directly influenced by the respective management team, and therefore no direct control factor can be identified.
The ”Reconciliation/consolidation” segment comprises income and expenses that are necessary in order to reconcile financial indicators used for internal management accounting, which are shown in the segment report of the operating business units, to the corresponding data for external financial reporting, as well as the amounts from consolidation adjustments.
23.3 Methodology of presentation and measurement principles
Income and expenses are generally reported at market prices, and allocated to the responsible business division. Interest income and expenses are allocated to the relevant segments using market interest rates. Costs are only allocated to the operating business divisions of DVB for which they are directly responsi-ble. General costs of operations, overheads or, for example, IT costs are not allocated to the operating business divisions. Fixed exchange rates are used for currency translation in the operating segments. These are determined in the context of annual plan-ning. DVB’s internal management reporting does not take into account taxes on income.
Income or costs from trading activities and exchange rate hedging (hedge accounting) are not allocated to the segments as central functions are responsible for such transactions. Only in excep-tional cases do business divisions directly enter into such trans-actions (Investment Management).
Intersegment, intra-group transactions are only undertaken to an insignificant degree and are entered into on an arm’s length basis.
The net interest income of the segments is determined on a net basis, primarily on the basis of market interest rates (i.e. off-setting interest income and interest expenses).
Segment assets exclusively comprise the relevant segment’s customer lending volume in line with internal management systems.
23.4 Performance measurement
The performance of DVB and of each segment is determined on the basis of consolidated net income before taxes as well as the indicators cost/income ratio and return on equity.
The cost/income ratio is used to assess efficiency. It is calcu-lated as follows: the general administrative expenses are divided by the total of net interest income (before allowance for credit losses), net fee and commission income, net result from financial instruments in accordance with IAS 39, results from investments in companies accounting for using the equity method and net other operating income/expenses.
Return on equity is a key profitability indicator and is calculated as follows: consolidated net income before taxes attributable to DVB’s shareholders is divided by the total of weighted capital (issued share capital, capital reserve, retained earnings exclud-ing the fund for general banking risks, non-controlling interests and deferred taxes, as well as before appropriation of consoli-dated net income). If the indicator is disclosed for parts of the Group, the issued share capital is shown in proportion to the risk capital employed.
The indicators described apply uniformly to all company divisions and are calculated on the same basis.
Notes to the income statement

198
DVB Bank SE | Group Annual Report 2014
23.6 Disclosures on company level
DVB manages its business activities exclusively by business division. Each business division operates on a global scale. Therefore, the Bank does not follow regional management approaches and does not present segment results by region due to the minor relevance and the disproportionately high effort involved in collecting data.
For information on products and services, please refer to the information provided regarding the business segments in the group management report on page 78 (Shipping Finance), page 90–91 (Aviation Finance), page 102 (Offshore Finance), page 111 (Land Transport Finance) as well as pages 132 and 135 (Investment Management).
23.5 Reconciliation/consolidation
The ”Reconciliation/consolidation” column includes consolidation and reconciliation items to reconcile from the segment result as reported under internal management reporting to the consoli-dated financial statements. These include, among others:
• Income and expenses that cannot or should not be attributed to any other segment, such as costs for deposit protection schemes or transactions affecting more than one period;
• Items resulting from different approaches used in internal and external financial reporting;
• Differences arising due to the application of fixed exchange rates on the operating segments; and
• Other consolidation effects.
Consolidation effects (€ mn)
Reconciliation/consolidation Reconciliation Consolidation2014 2013 2014 2013 2014 2013
Net interest income 33.5 –7.3 30.6 –12.7 2.9 5.5
Allowance for credit losses –1.3 1.6 1.9 1.6 –3.2 0.1
Net interest income
after allowance for credit losses 32.2 –5.5 32.5 –11.1 –0.3 5.6
Net fee and commission income –5.0 –1.3 –0.2 –2.8 –4.8 1.5
Results from investments in companies
accounted for using the equity method 0.0 0.1 0.0 0.0 0.0 0.1
Net other operating income/expenses 5.5 –1.9 0.3 0.1 5.2 –2.0
Results 32.7 –8.6 32.6 –13.8 0.1 5.2
Staff expenses –8.4 –6.9 –7.7 –7.2 –0.7 0.3
Non-staff expenses –19.8 –18.0 –20.3 –18.1 0.5 0.1
Depreciation, amortisation,
impairment and write-ups –0.1 –0.6 0.0 –0.7 –0.1 0.0
General administrative expenses –28.3 –25.5 –28.0 –26.0 –0.3 0.4
Consolidated net income
before IAS 39 and taxes 4.4 –34.2 4.6 –39.8 –0.2 5.6
Net result from financial instruments
in accordance with IAS 39 –1.0 1.7 –1.0 1.7 0.0 0.0
Consolidated net income before taxes 3.4 –32.5 3.7 –38.1 –0.3 5.6
Lending volume – – – – – –
Notes to the income statement

199
A B OU T US
GROUP M A N AGE MEN T RE P OR T
C ONSOL IDAT E D F IN A NC I A L S TA M E M E N T S
NOTES
AUDI T OP INION
DVB Bank SE | Group Annual Report 2014
24 Cash and balances with the central bank
This item includes a minimum reserve requirement in the amount of €7.9 million (previous year: €4.2 million).
25 Loans and advances to banks
Loans and advances to banks include receivables in the amount of €235.0 million in connection with five securities repurchase agreements with terms of less than three months where DVB acts as lender. The market value of the bonds under these repur-chase agreements amounts to €231.9 million.
26 Loans and advances to customers
DVB does not hold any claims against any of the highly-indebted euro zone countries (Greece, Ireland, Portugal, Spain and Italy).
Loans and advances to customers domiciled in these countries are not exposed to any country-specific risks, especially due to the fact that the relevant claims are collateralised by the financed transport assets.
In April 2012, DVB reclassified loan agreements from the category ”Financial assets held for trading” to the category ”Loans and receivables” in the amount of €117.0 million. The carrying amount of the reclassified transactions was €86.3 million (previous year: €89.5 million) as at the balance sheet date. If the financial instruments had not been reclassified, the additional measure-ment gains recorded in the period would have amounted to €2.3 million (previous year: measurement losses of €–0.4 million). The result recognised in profit or loss for the reporting period (consisting of interest income and measurement results) totalled €16.6 million in period under review (previous year: €–0.7 million). The fair value as at the reporting date was €87.0 million (previous year: €89.6 million). The effective interest rates of the reclassi-fied financial instruments range from 2.2% to 5.8%. The expected future cash flows amount to €137.2 million as at the date of reclassification. No other reclassifications were made in the previous business year.
€ mn 2014 2013 %
Cash on hand 0.0 0.0 –
Balances with the central bank 175.5 2,040.5 –91.4
Total 175.5 2,040.5 –91.4
€ mn 2014 2013 %
Loans and advances 596.8 199.1 –
thereof: payable on demand 596.8 199.1 –
thereof: with a limited term 0.0 0.0 –
Money market transactions 894.7 13.1 –
thereof: payable on demand – – –
thereof: with a limited term 894.7 13.1 –
Other loans and advances
to banks 0.1 0.1 –
Total 1,491.6 212.3 –
German banks 754.8 19.0 –
Foreign banks 736.8 193.3 –
Total 1,491.6 212.3 –
€ mn 2014 2013 %
Loans and advances 20,610.2 18,880.1 9.2
thereof: payable on demand 252.7 113.3 –
thereof: with a limited term1) 20,357.5 18,766.8 8.5
Other loans and advances
to customers 22.8 20.8 9.6
Total 20,633.0 18,900.9 9.2
German customers 1,039.8 869.0 19.7
Foreign customers1) 19,593.2 18,031.9 8.7
Total 20,633.0 18,900.9 9.2
1) The retrospective first-time application of IFRS 10 led to a change of the previous year’s figure by €4.0 million (see Note 1.1).
Notes to the statement of financial position
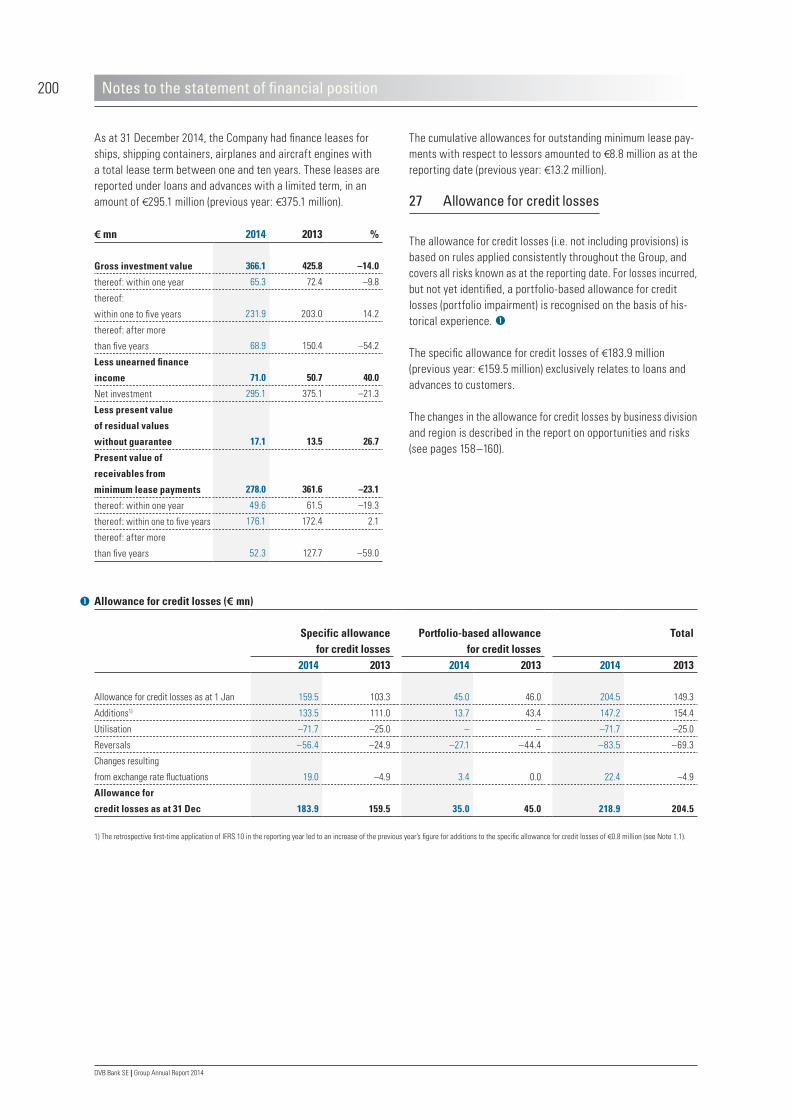
200
DVB Bank SE | Group Annual Report 2014
The cumulative allowances for outstanding minimum lease pay-ments with respect to lessors amounted to €8.8 million as at the reporting date (previous year: €13.2 million).
27 Allowance for credit losses
The allowance for credit losses (i.e. not including provisions) is based on rules applied consistently throughout the Group, and covers all risks known as at the reporting date. For losses incurred, but not yet identified, a portfolio-based allowance for credit losses (portfolio impairment) is recognised on the basis of his-torical experience.
The specific allowance for credit losses of €183.9 million (previous year: €159.5 million) exclusively relates to loans and advances to customers.
The changes in the allowance for credit losses by business division and region is described in the report on opportunities and risks (see pages 158–160).
As at 31 December 2014, the Company had finance leases for ships, shipping containers, airplanes and aircraft engines with a total lease term between one and ten years. These leases are reported under loans and advances with a limited term, in an amount of €295.1 million (previous year: €375.1 million).
Notes to the statement of financial position
€ mn 2014 2013 %
Gross investment value 366.1 425.8 –14.0
thereof: within one year 65.3 72.4 –9.8
thereof:
within one to five years 231.9 203.0 14.2
thereof: after more
than five years 68.9 150.4 –54.2
Less unearned finance
income 71.0 50.7 40.0
Net investment 295.1 375.1 –21.3
Less present value
of residual values
without guarantee 17.1 13.5 26.7
Present value of
receivables from
minimum lease payments 278.0 361.6 –23.1
thereof: within one year 49.6 61.5 –19.3
thereof: within one to five years 176.1 172.4 2.1
thereof: after more
than five years 52.3 127.7 –59.0
Allowance for credit losses (€ mn)
Specific allowancefor credit losses
Portfolio-based allowancefor credit losses
Total
2014 2013 2014 2013 2014 2013
Allowance for credit losses as at 1 Jan 159.5 103.3 45.0 46.0 204.5 149.3
Additions1) 133.5 111.0 13.7 43.4 147.2 154.4
Utilisation –71.7 –25.0 – – –71.7 –25.0
Reversals –56.4 –24.9 –27.1 –44.4 –83.5 –69.3
Changes resulting
from exchange rate fluctuations
19.0
–4.9
3.4
0.0
22.4
–4.9
Allowance for
credit losses as at 31 Dec
183.9
159.5
35.0
45.0
218.9
204.5
1) The retrospective first-time application of IFRS 10 in the reporting year led to an increase of the previous year’s figure for additions to the specific allowance for credit losses of €0.8 million (see Note 1.1).
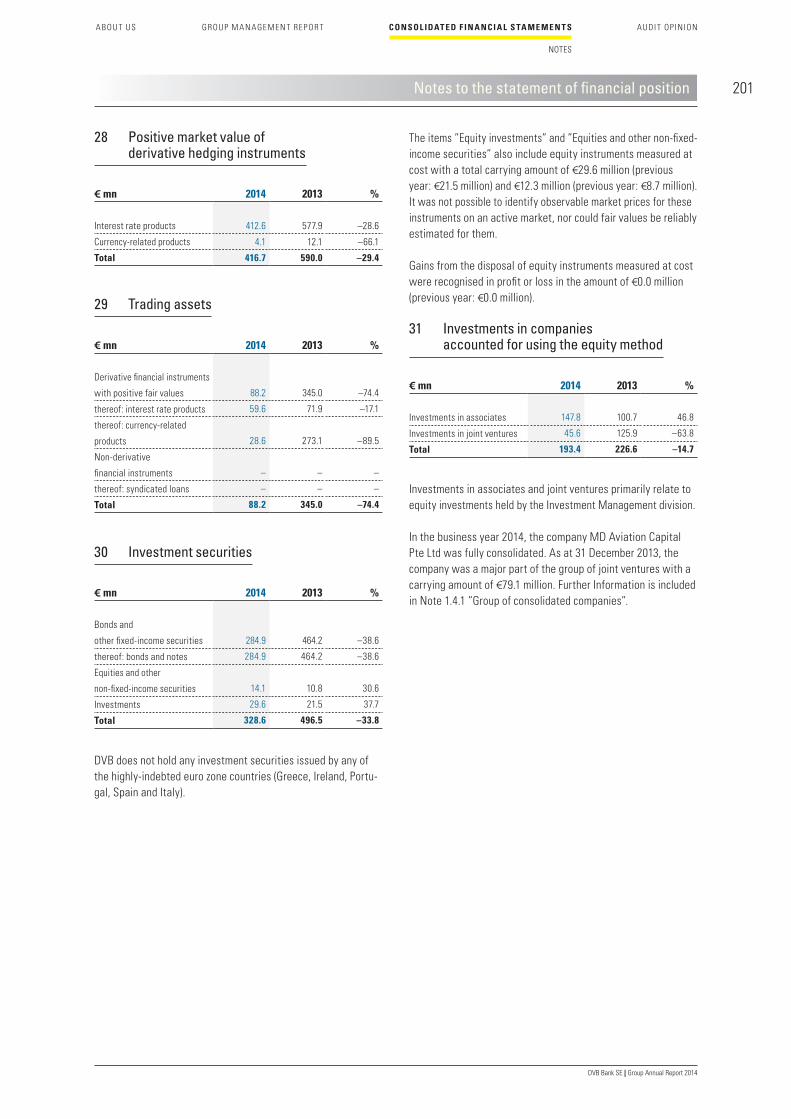
201
A B OU T US
GROUP M A N AGE MEN T RE P OR T
C ONSOL IDAT E D F IN A NC I A L S TA M E M E N T S
NOTES
AUDI T OP INION
DVB Bank SE | Group Annual Report 2014
28 Positive market value of derivative hedging instruments
29 Trading assets
30 Investment securities
DVB does not hold any investment securities issued by any of the highly-indebted euro zone countries (Greece, Ireland, Portu-gal, Spain and Italy).
The items ”Equity investments” and ”Equities and other non-fixed-income securities” also include equity instruments measured at cost with a total carrying amount of €29.6 million (previous year: €21.5 million) and €12.3 million (previous year: €8.7 million). It was not possible to identify observable market prices for these instruments on an active market, nor could fair values be reliably estimated for them.
Gains from the disposal of equity instruments measured at cost were recognised in profit or loss in the amount of €0.0 million (previous year: €0.0 million).
31 Investments in companies accounted for using the equity method
Investments in associates and joint ventures primarily relate to equity investments held by the Investment Management division.
In the business year 2014, the company MD Aviation Capital Pte Ltd was fully consolidated. As at 31 December 2013, the company was a major part of the group of joint ventures with a carrying amount of €79.1 million. Further Information is included in Note 1.4.1 ”Group of consolidated companies”.
Notes to the statement of financial position
€ mn 2014 2013 %
Interest rate products 412.6 577.9 –28.6
Currency-related products 4.1 12.1 –66.1
Total 416.7 590.0 –29.4
€ mn 2014 2013 %
Derivative financial instruments
with positive fair values 88.2 345.0 –74.4
thereof: interest rate products 59.6 71.9 –17.1
thereof: currency-related
products 28.6 273.1 –89.5
Non-derivative
financial instruments – – –
thereof: syndicated loans – – –
Total 88.2 345.0 –74.4
€ mn 2014 2013 %
Bonds and
other fixed-income securities 284.9 464.2 –38.6
thereof: bonds and notes 284.9 464.2 –38.6
Equities and other
non-fixed-income securities 14.1 10.8 30.6
Investments 29.6 21.5 37.7
Total 328.6 496.5 –33.8
€ mn 2014 2013 %
Investments in associates 147.8 100.7 46.8
Investments in joint ventures 45.6 125.9 –63.8
Total 193.4 226.6 –14.7
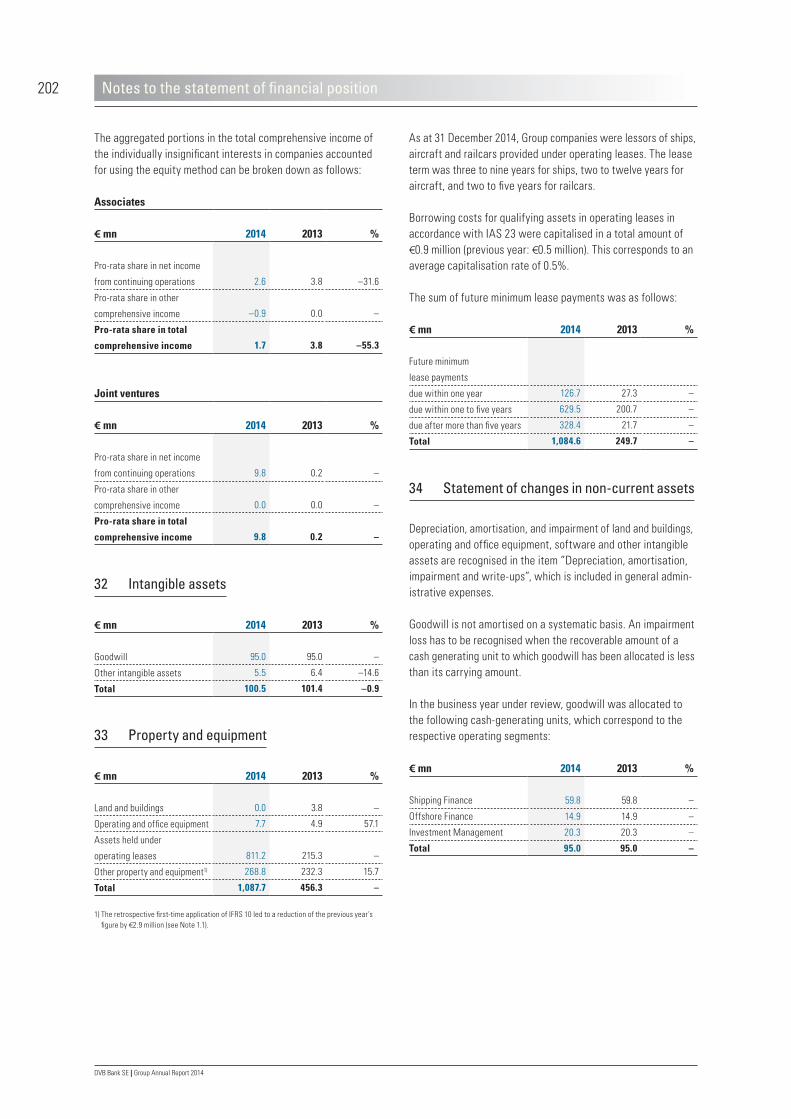
202
DVB Bank SE | Group Annual Report 2014
As at 31 December 2014, Group companies were lessors of ships, aircraft and railcars provided under operating leases. The lease term was three to nine years for ships, two to twelve years for aircraft, and two to five years for railcars.
Borrowing costs for qualifying assets in operating leases in accordance with IAS 23 were capitalised in a total amount of €0.9 million (previous year: €0.5 million). This corresponds to an average capitalisation rate of 0.5%.
The sum of future minimum lease payments was as follows:
34 Statement of changes in non-current assets
Depreciation, amortisation, and impairment of land and buildings, operating and office equipment, software and other intangible assets are recognised in the item ”Depreciation, amortisation, impairment and write-ups”, which is included in general admin-istrative expenses.
Goodwill is not amortised on a systematic basis. An impairment loss has to be recognised when the recoverable amount of a cash generating unit to which goodwill has been allocated is less than its carrying amount.
In the business year under review, goodwill was allocated to the following cash-generating units, which correspond to the respective operating segments:
The aggregated portions in the total comprehensive income of the individually insignificant interests in companies accounted for using the equity method can be broken down as follows:
32 Intangible assets
33 Property and equipment
€ mn 2014 2013 %
Goodwill 95.0 95.0 –
Other intangible assets 5.5 6.4 –14.6
Total 100.5 101.4 –0.9
€ mn 2014 2013 %
Land and buildings 0.0 3.8 –
Operating and office equipment 7.7 4.9 57.1
Assets held under
operating leases 811.2 215.3 –
Other property and equipment1) 268.8 232.3 15.7
Total 1,087.7 456.3 –
1) The retrospective first-time application of IFRS 10 led to a reduction of the previous year’s figure by €2.9 million (see Note 1.1).
Associates
€ mn 2014 2013 %
Pro-rata share in net income
from continuing operations 2.6 3.8 –31.6
Pro-rata share in other
comprehensive income –0.9 0.0 –
Pro-rata share in total
comprehensive income 1.7 3.8 –55.3
Joint ventures
€ mn 2014 2013 %
Pro-rata share in net income
from continuing operations 9.8 0.2 –
Pro-rata share in other
comprehensive income 0.0 0.0 –
Pro-rata share in total
comprehensive income 9.8 0.2 –
Notes to the statement of financial position
€ mn 2014 2013 %
Future minimum
lease payments
due within one year 126.7 27.3 –
due within one to five years 629.5 200.7 –
due after more than five years 328.4 21.7 –
Total 1,084.6 249.7 –
€ mn 2014 2013 %
Shipping Finance 59.8 59.8 –
Offshore Finance 14.9 14.9 –
Investment Management 20.3 20.3 –
Total 95.0 95.0 –

203
A B OU T US
GROUP M A N AGE MEN T RE P OR T
C ONSOL IDAT E D F IN A NC I A L S TA M E M E N T S
NOTES
AUDI T OP INION
DVB Bank SE | Group Annual Report 2014
The impairment tests performed as at the balance sheet date on the basis of the value in use did not result in any impairment losses. The value in use is determined on the basis of a medium-term, five-year projection for all material income and expense components. A constant earnings situation is assumed for periods of five years. The discount rates used are determined on the basis of the Capital Asset Pricing Model, which includes a risk-free interest rate, a market risk premium as well as a factor for the systematic risk (beta factor). The values for the risk-free interest rate, the market risk premium and the beta factor are determined using publicly accessible information sources. Busi-ness-specific beta factors are based on a group of listed peer companies with a similar business model.
The beta factors used for 2014 ranged between 1.21 and 2.00 (previous year: between 1.35 and 2.00). Therefore, the discount rates used in the business year 2014 for the cash-generating units range between 11.6% and 16.3% (previous year: 13.8% and 17.7%).
Other non-current assets include transport assets held for short-term rental (€236.0 million), maritime container boxes (€29.3 million) and assets under construction (€3.5 million).
Notes to the statement of financial position
Statement of changes in non-current assets (€ mn)
Land
and
buildings
Operating
and
office
equipment
Leased
assets
Other
property
and equip-
ment1)
Intangible
assets
(excl.
goodwill)
Goodwill
Total
Cost as at 1 Jan 2014 7.2 19.1 311.4 291.7 23.8 95.0 748.2
Additions at cost 0.0 4.6 648.8 103.4 0.6 – 757.4
Disposals at cost – –0.6 –107.0 –79.5 – – –187.1
Reclassifications – 0.3 – –1.1 0.8 – 0.0
Changes in the group of consolidated companies –7.2 0.0 –12.6 1.3 – – –18.5
Exchange rate changes – – 48.2 37.8 – – 86.0
Cost as at 31 Dec 2014 0.0 23.4 888.8 353.6 25.2 95.0 1,386.0
Write-ups – – 8.8 0.0 – – 8.8
Depreciation and amortisation 0.0 –2.0 –23.4 –16.0 –2.4 – –43.8
Impairment – – –9.2 –27.4 – – –36.6
Depreciation, amortisation and impairment
(previous years) –3.3 –14.3 –96.1 –59.4 –17.3 – –190.4
Depreciation, amortisation and impairment (disposals) – 0.6 38.8 26.9 – – 66.3
Changes in the group of consolidated companies 3.3 – 12.6 –1.3 – – 14.6
Exchange rate changes – – –9.1 –7.6 – – –16.7
Cumulative depreciation, amortisation,
impairment and write–ups 0.0 –15.7 –77.6 –84.8 –19.7 – –197.8
Carrying amount as at 31 Dec 2014 0.0 7.7 811.2 268.8 5.5 95.0 1,188.2
Carrying amount as at 31 Dec 2013 3.8 4.9 215.3 232.3 6.4 95.0 557.7
1) The retrospective first-time application of IFRS 10 led to a reduction of the opening balance of other property and equipment by €4.3 million. The previous year’s figure for depreciation, amortisation and impairment was adjusted by €1.4 million, while the carrying amount as at 31 December 2013 was adjusted by €2.9 million (see Note 1.1).

204
DVB Bank SE | Group Annual Report 2014
36 Other assets
In July 2010, DVB provided a US$175 million pre-delivery payment loan for the construction of ”Dalian Deepwater”, a sixth-genera-tion drillship, to Dalian Deepwater Developer Ltd, St Helier, Jersey, Channel Islands, a newly-established special purpose vehicle. In December 2012 and September 2013, additional amounts of US$25 million and US$6 million were provided. The company mentioned has been included in DVB’s consolidated financial statements in accordance with IFRS 10.
In July 2010, Dalian Deepwater Developer entered into a pur-chase agreement with Cosco, a group of shipyards, for delivery of a turnkey drillship. The shipyard company is building this sixth-generation drillship in its shipyard in Dalian, China.
The shipyard company did not deliver the ship as agreed by 15 April 2013. In addition, serious technical problems occurred during ship construction. The shipyard revised the estimated delivery date for the ship (31 March 2014).
As a result of the substantial delay and the uncertainty surround-ing the delivery date for the ship and the associated negative consequences for marketing the ship, Dalian Deepwater Developer terminated the agreement on the purchase of the drillship on 5 August 2013. The termination of the purchase agreement was made primarily on the basis of a unilateral breach of contract under English law on the part of the shipyard as well as on the basis of a contractual termination.
35 Income tax assets
Deferred tax assets amounting to €6.6 million (previous year: €4.4 million) were capitalised for tax loss carryforwards in the amount of €21.1 million (previous year: €14.3 million), based on tax planning calculations.
Deferred income tax assets were recognised for the following items of the statement of financial position:
We recognised deferred tax assets in the amount of €2.4 million (previous year: €2.4 million) directly in equity.
Notes to the statement of financial position
€ mn 2014 2013 %
Current income tax assets
Germany 0.6 0.7 –14.3
Foreign countries 4.4 4.7 –6.4
Deferred income tax assets
Temporary differences 88.2 39.5 –
Loss carryforward 6.6 4.4 50.0
Total 99.8 49.3 –
€ mn 2014 2013 %
Loans and advances to
banks and customers 2.6 4.1 –36.6
Trading assets 0.1 9.1 –98.9
Deposits from
banks and customers 71.3 16.6 –
Provisions 4.7 3.5 34.3
Other items 9.6 6.3 52.4
Total 88.3 39.6 –
€ mn 2014 2013 %
Receivables from
non-deductible taxes 4.6 4.8 –4.2
Advance payments
and prepaid expenses 2.7 1.4 92.9
Miscellaneous other assets 107.4 142.9 –24.8
Total 114.7 149.1 –23.1

205
A B OU T US
GROUP M A N AGE MEN T RE P OR T
C ONSOL IDAT E D F IN A NC I A L S TA M E M E N T S
NOTES
AUDI T OP INION
DVB Bank SE | Group Annual Report 2014
On 5 September 2013, the legal counsel of Dalian Deepwater Developer filed a motion to initiate arbitration proceedings at the London Court of International Arbitration. This motion was fol-lowed by a letter from Dalian Deepwater Developer’s lawyers to the shipyard in which the reasons for the termination of the pur-chase agreement were set out, and a claim for damages was made for an amount of US$215.6 million, which was due to be paid not later than 30 September 2013.
At the end of November 2013, the shipyard offered payment of a first instalment plus interest accrued in a total amount of US$117 million. On 27 December 2013, Dalian Deepwater Devel-oper accepted the offer, confirming that the claim for damages had not been settled. On 14 January 2014, the shipyard made a down payment to Dalian Deepwater Developer in the amount of US$110 million, followed by a further down payment of US$6.9 million on 17 January 2014.
On 7 February 2014, the shipyard filed a written defence and counterclaim rejecting any obligations in addition to the pay-ments already made.
In a preliminary hearing before the arbitration court on 15 July 2014, a positive decision was made as to the termination of the purchase agreement pursuant to which the damage resulting from the termination of the purchase agreement is not limited to the payment already made by Cosco in January 2014 (US$116.9 million). The main trial before the arbitration court is scheduled for 23 February 2015.
As at 31 December 2014, the lawyers commissioned by Dalian Deepwater Developer were confident of a favourable outcome of the arbitration proceedings concerning the company. With reference to the probabilities confirmed by the lawyers, the claim for damages had a discounted value of US$156.1 million as at 31 December 2014, which was offset against payments already received in the amount of US$116.9 million. The discount rate used was 6.0922%, based on a term of 14 months for the arbitration proceedings.
37 Deposits from other banks
Notes to the statement of financial position
€ mn 2014 2013 %
Loans and advances 2,855.8 3,621.4 –21.1
thereof: payable on demand 162.4 548.8 –70.4
thereof: with a limited term 2,693.4 3,072.6 –12.3
Money market transactions 202.7 162.2 25.0
thereof: payable on demand – – –
thereof: with a limited term 202.7 162.2 25.0
Total 3,058.5 3,783.6 –19.2
German banks 2,686.6 3,480.3 –22.8
Foreign banks 371.9 303.3 22.6
Total 3,058.5 3,783.6 –19.2

206
DVB Bank SE | Group Annual Report 2014
40 Negative fair values of derivative hedging instruments
41 Trading liabilities
38 Deposits from customers
39 Securitised liabilities
The nominal value of the ship covered bonds issued totals €486.2 million.
Notes to the statement of financial position
€ mn 2014 2013 %
Ship covered bonds 492.1 695.8 –29.3
Bearer bonds 10,813.7 10,438.7 3.6
Total 11,305.8 11,134.5 1.5
€ mn 2014 2013 %
Interest rate products 164.6 285.1 –42.3
Currency-related products 28.0 1.6 –
Other products 0.0 0.0 –
Total 192.6 286.7 –32.8
€ mn 2014 2013 %
Derivative financial instruments
with negative fair values 604.5 107.1 –
thereof: interest rate products 78.6 96.0 –18.1
thereof:
currency-related products 525.9 11.1 –
Total 604.5 107.1 –
€ mn 2014 2013 %
Loans and advances 7,058.6 6,071.3 16.3
thereof: payable on demand 551.1 320.8 71.8
thereof: with a limited term 6,507.5 5,750.5 13.2
Money market transactions 30.3 34.4 –11.9
thereof: payable on demand – – –
thereof: with a limited term 30.3 34.4 –11.9
Other deposits from customers 8.1 7.9 2.5
Total 7,097.0 6,113.6 16.1
German customers 6,398.4 5,772.7 10.8
Foreign customers 698.6 340.9 –
Total 7,097.0 6,113.6 16.1

207
A B OU T US
GROUP M A N AGE MEN T RE P OR T
C ONSOL IDAT E D F IN A NC I A L S TA M E M E N T S
NOTES
AUDI T OP INION
DVB Bank SE | Group Annual Report 2014
42 Provisions
Provisions for defined benefit obligations mainly consist of pen-sion plans which are – with the exception of US plans – closed to new entries. Additional defined benefit obligations only exist for members of the Board of Managing Directors or executives. Newly-hired employees in Germany, Norway and the Nether-lands are exclusively offered defined contribution plans. These plans do not require provisions to be recognised.
The pension plans in the Netherlands were changed at the end of 2014. This change is reflected in the actuarial assumptions used for the preparation of the consolidated financial statements 2014.
The total obligation from defined benefit plans can be classified into the following risk classes:
The final salary plans refer to pension commitments made by the employer for the benefit of the employee. The amount of the pension commitment depends on the final salary prior to the date when benefits fall due. Since lifelong benefit payments have
to be assumed in this context, the main risk factors for final salary plans are longevity, salary increases, inflation rate and discount rate.
The present value of the defined benefit obligations changed as follows:
The interest expense of €1.5 million (previous year: €1.4 million) was recorded under staff expenses.
Notes to the statement of financial position
€ mn 2014 2013 %
Provisions for
pension obligations 21.6 19.7 9.6
Provisions for early and
partial retirement plans 0.9 1.0 –10.0
Other provisions 42.6 41.8 1.9
Total 65.1 62.5 4.2
Risk classes (€ mn)
Germany Foreign countries Total2014 2013 2014 2013 2014 2013
Final salary plans 16.2 14.8 31.2 26.0 47.4 40.8
Contribution-based defined benefit plans – – 3.4 2.3 3.4 2.3
Accessory plans – – 4.2 3.4 4.2 3.4
Total 16.2 14.8 38.8 31.7 55.0 46.5
€ mn 2014 2013 %
Present value of
defined benefit pension
liabilities as at 1 Jan 46.5 43.9 5.9
Current service cost 0.0 3.0 –
Interest cost 1.5 1.4 7.1
Contributions by employees – – –
Pension payments made –1.4 –1.7 –17.6
Actuarial gains and losses 8.5 0.2 –
thereof: from changes in
demographic assumptions 0.0 –0.3 –
thereof: from changes in
financial assumptions 8.9 0.3 –
thereof: experience
adjustments –0.4 0.2 –
Currency translation
differences –0.1 –0.3 –66.7
Present value of
defined benefit obligation
as at 31 Dec 55.0 46.5 18.3
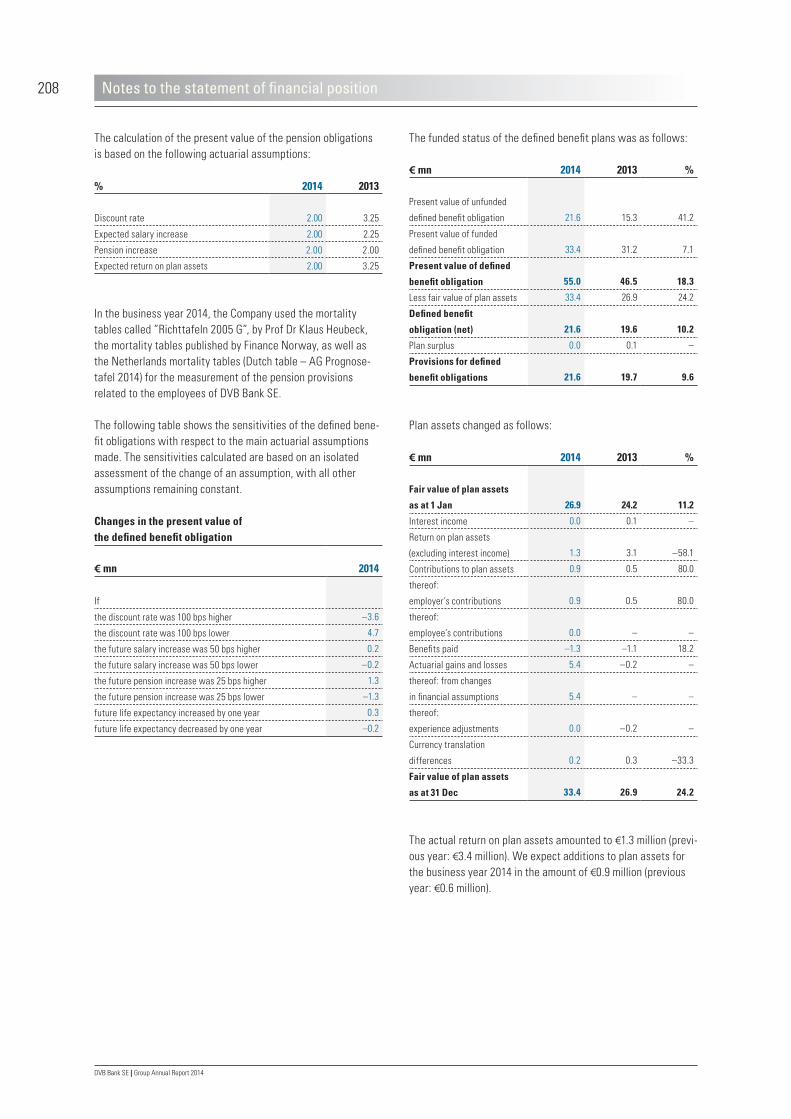
208
DVB Bank SE | Group Annual Report 2014
The funded status of the defined benefit plans was as follows:
Plan assets changed as follows:
The actual return on plan assets amounted to €1.3 million (previ-ous year: €3.4 million). We expect additions to plan assets for the business year 2014 in the amount of €0.9 million (previous year: €0.6 million).
The calculation of the present value of the pension obligations is based on the following actuarial assumptions:
In the business year 2014, the Company used the mortality tables called ”Richttafeln 2005 G”, by Prof Dr Klaus Heubeck, the mortality tables published by Finance Norway, as well as the Netherlands mortality tables (Dutch table – AG Prognose-tafel 2014) for the measurement of the pension provisions related to the employees of DVB Bank SE.
The following table shows the sensitivities of the defined bene-fit obligations with respect to the main actuarial assumptions made. The sensitivities calculated are based on an isolated assessment of the change of an assumption, with all other assumptions remaining constant.
Notes to the statement of financial position
% 2014 2013
Discount rate 2.00 3.25
Expected salary increase 2.00 2.25
Pension increase 2.00 2.00
Expected return on plan assets 2.00 3.25
Changes in the present value of the defined benefit obligation
€ mn 2014
If
the discount rate was 100 bps higher –3.6
the discount rate was 100 bps lower 4.7
the future salary increase was 50 bps higher 0.2
the future salary increase was 50 bps lower –0.2
the future pension increase was 25 bps higher 1.3
the future pension increase was 25 bps lower –1.3
future life expectancy increased by one year 0.3
future life expectancy decreased by one year –0.2
€ mn 2014 2013 %
Present value of unfunded
defined benefit obligation 21.6 15.3 41.2
Present value of funded
defined benefit obligation 33.4 31.2 7.1
Present value of defined
benefit obligation 55.0 46.5 18.3
Less fair value of plan assets 33.4 26.9 24.2
Defined benefit
obligation (net) 21.6 19.6 10.2
Plan surplus 0.0 0.1 –
Provisions for defined
benefit obligations 21.6 19.7 9.6
€ mn 2014 2013 %
Fair value of plan assets
as at 1 Jan 26.9 24.2 11.2
Interest income 0.0 0.1 –
Return on plan assets
(excluding interest income) 1.3 3.1 –58.1
Contributions to plan assets 0.9 0.5 80.0
thereof:
employer’s contributions 0.9 0.5 80.0
thereof:
employee’s contributions 0.0 – –
Benefits paid –1.3 –1.1 18.2
Actuarial gains and losses 5.4 –0.2 –
thereof: from changes
in financial assumptions 5.4 – –
thereof:
experience adjustments 0.0 –0.2 –
Currency translation
differences 0.2 0.3 –33.3
Fair value of plan assets
as at 31 Dec 33.4 26.9 24.2

209
A B OU T US
GROUP M A N AGE MEN T RE P OR T
C ONSOL IDAT E D F IN A NC I A L S TA M E M E N T S
NOTES
AUDI T OP INION
DVB Bank SE | Group Annual Report 2014
The plan assets attributable to active members as at the report-ing date consisted of the following types of investments:
Other pension plan sponsors comprise exclusively insurance companies; a risk concentration of individual plan assets can thus be excluded.
The age structure of persons covered by defined-benefit pension obligations is as follows:
Other provisions in the Group are as follows:
The provisions for bonuses mainly refer to bonus payments to employees of DVB, and are likely to result in an outflow of resources in the following business year.
Notes to the statement of financial position
% 2014 2013
Other pension plan sponsors 100.0 100.0
Fixed-income financial instruments – –
Property – –
Equities – –
Total 100.0 100.0
Below 50 years
Between 50 and
60 years
Over 60 years
Total
Active employees 29 15 10 54
Former employees 75 33 14 122
Pensioners 1 1 77 79
Total 105 49 101 255
€ mn 2014 2013 %
Asset retirement obligations 1.0 1.0 –
Lending business 0.1 0.1 –
Bonuses 27.1 26.9 0.7
Restructuring provisions 0.7 3.5 –80.0
Litigation 0.1 0.0 –
Miscellaneous other provisions 13.6 10.3 32.0
Total 42.6 41.8 1.9
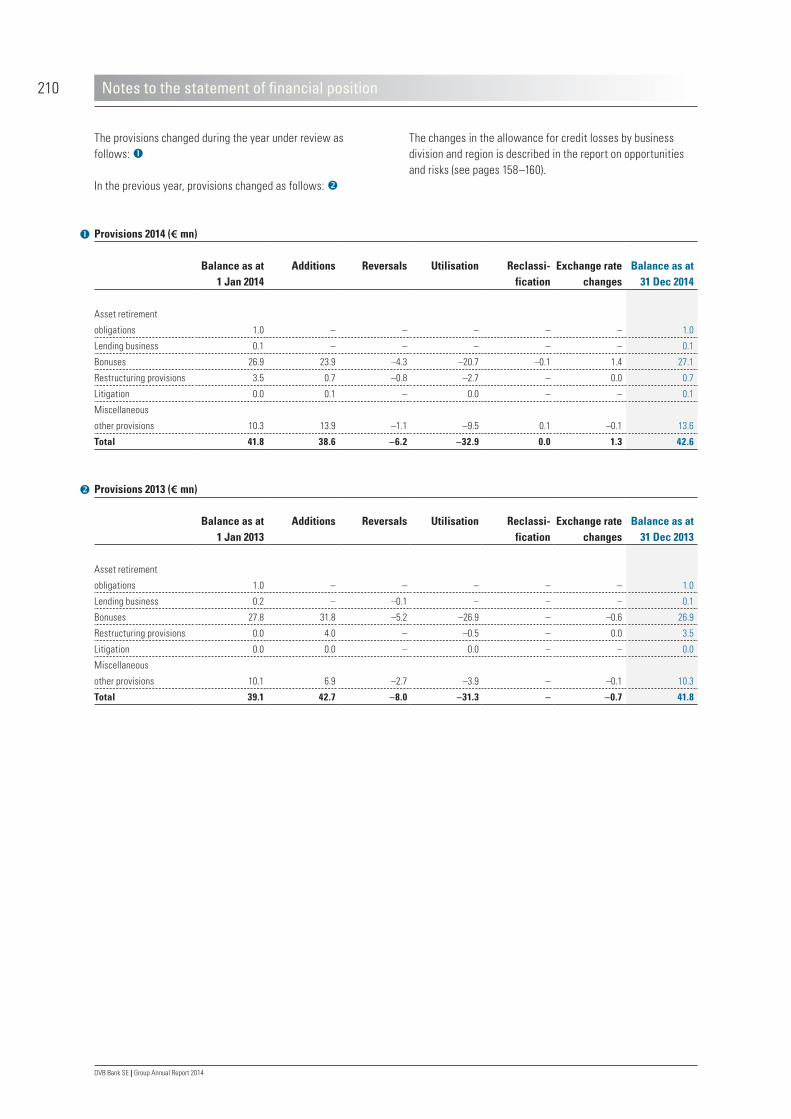
210
DVB Bank SE | Group Annual Report 2014
The changes in the allowance for credit losses by business division and region is described in the report on opportunities and risks (see pages 158–160).
The provisions changed during the year under review as follows:
In the previous year, provisions changed as follows:
Notes to the statement of financial position
Provisions 2014 (€ mn)
Balance as at 1 Jan 2014
Additions Reversals Utilisation Reclassi-fication
Exchange ratechanges
Balance as at 31 Dec 2014
Asset retirement
obligations 1.0 – – – – – 1.0
Lending business 0.1 – – – – – 0.1
Bonuses 26.9 23.9 –4.3 –20.7 –0.1 1.4 27.1
Restructuring provisions 3.5 0.7 –0.8 –2.7 – 0.0 0.7
Litigation 0.0 0.1 – 0.0 – – 0.1
Miscellaneous
other provisions 10.3 13.9 –1.1 –9.5 0.1 –0.1 13.6
Total 41.8 38.6 –6.2 –32.9 0.0 1.3 42.6
Provisions 2013 (€ mn)
Balance as at 1 Jan 2013
Additions Reversals Utilisation Reclassi-fication
Exchange ratechanges
Balance as at 31 Dec 2013
Asset retirement
obligations 1.0 – – – – – 1.0
Lending business 0.2 – –0.1 – – – 0.1
Bonuses 27.8 31.8 –5.2 –26.9 – –0.6 26.9
Restructuring provisions 0.0 4.0 – –0.5 – 0.0 3.5
Litigation 0.0 0.0 – 0.0 – – 0.0
Miscellaneous
other provisions 10.1 6.9 –2.7 –3.9 – –0.1 10.3
Total 39.1 42.7 –8.0 –31.3 – –0.7 41.8

211
A B OU T US
GROUP M A N AGE MEN T RE P OR T
C ONSOL IDAT E D F IN A NC I A L S TA M E M E N T S
NOTES
AUDI T OP INION
DVB Bank SE | Group Annual Report 2014
43 Income tax liabilities
Deferred income tax liabilities were recognised for the follow-ing items of the statement of financial position:
Deferred tax liabilities were recognised in the amount of €–8.5 million (previous year: €7.5 million) directly in equity.
44 Other liabilities
45 Subordinated liabilities
46 Equity
Equity can be broken down as follows:
46.1 Issued share capital (disclosures pursuant to section 315 (4) nos. 1 and 3 of the HGB)
As at the balance sheet date, the fully paid share capital of DVB Bank SE amounted to €118,791,945.12, pursuant to section 4 (1) of the Memorandum and Articles of Association, and consisted of 46,467,370 no-par value shares. These shares exclusively con-sisted of ordinary bearer shares. Please refer to sections 54 et. seq. of the AktG regarding the rights and duties attaching to such shares. DZ BANK held a share of 95.45% in the share capital of DVB Bank SE. The remaining shares (4.55%) were in free float.
46.2 Authorisations (disclosures pursuant to section 315 (4) no. 7 of the HGB)
The following authorisations exist:
• Subject to the approval of the Supervisory Board, the Board of Managing Directors is authorised to increase the Company’s issued share capital, on one or more occasions until 11 June 2019, by up to a total amount of €50 million via issuance of new no-par value shares for contribution in cash (Authorised Capital 2014, section 4 (2) of the Memorandum and Articles of Association). In general, the shareholders must be granted subscription rights.
Notes to the statement of financial position
€ mn 2014 2013 %
Current income tax liabilities 23.4 20.7 13.0
Deferred income tax liabilities 52.2 11.3 –
Total 75.6 32.0 –
€ mn 2014 2013 %
Loans and advances to banks
and customers, including
allowance for credit losses 13.2 – –
Investment securities 0.4 1.6 –75.0
Trading assets 24.0 – –
Property and equipment 0.0 0.2 –
Other items 14.6 9.5 53.7
Total 52.2 11.3 –
€ mn 2014 2013 %
Other tax liabilities 0.8 2.0 –60.0
Miscellaneous other liabilities1) 186.3 78.4 –
Total 187.1 80.4 –
1) The retrospective first-time application of IFRS 10 led to a change of the previous year’s figure by €0.1 million (see Note 1.1).
€ mn 2014 2013 %
Subordinated promissory
note loans 261.4 231.9 12.7
Subordinated bearer bonds 225.8 131.8 71.3
Total 487.2 363.7 34.0
€ mn 2014 2013 %
Issued share capital 116.6 116.7 –0.1
Capital reserve 320.6 321.3 –0.2
Retained earnings1) 974.6 919.1 6.0
Revaluation reserve 7.2 7.7 –6.5
Reserve from cash flow hedges –15.9 6.1 –
Reserve from
net investment hedges –8.2 2.4 –
Currency translation reserve 14.4 –2.9 –
Distributable profit 27.9 27.9 –
Total equity before
non-controlling interests 1,437.2 1,398.3 2.8
Non-controlling interests 0.2 1.0 –80.0
Total 1,437.4 1,399.3 2.7
1) The retrospective first-time application of IFRS 10 led to a change of retained earnings by €0.4 million (see Note 1.1).

212
DVB Bank SE | Group Annual Report 2014
Other retained earnings comprise the undistributed profits of the Group, including the cumulative amounts resulting from con-solidation adjustments recognised in profit or loss. Of the other retained earnings, an amount of €11.4 million (previous year: €10.9 million) was not distributable pursuant to section 268 (8) sentence 2 of the HGB.
In addition, retained earnings also include the fund for general banking risks totalling €82.4 million (previous year: €82.4 million).
46.6 Revaluation reserve
The revaluation reserve includes the changes in the fair value of financial assets available for sale, taking into account deferred taxes.
46.7 Reserve from cash flow hedges
The reserve from cash flow hedges includes measurement gains or losses from hedging instruments attributable to the effective portion of the hedging relationship, taking into account deferred taxes. The cash flows hedged through the hedging relationship will mainly be received by the Company in the following busi-ness year.
46.8 Reserve from net investment hedges
DVB uses foreign exchange forwards to hedge the currency translation risk from net investments in foreign operations with a different functional currency. The reserve from net investment hedges includes measurement gains or losses from hedging instruments attributable to the effective portion of the hedging relationship, taking into account deferred taxes.
46.9 Currency translation reserve
Currency translation differences resulting from the translation of financial statements of Group companies denominated in a foreign currency into euro (the Group currency) are recognised in the currency translation reserve.
46.10 Non-controlling interests
Non-controlling interests include the interest in equity of sub-sidiaries not attributable to DVB.
• Subject to the approval of the Supervisory Board, the Board of Managing Directors is authorised to issue, on one or more occasion until 11 June 2019, registered convertible bonds and/or bonds cum warrants (or combinations thereof) up to an amount of €25 million with a limited or an unlimited term, and to grant to the holders or creditors of bond conversion or option rights with regard to notional no-par value shares of the Company pursuant to the terms and conditions of the convertible bonds and the bonds cum warrants, respectively (Conditional Capital 2014; section 4 (3) of the Memorandum and Articles of Association).
• In accordance with section 71 (1) no. 7 of the AktG, DVB Bank SE is authorised to purchase and sell its own shares (treasury shares) for the purpose of securities trading. This authorisation will expire on 11 June 2019. According to this authorisation, the volume of the shares to be purchased at the end of a day may not exceed 5 % of the Bank’s share capital. The price for which treasury shares may be purchased must not be below the closing price for the relevant shares on the Frankfurt Stock Exchange on the trading day prior to the pur-chase, less 10%. The highest price for treas-ury shares must not exceed the closing price plus 10%.
46.3 Capital reserve
The capital reserve includes the premium from the issuance of shares, including subscription rights, exceeding the nominal value or the imputed value.
46.4 Treasury shares
As at 31 December 2014, DVB Bank SE held a total of 864,664 treasury shares at a carrying amount of €21,427,453.29, which were deducted from equity using the par value method. For this purpose, the treasury shares are divided into the components ”Issued share capital” and ”Capital reserve”. Gains or losses arising from transactions with treasury shares are offset against retained earnings.
46.5 Retained earnings
Retained earnings include the legal reserve, other retained earnings, as well as the fund for general banking risks.
The legal reserve amounted to €1.3 million (previous year: €1.3 million) and is subject to restrictions with regard to distri-bution to shareholders.
Notes to the statement of financial position

213
A B OU T US
GROUP M A N AGE MEN T RE P OR T
C ONSOL IDAT E D F IN A NC I A L S TA M E M E N T S
NOTES
AUDI T OP INION
DVB Bank SE | Group Annual Report 2014
47 Classes and categories of financial instruments
The carrying amounts and fair values of financial assets and financial liabilities were allocated to the classes and categories (or subcategories) of financial instruments as indicated in the tables below:
Notes to financial instruments
2014 2013 € mn
Carrying amount
Fair value Carrying amount
Fair value
Financial assets held for trading 88.2 88.2 345.0 345.0
thereof: trading assets 88.2 88.2 345.0 345.0
Financial assets designated as at fair value through profit or loss – – – –
thereof: loans and advances to banks – – – –
thereof: loans and advances to customers – – – –
thereof: investment securities – – – –
Derivative hedging instruments 416.7 416.7 590.0 590.0
thereof: positive fair values of derivative hedging instruments 416.7 416.7 590.0 590.0
Financial assets available for sale 286.7 286.7 420.5 420.5
thereof: investment securities 286.7 286.7 420.5 420.5
Financial assets measured at fair value 791.6 791.6 1,355.5 1,355.5
Loans and receivables 21,786.2 22,288.8 20,620.1 20,916.3
thereof: cash and balances with the central bank 175.5 175.5 2,040.5 2,040.5
thereof: loans and advances to banks 1,491.6 1,491.6 212.3 212.3
thereof: loans and advances to customers1) 20,119.0 20,621.7 18,321.4 18,615.9
thereof: investment securities – – 45.9 47.6
Financial assets available for sale 41.9 41.9 30.1 30.1
thereof: investment securities 41.9 41.9 30.1 30.1
Other assets 61.5 61.5 21.4 21.4
Financial assets measured at amortised cost 21,889.6 22,392.2 20,671.6 20,967.8
Finance leases 295.1 286.5 375.1 358.7
thereof: loans and advances to customers 295.1 286.5 375.1 358.7
Other financial assets 286.5 259.0 375.1 358.7
1) The retrospective first-time application of IFRS 10 led to a change of the previous year’s figures by €3.3 million (see Note 1.1).

214
DVB Bank SE | Group Annual Report 2014
As at year-end, financial collateral (before offsetting) was provided in the amount of €526.9 million (previous year: €539.1 million), and financial collateral received amounted to €602.1 million (previous year: €79.2 million). Both the collateral pledged as well as the collateral received was agreed upon exclusively as cover for derivative financial instruments entered into.
48 Financial assets and liabilities offset/not offset
Notes to financial instruments
2014 2013 € mn
Carrying amount
Fair value Carrying amount
Fair value
Financial liabilities held for trading 604.5 604.5 107.1 107.1
thereof: trading liabilities 604.5 604.5 107.1 107.1
thereof: other liabilities – – – –
Fair value option – – – –
thereof: deposits from other banks – – – –
thereof: deposits from customers – – – –
thereof: securitised liabilities – – – –
thereof: subordinated liabilities – – – –
Derivative hedging instruments 192.6 192.6 286.7 286.7
Negative fair values of derivative hedging instruments 192.6 192.6 286.7 286.7
Financial liabilities measured at fair value 797.1 797.1 393.8 393.8
Deposits from other banks 3,058.5 3,084.8 3,783.6 3,764.6
Deposits from customers 7,097.0 7,081.9 6,113.6 6,166.2
Securitised liabilities 11,305.8 11,588.3 11,134.5 11,323.3
Other liabilities 114.6 114.6 26.3 26.3
Subordinated liabilities 487.2 518.0 363.7 394.3
Financial liabilities measured at amortised cost 22,063.1 22,387.5 21,421.7 21,674.7
Finance leases – – – –
thereof: deposits from customers – – – –
Other financial liabilities – – – –
Amounts withunrecognised offsetting
agreementsGross amount
of financial instruments
not offset
Offsetting
Net amountsof items
carried on thebalance sheet
Financialinstruments
Amounts of cash collateral
received/provided
Net amountof financialinstruments
not offset€ mn 2014 2013 2014 2013 2014 2013 2014 2013 2014 2013 2014 2013
Positive fair values
of derivative
financial instruments 1,018.6 935.0 –513.8 – 504.8 935.0 –224.3 –373.9 –92.5 –459.9 188.0 101.2
Negative market values
of derivative
financial instruments 818.7 393.8 –21.6 – 797.1 393.8 –224.3 –373.9 –443.5 – 129.3 19.9

215
A B OU T US
GROUP M A N AGE MEN T RE P OR T
C ONSOL IDAT E D F IN A NC I A L S TA M E M E N T S
NOTES
AUDI T OP INION
DVB Bank SE | Group Annual Report 2014
49 Determination of fair values of financial instruments
The fair value is defined as the price that would be received to sell an asset or paid to transfer a liability in an orderly transaction between market participants at the measurement date.
The fair value of financial instruments which are listed on an active market is determined on the basis of market prices. The fair value of shares in funds is determined using the redemption price as published by the investment company. The fair values of these financial instruments are allocated to Level 1.
The fair value of financial instruments which are not listed on an active market is determined on the basis of accepted valuation models used uniformly throughout all classes. To the extent that the measurement models use inputs that are largely observable on the market, the resulting fair values are allocated to Level 2. To the extent that the measurement models use inputs that are largely not observable on the market, the resulting fair values are allocated to Level 3.
Non-derivative financial instruments as well as derivative finan-cial instruments with no option components are measured using the Discounted Cash Flow method (DCF). Currency-specific swap curves are used to determine the discount rate. Derivative finan-cial instruments with option components are measured using accepted option pricing models (Black-Scholes-/Black-76-model) using implied volatilities that can be observed on the market. The measurement models use parameters that largely can be observed on the market. Since November 2012, the fair value of Level 2 financial instruments has been deter-mined using forward curves with consistent tenors. The forward rate curves are structured based on homogeneous tenors.
Moreover, Level 2 derivative financial instruments which form part of existing hedges are discounted on the basis of overnight index swap rates. Where the currency of the hedge differs from the transaction currency, the cross-currency basis spread is taken into account additionally for the purpose of determining fair value. The measurement adjustment is applied prospectively and cor-responds to an adjustment to the current market standard.
The fair value of over-the-counter derivative financial instruments is measured using the net risk exposure, using the exception provided in IFRS 13.48. In the first step, credit risk is not taken into account. In a second step, credit risk exposure from deriva-tive financial instruments is recorded after determining the net risk exposure. Credit valuation adjustments (CVA) and debit valu-ation adjustments (DVA) are applied to derivative financial instruments, whereby the instruments at hand are largely non-optional. A semi-analytical approach is applied to determine CVA/DVA, calculating the relevant values using economic loss rates as well as probabilities of default matching the terms of the instruments. The CVA amounts are determined based on the formula per netting set specified in the draft Accounting Principle issued by the Institute of Public Auditors in Germany ERS HFA 47 No. 96. The CVA particularly reflects the expected exposures per netting set. The expected exposures per netting set are used to approximate the expected exposures per instru-ment and accordingly to allow the determination of the CVA amounts for individual transactions. The DVA amounts are allo-cated by analogy on the basis of the expected negative exposure.
In addition, a liquidity spread derived from market parameters is applied for the valuation of non-derivative liabilities.
The essential input factor which cannot be directly derived from market parameters is the credit spread, which is calculated based on the expected probabilities of default published by Standard & Poor’s.
During the year under review, there were no reclassifications between the individual levels of financial instruments measured at fair value through profit or loss. For certain classes of financial instruments (cash and balances with the central bank, loans and advances to banks, other assets and other liabilities), the fair value is stated as the carrying amount, as an approximation.
Notes to financial instruments

216
DVB Bank SE | Group Annual Report 2014
The fair values of the financial instruments measured at amortised cost were allocated to the following levels:
The fair values of the financial instruments measured at fair value were allocated to the following levels:
Notes to financial instruments
Determination of the fair values of financial instruments measured at fair value (€ mn)
Level 1 Level 2 Level 32014 2013 2014 2013 2014 2013
Loans and advances to banks – – – – – –
Loans and advances to customers – – – – – –
Trading assets – – 88.2 345.0 – –
Positive fair values of derivative
hedging instruments – – 416.7 590.0 – –
Investment securities 286.7 420.5 – – – –
Assets measured at fair value 286.7 420.5 504.9 935.0 – –
Deposits from other banks – – – – – –
Deposits from customers – – – – – –
Trading liabilities – – 604.5 107.1 – –
Negative fair values of derivative
hedging instruments – – 192.5 286.6 – –
Subordinated liabilities – – – – – –
Liabilities measured at fair value – – 797.0 393.7 – –
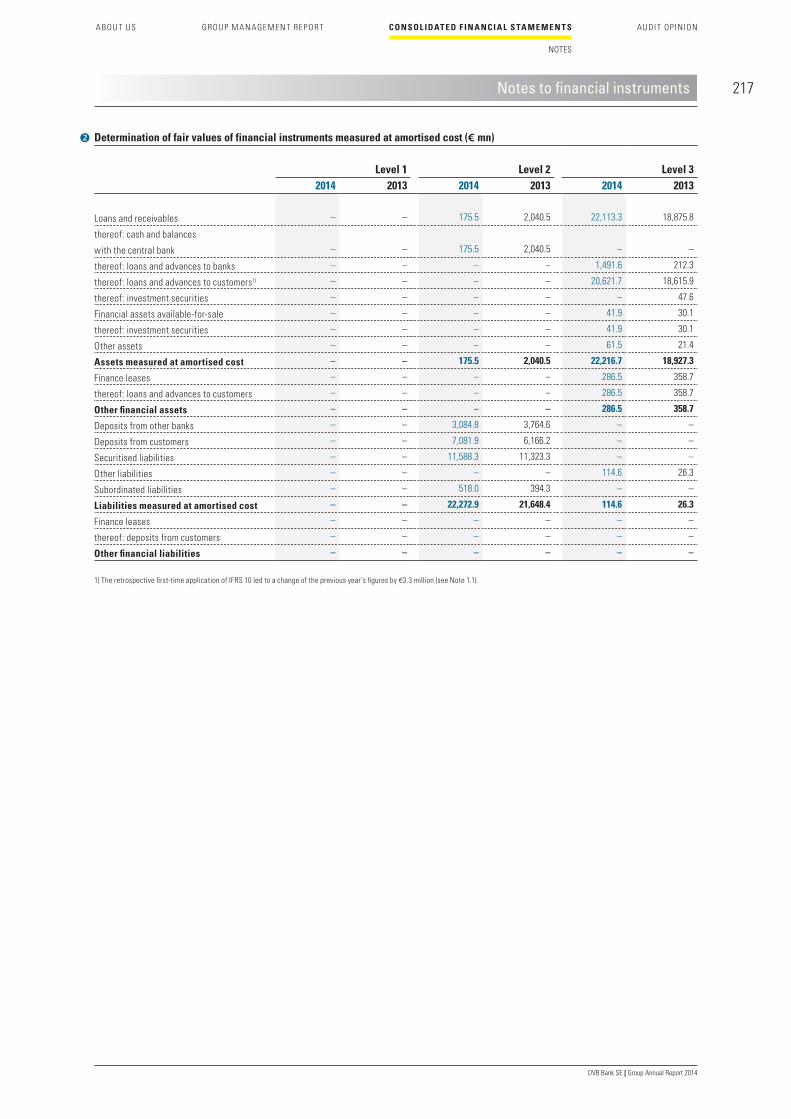
217
A B OU T US
GROUP M A N AGE MEN T RE P OR T
C ONSOL IDAT E D F IN A NC I A L S TA M E M E N T S
NOTES
AUDI T OP INION
DVB Bank SE | Group Annual Report 2014
Notes to financial instruments
Determination of fair values of financial instruments measured at amortised cost (€ mn)
Level 1 Level 2 Level 32014 2013 2014 2013 2014 2013
Loans and receivables – – 175.5 2,040.5 22,113.3 18,875.8
thereof: cash and balances
with the central bank – – 175.5 2,040.5 – –
thereof: loans and advances to banks – – – – 1,491.6 212.3
thereof: loans and advances to customers1) – – – – 20,621.7 18,615.9
thereof: investment securities – – – – – 47.6
Financial assets available-for-sale – – – – 41.9 30.1
thereof: investment securities – – – – 41.9 30.1
Other assets – – – – 61.5 21.4
Assets measured at amortised cost – – 175.5 2,040.5 22,216.7 18,927.3
Finance leases – – – – 286.5 358.7
thereof: loans and advances to customers – – – – 286.5 358.7
Other financial assets – – – – 286.5 358.7
Deposits from other banks – – 3,084.8 3,764.6 – –
Deposits from customers – – 7,081.9 6,166.2 – –
Securitised liabilities – – 11,588.3 11,323.3 – –
Other liabilities – – – – 114.6 26.3
Subordinated liabilities – – 518.0 394.3 – –
Liabilities measured at amortised cost – – 22,272.9 21,648.4 114.6 26.3
Finance leases – – – – – –
thereof: deposits from customers – – – – – –
Other financial liabilities – – – – – –
1) The retrospective first-time application of IFRS 10 led to a change of the previous year’s figures by €3.3 million (see Note 1.1).

218
DVB Bank SE | Group Annual Report 2014
amounts were €1.3 million (previous year: €1.2 million) in the reporting year. Taking currency translation effects of €–0.8 million (previous year: €–0.3 million) into account, the closing balance was €6.4 million (previous year: €6.9 million).
50 Unrecognised differences upon initial recognition
Unrecognised gains upon initial recognition in 2011 resulted from the purchase of financial assets. The related amortisation
Notes to financial instruments
1 Jan 2013 – 31 Dec 2013 (€ mn)
Recognition in the income statement
Recognition
in equity
Total
Net interest
income
Allowance for
credit losses
Net fee and
commission
income
Net result
from financial
instruments
in accordance
with IAS 39
Measurement
result
Financial assets and liabilities designated
as at fair value through profit or loss – – – – – –
Financial assets and liabilities held for trading –33.2 – – 19.1 – –14.1
Loans and receivables 692.2 –87.9 98.5 146.7 – 849.5
Financial assets available-for-sale 5.5 – – 1.3 5.5 12.3
Other liabilities –553.3 – – – – –553.3
Positive and negative fair values
of derivative hedging instruments 89.8 – – –148.9 14.5 –44.6
Total 201.0 –87.9 98.5 18.2 20.0 249.8
1) Retrospective application of IFRS 10 resulted in an adjustment of the previous year’s figure.
51 Earnings contributions of financial instruments by measurement categories
1 Jan 2014 – 31 Dec 2014 (€ mn)
Recognition in the income statement
Recognition
in equity
Total
Net interest
income
Allowance for
credit losses
Net fee and
commission
income
Net result
from financial
instruments
in accordance
with IAS 39
Measurement
result
Financial assets and liabilities designated
as at fair value through profit or loss – – – – – –
Financial assets and liabilities held for trading –26.2 – – –2.5 – –28.7
Loans and receivables 666.5 –62.4 92.2 –475.1 – 221.2
Financial assets available-for-sale 10.8 – – 0.9 –1.2 10.5
Other liabilities –531.9 – – – – –531.9
Positive and negative fair values
of derivative hedging instruments 101.3 – – 463.9 –50.7 514.5
Total 220.5 –62.4 92.2 –12.8 –51.9 185.6
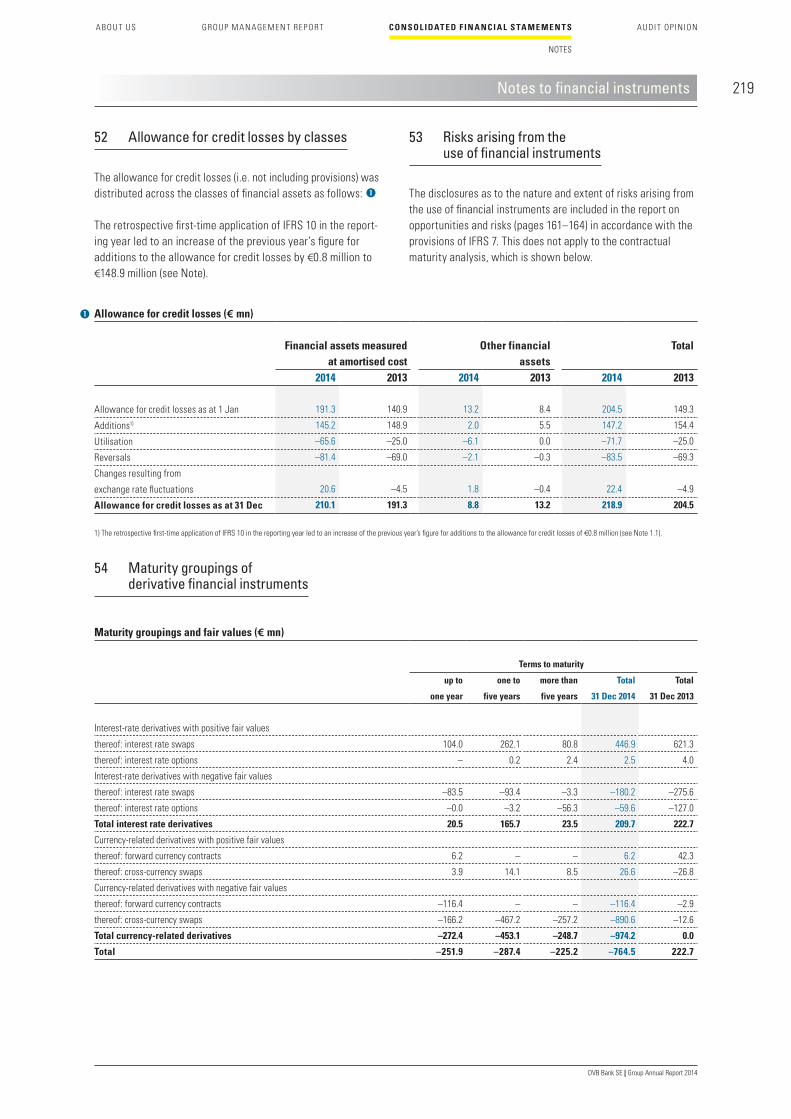
219
A B OU T US
GROUP M A N AGE MEN T RE P OR T
C ONSOL IDAT E D F IN A NC I A L S TA M E M E N T S
NOTES
AUDI T OP INION
DVB Bank SE | Group Annual Report 2014
52 Allowance for credit losses by classes
The allowance for credit losses (i.e. not including provisions) was distributed across the classes of financial assets as follows:
The retrospective first-time application of IFRS 10 in the report-ing year led to an increase of the previous year’s figure for additions to the allowance for credit losses by €0.8 million to €148.9 million (see Note).
53 Risks arising from the use of financial instruments
The disclosures as to the nature and extent of risks arising from the use of financial instruments are included in the report on opportunities and risks (pages 161–164) in accordance with the provisions of IFRS 7. This does not apply to the contractual maturity analysis, which is shown below.
Notes to financial instruments
54 Maturity groupings of derivative financial instruments
Allowance for credit losses (€ mn)
Financial assets measured at amortised cost
Other financialassets
Total
2014 2013 2014 2013 2014 2013
Allowance for credit losses as at 1 Jan 191.3 140.9 13.2 8.4 204.5 149.3
Additions1) 145.2 148.9 2.0 5.5 147.2 154.4
Utilisation –65.6 –25.0 –6.1 0.0 –71.7 –25.0
Reversals –81.4 –69.0 –2.1 –0.3 –83.5 –69.3
Changes resulting from
exchange rate fluctuations 20.6 –4.5 1.8 –0.4 22.4 –4.9
Allowance for credit losses as at 31 Dec 210.1 191.3 8.8 13.2 218.9 204.5
1) The retrospective first-time application of IFRS 10 in the reporting year led to an increase of the previous year’s figure for additions to the allowance for credit losses of €0.8 million (see Note 1.1).
Maturity groupings and fair values (€ mn)
Terms to maturity
up to
one year
one to
five years
more than
five years
Total
31 Dec 2014
Total
31 Dec 2013
Interest-rate derivatives with positive fair values
thereof: interest rate swaps 104.0 262.1 80.8 446.9 621.3
thereof: interest rate options – 0.2 2.4 2.5 4.0
Interest-rate derivatives with negative fair values
thereof: interest rate swaps –83.5 –93.4 –3.3 –180.2 –275.6
thereof: interest rate options –0.0 –3.2 –56.3 –59.6 –127.0
Total interest rate derivatives 20.5 165.7 23.5 209.7 222.7
Currency-related derivatives with positive fair values
thereof: forward currency contracts 6.2 – – 6.2 42.3
thereof: cross-currency swaps 3.9 14.1 8.5 26.6 –26.8
Currency-related derivatives with negative fair values
thereof: forward currency contracts –116.4 – – –116.4 –2.9
thereof: cross-currency swaps –166.2 –467.2 –257.2 –890.6 –12.6
Total currency-related derivatives –272.4 –453.1 –248.7 –974.2 0.0
Total –251.9 –287.4 –225.2 –764.5 222.7

220
DVB Bank SE | Group Annual Report 2014
55 Maturity groupings of non-derivative financial instruments
The amounts reported for the individual time bands reflect the contractual, undiscounted and future cash flows (interest and capital payments).
Notes to financial instruments
31 Dec 2014 (€ mn)
Payable on demand Terms to maturity Total
up to
three months
from
three months
up to one
from
one year
to five
more than
five years
indefinite
term
Loans and advances to banks 596.8 894.8 – – – – 1,491.6
Loans and advances to customers 998.3 1,660.5 3,799.3 13,882.0 4,370.0 – 24,710.1
Investment securities – 87.5 69.4 127.8 – 43.7 328.4
Other assets 61.5 – – – – – 61.5
Total assets 1,656.6 2,642.8 3,868.7 14,009.8 4,370.0 43.7 26,591.6
Deposits from other banks 162.4 467.9 264.2 1,424.2 1,045.3 – 3,364.0
Deposits from customers 551.1 145.3 127.7 2,789.8 4,646.9 – 8,260.8
Securitised liabilities – 756.8 2,252.3 8,107.9 750.8 – 11,867.8
Subordinated liabilities – 8.0 82.2 374.5 166.1 – 630.8
Other liabilities 114.6 – – – – – 114.6
Total liabilities 828.1 –1,378.0 2,726.4 12,696.4 6,609.1 – –24,238.0
Financial guarantee contracts – – 1.2 159.0 108.7 – 268.9
Loan commitments – 16.7 35.3 526.6 1,125.6 – 1,704.2
31 Dec 2013 (€ mn)
Payable on demand Terms to maturity Total
up to
three months
from
three months
up to one
from
one year
to five
more than
five years
indefinite
term
Loans and advances to banks 199.1 79.2 – – – – 278.3
Loans and advances to customers1) 113.3 1,612.9 2,670.5 12,863.4 4,368.3 – 21,628.4
Investment securities – 64.5 73.1 315.6 – 32.2 485.4
Other assets 21.4 – – – – – 21.4
Total assets 333.8 1,756.6 2,743.6 13,179.0 4,368.3 32.2 22,413.5
Deposits from other banks 548.8 855.5 278.1 1,144.1 1,091.7 – 3,918.2
Deposits from customers 320.8 266.5 449.5 2,578.2 4,120.3 – 7,735.3
Securitised liabilities – 57.7 1,750.5 8,872.3 1,256.8 – 11,937.3
Subordinated liabilities – 11.0 13.4 365.9 26.0 – 416.3
Other liabilities 26.3 – – – – – 26.3
Total liabilities 895.9 1,190.7 2,491.5 12,960.5 6,494.8 – 24,033.4
Financial guarantee contracts – – 0.6 142.4 66.9 15.6 225.5
Loan commitments – 47.2 23.3 279.0 863.7 – 1,213.2
1) The retrospective first-time application of IFRS 10 led to a total change of the previous year’s figures by €4.0 million (see Note 1.1).

221
A B OU T US
GROUP M A N AGE MEN T RE P OR T
C ONSOL IDAT E D F IN A NC I A L S TA M E M E N T S
NOTES
AUDI T OP INION
DVB Bank SE | Group Annual Report 2014
56 Equity capital management
The target figure for DVB’s equity capital management is the capital as determined pursuant to the Capital Requirements Regulation (CRR). The objective of equity capital management is to leverage further profitable growth in international transport finance by strengthening own funds and to fulfil the regulatory requirements with respect to the amount of equity at all times.
DVB’s regulatory capital is determined pursuant to the provisions of the CRR. In accordance with Article 92 of the CRR, the Group is obliged to ensure an appropriate amount of own funds in order to fulfil its obligations to customers. In addition, financial institutions are required, on the basis of the solvency principle, to quantify their counterparty credit risks as well as their market risks and to ensure that these risk exposures are backed by own funds.
Own funds are determined based on the regulatory group of consolidated companies under IFRS. Own funds consist of com-mon equity tier 1 capital and additional tier 1 capital as well as tier 2 capital. Compared to equity as reported in the statement of financial position, which is determined in accordance with the provisions of IFRS, the regulatory own funds also include sub-ordinated liabilities. The return on assets is calculated as the ratio of consolidated net income after taxes to total assets. It amounted to 0.35% as at 31 December 2014.
The regulatory capital requirements for banks under Regulation (EU) No. 575/2013 (CRR) were fulfilled at all times during the year under review.
The analysis of the components of regulatory own funds pursuant to Article 25 to 91 of the CRR is presented in the following table:
57 Subordinated assets
During the year under review, the Company did not hold subordi-nated assets to any considerable extent.
Other disclosures
Changes in own funds as defined by the CRR (€ mn)
31 Dec 2014
Paid-up capital instruments 118.8
Capital reserve plus other reserves eligible for inclusion 1,327.3
Deductions from common equity tier 1 (CET1) capital –472.8
Transitional provisions regarding common equity tier 1 (CET1) capital 248.7
Common equity tier 1 (CET1) capital 1,222.0
Transitional provisions regarding additional tier 1 (AT1) capital –160.0
Transfer of shortfall to common equity tier 1 (CET1) capital 160.0
Additional tier 1 (AT1) capital 0.0
Subordinated liabilities 270.0
Transitional provisions regarding tier 2 (T2) capital –83.4
Tier 2 (T2) capital 186.6
Own funds as defined by the CRR1) 1,408.6
1) Taking into account transfer to reserves from net profit
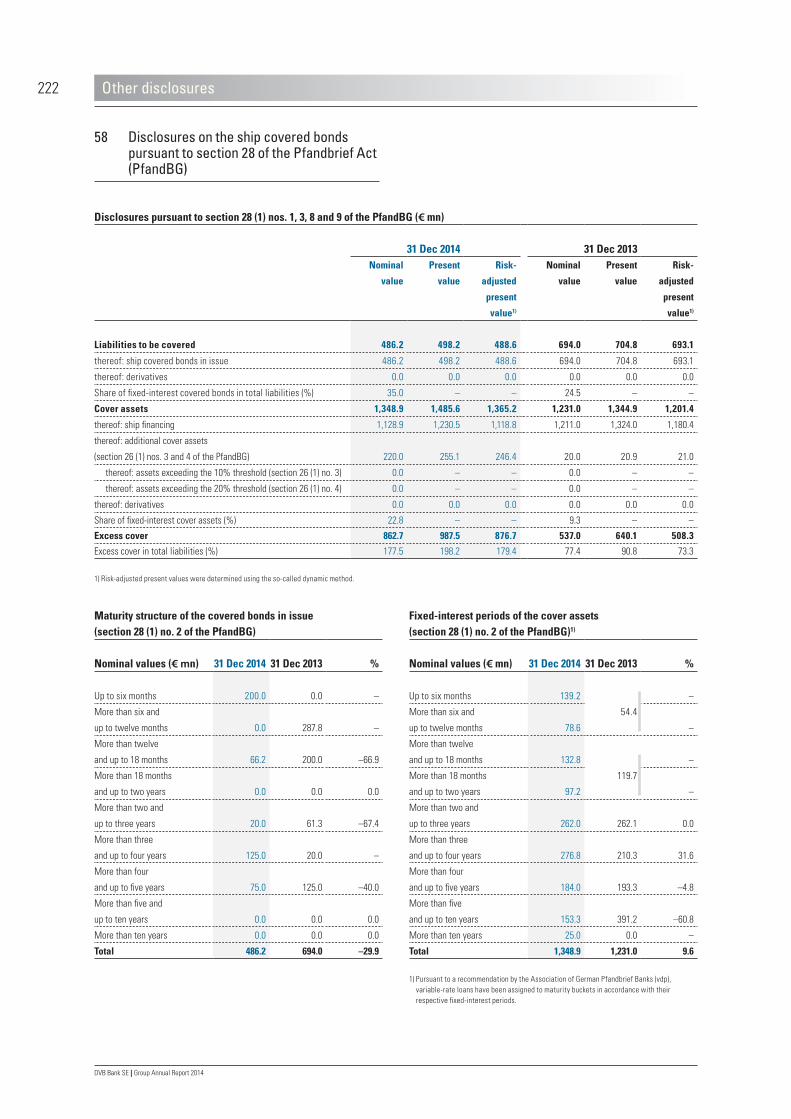
222
DVB Bank SE | Group Annual Report 2014
58 Disclosures on the ship covered bonds pursuant to section 28 of the Pfandbrief Act (PfandBG)
Other disclosures
Disclosures pursuant to section 28 (1) nos. 1, 3, 8 and 9 of the PfandBG (€ mn)
31 Dec 2014 31 Dec 2013
Nominal
value
Present
value
Risk-
adjusted
present
value1)
Nominal
value
Present
value
Risk-
adjusted
present
value1)
Liabilities to be covered 486.2 498.2 488.6 694.0 704.8 693.1
thereof: ship covered bonds in issue 486.2 498.2 488.6 694.0 704.8 693.1
thereof: derivatives 0.0 0.0 0.0 0.0 0.0 0.0
Share of fixed-interest covered bonds in total liabilities (%) 35.0 – – 24.5 – –
Cover assets 1,348.9 1,485.6 1,365.2 1,231.0 1,344.9 1,201.4
thereof: ship financing 1,128.9 1,230.5 1,118.8 1,211.0 1,324.0 1,180.4
thereof: additional cover assets
(section 26 (1) nos. 3 and 4 of the PfandBG)
220.0
255.1
246.4
20.0
20.9
21.0
thereof: assets exceeding the 10% threshold (section 26 (1) no. 3) 0.0 – – 0.0 – –
thereof: assets exceeding the 20% threshold (section 26 (1) no. 4) 0.0 – – 0.0 – –
thereof: derivatives 0.0 0.0 0.0 0.0 0.0 0.0
Share of fixed-interest cover assets (%) 22.8 – – 9.3 – –
Excess cover 862.7 987.5 876.7 537.0 640.1 508.3
Excess cover in total liabilities (%) 177.5 198.2 179.4 77.4 90.8 73.3
1) Risk-adjusted present values were determined using the so-called dynamic method.
Maturity structure of the covered bonds in issue(section 28 (1) no. 2 of the PfandBG)
Nominal values (€ mn) 31 Dec 2014 31 Dec 2013 %
Up to six months 200.0 0.0 –
More than six and
up to twelve months 0.0 287.8 –
More than twelve
and up to 18 months 66.2 200.0 –66.9
More than 18 months
and up to two years 0.0 0.0 0.0
More than two and
up to three years 20.0 61.3 –67.4
More than three
and up to four years 125.0 20.0 –
More than four
and up to five years 75.0 125.0 –40.0
More than five and
up to ten years 0.0 0.0 0.0
More than ten years 0.0 0.0 0.0
Total 486.2 694.0 –29.9
Fixed-interest periods of the cover assets (section 28 (1) no. 2 of the PfandBG)1)
Nominal values (€ mn) 31 Dec 2014 31 Dec 2013 %
Up to six months 139.2
54.4
–
More than six and
up to twelve months 78.6 –
More than twelve
and up to 18 months 132.8
119.7
–
More than 18 months
and up to two years 97.2 –
More than two and
up to three years 262.0 262.1 0.0
More than three
and up to four years 276.8 210.3 31.6
More than four
and up to five years 184.0 193.3 –4.8
More than five
and up to ten years 153.3 391.2 –60.8
More than ten years 25.0 0.0 –
Total 1,348.9 1,231.0 9.6
1) Pursuant to a recommendation by the Association of German Pfandbrief Banks (vdp), variable-rate loans have been assigned to maturity buckets in accordance with their respective fixed-interest periods.

223
A B OU T US
GROUP M A N AGE MEN T RE P OR T
C ONSOL IDAT E D F IN A NC I A L S TA M E M E N T S
NOTES
AUDI T OP INION
DVB Bank SE | Group Annual Report 2014
There were no inland waterway vessels or ships under construc-tion pledged at the reporting dates.
No takeovers had been carried out by the Bank and neither had foreclosures been pending or carried out as at the relevant reporting dates.
There were no arrears on interest payable at either reporting date.
Other disclosures
Foreclosures and takeovers by the Bank (section 28 (4) nos. 2a and 2b of the PfandBG)
Number 31 Dec 2014 31 Dec 2013 %
Foreclosures 0.0 0.0 0.0
Takeovers by the Bank 0.0 0.0 0.0
Arrears on the interest payable by borrowers (section 28 (4) nos. 2c of the PfandBG)
€ mn 31 Dec 2014 31 Dec 2013 %
Due and unpaid interest 0.0 0.0 0.0
Size categories of the cover assets (section 28 (4) no. 1a of the PfandBG)1)
Nominal values (€ mn) 31 Dec 2014 31 Dec 2013 %
Up to €500 thousand 0.0 0.0 0.0
More than €500 thousand
and up to €5 million 33.4 52.2 –36.0
More than €5 million 1,095.5 1,178.7 –7.1
Total 1,128.9 1,231.0 –8.3
1) Details of size categories for the previous year’s figures are disclosed for all cover assets (cf. section 53 sentence 2 of the PfandBG); in contrast, figures for the year under review are disclosed for cover loans only.
Foreign currencies(section 28 (1) no. 10 of the PfandBG)1)
Risk-adjusted present values (€ mn)
31 Dec 2014
31 Dec 2013
%
Euro –170.4 –425.0 –59.9
Japanese yen 0.0 1.6 –
Norwegian krone 13.7 16.5 –17.0
US dollar 1,033.3 915.3 12.9
Total 876.7 508.3 72.5
1) Figures related to the euro are stated for the sake of completeness.
Country in which the pledged sea-going vessels are registered (section 28 (4) no. 1b of the PfandBG)
Nominal values (€ mn) 31 Dec 2014 31 Dec 2013 %
Germany 30.0 7.1 –
Gibraltar 32.7 31.5 3.8
Greece 10.2 31.2 –67.3
United Kingdom 42.8 82.4 –48.1
Italy 0.0 4.5 –
Croatia 0.0 26.0 –
Liberia 168.0 150.3 11.8
Malta 300.7 210.2 43.1
Marshall Islands 451.5 502.0 –10.1
Norway 66.4 134.0 –50.4
Cyprus 26.6 31.8 –16.4
Total 1,128.9 1,211.0 –6.8
Additional cover assets by country (section 28 (1) nos. 4, 5 and 6 of the PfandBG)1)
Nominal values (€ mn) 31 Dec 2014 31 Dec 2013
Germany 20.0 20.0
thereof: assets in accordance with
section 26 (1) no. 2 of the PfandBG 0.0 0.0
thereof: assets in accordance with
section 26 (1) no. 3 of the PfandBG 20.0 20.0
thereof: covered bonds 0.0 0.0
thereof: assets in accordance with
section 26 (1) no. 4 of the PfandBG 0.0 0.0
France 150.0 0.0
thereof: assets in accordance with
section 26f (1) no. 2 of the PfandBG 0.0 0.0
thereof: assets in accordance with
section 26 (1) no. 3 of the PfandBG 150.0 0.0
thereof: covered bonds 0.0 0.0
thereof: assets in accordance with
section 26 (1) no. 4 of the PfandBG 0.0 0.0
Netherlands 50.0 0.0
thereof: assets in accordance with
section 26 (1) no. 2 of the PfandBG 0.0 0.0
thereof: assets in accordance with
section 26 (1) no. 3 of the PfandBG 50.0 0.0
thereof: covered bonds 0.0 0.0
thereof: assets in accordance with
section 26 (1) no. 4 of the PfandBG 0.0 0.0
Total 220.0 20.0
1) Debt securities compliant with provisions in article 129 of the capital requirements regulation (EU 575/2013).

224
DVB Bank SE | Group Annual Report 2014
59 Disclosures on the aircraft covered bonds pursuant to section 28 of the PfandBG
Other disclosures
Disclosures pursuant to section 28 (1) nos. 1, 3, 8 and 9 of the PfandBG (€ mn)
31 Dec 2014 31 Dec 2013
Nominal
value
Present
value
Risk-
adjusted
present
value1)
Nominal
value
Present
value
Risk-
adjusted
present
value1)
Liabilities to be covered 0.0 0.0 0.0 0.0 0.0 0.0
thereof: aircraft covered bonds in issue 0.0 0.0 0.0 0.0 0.0 0.0
thereof: derivatives 0.0 0.0 0.0 0.0 0.0 0.0
Share of fixed-interest covered bonds in total liabilities (%) n/a – – n/a – –
Cover assets 926.5 1,025.9 913.8 833.3 926.8 805.2
thereof: aircraft financings 926.5 1,025.9 913.8 833.3 926.8 805.2
thereof: additional cover assets
(section 26f (1) nos. 3 and 4 of the PfandBG)
0.0
0.0
0.0
0.0
0.0
0.0
thereof: assets exceeding the 10% threshold (section 26f (1) no. 3) 0.0 – – 0.0 – –
thereof: assets exceeding the 20% threshold (section 26f (1) no. 4) 0.0 – – 0.0 – –
thereof: derivatives (section 26f (1) no. 5 of the PfandBG) 0.0 0.0 0.0 0.0 0.0 0.0
Share of fixed-interest covered assets (%) 65.7 – – 53.4 – –
Excess cover 926.5 1,025.9 913.8 833.3 926.8 805.2
1) Risk-adjusted present values were determined using the so-called dynamic method.
Maturity structure of the covered bonds in issue(section 28 (1) no. 2 of the PfandBG)
Nominal values (€ mn) 31 Dec 2014 31 Dec 2013 %
Up to six months 0.0 0.0 0.0
More than six and
up to twelve months 0.0 0.0 0.0
More than twelve
and up to 18 months 0.0 0.0 0.0
More than 18 months
and up to two years 0.0 0.0 0.0
More than two and
up to three years 0.0 0.0 0.0
More than three
and up to four years 0.0 0.0 0.0
More than four and
up to five years 0.0 0.0 0.0
More than five and
up to ten years 0.0 0.0 0.0
More than ten years 0.0 0.0 0.0
Total 0.0 0.0 0.0
Fixed-interest periods of the cover assets (section 28 (1) no. 2 of the PfandBG)1)
Nominal values (€ mn) 31 Dec 2014 31 Dec 2013 %
Up to six months 64.5
72.3
–
More than six and
up to twelve months 80.3 –
More than twelve
and up to 18 months 57.4
72.1
–
More than 18 months
and up to two years 68.0 –
More than two and
up to three years 156.5 41.2 –
More than three
and up to four years 134.7 56.9 –
More than four and
up to five years 140.1 130.9 7.0
More than five and
up to ten years 198.3 444.7 –55.4
More than ten years 26.7 15.2 75.7
Total 926.5 833.3 11.2
1) Pursuant to a recommendation by the Association of German Pfandbrief Banks (vdp), variable-rate loans have been assigned to maturity buckets in accordance with their respective fixed-interest periods.

225
A B OU T US
GROUP M A N AGE MEN T RE P OR T
C ONSOL IDAT E D F IN A NC I A L S TA M E M E N T S
NOTES
AUDI T OP INION
DVB Bank SE | Group Annual Report 2014
No additional cover assets in accordance with section 26f of the PfandBG were registered at the reporting dates.
No takeovers had been carried out by the Bank and neither had foreclosures been pending or carried out as at the relevant reporting dates.
There were no arrears on interest payable at either reporting date.
Other disclosures
Foreclosures and takeovers by the Bank (section 28 (4) nos. 2a and 2b of the PfandBG)
Number 31 Dec 2014 31 Dec 2013 %
Foreclosures 0.0 0.0 0.0
Takeovers by the Bank 0.0 0.0 0.0
Arrears on the interest payable by borrowers (section 28 (4) nos. 2c of the PfandBG)
€ mn 31 Dec 2014 31 Dec 2013 %
Due and unpaid interest 0.0 0.0 0.0
Size categories of the cover assets (section 28 (4) no. 1a of the PfandBG)1)
Nominal values (€ mn) 31 Dec 2014 31 Dec 2013 %
Up to €500 thousand 0.0 0.0 0.0
More than €500 thousand and
up to €5 million 10.3 19.3 –46.6
More than €5 million 916.2 814.0 12.6
Total 926.5 833.3 11.2
1) Details of size categories for the previous year’s figures are disclosed for all cover assets (cf. section 53 sentence 2 of the PfandBG); in contrast, figures for the year under review are disclosed for cover loans only.
Foreign currencies(section 28 (1) no. 10 of the PfandBG)1)
Risk-adjusted present value (€ mn)
31 Dec 2014
31 Dec 2013
%
Euro 8.9 10.6 –16.0
US dollar 905.0 794.6 13.9
Total 913.8 805.2 13.5
1) Figures related to the euro are stated for the sake of completeness.
Country in which the pledged aircraft are registered(section 28 (4) no. 1b of the PfandBG)
Nominal values (€ mn) 31 Dec 2014 31 Dec 2013 %
Denmark 26.1 38.0 –31.3
Germany 18.4 43.5 –57.7
France 98.4 83.5 17.8
United Kingdom 105.2 63.9 64.6
Ireland 19.8 21.2 –6.6
Netherlands 51.2 35.0 46.3
Norway 38.2 0.0 –
Switzerland 12.5 12.2 2.5
USA 556.8 536.0 3.9
Total 926.5 833.3 11.2
Additional cover assets by country (section 28 (1) nos. 4, 5 and 6 of the PfandBG)1)
Nominal values (€ mn) 31 Dec 2014 31 Dec 2013
Germany 0.0 0.0
thereof: assets in accordance with
section 26f (1) no. 2 of the PfandBG 0.0 0.0
thereof: assets in accordance with
section 26f (1) no. 3 of the PfandBG 0.0 0.0
thereof: covered bonds 0.0 0.0
thereof: assets in accordance with
section 26f (1) no. 4 of the PfandBG 0.0 0.0
Total 0.0 0.0
1) Debt securities compliant with provisions in article 129 of the capital requirements regulation (EU 575/2013).

226
DVB Bank SE | Group Annual Report 2014
60 List of shareholdings
Other disclosures
Pursuant to section 313 (2) of the HGB as at 31 December 2014 (€)
Shareholding(%)
Net income/loss for the year
Equitycapital
DVB Bank SE, Frankfurt/Main 0.0 – –
I. Subsidiaries
DVB Bank America N.V.1), Willemstad, Curaçao 100 18,573,304 232,913,269
American Flirtation N.V., Willemstad, Curaçao 100 – 4)
DVB Container Finance America LLC, Majuro, Marshall Islands 100 – 4)
DVB Investment Management N.V., Willemstad, Curaçao 100 – 4)
Shipping Capital Antilles N.V., Willemstad, Curaçao 100 – 4)
AER Holding N.V., Willemstad, Curaçao 100 – 4)
Netherlands Shipmortgage Corporation Ltd, Hamilton, Bermuda 100 – 4)
TEU Management Company N.V., Willemstad, Curaçao 100 – 4)
DVB Group Merchant Bank (Asia) Ltd1), Singapore 100 38,139,960 427,135,327
DVB Aviation Finance Asia Pte Ltd, Singapore 100 2,470,180 43,876
Ibon Leasing Ltd, George Town, Cayman Islands 100 – 4)
Lexi Ltd, George Town, Cayman Islands 100 – 4)
Longspur Ltd, George Town, Cayman Islands 100 – 4)
Tubbataha Aviation Ltd, George Town, Cayman Islands 100 – 4)
DVB Holding GmbH2)3), Frankfurt/Main, Germany 100 0 13,000,000
DVB Objektgesellschaft Geschäftsführungs GmbH, Frankfurt/Main, Germany 100 –180 23,333
DVB Holding (US) Inc., Greenwich, USA 100 248,497 1,685,262
DVB Capital Markets LLC, New York, USA 100 1,278,829 2,284,129
DVB Service (US) LLC, New York, USA 100 – 4)
DVB Transport (US) LLC, New York, USA 100 – 4)
DVB Invest (Suisse) AG, Zurich, Switzerland 100 – 4)
DVB Transport Finance Ltd, London, United Kingdom 100 1,836,407 36,544,848
Hollandse Scheepshypotheekbank N.V., Rotterdam, Netherlands 100 – 4)
ITF International Transport Finance Suisse AG, Zurich, Switzerland 100 1,693,190 48,681,923
LogPay Financial Services GmbH2)3), Eschborn, Germany 100 0 3,750,000
LogPay Fuel Spain S.L.U., Barcelona, Spain 100 – 4)
LogPay Transport Services GmbH, Eschborn, Germany 75 – 4)
LogPay Fuel Italia S.R.L., Bolzano, Italy 100 – 4)
LogPay Mobility Services GmbH, Eschborn, Germany 100 – 4)
Nedship Shipping B.V., Shiphol, Netherlands 100 – 4)
Shipping Capital B.V., Shiphol, Netherlands 100 – 4)
Infifion XI B.V., Rotterdam, Netherlands 100 – 4)
Nedship Participation (Norway) B.V., Rotterdam, Netherlands 100 – 4)
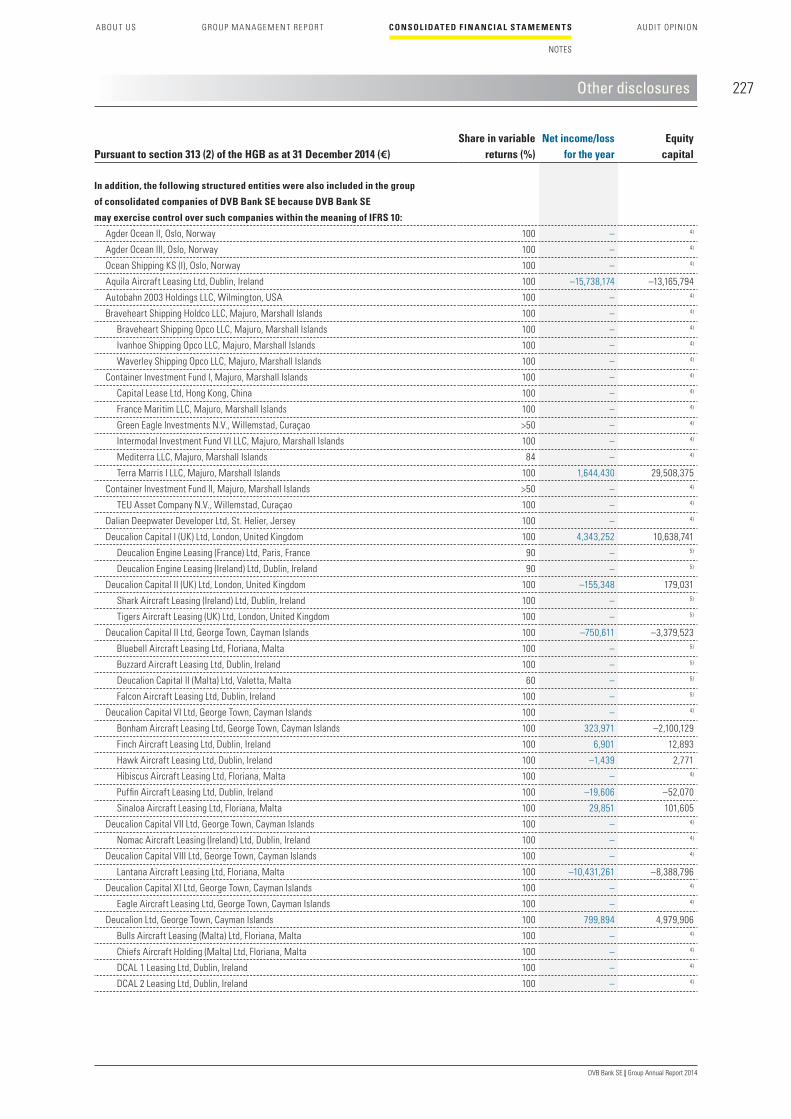
227
A B OU T US
GROUP M A N AGE MEN T RE P OR T
C ONSOL IDAT E D F IN A NC I A L S TA M E M E N T S
NOTES
AUDI T OP INION
DVB Bank SE | Group Annual Report 2014
Other disclosures
Pursuant to section 313 (2) of the HGB as at 31 December 2014 (€)
Share in variable returns (%)
Net income/loss for the year
Equity capital
In addition, the following structured entities were also included in the group
of consolidated companies of DVB Bank SE because DVB Bank SE
may exercise control over such companies within the meaning of IFRS 10:
Agder Ocean II, Oslo, Norway 100 – 4)
Agder Ocean III, Oslo, Norway 100 – 4)
Ocean Shipping KS (I), Oslo, Norway 100 – 4)
Aquila Aircraft Leasing Ltd, Dublin, Ireland 100 –15,738,174 –13,165,794
Autobahn 2003 Holdings LLC, Wilmington, USA 100 – 4)
Braveheart Shipping Holdco LLC, Majuro, Marshall Islands 100 – 4)
Braveheart Shipping Opco LLC, Majuro, Marshall Islands 100 – 4)
Ivanhoe Shipping Opco LLC, Majuro, Marshall Islands 100 – 4)
Waverley Shipping Opco LLC, Majuro, Marshall Islands 100 – 4)
Container Investment Fund I, Majuro, Marshall Islands 100 – 4)
Capital Lease Ltd, Hong Kong, China 100 – 4)
France Maritim LLC, Majuro, Marshall Islands 100 – 4)
Green Eagle Investments N.V., Willemstad, Curaçao >50 – 4)
Intermodal Investment Fund VI LLC, Majuro, Marshall Islands 100 – 4)
Mediterra LLC, Majuro, Marshall Islands 84 – 4)
Terra Marris I LLC, Majuro, Marshall Islands 100 1,644,430 29,508,375
Container Investment Fund II, Majuro, Marshall Islands >50 – 4)
TEU Asset Company N.V., Willemstad, Curaçao 100 – 4)
Dalian Deepwater Developer Ltd, St. Helier, Jersey 100 – 4)
Deucalion Capital I (UK) Ltd, London, United Kingdom 100 4,343,252 10,638,741
Deucalion Engine Leasing (France) Ltd, Paris, France 90 – 5)
Deucalion Engine Leasing (Ireland) Ltd, Dublin, Ireland 90 – 5)
Deucalion Capital II (UK) Ltd, London, United Kingdom 100 –155,348 179,031
Shark Aircraft Leasing (Ireland) Ltd, Dublin, Ireland 100 – 5)
Tigers Aircraft Leasing (UK) Ltd, London, United Kingdom 100 – 5)
Deucalion Capital II Ltd, George Town, Cayman Islands 100 –750,611 –3,379,523
Bluebell Aircraft Leasing Ltd, Floriana, Malta 100 – 5)
Buzzard Aircraft Leasing Ltd, Dublin, Ireland 100 – 5)
Deucalion Capital II (Malta) Ltd, Valetta, Malta 60 – 5)
Falcon Aircraft Leasing Ltd, Dublin, Ireland 100 – 5)
Deucalion Capital VI Ltd, George Town, Cayman Islands 100 – 4)
Bonham Aircraft Leasing Ltd, George Town, Cayman Islands 100 323,971 –2,100,129
Finch Aircraft Leasing Ltd, Dublin, Ireland 100 6,901 12,893
Hawk Aircraft Leasing Ltd, Dublin, Ireland 100 –1,439 2,771
Hibiscus Aircraft Leasing Ltd, Floriana, Malta 100 – 4)
Puffin Aircraft Leasing Ltd, Dublin, Ireland 100 –19,606 –52,070
Sinaloa Aircraft Leasing Ltd, Floriana, Malta 100 29,851 101,605
Deucalion Capital VII Ltd, George Town, Cayman Islands 100 – 4)
Nomac Aircraft Leasing (Ireland) Ltd, Dublin, Ireland 100 – 4)
Deucalion Capital VIII Ltd, George Town, Cayman Islands 100 – 4)
Lantana Aircraft Leasing Ltd, Floriana, Malta 100 –10,431,261 –8,388,796
Deucalion Capital XI Ltd, George Town, Cayman Islands 100 – 4)
Eagle Aircraft Leasing Ltd, George Town, Cayman Islands 100 – 4)
Deucalion Ltd, George Town, Cayman Islands 100 799,894 4,979,906
Bulls Aircraft Leasing (Malta) Ltd, Floriana, Malta 100 – 4)
Chiefs Aircraft Holding (Malta) Ltd, Floriana, Malta 100 – 4)
DCAL 1 Leasing Ltd, Dublin, Ireland 100 – 4)
DCAL 2 Leasing Ltd, Dublin, Ireland 100 – 4)

228
DVB Bank SE | Group Annual Report 2014
Other disclosures
Pursuant to section 313 (2) of the HGB as at 31 December 2014 (€)
Share in variable returns (%)
Net income/loss for the year
Equity capital
Highlanders Aircraft Leasing (IRL) Ltd, Dublin, Ireland 100 1,891,608 –162,143
Stormers Aircraft Leasing (Malta) Ltd, Floriana, Malta 100 – 4)
Glencoe Shipping Holdco LLC, Majuro, Marshall Islands 100 – 4)
Glen Campbell Opco LLC, Majuro, Marshall Islands 100 – 4)
Glen More Opco LLC, Majuro, Marshall Islands 100 – 4)
Glen Shee Opco LLC, Majuro, Marshall Islands 100 – 4)
Glen Shiel Opco LLC, Majuro, Marshall Islands 100 – 4)
Great Glen Opco LLC, Majuro, Marshall Islands 100 – 4)
Hudson Services LLC, Majuro, Marshall Islands 100 1,682,841 1,620,633
KV MSN 27602 Aircraft Ltd, Dublin, Ireland 100 – 4)
Maple Leaf Shipping Holdco LLC, Majuro, Marshall Islands 100 – 4)
Adirondack Shipping LLC, Majuro, Marshall Islands 100 – 4)
Asgard Shipping LLC, Majuro, Marshall Islands 100 – 4)
Bathgate Trading Opco LLC, Majuro, Marshall Islands 100 – 4)
Elli LLC, Majuro, Marshall Islands 100 – 4)
Loki LLC, Majuro, Marshall Islands 100 – 4)
Odin LLC, Majuro, Marshall Islands 100 – 4)
Philip Trading Opco LLC, Majuro, Marshall Islands 100 – 4)
Rushmore Shipping LLC, Majuro, Marshall Islands 100 – 4)
Shamrock Trading Opco LLC, Majuro, Marshall Islands 100 – 4)
Stani Trading Opco LLC, Majuro, Marshall Islands 100 – 4)
TBS I Trading Opco LLC, Majuro, Marshall Islands 100 – 4)
Thor LLC, Majuro, Marshall Islands 100 – 4)
MD Aviation Capital Pte Ltd, Singapore 100 9,051,782 166,452,458
MDAC 1 Pte Ltd, Singapore 100 626,804 16,949,867
MDAC 2 Pte Ltd, Singapore 100 1,086,445 17,220,867
MDAC 3 Pte Ltd, Singapore 100 2,304,411 16,605,649
MDAC 4 Pte Ltd, Singapore 100 516,659 10,075,704
MDAC 5 Pte Ltd, Singapore 100 475,969 11,341,774
MDAC 6 Pte Ltd, Singapore 100 3,171,684 46,249,782
MDAC 7 (Ireland) Ltd, Dublin, Ireland 100 – 4)
MDAC 8 Pte Ltd, Singapore 100 447,340 5,294,212
MDAC 9 Pte Ltd, Singapore 100 131,021 3,434,605
MDAC 10 (Ireland) Ltd, Dublin, Ireland 100 – 4)
MDAC 11 Pte Ltd, Singapore 100 – 4)
MDAC Malta Ltd, Floriana, Malta 100 – 4)
MS ”Mumbai Trader” GmbH & Co. KG, Bremen, Germany 100 – 4)
NFC Shipping Fund II LLC, Majuro, Marshall Islands 80 – 4)
Gandari Shipping Pte Ltd, Singapore 100 – 4)
NFC Shipping Fund B LLC, Majuro, Marshall Islands 100 – 4)
NFC Shipping Fund C LLC, Majuro, Marshall Islands 100 – 4)
Bukit Merah Shipping Pte Ltd, Singapore 100 45,886 155,175
Mount Kaba Shipping LLC, Majuro, Marshall Islands 100 – 4)
Mount Kinabalu LLC, Majuro, Marshall Islands 100 113,031 2,575,986
Mount Mulu LLC, Majuro, Marshall Islands 100 180,084 2,159,714

229
A B OU T US
GROUP M A N AGE MEN T RE P OR T
C ONSOL IDAT E D F IN A NC I A L S TA M E M E N T S
NOTES
AUDI T OP INION
DVB Bank SE | Group Annual Report 2014
Other disclosures
Pursuant to section 313 (2) of the HGB as at 31 December 2014 (€)
Share in variable returns (%)
Net income/loss for the year
Equity capital
Mount Pleasant Shipping Pte Ltd, Singapore 100 1,994,397 3,979,014
Mount Rinjani Shipping Pte Ltd, Singapore 100 –404,386 5,881,012
Mount Santubong LLC, Majuro, Marshall Islands 100 – 4)
NFC Labuan Shipleasing I Ltd, Labuan, Malaysia 100 – 4)
Taigetos Funding LLC, Majuro, Marshall Islands 100 – 4)
Taigetos II LLC, Majuro, Marshall Islands 100 – 4)
Taigetos III LLC, Majuro, Marshall Islands 100 – 4)
Wadi Funding LLC, Majuro, Marshall Islands 100 – 4)
Wadi Woraya I LLC, Majuro, Marshall Islands 100 – 4)
Wadi Woraya III LLC, Majuro, Marshall Islands 100 – 4)
Ocean Container II, Oslo, Norway 100 – 4)
SIIM Fund I (Shipping and Intermodal Investment Management Fund) I LLC, Majuro, Marshall Islands 100 – 4)
Blue Moon Shipping Ltd, St. John’s, Antigua/Barbuda 100 – 4)
Calidris Shipping LLC, Majuro, Marshall Islands 100 226,058 6,266,826
Green Mountain Shipping Ltd, Willemstad, Curaçao 100 –4,292,976 5,473,266
S1 Offshore Pte Ltd, Singapur 100 466,086 10,525,149
S2 Shipping and Offshore Pte Ltd, Singapur 100 – 4)
Scheepvaarmaatschappij Ewout B.V., Rotterdam, Netherlands 100 – 4)
Yellow Moon Shipping Ltd, St. John’s, Antigua/Barbuda 100 – 4)
SIIM Fund II (Shipping and Intermodal Investment Management Fund II) LLC, Majuro, Marshall Islands 100 – 4)
Stephenson Capital Ltd, George Town, Cayman Islands 100 492,644 –231,387
DUNAVAGON s.r.o., Dunajska Streda, Slovakia 100 – 5)
DV01 Szarazfoldi Jarmukolcsonzo rt, Aporka, Hungary 100 – 5)
SRF I Ltd, Floriana, Malta 100 – 5)
SRF II Ltd, Floriana, Malta 100 – 5)
SRF III Ltd, Floriana, Malta 100 – 5)
Pursuant to section 313 (2) of the HGB as at 31 December 2014 (€)
Shareholding(%)
Net income/loss for the year
Equitycapital
II. Joint ventures accounted for using the equity method
AerCap Partners I Ltd, Shannon, Ireland 50 3,995,121 –2,095,570
AerCap Partners II Ltd, Shannon, Ireland 50 –302,683 –1,998,405
Capital Equipment Management Holding GmbH, Hamburg, Germany 50 – 4)
D8 Product Tankers Ltd, Singapore 50 – 4)
D8 Product Tankers Investments LLC, Majuro, Marshall Islands 50 – 4)
Deucalion MC Engine Leasing Ltd, Dublin, Ireland 50 – 4)
First BD Feederships Shipping Ltd, St. John’s, Antigua/Barbuda 50 – 4)
Herakleitos 3050 LLC, Majuro, Marshall Islands 50 – 4)
Intermodal Investment Fund II LLC, Majuro, Marshall Islands 50 – 4)
Intermodal Investment Fund IV LLC, Majuro, Marshall Islands 50 692,888 11,338,857
Intermodal Investment Fund VII LLC, Majuro, Marshall Islands 50 – 4)
MS Oceana Schifffahrtsgesellschaft mbH & Co. KG, Hamburg, Germany 50 – 4)
MS Octavia Schifffahrtsgesellschaft mbH & Co. KG, Hamburg, Germany 50 – 4)
TAG ASSET Management LLC, Majuro, Marshall Islands 50 – 4)

230
DVB Bank SE | Group Annual Report 2014
Other disclosures
Pursuant to section 313 (2) of the HGB as at 31 December 2014 (€)
Shareholding(%)
Net income/loss for the year
Equitycapital
III. Associates accounted for using the equity method
8F Leasing S.A., Contern, Luxembourg 22 – 4)
Aer Lucht Ltd, Dublin, Ireland 47 – 4)
A330 Parts Ltd, Newark, USA 20 –841,285 5,493,906
Epic Pantheon International Gas Shipping Ltd, Tortola, British Virgin Islands 15 – 4)
Global Offshore Services B.V., Amsterdam, Netherlands 32 – 4)
Intermodal Investment Fund V LLC, Majuro, Marshall Islands 22 977,306 3,125,580
KCM Bulkers Ltd, Tortola, British Virgin Islands 49 – 4)
KOTANI JV CO. B.V., Amsterdam, Netherlands 48 – 4)
Modex Holding Limited (BVI), Tortola, British Virgin Islands 24 – 4)
MON A300 Leasing Ltd, George Town, Cayman Islands 20 1,720,648 2,757,100
MON Engine Parts Inc., Newark, USA 20 338,440 1,612,476
Mount Faber KS, Oslo, Norway 49 9,531,667 9,341,172
SRF Railcar Leasing Ltd, Cashel, Ireland 49 – 4)
TES Holdings Ltd, Bridgend, Wales, United Kingdom 40 2,185,172 22,755,188
West Supply III K/S, Haugesund, Norway 20 278,082 3,897,229
IV. Associates not accounted for using the equity method
Aviateur Capital Ltd, Dublin, Ireland 20 1,600,006 1,571,315
DVL Deutsche Verkehrs-Leasing GmbH, Eschborn 39 819 2,557,279
Gram Car Carriers Holdings Pte Ltd, Singapore 10 – 4)
Mandarin Containers Ltd, Tortola, British Virgin Islands 13 – 4)
West Supply III A/S, Haugesund, Norway 22 21,494 583,974
1) Net income distributed to DVB Bank SE within the same period2) There is a profit and loss transfer agreement with DVB Bank SE.3) The company applied the exemption provisions of section 264 (1) of the HGB.4) Not disclosed due to lack of materiality (IAS 8.8).5) Net income/loss is included in the higher-level subgroup.
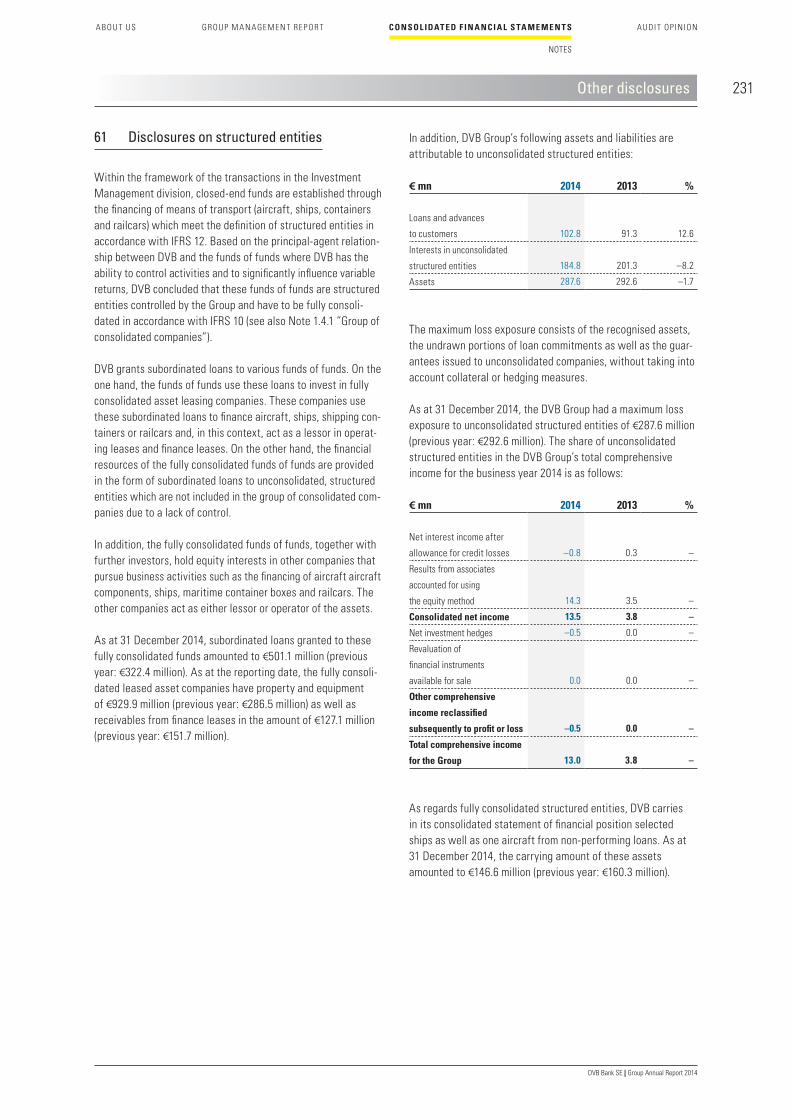
231
DVB Bank SE | Group Annual Report 2014
A B OU T US
GROUP M A N AGE MEN T RE P OR T
C ONSOL IDAT E D F IN A NC I A L S TA M E M E N T S
NOTES
AUDI T OP INION
61 Disclosures on structured entities
Within the framework of the transactions in the Investment Management division, closed-end funds are established through the financing of means of transport (aircraft, ships, containers and railcars) which meet the definition of structured entities in accordance with IFRS 12. Based on the principal-agent relation-ship between DVB and the funds of funds where DVB has the ability to control activities and to significantly influence variable returns, DVB concluded that these funds of funds are structured entities controlled by the Group and have to be fully consoli-dated in accordance with IFRS 10 (see also Note 1.4.1 ”Group of consolidated companies”).
DVB grants subordinated loans to various funds of funds. On the one hand, the funds of funds use these loans to invest in fully consolidated asset leasing companies. These companies use these subordinated loans to finance aircraft, ships, shipping con-tainers or railcars and, in this context, act as a lessor in operat-ing leases and finance leases. On the other hand, the financial resources of the fully consolidated funds of funds are provided in the form of subordinated loans to unconsolidated, structured entities which are not included in the group of consolidated com-panies due to a lack of control.
In addition, the fully consolidated funds of funds, together with further investors, hold equity interests in other companies that pursue business activities such as the financing of aircraft aircraft components, ships, maritime container boxes and railcars. The other companies act as either lessor or operator of the assets.
As at 31 December 2014, subordinated loans granted to these fully consolidated funds amounted to €501.1 million (previous year: €322.4 million). As at the reporting date, the fully consoli-dated leased asset companies have property and equipment of €929.9 million (previous year: €286.5 million) as well as receivables from finance leases in the amount of €127.1 million (previous year: €151.7 million).
In addition, DVB Group’s following assets and liabilities are attributable to unconsolidated structured entities:
The maximum loss exposure consists of the recognised assets, the undrawn portions of loan commitments as well as the guar-antees issued to unconsolidated companies, without taking into account collateral or hedging measures.
As at 31 December 2014, the DVB Group had a maximum loss exposure to unconsolidated structured entities of €287.6 million (previous year: €292.6 million). The share of unconsolidated structured entities in the DVB Group’s total comprehensive income for the business year 2014 is as follows:
As regards fully consolidated structured entities, DVB carries in its consolidated statement of financial position selected ships as well as one aircraft from non-performing loans. As at 31 December 2014, the carrying amount of these assets amounted to €146.6 million (previous year: €160.3 million).
Other disclosures
€ mn 2014 2013 %
Loans and advances
to customers 102.8 91.3 12.6
Interests in unconsolidated
structured entities 184.8 201.3 –8.2
Assets 287.6 292.6 –1.7
€ mn 2014 2013 %
Net interest income after
allowance for credit losses –0.8 0.3 –
Results from associates
accounted for using
the equity method 14.3 3.5 –
Consolidated net income 13.5 3.8 –
Net investment hedges –0.5 0.0 –
Revaluation of
financial instruments
available for sale 0.0 0.0 –
Other comprehensive
income reclassified
subsequently to profit or loss –0.5 0.0 –
Total comprehensive income
for the Group 13.0 3.8 –

232
DVB Bank SE | Group Annual Report 2014
64 Related party disclosures
64.1 Remuneration and shareholdings of members of the Board of Managing Directors and Supervisory Board
The remuneration report included in the group management report sets out the legal principles of DVB’s remuneration system (pages 72–75 of this annual report); the corporate governance report includes a detailed break-down and explanations on the remuneration paid to members of the Board of Managing Directors and the Supervisory Board (page 23–26 of this annual report).
The remuneration paid to current and former members of the Board of Managing Directors and their surviving dependants as well as to Supervisory Board members during the year under review was as follows:
The Supervisory Board has determined the structure of remu-neration for the Board of Managing Directors. In the year under review, the total remuneration of the Board of Managing Directors was comprised of a fixed component of 67.9% and a variable bonus of 32.1% (previous year: 55.9% fixed/44.1% variable com-ponent).
62 Financial guarantee contracts, contingent liabilities and other commitments
Financial guarantee contracts are disclosed at their nominal value. Other commitments include future minimum lease pay-ments from non-cancellable operating leases.
63 Average number of employees
The average number of employees changed during the year under review as follows:
The average number of employees includes employees on parental leave and temporary personnel, but does not include trainees and employees in the passive phase of partial retire-ment (Altersteilzeit).
Other disclosures
Employees 2014 2013 %
Women 233 223 4.5
Men 351 344 2.0
Total 584 567 3.0
€ mn 2014 2013 %
Financial guarantee contracts
and guarantees 268.9 225.5 19.2
Contingent liabilities from
irrevocable loan commitments 1,704.2 1,213.2 40.5
Other commitments 23.9 16.2 47.5
thereof: within one year 6.8 5.0 36.0
thereof: within one
to five years 16.1 9.5 69.5
thereof:
after more than five years 1.0 1.7 –41.2
Total 1,997.0 1,454.9 37.3
€ 000’s 2014 2013 %
Board of Managing Directors 3,370.3 3,157.9 6.7
Former members of the Board
of Managing Directors and
their surviving dependants 347.0 386.1 –10.1
Supervisory Board 426.7 272.2 56.8
Total 4,144.0 3,816.2 8.6
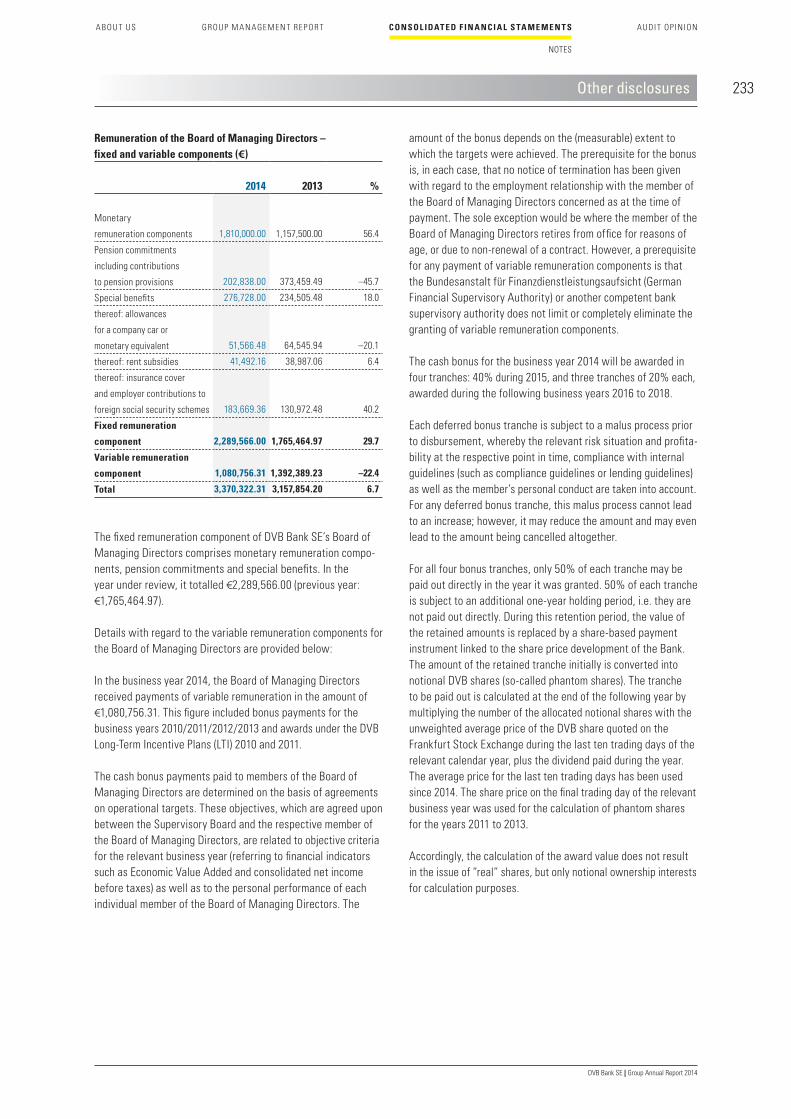
233
A B OU T US
GROUP M A N AGE MEN T RE P OR T
C ONSOL IDAT E D F IN A NC I A L S TA M E M E N T S
NOTES
AUDI T OP INION
DVB Bank SE | Group Annual Report 2014
The fixed remuneration component of DVB Bank SE’s Board of Managing Directors comprises monetary remuneration compo-nents, pension commitments and special benefits. In the year under review, it totalled €2,289,566.00 (previous year: €1,765,464.97).
Details with regard to the variable remuneration components for the Board of Managing Directors are provided below:
In the business year 2014, the Board of Managing Directors received payments of variable remuneration in the amount of €1,080,756.31. This figure included bonus payments for the business years 2010/2011/2012/2013 and awards under the DVB Long-Term Incentive Plans (LTI) 2010 and 2011.
The cash bonus payments paid to members of the Board of Managing Directors are determined on the basis of agreements on operational targets. These objectives, which are agreed upon between the Supervisory Board and the respective member of the Board of Managing Directors, are related to objective criteria for the relevant business year (referring to financial indicators such as Economic Value Added and consolidated net income before taxes) as well as to the personal performance of each individual member of the Board of Managing Directors. The
amount of the bonus depends on the (measurable) extent to which the targets were achieved. The prerequisite for the bonus is, in each case, that no notice of termination has been given with regard to the employment relationship with the member of the Board of Managing Directors concerned as at the time of payment. The sole exception would be where the member of the Board of Managing Directors retires from office for reasons of age, or due to non-renewal of a contract. However, a prerequisite for any payment of variable remuneration components is that the Bundesanstalt für Finanzdienstleistungsaufsicht (German Financial Supervisory Authority) or another competent bank supervisory authority does not limit or completely eliminate the granting of variable remuneration components.
The cash bonus for the business year 2014 will be awarded in four tranches: 40% during 2015, and three tranches of 20% each, awarded during the following business years 2016 to 2018.
Each deferred bonus tranche is subject to a malus process prior to disbursement, whereby the relevant risk situation and profita-bility at the respective point in time, compliance with internal guidelines (such as compliance guidelines or lending guidelines) as well as the member’s personal conduct are taken into account. For any deferred bonus tranche, this malus process cannot lead to an increase; however, it may reduce the amount and may even lead to the amount being cancelled altogether.
For all four bonus tranches, only 50% of each tranche may be paid out directly in the year it was granted. 50% of each tranche is subject to an additional one-year holding period, i.e. they are not paid out directly. During this retention period, the value of the retained amounts is replaced by a share-based payment instrument linked to the share price development of the Bank. The amount of the retained tranche initially is converted into notional DVB shares (so-called phantom shares). The tranche to be paid out is calculated at the end of the following year by multiplying the number of the allocated notional shares with the unweighted average price of the DVB share quoted on the Frankfurt Stock Exchange during the last ten trading days of the relevant calendar year, plus the dividend paid during the year. The average price for the last ten trading days has been used since 2014. The share price on the final trading day of the relevant business year was used for the calculation of phantom shares for the years 2011 to 2013.
Accordingly, the calculation of the award value does not result in the issue of ”real” shares, but only notional ownership interests for calculation purposes.
Other disclosures
Remuneration of the Board of Managing Directors – fixed and variable components (€)
2014 2013 %
Monetary
remuneration components 1,810,000.00 1,157,500.00 56.4
Pension commitments
including contributions
to pension provisions 202,838.00 373,459.49 –45.7
Special benefits 276,728.00 234,505.48 18.0
thereof: allowances
for a company car or
monetary equivalent 51,566.48 64,545.94 –20.1
thereof: rent subsidies 41,492.16 38,987.06 6.4
thereof: insurance cover
and employer contributions to
foreign social security schemes 183,669.36 130,972.48 40.2
Fixed remuneration
component 2,289,566.00 1,765,464.97 29.7
Variable remuneration
component 1,080,756.31 1,392,389.23 –22.4
Total 3,370,322.31 3,157,854.20 6.7

234
DVB Bank SE | Group Annual Report 2014
DVB Bank SE carries out a number of banking transactions with DZ BANK, including short-term borrowings, deposits, as well as foreign currency transactions. The business relationship between DVB Bank SE and DZ BANK AG, including other affiliated com-panies of the DZ BANK Group, is particularly close with regard to the refinancing business. The range of transactions also includes transactions with derivatives such as interest rate options, interest rate swaps or foreign exchange forwards.
The following table shows the transactions carried out with DZ BANK AG and other affiliated companies in the DZ BANK Group.
64.2 Share-based payments
In the year under review, an amount of €0.5 million was recorded as a provision in the current staff expenses in relation to share-based payments.
In the reporting period, 20,736.39 phantom shares were granted at a payout amount which is based on the price of the DVB share. The grant-date fair value amounted to €0.5 million, with reference to the share price on 30 December 2013 (€24.60). The grant-date fair value as at the current balance sheet date amounted to €0.5 million, with reference to the share price on 30 December 2014 (€24.65). The phantom shares granted will be fully paid out in 2015.
64.3 Pension liabilities to former members of the Board of Managing Directors
The defined benefit obligation (DBO) for pension liabilities to former members of the Board of Managing Directors and their surviving dependants amounts to €4.0 million (previous year: €4.0 million).
64.4 Related party disclosures
DVB Bank SE, as the parent company, prepares a report on rela-tionships with affiliated companies (dependent company report) in accordance with section 312 of the AktG, which is audited pursuant to section 313 of the AktG. The dependent company report includes a discussion of the relationships of DVB Bank SE with DZ BANK and its affiliated companies. Related party trans-actions are carried out on an arm’s length basis. Therefore, the auditors issued an unqualified audit opinion on the dependent company report.
Other disclosures
€ mn 2014 2013 %
Loans and advances to banks 825.8 0.4 –
Loans and advances
to customers 0.8 0.9 –11.1
Trading assets 0.0 55.5 –
Positive fair values
of derivative hedging
instruments 146.3 101.9 43.6
Total assets 972.9 158.7 –
Deposits from other banks 1,242.1 2,203.8 –43.6
Deposits from customers – – –
Securitised liabilities 7,798.7 8,333.4 –6.4
Trading liabilities 146.6 5.6 –
Negative fair values
of derivative hedging
instruments 12.5 34.4 –63.7
Subordinated liabilities 265.1 233.4 13.6
Total liabilities 9,465.0 10,810.6 -12.4

235
A B OU T US
GROUP M A N AGE MEN T RE P OR T
C ONSOL IDAT E D F IN A NC I A L S TA M E M E N T S
NOTES
AUDI T OP INION
DVB Bank SE | Group Annual Report 2014
The following tables show the transactions carried out by DVB Bank SE with its subsidiaries, joint ventures and associates.
65 Declaration of Compliance pursuant to section 161 of the AktG
Section 161 of the AktG requires the boards of managing directors and supervisory boards of listed companies to issue a declaration of compliance with the German Corporate Governance Code on an annual basis. They declare that the recommendations of the Code have been and are being complied with, and comment upon exceptions.
DVB Bank SE’s Board of Managing Directors and Supervisory Board published the Declaration of Compliance in accordance with section 161 of the AktG on 5 December 2014 in the German Federal Gazette (Bundesanzeiger) and simultaneously made the text permanently available to the public on the Bank’s website.
66 Financial statements of DVB Bank SE
DVB Bank SE is a parent company and, at the same time, a sub-sidiary of DZ BANK AG Deutsche Zentral-Genossenschaftsbank, Frankfurt/Main.
DZ BANK AG Deutsche Zentral-Genossenschaftsbank, Frankfurt/Main, prepared consolidated financial statements and a group management report as at 31 December 2014, which was sub-mitted to the Local Court of Frankfurt/Main and which includes DVB Bank SE.
Other disclosures
€ mn 2014 2013 %
Subsidiaries 5,788.4 5,254.4 10.2
Loans and advances
to banks 5,788.4 5,254.4 10.2
Subsidiaries 740.0 730.3 1.3
Joint ventures 18.8 22.5 –16.4
Associates 16.0 19.4 –17.5
Loans and advances
to customers 774.8 772.2 0.3
Subsidiaries 2.1 4.9 –57.1
Joint ventures 1.4 1.8 –22.2
Associates – 0.2 –
Trading assets 3.5 6.9 –49.3
Subsidiaries – – –
Positive fair values
of derivative hedging
instruments – – –
Total assets 6,566.7 6,033.5 8.8
€ mn 2014 2013 %
Subsidiaries 206.1 197.8 4.2
Deposits from other banks 206.1 197.8 4.2
Subsidiaries 70.2 85.0 –17.4
Associates 0.4 0.0 –
Deposits from customers 70.6 85.0 –16.9
Subsidiaries – – –
Trading liabilities – – –
Total liabilities 276.7 282.8 –2.2
236
DVB Bank SE | Group Annual Report 2014
To the best of our knowledge, and in accordance with the appli-cable financial reporting principles, the consolidated financial statements give a true and fair view of the assets, liabilities, financial position and profit or loss of the group, and the manage-ment report of the DVB Group includes a fair presentation of the development and performance of the business and the position of the DVB Group, together with a description of the principal opportunities and risks associated with the expected development of the DVB Group.
Frankfurt/Main, 4 March 2015The Board of Managing Directors
Wolfgang F. DrieseCEO and Chairman of the Board of Managing Directors
Ralf BedranowskyMember of the Board of Managing Directors
Bertrand GrabowskiMember of the Board of Managing Directors
Responsibility statement

237
DVB Bank SE | Group Annual Report 2014
A B OU T US
GROUP M A N AGE MEN T RE P OR T
C ONSOL IDAT ED F IN A NCI A L S TA ME MEN T S
AUDI T OP INION
Audit opinion (translation)
We have audited the consolidated financial statements prepared by DVB Bank SE, Frankfurt/Main, comprising the income state-ment, the statement of comprehensive income, the statement of financial position, the statement of changes in equity, the cash flow statement and the notes to the consolidated financial statements, together with the group management report for the business year from 1 January 2014 to 31 December 2014. The preparation of the consolidated financial statements and the group management report in accordance with IFRS as adopted by the European Union, and the additional requirements of German commercial law pursuant to section 315a (1) of the HGB are the responsibility of the Company’s management. Our responsibility is to express an opinion on the consolidated financial statements and the group management report based on our audit.
We conducted our audit of the consolidated financial statements in accordance with section 317 of the HGB and German gener-ally accepted standards for the audit of financial statements promulgated by the Institut der Wirtschaftsprüfer (Institute of Public Auditors in Germany). Those standards require that we plan and perform the audit such that misstatements materially affecting the presentation of the net assets, financial position and results of operations in the consolidated financial statements in accordance with the applicable financial reporting framework and in the group management report are detected with reason-able assurance. Knowledge of the business activities and the economic and legal environment of the Group and expectations as to possible misstatements are taken into account in the deter-mination of audit procedures. The effectiveness of the account-ing-related internal control system and the evidence supporting the disclosures in the consolidated financial statements and the group management report are examined primarily on a test basis within the framework of the audit. The audit includes assessing the annual financial statements of those entities included in consolidation, the determination of entities to be included in consolidation, the accounting and consolidation principles used and significant estimates made by management, as well as evaluating the overall presentation of the consolidated financial statements and the group management report. We believe that our audit provides a reasonable basis for our opinion.
Our audit has not led to any reservations.
In our opinion, based on the findings of our audit, the consoli-dated financial statements comply with IFRS as adopted by the EU and the additional requirements of German commercial law pursuant to section 315a (1) of the HGB and give a true and fair view of the net assets, financial position and results of operations of the Group in accordance with these requirements. The group management report is consistent with the consolidated financial statements and as a whole provides a suitable view of the Group’s position and suitably presents the opportunities and risks of future development.
Eschborn, Frankfurt/Main, 4 March 2015Ernst & Young GmbHWirtschaftsprüfungsgesellschaft
LöskenWirtschaftsprüfer(German Public Auditor)
StapelWirtschaftsprüfer(German Public Auditor)

DVB Bank SE | Group Annual Report 2014
DVB worldwide
Piräus
Curaçao
New York
London
Oslo
Singapore
Tokyo
EUROPEAMERICA ASIA/PACIFIC
Frankfurt/Main
Zurich
Hamburg
Athens
Shipping Finance
Aviation Finance
Offshore Finance
Land Transport Finance
Amsterdam
Further information
238 DVB worldwide
240 Key words
242 Glossary
246 Abbreviations
248 Imprint

Further information 239
DVB Bank SE | Group Annual Report 2014
Head office Frankfurt/MainDVB Bank SEPlatz der Republik 660325 Frankfurt/Main, GermanyPhone +49 69 9750 40, Fax +49 69 9750 4444 Europe AmsterdamDVB Bank SEAmsterdam BranchWTC Schiphol, Tower F, 6th FloorSchiphol Boulevard 2551118 BH Schiphol, The NetherlandsPhone +31 88 3997 900, Fax +31 88 3998 301
AthensDVB Bank SERepresentative Office Greece3, Moraitini Street &1, Palea Leof. Posidonos, Bldg. K4Delta Paleo Faliro175 61 Athens, GreecePhone +30 210 4557 400, Fax +30 210 4557 420
HamburgDVB Bank SEHamburg OfficeBallindamm 620095 Hamburg, GermanyPhone +49 40 3080 040, Fax +49 40 3080 0412
LondonDVB Bank SE London BranchPark House, 6th Floor16–18 Finsbury CircusLondon, EC2M 7EB, United KingdomPhone +44 20 7256 4300, Fax +44 20 7256 4450
OsloDVB Bank SENordic BranchHaakon VII’s gate 10161 Oslo, NorwayPhone +47 2 3012 200, Fax +47 2 3012 250
ZurichITF International Transport Finance Suisse AGWasserwerkstrasse 128006 Zurich, SwitzerlandPhone +41 44 3656 100, Fax +41 44 3656 200
North and South America CuraçaoDVB Bank America N.V.Zeelandia Office ParkKaya W.F.G. Mensing 14Willemstad, CuraçaoPhone +599 9 4318 700, Fax +599 9 4652 366
New York DVB Transport (US) LLC Representative Office of DVB Bank SE609 Fifth AvenueNew York, NY 10017-1021, USAPhone +1 212 588 8864, Fax +1 212 588 8936
DVB Capital Markets LLC 609 Fifth AvenueNew York, NY 10017-1021, USAPhone +1 212 858 2624, Fax +1 212 588 0424 Asia SingaporeDVB Bank SESingapore Branch77 Robinson Road # 30-02Singapore 068896Phone +65 6511 3433, Fax +65 6511 0700
DVB Group Merchant Bank (Asia) Ltd77 Robinson Road # 30-02Singapore 068896Phone +65 6511 3433, Fax +65 6511 0700
Tokyo DVB Transport Finance LtdTokyo Branch The Imperial Hotel Tower, 14th Floor (A-2)1-1, Uchisaiwaicho 1-chome, Chiyoda-kuTokyo 100-0011, JapanPhone +81 3 3593 7700, Fax +81 3 3593 7860 www.dvbbank.com e-mail: [email protected]
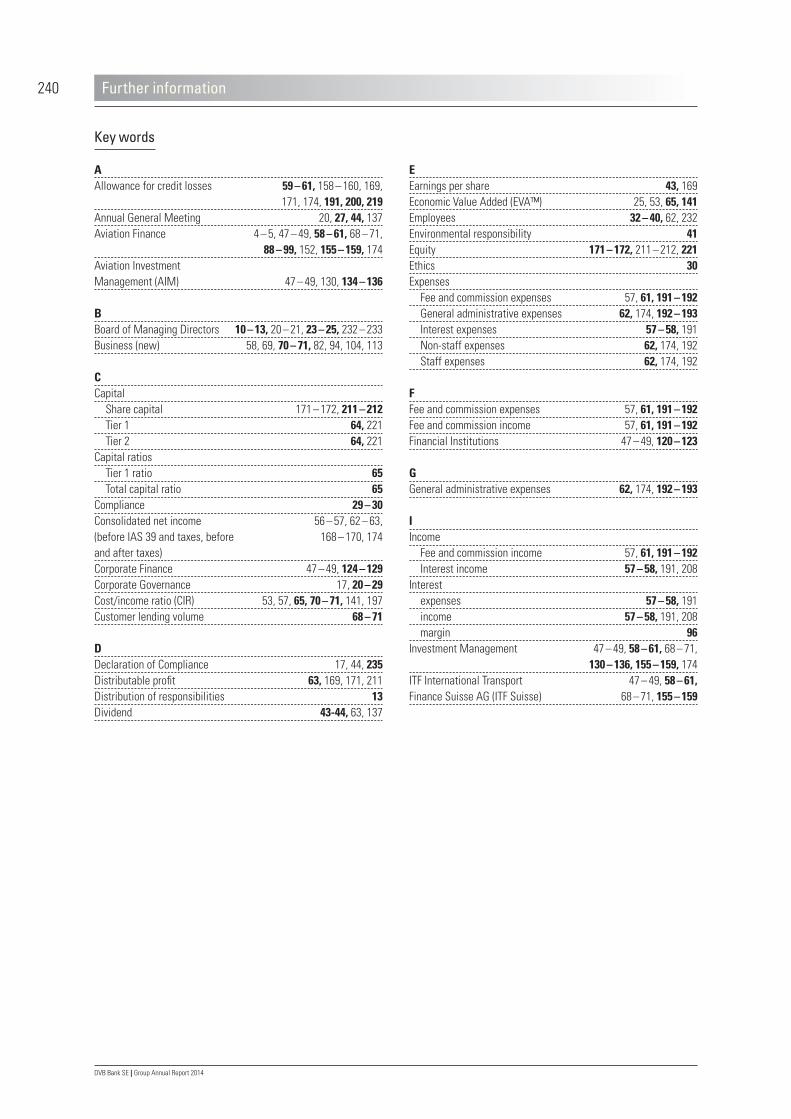
Further information240
DVB Bank SE | Group Annual Report 2014
E Earnings per share 43, 169Economic Value Added (EVA™) 25, 53, 65, 141Employees 32 – 40, 62, 232Environmental responsibility 41Equity 171 – 172, 211 – 212, 221Ethics 30Expenses Fee and commission expenses 57, 61, 191 – 192 General administrative expenses 62, 174, 192 – 193 Interest expenses 57 – 58, 191 Non-staff expenses 62, 174, 192 Staff expenses 62, 174, 192 F Fee and commission expenses 57, 61, 191 – 192Fee and commission income 57, 61, 191 – 192Financial Institutions 47 – 49, 120 – 123 G General administrative expenses 62, 174, 192 – 193 I Income Fee and commission income 57, 61, 191 – 192 Interest income 57 – 58, 191, 208Interest expenses 57 – 58, 191 income 57 – 58, 191, 208 margin 96Investment Management 47 – 49, 58 – 61, 68 – 71, 130 – 136, 155 – 159, 174ITF International Transport 47 – 49, 58 – 61, Finance Suisse AG (ITF Suisse) 68 – 71, 155 – 159
Key words
AAllowance for credit losses 59 – 61, 158 – 160, 169, 171, 174, 191, 200, 219Annual General Meeting 20, 27, 44, 137Aviation Finance 4 – 5, 47 – 49, 58 – 61, 68 – 71, 88 – 99, 152, 155 – 159, 174Aviation Investment Management (AIM) 47 – 49, 130, 134 – 136 B Board of Managing Directors 10 – 13, 20 – 21, 23 – 25, 232 – 233Business (new) 58, 69, 70 – 71, 82, 94, 104, 113 C Capital Share capital 171 – 172, 211 – 212 Tier 1 64, 221 Tier 2 64, 221Capital ratios Tier 1 ratio 65 Total capital ratio 65Compliance 29 – 30Consolidated net income 56 – 57, 62 – 63, (before IAS 39 and taxes, before 168 – 170, 174 and after taxes)Corporate Finance 47 – 49, 124 – 129Corporate Governance 17, 20 – 29Cost/income ratio (CIR) 53, 57, 65, 70 – 71, 141, 197Customer lending volume 68 – 71 D Declaration of Compliance 17, 44, 235Distributable profit 63, 169, 171, 211Distribution of responsibilities 13Dividend 43-44, 63, 137

Further information 241
DVB Bank SE | Group Annual Report 2014
L Land Transport Finance 6 – 7, 47 – 49, 58 – 61, 68 – 71, 108 – 119, 153, 155 – 159, 174Lending volume 57, 68, 148 – 152 N Net fee and commission income 56 – 57, 61, 169, 174, 191 – 192, 198Net interest income 56 – 58, 169, 174, (before and after allowance for credit losses) 191, 198, 231Net other operating income/expenses 57, 61, 169, 174, 193, 198 O Offshore Finance 8 – 9, 47 – 49, 58 – 61, 68 – 71, 100 – 107, 152, 155 – 159, 174Opportunities 164 – 165Own funds in accordance with CRR 64 – 65, 221 P Portfolio development 68 – 71Products Asset Management 47, 48, 90 – 91 Asset & Market Research 47, 49, 78, 90 – 91, 102, 111, 132 Client Account 47, 48 Corporate Finance Solutions 47, 48, 78, 102, 111, 126 Loan Participations 47, 49 Private Equity Sourcing & Investments 47, 48, 78, 90 – 91, 102, 111 Risk Distribution 47, 48, 78, 102, 111 Structured Asset Financing 47, 48, 90 – 91, 102, 111Profit Appropriation of profits 63, 169 Distributable profit 63, 169, 171, 211
R Rating 55Remuneration 23 – 26, 72 – 75, 232 – 234Result from financial instruments in 57, 62, 169, 174, 194, 198 accordance with IAS 39 from investments in companies 57, 61, 169, 174, 192, 198 accounted for using the equity methodRetained earnings 63, 168 – 169, 171 – 172, 211 – 212Return on equity (ROE) 53, 57, 65, 70 – 71, 141, 197Risk management 28, 84 – 85, 97, 106, 117, 142 – 143Risks 142, 147 – 164, 165 S Segment reporting 174, 196 – 198Share 42 – 43, 55, 211 – 212Share capital 171 – 172, 211 – 212Shipping & Intermodal 47 – 49, 130 – 133 Investment Management (SIIM)Shipping Finance 2 – 3, 47 – 49, 58 – 61, 68 – 71, 76 – 78, 151, 155 – 159, 174Social responsibility 41Supervisory Board 14 – 19, 21 – 23, 25 – 26Sustainability 30 – 41SWOT analysis 165

Further information242
DVB Bank SE | Group Annual Report 2014
Glossary
Advanced (Internal Ratings Based) Approach Method to determine a borrower’s counterparty credit risk. Instead of relying on external ratings (as prescribed by the stand-ardised approach), the Advanced Approach permits a bank to determine the risk on the basis of its in-house rating system – provided that this system fulfils the requirements defined by banking regulators for internal rating systems (also refer to ”Internal Rating Model”). Agent A person (either a natural person or a legal entity) acting on behalf of a third party (the principal). In the context of a syndi-cated loan, the agent acts on behalf of all lenders in the syndi-cate. The agent is responsible for loan administration and assumes the function of central payment agent. Anchor Handling Tug and Supply Vessel (AHTS) Vessel used for offshore operations and primarily aimed at supporting offshore platforms during towage to destination and anchoring operations Arranger Bank or financial institution that is responsible for originating and syndicating a transaction. Arrangers always have a leading role in the syndicate and often also assume the agent function. Asset Specifically, a transport asset to be financed Asset & Market Research Product description for generating in-depth analyses of transport assets and markets – DVB’s Asset & Market Research provides the fundamental basis for the activities of the Bank’s business divisions.
Basel III In 2010, the Basel Committee on Banking Supervision issued the Basel III Framework containing international standards for risk-adjusted capital adequacy of banks and financial services providers. These are basically applicable from 1 January 2014. Book building Type of syndication where the arranger does not assume the liquidity and placement risks associated with placing the syndi-cated loan Business risk Threat of losses from earnings fluctuations which may occur without any change in business strategy, and which are due to changed external circumstances (such as the general economic business climate, the product environment, client behaviour, and the competitive environment) Business volume Financial indicator measuring a company’s business performance. The business volume of a bank comprises its total assets plus contingent liabilities from irrevocable loan commitments. Cash flow Cash and cash equivalents paid and received during a given accounting period Club deal A transaction underwritten by a group of banks (usually a minimum of three and a maximum of 20–30 institutions) without the intention to subsequently reduce their exposure by way of syndication
Further information 243
DVB Bank SE | Group Annual Report 2014
Corporate Governance Code The German Corporate Governance Code (the ”Code”) provides rules designed to safeguard the efficiency and transparency of corporate governance and control, and to ensure that they are geared towards the long-term growth of enterprise value. The Government commission ”German Corporate Governance Code” reviews the Code once a year, against the background of ongoing national and international developments, and amends the wording if necessary. Counterparty credit risk Potential losses arising from an unexpected default, or a deterio-ration in our counterparties’ credit quality. Comprising lending, issuer, counterparty default and country risks, it represents DVB’s most significant individual risk exposure – this reflects the Bank’s business profile. Country risk Country risk is defined as the risk of loan losses or other monetary losses in a particular country, as a result of social/political and/or macro-economic developments or events. This comprises risk traditionally associated with the concept of country risk (conversion and transfer risk, payment freeze or moratorium), plus political and economic policy risks. DVB determines country risks on the basis of primary obligor groups. Customer lending volume (nominal) The aggregate of loans and advances to customers, guarantees and indemnities, irrevocable loan commitments, and derivatives. This figure is determined by way of consolidation in line with regulatory rules. DZ BANK DZ BANK Group is part of the German Cooperative Financial Services Network which comprises approximately 1,100 individual cooperative banks. Within the Network, DZ BANK acts as the central institution, and as a commercial bank in its own right.
Export credit agency (ECA) Organised in a similar way to insurance companies, export credit agencies provide cover for specific export transactions – usually on a statutory basis – and extend loans. Final take The portion of a transaction allocated to a specific bank, which it retains on its own books. In the event of oversubscription, the final take may be lower than that bank’s commitment. Fracking Hydraulic fracturing is a well-stimulation technique in which rock is fractured by a hydraulically pressurized liquid made of water, sand, and chemicals. The high-pressure fluid is injected into a wellbore to create cracks in the deep-rock formations through which natural gas, petroleum, and brine will flow more freely. Freighter/cargo aircraft Purpose-built or converted passenger planes for the transport of air cargo. Examples include the long-haul Boeing 777-200LRF and the short-haul Boeing 737-300SF. Incumbent The largest, dominating railway company in a specific market or geographic area Internal Rating Model (IRM) Statistical model used to estimate the probability of default associated with a given client, the expected loss given default for the unsecured portion of a loan, and the anticipated extent of the claim at the time of default – the exposure at default

Further information244
DVB Bank SE | Group Annual Report 2014
International Financial Reporting Standards (IFRS)/ International Accounting Standards (IAS) International accounting standards published by the International Accounting Standards Board (IASB). The purpose of IFRS is to provide investors with relevant information about an enterprise – on the net assets, financial position, and results of operations – to make investment decisions. Moreover, IFRS enhance trans-parency and improve the comparability of financial statements on an international level. Lead Arranger Also referred to as ”Mandated Lead Arranger and Bookrunner” – a bank with the mandate for originating, syndicating and execut-ing a transaction. The mandate may also include underwriting the transaction. Lending Policies DVB’s lending standards Liquidity risk The threat that current and future payment obligations may not be met within the specified time, or to the specified extent Loan Participations Denotes the business activities of DVB’s subsidiary ITF Inter-national Transport Finance Suisse AG, which is actively partici-pating in international senior asset-based lending MaRisk Abbreviation of Minimum Requirements for Risk Management in Banks – a set of rules and regulations issued by the German Federal Financial Supervisory Authority (BaFin) to define the requirements for the risk management systems of German financial institutions Market price risk The potential loss that the Bank might incur on its positions through price fluctuations in the equity, foreign exchange and interest rate markets (including associated derivatives) Medium-term notes (MTN) Listed medium-term debt securities
Narrowbody/single-aisle aircraft Short- to medium-haul aircraft with between 130 and 200 seats, used on routes such as Frankfurt–Amsterdam. It is the most popular category in terms of fleet size. Typical examples are the Airbus A320 and the Boeing 737. OASIS Object Finance Administration and Security Information System: DVB’s proprietary database application for analysing and managing credit portfolios Offshore Usually refers to crude oil production using maritime drilling platforms. Operating lease A lease where the lessor retains all the material risks and rewards incidental to ownership of the leased assets Operational risk (OpRisk) In accordance with the German Solvency Regulation, DVB defines operational risk as the risk of losses resulting from inadequate or failed internal processes or systems, from human error, or from external events. Passenger-km Measure for the transport performance an operator provides to passengers Passenger train-km The number of kilometres travelled by passenger trains Platform Supply Vessel (PSV) Vessel used for offshore operations and dedicated to the transport of goods and personnel to offshore platforms Political risk insurance Insurance cover to protect against political risks Private Equity Sourcing & Investments Product description for funds initiated and managed by DVB’s Investment Management division providing the Bank’s clients with equity products to finance their investment projects

Further information 245
DVB Bank SE | Group Annual Report 2014
Regional aircraft Smaller aircraft with between 50 and 110 seats, used on shorter routes with less demand or for off-peak services. Examples include the Bombardier CRJ200 or the Embraer E170. Risk Distribution Partial syndication of large-sized loans on the international interbank market, for the purposes of transferring risks and raising liquidity Sale-and-lease-back transaction Special form of leasing, where an asset (for example, a transport asset) is sold and immediately leased back for continued use Semi-submersible (semi-sub) vessel An offshore platform equipped with a drilling rig which is partly submerged in order to gain in stability Ship covered bond Debt security under German law which is backed by long-term lending exposures collateralised by ship mortgages Shortline A small or mid-sized railroad company that operates over a relatively short distance relative to larger, national railroad networks Stress test Banks use stress tests to analyse potential losses which may arise in a crisis environment, in order to take adequate counter-measures in good time. Structured Asset Financing Product description, comprising traditional asset finance, as well as tailor-made and structured solutions for complex financing projects in the Shipping Finance, Aviation Finance, Offshore Finance and Land Transport Finance divisions
Tapering The gradual but regular reduction of a central bank’s expansive monetary policy measures; at present this can be observed in the US where the Federal Reserve is gradually scaling back its bond-buying programmes. Tonne-km The transport of one tonne of goods over a distance of one kilometre. Transport Finance Generic term for DVB’s Shipping Finance, Aviation Finance, Offshore Finance and Land Transport Finance divisions Underwriter A lender giving a firm commitment – prior to drawdown – to underwrite a portion of the aggregate loan facility, with the intention to place a part of the underwritten portion with one or several third-party banks, by way of syndication Value at risk Measure indicating the maximum potential loss which may arise within a given time period, with a given probability (the confidence interval or confidence level) Value maintenance clause (VMC) A standard clause included in loan agreements, which comes into effect if the value of collateral falls below a certain share of the outstanding loan amount, thus exceeding the maximum permitted loan-to-value ratio. In these cases, the Bank can request the borrower to make an early repayment of a part of the loan principal, or to furnish additional collateral. Widebody/twin-aisle aircraft Larger aircraft with between 250 and 450 seats, often used on longer flights such as Frankfurt–Hong Kong. Typical examples are the Airbus A330, the Boeing 747, the new Boeing 787 and Airbus A380.

Further information246
DVB Bank SE | Group Annual Report 2014
DVBCF DVB Corporate Finance dwt Dead weight tonnes EVA™ Economic Value Added E&P (Capex) Exploration and production (capital expenditure) ECB European Central Bank EU European Union Fed US Federal Reserve FPSO Floating Production Storage and Offloading GDP Gross domestic product HGB Handelsgesetzbuch (German Commercial Code)
Abbreviations
AAM Aviation Asset Management AfS financial instruments Financial instruments available for sale AIM Aviation Investment Management AktG Aktiengesetz (German Public Limited Companies Act) ALCO Asset Liability Committee AQR Asset Quality Review bp Basis points CIR Cost/income ratio CRR Capital Requirements Regulation DCGK Deutcher Corporate Governance Kodex

Further information 247
DVB Bank SE | Group Annual Report 2014
PDP Pre-delivery payments ROE Return on Equity RPK Revenue passenger kilometre SE Societas Europaea (European public limited-liability company) SIC Standing Interpretations Committee SIIM Shipping & Intermodal Investment Management VaR Value at risk VAT Value added tax VMC Value Maintenance Clause WpHG Wertpapierhandelsgesetz (German Securities Trading Act)
IATA International Air Transport Association KWG Kreditwesengesetz (German Banking Act) LNG Liquefied Natural Gas LPG Liquefied Petroleum Gas LTI Long-Term Incentive Plan LTV ratio Loan-to-value ratio M&A Mergers & Acquisitions NPL Non-Performing Loans OSV Offshore Support Vessel pp Percentage points

Further information248
DVB Bank SE | Group Annual Report 2014
PhotosBoard of Managing Directors of DVB Bank SE (page 10–11) andSupervisory Board of DVB Bank SE (page 15):René Spalek, Offenbach/Main, Germany
Key events (inner cover page): DVB Bank SE, Frankfurt/Main, Germany
Employees and sustainability (pages 32–37, from left to right)Lewis Sutherland, Rosie Buaku, David Goring-Thomas, Özlem Ayata, Anders Baardvik, Corinna Sylira, Cornelia Urban, Paul da Vall, Patricia Galloway,Sohail Haji-Essa, Eva Meyer, Stephan Sayre,Björn Batenburg, Ying Liu, Keith McRae,Janice Davies, James Treseder-Griffin, Britta Nolle,DVB Bank SE, London, United KingdomPhotos by Linda Slingerland, DVB Bank SE, Amsterdam, The Netherlands
Shipping FinanceFront cover and pages 2–3:Odfjell SE, Bergen, NorwayPages 76–77:Linda Slingerland, DVB Bank SE, Amsterdam, The NetherlandsShipping Finance Deal of the Year 2014 (page 83):China Shipping Container Lines Co. Ltd, Shanghai, China
Aviation FinanceFront cover and pages 4–5 and 88–89: Bert van Leeuwen, DVB Bank SE, Amsterdam, The NetherlandsAviation Finance Deal of the Year 2014 (page 95): Apollo Aviation Group, LLC, Miami, USA
Offshore FinanceFront cover and pages 6–7:Harald M. Valderhaug, Skjongholmen, NorwayPages 100–101: Shutterstock, Inc., New YorkOffshore Finance Deal of the Year 2014 (page 105):Songa Offshore SE, Oslo, Norway
Land Transport FinanceFront cover, pages 8–9 and 108–109: Wouter Radstake, DVB Bank SE, Frankfurt/Main, Germany Land Transport Finance Deal of the Year 2014 (page 115):Florida East Coast Railway, St. Augustin, USA
Corporate FinanceCorporate Finance Deal of the Year 2014 (page 128):Jetscape Aviation Group Ltd, Virgin Islands
Imprint
DVB Bank SEPlatz der Republik 660325 Frankfurt/Main, Germany
Elisabeth WinterHead of Group Corporate CommunicationsManaging DirectorPhone +49 69 9750 4329
Lisa Boose-KirwelGroup Corporate CommunicationsManager Investor RelationsPhone +49 69 9750 4435
Sabine SchliebenGroup Corporate CommunicationsManager Investor & Online RelationsPhone +49 69 9750 4449
Design realisationStudio Oberländer GmbH, Frankfurt/Main, Germany
The Annual Report 2014 is published in English and German.It is available as PDF file on our webpage www.dvbbank.com > Investors > Publications > Financial reports.
After scanning this QR code with your smartphone,you will have direct access to our website.


DVB Bank SE | Konzern-Geschäftsbericht 2014
Financial calendar 2015
2 March Annual Accounts Press and Analysts’ Conference
5 March Publication of the single-entity Annual Report 2014on our website
26 March Publication of the Group Annual Report 2014on our website
13 May Publication of the Interim Management Statement during the first half of 2015(for the first three months, ending on 31 March 2015)
25 June Annual General Meeting Frankfurt/Main
26 June Dividend payment (German Securities ID 804550)
13 August Publication of the Half-Yearly Financial Report 2015
12 November Publication of the Interim Management Statementduring the second half of 2015(for the first nine months, ending on 30 September 2015)
4 December Publication of the 14th Declaration of Compliance for 2015/2016