GROUNDWATER RESOURCES IN LEE AND WHITESIDE COUNTIES
75
STATE OF ILLINOIS WILLIAM G. STRATTON. Governor GROUNDWATER RESOURCES IN LEE AND WHITESIDE COUNTIES BY ROSS HANSON DEPARTMENT OF REGISTRATION AND EDUCATION VERA ML BINKS, Director STATE WATER SURVEY DIVISION A. M. BUSWELL, Chief URBANA, ILLINOIS (Printed by the authority of the State of Illinois) ISWS RI 26 Loan c.3
Transcript of GROUNDWATER RESOURCES IN LEE AND WHITESIDE COUNTIES

STATE OF ILLINOIS
WILLIAM G. STRATTON. Governor
GROUNDWATER RESOURCES
IN
LEE AND WHITESIDE COUNTIES
BY
ROSS HANSON
DEPARTMENT OF REGISTRATION AND EDUCATION
VERA ML BINKS, Director
STATE WATER SURVEY DIVISION
A. M. BUSWELL, Chief
URBANA, ILLINOIS
(Printed by the authority of the State of Illinois)
ISWS RI 26 Loan c.3

ILLINOIS STATE WATER SURVEY LIBRARY COPY
DATE DUE
ISWS RI 26 Loan c.3
Hanson, Ross GROUNDWATER RESOURCES IN LEE AND WHITESIDE COUNTIES
05031503
DEMCO

REPORT OF INVESTIGATION NO. 26 S H I M STATE WATER SURVEY LIBRARY COPY JY 19
STATE OF ILLINOIS
WILLIAM 6. STRATTON, Governor
GROUNDWATER RESOURCES
IN
LEE AND WHITESIDE COUNTIES
BY
ROSS HANSON
DEPARTMENT OF REGISTRATION AND EDUCATION
VERA M. BINKS, Director
STATE WATER SURVEY DIVISION
A. M. BUSWELL, Chief
URBANA, ILLINOIS
(Printed by the authority of the State of Illinois)

FIG. 1.

TABLE OF CONTENTS
Page SUMMARY 1
INTRODUCTION 3
Location of the Area 3 Acknowledgments 3 Sources of Groundwater 3 Groundwater Levels 6 Pumpage Gallons per Capita Demand and 6
HISTORY OF PUBLIC AND INDUSTRIAL SUPPLIES 9
LEE COUNTY
1. AMBOY 10 Amboy Milk Company 10 Green River Ordnance Plant 10 Lee County Nursing Home 10
2. ASHTON 10
3. COMPTON 11
4. DIXON 11 Beier Brothers Bakery 12 Borden Company 12 Bus Terminal 12 Coss Dairy 13 Columbus McKinnon Chain Corporation 13 Dixon Airport 13 Dixon Country Club 13 Dixon Ice and Fuel 13 Eichlers 13 Freeman Shoe Company 13 Lawton Dairy 13 Lincoln Motel 13 Medusa Portland Cement Company 13 Public Service Company of Northern Illinois 14 Reynolds Wire Company 14 Standard Dairy Company 14
5. DIXON STATE HOSPITAL 14
6. FRANKLIN GROVE 15
7. HARMON 15
8. LEE 15
9. NELSON 16
10. PAW PAW 16
11. STEWARD 16
12. SUBLETTE 16 Helbig Cheese Company 16
13. WEST BROOKLYN 16

T A B L E OF CONTENTS (Continued)
P a g e HISTORY OF PUBLIC AND INDUSTRIAL S U P P L I E S (Continued)
WHITESIDE COUNTY
14. DEER GROVE 17
Chicago, Bur l ing ton & Quincy R .R 17
15. ERIE 17
S u p r e m e D a i r y P r o d u c t s Company 18
16. FULTON 18
A m e r i c a n A g r i c u l t u r a l and C h e m i c a l Company _ 18
17. MORRISON 18
Carna t ion Company 19
18. PROPHETSTOWN 19
E c l i p s e Lawn Mower Company 19
19. ROCK F A L L S 20
Geyer Manufac tu r ing Company 20 F o r t D e a r b o r n Manufac tu r ing Company 20 In t e rna t iona l H a r v e s t e r Company 20 C h a r l e s O. L a r s o n Company 20 L a w r e n c e P a r k . 21 P a r i s h - A l f o r d F e n c e and Machine Company 21 R u s s e l , B u r d s a l l and Ward 21 S t e r l i ng Soy Bean Mill. 21 R i v e r s i d e N u r s e r y 21
20. STERLING 21
A and S D a i r y 22 Borden Cheese Company 22 Coca Cola Bot t l ing Company 22 De A n n e ' s 22 G r e b n e r ' s Shoe S to re 22 Hey B r o t h e r s 22 I l l inois N o r t h e r n U t i l i t i e s Company 23 L a w r e n c e B r o t h e r s Manufac tu r ing Company 23 Nat iona l Manufac tu r ing Company 23 N o r t h w e s t e r n S tee l and Wi re C o m p a n y 23 P e o p l e s Ice and Coal Company 26 Senne f f -Her r Company 26 S in i s s ipp i P a r k . 26 S t e r l i ng S ta te P o l i c e H e a d q u a r t e r s 26 Stutzke H a r d w a r e S t o r e 26 Wahl C l ippe r C o r p o r a t i o n 26
21 . TAMPICO 26

T A B L E OF CONTENTS (Continued)
P a g e RESULTS OF CHEMICAL ANALYSES 27
T o t a l Disso lved Sol ids 27 H a r d n e s s 27 I ron and Manganese 27 F luo r ide s . . 27 N i t r a t e s 27 Chlor ide and Sulfate 27 Alka l in i ty 28 Methane 28
DISCUSSION OF WATER QUALITY . 28
ILLUSTRATIONS
F i g u r e P a g e
1 S ta te of I l l inois - loca t ion of Lee and Whi tes ide Count ies B
2 Loca t ion of W e l l s in L e e and Whi tes ide Count ies 2
3 W a t e r su r face con tou r s for dr i f t and l i m e s t o n e 4
4 W a t e r su r f ace c o n t o u r s for sands tone 5
5 P u m p a g e r e c o r d s at Dixon, Fu l ton , M o r r i s o n , S t e r l i n g 7
6 Hydrog raphs - m u n i c i p a l we l l s 9
7 Loca t ions of w e l l s with key n u m b e r s to c h e m i c a l a n a l y s e s in Tab le s III and IV -. 24, 25
TABLES
A Annual P u m p a g e - Fu l ton , M o r r i s o n , Dixon, S t e r l i ng 8
B Popu la t ion and Gal lons P e r Capi ta Demand 9
I L e e County Wel l s 29
II Whi te s ide County Wel ls 44
III L e e County Well W a t e r s - Chemica l A n a l y s e s 61
IV Whi te s ide County Well W a t e r s - C h e m i c a l A n a l y s e s 64

SUMMARY
This report is a continuation of a se r ies of a r e a l investigations of groundwater r e sources which is being conducted by the State Water Survey Division.
Available records a re tabulated of 529 wells which penetrate the sandstone, l imestone, and glacial drift aquifers. Daily pumpage from the aquifers in this Area was estimated in 1952 to average as follows:
Sandstone - 5.5 million gallons Limestone - 1.6 million gallons Glacial Drift - 2.3 million gallons
It is to be understood that this Division does not have information on every well in the Area but all large capacity municipal and industr ia l wells a re included plus numerous p r i vate wells. The wells not included herein would be only small-capacity domestic wells.
Fulton, Morrison, Dixon and Sterling have kept daily pumpage records . Fulton and Ster ling showed relative reductions in the daily per-capi ta demand. Morrison and Dixon showed reductions until 1940 but in the 1940-1950 period there was a noticeable increase in the per-capi ta use.
1

FIG. 2 -LOCATIONS OF WELLS IN LEE AND WHITESIDE COUNTIES

3
INTRODUCTION
This report of Groundwater Resources in Lee and Whiteside Counties is a continuation of a se r ies of areal investigations by the Illinois State Water Survey of water resources within the State. These investigations were initiated by the Water Survey due to the constantly increasing number of requests, throughout the State, for information on the occurrence, availability and quality of groundwater supplies. These requests have become progressively more numerous not only because of the droughty conditions which have prevailed during the past two yea r s but because of increased water uses in concentrated a reas .
The a reas thus far reported on a r e not connected, but have been selected because of the need for publishing specified areal mater ia l which should be helpful to well owners and dr i l l e rs . It is hoped that making such material available will create interest on the part of well owners to keep more complete well records in order to facilitate the meeting of future well problems.
The Water Survey has records of 529 wells in the two counties - 241 in Lee County and 288 in Whiteside County. These are tabulated in Tables I and II. The wells penetrate one or more of four water-bearingformations which a re referred to in this report as sandstone, limestone (dolomite), shallow and deep glacial drift.
Location of the Area
Lee and Whiteside Counties abut each other from east to west, respectively are located in the near northwest corner of the State (Figure 1). Carrol l and Ogle Counties adjoin the Area on the north, DeKalb County on the east; La-Salle, Bureau and Henry Counties on the south; and Rock Island County and the Mississippi River form the western boundary.
Dixon is the seat and largest city of Lee County with a 1950 population of 11,468. Other municipalities within Lee County having groundwater supplies, have a combined population of 5910. The total population of the County is 36,451.
Morrison is the seat of Whiteside County with a population of 3531. Sterling and Rock Fal l s have a common distribution system supplying t h e largest municipal population in Whiteside County of 20,800. Other municipalit ies in Whiteside County having groundwater supplies have a combined population of 7337. The total population of Whiteside County is 49,330.
The combined population of the Area is 85,781. The total population of all municipali
t ies having groundwater supplies amounts to 49,039 leaving a rural population of 36,742 which is dependent on private wells for water.
Acknowledgments The investigation was made under the ad
ministration of Dr. A. M. Buswell, Chief of the State Water Survey Division and under the direction of H. E. Hudson, J r . , Head of the Engineering Subdivision who with H. F. Smith, Engineer, provided counsel during the progress of the work.
The discussion on the resul ts of the chemical analyses was prepared by T. E. Larson, Head of the Chemistry Subdivision who arranged the data in Tables III and IV.
Members of the Survey staff, past and p r e s ent, collected much of the information which is used in the preparation of this report .
Waterworks operators , well d r i l l e r s and well owners have been very helpful in supplying technical and historical data.
Par t icular acknowledgment is made to the following for their cooperation and furnishing of records: J. W. Shipma, Superintendent of Fulton Water Department; Glen F. Coe, Manager Dixon Water Company, Harry E. Traum, Superintendent of Morrison Water and Sewage Department; J. C. Moomau, Manager and H. E. Hall, Superintendent, Northern Illinois Water Corporation at Sterling-Rock Fal ls .
Sources of Groundwater Three sources of groundwater a r e known
to occur in Lee and Whiteside Counties: (1) sandstone, (2) limestone (dolomite), (3) glacial drift.
Sandstone. The sandstone aquifers underlie the Area and are a source of water to municipal and industrial wells in Amboy, Dixon, Franklin Grove (new well), Paw Paw and West Brooklyn in Lee County and in Fulton, Morrison and Sterling in Whiteside County (Figure 2).
During production tes t s by the State Water Survey, these sandstones have been observed to yield 350 to 1000 gallons per minute. After some rehabilitation work in the two wells at the.Dixon State Hospital in 1952, the No. 1 well was reported to produce 1475 gallons per minute with a drawdown of 42.0 feet after six hours pumping.
The pumpage from the sandstone wells at Fulton, Morrison, Sterling and Dixon is metered and accurate records a r e maintained. These pumpages, plus an estimate of the average daily withdrawal from other known sandstone wells in the two counties, amounted to an average 5.5 millions gallons daily, in 1952.

FIG. 3 - WATER SURFACE CONTOURS FOR DRIFT AND LIMESTONE

FIG. 4 - WATER SURFACE CONTOURS FOR SANDSTONE

6
Limestone. Wells producing water from limestone deposits a re found in the northern part of the two Counties and in the southwestern part of Whiteside County (Figure 2).
Municipal wells at Ashton, Er ie (old well), Franklin Grove (old well), Prophetstown and Sublette penetrate limestone. Yields from this aquifer a re quite variable, dependent largely on the extent of crevicing. The specific capacit ies a r e ordinarily low and wells penetrating the l imestone in this a rea a re known to fall off considerably in their yields and a re not r e garded as dependable in sustaining yields for sizable supplies for municipal or industrial uses .
E r i e constructed a new well into sand and gravel deposits in Septemher 1953 and Franklin Grove completed a new well into sandstone in September 1954.
Daily pumpage from the tabulated wells that a re known to penetrate limestone was e s timated to average 1.6 million gallons, in 1952.
Glacial Drift. Wells furnishing water from the glacial drift are found in the southern part of the two counties and in the eas tern part of Lee County and western part of Whiteside County (Figure 2).
In some of the Area, part icularly the e a s te rn and southeastern par ts of Lee County (Zone III, F igure 3) where the glacial drift has greater thickness, shallow dug wells have failed in r e cent yea r s . In many such cases the wells have been deepened by drilling and installing a casing to a lower source in the drift. Some of these wells have been deepened to more than 300 feet. A number of wells were found which were drilled originally to the lower aquifer. The Compton and Lee municipal wells, penetrate this aquifer at 330 feet depth and a r e reported to yield 60 to 70 gallons per minute.
In Zone II (Figure 3) a r e found shallow wells where dr ive points a re used extensively. The villages of Harmon and Tampico obtain water from points driven to depths of 20 or 30 feet. One large-acreage stock farm has a dr ive point in every pasture field.
Jus t south of Rock Fal l s some tubular wells have recently been developed in sand and gravel with yields of more than 500 gallons per minute. The new well at E r i e was finished in sand and gravel at a depth of 162 feet and was reported to yield 964 gallons per minute, after 15 hours pumping, with a drawdown of 12 feet.
The Steward municipal well is finished in sand and gravel at 100 feet depth, and repor t edly yields 40 gallons per minute.
Daily pumpage from the tabulated sand and gravel wells in the Area was estimated to average 2.3 million gallons, in 1952.
Groundwater Levels
The physical description of each well of record in the files of this Division is tabulated in Table I for Lee County and Table II for Whiteside County. A complete description of the well is not available in all cases. The information has come from various sources , part icularly as to the farm and domestic p r i vate supplies. Fo r municipal and industrial supplies t h e information has been received largely f r o m owners, operators , engineers, well d r i l l e r s , pump manufacturers or o thers directly interested in the part icular supply.
Sandstone Water Levels. The water su r face (piezometric) contours (Figure 4) have been plotted from data obtained from municipal and industrial sandstone supplies at Fu l ton, Morrison, Sterling, Dixon, Amboy, Dixon State Hospital and Green River Ordnance Plant (now abandoned). The contours at the outer edges of the Area coincide with the sandstone piezometric surface map which this Division has prepared for the northwest region of the State. The contour elevations a re in feet above mean sea level.
Limestone Water Levels. The water s u r face contours (Zone I, Figure 3) for the l imestone wells have been plotted from data furnished by well owners, d r i l l e r s and engineers. The contour elevations a r e in feet above mean sea level and a re based on information of depths to water in the wells. In some cases actual tape measurements were made and referenced to known elevations. The contours a r e drawn only where water level data have been available. No attempt was made to draw in contours in large a reas where the data were deficient.
Glacial Drift Water Levels. There a re two well-defined aquifers in the glacial drift (Zones II and III, Figure 3). In Zone II the wells a re shallow in depth and are either dug or a r e drive points. The villages of Tampico and Harmon obtain water from drive points at sha l low depths.
In Zone III the wells a re drilled to depths of 250 to 330 feet. Some of the wells in this zone were originally dug to shallow depths but were la ter deepened by drilling to a lower aquifer. No drive-point wells were found in this zone.
Pumpage and Gallons per Capita Demand
Four cities have complete pumpage records up to date. Dixon's records were started in 1915 and have been continuous. Sterl ing's r e cords began with the year 1929, Morrison in 1931, and Fulton in 1940. These data, for each year of record, a re shown in Table A.

7
FIG. 5 - PUMPAGE RECORDS FOR MUNICIPAL WELLS AT
DIXON, FULTON, MORRISON AND STERLING

8
Pumpage in the four cities has followed a s imi lar pattern. The variations pr ior to the ear ly 1940s a r e not diss imilar and beginning in the mid-1940s pumping in the four cities has shown a steady annual increase (Figure 5). An attempt has been made to explain the increased water use by comparing the increases in pumpage a n d population (Table B). The
population figures a r e taken from the U. S. Census repor ts for each ten years . The daily per capita demand through 1940 showed a de c rease for Morrison, Dixon and Sterling. Fu l ton showed a reduction through 1950. Morrison and Dixon showed considerable increases in the 1940-1950 period. Sterling showed a small increase for the same period.
TABLE A
ANNUAL PUMPAGE FOR
FULTON, MORRISON, DIXON, STERLING
Year Morrison Dixon Sterling Year Fulton Morrison Dixon Sterling Million Gallons Million Gallons
1915 268 1934 105 248 326
1916 280 1935 101 208 313
1917 319 1936 138 287 321
1918 294 1937 120 304 328
1919 240 1938 100 220 342
1920 247 1939 98 238 337
1921 221 1940 69 98 231 311
1922 239 1941 51 97 241 287
1923 267 1942 48 98 265 292
1924 226 1943 44 97 294 286
1925 216 1944 41 92 302 330
1926 216 1945 40 99 294 369
1927 219 1946 34 122 339 422
1928 215 1947 33 149 386 483
1929 248 375 1948 33 148 384 492
1930 247 351 1949 40 119 410 449
1931 156 226 342 1950 46 139 446 444
1932 141 204 295 1951 45 153 468 491
1933 142 221 285 1952 46 144 474 519

9
T A B L E B
WATER USE
POPULATION AND GALLONS P E R CAPITA DEMAND F O R
F U L T O N , MORRISON, DIXON, STERLING
Y e a r
1920
1930
1940
1950
F u l t o n P o p . gpcd.
2585 73
2706 47
M o r r i s o n P o p , gpcd.
3067 139
3187 84
3531 108
Dixon P o p . gpcd.
8191 83
9908 68
10671 59
11468 107
S t e r l i n g P o p . gpcd.
13905 69
16350 52
20800 58
HISTORY OF PUBLIC AND INDUSTRIAL GROUNDWATER S U P P L I E S IN
L E E AND WHITESIDE COUNTIES
It is in tended in t h i s Repor t of I n v e s t i g a t ion to inc lude a l l publ ic , s e m i - p u b l i c and i n d u s t r i a l g r o u n d w a t e r supp l i e s i n L e e and Whi t e s ide Coun t i e s in the S t a t e of I l l ino i s . T h e r e a r e a l s o p r i v a t e we l l s u p p l i e s inc luded in t h i s r e p o r t on which many of t h e d a t a have been t aken f r o m t h e Survey 1 s r e c o r d s p lus a d d i t iona l d a t a which have been co l l ec ted d u r i n g t h e s e v e r a l f ield t r i p s m a d e t o the A r e a i n the c o u r s e of p r e p a r a t i o n of t h i s r e p o r t .
No new mun ic ipa l supp l i e s have been i n s t a l l ed i n e i t h e r L e e o r Whi t e s ide County s i n c e 1950 but t h e r e a r e s o m e new w e l l s added to t h e then e x i s t i n g supp l i e s . A d e s c r i p t i o n of e a c h publ ic g r o u n d w a t e r supply wi th in t h e S ta te i s given in S ta te W a t e r Survey Bu l l e t i n No. 40 publ i shed in 1950. In t h i s R e p o r t of I n v e s t i g a t ion only a br ie f e x t r a c t is given of t h e h i s t o r y of each publ ic supply in L e e and Whi t e s ide Coun t i e s p r i o r to 1950 but a l l new i n f o r m a t ion which h a s b e e n m a d e ava i l ab l e subsequen t to 1950 is inc luded h e r e i n . A t abu la t ion of a l l we l l s o f p r i v a t e , publ ic o r i n d u s t r i a l c l a s s i f ica t ion upon wh ich s o m e p h y s i c a l i n fo rma t ion h a s been obta ined i s shown in T a b l e I , for L e e County and T a b l e I I for Whi t e s ide County . T h e r e s u l t s of l a b o r a t o r y a n a l y s e s of we l l w a t e r s a r e shown in T a b l e III for L e e County and T a b l e IV fo r Whi t e s ide County. A key n u m b e r i s given t o each l a b o r a t o r y a n a l y s i s fo r c r o s s r e f e r e n c e to identify t h e wel l o w n e r and t h e loca t ion of t h e we l l in T a b l e s I and II , or t h e r e s u l t s of the a n a l y s e s in T a b l e s III and IV.
All e l e v a t i o n s a r e i n feet above m e a n s e a l e v e l d a t u m , obta ined f rom t h e Uni ted S t a t e s Geolog ica l Su rvey topograph ic m a p s . T h e 1950 popula t ion of e a c h munic ipa l i ty is shown in p a r e n t h e s i s following i t s n a m e . H y d r o g r a p h s fo r 13 mun ic ipa l and t h e Dixon S t a t e Hosp i t a l w e l l s a r e shown in F i g . 6 . FIG. 6 - HYDROGRAPHS
MUNICIPAL W E L L S

10 LEE COUNTY
Amboy (2128)
A public water supply was installed for the City of Amboy in 1892. Water is obtained from two wells.
Well No. 1, or North Well, was drilled in 1892 to a reported depth of 2012 feet below a ground surface elevation of 750. The well is located near East Avenue between Main and Chester Streets and was reported to be cased with 10-inch pipe to 30.5 feet. The hole was 10 inches in diameter from 0 to 57 feet and six inches in diameter below 57 feet. A 5-inch l iner was set between 1200 and 1400 feet. In 1932 Layne-North Central Company reported the well measured 357.5 feet deep.
Well No. 1 is maintained for emergency use. Water from the well is discharged directly to the mains.
Well No. 2 was drilled to a depth of 1100 feet in 1924, and is located 77 feet southeast of Well No. 1. It is reported to be 12 inches in diameter at the top and 6 inches at the bottom. Otherwise, the casing record is not known. All water from Well No. 2 i2 chlorinated, softened and treated for iron removal. A summary of laboratory analysis (No. 112906) of the water is given in Table III, key number 5.
The hydrograph for the Amboy city wells is shown in Figure 6.
Pumpage for the city of Amboy for May 1951 averaged 134,177 gpd.
Amboy Milk Company. The Amboy Milk Company, located about 400 feet southwest of the Amboy city wells, has a well drilled in 1939 to a depth of 1120 feet. The 12-inch casing was set to 80 feet and was cemented in place.
A production test was made by the State Water Survey on February 16-17, 1939. The non-pumping water level was three feet below the pump base and after 12 hours pumping at a rate of 560 gpm the drawdown was 133 feet.
In December 1947, Mr. A. L. Fluehr, Plant Engineer, reported that the non-pumping water level was 17 feet below the top of the well and, when pumping at a ra te of 600 gpm, the drawdown was 130 feet. In June 1951 the pumping equipment consisted of: 167 feet of 6-inch column pipe; 5-stage, M. C, American Well Works (Shop No. 69089) water lubricated turbine pump over-al l length 54 inches and rated at 600 gpm; 20 feet of 6-inch suction pipe; 167 feet of a i r line; 40 hp U.S. Motor.
In June 1951 the non-pumping water level was reported to be 52 feet and the drawdown was 90 feet when pumping at 600 gpm.
A summary of an analysis (Lab. No. 111085) of the water is given in Table III, key number 4.
Pumpage from the plant well is estimated to average 250,000 gpd per year but var ies from 5 to 10 million gallons pe r month.
The Amboy Milk Company plant uses water from the city supply for boi lers .
Green River Ordnance Plant. A number of wells into the St. Peter and Galesville sandstones were drilled in 1942 for the Green River Ordnance Plant, west of Amboy. Par t ia l data on some of the wells are shown in Table No. I. Laboratory analyses (Nos. 93150, 93173, 93446) of the water a re shown in Table III, key numbers 21, 26, and 25 respectively.
Lee County Nursing Home. Well No. 3 was dril led to depth of 330 feet in September 1953 for the Lee County Nursing Home, northwest of Eldena in Section 26, T. 21 N., R. 9 E. The well was cased with galvanized wrought iron casing from the surface to 80 feet below which the hole is open to 330 feet. Limestone was encountered at 33 feet.
A production tes t was made by Mr. R. H. Anderson, of C. K. Willett, Consulting Engineers , Dixon in October, 1953. The pump was set at 145 feet and with 150 feet of a i r line from three feet above the ground level (e levation 785). The water level before pumping was 48 feet and after two hours pumping at 96 gpm the drawdown was 44 feet. Pumping was then continued at an accelerated rate and after 5 1/2 hours at a final ra te of 186 gpm the drawdown was 89 feet.
Ashton (913)
A public water supply was installed for the village of Ashton in 1915.
Water is obtained from a well drilled to a depth of 545 feet and located near Middle Street between Second and Third Streets . The ground elevation at the well is 810.
The well is reported to be cased with 12-inćh pipe to rock at 180 feet, below which the hole is eight inches in diameter . When the well was drilled for the village, it was assumed that it would be s imilar to the Chicago-Northwestern well, but little water was encountered at the same depth.
On March 19, 1942, the American Well Works Company made a production test and reported that, when pumping at a rate of 300 gpm, the drawdown was 147 feet from a non-pumping water level of 39 feet. The hydro-graph for the Ashton Village well is shown on Figure 6.
A summary of an analysis (Lab. No. 113129) of the water is given in Table III, key number 19.

In June 1951, pumpage was estimated to average 70,000 gpd.
Chicago and Northwestern Railroad. The Chicago and Northwestern Railroad well, located about 500 feet west of the Ashton village well, was drilled, before the village well, to a depth of 247 feet, terminating in limestone. Rock was entered at 29 feet.
This well is connected to the village d i s tribution system but valves and fittings m a y have deteriorated from rust.
In December 1947 pumpage was estimated to average 48,000 gpd.
Compton (321)
A public water supply was installed for the village of Compton in 1895.
Two wells were drilled to the same depth, 335 feet, and located in the village hall on the east side of Fourth Street between Main and Cherry Streets . At the top of the wells is a pit four feet in depth. The ground elevation is 982.
The East Well was reported to be three inches in diameter. In 1937 the pump failed and was removed. The well is not in use.
The West well, located eight feet from the East well was reported, in 1938, to be 315 feet deep and cased with 8-inch pipe from the su r face to 300 feet, and 6-inch pipe from 300 to 307 feet, and 4 1/2-inch pipe from 307 feet to the bottom of the hole. On July 21, 1938, a production test was made by t h e American Well Works Company. It was reported that after 13 hours pumping at a ra te of 70 gpm, the drawdown w'as 29 feet from a non-pumping water level of 235 feet.
A new pump was installed at that t ime with the column pipe lengthened to 290 feet. The hydrograph for the village well is shown in Figure 6.
A summary of an analysis(Lab. No. 113200) of the water is given in Table III, key Number 9.
In January, 1948, pumpage was estimated to average 23,000 gpd.
Dixon (11523)
A public water supply was installed for the city of Dixon in 1883 by the Dixon Water Company. Water was obtained from the Rock River. In 1888, two deep wells were drilled by J. P. Miller Artesian Well Company and located on the southerly bank of Rock River about 400 feet east of Artesian Avenue. The ground elevation is 662.
Well No. 1, East Well, was reported to be 1630 feet deep and cased with 8-inch pipe to a depth of 160 feet. In 1915 the well flowed, but the production rate was increased by in-
11
stallation of an air lift with 107 feet of 1 1/2-inch a i r pipe. The top of the well and the pump were located in a pit 10 feet deep. In 1938 the well was seldom used but could supply 500 to 600 gpm in emergency for a short period. In January, 1948, the centrifugal pump had been removed, and in June 1951 it was reported that the well must be reconditioned, before any extensive service could be expected.
Well No. 2, West Well, was located 150 feet west of Well No. 1 and was reported to be 1700 feet deep and cased with 8-inch pipe to 160 feet. Water was first pumped by a i r lift, then in 1916 a centrifugal pump was installed. In 1938 a turbine pump was installed with 40 feet of 5-inch column pipe. In June 1951, Well No. 2 was in service but it was r e ported that the well should be reconditioned.
Well No. 3 was drilled in 1914 to a depth of 1865 feet and located 400 feet west of Well No. 1. It was reported to be cased with 8-inch pipe to a depth of 645 feet below a s u r face elevation of 656. The top of the well is in a pit about 10 feet deep.
About 1938, the well was reported to have filled in to a depth of 1793 feet and in March 1944 the well was rehabilitated. The well was "shot" at three levels: 1427, 950, and 900 feet. An 18-inch casing was installed from the su r face to 161 feet and a 16-inch liner was set between 327 and 546 feet. After the rehabil i tation work, water flowed from the top of the well at a rate of about 40 gpm. The 3-stage Pee r l e s s turbine pump, now in place, was installed in June 1944 with 100 feet of 10-inch column pipe. In a production tes t by the d r i l l er on June 19, 1944, when pumping at a ra te of 1145 gpm, the drawdown was 83 feet. On January 8, 1948, the non-pumping water level was 15 feet and after 4 hours pumping at a ra te of 800 gpm, the drawdown was 67 feet.
In January, 1948, Well No. 3 furnished all of the demand except for occasional pumping from Wells No. 2 and 5.
Beginning on March 18, 1949, Well No. 3 was reconditioned by C. W. Varner , Dubuque, Iowa. It was reported that th ree shots of 350 lb. (250 lb. of 50%; 100 1b. of 40%) each were exploded at depth of 1325, 1220 and 970 feet. All shots were below the St. Pe te r sandstone, which was cemented out in the reconditioning work.
On November 26, 1948 the pump was set at 130 feet and on January 1, 1949, the pumping level was 102.5 feet with a drawdown of 87.5 feet. On July 22, 1949, the 3-stage P e e r less pump had been reconditioned and was r e installed with 130 feet of 10-inch column pipe and 130 feet of air line. In June 1951, Well No. 3 was in service.
Since reconditioning Well No. 3 water levels have been reported as given in Table C.

12 TABLE C
Water Levels in Well No. 3
Water Level below Pump Base
Non-Pumping Pumping Drawdown Date Feet Feet Feet
7-22-49 15.0 69.0 54.0
12-31-49 15.0 72.0 57.0
3-17-51 17.0
4 - 2-51 15.0
6- 1-51 15.0 91.0 76.0
A summary of an analysis (Lab. No. 113127) of the water of Well No. 3 is given in Table III, key number 3.
Well No. 4 was drilled in 1894 to a depth of 1700 feet and located 900 feet west of Well No. 1. The well was reported to be cased with 7-inch pipe to a depth of 160 feet below a su r face elevation of 653.
Well No. 4 was put back in service in 1936 after having been out of service for about 12 y e a r s . In 1938, it was reported that it was used 24 hours daily with Wells No. 2 & 3 used to supply peak demand. In December 1947 Well No. 4 was not in service, and in June, 1951 it was reported that the centrifugal pump must be replaced by a different pump before service in this well could be restored.
Well No. 5 was completed in 1947 and located 25 feet south of East River Street and 350 feet west of Well No. 4. The well was drilled to 1700 feet but was "shot" and cleaned out to 1472 feet. The ground elevation at the well is 660'+. The hole was cased with 18-inch pipe, grouted in to a depth of 160 feet and a 16-inch l iner was set between 330 and 420 feet.
Upon completion of the well the non-pumping water level was 12 feet 4 inches below the top of the casing. In a production test , made by the dr i l le r , after 24-hour pumping at a ra te of 1200 gallons per minute, the drawdown was 70 feet. The hydrograph for the Dixon wells is shown in F igure 6.
In June 1951, Wells 1 and 4 were not in service. Well No. 3 supplied all of the demand except for occasional pumping from Wells 2 and 5 which were maintained for emergency use only.
Figure 5 shows the annual pumpage for Dixon for the yea r s 1915-1952 inclusive. F o r 1952 the total metered pumpage for Dixon averaged 1.295 mgd.
The following industries, having wells, a r e located within or in the vicinity of Dixon.
Beier Brothers Bakery. This bakery, located in the east part of Dixon has a well drilled in 1934 by R. H. Wadsworth, Dixon, to a depth of 110 feet and cased with 6-inch pipe to 12 feet. The top of the well is in the basement 12 feet below the street level elevation of 650.
A 6-stage Pomona turbine, rated at 50 gpm, is pumped for 10 hours daily at a ra te of 10 gpm with a drawdown of three feet from a static level of 30 feet.
A summary of the analysis (Lab. No. 75304) of the water is given in Table III, key No. 14.
Borden Company. This plant located north of the Rock River in Dixon, at 830 Palmyra Road, has had seven wells.
The original well was constructed about 1910. Nothing is known as to the depth or type of construction. The well was abandoned years ago.
Well No. 1 is located at the plant on ground about elevation 660. It was reported to be 1450 feet deep. On January 31, 1948 the static water level was reported 45 feet and the pumping level was 88 feet. Well No. 1 has been discontinued.
Well No. 2, located west of the plant, is reported to be 1600 feet deep and on January 31, 1948 the water level was 50 feet. This well was in service in June 1951.
Well No. 3 was located 90 feet from Well No. 4 and has been discontinued. There is no pump in the well.
Well No. 4 is located in the Rock River bottomland southeast of the plant and on ground elevation of 640. The well is 189 feet deep and on January 31, 1948 the static water level was reported 25 feet below the surface and the pumping level was 45 feet.
The well is equipped with a Pomona t u r bine pump and in June 1951 was in service.
Well No. 5 is only a hole with no pumping installation.
Well No. 6 was completed in December 1948 by Layne Western Company, Chicago, to a depth of 200 feet and located in the bottomland southwest of the plant (elev. 640).
Pumping equipment included 40 feet of 6-inch column pipe; 10-inch, 3-stage Layne tu r bine pump, model RKFC, 3.0 feet in length; 10 feet of 6-inch suction with 6-inch bronze s trainer; 10 hp, 1750 rpm G.E. Motor.
Wells 2, 4 and 6 were in service in June 1951 and total pumpage for the plant operation averaged 6000 gpd.
Bus Terminal . This building is located at the north end of the Peor ia Avenue bridge over Rock River. The well was drilled in 1948 by R. Dresden & Son, Polo, to a depth of 105 feet and cased with 6-inch pipe to rock at 85 feet. The well is equipped with a jet pump and on June 5, 1951 the stat ic water level was r e -

ported to be 25 feet below a ground elevation of 660.
Pumpage is estimated to average 1000 gpd. Coss Dairy. This business is located at
112 West Everett Street on the north side of Rock River. The well was drilled in 1930 to a depth of 205 feet and was cased with 6-inch pipe to rock at 85 feet (gr. elev. 660).
The pumping equipment includes a water lubricated Pomona turbine, rated at 60 gpm, with 45 feet of 3-inch column pipe. The pump was out of order in June 1951, because of lowering water level. Power is furnished by a 7 1/2 hp electric motor.
Pumpage is estimated to average 10,000 gpd. It was formerly 20,000 gpd before cooling was discontinued.
Columbus - McKinnon C h a i n Corporation (Dixon Division). This plant, located at 1200 W. 7th Street, has two wells which are located on opposite sides of the building at the rear .
Well No. 1 (east) was drilled about 1947 by R. Dresden, to a depth of 110 feet below a ground elevation of 690. A 1-hp Jacuzzi jet pump is installed which is used about 10 to 12 hours daily and pumpage is estimated to average 9000 gpd.
Well No. 2 (west) was drilled about 1949 by Dresden to a depth of 170 or 180 feet. The pump is a 1 hp Jacuzzi jet and is operated 24 hours daily.
Pumpage is estimated to average 15,000 gpd.
Dixon Airport. The airport is located about 1 1/2 miles east of Dixon on U.S. Route 30 (Alt.). The well was drilled in 1334 by R.H. Wadsworth, Dixon, to a depth of 175 feet and cased to the bottom with 6-inch pipe. The static water level was 47 feet below a su r face elevation of 785.
The force pump cylinder was set at 109 feet.
A summary of an analysis (Lab. No. 74990) of the water is given in Table III, key number 36.
Dixon Country Club. The Dixon Country Club, located in the NE 1/4 Section 30, T. 22 N., R. 9 E, about one mile north of Dixon has a well drilled in 1950 by Stultz. The well is reported to be 340 feet deep and cased with 6-inch pipe. In June 1951 a pump had not been installed. Static water level at that time was reported to be 18 inches below a ground elevation of 760.
The Country Club has two other 6-inch wells each about 200 feet deep. Pumpage is estimated to average 1500 gpd for about seven months each year.
Dixon Ice and Fuel. This plant, located at 532 East River Street, has three wells, all s imilar in construction and equipment and
13
spaced about 100 feet apart north and south. The wells a r e reported to be 110 feet deep, penetrating rock at five feet below a ground elevation of 660.
Each well is equipped with a 4-inch tu r bine pump, rated at 50 gpm, with 60 feet of column pipe. Static water level in June 1951 was reported 20 feet below the surface. One of the wells, on ground six or seven feet lower than the other two, flowed until about 1940.
Two pumps a re operated 24 hours daily and the third one about 12 hours daily. Pumpage is estimated to average 170,000 gpd.
Eichlers . This store, located in the 300 block West F i r s t Street, has a well drilled by Dresden in 1948 to a depth of 145 feet. The water is used for a i r conditioning and pumpage is estimated to average 1500 gpd for seven months of the year.
F reeman Shoe Company, Plant No. 3. This plant, located at 1000 W. F i r s t Street, has a dug well, 30 feet in depth, and 36 inches in diameter . The well is lined with rubble.
Pumping equipment includes a Rath centrifugal pump, Serial Number 22963-1, Model 374 BF. Power is furnished by a 5 hp Leland electr ic motor.
The non-pumping water level is reportedly constant at 25 feet below the surface (elev. (680). The calculated inflow rate of 10 gpm. is based on recovery following a pumping pe r iod. Water is used for boilers, washing, toilets . City water is used for drinking.
Pumpage is estimated to average 2000 gpd. Lawton Dairy. This plant, located at the
north end of the Peoria Avenue bridge over Rock River, has a well drilled in 1943 to a depth of 120 feet. It is cased with 6-inch pipe to rock at 90 feet below a surface elevation of 660.
Static water level in June 1951 was reported to be 18 or 20 feet below the surface. A Pomona turbine pump is installed.
Pumpage is estimated to average 3000 gpd. Lincoln Motel. This motel, located about
one-half mile northwest of Dixon at the junction of Highways 26 and 52, has a well drilled in 1951 to a depth of 205 feet below a ground elevation of 730.
Pumping equipment includes a multi-stage jet (4 impellers) rated at 40 gpm and the s ta t ic water level on June 5, 1951 was 50 feet below the surface.
The 24-unit Motel was not finished in June 1951, and pumpage records had not been made.
Medusa Portland Cement Company. This plant, located about 1 1/2 miles northeast of Dixon just north of Highway No. 2, has two wells.
One well, located at the office and used mainly for drinking water, is 90 feet deep. It is equipped with a plunger pump and 70 feet

14
of 4 1/4-inch discharge column. Pumpage is estimated to average 2000 gpd. The other well, located at the quarry one
mile north of the plant, is reported to be 146 feet deep.
Both wells a re six inches in diameter and in rock from the surface. The quarry well is equipped with a plunger pump and 60 feet of 1 1/2-inch discharge column. The water level in 1948 was reported to be 46 feet below the surface elevation of 660.
The water is used for dri l l holes at the quarry and pumpage is estimated to average 10,000 gpd.
Public Service Company of Northern Il l inois. The garage well is reported to be 65 feet deep below a surface elevation of 680. It is equipped with a Pee r l e s s turbine pump rated at 100 gpm. Power is furnished by a 7 1/2 hp electr ic motor.
Water is used for washing ca r s and sanit a ry needs. Pumpage is estimated to average 2000 gpd. Some additional water is used from the Rock River.
A 6-inch well at the power plant was drilled in 1937 to a depth of 160 feet below a surface elevation of 545. A centrifugal pump was installed with 30 feet of suction and operated at a ra te of 400 gpm with a drawdown of five feet. This well is reported to be out of s e r vice.
A summary of an analysis (Lab. No. 85933) of the water is given in Table III, key Number 38.
Reynolds Wire Company (Division of National Standard Company). This plant, located on East F i r s t Street just east of the Dixon Water Works has three wells.
The principal well, located at the northwest corner of the plant grounds, was drilled in 1939 to a depth of 100 feet and cased with 8-inch pipe to rock at 80 feet below a su r face elevation of 660.
A Pomona turbine, rated at 85 gpm against 100 feet of head, is set at 170 feet. The non-pumping water level on June 6, 1951 was 25 feet below the surface. The water is used for r insing and the electro-galvanizing process . The pump is operated 24 hours daily at full capacity.
Pumpage is estimated to average 120,000 gpd.
A second well is 40 feet deep and cased with 3-inch pipe. The centrifugal pump with 2-inch discharge is rated at 30 gpm against 50 feet of head. The pump is operated 24 hours daily, but when the rate exceeds 30 gpm, the pump breaks suction. The statement was made: "the heavy pumping from the Dixon city wells interferes with these (shallow) wells" .
River water is used at a ra te of 200 gpm for hot galvanizing and boilers .
A third well was drilled in 1930 to a depth of 40 feet and cased with 4-inch pipe. The well is no longer in use because the water , which was used for drinking at the plant and offices, developed an objectionable tas te . City water is now used.
Standard Dairy Company. This business, located at 1114 South Galena Street, has a well drilled in 1931 by Jonah Stultz to a depth of 277 feet. The well is cased with 6-inch pipe to rock at 19 feet below which the hole is six inches in diameter to the bottom.
In June 1951 the Fai rbanks-Morse cylinde r pump was out for repa i rs and city water was being used. The water level was 120 feet below a surface elevation of 785.
About 6000 gpd is used when operating the pump.
A summary of an analysis (Lab. No. 112904) of water from this well is given in Table III, key number 34.
Dixon State Hospital
Water for Dixon State Hospital, located one mile north of Dixon in NE 1/4, Section 29, T. 22N., R. 9 E., is obtained from two wells.
Well No. 1 was drilled in 1915 to a depth of 1922 feet and located 200 feet north and 2300 feet west of the southeast corner of Section 21, T. 22 N., R. 9 E. When the well was completed the water level was three feet below a ground level of 680.
Well No. 2 was drilled in 1915 to a depth of 1780 feet and located 150 feet north of Well No. 1. When the well was completed, the water level was five feet below ground level. In September 1938, a production test was made by the State Water Survey Division. When pumping at a ra te of 960 gallons per minute, the drawdown was 21 feet from a non-pumping water level of 21 feet below the pumphouse floor. On March 8, 1951, Well No. 1 was not in service, and the water level was 38.4 feet below ground level. The pump in Well No. 1 was then started and after three hours the water level was 93.6 feet.
Both wells were rehabilitated in 1952. The rehabilitation work was reported to consist of reaming out each hole to a 23-inch diameter, and installing an 18-inch casing from the s u r face to 200 feet. The annular space between the casing and the wall of the hole was p r e s sure cemented. Each hole was reamed to 16-inch diameter from 200 to 420-foot depth and a 12-inch casing installed from the surface to 520 feet. The annular space between the 12-inch casing and the outer casings and between the 12-inch casing and the 16-inch hole was pressure cemented from the surface to 520 feet.

After this work was completed, a brief production test was made in Vel l No. 1 by the State Water Survey Division on May 20, 1952. Well No. 1 was equipped with a P e e r l e s s t u r bine pump set at 120 feet with 120 feet of air line. Well No. 2 was equipped with a Pomona turbine pump set at 70 feet and 70 feet of air line. During the entire tes t the pump in Well No. 2 was operating at an estimated rate of 700 gpm. The water level in Well No. 1 was 34.0 feet below the surface and in Well No. 2 was 44.5 feet. After six hours pumping in Well No. 1 at 1475 gpm, the drawdown in Well No. 1 was 42.0 feet and in No. 2, due to No. 1 pumping, was 6.5 feet.
A summary of an analysis (Lab. No. 128882) of the water from Well No. 1 is shown in Table III, key number 2.
A summary of an analysis (Lab. No. 124893) of the water from Well No. 2 is shown in Table III, key number 1.
The hydrograph for the Dixon State Hospital wells is shown on Figure 6. In June 1951 pump-age was estimated to average 750,000 gpd.
Franklin Grove (741)
The public water supply system for the vi llage of Franklin Grove was installed in 1902.
In June 1951, water was being obtained from two wells located about 50 feet apart in a north and south direction in the pump building in the center of the business distr ict on the north side of South Street between Elm and Walnut Streets .
The older well, or South Well, was drilled in 1902 to a depth of 298 feet, below a ground elevation of 810 feet. The hydrograph for the South Well is shown in Figure 6. This well is the principal source of supply.
A summary of an analysis (Lab. No. 112905) of the water from the South Well is shown in Table III, key number 17.
The North Well was rehabilitated in 1950 by Pieper and Pieper in June 1951 was used about three days weekly. It was reported to yield as much as the South Well.
In December 1952 pumpage for Franklin Grove was estimated to average 35,000 gpd.
Well No. 3 was completed in September 1954 to a depth of 769 feet by C. W. Varner Well Drilling Company, Dubuque, Iowa. The well is located on North Street between Elm and Spring Streets or approximately 700 feet south and 950 feet east of the northwest corner of Section 1, T. 21 N., R. 10 E. The well is cased with 18-inchpipe from the ground Surface (elev. 810) to 36 feet and with 12-inch pipe from the ground surface to 150 feet. The annular space outside the 12-inch casing was cement-grouted by p ressure . Below the 12-
15
inch casing the hole was finished at 12 inches in diameter to the bottom.
A production test was made on September 28, 1954 by C. K. Willett Consulting Engineers, Dixon. Before pumping, the static water level was 40 feet. After three hours pumping at a ra te of 165.2 gpm the drawdown was five feet. After the next three hours pumping at 252.1 gpm the drawdown was 8.5 feet. The final four hours pumping ra te was 351 gpm with a drawdown of 14 feet.
Harmon (208)
The village of Harmon installed a public water supply in 1909. Water was obtained from a 5-inch tubular well drilled in 1909 to a depth of 532 feet below a ground elevation of 700.
In December 1916, the non-pumping water level was seven feet below the ground surface and, when pumping at 30 gallons per minute, the drawdown was about 60 to 65 feet. The well was reported to be abandoned about 1923.
A summary of an analysis (Lab. No. 36191) of the water from the above well is shown in Table III, key number 28.
The village now obtains water from eight 1 1 /4-inch drive points located in two rows, the north row about eight feet south of the old well. The points are about 32 feet deep with a 2 1/2-foot length of screen at the bottom of each pipe.
A summary of an analysis (Lab. No. 112899) of the water is shown in Table III, key number 12.
Pumpage has been estimated to average 12,000 gallons per day. In June 1951 continuous pumping was necessary because the s to r age tank was in bad repair .
Lee (251)
P r io r to 1904, a limited public water supply for the village of Lee was operated by a private company. Water was obtained from a 3-inch well reported to be 315 feet deep .
In 1904 the village had a well drilled to a depth of 335 feet penetrating a sand and gravel formation. The well is cased with 6-inch pipe from the surface to 235 feet and 4 1/2-inch pipe from 235 feet to the screen.
In February 1947, the existing pumping equipment was installed which includes 200 feet of 4 1/2-inch column pipe and a 6-inch, 23-stage Fairbanks-Morse oil-lubricated turbine pump rated at 65 gpm against a head of 320 feet.
A summary of an analysis (Lab. No. 112126) of the water is shown in Table III, key number 7.
In June, 1951, the pumpage was estimated to average 12,000 gallons per day.

16
Nelson (289)
The village of Nelson, located about seven miles southwest of Dixon, has no public water supply.
The Chicago and Northwestern Railroad has two wells, one at the depot and the other at the roundhouse. All water is now obtained from the roundhouse well which is 55 feet deep and 25 feet in diameter . Pumpage was es t imated to average 1.2 million gallons per day.
Paw Paw (594)
A public water supply system was instal led by the village of Paw Paw in 1891. In 1895 a second well was drilled to a depth of 1018 feet below a ground elevation of 928. The first well was then abandoned.
The casing record is reported as follows: 10-inch diameter from the surface to 133 feet; 8-inch from 100 to 402 feet; 6-inch from 345 to 454 feet 6 inches. The 6-inch casing was driven six inches in the limestone.
In February 1938 the pump which had been set at 250 feet broke off and dropped down in the well. This was reported to have been fished out. In June 1951 the pump assembly, which had been installed in August 1943, consisted of: 240 feet of 4-inch column pipe; 7-inch, 10-stage American Well Works oil-lubricated turbine pump No. 68675, rated at 180 gallons per minute against a head of 237 feet when operating at 1760 rpm; 10 feet of 4-inch suction pipe; 240 feet of a i r line; 15 hp U. S. Electr ic Company Motor No. 304148.
In December, 1953 the well pit in the pumping station had been filled in with earth and concreted over to avoid possible contamination. The hydrograph for the Paw Paw well is shown in Figure 6.
A summary of an analysis (Lab. No. 113131) of the water is shown in Table III, key number 8.
In December, 1953 usage was estimated to average 25,000 gallons per day, but the pump-age was estimated at 65,000 gallons per day due largely to leak losses and low pump efficiency.
Steward (270)
A water system was installed for the vi l lage of Steward about 1909 and since 1939 the system has been municipally owned. Water is obtained from an 8-inch well which is 100 feet in depth terminating in sand and gravel.
In 1951, the pump assembly, installed in April 1936, consisted of 50 feet of 4-inch column pipe; 6-inch American Well Works oil-lubricated turbine pump, No. 60572, rated at 40 gpm when operating at 345 rpm; the over
all length of the pump is 28 1/2 inches; 10 feet of 3 1/2-inch suction pipe; 50 feet bf air line; 5 hp General Elect r ic Motor No. 5402060.
The hydrograph for the Steward well is shown on Figure 6. Pumpage in 1951 was e s timated to average 10,000 gallons per day.
A summary of an analysis (Lab. No. 112900) of the water is shown in Table III, key number 22.
Sublette (290) The village of Sublette installed a public
water supply about 1893. A well drilled at that t ime, to an unreported depth, produced little water and was replaced in 1898 by a well drilled to a depth of 752 feet below a su r face elevation of 920.
The casing record is: 10-inch pipe from the surface to 364 feet; 6-inch pipe from 364 to 443 feet; 6-inch hole from 443 to 752 feet.
In 1951 the pump assembly, installed in April 1936, consisted of: 250 feet of 5-inch column pipe; 7 7/16-inch, 11-stage Pomona turbine pump, No. N-768 rated at 100 gallons per minute against 250 feet of head at 1760 rpm, over-al l length of the pump five feet 10 5/8 inches. (Note: In June 1951 an 11-stage Fairbanks-Morse Pomona turbine was on hand to replace the old turbine); 20 feet of 5-inch suction pipe; 250 feet of 1/4-inch a i r line; 15 hp Westinghouse Elect r ic Motor No. 8105935 operating at 1767 rpm.
A summary of an analysis (Lab. No. 112898) of the water is shown in Table III, key number 24.
The hydrograph for the Sublette well is shown in Figure 6. Pumpage in April 1953 was estimated to average 20,000 gpd, but there are reportedly numerous leaks yet to be stopped.
Helbig Cheese Factory. This factory, located in Sublette, has a well which was drilled in 1940 to a reported depth of 317 feet below a surface elevation of 920. The well is cased to the bottom with 4-inch pipe and equipped with a Fai rbanks-Morse plunger pump with the suction set at about 275 feet.
In 1951 the cheese factory was using about 2500 gallons per day.
West Brooklyn (194)
A water supply was installed for the vi llage of West Brooklyn about 1898. A well, located near the southwest corner of the intersect ion of Third and Johnson Streets was drilled to a depth of 385 feet below a surface elevation of 983. The well was overhauled about 1903 because of sand cave-ins and in 1913 while repair work was being done, the pump rods were broken and the well t hen ' a -bandoned with the pump down in the well.

Following this accident in 1913, a 3-inch well at the F a r m e r s Cooperative Elevator Company was put into service for the village. The well is 395 feet deep and equipped with an American Well Works 2-inch by 24-inch cylinder pump operating with an 8-inch stroke at 35 gpm. The pump is attached to 285 feet of 1 1/2-inch column pipe.
Well No. 2 was drilled in 1915-16 to a depth of 358 feet and located about three feet from the old village Well No. 1. In 1937 the well was repaired and deepened to 370 feet. The well was reported to be cased with 8-inch pipe from the surface to 280 feet, and with 6-inch pipe from the surface to 260 feet with 4-inch pipe from 257 to 305 feet; with 2-inch pipe from 256 to 314 feet; a 2-inch screen (60 mesh) from 314 to 334 feet and 1 1/4-inch
17 screen (60 mesh) from 332 to 350 feet.
Well No. 3 was completed in 1948 to a depth of 650 feet and located 45 feet east of Well No. 1. The well was reported to be cased with 10-inch pipe from the surface to 492 feet penetrating two feet of sandstone and an 18-inch hole from 492 to 650 feet.
When the well was completed, the dr i l le r reported the static water level was 229 feet below the surface and the drawdown was 43 feet when pumping at a rate of 150 gpm.
A summary of an analysis (Lab. No. 113672) of the water is shown in Table III, key number 23.
The hydrograph for the West Brooklyn wells is shown on Figure 6. Pumpage for 1952 was estimated to average 20,000 gallons per day:
WHITESIDE COUNTY
Deer Grove (72)
The village of Deer Grove has no public water supply. Pr ivate wells, mostly dug, a r e from 20 to 40 feet in depth.
Chicago, Burlington and Quincy Railroad. The C. B. & Q. R. R. has a well located about 100 feet east of the depot in Deer Grove in Section 28, T. 19 N., R. 7 E. The well was completed in 1946, by Layne-Western Company, Chicago, to a depth of 50 feet, and is cased with 6-inch pipe. Some repor ts are that the well is gravel-packed.
The well is equipped with a Layne 3-stage turbine pump No. 11977, attached to 37 feet 2 inches of 4-inch column pipe. The over-al l length of the pump is 2 feet 10 inches. An ai r line was installed but it is not in working o r de r and the gage has been removed.
Water is pumped into an elevated tank at a rate of 100 gpm. Daily pumpage is es t imated to be 40,000 gallons. The station agent reported that a thin vein of water-bearing sand and gravel was encountered at 15 feet and that the well was finished in the same type formation from 20 to 25 feet. The water level was estimated at 20 feet and it was reported that the well has never failed.
E r i e (1180)
A public water supply was installed for the village of Erie in 1920, at which time Well No. 1 was drilled to a depth of 567 feet. The top of the well was eight feet below the ground level elevation 585 and a 10-inch casing extended from 8 to 175 feet, penetrating eight
feet of rock. The diameter of the bottom hole is eight inches.
Water is pumped by two Kewanee triplex suction pumps, No. 75-Y and 75-R rated at 180 and 100 gpm respectively.
Water flowed over the top of the casing when the well was completed and in 1937 the water level was reported as being "close to the top". In October 1947 the lowest water level, that had been measured, up to date, was 26 feet below the top of the well. The well hydrograph is shown on Figure 6.
A summary of an analysis (Lab. No. 112153) of the water from Well No. 1 is given in Table IV, key number 23.
WellNo. 2 was completed in September 1953 by J. P. Miller Artesian Well Company, Brook-field.
A 6-inch tes t well was drilled f irs t to a depth of 161 feet 5 inches with 20 feet of screen. A production test was made by the State Water Survey on April 14-15, 1953. F o r tes t purposes, a shaft-driven Peer l e s s ver t ica l t u r bine pump was operated from a Red Seal gasoline engine. The top of the bowls was set at a depth of 105 feet. After six hours pumping at a ra te of 200 gpm the drawdown was 7.5 feet. Pumping was continued with intermittent motor trouble and after 17 hours at ra tes of 200 to 230 gpm the drawdown was 9.5 feet.
The permanent Well No. 2 was located about 150 feet northeast of the old Well No. 1, or approximately 264 feet north and 1221 feet west of the southeast corner of Section 6, T. 19 N., R. 4 E. The well was constructed to a depth of 171 feet below an elevation of 592. A 12-inch inner casing and 25 feet of screen, was set with the bottom of the sc reen at 162

18 feet. The hole was drilled to a diameter of 30 inches and the annular space between the 12-inch s c r een and the 30-inch hole packed with a graded gravel.
A production test was made on September 23, 1953 under the supervision of Mr. R. H. Anderson of C. K. Willett, Consulting Enginee r s , Dixon. Pumping was started at a ra te of 378 gpm and gradually accelerated to 964 gpm, after 15 1/2 hours with a final drawdown of 12 feet from a static level of 17 feet.
A sample of water was collected for minera l analysis (Lab. No. 133002) summary of which is shown in Table IV, key number 21.
Supreme Dairy Products Company. This plant is located on the north side of the s t reet ac ross from the village hall in Er ie .
Water is obtained from a 1 1/4-inch dr ive-point, the bottom of which is 26 feet below the surface elevation of 585. Water is pumped at a ra te of about 25 gpm for five hours daily. Water levels a re 11 to 16 feet below ground.
Water is used for cooling.
Fulton (2706)
A public water supply was installed by the city of Fulton about 1887.
Water was first obtained from a 6-inch well dril led in 1890 to a depth of .1246 feet below a surface elevation of 595.
Leverett , in his "Illinois Glacial Lobe" published in 1899 stated: "a flow of sulphurous water was struck at about 475 feet. Another flow was obtained from the Potsdam at 940 to 1050 feet. The head is sufficient to ca r ry the water 60 feet above the surface. The e s timated capacity is 300 gpm".
Later the free flow decreased and in 1913 a pump was installed. The well was subsequently abandoned.
Wells No. 2 and 3 were drilled in 1908 and 1931 to depths of 1260 and 1943 feet r e spectively.
In April 1950, a 4-stage turbine was installed in Well No. 3 and 80 feet of column pipe was added, making a total length of 170 feet of column. The pumping rate was then 750 gpm and the pumping level was maintained at 55 feet above the pump or 115 feet below the top of the well.
The old 2-stage unit from Well No. 3 was installed in Well No. 2.
In July 1951 the large rese rvo i r was being lined with concrete after which the small r e s e r voir would be abandoned.
Summaries of laboratory analyses 112869 and 112156 of the water from Well No. 2 a r e shown in Table IV, key numbers 1 and 3 r e spectively. A summary of laboratory analys i s 112870 is given in Table IV, key number 2.
The hydrograph for the Fulton wells is shown on Figure 6, and the pumpage for each year 1940-1952 inclusive is shown on Figure 5. Pumpage for 1952 averaged 127,000 gpd.
American Agricultural and Chemical Com-pany. This plant is located on the bank of the Mississippi River, in the NW 1/4 of Section 33, T. 22 N., R. 3 E. about three-fourths mile south of Fulton.
A well was constructed in 1947 to a depth of 43 feet. A 24-inch drive pipe was set from 0 to 18 feet. A 12-inch wrought steel casing was set from 0 to 22 feet with a 12-inch Johnson Everdur screen (no. 100 slot openings) set from 20 to 43 feet. The annular space between the screen and 24-inch hole was packed with 3/16-to 3/8-inch gravel. When finished the water level was 8.0 feet below the surface. Water levels vary with the r iver stage.
The well is equipped with an 8-inch, 5-stage Deming turbine pump (Fig. 4700) with bronze impel lers ; 20 feet of 5-inch column pipe; 5.0 feet of 4-inch suction pipe with s t ra in er . The pump is rated at 250 gpm against a head of 115 feet. Power is furnished by a 10 hp, 1750 rpm U. S. Motor.
In July 1951, the pump had been in continuous operation for more than a year . About 300,000 gpd is used for cooling and processing acids.
A summary of an analysis (Lab. No. 112866) of the water from this well is given in Table IV, key number 47.
There a r e two other wells - both 2-inch dr ive points - located in the office building and shop building. The points a r e 44 feet deep and each equipped with a Deming suction pump rated at 1000 gallons per hour.
Morrison (3531)
The public water supply for Morrison was installed pr ior to 1880.
Water was first obtained from an ar tes ian well, equipped with a deep-well pump. This supply became inadequate in 1881 and a spring, issuing from limestone, was developed. The ar tes ian well was abandoned. In 1938 the flow from the spring was estimated at 220 gpm. The spring has not been in use since August 6, 1948 when the roof of the spring-house caved in. At the t ime the pumping rate averaged 70 to 80 gpm in a 24-hour period.
Wells No. 1 and 2 were drilled in 1897 and 1912 to depths of 1643 and 2048 feet respect ively. Well No. 1 (east) was sounded in 1909 and reported to be 900 feet deep. In 1938 it was reamed and cleaned out to 1595 feet and cased" with 10-inch pipe to 137 feet. Fur ther cave-ins necessitated cleaning out the well in 1940 after which the yield rate of 350 gpm

was reported with a drawdown of 76 feet from a non-pumping water level of 14 feet below the surface. The east well was taken out of service in 1951.
Well No. 2 (west) had a natural flow of about 88 gpm in 1944 and was pumped at ra tes of 750 to 800 gpm. The well has not been used since 1950 and is reported to be almost dry.
A summary of an analysis (Lab. No. 112154) of the water from the west well is shown in Table IV, key number 4.
Well No. 3 was drilled in Septemberl950 to a depth of 1625 feet by C. W. Varner Well Drilling Company, Dubuque, Iowa. The well is cased with a 24-inch pipe from two feet above to 95 feet below ground. A 21-inch casing is reported to be below the 24-inch pipe but the length of the 21-inch is not known. A 16-inch casing is grouted-in from two feet above to 485 feet below the surface. The hole is 15 1/4 inches in diameter to the bottom of the well.
The pumping equipment includes a F a i r banks-Morse "Pomona" water-lubricated tu r bine rated at 1000 gpm, against a head of 169 feet, set at 150 feet. Power is furnished by a 60 hp G. E. e lectr ic motor with a right-angle gear head connected to a 90 hp Sterling gas engine for emergency power.
The static water level was 77 feet with a drawdown of 37 feet when pumping at a rate of 1860 gpm. The drawdown was 19 feet when pumping at 1250 gpm.
The hydrograph for the Morrison wells is shown on Figure 6.
Annual pumpage lor Morrison for the years 1931-1952 inclusive is shown on Figure 5.
Pumpage for 1952 averaged 645,000 gpd. Carnation Company. This Company, loca
ted in the westly part of Morrison, near the northeast part of the intersection of Wall and Heaton s t ree t s , has two deep wells, spaced 150 feet apart.
Well No. 1 was drilled in 1907 to a depth of 1006 feet, by L. Wilson, Chicago. The well was repaired in January 1950 by C. W. Varner, Dubuque, Iowa and is cased as follows:
12-inch casing, 0 (floor level) to 68 feet 10-inch casing, 0 (floor level) to 98 feet
8-inch l iner - from 280 to 480 feet 6-inch liner - from 810 to 873 feet Pumping equipment includes an a i r - l i f t
with 2-inch a i r pipe and with 8-inch r i se r pipe to 92 feet, then reduced (8-inch by 6-inch r e ducer) to six inches from 92 to 281 feet. The pump is rated at 600 gpm. Power is furnished by a s team-driven compressor.
Water is used from this well at a rate of .600 gpm for seven or eight hours daily.
Well No. 2 was drilled in 1947 to a depth of 1101 feet by J. P. Miller Artesian Well Company, Brookfield. The casing and hole
19 sizes were reported as follows:
28-inch casing from 0 to 102 feet 16-inch casing from 0 to 124 feet 12-inch liner from 290 to 488 feet 10-inch liner from 815 to 818 feet 10-inch hole from 815 to 1101 feet
When the well was finished in 1947 the water level was 60 feet below the surface. Pumping is by a Layne turbine pump rated at 600 gpm. Power is furnished by a 50 hp e lect r i c motor.
This well is used only occasionally because the other pump (Well No. 1) is operated more economically with steam power.
Prophetstown (1691)
The water works was installed by the city of Prophetstown in 1904. Water was obtained from two large diameter (8 feet and 16 feet) dug wells located on the bank of the Rock River in the northeastern part of town. Both wells were originally dug to a depth of 16 feet but in 1933 were deepened to 35 and 27 feet. Wat e r levels varied with the r iver stage. During a flood in 1938, the wells were completely submerged. Subsequently the brick walls were heightened and a chlorinator installed.
Both wells were abandoned when, in 1944, a new well was drilled at High and East Second Streets . The well was drilled through sand and gravel to a depth of 193 feet and penetrating 42 feet of limestone to a total depth of 235 feet. The 10-inch casing extended from the surface (elevation 615) to 195 feet below which the hole was 10 inches in diameter.
The pumping installation consists of 80 feet of 5-inch column pipe; 8-inch, 6-stage Amer ican Well Works MC turbine pump No. 69871, rated at 250 gpm against 223 feet of head at 1750 rpm; the over-al l length of the pump is 5 feet 3 inches, 20 feet of 5-inch suction pipe; 20 hp U. S. Motor.
In a production test made on March 15, 1944 it was reported that when pumping at 304 gpm, the drawdown was 26 1/2 feet from a non-pumping water level of 41.0 feet below the surface. Complete recovery occurred in two minutes after stopping the pump.
A summary of an analysis (Lab. No. 112155) of the water from this well is given in Table IV, key number 34.
Average daily pumpage in 1952 was es t i mated to average 130,000 gallons.
Eclipse Lawn Mower Company. This plant, located in Phrophetstown, has two wells. Well No. 1 was drilled in 1941 to a depth of 40 feet and cased with 5-inch pipe with an 8-foot length of Johnson b ras s screen in a "pea gravel" formation. The static water level was 24 feet below a surface elevation of 622. The water is used for drinking and sanitary needs.

20
Well No. 2 was completed in June 1942 by Neely and Schimmelpfenig, Batavia. The well is 188 feet deep and cased with 148 feet of 8-inch pipe and 40 feet of Johnson Armco-Iron wire-wound screen (No. 14 mesh). (Note: Before drilling Well No. 2, a 10-inch test well had been drilled to a depth of 1052 feet penetrat ing St. Pe t e r sandstone at 902 feet. The well produced 10 gpm. After shooting the sandstone the well produced 50 gpm with a drawdown of 150 feet.)
When completed Well No. 2 was reported to produce 470 gpm with a drawdown of 35 feet from a non-pumping water level of 24 feet.
The pumping installation consists of: 80 feet of 6-inch column pipe; 8-inch, 11-stage Aurora Pump Company turbine pump No. 13249 rated at 350 gpm against 220 feet of head; over-a l l length of the pump 7 feet 3 inches; 30 feet of 6-inch suction; 117 feet 3 inches of a i r line; 30 hp G. E. motor.
A summary of an analysis (Lab. No. 112157) of the water from this well is given in Table IV, key number 42.
The daily pumpage is estimated to average 150,000 gallons.
Rock Fal l s (7983)
Rock Fal l s is supplied with water from Sterling.
Erection of the one-half million dollar sewage pumping station of the Rock Fa l l s Sewerage Improvement was started in 1950 and located in the extreme southwest part of Rock Fa l l s about two blocks east of Fourteenth Avenue Road or approximately 3000 feet south and 900 feet east of the northwest corner of Section 33, T. 21 N., R. 7 E.
In January 1951 the heavy inflow of groundwater into the excavation necessitated driving sand points and continuous pumping in o rder to dewater the hole so that the footings and foundation could be set. The ground surface elevation at the site is 637, the static water level surface was at elevation 630 (approximate) and the bottom of the excavation at e levation 611, as reported by Mr. R. H. Anderson of C. K. Willett, Consulting Engineers. It was reported that the pumpage rate from the dr ive points was estimated at 2500 gpm over several months period, but an accurate record of the discharge from the excavation was not kept.
Based on the data furnished by Mr. Anderson, and applying those data to the Darcy and Thiem equations for determining permeabil i t ies of the formation, the resul ts calculated were:
Darcy - P = 26900 gpd/sq. ft. Thiem - P = 33000 gpd/sq. ft.
The coefficient of t ransmissibi l i ty (T) was ca l culated as:
Darcy - T - 538,000 gpd/ft. Thiem - T - 660,000 gpd/ft.
In July 1953 some test dril l ing was done by Layne-Western Company, Aurora, for the Northern Illinois Water Corporation of Sterling. The location was approximately 3140 feet south and 2140 feet east of the northwest corner of Section 33 about one-quarter mile southeast of the Sewage Pumping Station. Well No. 5 was completed in November 1953 by Kelly Well Company to a depth of 68 feet. It was reported that the static water level was nine feet below the surface and when pumping at 500 gpm the drawdown was 18.5 feet. The well is 17 inches in diameter.
Analysis of a sample (Lab. No. 133299) showed the water from Well No. 5 to have 1.2 ppm iron; 272 ppm hardness and a total minera l content of 296 ppm.
The following industries, having wells, a r e located within or in the vicinity of Rock Fal ls .
For t Dearborn Manufacturing Company. This Company, a division of the Chicago Metal Hose Corporation, is located on F i r s t Street just south of F i r s t Avenue. A tubular well was drilled in 1919 to a depth of 155 feet, and cased with 6-inch pipe to 35 feet.
Geyer Manufacturing Company. This plant located at 200 East Fourth Street, has an 8-inch tubular well drilled to a depth of 80 feet below a ground elevation of 640. The well is equipped with an A. Y. McDaniel jet pump No. 476.
About 10,000 gpd a re used for cooling, drinking and sanitary needs.
International Harvester Company. This Company has a 25,000-gallon wooden elevated tank for fire protection. Water is from Sterling. A well, formerly used for drinking water has been abandoned for several yea r s .
Charles O. Larson Company. This plant is located on U. S. Highway No. 30, about two miles southeast of Rock Fal ls , in the" NE 1/4 NE 1/4 Section 2, T. 20 N., R. 7 E. The well was drilled in early 1954, by Allabaugh Well Company, Rockford, to a depth of 85 feet, penetrat ing eight feet of limestone. The well was finished at 77 feet and cased with 57 feet of 10-inch id pipe and 20 feet of 10-inch od Johnson Red Brass screen (opposite 20 feet of sand and gravel). The top 11 feet of the screen has No. 80 slot openings and the bottom nine feet has No. 20 slot openings.
When completed, the dr i l le r reported a static level of nine feet below a surface elevation of 645 and after two hours test-pumping at 960 gpm the drawdown was 16 feet.
The permanent pump assembly, to be installed, consists of two Jacuzzi horizontal centrifugal pumps, of 100 and 200 gpm capacities, manifolded to one 5-inch suction pipe, 25 feet in length. The 100 gpm pump has a 3-inch in-

take and 2-inch discharge and is operated from a 5 hp electr ic motor. The 200 gpm pump has a 4-inch intake and a 3-inch discharge and is operated from a 10 hp electric motor.
Lawrence Park, a part of the Sterling and Colonna Park District , is located on an island in the Rock River at the west edge of Sterling and Rock Fal l s , and under the new bridge connecting the two cities.
There a r e two wells on the park grounds. A tubular well is reported to be drilled to 175 feet and cased with 6-inch pipe to 65 feet. The well is equipped with a centrifugal pump. Static water level is about 14 feet below the s u r face elevation of 640.
The water is used for drinking. A well, 20 feet by 40 feet, was dug, in
1927, to rock at 35 feet. It is equipped with a Dayton-Dowd centrifugal pump rated at 300 gpm. The water level on June 28, 1951 was five feet below the surface (640).
It was reported that the well, when pumping at a ra te of 300 gpm can be dewatered in eight hours but refills in two to three hours depending on the r iver stage.
Water from this well is used for the pool, showers and sanitary needs.
Parish-Alford Fence and Machine Company. This Company, a division of the Northwestern Steel and Wire Company, is located on F i r s t and Fifth Avenue extended. The well was drilled in 1940 by Allabaugh Well Company, Rockford, to a depth of 813 feet below a ground elevation of 630. The well was cased with 8-inch black iron pipe from the surface to 67 1/2 feet and with a 4 1/2-inch black iron liner from 160 to 370 feet.
The pumping equipment installed new in November 1950 consists of: 160 feet of 5-inch column pipe; 8-inch, 13-stage Aurora M. C. bronze turbine pump (Type DWT) rated at 200 gpm against 295 feet of head; 30 feet of 5-inch suction pipe with s t rainer; 160 feet of air line, 20 hp, 1750-rpm U. S. electric motor. This installation was reported to be identical with that in the well of Northwestern Steel and Wire directly across the Rock River in Sterling.
When completed in 1940, the static water level was 30 feet below the surface and when pumping at 250 gpm the drawdown was 20 feet. After the new pump was installed in 1950 the
21 water level was 105 feet and while pumping at a ra te of 200 gpm the drawdown was below the a i r line.
Pumpage is estimated to average 200,000 gpd.
Russell, Burdsall and Ward, This plant, located at Second Street and Avenue "A" has a well drilled in April 1921 to a depth of 363 feet below a surface elevation of 630. The well is cased with 8-inch pipe to 18 feet and with 6-inch pipe from 18 to 65 feet.
The pumping equipment includes a Size 6 Aurora turbine pump, Type T H M B set with the bottom of the pump at 142 feet; 30 feet of 4-inch suction pipe; 5 hp, 1450rpm electric motor.
Sterling Soy Bean Mill. This plant, located at the east end of Tenth Street, has a tubular well drilled in 1947 to a depth of 108 feet below a surface elevation of 640.
Water was encountered at 97 feet. On June 28, 1951 the water level was 26 feet.
The well is cased with 6-inch pipe and equipped with a Deming jet pump rated at 50 gpm, with the jet set at 68 feet. Power is furnished from a 1 hp electric motor.
Water is used for the boilers, drinking and processing. Pumpage is estimated at 3000 gpd.
Riverside Nursery. The Riverside Nurs ery, located in the SW 1/4 SW 1/4 Section 26, T. 21 N., R. 7 E. about one-half mile east of Rock Fal ls installed a water system in 1953. Water is pumped from one 6-inch and five 2-inch sand points, each 25 feet deep, into a collecting reservoir . The ground surface elevation is 645 . A Carver centrifugal pump, rated at 550 gpm is installed.
The non-pumping water level is 16 feet below the surface and water is pumped at a rate of 200 gpm for 10 to 12 hours daily.
Sterling (12817)
The waterworks system for the city of Sterling was installed in 1885 and is owned and operated by the Northern Illinois Water Corporation. Four wells a re in service and are described in State Water Survey Bulletin No. 40 published in 1950. The data in Table D were reported in April 1951.
T A B L E D
D e p t h t o W a t e r L e v e l Wel l N o n - p u m p i n g P u m p i n g Drawdown P u m p i n g R a t e Speci f ic Capac i ty
N u m b e r F e e t F e e t F e e t G P M gpm/ f t D .D.
1 58 84 26 380 14.6
2 42 83 41 342 8.3
3 55 87 32 330 10.3
4 48 78 30 480 16.0

22
Pumping ra t e s were checked on the Sparling mete rs as follows:
Date
April 4, 1951
April 8, 1951
April 5, 1951
April 10, 1951
Well Number
1
2
3
4
Pumping Rate G.P.M.
380
345
320
470
A summary of an analysis (Lab. No. 118203) of the water from Well No. 1 is given in Table IV, key number 8.
A summary of an analysis (Lab. No. 118293) of the water from Well No. 2 is given in Table IV, key number 7.
A summary of an analysis (Lab. No. 118204) of the water from Well No. 3 is given in Table IV, key number 9.
A summary of an analysis (Lab. No. 112805) of the water from Well No. 4 is given in Table IV, key number 5.
F rom 1940 to 1950, the number of custome r s increased from 3700 to 5000 and over the same period pumpage increased from 0.8 to 1.3 mgd.
The hydrograph for the Sterling wells is shown on Fig. 6.
Annual pumpage for the yea r s 1929-1952 inclusive a r e shown on Fig. 5. Pumpage for the year 1952 averaged 1.42 mgd.
The following industries having wells, a re located within, or in the vicinity of Sterling.
A & S Dairy. The well at the A & S Dairy, 421 Locust Street, was drilled in 1930 to a depth of 160 feet and cased with 8-inch pipe to 120 feet. The ground surface elevation at the well is 660.
In 1949 the drop pipe was lowered 20 feet but no water4evels were reported. The Pomona turbine pump operates at 140 gpm for six hours daily. About 500 gallons per hour a re used for the remaining 18 hours daily. Total water pumped is estimated to average 60,000 gpd.
Borden Cheese Company. This plant l o cated at the west edge of town on the south side of Alt. U. S. 30, has one tubular well and two c is terns .
The tubular well was drilled in 1907 by L. Wilson, Chicago to a depth of 1000 feet and deepened in 1920 to 1407 feet. It is cased with 6-inch pipe. The surface elevation is 640. The well flowed until about 1920. During the deepening work in 1920, when the dri l l reached 1247 feet, the flow ra te was 130 gpm. At 1275 feet an open crevice was encountered and the flow rate was 200 gpm. At 1409 feet, the flow ra te was 257 gpm.
The well is equipped with 70 feet of 3-inch column pipe; 14-stage Fairbanks-Morse-Pomona turbine pump rated at 140 gpm; an a i r line of unknown length. Power is furnished by an elect r i c motor.
Water from this well is used for cooling and drinking. A summary of the analysis (Lab. No. 113670) of the water from this well is given in Table IV, key number 6.
A dug well is located in the r iver bottom south of the plant. The well is 30 feet in d i ameter , 20 feet deep and lined with brick. The water level June 27, 1951 was 11.0 feet below the ground elevation of 630. Water from this well is used for cooling and boilers.
Near the tubular well there is a 53 by 23-foot dug well which is 7.5 feet deep and lined with 15 inches of concrete. This is used as a rese rvo i r for return water stored for fire protection.
Pumpage for the plant is estimated to average 140,000 gpd.
Coca Cola Bottling Company. This plant, located at 205 Third Avenue, has a well drilled in 1932 to a depth of 110 feet and deepened in 1937 to 210 feet. It is cased with 6-inch pipe to 30 feet, and equipped with an Aurora turbine pump set at 150 feet. Power is furnished by a 30 hp electr ic motor. The ground surface elevation is 665 and in 1932 the water level was reported to be 28 feet below the surface.
It is estimated that 10,000 gpd is used for 160 days per year for bottling.
DeAnne's. This d r e s s shop, located at 401 Locust Street, has a well drilled to a depth of 110 feet and cased to rock at 20 feet. The well is equipped with an Aurora centrifugal pump rated at 1000 gallons per hour with 20 feet of suction pipe. The water is used for a i r conditioning.
Pumpage is estimated to average 4000 gpd per year .
Grebner ' s Shoe Store. This s tore , located at 10 W. Third Street, has a well drilled in July 1939 to a depth of 97 feet. Rock was encountered at 20 feet. The well is equipped with an Aurora shallow well centrifugal pump, rated at 325 gallons per hour, with 22 feet of suction pipe. The water level in July 1951 was reported to be 14 feet below the surface.
Pumpage is estimated to average 1200 gallons per day pe r year .
Hey Brothers . This plant, located at 214 E. Third Street , has two wells. The surface elevation is 670.
One well, drilled in 1917 to 132 feet, is cased. with 8-inch pipe from the surface to the rock at 32.5 feet and with 6-inch pipe from the surface to 33.0 feet.
The other well, drilled in 1931 to 85 feet was deepened to 400 feet in 1937. It is cased with 8-inch pipe.

Not as much water has been used since 1950 because of the installation of evaporating condensers.
Total pumpage from both wells is es t imated to average 1500 gpd.
Illinois Northern Utilities Company. This Company has two wells, one of which is located south of the C. & N. W. R. R. and a pit 250 feet east of the foot of Broadway. This well is reported to be eight inches in diameter and 125 feet deep. A summary of an analysis (Lab. No. 88753) of the water from this well is given in Table IV, key number 31.
The other well, located approximately 241 feet south of Miller Street and 129 feet east of Bass Street, was drilled in 1939 by Gray Well Company, Chicago, to a depth of 1580 feet. The well is reported to be cased with 18-inch pipe to 15 feet and 10-inch pipe to 351 feet cemented with pure neat grout. The hole is reduced to 10 inches in diameter at 351 feet and to eight inches at 780 feet where 20 feet of 8-inch liner was installed. The elevation of the top of the well is 630.5.
A production tes t was made by the dr i l le r when the well was 779 feet deep. When pumping at 60 gpm the water was lowered from 11 to 150 feet. On December 27, 1939, when final depth of 1580 feet was reached, a production test was made. When pumping at a ra te of 515 gpm, the drawdown was 28.3 feet from a static of 11 feet. On December 10, 1947, the non-pumping water level was reported to be 32 feet.
A summary of an analysis (Lab. No. 88742) of the water from this well is given in Table IV, key number 10.
The pumping equipment consists of: 70 feet of 6-inch column pipe; 7 5/8-inch, 10-stage American Well Works turbine pump. No. 63213, rated at 300 gpm, over-al l length of pump 6 feet 11 3/4 inches; 20 feet of 5-inch suction pipe; 70 feet of 1/4-inch b ras s pipe a i r line; electric motor.
Lawrence Brothers Manufacturing Company. This factory, located at the east side of the north end of the F i r s t Avenue highway bridge, has a well that was drilled in 1947 by Allabaugh Well Company, Rockford, to a depth of 762 feet and cased with 10-inch pipe from the surface to 63 feet and an inner casing of 8-inch pipe from the surface to 243 feet. The surface elevation is 640. The hole below the casing was eight inches in diameter to the bottom. When completed the well was equipped with an 8-inch American Well Works turbine pump with 150 feet of 5-inch column pipe and 30 feet of suction pipe. In a, production test the maximum yield was reported 45 gpm.
The well was then shot with 80 quarts of nitro-glycerin. Over a period of five to eight weeks, it was reported that "a carload of sandstone was removed". In a subsequent produc-
23
tion test the yield ra te was 125 gpm with a drawdown of 95 feet from a static level of 55 feet. In January 1952, the pump was pulled and repaired and in November 1952 the pumping rate was a little l e ss than when drilled.
In August 1953, the well had been deepened, by Allabaugh, with a 6-inch hole from 750 to 1646 feet after installing a 6-inch l iner from 650 to 750 feet.
The 7 5/8-inch, 13-stage American Well Works turbine pump was installed with 100 feet of 5-inch column pipe and 10 feet of suc tion pipe with s t ra iner . Power is furnished by a 20 hp electric motor.
Most of the water yield was reported from 1450 to 1600 feet.
In a production test it was reported by the dr i l le r that when pumping at 250 gpm the drawdown was five feet from a static level of 50 feet.
Pumpage is estimated to average 5000 gpd. National Manufacturing Company. The well
at this plant, located on the west side at the north end of the F i r s t Avenue bridge, was d r i l l ed in 1915 to a depth of 155 feet and deepened in 1930 to 850 feet, below a surface elevation of 640. It was cased with 10-inch pipe from the surface to 60 feet, with 8-inch pipe from the surface to 80 feet and with 6-inch pipe from the surface to 200 feet below which the hole was six inches to the bottom.
The well has not been in service for severa l yea r s . In July 1951 the water level was measured 16.0 feet below the top of the well, which is at approximate elevation 640.
Northwestern Steel and Wire Company. This plant, located south of the C. & N. W. R. R. between Avenues B and K, has two wells in service.
One well was drilled in 1940 by Gray Well Company, Chicago, to a depth of 760 feet and cased with 12 1/2-inch pipe to 23 feet and 8-inch pipe to 347 feet. Both casings a r e c e mented from the surface. The hole is eight inches to the bottom.
When completed, the well was tested and a yield of 465 gpm was reported with a drawdown of 145 feet from a static level of 18 feet below the surface.
On June 20, 1945 the non-pumping water level was reported at 38.5 feet and after one-half hour pumping at 225 gpm the drawdown was 65.0 feet.
In April 1949, the pump was overhauled and reinstalled. The pumping equipment cons is t s of: 160 feet of 5-inch column pipe; 8-inch, 13-stage M. C. Aurora turbine, No. 26016, rated at 200 gpm at 295 feet of head; 30 feet of 5-inch suction pipe with s t rainer; 160 feet of a i r line; 20 hp U. S. electric motor.
On April 9, 1949 the static water level was reported to be 78.1 feet and after pump-

24
FIG. 7 - LOCATIONS OF W E L L S WITH KEY NUMBERS

25
TO CHEMICAL ANALYSES IN TABLES III AND IV

26
ing 50 minutes at 200 gpm the drawdown was 68.0 feet. In 1951 this pump was being operated 24 hours daily.
A summary of an analysis (Lab. No. 88741) of the water from this well is given in Table IV, key number 11.
A well was drilled, at the Bar Mill plant in 1952, to a depth of 707 feet, below a sur face elevation of 640. When tested, it is r e ported that the yield was 50 gpm with a 200-foot drawdown from a static level of 50 feet.
The well was deepened in August 1952, by J. P. Miller Artesian Well Company, from 707 to 1636 feet and cased with 12-inch pipe from the surface to 28 feet; with 8-inch pipe from the surface to 371 feet, and cemented in place. F rom 371 to 1636 feet the hole is eight inches in diameter .
In a production test by the State Water Survey, after pumping at 600 gpm for five hours, the drawdown was 24 feet from a static water level of 50 feet.
Peoples Ice and Coal Company. This plant located at the foot of Second Avenue on the north side of the C. & N. W. R. R., has had three 8-inch wells . Two of the wells, originally 1250 and 175 feet deep, have been abandoned. The third well was drilled in 1940 to a depth of 174 feet and cased with 8-inch pipe to 25 feet. The lower 15 feet were drilled in crumbly shale and it was reported that that section was filled with gravel.
Senneff-Herr Company. This plant, located at 208 Four th Avenue, has a well which was drilled in 1940 to a depth of 265 feet and cased with 8-inch black pipe from the surface to 35 feet. The yield ra te was reported 10 gpm.
In June 1941, the well was deepened by Allabaugh Well Company, Rockford, to 650 feet and a 6-inch liner, with well packer, was set from 130 to 330 feet. In a production test September 29, 1941 the dr i l le r reported that, when pumping at 60 gpm the drawdown was 50 feet from a static level of 40 feet below a surface elevation of 670. The pumping equipment includes an Aurora turbine pump, 9F888 rated at 60 gpm with 100 feet of column pipe and 10 feet of 4-inch suction pipe.
A summary of an analysis (Lab. No. 113669) of the water from this well is given in Table IV, key number 17.
Pumpage is estimated at 2500 gpd. Sinissippi Park , located along the north
bank of Rock River at the east edge of Sterling, is a part of the Sterling and Colonna Park Distr ict . A well was drilled in February 1950 by Forder-Schil l ing to a depth of 265 feet and cased with 8-inch pipe to rock at 32 feet.
Pumping equipment includes a Red Jacket jet pump with the jet set at 100 feet. The pump is rated at 60 gpm. Power is furnished
by a 5 hp electr ic motor. The water level on June 28, 1951 Was 40
feet below the surface elevation of 670. Sterling State Police Headquarters, Dis
t r ic t 1. The State Police Headquarters for Distr ict 1 is located on Alt. Route 30 about one-half mile east of Sterling.
Two wells a re located at the station. Very li t t le information is available on the older well other than that it is 90 feet deep. A summary of an analysis (Lab. No. 86367) of the water from this well is given in Table IV, key number 52.
Well No. 2 was completed in March 1952 by Layne-Western Company to a depth of 476 feet below a ground elevation of 700. A 10-inch drive pipe was set from the surface to 31 feet and a 6-inch casing from the surface to 301 feet. The bottom 20 feet of the 6-inch casing was cemented-in.
In a production test , after 24-hours pumping at a rate of 11 gpm the drawdown was 130 feet from a static level of 94 feet below the surface.
A summary of an analysis (Lab. No. 128175) of the water from this well is given in Table IV, key number 36.
Stutzke Hardware Store. This s tore , located at 407 Locust Street, has a well drilled to a depth of 110 feet, and equipped with an Aurora centrifugal pump with 22 feet of suction pipe. In July 1951 the static water level was 14 feet below the surface.
The pump is rated at 325 gallons per hour and is used for eight hours daily for a i r conditioning.
Wahl-Clipper Corporation. This plant, lo-cated at 407 East Third Street, has a well dril led to a depth of 420 feet and cased with 8-inch pipe to 35 feet, below which the hole is six inches in diameter to the bottom.
In 1948 when pumping at 40 gp-m the drawdown was 44 feet from a static water level of 58 feet.
The well is equipped with an Aurora tu r bine pump, rated at 60 gpm, set at 200 feet. Power is furnished by a 7 l / 2 hp U. S. elect r i c motor.
Pumpage is estimated to average 7000 gpd.
Tampico (760)
A public water supply was installed by the village of Tampico about 1912.
Water is obtained from twenty-four 2-inch drive points. These a re described in detail in State Water Survey Bulletin No. 40.
A summary of an analysis(Lab. No. 112513) of the water from the Tampico wells is given in Table IV, key number 26.
Pumpage is estimated to average 60,000 gpd.

27
RESULTS OF CHEMICAL ANALYSES
Chemical analyses of the waters from 38 wells in Lee County have been made by the State Water Survey. The location of these Lee County wells a re shown in Figure 7, and referenced by a key number given to each well. The key number is also shown with the laboratory analysis number in Table I to identify the well owner and again in Table III where the resu l t s of the analyses a r e shown.
Chemical analyses of the waters from 58 wells in Whiteside County have been made by the State Water Survey. The location of these Whiteside County wells a re shown on Figure 7 and referenced by a key number given to each well. The key number is also shown with the laboratory analysis number in Table II to identify the well owner and again in Table IV where the resul ts of the analyses are shown.
The resul ts of chemical analyses, Table III for Lee County and Table IV for Whiteside County, are expressed in parts per million (ppm). P a r t s per million refers to pounds per million pounds of water or grams per 1000 l i te rs of water. Such resul ts can be converted to grains per gallon (gpd) by dividing by the factor 17.2. The par ts per million resul ts can be converted to equivalents per million by dividing by the equivalent weight of the par t i cular ion. The results for hardness, alkalinity and non-carbonate hardness are expressed in equivalent t e r m s of calcium carbonate. Since the pH of nearly all samples was less than eight, no carbonate alkalinity existed and the alkalinity exists actually as bi-carbonate.
Total Dissolved Solids
The total mineral content includes all the mineral ingredients in the water. These ingredients originated largely by the solution of the chloride, ni trate, sulfate, and carbonate sal ts of calcium, magnesium, ammonium and sodium. On solution of each or any of these ingredients however, the component parts of each salt exist in the water as separate ent i t ies and bear no relation to the original combination.
Water with a high mineral content may have a salty or brackish taste, of an intensity which depends on the concentration and kind of mine ra l s in solution.
The Public Health Service Drinking Water Standards for Interstate C a r r i e r s (1946) states that water should not contain more than 500 ppm total dissolved solids, but if such water is not available 1000 ppm may be permitted. A mineralization of 1000 ppm can be faintly tasted.
Hardness
Hard water is caused primari ly by the presence of calcium and magnesium in the water . The hardness of 88.7% of 532 of the Illinois public groundwater supplies is greater than 200 ppm and 60.2% have a hardness greater than 300 ppm.
Iron and Manganese
Two out of every three well water supplies in Illinois contain 0.4 ppm iron or more. Manganese is present in a concentration of 0.2 ppm in 14.4% of 506 public ground water supplies.
Fluorides
The fluoride content of waters has been reported to be associated with both dental c a r ies and mottled tooth enamel or dental fluoros i s . The incidence of dental car ies is low for water supplies containing 1 to 1.5 ppm of fluoride, or more, and is high for water supplies containing 0 to .5 ppm fluoride. On the other hand, the incidence of darkened or mottled teeth is increasingly high for water supplies containing 1.5 or more ppm. fluorides, and is low for water supplies containing less than 1.0 ppm fluoride.
Nitrates
Excessive nitrate concentrations in water may cause "blue babies" when such water is used in the preparation of infant feeding formulas. Serious cases of methemoglobinemea in adults have also been attributed to this. An upper safe limit has tentatively been set as 44 ppm. (as NO3) by the National Research Council. At least one supply in Illinois, however, contains more than 80 ppm and has been in use for a number of yea r s with no reported difficulty from this cause. This subject is under constant consideration by the State Department of Public Health at the present t ime.
Chloride and Sulfate
The presence of high chloride and sulfate concentrations a re direct indications of high total mineral content. Chloride and sulfate sa l ts a re generally quite soluble in water at

28
normal temperatures , although the solubility of calcium sulfate at temperatures approaching boiling reduces to the point where all of the calcium and sulfate a re not compatible in solution. The incompatibility of calcium and sulfate at elevated tempera tures is not as great as the incompatibility of calcium and carbonate.
The presence of high chloride and sulfate content producing waters of high minera l content is responsible for grea ter electr ical conductivity. This in turn enhances corrosive propert ies of water, part icularly with respect to iron and greatly accelerates the galvanic corrosive effect on iron when coupled with copper bearing metals.
Chlorides are detectable by tas te when present in concentrations of 400 to 500 ppm. or more .
Alkalinity
In most ground waters in Illinois, the a l kalinity is in the range of 200 to 400 ppm. and in general is associated with 20 to 50 ppm free carbon dioxide. The free carbon dioxide in the water is usually not more than that which is necessary to maintain the solubility of calcium in these waters .
Methane
Methane gas is present in a number of ground water supplies and on several occasions has caused severe explosions. This gas is color less , odorless, and tas te less . It is lighter than air, inflammable, and when released from the water and mixed in concentrations of 5 to 15% with a i r the resultant mixture is highly explosive on ignition. If water containing this gas is passed through a pressure tank it is possible for the a i r cushion to contain a high proportion of methane. In such cases the vent or the re lease of accumulated gas in the p r e s su re tank should extend outdoors and should not be vented inside of the building. An inside vent can easily lead to the 5 to 15% mixture with a i r in the room in which the pressure tank is located. Methane gas can readily be r e moved from water by standard aeration p roce dures .
The occurrence of methane in groundwater appears to be limited to supplies which obtain their water from the unconsolidated beds above the bedrock. On a few occasions such gas has been obtained from wells yielding water from limestone where the limestone presumably has been fed from the overlying unconsolidated de posits .
DISCUSSION OF WATER QUALITY
In Lee and Whiteside Counties, water from wells penetrating the deeper sandstones at depths grea te r than 750 feet (Wells No. 1-3 in Lee County and 1-11 in Whiteside County, (Tables III and IV respectively) a re noted to have a hardness ranging from 271 to 328 ppm and a total mineral content ranging from 308 to 357 ppm. The alkalinities a re slightly less than the hardness ranging from 248 ppm to 300 ppm. All samples from these wells contained a s ignificant concentration of sulfate, very low nit ra te and variable chloride content. The fluoride content ranged from 0.1 to 0.6 ppm, the silica content from 10 to 15 ppm. There is l i t t le or no ammonia present, manganese is absent, but iron, may on occasions be found in a concentration of as much as 0.7 ppm.
Two samples from shallow wells in Lee County (No. 10 and 11) were noted to have an exceptionally low mineral content and hardness at the t ime of collection of the sample.
Exceedingly high hardness (400-600 ppm was noted in samples from 15 wells (No. 12 to 18 in Whiteside County and 12 to 19 in Lee
County). These waters usually are noted to contain unusually high ni t rate and/or considerable sulfate concentrations. The chloride contents were also frequently noted to be re la t ively high. Where determined, the fluoride content did not exceed 0.5 ppm. Waters from the remaining wells appear to have a normal hardness ranging from 200 to 390 ppm with the exception of four wells located in the southeastern part of Lee County. The median hardness for the wells penetrating drift and limestone is 300 ppm.
With the exception of the waters obtained from the deeper sandstone, the iron contents are g rea te r than 0.3 ppm in 56% of the s a m ples.
Manganese is present in appreciable concentrations, (greater than 0.1 ppm) in wells located pr imari ly in the southern half of Whiteside County.
No samples in the region were noted to be of exceptionally high mineral content nor of exceptionally high fluoride content.

TABLE I
L E E COUNTY - WELLS P r i v a t e , Pub l i c and I n d u s t r i a l
Depth Well Well Ground to f inished C a p a - P u m p a g e
Dr i l l ed Depth D iam. E l e v . Wa te r in g r a v e l c i ty L a b o r a t o r y Analys is 1000s Loca t ion Year ft. in. MSL. ft. or r o c k gpm. Use No. Key No. gpd.
T 19N R 10E
Sect ion 10, NW l / 4 1941 247 3 860 150 g r a v e l 12 f a r m
Sect ion 23 , NW 920 230 g r a v e l 12 f a r m
Sect ion 24, SW 1949 313 3 870 194 g r a v e l f a r m
T 19N R 11 E
S U B L E T T E 1898 752 10-6* 920 220 rock 90 publ ic 112898 24 12
Halbig Cheese 1940 317 4 920 225? g r a v e l i ndus . 3
Sec t ion 9, NE l / 4 1944 301 3 940 240 g r a v e l 12 f a r m
Sect ion 14, SW 1943 367 3 880 g r a v e l f a r m
Sect ion 20, SE 328 3 883 10 g r a v e l f a r m
Sect ion 31 , NE 218 3 860 150 g r a v e l f a r m
Sect ion 32, NE 293 3 850 g r a v e l f a r m
T 20N R 8E
Sect ion 12, NW 1944 53 5 g r a v e l f a r m
Sect ion 13, SW 1943 133 6 710 5 g r a v e l 15 f a r m
Sect ion 14, SE 1939 143 6 700 60 g r a v e l f a r m
HARMON' 1909 532 5 7 r o c k 30 publ ic 36191 28
* D i a m e t e r r e d u c e d f r o m 10 to 6 i nches

TABLE I CONTINUED LEE COUNTY WELLS
Depth Well Well Ground to f inished C a p a - P u m p a g e
Dr i l l ed Depth D i a m . E l ev . W a t e r in g r a v e l c i ty L a b o r a t o r y A n a l y s i s 1000s Loca t ion Y e a r ft. in. MSL. ft. or r o c k gpm. Use No. Key No. gpd.
T 20N R 8E (Cont 'd)
HARMON 1923 32 1 l / 2 700 g r a v e l publ ic 112899 12 16
Sec t ion 22, NE l / 4 1946 55 6 705 g r a v e l 8 f a r m
Sect ion 26, NW 1943 75 6 690 14 g r a v e l 10 f a r m
T 20N R 9E
Green River, O. P. , P-l 1942 371 24 792 33 rock 400 indus. 93173 26
Green River, A-2 1942 425 10 753 +1 rock 410 indus. 93150 21
Section 10, SE l/4 1946 85 3 750 36 gravel 15 farm
Green River, P-2 1942 479 16 755 5 rock 476 indus. 93446 25
T 20N R 10E
Sect ion 1, NW l / 4 1912 70 6 795 20 r o c k f a r m
G r e e n R i v e r , A - l 1942 430 10 788 28 r o c k 595 indus . 93075 27
Amboy Mi lk Co. 1938 1120 12 750 52 r o c k 600 indus . 111085 4 250
AMBOY NO. 2 1924 1100 12 750 88 r o c k 265 publ ic 112906 5 134
Sec t ion 24, SW l / 4 1940 110 6 770 r o c k f a r m
T 20N R 11E
Sect ion 5, SE l / 4 70 3 815 55 r o c k f a r m
Sect ion 16, NW 90 3 765 23 r o c k f a r m

TABLE I CONTINUED L E E COUNTY WELLS
Depth Well Well Ground to f inished C a p a - P u m p a g e
Dr i l l ed Depth D i a m . E l e v . W a t e r i n g r a v e l c i ty L a b o r a t o r y A n a l y s i s 1000s Loca t ion Year ft. in . MSL. ft. or r o c k gpm. Use No. Key No. gpd.
T ZON R HE (Cont 'd)
Sec t ion 25 , NE 1946 298 3 920 177 g r a v e l 7 f a r m
Sect ion 27, SE 1948 301 3 900 188 g r a v e l 15 f a r m
T 21N R 8E
Sect ion 1, NE l / 4 1936 202 4 72 0 5 r o c k f a r m 81436 31
Sect ion 1, SW 1861 65 4 8 - 6 * 720 15 r o c k f a r m
Sect ion 2, NE 1905 185 6 760 125 r o c k f a r m 80724 37
Sec t ion 3, SW 1918 95 6 745 75 r o c k f a r m
Sect ion 4, NW 160 4 8 - 6 * 755 60 r o c k f a r m
Sect ion 5, SW 80 4 8 - 6 * 680 19 r o c k f a r m
Sect ion 5, NW 1940 84 6 740 r o c k house
Sect ion 6, NW 1867 105 6 720 50 r o c k f a r m
Sect ion 6, SW 1931 135 8 760 80 r o c k f a r m
Sect ion 9, NW 16 48 670 12 g r a v e l f a r m
Sect ion 9, SE 48 4 8 - 6 * 680 30 r o c k f a r m
Sect ion 10, NE 1902 104 6 650 76 r o c k f a r m 80725 13
Sec t ion 11, NW 1908 75 6 660 35 r o c k f a r m
Sec t ion 11, SE 1930 176 6 680 86 r o c k f a r m
C & N. W. R . R . , Ne l son 35 300 676 5 g r a v e l b o i l e r s 12
* D i a m e t e r r educed f r o m 48 to 6 i nches

TABLE I CONTINUED L E E COUNTY WELLS
Depth Well Wel l Ground to f inished C a p a - P u m p a g e
Dr i l l ed Depth D i a m . E l e v . W a t e r in g r a v e l c i ty L a b o r a t o r y A n a l y s i s 1000s Loca t ion Year ft. in. MSL. ft. or r o c k g p m . Use No. Key No. gpd.
T 21N R 8E (Cont 'd)
Sec t ion 23 , SW 1943 212 6 700 30 r o c k f a r m
Sect ion 27, SW 1947 70 6 700 r o c k f a r m
T 2 I N R 9E
Sect ion 2, NE l / 4 1931 285 8 795 35 r o c k f a r m 5
Sec t ion 2, SE 1880 80 4 8 - 6 * 805 35 r o c k f a r m
Sect ion 3, NE 70 4 8 - 6 * 780 15 r o c k f a r m
Dixon A i r p o r t 1934 175 6 785 47 r o c k A i r p o r t 74990 36
B e i e r B r o s . 1934 110 6 650 10 indus . 75304 14
C o l u m b u s - M c K i n n o n 1949 180 - 690 30 indus . 24
F r e e m a n Shoe 30 36 680 25 ' g r a v e l i ndus . 2
Pub l i c S e r v . Co. of Nor . I11. 1937 160 6 545 15 r o c k 400 indus . 85933 38
B. F. Shaw P t g . Co. 80 6 660 indus . 130762 15
Mable Shaw 217 81205 16
S tandard D a i r y 1931 277 6 720 120 r o c k indus . 112904 34 6
Sec t ion 6, NW 1922 220 6 650 18 r o c k f a r m 80680 35
Sect ion 8, NW 1943 150 6 770 98 r o c k f a r m
Sect ion 10, SE 1945 111 5 787 r o c k f a r m
Sect ion 10, SW 1943 100 6 787 r o c k f a r m
Sect ion 13, W l / 2 1942 90 4 800 30 r o c k f a r m
* D i a m e t e r r e d u c e d f r o m 48 to 6 inches

TABLE I CONTINUED LEE COUNTY WELLS
Depth Well Well Ground to f in i shed C a p a - P u m p a g e
D r i l l e d Depth D i a m . E l e v . Wate r in g r a v e l c i ty L a b o r a t o r y Ana lys i s 1000s L o c a t i o n Y e a r ft. in . MSL. ft. or r o c k g p m . Use No. Key No. gpd.
T 21 N R 9 E
Sect ion 20, SW 1941 66 4 740 30 r o c k f a r m
L e e County N u r s i n g Home 1953 330 8 785 48 r o c k 186 s e m 1 - 5 publ ic
T 21N R 1 0 E
FRANKLIN G R O V E - S o u t h 1902 298 10 810 35 r o c k 100 pub l i c 112905 17 30
FRANKLIN G R O V E - N o r t h 1924 150 10 810 31 r o c k 100 publ ic
FRANKLIN G R O V E - 3 1954 769 12 810. 40 r o c k 350 publ ic
Sect ion 5, SW l / 4 1922 166 6 790 40 r o c k f a r m
Sect ion 5, NW 60 6 795 40 r o c k f a r m '
Sect ion 7, SW 1924 65 6 805 35 r o c k f a r m
Sect ion 7, NW 85 6 800 50 r o c k f a r m
Sect ion 7, NW 1922 124 5 790 45 r o c k f a r m
Sect ion 34, NW l / 4 1905 118 6 0 - 5 * .820 48 r o c k f a r m
Sect ion 34, NW 138 6 0 - 5 * 825 50 r o c k f a r m
T 21N R H E
Sect ion 2, SE- 1/4 90 6 830 25 r o c k f a r m
Sect ion 10, NW 60 830 6 r o c k f a r m
Sect ion 16, NW 1941 80 6 820 25 r o c k 20 f a r m
Sect ion 34, SW 1942 128 4 780 flow r o c k 3 f a r m
* D i a m e t e r r e d u c e d f r o m 60 to 5 i nches

T A B L E I CONTINUED L E E COUNTY W E L L S
Depth Well Well Ground to f inished C a p a - P u m p a g e
Dr i l l ed Depth D i a m . E l e v . W a t e r i n g r a v e l c i ty L a b o r a t o r y A n a l y s i s 1000s L o c a t i o n Y e a r ft. in. MSL. ft. or r o c k ' ' gpm. Use No. Key No. gpd.
T 22 N R 8E
Sect ion 13, SE l / 4 1860 200 6 805 150 r o c k f a r m
Sect ion 13, NW 1924 164 4 800 134 r o c k f a r m
Sect ion 14, NE 1865 170 6 819 140 r o c k f a r m
Sect ion 15, NE 200 6 800 140 f a r m
Sec t ion 19, SE 1901 116 6 760 46 r o c k f a r m
Sect ion 23 , NW 160 6 780 126 f a r m
Sect ion 24, NE 180 6 740 80 r o c k f a r m
Sect ion 24, NW 235 4 8 - 6 * 802 20 f a r m
Sect ion 26 , SW 1908 186 6 795 90 f a r m
Sect ion 27, NW 1945 217 6 760 72 rock 25 f a r m
Sect ion 28 , NW 1908 98 6 750 50 f a r m
Sect ion 30, NE 1885 128 8 750 78 f a r m
Sect ion 31 , SE 1865 116 8 726 60 r o c k f a r m
Sect ion 33, NE l / 4 165 5 770 55 r o c k f a r m
Sec t ion 33, NE 75 5 770 70 r o c k f a r m
Sec t ion 34, SE 1860 75 6 780 50 r o c k f a r m
Sect ion 34, NW 70 48-6* 770 r o c k f a r m
Sect ion 35, SE 1890 100 6 740 70 r o c k f a r m
* D i a m e t e r r educed f r o m 48 to 6 inches

TABLE I CONTINUED L E E COUNTY WELLS
Depth Wel l Well Ground to f inished C a p a - Pumpage
Dr i l l ed Depth D i a m . E l e v . Wate r in g r a v e l c i ty L a b o r a t o r y A n a l y s i s 1000s Loca t ion Y e a r ft. in . MSL. ft. or r o c k gpm. Use No. Key No. gpd.
T 22N R 8E (Cont 'd)
Sect ion 35, SW 1902 110 6 760 85 r o c k f a r m
Sect ion 36, NE 1926 127 6 770 f a r m
Sec t ion 36, SE 1898 140 6 720 100 r o c k f a r m
Sect ion 36, SW 1880 96 6 772 61 r o c k f a r m
T 22N R 9E
Sect ion 9, SE l / 4 1850 65 60 700 57 r o c k f a r m
Sect ion 9, SE 1900 54 6 720 34 r o c k f a r m
Sect ion 9, SW 1878 104 6 0 - 6 * 720 50 r o c k f a r m
Sect ion 10, SW 1905 167 6 760 60 r o c k f a r m
Sec t ion 14, SE 1925 108 6 700 64 r o c k f a r m
Sect ion 14, SE 1932 70 6 690 44 r o c k f a r m 80603 10
Sect ion 14, NW 1834 20 6 0 - 1 l / 4 * * 655 15 g r a v e l f a r m
Sect ion 16, SE 1900 132 6 760 110 r o c k f a r m
Sec t ion 16, NW 1900 160 6 765 125 r o c k f a r m
Sect ion 17, SE 1942 60 670 32 r o c k f a r m
Sect ion 20, NE 1931 25 72 650 s p r i n g rock f a r m
Sect ion 20, NE 1933 335 6 700 40 r o c k f a r m 80595 33
* D i a m e t e r r e d u c e d f r o m 60 to 6 i nches * * D i a m e t e r r educed f r o m 60 to 1 l / 4 inches

TABLE 1 CONTINUED LEE COUNTY WELLS
Depth Well Well Ground to f inished C a p a - P u m p a g e
Dr i l l ed Depth D i a m . E l e v . W a t e r in g r a v e l c i ty L a b o r a t o r y A n a l y s i s 1000s L o c a t i o n Y e a r ft. in. MSL. ft. or r o c k gpm. Use No. Key No. gpd.
T 22N R 9E (Cont 'd)
Sec t ion 20, SW 1915 173 6 800 160 r o c k f a r m
Dixon State Hospi ta l -1 1915 1922 23 680 34 rock 1475 publ ic 128882 2
Dixon State H o s p i t a l - 2 1915 1780 23 680 34 r o c k 700 publ ic 124893 1 684
Sect ion 22, SE 1920 75 6 710 15 r o c k f a r m
Sect ion 22, SW 1880 25 60 640 21 g r a v e l f a r m
Sect ion 22 , NW 1900 115 6 665 20 r o c k f a r m
Sect ion 23 , NE 1931 72 6 690 37 r o c k f a r m 80602 11
Sec t ion 23 , NE 1923 72 5 700 27 r o c k f a r m
Sect ion 23 , SE 1873 100 6 0 - 6 * 700 50 r o c k f a r m
Sect ion 24, SE 1931 18 2 675 9 g r a v e l f a r m 80698 29
Sect ion 24, SE 1879 60 4 8 - 5 * * 690 23 r o c k f a r m
Sect ion 24, NW 1907 96 6 680 12 r o c k f a r m
Sect ion 24 1939 95 5 660 25 r o c k f a r m
Sect ion 25 , NE 1916 94 4 690 20 r o c k f a r m 80746 18
Sec t ion 25 1940 77 4 720 24 r o c k 10 f a r m
Sec t ion 25 , SW 1870 255 6 0 - 4 * * * 740 59 r o c k f a r m 80747 32
Sect ion 26, NE 1850 130 6 780 15 r o c k f a r m
* D i a m e t e r r educed f r o m 60 to 6 inches * * D i a m e t e r r educed f r o m 48 to 5 inches
* * * D i a m e t e r r educed f r o m 60 to 4 inches

T A B L E I CONTINUED L E E COUNTY WELLS
Depth Well Well Ground to f inished C a p a - P u m p a g e
Dr i l l ed Depth D iam. E l ev . Wate r in g r a v e l c i ty L a b o r a t o r y Ana lys i s 1000s Loca t ion Year ft. i n . M S L . ft. o r r o c k gpm. Use No. Key No. gpd.
T 22N R 9E (Cont 'd)
Medusa P. C. 146 6 660 46 rock indus . 10
Sect ion 28 , SE 1860 48 3 675 8 rock f a r m
Sect ion 28, SE 1900 60 6 680 40 r o c k f a r m
Sect ion 28, SW 1914 98 5 720 25 r o c k f a r m
Dixon C . C . 1950 340 36 760 2 r o c k Club 2
L inco ln Mote l 1951 205 730 50 r o c k S e m i -publ ic
Sect ion 29, SE 1890 165 6 780 60 r o c k f a r m 80596 30
Sec t ion 29, SE 1932 212 6 785 110 rock f a r m 8
Sec t ion 29, SW 70 4 8 - 6 * 775 50 r o c k f a r m
Sect ion 29, SW 210 6 780 70 r o c k f a r m
Sect ion 30, SE 1928 72 6 720 30 r o c k f a r m
Sect ion 30, SE 1880 175 6 726 75 r o c k f a r m
Sec t ion 30, SE 1910 125 6 700 50 r o c k f a r m
Sect ion 30, SW 1928 240 6 740 70 r o c k Club 2
B o r d e n No. 2 1600 660 50 r o c k indus .
B o r d e n No. 4 189 640 25 indus .
B o r d e n No. 6 1948 200 10 640 indus . 6
Sec t ion 3 1 , NE 1929 72 6 720 28 r o c k f a r m
* D i a m e t e r r e d u c e d f r o m 48 to 6 i nches
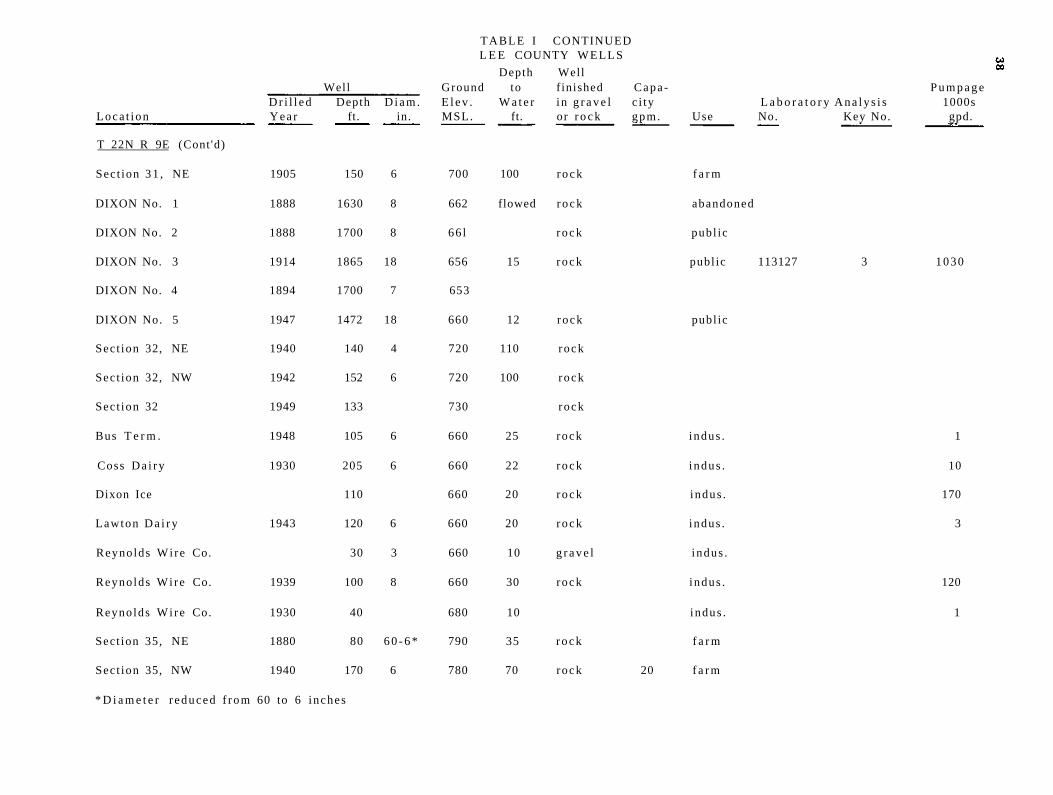
TABLE I CONTINUED L E E COUNTY WELLS
Depth Well Well Ground to f inished Capa - P u m p a g e
D r i l l e d Depth D i a m . E l e v . W a t e r i n g r a v e l c i ty L a b o r a t o r y A n a l y s i s 1000s Loca t ion Y e a r ft. in. MSL. ft. or r o c k gpm. Use No. Key No. gpd.
T 22N R 9E (Cont 'd)
Sec t ion 3 1 , NE 1905 150 6 700 100 r o c k f a r m
DIXON No. 1 1888 1630 8 662 flowed r o c k abandoned
DIXON No. 2 1888 1700 8 66 l r o c k publ ic
DIXON No. 3 1914 1865 18 656 15 r o c k publ ic 113127 3 1030
DIXON No. 4 1894 1700 7 653
DIXON No. 5 1947 1472 18 660 12 rock publ ic
Sec t ion 32, NE 1940 140 4 720 110 rock
Sec t ion 32, NW 1942 152 6 720 100 rock
Sec t ion 32 1949 133 730 rock
Bus T e r m . 1948 105 6 660 25 rock indus . 1
Coss D a i r y 1930 205 6 660 22 r o c k i ndus . 10
Dixon Ice 110 660 20 r o c k indus . 170
Lawton D a i r y 1943 120 6 660 20 r o c k indus . 3
Reynolds Wi re Co. 30 3 660 10 g r a v e l i ndus .
Reynolds Wi re Co. 1939 100 8 660 30 rock indus . 120
Reynolds Wi re Co. 1930 40 680 10 indus . 1
Sect ion 35, NE 1880 80 6 0 - 6 * 790 35 r o c k f a r m
Sect ion 35, NW 1940 170 6 780 70 rock 20 f a r m
* D i a m e t e r r e d u c e d f r o m 60 to 6 inches

TABLE I CONTINUED L E E COUNTY W E L L S
Depth Well Well Ground to f i n i shed C a p a - P u m p a g e
Dr i l l ed Depth D iam. E lev . W a t e r in g r a v e l ci ty L a b o r a t o r y Ana lys i s 1000s L o c a t i o n . Y e a r ft. in. MSL. ft. or r o c k gpm. Use No. Key No. gpd.
T 22N R 9E (Cont 'd)
Sect ion 35 1941 135 6 780 83 r o c k 15 f a r m
Sect ion 36 62+ 6 0 - 6 * 780 40 r o c k f a r m
T 22N R 10E
Sect ion 17, NE l / 4 1941 95 6 764 30 r o c k 15 f a r m
Sect ion 17, NW 85 4 8 - 5 * * 720 28 r o c k
Sect ion 18, NW 18 60 680 14 g r a v e l f a r m
Sect ion 18, SW 22 48 675 g r a v e l f a r m
Sect ion 19, NW 70 6 0 - 6 * 700 18 r o c k f a r m
Sect ion 22, NW 1904 100 8 760 80 r o c k f a r m
Sect ion 23 , NE 60 6 825 40 rock f a r m
Sec t ion 23 , SW 125 6 825 100 r o c k f a r m
Sect ion 24, SW 1898 150 6 820 100 rock f a r m
Sect ion 24, SW 1900 120 6 820 100 rock f a r m
Sect ion 24, NW 60 6 840 40 r o c k f a r m
Sect ion 25 , SW 90 5 829 48 r o c k f a r m
Sect ion 25 , SW 80 6 810 60 r o c k f a r m
Sec t ion 26, NE 170 6 825 48 r o c k f a r m
* D i a m e t e r r educed f r o m 60 to 6 i nches * * D i a m e t e r r e d u c e d f rom 48 to 5 i nches

TABLE I CONTINUED L E E COUNTY WELLS
Loca t ion
T 22N R 10E (Cont 'd)
Well Dr i l l ed Depth D i a m . Year ft. in.
Depth Well Ground to f inished C a p a - P u m p a g e E l e v . Wa te r in g r a v e l c i ty L a b o r a t o r y Ana lys i s 1000s MSL. ft. or r o c k gpm. Use No. Key No. gpd.
Sect ion 26, SE 84 6 810 64 r o c k f a r m
Sec t ion 26 , NW 84 6 822 80 rock f a r m
Sect ion 27, NE 1895 170 6 805 60 rock f a r m
Sect ion 27, SE 1899 84 6 800 68 r o c k f a r m
Sect ion 27, NW 1902 110 6 800 90 r o c k f a r m
Sect ion 28 , NW 1914 153 8 760 23 rock f a r m
Sect ion 28, NW 1907 150 780 r o c k f a r m
Sect ion 30, NE 1880 165 4 8 - 5 * 760 130 rock f a r m
Sect ion 31 , NE 1899 85 6 720 38 r o c k f a r m
Sect ion 31 , SE 28 60 740 r o c k f a r m
Sect ion 32, SE 1880 104 6 780 54 r o c k f a r m
Sect ion 32, SW 1894 37 6 735 9 rock f a r m
Sec t ion 34, NW 1898 129 6 800 100 rock f a r m
Sect ion 35, NE 50 8 815 r o c k f a r m
Sect ion 35, SW 1921 175 6 805 19 rock f a r m
Sect ion 36, SW 1854 50 8 816 40 rock f a r m
T 22N R 11E
ASHTON 1915 545 5 810 39 r o c k publ ic
* D i a m e t e r r educed f r o m 48 to 5 inches
113129 19 70

TABLE I CONTINUED L E E COUNTY W E L L S
Loca t ion
Well Dr i l l ed Depth D i a m . Y e a r ft. in .
Depth Well Ground to f inished C a p a -E lev . Wate r in g r a v e l c i ty MSL. ft. o r r o c k g p m . Use
L a b o r a t o r y A n a l y s i s No. Key No.
P u m p a g e 1000s gpd.
T 22N R 11E (Cont 'd)
C. & N. W. R. R. 1900 249 810 35 r o c k locomot ive 20
T 37N R 1E
Sect ion 2, NE l / 4 1946 326 3 960 190 g r a v e l 10 f a r m
Sect ion 5, NW 1946 261 3 900 128 g r a v e l 16 f a r m
Sec t ion 6, NE 1944 249 3 850 124 g r a v e l 20 f a r m
WEST BROOKLYN 1898 660 5 983 229 r o c k 100 publ ic 113672 23 15
Sect ion 8, SE 1940 391 980 300 g r a v e l 12 f a r m
Sect ion 10, NW 1945 366 3 1010 285 g r a v e l 10 f a r m
COMPTON 1895 335 8 982 235 g r a v e l 70 publ ic 113200 9 23
Sect ion 18, NE 1941 365 980 270 g r a v e l 12 f a r m
Sect ion 19/ NW 326 p r i v a t e 117326 6
Sec t ion 23 , NW 1945 333 3 915 187 g r a v e l 15 f a r m
Sect ion 26, NE 1944 330 3 950 201 g r a v e l 15 f a r m
Sect ion 36, NE 1944 328 3 910 181 g r a v e l 12 f a r m
T 37N R 2E
Sect ion 2, SW l / 4 1947 331 5 940 248 g r a v e l 4 f a r m
PAW PAW 1895 1018 10 928 188 r o c k 80 publ ic 113131 8 40
Sec t ion 30, SW 1944 336 3 920 201 g r a v e l 6 f a r m

TABLE 1 CONTINUED LEE COUNTY WELLS
Loca t ion
Well Dr i l l ed Depth D i a m . E l e v . Y e a r ft. in. MSL.
Depth Well to f inished C a p a -
W a t e r in g r a v e l c i ty ft. or rock gpm. Use
L a b o r a t o r y A n a l y s i s No. Key No.
P u m p a g e 1000s gpd-
T 38N R 1E
Sect ion 7, SE l / 4 1952 206 6 780 r o c k f a r m
Sect ion 15, SE 1948 32 3 810 5 g r a v e l 15 f a r m 12
Sect ion 18, NE 25 3 780 5 g r a v e l f a r m
Sect ion 2 1 , NW 1948 30 3 770 5 g r a v e l 16 f a r m
Sect ion 23 , NE 1940 40 825 8 g r a v e l 10 F i l l . Sta. 2
Sect ion 27, SE 1941 205 880 75 g r a v e l 15 f a r m
Sect ion 28 , SE 1944 229 3 820 65 g r a v e l 15 f a r m
Sect ion 29, SW 1944 172 3 800 47 g r a v e l 15 f a r m
Sect ion 3 1 , NW 1940 59 3 800 28 g r a v e l 15 f a r m
Sect ion 3 1 , SE 1946 30 3 800 18 g r a v e l 10 f a r m
Sect ion 34, NE 1945 225 3 920 98 g r a v e l 15 f a r m
Sect ion 34, SW 1950 214 3 850 94 g r a v e l 15 farm*
Sec t ion 34, SE 1944 131 3 940 g r a v e l 19 f a r m
T 38N R 2E
L E E 1904 335 6 940 188 g r a v e l 65 publ ic 112126 7 12
Sect ion 4, NW l / 4 1947 387 850 rock f a r m
Sect ion 5, SW 30 3 780 6 g r a v e l f a r m
Sect ion 10, NW 2 06 6 840 60 g r a v e l f a r m
Sect ion 19, NE 1947 94 3 850 69 g r a v e l 15 f a r m

TABLE I CONTINUED LEE COUNTY WELLS
Depth Well Well Ground to finished Capa- Pumpage
Drilled Depth Diam. Elev. Water in gravel city Laboratory Analysis 1000s Location Year ft. in. MSL. ft. or rock gpm. Use. No. Key No. gpd.
T 39N R 1E
Sect ion 1, SE l / 4 1942 107 5 825 12 r o c k 20 f a r m
Sect ion 3, NE 1939 300 6 790 4 r o c k 35 f a r m
Sect ion 20, SW 1945 141 6 830 r o c k f a r m
Sec t ion 26 , NE 113 6 840 14 r o c k f a r m
T 39N R 2E
Sec t ion 11 , SW l / 4 1944 500 6 920 150 r o c k 25 f a r m
Sect ion 17, SE 1913 320 12 860 40 r o c k 30 locomot ive
Sec t ion 17, SE 1914 28 8 860 13 50 locomot ive
STEWARD 1909 100 8 823 26 g r a v e l publ ic 112900 22 10
Sec t ion 28 , NE 1948 470 6 920 80 r o c k f a r m 132448 20 2
Sect ion 35, SE 1951 345 6 930 175 g r a v e l f a r m

TABLE II
WHITESIDE COUNTY - WELLS P r i v a t e , P u b l i c and I n d u s t r i a l
Loca t ion
Well Dr i l l ed Depth D iam. Y e a r ft. in .
Depth Well Ground to f inished C a p a -E lev . Wa te r in g r a v e l c i ty MSL. ft. o r r o c k g p m .
L a b o r a t o r y A n a l y s i s Use No. Key No.
P u m p a g e 1000s gpd-
T 19N R 3E
Sect ion 3, NE l / 4 20 1 l / 4 580 8 g r a v e l f a r m
Sect ion 3, SE 40 1 l / 4 580 10 g r a v e l f a r m
Sect ion 4, SE 15 1 l / 4 575 5 g r a v e l f a r m 80732 53
Sect ion 5, NE 20 1 l / 4 580 8 g r a v e l f a r m
Sect ion 11 , SW 16 1 l / 4 585 10 g r a v e l f a r m
Sect ion 14, SW 1924 65 6 580 15 r o c k f a r m 80733 16
Sect ion 16, NE 16 1 l / 4 575 6 g r a v e l f a r m
Sect ion 2 1 , NE 18 1 l / 2 580 12 g r a v e l f a r m
Sect ion 24, SW 20 1 l / 4 580 18 g r a v e l f a r m
Sec t ion 25 , NE 16 1 l / 4 580 10 g r a v e l f a r m
Sect ion 26, NW 32 6 580 14 r o c k
Sect ion 27, NE 63 6 580 12 r o c k f a r m
Sect ion 27, SE 16 1 l / 4 580 8 g r a v e l f a r m
Sect ion 28 , NE 20 1 l / 4 580 8 g r a v e l f a r m
T 19N R 4E
Sect ion 4, NE l / 4 1941 42 6 580 7 g r a v e l 10 f a r m
ERIE No. 1 1920 567 10 586 26 r o c k publ ic 112153 23 45

TABLE II CONTINUED WHITESIDE COUNTY WELLS
Depth Well Well Ground to finished Capa- Pumpage
Drilled Depth Diam. Elev. Water in gravel city Laboratory Analysis 1000s Location Year ft. in. M S L . ft. or rock gpm. Use No. Key No. gpd
T 19N R 4E (Cont'd)
ERIE No. 2 1953 171 12 586 17 gravel 700 public 133002 21
Supreme Dairy Products Co. 26 1 l / 4 586 11 gravel 25 indus 8
Section 16 25 1 l / 4 590 10 gravel farm
Section 25, SE 18 1 l / 4 14 gravel 132445 45
Section 26, NW 35 1 l / 4 615 19 gravel farm
T 19N R 5E
PROPHETSTOWN 1944 235 10 6 l5 41 rock 304 public 112155 35 110
Eclipse Lawn Mower No. 1 1941 40 5 622 24 gravel indus
Eclipse Lawn Mower No. 2 1942 193 10 622 24 rock 470 indus 112157 42 10
Section 28, SW 1/4 14 l l / 2 619 10 gravel 132446 41
T 19N R 6E
TAMPICO 1947 30 2 645 13 gravel 160 public 112513 26 60
Section 34, SE l /4 20 1 l /2 630 15 gravel farm
T 19N R 7E
C.B. &Q. R. R. , Deer Grove 1946 50 6 647 20 gravel 100 locom. 3
T 20N R 2E
Section 1, SE l/4 1895 100 5 720 45 rock farm

T A B L E II CONTINUED WHITESIDE COUNTY WELLS
Depth Well Well Ground to f inished C a p a - P u m p a g e
Dr i l l ed Depth D i a m . E l ev . Wa te r in g r a v e l c i ty L a b o r a t o r y A n a l y s i s 1000s Loca t ion Year ft. in. MSL. ft. or r o c k gprn. Use No. Key No. gpd.
T 20N R 2E (Cont 'd)
Sect ion 2, SE 1902 43 5 680 16 r o c k f a r m
Sect ion 11, SE 22 1 l / 4 610 6 g r a v e l f a r m
Sect ion 12, SE 1906 106 5 650 63 r o c k f a r m
Sect ion 12, SE 1903 106 5 650 60 r o c k
Sec t ion 13, NE 1924 132 5 620 65 r o c k f a r m
Sect ion 13, NW 1896 32 1 l / 4 610 14 g r a v e l f a r m
Sec t ion 14, NE 18 1 l / 4 580 12 g r a v e l f a r m
Sec t ion 24, NW 1902 31 1 l / 4 590 12 g r a v e l f a r m
Sect ion 24, NW 45 1 l / 4 590 g r a v e l 80847 20
Sec t ion 25 , NE 32 1 l / 4 600 8 g r a v e l f a r m
Sec t ion 25 , NW 27 1 l / 4 580 25 g r a v e l f a r m
Sect ion 36, SW 20 1 l / 4 575 10
T 20N R 3E
Sect ion 1, SW l / 4 100 5 720 45 r o c k f a r m
Sect ion 4, NE 1928 206 5 720 71 r o c k f a r m
Sect ion 4, SW 1913 66 5 740 35 r o c k f a r m
Sect ion 6, SE 1922 92 5 720 60 r o c k f a r m
Sect ion 7, NW 1927 44 5 720 18 r o c k f a r m
Sect ion 8, SE 180 5 680 110 r o c k f a r m

TABLE II CONTINUED WHITESIDE COUNTY WELLS
Depth Well Wel l Ground to f in ished C a p a - P u m p a g e
Dr i l l ed Depth D i a m . E l e v . Wa te r in g r a v e l c i ty L a b o r a t o r y A n a l y s i s 1000s Loca t ion Y e a r ft. in . MSL. ft. or r o c k gpm. Use No. Key No. gpd.
T 20N R 3E (Cont 'd)
Sec t ion 9, NE 1922 102 5 740 50 r o c k f a r m
Sect ion 10, NE 1896 65 6 700 45 r o c k f a r m
Sect ion 11, NE 60 5 720 40 r o c k f a r m
Sect ion 11, NE 1910 74 5 720 45 r o c k f a r m
Sect ion 12, NW 100 5 700 60 r o c k f a r m
Sect ion 12, SE 100 5 720 70 r o c k f a r m
Sect ion 13, SW 1904 40 5 640 15 r o c k f a r m
Sect ion 14, SE 88 6 680 56 r o c k f a r m
Sec t ion 15, SW 1874 103 3 6 - 5 * 680 48 r o c k f a r m 80616 56
Sect ion 15, SW i920 100 5 620 100 r o c k f a r m
Sect ion 16, NW 1913 175 5 700 100 r o c k f a r m
Sec t ion 17, SE 1904 199 5 640 90 r o c k f a r m
Sect ion 18, NE 1893 97 5 630 45 r o c k f a r m
Sect ion 18, SE 80 5 600 36 r o c k f a r m
Sec t ion 19, SW 30 1 l / 4 600 10 g r a v e l f a r m
Sect ion 19, SE 30 1 l / 4 600 10 g r a v e l f a r m
Sect ion 20 , NW 34 1 l / 4 620 26 g r a v e l f a r m
Sect ion 2 1 , NE 150 5 640 85 r o c k f a r m
* D i a m e t e r r educed f r o m 36 to 5 i nches

TABLE II CONTINUED WHITESIDE COUNTY W E L L S
Depth Well Well Ground to f inished C a p a - P u m p a g e
Dr i l l ed Depth D iam. E l e v . Wa te r in g r a v e l c i ty L a b o r a t o r y Ana lys i s 1000s Loca t ion Year ft. in . MSL. ft. or r o c k gpm. Use No. Key No. gpd.
T 20N R 3E (Cont 'd)
Sec t ion 2 1 , NE 120 5 640 77 r o c k f a r m
Sect ion 22 , NE 120 6 620 80 r o c k f a r m
Sect ion 22, SW 100 6 610 80 r o c k f a r m
Sect ion 23 , SE 1903 83 5 610 50 r o c k f a r m
Sect ion 24, SE 1906 111 5 600 50 r o c k f a r m
Sec t ion 2 5 , SE 20 1 l / 4 600 10 g r a v e l f a r m
Sect ion 26, SW 23 1 l / 4 590 12 g r a v e l f a r m
Sect ion 27, NE 20 1 l / 4 595 7 g r a v e l f a r m
Sect ion 28 , NE 30 1 l / 4 600 20 g r a v e l f a r m
Sect ion 29 , NW 22 1 l / 4 600 10 g r a v e l f a r m
Sect ion 30, NE 30 1 l / 4 600 15 g r a v e l f a r m
Sect ion 30, NE 30 1 l / 4 600 15 g r a v e l f a r m
Sect ion 3 1 , NE 30 1 l / 2 590 10 g r a v e l f a r m
Sect ion 32, NW 25 1 l / 4 580 15 g r a v e l f a r m
Sec t ion 33 , NE 16 1 l / 4 590 6 g r a v e l f a r m
Sect ion 34, NE 16 1 l / 4 590 8 g r a v e l f a r m
Sect ion 35, NE 30 1 l / 4 590 10 g r a v e l f a r m
Sect ion 36, SW 30 1 l / 4 595 10 g r a v e l f a r m

TABLE II CONTINUED WHITESIDE COUNTY W E L L S
Depth Well Well Ground to f inished Capa - P u m p a g e
Dr i l l ed Depth D iam. E l ev . Wate r in g r a v e l c i ty L a b o r a t o r y A n a l y s i s 1000s Loca t ion Year ft. in. MSL. ft. or r o c k gpm. Use No. Key No. gpd.
T 20N R 4E
Sect ion 3, SW l / 4 48 600 9 r o c k
Sect ion 10, SW 90 6 620 r o c k f a r m 74807 18
T 20N R 5E
Sect ion 16, SW l / 4 1940 70 6 r o c k f a r m
Sect ion 16, SE 1940 60 6 610 r o c k house 88758 54
T 20N R 7E
Sect ion 2, NE l / 4 NE l / 4 1954 77 10 645 9 g r a v e l 960 indus .
T 21N R 2E
Section 24, SW l/4 1930 87 5 630 rock garage 80617 13
Section 24, SW 1933 91 5 630 59 rock house
Section 24, SW 1919 136 5 630 50 rock house Section 25, NE 100 5 660 60 rock house 80300 12
Section 36, SE 1907 100 72-5* 600 20 rock farm
T 21N R 3E
Sect ion 2, SW l / 4 50 680 25 r o c k 2 f a r m
Sec t ion 3, SW 1901 82 600 42 r o c k 2 f a r m
Sect ion 4, SW 16 1 l / 4 580 10 g r a v e l 2 f a r m
Sect ion 9, SW 16 1 l / 4 580 10 g r a v e l 2 f a r m
Sect ion 9, SW 25 1 l / 4 580 15 g r a v e l 2 f a r m
* D i a m e t e r r educed f r o m 72 to 5 inches

TABLE II CONTINUED WHITESIDE COUNTY WELLS
Depth Well Well Ground to f inished C a p a - P u m p a g e
Dr i l l ed Depth D i a m . E l e v . Wate r in g r a v e l c i ty L a b o r a t o r y A n a l y s i s 1000s Loca t ion Year ft. in . MSL. ft. or r o c k gpm. Use No. Key No. gpd.
T 21N R 3E (Cont 'd)
Sec t ion 10, NW 1919 145 6 620 72 r o c k 2 f a r m
Sec t ion 10, SE 1927 86 5 680 40 r o c k 2 f a r m
Sect ion 11, SW 1901 97 5 680 40 r o c k 2 f a r m
Sec t ion 13, NW 1916 62 6 710 30 r o c k 2 f a r m
Sect ion 14, NE 1926 56 5 710 14 r o c k 2 f a r m
Sect ion 14, SE 56 720 15 r o c k 2 f a r m
Sect ion 16, SW 18 1 1/4 610 10 g r a v e l 2 f a r m
Sect ion 16, SW 90 5 665 40 r o c k 2 f a r m
Sect ion 17. SW 16 1 1/4 580 10 g r a v e l 2 f a r m
Sec t ion 19, NE 42 5 580 r o c k 2 f a r m 80846 57
Sec t ion 20, NW 70 6 580 35 r o c k 2 f a r m
Sec t ion 20, NW 15 1 1/4 580 10 g r a v e l 2 f a r m
Sect ion 2 3 , NW 1905 68 5 720 50 r o c k 2 c h u r c h
Sec t ion 24 , NE 720 30 g r a v e l 2 f a r m
Sect ion 24, SW 1896 128 48-.6* 720 63 r o c k 2 f a r m
Sec t ion 29, NE 1905 71 5 700 40 r o c k 2 f a r m
Sect ion 29, SW 1914 115 5 700 70 r o c k 2 f a r m
Sec t ion 29 , SE 1896 94 5 740 40 r o c k 2 f a r m
* D i a m e t e r r educed f r o m 48 to 6 i nches

TABLE II CONTINUED WHITESIDE COUNTY W E L L S
Depth Well Well Ground to f in ished C a p a - P u m p a g e
Dr i l l ed Depth D i a m . E l e v . W a t e r in g r a v e l c i ty L a b o r a t o r y Ana lys i s 1 000s Loca t ion Year ft. in . MSL. ft. or r o c k g p m . Use No. Key No. gpd.
T 2 1N R 3E (Co n t 'd )
Sec t ion 30, , SE 48 5 610 16 r o c k 2 f a r m
Sect ion 32, , SW 1927 43 5 680 flow r o c k 2 f a r m
Sect ion 33, sw 1901 62 5 680 flow r o c k 2 f a r m
Sect ion 34, NE 50 4 1/2 720 50
Sec t ion 34, , NW 1900 63 5 740 35 r o c k 2 f a r m
T 21N R 4E
Sect ion 3, SE 1/4 1940 82 6 680 r o c k f a r m
Sect ion 12, SE 1942 117 6 660 r o c k f a r m
Sec t ion 17, NW 1942 104 6 620 r o c k f a r m
Sect ion 18, , NE 60 6 600 20 r o c k f a r m
Sect ion 28, , NE 50 670 17 r o c k f a r m
Sec t ion 32, NE 20 610 g r a v e l f a r m
Sect ion 34, NW 1951 188 6 630 100 r o c k f a r m
T 21N R 5E
Sect ion 2, NW 1 / 4 1890 100 5 720 50 r o c k f a r m
Sect ion 3, NW 48 4 700 18 f a r m
Sect ion 3, NW 670 flow f a r m
Sec t ion 5, SE 1915 137 5 700 r o c k f a r m 80551 46

TABLE II CONTINUED WHITESIDE COUNTY WELLS
Depth Well Wel l s Ground to f inished C a p a - P u m p a g e
Dr i l l ed Depth D i a m . E l e v . W a t e r in g r a v e l c i ty L a b o r a t o r y A n a l y s i s 1000s Loca t ion Y e a r ft. in . MSL. ft. or r o c k gpm. Use No. Key No. gpd.
T 21N R 5E (Cont 'd)
Sec t ion 6, SW 1918 92 5 700 80 r o c k f a r m
Sec t ion 7, NE 1915 65 4 680 32 r o c k f a r m
Sect ion 7, SE 1921 52 4 660 30 f a r m
Sect ion 8, NW 1890 120 6 700 70 f a r m
Sect ion 8, SW 101 700 66 f a r m
Sect ion 9, NW 1903 202 5 710 50 r o c k f a r m 80552 32
Sec t ion 9, SE 1907 140 5 680 70 r o c k f a r m
Sect ion 10, NW 1913 100 5 715 60 r o c k f a r m
Sect ion 11 , NE 60 700 20 r o c k
Sect ion 11 , NW 1908 90 5 700 50 r o c k f a r m
Sect ion 13, SW 1898 70 4 710 20 r o c k f a r m
Sect ion 13, SE 1884 85 6 720 40 r o c k f a r m
Sect ion 14, SW 1913 70 5 720 r o c k f a r m
Sect ion 14, SW 1893 80 4 710 35 r o c k f a r m
Sect ion 16, SW 30 6 640 17 10 house 132447 49
Sec t ion 16, SE 1888 155 4 650 15 g r a v e l f a r m
Sect ion 16, SE 105 6 660 11 g r a v e l f a r m
Sect ion 17, NW 1908 108 5 700 48 rock f a r m
Sec t ion 17, SW 1922 80 5 680 50 r o c k f a r m

TABLE II CONTINUED WHITESIDE COUNTY W E L L S
Depth Well Well Ground to f in ished C a p a - Pumpage
Dr i l l ed Depth Diam. E l e v . W a t e r in g r a v e l c i ty L a b o r a t o r y A n a l y s i s 1000s Loca t ion Year ft. i n . M S L . ft. o r rock gpm. U s e N o . Key No. gpd.
T 21N R 5E (Cont 'd)
MORRISON (Eas t ) 1897 1643 10 670 14 r o c k 350 publ ic
MORRISON (West) 1912 2048 12 670 50 r o c k 400 publ ic 112154 4 319
MORRISON No. 3 1950 1625 16 670 77 r o c k 1000 publ ic
C a r n a t i o n Co. No. 1 1907 1006 10 700 r o c k indus
C a r n a t i o n Co. No. 2 1947 1101 28 700 50 r o c k 600 indus 50
Sec t ion 20 , NE 150 640 r o c k f a r m
Sect ion 20, SE 14 72 645 5 g r a v e l f a r m
Sect ion 2 1 , NE 1914 76 5 665 20 r o c k f a r m
Sect ion 22, NE 1880 25 690 20 g r a v e l f a r m
Sect ion 22, SW 1906 70 5 680 40 r o c k f a r m
Sect ion 22, SE 48 680 22 f a r m
Sect ion 23 , SE 1917 96 5 700 20 r o c k poor f a r m 3
Sec t ion 24, NE 87 5 700 22 r o c k f a r m
Sect ion 24, SW 1890 105 5 700 25 r o c k f a r m
Sect ion 24, SE 110 710 30 r o c k f a r m
Sect ion 25 , NE 27 l l / 2 700 10 g r a v e l f a r m
Sect ion 25 , NE 60 5 700 24 r o c k f a r m
Sec t ion 26, NE 1928 40 5 660 20 r o c k f a r m
Sect ion 26, NW 1903 40 5 670 30 r o c k f a r m

TABLE II CONTINUED WHITESIDE COUNTY WELLS
Depth Well Well Ground to f inished C a p a - P u m p a g e
Dr i l l ed Depth D iam. E l ev . W a t e r in g r a v e l c i ty L a b o r a t o r y A n a l y s i s 1000s Loca t ion Year ft. in. M S L . ft. or r o c k gpm Use No. Key No. and.
T 21N R 5E (Cont 'd)
Sect ion 26, SW 1890 60 4 670 30 rock f a r m
Sect ion 26, SE 1888 60 4 660 30 r o c k f a r m
Sect ion 27, NW 1908 70 5 680 60 r o c k f a r m
Sect ion 27, SW 35 675 20 g r a v e l f a r m
Sect ion 30, SE 1913 118 5 625 r o c k f a r m 80553 27
Sec t ion 32, NW 1888 40 5 640 20 r o c k f a r m
Sect ion 33, NE 12 670 10 g r a v e l f a r m
Sect ion 33, SW 1890 75 4 660 20 rock f a r m
Sect ion 34, SW 1888 95 4 660 50 rock f a r m
Sect ion 34, SE 1892 60 4 660 30 r o c k f a r m 80554 51
Sec t ion 35, NE 1888 75 5 660 30 r o c k f a r m
Sect ion 35, NE 1912 70 5 660 30 r o c k f a r m
Sect ion 35, NW 1918 90 5 660 30 r o c k f a r m
Sect ion 35, SW 1913 80 5 660 30 rock f a r m
Sect ion 35, SE 80 5 640 30 rock f a r m
T 21N R 6E
Sect ion 13, SW l / 4 1941 60 6 660 r o c k f a r m
T 21N R 7E
Sect ion 14, SW 1/4 78 6 685 27 r o c k p r i v a t e

TABLE II CONTINUED WHITESIDE COUNTY WELLS
Depth Well Well Ground to f inished Capa - P u m p a g e
Dr i l l ed Depth Diam. E l e v . Wa te r in g r a v e l c i ty L a b o r a t o r y A n a l y s i s 1000s Loca t ion Year ft. i n . M S L . ft. o r r o c k gprn. Use No. Key No. gpd.
T 21N R 7E (Cont 'd)
Po l i ce Radio No. 1 90 86367 52
P o l i c e Radio No. 2 1952 476 10 TOO 94 r o c k 11 128175 36 2
Sect ion 16, SE 120 680 r o c k p r i v a t e 88749 44
STERLING No. 1 1886 1434 20 642 48 r o c k 470 publ ic 118203 8 425
STERLING No. 2 1897 1725 20 642 46 r o c k 380 publ ic 118293 7 425
STERLING No. 3 1901 1830 8 642 45 r o c k 400 publ ic 118204 9 425
STERLING No. 4 1909 1630 20 645 64 r o c k 500 publ ic 118205 5 425
A & S D a i r y 1930 160 8 660 30 r o c k 140 indus 60
B o r d e n 1920* 1409 6 640 29 r o c k 140 indus 113670 6 140
B o r d e n 20 360 640 11 g r a v e l
Coca Cola 1937 210 6 665 28 r o c k indus 3
De A n n e ' s 110 665 r o c k indus 4
G r e b n e r ' s Shoe S to re 1939 97 665 14 r o c k indus 3
Hey B r o s . 1917 132 8 670 indus
Hey B r o s . 1937 400 8 670 r o c k indus 15
I11. Nor th Ut i l . 125 8 r o c k indus 88753 31
I11. Nor th . Ut i l . 1939 1580 18-10** 631 r o c k 500 indus 88742 10
* Dr i l l ed in 1907 to 1000 ft. , Deepened to 1409 ft. in 1920
* * D i a m e t e r r educed f rom 18 to 10 inches

TABLE II CONTINUED WHITESIDE COUNTY WELLS
Depth Well Well Ground to f inished Capa - P u m p a g e
Dr i l l ed Depth D i a m . E l e v . Wa te r in g r a v e l c i ty L a b o r a t o r y A n a l y s i s 1000s Loca t ion Year ft. ft. MjSL. ft. or r o c k gpm. Use No. Key No. g p d .
T 21N R 7E (Cont 'd
L a w r e n c e B r o s . 1953* 1646 8 640 55 r o c k 260 indus 5
Nat ional Mfg. 1930 850 10 640 16 r o c k indus 2
Senne f f -Her r 1941 650 8 670 40 r o c k 60 indus 113669 17 3
Stutzke H a r d w a r e 110 660 14 r o c k indus 1
W a h l - C l i p p e r C o r p . 420 8 670 58 r o c k 60 indus 7
Sect ion 22, NW 63 p r i v a t e 88762 35
S in i s s ipp i P a r k 1950 260 8 670 48 r o c k 50 s e m i - p u b l i c
N o r t h w e s t St. & Wi re 1952 1636 12 625 50 r o c k 600 indus 250
N o r t h w e s t S t . & W i r e #3 1940 760 12 1/2 18 r o c k 465 indus 88741 11
P e o p l e s Ice & Coal Co. 1940 174 8 625 r o c k 30 indus 18
Sec t ion 23 , NE 1934 600 8 680 p r i v a t e 112152 19
ROCK F A L L S
R i v e r s i d e N u r s e r y 1953 25 6 and 2 645 16 g r ave l 200 indus
Sec t ion 27, NE 1940 32 4 640 8 r o c k 10 p r i v a t e 88760 29
Sect ion 27 , NW 1940 50 4 640 22 r o c k 10 p r i v a t e 88763 48
F t . D e a r b o r n Mfg. Co. 1919 155 6 630 r o c k indus
G e y e r Mfg. Co. 80 8 640 indus 10
L a w r e n c e P a r k 1927 35 240 640 5 g r a v e l 300 s e m i - p u b l i c 3
*Dr i l l ed in 1947 to 762 ft. , Deepened to 1646 ft. in 1953

TABLE II CONTINUED WHITESIDE COUNTY WELLS
Depth Well Well Ground to f inished Capa - P u m p a g e
Dr i l l ed Depth D iam. E l e v . Wa te r in g r a v e l c i ty L a b o r a t o r y Ana lys i s 1000s Loca t ion Year ft. in. MSL. ft. or r o c k gpm. Use No. Key No. gpd.
T 21N R 7E (Cont 'd)
L a w r e n c e P a r k 175 6 640 14 r o c k s e m i - p u b l i c
P a r i s h - A l f o r d 1940 815 8 630 105 r o c k 250 indus 200
R u s s e l l , B u r d s a l l & Ward 1921 363 8 630 10 r o c k indus
S te r l ing Soy B e a n Mil l 1947 108 6 640 26 3 indus 3
Sec t ion 33, SE 1951 20 240 637 7 g r a v e l 2500 p r i v a t e 131173 43
Sect ion 33, SE 18 g r a v e l p r i v a t e 131174 25
Sec t ion 33, SE 22 g r a v e l p r i v a t e 131175 40
Sect ion 33, SE 23 g r a v e l p r i v a t e 131176 22
Sect ion 33, SE 21 g r a v e l p r i v a t e 131177 28
Sec t ion 33, SE 20 g r a v e l p r i v a t e 131178 24
Sect ion 33, SE 57 g r a v e l p r i v a t e 133093 30
Sec t ion 33, SW 198 r o c k p r i v a t e 133095 37
T 22N R 3E
Sect ion 12, SW l / 4 18 1 l / 4 600 4 g r a v e l f a r m
Sec t ion 14, NW 30 1 l / 4 590 8 g r a v e l f a r m
Sect ion 14, SE 18 1 l / 4 590 7 g r a v e l f a r m
Sec t ion 15, SE 25 1 l / 4 580 7 g r a v e l f a r m
Sect ion 22, NW 15 1 l / 4 580 8 g r a v e l f a r m
Sect ion 22, NW 15 1 l / 4 580 5 g r a v e l f a r m

TABLE II CONTINUED WHITESIDE COUNTY WELLS
Depth Well Well Ground to f inished C a p a - P u m p a g e
D r i l l e d Depth D i a m . E l e v . W a t e r i n g r a v e l c i ty L a b o r a t o r y A n a l y s i s 1000s Loca t ion Y e a r ft. in. MSL. ft. or r o c k gpm. Use No. Key No. gpd.
T 22N R 3E (Cont 'd)
Sec t ion 25 , SW 25 1 l / 4 590 4 g r a v e l f a r m
Sect ion 27, SE 25 1 l / 4 580 12 g r a v e l f a r m
F U L T O N No. 2 1908 1260 8 600 30 r o c k 200 publ ic 112156 3 112869 1 92
F U L T O N No. 3 1931 1943 16 600 45 r o c k 500 publ ic 112870 2
A m e r . A g r i . Chem. Co. 1947 44 12 580 8 g r a v e l 250 indus 112866 47 300
A m e r . A g r i . Chem. Co. 44 2 580 8 g r a v e l 10 indus
A m e r . A g r i . Chem. Co. 44 2 580 8 g r a v e l 10 indus
Sect ion 34, NE 30 1 l / 2 590 12 g r a v e l f a r m
Sect ion 34, NW 18 1 l / 4 590 6 g r a v e l f a r m
Sect ion 35, NE 30 1 l / 4 595 12 g r a v e l f a r m
Sect ion 35, NW 30 1 l / 4 595 12 g r a v e l f a r m
Sect ion 36, NW 50 6 600 30 r o c k f a r m
T 22N R 4E
Sect ion 2, SW l / 4 40 48 720 37 g r a v e l f a r m
Sect ion 2, SE 150 800 50 r o c k f a r m
Sect ion 11, SW 1939 46 6 680 r o c k f a r m 88748 39
Sect ion 12, NE 90 740 60 r o c k f a r m
Sect ion 12, NW 60 740 25 r o c k 2 f a r m

TABLE II CONTINUED WHITESIDE COUNTY WELLS
Depth Well Well Ground to f in ished C a p a - P u m p a g e
Dr i l l ed Depth Diam. E l e v . W a t e r in g r a v e l c i ty L a b o r a t o r y A n a l y s i s 1000s Loca t ion Year ft. in. M S L . ft. or r o c k gpm. Use No. Key No. gpd.
T 22N R 4E (Cont 'd)
Sec t ion 15, SE 1900 125 4 720 90 r o c k 2 f a r m
Sec t ion 24, NE 1888 122 4 800 100 r o c k 2 f a r m
Sect ion 27; NE 1890 90 4 750 70 r o c k 2 f a r m
Sect ion 34, SW 1890 55 5 700 30 r o c k 2 f a r m
Sect ion 36, NE 1897 65 4 740 60 r o c k 2 f a r m
T 22N R 5E
Sect ion 2, SW l / 4 1895 135 5 740 f a r m 80918 55
Sect ion 5, NE 240 760 25 f a r m
Sect ion 5, NW 1926 103 6 720 30 r o c k f a r m 80917 58
Sect ion 5, SE 1864 72 4 720 30 f a r m
Sec t ion 6, NE 65 6 730 55 f a r m
Sect ion 7, NW 80 6 740 50 f a r m
Sect ion 7, SE 1860 59 60 720 50 f a r m
Sect ion 8, NE 84 6 720 60 f a r m
Sect ion 9, SW 1941 90 6 720 40 r o c k f a r m
Sect ion 10, SE 80 720 50 f a r m
Sect ion 11, SE 136 6 780 100 r o c k f a r m
Sect ion 12, NW 1919 110 6 720 60 r o c k 2 f a r m
Sec t ion 14, SW 1919 203 6 720 103 r o c k 2 f a r m

TABLE II CONTINUED WHITESIDE COUNTY WELLS
Depth Well Well Ground to finished Capa- Pumpage
Drilled Depth Diam. Elev. Water in gravel city Laboratory Analysis 1000s Location Year ft. in. MSL. ft. or rock gpm. Use No. Key No. gpd.
T 22N R 5E (Cont'd)
Section 16, NE 128 720 54 rock farm
Section 20, SE 1898 60 4 740 30 rock farm
Section 23, SW 1890 90 4 700 rock farm 80944 33
Section 24, SE 1884 120 6 750 60 rock farm
Section 25, NW 100 5 720 70 farm
Section 26, SE 45 660 25 rock farm
Section 32, NE 1913 95 5 700 63 rock farm
T 22N R 6E
Section 3, NE l / 4 1941 280 6 860 120 rock farm
Section 25, SW 1948 470 6 746 rock farm 2
T 22N R 7E
Section 12, SW l / 4 1940 176 6 730 rock farm 88757 15
Section 16, NE 1940 130 6 815 rock farm 88764 14
Section 23, NW 1940 100 6 780 rock farm 88755 38
Section 33, SW 1940 125 7 780 farm 88756 50
Section 35, SW 1948 392 6 690 rock 2

TABLE III
LEE COUNTY WELL WATERS - CHEMICAL ANALYSES
ppm ppm ppm ppm ppm ppm ppm ppm ppm ppm ppm ppm ppm ppm ppm
1 124893 1780 520* 0.4 0 62. 1 33. 3 0. 1 8. 1 14. 0 0. 5, 6 0.2 17.5 284 293 310
2 128882 1922 520* 0.5 0 62.9 34.6 0. 1 8.5 10.2 0.6 7 0.3 20.2 288 300 314 57. 0
3 113127 1865 546* 0.6 Tr. 66.9 34.0 0. 1 4. 1 14.4 0. 3 2 Tr. 13.2 300 307 308 57. 4
4 111085 1120 80* 1.7 0. 1 3 18.9 352 369 382 7.3 45 53
5 112906 1100 1.9 0 91.4 39.6 0.5 6.9 20.9 0. 1 9 Tr. 41. 1 352 392 421 55
6 117326 326 1.8 2 276 155 290
7 112126 335 335 0.4 0 29.5 18. 1 0.4 38.9 15.0 0.6 2 0.8 2. 5 228 149 240 7.8 10 52
8 113131 1018 545 0.2 0 40. 3 23.2 0.6 19.6 15.0 0.4 1 0. 1 2. 3 236 196 238 54. 2
9 113200 315 1.2 0 46.5 20.6 0.4 30.8 19.9 0.5 1 0.2 0 268 202 284 52
10 80603 70 14 0.2 0 11. 0 5.7 0.01 4. 1 14.0 0 2.6 - 58 51 78
11 80602 72 16 2.5 0 15. 0 2.29 0.06 6.0 6.0 10 3.6 29.8 12 47 91
12 112899 32 32 2.5 0. 1 120.2 55.8 0.3 16.1 19.6 0.1 36 0. 1 218.0 288 530 682 53
13 80725 104 13 0.5 0 104. 0 50.3 11.0 13.0 18 71.0 17.5 364 467 480
14 75304 110 12 0.0 0 93.4 47.3 33.6 10. 0 29 32.7 103.2 326 428 550
15 130762 30 0.1 30 328 508 566
* Cemented

TABLE III CONTINUED LEE COUNTY W E L L WATERS - CHEMICAL ANALYSES
ppm ppm ppm ppm ppm ppm ppm ppm ppm ppm ppm ppm ppm ppm ppm
16 81205 217 0.4 0 101.0 51.8 15.9 10. 0 28 22. 1 150.6 286 466 616
17 112905 298 60 1.2 0. 1 103.8 44.6 Tr. 9.4 19. 0 0. 1 19 1.4 91.1 340 443 493
18 80746 94 94 0. 1 0.2 97.4 39. 3 12.2 15.0 13 21.2 61.3 332 405 460
19 113129 545 180 Tr. 0 88.9 47.7 Tr. 3.0 19.0 0. 1 18 42.9 78. 0 284 419 470 52. 2
20 132448 470 100 2. 1 0. 6 1 1.1 288 228 2 94 53
21 93150 425 84 1.8 0 69.6 16.9 0.5 30.6 16. 0 1 1.5 0.8 308 244 326 7.2 36 51. 5
22 112900 135 0.8 0 65.3 25.3 0.2 5.3 24.6 0. 2 2 0. 1 7.6 268 267 292
23 113672 660 495 5.5 Tr. 55.4 32.5 14.0 14.8 0. 3 2 0.2 3.7 296 273 295 52
24 112898 752 443 2.5 0 62.6 28.8 1. 1 6.0 18.8 0. 2 1 0. 1 1.6 288 275 306 53. 6
25 93446 479 113 1.6 0 68. 0 27. 3 0.5 10.6 14.5 2 0.4 7.0 296 282 315 7.1 44 52
26 93173 371 236 3.0 Tr. 73.3 24.6 0.4 22. 3 17.0 1 1.8 2.5 328 284 338 7.1 48 52
27 93075 430 161 2.5 Tr. 2 292 287 306
28 36191 532 0.6 66.6 32. 3 2.8 21.4 6.6 6 1.2 0.5 336 298 348
29 80698 18 1.0 0 70.0 31.3 0.01 5.3 10. 0 1 2.6 28. 1 266 304 311
30 80596 165 165 0.9 0 69.0 38.0 0.03 6.2 9.0 12 32. 0 28.2 270 328 373
31 81436 202 150 2.8 0 74.2 34. 9 4.4 10. 0 2 6.2 8. 0 322 329 346
32 80747 255 45 0.2 0 77.0 37. 1 2.5 9.0 1 2.7 4.7 342 345 343 33 80595 355 12 0 0 74.8 39.0 0.06 7.6 13. 0 6 13.3 29.4 314 347 383

T A B L E III CONTINUED L E E COUNTY W E L L WATERS - CHEMICAL ANALYSES
ppm ppm ppm ppm ppm ppm ppm ppm ppm ppm ppm ppm ppm ppm ppm
34 112904 277 19 1.8 0 87.3 31.9 0.5 0 22.6 0. 1 2 0.2 3.7 344 350 346
35 80680 220 25 0. 1 0 84.0 34.7 0.01 9.4 8.0 2 2.6 2. 3 366 353 369
36 74990 175 175 0 374 360
37 80724 185 14 0.3 0 77.8 41.8 6.4 12. 0 7 39. 0 37. 1 310 366 388
38 85933 160 0.8 89. 1 0 354 56

TABLE IV
WHITESIDE COUNTY WELL WATERS - CHEMICAL ANALYSES
ppm ppm ppm ppm ppm ppm ppm ppm ppm ppm ppm ppm ppm ppm
1 112869 1500 0. 1 5 268 271 311 58
2 112870 1943 0.7 8 264 278 315 58
3 112156 1260 337 0. 0 0. 0 59.6 31. 0 Tr. 1.6 12.3 0.4 5 2.2 22.0 248 277 308 58
4 112154 2 048 1132 0.0 0.0 64.6 32.7 Tr. 1.6 13.5 0. 1 8 0.8 35.2 264 296 292 65
5 118205 1630 198 0.5 0.0 58.3 33.7 Tr. 11. 5 12.4 0.3 23 0.2 19.5 256 284 340
6 113670 1380 900 0. 3 0.3 5 21.2 288 310 325 60. 5
7 118293 1725 127 0.5 0.0 67.9 33.9 Tr. 9.9 12.7 0. 1 42 0.2 23. 0 248 310 357
8 118203 1434 103 0.3 0.0 66.3 37.6 Tr. 1.4 12.5 0.2 13 0.6 27.6 276 320 333
9 118204 1830 132 0.1 0.0 69.5 36.9 Tr. 3.7 13. 1 0.3 21 0.6 26.7 276 326 353
10 88742 1580 351 0. 1 0.0 62.6 35. 1 0.3 7.4 11.8 5 0.9 14.8 2 94 328 300
11 88741 760 347 0.5 0.0 55.9 20.2 0.9 53.6 11.5 27 1.3 8.4 294 223 366 58. 0
12 80300 100 Tr. 0. 0 90.9 41.7 - 1.8 10 15 53.2 27.8 310 399 410
13 80617 87 5.5 Tr. 0. 0 113.4 54.6 0.01 50. 9 14.0 48 75. 0 119. 3 366 507 705
14 88764 130 37 0.6 71 364 533 759
15 88757 176 35 0.5 25 500 540 644
16 80733 65 0.3 0 134 59.7 0. 1 102.3 12.0 98 212 137 352 581 1082 17 113669 650 260 0. 1 0. 1 34 199.7 388 583 732 55. 5

T A B L E IV CONTINUED WHITESIDE COUNTY W E L L WATERS - CHEMICAL ANALYSES
ft ft ppm ppm ppm ppm ppm ppm ppm ppm ppm ppm ppm ppm ppm ppm °F
18 74807 90 55 99 58 428 600 814
19 112152 600 0.4 9 74. 3 264 121 381
20 80847 45 0 0. 1 0 31.6 12.3 Tr. 5. 1 4.0 6 12.4 23. 0 98 129 166
21 133002 171 162 0.1 0.9 52.9 17.8 Tr. 7. 21.4 0.3 10 18.4 20. 1 172 206 245 54
22 131176 23 23 Tr. 0. 1 10 17.6 136 212 253
23 112153 567 175 0.3 1.6 54.6 18.2 Tr. 0 25. 1 0.2 10 20. 1 24.3 156 212 245
24 131178 20 20 Tr. 0. 1 6 5. 1 172 226 2 54
25 131174 18 18 Tr. 0.1 12 15.9 152 236 261
26 112513 30 30 0.3 0.2 64.0 21.7 Tr. 14.7 16.4 0.2 4 6.5 83.5 184 250 334 53.5
27 80553 118 118 Tr. 0. 1 66.2 20.7 0.03 20.0 8.0 1 2.0 3.3 288 251 279
28 131177 21 21 1.7 0.1 5 1.4 216 260 278
29 88760 32 14 0.4 7 196 261 297
30 133093 57 2.2 0.2 6 0.6 228 264 289
31 88753 125 2.0 10 2 56 265 324
32 80552 202 202 Tr. Tr. 59.9 31.0 0.02 13. 1 7.0 1 8.0 0 298 277 301
33 80944 90 70 0.5 25 500 540 644
34 112155 235 0.3 0.3 70.9 25.9 Tr. 0.7 28.3 0.1 1 1.5 3. 1 280 284 306 52
35 88762 63 1.3 8 274 288 328

TABLE IV CONTINUED WHITESIDE COUNTY W E L L WATERS - CHEMICAL ANALYSES
ppm ppm ppm ppm ppm ppm ppm ppm ppm ppm ppm ppm ppm ppm
36 128175 476 301 1.6 8 2 96 294 335 55.2
37 133095 198 6.3 0.2 5 0.5 276 296 315
38 88755 100 100 7.5 3 306 299 334
39 88748 46 46 5.2 69.3 30.7 2 6.8 310 300 319
40 131175 22 22 0. 1 0. 1 14 11.3 224 304 334
41 132446 14 14 0.6 5 0.7 228 316 332 57
42 112157 193 148 0.4 0.7 77.1 30.4 Tr. 0.7 29.0 0.4 1 3. 3 2.9 312 318 344 53
43 131173 20 20 Tr. 0.1 11 15.7 240 320 352
44 88749 120 2.9 4 350 323 390
45 132445 18 18 0.4 32 Tr. 164 324 373 53
46 80551 137 90 0 0 81.5 32.3 0.0 5.8 8.0 1 2.3 1.6 394 336 336
47 112866 43 0. 1 5 164 336 397 53.8
48 88763 50 18.5 0.2 11 238 348 377
49 132447 30 23 0. 1 1 2.8 392 352 401 53
50 88756 125 38 0.0 1 370 359 408
51 80554 60 40 2.7 0. 1 92.2 31.4 0. 01 22. 1 9.0 25 2.0 49. 0 320 360 432
52 86367 90 0 0 82.8 37.8 Tr. 6.7 18.0 13 2.9 39.6 314 362 403
53 80732 15 0 0.4 1.6 95.2 30.9 0. 05 25.7 10.0 37 5. 1 79.8 282 365 453

TABLE IV CONTINUED WHITESIDE COUNTY WELL WATERS - CHEMICAL ANALYSES
ppm ppm ppm ppm ppm ppm ppm ppm ppm ppm ppm ppm ppm ppm
54 88758 60 25 19 308 374 448
55 80918 135 100 3.4 0.2 93.0 32.4 2.4 8.3 12.0 5 1.3 1.0 406 390 403
56 80616 103 20 22 10. 0 318 406
57 80846 42 7.5 2 25.0 302 358
58 80917 103 32 3 12. 0 276 304

STATE WATER SURVEY DIVISION Urbana
REPORTS OF INVESTIGATION
No. 1. Temperature and Turbidity of Some River Waters in Illinois. By Max Suter (1948). No. 2. Groundwater Resources in Winnebago County, with Specific Reference to Conditions at Rockford.
By H. F. Smith and T. E. Larson (1948). No. 3. Radar and Rainfall. By G. E. Stout and F. A. Huff (1949). Out of print No. 4. The Silt Problem of Spring Lake, Macomb, Illinois. By J. B. Stall, L. C. Gottschalk, A. A. Klingebiel,
E. L. Sauer, and E. E. DeTurk (1949). Out of print. No. 5. Infiltration of Soils in the Peoria Area. By G. A. Stauffer (1949). No. 6. Groundwater Resources in Champaign County. By H. F. Smith (1950). No. 7. The Silting of Ridge Lake, Fox Ridge State Park, Charleston, Illinois. By. J. B. Stall, L. C. Gott
schalk, A. A. Klingebiel, E. L. Sauer and S. W. Melsted (1951). Out of print. No. 8. The Silting of Lake Chautauqua, Havana, Illinois. By J. B. Stall and S. W. Melsted (1951). No. 9. The Silting of Carbondale Reservoir, Carbondale, Illinois. By B. O. Larson, A. A. Klingebiel, E.
L. Sauer, S. W. Melsted, and R. C. Hay (1951). Out of print. No. 10. The Silting of Lake Bracken, Galesburg, Illinois. By B. O. Larson, A. A. Klingebiel, E, L. Sauer,
and S. W. Melsted (1951). No. 11. Irrigation in Illinois. By W. J. Roberts (1951). No. 12. The Silting of West Frankfort Reservoir, West Frankfort, Illinois. By J. B. Stall, A. A. Klingebiel,
S. W. Melsted, and E. L. Sauer (1951). No. 13. Studies of Thunderstorm Rainfall with Dense Raingage Networks and Radar (1951). Out of print No. 14. The Storm of July 8, 1951 in North Central Illinois (1952). No. 15. The Silting of Lake Calhoun, Galva, Illinois. By J. B. Stall, A. A. Klingebiel, S. A. Melsted and E. L.
Sauer (1952). No. 16. The Silting of Lake Springfield, Springfield, Illinois. By J. B. Stall, L. C. Gottschalk, and H. M.
Smith (1952). No. 17. Preliminary Investigation of Groundwater Resources in the American Bottom. By Jack Bruin and
H. F.Smith (1953). No. 18. The Silting of Lake Carthage, Carthage, Illinois. By J. B. Stall, G. R. Hall, S. W. Melsted and E.
L. Sauer (1953). No. 19. Rainfall-Radar Studies of 1951. By G. E. Stout, J. C. Neill, and G. W. Farnsworth (1953). No. 20. Precipitation Measurement Study by John C. Kurtyka (1953). No. 21. Analysis of 1952 Radar and Raingage Data by J. C. Neill (1953). No. 22. Study of an Illinois Tornado Using Radar, Synoptic Weather and Field Survey Data by E. A. Huff,
H. W. Hiser and S. G. Bigler (1954). No. 23. Bubbler System Instrumentation for Water Level Measurement. No. 24. The Storm of July 18-19, 1952 Rockford, Illinois and Vicinity by Bernt O. Larson, Homer W.
Hiser, and Warren Daniels. No. 25. Selected Methods for Pumping Test Analysis.