Groundwater Potential Zone Identification using …. 5 Issue 5... · 2017-11-16 · water shortage...
9
IOSR Journal of Applied Geology and Geophysics (IOSR-JAGG) e-ISSN: 2321–0990, p-ISSN: 2321–0982.Volume 5, Issue 5 Ver. II (Sep. – Oct. 2017), PP 43-51 www.iosrjournals.org DOI: 10.9790/0837-0505024351 www.iosrjournals.org 43 | Page Groundwater Potential Zone Identification using Remote Sensing and GIS Techniques - A Case Study of Karwi Block Area, Uttar Pradesh, India Arnab Saha 1* , Ankur Rana 1 , Sewata Tomar 2 , Shashank Tripathy 3 , Arjun Singh 3 1 Department of Civil Engineering, Uttarakhand Technical University, Dehradun, India 2 Department of Geo-informatics and Remote Sensing, Amity University, Noida, India 3 Department of Groundwater Resources, Remote Sensing Application Centre, Lucknow, India * Corresponding Author: Arnab Saha Abstract: The study deals with identification of potential groundwater areas in parts of Karwi block area, Chitrakoot district, Uttar Pradesh. Based on the incorporated studies, it has been observed that the lithology, geomorphology, lineaments, slope and land use/land cover was generated from IRS P6 LISS III data and Survey of India, toposheet on 1:50,000 scale and incorporated data with raster based Geographical Information System (GIS) to identify the groundwater potential zones. The assessment of satellite images, topographic maps supported by ground truth survey revealed that the area has a network of interlinked subsurface features. For surface water resources and ground water resources, the appropriate assessment of water potential helps in additional exploration at voluntary level. To formulize the proper management programme, a reliable and up to date information about various factors, viz. size and shape of river basin, topography, slope, elevation and their characteristics, land use/land cover, and drainage parameters are required. The incorporated map generated was further classified according to spatial variation of the ground water potential. Seven categories of groundwater potential zones availability namely: Excellent (0.011%), Very Good to Good (0.027%), Good (10.773%), Good to Moderate (81.371%), Moderate to Poor (0.365%), Poor (6.949%) and River (0.501%) were delineated and identified. In this system used a subsistence plan for optimum development of the water resources and for finding solution for different management problem related to natural resources. The final result represents the favorable groundwater potential zones and this information could be used to reduce the water shortage and quality risks for public health. Keywords: DEM, GIS, Geomorphology, Remote Sensing --------------------------------------------------------------------------------------------------------------------------------------- Date of Submission: 04-11-2017 Date of acceptance: 16-11-2017 --------------------------------------------------------------------------------------------------------------------------------------- I. Introduction Ground water is a vital resource for both industrial and livelihood purpose, due to increasing demand of fresh water supply has bought awareness among us to save water resources which is a primary source. The value of using water was never undermined, but it’s about time that even its exchange value is given due importance. Fresh water, at present is a limited resource, and it is being flowed over the world (Khan et al., 2013). More than 2000 million people would stay alive under conditions of high shortage of water by the year 2050, according to the UNEP (United Nations Environment Programme), which urge water could bear out to be a limiting factor for development in various regions of the world. About one-fifth of the world total population lack access to safe drinking water and with the present way of utilization; two out of every three persons on the earth will live in water-scarcity conditions by 2025. One-third of the world total population at present live in countries with moderate to high water shortage—where water utilization is more than threshold of the renewable unsullied water supply, said by GEO (Global Environment Outlook) 2000, the UNEP’s millennium report. Pollution, scarcity of water resources, and global climate change will be the prime forthcoming challenge in the next century, said by the report (Janaki and Subramani, 2016). The continuously changing the global climate and environment makes it necessary to realize and compute various hydrological components for competent water resource management (Saha et al., 2017). The reality of water calamity cannot be ignored. India has been outrageous of being poor management of water resources. The requirement of clean water is already outstrip, the adequate supply. Majority of the population in hi-tech cities today depends on groundwater. Use of remote sensing and geographical information system for potential groundwater zones investigation is an conventional and effective procedure (Raghu and Swamy, 2009). Remote sensing in concurrence with the current studies like geo-hydrological and geo-physical analysis is developing increasingly as a dominant resource to target potential ground water zones (Jose et al., 2012). Geo-physical inspections
Transcript of Groundwater Potential Zone Identification using …. 5 Issue 5... · 2017-11-16 · water shortage...

IOSR Journal of Applied Geology and Geophysics (IOSR-JAGG)
e-ISSN: 2321–0990, p-ISSN: 2321–0982.Volume 5, Issue 5 Ver. II (Sep. – Oct. 2017), PP 43-51
www.iosrjournals.org
DOI: 10.9790/0837-0505024351 www.iosrjournals.org 43 | Page
Groundwater Potential Zone Identification using Remote Sensing
and GIS Techniques - A Case Study of Karwi Block Area,
Uttar Pradesh, India
Arnab Saha1*
, Ankur Rana1, Sewata Tomar
2, Shashank Tripathy
3, Arjun Singh
3
1Department of Civil Engineering, Uttarakhand Technical University, Dehradun, India 2Department of Geo-informatics and Remote Sensing, Amity University, Noida, India
3Department of Groundwater Resources, Remote Sensing Application Centre, Lucknow, India
*Corresponding Author: Arnab Saha
Abstract: The study deals with identification of potential groundwater areas in parts of Karwi block area,
Chitrakoot district, Uttar Pradesh. Based on the incorporated studies, it has been observed that the lithology,
geomorphology, lineaments, slope and land use/land cover was generated from IRS P6 LISS III data and Survey
of India, toposheet on 1:50,000 scale and incorporated data with raster based Geographical Information
System (GIS) to identify the groundwater potential zones. The assessment of satellite images, topographic maps
supported by ground truth survey revealed that the area has a network of interlinked subsurface features. For
surface water resources and ground water resources, the appropriate assessment of water potential helps in
additional exploration at voluntary level. To formulize the proper management programme, a reliable and up to
date information about various factors, viz. size and shape of river basin, topography, slope, elevation and their
characteristics, land use/land cover, and drainage parameters are required. The incorporated map generated
was further classified according to spatial variation of the ground water potential. Seven categories of
groundwater potential zones availability namely: Excellent (0.011%), Very Good to Good (0.027%), Good
(10.773%), Good to Moderate (81.371%), Moderate to Poor (0.365%), Poor (6.949%) and River (0.501%)
were delineated and identified. In this system used a subsistence plan for optimum development of the water
resources and for finding solution for different management problem related to natural resources. The final
result represents the favorable groundwater potential zones and this information could be used to reduce the
water shortage and quality risks for public health.
Keywords: DEM, GIS, Geomorphology, Remote Sensing
----------------------------------------------------------------------------------------------------------------------------- ----------
Date of Submission: 04-11-2017 Date of acceptance: 16-11-2017
----------------------------------------------------------------------------------------------------------------------------- ----------
I. Introduction Ground water is a vital resource for both industrial and livelihood purpose, due to increasing demand of
fresh water supply has bought awareness among us to save water resources which is a primary source. The value
of using water was never undermined, but it’s about time that even its exchange value is given due importance.
Fresh water, at present is a limited resource, and it is being flowed over the world (Khan et al., 2013). More than
2000 million people would stay alive under conditions of high shortage of water by the year 2050, according to
the UNEP (United Nations Environment Programme), which urge water could bear out to be a limiting factor
for development in various regions of the world. About one-fifth of the world total population lack access to
safe drinking water and with the present way of utilization; two out of every three persons on the earth will live
in water-scarcity conditions by 2025. One-third of the world total population at present live in countries with
moderate to high water shortage—where water utilization is more than threshold of the renewable unsullied
water supply, said by GEO (Global Environment Outlook) 2000, the UNEP’s millennium report. Pollution,
scarcity of water resources, and global climate change will be the prime forthcoming challenge in the next
century, said by the report (Janaki and Subramani, 2016). The continuously changing the global climate and
environment makes it necessary to realize and compute various hydrological components for competent water
resource management (Saha et al., 2017). The reality of water calamity cannot be ignored. India has been
outrageous of being poor management of water resources. The requirement of clean water is already outstrip,
the adequate supply. Majority of the population in hi-tech cities today depends on groundwater.
Use of remote sensing and geographical information system for potential groundwater zones
investigation is an conventional and effective procedure (Raghu and Swamy, 2009). Remote sensing in
concurrence with the current studies like geo-hydrological and geo-physical analysis is developing increasingly
as a dominant resource to target potential ground water zones (Jose et al., 2012). Geo-physical inspections

Groundwater Potential Zone Identification using Remote Sensing and GIS Techniques - A Case ..
DOI: 10.9790/0837-0505024351 www.iosrjournals.org 44 | Page
enable us in identification of groundwater aquifers and evaluation of their movements whereas, GIS enables
user specific management and incorporation of multi-thematic data (Janaki and Subramani, 2016). Proved that
remote sensing technique combined with Geographical Information System (GIS) procedure are very proficient
in identification of groundwater capability of any area (Murthy et al., 2003; Prakash Ravi and Singh, 2004). In
this study IRS IA, LISS II data has been used to identify and classify seven groundwater potential zones by
integrating diverse thematic maps. The study reveals that incorporation of thematic maps prepared from
conventional remote sensing techniques using GIS and rectified ground truth survey, established the base line
information for potential ground water zones (Manikandan et al., 2014). Integration of GIS and remote sensing
techniques have proved to be an proficient tools in groundwater studies (Krishnamurthy et al., 2007; Sander et
al., 1996; Adhikari and Kumar, 2006), satellite data serves as groundwork inventory method to understand the
ground water prospects / condition and GIS enabled assimilation and management of multi thematic layers.
Hence, the present study in endeavor to identify and understand the ground water prediction zone of Karwi
block, in a part of Uttar Pradesh, Chitrakoot district, North Central India by an incorporated approach of
advanced remotely sensed data, GIS, field survey, and lab technologies.
II. Study Area The present study focused to assess the probable ground water predicts zone of defined area as Karwi
Block part of Chitrakoot District, Uttar Pradesh, India. The study area lies between latitude 25°5’58.383‖ to
25°25’17.889‖‖ N and longitude 80°41’40.233’’ to 81°1’52.613’’E covering an area of 51879.52Ha. Chitrakoot
Dham (Karwi) is serving as a district headquarters and a municipal corporation in Chitrakoot district of Uttar
Pradesh, India. Since, Karwi block was a tehsil in Banda district. On May 6th, 1997 Government of Uttar
Pradesh carved out a new district Chitrakoot (Initially named as Chhatrapati Shahuji Mahraj- Nagar) from
Banda district. Since then the block is serving as district headquarter. The town named Karwee, in New
Zealand's Canterbury region was named after Karwi by a retired British Army colonel. As of 2001, India census,
Chitrakoot Dham (Karwi) had a population of 48,853. Males constitute 54% of the population and females 46%.
Chitrakoot Dham (Karwi) falls on National Highway 76 (NH-76) stretched from Pindar to Allahabad via
Udaipur, Chittaurgarh, Kota, Shivpuri, Jhansi, and Banda. Chitakoot Dham (Karwi) is a railway station on
Manikpur - Jhansi/Kanpur main railway track, served by the North-Central division of Indian Railways.
Figure 1: Study area map of Karwi Block, Chitrakoot, U.P.
III. Materials And Data Used For the present study, diverse datasets and software resources comprised of imagery details and
analysis tools have been used. The Shuttle Radar Topography Mission (SRTM) DEM of 90 m resolution was
used. The use of Digital Elevation Model (DEM) in specific has made watershed demarcation a comparatively a
smooth process (Saha and Singh, 2017). The LISS III satellite data is used for the year 2016. The Linear
Imaging Self Scanning Sensor (LISS-III) is a multi-spectral sensor operating in four spectral bands, in which
three bands are in visible and near infrared and one in SWIR region, as in the case of IRS-1C/1D.

Groundwater Potential Zone Identification using Remote Sensing and GIS Techniques - A Case ..
DOI: 10.9790/0837-0505024351 www.iosrjournals.org 45 | Page
Table 1: Data Used in the present work
Types of data/software Details of data/software Sources
SRTM DEM 90 m, Year 2004 http://srtm.csi.cgiar.org/
LISS III satellite imagery Dated 30/01/2016 and https://earthexplorer.usgs.gov/
02/03/2016
ArcGIS software ArcMap 10.3 http://desktop.arcgis.com/
IV. Methodology
Figure 2: Flowchart of Groundwater Potential Zone mapping
The methodology adopted for the present study is shown in above figure. The base map of Karwi block
was prepared based on topographic maps from Survey of India on a 1:50,000 scale. The drainage network for
the study area is processed in ArcGIS 10.3 platform. The slope maps were prepared from SRTM DEM data in
ArcGIS spatial analyst module (Manikandan et al., 2014). The rainfall map has been prepared using the data
obtained from the Indian Meteorological Department (IMD) gauge stations. These data were then spatially
interpolated using Inverse Distance Weighted (IDW) method to obtain the rainfall circulation map. This
interpolation method combines the concepts of intimacy to follow thiessen polygons with plodding change of
the trend surface (Magesh et al., 2012). The drainage density and lineament density maps were prepared using
the line density analysis tool in ArcGIS (Magesh et al., 2012) Satellite images from IRS-P6, LlSS-III sensor, on
a scale of 1:50,000 (geo-coded, with UTM projection, spheroid and datum WGS 84, Zone 44 North) have been
used for delineation of thematic layers such as land-use, lithology, lineament, and soil types. These thematic
layers were converted into a raster format (30 m resolution) before they were brought into GIS environment.
The groundwater potential zones were obtained by overlaying all the thematic maps in terms of weighted
overlay methods using the spatial analysis tool in ArcGIS 10.3 (Nagarajan and Singh, 2009). During weighted
overlay analysis, the ranking was given for each individual parameter of each thematic map, and weights were
assigned according to the multi-influencing factor (MIF) of that particular feature on the hydro-geological
environment of the study area.
Seven influencing factors, such as lithology, slope, land-use, lineament, drainage density, soil, and
rainfall have been acknowledged to delineate the groundwater potential zones. Interrelationship between these
factors with their effect is shown. Each relationship is weighted according to its potency. The representative
weights of a factor of the potential zone are the sum of all weights from each factor. A factor with a superior
weight value shows a larger impact and a factor with an inferior weight value shows a smaller impact on

Groundwater Potential Zone Identification using Remote Sensing and GIS Techniques - A Case ..
DOI: 10.9790/0837-0505024351 www.iosrjournals.org 46 | Page
groundwater potential zones. Assimilation of these factors with their potential weights are computed throughout
weighted overlay analysis in ArcGIS.
Geomorphological map can be well thought-out as graphical inventory of scenery depicting landforms,
surface as well as sub-surface materials. Sketches and maps of landscapes and landforms (e.g. Dykes, 2008)
have been elementary methods to analyze and visualize earth’s surface features continually ever since
geomorphological research. The prevalent distribution and comprehensive graphical capabilities of geographic
information systems (GIS) seeing that the availability of high-resolution remote sensing data such as airborne
and satellite imagery and surface elevation models has led to the recent renovation of the method (Lee et al.,
2001, Paron and Claessens, 2011, Smith et al., 2013).
Lithological map can be well thought-out the study area rock types as massive sandstones and granitic
rocks occupy whole mountainous range and hills. Geologically, the study area consists of hard quartzite rocks
mainly granite and charnockite of the Precambrian age. A few secluded granite bodies located in the reserve
forest areas of north-east of kalua mafi are well thought-out as closet granite, pink and grey in color, being
intrusive in to the peninsular gneissic complex, the sargur supracrustals and charnockite, chamundi granite,
exposed south of study area.
V. Results And Discussion The different type of thematic layers resulting the analysis for groundwater potential zones and result
of the composite map obtained in (Figs.), are discuss below in details:
Geomorphology:
The Geomorphic surface can be considered as outer indicators for the identification of ground water
conditions. Geomorphology is well depicted in satellite imagery. False color composites of the original bands
and principal component images have been used for the interpretation of the geomorphic features. Geomorphic
features and structural information from satellite images are interpreted to identify ground water and assisted the
site of recharge zones and ground water situations. Assorted geomorphic features have been identified in the
images using remote sensing techniques (Kumar et al., 2013). Geomorphic unit of the study area have been
identified on the basis of satellite data and followed by ground truth validation. Two types of landforms dwell in
the study area of Karwi block area, a part of Mandakini river basin in Chitrakoot district of Uttar Pradesh. First
type of denudational landforms (Hill, Plateau), and other second types of fluvial landforms of Alluvial plain,
Pedi Plain, Striped Plain, Flood Plain etc. The quantitative assessment of Karwi block area carries out with the
help of research literature review, deduce geology, satellite data and ground surveys so as to discriminate
difference in landform features of the area. For example- Alluvial Plain, Pedi Plain, Striped Plain, Plateau etc
(Kumar and Dev, 2014). The annotation of the alluvial plain is found to be excellent for ground water potential
zone of Karwi block area.
Figure 3: Hydro-Geomorphological Map of Karwi Block

Groundwater Potential Zone Identification using Remote Sensing and GIS Techniques - A Case ..
DOI: 10.9790/0837-0505024351 www.iosrjournals.org 47 | Page
Lithology:
The study area consists of rock types having massive sandstones; granitic rocks which occupies whole
ranges and hills. Geologically, the study area consists of hard quartzite rocks mainly granite and charnockite of
the Precambrian age. A few isolated granite bodies located in the reserve forest in northeast of kalua mafi are
considered as closepet granite, pink and yellow in color, being intrusive in to the peninsular gneissic complex,
thick bedded massive sandstone, and charnockites, chamundi granite, exposed to the south of study area. These
rocks are intruded by dolerite dykes of proterozoic age. Gneiss is medium grained with yellow and pink colors
and occupies north-west part. They have secondary porosity such as fractures, joints, faults, etc. Granite rocks
occupy south-eastern part forming the hill ranges with less primary porosity as well as high secondary porosity.
Figure 4: Lithological Map Figure 5: Slope Map
Slope:
Slope/gradient is a rate of change of elevation and well thought-out as the principal factor of the
sacrificial water flow seeing as it determines the effect of gravity on the water movement. The slope is directly
proportional to runoff, thus ground water recharge will be lesser in the area with vertical slope. The water flow
over the smoothly undulating plains is slow and sufficient time is accessible to enhance the penetration rate of
water to the underlying splintered aquifer. The slope was estimated from SRTM data, using 3D Analyst tools of
ArcGIS 10.3 software. The slope was estimated from the digital elevation model (DEM), which was obtained
from the contour lines in the topographical map.
Drainage:
Mandakini River is the foremost river with widespread drainage system, draining the water to the
whole area and responsible for biodiversity, habitation, agro-economic growth and livelihood. The Mandakini
river basin a complete drainage system is found to be 1st order to the main river (Kumar and Dev, 2014). The
drainage pattern of the area is dendritic and drainage texture of the study area is medium. The interconnected
nature of land and water resource calls for a holistic approach toward the urban and rural areas development and
watershed management. The enlargement of stream segments is mainly affected by the slope and local relief
which may fabricate distinction in drainage density from place to place. This drainage system is expressive for
river basin and watershed management. The drainage system is formed with different streams and streamlets.

Groundwater Potential Zone Identification using Remote Sensing and GIS Techniques - A Case ..
DOI: 10.9790/0837-0505024351 www.iosrjournals.org 48 | Page
Figure 6: Water body Map Figure 7: Land Use and Land Cover Map
Land use / Land cover:
Apprehending the importance of Land use/Land cover in ground water potentiality, Land use/Land
cover maps was prepared using geocoded LISS III images and field data. The various Land use/Land cover
classes delineated by employing the slandered methods of visual interpretation and the identified features
includes crop land, forest/plantation, waste land, hills, built-up, fallow/open land, deciduous, lakes/pond, barren,
rocky, road network and river/water bodies. In this majority of the area is used for scrubs land followed by crop
land. The Karwi Block area in a part of Uttar Pradesh, classified from satellite data covers an total area of
51879.52 ha. Out of total classified area obtained from satellite data yields to Crop land of 71.4%, deciduous
12.06%, fallow/open land of 12.19%, Built Up area of 1.95%, river/water body area of 0.52%, Plantation 1.76%
and barren rocky land of 0.28% of the interpreted of satellite data.
Table 2: Land use/Land cover Statistics Based on Visual Image Interpretation
Sl No. Class Name Area (in Ha) Area (in %)
1 Barren Rocky/Stony Waste 148.78 0.28
2 Built Up 1012.23 1.95
3 Crop Land 36909.27 71.14
4 Deciduous 6256.42 12.06
5 Fallow 6325.8 12.19
6 Gullied/Ravenous Land 0.05 0.00009
7 Land with Scrub 0.580 0.0001
8 Plantation 913.71 1.76
9 Reservoirs 0.06 0.00009
10 River 272.54 0.52
11 Salt affected land 0.045 0.00008
12 Lakes/Pond 38.85 0.07
13 Land without scrub 0.254 0.0001
14 Total 51879.52
Groundwater Potential Zone Identification using Remote Sensing and GIS Techniques - A Case ..
DOI: 10.9790/0837-0505024351 www.iosrjournals.org 49 | Page
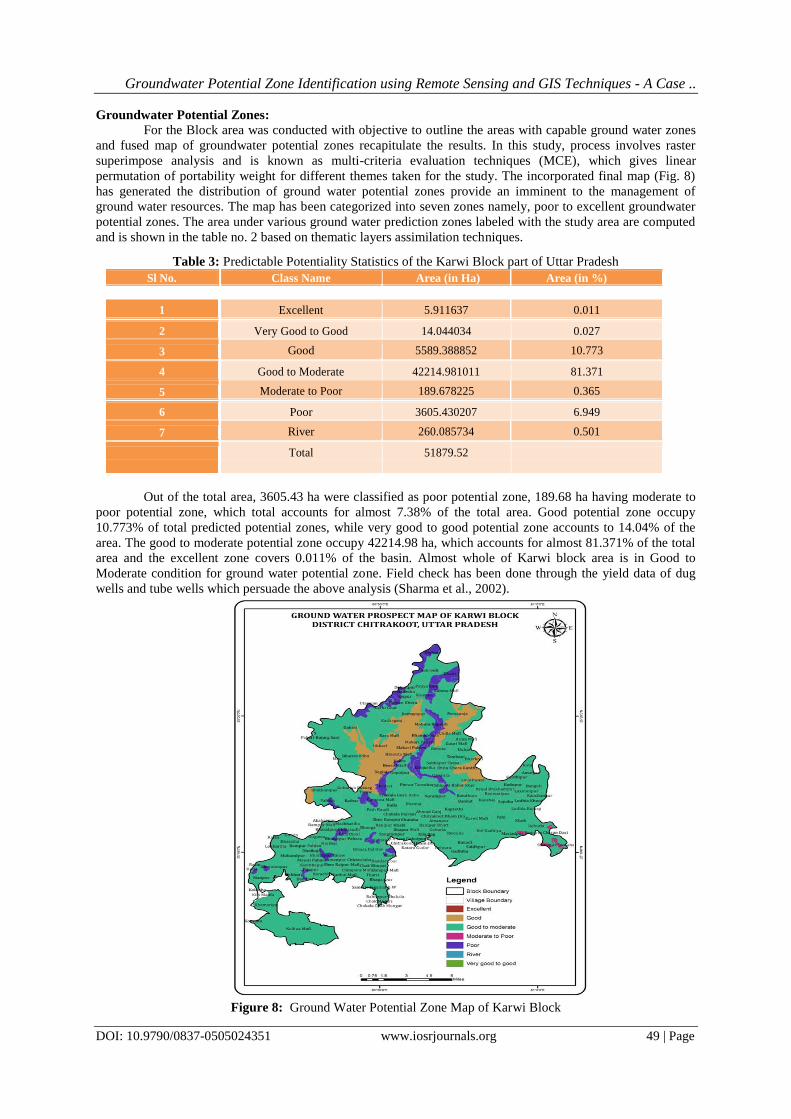
Groundwater Potential Zones:
For the Block area was conducted with objective to outline the areas with capable ground water zones
and fused map of groundwater potential zones recapitulate the results. In this study, process involves raster
superimpose analysis and is known as multi-criteria evaluation techniques (MCE), which gives linear
permutation of portability weight for different themes taken for the study. The incorporated final map (Fig. 8)
has generated the distribution of ground water potential zones provide an imminent to the management of
ground water resources. The map has been categorized into seven zones namely, poor to excellent groundwater
potential zones. The area under various ground water prediction zones labeled with the study area are computed
and is shown in the table no. 2 based on thematic layers assimilation techniques.
Table 3: Predictable Potentiality Statistics of the Karwi Block part of Uttar Pradesh
Sl No. Class Name Area (in Ha) Area (in %)
1 Excellent 5.911637 0.011
2 Very Good to Good 14.044034 0.027
3 Good 5589.388852 10.773
4 Good to Moderate 42214.981011 81.371
5 Moderate to Poor 189.678225 0.365
6 Poor 3605.430207 6.949
7 River 260.085734 0.501
Total 51879.52
Out of the total area, 3605.43 ha were classified as poor potential zone, 189.68 ha having moderate to
poor potential zone, which total accounts for almost 7.38% of the total area. Good potential zone occupy
10.773% of total predicted potential zones, while very good to good potential zone accounts to 14.04% of the
area. The good to moderate potential zone occupy 42214.98 ha, which accounts for almost 81.371% of the total
area and the excellent zone covers 0.011% of the basin. Almost whole of Karwi block area is in Good to
Moderate condition for ground water potential zone. Field check has been done through the yield data of dug
wells and tube wells which persuade the above analysis (Sharma et al., 2002).
Figure 8: Ground Water Potential Zone Map of Karwi Block
Groundwater Potential Zone Identification using Remote Sensing and GIS Techniques - A Case ..
DOI: 10.9790/0837-0505024351 www.iosrjournals.org 50 | Page
VI. Conclusion In the present study, an endeavor has been made to generate ground water potential zone maps through
multi-criteria evaluation techniques using the raster based GIS assessment and also to appraise the incessant
variation of ground water prospects availability in the area (Kumar and Dev, 2014). In this, exploration can be
incorporated into Karwi block management plan aimed at improving the life style of humans and protecting the
natural environment. It forms a complete water potential zones system which provides an expressive role in
agriculture, rural and urban areas development of study area. It has been observed from ground water potential
that the smooth slope has more potential for ground water than the rough slope (Kumar and Dev, 2014). The
incorporated ground water potential zones map has been categorized into seven classes on the basis of the
increasing weightage to different features of the thematic maps. The poor zone indicates the least favorable area
for groundwater prospect; whereas excellent zone indicates the most favorable area for groundwater prospect
(Murasingh et al., 2014). The total area of ground water prospects zones is 51879.52 ha. And excellent ground
water potential zone area is 0.011% of the total area and from Good to Moderate ground water potential zone
covers an area of 81.371%. The ground survey has been made through the data of dug wells and tube wells
which satisfy the above scrutiny. Therefore, appropriate management interventions and amicable salutations for
drinking water supply, irrigation tube wells, wells of basin better developments and management need to be
initiated without further delay. This vital information could be used effectively for the identification of suitable
locations or extraction of drinkable water. The current approach using GIS and remote sensing is holistic in
nature and will Minimize the effect of time and cost especially, for identifying ground water-potential zones and
suitable site-specific recharge structures in hard rock terrain on a regional as well as local scale, thus enabling
quick decision-making for water management.
Acknowledgements The authors express their gratefulness to Remote Sensing Application Centre, Lucknow and UTU, Dehradun
for proving the lab facility to carry out this research work. The corresponding author is thankful to Mr. Arsh
Doda, Founder & CEO, Antef Technologies Private Limited, India for his valuable suggestions while carrying
out this work.
References [1] Adhikari, S.K. and Kumar, S., 2006. ―Groundwater Prospecting and Management‖, Springer Hydrogeology, pp 1-219, DOI
10.1007/978-981-10-1148-1_2
[2] Dykes, AP., 2008. ―Geomorphological maps of Irish peat landslides created using hand-held GPS‖, Journal of Maps, pp 258-276.
[3] Janaki, A. and Subramani, T., 2016. ―Identification Of Aquifer And Its Management Of Ground Water Resource Using GIS In
Karur‖, International Journal of Emerging Trends & Technology in Computer Science (IJETTCS), 5(3), pp 81-92.
[4] Jose, S. K., Jayasree, R., Kumar, S. and Rajendran, S., 2012. ―Identification of Ground Water Potential Zones in Palakkad District, Kerala Through Multicriteria Analysis Techniques using Geo-information Technology‖, Bonfring International Journal of Industrial
Engineering and Management Science, 2(Special Issue 1), pp 62-68.
[5] Khan, S. U., 2013. ―Harvest The Rainwater Wherever it Pours: Every Drop Counts‖, Excellence International Journal of Education and Research, 1(3), pp 122-130.
[6] Krishnamurthy, J., Venkatesa Kumar, N., Jayaraman, V. and Manivel M., 2007. ―An approach to demarcate ground water potential
zones through remote sensing and a geographical information system‖, International Journal of Remote Sensing, 17(10), pp 1867-1884.
[7] Kumar, D. and Dev, P., 2014. ―Groundwater Potential Zone Identification of Karwi Area, Mandakini River Basin, Uttar Pradesh
using Remote Sensing and GIS Techniques‖, International Journal of Engineering Science Invention, 3(11), pp 10-19. [8] Kumar, D., Yadav, P.P.S., Lal, M., Kherawat, B.S., Kumar, B. and Kumar, R., 2013. ―Monitoring and Modeling of Baghin River
Basin of Uttar Pradesh using Remote Sensing and GIS Techniques‖, International Journal of Forest, Soil and Erosion (IJFSE), 3(2),
pp 392-395. [9] Lee, EM., 2001. ―Geomorphological mapping‖, Geological Society Special Publication, 18, pp 53-56.
[10] Magesh, N.S., Chandrasekar, N. and Soundranayagam, J.P., 2012. ―Delineation of groundwater potential zones in Theni district,
Tamil Nadu, using remote sensing, GIS and MIF techniques‖, Geoscience Frontiers, 3(2), pp 189-196. [11] Manikandan, J., Kiruthika, A.M. and Sureshbabu, S., 2014. ―Evaluation of groundwater potential zones in krishnagiri district,
Tamil Nadu using MIF Technique‖, International Journal of Innovative Research in Science, Engineering and Technology, 3(3), pp
10524-10534. [12] Murasingh, S., 2014. ―Analysis of Groundwater Potential Zones Using Electrical Resistivity, RS & GIS Techniques in a Typical
Mine Area of Odisha‖,Thesis- National Institute of Technology, Rourkela, pp 1-64. [13] Murthy, K.S.R., Amminedu, E. and Venkateswara Rao, V., 2003. ―Integration of thematic maps through GIS for identification of
groundwater potential zones‖, Journal of the Indian Society of Remote Sensing, 31(3), pp 197–210.
[14] Nagarajan, M. and Singh, S., 2009. ―Assessment of Ground water Potential Zones using GIS Technique‖, Journal of Indian Society of Remote Sensing, 37(1), pp 69-77.
[15] Paron, P. and Claessens, L., 2011. ―Chapter Four - Makers and Users of Geomorphological Maps‖, Developments in Earth Surface
Processes, 15, pp 75-106. [16] Prakash Ravi, S. and Singh, A., 2004. ―Integration of thematic through GIS for identification of Groundwater potential zones‖,
proceeding in Map India 2004.

Groundwater Potential Zone Identification using Remote Sensing and GIS Techniques - A Case ..
DOI: 10.9790/0837-0505024351 www.iosrjournals.org 51 | Page
[17] Raghu, V. and Swamy, M.V., 2009. ―Remote sensing in ground water exploration for development of temple tourism in
Vemulawada, Karimnagar District, Andhra Pradesh‖, J. Ind. Geophys. Union, 13(4), pp 183-190.
[18] Rain Water Harvesting, Paper Topics, Graduateway, https://graduateway.com/rain-water-harvesting-2/ [19] Saha, A., Thakur, P.K. and Chouksey, A., 2017. ―Hydrological Simulation using Process Based and Empirical Models for Flood
Peak Estimation‖, International Journal of Advanced Remote Sensing and GIS, 6(1), pp 2253-2266.
[20] Saha, A. and Singh, P., 2017. ―Drainage Morphometric Analysis and Water Resource Management of Hindon River Basin, using Earth Observation Data Sets‖, Imperial Journal of Interdisciplinary Research, 3(4), pp 2051-2057.
[21] Sanders, D.B. and Mirabel, I.F., 1996. ―Luminous Infrared Galaxies‖, Annu. Rev. Astron. Astrophys, 34, pp 749–792.
[22] Sharma, M.P., Kujur, A. and Sharma, U., 2002. ―Identification of groundwater prospecting zones using Remote Sensing and GIS techniques in and around Gola block, Ramgarh district, Jharkhand India‖, International Journal of Scientific & Research
Publication, 3(3), pp 1-6.
[23] Smith Mike, J. and Otto, J.C., 2013. ―Geomorphological mapping‖, Geomorphological techniques, British Society for Geomorphology, 2(6), pp 1-10.
IOSR Journal of Applied Geology and Geophysics (IOSR-JAGG) is UGC approved Journal
with Sl. No. 5021, Journal no. 49115.
Arnab Saha Groundwater Potential Zone Identification using Remote Sensing and GIS
Techniques - A Case Study of Karwi Block Area, Uttar Pradesh, India.‖ IOSR Journal of
Applied Geology and Geophysics (IOSR-JAGG) , vol. 5, no. 5, 2017, pp. 43-51.