GROUNDWATER MONITORING NETWORK … and Soil Remedy Areas Final Report.pdf · 6.0 Long-Term...
174
Long-Term Groundwater Monitoring Optimization Clare Water Supply Superfund Site Permeable Reactive Barrier and Soil Remedy Areas Clare, Michigan
Transcript of GROUNDWATER MONITORING NETWORK … and Soil Remedy Areas Final Report.pdf · 6.0 Long-Term...

Long-Term GroundwaterMonitoring Optimization
Clare Water Supply Superfund SitePermeable Reactive Barrier and
Soil Remedy AreasClare, Michigan

Long-Term GroundwaterMonitoring Optimization
Clare Water Supply Superfund SitePermeable Reactive Barrier and
Soil Remedy AreasClare, Michigan
Solid Waste and Emergency Response (5203P)
EPA 542-R-07-010 August 2007 www.epa.gov

Notice and Disclaimer
Work described herein was performed by GSI Environmental, Inc., Houston, TX, for the U.S. Environmental Protection Agency (U.S. EPA) and Parsons, Inc., Denver CO, for the U.S. Army Corps of Engineers (USACE). It has undergone technical review by EPA and USACE. Work conducted by GSI Environmental, Inc., including preparation of this report, was performed under EPA contract 68-W-03-038 to Environmental Management Support, Inc., Silver Spring. Maryland. Work conducted by Parsons, Inc., was performed under USACE Purchase Order W9128F-05-P-0041. Reference to any trade names, commercial products, process, or service does not constitute or imply endorsement, recommendation for use, or favoring by the U. S. EPA, USACE, or any other agency of the United States Government. The views and opinions of the authors expressed herein do not necessarily state or reflect those of the United States Government or any agency thereof. For further information, contact
Kathy Yager U.S. EPA/OSRTI 617-918-8362 [email protected]
Kirby Biggs EPA/OSRTI 703-299-3438 [email protected].
A PDF version of this report is available for viewing or downloading from EPA’s Hazardous Waste Cleanup Information (Clu-In) website at http://clu-in.org/optimization by clicking on “Application” and then “Long-Term Monitoring.” PDF copies also are available on the Federal Remediation Technologies Roundtable website at http://www.frtr.gov/optimization/monitoring.htm.

March 22, 2007
Table of Contents 1.0 Project Objectives ................................................................................................. 1 2.0 Site Background Information ................................................................................. 2
2.1 PRB Area................................................................................................... 2 2.2 Soil Remedy Area...................................................................................... 3
3.0 Methods................................................................................................................. 4 3.1 Qualitative Evaluation................................................................................ 4 3.2 MAROS Statistical Methods ...................................................................... 5 3.3 Data Input, Consolidation, and Site Assumptions ..................................... 5
4.0 PRB Area Results ................................................................................................. 6 4.1 Qualitative Review for the PRB Area......................................................... 6 4.2 MAROS Statistical Review for the PRB Area .......................................... 10 4.3 Recommendations for the PRB Area ...................................................... 11
5.0 Soil Remedy Area Results .................................................................................. 12 5.1 Qualitative Review for the Soil Remedy Area.......................................... 12 5.2 MAROS Statistical Review for the Soil Remedy Area ............................. 14 5.3 Recommendations for the Soil Remedy Area ......................................... 15
6.0 Long-Term Monitoring Program Flexibility .......................................................... 16 7.0 References Cited................................................................................................. 16 Tables Table 1 Summary of Site-Wide Long-Term Groundwater Monitoring Plan Table 2 Aquifer Input Parameters Table 3 Qualitative Evaluation of PRB Area Groundwater Monitoring Network Table 4 Well Trend Summary Results For PRB Area: 1999-2006 Table 5 Well Redundancy Analysis Summary Results For PRB Area Table 6 Final Recommended Groundwater Monitoring Network For PRB Area Table 7 Qualitative Evaluation of Soil Remedy Area Groundwater Monitoring Network Table 8 Well Trend Summary Results For Soil Remedy Area: 1999-2006 Table 9 Final Recommended Groundwater Monitoring Network For Soil Remedy Area
Figures Figure 1 Groundwater Monitoring Locations: PRB and Soil Remedy Areas Figure 2a Approximate Well Screen Intervals for PRB Area Figure 2b Approximate Well Screen Intervals for Soil Remedy Area Figure 3 Qualitative Evaluation Results for PRB Area Figure 4 Temporal Trend Results: Vinyl Chloride PRB Area Figure 5 Well Sufficiency Vinyl Chloride PRB Area Figure 6 Final Recommended Monitoring Network PRB Area Figure 7 Qualitative Evaluation Results for Soil Remedy Area Figure 8 Temporal Trend Results: TCE Soil Remedy Area Figure 9 Final Recommended Monitoring Network Soil Remedy Area
Attachments A: Geologic Cross-Sections B: MAROS 2.2 Methodology C: MAROS Reports D: Electronic Database (on CD) E: Selected November 2006 Data F: Review Comments and Responses
Long-Term Groundwater Monitoring Network Optimization Page i PRB and Soil Remedy Areas Clare Water Supply Superfund Site

March 22, 2007
LIST OF ACRONYMS AND ABBREVIATIONS
µg/L microgram(s) per liter
bgs below ground surface
cis-1,2-DCE cis-1,2-dichloroethene
cm/sec centimeters per second
COCs constituents of concern
CUO cleanup objective
DCE dichloroethene
DO dissolved oxygen
DPE dual-phase extraction
FS Feasibility Study
ft amsl feet above mean sea level
ft/day feet per day
GSI Groundwater Services, Inc.
LTM long-term monitoring
MAROS Monitoring and Remediation Optimization System software
MCES Modified Cost Effective Sampling
MCL Maximum Contaminant Level
mg/L milligram(s) per liter
MNA monitored natural attenuation
MNO monitoring network optimization
ORP oxidation-reduction potential
Parsons Parsons Infrastructure and Technology Group, Inc.
PCE tetrachloroethene
PRB Permeable Reactive Barrier
Progressive Progressive Engineering & Construction, Inc.
RI Remedial Investigation
ROD Record of Decision
TAL target analyte list
TCE trichloroethene
USEPA United States Environmental Protection Agency
VC vinyl chloride
Long-Term Groundwater Monitoring Network Optimization Page ii VOCs volatile organic compounds
PRB and Soil Remedy Areas Clare Water Supply Superfund Site

March 22, 2007
GROUNDWATER MONITORING NETWORK OPTIMIZATION PRB AND SOIL REMEDY AREAS
CLARE WATER SUPPLY SUPERFUND SITE
The following memorandum contains a review of the long-term groundwater monitoring network for the Permeable Reactive Barrier (PRB) and Soil Remedy Areas at the Clare Water Supply Superfund Site in Clare, Michigan. The review was a joint effort performed by Groundwater Services, Inc. (GSI) of Houston, Texas and Parsons Infrastructure and Technology Group, Inc. (Parsons) of Denver, Colorado. The current monitoring network in each area was evaluated using a formal qualitative approach (performed by Parsons) and statistical tools found in the Monitoring and Remediation Optimization System software (MAROS) (performed by GSI). Following performance of the qualitative and quantitative evaluations, Parsons and GSI collaborated to derive final recommendations for the groundwater monitoring networks using the results of the qualitative and quantitative evaluations.
Recommendations are made for groundwater sampling frequency and location based on available data pertaining to current hydrogeologic and contaminant conditions. The report evaluates the PRB Area and Soil Remedy Area monitoring networks using analytical data obtained from Progressive Engineering & Construction, Inc. (Progressive). PRB Area data extended from March 1994 to May 2006, although most wells only had data extending from May 2005 to May 2006. Soil Remedy Area data extended from June 1988 to May 2006, although most wells only had data for the period from March 1999 to May 2006. Additional data for the PRB and Soil Remedy Areas collected in November 2006 were received after the monitoring network optimization (MNO) evaluation had been completed. These data were qualitatively reviewed to assess any impacts on MNO recommendations, but were not formally incorporated into the complete evaluation described in this report. The November 2006 sampling results are provided in Attachment E.
1.0 Project Objectives The goal of the monitoring network optimization (MNO) evaluation for the PRB and Soil Remedy Areas is to design monitoring programs that are cost and time efficient as well as protective of potential receptors. The monitoring program should provide sufficient data to support site management decisions. The evaluation focuses on the following objectives:
• Evaluate well locations and screened intervals within the context of the hydrogeologic regime to determine if they meet site characterization and decision support objectives. Identify possible data gaps.
• Evaluate overall plume stability qualitatively and through trend and moment analysis.
• Evaluate individual well concentration trends over time for target constituents of concern (COCs) both qualitatively and statistically.
• Develop sampling location and frequency recommendations based on both qualitative and quantitative statistical analysis results.
Long-Term Groundwater Monitoring Network Optimization Page 1 PRB and Soil Remedy Areas Clare Water Supply Superfund Site

March 22, 2007
2.0 Site Background Information Site background information was primarily obtained from 1) the 2005 Annual Monitoring Report for the Clare Water Supply Superfund Site (Progressive, 2006), 2) personal communications with Progressive personnel, and 3) the draft five-year review report prepared in 2006 (USEPA, 2006). The five-year review report states that the site soils create two different hydrologic regimes within the investigation area. The first hydraulic regime consists of a perched water zone created by the low-permeability clay/till unit(s) in the western half of the site (where the PRB and Soil Remedy Areas are located). The second is created by aquifer sand underlying till. The aquifer is 20 to 40 feet thick in a sand unit beginning at 30 to 40 feet below the ground surface. In the western, industrialized portion of the site, 30 to 40 feet of clay and glacial till overlie the aquifer. The inferred goals of the groundwater monitoring program at these two areas are to:
• Determine the combined impact of engineered remedial measures and natural attenuation on concentrations of priority chlorinated constituents dissolved in groundwater; and
• Ensure that groundwater contamination is not posing unacceptable risks to potential receptors.
2.1 PRB Area
The PRB groundwater remedy consists of two PRBs in sequence that were installed to a depth of 17 feet below ground surface (bgs) along the property boundary of the former Mitchell source area in December 2004 (see Figure 1). The PRBs are designed to treat shallow groundwater contaminated with chlorinated volatile organic compounds (VOCs) as it migrates through the treatment walls. They are reportedly filled with iron-encrusted foundry sand.
The uppermost 8 to 23 feet of the soil column in the vicinity of the PRBs consists of sand backfill material (filling a former contaminated soil excavation) having a hydraulic conductivity of approximately 1 x 10⁻⁴ centimeters per second (cm/sec). The water table is present within 5 feet of the ground surface. The sand is underlain and encased laterally by low-permeability native material having a hydraulic conductivity of approximately 1 x 10⁻⁷ to 5 x 10⁻⁷ cm/sec (see cross sections from Progressive in Attachment A). The shallow groundwater flow direction is inferred to be south to southeast, across the PRBs, based on hydraulic potential data. The groundwater flow direction in the deep zone appears to range from north to east in the vicinity of the PRB Area, based on potentiometric surface maps contained in the 2005 Annual Monitoring Report (Progressive, 2006). A representative groundwater seepage velocity for the site provided by Progressive is 0.27 foot per day (ft/day) based on data contained in a Secor (November 2004) design report. According to Progressive, this seepage velocity is more representative of the sand backfill than of the surrounding native materials, which have a relatively low permeability.
According to Progressive, the recent and historical hydraulic data suggest a perched water table in the vicinity of the PRB and Soil Remedy Areas. The remedial investigation (RI) and feasibility study (FS) concluded that lateral flow in the perched water-bearing zone is possible in some areas, but is likely limited due to seasonal water table changes, and vertical flow is possible through assumed (but not verified) desiccation cracks in the glacial till.
Long-Term Groundwater Monitoring Network Optimization Page 2 PRB and Soil Remedy Areas Clare Water Supply Superfund Site

March 22, 2007
A drainage channel (the U.S. 10 Drainage Ditch) is located immediately south (downgradient) of the PRB Area. The drainage ditch empties into a small wetlands area which directly recharges the aquifer in the vicinity of water supply wells MW2 and MW5 (USEPA, 2006). According to Lithologic Cross Section A-A’, transmitted by Progressive and contained in Attachment A, this ditch is approximately 7 to 8 feet deep with a bottom elevation of approximately 835 to 836 feet above mean sea level (ft amsl). However, a review comment for the draft report submitted by Progressive indicates that the ditch is only 2 to 3 feet deep with a bottom elevation of approximately 840 ft amsl. Assuming that Progressive is referring to the same ditch, this discrepancy should be reviewed and the actual depth of the ditch should be confirmed. Given the shallow depth to groundwater in the perched zone, it is possible that some groundwater discharge to this ditch occurs if it is indeed 7 to 8 feet deep. Progressive reports that the channel is only seasonally wetted, with minimal flow, and even if PRB Area groundwater discharges to the swale, sampling data indicate that it poses no unacceptable risk to the downstream wetland area or to the water supply wells themselves. Therefore, Progressive reports that there are no significant receptor impacts related to PRB Area groundwater. The clean-up objective (CUO) for this area is the Michigan ground to surface water criterion for VC (15 micrograms per liter [µg/L]), as opposed to the US Environmental Protection Agency (USEPA) maximum contaminant level (MCL) of 2 µg/L. However, if groundwater in the vicinity of the PRB is found to be in communication with the deeper aquifer used for municipal water supplies, the MCL would apply.
2.2 Soil Remedy Area
Soil from the former Mitchell and ExCello properties was placed on the existing land surface beneath an engineered cap within the former ExCello property. A slurry wall was installed around the cap, and a dual-phase extraction (DPE) system was installed to treat vapor and groundwater removed from the contained area. The soil remedy was constructed in 1999, and the DPE system began operating in April 1999. The DPE system continues to operate on a cyclic basis, with treated water discharged to the local wastewater treatment plant.
The area on which the excavated soils were stockpiled was not excavated, but did contain soils with high concentrations of contaminants to depths up to about 15 to 28 feet bgs. No liner exists beneath the emplaced soils. The cap overlying the emplaced soils (from surface downward) consists of 1) vegetative cover, 2) a geonet underlain by a minimum 2-foot-thick soil cover, and 3) a low-density polyethylene 40-mil membrane liner. The native soils at the original land surface consist of silty sand underlain by low permeability clay and then low permeability till at varying depths. Geologic cross-sections created by Secor in 2005 and transmitted by Progressive are contained in Attachment A. The DPE wells are 30 feet deep and extend to beneath the silty sand/clay interface. The water table in the shallow wells installed north of the soil remedy cell (DMW-1S, -2S, and -3S) in May and November 2005 ranged from approximately 8 to 13 feet bgs, a few feet below the bottom of the emplaced soils and near the top of the native clay and glacial till.
The slurry wall surrounds the entire cap and reportedly varies in depth from about 14 to 22 feet bgs (deeper to the north); it extends a minimum of two feet beneath the clay/till interface. The permeability of the slurry wall (per the design) was to be less than 1x10⁻⁷ cm/sec. Per the RI report the average hydraulic conductivities are as follows: till 10-7 cm/sec, clay 10-7 cm/sec, silty sand 10-3 cm/sec, and clayey sand 10-5 cm/sec. The cap/slurry wall does not contain all of the area of soil impacts originally defined at Ex-Long-Term Groundwater Monitoring Network Optimization Page 3 PRB and Soil Remedy Areas Clare Water Supply Superfund Site

March 22, 2007
Cello; the area north of the cap close to US10 could not be excavated due to utilities/sewers and right of way issues – some impacts remained in place near DMW-1S, 2S, and 3S. Also, one of the DPE wells (EW-13) is located outside the slurry wall to the south, potentially due to the presence of impacted soils that were left in place, although the reason is not known with certainty. According to Progressive, there are no potential receptors for the Soil Remedy Area groundwater.
The groundwater seepage velocity outside of the soil treatment cell, obtained from Progressive, is 2.9 x 10⁻⁵ foot per day (0.01 foot per year). This velocity is based on the calculated seepage velocity for the vicinity of groundwater extraction well PRP-1 using a hydraulic conductivity of 2.67 x 10⁻⁷ cm/sec reported in the RI report (Dames & Moore, 1990). Based on the author’s professional judgment and experience, this velocity is likely biased low, and the actual average seepage velocity at the site is likely substantially higher.
3.0 Methods Evaluation of the groundwater monitoring networks in the vicinity of the PRB and Soil Remedy Areas consisted of both qualitative evaluation of site analytical data and hydrogeologic conditions and a quantitative, statistical evaluation of site analytical data. These two methods were combined to recommend a final groundwater monitoring strategy to support site monitoring objectives.
3.1 Qualitative Evaluation
Multiple factors were considered in developing recommendations for continuation or cessation of groundwater monitoring at each well. In some cases, a recommendation was made to continue monitoring a particular well, but at a reduced frequency. A recommendation to discontinue groundwater quality monitoring at a particular well based on the information reviewed does not necessarily constitute a recommendation to physically abandon the well. A change in site conditions might warrant resumption of monitoring at some time in the future at wells that are not currently recommended for continued sampling. In general, continuation of water level measurements in all site wells to facilitate groundwater flow direction and hydraulic gradient evaluation is recommended. Typical factors considered in developing recommendations to retain a well in, or remove a well from, a long-term monitoring (LTM) program are summarized in the table below.
REASONS FOR RETAINING A WELL IN MONITORING NETWORK
REASONS FOR REMOVING A WELL FROM MONITORING NETWORK
Well is needed to further characterize the site or monitor changes in contaminant concentrations through time
Well provides spatially redundant information with a neighboring well (e.g., same constituents, and/or short distance between wells) Well has been dry for more than two yearsa/ Well is important for defining the lateral or
vertical extent of contaminants Well is needed to monitor water quality at a compliance or receptor exposure point (e.g., water supply well)
Contaminant concentrations are consistently below laboratory detection limits or cleanup goals
Well is important for defining background water quality
Well is completed in same water-bearing zone as nearby well(s)
a/ Periodic water-level monitoring should be performed in dry wells to confirm that the upper boundary of the saturated zone remains below the well screen. If the well becomes re-wetted, then its inclusion in the monitoring program should be evaluated.
Long-Term Groundwater Monitoring Network Optimization Page 4 PRB and Soil Remedy Areas Clare Water Supply Superfund Site

March 22, 2007
Once the decision has been made to retain a well in the network, data are reviewed to determine a sampling frequency supportive of site monitoring objectives. Typical factors considered in developing recommendations for monitoring frequency are summarized below.
REASONS FOR INCREASING SAMPLING FREQUENCY
REASONS FOR DECREASING SAMPLING FREQUENCY
Groundwater velocity is high Groundwater velocity is low
Change in contaminant concentration would significantly alter a decision or course of action
Change in contaminant concentration would not significantly alter a decision or course of action
Well is necessary to monitor source area or operating remedial system
Well is distal from source area and remedial system
Cannot predict if concentrations will change significantly over time, or recent significant increasing trend in contaminant concentrations at a monitoring location resulting in concentrations approaching or exceeding a cleanup goal, possibly indicating plume expansion
Concentrations are not expected to change significantly over time, or contaminant levels have been below groundwater cleanup objectives for some prescribed period of time
3.2 MAROS Statistical Methods
Statistical methods in the MAROS 2.2 software were used along with the qualitative evaluation of the network to evaluate concentration trends, concentration stability, and spatial uncertainty in the PRB and Soil Remedy Areas. MAROS is a collection of tools in one software package that is used in an explanatory, non-linear but linked fashion to statistically evaluate groundwater monitoring programs. The software includes individual well trend and plume stability analysis tools, spatial statistics, and empirical relationships to assist the user in improving a groundwater monitoring network system. Results generated from the software tool were used to develop lines of evidence, which, in combination with results of the qualitative analysis, were used to recommend an optimized monitoring network for the PRB and Soil Remedy Areas. A description of each tool used in the MAROS software is provided as Attachment B. For a detailed description of the structure of the software and further utilities, refer to the MAROS 2.2 Manual (AFCEE, 2003; http://www.gsi-net.com/software/maros/Maros.htm) and Aziz et al., 2003. 3.3 Data Input, Consolidation, and Site Assumptions
Data for the PRB and Soil Remedy Areas were supplied by Progressive, supplemented with information from historic site reports. Chemical analytical data were organized by Progressive in a database, from which summary statistics were calculated. It should be noted that the dataset transmitted by Progressive was not complete in that not all historical analytical data collected for site wells were included. A complete set of historical analytical results was not available to Progressive when they assumed responsibility for site monitoring. Specifically, data for VC and tetrachloroethene (PCE)
Long-Term Groundwater Monitoring Network Optimization Page 5 PRB and Soil Remedy Areas Clare Water Supply Superfund Site

March 22, 2007
collected prior to May 2005 were not included for most wells. This evaluation assumed that the missing data were generally non-detect; however, this should be confirmed to the extent practical and feasible before final changes to the LTM program are made. Wells and sampling frequencies in the current groundwater monitoring program are shown in Table 1. Each of the wells listed in Table 1 was considered in the qualitative evaluation. Data for 18 wells at the PRB Area (all wells listed in Table 1 except SW-11) and 9 wells at the Soil Remedy Area (all wells listed in Table 1 except EW-series wells) were used in the quantitative (MAROS) analysis.
The monitoring wells in each area are grouped into shallow, intermediate, and deep categories based on their screen intervals in the underlying aquifer. Screened intervals for wells at the PRB and Soil Remedy Areas are illustrated on Figures 2 and 3, respectively. All but four of the wells at the PRB area are screened in the shallow zone near the water table, with the remaining wells assigned to the intermediate (1 well) and deep (3 wells) zones. In the Soil Remedy Area, the monitoring wells are primarily shallow (4 wells) or deep (4 wells), while the dual-phase extraction wells are classified as intermediate-depth. For both the PRB and Soil Remedy Areas shallow and intermediate groundwater zones were considered together as one two-dimensional slice for the quantitative evaluation (MAROS). The deep zone was considered separate from the shallow/intermediate zone. For the qualitative evaluation, the zones were viewed as largely independent.
A list of aquifer physical parameters assumed for the analysis is shown in Table 2. Two screening levels were identified for concentrations of VC in groundwater at the PRB Area. The draft 5-year review report for the Clare Superfund Site prepared by the USEPA (2006) states that The goal of the PRB installation “was to degrade Vinyl Chloride within the groundwater to levels below the Michigan Part 201 Ground Water/Surface Water Interface (GSI) standards or below 15 µg/l before it discharged into the drainage ditch or otherwise migrates off the former Mitchell facility property and enters the water supply aquifer.” Therefore, a CUO for VC of 0.015 milligrams per liter (mg/L) was assumed, while the USEPA MCL for VC of 0.002 mg/L was used as a general screening level for water quality in the aquifer. The USEPA MCL for trichloroethene (TCE) of 0.005 mg/L was used as a general screening level for water quality in the Soil Remedy Area, where TCE is the primary COC. Groundwater seepage velocities obtained from Progressive and discussed in Section 2.0 were used. Groundwater flow directions were inferred from potentiometric surface elevation data contained in the 2005 annual monitoring report (Progressive, 2006).
4.0 PRB Area Results The qualitative and quantitative evaluation results are discussed in the following subsections.
4.1 Qualitative Review for the PRB Area
• Details of the qualitative evaluation are shown on Figure 4 and Table 3. Wells recommended to be retained in the monitoring program were those that best defined the magnitude and extent of the plume and indicated the VOC removal effectiveness of the PRBs.
• Most of the monitoring wells present at the PRB Area were sampled quarterly from May 2005 to May 2006 (total of five events). After May 2006, the sampling frequency for these wells was reduced to semiannual, with the next event
Long-Term Groundwater Monitoring Network Optimization Page 6 PRB and Soil Remedy Areas Clare Water Supply Superfund Site

March 22, 2007
occurring in November 2006. These wells include 300A and MW-301 through MW-313. Wells 220, 300B, and 300C have been sampled semiannually and were not sampled quarterly from May 2006 to May 2006.
• A total of five wells were recommended for exclusion from the monitoring program because the qualitative evaluation determined that additional sampling would not provide useful information. A reduction in the sampling frequency was recommended for an additional two wells (MW-312 and MW-313). The rationale for the sampling frequency reductions is provided on a well-specific basis in Table 3.
• In general, a semiannual sampling frequency for most wells is recommended because 1) at least six monitoring events have been performed at each well as of November 2006, including five quarterly sampling events for the most recently installed wells (MW-301 through MW-313), providing a baseline to assess temporal trends and observe any seasonal variations in concentrations; 2) increasing concentration trends were not observed for most wells; 3) reducing sampling frequency would not endanger potential receptors based on available information; and 4) semiannual monitoring will still provide sufficient data to assess the effectiveness of the PRBs and determine temporal trends qualitatively and/or statistically.
• The available data indicate a high degree of vertical variation in contaminant concentrations over short distances at some locations, even within what is identified as sand backfill material on Cross-Sections A-A’ and B-B’ provided by Progressive (see Attachment A). For example, total combined concentrations of TCE+cis-1,2-dichloroethene (DCE)+VC at vertical profiling borehole VAS-301 (Figure 3) varied from 2 µg/L at 8 to 10.5 feet bgs to 2,040 µg/L at 10.5 to 13 feet bgs, a total vertical distance of only five feet. Similarly, VC concentrations at VAS-302 decreased by an order of magnitude from 870 µg/L from 7.5 to 10 feet bgs to 90 µg/L from 10 to 12.5 feet bgs. It appears that the vertical profiling data were used to select well screen intervals. However, the groundwater quality data obtained from the subsequently-installed wells at the same location sometimes vary significantly in magnitude from the vertical profiling data. For example, the VC concentration in MW-302 in May 2005 was 99 µg/L, compared to vertical profiling concentrations in the same depth interval of 1,010 to 1,700 µg/L in VAS-301 (January 2005). Therefore, the wells may not always be accurate indicators of maximum VOC concentrations present in the shallow aquifer. The only way to achieve better resolution would be to have multiple short, discrete screens at various depths at a given location.
• The target analyte list (TAL) for the PRB area includes VOCs (SW8260B) and selected field parameters (pH, conductivity, temperature, turbidity, dissolved oxygen [DO], oxidation-reduction potential [ORP], and ferrous iron). In addition, samples from six wells are analyzed for Michigan 10 metals. With the exception of Michigan 10 metals and ferrous iron, this TAL is reasonably optimized. However, the following recommendations are offered:
o Discuss optimizing the target VOC list to a short-list of key contaminants of concern (e.g., chlorinated ethenes) with the analytical laboratory. Potential advantages include lower laboratory analytical costs and lower data management/validation/reporting costs. However, all constituents targeted for
Long-Term Groundwater Monitoring Network Optimization Page 7 PRB and Soil Remedy Areas Clare Water Supply Superfund Site

March 22, 2007
analysis should be entered into the site database for each sampling event. Data gaps in the current database create uncertainty in the evaluation of lower priority constituents.
o Continued analysis for ferrous iron during every sampling event is not necessary. Groundwater from wells MW-301 through MW-313 was analyzed for ferrous iron three times in 2005. Ferrous iron concentrations provide an indication of whether iron-reducing conditions are present, which facilitates an evaluation of whether certain chlorinated VOCs can be readily degraded. However, once ferrous iron conditions are established, the sampling frequency can be reduced substantially to at least biennial (every other year) to allow periodic remedy evaluations.
o Delete Michigan 10 metals analysis based on the August 2005 metals data. There was only one very slight exceedance of an MCL (arsenic of 0.011 mg/L at MW-311 compared to MCL of 0.01 mg/L).
• In general, hydraulic monitoring for all wells located within the area of interest and screened within the depth zones of interest is recommended to maximize the accuracy of potentiometric surface maps. This recommendation is based on the observation that measurement of water levels in monitoring wells is generally relatively fast and inexpensive relative to water quality monitoring, and provides very important site characterization information. However, if multiple wells screened at similar depths are clustered in a small area and have similar groundwater elevations, one or more could be considered for removal from the hydraulic monitoring program unless more detailed delineation of local groundwater flow patterns is desired. At least two years of quarterly hydraulic monitoring is recommended to determine seasonal impacts on the potentiometric surface in the vicinity of the PRB Area. After that, semiannual hydraulic monitoring during relatively wet and dry times (e.g., spring and fall, concurrent with the groundwater sampling events) should be sufficient unless the quarterly monitoring results indicate significant seasonal variability that needs to be monitored more frequently. Hydraulic monitoring of all wells at the PRB area is recommended.
• The following potential data gaps were noted during performance of the qualitative evaluation for the PRB Area. They should be reviewed with the objective of verifying whether or not the current level of plume definition is acceptable in terms of 1) risks posed to potential receptors and 2) estimating the time and cost to achieve CUOs in groundwater.
o The downgradient extent of the VOC plume is not well defined. VC concentrations in the most downgradient wells in May 2006 ranged up to 58 µg/L (well MW-308); in November 2006 the VC concentration in this well had decreased to 20 µg/L. VC concentrations that exceed the cleanup goal appear to be bypassing the PRBs in the shallow zone, as indicated by VC concentrations detected at MW-310 (21 to 27 µg/L in May and November 2006). There are no wells installed that could be used to define the downgradient extent of the contamination detected at MW-310 based on inferred groundwater flow directions for the shallow zone. A surface water drainage channel borders the site on the south side. Given the shallow depth to the water table at the site (within approximately 2 feet of the ground surface
Long-Term Groundwater Monitoring Network Optimization Page 8 PRB and Soil Remedy Areas Clare Water Supply Superfund Site

March 22, 2007
at MW-308) and the assumed depth of the adjacent drainage channel (approximately 7-8 feet based on Lithologic Cross Section A-A’ in Attachment A), it appears likely that some discharge of contaminated groundwater to the surface water drainage occurs. However, information obtained from Progressive indicates that surface water and other sampling has indicated that this potential exposure pathway is not of concern (Personal communication from Bridget Morello, 23 October 2006).
o Appropriate sampling should continue to be performed to confirm that surface water is not an exposure/migration pathway of concern that will result in unacceptable levels of risk to human or ecological receptors. An aerial photograph of the site obtained from the USEPA indicates that an areally extensive, undeveloped, partially forested area is located on the downgradient (south) side of the drainage channel. Any contaminants that underflow the drainage channel would migrate beneath this area. The boundary of the Clare Water Supply Superfund Site is located approximately 400 feet south of the PRBs. The stakeholders should verify that the current level of plume definition is acceptable in terms of risks posed to potential receptors.
o Intermediate-depth well 300B contained 200 µg/L of VC in May 2006 and 140 µg/L in November 2006. This is the only intermediate-depth well at the site and is screened from approximately 3 to 13 feet below the bottom of the PRBs. Therefore, the detected contamination is likely not treated by the PRBs. The areal extent and magnitude of contamination in the intermediate depth zone is not defined. Similarly, groundwater quality in the deep zone is not well defined, given that there are only three wells screened in this zone at the site, one of which is cross-gradient of the plume (well 220) and one which is south of the drainage channel (MW-312). Therefore, the vertical extent of groundwater contamination is not well delineated. There are no deep wells installed at the PRB Area downgradient of 300C, which has had recent exceedances of the CUO for VC. In addition, well 300C may be screened in a more permeable sand aquifer underlying the till based on geologic information presented in Section 2.0. As stated above, the stakeholders should verify that the current level of plume definition is acceptable in terms of risks posed to potential receptors and that sufficient data are available to properly estimate the time and cost required to achieve CUOs and site closure.
o Although monitored natural attenuation (MNA) is not part of the remedy specified in the Record of Decision (ROD; USEPA, 1992), the degree to which natural attenuation processes are reducing dissolved contaminant concentrations at the PRB Area is of interest because VC concentrations exceeding CUOs are migrating downgradient from the PRBs, and the PRBs are not deep enough to treat all of the CUO exceedances (i.e., at well 300B). Therefore, it is desirable to determine the effectiveness of MNA at treating the residual contamination in order to assess the time and cost required to achieve CUOs and whether they can be achieved within a reasonable timeframe. Some important natural attenuation indicator parameters that can provide insight into the ability of the groundwater system to degrade the COCs are already measured (i.e., DO and ORP). It should be noted however, that the biogeochemical nature of the shallow groundwater environment
Long-Term Groundwater Monitoring Network Optimization Page 9 PRB and Soil Remedy Areas Clare Water Supply Superfund Site

March 22, 2007
immediately downgradient of the PRBs is impacted by the PRBs, and may not be representative of the groundwater environment farther downgradient. The Technical Protocol for Evaluating Natural Attenuation of Chlorinated Solvents in Ground Water (EPA/600/R-98/128, 1998) provides guidance on evaluating the site-specific effectiveness of MNA for chlorinated VOCs.
4.2 MAROS Statistical Review for the PRB Area
• The MAROS COC Assessment ranked VC as the priority constituent for the PRB area. VC was, therefore, chosen as the target monitoring constituent for the MAROS evaluation. Qualitative consideration was given to cis-1,2-DCE and the less frequent detections of TCE and PCE.
• Individual well trend analyses for VC were determined in MAROS using analytical data collected between 1999 and 2006. Results are illustrated in Table 4 and Figure 5. The majority of wells have a relatively short monitoring record of quarterly samples between May 2005 and May 2006. Among the 12 wells recently installed in the shallow zone, roughly half show a stable concentration trend. One well, MW-306, shows a decreasing trend, while the others show variation in VC concentrations over the recent time frame. Older wells 300-A, 300-B and 300-C show increasing concentration trends.
• The total dissolved mass estimate (zeroth moment) for VC showed a “Decreasing” trend between 1999 and 2006 for the shallow groundwater zone. Recent estimates of total dissolved mass in the shallow zone range between 0.3 kilograms (Kg) in 2005 dropping to 0.2 Kg in 2006. First moments (center of mass) in the PRB area are very stable over the 2005 to 2006 time-frame, as mass stays centered on higher concentration wells near 300A. However, this time-frame is very short. Moments should be reevaluated after a longer data set has been collected (4 years of data). Moments for the deep zone could not be evaluated due to the small number of monitoring locations.
• Spatial analysis of the VC plume using Delaunay triangulation and slope factor calculations indicate that the interior of the plume is well characterized by the existing well network and no new wells are recommended inside the network. However, a qualitative evaluation of the plume shows that the downgradient area to the south is not delineated to the CUO. Redundancy analysis indicates that locations MW-301, MW-304 and MW-305 may be removed from the network without loss of information. The results of the spatial analysis were considered in a final qualitative review, and wells MW-304 and MW-305 were retained in the program at a reduced sample frequency.
• Results of the MAROS well sampling frequency tool (the Modified Cost Effective Sampling [MCES] method) indicate that sampling frequency for the majority of wells in the PRB area can maintained at semiannual. Results of the MCES are shown in Table 5. Most of the monitoring well network was sampled quarterly from May 2005 to May 2006; since then, the sampling frequency has been decreased to semiannual.
Based on current trends, the MCES results for the majority of wells indicate that Annual sampling would be adequate to monitor changes in the plume. Wells 300A and 300B were recommended for Quarterly sampling based on a recent increasing concentration trend; however, due to the length of the monitoring
Long-Term Groundwater Monitoring Network Optimization Page 10 PRB and Soil Remedy Areas Clare Water Supply Superfund Site

March 22, 2007
record and the location of these wells, a semiannual monitoring frequency is recommended after the qualitative evaluation. A Quarterly result was also returned for well MW-305, based on an order of magnitude concentration increase between November 2005 and March 2006. The increase may be a transient phenomenon, but after the qualitative evaluation, the well is recommended for retention in the monitoring program at a semiannual frequency.
Final recommendations for sampling frequency were determined after a review of both qualitative and quantitative information.
4.3 Recommendations for the PRB Area
Recommendations for the PRB Area are summarized in Table 6 and described below.
• Continued sampling of 15 monitoring wells at the PRB Area is recommended. Continuation of a semiannual monitoring frequency for most wells is deemed appropriate assuming that future monitoring results do not indicate increasing trends that should be monitored more closely. Continued sampling of two lower-priority wells (MW-313 and MW-312) at an annual frequency is recommended. MW-313 is located cross-gradient of the VOC plume and MW-312 is screened in a relatively deep interval.
• Exclusion of four wells from the monitoring program at the PRB Area is recommended for the reasons identified in Tables 3 and 6. In general, these wells are not providing data of sufficient usefulness to justify continued sampling.
• The potential data gaps identified in Section 4.1 should be carefully considered, and additional sampling/characterization should be performed if appropriate to ensure that 1) the plume is adequately characterized to determine risks to potential receptors, 2) potential receptors are not being impacted by site-related contamination to an unacceptable degree, and 3) the appropriate data are collected to evaluate the effectiveness of MNA and properly estimate the time and cost required to achieve CUOs. Detailed site characterization information for the PRB area is not currently available in site documents provided to the authors. The lack of clarity in determining the depth of the drainage ditch near the PRB is indicative of challenges in information management associated with this area of concern. The majority of wells in the PRB area were drilled after the RODs were issued (1990, 1992, and 1997) and current information on the specific source of contamination and area hydrogeology are not included in these documents. The recommendation for the PRB area includes development of a Site Conceptual Model document to guide management decisions for this area of concern.
• Development of a comprehensive site-wide database should continue. Current and future analytical results should be available from laboratories in electronic data deliverable (EDD) format, which should simplify the validation and importation process. Results of historical analyses should be added to the database where possible, particularly when these data are used to support management decisions. The site-wide database should be made available to all stakeholders.
Long-Term Groundwater Monitoring Network Optimization Page 11 PRB and Soil Remedy Areas Clare Water Supply Superfund Site

March 22, 2007
5.0 Soil Remedy Area Results 5.1 Qualitative Review for the Soil Remedy Area
• Details of the qualitative evaluation for the Soil Remedy Area are summarized in Table 7 and depicted on Figure 7. All wells that are part of the current monitoring program for this site are recommended for retention. However, a reduction in the sampling frequency is recommended for at least seven of the nine monitoring wells listed in Table 7. In general, the frequency reductions were recommended because 1) existing monitoring wells have been sampled at least 16 times over a period of at least 7 years, and, with few exceptions, increasing trends are not evident (based on statistical trend analysis results through May 2006); 2) the reported low groundwater flow velocity and presence of a slurry wall surrounding the soil remedy cell should prevent rapid changes in dissolved contaminant concentrations and preclude the need for more frequent monitoring; 3) operation of the DPE system within/beneath the soil remedy cell is apparently removing VOC mass and reducing VOC concentrations in the vadose and saturated zones over time; and 4) available information indicates that there are no nearby receptors. Continued semi-annual monitoring of two wells DMW-3S and DMW-3D is recommended due the magnitude of recent COC detections. Continuation of this frequency is contingent on future analytical results.
• The TAL for the Soil Remedy Area includes VOCs (SW8260B) and selected field parameters (pH, conductivity, temperature, turbidity, DO, and ORP). This TAL is reasonably optimized. However, discussion with the analytical laboratory regarding optimization of the target VOC list to a short-list of key COCs (e.g., chlorinated ethenes) is recommended. Potential advantages include lower laboratory analytical costs and lower data management/validation/reporting costs.
• The hydraulic monitoring recommendations made for the PRB Area (Section 4.1) are also applicable to the Soil Remedy Area.
• The following potential data gaps were noted during performance of the MNO evaluation for the Soil Remedy Area. They should be reviewed with the objective of verifying whether or not the current level of plume definition is acceptable in terms of 1) risks posed to potential receptors and 2) estimating the time and cost to achieve CUOs in groundwater.
o The downgradient extent of the VOC plume in the shallow zone is not well defined. The TCE concentration measured in well DMW-3S in May 2006 was 23 µg/L compared to a CUO of 5 µg/L, and there are no shallow wells installed farther downgradient. The DO and ORP values measured at this well in November 2005 (8.8 mg/L and 94 millivolts, respectively) indicate that the shallow saturated zone is aerobic and oxidizing in this area, and the TCE will not readily degrade. This observation is supported by the relative lack of reductive dechlorination daughter products at DMW-3S (i.e., DCE and VC). However, information obtained from Progressive indicates that there are no receptors in the vicinity of the Soil Remedy Area (Personal communication from Bridget Morello, 26 October 2006). The northern boundary of the Clare Water Supply Superfund Site appears to be located approximately 200 feet north of the Soil Remedy Area, and institutional controls that preclude exposure to groundwater may not be in place north of this boundary. The
Long-Term Groundwater Monitoring Network Optimization Page 12 PRB and Soil Remedy Areas Clare Water Supply Superfund Site

March 22, 2007
stakeholders should verify that the current level of plume definition is acceptable in terms of characterizing risks posed to potential receptors.
o The intermediate zone is the first water-bearing zone below the bottom of the slurry wall. There is only one well screened in this zone (215), and it is located approximately 165 feet north of the soil remedy cell. Therefore, the existing monitoring network would likely not detect contaminant migration from beneath the soil cell in the intermediate zone. Installation of three intermediate-zone wells along the northern (presumed downgradient) edge of the soil cell (at or near shallow wells DMW-1S, -2S, and -3S, Figure 7) should be considered. The intermediate-zone well control in this area appears to be sparse, and inferred groundwater flow directions in the intermediate zone are therefore somewhat speculative. Installation of new wells in this zone would help establish the groundwater flow direction in the intermediate zone (i.e., via triangulation between well 215 and the new wells). If the groundwater flow direction in the intermediate zone is actually more directly eastward as suggested by a more recent potentiometric surface map transmitted by Progressive (that was contoured without using anomalous data from well 300B), then consideration should be given to focusing installation of new intermediate wells on the east side of the soil remedy cell as indicated in the response to Progressive comment #16 (Attachment F). Two intermediate wells could be installed along the east side and a third on the north side to determine the vertical extent of identified contamination given the presence of a continuing source in that area.
o Groundwater elevation data collected in 2005 indicate a northerly to northwesterly groundwater flow direction in the shallow zone at the Soil Remedy Area. Well DMW-1S is located approximately 70 feet east of the northwestern corner of the soil cell. Therefore, dissolved contaminants migrating from beneath the western portion of the soil cell may not be detected by the existing shallow well network. Installation of an additional shallow well along the southern edge of US Highway 10 approximately 70 feet west of DMW-1S should be considered (Figure 7). It appears that the contouring of shallow groundwater elevation data for the Soil Remedy Area on Figures 7 and 10 of the 2005 Annual Monitoring Report may not be completely correct. For example, the elevation for DMW-2S measured in May 2005 (838.23) is incorrectly located between the 836 and 838 elevation contours.
o Groundwater elevation data collected in 2005 indicate groundwater flow in the deep zone toward the east to east-northeast. However, it appears that the well control in this area is sparse, and inferred flow directions in the deep zone are somewhat speculative. Given the potential for migration toward the east-northeast, installation of one additional deep zone well northwest of DMW-3S (Figure 7) should be considered to detect any contaminant migration in the deep zone from beneath the northern portion of the soil cell. Installing a deep zone well near DMW-3S would have the added benefit of allowing assessment of vertical hydraulic gradients between the shallow, intermediate, and deep zones (assuming an intermediate well is also installed as discussed above), and also would help determine the groundwater flow direction with a higher degree of certainty (via triangulation with existing deep wells). Installation of one additional deep zone well could be made conditional on
Long-Term Groundwater Monitoring Network Optimization Page 13 PRB and Soil Remedy Areas Clare Water Supply Superfund Site

March 22, 2007
sampling results for new intermediate zone wells. If the intermediate zone wells do not contain COCs at concentrations of concern, indicating a lack of significant vertical migration of COCs, then installation of a new deep well would not be necessary or recommended.
o As described in Section 2.2, it appears that the estimated groundwater velocity for the native materials at the Soil Remedy Area may be based on a single hydraulic conductivity measurement made elsewhere on the Clare Superfund Site. Therefore, there appears to be a fairly high degree of uncertainty regarding the groundwater seepage velocity at the Soil Remedy Area. Refinement/confirmation of the magnitude of this variable via performance of slug and/or pumping tests in selected site wells should be considered given that it is an important variable in assessing contaminant fate and transport and determining optimal monitoring locations and frequencies.
o The contaminant conditions required to trigger a reexamination of the monitoring program (i.e. monitoring objectives) do not appear to be well defined. Currently there is a CUO exceedance at well DMW-3S. However, this TCE detection does not appear to be of concern given the reported lack of nearby receptors. Is there a threshold value above which additional plume characterization would be determined to be advisable? Some thought should be given to articulating what contaminant concentrations are considered to be significant.
o There are 13 DPE wells at the Soil Remedy Area, all of which are assumed to be operating on at least an intermittent basis. However, these wells are not sampled (or at least sample results are not reported in the database) so it is not possible to determine if one or more of the wells can be shut down because it is no longer removing significant VOC mass. This situation is economical from a monitoring perspective, but may not be economical from the standpoint of energy usage, costs for treatment of extracted water, and system operation and maintenance. Consideration should be given to whether the economic benefits of occasional sampling of the DPE wells would outweigh the added cost.
5.2 MAROS Statistical Review for the Soil Remedy Area
The Soil Remedy Area has a limited number of wells screened in both the shallow and deep intervals. Because fewer that six locations are monitored in each zone, the spatial statistical evaluation of the Soil Remedy area was limited in scope.
• The COC Assessment module in MAROS identified VC as the only priority constituent in the Soil Remedy area, based on its low MCL and historic concentrations at some locations; however the data set did not have a complete record for VC. TCE was chosen as the guiding constituent for the network evaluation based on its more extensive record.
• The majority of wells in the Soil Remedy Area have limited detections of TCE. Mann-Kendall concentration trend results are illustrated on Figure 9. Locations UMW-1S, DMW-2D, and UMW-1D had non-detect results for all sample events, while locations DMW-1D, and DMW-3D had single detections that were not confirmed in later sampling. The deep zone of the aquifer to the east of the Soil Remedy area is largely unaffected by COCs.
Long-Term Groundwater Monitoring Network Optimization Page 14 PRB and Soil Remedy Areas Clare Water Supply Superfund Site

March 22, 2007
Concentrations for shallow zone wells DMW 1 through 3 all showed strongly decreasing trends for TCE, while location 215 showed sporadic detections resulting in No Trend (NT), or high variability for TCE. Strongly decreasing trends at downgradient shallow zone locations indicate that the combined slurry wall and DPE remediation systems are functioning to reduce concentrations in this area.
• Preliminary sample frequency results from the MCES tool indicate that the frequency of well sampling could be reduced from semiannual to largely annual without loss of significant information. For the deep zone wells, preliminary results indicate that a biennial (every two year) sampling frequency would be adequate to characterize the change in concentration at these locations. In order to determine the final sampling frequency, the results of both the qualitative and statistical analyses were combined. Final recommendations are presented in Table 9 and are illustrated on Figure 10.
• The number of wells in the Soil Remedy Area in each groundwater zone (<6) were insufficient to perform moment analysis and formal spatial analysis for well redundancy and sufficiency. Well redundancy and sufficiency recommendations are based on the qualitative evaluation detailed above.
5.3 Recommendations for the Soil Remedy Area
Recommendations for the Soil Remedy Area are summarized in Table 9 and described below.
• Nine monitoring wells currently included in the monitoring program should be retained for continued sampling as described in Tables 7 and 9; however, sampling frequencies for at least seven of the wells could be reduced to annual (five wells) or biennial (every other year) (two wells). The current semiannual frequency for the remaining two wells (DMW-3S and DMW-3D) should be retained due to potentially increasing concentrations. Concentration trends can be evaluated at these locations after another one to two additional semi-annual monitoring events are performed, and the sample frequency adjusted to annual if concentrations are stable to decreasing.
• Shallow well SW-5 can be excluded from the Soil Remedy Area monitoring program as described in Tables 7 and 9. However, if this well is considered useful for site-wide monitoring or for monitoring another nearby site, then it should be retained for those purposes.
• The potential data gaps identified in Section 5.1 should be carefully considered, and additional sampling/characterization should be performed as appropriate to ensure that 1) the plume is adequately characterized to determine risks to potential receptors, 2) potential receptors are not being impacted by site-related contamination to an unacceptable degree, and 2) the appropriate data are collected to properly estimate the time and cost required to achieve CUOs for groundwater. As with the PRB area, a Site Conceptual Model document including detailed descriptions of area hydrogeology may be valuable in organizing site information and providing management decision support.
• At a minimum, installation of one shallow well and three intermediate-depth wells is recommended to more fully characterize the quality of groundwater migrating
Long-Term Groundwater Monitoring Network Optimization Page 15 PRB and Soil Remedy Areas Clare Water Supply Superfund Site

March 22, 2007
downgradient from beneath the soil remedy cell and to better define groundwater flow directions in the intermediate zones. In addition, installation of one deep well should be considered if sampling results for new intermediate-depth wells indicate the presence of COCs at concentrations of concern in intermediate groundwater as described in Section 5.1.
• Development of a comprehensive site-wide database should continue. Current and future analytical results should be available from laboratories in electronic data deliverable (EDD) format, which should simplify the validation and importation process. Results of historical analyses should be added to the database where possible, particularly when these data are used to support management decisions. The site-wide database should be made available to all stakeholders.
6.0 Long-Term Monitoring Program Flexibility The long-term monitoring (LTM) program recommendations described above are based on available data regarding current (and expected future) site conditions. Changing site conditions, such as changes in hydraulic (pumping-related) stresses or remedial system operation, could affect contaminant fate and transport. Therefore, the LTM program should be reviewed if site conditions change significantly, and revised as necessary to adequately track changes in the magnitude and extent of COCs in groundwater over time.
7.0 References Cited AFCEE. (1997). Air Force Center for Environmental Excellence, AFCEE Long-Term
Monitoring Optimization Guide, http://www.afcee.brooks.af.mil.
AFCEE. (2003). Monitoring and Remediation Optimization System (MAROS) 2.1 Software Users Guide. Air Force Center for Environmental Excellence. http://www.gsi-net.com/software/MAROS_V2_1Manual.pdf
Aziz, J. A., C. J. Newell, M. Ling, H. S. Rifai and J. R. Gonzales (2003). "MAROS: A Decision Support System for Optimizing Monitoring Plans." Ground Water 41(3): 355-367.
Progressive Environmental and Construction, Inc. (2006). 2005 Annual Monitoring Report, Clare Water Supply Superfund Site, Clare Michigan. Prepared for Clare PRP Group. February 21. Tampa, Florida.
USEPA (1992). EPA Superfund Record of Decision: Clare Water Supply, EPA ID MID980002273, OU 02, Clare, MI. EPA/ROD/R05-92/209. September 16.
USEPA (1998). Technical Protocol for Evaluating Natural Attenuation of Chlorinated Solvents in Ground Water. EPA/600/R-98/128. Office of Research and Development. September.
USEPA (2006). Draft Second Five-Year Review Report for Clare Water Supply, City of Clare, Clare County, Michigan. Prepared by USEPA Region 5, Chicago, Illinois. September.
Long-Term Groundwater Monitoring Network Optimization Page 16 PRB and Soil Remedy Areas Clare Water Supply Superfund Site

Tables

TABLE 1Summary of Site-Wide Long
Term Groundwater Monitoring Plan Clare Water Supply Superfund Site, Michigan
Hydraulic Monitoring
Current Frequency Current Frequency MethodPRB Monitoring
220 Deep 60.5 55.5 5 Monthly Semi Annual VOCs - 8260B300A Shallow 17 12 5 Monthly Semi Annual VOCs - 8260B300B Intermediate 30 20 10 Monthly Semi Annual VOCs - 8260B300C Deep 80 60 20 Monthly Semi Annual VOCs - 8260B
MW-301 Shallow 17 12 5 Monthly Semi Annual VOCs - 8260BMW-302 Shallow 15 10 5 Monthly Semi Annual VOCs - 8260BMW-303 Shallow 15 10 5 Monthly Semi Annual VOCs - 8260BMW-304 Shallow 15 10 5 Monthly Semi Annual VOCs - 8260B, MI 10 MetalsMW-305 Shallow 12 7 5 Monthly Semi Annual VOCs - 8260B, MI 10 MetalsMW-306 Shallow 17 12 5 Monthly Semi Annual VOCs - 8260B, MI 10 MetalsMW-307 Shallow 17 12 5 Monthly Semi Annual VOCs - 8260B, MI 10 MetalsMW-308 Shallow 12 7 5 Monthly Semi Annual VOCs - 8260B, MI 10 MetalsMW-309 Shallow 17 12 5 Monthly Semi Annual VOCs - 8260BMW-310 Shallow 17 12 5 Monthly Semi Annual VOCs - 8260BMW-311 Shallow 10 5 5 Monthly Semi Annual VOCs - 8260B, MI 10 MetalsMW-312 Deep 70 65 5 Monthly Semi Annual VOCs - 8260BMW-313 Shallow 17 12 5 Monthly Semi Annual VOCs - 8260BSW-11 Shallow 5.5 2 3 Monthly Not Sampled --SW-12 Shallow 11.5 8 3 Monthly Semi Annual VOCs - 8260B
Soil Remedy MonitoringDMW-1D Deep 75 70 5 Semi Annual Semi Annual VOCs - 8260BDMW-1S Shallow 17 12 5 Semi Annual Semi Annual VOCs - 8260BDMW-2D Deep 75 70 5 Semi Annual Semi Annual VOCs - 8260BDMW-2S Shallow 11 6 5 Semi Annual Semi Annual VOCs - 8260BDMW-3D Deep 75 70 5 Semi Annual Semi Annual VOCs - 8260BDMW-3S Shallow 10 5 5 Semi Annual Semi Annual VOCs - 8260B
EW-1 Intermediate 30 25 5 Semi Annual Not SampledEW-2 Intermediate 30 25 5 Semi Annual Not SampledEW-3 Intermediate 30 25 5 Semi Annual Not SampledEW-4 Intermediate 30 25 5 Semi Annual Not SampledEW-5 Intermediate 30 25 5 Semi Annual Not SampledEW-6 Intermediate 30 25 5 Semi Annual Not SampledEW-7 Intermediate 30 25 5 Semi Annual Not SampledEW-8 Intermediate 30 25 5 Semi Annual Not SampledEW-9 Intermediate 30 25 5 Semi Annual Not Sampled
EW-10 Intermediate 30 25 5 Semi Annual Not SampledEW-11 Intermediate 30 25 5 Semi Annual Not SampledEW-12 Intermediate 30 25 5 Semi Annual Not SampledEW-13 Intermediate 30 25 5 Semi Annual Not SampledSW-5 Shallow 6 3 3 Semi Annual Semi Annual VOCs - 8260B
UMW-1D Deep 55 50 5 Semi Annual Semi Annual VOCs - 8260BUMW-1S Shallow 9 4 5 Semi Annual Semi Annual VOCs - 8260B
Notes:Monthly hydraulic monitoring ended in May 2006; next hydraulic monitoring event was November 2006.BGS = feet below ground surface.
Water Quality Monitoring
Well General Well
DepthWell Depth
(BGS)
Top of Screen (BGS)
Screen Length
\proj\clare\EPA GIS\files to Parsons\PRB & Soil Remedy Tables_rev2.xls

GSI Job No. G-3138-105Issued 03/22/2007Page 1 of 1
PRB Soil RemedyValue Value Units
Current Plume Length 380 350 ftMaximum Plume Length 380 350 ftPlumeWidth 380 350 ftSeepageVelocity Intermediate (ft/yr)* 98 0.005 ft/yrDistance to Receptors (Source to MW-5) 1200 2000 ftGWFluctuations No No --SourceTreatment Permeable Reactive Barrier Cap, slurry wall and DPE --PlumeType Chlorinated Solvent Chlorinated Solvent --NAPL Present No No --
Vinyl Chloride Screening Levels TrichloroetheneCleanup Objective 0.015 -- mg/LMCL 0.002 0.005 mg/L
Parameter Value ValueGroundwater flow direction South NorthPorosity 0.38 0.39 --Source Location near Well 300A* Soil Remedy Cell --Source X-Coordinate 13014379.33 13014044.21 ftSource Y-Coordinate 845654.49 846239.92 ftSaturated Thickness 30 15 (Shallow) ft
Notes:1. Aquifer data from Progressive database (2006).2. Priority COCs defined by prevalence, toxicty and mobility.3. Saturated thickness represents the span of the shallow to intermediate aquifer.5. ft = Coordinates in NAD 1983 State Plane Michigan Central feet.6. Cleanup Objective from Michigan Part 201 Ground Water /Surface Water Interface standard for PRB area. MCL = USEPA Maximum Contaminant Level for drinking water.7. * = For the purpose of the spatial analysis, a point north of the barrier wall was chosen as the 'source' area.
Parameter
TABLE 2AQUIFER INPUT PARAMETERS FOR MAROS
LONG-TERM MONITORING OPTIMIZATIONCLARE WATER SUPPLY SUPERFUND SITE, MICHIGAN

PARSONS
Exclude Retain Monitoring Frequency Recommendation Rationale
220 Deep Semi-Annual X NAVOCs trace-level to non-detect during 43 sampling events over 12 years (1994-2006) with no cleanup objective (CUO) exceedances. No reason to believe that this will change in the future. Continued monitoring of this deep zone well that is screened below the primary contaminated interval would not provide useful information.
300A Shallow Semi-Annual X Semi-AnnualProvides upgradient data to evaluate VOC removal effectiveness of southern PRB. 17 sampling events from Dec '99 to Nov '06 provide sufficient baseline data to evaluate seasonal removal effectiveness; semiannual monitoring frequency should allow sufficient data to be collected to permit evaluation of PRB performance over time.
300B Intermediate Semi-Annual X Semi-Annual Screened in Gray Till below bottom of PRBs that is not well-monitored; contains elevated VC levels that appear to be increasing with time; results indicative of underflow of VOCs beneath PRB; retain to continue monitoring groundwater quality in deeper zone.
300C Deep Semi-Annual X Semi-Annual* Screened approx 44 to 64 ft below bottom of PRBs; only 3 deep wells present at site. Increasing VC trend between April '03 and Nov '05. Retain at moderate frequency to monitor trend. Consider reducing frequency to annual if increasing trend ceases.
MW-301 ShallowSemi-Annual X NA
Results of 5 sampling events in 2005-2006 indicate occasional presence of very low VOC levels < CUO; no apparent increasing or decreasing trends. However, this well does not serve to bound plume on west side or accurately indicate VOC mass migrating around PRBs given higher COC detections in MW310, which is screened in same interval and located futher west. Therefore, MW301 not providing useful data.
MW-302 Shallow
Semi-Annual X Semi-Annual
Measures water quality upgradient of PRBs in MW302-303-304/311 transect. COC concentrations over 5 quarterly events ending in May 06 consistently increased from MW302 to MW303; therefore, contrast between MW302 and MW303 did not appear to be a good indicator of PRB removal efficiency. Potential explanations include: 1) PRB is not effective at this location, 2) MW302 is not screened in primary contaminant flowpath, 3) groundwater does not migrate from MW302 to MW303, or 4) there is a source of VOCs between MW302 and MW303. However, trend reversed in Nov 06 (VC higher at MW302 than at MW303), potentially indicating PRB effects. Maintain semiannual monitoring frequency to assess future trends and PRB impacts. Note that COC concentrations in MW302 are much lower than detected in adjacent vertical profiling samples from VAS-301, indicating that data for MW302 are not representative of maximum COC concentrations in groundwater at this location.
MW-303 ShallowSemi-Annual X Semi-Annual
Measures elevated COC levels in this area, and provides useful upgradient data to evaluate VOC removal efficiency of southern PRB. Concentration decrease from Aug to Nov 05 appears to indicate effect of northern PRB installation. Semi-annual monitoring frequency should yield sufficient data over time regarding PRB effectiveness.
MW-304 Shallow
Semi-Annual X Semi-Annual Provides useful data regarding VOC removal efficiency of southern PRB near base of shallow zone. Semiannual monitoring frequency should yield sufficient data over time regarding PRB effectiveness. Note that vertical profiling data for adjacent VAS-304 indicate that MW-304 may be screened beneath highest VOC concentrations present in aquifer at this location.
MW-305 Shallow
Semi-Annual X NA
Measures water quality upgradient of PRBs in MW305-300A-307/308 transect. COC concentrations over 5 quarterly events consistently increased from MW305 to MW300A; therefore, contrast between these two wells does not appear to be a good indicator of northern PRB removal efficiency. Same trend observed in Nov 06. Potential explanations include: 1) PRB is not effective at this location, 2) MW305 is not screened in primary contaminant flowpath, 3) groundwater does not migrate from MW305 to MW300A, or 4) there is a source of VOCs between MW305 and MW300A. Note that COC concentrations in MW305 are much lower than detected in adjacent vertical profiling samples from VAS-302, indicating that data for MW305 are not representative of maximum COC concentrations in groundwater at this location. Continued monitoring of MW305 does not provide useful information regarding COC concentrations entering northern PRB and PRB effectiveness.
MW-306 Shallow Semi-Annual X Semi-AnnualProvides useful data regarding combined VOC removal efficiency of northern and southern PRBs and concentrations exiting PRB area. Semi-annual monitoring frequency should yield sufficient data over time regarding PRB effectiveness.
MW-307 Shallow Semi-Annual X Semi-AnnualProvides useful data regarding VOC removal efficiency of southern PRB and concentrations exiting PRB area near base of shallow zone. Semi-annual monitoring frequency should yield sufficient data over time regarding PRB effectiveness.
MW-308 Shallow Semi-Annual X Semi-AnnualProvides useful data regarding VOC removal efficiency of southern PRB and concentrations exiting PRB area in middle portion of shallow zone. Semi-annual monitoring frequency should yield sufficient data over time regarding PRB effectiveness.
MW-309 ShallowSemi-Annual X Semi-Annual
Monitors untreated VOC concentrations migrating past east end of PRBs. Data suggest possible increasing trend from Aug '05 to May '06, with lower VC concentration in Nov 06. Semi-annual monitoring frequency should yield sufficient data over time regarding PRB effectiveness unless increasing trend continues in the future.
TABLE 3QUALITATIVE EVALUATION OF PRB AREA GROUNDWATER MONITORING NETWORK
LONG-TERM MONITORING OPTIMIZATIONCLARE WATER SUPPLY SUPERFUND SITE, MICHIGAN
Well Name Hydrologic Unit Current
Sampling Frequency
Qualitative Analysis

PARSONS
Exclude Retain Monitoring Frequency Recommendation Rationale
TABLE 3QUALITATIVE EVALUATION OF PRB AREA GROUNDWATER MONITORING NETWORK
LONG-TERM MONITORING OPTIMIZATIONCLARE WATER SUPPLY SUPERFUND SITE, MICHIGAN
Well Name Hydrologic Unit Current
Sampling Frequency
Qualitative Analysis
MW-310 Shallow Semi-Annual X Semi-AnnualMonitors untreated VOC concentrations migrating past west end of PRBs. Stable VC trend indicated as of Nov 06; semi-annual monitoring frequency should yield sufficient data over time regarding COC concentrations in this area.
MW-311 ShallowSemi-Annual X Semi-Annual
Provides useful data regarding VOC removal efficiency of southern PRB and concentations exiting PRB area in middle to upper portion of shallow zone. COC concentrations generally similar to slightly higher than in paired well MW304, consistent with vertical profiling results from VAS-305 (maximum concentrations at 8.5' bls). Semi-annual monitoring frequency should yield sufficient data over time regarding PRB effectiveness.
MW-312 DeepSemi-Annual X Annual
Retain as deep zone sentry well in downgradient direction due to increasing trends in well 300C, which is screened at similar depth interval. Relatively low frequency justified by lack of COC detections through Nov 06 and reported lack of receptors. If rapid plume expansion at this depth was going to occur it would likely have already impacted this well.
MW-313 Shallow Semi-Annual X Every other yearWell appears to be cross-gradient of VOC plume; only 2 trace-level chlorinated ethene detections in 6 monitoring events (up to Nov 06). Retain at low frequency to monitor eastern extent of plume over time.
SW-11 Shallow Not Sampled X NANov 06 sampling event first since 1999. No COC detections over 11 events from 1994 to 1999, and only 1 trace-level toluene detection in Nov 06 (possible lab contaminant). Distant and upgradient from PRBs. Other wells installed closer to PRBs provide better site-specific upgradient data.
SW-12 Shallow Semi-Annual X NAWell is cross-gradient of VOC plume; only 1 trace-level chlorinated ethene detection in 14 monitoring events. Continued low-frequency monitoring of MW313 would facilitate assessment of eastern plume extent over time.
NA = not applicable.* = conditional recommendation; see comments.
GSI Job No. G-3138-105Issued 03/22/2007Page 1 of 1
300A 15 15 5.2 Yes 0.925 Yes I I I300B 13 13 0.2 Yes 0.0546 Yes I I I
MW-301 5 4 0.0015 No 0.0013 No S S SMW-302 5 5 0.099 Yes 0.059 Yes S D PDMW-303 5 5 1.6 Yes 0.604 Yes NT D SMW-304 5 5 0.041 Yes 0.0231 Yes S S SMW-305 5 5 0.24 Yes 0.152 Yes S NT SMW-306 5 5 0.015 No 0.00518 Yes D D DMW-307 5 4 0.033 Yes 0.012 Yes NT NT NTMW-308 5 5 0.058 Yes 0.0414 Yes NT NT NTMW-309 5 5 0.048 Yes 0.0242 Yes NT S SMW-310 5 5 0.027 Yes 0.0167 Yes NT NT NTMW-311 5 5 0.069 Yes 0.0312 Yes S S SMW-313 5 1 0.00073 No 0.000946 No ND* ND* ND*SW-12 12 1 0.0016 No 0.00105 No ND* ND* ND*
220 15 1 0.00031 No 0.000954 No S S S300C 13 8 0.027 Yes 0.0076 Yes I I I
MW-312 5 0 0.001 No 0.001 No -- -- ND
Notes1. Trends were evaluated for data collected between 1/1/1999 and 5/30/2006. Trends including new data from 11/2006 are shown in Attachment C.2. Shallow and Intermediate zone is approximately between 7 and 40 ft bgs (847 and 817 ft AMSL). Deep zone is below 40 ft bgs (below 817 ft AMSL).3. Number of Samples is the number of samples for the compound at this location. Number of Detects is the number of times the compound has been detected at this location.4. Maximum Result is the maximum concentration for the COC indicated between 1999 and 2006.5. CUO = Clean-up Objective, 0.015 mg/L. MCL = 0.002 mg/L for vinyl chloride. 'Above MCL' indicates that the result value is above the screening level'. 6. D = Decreasing; PD = Probably Decreasing; S = Stable; PI = Probably Increasing; I = Increasing; N/A = Insufficient Data to determine trend; NT = No Trend; ND = well has all non-detect results for COC; ND* = Non-detect except for one trace value.7. Mann-Kendall trend results are illustrated on Figure 4.
Linear Regression
TrendOverall Trend
Result
TABLE 4WELL TREND SUMMARY RESULTS FOR PRB AREA: 1999-2006
LONG-TERM MONITORING OPTIMIZATIONCLARE WATER SUPPLY SUPERFUND SITE, MICHIGAN
Vinyl Chloride Shallow and Intermediate Zone
Vinyl Chloride Deep Zone
Max Result Above CUO?
Average Result [mg/L]
Average Result Above
MCL?Mann Kendall
TrendWellNameNumber of Samples
Number of Detects
Maximum Result [mg/L]

GSI Job No. G-3138-105Issued 03/22/2007Page 1 of 1
300A 0.47 0.28 0.72 Retain Quarterly300B 0.39 0.15 0.54 Retain Quarterly
MW-301 0.87 0.59 1.00 Retain BiennialMW-302 0.11 0.02 0.28 Exclude Annual
MW-303 0.35 0.30 0.50 Retain Annual
MW-304 0.13 0.00 0.27 Exclude AnnualMW-305 0.19 0.00 0.49 Exclude QuarterlyMW-306 0.60 0.20 0.80 Retain AnnualMw-307 0.54 0.16 1.00 Retain AnnualMW-308 0.24 0.00 0.53 Retain AnnualMW-309 0.20 0.13 0.31 Retain AnnualMW-310 0.32 0.03 0.70 Retain SemiAnnualMW-311 0.13 0.01 0.25 Retain AnnualMW-313 0.90 0.55 1.00 Retain BiennialSW-12 0.88 0.65 1.00 Retain Annual
Deep Zone Wells220 Biennial
300C BiennialMW-312 Biennial
Notes:1. Slope Factor is the difference between the actual concentration and the concentration estimated from nearest neighbors normalized by the actual concentration. Slope factors close to 1 show the concentrations cannot be estimated from the nearest neighbors, and the well is important in the network.2. Slope factors were calculated using data between January 2002 and May 2006.3. Locations with slope factors below 0.3 were considered for elimination.4. Preliminary Sample Frequency is the result from the MCES analysis, 1999-2006.
TABLE 5WELL REDUNDANCY ANALYSIS SUMMARY RESULTS FOR PRB AREA
LONG-TERM MONITORING OPTIMIZATIONCLARE WATER SUPPLY SUPERFUND SITE, MICHIGAN
Preliminary Statistical Result
Preliminary Sample Frequency
Shallow and Intermediate Zone Wells
Insufficient well locations in deep zone for spatial analysis
WellName
Vinyl Chloride Average Slope
Factor
Vinyl Chloride Minimum Slope
Factor
Vinyl Chloride Maximum Slope
Factor

Sample Locations Sample Frequency
300A 15 15 0.925 Yes I I I Retain Semiannual
Monitors high concentrations between PRB, efficacy of southern PRB.
300B 13 13 0.055 Yes I I I Retain Semiannual
Monitors Intermediate groundwater zone, not treated by PRB
MW-301 5 4 0.001 No S S S Exclude --
Low concentration to non-detect, redundant with MW-310.
MW-302 5 5 0.059 Yes S D PD Retain Semiannual
Upgradient, low concentrations, outside of main plume
MW-303 5 5 0.604 Yes NT D S Retain Semiannual Monitors efficacy of PRB
MW-304 5 5 0.023 Yes S S S Retain* Semiannual
Monitors efficacy of PRB in lower Shallow Zone, companion well to MW311
MW-305 5 5 0.152 Yes S NT S Retain* SemiannualMonitors upgradient of PRB in Shallow Zone
MW-306 5 5 0.005 No D D D Retain Semiannual
Monitors immediately downgradient of eastern PRB in Shallow Zone
MW-307 5 4 0.012 No NT NT NT Retain Semiannual
Monitors efficacy of PRB in lower Shallow Zone, companion well to MW-308
MW-308 5 5 0.041 Yes NT NT NT Retain SemiannualMonitors efficacy of PRB in mid-upper Shallow Zone
MW-309 5 5 0.024 Yes NT S S Retain Semiannual
Monitors eastern edge of PRB for possible routing of plume around PRB
MW-310 5 5 0.017 Yes NT NT NT Retain Semiannual
Monitors western Shallow Zone, outside of PRB remedy.
MW-311 5 5 0.031 Yes S S S Retain SemiannualMonitors efficacy of PRB in mid-upper Shallow Zone
MW-313 5 1 0.001 No ND* ND* ND* Retain Annual
Sentry well cross-gradient shallow eastern edge of plume
SW-12 12 1 0.001 No ND* ND* ND* Exclude --Cross-gradient, not in main plume.
SW-11 2 0 0.001 No ND ND ND Exclude -- Upgradient, not in plume
220 15 1 0.000954 No S S S Exclude --
Largely non-detect, not representative of plume or source.
300C 13 8 0.0076 No I I I Retain SemiannualMonitors upgradient Deep Zone
MW-312 5 0 0.001 No -- -- ND Retain Annual Deep Zone sentry well
Notes1. Shallow and Intermediate zone is approximately between 7 to 37 ft bgs (847 and 817 ft AMSL). Deep zone is below 40 ft bgs (below 817 ft AMSL).2. Number of Samples is the number of samples during the recent time-frame for the compound at this location. Number of Detects is the number of times the compound has been detected for data consolidated by quarter at this location.3. Average Result is the average concentration for TCE between 1999 and 2006.4. CUO = Clean-up Objective, 0.005 mg/L. 'Above CUO' indicates that the result value is above the objective standard. 5. D = Decreasing; PD = Probably Decreasing; S = Stable; PI = Probably Increasing; I = Increasing; N/A = Insufficient Data to determine trend; NT = No Trend; ND = well has all non-detect results for COC; ND* = Non-detect except for one trace value.6. All recommendations are contingent upon stable plume status under current conditions. Changes in groundwater flow velocity or head may require increasing or decreasing sample locations and frequency.7. Sample locations are illustrated on Figure 7.8. * = Recommended for exclusion by either qualitative or quantitative analysis, but retained after final evaluation.
Recommendation After Qualitative and Quantitative Review
Rationale
TABLE 6FINAL RECOMMENDED GROUNDWATER MONITORING NETWORK FOR PRB AREA
LONG-TERM MONITORING OPTIMIZATIONCLARE WATER SUPPLY SUPERFUND SITE, MICHIGAN
Shallow and Intermediate Zone
Deep Zone
Average Result Above
CUO?
VC Mann Kendall Trend
VC Linear Regression
TrendVC Overall
Trend ResultWellNameNumber of Samples
Number of Detects
Average Result [mg/L]

PARSONS
Exclude Retain Monitoring Frequency Recommendation Rationale
DMW-1D Deep Semi-Annual X Annual
16 sampling events from 3/99 to 11/06. Missing PCE and VC data from 3/99 to 5/04. COCs non-detect in almost every case but increased cis-DCE in 11/06 (unvalidated data). Retain as deep sentry well downgradient of soil remedy cell. Frequency reduction justified based on historical monitoring results (primarily non-detect), assumed low groundwater flow velocity, presence of low-permeability sediments below soil cell and slurry wall around it, and deep screen interval (significant impacts at 70 ft bgs less likely).
DMW-1S Shallow Semi-Annual X Annual
16 sampling events from 3/99 to 11/06. Missing PCE and VC data from 3/99 to 5/04. Retain as downgradient shallow sentry well. TCE exhibits decreasing trend while cis-DCE exhibits no trend and variable concentrations with occasional cleanup goal exceedances. Reduce frequency to annual given assumed low groundwater flow velocity, lack of receptors, and lack of recent CUO exceedances (only 2 in previous 8 events up to 11/06) unless risks to potential receptors are perceived, justifying additional remedial action and/or sampling.
DMW-2D Deep Semi-Annual X Annual Same as DMW-1D.
DMW-2S Shallow Semi-Annual X AnnualNo CUO exceedances since 1999. Retain as downgradient shallow sentry well. Frequency reduction justified based on historical monitoring results (trace-level to non-detect), assumed low groundwater flow velocity, lack of receptors, and presence of slurry wall restricting migration of contaminants from soil cell into downgradient shallow zone groundwater.
DMW-3D DeepSemi-Annual X Semi-Annual* Same as DMW-1D. However, data for 2005-2006 suggest possible increasing trend in chlorinated VOC concentrations; therefore, retain current sampling
frequency to assess temporal trend. Consider frequency reduction to annual if future data demonstrate that concentrations are not increasing.
DMW-3S Shallow
Semi-Annual X Semi-Annual*16 sampling events from 3/99 to 11/06. Missing PCE and VC data from 3/99 to 5/04. TCE exceeded cleanup goals in most recent events. Overall decreasing trend, but November 05 and May 06 data suggest possible rebound. Retain as downgradient shallow sentry well. If results of one additional semi-annual event indicates resumption of either stable or decreasing trend, then reduce frequency to annual.
SW-5 Shallow Semi-Annual X -- 30 sampling events since 12/94; no cleanup goal exceedances since 1998. Upgradient to cross-gradient from Soil Remedy Cell; additional sampling would not provide useful data regarding Soil Remedy Area.
UMW-1D Deep Semi-Annual X every other yearRetain as upgradient deep zone well; low monitoring frequency justified by upgradient location and lack of historical COC detections over 16 monitoring events since 1999.
UMW-1S Shallow Semi-Annual X every other yearRetain as upgradient shallow zone well; frequency reduction justified by upgradient location and lack of historical COC detections over 16 monitoring events since 1999.
EW-1 Intermediate Semi-Annual No DataEW-2 Intermediate Semi-Annual No DataEW-3 Intermediate Semi-Annual No DataEW-4 Intermediate Semi-Annual No DataEW-5 Intermediate Semi-Annual No DataEW-6 Intermediate Semi-Annual No DataEW-7 Intermediate Semi-Annual No DataEW-8 Intermediate Semi-Annual No DataEW-9 Intermediate Semi-Annual No DataEW-10 Intermediate Semi-Annual No DataEW-11 Intermediate Semi-Annual No DataEW-12 Intermediate Semi-Annual No DataEW-13 Intermediate Semi-Annual No Data
215 Intermediate
Semi-Annual X AnnualSampled 36 times from 3/94 to 11/06 with only scattered low-level detections and no CUO exceedances. Retain as downgradient intermediate-zone sentry well. Frequency reduction justified by monitoring history, distance from source area, assumed low groundwater flow velocity, lack of receptors, potential for DMW-1S/2S/3S to provide early warning of contaminant migration toward 215.
* = conditional recommendation; see comments.
TABLE 7QUALITATIVE EVALUATION OF SOIL REMEDY AREA GROUNDWATER MONITORING NETWORK
LONG-TERM MONITORING OPTIMIZATIONCLARE WATER SUPPLY SUPERFUND SITE, MICHIGAN
Well Name Hydrologic Unit Current
Sampling Frequency
Qualitative Analysis

GSI Job No. G-3138-105Issued 03/22/2007Page 1 of 1
DMW-1S 15 15 0.099 Yes 0.017 Yes D D D AnnualDMW-2S 14 7 0.048 Yes 0.0019 No D D D AnnualDMW-3S 15 15 0.007 Yes 0.021 Yes D D D AnnualUMW-1S 15 0 0.001 No 0.001 No -- -- ND BiennialSW-5 13 0 0.001 No 0.001 No -- -- ND Biennial
DMW-1D 15 1 0.001 No 0.001 No -- -- ND* BiennialDMW-2D 15 0 0.001 No 0.001 No -- -- ND BiennialDMW-3D 15 1 0.0016 No 0.00104 No NT NT NT BiennialUMW-1D 15 0 0.001 No 0.001 No -- -- ND Biennial
Notes1. Trends were evaluated for data collected between 1/1/1999 and 5/30/2006.2. Shallow and Intermediate zone is approximately between 0 and 17 ft bgs. Deep zone is below 50 ft bgs.3. Number of Samples is the number of samples for the compound at this location. Number of Detects is the number of times the compound has been detected at this location.4. Maximum Result is the maximum concentration for the COC indicated between 1999 and 2006.5. CUO = Clean-up Objective, 0.015 mg/L. MCL = 0.005 mg/L for TCE. 'Above MCL' indicates that the result value is above the screening level'. 6. D = Decreasing; PD = Probably Decreasing; S = Stable; PI = Probably Increasing; I = Increasing; N/A = Insufficient Data to determine trend; NT = No Trend; ND = well has all non-detect results for COC; ND* = Non-detect except for one trace value.7. Mann-Kendall trend results are illustrated on Figure 4.8. LOE = Lines of Evidence. The LOE trend is a combination of the Mann-Kendall and Linear Regression trends.9. Average Result is the average concentration at the monitoring location for all samples between 1999 and 2006.10. The Sampling Frequency is a preliminary result from the software algorithm. A final frequency should be determined after a qualitative evaluation of all site data.11* Location DMW-1D had only one detection of TCE and DCE in June 2000. The detection was not repeated in subsequent sample events.
Trichloroethene Chloride Deep Zone
TABLE 8WELL TREND SUMMARY RESULTS SOIL REMEDY AREA: 1999-2006
LONG-TERM MONITORING OPTIMIZATIONCLARE WATER SUPPLY SUPERFUND SITE, MICHIGAN
Linear Regression
TrendOverall Trend
Result
Preliminary Sample
FrequencyTrichloroethene Shallow Zone
Max Result Above MCL?
Average Result [mg/L]
Average Result Above
MCL?Mann Kendall
TrendWellNameNumber of Samples
Number of Detects
Maximum Result [mg/L]

Sample Locations Sample Frequency
DMW-1S 15 15 0.017 Yes D D D Retain AnnualDowngradient shallow sentry well
DMW-2S 14 7 0.002 No D D D Retain AnnualDowngradient shallow sentry well
DMW-3S 15 15 0.021 Yes D D D Retain Semiannual*
Consider changing frequency to Annual if concentrations stable to decreasing over 2-3 sample events
UMW-1S 15 0 0.001 No -- -- ND Retain BiennialMonitors shallow zone upgradient of soil remedy.
215 15 3 0.001 No NT NT NT Retain Annual
Sentry well for downgradient intermediate groundwater zone.
SW-5 13 0 0.001 No ND ND ND Exclude --
Cross-gradient of Soil Remedy Cell and not providing useful data.
DMW-1D 15 1 0.001 No -- -- ND* Retain AnnualMonitors for contaminant migration in deep zone
DMW-2D 15 0 0.001 No -- -- ND Retain AnnualMonitors for contaminant migration in deep zone
DMW-3D 15 1 0.001 No NT NT NT Retain Semiannual*
Consider changing frequency to Annual if concentrations stable to decreasing over 2-3 sample events
UMW-1D 15 0 0.001 No -- -- ND Retain BiennialMonitors deep groundwater zone upgradient of soil remedy
Notes1. Shallow and Intermediate zone is approximately between 7 to 37 ft bgs (847 and 817 ft AMSL). Deep zone is below 40 ft bgs (below 817 ft AMSL).2. Number of Samples is the number of samples during the recent time-frame for the compound at this location. Number of Detects is the number of times the compound has been detected for data consolidated by quarter at this location.3. Average Result is the average concentration for TCE between 1999 and 2006.4. CUO = Clean-up Objective is equal to MCL, 0.005 mg/L. 'Above CUO' indicates that the result value is above the objective standard. 5. D = Decreasing; PD = Probably Decreasing; S = Stable; PI = Probably Increasing; I = Increasing; N/A = Insufficient Data to determine trend; NT = No Trend; ND = well has all non-detect results for COC; ND* = Non-detect except for one trace value.6. All recommendations are contingent upon stable plume status under current conditions. Changes in groundwater flow velocity or head may require increasing or decreasing sample locations and frequency.7. Sample locations are illustrated on Figure 9.8. * = Consider reducing frequency to Annual if concentration trends stable to decreasing.9. SW-5 may provide useful information for the Site-Wide groundwater monitoring network, which was not evaluated here.
Shallow and Intermediate Zone
Deep Zone
Average Result Above
CUO?
TCE Mann Kendall Trend
TCE Linear Regression
TrendTCE Overall Trend ResultWellName
Number of Samples
Number of Detects
Average Result [mg/L]
Recommendation After Qualitative and Quantitative Review
Rationale
TABLE 9FINAL RECOMMENDED MONITORING NETWORK SOIL REMEDY AREA
LONG-TERM MONITORING OPTIMIZATIONCLARE WATER SUPPLY SUPERFUND SITE, MICHIGAN

Figures

"/
"/ "/"/"/
"/
"/"/"/"/
"/
"/
"/
"/
"/#0
!.
!.
!.
#0
#0
!.
"/
!.
"/
!.
"/
"/
"/
!.
"/
215
104
SW-9
SW-5
UMW-1S
UMW-1D
DMW-3S
DMW-3D
DMW-2S
DMW-2D
DMW-1S
DMW-1D
220300C
300B300A
SW-12
SW-11
MW-312
MW-313
MW-311
MW-310
MW-308
MW-307
MW-306
MW-309
MW-305
MW-304
MW-303
MW-302
MW-301
£
0 70 140
Scale (ft)
Clare Water Treatment SiteClare, Michigan
GSI Job No.
Issued:
Drawn by:
Chk'd by:
Appv'd by:
MV
MV
MV
Legend
GROUNDWATER MONITORING LOCATIONS: PRB AND SOIL REMEDY AREAS
Figure 1
Notes: 1. Shallow zone is between 5 and 20 FT bgs. Intermediate zone is between 20 and 50 FT bgs. Deep zone is between 50 and 80 FT bgs.2. Data source Progressive Environmental and Construction, August 2006.
G-3138-105
03/22/2007
Well Depth
Permeable Reactive Barrier
"/ PRB Area Wells
"/Soil Remedy Area Wells
!. Deep
#0 Intermediate
"/ Shallow
Soil Remedy Area
Permeable ReativeBarrier Area (PRB)

Draft PARSONS
FIGURE 2AAPPROXIMATE WELL SCREEN INTERVALS FOR PRB AREA
LONG-TERM MONITORING OPTIMIZATION EVALUATIONCLARE WATER SUPPLY SUPERFUND SITE, MICHIGAN
Elevation
220
300A
300B
300C
MW
-301
MW
-302
MW
-303
MW
-304
MW
-305
MW
-306
MW
-307
MW
-308
MW
-309
MW
-310
MW
-311
MW
-312
MW
-313
SW
-11
SW
-12
Zone D S I D S S S S S S S S S S S D S S S843 843 843 843 843 843 843 843 843 843 843 843 843 843 843 843 843 843 843 843
841 842 842 842 842 842 842 842 842 842 842 842 842 842 842 842 842 842 841 842 Approx Water Table839 839 839 839 839 839 839 839 839 839 839 839 839 839 839 839 839 839 839 839
837 837 837 837 837 837 837 837 837 837 837 837 837 837 837 837 837 837 837 837
835 835 835 835 835 835 835 835 835 835 835 835 835 835 835 835 835 835 835 835
833 833 833 833 833 833 833 833 833 833 833 833 833 833 833 833 833 833 833 833
831 831 831 831 831 831 831 831 831 831 831 831 831 831 831 831 831 831 831 831
829 829 829 829 829 829 829 829 829 829 829 829 829 829 829 829 829 829
827 827 827 827 827 827 827 827 827 827 827 827 827 827 827 827 827 827 827 827 Bottom of PRBs (826-827)825 825 825 825 825 825 825 825 825 825 825 825 825 825 825 825 825 825 825 825 Approx Top of Intermediate Zone823 823 823 823 823 823 823 823 823 823 823 823 823 823 823 823 823 823 823 823
821 821 821 821 821 821 821 821 821 821 821 821 821 821 821 821 821 821 821 821
819 819 819 819 819 819 819 819 819 819 819 819 819 819 819 819 819 819 819 819
817 817 817 817 817 817 817 817 817 817 817 817 817 817 817 817 817 817 817 817
815 815 815 815 815 815 815 815 815 815 815 815 815 815 815 815 815 815 815 815
813 813 813 813 813 813 813 813 813 813 813 813 813 813 813 813 813 813 813 813
811 811 811 811 811 811 811 811 811 811 811 811 811 811 811 811 811 811 811 811
809 809 809 809 809 809 809 809 809 809 809 809 809 809 809 809 809 809 809 809
807 807 807 807 807 807 807 807 807 807 807 807 807 807 807 807 807 807 807 807
805 805 805 805 805 805 805 805 805 805 805 805 805 805 805 805 805 805 805 805
803 803 803 803 803 803 803 803 803 803 803 803 803 803 803 803 803 803 803 803
801 801 801 801 801 801 801 801 801 801 801 801 801 801 801 801 801 801 801 801
799 799 799 799 799 799 799 799 799 799 799 799 799 799 799 799 799 799 799 799
797 797 797 797 797 797 797 797 797 797 797 797 797 797 797 797 797 797 797 797
795 795 795 795 795 795 795 795 795 795 795 795 795 795 795 795 795 795 795 795
793 793 793 793 793 793 793 793 793 793 793 793 793 793 793 793 793 793 793 793 Approx Top of Deep Zone791 791 791 791 791 791 791 791 791 791 791 791 791 791 791 791 791 791 791 791
789 789 789 789 789 789 789 789 789 789 789 789 789 789 789 789 789 789 789 789
787 787 787 787 787 787 787 787 787 787 787 787 787 787 787 787 787 787 787 787
785 785 785 785 785 785 785 785 785 785 785 785 785 785 785 785 785 785 785 785
783 783 783 783 783 783 783 783 783 783 783 783 783 783 783 783 783 783 783 783
781 781 781 781 781 781 781 781 781 781 781 781 781 781 781 781 781 781 781 781
779 779 779 779 779 779 779 779 779 779 779 779 779 779 779 779 779 779 779 779
777 777 777 777 777 777 777 777 777 777 777 777 777 777 777 777 777 777 777 777
775 775 775 775 775 775 775 775 775 775 775 775 775 775 775 775 775 775 775 775
773 773 773 773 773 773 773 773 773 773 773 773 773 773 773 773 773 773 773 773
771 771 771 771 771 771 771 771 771 771 771 771 771 771 771 771 771 771 771 771
769 769 769 769 769 769 769 769 769 769 769 769 769 769 769 769 769 769 769 769
767 767 767 767 767 767 767 767 767 767 767 767 767 767 767 767 767 767 767 767
765 765 765 765 765 765 765 765 765 765 765 765 765 765 765 765 765 765 765
763 763 763 763 763 763 763 763 763 763 763 763 763 763 763 763 763 763 763 763
761 761 761 761 761 761 761 761 761 761 761 761 761 761 761 761 761 761 761 761
759 759 759 759 759 759 759 759 759 759 759 759 759 759 759 759 759 759 759 759
757 757 757 757 757 757 757 757 757 757 757 757 757 757 757 757 757 757 757 757
755 755 755 755 755 755 755 755 755 755 755 755 755 755 755 755 755 755 755 755
753 753 753 753 753 753 753 753 753 753 753 753 753 753 753 753 753 753 753 753
751 751 751 751 751 751 751 751 751 751 751 751 751 751 751 751 751 751 751 751
749 749 749 749 749 749 749 749 749 749 749 749 749 749 749 749 749 749 749 749
747 747 747 747 747 747 747 747 747 747 747 747 747 747 747 747 747 747 747 747
ShallowIntermediateDeep

Draft PARSONSFIGURE 2B
PPROXIMATE WELL SCREEN INTERVALS FOR SOIL REMEDY AREALONG-TERM MONITORING OPTIMIZATION EVALUATION
CLARE WATER SUPPLY SUPERFUND SITE, MICHIGAN
Elevation
215
DM
W-1
DD
MW
-1S
DM
W-2
DD
MW
-2S
DM
W-3
DD
MW
-3S
EW
-1E
W-2
EW
-3E
W-4
EW
-5E
W-6
EW
-7E
W-8
EW
-9E
W-1
0E
W-1
1E
W-1
2E
W-1
3S
W-5
UM
W-1
DU
MW
-1S
Zone I D S D S D D I I I I I I I I I I I I I D S845 845 845 845 845 845 845 845 845 845 845 845 845 845 845 845 845 845 845 845 845 845
843 843 843 843 843 843 843 843 843 843 843 843 843 843 843 843 843 843 843 843
841 841 841 841 841 841 841 841 841 841 841 841 841 841 841 841 841 841 841 841 841 841 841 Approx Water Table (836-844)839 839 839 839 839 839 839 839 839 839 839 839 839 839 839 839 839 839 839 839
837 837 837 837 837 837 837 837 837 837 837 837 837 837 837 837 837 837 837 837
835 835 835 835 835 835 835 835 835 835 835 835 835 835 835 835 835 835 835 835
833 832 832 833 832 832 832 832 832 832 832 832 832 832 832 832 832 832 832 832 832 832 832 Base of Slurry Wall831 831 831 831 831 831 831 831 831 831 831 831 831 831 831 831 831 831 831 831 831 831 831 Approx Top of Intermediate Zone829 829 829 829 829 829 829 829 829 829 829 829 829 829 829 829 829 829 829 829
827 827 827 827 827 827 827 827 827 827 827 827 827 827 827 827 827 827 827 827
825 825 825 825 825 825 825 825 825 825 825 825 825 825 825 825 825 825 825 825 825 825
823 823 823 823 823 823 823 823 823 823 823 823 823 823 823 823 823 823 823 823
821 821 821 821 821 821 821 821 821 821 821 821 821 821 821 821 821 821 821 821
819 819 819 819 819 819 819 819 819 819 819 819 819 819 819 819 819 819 819 819
817 817 817 817 817 817 817 817 817 817 817 817 817 817 817 817 817 817 817 817
815 815 815 815 815 815 815 815 815 815 815 815 815 815 815 815 815 815 815 815
813 813 813 813 813 813 813 813 813 813 813 813 813 813 813 813 813 813 813 813
811 811 811 811 811 811 811 811 811 811 811 811 811 811 811 811 811 811 811 811
809 809 809 809 809 809 809 809 809 809 809 809 809 809 809 809 809 809 809 809
807 807 807 807 807 807 807 807 807 807 807 807 807 807 807 807 807 807 807 807
805 805 805 805 805 805 805 805 805 805 805 805 805 805 805 805 805 805 805 805
803 803 803 803 803 803 803 803 803 803 803 803 803 803 803 803 803 803 803 803 803 803 803 Approx Top of Deep Zone801 801 801 801 801 801 801 801 801 801 801 801 801 801 801 801 801 801 801 801
799 799 799 799 799 799 799 799 799 799 799 799 799 799 799 799 799 799 799 799
797 797 797 797 797 797 797 797 797 797 797 797 797 797 797 797 797 797 797 797
795 795 795 795 795 795 795 795 795 795 795 795 795 795 795 795 795 795 795 795
793 793 793 793 793 793 793 793 793 793 793 793 793 793 793 793 793 793 793 793
791 791 791 791 791 791 791 791 791 791 791 791 791 791 791 791 791 791 791 791
789 789 789 789 789 789 789 789 789 789 789 789 789 789 789 789 789 789 789 789
787 787 787 787 787 787 787 787 787 787 787 787 787 787 787 787 787 787 787 787
785 785 785 785 785 785 785 785 785 785 785 785 785 785 785 785 785 785 785 785
783 783 783 783 783 783 783 783 783 783 783 783 783 783 783 783 783 783 783 783
781 781 781 781 781 781 781 781 781 781 781 781 781 781 781 781 781 781 781 781
779 779 779 779 779 779 779 779 779 779 779 779 779 779 779 779 779 779 779 779
777 777 777 777 777 777 777 777 777 777 777 777 777 777 777 777 777 777 777 777
775 775 775 775 775 775 775 775 775 775 775 775 775 775 775 775 775 775 775 775
773 773 773 773 773 773 773 773 773 773 773 773 773 773 773 773 773 773 773 773
771 771 771 771 771 771 771 771 771 771 771 771 771 771 771 771 771 771 771 771
769 769 769 769 769 769 769 769 769 769 769 769 769 769 769 769 769 769 769 769
767 767 767 767 767 767 767 767 767 767 767 767 767 767 767 767 767 767 767 767
765 765 765 765 765 765 765 765 765 765 765 765 765 765 765 765 765 765 765 765
763 763 763 763 763 763 763 763 763 763 763 763 763 763 763 763 763 763 763 763
761 761 761 761 761 761 761 761 761 761 761 761 761 761 761 761 761 761 761 761
759 759 759 759 759 759 759 759 759 759 759 759 759 759 759 759 759 759 759 759
757 757 757 757 757 757 757 757 757 757 757 757 757 757 757 757 757 757 757 757
755 755 755 755 755 755 755 755 755 755 755 755 755 755 755 755 755 755 755 755
753 753 753 753 753 753 753 753 753 753 753 753 753 753 753 753 753 753 753 753
751 751 751 751 751 751 751 751 751 751 751 751 751 751 751 751 751 751 751 751
749 749 749 749 749 749 749 749 749 749 749 749 749 749 749 749 749 749 749 749
747 747 747 747 747 747 747 747 747 747 747 747 747 747 747 747 747 747 747 747
ShallowIntermediateDeep


SW-11Not used
300B(Intermediate)
220(Deep)
300C(Deep)
300A
SW-12
MW-313
MW-312(Deep)
MW-311
MW-310
MW-309
MW-308
MW-307
MW-306
MW-305
MW-304
MW-303
MW-302
MW-301
£
0 30 60
Scale (ft)
Clare Water Treatment SiteClare, Michigan
GSI Job No.
Issued:
Drawn by:
Chk'd by:
Appv'd by:
MV
MV
MV
Legend
MannKendall Trend Vinyl Chloride
Permeable Reactive Barrier
TEMPORAL TREND RESULTS: VINYL CHLORIDE
PRB AREA
Figure 4
Notes: 1. Concentration trends were determined for vinyl chloride data between 1999 and November 2006.2. All wells screened in shallow zone of aquifer except locations indicated.3. Data source Progressive Environmental and Construction, August 2006.
Decreasing
03/22/2007
G-3138-105
Groundwater FlowDirection
Stable
Increasing
# No Trend
Non Detect
Probably Decreasing

$+
$+
$+
$+$+ $+
$+
$+
$+
$+$+$+
$+
$+
$+
$+
$+
$+
$+
SW-11
300B(Intermediate)
220(Deep)
300C(Deep)
300A
SW-12
MW-313
MW-312(Deep)
MW-311
MW-310
MW-309
MW-308
MW-307
MW-306
MW-305
MW-304
MW-303
MW-302
MW-301
£
0 30 60
Scale (ft)
Clare Water Treatment SiteClare, Michigan
GSI Job No.
Issued:
Drawn by:
Chk'd by:
Appv'd by:
MV
MV
MV
Legend
Permeable Reactive Barrier
WELL SUFFICIENCYVINYL CHLORIDE
PRB AREA
Figure 5
Notes: 1. Average concentrations for wells 1999-2006.2. CUO = 0.015 mg/L; MCL = 0.002 mg/L. 3. All wells screened in shallow zone of aquifer except locations indicated.4. Data source Progressive Environmental and Construction, August 2006.
03/22/2007
G-3138-105
Average ConcentrationVinyl Chloride
Area South of PRBNot Delineated to CUOfor Shallow GW
$+ 0.000946 - 0.001 mg/L
$+ 0.001 - 0.002 mg/L
$+ 0.002 - 0.01 mg/L
$+ 0.01 - 0.015 mg/L
$+ 0.015 - 0.925 mg/L

!?
")
")
")!? ")
")
")
")
")")")
")
")
")
")
")
!?
!?
SW-11Not used
300B(Intermediate)
220(Deep)
300C(Deep)
300A
SW-12
MW-313
MW-312(Deep)
MW-311
MW-310
MW-309
MW-308
MW-307
MW-306
MW-305
MW-304
MW-303
MW-302
MW-301
£
0 30 60
Scale (ft)
Clare Water Treatment SiteClare, Michigan
GSI Job No.
Issued:
Drawn by:
Chk'd by:
Appv'd by:
MV
MV
MV
Legend
FINAL RECOMMENDED MONITORING NETWORK
PRB AREA
Figure 6
Notes: 1. Analysis was conducted for vinyl chloride data between 1999 and 2006.2. All wells screened in shallow zone of aquifer except locations indicated.3. Data source Progressive Environmental and Construction, August 2006.
Permeable Reactive Barrier
G-3138-105
03/22/2007
Recommended Sample Frequency
!? Exclude
") Biennial
") Annual
") Semiannual


SW-11Not used
215(Intermediate)
104(Intermediate)
(Insufficient Data)
SW-9
SW-5
UMW-1S
UMW-1D(Deep)
DMW-3S
DMW-3D(Deep)
DMW-2S
DMW-2D(Deep)
DMW-1S
DMW-1D(Deep)*
£
0 60 120
Scale (ft)
Clare Water SupplyClare, Michigan
GSI Job No.
Issued:
Drawn by:
Chk'd by:
Appv'd by:
MV
Legend
TEMPORAL TRENDRESULTS: TCE
SOIL REMEDY AREA
Figure 8
Notes: 1. Trends were determined for trichloroethene data between 1999 and 2006.2. All wells screened in shallow zone of aquifer except locations indicated.3. Data source Progressive Environmental and Construction, August 2006.4. *Well DMW-1D had one detection of TCE that was not reproduced -- well may be non-detect for TCE.
Shallow Flow
Soil Remedy Cell
Mann-Kendall TrendTrichloroethene
Decreasing
Probably Decreasing
Stable
Probably Increasing
Increasing
No Trend
Non detect
G-3138-105
MV
MV
03/22/2007
Deep Flow
Intermediate Flow

’
")
")
")
")
")
")
")
!.
’
")
")
215
104(Intermediate)
(Insufficient Data)
SW-9
SW-5
UMW-1S
UMW-1D(Deep)
DMW-3S
DMW-3D(Deep)
DMW-2S
DMW-2D(Deep)
DMW-1S
DMW-1D(Deep)
£
0 60 120
Scale (ft)
Clare Water SupplyClare, Michigan
GSI Job No.
Issued:
Drawn by:
Chk'd by:
Appv'd by:
MV
MV
MV
Legend
FINAL RECOMMENDEDMONITORING NETWORK
SOIL REMEDY AREA
Figure 9
Notes: 1. Results represent a combination of qualitative and quantitative methods. See text for details.2. Analysis was conducted for trichloroethene data between 1999 and 2006.3. Data source Progressive Environmental and Construction, August 2006.
Soil Remedy Cell
Recommended Sampling Frequency
") Annual
") Biennial
G-3138-105
03/22/2007
Area of potentialnew shallow well
Shallow Flow
Intermediate Flow
Deep Flow
Area of potentialnews Intermediate wells(nested with shallow wells)
Area of potentialnew Deep well
!. Exclude
") Semiannual
’ Not Analyzed

Attachment A
Geologic Cross-Sections


Attachment B
MAROS 2.2 Methodology

ATTACHMENT B
MAROS 2.2 METHODOLOGY
Contents 1.0 MAROS Conceptual Model.................................................................................... 1 2.0 Data Management .................................................................................................. 2 3.0 Site Details.............................................................................................................. 2 4.0 Constituent Selection ............................................................................................ 3 5.0 Data Consolidation ................................................................................................ 3 6.0 Overview Statistics: Plume Trend Analysis ........................................................ 3 6.1 Mann-Kendall Analysis................................................................................. 4 6.2 Linear Regression Analysis.......................................................................... 4 6.3 Overall Plume Analysis ................................................................................ 5 6.4 Moment Analysis .......................................................................................... 6 7.0 Detailed Statistics: Optimization Analysis .......................................................... 8 7.1 Well Redundancy Analysis- Delaunay Method ............................................ 8 7.2 Well Sufficiency Analysis - Delaunay Method .............................................. 9 7.3 Sampling Frequency - Modified CES Method ............................................ 10 7.4 Data Sufficiency – Power Analysis............................................................. 11 Cited References Tables Table 1 Mann-Kendall Analysis Decision Matrix
Table 2 Linear Regression Analysis Decision Matrix Figures Figure 1 MAROS Decision Support Tool Flow Chart Figure 2 MAROS Overview Statistics Trend Analysis Methodology Figure 3 Decision Matrix for Determining Provisional Frequency

GSI Job No. G-3138-105 November 8, 2006
Attachment B MAROS 2.2 Methodology
1
MAROS METHODOLOGY MAROS is a collection of tools in one software package that is used in an explanatory, non-linear but linked fashion. The tool includes models, statistics, heuristic rules, and empirical relationships to assist the user in optimizing a groundwater monitoring network system. The final optimized network maintains adequate delineation while providing information on plume dynamics over time. Results generated from the software tool can be used to develop lines of evidence, which, in combination with expert opinion, can be used to inform regulatory decisions for safe and economical long-term monitoring of groundwater plumes. For a detailed description of the structure of the software and further utilities, refer to the MAROS 2.2 Manual (AFCEE, 2003; http://www.gsi-net.com/software/MAROS_V2_1Manual.pdf) and Aziz et al., 2003. 1.0 MAROS Conceptual Model In MAROS 2.2, two levels of analysis are used for optimizing long-term monitoring plans: 1) an overview statistical evaluation with interpretive trend analysis based on temporal trend analysis and plume stability information; and 2) a more detailed statistical optimization based on spatial and temporal redundancy reduction methods (see Figures A.1 and A.2 for further details). In general, the MAROS method applies to 2-D aquifers that have relatively simple site hydrogeology. However, for a multi-aquifer (3-D) system, the user has the option to apply the statistical analysis layer-by-layer. The overview statistics or interpretive trend analysis assesses the general monitoring system category by considering individual well concentration trends, overall plume stability, hydrogeologic factors (e.g., seepage velocity, and current plume length), and the location of potential receptors (e.g., property boundaries or drinking water wells). The method relies on temporal trend analysis to assess plume stability, which is then used to determine the general monitoring system category. Since the monitoring system category is evaluated for both source and tail regions of the plume, the site wells are divided into two different zones: the source zone and the tail zone. Source zone monitoring wells could include areas with non-aqueous phase liquids (NAPLs), contaminated vadose zone soils, and areas where aqueous-phase releases have been introduced into ground water. The source zone generally contains locations with historical high ground water concentrations of the COCs. The tail zone is usually the area downgradient of the contaminant source zone. Although this classification is a simplification of the plume conceptual model, this broadness makes the user aware on an individual well basis that the concentration trend results can have a different interpretation depending on the well location in and around the plume. The location and type of the individual wells allows further interpretation of the trend results, depending on what type of well is being analyzed (e.g., remediation well, leading plume edge well, or monitoring well). General recommendations for the monitoring network frequency and density are suggested based on heuristic rules applied to the source and tail trend results.

GSI Job No. G-3138-105 November 8, 2006
Attachment B MAROS 2.2 Methodology
2
The detailed statistics level of analysis or sampling optimization consists of well redundancy and well sufficiency analyses using the Delaunay method, a sampling frequency analysis using the Modified Cost Effective Sampling (MCES) method and a data sufficiency analysis including statistical power analysis. The well redundancy analysis is designed to minimize monitoring locations and the Modified CES method is designed to minimize the frequency of sampling. The data sufficiency analysis uses simple statistical methods to assess the sampling record to determine if groundwater concentrations are statistically below target levels and if the current monitoring network and record is sufficient in terms of evaluating concentrations at downgradient locations. 2.0 Data Management In MAROS, ground water monitoring data can be imported from simple database-format Microsoft® Excel spreadsheets, Microsoft Access tables, previously created MAROS database archive files, or entered manually. Monitoring data interpretation in MAROS is based on historical analytical data from a consistent set of wells over a series of sampling events. The analytical data is composed of the well name, coordinate location, constituent, result, detection limit and associated data qualifiers. Statistical validity of the concentration trend analysis requires constraints on the minimum data input of at least four wells (ASTM 1998) in which COCs have been detected. Individual sampling locations need to include data from at least six most-recent sampling events. To ensure a meaningful comparison of COC concentrations over time and space, both data quality and data quantity need to be considered. Prior to statistical analysis, the user can consolidate irregularly sampled data or smooth data that might result from seasonal fluctuations or a change in site conditions. Because MAROS is a terminal analytical tool designed for long-term planning, impacts of seasonal variation in the water unit are treated on a broad scale, as they relate to multi-year trends. Imported ground water monitoring data and the site-specific information entered in Site Details can be archived and exported as MAROS archive files. These archive files can be appended as new monitoring data becomes available, resulting in a dynamic long-term monitoring database that reflects the changing conditions at the site (i.e. biodegradation, compliance attainment, completion of remediation phase, etc.). For wells with a limited monitoring history, addition of information as it becomes available can change the frequency or identity of wells in the network. 3.0 Site Details Information needed for the MAROS analysis includes site-specific parameters such as seepage velocity and current plume length and width. Information on the location of potential receptors relative to the source and tail regions of the plume is entered at this point. Part of the trend analysis methodology applied in MAROS focuses on where the monitoring well is located, therefore the user needs to divide site wells into two different zones: the source zone or the tail zone. Although this classification is a simplification of the well function, this broadness makes the user aware on an individual well basis that the concentration trend results can have a different interpretation depending on the well location in and around the plume. It is up to the user to make further interpretation of the

GSI Job No. G-3138-105 November 8, 2006
Attachment B MAROS 2.2 Methodology
3
trend results, depending on what type of well is being analyzed (e.g., remediation well, leading plume edge well, or monitoring well). The Site Details section of MAROS contains a preliminary map of well locations to confirm well coordinates. 4.0 Constituent Selection A database with multiple COCs can be entered into the MAROS software. MAROS allows the analysis of up to 5 COCs concurrently and users can pick COCs from a list of compounds existing in the monitoring data. MAROS runs separate optimizations for each compound. For sites with a single source, the suggested strategy is to choose one to three priority COCs for the optimization. If, for example, the site contains multiple chlorinated volatile organic compounds (VOCs), the standard sample chemical analysis will evaluate all VOCs, so the sample locations and frequency should based on the concentration trends of the most prevalent, toxic or mobile compounds. If different chemical classes are present, such as metals and chlorinated VOCs, choose and evaluate the priority constituent in each chemical class. MAROS includes a short module that provides recommendations on prioritizing COCs based on toxicity, prevalence, and mobility of the compound. The toxicity ranking is determined by examining a representative concentration for each compound for the entire site. The representative concentration is then compared to the screening level (PRG or MCL) for that compound and the COCs are ranked according to the representative concentrations percent exceedence of the screening level. The evaluation of prevalence is performed by determining a representative concentration for each well location and evaluating the total exceedences (values above screening levels) compared to the total number of wells. Compounds found over screening levels are ranked for mobility based on Kd (sorption partition coefficient). The MAROS COC assessment provides the relative ranking of each COC, but the user must choose which COCs are included in the analysis. 5.0 Data Consolidation Typically, raw data from long-term monitoring have been measured irregularly in time or contain many non-detects, trace level results, and duplicates. Therefore, before the data can be further analyzed, raw data are filtered, consolidated, transformed, and possibly smoothed to allow for a consistent dataset meeting the minimum data requirements for statistical analysis mentioned previously. MAROS allows users to specify the period of interest in which data will be consolidated (i.e., monthly, bi-monthly, quarterly, semi-annual, yearly, or a biennial basis). In computing the representative value when consolidating, one of four statistics can be used: median, geometric mean, mean, and maximum. Non-detects can be transformed to one half the reporting or method detection limit (DL), the DL, or a fraction of the DL. Trace level results can be represented by their actual values, one half of the DL, the DL, or a fraction of their actual values. Duplicates are reduced in MAROS by one of three ways: assigning the average, maximum, or first value. The reduced data for each COC

GSI Job No. G-3138-105 November 8, 2006
Attachment B MAROS 2.2 Methodology
4
and each well can be viewed as a time series in a graphical form on a linear or semi-log plot generated by the software. 6.0 Overview Statistics: Plume Trend Analysis Within the MAROS software there are historical data analyses that support a conclusion about plume stability (e.g., increasing plume, etc.) through statistical trend analysis of historical monitoring data. Plume stability results are assessed from time-series concentration data with the application of three statistical tools: Mann-Kendall Trend analysis, linear regression trend analysis and moment analysis. The two trend methods are used to estimate the concentration trend for each well and each COC based on a statistical trend analysis of concentrations versus time at each well. These trend analyses are then consolidated to give the user a general plume stability estimate and general monitoring frequency and density recommendations (see Figures A.1 through A.3 for further step-by-step details). Both qualitative and quantitative plume information can be gained by these evaluations of monitoring network historical data trends both spatially and temporally. The MAROS Overview Statistics are the foundation the user needs to make informed optimization decisions at the site. The Overview Statistics are designed to allow site personnel to develop a better understanding of the plume behavior over time and understand how the individual well concentration trends are spatially distributed within the plume. This step allows the user to gain information that will support a more informed decision to be made in the next level or detailed statistics optimization analysis. 6.1 Mann-Kendall Analysis The Mann-Kendall test is a statistical procedure that is well suited for analyzing trends in data over time. The Mann-Kendall test can be viewed as a non-parametric test for zero slope of the first-order regression of time-ordered concentration data versus time. One advantage of the Mann-Kendall test is that it does not require any assumptions as to the statistical distribution of the data (e.g. normal, lognormal, etc.) and can be used with data sets which include irregular sampling intervals and missing data. The Mann-Kendall test is designed for analyzing a single groundwater constituent, multiple constituents are analyzed separately. The Mann-Kendall S statistic measures the trend in the data: positive values indicate an increase in concentrations over time and negative values indicate a decrease in concentrations over time. The strength of the trend is proportional to the magnitude of the Mann-Kendall statistic (i.e., a large value indicates a strong trend). The confidence in the trend is determined by consulting the S statistic and the sample size, n, in a Kendall probability table such as the one reported in Hollander and Wolfe (1973).
The concentration trend is determined for each well and each COC based on results of the S statistic, the confidence in the trend, and the Coefficient of Variation (COV). The decision matrix for this evaluation is shown in Table 3. A Mann-Kendall statistic that is greater than 0 combined with a confidence of greater than 95% is categorized as an Increasing trend while a Mann-Kendall statistic of less than 0 with a confidence between 90% and 95% is defined as a probably Increasing trend, and so on.

GSI Job No. G-3138-105 November 8, 2006
Attachment B MAROS 2.2 Methodology
5
Depending on statistical indicators, the concentration trend is classified into six categories:
• Decreasing (D), • Probably Decreasing (PD), • Stable (S), • No Trend (NT), • Probably Increasing (PI) • Increasing (I).
These trend estimates are then analyzed to identify the source and tail region overall stability category (see Figure 2 for further details). 6.2 Linear Regression Analysis Linear Regression is a parametric statistical procedure that is typically used for analyzing trends in data over time. Using this type of analysis, a higher degree of scatter simply corresponds to a wider confidence interval about the average log-slope. Assuming the sign (i.e., positive or negative) of the estimated log-slope is correct, a level of confidence that the slope is not zero can be easily determined. Thus, despite a poor goodness of fit, the overall trend in the data may still be ascertained, where low levels of confidence correspond to “Stable” or “No Trend” conditions (depending on the degree of scatter) and higher levels of confidence indicate the stronger likelihood of a trend. The linear regression analysis is based on the first-order linear regression of the log-transformed concentration data versus time. The slope obtained from this log-transformed regression, the confidence level for this log-slope, and the COV of the untransformed data are used to determine the concentration trend. The decision matrix for this evaluation is shown in Table 4. To estimate the confidence in the log-slope, the standard error of the log-slope is calculated. The coefficient of variation, defined as the standard deviation divided by the average, is used as a secondary measure of scatter to distinguish between “Stable” or “No Trend” conditions for negative slopes. The Linear Regression Analysis is designed for analyzing a single groundwater constituent; multiple constituents are analyzed separately, (up to five COCs simultaneously). For this evaluation, a decision matrix developed by Groundwater Services, Inc. is also used to determine the “Concentration Trend” category (plume stability) for each well. Depending on statistical indicators, the concentration trend is classified into six categories:
• Decreasing (D), • Probably Decreasing (PD), • Stable (S), • No Trend (NT), • Probably Increasing (PI) • Increasing (I).

GSI Job No. G-3138-105 November 8, 2006
Attachment B MAROS 2.2 Methodology
6
The resulting confidence in the trend, together with the log-slope and the COV of the untransformed data, are used in the linear regression analysis decision matrix to determine the concentration trend. For example, a positive log-slope with a confidence of less than 90% is categorized as having No Trend whereas a negative log-slope is considered Stable if the COV is less than 1 and categorized as No Trend if the COV is greater than 1. 6.3 Overall Plume Analysis General recommendations for the monitoring network frequency and density are suggested based on heuristic rules applied to the source and tail trend results. Individual well trend results are consolidated and weighted by the MAROS according to user input, and the direction and strength of contaminant concentration trends in the source zone and tail zone for each COC are determined. Based on
i) the consolidated trend analysis, ii) hydrogeologic factors (e.g., seepage velocity), and iii) location of potential receptors (e.g., wells, discharge points, or property
boundaries), the software suggests a general optimization plan for the current monitoring system in order to efficiently but effectively monitor groundwater in the future. A flow chart utilizing the trend analysis results and other site-specific parameters to form a general sampling frequency and well density recommendation is outlined in Figure 2. For example, a generic plan for a shrinking petroleum hydrocarbon plume (BTEX) in a slow hydrogeologic environment (silt) with no nearby receptors would entail minimal, low frequency sampling of just a few indicators. On the other hand, the generic plan for a chlorinated solvent plume in a fast hydrogeologic environment that is expanding but has very erratic concentrations over time would entail more extensive, higher frequency sampling. The generic plan is based on a heuristically derived algorithm for assessing future sampling duration, location and density that takes into consideration plume stability. For a detailed description of the heuristic rules used in the MAROS software, refer to the MAROS 2.2Manual (AFCEE, 2003). 6.4 Moment Analysis An analysis of moments can help resolve plume trends, where the zeroth moment shows change in dissolved mass vs. time, the first moment shows the center of mass location vs. time, and the second moment shows the spread of the plume vs. time. Moment calculations can predict how the plume will change in the future if further statistical analysis is applied to the moments to identify a trend (in this case, Mann Kendall Trend Analysis is applied). The trend analysis of moments can be summarized as:
• Zeroth Moment: An estimate of the total mass of the constituent for each sample event
• First Moment: An estimate of the center of mass for each sample event • Second Moment: An estimate of the spread of the plume around the center of
mass

GSI Job No. G-3138-105 November 8, 2006
Attachment B MAROS 2.2 Methodology
7
The role of moment analysis in MAROS is to provide a relative estimate of plume stability and condition within the context of results from other MAROS modules. The Moment analysis algorithms in MAROS are simple approximations of complex calculations and are meant to estimate changes in total mass, center of mass and spread of mass for complex well networks. The Moment Analysis module is sensitive to the number and arrangement of wells in each sampling event, so, changes in the number and identity of wells during monitoring events, and the parameters chosen for data consolidation can cause changes in the estimated moments. Plume stability may vary by constituent, therefore the MAROS Moment analysis can be used to evaluate multiple COCs simultaneously which can be used to provide a quick way of comparing individual plume parameters to determine the size and movement of constituents relative to one another. Moment analysis in the MAROS software can also be used to assist the user in evaluating the impact on plume delineation in future sampling events by removing identified “redundant” wells from a long-term monitoring program (this analysis was not performed as part of this study, for more details on this application of moment analysis refer to the MAROS Users Manual (AFCEE, 2003)). The zeroth moment is the sum of concentrations for all monitoring wells and is a mass estimate. The zeroth moment calculation can show high variability over time, largely due to the fluctuating concentrations at the most contaminated wells as well as varying monitoring well network. Plume analysis and delineation based exclusively on concentration can exhibit fluctuating temporal and spatial values. The mass estimate is also sensitive to the extent of the site monitoring well network over time. The zeroth moment trend over time is determined by using the Mann-Kendall Trend Methodology. The zeroth Moment trend test allows the user to understand how the plume mass has changed over time. Results for the trend include: Increasing, probably Increasing, no trend, stable, probably decreasing, decreasing or not applicable (N/A) (Insufficient Data). When considering the results of the zeroth moment trend, the following factors should be considered which could effect the calculation and interpretation of the plume mass over time: 1) Change in the spatial distribution of the wells sampled historically 2) Different wells sampled within the well network over time (addition and subtraction of well within the network). 3) Adequate versus inadequate delineation of the plume over time The first moment estimates the center of mass, coordinates (Xc and Yc) for each sample event and COC. The changing center of mass locations indicate the movement of the center of mass over time. Whereas, the distance from the original source location to the center of mass locations indicate the movement of the center of mass over time relative to the original source. Calculation of the first moment normalizes the spread by the concentration indicating the center of mass. The first moment trend of the distance to the center of mass over time shows movement of the plume in relation to the original source location over time. Analysis of the movement of mass should be viewed as it relates to 1) the original source location of contamination 2) the direction of groundwater flow and/or 3) source removal or remediation. Spatial and temporal trends in the center of mass can indicate spreading or shrinking or transient movement based on season variation in rainfall or other hydraulic considerations. No appreciable movement or a neutral trend in the center of mass would indicate plume stability. However, changes in

GSI Job No. G-3138-105 November 8, 2006
Attachment B MAROS 2.2 Methodology
8
the first moment over time do not necessarily completely characterize the changes in the concentration distribution (and the mass) over time. Therefore, in order to fully characterize the plume the First Moment trend should be compared to the zeroth moment trend (mass change over time). The second moment indicates the spread of the contaminant about the center of mass (Sxx and Syy), or the distance of contamination from the center of mass for a particular COC and sample event. The Second Moment represents the spread of the plume over time in both the x and y directions. The Second Moment trend indicates the spread of the plume about the center of mass. Analysis of the spread of the plume should be viewed as it relates to the direction of groundwater flow. An Increasing trend in the second moment indicates an expanding plume, whereas a declining trend in the second moment indicates a shrinking plume. No appreciable movement or a neutral trend in the center of mass would indicate plume stability. The second moment provides a measure of the spread of the concentration distribution about the plume’s center of mass. However, changes in the second moment over time do not necessarily completely characterize the changes in the concentration distribution (and the mass) over time. Therefore, in order to fully characterize the plume the Second Moment trend should be compared to the zeroth moment trend (mass change over time). 7.0 Detailed Statistics: Optimization Analysis Although the overall plume analysis shows a general recommendation regarding sampling frequency reduction and a general sampling density, a more detailed analysis is also available with the MAROS 2.2 software in order to allow for further reductions on a well-by-well basis for frequency, well redundancy, well sufficiency and sampling sufficiency. The MAROS Detailed Statistics allows for a quantitative analysis for spatial and temporal optimization of the well network on a well-by-well basis. The results from the Overview Statistics should be considered along with the MAROS optimization recommendations gained from the Detailed Statistical Analysis described previously. The MAROS Detailed Statistics results should be reassessed in view of site knowledge and regulatory requirements as well as in consideration of the Overview Statistics (Figure 2). The Detailed Statistics or Sampling Optimization MAROS modules can be used to determine the minimal number of sampling locations and the lowest frequency of sampling that can still meet the requirements of sampling spatially and temporally for an existing monitoring program. It also provides an analysis of the sufficiency of data for the monitoring program. Sampling optimization in MAROS consists of four parts:
• Well redundancy analysis using the Delaunay method • Well sufficiency analysis using the Delaunay method • Sampling frequency determination using the Modified CES method • Data sufficiency analysis using statistical power analysis.

GSI Job No. G-3138-105 November 8, 2006
Attachment B MAROS 2.2 Methodology
9
The well redundancy analysis using the Delaunay method identifies and eliminates redundant locations from the monitoring network. The well sufficiency analysis can determine the areas where new sampling locations might be needed. The Modified CES method determines the optimal sampling frequency for a sampling location based on the direction, magnitude, and uncertainty in its concentration trend. The data sufficiency analysis examines the risk-based site cleanup status and power and expected sample size associated with the cleanup status evaluation. 7.1 Well Redundancy Analysis – Delaunay Method The well redundancy analysis using the Delaunay method is designed to select the minimum number of sampling locations based on the spatial analysis of the relative importance of each sampling location in the monitoring network. The approach allows elimination of sampling locations that have little impact on the historical characterization of a contaminant plume. An extended method or wells sufficiency analysis, based on the Delaunay method, can also be used for recommending new sampling locations. Details about the Delaunay method can be found in Appendix A.2 of the MAROS Manual (AFCEE, 2003). Sampling Location determination uses the Delaunay triangulation method to determine the significance of the current sampling locations relative to the overall monitoring network. The Delaunay method calculates the network Area and Average concentration of the plume using data from multiple monitoring wells. A slope factor (SF) is calculated for each well to indicate the significance of this well in the system (i.e. how removing a well changes the average concentration.) The Sampling Location optimization process is performed in a stepwise fashion. Step one involves assessing the significance of the well in the system, if a well has a small SF (little significance to the network), the well may be removed from the monitoring network. Step two involves evaluating the information loss of removing a well from the network. If one well has a small SF, it may or may not be eliminated depending on whether the information loss is significant. If the information loss is not significant, the well can be eliminated from the monitoring network and the process of optimization continues with fewer wells. However if the well information loss is significant then the optimization terminates. This sampling optimization process allows the user to assess “redundant” wells that will not incur significant information loss on a constituent-by-constituent basis for individual sampling events. 7.2 Well Sufficiency Analysis – Delaunay Method The well sufficiency analysis, using the Delaunay method, is designed to recommend new sampling locations in areas within the existing monitoring network where there is a high level of uncertainty in contaminant concentration. Details about the well sufficiency analysis can be found in Appendix A.2 of the MAROS Manual (AFCEE, 2003). In many cases, new sampling locations need to be added to the existing network to enhance the spatial plume characterization. If the MAROS algorithm calculates a high

GSI Job No. G-3138-105 November 8, 2006
Attachment B MAROS 2.2 Methodology
10
level of uncertainty in predicting the constituent concentration for a particular area, a new sampling location is recommended. The Slope Factor (SF) values obtained from the redundancy evaluation described above are used to calculate the concentration estimation error for each triangle area formed in the Delaunay triangulation. The estimated SF value for each area is then classified into four levels: Small, Moderate, Large, or Extremely large (S, M, L, E) because the larger the estimated SF value, the higher the estimation error at this area. Therefore, the triangular areas with the estimated SF value at the Extremely large or Large level can be candidate regions for new sampling locations. The results from the Delaunay method and the method for determining new sampling locations are derived solely from the spatial configuration of the monitoring network and the spatial pattern of the contaminant plume. No parameters such as the hydrogeologic conditions are considered in the analysis. Therefore, professional judgment and regulatory considerations must be used to make final decisions. 7.3 Sampling Frequency Determination - Modified CES Method The Modified CES method optimizes sampling frequency for each sampling location based on the magnitude, direction, and uncertainty of its concentration trend derived from its recent and historical monitoring records. The Modified Cost Effective Sampling (MCES) estimates a conservative lowest-frequency sampling schedule for a given groundwater monitoring location that still provides needed information for regulatory and remedial decision-making. The MCES method was developed on the basis of the Cost Effective Sampling (CES) method developed by Ridley et al (1995). Details about the MCES method can be found in Appendix A.9 of the MAROS Manual (AFCEE, 2003). In order to estimate the least frequent sampling schedule for a monitoring location that still provides enough information for regulatory and remedial decision-making, MCES employs three steps to determine the sampling frequency. The first step involves analyzing frequency based on recent trends. A preliminary location sampling frequency (PLSF) is developed based on the rate of change of well concentrations calculated by linear regression along with the Mann-Kendall trend analysis of the most recent monitoring data (see Figure 3). The variability within the sequential sampling data is accounted for by the Mann-Kendall analysis. The rate of change vs. trend result matrix categorizes wells as requiring annual, semi-annual or quarterly sampling. The PLSF is then reevaluated and adjusted based on overall trends. If the long-term history of change is significantly greater than the recent trend, the frequency may be reduced by one level. The final step in the analysis involves reducing frequency based on risk, site-specific conditions, regulatory requirements or other external issues. Since not all compounds in the target being assessed are equally harmful, frequency is reduced by one level if recent maximum concentration for a compound of high risk is less than 1/2 of the Maximum Concentration Limit (MCL). The result of applying this method is a suggested sampling frequency based on recent sampling data trends and overall sampling data trends and expert judgment.

GSI Job No. G-3138-105 November 8, 2006
Attachment B MAROS 2.2 Methodology
11
The final sampling frequency determined from the MCES method can be Quarterly, Semiannual, Annual, or Biennial. Users can further reduce the sampling frequency to, for example, once every three years, if the trend estimated from Biennial data (i.e., data drawn once every two years from the original data) is the same as that estimated from the original data. 7.4 Data Sufficiency Analysis – Power Analysis The MAROS Data Sufficiency module employs simple statistical methods to evaluate whether the collected data are adequate both in quantity and in quality for revealing changes in constituent concentrations. The first section of the module evaluates individual well concentrations to determine if they are statistically below a target screening level. The second section includes a simple calculation for estimating projected groundwater concentrations at a specified point downgradient of the plume. A statistical Power analysis is then applied to the projected concentrations to determine if the downgradient concentrations are statistically below the cleanup standard. If the number of projected concentrations is below the level to provide statistical significance, then the number of sample events required to statistically confirm concentrations below standards is estimated from the Power analysis. Before testing the cleanup status for individual wells, the stability or trend of the contaminant plume should be evaluated. Only after the plume has reached stability or is reliably diminishing can we conduct a test to examine the cleanup status of wells. Applying the analysis to wells in an expanding plume may cause incorrect conclusions and is less meaningful. Statistical power analysis is a technique for interpreting the results of statistical tests. The Power of a statistical test is a measure of the ability of the test to detect an effect given that the effect actually exists. The method provides additional information about a statistical test: 1) the power of the statistical test, i.e., the probability of finding a difference in the variable of interest when a difference truly exists; and 2) the expected sample size of a future sampling plan given the minimum detectable difference it is supposed to detect. For example, if the mean concentration is lower than the cleanup goal but a statistical test cannot prove this, the power and expected sample size can tell the reason and how many more samples are needed to result in a significant test. The additional samples can be obtained by a longer period of sampling or an increased sampling frequency. Details about the data sufficiency analysis can be found in Appendix A.6 of the MAROS Manual (AFCEE, 2003). When applying the MAROS power analysis method, a hypothetical statistical compliance boundary (HSCB) is assigned to be a line perpendicular to the groundwater flow direction (see figure below). Monitoring well concentrations are projected onto the HSCB using the distance from each well to the compliance boundary along with a decay coefficient. The projected concentrations from each well and each sampling event are then used in the risk-based power analysis. Since there may be more than one sampling event selected by the user, the risk-based power analysis results are given on an event-

GSI Job No. G-3138-105 November 8, 2006
Attachment B MAROS 2.2 Methodology
12
by-event basis. This power analysis can then indicate if target are statistically achieved at the HSCB. For instance, at a site where the historical monitoring record is short with few wells, the HSCB would be distant; whereas, at a site with longer duration of sampling with many wells, the HSCB would be close. Ultimately, at a site the goal would be to have the HSCB coincide with or be within the actual compliance boundary (typically the site property line).
In order to perform a risk-based cleanup status evaluation for the whole site, a strategy was developed as follows.
• Estimate concentration versus distance decay coefficient from plume centerline wells.
• Extrapolate concentration versus distance for each well using this decay coefficient.
• Comparing the extrapolated concentrations with the compliance concentration using power analysis.
Results from this analysis can be Attained or Not Attained, providing a statistical interpretation of whether the cleanup goal has been met on the site-scale from the risk-based point of view. The results as a function of time can be used to evaluate if the monitoring system has enough power at each step in the sampling record to indicate certainty of compliance by the plume location and condition relative to the compliance boundary. For example, if results are Not Attained at early sampling events but are Attained in recent sampling events, it indicates that the recent sampling record provides a powerful enough result to indicate compliance of the plume relative to the location of the receptor or compliance boundary.
Groundwater flow direction
“ HSCB”
The nearest downgradient receptor
Concentrations projected to this line

GSI Job No. G-3138-105 November 8, 2006
Attachment B MAROS 2.2 Methodology
13
CITED REFERENCES AFCEE 2003. Monitoring and Remediation Optimization System (MAROS) 2.1 Software Users Guide. Air Force Center for Environmental Excellence. http://www.gsi-net.com/software/MAROS_V2_1Manual.pdf AFCEE. 1997. Air Force Center for Environmental Excellence, AFCEE Long-Term Monitoring Optimization Guide, http://www.afcee.brooks.af.mil. Aziz, J. A., C. J. Newell, M. Ling, H. S. Rifai and J. R. Gonzales (2003). "MAROS: A Decision Support System for Optimizing Monitoring Plans." Ground Water 41(3): 355-367. Gilbert, R. O., 1987, Statistical Methods for Environmental Pollution Monitoring, Van Nostrand Reinhold, New York, NY, ISBN 0-442-23050-8. Hollander, M. and Wolfe, D. A. (1973). Nonparametric Statistical Methods, Wiley, New York, NY. Ridley, M.N. et al., 1995. Cost-Effective Sampling of Groundwater Monitoring Wells, the Regents of UC/LLNL, Lawrence Livermore National Laboratory. U.S. Environmental Protection Agency, 1992. Methods for Evaluating the Attainment of Cleanup Standards Volume 2: Ground Water. Weight, W. D. and J. L. Sonderegger (2001). Manual of Applied Field Hydrogeology. New York, NY, McGraw-Hill.

TABLE 1 Mann-Kendall Analysis Decision Matrix (Aziz, et. al., 2003)
Mann-Kendall Statistic
Confidence in the Trend
Concentration Trend
S > 0 > 95% Increasing
S > 0 90 - 95% Probably Increasing
S > 0 < 90% No Trend
S ≤ 0 < 90% and COV ≥ 1 No Trend
S ≤ 0 < 90% and COV < 1 Stable
S < 0 90 - 95% Probably Decreasing
S < 0 > 95% Decreasing
TABLE 2 Linear Regression Analysis Decision Matrix (Aziz, et. al., 2003)
Log-slope Confidence in the Trend Positive Negative
< 90% No Trend COV < 1 Stable
COV > 1 No Trend
90 - 95% Probably Increasing Probably Decreasing
> 95% Increasing Decreasing

MAROS: Decision Support Tool
MAROS is a collection of tools in one software package that is used in an explanatory, non-linear fashion. The tool includes models, geostatistics, heuristic rules, and empirical relationships to assist the user in optimizing a groundwater monitoring network system while maintaining adequate delineation of the plume as well as knowledge of the plume state over time. Different users utilize the tool in different ways and interpret the results from a different viewpoint.
Overview Statistics
What it is: Simple, qualitative and quantitative plume information can be gained through evaluation of monitoring network historical data trends both spatially and temporally. The MAROS Overview Statistics are the foundation the user needs to make informed optimization decisions at the site. What it does: The Overview Statistics are designed to allow site personnel to develop a better understanding of the plume behavior over time and understand how the individual well concentration trends are spatially distributed within the plume. This step allows the user to gain information that will support a more informed decision to be made in the next level of optimization analysis. What are the tools: Overview Statistics includes two analytical tools:
1) Trend Analysis: includes Mann-Kendall and Linear Regression statistics for individual wells and results in general heuristically-derived monitoring categories with a suggested sampling density and monitoring frequency.
2) Moment Analysis: includes dissolved mass estimation (0th Moment), center of mass (1st Moment), and
plume spread (2nd Moment) over time. Trends of these moments show the user another piece of information about the plume stability over time.
What is the product: A first-cut blueprint for a future long-term monitoring program that is intended to be a foundation for more detailed statistical analysis.
Detailed Statistics
What it is: The MAROS Detailed Statistics allows for a quantitative analysis for spatial and temporal optimization of the well network on a well-by-well basis. What it does: The results from the Overview Statistics should be considered along side the MAROS optimization recommendations gained from the Detailed Statistical Analysis. The MAROS Detailed Statistics results should be reassessed in view of site knowledge and regulatory requirements as well as the Overview Statistics. What are the tools: Detailed Statistics includes four analytical tools:
1) Sampling Frequency Optimization: uses the Modified CES method to establish a recommended future sampling frequency.
2) Well Redundancy Analysis: uses the Delaunay Method to evaluate if any wells within the monitoring
network are redundant and can be eliminated without any significant loss of plume information. 3) Well Sufficiency Analysis: uses the Delaunay Method to evaluate areas where new wells are
recommended within the monitoring network due to high levels of concentration uncertainty. 4) Data Sufficiency Analysis: uses Power Analysis to assess if the historical monitoring data record has
sufficient power to accurately reflect the location of the plume relative to the nearest receptor or compliance point.
What is the product: List of wells to remove from the monitoring program, locations where monitoring wells may need to be added, recommended frequency of sampling for each well, analysis if the overall system is statistically powerful to monitor the plume.
Figure 1. MAROS Decision Support Tool Flow Chart

Figure 2: MAROS Overview Statistics Trend Analysis Methodology

Figure 3. Decision Matrix for Determining Provisional Frequency (Figure A.3.1 of the
MAROS Manual (AFCEE 2003)

Attachment C
MAROS Reports

March 22, 2007
LONG-TERM MONITORING NETWORK OPTIMIZATION
PRB AND SOIL REMEDY AREAS
Clare Water Supply Superfund Site Clare, Michigan
ATTACHMENT C: MAROS Reports PRB Area: COC Assessment Report Mann-Kendall Reports Selected Wells (Including data from November 2006 monitoring event) Soil Remedy Area: COC Assessment Report Mann-Kendall Reports Selected Wells

MAROS COC AssessmentMVUser Name:
ClareLocation: MichiganState:
Clare Water SupplyProject:
Prevalence:
Mobility:
Toxicity:
VINYL CHLORIDE
Contaminants of Concern (COC's)
cis-1,2-DICHLOROETHYLENE
Contaminant of ConcernTotal Wells
Total Excedences
Total detectsClass
Percent Excedences
VINYL CHLORIDE ORG 16 1510 62.5%
cis-1,2-DICHLOROETHYLENE ORG 16 133 18.8%
Note: Top COCs by prevalence were determined by examining a representative concentration for each well location at the site. The total excedences (values above the chosen PRGs) are compared to the total number of wells to determine the prevalence of the compound.
Contaminant of Concern Kd
VINYL CHLORIDE 0.042
cis-1,2-DICHLOROETHYLENE 0.0724
Note: Top COCs by mobility were determined by examining each detected compound in the dataset and comparing their mobilities (Koc's for organics, assume foc = 0.001, and Kd's for metals).
Contaminant of Concern
Representative Concentration
(mg/L)PRG
(mg/L)
Percent Above PRG
VINYL CHLORIDE 1.2E-01 1.5E-02 713.2%
cis-1,2-DICHLOROETHYLENE 6.9E-02 6.1E-02 12.9%
Note: Top COCs by toxicity were determined by examining a representative concentration for each compound over the entire site. The compound representative concentrations are then compared with the chosen PRG for that compound, with the percentage excedence from the PRG determining the compound's toxicity. All compounds above exceed the PRG.
Tuesday, November 07, 2006 Page 1 of 1MAROS Version 2.2, 2006, AFCEE

Consolidation Period:
ND Values:J Flag Values :
No Time ConsolidationMedianConsolidation Type:
Duplicate Consolidation: AverageSpecified Detection Limit
Actual Value
Time Period: 3/23/1994 11/10/2006to
Well
Mann- Kendall Trend
Linear Regression
Trend
Number of
Detects
Number of
Samples
Average Conc. (mg/L)
Median Conc. (mg/L)
All Samples
"ND" ?
MAROS Statistical Trend Analysis Summary MVUser Name:
ClareLocation: MichiganState:ClareProject:
Source/Tail
cis-1,2-DICHLOROETHYLENE
220 NT NT631T 1.3E-03 5.0E-04 No300A S NT1515S 4.1E-01 2.7E-01 No300B I I1313S 5.6E-03 5.5E-03 No300C S S213S 5.8E-04 5.0E-04 NoMW-301 S S35T 8.8E-04 7.3E-04 NoMW-302 D PD45S 4.0E-02 3.1E-02 NoMW-303 NT D55T 4.9E-01 6.1E-02 NoMW-304 S S55T 4.8E-03 4.6E-03 NoMW-305 S S55S 1.2E-01 1.1E-01 NoMW-306 NT NT25T 1.2E-03 5.0E-04 NoMw-307 S I05T 5.0E-04 5.0E-04 YesMW-308 S S55T 8.4E-03 5.8E-03 NoMw-309 NT S55T 3.3E-03 2.4E-03 NoMW-310 S S15T 6.6E-04 5.0E-04 NoMW-311 NT NT55T 2.0E-02 8.9E-03 NoMW-312 S S15T 5.4E-04 5.0E-04 NoMW-313 NT NT15T 6.0E-04 5.0E-04 NoSW-11 S D010T 5.0E-04 5.0E-04 YesSW-12 S D012T 5.0E-04 5.0E-04 Yes
VINYL CHLORIDE
220 S PD135T 9.8E-04 1.0E-03 No300A I PI1616S 8.8E-01 7.2E-01 No300B I I1414S 6.1E-02 3.6E-02 No300C I I914S 8.0E-03 1.3E-03 NoMW-301 S D56T 1.2E-03 1.3E-03 NoMW-302 S NT66S 6.8E-02 5.7E-02 NoMW-303 D D66T 5.2E-01 1.2E-01 NoMW-304 PD D66T 2.0E-02 1.9E-02 NoMW-305 S NT66S 1.5E-01 1.5E-01 NoMW-306 D D66T 4.5E-03 2.3E-03 NoMw-307 S S56T 1.1E-02 9.1E-03 NoMW-308 S S66T 3.8E-02 3.6E-02 NoMw-309 S D66T 2.1E-02 1.7E-02 NoMW-310 NT NT66T 1.7E-02 2.0E-02 No
Monday, December 18, 2006 Page 1 of 2MAROS Version 2.2, 2006, AFCEE

WellSource/
Tail
Mann- Kendall
Trend
Linear Regression
Trend
VINYL CHLORIDE
Number of
Detects
Number of
Samples
Average Conc. (mg/L)
Median Conc. (mg/L)
MAROS Statistical Trend Analysis Summary
All Samples
"ND" ?
MW-311 S PD66T 2.8E-02 2.2E-02 NoMW-312 S S06T 1.0E-03 1.0E-03 YesMW-313 NT NT16T 9.6E-04 1.0E-03 NoSW-11 S S012T 1.0E-03 1.0E-03 YesSW-12 S D114T 1.0E-03 1.0E-03 No
Note: Increasing (I); Probably Increasing (PI); Stable (S); Probably Decreasing (PD); Decreasing (D); No Trend (NT); Not Applicable (N/A); Not Applicable (N/A) - Due to insufficient Data (< 4 sampling events); No Detectable Concentration (NDC)
The Number of Samples and Number of Detects shown above are post-consolidation values.
Monday, December 18, 2006 Page 2 of 2MAROS Version 2.2, 2006, AFCEE

0.75
Coefficient of Variation:
96.5%
Mann Kendall S Statistic:
41
Confidence in Trend:
I
Mann Kendall Concentration Trend: (See Note)
VINYL CHLORIDE
Well:Well Type:COC:
S300A
Effective DateWell TypeWell Constituent
Data Table:
0.1
1
10Dec
-99
Jun-00
Dec-00
Oct-01
May-02
Oct-02
Apr-03
Oct-03
Apr-04
Oct-04
May-05
Aug-05
Nov-05
Mar-06
May-06
Nov-06
Date
Con
cent
ratio
n (m
g/L)
Result (mg/L) Flag
0.0E+00
5.0E-01
1.0E+00
1.5E+00
2.0E+00
2.5E+00
3.0E+00
3.5E+00Dec
-99
Dec-00
May-02
Apr-03
Apr-04
May-05
Nov-05
May-06
Date
Con
cent
ratio
n (m
g/L)
Number of Samples
Number of Detects
MAROS Mann-Kendall Statistics Summary
Consolidation Period:
ND Values:
J Flag Values :
OtherMaximumConsolidation Type:
Duplicate Consolidation: FirstSpecified Detection Limit
Fraction of Actual Value
Time Period: to
12/12/1999 2.9E-01300A S VINYL CHLORIDE 2 26/28/2000 3.3E-01300A S VINYL CHLORIDE 1 112/6/2000 6.6E-01300A S VINYL CHLORIDE 1 110/30/2001 3.9E-01300A S VINYL CHLORIDE 1 15/1/2002 7.0E-01300A S VINYL CHLORIDE 2 2
10/29/2002 7.3E-01300A S VINYL CHLORIDE 1 14/22/2003 9.8E-01300A S VINYL CHLORIDE 1 110/21/2003 9.0E-01300A S VINYL CHLORIDE 1 14/27/2004 9.4E-01300A S VINYL CHLORIDE 1 110/27/2004 9.4E-01300A S VINYL CHLORIDE 1 15/24/2005 1.4E+00300A S VINYL CHLORIDE 1 18/11/2005 1.5E+00300A S VINYL CHLORIDE 1 111/9/2005 3.0E+00300A S VINYL CHLORIDE 2 23/15/2006 5.5E-01300A S VINYL CHLORIDE 1 15/15/2006 6.1E-01300A S VINYL CHLORIDE 1 111/15/2006 2.2E-01300A S VINYL CHLORIDE 1 1
Note: Increasing (I); Probably Increasing (PI); Stable (S); Probably Decreasing (PD); Decreasing (D); No Trend (NT); Not Applicable (N/A) - Due to insufficient Data (< 4 sampling events); ND = Non-detect
3/19/2007 Page 1 of 1MAROS Version 2.2, 2006, AFCEE

1.02
Coefficient of Variation:
100.0%
Mann Kendall S Statistic:
71
Confidence in Trend:
I
Mann Kendall Concentration Trend: (See Note)
VINYL CHLORIDE
Well:Well Type:COC:
S300B
Effective DateWell TypeWell Constituent
Data Table:
1.00E-03
1.00E-02
1.00E-01
1.00E+00Dec
-99
Jun-00
Dec-00
Oct-01
May-02
Oct-02
Apr-03
Oct-03
Apr-04
Oct-04
May-05
Nov-05
May-06
Nov-06
Date
Con
cent
ratio
n (m
g/L)
Result (mg/L) Flag
0.0E+00
5.0E-02
1.0E-01
1.5E-01
2.0E-01
2.5E-01Dec
-99
Jun-00
Dec-00
Oct-01
May-02
Oct-02
Apr-03
Oct-03
Apr-04
Oct-04
May-05
Nov-05
May-06
Nov-06
Date
Con
cent
ratio
n (m
g/L)
Number of Samples
Number of Detects
MAROS Mann-Kendall Statistics Summary
Consolidation Period:
ND Values:
J Flag Values :
OtherMaximumConsolidation Type:
Duplicate Consolidation: FirstSpecified Detection Limit
Fraction of Actual Value
Time Period: to
12/12/1999 1.4E-02300B S VINYL CHLORIDE 1 16/28/2000 2.0E-02300B S VINYL CHLORIDE 1 112/6/2000 7.2E-03300B S VINYL CHLORIDE 1 110/30/2001 3.6E-03300B S VINYL CHLORIDE 1 15/1/2002 1.0E-02300B S VINYL CHLORIDE 1 1
10/29/2002 2.4E-02300B S VINYL CHLORIDE 1 14/22/2003 3.4E-02300B S VINYL CHLORIDE 1 110/21/2003 3.7E-02300B S VINYL CHLORIDE 1 14/27/2004 6.2E-02300B S VINYL CHLORIDE 1 110/27/2004 4.8E-02300B S VINYL CHLORIDE 1 15/24/2005 1.1E-01300B S VINYL CHLORIDE 1 111/9/2005 1.4E-01300B S VINYL CHLORIDE 1 15/15/2006 2.0E-01300B S VINYL CHLORIDE 1 111/15/2006 1.4E-01300B S VINYL CHLORIDE 1 1
Note: Increasing (I); Probably Increasing (PI); Stable (S); Probably Decreasing (PD); Decreasing (D); No Trend (NT); Not Applicable (N/A) - Due to insufficient Data (< 4 sampling events); ND = Non-detect
3/19/2007 Page 1 of 1MAROS Version 2.2, 2006, AFCEE

1.27
Coefficient of Variation:
99.6%
Mann Kendall S Statistic:
48
Confidence in Trend:
I
Mann Kendall Concentration Trend: (See Note)
VINYL CHLORIDE
Well:Well Type:COC:
T300C
Effective DateWell TypeWell Constituent
Data Table:
0.0001
0.001
0.01
0.1
1Dec
-99
Jul-0
0Dec
-00
Oct-01
May-02
Oct-02
Apr-03
Oct-03
Apr-04
Oct-04
May-05
Nov-05
May-06
Nov-06
Date
Con
cent
ratio
n (m
g/L)
Result (mg/L) Flag
0.0E+00
5.0E-03
1.0E-02
1.5E-02
2.0E-02
2.5E-02
3.0E-02Dec
-99
Jul-0
0Dec
-00
Oct-01
May-02
Oct-02
Apr-03
Oct-03
Apr-04
Oct-04
May-05
Nov-05
May-06
Nov-06
Date
Con
cent
ratio
n (m
g/L)
Number of Samples
Number of Detects
MAROS Mann-Kendall Statistics Summary
Consolidation Period:
ND Values:
J Flag Values :
OtherMaximumConsolidation Type:
Duplicate Consolidation: FirstSpecified Detection Limit
Fraction of Actual Value
Time Period: to
12/12/1999 1.0E-03300C T VINYL CHLORIDE ND 1 07/21/2000 7.3E-04300C T VINYL CHLORIDE 1 112/6/2000 2.9E-04300C T VINYL CHLORIDE 1 110/30/2001 1.0E-03300C T VINYL CHLORIDE ND 1 05/1/2002 1.0E-03300C T VINYL CHLORIDE ND 1 0
10/29/2002 3.2E-03300C T VINYL CHLORIDE 1 14/22/2003 1.0E-03300C T VINYL CHLORIDE ND 1 010/21/2003 1.3E-02300C T VINYL CHLORIDE 1 14/27/2004 1.6E-03300C T VINYL CHLORIDE 1 110/27/2004 2.4E-02300C T VINYL CHLORIDE 1 15/24/2005 2.4E-02300C T VINYL CHLORIDE 1 111/9/2005 2.7E-02300C T VINYL CHLORIDE 1 15/15/2006 1.0E-03300C T VINYL CHLORIDE ND 1 011/15/2006 1.3E-02300C T VINYL CHLORIDE 1 1
Note: Increasing (I); Probably Increasing (PI); Stable (S); Probably Decreasing (PD); Decreasing (D); No Trend (NT); Not Applicable (N/A) - Due to insufficient Data (< 4 sampling events); ND = Non-detect
3/19/2007 Page 1 of 1MAROS Version 2.2, 2006, AFCEE

1.29
Coefficient of Variation:
97.2%
Mann Kendall S Statistic:
-11
Confidence in Trend:
D
Mann Kendall Concentration Trend: (See Note)
VINYL CHLORIDE
Well:Well Type:COC:
SMW-303
Effective DateWell TypeWell Constituent
Data Table:
0.01
0.1
1
10May
-05
Aug-05
Nov-05
Mar-06
May-06
Nov-06
Date
Con
cent
ratio
n (m
g/L)
Result (mg/L) Flag
0.0E+00
2.0E-014.0E-01
6.0E-01
8.0E-011.0E+00
1.2E+00
1.4E+001.6E+00
1.8E+00May
-05
Aug-05
Nov-05
Mar-06
May-06
Nov-06
Date
Con
cent
ratio
n (m
g/L)
Number of Samples
Number of Detects
MAROS Mann-Kendall Statistics Summary
Consolidation Period:
ND Values:
J Flag Values :
OtherMaximumConsolidation Type:
Duplicate Consolidation: FirstSpecified Detection Limit
Fraction of Actual Value
Time Period: to
5/24/2005 1.6E+00MW-303 S VINYL CHLORIDE 1 18/11/2005 1.1E+00MW-303 S VINYL CHLORIDE 1 111/9/2005 9.1E-02MW-303 S VINYL CHLORIDE 1 13/15/2006 1.2E-01MW-303 S VINYL CHLORIDE 1 15/15/2006 1.1E-01MW-303 S VINYL CHLORIDE 1 111/15/2006 7.6E-02MW-303 S VINYL CHLORIDE 1 1
Note: Increasing (I); Probably Increasing (PI); Stable (S); Probably Decreasing (PD); Decreasing (D); No Trend (NT); Not Applicable (N/A) - Due to insufficient Data (< 4 sampling events); ND = Non-detect
3/19/2007 Page 1 of 1MAROS Version 2.2, 2006, AFCEE

0.68
Coefficient of Variation:
93.2%
Mann Kendall S Statistic:
-9
Confidence in Trend:
PD
Mann Kendall Concentration Trend: (See Note)
VINYL CHLORIDE
Well:Well Type:COC:
TMW-304
Effective DateWell TypeWell Constituent
Data Table:
1.00E-03
1.00E-02
1.00E-01
1.00E+00May
-05
Aug-05
Nov-05
Mar-06
May-06
Nov-06
Date
Con
cent
ratio
n (m
g/L)
Result (mg/L) Flag
0.0E+00
5.0E-031.0E-02
1.5E-02
2.0E-022.5E-02
3.0E-02
3.5E-024.0E-02
4.5E-02May
-05
Aug-05
Nov-05
Mar-06
May-06
Nov-06
Date
Con
cent
ratio
n (m
g/L)
Number of Samples
Number of Detects
MAROS Mann-Kendall Statistics Summary
Consolidation Period:
ND Values:
J Flag Values :
OtherMaximumConsolidation Type:
Duplicate Consolidation: FirstSpecified Detection Limit
Fraction of Actual Value
Time Period: to
5/24/2005 4.1E-02MW-304 T VINYL CHLORIDE 1 18/11/2005 2.8E-02MW-304 T VINYL CHLORIDE 1 111/9/2005 8.5E-03MW-304 T VINYL CHLORIDE 1 13/15/2006 1.8E-02MW-304 T VINYL CHLORIDE 1 15/15/2006 2.0E-02MW-304 T VINYL CHLORIDE 1 111/15/2006 3.7E-03MW-304 T VINYL CHLORIDE 1 1
Note: Increasing (I); Probably Increasing (PI); Stable (S); Probably Decreasing (PD); Decreasing (D); No Trend (NT); Not Applicable (N/A) - Due to insufficient Data (< 4 sampling events); ND = Non-detect
3/19/2007 Page 1 of 1MAROS Version 2.2, 2006, AFCEE
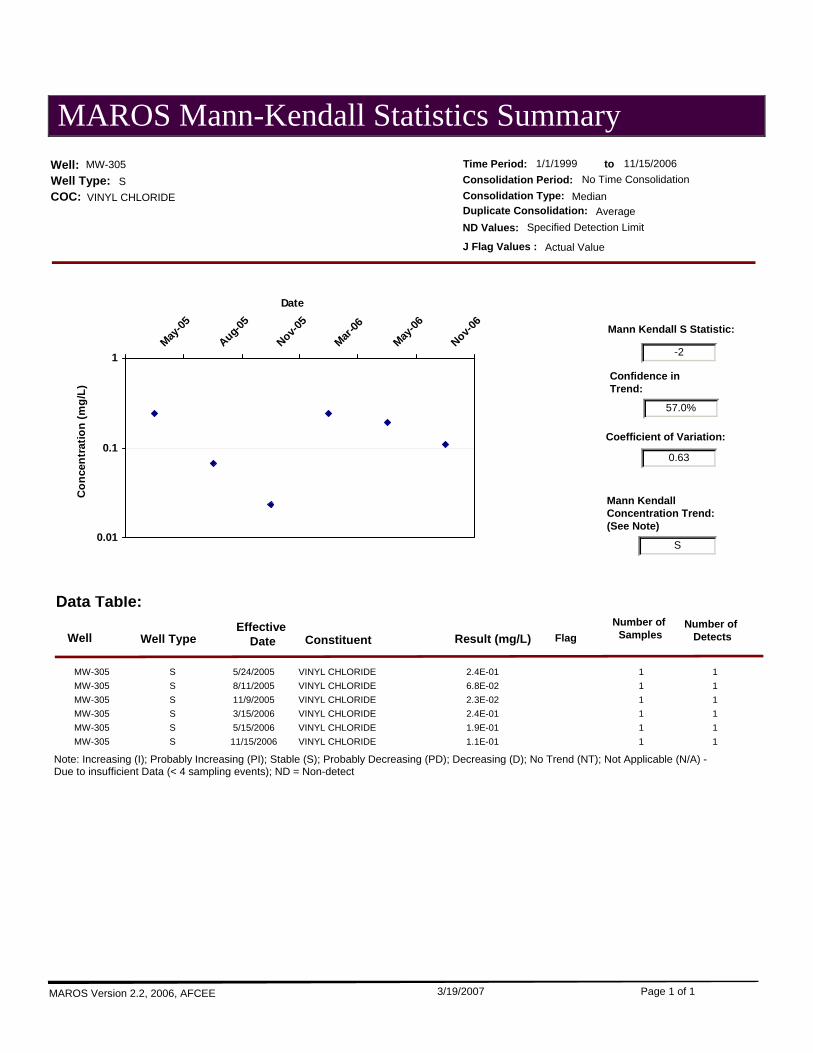
0.63
Coefficient of Variation:
57.0%
Mann Kendall S Statistic:
-2
Confidence in Trend:
S
Mann Kendall Concentration Trend: (See Note)
VINYL CHLORIDE
Well:Well Type:COC:
SMW-305
Effective DateWell TypeWell Constituent
Data Table:
0.01
0.1
1May
-05
Aug-05
Nov-05
Mar-06
May-06
Nov-06
Date
Con
cent
ratio
n (m
g/L)
Result (mg/L) FlagNumber of
SamplesNumber of
Detects
MAROS Mann-Kendall Statistics Summary
Consolidation Period:
ND Values:
J Flag Values :
No Time ConsolidationMedianConsolidation Type:
Duplicate Consolidation: AverageSpecified Detection Limit
Actual Value
Time Period: 1/1/1999 11/15/2006to
5/24/2005 2.4E-01MW-305 S VINYL CHLORIDE 1 18/11/2005 6.8E-02MW-305 S VINYL CHLORIDE 1 111/9/2005 2.3E-02MW-305 S VINYL CHLORIDE 1 13/15/2006 2.4E-01MW-305 S VINYL CHLORIDE 1 15/15/2006 1.9E-01MW-305 S VINYL CHLORIDE 1 111/15/2006 1.1E-01MW-305 S VINYL CHLORIDE 1 1
Note: Increasing (I); Probably Increasing (PI); Stable (S); Probably Decreasing (PD); Decreasing (D); No Trend (NT); Not Applicable (N/A) - Due to insufficient Data (< 4 sampling events); ND = Non-detect
3/19/2007 Page 1 of 1MAROS Version 2.2, 2006, AFCEE

1.17
Coefficient of Variation:
99.2%
Mann Kendall S Statistic:
-13
Confidence in Trend:
D
Mann Kendall Concentration Trend: (See Note)
VINYL CHLORIDE
Well:Well Type:COC:
TMW-306
Effective DateWell TypeWell Constituent
Data Table:
1.00E-03
1.00E-02
1.00E-01
1.00E+00May
-05
Aug-05
Nov-05
Mar-06
May-06
Nov-06
Date
Con
cent
ratio
n (m
g/L)
Result (mg/L) Flag
0.0E+00
2.0E-03
4.0E-03
6.0E-03
8.0E-03
1.0E-02
1.2E-02
1.4E-02
1.6E-02May
-05
Aug-05
Nov-05
Mar-06
May-06
Nov-06
Date
Con
cent
ratio
n (m
g/L)
Number of Samples
Number of Detects
MAROS Mann-Kendall Statistics Summary
Consolidation Period:
ND Values:
J Flag Values :
OtherMaximumConsolidation Type:
Duplicate Consolidation: FirstSpecified Detection Limit
Fraction of Actual Value
Time Period: to
5/24/2005 1.5E-02MW-306 T VINYL CHLORIDE 1 18/11/2005 4.4E-03MW-306 T VINYL CHLORIDE 1 111/9/2005 2.4E-03MW-306 T VINYL CHLORIDE 1 13/15/2006 2.0E-03MW-306 T VINYL CHLORIDE 1 15/15/2006 2.1E-03MW-306 T VINYL CHLORIDE 1 111/15/2006 1.1E-03MW-306 T VINYL CHLORIDE 1 1
Note: Increasing (I); Probably Increasing (PI); Stable (S); Probably Decreasing (PD); Decreasing (D); No Trend (NT); Not Applicable (N/A) - Due to insufficient Data (< 4 sampling events); ND = Non-detect
3/19/2007 Page 1 of 1MAROS Version 2.2, 2006, AFCEE

0.99
Coefficient of Variation:
76.5%
Mann Kendall S Statistic:
-5
Confidence in Trend:
S
Mann Kendall Concentration Trend: (See Note)
VINYL CHLORIDE
Well:Well Type:COC:
TMw-307
Effective DateWell TypeWell Constituent
Data Table:
1.00E-03
1.00E-02
1.00E-01
1.00E+00May
-05
Aug-05
Nov-05
Mar-06
May-06
Nov-06
Date
Con
cent
ratio
n (m
g/L)
Result (mg/L) Flag
0.0E+00
5.0E-03
1.0E-02
1.5E-02
2.0E-02
2.5E-02
3.0E-02
3.5E-02May
-05
Aug-05
Nov-05
Mar-06
May-06
Nov-06
Date
Con
cent
ratio
n (m
g/L)
Number of Samples
Number of Detects
MAROS Mann-Kendall Statistics Summary
Consolidation Period:
ND Values:
J Flag Values :
OtherMaximumConsolidation Type:
Duplicate Consolidation: FirstSpecified Detection Limit
Fraction of Actual Value
Time Period: to
5/24/2005 3.3E-02Mw-307 T VINYL CHLORIDE 1 18/11/2005 1.1E-02Mw-307 T VINYL CHLORIDE 1 111/9/2005 1.0E-03Mw-307 T VINYL CHLORIDE ND 1 03/15/2006 5.0E-03Mw-307 T VINYL CHLORIDE 1 15/15/2006 1.0E-02Mw-307 T VINYL CHLORIDE 1 111/15/2006 8.1E-03Mw-307 T VINYL CHLORIDE 1 1
Note: Increasing (I); Probably Increasing (PI); Stable (S); Probably Decreasing (PD); Decreasing (D); No Trend (NT); Not Applicable (N/A) - Due to insufficient Data (< 4 sampling events); ND = Non-detect
3/19/2007 Page 1 of 1MAROS Version 2.2, 2006, AFCEE

0.45
Coefficient of Variation:
64.0%
Mann Kendall S Statistic:
-3
Confidence in Trend:
S
Mann Kendall Concentration Trend: (See Note)
VINYL CHLORIDE
Well:Well Type:COC:
TMW-308
Effective DateWell TypeWell Constituent
Data Table:
1.00E-02
1.00E-01
1.00E+00May
-05
Aug-05
Nov-05
Mar-06
May-06
Nov-06
Date
Con
cent
ratio
n (m
g/L)
Result (mg/L) Flag
0.0E+00
1.0E-02
2.0E-02
3.0E-02
4.0E-02
5.0E-02
6.0E-02
7.0E-02May
-05
Aug-05
Nov-05
Mar-06
May-06
Nov-06
Date
Con
cent
ratio
n (m
g/L)
Number of Samples
Number of Detects
MAROS Mann-Kendall Statistics Summary
Consolidation Period:
ND Values:
J Flag Values :
OtherMaximumConsolidation Type:
Duplicate Consolidation: FirstSpecified Detection Limit
Fraction of Actual Value
Time Period: to
5/24/2005 5.5E-02MW-308 T VINYL CHLORIDE 1 18/11/2005 2.6E-02MW-308 T VINYL CHLORIDE 1 111/9/2005 2.3E-02MW-308 T VINYL CHLORIDE 1 13/15/2006 4.5E-02MW-308 T VINYL CHLORIDE 1 15/15/2006 5.8E-02MW-308 T VINYL CHLORIDE 1 111/15/2006 2.0E-02MW-308 T VINYL CHLORIDE 1 1
Note: Increasing (I); Probably Increasing (PI); Stable (S); Probably Decreasing (PD); Decreasing (D); No Trend (NT); Not Applicable (N/A) - Due to insufficient Data (< 4 sampling events); ND = Non-detect
3/19/2007 Page 1 of 1MAROS Version 2.2, 2006, AFCEE

0.75
Coefficient of Variation:
64.0%
Mann Kendall S Statistic:
-3
Confidence in Trend:
S
Mann Kendall Concentration Trend: (See Note)
VINYL CHLORIDE
Well:Well Type:COC:
TMw-309
Effective DateWell TypeWell Constituent
Data Table:
1.00E-03
1.00E-02
1.00E-01
1.00E+00May
-05
Aug-05
Nov-05
Mar-06
May-06
Nov-06
Date
Con
cent
ratio
n (m
g/L)
Result (mg/L) Flag
0.0E+00
1.0E-02
2.0E-02
3.0E-02
4.0E-02
5.0E-02
6.0E-02May
-05
Aug-05
Nov-05
Mar-06
May-06
Nov-06
Date
Con
cent
ratio
n (m
g/L)
Number of Samples
Number of Detects
MAROS Mann-Kendall Statistics Summary
Consolidation Period:
ND Values:
J Flag Values :
OtherMaximumConsolidation Type:
Duplicate Consolidation: FirstSpecified Detection Limit
Fraction of Actual Value
Time Period: to
5/24/2005 4.8E-02Mw-309 T VINYL CHLORIDE 1 18/11/2005 1.4E-02Mw-309 T VINYL CHLORIDE 1 111/9/2005 1.6E-02Mw-309 T VINYL CHLORIDE 1 13/15/2006 1.8E-02Mw-309 T VINYL CHLORIDE 1 15/15/2006 2.5E-02Mw-309 T VINYL CHLORIDE 1 111/15/2006 2.2E-03Mw-309 T VINYL CHLORIDE 1 1
Note: Increasing (I); Probably Increasing (PI); Stable (S); Probably Decreasing (PD); Decreasing (D); No Trend (NT); Not Applicable (N/A) - Due to insufficient Data (< 4 sampling events); ND = Non-detect
3/19/2007 Page 1 of 1MAROS Version 2.2, 2006, AFCEE

MAROS COC AssessmentMVUser Name:
ClareLocation: MichiganState:
Soil RemedyProject:
Prevalence:
Mobility:
Toxicity:
VINYL CHLORIDE
Contaminants of Concern (COC's)
TRICHLOROETHYLENE (TCE)
cis-1,2-DICHLOROETHYLENE
Contaminant of ConcernTotal Wells
Total Excedences
Total detectsClass
Percent Excedences
TRICHLOROETHYLENE (TCE) ORG 8 52 25.0%
Note: Top COCs by prevalence were determined by examining a representative concentration for each well location at the site. The total excedences (values above the chosen PRGs) are compared to the total number of wells to determine the prevalence of the compound.
Contaminant of Concern Kd
TRICHLOROETHYLENE (TCE) 0.297
Note: Top COCs by mobility were determined by examining each detected compound in the dataset and comparing their mobilities (Koc's for organics, assume foc = 0.001, and Kd's for metals).
Contaminant of Concern
Representative Concentration
(mg/L)PRG
(mg/L)
Percent Above PRG
TRICHLOROETHYLENE (TCE) 5.3E-03 5.0E-03 6.9%
Note: Top COCs by toxicity were determined by examining a representative concentration for each compound over the entire site. The compound representative concentrations are then compared with the chosen PRG for that compound, with the percentage excedence from the PRG determining the compound's toxicity. All compounds above exceed the PRG.
Saturday, October 28, 2006 Page 1 of 1MAROS Version 2.2, 2006, AFCEE

0.00
Coefficient of Variation:
48.0%
Mann Kendall S Statistic:
0
Confidence in Trend:
S
Mann Kendall Concentration Trend: (See Note)
TRICHLOROETHYLENE (TCE)
Well:Well Type:COC:
TUMW-1S
Effective DateWell TypeWell Constituent
Data Table:
Result (mg/L) Flag
0.0E+00
2.0E-04
4.0E-04
6.0E-04
8.0E-04
1.0E-03
1.2E-03Mar
-99
Jun-99
Dec-99
Jun-00
Dec-00
Oct-01
May-02
Oct-02
Apr-03
Oct-03
Apr-04
Oct-04
May-05
Nov-05
May-06
Date
Con
cent
ratio
n (m
g/L)
Number of Samples
Number of Detects
MAROS Mann-Kendall Statistics Summary
Consolidation Period:
ND Values:
J Flag Values :
No Time ConsolidationMedianConsolidation Type:
Duplicate Consolidation: AverageSpecified Detection Limit
Actual Value
Time Period: 1/1/1999 5/18/2006to
3/24/1999 1.0E-03UMW-1S T TRICHLOROETHYLENE (TCE) ND 1 06/23/1999 1.0E-03UMW-1S T TRICHLOROETHYLENE (TCE) ND 1 012/21/1999 1.0E-03UMW-1S T TRICHLOROETHYLENE (TCE) ND 1 06/28/2000 1.0E-03UMW-1S T TRICHLOROETHYLENE (TCE) ND 1 012/6/2000 1.0E-03UMW-1S T TRICHLOROETHYLENE (TCE) ND 1 010/30/2001 1.0E-03UMW-1S T TRICHLOROETHYLENE (TCE) ND 1 05/1/2002 1.0E-03UMW-1S T TRICHLOROETHYLENE (TCE) ND 1 0
10/28/2002 1.0E-03UMW-1S T TRICHLOROETHYLENE (TCE) ND 1 04/22/2003 1.0E-03UMW-1S T TRICHLOROETHYLENE (TCE) ND 1 010/21/2003 1.0E-03UMW-1S T TRICHLOROETHYLENE (TCE) ND 1 04/27/2004 1.0E-03UMW-1S T TRICHLOROETHYLENE (TCE) ND 1 010/26/2004 1.0E-03UMW-1S T TRICHLOROETHYLENE (TCE) ND 1 05/20/2005 1.0E-03UMW-1S T TRICHLOROETHYLENE (TCE) ND 1 011/8/2005 1.0E-03UMW-1S T TRICHLOROETHYLENE (TCE) ND 1 05/16/2006 1.0E-03UMW-1S T TRICHLOROETHYLENE (TCE) ND 1 0
Note: Increasing (I); Probably Increasing (PI); Stable (S); Probably Decreasing (PD); Decreasing (D); No Trend (NT); Not Applicable (N/A) - Due to insufficient Data (< 4 sampling events); ND = Non-detect
11/6/2006 Page 1 of 1MAROS Version 2.2, 2006, AFCEE

1.61
Coefficient of Variation:
100.0%
Mann Kendall S Statistic:
-93
Confidence in Trend:
D
Mann Kendall Concentration Trend: (See Note)
TRICHLOROETHYLENE (TCE)
Well:Well Type:COC:
SDMW-1S
Effective DateWell TypeWell Constituent
Data Table:
Result (mg/L) Flag
0.0E+00
2.0E-02
4.0E-02
6.0E-02
8.0E-02
1.0E-01
1.2E-01Mar
-99
Jun-99
Dec-99
Jun-00
Dec-00
Oct-01
May-02
Oct-02
Apr-03
Oct-03
Apr-04
Oct-04
May-05
Nov-05
May-06
Date
Con
cent
ratio
n (m
g/L)
Number of Samples
Number of Detects
MAROS Mann-Kendall Statistics Summary
Consolidation Period:
ND Values:
J Flag Values :
No Time ConsolidationMedianConsolidation Type:
Duplicate Consolidation: AverageSpecified Detection Limit
Actual Value
Time Period: 3/24/1999 5/16/2006to
3/24/1999 9.9E-02DMW-1S S TRICHLOROETHYLENE (TCE) 1 16/23/1999 6.7E-02DMW-1S S TRICHLOROETHYLENE (TCE) 1 112/21/1999 1.4E-02DMW-1S S TRICHLOROETHYLENE (TCE) 1 16/28/2000 1.3E-02DMW-1S S TRICHLOROETHYLENE (TCE) 1 112/6/2000 1.0E-02DMW-1S S TRICHLOROETHYLENE (TCE) 1 110/30/2001 9.0E-03DMW-1S S TRICHLOROETHYLENE (TCE) 1 15/1/2002 7.0E-03DMW-1S S TRICHLOROETHYLENE (TCE) 1 1
10/28/2002 7.0E-03DMW-1S S TRICHLOROETHYLENE (TCE) 1 14/22/2003 9.0E-03DMW-1S S TRICHLOROETHYLENE (TCE) 1 110/21/2003 4.0E-03DMW-1S S TRICHLOROETHYLENE (TCE) 1 14/27/2004 4.0E-03DMW-1S S TRICHLOROETHYLENE (TCE) 1 110/26/2004 4.0E-03DMW-1S S TRICHLOROETHYLENE (TCE) 1 15/20/2005 4.0E-03DMW-1S S TRICHLOROETHYLENE (TCE) 1 111/8/2005 3.2E-03DMW-1S S TRICHLOROETHYLENE (TCE) 1 15/16/2006 2.9E-03DMW-1S S TRICHLOROETHYLENE (TCE) 1 1
Note: Increasing (I); Probably Increasing (PI); Stable (S); Probably Decreasing (PD); Decreasing (D); No Trend (NT); Not Applicable (N/A) - Due to insufficient Data (< 4 sampling events); ND = Non-detect
10/28/2006 Page 1 of 1MAROS Version 2.2, 2006, AFCEE
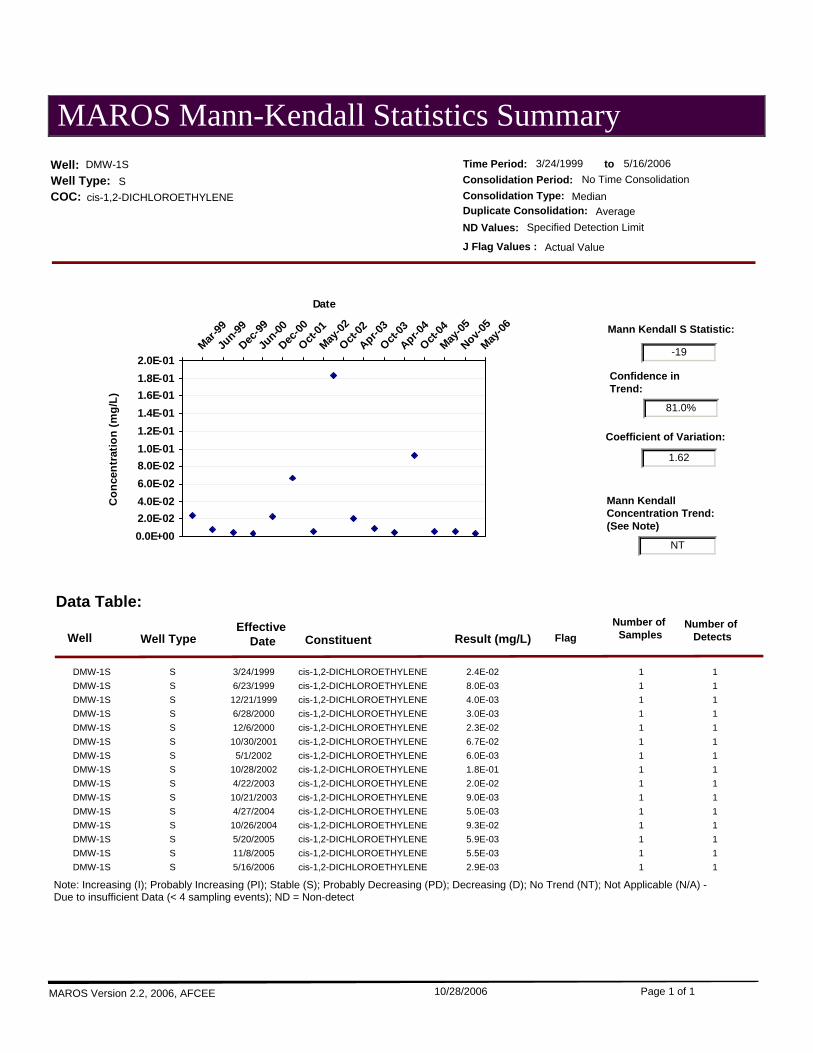
1.62
Coefficient of Variation:
81.0%
Mann Kendall S Statistic:
-19
Confidence in Trend:
NT
Mann Kendall Concentration Trend: (See Note)
cis-1,2-DICHLOROETHYLENE
Well:Well Type:COC:
SDMW-1S
Effective DateWell TypeWell Constituent
Data Table:
Result (mg/L) Flag
0.0E+002.0E-024.0E-026.0E-028.0E-021.0E-011.2E-011.4E-011.6E-011.8E-012.0E-01
Mar-99
Jun-99
Dec-99
Jun-00
Dec-00
Oct-01
May-02
Oct-02
Apr-03
Oct-03
Apr-04
Oct-04
May-05
Nov-05
May-06
Date
Con
cent
ratio
n (m
g/L)
Number of Samples
Number of Detects
MAROS Mann-Kendall Statistics Summary
Consolidation Period:
ND Values:
J Flag Values :
No Time ConsolidationMedianConsolidation Type:
Duplicate Consolidation: AverageSpecified Detection Limit
Actual Value
Time Period: 3/24/1999 5/16/2006to
3/24/1999 2.4E-02DMW-1S S cis-1,2-DICHLOROETHYLENE 1 16/23/1999 8.0E-03DMW-1S S cis-1,2-DICHLOROETHYLENE 1 112/21/1999 4.0E-03DMW-1S S cis-1,2-DICHLOROETHYLENE 1 16/28/2000 3.0E-03DMW-1S S cis-1,2-DICHLOROETHYLENE 1 112/6/2000 2.3E-02DMW-1S S cis-1,2-DICHLOROETHYLENE 1 110/30/2001 6.7E-02DMW-1S S cis-1,2-DICHLOROETHYLENE 1 15/1/2002 6.0E-03DMW-1S S cis-1,2-DICHLOROETHYLENE 1 1
10/28/2002 1.8E-01DMW-1S S cis-1,2-DICHLOROETHYLENE 1 14/22/2003 2.0E-02DMW-1S S cis-1,2-DICHLOROETHYLENE 1 110/21/2003 9.0E-03DMW-1S S cis-1,2-DICHLOROETHYLENE 1 14/27/2004 5.0E-03DMW-1S S cis-1,2-DICHLOROETHYLENE 1 110/26/2004 9.3E-02DMW-1S S cis-1,2-DICHLOROETHYLENE 1 15/20/2005 5.9E-03DMW-1S S cis-1,2-DICHLOROETHYLENE 1 111/8/2005 5.5E-03DMW-1S S cis-1,2-DICHLOROETHYLENE 1 15/16/2006 2.9E-03DMW-1S S cis-1,2-DICHLOROETHYLENE 1 1
Note: Increasing (I); Probably Increasing (PI); Stable (S); Probably Decreasing (PD); Decreasing (D); No Trend (NT); Not Applicable (N/A) - Due to insufficient Data (< 4 sampling events); ND = Non-detect
10/28/2006 Page 1 of 1MAROS Version 2.2, 2006, AFCEE

0.95
Coefficient of Variation:
99.3%
Mann Kendall S Statistic:
-45
Confidence in Trend:
D
Mann Kendall Concentration Trend: (See Note)
TRICHLOROETHYLENE (TCE)
Well:Well Type:COC:
SDMW-2S
Effective DateWell TypeWell Constituent
Data Table:
Result (mg/L) Flag
0.0E+00
1.0E-03
2.0E-03
3.0E-03
4.0E-03
5.0E-03
6.0E-03
7.0E-03
8.0E-03Mar
-99
Jun-99
Dec-99
Jun-00
Dec-00
Oct-01
May-02
Oct-02
Apr-03
Oct-03
Apr-04
Oct-04
May-05
May-06
Date
Con
cent
ratio
n (m
g/L)
Number of Samples
Number of Detects
MAROS Mann-Kendall Statistics Summary
Consolidation Period:
ND Values:
J Flag Values :
No Time ConsolidationMedianConsolidation Type:
Duplicate Consolidation: AverageSpecified Detection Limit
Actual Value
Time Period: 3/24/1999 5/16/2006to
3/24/1999 5.0E-03DMW-2S S TRICHLOROETHYLENE (TCE) 1 16/23/1999 7.0E-03DMW-2S S TRICHLOROETHYLENE (TCE) 1 112/21/1999 2.0E-03DMW-2S S TRICHLOROETHYLENE (TCE) 1 16/28/2000 1.0E-03DMW-2S S TRICHLOROETHYLENE (TCE) ND 1 012/6/2000 1.0E-03DMW-2S S TRICHLOROETHYLENE (TCE) ND 1 010/30/2001 2.0E-03DMW-2S S TRICHLOROETHYLENE (TCE) 1 15/1/2002 1.0E-03DMW-2S S TRICHLOROETHYLENE (TCE) 1 1
10/28/2002 2.0E-03DMW-2S S TRICHLOROETHYLENE (TCE) 1 14/22/2003 1.0E-03DMW-2S S TRICHLOROETHYLENE (TCE) ND 1 010/21/2003 1.0E-03DMW-2S S TRICHLOROETHYLENE (TCE) ND 1 04/27/2004 1.0E-03DMW-2S S TRICHLOROETHYLENE (TCE) ND 1 010/26/2004 1.0E-03DMW-2S S TRICHLOROETHYLENE (TCE) ND 1 05/20/2005 1.0E-03DMW-2S S TRICHLOROETHYLENE (TCE) ND 1 05/16/2006 7.9E-04DMW-2S S TRICHLOROETHYLENE (TCE) 1 1
Note: Increasing (I); Probably Increasing (PI); Stable (S); Probably Decreasing (PD); Decreasing (D); No Trend (NT); Not Applicable (N/A) - Due to insufficient Data (< 4 sampling events); ND = Non-detect
10/28/2006 Page 1 of 1MAROS Version 2.2, 2006, AFCEE
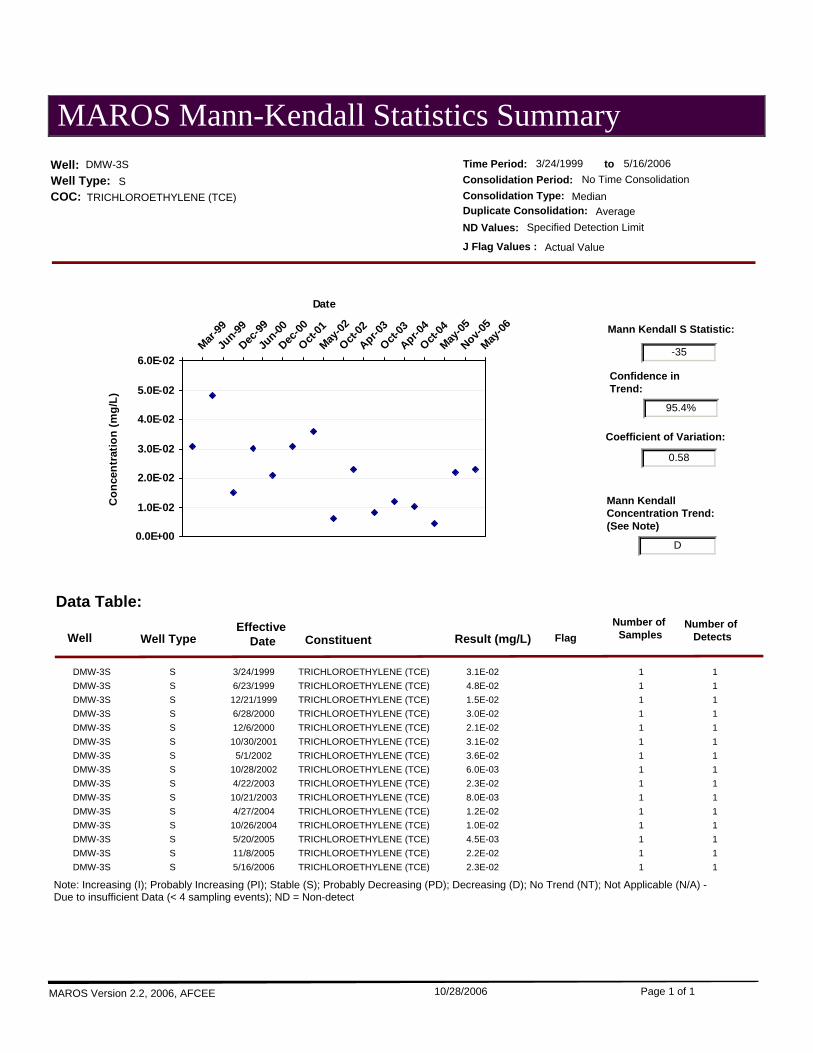
0.58
Coefficient of Variation:
95.4%
Mann Kendall S Statistic:
-35
Confidence in Trend:
D
Mann Kendall Concentration Trend: (See Note)
TRICHLOROETHYLENE (TCE)
Well:Well Type:COC:
SDMW-3S
Effective DateWell TypeWell Constituent
Data Table:
Result (mg/L) Flag
0.0E+00
1.0E-02
2.0E-02
3.0E-02
4.0E-02
5.0E-02
6.0E-02Mar
-99
Jun-99
Dec-99
Jun-00
Dec-00
Oct-01
May-02
Oct-02
Apr-03
Oct-03
Apr-04
Oct-04
May-05
Nov-05
May-06
Date
Con
cent
ratio
n (m
g/L)
Number of Samples
Number of Detects
MAROS Mann-Kendall Statistics Summary
Consolidation Period:
ND Values:
J Flag Values :
No Time ConsolidationMedianConsolidation Type:
Duplicate Consolidation: AverageSpecified Detection Limit
Actual Value
Time Period: 3/24/1999 5/16/2006to
3/24/1999 3.1E-02DMW-3S S TRICHLOROETHYLENE (TCE) 1 16/23/1999 4.8E-02DMW-3S S TRICHLOROETHYLENE (TCE) 1 112/21/1999 1.5E-02DMW-3S S TRICHLOROETHYLENE (TCE) 1 16/28/2000 3.0E-02DMW-3S S TRICHLOROETHYLENE (TCE) 1 112/6/2000 2.1E-02DMW-3S S TRICHLOROETHYLENE (TCE) 1 110/30/2001 3.1E-02DMW-3S S TRICHLOROETHYLENE (TCE) 1 15/1/2002 3.6E-02DMW-3S S TRICHLOROETHYLENE (TCE) 1 1
10/28/2002 6.0E-03DMW-3S S TRICHLOROETHYLENE (TCE) 1 14/22/2003 2.3E-02DMW-3S S TRICHLOROETHYLENE (TCE) 1 110/21/2003 8.0E-03DMW-3S S TRICHLOROETHYLENE (TCE) 1 14/27/2004 1.2E-02DMW-3S S TRICHLOROETHYLENE (TCE) 1 110/26/2004 1.0E-02DMW-3S S TRICHLOROETHYLENE (TCE) 1 15/20/2005 4.5E-03DMW-3S S TRICHLOROETHYLENE (TCE) 1 111/8/2005 2.2E-02DMW-3S S TRICHLOROETHYLENE (TCE) 1 15/16/2006 2.3E-02DMW-3S S TRICHLOROETHYLENE (TCE) 1 1
Note: Increasing (I); Probably Increasing (PI); Stable (S); Probably Decreasing (PD); Decreasing (D); No Trend (NT); Not Applicable (N/A) - Due to insufficient Data (< 4 sampling events); ND = Non-detect
10/28/2006 Page 1 of 1MAROS Version 2.2, 2006, AFCEE

0.00
Coefficient of Variation:
63.3%
Mann Kendall S Statistic:
8
Confidence in Trend:
NT
Mann Kendall Concentration Trend: (See Note)
TRICHLOROETHYLENE (TCE)
Well:Well Type:COC:
TDMW-1D
Effective DateWell TypeWell Constituent
Data Table:
Result (mg/L) Flag
0.0E+00
2.0E-04
4.0E-04
6.0E-04
8.0E-04
1.0E-03
1.2E-03Mar
-99
Jun-99
Dec-99
Jun-00
Dec-00
Oct-01
May-02
Oct-02
Apr-03
Oct-03
Apr-04
Oct-04
May-05
Nov-05
May-06
Date
Con
cent
ratio
n (m
g/L)
Number of Samples
Number of Detects
MAROS Mann-Kendall Statistics Summary
Consolidation Period:
ND Values:
J Flag Values :
No Time ConsolidationMedianConsolidation Type:
Duplicate Consolidation: AverageSpecified Detection Limit
Actual Value
Time Period: 1/1/1999 5/18/2006to
3/24/1999 1.0E-03DMW-1D T TRICHLOROETHYLENE (TCE) ND 1 06/23/1999 1.0E-03DMW-1D T TRICHLOROETHYLENE (TCE) ND 1 012/21/1999 1.0E-03DMW-1D T TRICHLOROETHYLENE (TCE) ND 1 06/28/2000 1.0E-03DMW-1D T TRICHLOROETHYLENE (TCE) 1 112/6/2000 1.0E-03DMW-1D T TRICHLOROETHYLENE (TCE) ND 1 010/30/2001 1.0E-03DMW-1D T TRICHLOROETHYLENE (TCE) ND 1 05/1/2002 1.0E-03DMW-1D T TRICHLOROETHYLENE (TCE) ND 1 0
10/28/2002 1.0E-03DMW-1D T TRICHLOROETHYLENE (TCE) ND 1 04/22/2003 1.0E-03DMW-1D T TRICHLOROETHYLENE (TCE) ND 1 010/21/2003 1.0E-03DMW-1D T TRICHLOROETHYLENE (TCE) ND 1 04/27/2004 1.0E-03DMW-1D T TRICHLOROETHYLENE (TCE) ND 1 010/26/2004 1.0E-03DMW-1D T TRICHLOROETHYLENE (TCE) ND 1 05/20/2005 1.0E-03DMW-1D T TRICHLOROETHYLENE (TCE) ND 1 011/8/2005 1.0E-03DMW-1D T TRICHLOROETHYLENE (TCE) ND 1 05/16/2006 1.0E-03DMW-1D T TRICHLOROETHYLENE (TCE) ND 1 0
Note: Increasing (I); Probably Increasing (PI); Stable (S); Probably Decreasing (PD); Decreasing (D); No Trend (NT); Not Applicable (N/A) - Due to insufficient Data (< 4 sampling events); ND = Non-detect
11/6/2006 Page 1 of 1MAROS Version 2.2, 2006, AFCEE

0.00
Coefficient of Variation:
48.0%
Mann Kendall S Statistic:
0
Confidence in Trend:
S
Mann Kendall Concentration Trend: (See Note)
TRICHLOROETHYLENE (TCE)
Well:Well Type:COC:
TUMW-1D
Effective DateWell TypeWell Constituent
Data Table:
Result (mg/L) Flag
0.0E+00
2.0E-04
4.0E-04
6.0E-04
8.0E-04
1.0E-03
1.2E-03Mar
-99
Jun-99
Dec-99
Jun-00
Dec-00
Oct-01
May-02
Oct-02
Apr-03
Oct-03
Apr-04
Oct-04
May-05
Nov-05
May-06
Date
Con
cent
ratio
n (m
g/L)
Number of Samples
Number of Detects
MAROS Mann-Kendall Statistics Summary
Consolidation Period:
ND Values:
J Flag Values :
No Time ConsolidationMedianConsolidation Type:
Duplicate Consolidation: AverageSpecified Detection Limit
Actual Value
Time Period: 1/1/1999 5/18/2006to
3/24/1999 1.0E-03UMW-1D T TRICHLOROETHYLENE (TCE) ND 1 06/23/1999 1.0E-03UMW-1D T TRICHLOROETHYLENE (TCE) ND 1 012/21/1999 1.0E-03UMW-1D T TRICHLOROETHYLENE (TCE) ND 1 06/28/2000 1.0E-03UMW-1D T TRICHLOROETHYLENE (TCE) ND 1 012/6/2000 1.0E-03UMW-1D T TRICHLOROETHYLENE (TCE) ND 1 010/30/2001 1.0E-03UMW-1D T TRICHLOROETHYLENE (TCE) ND 1 05/1/2002 1.0E-03UMW-1D T TRICHLOROETHYLENE (TCE) ND 1 0
10/28/2002 1.0E-03UMW-1D T TRICHLOROETHYLENE (TCE) ND 1 04/22/2003 1.0E-03UMW-1D T TRICHLOROETHYLENE (TCE) ND 1 010/21/2003 1.0E-03UMW-1D T TRICHLOROETHYLENE (TCE) ND 1 04/27/2004 1.0E-03UMW-1D T TRICHLOROETHYLENE (TCE) ND 1 010/26/2004 1.0E-03UMW-1D T TRICHLOROETHYLENE (TCE) ND 1 05/20/2005 1.0E-03UMW-1D T TRICHLOROETHYLENE (TCE) ND 1 011/8/2005 1.0E-03UMW-1D T TRICHLOROETHYLENE (TCE) ND 1 05/16/2006 1.0E-03UMW-1D T TRICHLOROETHYLENE (TCE) ND 1 0
Note: Increasing (I); Probably Increasing (PI); Stable (S); Probably Decreasing (PD); Decreasing (D); No Trend (NT); Not Applicable (N/A) - Due to insufficient Data (< 4 sampling events); ND = Non-detect
11/6/2006 Page 1 of 1MAROS Version 2.2, 2006, AFCEE

0.00
Coefficient of Variation:
48.0%
Mann Kendall S Statistic:
0
Confidence in Trend:
S
Mann Kendall Concentration Trend: (See Note)
TRICHLOROETHYLENE (TCE)
Well:Well Type:COC:
TDMW-2D
Effective DateWell TypeWell Constituent
Data Table:
Result (mg/L) Flag
0.0E+00
2.0E-04
4.0E-04
6.0E-04
8.0E-04
1.0E-03
1.2E-03Mar
-99
Jun-99
Dec-99
Jun-00
Dec-00
Oct-01
May-02
Oct-02
Apr-03
Oct-03
Apr-04
Oct-04
May-05
Nov-05
May-06
Date
Con
cent
ratio
n (m
g/L)
Number of Samples
Number of Detects
MAROS Mann-Kendall Statistics Summary
Consolidation Period:
ND Values:
J Flag Values :
No Time ConsolidationMedianConsolidation Type:
Duplicate Consolidation: AverageSpecified Detection Limit
Actual Value
Time Period: 1/1/1999 5/18/2006to
3/24/1999 1.0E-03DMW-2D T TRICHLOROETHYLENE (TCE) ND 1 06/23/1999 1.0E-03DMW-2D T TRICHLOROETHYLENE (TCE) ND 1 012/21/1999 1.0E-03DMW-2D T TRICHLOROETHYLENE (TCE) ND 1 06/28/2000 1.0E-03DMW-2D T TRICHLOROETHYLENE (TCE) ND 1 012/6/2000 1.0E-03DMW-2D T TRICHLOROETHYLENE (TCE) ND 1 010/30/2001 1.0E-03DMW-2D T TRICHLOROETHYLENE (TCE) ND 1 05/1/2002 1.0E-03DMW-2D T TRICHLOROETHYLENE (TCE) ND 1 0
10/28/2002 1.0E-03DMW-2D T TRICHLOROETHYLENE (TCE) ND 1 04/22/2003 1.0E-03DMW-2D T TRICHLOROETHYLENE (TCE) ND 1 010/21/2003 1.0E-03DMW-2D T TRICHLOROETHYLENE (TCE) ND 1 04/27/2004 1.0E-03DMW-2D T TRICHLOROETHYLENE (TCE) ND 1 010/26/2004 1.0E-03DMW-2D T TRICHLOROETHYLENE (TCE) ND 1 05/20/2005 1.0E-03DMW-2D T TRICHLOROETHYLENE (TCE) ND 1 011/8/2005 1.0E-03DMW-2D T TRICHLOROETHYLENE (TCE) ND 1 05/16/2006 1.0E-03DMW-2D T TRICHLOROETHYLENE (TCE) ND 1 0
Note: Increasing (I); Probably Increasing (PI); Stable (S); Probably Decreasing (PD); Decreasing (D); No Trend (NT); Not Applicable (N/A) - Due to insufficient Data (< 4 sampling events); ND = Non-detect
11/6/2006 Page 1 of 1MAROS Version 2.2, 2006, AFCEE

0.15
Coefficient of Variation:
66.9%
Mann Kendall S Statistic:
10
Confidence in Trend:
NT
Mann Kendall Concentration Trend: (See Note)
TRICHLOROETHYLENE (TCE)
Well:Well Type:COC:
TDMW-3D
Effective DateWell TypeWell Constituent
Data Table:
Result (mg/L) Flag
0.0E+00
2.0E-044.0E-04
6.0E-04
8.0E-041.0E-03
1.2E-03
1.4E-031.6E-03
1.8E-03Mar
-99
Jun-99
Dec-99
Jun-00
Dec-00
Oct-01
May-02
Oct-02
Apr-03
Oct-03
Apr-04
Oct-04
May-05
Nov-05
May-06
Date
Con
cent
ratio
n (m
g/L)
Number of Samples
Number of Detects
MAROS Mann-Kendall Statistics Summary
Consolidation Period:
ND Values:
J Flag Values :
No Time ConsolidationMedianConsolidation Type:
Duplicate Consolidation: AverageSpecified Detection Limit
Actual Value
Time Period: 1/1/1999 5/18/2006to
3/24/1999 1.0E-03DMW-3D T TRICHLOROETHYLENE (TCE) ND 1 06/23/1999 1.0E-03DMW-3D T TRICHLOROETHYLENE (TCE) ND 1 012/21/1999 1.0E-03DMW-3D T TRICHLOROETHYLENE (TCE) ND 1 06/28/2000 1.0E-03DMW-3D T TRICHLOROETHYLENE (TCE) ND 1 012/6/2000 1.0E-03DMW-3D T TRICHLOROETHYLENE (TCE) ND 1 010/30/2001 1.0E-03DMW-3D T TRICHLOROETHYLENE (TCE) ND 1 05/1/2002 1.0E-03DMW-3D T TRICHLOROETHYLENE (TCE) ND 1 0
10/28/2002 1.0E-03DMW-3D T TRICHLOROETHYLENE (TCE) ND 1 04/22/2003 1.0E-03DMW-3D T TRICHLOROETHYLENE (TCE) ND 1 010/21/2003 1.0E-03DMW-3D T TRICHLOROETHYLENE (TCE) ND 1 04/27/2004 1.0E-03DMW-3D T TRICHLOROETHYLENE (TCE) ND 1 010/26/2004 1.0E-03DMW-3D T TRICHLOROETHYLENE (TCE) ND 1 05/20/2005 1.6E-03DMW-3D T TRICHLOROETHYLENE (TCE) 1 111/8/2005 1.0E-03DMW-3D T TRICHLOROETHYLENE (TCE) ND 1 05/16/2006 1.0E-03DMW-3D T TRICHLOROETHYLENE (TCE) ND 1 0
Note: Increasing (I); Probably Increasing (PI); Stable (S); Probably Decreasing (PD); Decreasing (D); No Trend (NT); Not Applicable (N/A) - Due to insufficient Data (< 4 sampling events); ND = Non-detect
11/6/2006 Page 1 of 1MAROS Version 2.2, 2006, AFCEE

0.37
Coefficient of Variation:
81.2%
Mann Kendall S Statistic:
-61
Confidence in Trend:
S
Mann Kendall Concentration Trend: (See Note)
TRICHLOROETHYLENE (TCE)
Well:Well Type:COC:
T215
Effective DateWell TypeWell Constituent
Data Table:
Result (mg/L) Flag
0.0E+00
5.0E-04
1.0E-03
1.5E-03
2.0E-03
2.5E-03Mar
-94
Dec-94
Sep-95
Jun-96
Mar-97
Dec-97
Oct-98
Dec-99
Oct-01
Apr-03
Oct-04
May-06
Date
Con
cent
ratio
n (m
g/L)
Number of Samples
Number of Detects
MAROS Mann-Kendall Statistics Summary
Consolidation Period:
ND Values:
J Flag Values :
No Time ConsolidationMedianConsolidation Type:
Duplicate Consolidation: AverageSpecified Detection Limit
Actual Value
Time Period: 6/1/1988 5/16/2006to
3/21/1994 1.0E-03215 T TRICHLOROETHYLENE (TCE) 1 16/28/1994 2.1E-03215 T TRICHLOROETHYLENE (TCE) 2 29/21/1994 1.0E-03215 T TRICHLOROETHYLENE (TCE) ND 1 012/19/1994 1.3E-03215 T TRICHLOROETHYLENE (TCE) 1 13/21/1995 1.0E-03215 T TRICHLOROETHYLENE (TCE) ND 1 06/27/1995 1.0E-03215 T TRICHLOROETHYLENE (TCE) ND 1 09/19/1995 1.0E-03215 T TRICHLOROETHYLENE (TCE) ND 1 012/19/1995 1.0E-03215 T TRICHLOROETHYLENE (TCE) ND 1 03/26/1996 1.0E-03215 T TRICHLOROETHYLENE (TCE) ND 1 06/19/1996 1.3E-03215 T TRICHLOROETHYLENE (TCE) 1 19/17/1996 7.4E-04215 T TRICHLOROETHYLENE (TCE) 1 112/17/1996 1.0E-03215 T TRICHLOROETHYLENE (TCE) ND 1 03/25/1997 5.5E-04215 T TRICHLOROETHYLENE (TCE) 1 16/24/1997 1.0E-03215 T TRICHLOROETHYLENE (TCE) ND 1 09/23/1997 1.0E-03215 T TRICHLOROETHYLENE (TCE) ND 1 012/16/1997 1.0E-03215 T TRICHLOROETHYLENE (TCE) ND 1 03/24/1998 4.0E-04215 T TRICHLOROETHYLENE (TCE) 2 26/17/1998 4.4E-04215 T TRICHLOROETHYLENE (TCE) 1 110/1/1998 3.8E-04215 T TRICHLOROETHYLENE (TCE) 2 23/24/1999 2.9E-04215 T TRICHLOROETHYLENE (TCE) 1 16/23/1999 1.0E-03215 T TRICHLOROETHYLENE (TCE) ND 1 012/21/1999 1.0E-03215 T TRICHLOROETHYLENE (TCE) ND 1 0
10/30/2006 Page 1 of 2MAROS Version 2.2, 2006, AFCEE

Result (mg/L) FlagEffective
DateWell TypeWell ConstituentNumber of
SamplesNumber of
Detects
MAROS Mann-Kendall Statistics Summary
6/28/2000 1.0E-03215 T TRICHLOROETHYLENE (TCE) ND 1 012/6/2000 6.5E-04215 T TRICHLOROETHYLENE (TCE) 2 110/30/2001 1.0E-03215 T TRICHLOROETHYLENE (TCE) ND 1 05/1/2002 1.4E-04215 T TRICHLOROETHYLENE (TCE) 1 1
10/28/2002 1.0E-03215 T TRICHLOROETHYLENE (TCE) ND 1 04/22/2003 1.0E-03215 T TRICHLOROETHYLENE (TCE) ND 1 010/21/2003 1.0E-03215 T TRICHLOROETHYLENE (TCE) ND 1 04/27/2004 1.0E-03215 T TRICHLOROETHYLENE (TCE) ND 1 010/26/2004 1.0E-03215 T TRICHLOROETHYLENE (TCE) ND 1 05/20/2005 1.0E-03215 T TRICHLOROETHYLENE (TCE) ND 1 011/8/2005 1.0E-03215 T TRICHLOROETHYLENE (TCE) ND 1 05/16/2006 1.0E-03215 T TRICHLOROETHYLENE (TCE) ND 1 0
Note: Increasing (I); Probably Increasing (PI); Stable (S); Probably Decreasing (PD); Decreasing (D); No Trend (NT); Not Applicable (N/A) - Due to insufficient Data (< 4 sampling events); ND = Non-detect
10/30/2006 Page 2 of 2MAROS Version 2.2, 2006, AFCEE

0.91
Coefficient of Variation:
61.2%
Mann Kendall S Statistic:
22
Confidence in Trend:
NT
Mann Kendall Concentration Trend: (See Note)
TRICHLOROETHYLENE (TCE)
Well:Well Type:COC:
TSW-9
Effective DateWell TypeWell Constituent
Data Table:
Result (mg/L) Flag
0.0E+00
2.0E-03
4.0E-03
6.0E-03
8.0E-03
1.0E-02
1.2E-02
1.4E-02Ju
n-88
Jun-94
Mar-95
Dec-95
Sep-96
Jun-97
Mar-98
Mar-99
Jun-00
May-02
Oct-03
May-05
Date
Con
cent
ratio
n (m
g/L)
Number of Samples
Number of Detects
MAROS Mann-Kendall Statistics Summary
Consolidation Period:
ND Values:
J Flag Values :
No Time ConsolidationMedianConsolidation Type:
Duplicate Consolidation: AverageSpecified Detection Limit
Actual Value
Time Period: 6/1/1988 5/16/2006to
6/1/1988 4.0E-03SW-9 T TRICHLOROETHYLENE (TCE) 1 16/1/1989 2.0E-03SW-9 T TRICHLOROETHYLENE (TCE) 1 1
3/21/1994 4.1E-03SW-9 T TRICHLOROETHYLENE (TCE) 1 16/28/1994 4.6E-03SW-9 T TRICHLOROETHYLENE (TCE) 2 29/21/1994 1.0E-03SW-9 T TRICHLOROETHYLENE (TCE) ND 1 012/19/1994 1.8E-03SW-9 T TRICHLOROETHYLENE (TCE) 1 13/21/1995 2.8E-03SW-9 T TRICHLOROETHYLENE (TCE) 1 16/27/1995 1.5E-03SW-9 T TRICHLOROETHYLENE (TCE) 2 19/19/1995 3.3E-03SW-9 T TRICHLOROETHYLENE (TCE) 1 112/19/1995 1.9E-03SW-9 T TRICHLOROETHYLENE (TCE) 1 13/26/1996 2.0E-03SW-9 T TRICHLOROETHYLENE (TCE) 1 16/19/1996 9.5E-04SW-9 T TRICHLOROETHYLENE (TCE) 2 19/17/1996 1.0E-03SW-9 T TRICHLOROETHYLENE (TCE) ND 1 012/17/1996 2.4E-03SW-9 T TRICHLOROETHYLENE (TCE) 1 13/25/1997 1.1E-03SW-9 T TRICHLOROETHYLENE (TCE) 1 16/24/1997 8.8E-04SW-9 T TRICHLOROETHYLENE (TCE) 3 39/23/1997 1.9E-03SW-9 T TRICHLOROETHYLENE (TCE) 1 112/16/1997 1.6E-03SW-9 T TRICHLOROETHYLENE (TCE) 1 13/24/1998 8.6E-04SW-9 T TRICHLOROETHYLENE (TCE) 1 16/17/1998 1.5E-03SW-9 T TRICHLOROETHYLENE (TCE) 1 110/1/1998 1.1E-03SW-9 T TRICHLOROETHYLENE (TCE) 2 23/24/1999 1.2E-02SW-9 T TRICHLOROETHYLENE (TCE) 1 1
10/30/2006 Page 1 of 2MAROS Version 2.2, 2006, AFCEE

Result (mg/L) FlagEffective
DateWell TypeWell ConstituentNumber of
SamplesNumber of
Detects
MAROS Mann-Kendall Statistics Summary
6/23/1999 9.2E-03SW-9 T TRICHLOROETHYLENE (TCE) 1 112/21/1999 1.2E-02SW-9 T TRICHLOROETHYLENE (TCE) 1 16/28/2000 1.1E-02SW-9 T TRICHLOROETHYLENE (TCE) 1 112/6/2000 7.0E-03SW-9 T TRICHLOROETHYLENE (TCE) 1 110/30/2001 4.4E-03SW-9 T TRICHLOROETHYLENE (TCE) 1 15/1/2002 4.8E-03SW-9 T TRICHLOROETHYLENE (TCE) 1 1
10/28/2002 6.1E-03SW-9 T TRICHLOROETHYLENE (TCE) 1 14/22/2003 6.4E-03SW-9 T TRICHLOROETHYLENE (TCE) 1 110/21/2003 2.0E-03SW-9 T TRICHLOROETHYLENE (TCE) 1 14/27/2004 1.5E-03SW-9 T TRICHLOROETHYLENE (TCE) 2 110/26/2004 2.7E-03SW-9 T TRICHLOROETHYLENE (TCE) 1 15/20/2005 1.8E-03SW-9 T TRICHLOROETHYLENE (TCE) 1 111/8/2005 1.7E-03SW-9 T TRICHLOROETHYLENE (TCE) 1 15/16/2006 1.3E-03SW-9 T TRICHLOROETHYLENE (TCE) 1 1
Note: Increasing (I); Probably Increasing (PI); Stable (S); Probably Decreasing (PD); Decreasing (D); No Trend (NT); Not Applicable (N/A) - Due to insufficient Data (< 4 sampling events); ND = Non-detect
10/30/2006 Page 2 of 2MAROS Version 2.2, 2006, AFCEE

November 7. 2006
LONG-TERM MONITORING NETWORK OPTIMIZATION
PRB AND SOIL REMEDY AREAS
Clare Water Supply Superfund Site Clare, Michigan
APPENDIX B: MAROS Reports PRB Area: COC Assessment Report Mann-Kendall Reports Selected Wells Soil Remedy Area: COC Assessment Report Mann-Kendall Reports Selected Wells

MAROS COC AssessmentMVUser Name:
ClareLocation: MichiganState:
Clare Water SupplyProject:
Prevalence:
Mobility:
Toxicity:
VINYL CHLORIDE
Contaminants of Concern (COC's)
cis-1,2-DICHLOROETHYLENE
Contaminant of ConcernTotal Wells
Total Excedences
Total detectsClass
Percent Excedences
VINYL CHLORIDE ORG 16 1510 62.5%
cis-1,2-DICHLOROETHYLENE ORG 16 133 18.8%
Note: Top COCs by prevalence were determined by examining a representative concentration for each well location at the site. The total excedences (values above the chosen PRGs) are compared to the total number of wells to determine the prevalence of the compound.
Contaminant of Concern Kd
VINYL CHLORIDE 0.042
cis-1,2-DICHLOROETHYLENE 0.0724
Note: Top COCs by mobility were determined by examining each detected compound in the dataset and comparing their mobilities (Koc's for organics, assume foc = 0.001, and Kd's for metals).
Contaminant of Concern
Representative Concentration
(mg/L)PRG
(mg/L)
Percent Above PRG
VINYL CHLORIDE 1.2E-01 1.5E-02 713.2%
cis-1,2-DICHLOROETHYLENE 6.9E-02 6.1E-02 12.9%
Note: Top COCs by toxicity were determined by examining a representative concentration for each compound over the entire site. The compound representative concentrations are then compared with the chosen PRG for that compound, with the percentage excedence from the PRG determining the compound's toxicity. All compounds above exceed the PRG.
Tuesday, November 07, 2006 Page 1 of 1MAROS Version 2.2, 2006, AFCEE

0.18
Coefficient of Variation:
67.5%
Mann Kendall S Statistic:
-3
Confidence in Trend:
S
Mann Kendall Concentration Trend: (See Note)
VINYL CHLORIDE
Well:Well Type:COC:
TMW-301
Effective DateWell TypeWell Constituent
Data Table:
1.00E-03
1.00E-02
1.00E-01
1.00E+00May
-05
Aug-05
Nov-05
Mar-06
May-06
Date
Con
cent
ratio
n (m
g/L)
Result (mg/L) FlagNumber of
SamplesNumber of
Detects
MAROS Mann-Kendall Statistics Summary
Consolidation Period:
ND Values:
J Flag Values :
No Time ConsolidationMedianConsolidation Type:
Duplicate Consolidation: AverageSpecified Detection Limit
Actual Value
Time Period: 1/1/1999 5/17/2006to
5/24/2005 1.5E-03MW-301 T VINYL CHLORIDE 1 18/11/2005 1.5E-03MW-301 T VINYL CHLORIDE 1 111/9/2005 1.0E-03MW-301 T VINYL CHLORIDE ND 1 03/15/2006 1.1E-03MW-301 T VINYL CHLORIDE 1 15/17/2006 1.4E-03MW-301 T VINYL CHLORIDE 1 1
Note: Increasing (I); Probably Increasing (PI); Stable (S); Probably Decreasing (PD); Decreasing (D); No Trend (NT); Not Applicable (N/A) - Due to insufficient Data (< 4 sampling events); ND = Non-detect
10/24/2006 Page 1 of 1MAROS Version 2.2, 2006, AFCEE

0.41
Coefficient of Variation:
88.3%
Mann Kendall S Statistic:
-6
Confidence in Trend:
S
Mann Kendall Concentration Trend: (See Note)
VINYL CHLORIDE
Well:Well Type:COC:
SMW-302
Effective DateWell TypeWell Constituent
Data Table:
1.00E-02
1.00E-01
1.00E+00May
-05
Aug-05
Nov-05
Mar-06
May-06
Date
Con
cent
ratio
n (m
g/L)
Result (mg/L) FlagNumber of
SamplesNumber of
Detects
MAROS Mann-Kendall Statistics Summary
Consolidation Period:
ND Values:
J Flag Values :
No Time ConsolidationMedianConsolidation Type:
Duplicate Consolidation: AverageSpecified Detection Limit
Actual Value
Time Period: 1/1/1999 5/17/2006to
5/24/2005 9.9E-02MW-302 S VINYL CHLORIDE 1 18/11/2005 5.0E-02MW-302 S VINYL CHLORIDE 1 111/9/2005 5.9E-02MW-302 S VINYL CHLORIDE 1 13/15/2006 5.4E-02MW-302 S VINYL CHLORIDE 1 15/17/2006 3.3E-02MW-302 S VINYL CHLORIDE 1 1
Note: Increasing (I); Probably Increasing (PI); Stable (S); Probably Decreasing (PD); Decreasing (D); No Trend (NT); Not Applicable (N/A) - Due to insufficient Data (< 4 sampling events); ND = Non-detect
10/24/2006 Page 1 of 1MAROS Version 2.2, 2006, AFCEE

1.16
Coefficient of Variation:
88.3%
Mann Kendall S Statistic:
-6
Confidence in Trend:
NT
Mann Kendall Concentration Trend: (See Note)
VINYL CHLORIDE
Well:Well Type:COC:
SMW-303
Effective DateWell TypeWell Constituent
Data Table:
0.01
0.1
1
10May
-05
Aug-05
Nov-05
Mar-06
May-06
Date
Con
cent
ratio
n (m
g/L)
Result (mg/L) FlagNumber of
SamplesNumber of
Detects
MAROS Mann-Kendall Statistics Summary
Consolidation Period:
ND Values:
J Flag Values :
No Time ConsolidationMedianConsolidation Type:
Duplicate Consolidation: AverageSpecified Detection Limit
Actual Value
Time Period: 1/1/1999 5/17/2006to
5/24/2005 1.6E+00MW-303 S VINYL CHLORIDE 1 18/11/2005 1.1E+00MW-303 S VINYL CHLORIDE 1 111/9/2005 9.1E-02MW-303 S VINYL CHLORIDE 1 13/15/2006 1.2E-01MW-303 S VINYL CHLORIDE 1 15/17/2006 1.1E-01MW-303 S VINYL CHLORIDE 1 1
Note: Increasing (I); Probably Increasing (PI); Stable (S); Probably Decreasing (PD); Decreasing (D); No Trend (NT); Not Applicable (N/A) - Due to insufficient Data (< 4 sampling events); ND = Non-detect
10/24/2006 Page 1 of 1MAROS Version 2.2, 2006, AFCEE

0.53
Coefficient of Variation:
75.8%
Mann Kendall S Statistic:
-4
Confidence in Trend:
S
Mann Kendall Concentration Trend: (See Note)
VINYL CHLORIDE
Well:Well Type:COC:
TMW-304
Effective DateWell TypeWell Constituent
Data Table:
1.00E-03
1.00E-02
1.00E-01
1.00E+00May
-05
Aug-05
Nov-05
Mar-06
May-06
Date
Con
cent
ratio
n (m
g/L)
Result (mg/L) FlagNumber of
SamplesNumber of
Detects
MAROS Mann-Kendall Statistics Summary
Consolidation Period:
ND Values:
J Flag Values :
No Time ConsolidationMedianConsolidation Type:
Duplicate Consolidation: AverageSpecified Detection Limit
Actual Value
Time Period: 1/1/1999 5/17/2006to
5/24/2005 4.1E-02MW-304 T VINYL CHLORIDE 1 18/11/2005 2.8E-02MW-304 T VINYL CHLORIDE 1 111/9/2005 8.5E-03MW-304 T VINYL CHLORIDE 1 13/15/2006 1.8E-02MW-304 T VINYL CHLORIDE 1 15/17/2006 2.0E-02MW-304 T VINYL CHLORIDE 1 1
Note: Increasing (I); Probably Increasing (PI); Stable (S); Probably Decreasing (PD); Decreasing (D); No Trend (NT); Not Applicable (N/A) - Due to insufficient Data (< 4 sampling events); ND = Non-detect
10/24/2006 Page 1 of 1MAROS Version 2.2, 2006, AFCEE

0.66
Coefficient of Variation:
50.0%
Mann Kendall S Statistic:
-1
Confidence in Trend:
S
Mann Kendall Concentration Trend: (See Note)
VINYL CHLORIDE
Well:Well Type:COC:
SMW-305
Effective DateWell TypeWell Constituent
Data Table:
0.01
0.1
1May
-05
Aug-05
Nov-05
Mar-06
May-06
Date
Con
cent
ratio
n (m
g/L)
Result (mg/L) FlagNumber of
SamplesNumber of
Detects
MAROS Mann-Kendall Statistics Summary
Consolidation Period:
ND Values:
J Flag Values :
No Time ConsolidationMedianConsolidation Type:
Duplicate Consolidation: AverageSpecified Detection Limit
Actual Value
Time Period: 1/1/1999 5/17/2006to
5/24/2005 2.4E-01MW-305 S VINYL CHLORIDE 1 18/11/2005 6.8E-02MW-305 S VINYL CHLORIDE 1 111/9/2005 2.3E-02MW-305 S VINYL CHLORIDE 1 13/15/2006 2.4E-01MW-305 S VINYL CHLORIDE 1 15/17/2006 1.9E-01MW-305 S VINYL CHLORIDE 1 1
Note: Increasing (I); Probably Increasing (PI); Stable (S); Probably Decreasing (PD); Decreasing (D); No Trend (NT); Not Applicable (N/A) - Due to insufficient Data (< 4 sampling events); ND = Non-detect
10/24/2006 Page 1 of 1MAROS Version 2.2, 2006, AFCEE

1.08
Coefficient of Variation:
95.8%
Mann Kendall S Statistic:
-8
Confidence in Trend:
D
Mann Kendall Concentration Trend: (See Note)
VINYL CHLORIDE
Well:Well Type:COC:
TMW-306
Effective DateWell TypeWell Constituent
Data Table:
1.00E-03
1.00E-02
1.00E-01
1.00E+00May
-05
Aug-05
Nov-05
Mar-06
May-06
Date
Con
cent
ratio
n (m
g/L)
Result (mg/L) FlagNumber of
SamplesNumber of
Detects
MAROS Mann-Kendall Statistics Summary
Consolidation Period:
ND Values:
J Flag Values :
No Time ConsolidationMedianConsolidation Type:
Duplicate Consolidation: AverageSpecified Detection Limit
Actual Value
Time Period: 1/1/1999 5/17/2006to
5/24/2005 1.5E-02MW-306 T VINYL CHLORIDE 1 18/11/2005 4.4E-03MW-306 T VINYL CHLORIDE 1 111/9/2005 2.4E-03MW-306 T VINYL CHLORIDE 1 13/15/2006 2.0E-03MW-306 T VINYL CHLORIDE 1 15/17/2006 2.1E-03MW-306 T VINYL CHLORIDE 1 1
Note: Increasing (I); Probably Increasing (PI); Stable (S); Probably Decreasing (PD); Decreasing (D); No Trend (NT); Not Applicable (N/A) - Due to insufficient Data (< 4 sampling events); ND = Non-detect
10/24/2006 Page 1 of 1MAROS Version 2.2, 2006, AFCEE

1.03
Coefficient of Variation:
75.8%
Mann Kendall S Statistic:
-4
Confidence in Trend:
NT
Mann Kendall Concentration Trend: (See Note)
VINYL CHLORIDE
Well:Well Type:COC:
TMw-307
Effective DateWell TypeWell Constituent
Data Table:
1.00E-03
1.00E-02
1.00E-01
1.00E+00May
-05
Aug-05
Nov-05
Mar-06
May-06
Date
Con
cent
ratio
n (m
g/L)
Result (mg/L) FlagNumber of
SamplesNumber of
Detects
MAROS Mann-Kendall Statistics Summary
Consolidation Period:
ND Values:
J Flag Values :
No Time ConsolidationMedianConsolidation Type:
Duplicate Consolidation: AverageSpecified Detection Limit
Actual Value
Time Period: 1/1/1999 5/17/2006to
5/24/2005 3.3E-02Mw-307 T VINYL CHLORIDE 1 18/11/2005 1.1E-02Mw-307 T VINYL CHLORIDE 1 111/9/2005 1.0E-03Mw-307 T VINYL CHLORIDE ND 1 03/15/2006 5.0E-03Mw-307 T VINYL CHLORIDE 1 15/17/2006 1.0E-02Mw-307 T VINYL CHLORIDE 1 1
Note: Increasing (I); Probably Increasing (PI); Stable (S); Probably Decreasing (PD); Decreasing (D); No Trend (NT); Not Applicable (N/A) - Due to insufficient Data (< 4 sampling events); ND = Non-detect
10/24/2006 Page 1 of 1MAROS Version 2.2, 2006, AFCEE

0.39
Coefficient of Variation:
59.2%
Mann Kendall S Statistic:
2
Confidence in Trend:
NT
Mann Kendall Concentration Trend: (See Note)
VINYL CHLORIDE
Well:Well Type:COC:
TMW-308
Effective DateWell TypeWell Constituent
Data Table:
1.00E-02
1.00E-01
1.00E+00May
-05
Aug-05
Nov-05
Mar-06
May-06
Date
Con
cent
ratio
n (m
g/L)
Result (mg/L) FlagNumber of
SamplesNumber of
Detects
MAROS Mann-Kendall Statistics Summary
Consolidation Period:
ND Values:
J Flag Values :
No Time ConsolidationMedianConsolidation Type:
Duplicate Consolidation: AverageSpecified Detection Limit
Actual Value
Time Period: 1/1/1999 5/17/2006to
5/24/2005 5.5E-02MW-308 T VINYL CHLORIDE 1 18/11/2005 2.6E-02MW-308 T VINYL CHLORIDE 1 111/9/2005 2.3E-02MW-308 T VINYL CHLORIDE 1 13/15/2006 4.5E-02MW-308 T VINYL CHLORIDE 1 15/17/2006 5.8E-02MW-308 T VINYL CHLORIDE 1 1
Note: Increasing (I); Probably Increasing (PI); Stable (S); Probably Decreasing (PD); Decreasing (D); No Trend (NT); Not Applicable (N/A) - Due to insufficient Data (< 4 sampling events); ND = Non-detect
10/24/2006 Page 1 of 1MAROS Version 2.2, 2006, AFCEE

0.58
Coefficient of Variation:
59.2%
Mann Kendall S Statistic:
2
Confidence in Trend:
NT
Mann Kendall Concentration Trend: (See Note)
VINYL CHLORIDE
Well:Well Type:COC:
TMw-309
Effective DateWell TypeWell Constituent
Data Table:
1.00E-02
1.00E-01
1.00E+00May
-05
Aug-05
Nov-05
Mar-06
May-06
Date
Con
cent
ratio
n (m
g/L)
Result (mg/L) FlagNumber of
SamplesNumber of
Detects
MAROS Mann-Kendall Statistics Summary
Consolidation Period:
ND Values:
J Flag Values :
No Time ConsolidationMedianConsolidation Type:
Duplicate Consolidation: AverageSpecified Detection Limit
Actual Value
Time Period: 1/1/1999 5/17/2006to
5/24/2005 4.8E-02Mw-309 T VINYL CHLORIDE 1 18/11/2005 1.4E-02Mw-309 T VINYL CHLORIDE 1 111/9/2005 1.6E-02Mw-309 T VINYL CHLORIDE 1 13/15/2006 1.8E-02Mw-309 T VINYL CHLORIDE 1 15/17/2006 2.5E-02Mw-309 T VINYL CHLORIDE 1 1
Note: Increasing (I); Probably Increasing (PI); Stable (S); Probably Decreasing (PD); Decreasing (D); No Trend (NT); Not Applicable (N/A) - Due to insufficient Data (< 4 sampling events); ND = Non-detect
10/24/2006 Page 1 of 1MAROS Version 2.2, 2006, AFCEE

0.60
Coefficient of Variation:
88.3%
Mann Kendall S Statistic:
6
Confidence in Trend:
NT
Mann Kendall Concentration Trend: (See Note)
VINYL CHLORIDE
Well:Well Type:COC:
TMW-310
Effective DateWell TypeWell Constituent
Data Table:
1.00E-03
1.00E-02
1.00E-01
1.00E+00May
-05
Aug-05
Nov-05
Mar-06
May-06
Date
Con
cent
ratio
n (m
g/L)
Result (mg/L) FlagNumber of
SamplesNumber of
Detects
MAROS Mann-Kendall Statistics Summary
Consolidation Period:
ND Values:
J Flag Values :
No Time ConsolidationMedianConsolidation Type:
Duplicate Consolidation: AverageSpecified Detection Limit
Actual Value
Time Period: 1/1/1999 5/17/2006to
5/24/2005 7.1E-03MW-310 T VINYL CHLORIDE 1 18/11/2005 1.9E-02MW-310 T VINYL CHLORIDE 1 111/9/2005 5.2E-03MW-310 T VINYL CHLORIDE 1 13/15/2006 2.5E-02MW-310 T VINYL CHLORIDE 1 15/17/2006 2.7E-02MW-310 T VINYL CHLORIDE 1 1
Note: Increasing (I); Probably Increasing (PI); Stable (S); Probably Decreasing (PD); Decreasing (D); No Trend (NT); Not Applicable (N/A) - Due to insufficient Data (< 4 sampling events); ND = Non-detect
10/24/2006 Page 1 of 1MAROS Version 2.2, 2006, AFCEE

0.70
Coefficient of Variation:
59.2%
Mann Kendall S Statistic:
-2
Confidence in Trend:
S
Mann Kendall Concentration Trend: (See Note)
VINYL CHLORIDE
Well:Well Type:COC:
TMW-311
Effective DateWell TypeWell Constituent
Data Table:
1.00E-02
1.00E-01
1.00E+00May
-05
Aug-05
Nov-05
Mar-06
May-06
Date
Con
cent
ratio
n (m
g/L)
Result (mg/L) FlagNumber of
SamplesNumber of
Detects
MAROS Mann-Kendall Statistics Summary
Consolidation Period:
ND Values:
J Flag Values :
No Time ConsolidationMedianConsolidation Type:
Duplicate Consolidation: AverageSpecified Detection Limit
Actual Value
Time Period: 1/1/1999 5/17/2006to
5/24/2005 2.9E-02MW-311 T VINYL CHLORIDE 1 18/11/2005 6.9E-02MW-311 T VINYL CHLORIDE 1 111/9/2005 1.5E-02MW-311 T VINYL CHLORIDE 1 13/15/2006 1.7E-02MW-311 T VINYL CHLORIDE 1 15/17/2006 2.6E-02MW-311 T VINYL CHLORIDE 1 1
Note: Increasing (I); Probably Increasing (PI); Stable (S); Probably Decreasing (PD); Decreasing (D); No Trend (NT); Not Applicable (N/A) - Due to insufficient Data (< 4 sampling events); ND = Non-detect
10/24/2006 Page 1 of 1MAROS Version 2.2, 2006, AFCEE

0.00
Coefficient of Variation:
40.8%
Mann Kendall S Statistic:
0
Confidence in Trend:
S
Mann Kendall Concentration Trend: (See Note)
VINYL CHLORIDE
Well:Well Type:COC:
TMW-312
Effective DateWell TypeWell Constituent
Data Table:
Result (mg/L) Flag
0.0E+00
2.0E-04
4.0E-04
6.0E-04
8.0E-04
1.0E-03
1.2E-03May
-05
Aug-05
Nov-05
Mar-06
May-06
Date
Con
cent
ratio
n (m
g/L)
Number of Samples
Number of Detects
MAROS Mann-Kendall Statistics Summary
Consolidation Period:
ND Values:
J Flag Values :
No Time ConsolidationMedianConsolidation Type:
Duplicate Consolidation: AverageSpecified Detection Limit
Actual Value
Time Period: 1/1/1999 5/18/2006to
5/24/2005 1.0E-03MW-312 T VINYL CHLORIDE ND 1 08/11/2005 1.0E-03MW-312 T VINYL CHLORIDE ND 1 011/9/2005 1.0E-03MW-312 T VINYL CHLORIDE ND 1 03/15/2006 1.0E-03MW-312 T VINYL CHLORIDE ND 1 05/17/2006 1.0E-03MW-312 T VINYL CHLORIDE ND 1 0
Note: Increasing (I); Probably Increasing (PI); Stable (S); Probably Decreasing (PD); Decreasing (D); No Trend (NT); Not Applicable (N/A) - Due to insufficient Data (< 4 sampling events); ND = Non-detect
11/6/2006 Page 1 of 1MAROS Version 2.2, 2006, AFCEE

0.13
Coefficient of Variation:
75.8%
Mann Kendall S Statistic:
4
Confidence in Trend:
NT
Mann Kendall Concentration Trend: (See Note)
VINYL CHLORIDE
Well:Well Type:COC:
TMW-313
Effective DateWell TypeWell Constituent
Data Table:
1.00E-04
1.00E-03
1.00E-02
1.00E-01
1.00E+00May
-05
Aug-05
Nov-05
Mar-06
May-06
Date
Con
cent
ratio
n (m
g/L)
Result (mg/L) FlagNumber of
SamplesNumber of
Detects
MAROS Mann-Kendall Statistics Summary
Consolidation Period:
ND Values:
J Flag Values :
No Time ConsolidationMedianConsolidation Type:
Duplicate Consolidation: AverageSpecified Detection Limit
Actual Value
Time Period: 1/1/1999 5/18/2006to
5/24/2005 7.3E-04MW-313 T VINYL CHLORIDE 1 18/11/2005 1.0E-03MW-313 T VINYL CHLORIDE ND 1 011/9/2005 1.0E-03MW-313 T VINYL CHLORIDE ND 1 03/15/2006 1.0E-03MW-313 T VINYL CHLORIDE ND 1 05/17/2006 1.0E-03MW-313 T VINYL CHLORIDE ND 1 0
Note: Increasing (I); Probably Increasing (PI); Stable (S); Probably Decreasing (PD); Decreasing (D); No Trend (NT); Not Applicable (N/A) - Due to insufficient Data (< 4 sampling events); ND = Non-detect
11/6/2006 Page 1 of 1MAROS Version 2.2, 2006, AFCEE

0.72
Coefficient of Variation:
99.8%
Mann Kendall S Statistic:
56
Confidence in Trend:
I
Mann Kendall Concentration Trend: (See Note)
VINYL CHLORIDE
Well:Well Type:COC:
S300A
Effective DateWell TypeWell Constituent
Data Table:
0.1
1
10Dec
-99
Jun-00
Dec-00
Oct-01
May-02
Oct-02
Apr-03
Oct-03
Apr-04
Oct-04
May-05
Aug-05
Nov-05
Mar-06
May-06
Date
Con
cent
ratio
n (m
g/L)
Result (mg/L) FlagNumber of
SamplesNumber of
Detects
MAROS Mann-Kendall Statistics Summary
Consolidation Period:
ND Values:
J Flag Values :
No Time ConsolidationMedianConsolidation Type:
Duplicate Consolidation: AverageSpecified Detection Limit
Actual Value
Time Period: 1/1/1999 5/17/2006to
12/12/1999 2.9E-01300A S VINYL CHLORIDE 2 26/28/2000 3.3E-01300A S VINYL CHLORIDE 1 112/6/2000 6.6E-01300A S VINYL CHLORIDE 1 110/30/2001 3.9E-01300A S VINYL CHLORIDE 1 15/1/2002 7.0E-01300A S VINYL CHLORIDE 2 2
10/29/2002 7.3E-01300A S VINYL CHLORIDE 1 14/22/2003 9.8E-01300A S VINYL CHLORIDE 1 110/21/2003 9.0E-01300A S VINYL CHLORIDE 1 14/27/2004 9.4E-01300A S VINYL CHLORIDE 1 110/27/2004 9.4E-01300A S VINYL CHLORIDE 1 15/24/2005 1.4E+00300A S VINYL CHLORIDE 1 18/11/2005 1.5E+00300A S VINYL CHLORIDE 1 111/9/2005 3.0E+00300A S VINYL CHLORIDE 2 23/15/2006 5.5E-01300A S VINYL CHLORIDE 1 15/17/2006 6.1E-01300A S VINYL CHLORIDE 1 1
Note: Increasing (I); Probably Increasing (PI); Stable (S); Probably Decreasing (PD); Decreasing (D); No Trend (NT); Not Applicable (N/A) - Due to insufficient Data (< 4 sampling events); ND = Non-detect
10/24/2006 Page 1 of 1MAROS Version 2.2, 2006, AFCEE

1.10
Coefficient of Variation:
100.0%
Mann Kendall S Statistic:
62
Confidence in Trend:
I
Mann Kendall Concentration Trend: (See Note)
VINYL CHLORIDE
Well:Well Type:COC:
S300B
Effective DateWell TypeWell Constituent
Data Table:
1.00E-03
1.00E-02
1.00E-01
1.00E+00Dec
-99
Jun-00
Dec-00
Oct-01
May-02
Oct-02
Apr-03
Oct-03
Apr-04
Oct-04
May-05
Nov-05
May-06
Date
Con
cent
ratio
n (m
g/L)
Result (mg/L) FlagNumber of
SamplesNumber of
Detects
MAROS Mann-Kendall Statistics Summary
Consolidation Period:
ND Values:
J Flag Values :
No Time ConsolidationMedianConsolidation Type:
Duplicate Consolidation: AverageSpecified Detection Limit
Actual Value
Time Period: 1/1/1999 5/17/2006to
12/12/1999 1.4E-02300B S VINYL CHLORIDE 1 16/28/2000 2.0E-02300B S VINYL CHLORIDE 1 112/6/2000 7.2E-03300B S VINYL CHLORIDE 1 110/30/2001 3.6E-03300B S VINYL CHLORIDE 1 15/1/2002 1.0E-02300B S VINYL CHLORIDE 1 1
10/29/2002 2.4E-02300B S VINYL CHLORIDE 1 14/22/2003 3.4E-02300B S VINYL CHLORIDE 1 110/21/2003 3.7E-02300B S VINYL CHLORIDE 1 14/27/2004 6.2E-02300B S VINYL CHLORIDE 1 110/27/2004 4.8E-02300B S VINYL CHLORIDE 1 15/24/2005 1.1E-01300B S VINYL CHLORIDE 1 111/9/2005 1.4E-01300B S VINYL CHLORIDE 1 15/17/2006 2.0E-01300B S VINYL CHLORIDE 1 1
Note: Increasing (I); Probably Increasing (PI); Stable (S); Probably Decreasing (PD); Decreasing (D); No Trend (NT); Not Applicable (N/A) - Due to insufficient Data (< 4 sampling events); ND = Non-detect
10/24/2006 Page 1 of 1MAROS Version 2.2, 2006, AFCEE

1.38
Coefficient of Variation:
99.6%
Mann Kendall S Statistic:
43
Confidence in Trend:
I
Mann Kendall Concentration Trend: (See Note)
VINYL CHLORIDE
Well:Well Type:COC:
T300C
Effective DateWell TypeWell Constituent
Data Table:
Result (mg/L) Flag
0.0E+00
5.0E-03
1.0E-02
1.5E-02
2.0E-02
2.5E-02
3.0E-02Dec
-99
Jul-0
0Dec
-00
Oct-01
May-02
Oct-02
Apr-03
Oct-03
Apr-04
Oct-04
May-05
Nov-05
May-06
Date
Con
cent
ratio
n (m
g/L)
Number of Samples
Number of Detects
MAROS Mann-Kendall Statistics Summary
Consolidation Period:
ND Values:
J Flag Values :
No Time ConsolidationMedianConsolidation Type:
Duplicate Consolidation: AverageSpecified Detection Limit
Actual Value
Time Period: 1/1/1999 5/18/2006to
12/12/1999 1.0E-03300C T VINYL CHLORIDE ND 1 07/21/2000 7.3E-04300C T VINYL CHLORIDE 1 112/6/2000 2.9E-04300C T VINYL CHLORIDE 1 110/30/2001 1.0E-03300C T VINYL CHLORIDE ND 1 05/1/2002 1.0E-03300C T VINYL CHLORIDE ND 1 0
10/29/2002 3.2E-03300C T VINYL CHLORIDE 1 14/22/2003 1.0E-03300C T VINYL CHLORIDE ND 1 010/21/2003 1.3E-02300C T VINYL CHLORIDE 1 14/27/2004 1.6E-03300C T VINYL CHLORIDE 1 110/27/2004 2.4E-02300C T VINYL CHLORIDE 1 15/24/2005 2.4E-02300C T VINYL CHLORIDE 1 111/9/2005 2.7E-02300C T VINYL CHLORIDE 1 15/17/2006 1.0E-03300C T VINYL CHLORIDE ND 1 0
Note: Increasing (I); Probably Increasing (PI); Stable (S); Probably Decreasing (PD); Decreasing (D); No Trend (NT); Not Applicable (N/A) - Due to insufficient Data (< 4 sampling events); ND = Non-detect
11/6/2006 Page 1 of 1MAROS Version 2.2, 2006, AFCEE

0.19
Coefficient of Variation:
63.3%
Mann Kendall S Statistic:
-8
Confidence in Trend:
S
Mann Kendall Concentration Trend: (See Note)
VINYL CHLORIDE
Well:Well Type:COC:
T220
Effective DateWell TypeWell Constituent
Data Table:
Result (mg/L) Flag
0.0E+00
2.0E-04
4.0E-04
6.0E-04
8.0E-04
1.0E-03
1.2E-03Mar
-99
Jun-99
Dec-99
Jun-00
Dec-00
Oct-01
May-02
Oct-02
Apr-03
Oct-03
Apr-04
Oct-04
May-05
Nov-05
May-06
Date
Con
cent
ratio
n (m
g/L)
Number of Samples
Number of Detects
MAROS Mann-Kendall Statistics Summary
Consolidation Period:
ND Values:
J Flag Values :
No Time ConsolidationMedianConsolidation Type:
Duplicate Consolidation: AverageSpecified Detection Limit
Actual Value
Time Period: 1/1/1999 5/18/2006to
3/24/1999 1.0E-03220 T VINYL CHLORIDE ND 1 06/23/1999 1.0E-03220 T VINYL CHLORIDE ND 1 012/12/1999 1.0E-03220 T VINYL CHLORIDE ND 1 06/28/2000 1.0E-03220 T VINYL CHLORIDE ND 2 012/6/2000 1.0E-03220 T VINYL CHLORIDE ND 1 010/30/2001 1.0E-03220 T VINYL CHLORIDE ND 2 05/1/2002 1.0E-03220 T VINYL CHLORIDE ND 1 0
10/29/2002 1.0E-03220 T VINYL CHLORIDE ND 1 04/22/2003 1.0E-03220 T VINYL CHLORIDE ND 1 010/21/2003 1.0E-03220 T VINYL CHLORIDE ND 1 04/27/2004 1.0E-03220 T VINYL CHLORIDE ND 1 010/27/2004 3.1E-04220 T VINYL CHLORIDE 1 15/24/2005 1.0E-03220 T VINYL CHLORIDE ND 1 011/9/2005 1.0E-03220 T VINYL CHLORIDE ND 1 05/17/2006 1.0E-03220 T VINYL CHLORIDE ND 1 0
Note: Increasing (I); Probably Increasing (PI); Stable (S); Probably Decreasing (PD); Decreasing (D); No Trend (NT); Not Applicable (N/A) - Due to insufficient Data (< 4 sampling events); ND = Non-detect
11/6/2006 Page 1 of 1MAROS Version 2.2, 2006, AFCEE

MAROS COC AssessmentMVUser Name:
ClareLocation: MichiganState:
Soil RemedyProject:
Prevalence:
Mobility:
Toxicity:
VINYL CHLORIDE
Contaminants of Concern (COC's)
TRICHLOROETHYLENE (TCE)
cis-1,2-DICHLOROETHYLENE
Contaminant of ConcernTotal Wells
Total Excedences
Total detectsClass
Percent Excedences
TRICHLOROETHYLENE (TCE) ORG 8 52 25.0%
Note: Top COCs by prevalence were determined by examining a representative concentration for each well location at the site. The total excedences (values above the chosen PRGs) are compared to the total number of wells to determine the prevalence of the compound.
Contaminant of Concern Kd
TRICHLOROETHYLENE (TCE) 0.297
Note: Top COCs by mobility were determined by examining each detected compound in the dataset and comparing their mobilities (Koc's for organics, assume foc = 0.001, and Kd's for metals).
Contaminant of Concern
Representative Concentration
(mg/L)PRG
(mg/L)
Percent Above PRG
TRICHLOROETHYLENE (TCE) 5.3E-03 5.0E-03 6.9%
Note: Top COCs by toxicity were determined by examining a representative concentration for each compound over the entire site. The compound representative concentrations are then compared with the chosen PRG for that compound, with the percentage excedence from the PRG determining the compound's toxicity. All compounds above exceed the PRG.
Saturday, October 28, 2006 Page 1 of 1MAROS Version 2.2, 2006, AFCEE

0.00
Coefficient of Variation:
48.0%
Mann Kendall S Statistic:
0
Confidence in Trend:
S
Mann Kendall Concentration Trend: (See Note)
TRICHLOROETHYLENE (TCE)
Well:Well Type:COC:
TUMW-1S
Effective DateWell TypeWell Constituent
Data Table:
Result (mg/L) Flag
0.0E+00
2.0E-04
4.0E-04
6.0E-04
8.0E-04
1.0E-03
1.2E-03Mar
-99
Jun-99
Dec-99
Jun-00
Dec-00
Oct-01
May-02
Oct-02
Apr-03
Oct-03
Apr-04
Oct-04
May-05
Nov-05
May-06
Date
Con
cent
ratio
n (m
g/L)
Number of Samples
Number of Detects
MAROS Mann-Kendall Statistics Summary
Consolidation Period:
ND Values:
J Flag Values :
No Time ConsolidationMedianConsolidation Type:
Duplicate Consolidation: AverageSpecified Detection Limit
Actual Value
Time Period: 1/1/1999 5/18/2006to
3/24/1999 1.0E-03UMW-1S T TRICHLOROETHYLENE (TCE) ND 1 06/23/1999 1.0E-03UMW-1S T TRICHLOROETHYLENE (TCE) ND 1 012/21/1999 1.0E-03UMW-1S T TRICHLOROETHYLENE (TCE) ND 1 06/28/2000 1.0E-03UMW-1S T TRICHLOROETHYLENE (TCE) ND 1 012/6/2000 1.0E-03UMW-1S T TRICHLOROETHYLENE (TCE) ND 1 010/30/2001 1.0E-03UMW-1S T TRICHLOROETHYLENE (TCE) ND 1 05/1/2002 1.0E-03UMW-1S T TRICHLOROETHYLENE (TCE) ND 1 0
10/28/2002 1.0E-03UMW-1S T TRICHLOROETHYLENE (TCE) ND 1 04/22/2003 1.0E-03UMW-1S T TRICHLOROETHYLENE (TCE) ND 1 010/21/2003 1.0E-03UMW-1S T TRICHLOROETHYLENE (TCE) ND 1 04/27/2004 1.0E-03UMW-1S T TRICHLOROETHYLENE (TCE) ND 1 010/26/2004 1.0E-03UMW-1S T TRICHLOROETHYLENE (TCE) ND 1 05/20/2005 1.0E-03UMW-1S T TRICHLOROETHYLENE (TCE) ND 1 011/8/2005 1.0E-03UMW-1S T TRICHLOROETHYLENE (TCE) ND 1 05/16/2006 1.0E-03UMW-1S T TRICHLOROETHYLENE (TCE) ND 1 0
Note: Increasing (I); Probably Increasing (PI); Stable (S); Probably Decreasing (PD); Decreasing (D); No Trend (NT); Not Applicable (N/A) - Due to insufficient Data (< 4 sampling events); ND = Non-detect
11/6/2006 Page 1 of 1MAROS Version 2.2, 2006, AFCEE

1.61
Coefficient of Variation:
100.0%
Mann Kendall S Statistic:
-93
Confidence in Trend:
D
Mann Kendall Concentration Trend: (See Note)
TRICHLOROETHYLENE (TCE)
Well:Well Type:COC:
SDMW-1S
Effective DateWell TypeWell Constituent
Data Table:
Result (mg/L) Flag
0.0E+00
2.0E-02
4.0E-02
6.0E-02
8.0E-02
1.0E-01
1.2E-01Mar
-99
Jun-99
Dec-99
Jun-00
Dec-00
Oct-01
May-02
Oct-02
Apr-03
Oct-03
Apr-04
Oct-04
May-05
Nov-05
May-06
Date
Con
cent
ratio
n (m
g/L)
Number of Samples
Number of Detects
MAROS Mann-Kendall Statistics Summary
Consolidation Period:
ND Values:
J Flag Values :
No Time ConsolidationMedianConsolidation Type:
Duplicate Consolidation: AverageSpecified Detection Limit
Actual Value
Time Period: 3/24/1999 5/16/2006to
3/24/1999 9.9E-02DMW-1S S TRICHLOROETHYLENE (TCE) 1 16/23/1999 6.7E-02DMW-1S S TRICHLOROETHYLENE (TCE) 1 112/21/1999 1.4E-02DMW-1S S TRICHLOROETHYLENE (TCE) 1 16/28/2000 1.3E-02DMW-1S S TRICHLOROETHYLENE (TCE) 1 112/6/2000 1.0E-02DMW-1S S TRICHLOROETHYLENE (TCE) 1 110/30/2001 9.0E-03DMW-1S S TRICHLOROETHYLENE (TCE) 1 15/1/2002 7.0E-03DMW-1S S TRICHLOROETHYLENE (TCE) 1 1
10/28/2002 7.0E-03DMW-1S S TRICHLOROETHYLENE (TCE) 1 14/22/2003 9.0E-03DMW-1S S TRICHLOROETHYLENE (TCE) 1 110/21/2003 4.0E-03DMW-1S S TRICHLOROETHYLENE (TCE) 1 14/27/2004 4.0E-03DMW-1S S TRICHLOROETHYLENE (TCE) 1 110/26/2004 4.0E-03DMW-1S S TRICHLOROETHYLENE (TCE) 1 15/20/2005 4.0E-03DMW-1S S TRICHLOROETHYLENE (TCE) 1 111/8/2005 3.2E-03DMW-1S S TRICHLOROETHYLENE (TCE) 1 15/16/2006 2.9E-03DMW-1S S TRICHLOROETHYLENE (TCE) 1 1
Note: Increasing (I); Probably Increasing (PI); Stable (S); Probably Decreasing (PD); Decreasing (D); No Trend (NT); Not Applicable (N/A) - Due to insufficient Data (< 4 sampling events); ND = Non-detect
10/28/2006 Page 1 of 1MAROS Version 2.2, 2006, AFCEE

1.62
Coefficient of Variation:
81.0%
Mann Kendall S Statistic:
-19
Confidence in Trend:
NT
Mann Kendall Concentration Trend: (See Note)
cis-1,2-DICHLOROETHYLENE
Well:Well Type:COC:
SDMW-1S
Effective DateWell TypeWell Constituent
Data Table:
Result (mg/L) Flag
0.0E+002.0E-024.0E-026.0E-028.0E-021.0E-011.2E-011.4E-011.6E-011.8E-012.0E-01
Mar-99
Jun-99
Dec-99
Jun-00
Dec-00
Oct-01
May-02
Oct-02
Apr-03
Oct-03
Apr-04
Oct-04
May-05
Nov-05
May-06
Date
Con
cent
ratio
n (m
g/L)
Number of Samples
Number of Detects
MAROS Mann-Kendall Statistics Summary
Consolidation Period:
ND Values:
J Flag Values :
No Time ConsolidationMedianConsolidation Type:
Duplicate Consolidation: AverageSpecified Detection Limit
Actual Value
Time Period: 3/24/1999 5/16/2006to
3/24/1999 2.4E-02DMW-1S S cis-1,2-DICHLOROETHYLENE 1 16/23/1999 8.0E-03DMW-1S S cis-1,2-DICHLOROETHYLENE 1 112/21/1999 4.0E-03DMW-1S S cis-1,2-DICHLOROETHYLENE 1 16/28/2000 3.0E-03DMW-1S S cis-1,2-DICHLOROETHYLENE 1 112/6/2000 2.3E-02DMW-1S S cis-1,2-DICHLOROETHYLENE 1 110/30/2001 6.7E-02DMW-1S S cis-1,2-DICHLOROETHYLENE 1 15/1/2002 6.0E-03DMW-1S S cis-1,2-DICHLOROETHYLENE 1 1
10/28/2002 1.8E-01DMW-1S S cis-1,2-DICHLOROETHYLENE 1 14/22/2003 2.0E-02DMW-1S S cis-1,2-DICHLOROETHYLENE 1 110/21/2003 9.0E-03DMW-1S S cis-1,2-DICHLOROETHYLENE 1 14/27/2004 5.0E-03DMW-1S S cis-1,2-DICHLOROETHYLENE 1 110/26/2004 9.3E-02DMW-1S S cis-1,2-DICHLOROETHYLENE 1 15/20/2005 5.9E-03DMW-1S S cis-1,2-DICHLOROETHYLENE 1 111/8/2005 5.5E-03DMW-1S S cis-1,2-DICHLOROETHYLENE 1 15/16/2006 2.9E-03DMW-1S S cis-1,2-DICHLOROETHYLENE 1 1
Note: Increasing (I); Probably Increasing (PI); Stable (S); Probably Decreasing (PD); Decreasing (D); No Trend (NT); Not Applicable (N/A) - Due to insufficient Data (< 4 sampling events); ND = Non-detect
10/28/2006 Page 1 of 1MAROS Version 2.2, 2006, AFCEE

0.95
Coefficient of Variation:
99.3%
Mann Kendall S Statistic:
-45
Confidence in Trend:
D
Mann Kendall Concentration Trend: (See Note)
TRICHLOROETHYLENE (TCE)
Well:Well Type:COC:
SDMW-2S
Effective DateWell TypeWell Constituent
Data Table:
Result (mg/L) Flag
0.0E+00
1.0E-03
2.0E-03
3.0E-03
4.0E-03
5.0E-03
6.0E-03
7.0E-03
8.0E-03Mar
-99
Jun-99
Dec-99
Jun-00
Dec-00
Oct-01
May-02
Oct-02
Apr-03
Oct-03
Apr-04
Oct-04
May-05
May-06
Date
Con
cent
ratio
n (m
g/L)
Number of Samples
Number of Detects
MAROS Mann-Kendall Statistics Summary
Consolidation Period:
ND Values:
J Flag Values :
No Time ConsolidationMedianConsolidation Type:
Duplicate Consolidation: AverageSpecified Detection Limit
Actual Value
Time Period: 3/24/1999 5/16/2006to
3/24/1999 5.0E-03DMW-2S S TRICHLOROETHYLENE (TCE) 1 16/23/1999 7.0E-03DMW-2S S TRICHLOROETHYLENE (TCE) 1 112/21/1999 2.0E-03DMW-2S S TRICHLOROETHYLENE (TCE) 1 16/28/2000 1.0E-03DMW-2S S TRICHLOROETHYLENE (TCE) ND 1 012/6/2000 1.0E-03DMW-2S S TRICHLOROETHYLENE (TCE) ND 1 010/30/2001 2.0E-03DMW-2S S TRICHLOROETHYLENE (TCE) 1 15/1/2002 1.0E-03DMW-2S S TRICHLOROETHYLENE (TCE) 1 1
10/28/2002 2.0E-03DMW-2S S TRICHLOROETHYLENE (TCE) 1 14/22/2003 1.0E-03DMW-2S S TRICHLOROETHYLENE (TCE) ND 1 010/21/2003 1.0E-03DMW-2S S TRICHLOROETHYLENE (TCE) ND 1 04/27/2004 1.0E-03DMW-2S S TRICHLOROETHYLENE (TCE) ND 1 010/26/2004 1.0E-03DMW-2S S TRICHLOROETHYLENE (TCE) ND 1 05/20/2005 1.0E-03DMW-2S S TRICHLOROETHYLENE (TCE) ND 1 05/16/2006 7.9E-04DMW-2S S TRICHLOROETHYLENE (TCE) 1 1
Note: Increasing (I); Probably Increasing (PI); Stable (S); Probably Decreasing (PD); Decreasing (D); No Trend (NT); Not Applicable (N/A) - Due to insufficient Data (< 4 sampling events); ND = Non-detect
10/28/2006 Page 1 of 1MAROS Version 2.2, 2006, AFCEE

0.58
Coefficient of Variation:
95.4%
Mann Kendall S Statistic:
-35
Confidence in Trend:
D
Mann Kendall Concentration Trend: (See Note)
TRICHLOROETHYLENE (TCE)
Well:Well Type:COC:
SDMW-3S
Effective DateWell TypeWell Constituent
Data Table:
Result (mg/L) Flag
0.0E+00
1.0E-02
2.0E-02
3.0E-02
4.0E-02
5.0E-02
6.0E-02Mar
-99
Jun-99
Dec-99
Jun-00
Dec-00
Oct-01
May-02
Oct-02
Apr-03
Oct-03
Apr-04
Oct-04
May-05
Nov-05
May-06
Date
Con
cent
ratio
n (m
g/L)
Number of Samples
Number of Detects
MAROS Mann-Kendall Statistics Summary
Consolidation Period:
ND Values:
J Flag Values :
No Time ConsolidationMedianConsolidation Type:
Duplicate Consolidation: AverageSpecified Detection Limit
Actual Value
Time Period: 3/24/1999 5/16/2006to
3/24/1999 3.1E-02DMW-3S S TRICHLOROETHYLENE (TCE) 1 16/23/1999 4.8E-02DMW-3S S TRICHLOROETHYLENE (TCE) 1 112/21/1999 1.5E-02DMW-3S S TRICHLOROETHYLENE (TCE) 1 16/28/2000 3.0E-02DMW-3S S TRICHLOROETHYLENE (TCE) 1 112/6/2000 2.1E-02DMW-3S S TRICHLOROETHYLENE (TCE) 1 110/30/2001 3.1E-02DMW-3S S TRICHLOROETHYLENE (TCE) 1 15/1/2002 3.6E-02DMW-3S S TRICHLOROETHYLENE (TCE) 1 1
10/28/2002 6.0E-03DMW-3S S TRICHLOROETHYLENE (TCE) 1 14/22/2003 2.3E-02DMW-3S S TRICHLOROETHYLENE (TCE) 1 110/21/2003 8.0E-03DMW-3S S TRICHLOROETHYLENE (TCE) 1 14/27/2004 1.2E-02DMW-3S S TRICHLOROETHYLENE (TCE) 1 110/26/2004 1.0E-02DMW-3S S TRICHLOROETHYLENE (TCE) 1 15/20/2005 4.5E-03DMW-3S S TRICHLOROETHYLENE (TCE) 1 111/8/2005 2.2E-02DMW-3S S TRICHLOROETHYLENE (TCE) 1 15/16/2006 2.3E-02DMW-3S S TRICHLOROETHYLENE (TCE) 1 1
Note: Increasing (I); Probably Increasing (PI); Stable (S); Probably Decreasing (PD); Decreasing (D); No Trend (NT); Not Applicable (N/A) - Due to insufficient Data (< 4 sampling events); ND = Non-detect
10/28/2006 Page 1 of 1MAROS Version 2.2, 2006, AFCEE

0.00
Coefficient of Variation:
63.3%
Mann Kendall S Statistic:
8
Confidence in Trend:
NT
Mann Kendall Concentration Trend: (See Note)
TRICHLOROETHYLENE (TCE)
Well:Well Type:COC:
TDMW-1D
Effective DateWell TypeWell Constituent
Data Table:
Result (mg/L) Flag
0.0E+00
2.0E-04
4.0E-04
6.0E-04
8.0E-04
1.0E-03
1.2E-03Mar
-99
Jun-99
Dec-99
Jun-00
Dec-00
Oct-01
May-02
Oct-02
Apr-03
Oct-03
Apr-04
Oct-04
May-05
Nov-05
May-06
Date
Con
cent
ratio
n (m
g/L)
Number of Samples
Number of Detects
MAROS Mann-Kendall Statistics Summary
Consolidation Period:
ND Values:
J Flag Values :
No Time ConsolidationMedianConsolidation Type:
Duplicate Consolidation: AverageSpecified Detection Limit
Actual Value
Time Period: 1/1/1999 5/18/2006to
3/24/1999 1.0E-03DMW-1D T TRICHLOROETHYLENE (TCE) ND 1 06/23/1999 1.0E-03DMW-1D T TRICHLOROETHYLENE (TCE) ND 1 012/21/1999 1.0E-03DMW-1D T TRICHLOROETHYLENE (TCE) ND 1 06/28/2000 1.0E-03DMW-1D T TRICHLOROETHYLENE (TCE) 1 112/6/2000 1.0E-03DMW-1D T TRICHLOROETHYLENE (TCE) ND 1 010/30/2001 1.0E-03DMW-1D T TRICHLOROETHYLENE (TCE) ND 1 05/1/2002 1.0E-03DMW-1D T TRICHLOROETHYLENE (TCE) ND 1 0
10/28/2002 1.0E-03DMW-1D T TRICHLOROETHYLENE (TCE) ND 1 04/22/2003 1.0E-03DMW-1D T TRICHLOROETHYLENE (TCE) ND 1 010/21/2003 1.0E-03DMW-1D T TRICHLOROETHYLENE (TCE) ND 1 04/27/2004 1.0E-03DMW-1D T TRICHLOROETHYLENE (TCE) ND 1 010/26/2004 1.0E-03DMW-1D T TRICHLOROETHYLENE (TCE) ND 1 05/20/2005 1.0E-03DMW-1D T TRICHLOROETHYLENE (TCE) ND 1 011/8/2005 1.0E-03DMW-1D T TRICHLOROETHYLENE (TCE) ND 1 05/16/2006 1.0E-03DMW-1D T TRICHLOROETHYLENE (TCE) ND 1 0
Note: Increasing (I); Probably Increasing (PI); Stable (S); Probably Decreasing (PD); Decreasing (D); No Trend (NT); Not Applicable (N/A) - Due to insufficient Data (< 4 sampling events); ND = Non-detect
11/6/2006 Page 1 of 1MAROS Version 2.2, 2006, AFCEE

0.00
Coefficient of Variation:
48.0%
Mann Kendall S Statistic:
0
Confidence in Trend:
S
Mann Kendall Concentration Trend: (See Note)
TRICHLOROETHYLENE (TCE)
Well:Well Type:COC:
TUMW-1D
Effective DateWell TypeWell Constituent
Data Table:
Result (mg/L) Flag
0.0E+00
2.0E-04
4.0E-04
6.0E-04
8.0E-04
1.0E-03
1.2E-03Mar
-99
Jun-99
Dec-99
Jun-00
Dec-00
Oct-01
May-02
Oct-02
Apr-03
Oct-03
Apr-04
Oct-04
May-05
Nov-05
May-06
Date
Con
cent
ratio
n (m
g/L)
Number of Samples
Number of Detects
MAROS Mann-Kendall Statistics Summary
Consolidation Period:
ND Values:
J Flag Values :
No Time ConsolidationMedianConsolidation Type:
Duplicate Consolidation: AverageSpecified Detection Limit
Actual Value
Time Period: 1/1/1999 5/18/2006to
3/24/1999 1.0E-03UMW-1D T TRICHLOROETHYLENE (TCE) ND 1 06/23/1999 1.0E-03UMW-1D T TRICHLOROETHYLENE (TCE) ND 1 012/21/1999 1.0E-03UMW-1D T TRICHLOROETHYLENE (TCE) ND 1 06/28/2000 1.0E-03UMW-1D T TRICHLOROETHYLENE (TCE) ND 1 012/6/2000 1.0E-03UMW-1D T TRICHLOROETHYLENE (TCE) ND 1 010/30/2001 1.0E-03UMW-1D T TRICHLOROETHYLENE (TCE) ND 1 05/1/2002 1.0E-03UMW-1D T TRICHLOROETHYLENE (TCE) ND 1 0
10/28/2002 1.0E-03UMW-1D T TRICHLOROETHYLENE (TCE) ND 1 04/22/2003 1.0E-03UMW-1D T TRICHLOROETHYLENE (TCE) ND 1 010/21/2003 1.0E-03UMW-1D T TRICHLOROETHYLENE (TCE) ND 1 04/27/2004 1.0E-03UMW-1D T TRICHLOROETHYLENE (TCE) ND 1 010/26/2004 1.0E-03UMW-1D T TRICHLOROETHYLENE (TCE) ND 1 05/20/2005 1.0E-03UMW-1D T TRICHLOROETHYLENE (TCE) ND 1 011/8/2005 1.0E-03UMW-1D T TRICHLOROETHYLENE (TCE) ND 1 05/16/2006 1.0E-03UMW-1D T TRICHLOROETHYLENE (TCE) ND 1 0
Note: Increasing (I); Probably Increasing (PI); Stable (S); Probably Decreasing (PD); Decreasing (D); No Trend (NT); Not Applicable (N/A) - Due to insufficient Data (< 4 sampling events); ND = Non-detect
11/6/2006 Page 1 of 1MAROS Version 2.2, 2006, AFCEE

0.00
Coefficient of Variation:
48.0%
Mann Kendall S Statistic:
0
Confidence in Trend:
S
Mann Kendall Concentration Trend: (See Note)
TRICHLOROETHYLENE (TCE)
Well:Well Type:COC:
TDMW-2D
Effective DateWell TypeWell Constituent
Data Table:
Result (mg/L) Flag
0.0E+00
2.0E-04
4.0E-04
6.0E-04
8.0E-04
1.0E-03
1.2E-03Mar
-99
Jun-99
Dec-99
Jun-00
Dec-00
Oct-01
May-02
Oct-02
Apr-03
Oct-03
Apr-04
Oct-04
May-05
Nov-05
May-06
Date
Con
cent
ratio
n (m
g/L)
Number of Samples
Number of Detects
MAROS Mann-Kendall Statistics Summary
Consolidation Period:
ND Values:
J Flag Values :
No Time ConsolidationMedianConsolidation Type:
Duplicate Consolidation: AverageSpecified Detection Limit
Actual Value
Time Period: 1/1/1999 5/18/2006to
3/24/1999 1.0E-03DMW-2D T TRICHLOROETHYLENE (TCE) ND 1 06/23/1999 1.0E-03DMW-2D T TRICHLOROETHYLENE (TCE) ND 1 012/21/1999 1.0E-03DMW-2D T TRICHLOROETHYLENE (TCE) ND 1 06/28/2000 1.0E-03DMW-2D T TRICHLOROETHYLENE (TCE) ND 1 012/6/2000 1.0E-03DMW-2D T TRICHLOROETHYLENE (TCE) ND 1 010/30/2001 1.0E-03DMW-2D T TRICHLOROETHYLENE (TCE) ND 1 05/1/2002 1.0E-03DMW-2D T TRICHLOROETHYLENE (TCE) ND 1 0
10/28/2002 1.0E-03DMW-2D T TRICHLOROETHYLENE (TCE) ND 1 04/22/2003 1.0E-03DMW-2D T TRICHLOROETHYLENE (TCE) ND 1 010/21/2003 1.0E-03DMW-2D T TRICHLOROETHYLENE (TCE) ND 1 04/27/2004 1.0E-03DMW-2D T TRICHLOROETHYLENE (TCE) ND 1 010/26/2004 1.0E-03DMW-2D T TRICHLOROETHYLENE (TCE) ND 1 05/20/2005 1.0E-03DMW-2D T TRICHLOROETHYLENE (TCE) ND 1 011/8/2005 1.0E-03DMW-2D T TRICHLOROETHYLENE (TCE) ND 1 05/16/2006 1.0E-03DMW-2D T TRICHLOROETHYLENE (TCE) ND 1 0
Note: Increasing (I); Probably Increasing (PI); Stable (S); Probably Decreasing (PD); Decreasing (D); No Trend (NT); Not Applicable (N/A) - Due to insufficient Data (< 4 sampling events); ND = Non-detect
11/6/2006 Page 1 of 1MAROS Version 2.2, 2006, AFCEE

0.15
Coefficient of Variation:
66.9%
Mann Kendall S Statistic:
10
Confidence in Trend:
NT
Mann Kendall Concentration Trend: (See Note)
TRICHLOROETHYLENE (TCE)
Well:Well Type:COC:
TDMW-3D
Effective DateWell TypeWell Constituent
Data Table:
Result (mg/L) Flag
0.0E+00
2.0E-044.0E-04
6.0E-04
8.0E-041.0E-03
1.2E-03
1.4E-031.6E-03
1.8E-03Mar
-99
Jun-99
Dec-99
Jun-00
Dec-00
Oct-01
May-02
Oct-02
Apr-03
Oct-03
Apr-04
Oct-04
May-05
Nov-05
May-06
Date
Con
cent
ratio
n (m
g/L)
Number of Samples
Number of Detects
MAROS Mann-Kendall Statistics Summary
Consolidation Period:
ND Values:
J Flag Values :
No Time ConsolidationMedianConsolidation Type:
Duplicate Consolidation: AverageSpecified Detection Limit
Actual Value
Time Period: 1/1/1999 5/18/2006to
3/24/1999 1.0E-03DMW-3D T TRICHLOROETHYLENE (TCE) ND 1 06/23/1999 1.0E-03DMW-3D T TRICHLOROETHYLENE (TCE) ND 1 012/21/1999 1.0E-03DMW-3D T TRICHLOROETHYLENE (TCE) ND 1 06/28/2000 1.0E-03DMW-3D T TRICHLOROETHYLENE (TCE) ND 1 012/6/2000 1.0E-03DMW-3D T TRICHLOROETHYLENE (TCE) ND 1 010/30/2001 1.0E-03DMW-3D T TRICHLOROETHYLENE (TCE) ND 1 05/1/2002 1.0E-03DMW-3D T TRICHLOROETHYLENE (TCE) ND 1 0
10/28/2002 1.0E-03DMW-3D T TRICHLOROETHYLENE (TCE) ND 1 04/22/2003 1.0E-03DMW-3D T TRICHLOROETHYLENE (TCE) ND 1 010/21/2003 1.0E-03DMW-3D T TRICHLOROETHYLENE (TCE) ND 1 04/27/2004 1.0E-03DMW-3D T TRICHLOROETHYLENE (TCE) ND 1 010/26/2004 1.0E-03DMW-3D T TRICHLOROETHYLENE (TCE) ND 1 05/20/2005 1.6E-03DMW-3D T TRICHLOROETHYLENE (TCE) 1 111/8/2005 1.0E-03DMW-3D T TRICHLOROETHYLENE (TCE) ND 1 05/16/2006 1.0E-03DMW-3D T TRICHLOROETHYLENE (TCE) ND 1 0
Note: Increasing (I); Probably Increasing (PI); Stable (S); Probably Decreasing (PD); Decreasing (D); No Trend (NT); Not Applicable (N/A) - Due to insufficient Data (< 4 sampling events); ND = Non-detect
11/6/2006 Page 1 of 1MAROS Version 2.2, 2006, AFCEE

0.37
Coefficient of Variation:
81.2%
Mann Kendall S Statistic:
-61
Confidence in Trend:
S
Mann Kendall Concentration Trend: (See Note)
TRICHLOROETHYLENE (TCE)
Well:Well Type:COC:
T215
Effective DateWell TypeWell Constituent
Data Table:
Result (mg/L) Flag
0.0E+00
5.0E-04
1.0E-03
1.5E-03
2.0E-03
2.5E-03Mar
-94
Dec-94
Sep-95
Jun-96
Mar-97
Dec-97
Oct-98
Dec-99
Oct-01
Apr-03
Oct-04
May-06
Date
Con
cent
ratio
n (m
g/L)
Number of Samples
Number of Detects
MAROS Mann-Kendall Statistics Summary
Consolidation Period:
ND Values:
J Flag Values :
No Time ConsolidationMedianConsolidation Type:
Duplicate Consolidation: AverageSpecified Detection Limit
Actual Value
Time Period: 6/1/1988 5/16/2006to
3/21/1994 1.0E-03215 T TRICHLOROETHYLENE (TCE) 1 16/28/1994 2.1E-03215 T TRICHLOROETHYLENE (TCE) 2 29/21/1994 1.0E-03215 T TRICHLOROETHYLENE (TCE) ND 1 012/19/1994 1.3E-03215 T TRICHLOROETHYLENE (TCE) 1 13/21/1995 1.0E-03215 T TRICHLOROETHYLENE (TCE) ND 1 06/27/1995 1.0E-03215 T TRICHLOROETHYLENE (TCE) ND 1 09/19/1995 1.0E-03215 T TRICHLOROETHYLENE (TCE) ND 1 012/19/1995 1.0E-03215 T TRICHLOROETHYLENE (TCE) ND 1 03/26/1996 1.0E-03215 T TRICHLOROETHYLENE (TCE) ND 1 06/19/1996 1.3E-03215 T TRICHLOROETHYLENE (TCE) 1 19/17/1996 7.4E-04215 T TRICHLOROETHYLENE (TCE) 1 112/17/1996 1.0E-03215 T TRICHLOROETHYLENE (TCE) ND 1 03/25/1997 5.5E-04215 T TRICHLOROETHYLENE (TCE) 1 16/24/1997 1.0E-03215 T TRICHLOROETHYLENE (TCE) ND 1 09/23/1997 1.0E-03215 T TRICHLOROETHYLENE (TCE) ND 1 012/16/1997 1.0E-03215 T TRICHLOROETHYLENE (TCE) ND 1 03/24/1998 4.0E-04215 T TRICHLOROETHYLENE (TCE) 2 26/17/1998 4.4E-04215 T TRICHLOROETHYLENE (TCE) 1 110/1/1998 3.8E-04215 T TRICHLOROETHYLENE (TCE) 2 23/24/1999 2.9E-04215 T TRICHLOROETHYLENE (TCE) 1 16/23/1999 1.0E-03215 T TRICHLOROETHYLENE (TCE) ND 1 012/21/1999 1.0E-03215 T TRICHLOROETHYLENE (TCE) ND 1 0
10/30/2006 Page 1 of 2MAROS Version 2.2, 2006, AFCEE

Result (mg/L) FlagEffective
DateWell TypeWell ConstituentNumber of
SamplesNumber of
Detects
MAROS Mann-Kendall Statistics Summary
6/28/2000 1.0E-03215 T TRICHLOROETHYLENE (TCE) ND 1 012/6/2000 6.5E-04215 T TRICHLOROETHYLENE (TCE) 2 110/30/2001 1.0E-03215 T TRICHLOROETHYLENE (TCE) ND 1 05/1/2002 1.4E-04215 T TRICHLOROETHYLENE (TCE) 1 1
10/28/2002 1.0E-03215 T TRICHLOROETHYLENE (TCE) ND 1 04/22/2003 1.0E-03215 T TRICHLOROETHYLENE (TCE) ND 1 010/21/2003 1.0E-03215 T TRICHLOROETHYLENE (TCE) ND 1 04/27/2004 1.0E-03215 T TRICHLOROETHYLENE (TCE) ND 1 010/26/2004 1.0E-03215 T TRICHLOROETHYLENE (TCE) ND 1 05/20/2005 1.0E-03215 T TRICHLOROETHYLENE (TCE) ND 1 011/8/2005 1.0E-03215 T TRICHLOROETHYLENE (TCE) ND 1 05/16/2006 1.0E-03215 T TRICHLOROETHYLENE (TCE) ND 1 0
Note: Increasing (I); Probably Increasing (PI); Stable (S); Probably Decreasing (PD); Decreasing (D); No Trend (NT); Not Applicable (N/A) - Due to insufficient Data (< 4 sampling events); ND = Non-detect
10/30/2006 Page 2 of 2MAROS Version 2.2, 2006, AFCEE

0.91
Coefficient of Variation:
61.2%
Mann Kendall S Statistic:
22
Confidence in Trend:
NT
Mann Kendall Concentration Trend: (See Note)
TRICHLOROETHYLENE (TCE)
Well:Well Type:COC:
TSW-9
Effective DateWell TypeWell Constituent
Data Table:
Result (mg/L) Flag
0.0E+00
2.0E-03
4.0E-03
6.0E-03
8.0E-03
1.0E-02
1.2E-02
1.4E-02Ju
n-88
Jun-94
Mar-95
Dec-95
Sep-96
Jun-97
Mar-98
Mar-99
Jun-00
May-02
Oct-03
May-05
Date
Con
cent
ratio
n (m
g/L)
Number of Samples
Number of Detects
MAROS Mann-Kendall Statistics Summary
Consolidation Period:
ND Values:
J Flag Values :
No Time ConsolidationMedianConsolidation Type:
Duplicate Consolidation: AverageSpecified Detection Limit
Actual Value
Time Period: 6/1/1988 5/16/2006to
6/1/1988 4.0E-03SW-9 T TRICHLOROETHYLENE (TCE) 1 16/1/1989 2.0E-03SW-9 T TRICHLOROETHYLENE (TCE) 1 1
3/21/1994 4.1E-03SW-9 T TRICHLOROETHYLENE (TCE) 1 16/28/1994 4.6E-03SW-9 T TRICHLOROETHYLENE (TCE) 2 29/21/1994 1.0E-03SW-9 T TRICHLOROETHYLENE (TCE) ND 1 012/19/1994 1.8E-03SW-9 T TRICHLOROETHYLENE (TCE) 1 13/21/1995 2.8E-03SW-9 T TRICHLOROETHYLENE (TCE) 1 16/27/1995 1.5E-03SW-9 T TRICHLOROETHYLENE (TCE) 2 19/19/1995 3.3E-03SW-9 T TRICHLOROETHYLENE (TCE) 1 112/19/1995 1.9E-03SW-9 T TRICHLOROETHYLENE (TCE) 1 13/26/1996 2.0E-03SW-9 T TRICHLOROETHYLENE (TCE) 1 16/19/1996 9.5E-04SW-9 T TRICHLOROETHYLENE (TCE) 2 19/17/1996 1.0E-03SW-9 T TRICHLOROETHYLENE (TCE) ND 1 012/17/1996 2.4E-03SW-9 T TRICHLOROETHYLENE (TCE) 1 13/25/1997 1.1E-03SW-9 T TRICHLOROETHYLENE (TCE) 1 16/24/1997 8.8E-04SW-9 T TRICHLOROETHYLENE (TCE) 3 39/23/1997 1.9E-03SW-9 T TRICHLOROETHYLENE (TCE) 1 112/16/1997 1.6E-03SW-9 T TRICHLOROETHYLENE (TCE) 1 13/24/1998 8.6E-04SW-9 T TRICHLOROETHYLENE (TCE) 1 16/17/1998 1.5E-03SW-9 T TRICHLOROETHYLENE (TCE) 1 110/1/1998 1.1E-03SW-9 T TRICHLOROETHYLENE (TCE) 2 23/24/1999 1.2E-02SW-9 T TRICHLOROETHYLENE (TCE) 1 1
10/30/2006 Page 1 of 2MAROS Version 2.2, 2006, AFCEE

Result (mg/L) FlagEffective
DateWell TypeWell ConstituentNumber of
SamplesNumber of
Detects
MAROS Mann-Kendall Statistics Summary
6/23/1999 9.2E-03SW-9 T TRICHLOROETHYLENE (TCE) 1 112/21/1999 1.2E-02SW-9 T TRICHLOROETHYLENE (TCE) 1 16/28/2000 1.1E-02SW-9 T TRICHLOROETHYLENE (TCE) 1 112/6/2000 7.0E-03SW-9 T TRICHLOROETHYLENE (TCE) 1 110/30/2001 4.4E-03SW-9 T TRICHLOROETHYLENE (TCE) 1 15/1/2002 4.8E-03SW-9 T TRICHLOROETHYLENE (TCE) 1 1
10/28/2002 6.1E-03SW-9 T TRICHLOROETHYLENE (TCE) 1 14/22/2003 6.4E-03SW-9 T TRICHLOROETHYLENE (TCE) 1 110/21/2003 2.0E-03SW-9 T TRICHLOROETHYLENE (TCE) 1 14/27/2004 1.5E-03SW-9 T TRICHLOROETHYLENE (TCE) 2 110/26/2004 2.7E-03SW-9 T TRICHLOROETHYLENE (TCE) 1 15/20/2005 1.8E-03SW-9 T TRICHLOROETHYLENE (TCE) 1 111/8/2005 1.7E-03SW-9 T TRICHLOROETHYLENE (TCE) 1 15/16/2006 1.3E-03SW-9 T TRICHLOROETHYLENE (TCE) 1 1
Note: Increasing (I); Probably Increasing (PI); Stable (S); Probably Decreasing (PD); Decreasing (D); No Trend (NT); Not Applicable (N/A) - Due to insufficient Data (< 4 sampling events); ND = Non-detect
10/30/2006 Page 2 of 2MAROS Version 2.2, 2006, AFCEE

Attachment D
Electronic Database
(provided on CD in hardcopy report)

Attachment E
Selected November 2006 Data


Attachment F
Review Comments and Responses

Progressive comments_responses final.doc Page 1 of 12
RESPONSE TO PROGRESSIVE ENGINEERING & CONSTRUCTION, INC.’s COMMENTS ON THE DRAFT LONG-TERM GROUNDWATER MONITORING OPTIMIZATION
CLARE WATER SUPPLY SUPERFUND SITE PRB AND SOIL REMEDY AREAS, DATED NOVEMBER 8, 2006 Item No. Section Page/Line/
Para Comment Response
1 Section 2.1
pg 2, 4th
paragraph Report references the drainage swale in the vicinity of the PRB as having a depth of 7-8 feet below land surface (ft bls). Survey data for the swale ranges from 840.49 to 840.15 feet above mean sea level (ft amsl) from west to east along the proximity of the PRB remedy compared to the top-of-ground data for the monitor wells nearest the swale (MW-308 and MW-311) of 843.3 and 842.4 ft amsl, respectively. Therefore, survey data indicate that the swale, in the vicinity of the PRB, is approximately 2-3 ft. deep.
The depth of 7-8 feet was taken from Lithologic Cross Section A-A’ obtained from Progressive. If the cross section is incorrect, then the text will be revised to indicate a 2-3 foot depth. This shallow depth may explain why there is so little flow in the swale—it may receive very little to no groundwater discharge.
2 Section 2.2
pg 3, 4th
paragraph Text should clarify who’s professional judgment is being referenced here. Also, Progressive offers the following additional information regarding seepage velocities in the proximity of the soil remedy which may/may not impact the implication made in this paragraph: laboratory permeameter tests conducted by Dames and Moore (in 1990) on cores from borings SW-12 (4’-6’), SW-28 (8’-10’) and B-29 (6’-8’) yielded an average hydraulic conductivity for the clay layer of 4.3x10
-7 cm/sec;
laboratory tests on cores from borings 208, 212 and B-29 yielded an average hydraulic conductivity for the underlying glacial till in the range of 1x10
-7 cm/sec; and
based upon the November 2006 hydraulic data, this would put groundwater seepage velocity in the range of 2.3E-5 ft/day and 3.5E-5 ft/day for the clay and underlying glacial till layers, respectively.
Text regarding professional judgment will be clarified. Laboratory permeability tests on discrete soil samples may not provide an accurate representation of the hydraulic conductivity of the larger in situ water-bearing zone. For example, flow may occur through fracture networks that are not well-represented in the tested soil samples. Groundwater velocity estimates should be derived using hydraulic conductivity data from site-specific field tests (i.e., slug tests, pumping tests, tracer tests).
3 Section 3.3
pg 5, 1st
paragraph Recommend that the final sentence of this paragraph be moved (and reworded as appropriate) to after the third sentence of same paragraph.
Change will be made.

RESPONSE TO PROGRESSIVE ENGINEERING & CONSTRUCTION, INC.’s COMMENTS ON THE DRAFT LONG-TERM GROUNDWATER MONITORING OPTIMIZATION
CLARE WATER SUPPLY SUPERFUND SITE PRB AND SOIL REMEDY AREAS, DATED NOVEMBER 8, 2006 (Continued)
Progressive comments_responses final.doc Page 2 of 12
Item No. Section Page/Line/
Para Comment Response
4 Section 4.0
Groundwater quality data collected in November 2006 are available and attached for inclusion in the evaluation. The November data demonstrate significant concentration decreases for the overwhelming majority of the monitoring network.
The November 2006 data can be used by interested parties to evaluate the conclusions and recommendations made in the LTMO report. There is insufficient budget remaining to fully incorporate the new data into the evaluation and revise the report accordingly. However, the data will be reviewed qualitatively to determine the impact, if any, on the recommendations made. In addition, the data will be included in the final report as an attachment.
5 Section 4.1
pg 7, 1st
bullet It should be noted that quarterly data were collected for a duration of 1 year, not two years as indicated, the frequency was then changed to semiannual.
Text and tables will be revised.
6 Section 4.1
pg 7, 2nd
bullet
Progressive would like to clarify that vertical aquifer sampling (VAS) was performed just subsequent to the PRB installation by Secor. The resultant data was used by Progressive prior to installation of the new PRB monitor wells (MW-301 to MW-313) to identify which borings should undergo VAS during monitor well installation for purposes of selecting the proper screened intervals. During the installation of MW-301 to MW-313, Progressive performed VAS at select locations and placed well screens within the vertical zone exhibiting the highest concentrations of contaminants of concern. Due to the VAS performed during the monitor well installation activities and given that the water table in this area has exhibited seasonal fluctuations of up to 5 ft at some locations, the 5-ft screens used are of an appropriate length to best monitor water quality in this area.
Comment noted. The referenced text in the 2nd bullet still appears to be accurate and appropriate and no changes are proposed.

RESPONSE TO PROGRESSIVE ENGINEERING & CONSTRUCTION, INC.’s COMMENTS ON THE DRAFT LONG-TERM GROUNDWATER MONITORING OPTIMIZATION
CLARE WATER SUPPLY SUPERFUND SITE PRB AND SOIL REMEDY AREAS, DATED NOVEMBER 8, 2006 (Continued)
Progressive comments_responses final.doc Page 3 of 12
Item No. Section Page/Line/
Para Comment Response
7 Section 4.1
pg 7, 5th
bullet and pg 8, 1
st
bullet
Progressive agrees with elimination of monitoring for MI 10 metals and reducing the frequency of monitoring for ferrous iron.
Comment noted.
8 Section 4.1
pg 8, 3rd
and 4
th
bullets
As stated above, the reference to the drainage swale depth being 7-8 ft is erroneous; actual depth is 2-3 ft based upon survey data. In addition, the swale is typically dry, and has only been observed to contain flowing water immediately subsequent to precipitation events and during periods of snow melt. Regarding the extent of definition of downgradient VOCs, Progressive asserts that as long as the concentrations exhibited in the monitor wells located south of the PRB continue to decline, monitoring further downgradient is unnecessary. Also, there is no need to monitor the area south of the swale due to existing MW-312 and SW-23. As of November 2006 analytical data for all wells south of the PRB exhibited VC concentrations less than the GSI criteria, with one exception, MW-308 which had a VC concentration of 20 ug/L, just 5 parts per billion above the GSI criteria. For these reasons, Progressive continues to maintain that the PRB area shallow groundwater monitor well network, installed pursuant to the Final PRB Monitoring Work Plan (dated 5/2/05) as approved with comments by USEPA (letter dated 5/11/05), is sufficient to provide the data necessary to monitor the performance of the PRB remedy. As decreasing concentrations have been the norm at all downgradient monitor locations, and there are no possible receptors in the near vicinity, there is no basis to support expansion of the shallow monitor network at this time.
Depth of swale will be corrected if necessary as described in response to comment #1.
The report did not contain definite recommendations for downgradient monitoring. The extent of definition of downgradient VOCs was presented as a potential data gap for stakeholder consideration. We agree that the November 2006 results are promising. However, some VC that exceeds the cleanup goal is bypassing the PRBs in the shallow zone, especially at MW-310 (21 to 27 µg/L in May and November 2006). There are no wells installed that could be used to define the downgradient extent of this contamination based on inferred groundwater flow directions for the shallow zone. It is likely that concentrations of concern are not migrating to the Clare site boundary to the south given the low magnitude of the concentrations and the fact the VC can degrade under a variety of geochemical conditions.
Typically, the downgradient extent of contaminant concentrations exceeding cleanup goals is defined upfront during the site characterization stage, so that informed remedial decisions can be made based on knowledge of the plume extent and plume dynamics (i.e., is plume expanding, stable, or decreasing?).

RESPONSE TO PROGRESSIVE ENGINEERING & CONSTRUCTION, INC.’s COMMENTS ON THE DRAFT LONG-TERM GROUNDWATER MONITORING OPTIMIZATION
CLARE WATER SUPPLY SUPERFUND SITE PRB AND SOIL REMEDY AREAS, DATED NOVEMBER 8, 2006 (Continued)
Progressive comments_responses final.doc Page 4 of 12
Item No. Section Page/Line/
Para Comment Response
9 Section 4.1
pg 8, 5th
bullet The PRB was not designed to treat water in the intermediate and/or deep aquifers; references to the likeliness of the PRB treating these deeper aquifers are, therefore, not applicable. With regard to the extent of delineation of the intermediate and deep aquifers, it should be noted that historical data provides additional useful information for these aquifers. Monitor well 207 (located in the source area upgradient of the PRB and screened from 57-62 ft bls) exhibited non-detect results when it was last sampled in March 1994. Also, well W-4 (located approximately 400 ft downgradient of the PRB area and screened from 45-50 ft bls) exhibited concentrations all below 1 ppb when it was last sampled in June 1998. For your use, the coordinates of wells W-4 and 207 were 678713.39, 4854167.96 and 678562.58, 4854213.37, respectively. If installation of any additional wells were to be considered in this area, they would be installed for MNA use only.
Whether or not the PRB was designed to treat water in the intermediate or deep aquifers is not the point of this text. The text simply presents an observation that is relevant to the LTMO evaluation—namely that contaminants detected in the intermediate zone at 300B are not treated.
Regarding the extent of delineation in the intermediate and deep zones, here are some relevant observations: --200 µg/L of VC was detected in well 300B in May 2006 (140 µg/L in November 2006), in groundwater that is not treated by the PRB. VC concentrations at this well were found to be statistically increasing based on data collected through November 2006. --Potentiometric maps in the 2005 Annual Report show this well to be located near the center of a potentiometric high, with flow occurring radially outwards in all directions from this area. Therefore, the flow direction in the intermediate zone at well 300B is not known with certainty. These maps indicate that there is not sufficient well control to confidently delineate the groundwater flow direction in the intermediate zone in this area. --There is not sufficient well control to confidently delineate the migration direction and extent of VC in the intermediate zone in this area. --VC is a relatively volatile and toxic compound that can pose an inhalation risk to occupants of overlying structures in some situations. --Therefore, the situation is that there is a VC plume containing concentrations that substantially exceed the CUO that is of unknown extent and migration

RESPONSE TO PROGRESSIVE ENGINEERING & CONSTRUCTION, INC.’s COMMENTS ON THE DRAFT LONG-TERM GROUNDWATER MONITORING OPTIMIZATION
CLARE WATER SUPPLY SUPERFUND SITE PRB AND SOIL REMEDY AREAS, DATED NOVEMBER 8, 2006 (Continued)
Progressive comments_responses final.doc Page 5 of 12
Item No. Section Page/Line/
Para Comment Response
direction. Whether these information gaps are significant is a question for the stakeholders to determine based on risk analysis. Could these concentrations pose an inhalation risk to any potential indoor air receptors? Can this question be answered given the current level of characterization? These are the types of questions that need to be considered. It is our opinion that the historical data for wells 207 and W-4 do not provide definitive answers to these questions.
10 Section 4.2
pg 9 and 10, 4
th
bullet
Progressive maintains that there is no need to delineate south of the PRB per the above comments regarding Section 4.1, pg 8, 3
rd and 4
th bullets. Progressive also
reiterates that monitoring of the PRB area was performed on a quarterly basis for only one year, not two.
See responses to comments 5 and 8. The sampling frequency was corrected in the text and tables.
11 Section 4.3
pg 10, 1st
and 2nd
bullets
Progressive agrees with the proposed semiannual sampling frequency, and we are also willing to perform semi-annual sampling at the wells (MW-312 and MW-313) where an annual frequency was recommended. Progressive agrees with the recommendations to eliminate MI 10 metals sampling and reduce the ferrous iron sampling frequency. The recent data (attached hereto) continue to demonstrate decreasing concentration trends at most PRB area wells; the inclusion of this data in your evaluation should alleviate the concern you identified of possible increasing concentration trends at MW-309 and MW-310. Progressive believes that performing hydraulic monitoring on a semi-annual basis should be sufficient for this area, and is interested to see the results of the GSI/Parsons evaluation of the hydraulic data (sent on 12/6/06 and attached to this memo for reference) to see which, if any, locations are identified
Evaluation of the hydraulic data submitted by Progressive is beyond the scope of what Parsons and GSI are budgeted to perform. In general, hydraulic monitoring for all wells located within the area of interest and screened within the depth zones of interest is recommended to maximize the accuracy of potentiometric surface maps. This recommendation is based on the observation that measurement of water levels in monitoring wells is generally relatively fast and inexpensive relative to water quality monitoring, and provides very important site characterization information. However, if multiple wells screened at similar depths are clustered in a small area and have similar groundwater elevations, one or more could be considered for removal from the hydraulic monitoring program unless more detailed

RESPONSE TO PROGRESSIVE ENGINEERING & CONSTRUCTION, INC.’s COMMENTS ON THE DRAFT LONG-TERM GROUNDWATER MONITORING OPTIMIZATION
CLARE WATER SUPPLY SUPERFUND SITE PRB AND SOIL REMEDY AREAS, DATED NOVEMBER 8, 2006 (Continued)
Progressive comments_responses final.doc Page 6 of 12
Item No. Section Page/Line/
Para Comment Response
for omission from the current hydraulic monitoring list due to redundancy.
delineation of local groundwater flow patterns is desired. At least two years of quarterly hydraulic monitoring is recommended to determine seasonal impacts on the potentiometric surface. After that, semiannual hydraulic monitoring during relatively wet and dry times (e.g., spring and fall) should be sufficient unless the quarterly monitoring results indicate significant seasonal variability that needs to be monitored more frequently. Hydraulic monitoring of all wells at the PRB and Soil Remedy areas is recommended. Text regarding hydraulic monitoring recommendations will be added to the LTMO report.
12 Section 4.3
pg 10, 3rd
bullet
Again, for the reasons stated above (see comments regarding: Section 3.3, pg 5, 1
st paragraph; Section 4.0;
Section 4.1, pg 7, 2nd
bullet; Section 4.1, pg 8, 3rd
and 4th
bullets; and Section 4.1, pg 8, 5th bullet) Progressive
disagrees that any further action is needed at the PRB area. However, we are prepared to reassess the adequacy of the program after two additional years (4 semi-annual events) of monitoring are performed in this area.
See responses to previous comments that pertain to this issue.
13 Section 5.0
As previously mentioned, the groundwater analytical data generated from November 2006 sampling are now available and are attached for your use and/or inclusion in your evaluation.
See response to comment #4.
14 Section 5.1
pg 10 and 11, 1
st
bullet
Progressive agrees that a reduction in the monitoring frequency at the identified locations is prudent.
Comment noted.
15 Section pg 11, 3rd
It should be noted that residual impacts were left in place outside of the slurry wall/cap when it was installed.
The report did not contain definite recommendations for additional monitoring downgradient of the

RESPONSE TO PROGRESSIVE ENGINEERING & CONSTRUCTION, INC.’s COMMENTS ON THE DRAFT LONG-TERM GROUNDWATER MONITORING OPTIMIZATION
CLARE WATER SUPPLY SUPERFUND SITE PRB AND SOIL REMEDY AREAS, DATED NOVEMBER 8, 2006 (Continued)
Progressive comments_responses final.doc Page 7 of 12
Item No. Section Page/Line/
Para Comment Response
5.1 bullet Placement of the slurry wall was restricted due to the presence of existing utilities and, therefore, containment of impacted soil and groundwater north of the remedy wasn’t possible. Due to the lack of receptors in the vicinity, and the results of the most recent groundwater sampling event (November 2006) which exhibit stable to decreasing concentrations within the shallow aquifer, Progressive asserts that the monitor wells immediately outside the containment cell are sufficient to evaluate the performance of the remedy; and, if groundwater concentrations at these wells do not remain stable to decreasing further sampling/wells may be considered.
existing shallow well network. The extent of definition of downgradient VOCs was presented as a potential data gap for stakeholder consideration. The proximity of the Soil Remedy Area to the site boundary to the north makes it more important to confirm that TCE concentrations of concern are not migrating out of the area of institutional controls. In addition, there appear to be buildings across Highway 10 to the north; could there be vapor intrusion concerns that need to be considered given the presence of TCE north of the slurry wall? Stable TCE concentrations could indicate the presence of a continuing source that could potentially be feeding an expanding TCE plume. This is all conjecture of course but there are no downgradient data to either support or refute this observation.

RESPONSE TO PROGRESSIVE ENGINEERING & CONSTRUCTION, INC.’s COMMENTS ON THE DRAFT LONG-TERM GROUNDWATER MONITORING OPTIMIZATION
CLARE WATER SUPPLY SUPERFUND SITE PRB AND SOIL REMEDY AREAS, DATED NOVEMBER 8, 2006 (Continued)
Progressive comments_responses final.doc Page 8 of 12
Item No. Section Page/Line/
Para Comment Response
16 Section 5.1
pg 11, 4th
bullet Progressive agrees with the contention that the current number of intermediate wells in this vicinity lends to somewhat speculative hydraulic data evaluation. However, based upon the non-detect concentrations in downgradient intermediate wells 104 and 215 indicating no significant impacts in the intermediate aquifer, the deeps wells DMW-1D, DMW-2D, DMW-3D and UMW-1D all exhibiting concentrations below cleanup objectives, the lack of risk to receptors from possible impacts to the intermediate aquifer and the fact that additional water quality data from this area would not change the operation of the remedy, Progressive does not believe that additional characterization is necessary in this aquifer. Progressive would also like to note that the interpretation of the regional groundwater flow direction in this area may be skewed by the seemingly anomalous hydraulic data from 300B located at the PRB area. A depiction of the intermediate aquifer potentiometric surface that was generated with omission of data from 300B is attached for your consideration (we also attached a map depicting the potentiometric surface with 300B included for reference). This interpretation suggests that installation of three intermediate monitor wells along the north side of the containment cell (where the aquifer is currently monitored by intermediate wells 215 and to some extent 104) would not be helpful. However, Progressive is willing to install one intermediate well for hydraulic monitoring purposes in the area adjacent to the southeast corner of the soil remedy building.
Parsons does not agree that data for wells 104 and 215 lead to the conclusion that there are no significant impacts to the intermediate aquifer. These wells are approximately 440 ft apart, and they are screened at differing elevations (25 to 30 feet bgs for 215 and 42.6 to 47.6 ft bgs for 104). If a CAH plume in the intermediate zone was emanating from the soil remedy area it would not necessarily be detected in these wells.
The alternate interpretation of the intermediate groundwater potentiometric surface provided by Progressive suggests that wells 215 and 104 may not be useful in determining impacts to intermediate zone groundwater quality. If this alternate interpretation is correct, then installation of two intermediate wells east (downgradient) of the soil remedy cell should be considered. In addition, installation of at least one intermediate well on the north side still seems reasonable to determine the vertical extent of identified contamination given the presence of a continuing source in that area. The reason for recommending one additional deep well was to allow monitoring of groundwater quality in the full range of potential groundwater flow directions from the soil remedy cell and to help confirm groundwater flow directions in the deep zone. Any additional wells could potentially be installed as temporary wells to allow collection of a groundwater sample and a water level elevation; they could then be abandoned if the results did not indicate cause for concern.

RESPONSE TO PROGRESSIVE ENGINEERING & CONSTRUCTION, INC.’s COMMENTS ON THE DRAFT LONG-TERM GROUNDWATER MONITORING OPTIMIZATION
CLARE WATER SUPPLY SUPERFUND SITE PRB AND SOIL REMEDY AREAS, DATED NOVEMBER 8, 2006 (Continued)
Progressive comments_responses final.doc Page 9 of 12
Item No. Section Page/Line/
Para Comment Response
17 Section 5.1
pg 12, 1st
bullet This bullet discusses shallow groundwater migration out of the soil cell based on 2005 groundwater level data. Please note that Progressive has since identified a flaw in the collection process of the hydraulic data within the containment cell that renders the soil remedy area shallow aquifer potentiometric contours suspect; i.e., field personnel were not allowing proper time for water levels to stabilize after breaking the vacuum seal of the extraction wells. Progressive has included the most recent (properly collected) hydraulic data contours for your use/information, and that map depicts a significant inward hydraulic gradient around the entire containment cell. Therefore, based upon the historically consistent operation of the soil remedy (lack of [unplanned] downtime), historical groundwater level data, the most recently collected shallow groundwater data, and the fact that the slurry wall is keyed into the clay, Progressive believes that this inward gradient has likely been maintained since installation of the remedy and seepage out of the cell in the shallow aquifer is unlikely. As such, there is no need to install another shallow well NW of the containment cell, and continued monitoring of existing wells DMW-1S, DMW-2S and DMW-3S will provide sufficient detail regarding the fate of residual impacts outside the cell.
Given the current operational schedule of 1 month on/5 months off and the inferred regional shallow groundwater flow direction toward the north-northwest, installation of one additional shallow well as indicated in the LTMO report does not appear unreasonable or excessive to confirm that the remedy is remaining protective over time.

RESPONSE TO PROGRESSIVE ENGINEERING & CONSTRUCTION, INC.’s COMMENTS ON THE DRAFT LONG-TERM GROUNDWATER MONITORING OPTIMIZATION
CLARE WATER SUPPLY SUPERFUND SITE PRB AND SOIL REMEDY AREAS, DATED NOVEMBER 8, 2006 (Continued)
Progressive comments_responses final.doc Page 10 of 12
Item No. Section Page/Line/
Para Comment Response
18 Section 5.1
pg 12, 2nod
bullet
Progressive agrees that the current number of deep wells in this vicinity lends to somewhat speculative hydraulic data evaluation, however, since there is no evidence that any significant impacts (above cleanup objectives) have migrated into the deep aquifer as exemplified by the historic concentrations exhibited at wells DMW-1D, DMW-2D, DMW-3D, UMW-1D, and the same can be said for the intermediate aquifer in this vicinity given the historic results for 104 and 215, there does not appear to be any justification for additional characterization of this aquifer.
Data for wells 104 and 215 may not be relevant for determining impacts to the intermediate zone given the alternate potentiometric surface map prepared by Progressive (showing a hydraulic gradient to the east). See also response to comment #16. The objective of the additional well installations recommended for consideration was simply to more fully cover the range of potential flow directions indicated by the available data. The justifications for addition of another deep well are stated in the report and include: 1) more accurate and site-specific determination of groundwater flow direction and vertical hydraulic gradient, and 2) obtaining groundwater quality data along a potential flowline from the soil remedy cell that is not currently monitored. How can we be sure that the existing deep wells are properly positioned if the hydraulic data are sparse and the potentiometric surface interpretation is somewhat speculative as a result?
19 Section 5.1
pg 12, 3rd
bullet
Based upon the most recent groundwater elevation data showing an inward hydraulic gradient around the containment cell in the shallow aquifer, it is likely that seepage out of the containment cell in the shallow aquifer is insignificant. Per the additional information provided above (see comment on Section 2.2), the groundwater seepage velocity is likely in the range of 2.3E-5 ft/day and 3.5E-5 ft/day for the clay and underlying glacial till layers, respectively. Impacts detected in groundwater outside of the containment cell are likely from residual source material that was left in place as previously discussed.
See response to comment #2.

RESPONSE TO PROGRESSIVE ENGINEERING & CONSTRUCTION, INC.’s COMMENTS ON THE DRAFT LONG-TERM GROUNDWATER MONITORING OPTIMIZATION
CLARE WATER SUPPLY SUPERFUND SITE PRB AND SOIL REMEDY AREAS, DATED NOVEMBER 8, 2006 (Continued)
Progressive comments_responses final.doc Page 11 of 12
Item No. Section Page/Line/
Para Comment Response
20 Section 5.1
pg 12, 4th
bullet There is no threshold value or trigger concentration for additional assessment. So long as routine monitoring results continue to exhibit stable or non-increasing trends (below the pre-startup levels), there is no reason for additional assessment.
Comment noted.
21 Section 5.1
pg 13, 1st
bullet It should be noted that the operating frequency of the soil remedy has been reduced to 1-month on / 5-months off (as of November 2006, per EPA approval). Should sample results indicate that influent concentrations have significantly rebounded when the system is restarted in May 2007, Progressive will sample the individual extraction wells to assist with further optimization of the remedy.
Comment noted.
22 Section 5.3
pg 14, 1st
bullet Progressive agrees with the recommended sampling frequencies. Progressive believes that performing hydraulic monitoring on a semiannual basis should provide sufficient hydraulic information for this area, and is interested to see the results of the GSI/Parsons evaluation of the hydraulic data (sent on 12/6/06 and attached to this memo for reference) to see which, if any, locations are identified for omission from the current hydraulic monitoring list due to redundancy.
See response to comment #11. Given the already sparse density of water level measurements in this area and resulting uncertainty regarding groundwater flow directions, particularly in deeper zones, periodic collection of water level measurements in all wells associated with the soil remedy area and all nearby wells is recommended.

RESPONSE TO PROGRESSIVE ENGINEERING & CONSTRUCTION, INC.’s COMMENTS ON THE DRAFT LONG-TERM GROUNDWATER MONITORING OPTIMIZATION
CLARE WATER SUPPLY SUPERFUND SITE PRB AND SOIL REMEDY AREAS, DATED NOVEMBER 8, 2006 (Continued)
Progressive comments_responses final.doc Page 12 of 12
Item No. Section Page/Line/
Para Comment Response
23 Section 5.3
pg 14, 2nd
and 3
rd
bullet
Progressive does not agree that further characterization of the shallow aquifer is warranted based upon the hydraulic performance of the remedy (as demonstrated for November 2006 in the attached figure), the stable to decreasing concentrations exhibited by the shallow aquifer monitoring and the lack of risk to receptors. Progressive does not agree that further characterization of the intermediate aquifer is necessary based upon the non-detect concentrations in downgradient intermediate wells 104 and 215 indicating no significant impacts in the intermediate aquifer, the concentrations all below cleanup objectives exhibited by deep wells DMW-1D, DMW-2D, DMW-3D and UMW-1D, the lack of risk to receptors from possible impacts to the intermediate aquifer and the fact that additional water quality data from this area would not change the operation of the remedy. However, Progressive will agree to install one new intermediate monitor well for hydraulic monitoring purposes, and suggests locating that well adjacent to the southeast side of the soil remedy building to improve the hydraulic monitoring network in that area.
See above responses to comments pertaining to these issues.
24 General Progressive does not agree that further characterization of the deep aquifer is necessary since there is no evidence that any significant impacts (above cleanup objectives) have migrated into the deep aquifer as exemplified by the historic concentrations exhibited at wells DMW-1D, DMW-2D, DMW-3D, UMW-1D, and the same can be said for the intermediate aquifer in this vicinity given the historic results for 104 and 215.
See above responses to comments pertaining to these issues.

MDEQcomments_responses final.doc Page 1 of 21
RESPONSE TO MDEQ COMMENTS ON THE DRAFT LONG-TERM GROUNDWATER MONITORING OPTIMIZATION
CLARE WATER SUPPLY SUPERFUND SITE
Comments on the preliminary Long-Term Monitoring Optimization memoranda for the Stageright, PRB and Soil Remedy areas of the Clare Water Supply Superfund site were received from three parties at MDEQ: Barbara Vetort, Mark Henry and John Spielberg. The comments are addressed below, with comments grouped according to similar topic areas. Commenter Area Page/Lin
e/Para Comment Response
JS Comment 1a
BV Comment 4 (page 2 paragraph 3)
General (JS) The agencies and the PRPs would really benefit from having data in electronic format all in one place. The data should include all the source areas: Mitchell, Ex-Cell-O, StageRight, American Dry Cleaners, Stanley Oil, Standard Oil, MDOT bulk storage, etc. The data should be raw data as reported by the laboratories, including detection limits and qualifiers. CAS numbers for the parameters tested is also a good idea. Most laboratories can provide data in electronic, database format.
(BV) The recommendation to combine groundwater elevation data collected from Stageright wells with data collected from the rest of the site wells to facilitate a more complete picture of groundwater hydraulics east of Stageright should be implemented. The current level of plume definition is not acceptable in the Stageright area.
The authors agree that all site analytical data should be maintained in an electronic database, accessible to all stakeholders. Proper data management is central to all site optimization efforts. Progressive Engineering is maintaining a site-wide electronic database, and they have done an excellent job under the circumstances. The Progressive database contains both analytical and hydraulic monitoring data for the entire site. The authors suggest that the site database be made available to all stakeholders. An updated database should be distributed to stakeholders after the results of each sample event are added.
Inclusion of validated data in the database as opposed to raw data (assuming that data validation is performed) is recommended.
The database used for the LTMO efforts will be included on CD in the final report.
As a general observation, the addition of current and future monitoring data to the database is a fairly simple matter as data are now delivered in electronic format from most labs.
The addition of historic information to the electronic database is more problematic. Often, these data are only available in hard-copy and must be added

RESPONSE TO MDEQ’s COMMENTS ON THE DRAFT LONG-TERM GROUNDWATER MONITORING OPTIMIZATION
CLARE WATER SUPPLY SUPERFUND SITE (Continued)
MDEQcomments_responses final.doc Page 2 of 21
Commenter Area Page/Line/Para Comment Response
manually. Frequently, data are missing detection limits, method names or data flags. Manual addition of data is an expensive process and the opportunity for introducing transcription errors is extremely high. Specific elements of the historic data set should be prioritized and added to the database as time and budgets permit. Priority data include concentrations of constituents that exceed screening levels and detected compounds.
The authors would also suggest that a sample location table be maintained in the site database. Sample locations tables generally include information such as the well name (and any historic names), the depth, top of casing, screened intervals, geographic coordinates, and date of installation. A location table can be useful for documenting details such as VAS. A table with groundwater parameters such as K values would be extremely helpful for a site this complex.
JS
Comment 2a
Stageright The MDEQ believes this area is the highest priority area at the site to be dealt with
The authors agree.
JS
Comment 2b
Stageright The MDEQ supports the objective of determining whether this area was characterized sufficiently. One way this can be evaluated is by finding out which wells were vertically sampled prior to setting the well screens. If vertical aquifer sampling (VAS) was insufficient, then this may need to be completed prior to implementing an LTMO in this area, or in conjunction with the LTMO.
Generally speaking, characterization of the vertical extent of contamination is desirable. Vertical sampling is generally part of site characterization. The authors were not provided with VAS information.
Some sites benefit from a formal conceptual site model document detailing well installation details, groundwater parameters, source areas, transport mechanisms, geotechnical evaluations, receptors etc. It can be very useful to put all of the site data in one location for all stakeholders.

RESPONSE TO MDEQ’s COMMENTS ON THE DRAFT LONG-TERM GROUNDWATER MONITORING OPTIMIZATION
CLARE WATER SUPPLY SUPERFUND SITE (Continued)
MDEQcomments_responses final.doc Page 3 of 21
Commenter Area Page/Line/Para Comment Response
In most cases, consensus on site characterization and site conceptual model should be largely complete before monitoring networks are optimized. As a general rule, the LTMO scope of work is limited to determining if a sufficient number of wells exist spatially to achieve monitoring objectives. The authors are not funded or scoped to performed a detailed review of the site investigation as part of the LTMO evaluation.
JS
Comment 2c
Stageright The MDEQ agrees that the shallow zone has not been well characterized. This zone needs better definition. The shallow water-bearing zone and the vadose zone above it may potentially contain a smear zone containing a continuing source of TCE and other contaminants. Past contamination near the water table could have moved up and down with rising and falling water levels, thus causing the vertical smearing of contamination in this zone.
See comment 2b above. A ‘smear zone’ is typically present at sites that have had floating free product (e.g., petroleum product), whereas TCE does not float on the groundwater surface. Continuing sources of contamination would be an element included in a conceptual site model.
JS
Comment 2d
Stageright Any new wells installed should be completed with the benefit of VAS to determine the zones of highest contamination
Comment noted. The authors agree that long-term monitoring wells should be screened within the zone containing the highest dissolved contaminant concentrations to the extent practical.
JS
Comment 2e
Stageright MDEQ agrees that chloride, alkalinity and TDS sampling and analysis can be reduced
Comment noted.
JS
Comment 2f and BV
Stageright (JS) Would be best to have the complete data set for this area rather than just summaries that show exceedances of cleanup objectives. Electronic format data in spreadsheets would be better than hard copy.
See comment 1a, above.

RESPONSE TO MDEQ’s COMMENTS ON THE DRAFT LONG-TERM GROUNDWATER MONITORING OPTIMIZATION
CLARE WATER SUPPLY SUPERFUND SITE (Continued)
MDEQcomments_responses final.doc Page 4 of 21
Commenter Area Page/Line/Para Comment Response
Comment (page 1
paragraph 3)
(BV) The MDEQ Superfund staff has not received the majority of the necessary TCRA data to include the boring logs and analytical data. Therefore, the MDEQ Superfund staff cannot verify the technical information used for the optimization.
JS
Comment 2f
And BV Comment 2 (page 2, paragraph 1)
Stageright (JS) An assumption was made by the optimizers that missing data meant that concentrations were non-detect. MDEQ agrees that evaluating this assumption with more complete historical data is a good idea.
(BV) This report states that Progressive Engineering provided the data for optimization. Progressive Engineering is not the Stageright TCRA consultant. This report states that not all the data collected by the Stageright consultant, MACTEC, was included, therefore the Optimizers assumed the results were non-detect. The Optimizers state that historical constituent concentrations should be confirmed before the Long-Term Monitoring Program is finalized. The Agencies need to confirm that all the Stageright data and well logs are comprehensive and accurate.
Many times it is difficult to track historic data from former or uncooperative consultants and to translate it from hard-copy to electronic data. (See comment 1a above).
The authors were told by Progressive that ‘missing data’ were assumed to be non-detect results. The authors did not have access to hard-copy data from previous site investigations to verify concentrations and detection limits, so, had to accept the dataset as delivered.
As a general note, most LTM networks are optimized for one to two major contaminants of concern (COCs), when the less prevalent contaminants are contained within the plume of the priority COCs. In the case of Stageright, TCE is the parent compound, and appears to be most widespread with the most exceedances. Data for TCE in the Stageright area are recorded in the site database, and include non-detect results. For this reason, the authors proceeded with the analysis. The optimization was performed for TCE with other compounds considered qualitatively to evaluate and confirm recommendations.

RESPONSE TO MDEQ’s COMMENTS ON THE DRAFT LONG-TERM GROUNDWATER MONITORING OPTIMIZATION
CLARE WATER SUPPLY SUPERFUND SITE (Continued)
MDEQcomments_responses final.doc Page 5 of 21
Commenter Area Page/Line/Para Comment Response
.
JS
Comment 2g
And BV Comment 3 (page 2, paragraph 2)
Stageright (JS): Exclusion of site-wide monitoring wells in this area (e.g., 211, D-106, D-107, WD-10) should not be assumed to mean they should be excluded from site-wide monitoring.
(BV): I agree with the majority of recommendations that are outlined on pages eight and nine. One exception, the recommendations include excluding wells that are not associated with the Stageright TCRA. Therefore, excluding wells 211, D106, D107, and WD10 is not appropriate for the well field remedial action.
One of the central activities of LTMO is to determine to what extent an individual monitoring location provides unique information in support of site monitoring objectives.
A major issue of the Clare Water Supply ROD and associated documents is that groundwater monitoring objectives are not explicitly defined. Without explicit monitoring objectives the goal and significance of monitoring any individual location can be interpreted differently by each stakeholder.
Based on qualitative and statistical evaluation, the deep wells recommended for removal from routine monitoring did not provide unique information significant to Stageright site management decisions. However, as MDEQ has expressed concern over removal of these locations, their contribution and suggested sample frequency will be revisited and any recommendations will be better explained in the final report. Even if these wells are not recommended for further sampling connected to the Stageright site, they could be retained for the site-wide monitoring program, which was not evaluated.
JS
Comment 2h
Stageright Deep zone well P-202 is too close to municipal well MW-5 to be useful as a sentinel well. The optimizers say this area is not well monitored. Therefore, better characterization of this zone is needed. Another deep zone well should be installed near the east edge of the StageRight parking lot, just south of MW-8-97.
Given an estimated deep aquifer seepage velocity of approximately 18 ft/d, all current wells are too close to MW-5 to function as sentinel wells in the short term. Well MW-10-97 is approximately 2 weeks travel time to MW-5. Most analytical samples require at least 2 weeks to process. Data review is usually much slower than analysis, and action, slower, yet.
With these limitations, sampling P-202 provides a

RESPONSE TO MDEQ’s COMMENTS ON THE DRAFT LONG-TERM GROUNDWATER MONITORING OPTIMIZATION
CLARE WATER SUPPLY SUPERFUND SITE (Continued)
MDEQcomments_responses final.doc Page 6 of 21
Commenter Area Page/Line/Para Comment Response
long-term, well-documented metric of plume stability. The well shows decreasing trends. Installation of another deep zone well should be accompanied by an explicit monitoring objective the well will fulfill and, if necessary, expedited chemical analysis to achieve the objective.
JS
Comment 2i
MDEQ would like an explanation of how the average TCE concentration reported in Tables 4 and 7 is used. Is it used in any other calculation or statistic? Or, is it just a benchmark to compare against the CUO and MCL?
Average TCE concentration is a simple statistical benchmark used in a general way to identify high, medium and low concentration wells relative to the regulatory screening levels.
Taken together with the maximum concentration, sample size, and concentration trend, the average concentration provides a summary of information relevant to defining the area of regulatory concern and the function of the location in the monitoring network.
JS
Comment 2j and 3a
The new municipal well, MW-8, was not mentioned. It should be noted on the site maps, and considered in the LTMO evaluation. Even though this well is outside the StageRight area, it is a potential receptor of contaminants from StageRight. Because of this, it should be considered in the evaluation.
The new municipal well was installed as we finished the draft report. The authors were not informed of its construction until after the analysis was performed.
We do not have the coordinates for the well or any information on its screened interval, pumping rate or preliminary concentrations of priority COCs. Because this well was installed near an existing contaminant plume, it should be sampled periodically same as other nearby active water supply wells.
BV Comment 1
(page 1,
Stageright General There is no site conceptual model presented to provide the basis for the optimization effort. Were the remedial design MODFLOW files used for this project? Since they
As far as the authors know, there is no single document describing a consensus site conceptual model for the areas of concern. (For further discussion of site conceptual model and site

RESPONSE TO MDEQ’s COMMENTS ON THE DRAFT LONG-TERM GROUNDWATER MONITORING OPTIMIZATION
CLARE WATER SUPPLY SUPERFUND SITE (Continued)
MDEQcomments_responses final.doc Page 7 of 21
Commenter Area Page/Line/Para Comment Response
paragraph 2) were not cited, we assume these files were not used. characterization, see Comment 2b)
The site conceptual model was not detailed in the draft memorandum for the Stageright Area (or PRB/Soil Remedy). A brief summary of relevant conceptual model information provided to the authors will be included in the final memorandum.
The authors reviewed the data received, which included the RODs, 5-year review, potentiometric surface maps, cross-sections and analytical database. Supplemental data on seepage velocity, porosity, groundwater flow direction, etc. were supplied by Progressive.
LTMO is not generally a groundwater flow modeling effort. MODFLOW files were neither requested nor made available to us, nor were the results of site modeling made available.
BV Comment 4
(page 2, paragraph 4)
Stageright The Long-Term Monitoring Optimization (LTMO) states that a change in site conditions might warrant resumption of monitoring at some time in the future at wells that are not currently recommended for continued sampling. A contingency plan specifying this should be a part of any changes to the groundwater monitoring program. In addition, every five years a complete round of analytical sampling for all wells should be performed to verify that the LTMO remains effective. This comprehensive monitoring was stated as a requirement by the former Potentially Responsible Party’s consultant in the 1994 Remedial Design Remedial Action Work Plan.
The authors agree.
Contingency plans should be related to the stated monitoring objectives. Both should be published in a site management document.
BV Comment 5
PRB Area I am concerned that the MDEQ technical support staff was not given adequate input on the site conceptual
CSM information was provided to the authors by Progressive and the USEPA, and is summarized in

RESPONSE TO MDEQ’s COMMENTS ON THE DRAFT LONG-TERM GROUNDWATER MONITORING OPTIMIZATION
CLARE WATER SUPPLY SUPERFUND SITE (Continued)
MDEQcomments_responses final.doc Page 8 of 21
Commenter Area Page/Line/Para Comment Response
(page 2 paragraph 5)
model used as the basis for the LTMO. Section 2 of the LTMO report. Groundwater input parameters are listed in Table 2 of the LTMO report.
BV Comment 6
(page 2 paragraph 6)
PRB Area For example, in Section 2.1 PRB area, it states that the shallow groundwater flow direction is south-to-southeast across the PRBs. This has not been verified by existing site data. The remedial investigation reports the shallow aquifer permeabilities range from 10-3 to 10-5, rather than 10-7.
Existing potentiometric surface data indicate that the groundwater flow direction is roughly S/SE in the vicinity of the PRB; however, the authors concur that the site is not fully characterized as detailed in Section 4.1 of the LTMO report. The hydraulic gradient information derived from water level measurements was used to infer the groundwater flow direction; this is the standard practice at a majority of contaminated sites.
It appears that a range of aquifer hydraulic conductivities have been reported for various geologic units; consensus values should be determined as part of the CSM review. At least some of the K values reported in the RI report appear to have been derived from laboratory tests of soil samples, and may not accurately represent field-scale K values. The range of 1E-07 to 5E-07 cm/sec given in the text of the report was derived from lithologic cross-sections provided by Progressive and contained in Attachment A of the report. The Dames & Moore RI report states that the till has a hydraulic conductivity on the order of 10-7 cm/sec.
BV Comment 7
(page 3 paragraph 1)
PRB Area The PRB remedial action area is still completing the first two years of remedial action monitoring. The MDEQ Superfund staff has stated that the PRB should not be optimized until the remedy is demonstrated to be operating effectively. It is premature to optimize the monitoring program at the PRB area. The current level of plume definition is not acceptable in this area.
Comment noted. The authors concur, for the most part. Concrete metrics should be developed for determining if the remedy is operating effectively.
As a general note, given a sufficiently long sample record, recommendations for current sampling locations and frequency can be made while site characterization efforts are on-going. While areas of site characterization uncertainty can be identified during LTMO, specific actions to address site

RESPONSE TO MDEQ’s COMMENTS ON THE DRAFT LONG-TERM GROUNDWATER MONITORING OPTIMIZATION
CLARE WATER SUPPLY SUPERFUND SITE (Continued)
MDEQcomments_responses final.doc Page 9 of 21
Commenter Area Page/Line/Para Comment Response
characterization must be based on stakeholder consensus. The authors believe that the LTMO recommendations made in the report are reasonable; however, they should be reassessed as noew data are obtained.
BV Comment 8
(page 3 paragraph 3
Soil Remedy
The last sentence in the second paragraph states that the groundwater monitoring wells DMW1S, DMW2S, and DMW3S, in May and November 2005 ranged from 8 to 13 feet bgs. The report states this is a few feet below the bottom of the emplaced soils and near the top of the till. The emplaced soils (soil from Mitchell area) are essentially at the former ground surface, the till is below the upper aquifer. Please clarify this sentence.
A reference to cross-sections drawn by Secor and contained in Appendix A will be added to this text. These cross-sections show the water table being present a few feet below the bottom of the emplaced ‘Mitchell’ soils.
BV Comment 9
(page 3 paragraph 4)
Soil Remedy
The receptors for the upper aquifer are the municipal well field. The seepage velocities for this area are too low. The Dames & Moore Remedial Investigation (RI) reports the upper aquifer to be 10-5.
Seepage velocities appear to vary across the site. Consensus representative velocities are needed for LTMO, and should be supplied by the stakeholders. As stated in Section 2.2 of the report, we agree that the seepage velocity obtained from Progressive for the area outside the soil treatment cell is too low.
BV Comment 10
(page 3 paragraph 5)
Soil Remedy
The Optimizers state that they did not have a complete data set for Vinyl Chloride for this area. The soil remedy area should have a complete data set for the wells discussed, back to their installation date, which is the same as the soil remedy completion date, circa 1999. RI wells are present around the soil remedy area, were their data sets complete? Some of the issues with the data set are related to Quality Assurance/Quality Control problems that were experienced during the groundwater monitoring sampling events.
For wells DMW 1S-3S and 1D-3D, the site database contains vinyl chloride results from 2005 – 2006. TCE data are recorded from 1999 -2006. (See Comment 1a). Other wells in the area have a more complete data set for vinyl chloride, with results for SW-9 extending to 1988. These wells are not closely associated with the soil remedy area.
BV Comment 11
(page 3 paragraph 6)
Soil Remedy
I agree with the recommendations for the Soil Remedy Area. However, I recommend annual rather than biennial sampling for UMW1D and UMW1S. This evaluation does not look at any data older than 1999. There is data for many of the existing wells that
Annual sampling for UMW1D and UMW1S to address ‘background’ water quality or to determine if constituents from outside the soil remedy area are migrating toward it is potentially reasonable. However, if the groundwater flow velocity in this area is indeed very low, then annual sampling may

RESPONSE TO MDEQ’s COMMENTS ON THE DRAFT LONG-TERM GROUNDWATER MONITORING OPTIMIZATION
CLARE WATER SUPPLY SUPERFUND SITE (Continued)
MDEQcomments_responses final.doc Page 10 of 21
Commenter Area Page/Line/Para Comment Response
goes back to the 1980s. Why isn’t this data evaluated for at least some key wells? The current level of plume definition seems adequate in this area.
be overkill because abrupt changes in upgradient groundwater quality that could impact the soil remedy area would be unlikely.
For LTMO, ‘recent’ analytical data are given higher priority as historic data may have been collected under different sampling or analysis protocols. Often historic data have higher detection limits, and outliers that can skew statistics. Recent data are more likely to be comparable. Of the wells evaluated, only well 215 had data collected prior to 1999; these data were used in the qualitative evaluation of this well.
MH Comment 1
Stageright
General Comment
1) From the information provided is seems that there
are very few shallow monitoring wells associated with the part of the site. Has the shallow of the aquifer been shown to be clean? The data indicates that a rather substantial source of contamination exists at the site. If this source material is in the vadose zone, then there would be substantial contamination in the shallow portion of the aquifer which could discharge to the nearby wetlands.
Comment noted, see Comment 2b on site characterization.
MH Comment 2
Stageright
General Comment
2) Since this document deals with optimization of the
monitoring well network, it would be best if the Agencies took into account whether or not the individual monitoring well locations had been characterized using vertical aquifer sampling (VAS) techniques. More weight should placed on the value of the data from a particular part of the sight where VAS has been used to define the vertical and horizontal extent of contamination. MACTEC should be able to provide this information.
Comment noted, see Comment 2b on site characterization.
Well weighting is possible for both qualitative and MAROS evaluations.
MH Comment 3
Stageright 3) There is a column in Table 4 that indicates the
average concentrations found in the individual wells. I’m not sure that the average concentrations are very
Comment noted. See comment response 2i above.

RESPONSE TO MDEQ’s COMMENTS ON THE DRAFT LONG-TERM GROUNDWATER MONITORING OPTIMIZATION
CLARE WATER SUPPLY SUPERFUND SITE (Continued)
MDEQcomments_responses final.doc Page 11 of 21
Commenter Area Page/Line/Para Comment Response
General Comment
appropriate for decision making purposes unless the geochemistry at that location is at steady-state.
MH Comment 4
Stageright
General Comment
4) The documentation for the MAROS software
package (Appendix B) that was used for the evaluation does not speak to the basic assumption that the site is well characterized and that the existing monitoring well network actually represents the plume. This presumed assumption has been violated at each of the 3 source areas (Stageright, Mitchell and ExCello). At each of these areas there exists groundwater contamination that has not been delineated in magnitude or area. Integral to a “moment analysis” would be a thorough understanding of the distribution of that mass. The MAROS evaluations of these areas identified these deficiencies. The MAROS evaluations reinforce the fact that these sources are not fully defined – especially in the deeper portions of the aquifer. The lack of definition of the individual sources precludes an understanding of the interactions between them, or the cumulative effects of the three.
Comment noted, see Comment 2b on site characterization and BV Comment 7.
While the extent of all identified groundwater contamination has not been fully delineated (based on data supplied to the authors) sufficient data are available for a subset of wells to optimize the monitoring approach in limited areas.
Collecting more data than is needed in one area does not help the lack of data in another. The authors maintain that some current locations can be monitored at a reduced frequency while the site undergoes further characterization.
MH Comment 5
Stageright
General Comment
5) There has been no discussion of the capture zone of
the municipal wells in the vicinity of the site. I suspect that all parts of the site are within the capture zone of the municipal system.
No data were provided on the pumping rate and capture zone of the public supply wells. The authors assumed (based on gw flow velocity and potentiometric surface) that the capture zone extended across the entire Stageright area. It was also assumed that the Stageright plume does not extend east of the municipal well MW-2.
MH Comment 6
Stageright
General Comment
6) This optimization process should be repeated once
the site-wide data gaps have been filled and we have a better understanding of the contaminant distributions and transport pathways.
Comment noted; the authors concur with this comment. Optimization should be a dynamic process and LTMO conclusions and recommendations should be reassessed as new data are obtained.

RESPONSE TO MDEQ’s COMMENTS ON THE DRAFT LONG-TERM GROUNDWATER MONITORING OPTIMIZATION
CLARE WATER SUPPLY SUPERFUND SITE (Continued)
MDEQcomments_responses final.doc Page 12 of 21
Commenter Area Page/Line/Para Comment Response
MH Specific Comment 1
Stageright
Specific Comment
1) Page 4, pp 1; The documents states that there was
an assumption made that all the missing data are non-detect. This should be checked into, and if found not to be true, the entire process should be reevaluated.
Comment noted. The authors do not have access to the missing data, which may be in hard copy form.
MH Specific Comment 2
Stageright
Specific Comment
2) Page 4, pp 3; The end of the paragraph states that
the number of wells screened in the shallow zone was insufficient to perform a statistical analysis. From this one could conclude that the contamination in the shallow zones cannot be statistically evaluated using the software employed.
The number of wells screened in the shallow zone was insufficient to perform a spatial statistical analysis using MAROS. Concentration trends at individual well locations could be evaluated if there were sufficient sample events, but these wells have not been sampled regularly.
Is there a reason these wells are not sampled? Dry?
MH Specific Comment 3
Stageright
Specific Comment
3) Page 5, pp 1; This paragraph discusses the
recommendations being based on the assumption that the “relatively rapid [groundwater] velocity will continue in the future”. I also suggest that the In this part of the facility, the groundwater velocity is high because of its proximity to municipal production wells. A new production well has been installed in a near proximity to the Stageright facility. If the new well is not pumping at the same rate or from the same vertical interval as the pumping parameters used in the assumptions of the optimization model, the model may have to be reevaluated.
The authors agree. The new well was added, unknown to the authors, near the end of the analysis.
However, the groundwater velocity in this area most likely will not decrease significantly due to installation of a new extraction well.
MH Specific Comment 4
Stageright
Specific Comment
4) Page 5, pp 3; This paragraph suggests that the site
characterization should be performed and suggests an additional monitoring well pair be installed. Any site wells should be installed using VAS techniques. Beyond just installing two additional wells additional characterization should be undertaken to determine the distribution and magnitude of the source.
Comment noted.

RESPONSE TO MDEQ’s COMMENTS ON THE DRAFT LONG-TERM GROUNDWATER MONITORING OPTIMIZATION
CLARE WATER SUPPLY SUPERFUND SITE (Continued)
MDEQcomments_responses final.doc Page 13 of 21
Commenter Area Page/Line/Para Comment Response
MH Specific Comment 5
Stageright
Specific Comment
5) Page 5, last paragraph; The document suggests that
fewer contaminants could be analyzed during sampling events. If the Agencies agree that this is the best approach, then I suggest that periodically the entire list of contaminants included in an EPA Method 8260B analysis be evaluated
The rationale for this approach should be clearly identified. Once COCs are identified, analysis for other contaminants should not be necessary unless new releases occur or hydraulic conditions change. However, given that the cost of a full 8260 analysis is not likely to be substantially more expensive than an abbreviated analysis, periodic analysis for a full analyte list should not have significant cost impacts.
MH Specific Comment 6
Stageright
Specific Comment
6) Page 6, pp 2; I would agree, continuing to monitor
the groundwater for chloride, TDS and alkalinity on a regular basis is not providing information that cannot be gained on a much less frequent basis.
Comment noted.
MH Specific Comment 7
Stageright
Specific Comment
7) Page 7, pp 3; The recommendation is made to
exclude MW-2-99 and MW-6-97 from the monitoring program, yet in the first paragraph of the following page the statement is made that near MW-6-97 the aquifer is “not well defined”. This is counterintuitive.
Groundwater flow and contaminant transport in the Stageright area appears to be heterogeneous and channelized, with high concentrations (MW-1-02) adjacent to low concentrations (MW-6-97). The nature of the hydrogeology at and between the six points identified in Figure 6 should be clarified as part of a consensus conceptual site model.
This said, MW-2-99 and MW-6-97 do not help characterize the contaminated part of the aquifer. They probably identify an area with lower flow velocity or some sort of hydrogeological discontinuity. Because they do not characterize the contaminated zone very well, they do not provide significant information to support management decisions. Routine monitoring of these wells is not particularly efficient.
MH Specific Comment 8
Stageright
Specific Comment
8) Page 8, pp 1; The document states the intermediate
groundwater zone to the east of MW1-02 and MW-6-97 is not well defined. I suggest that VAS be performed and/or a monitoring well cluster be installed in this area.
The groundwater quality is not delineated to the east of wells MW-1-02, MW-6-97 and MW-8-97. Plume delineation efforts are recommended for this area.

RESPONSE TO MDEQ’s COMMENTS ON THE DRAFT LONG-TERM GROUNDWATER MONITORING OPTIMIZATION
CLARE WATER SUPPLY SUPERFUND SITE (Continued)
MDEQcomments_responses final.doc Page 14 of 21
Commenter Area Page/Line/Para Comment Response
MH Specific Comment 9
Stageright
Specific Comment
9) Page 8, pp 2; The document points out that the
groundwater velocity near MW-5 is extremely rapid and that concentrations are largely stable or decreasing. This indicates to me that that there is a moderately large source of parent contaminant at the site that may exist as a non-aqueous phase liquid.
Decisions on source area treatment can be complicated. The reference in footnote 4 below may be of help.
This is outside the scope of LTMO. All we can say now is that under current conditions, the plume appears to be stable. The magnitudes of dissolved contaminant concentrations are not indicative of the presence of significant NAPL. It is possible that sorbed contaminants are continually ‘bleeding’ into the groundwater in the source area.
MH Specific Comment 10
Stageright
Specific Comment
10) Page 8, pp 5; This paragraph in the
recommendations suggests additional monitoring is needed east of MW-6-97. This should include VAS.
See response to Comment 8
MH PRB Comment 1
PRB General
Comment
1) The document does not discuss any data gaps
surrounding the permeable reactive barrier (PRB) wall.
Data gaps for the PRB area are discussed in Section 4.1 of the report.
MH PRB Comment 2
PRB General
Comment
2) Are there institutional controls in place for all parts of
the site to which contamination exists or could migrate to?
We have been told that institutional controls cover the entire Clare Water Supply site. However, the exact nature and extent of the institutional controls are unknown to us.
MH PRB Comment 3
PRB General
Comment
3) How much sensitivity analysis was performed for the
models and statistical software packages to bracket the range of values used in their assumptions?
None. We requested values for the input parameters from Progressive, and received, what should be, the consensus values established after a thorough site investigation. The LTMO analysis was not a modeling effort.
However, as part of the qualitative evaluation, groundwater potentiometric surface maps, reports and analytical data were reviewed. The memoranda indicate cases where the data reviewed did not mesh with input parameters supplied.

RESPONSE TO MDEQ’s COMMENTS ON THE DRAFT LONG-TERM GROUNDWATER MONITORING OPTIMIZATION
CLARE WATER SUPPLY SUPERFUND SITE (Continued)
MDEQcomments_responses final.doc Page 15 of 21
Commenter Area Page/Line/Para Comment Response
MH PRB Comment 4
PRB General
Comment
4) The hydrogeology of the entire site should be looked
at as a whole. Isopotential maps should include all parts of the site and should be updated following each monitoring event.
Comment noted.
MH PRB Comment 1
PRB Specific
Comment
1) Page 2, pp 1; The document describes the surficial
unconfined aquifer as perched water. “Perched” suggests that the aquifer rests above some dry vadose soils. This is not the case. This unconfined portion of the aquifer becomes continuous with the main (deeper) aquifer to the east of the PRB.
Perched aquifers are aquifers that have a relatively low-permeability confining layer (aquiclude) below the groundwater, and sit above the main water table. Information supplied to the authors suggests that the surficial aquifer is perched above a relatively low-permeability till unit in the area of the PRB.
Perched water is usually more susceptible to fluctuations caused by seasonal influences. While the perched water may discharge to the main aquifer to the east or to the ditch to the south, in the area of the PRB, the surficial unit is technically perched.
MH PRB Comment 2
PRB Specific
Comment
2) Page 2 bullet 1; To the best of my knowledge,
monitored natural attenuation (MNA) is not part of the ROD remedy. In this bulleted section, one of the goals should be to effect reliable source control measures.
In order to collect data in support of monitoring objectives, it is good to have monitoring objectives.
As there are no explicitly defined monitoring goals for the PRB area, the authors created some. The first bullet includes evaluating the effectiveness of source control measures, which is essential in implementing ‘reliable source control measures’ as stated in the comment.
Under monitoring goals for the PRB, the authors do not mention monitored natural attenuation (MNA) as a remedy strategy. However, the authors do acknowledge the existence of natural attenuation processes. Vinyl chloride is biodegraded aerobically (see reference Note 5), and physical processes such as dilution and dispersion contribute to reduced concentrations downgradient from a source. Collectively, these processes are known as ‘natural attenuation’, and this is what was meant in

RESPONSE TO MDEQ’s COMMENTS ON THE DRAFT LONG-TERM GROUNDWATER MONITORING OPTIMIZATION
CLARE WATER SUPPLY SUPERFUND SITE (Continued)
MDEQcomments_responses final.doc Page 16 of 21
Commenter Area Page/Line/Para Comment Response
the statement.
Although MNA is not a formal part of the remedy identified in the ROD, in reality it is part of the remedy that is being relied upon because there are VOC concentrations that exceed cleanup goals that are not being treated by the PRB. This should not be ignored, regardless of whether or not MNA is included in the ROD.
The combined influence of the PRB and natural attenuation processes limit the extent of groundwater affected with constituents above regulatory limits. The goal of the monitoring program should be to evaluate the extent of groundwater above regulatory screening levels.
Later in the report, the authors point out that MNA appears to be a tacit remedy for intermediate and deep groundwater in the PRB area, as the PRB’s do not extend to deeper areas of contamination. This comment will be edited, as it is misleading.
The authors did not include confirmation of source control as a monitoring objective, as no source of constituents was identified to us. However, the authors would support monitoring of the source area, once it is identified. The ROD (1992) states that “a source removal action was undertaken by one of the PRPs in this area under an order from the MDNR”, but it is not clear if this was the source of vinyl chloride in the PRB area.
In the future, identification of the source of vinyl chloride and a complete statement of monitoring objectives may be included as part of a Site Conceptual Model.
MH PRB PRB 3) Page 2, Section 2.1, pp 2; The statement is made
that the shallow groundwater direction is south to Comment noted. The groundwater flow direction was inferred from the measured hydraulic potentials,

RESPONSE TO MDEQ’s COMMENTS ON THE DRAFT LONG-TERM GROUNDWATER MONITORING OPTIMIZATION
CLARE WATER SUPPLY SUPERFUND SITE (Continued)
MDEQcomments_responses final.doc Page 17 of 21
Commenter Area Page/Line/Para Comment Response
Comment 3 Specific Comment
southeast, across the PRB. Simply demonstrating a hydraulic potential across the PRB (4 times per year) is not equivalent to demonstrating flow through the PRB.
which is a typical practice. The authors agree that the flow direction is inferred, and not specifically demonstrated. The text will be revised to better indicate this.
MH PRB Comment 4
PRB Specific
Comment
4) Page 2, Section 2.1, pp 4; The document states that
the wetlands area directly recharges the aquifer. Is this known or assumed?
The ROD (1992) states “The drainage ditch empties into a small wetlands area which directly recharges the aquifer in the vicinity of the two contaminated wells.” Both the ROD and the maps received are not clear in distinguishing the various ditches across the site. The ROD statement was assumed to apply to the ditch south of the PRB which appears to flow to the east.
Clarifying the interaction between area surface water and groundwater may be a goal of a site conceptual model.
MH PRB Comment 5
PRB Specific
Comment
5) Page 3, Section 2.2, pp 3; The authors state that at
the ExCello site, that some impacts” remained in place near DMW1S, 2S, and 3S. This area should be defined and the impacts monitored.
Comment noted.
MH PRB Comment 6
PRB Specific
Comment
6) Page 3, Section 2.2, pp 4; I would like to know how
much water PRP-1 is pumping and at what rate in a 10-7 cm/sec formation. Does PRP-1 even pump water? If the MAROS software(s) used this hydraulic conductivity, then a sensitivity analysis should be performed or pneumatic slug testing of the existing site monitoring wells.
PRP-1 is approximately 400 ft W/SW of the Ex-Cello area. The PRP-1 area was not analyzed as part of the LTMO evaluation, and the authors do not have any details about this well. Hydraulic conductivity in this area may be different from the soil cell as the clay/till unit disappears to the east.
For the Ex-Cello/Soil Remedy area, seepage velocity was used as a qualitative metric of the propensity for the groundwater plume to expand. The combination of low groundwater velocity and decreasing to non-detect concentrations indicates the plume does not require an extensive monitoring effort. The authors do recommend further groundwater testing to delineate the groundwater quality north and east of the soil cell as described in

RESPONSE TO MDEQ’s COMMENTS ON THE DRAFT LONG-TERM GROUNDWATER MONITORING OPTIMIZATION
CLARE WATER SUPPLY SUPERFUND SITE (Continued)
MDEQcomments_responses final.doc Page 18 of 21
Commenter Area Page/Line/Para Comment Response
Section 5.1 of the report.
MH PRB Comment 7
PRB Specific
Comment
7) Page 5, Section 3.3; The statement is made that the
“Dataset transmitted by Progressive was not complete…”. This should be looked into. If the MAROS evaluation can be influenced by data that was omitted, that data should be provided and reevaluated. I would like to know why “data for vinyl chloride and tetrachloroethylene collected prior to 2005 were not included for most wells
This statement will be corrected. The data set for the PRB provides what appears to be a full set of data for PCE, TCE, cDCE and VC.
The soil remedy data set does not have results for PCE and VC prior to 2005 for many wells.
See Comment 1a on historic data.
MH PRB Comment 8
PRB Specific
Comment
8) Page 6, Section 3.3, pp 3; The dynamics of the
groundwater flow at the site should be evaluated and should include the entire range of groundwater directions that would result from seasonal variation.
Comment noted.
MH PRB Comment 9
PRB Specific
Comment
9) Page 8, pp 3; The last sentence in this bullet
indicates that surface water exposure pathway is not a concern. This should be discussed among the agencies. If this result influences the MAROS data evaluation, the site should be reevaluated.
The potential for groundwater to discharge to the ditch is of concern to the authors.
The LTMO analysis indicates that the southerly (inferred downgradient) extent of the VOC plume is not well defined.south of the PRBs.
Unless additional sample data are available for shallow groundwater and the groundwater/surface water interface, the LTMO evaluation will not change.
MH PRB Comment 10
PRB Specific
Comment
10) Page 8, pp 4; The contamination in the intermediate
and deeper portions of the aquifer should be defined and monitored.
Comment noted.
MH PRB Comment 11
PRB Specific
Comment
11) Page 8, last paragraph; MNA is not part of the ROD
remedy. Comment noted. MNA was not considered as a remedial alternative in the ROD (1992). This will be edited.
MH PRB Comment 12
PRB Specific
12) Page 9, Section 4.2, bullet 3; I have to raise the
question of how can one reliably estimate the center of mass if that mass has not been defined and is not monitored?
The center of mass is calculated only for the area covered by the wells. Mass outside of the well network is not considered.

RESPONSE TO MDEQ’s COMMENTS ON THE DRAFT LONG-TERM GROUNDWATER MONITORING OPTIMIZATION
CLARE WATER SUPPLY SUPERFUND SITE (Continued)
MDEQcomments_responses final.doc Page 19 of 21
Commenter Area Page/Line/Para Comment Response
Comment
MH PRB Comment 13
PRB Specific
Comment
13) Page 10, pp 2; This paragraph describes an order of
magnitude change in concentration over the course of the past year yet earlier in this document the authors recommend that this well no longer be monitored due to its redundancy. This would seem to be a valuable well, why would we not monitor it?
The authors state that well MW-305 “is recommended for retention in the monitoring program at a semiannual frequency”. The initial statistical evaluation found this well to be redundant because, over the length of the monitoring record, the concentration at MW-305 could be estimated from surrounding wells. Statistically, the well was not unique. However, the well was retained in the network after the qualitative evaluation (see Table 6) because of reasons laid out in Table 3. The preliminary frequency analysis indicated that MW-305 should be sampled Quarterly, because of the jump in concentration. However, after the qualitative evaluation the recommendation was made for semi-annual sampling. MW-305 is a good example of why all statistical evaluations should be reviewed qualitatively.
MH PRB Comment 14
PRB Specific
Comment
14) Page 10, Section 4.3, bullet 3; Once again, MNA is
not part of the ROD remedy. Comment noted. See response to MH PRB comment 2.
MH PRB Comment 15
Soil Remedy Specific
Comment
15) Page 11, pp 3; Before the “risks to receptors” is
evaluated, shouldn’t we define the limits of the groundwater and soil contamination?
Comment noted. Definition of extent of contamination is typically performed prior to completion of risk analysis.
MH PRB Soil Remedy
16) Page 11, pp 4; As Parsons points out, the
institutional controls should be evaluated in light of where contamination is and can potentially migrate
Comment noted.

RESPONSE TO MDEQ’s COMMENTS ON THE DRAFT LONG-TERM GROUNDWATER MONITORING OPTIMIZATION
CLARE WATER SUPPLY SUPERFUND SITE (Continued)
MDEQcomments_responses final.doc Page 20 of 21
Commenter Area Page/Line/Para Comment Response
Comment 16 Specific Comment
to.
MH PRB Comment 17
Soil Remedy Specific
Comment
17) Page 11, Last paragraph; This paragraph details a
data gap in the current monitoring well network. This data gap should be filled with a VAS investigation and an appropriate monitoring well or two.
Comment noted.
MH PRB Comment 18
Soil Remedy Specific
Comment
18) Page 12, pp 2; This paragraph correctly reiterates
the need for additional characterization and some additional monitoring to demonstrate that the ExCello remedy is working effectively.
Comment noted.
MH PRB Comment 19
Soil Remedy Specific
Comment
19) Page 12, pp 4; Hydraulic conductivity measurements
in a distribution of site monitoring wells should be measured to resolve this data gap. I suggest pneumatic slug testing as it is fairly inexpensive and easy to perform.
Comment noted.
MH PRB Comment 20
Soil Remedy Specific
Comment
20) Page 12, last paragraph; The statement is made that
“this TCE detection does not appear to be of concern given the lack of nearby receptors.” This should be looked at in light of the 10-year capture zone for the municipal well system, ARAR’s, and the availability of adequate institutional controls.
A formal site conceptual model may be a good place to evaluate these issues.
MH PRB Comment 21
Soil Remedy Specific
Comment
21) Page 13, pp 1; Perhaps the ExCello remedy needs to
be reevaluated. Since water is being pumped from within the enclosure, even after years of operation, it may be that the cap, sidewalls or floor may be leaking. Is it time to sample the soil within the enclosure (I did not see any soil gas probes) to determine if the treatment objectives have been met? How do the soil/groundwater concentrations outside the cell compare to those media within the cell?
The authors do not have access to sampling data within the cell.

RESPONSE TO MDEQ’s COMMENTS ON THE DRAFT LONG-TERM GROUNDWATER MONITORING OPTIMIZATION
CLARE WATER SUPPLY SUPERFUND SITE (Continued)
MDEQcomments_responses final.doc Page 21 of 21
Notes:
1. JS = Comment received from John Spielberg MDEQ
2. BV = Comment received from Barbara Vetorts MDEQ.
3. MH = Comment received from Mark Henry.
4. DNAPL References: Kavanaugh et al. (2003) The DNAPL Remediation Challenge: Is there a case for source depletion. USEPA EPA/600/R-03/143.
5. Bradley, P.M. and F.H. Chapelle, Effect of Contaminant Concentration on Aerobic Microbial Mineralization of DCE and VC in Stream-Bed Sediments. Environmental Science and Technology, 1998. 32(5): p. 553-557.