Groundwater Model Report - loadstonepty.comloadstonepty.com/docs/App I_SLR (2013f)_Groundwater Model...
63
EPL-3112, Dordabis Iron Ore Mine Project Groundwater Model Report Steady State Groundwater Flow and Transient Non-Reactive Transport Modelling SLR Project No.: 733.12017.00003 July 2013 Lodestone Namibia (Pty) Ltd. 12 th floor Sanlam Centre Independence Avenue Windhoek
Transcript of Groundwater Model Report - loadstonepty.comloadstonepty.com/docs/App I_SLR (2013f)_Groundwater Model...

EPL-3112, Dordabis Iron Ore Mine Project
Groundwater Model Report
Steady State Groundwater Flow and
Transient Non-Reactive Transport Modelling
SLR Project No.: 733.12017.00003
July 2013
Lodestone Namibia (Pty) Ltd.
12th floor Sanlam Centre
Independence Avenue
Windhoek
EPL-3112, Dordabis Iron Ore Mine Project
Groundwater Model Report
Steady State Groundwater Flow and
Transient Non-Reactive Transport Modelling
SLR Project No.: 733.12017.00003
July 2013
Lodestone Namibia (Pty) Ltd.
12th floor Sanlam Centre
Independence Avenue
Windhoek

DOCUMENT INFORMATION
Title Groundwater Model Report – Dordabis Iron Ore Mine Project
Project Manager Braam Van Wyk
Project Manager e-mail [email protected]
Author Florian Winker
Reviewer Braam Van Wyk, Arnold Bittner
Client Lodestone Namibia (Pty) Ltd
Date last printed 2013/08/02 10:32:00 AM
Date last saved 2013/08/02 10:32:00 AM
Comments
Keywords Flow and transport modelling, Lodestone, Dordabis
Project Number 733.12017.00003
Report Number 2013-G34-V1
Status Client Draft
Issue Date July 2013
SLR Environmental Consulting (Namibia) (Pty) Ltd
SLR Ref. 733.12017.00003 Report No.2013-G34
Groundwater Model Report – Dordabis July 2013
Page i
GROUNDWATER MODEL REPORT – DORDABIS IRON ORE MINE PROJECT
CONTENTS
EXECUTIVE SUMMARY .............................................................................................................................. 1
1 INTRODUCTION ................................................................................................................................... 3
1.1 MODEL OBJECTIVES .......................................................................................................................... 3
1.2 MODEL FUNCTION ............................................................................................................................. 3
1.3 GENERAL SETTINGS .......................................................................................................................... 4 1.3.1 PROJECT AREA LOCATION ............................................................................................................................ 4 1.3.2 CLIMATE ..................................................................................................................................................... 4 1.3.3 TOPOGRAPHY .............................................................................................................................................. 7 1.3.4 GEOLOGY ................................................................................................................................................... 7 1.3.5 HYDROLOGY ............................................................................................................................................. 10 1.3.6 LAND USE ................................................................................................................................................. 11
2 CONCEPTUAL MODEL ...................................................................................................................... 11
2.1 AVAILABLE MODELS AND DATA ........................................................................................................ 11
2.2 AQUIFER SYSTEM ........................................................................................................................... 11
2.3 WATER QUALITY ............................................................................................................................. 15
2.4 HYDROLOGIC BOUNDARIES ............................................................................................................. 18
2.5 HYDRAULIC PROPERTIES ................................................................................................................. 18
2.6 SOURCES AND SINKS ...................................................................................................................... 20 2.6.1 RECHARGE ............................................................................................................................................... 20 2.6.2 EVAPOTRANSPIRATION ............................................................................................................................... 21 2.6.3 CROSS-BOUNDARY INFLOW & OUTFLOW...................................................................................................... 21 2.6.4 ABSTRACTION ON NEIGHBOURING FARMS .................................................................................................... 21
3 GROUNDWATER MODELLING SOFTWARE ................................................................................... 22
4 MODEL CONSTRUCTION .................................................................................................................. 22
4.1 MODEL DOMAIN .............................................................................................................................. 22
4.2 HYDRAULIC PARAMETERS ............................................................................................................... 25
4.3 SOURCES AND SINKS ...................................................................................................................... 27 4.3.1 RECHARGE ............................................................................................................................................... 27 4.3.2 BOUNDARY CONDITIONS ............................................................................................................................. 28
4.4 SELECTION OF CALIBRATION TARGETS AND GOALS .......................................................................... 29
55 CCAALLIIBBRRAATTIIOONN .................................................................................................................................... 31
5.1 STATISTICAL CALIBRATION EVALUATION ......................................................................................... 31
5.2 FINAL HYDRAULIC CONDUCTIVITIES ................................................................................................. 34
5.3 STEADY STATE FLOW CHARACTERISTICS ......................................................................................... 35
5.4 WATER BALANCE ............................................................................................................................ 36
66 PPRREEDDIICCTTIIVVEE SSIIMMUULLAATTIIOONNSS ............................................................................................................. 37
6.1 MINE DEWATERING SIMULATIONS .................................................................................................... 37 6.1.1 ASSUMPTIONS AND LIMITATIONS .................................................................................................................. 37 6.1.2 SCENARIO 1: 5 YEARS OPERATIONAL PHASE ................................................................................................ 38 6.1.3 SCENARIO 2: END OF LIFE OF MINE (13 YEARS) ........................................................................................... 40 6.1.4 DISCUSSION .............................................................................................................................................. 41 6.1.5 MINE DEWATERING DESIGN ........................................................................................................................ 42
6.2 NON-REACTIVE TRANSPORT MODEL ................................................................................................. 43

SLR Environmental Consulting (Namibia) (Pty) Ltd
SLR Ref. 733.12017.00003 Report No.2013-G34
Groundwater Model Report – Dordabis July 2013
Page ii
6.2.1 ASSUMPTIONS AND LIMITATIONS .................................................................................................................. 43 6.2.2 SCENARIO 3: POST OPERATIONAL NON-REACTIVE TRANSPORT ASSUMING A DRY MINE PIT ............................. 44 6.2.3 SCENARIO 4: POST OPERATIONAL NON-REACTIVE TRANSPORT (PARTIALLY BACKFILLED MINE PIT) .................. 48 6.2.4 DISCUSSION .............................................................................................................................................. 51
77 CCOONNCCLLUUSSIIOONN ..................................................................................................................................... 51
7.1 CONFIDENCE IN MODEL PREDICTIONS .............................................................................................. 52
88 RREECCOOMMMMEENNDDAATTIIOONNSS ....................................................................................................................... 52
9 REFERENCES .................................................................................................................................... 54
LIST OF FIGURES
FIGURE 1: LOCATION OF EPL-3112 ................................................................................................................... 4
FIGURE 2: REGIONAL MONTHLY RAINFALL ..................................................................................................... 5
FIGURE 3: MEAN ANNUAL PRECIPITATION DERIVED FROM METONA & MET, 2002 ................................... 6
FIGURE 4: BOX-WHISKER RAINFALL FARM RIETFONTEIN [1980-1999] (METEONA, 2013) ......................... 6
FIGURE 5: REGIONAL GEOLOGY (WHK 2216, GSN). (LITHOCODES DESCRIPTION GIVEN IN TABLE 1) ... 9
FIGURE 6: SCHEMATIC GEOLOGICAL CROSS-SECTION ................................................................................ 9
FIGURE 7: REGIONAL WATER LEVELS (SLR, 2013A) .................................................................................... 12
FIGURE 8: LOCATION OF BOREHOLES IDENTIFIED IN HYDROCENSUS 2012 AND 2013 .......................... 13
FIGURE 9: GROUNDWATER HEAD CONTOUR LINES, GEOLOGY AND SURFACE WATER FEATURES ... 14
FIGURE 10: SIMPLIFIED NW-SE GEOLOGICAL CROSS-SECTION INCL WATER LEVEL DERIVED BY INTERPOLATION OF HYDROCENSUS AND GROWAS WATER LEVEL DATA .............................................. 15
FIGURE 11: RELEATIONSHIP BETWEEN MAR AND GROUNDWATER RECHARGE (SCHMIDT, 1997) ........ 21
FIGURE 12: MODELBOUNDARY, SURFACE WATER CATCHMENTS AND GW-CONTOURS ......................... 23
FIGURE 13: FINITE ELEMENT MESH ................................................................................................................. 24
FIGURE 14: MODEL DOMAIN – ELEVATIONS, HORIZONTAL AND VERTICAL DISCRETISATION ................ 25
FIGURE 15: INITIAL HYDROGEOLOGICAL UNITS AND ASSOCIATED CONDUCTIVITIES ............................. 27
FIGURE 16: RECHARGE RATES APPLIED TO LAYER 1 ................................................................................... 28
FIGURE 17: FINITE ELEMENT MESH AND BOUNDARY CONDITIONS ............................................................ 29
FIGURE 18: CALIBRATION TARGETS AND WATER LEVEL MONITORING POINTS ....................................... 30
FIGURE 19: SCATTERPLOT SHOWING OBSERVED VS. COMPUTED GROUNDWATER HEADS ................. 32
FIGURE 20: DISTRIBUTION OF FINAL HYDRAULIC CONDUCTIVITIES IN LAYER 1 ...................................... 34
FIGURE 21: DISTRIBUTION OF FINAL HYDRAULIC CONDUCTIVITIES IN LAYER 2 & 3 ................................ 35
FIGURE 22: COMPUTED GROUNDWATER CONTOURS IN LAYER 3 .............................................................. 36
FIGURE 23: PROPOSED DEVELOPMENTS AND DEPTH OF SOUTHERN PIT AT THE END OF LOM ........... 38
FIGURE 24: SCENARIO 1: GROUNDWATER HEAD CONTOURS AND RADIUS OF INFLUENCE ................... 39
FIGURE 25: SCENARIO 2: GROUNDWATER HEAD CONTOURS AND RADIUS OF INFLUENCE ................... 41
FIGURE 26: CONCEPTUAL MINE DEWATERING DESIGNS (AGES, 2013) ...................................................... 43
FIGURE 27: SCENARIO 3 (DRY MINE PIT): SPREADING OF POTENTIAL PLUME IN LAYER 2 ..................... 46
FIGURE 28: SCENARIO 3 (DRY MINE PIT): SPREADING OF POTENTIAL PLUME IN LAYER 3 ..................... 47
FIGURE 29: SCENARIO 4 (PARTIALY BACKFILLED MINE PIT): SPREADING OF POTENTIAL PLUME IN LAYER 2 49
FIGURE 30: SCENARIO 4 (PARTIALY BACKFILLED MINE PIT): SPREADING OF POTENTIAL PLUME IN LAYER 3 50

SLR Environmental Consulting (Namibia) (Pty) Ltd
SLR Ref. 733.12017.00003 Report No.2013-G34
Groundwater Model Report – Dordabis July 2013
Page iii
LIST OF TABLES
TABLE 1: REGIONAL LITHOSTRATIGRAPHIC SUCCESSION ........................................................................... 10
TABLE 2: MAJOR ION CONCENTRATIONS AND PHYSICAL PARAMETERS IN NEWLY DRILLED MONITORING BOREHOLES (FEB 2013) .......................................................................................................... 16
TABLE 3: METAL CONCENTRATIONS IN NEWLY DRILLED MONITORING BOREHOLES (FEB 2013) ........... 17
TABLE 4: TEST PUMPING SUMMARY ................................................................................................................. 19
TABLE 5: HYDRAULIC CONDUCTIVITY RANGES - LITERATURE VALUES ...................................................... 19
TABLE 6: BOREHOLE ABSTRACTION RATES RECORDED DURING HYDROCENSUS 2013 ......................... 21
TABLE 7: MODEL DETAILS .................................................................................................................................. 24
TABLE 8: MODEL LAYER SUMMARY AND INITIAL HYDRAULIC CONDUCTIVITIES ........................................ 26
TABLE 9: STEADY STATE CALIBRATION STATISTICS ..................................................................................... 31
TABLE 10: CALIBRATION SUMMARY: RESIDUALS AND CALIBRATION STATISTICS ...................................... 33
TABLE 11: FINAL HYDRAULIC CONDUCTIVITIES OF LODESTONE GROUNDWATER MODEL ....................... 34
TABLE 12: WATER BALANCE SUMMARY ............................................................................................................ 37
TABLE 13: SCENARIO 1: WATER BALANCE – 5 YEAR MINE DEWATERING .................................................... 40
TABLE 14: SCENARIO 2: WATER BALANCE – LOM MINE DEWATERING ......................................................... 40

SLR Environmental Consulting (Namibia) (Pty) Ltd
SLR Ref. 733.12017.00003 Report No.2013-G34
Groundwater Model Report – Dordabis July 2013
Page iv
ACRONYMS AND ABBREVIATIONS
Below a list of acronyms and abbreviations used in this report.
Acronyms / Abbreviations
Definition
BIF Banded Iron Formation
C Celsius
CDT Constant Discharge Test
d Day
DL,T,V Dispersivity (longitudinal, transversal, vertical)
E East
EIA Environmental Impact Assessment
EPL Exclusive Prospecting License
EPM Equivalent Porous Medium
h Hour
kf Hydraulic Conductivity
Km Kilometre
Km Kilometre
LoM Life of Mine
m Metre
M btc Metre below top casing
MAP Mean Annual Precipitation
MAR Mean Annual Rainfall
mm Millimetre
MRT Multi Rate Test
N North
Neff Drainable Porosity
Q Flow/Discharge
RoI Radius of Influence
RWL Rest Water Level
S South
SD Slimes Dam
SMZ Southern Marginal Zone
T Transmissivity
TMI Total Magnetic Intensity
W West
WRD Waste Rock Dump

SLR Environmental Consulting (Namibia) (Pty) Ltd
SLR Ref. 733.12017.00003 Report No.2013-G34
Groundwater Model Report – Dordabis Iron Ore Mine Project July 2013
Page 1
EXECUTIVE SUMMARY
The conceptual groundwater model for the proposed Dordabis Iron Ore Mine was converted into a
numerical groundwater model to simulate mine dewatering and the potential spreading of leachate
emanating from the proposed Slimes Dam and Waste Rock Dump sites evaluating associated impacts on
the groundwater environment. A 3-dimensional 3-layer, steady-state groundwater flow model using the
internationally accepted Feflow software was set-up to account for the geological complexity of the site
and different hydraulic parameters assigned to these layers within the model domain.
The model covers an area of approx. 230 km2 around the proposed mine. Based on available data,
derived from drilling and test pumping of monitoring boreholes, two hydrocensus campaigns and based
on other readily available information a conceptual model was established.
Due to limited information on hydrogeological characteristics and the complex geology prevailing the
EPM approach was used in which the fractured material is treated as a continious porous medium,
despite the results of the conceptual modelling characterising the groundwater system in place as
discountinious and compartimentalised. Further assumptions and limitations are given by neglecting
(amongst others) abstraction from boreholes on neighbouring farms and the influence of floods in the
ephemeral river.
Using 21 groundwater level data points within the model domain, derived from the latest 2013
hydrocensus and drilling activities in early 2013, a good calibration of the model was achieved with in the
focus area and the model subsequently used for the calculation of dewatering scenarios and transient
non–reactive contaminant transport simulations.Two (2) dewatering scenarios (5 years and end of mine
life) were simulated and potential impacts on the groundwater level and inflows into the open cast mine
calculated. Mine dewatering was simulated using hydraulic head boundary conditions assigned at the pit
bottom. Potential fissure water inflow into the pit after 5 years of mining and at the end of mine life are
estimated as approx. 70 m3/d and 200 m
3/d, respectively.
The simulated Radius of Influence (RoI) in both scenarios extends beyond the Tsatsachas farm border
and even across the Skaap River. Nevertheless, based on the conceptual model it is assumed that no
influence will be observed to this extent nor will water levels in the Skaap River be affected seriously. The
Skaap River is assumed to act as an distinct aquifer with only limited hydraulic connection to the bedrock
aquifer with major groundwater exchange only in areas where faults acting as water conduits. The model
assumes continuous bedrock units and that permeabilities measured in monitoring boreholes (which
intersected water) extend to the Skaap River. This is unlikely to be the case in reality, where some form
of barrier or impermeable matrix is likely to exist, which will reduce the extent of the RoI and seepage
losses in the alluvial aquifer.
The two mine dewatering scenarios served as the basis for the simulation of potential post operational
impacts on the groundwater system after mine closure by assuming a partially backfilled mine pit (5 year
dewatering scenario) and a completely dry mine pit (end of mine life scenario).

SLR Environmental Consulting (Namibia) (Pty) Ltd
SLR Ref. 733.12017.00003 Report No.2013-G34
Groundwater Model Report – Dordabis Iron Ore Mine Project July 2013
Page 2
Transient non-reactive transport models were set up simulating potential impacts on groundwater quality
due to leachates from the proposed Slimes Dams and Waste Rock Dump. The conservative transport
simulations over up to 500 years assumed a worst case scenario, i.e. continuous source strength for all
storage facilities and no degradation of any pollutants.
Flow velocities and travel times are predicted to be low/slow. The findings suggest that a dry mine pit
would be favourable in terms of capturing potential leachates since most facilities of the proposed
infrastructure would be located within the induced cone of depression. Nevertheless, a less extensive
cone of depression due to backfilling is not considered to have a major impact on groundwater quality
too. Slow transport velocities, dilution, source concentrations (most probably within relevant water quality
guidelines) make the exisitence of a permanent sink nt a neccessity. As a result the backfilling of the
mine pit with waste rock and tailings residuals, which are assumed to be non-acid generating based on a
geochemical study undertaken is recommended promoting a potential recovery of the water level and
thus a less extensive permanent radius of influence.
The drilling and testing of additional monitoring boreholes strategically placed around final infrastructure
and in the Skaap River and the establishment of a comprehensive groundwater monitoring network and
routine is recommended as well as updates of the groundwater model as geological, structural and
groundwater level and quality data become available.

SLR Environmental Consulting (Namibia) (Pty) Ltd
SLR Ref. 733.12017.00003 Report No.2013-G34
Groundwater Model Report – Dordabis Iron Ore Mine Project July 2013
Page 3
GROUNDWATER MODEL REPORT – DORDABIS IRON ORE MINE PROJECT
1 INTRODUCTION
In EPL-3112 situated some 70 km southeast of Windhoek Lodestone Namibia (Pty) Ltd (“Lodestone”) is
prospecting for oxidised iron ore in the form of hematite and magnetite. SLR Environmental Consulting
Namibia (Pty) Ltd (“SLR”) was appointed to provide groundwater specialist input to the Environmental
Impact Assessment (EIA) to be submitted with a mining license application for EPL3112. As part of the
investigations a numerical groundwater flow model was set up to simulate the groundwater flow pattern
and potential impacts on the groundwater system due to mining activities.
1.1 MODEL OBJECTIVES
Groundwater inflow to open-pit mines and mining infrastructures can create significant impacts both on
mine operations and on the environment. There are two major related issues that should be addressed:
mine dewatering requirements and environmental impacts on groundwater levels and on groundwater quality,
during mining and post-mining periods.
A groundwater flow model simulates hydraulic heads and groundwater flow rates within and across the
boundaries of the system under consideration. It provides estimates of water balance and travel times
along flow paths. A solute transport model simulates the concentrations of substances dissolved in
groundwater. These models can simulate the migration of solutes through the subsurface and the
boundaries of the system.
Decision support for mine construction (e.g. dewatering, mine water balance) shall be given. The model
results will be used for the assessment of groundwater risks and the valuation of suitable mitigation
measures.
Summarised, the groundwater model will be used to estimate:
general flow direction / velocity information
groundwater inflow volume estimations into the proposed mine pit
input to the general mine water balance
prediction of potential contaminant flow paths
1.2 MODEL FUNCTION
The 3-D numerical groundwater and solute-transport model was used to characterise the groundwater
system based on available information and to predict dewatering requirements and mining impacts. With
the aim of a calibrated steady state flow solution pit inflow was calculated by applying hydraulic head
boundary conditions. In addition results of two distinct dewatering scenarios were used in steady state

SLR Environmental Consulting (Namibia) (Pty) Ltd
SLR Ref. 733.12017.00003 Report No.2013-G34
Groundwater Model Report – Dordabis Iron Ore Mine Project July 2013
Page 4
flow and transient non-reactive transport simulations (convection and dispersion only) to predict worst
case pollution scenarios by neglecting chemical reactions like retardation and adsorption processes.
1.3 GENERAL SETTINGS
In a DESK STUDY AND HYDROCENSUS REPORT submitted in April 2013 (SLR, 2013a) a detailed discussion
of the regional characteristics is given. For the sake of completeness relevant information on the regional
characteristics required for the development of the numerical model is included in this paragraph.
1.3.1 PROJECT AREA LOCATION
The location of EPL-3112 is illustrated in Figure 1. It is located roughly 70 km from Windhoek en route to
Dordabis settlement. Most of the areas surrounding the EPL are privately owned farms with a few
resettlement farms south of the EPL-3112. The EPL area covers sections of two farms, namely
Tsatsachas to the south and Elisenhöhe to the north.
FIGURE 1: LOCATION OF EPL-3112
1.3.2 CLIMATE
The average annual temperatures range between 18-20˚C. The mean annual precipitation (MAP) for the
EPL is approximately 350 mm. Rainfall is generally in the form of thunderstorms which can be of high
intensity with lightning, (MET, 2002).

SLR Environmental Consulting (Namibia) (Pty) Ltd
SLR Ref. 733.12017.00003 Report No.2013-G34
Groundwater Model Report – Dordabis Iron Ore Mine Project July 2013
Page 5
The region’s monthly rainfall distribution is given in Figure 2. The data was sourced from a publication by
the Ministry of Works and Transport (MWT, 2012) for stations at Windhoek (55 km NW of the site) and
Gobabis (156 km NE of the site) and from the Atlas of Namibia for the 23-17 degree grid cell
(MENDELSOHN ET AL, 2002). Almost all precipitation falls during the summer months. Peak falls are in
January and February while almost no precipitation falls from June to August.
FIGURE 2: REGIONAL MONTHLY RAINFALL
In the Box-Whisker Plot shown in Figure 4, monthly rainfall data for the period 1980 - 1999 from rainfall
station located at Farm Rietfontein (located about 5 km southwest of the proposed mine) provided by the
Meteorological Service Namibia (“Meteona”) is illustrated. The ends of the Whisker are set at 1.5*IQR
above the third quartile (Q3) and 1.5*IQR below the first quartile (Q1). If the minimum or maximum
values are outside this range, then they are shown as outliers. The high variability, especially in the rainy
season is depicted.
Rainfall time series provided by Meteona are too short for accurate statistical evaluation therefore the
figure provided by the Atlas of Namibia will be used in the investigation. In Figure 3 mean annual rainfall
zones and gathered point data are illustrated.

SLR Environmental Consulting (Namibia) (Pty) Ltd
SLR Ref. 733.12017.00003 Report No.2013-G34
Groundwater Model Report – Dordabis Iron Ore Mine Project July 2013
Page 6
FIGURE 3: MEAN ANNUAL PRECIPITATION DERIVED FROM METEONA & MET, 2002
Labels JAN FEB MAR APR MAY JUN JUL AUG SEP OCT NOV DEC
Min 3.9 17.0 1.0 0.0 0.0 0.0 0.0 0.0 0.0 0.0 0.9 0.3
Q1 26.5 33.7 29.3 5.1 0.0 0.0 0.0 0.0 0.0 0.7 4.4 18.6
Median 88.8 75.4 56.7 20.3 0.0 0.0 0.0 0.0 0.0 2.9 13.0 35.9
Q3 114.1 104.7 75.7 32.4 4.5 0.0 0.0 0.0 1.6 13.0 34.0 63.1
Max 339.4 230.6 149.8 67.7 31.4 5.1 10.3 4.3 13.7 72.9 61.9 148.4
IQR 87.6 71.0 46.4 27.4 4.5 0.0 0.0 0.0 1.6 12.3 29.6 44.6
Upper Outliers 1.0 1.0 1.0 0.0 3.0 4.0 2.0 1.0 4.0 2.0 0.0 1.0
Lower Outliers 0.0 0.0 0.0 0.0 0.0 0.0 0.0 0.0 0.0 0.0 0.0 0.0
Average 85.4 79.9 55.4 23.4 4.6 0.4 0.5 0.2 1.7 12.3 21.2 47.8
0.0
50.0
100.0
150.0
200.0
250.0
300.0
350.0
JAN FEB MAR APR MAY JUN JUL AUG SEP OCT NOV DEC
Ra
infa
ll [m
m/m
on
th]
Min Outlier Max Outlier
FIGURE 4: BOX-WHISKER RAINFALL FARM RIETFONTEIN [1980-1999] (METEONA, 2013)

SLR Environmental Consulting (Namibia) (Pty) Ltd
SLR Ref. 733.12017.00003 Report No.2013-G34
Groundwater Model Report – Dordabis Iron Ore Mine Project July 2013
Page 7
1.3.3 TOPOGRAPHY
In general, the topography of the EPL area is undulating plains, with gentle rises and dips, crossed by a
few shallow watercourses.
The vegetation specialist study reports small rocky outcrops of varying sizes, but mostly only 1 m above
the surrounding terrain. A few small rocky hills exist with steep slopes. The plains in the west consist of
deep sand and in the east of shallower soil on a calcareous base. Within the sandy plain there is a group
of three small pans (C. Christian, personal comm.).
The highest point within the EPL can be found in the NW (1965 m amsl) while the site is sloping towards
the south-eastern corner (lowest point: 1551 m amsl).
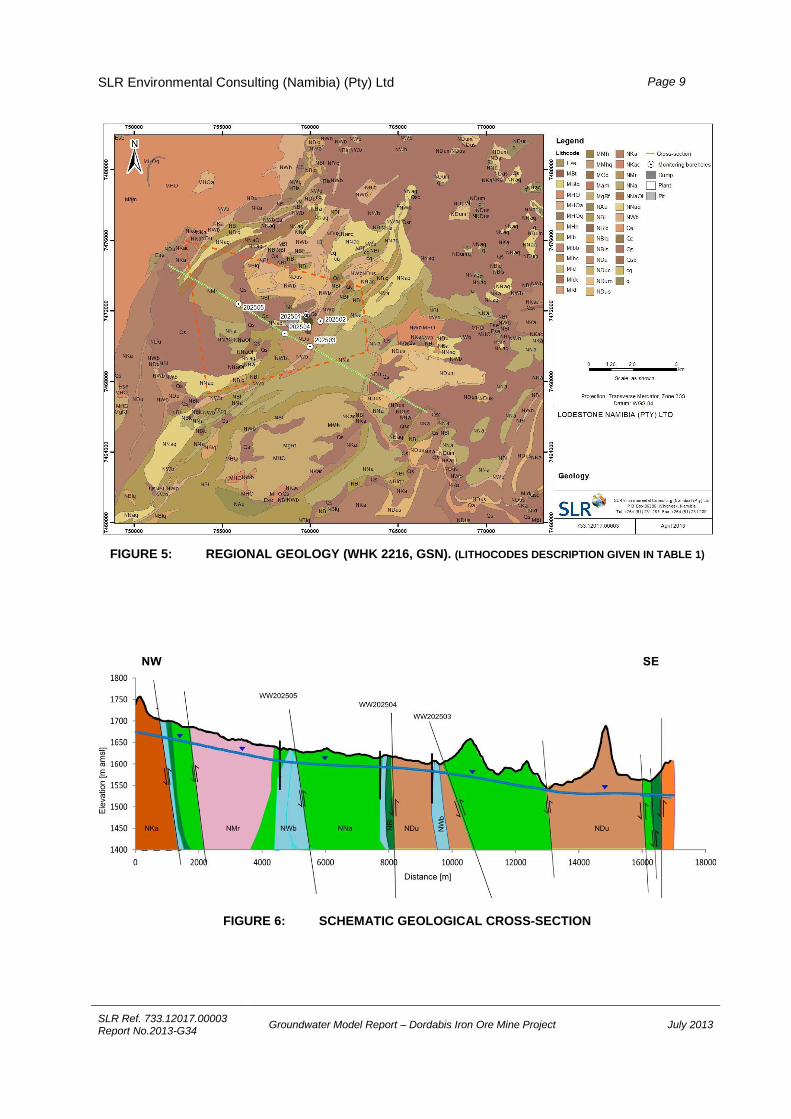
1.3.4 GEOLOGY
The project area is located in the Southern Marginal Zone (SMZ) of the Damara Orogenic Belt
comprising mainly low to medium grade metamorphic rocks in a thrust belt. The geology of the project
area, illustrated in Figure 5, is predominantly made up by rocks of the Nosib and Hakos Groups of the
Damara Supergroup and is complex in geology and structure.
The Hakos Group consists of rocks of the Kudis and the Vaalgras Subgroups. The Kudis Subgroup in
general consists of the Auas, Hakosberg, Blaukranz, Waldburg and Coas Formations and the Vaalgras
Subgroup consists in general of the Ghomab, Mahonda, Melrose, Samara and Naos Formations. The
Nosib Group consists of the Kamtsas and Duruchaus Formation. The oldest rocks in the project area
(predominantly granitic and gneissic rock types) are classed with the Hohewarte Complex. The regional
lithostratigraphic succession (after Miller, 2008) is given in Table 1.
The project area represents not only topographically a depression but also geologically it can be
described as a regional syncline structure. The area was exposed to a number of phases of folding and
stresses (compressional stress and shear stress) with varying intensities. The rocks of the Nosib and
Hakos Groups were pushed in a north-western direction onto the Hohewarte Complex resulting in a
complex stratigraphic succession characterised by overturned and recumbent folds as well as thrust
faults.
Within the EPL the following Formations and rock types prevail (after Miller, 2008):
The main rock type in the Melrose Formation is the uniform pelitic schist with large garnet
porphyroblasts. The appearance of the schist does however change with the differing metamorphic
grades.
The Naos Formation (Vaalgras Subgroup) hosts the Banded Iron Formation (BIF) commonly referred to
as the “Khomas Itabirites” representing prominent outcrops and range in thickness between a few
centimetres to 10 m or more. They have been highly metamorphosed and are deformed as part of

SLR Environmental Consulting (Namibia) (Pty) Ltd
SLR Ref. 733.12017.00003 Report No.2013-G34
Groundwater Model Report – Dordabis Iron Ore Mine Project July 2013
Page 8
synclinal and anticlinal structure; as a result tight isoclinal folds and faulting have caused duplication of
Itabirites layers. Mica schist; diamictite; pebbly schist; quartzite (micaceous); amphibolite; quartzite
(ferruginous) display associated rock types.
Units within the Kudis Subgroup are the Waldburg and Blaukrans Formations. The Waldburg Formation
in general consists of strongly tectonised dark grey, bluish grey and white dolomitic to calcitic marble that
form lenses at or near the base of the Subgroup. The marbles which contain talc, tremolite and/or quartz
in places, interfinger laterally and vertically with graphitic schist of the Blaukrans Formation (Miller, 2008
after Hoffmann, 1989)
The pelitic graphite schist of the Blaukrans Formation forms in general the thickest and laterally most
extensive unit of the Kudis Subgroup. The Waldburg, Hakosberg and Auas Formations are interbedded
within the Blaukranz graphitic schist. The rock types include black, variably pyritic, graphite-rich schist
and grey quartz-mica schist and graphitic quartz-muscovite schist. Thinly interbedded rock types include
lenses of grey to black marble, calcareous schist, pebbly schist, quartzite, quartzose or schistose
conglomerate that is usually variably graphitic and fine grained pyritic chert.
The Nosib Group in the Southern Margin Zone consists of the arkosic Kamtsas Formation and the more
pelitic Duruchaus Formation. The Kamtsas Formation covers extensive platform areas adjacent to the
southern graben of the Damara Belt, whereas the Duruchaus Formation is the rift-fill succession within
the graben. The Kamtsas Formation extends from the platform areas to the south into the graben where
it interfingers with and is overlain by the Duruchaus Formation.
The Kamtsas Formation forms prominent fault-bounded mountain ridges. The frontal thrust of the SMZ is
located along the northern foot of these ridges. The Kamtsas Formation is a succession of grey to light
reddish, medium – to–coarse, feldspathic quartzite with a maximum thickness of about 6000 m. The
quartzite rests unconformably on the pre Damara rocks.
The Duruchaus Formation form individual tectonic slices, some of which are thin but laterally continuous
for several kilometres. The main rock types in this area are, phyllite, phyllitic siltstones and sandy
siltstones that metamorphism transformed to fine grained mica schist.
In Figure 6 the above discussed Formations are illustrated in a NW-SE schematic cross-section striking
recently drilled monitoring boreholes. Field observation indicated a much more complex geological
setting as shown in the geological map (1:250 000, Sheet Windhoek). Nevertheless, in consequence of
limited detailed geological information available the geological map was used as a basis for the study.
SLR Environmental Consulting (Namibia) (Pty) Ltd
SLR Ref. 733.12017.00003 Report No.2013-G34
Groundwater Model Report – Dordabis Iron Ore Mine Project July 2013
Page 9
FIGURE 5: REGIONAL GEOLOGY (WHK 2216, GSN). (LITHOCODES DESCRIPTION GIVEN IN TABLE 1)
FIGURE 6: SCHEMATIC GEOLOGICAL CROSS-SECTION

SLR Environmental Consulting (Namibia) (Pty) Ltd
SLR Ref. 733.12017.00003 Report No.2013-G34
Groundwater Model Report – Dordabis Iron Ore Mine Project July 2013
Page 10
TABLE 1: REGIONAL LITHOSTRATIGRAPHIC SUCCESSION
Group Subgroup Formation Code Lithology
- - - - - - - -- Quaternary Sediments - - - - - - - -
Qa Alluvium
Qs Qc
Surficial deposits Calcrete
- - - - - - - - - - - - - - - - - - - - - - - - - - - - - - - - - - - - Discordance - - - - - - - - - - - - - - - - - - - - - - - - - - - - - - - - - - - - - - -
Hakos Vaalgras Gomab River NGr Mica schist; chlorite-amphibole-carbonate schist; metafelsite; marble
Mahonda NMh Quartzite
Melrose NMr Mica schist; garnet-muscovite schist, quartzite (calcareous); schist (calcareous)
Samara/Corona NCr Marble (dolomitic/calcitic); schist; phyllite; quartzite
Naos NNa Mica schist; diamictite; pebbly schist; quartzite (micaceous); amphibolite; quartzite (ferruginous)
Kudis Auas NAu Quartzite; mica schist; graphitic schist
Hakosberg NHk Quartzite
Blaukranz NBl Schist (graphitic); schist (calcareous);marble; quartzite; conglomerate; schist (pebbly)
Waldburg NWb Marble; schist (graphitic); mica schist; quartzite
Coas NCs Carbonate bearing succession
- - - - - - - - - - - - - - - - - - - - - - - - - - - - - - - - - - - - Discordance - - - - - - - - - - - - - - - - - - - - - - - - - - - - - - - - - - - - - - -
Nosib Duruchaus NDu Mica schist; quartz-feldspar schist; phyllite; quartzite; calcareous schist; impure marble; conglomerate
Kamtsas NKa Quartzite (feldspathic/pebbly); shale; conglomerate
- - - - - GamsbergSuite /Rietfontein - - - - - - MgRf Granite
Rehoboth Marienhof
- - - - - - - - Hohewarte Complex - - - - - - - - MHO Paragneiss; migmatite; orthogneiss; amphibolite; granite; quartzite; schist
1.3.5 HYDROLOGY
The project site is situated within the catchment of the Skaap River, approximately 5.5 km upstream of
the Skaap River runoff gauging station on Farm Hatsamas. The surface water catchment upstream of
this gauging station has an area of 738 km2. After an approximate total length of flow of 150 km the
Skaap River disappears in the permanent dune field of the Kalahari.
As illustrated in Figure 9 (page 14), the proposed project infrastructure is located on a water divide
striking through the EPL from NW to SE. The entire EPL drains into the Skaap River. The watercourses
on the northern side of the water divide all drain in a north-eastern direction directly into the Skaap River
while the watercourses on the southern side of the divide drain into a tributary of the Skaap River. More
information can be found in SLR (2013c) representing a detailed surface water study as input to the EIA.

SLR Environmental Consulting (Namibia) (Pty) Ltd
SLR Ref. 733.12017.00003 Report No.2013-G34
Groundwater Model Report – Dordabis Iron Ore Mine Project July 2013
Page 11
1.3.6 LAND USE
As aforementioned above most of the areas surrounding the EPL are privately owned cattle farm lands
with a few resettlement farms south of the EPL.
Since most bedrock aquifers in the area are medium to low yielding the higher yielding Skaap River
represents a preferable target for water supply to the farms. Either wells are dug into the alluvium of the
river or boreholes are drilled adjacent to the river intersecting hard rock benefiting from recharge of river
water.
2 CONCEPTUAL MODEL
2.1 AVAILABLE MODELS AND DATA
A digital elevation model (30 m x 30 m) of the project area derived from ASTER (Advanced Spaceborne
Thermal Emission and Reflection, USGS, 2013) data was used as a general terrain reference, since only
a local elevation survey was done covering the area of the proposed mine pits, which in addition shows
relative discrepancies to the regional spaceborne data.
Information on geology and structures were gathered using the geological map (1: 250.000 Geological
Series, Namibia, sheet 2216 Windhoek), the evaluation of bore loggings of monitoring and exploration
boreholes, magnetic intensity maps and satellite image interpretation.
The assessment of local and regional hydrogeological conditions and characteristics are based on site
visits and investigations (hydrocensus), the national borehole data base (GROWAS), the results of
drilling and hydraulic testing and review of data, literature and previous investigations done in adjacent
and/or similar environments.
In general the level of detail within the conceptual model is based on the modelling objectives, the
availability of quality data, knowledge of the groundwater system of interest, and its complexity.
2.2 AQUIFER SYSTEM
Groundwater within the project is hosted in two distinct aquifer types, in an alluvial river aquifer and in
fractured bedrock aquifers. The alluvial aquifer, represented by the Skaap River, holds water in
intergranular pore spaces, whereas water in the fractured bedrock aquifers is held in cracks and
fractures in otherwise impermeable strata.
It is assumed that there is only a limited hydraulic connection between the alluvial aquifer and the
bedrock aquifers, i.e. perched aquifer conditions dominate within the alluvial aquifer and hydraulic
connection to the bedrock aquifer with major groundwater exchange only taking place in areas where
faults striking the river system act as water conduits.

SLR Environmental Consulting (Namibia) (Pty) Ltd
SLR Ref. 733.12017.00003 Report No.2013-G34
Groundwater Model Report – Dordabis Iron Ore Mine Project July 2013
Page 12
Water levels recorded during 2 hydrocensus campaigns carried out in February 2012 and February 2013
are illustrated in Figure 7. Since most boreholes are located close to the Skaap River water levels are
rather shallow (≈ 10 m bgl) and water level information distant to the river is limited. Deep water levels
were found either in topographically higher areas (e.g. on Farm Langbeen) or in boreholes influenced by
abstraction from adjacent boreholes.
In recently drilled monitoring boreholes (WW202501 - WW202504) covering the area of the proposed
mine site, water levels between 14.7 m btc and 21.4 m btc were recorded. WW202505 located approx.
3 km northwest of the southern pit had a water level of 27.6 m btc and WW202508 and WW202509
located 4 km to 5 km west of the proposed infrastructure had deeper levels of 48.6 m btc and 52.7 m btc,
respectively. The rest water levels recorded in monitoring boreholes are listed in the test pumping
summary, section 2.5 page 18).
FIGURE 7: REGIONAL WATER LEVELS (SLR, 2013A)

SLR Environmental Consulting (Namibia) (Pty) Ltd
SLR Ref. 733.12017.00003 Report No.2013-G34
Groundwater Model Report – Dordabis Iron Ore Mine Project July 2013
Page 13
FIGURE 8: LOCATION OF BOREHOLES IDENTIFIED IN HYDROCENSUS 2012 AND 2013
The contour map in Figure 9 was produced by linear interpolation of groundwater heads derived by
subtracting water level data recorded during the hydrocensus 2013 and figures found in GROWAS from
Aster elevation data (USGS, 2013). It indicates steep groundwater head gradients up- and downstream
of the proposed infrastructure. This might be due to a lack in extensive water level information;
nevertheless conformity to geological units illustrated is given.
The regional groundwater flow is directed NW-SE across the geological strike (Damara strike). It is
assumed that local groundwater flow occurs along the strike within distinct hydrogeological units and the
contacts between different units often impermeable, hence with flow between different units often
restricted to fractured zones. This assumption is supported by test pumping results, where
compartmentalised, discontinuous aquifer behaviours were observed (SLR, 2013b) and by the deep rest
water level recorded lately in borehole (WW202506) utilised for water supply to the construction camp.
The anticlinal structure represented by the Nosib Group, Duruchaus Formation located just downstream
of the southern pit, striking in a NE-SW direction is assumed to act as a prominent regional barrier to
groundwater flow, while local thrust faults and contact zones between geological units are considered to
be conductors or barriers. During the drilling of the five monitoring boreholes (WW202501 - WW202505)
water was struck predominantly at the contact between different lithologies/rock types and/or formations
while only low to medium yields were encountered, which is assumed to be a regional characteristic (e.g.
DWAF, 2001), borehole yields stored in the GROWAS database also confirm this. Detailed information

SLR Environmental Consulting (Namibia) (Pty) Ltd
SLR Ref. 733.12017.00003 Report No.2013-G34
Groundwater Model Report – Dordabis Iron Ore Mine Project July 2013
Page 14
about drilling and test pumping can be found in SLR (2013b). Nevertheless, intersecting structures
and/or contact zones did not always result in the striking of water. Since none of the mapped, or
assumed prominent, regional potentially water bearing structure were identified during drilling activities,
their representation in the numerical model is debatable and should be implemented once more
information becomes available.
FIGURE 9: GROUNDWATER HEAD CONTOUR LINES, GEOLOGY AND SURFACE WATER FEATURES
The yellow line in Figure 9 shows the location of the schematic cross-section illustrated in Figure 10. The
blue line in the cross-section represents the interpolated water level. Conceptual water levels are given

SLR Environmental Consulting (Namibia) (Pty) Ltd
SLR Ref. 733.12017.00003 Report No.2013-G34
Groundwater Model Report – Dordabis Iron Ore Mine Project July 2013
Page 15
by the red lines in the cross-section and shall exemplify the assumed actual water level characteristics of
the compartmentalised discontinuous hydrogeological units implying limited hydraulic connections.
FIGURE 10: SIMPLIFIED NW-SE GEOLOGICAL CROSS-SECTION INCL WATER LEVEL DERIVED BY
INTERPOLATION OF HYDROCENSUS AND GROWAS WATER LEVEL DATA
2.3 WATER QUALITY
During the 2012 hydrocensus, groundwater samples were taken from four monitoring points and during
the 2013 hydrocensus, groundwater samples were collected from 10 monitoring points (one from each
farm) (SLR, 2013a). All samples were submitted to a laboratory for major ions and total metals analysis.
The results suggest that background groundwater quality is of reasonably good quality when compared
to Namibian Drinking Water Standards, however elevated nitrate concentrations were observed in two
boreholes; HAT-4 (2012) and in EB-1 (2013) and an elevated iron concentrations was observed in one
borehole; BK-3 (2013).
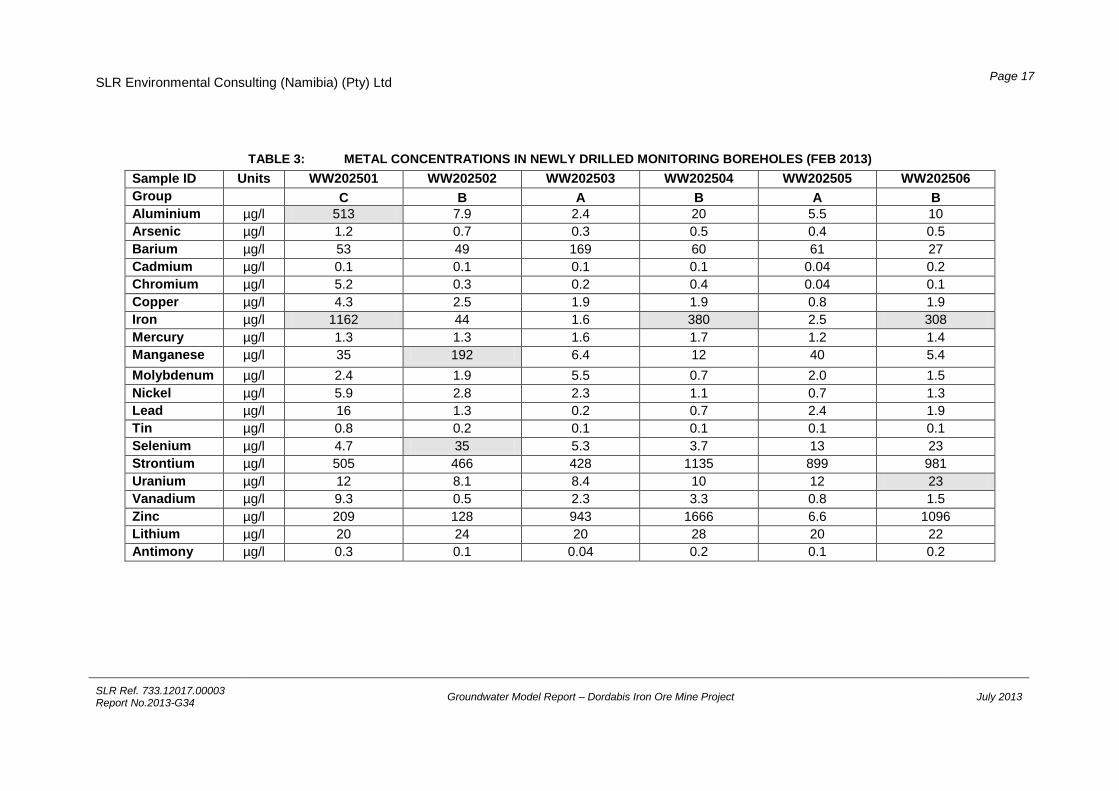
Water samples were also collected during the test pumping of newly drilled monitoring boreholes.
Concentrations of major ions and total metals analysed are given in Table 2 and Table 3, respectively
with concentration highlited determining the water quality group. The water quality in the monitoring
boreholes can be classified as good (based on Namibian guideline values) and is suitable for human
consumption. The highest iron concentration of 1162 µg/l (Group C) was found in borehole WW20251
and elevated concentrations (Group B) in WW202504 (380 µg/l) and WW202506 (380 µg/l). An elevated
manganese concentration of 192 µg/l compared to samples collected in the other monitoring boreholes
was detected in WW202502.

SLR Environmental Consulting (Namibia) (Pty) Ltd
SLR Ref. 733.12017.00003 Report No.2013-G34
Groundwater Model Report – Dordabis Iron Ore Mine Project July 2013
Page 16
TABLE 2: MAJOR ION CONCENTRATIONS AND PHYSICAL PARAMETERS IN NEWLY DRILLED MONITORING BOREHOLES (FEB 2013)
BH ID Unit WW202501 WW202502 WW202503 WW202504 WW202505 WW202506
Group D B B C B C
pH 7.4 7.1 7.3 7.0 7.9 7.1
Electrical Conductivity mS/m 132.3 122.2 86.3 227 95.7 206
Turbidity NTU 26 0.30 0.50 5.9 1.1 2.7
Total Dissolved Solids (det.) mg/l 812 736 473 1460 506 1357
P-Alkalinity as CaCO3 mg/l 0 0 0 0 0 0
Total Alkalinity as CaCO3 mg/l 480 494 385 584 352 546
Total Hardness as CaCO3 mg/l 769 626 458 994 375 987
Ca-Hardness as CaCO3 mg/l 332 280 207 454 152 382
Mg-Hardness as CaCO3 mg/l 437 346 251 539 222 605
Chloride as Cl- mg/l 21 29 16 200 42 128
Fluoride as F- mg/l 0.4 0.4 0.3 1.0 0.4 0.2
Sulphate as SO42-
mg/l 288 177 103 395 101 451
Nitrate as N mg/l <0.5 <0.5 6.4 1.1 <0.5 4.3
Nitrite as N mg/l <0.1 <0.1 <0.1 <0.1 <0.1 <0.1
Sodium as Na mg/l 17 42 13 152 60 108
Potassium as K mg/l 13 11 13 11 12 18
Magnesium as Mg mg/l 106 84 61 131 54 147
Calcium as Ca mg/l 133 112 83 182 61 153
SLR Environmental Consulting (Namibia) (Pty) Ltd
SLR Ref. 733.12017.00003 Report No.2013-G34
Groundwater Model Report – Dordabis Iron Ore Mine Project July 2013
Page 17
TABLE 3: METAL CONCENTRATIONS IN NEWLY DRILLED MONITORING BOREHOLES (FEB 2013)
Sample ID Units WW202501 WW202502 WW202503 WW202504 WW202505 WW202506
Group C B A B A B
Aluminium µg/l 513 7.9 2.4 20 5.5 10
Arsenic µg/l 1.2 0.7 0.3 0.5 0.4 0.5
Barium µg/l 53 49 169 60 61 27
Cadmium µg/l 0.1 0.1 0.1 0.1 0.04 0.2
Chromium µg/l 5.2 0.3 0.2 0.4 0.04 0.1
Copper µg/l 4.3 2.5 1.9 1.9 0.8 1.9
Iron µg/l 1162 44 1.6 380 2.5 308
Mercury µg/l 1.3 1.3 1.6 1.7 1.2 1.4
Manganese µg/l 35 192 6.4 12 40 5.4
Molybdenum µg/l 2.4 1.9 5.5 0.7 2.0 1.5
Nickel µg/l 5.9 2.8 2.3 1.1 0.7 1.3
Lead µg/l 16 1.3 0.2 0.7 2.4 1.9
Tin µg/l 0.8 0.2 0.1 0.1 0.1 0.1
Selenium µg/l 4.7 35 5.3 3.7 13 23
Strontium µg/l 505 466 428 1135 899 981
Uranium µg/l 12 8.1 8.4 10 12 23
Vanadium µg/l 9.3 0.5 2.3 3.3 0.8 1.5
Zinc µg/l 209 128 943 1666 6.6 1096
Lithium µg/l 20 24 20 28 20 22
Antimony µg/l 0.3 0.1 0.04 0.2 0.1 0.2

SLR Environmental Consulting (Namibia) (Pty) Ltd
SLR Ref. 733.12017.00003 Report No.2013-G34
Groundwater Model Report – Dordabis Iron Ore Mine Project July 2013
Page 18
2.4 HYDROLOGIC BOUNDARIES
The hydrologic boundaries are illustrated in the contour map given in Figure 9 (page 14). As
aforementioned the proposed infrastructure is placed on the water divide separating the Skaap River
catchment into an eastern and a western part. In addition the mountain ridge made up by rocks of the
Nosib Group (Kamtsas Formation) located in the west of the EPL represent a surface watershed border
rendering surface water flow from the upstream catchment area impossible. Since regional groundwater
data in this study is scarce and unreliable as well as unspecified water levels (date, etc.) stored in
GROWAS was included in the groundwater head interpolation the surface water divides shall be
assumed to be a proxy for the groundwater catchment, i.e. the model boundaries were delineated along
the catchment boundaries of the Skaap River where possible.
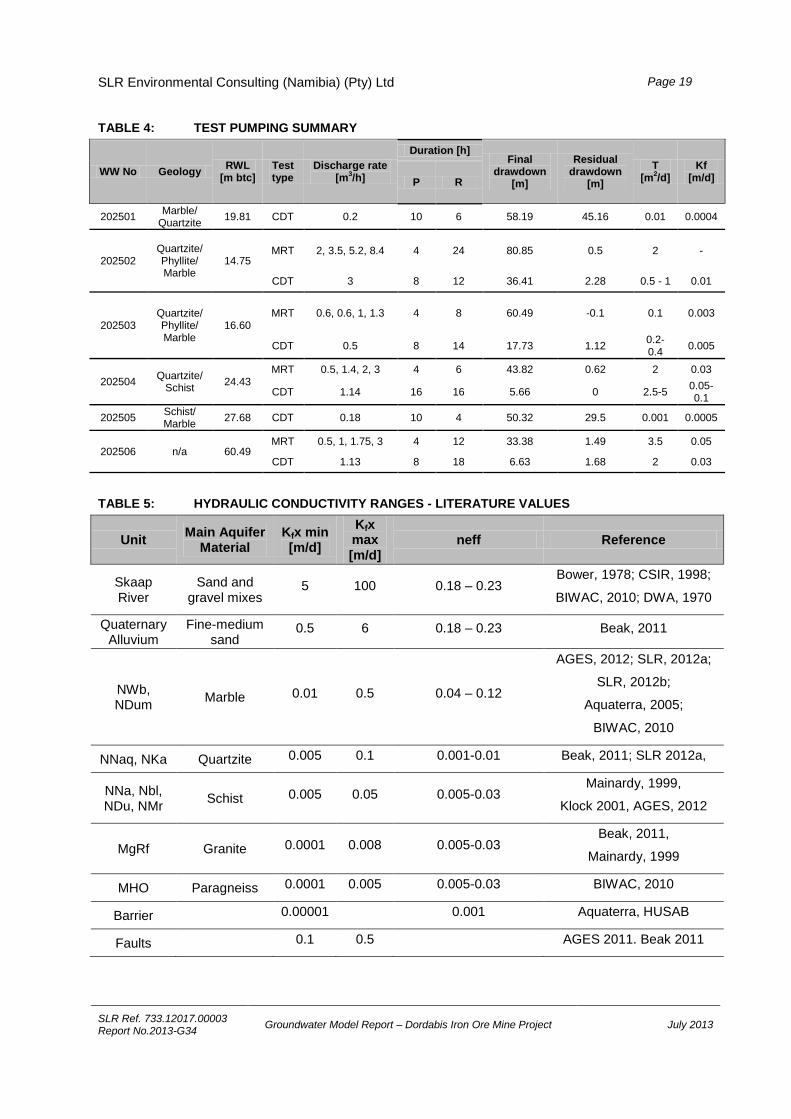
2.5 HYDRAULIC PROPERTIES
The monitoring boreholes drilled in early 2013 were test pumped shortly after drilling. Drilling results as
well as water level drawdown and recovery data of the pumping tests were evaluated and submitted in a
separate report (SLR, 2013b). The test pumping results are summarised in Table 4. Distinct water strikes
were encountered at all boreholes except WW202505 (seepage only). Water level responses to pumping
were typical for fractured double porosity aquifer systems. The high residual drawdowns in most of the
boreholes are indicative of the dewatering of localised and discontinuous aquifer systems with weak
hydraulic connection. Evaluated transmissivities are rather low ranging between <0.1 to 5 m2/d. Since no
observation boreholes exist in the vicinity of the pumped boreholes during testing, no storage parameters
were evaluated.
No test pumping was carried out within the Skaap River, nor could information about hydraulic
parameters be found in the archive of the Department of Water Affairs and Forestry or based on common
literature review. For a well located on Farm Tsatsachas a yield of 4 m3/h was reported (SLR, 2013a).
Based on this medium yields are expected (4-10m3/h) in the Skaap River.
Given the lack of information on extensive hydrogeological characteristics a literature review on hydraulic
properties of rock type in the project area has been completed. The hydraulic properties are summarised
in Table 3. The values stated display a wide range, due to different weathered and fractured conditions of
geological environments investigated.
SLR Environmental Consulting (Namibia) (Pty) Ltd
SLR Ref. 733.12017.00003 Report No.2013-G34
Groundwater Model Report – Dordabis Iron Ore Mine Project July 2013
Page 19
TABLE 4: TEST PUMPING SUMMARY
WW No Geology RWL
[m btc] Test type
Discharge rate [m
3/h]
Duration [h] Final
drawdown [m]
Residual drawdown
[m]
T [m
2/d]
Kf [m/d] P R
202501 Marble/
Quartzite 19.81 CDT 0.2 10 6 58.19 45.16 0.01 0.0004
202502 Quartzite/Phyllite/ Marble
14.75 MRT 2, 3.5, 5.2, 8.4 4 24 80.85 0.5 2 -
CDT 3 8 12 36.41 2.28 0.5 - 1 0.01
202503 Quartzite/Phyllite/ Marble
16.60 MRT 0.6, 0.6, 1, 1.3 4 8 60.49 -0.1 0.1 0.003
CDT 0.5 8 14 17.73 1.12 0.2-0.4
0.005
202504 Quartzite/
Schist 24.43
MRT 0.5, 1.4, 2, 3 4 6 43.82 0.62 2 0.03
CDT 1.14 16 16 5.66 0 2.5-5 0.05-0.1
202505 Schist/ Marble
27.68 CDT 0.18 10 4 50.32 29.5 0.001 0.0005
202506 n/a 60.49 MRT 0.5, 1, 1.75, 3 4 12 33.38 1.49 3.5 0.05
CDT 1.13 8 18 6.63 1.68 2 0.03
TABLE 5: HYDRAULIC CONDUCTIVITY RANGES - LITERATURE VALUES
Unit Main Aquifer
Material Kfx min [m/d]
Kfx max [m/d]
neff Reference
Skaap River
Sand and gravel mixes
5 100 0.18 – 0.23 Bower, 1978; CSIR, 1998;
BIWAC, 2010; DWA, 1970
Quaternary Alluvium
Fine-medium sand
0.5 6 0.18 – 0.23 Beak, 2011
NWb, NDum
Marble 0.01 0.5 0.04 – 0.12
AGES, 2012; SLR, 2012a;
SLR, 2012b;
Aquaterra, 2005;
BIWAC, 2010
NNaq, NKa Quartzite 0.005 0.1 0.001-0.01 Beak, 2011; SLR 2012a,
NNa, Nbl, NDu, NMr
Schist 0.005 0.05 0.005-0.03 Mainardy, 1999,
Klock 2001, AGES, 2012
MgRf Granite 0.0001 0.008 0.005-0.03 Beak, 2011,
Mainardy, 1999
MHO Paragneiss 0.0001 0.005 0.005-0.03 BIWAC, 2010
Barrier 0.00001 0.001 Aquaterra, HUSAB
Faults 0.1 0.5 AGES 2011. Beak 2011
SLR Environmental Consulting (Namibia) (Pty) Ltd
SLR Ref. 733.12017.00003 Report No.2013-G34
Groundwater Model Report – Dordabis Iron Ore Mine Project July 2013
Page 20
2.6 SOURCES AND SINKS
Sources of water to the project area are represented by direct recharge and inflow at model boundaries.
On the other hand sinks are specified by evapotranspiration, outflow at model boundaries as well as
water abstraction on farms located within the model area.
2.6.1 RECHARGE
A large range of recharge rates were reported by several investigations within Namibia and vary from
0.01% to 10% of mean annual rainfall (MAR) (e.g. Bardenhagen, 2007; Mainardy, 1999; Wrabel, 1999;
Külls, 2000. Heyns (1992) obtained a recharge rate for the entire country of 1% of MAR.
Aquifer recharge resulting from rainfall events is dependent on the temporal and spatial variation in
precipitation as well as the host rock surface and subsurface susceptibility in terms of infiltration and
storage. By virtue of its surface and subsurface hydrogeological conditions, the marble outcrop area is
potentially a good recharge area, but is also susceptible in terms of pollution. Due to the fact that most of
the precipitation in the region is in the form of thunderstorms, it is likely that some of the rain water
infiltrates into the coarser sediments and into open fractures and faults to finally reach the groundwater
table before evaporating or flowing into the next river bed.
Indirect recharge due to flood events in ephemeral rivers is assumed to be of major importance in the
project area. Surface water levels recorded at gauging stations in the Skaap River are of poor quality and
short in time. In addition river geometry and recharge mechanisms are not known. The highest recharge
rate will be applied to the Skaap River.
Figure 11 shows the relationship between Mean Annual Rainfall (MAR) and groundwater recharge (as
percentage of MAR) from studies in hard-rock environments of southern Africa.

SLR Environmental Consulting (Namibia) (Pty) Ltd
SLR Ref. 733.12017.00003 Report No.2013-G34
Groundwater Model Report – Dordabis Iron Ore Mine Project July 2013
Page 21
FIGURE 11: RELEATIONSHIP BETWEEN MAR AND GROUNDWATER RECHARGE (SCHMIDT, 1997)
2.6.2 EVAPOTRANSPIRATION
The evaporation rate within the region is estimated at 2,100 to 2,240mm/yr (MET, 2002).
Evapotranspiration was accounted for by applying net groundwater recharge in all areas.
2.6.3 CROSS-BOUNDARY INFLOW & OUTFLOW
An unknown volume of groundwater is assumed to enter the project area from the granitic and gneissic
rock types of the Hohewarte Complex, while the Skaap River is fed by upper catchment parts.
Groundwater leaves the project area via the alluvium of the Skaap River and the bedrock aquifers.
2.6.4 ABSTRACTION ON NEIGHBOURING FARMS
Borehole abstraction rates at farm boreholes were recorded during the hydrocensus whenever
possible/available. The gathered figures are listed in Table 6. Due to the complex geology prevailing and
the lack of information on regional hydrogeological characteristics, borehole abstraction on neighbouring
farms will not be implemented in the initial model. Nevertheless all borehole locations will be considered
during mesh generation for possible implementation at a later stage. Based on information listed in Table
6 the total volume abstracted from farms located in the project area is estimated to be approx.
150,000 m3/year.
TABLE 6: BOREHOLE ABSTRACTION RATES RECORDED DURING HYDROCENSUS 2013
BH ID Farm Pos Type Installation Q [m3/h]
AS-2 Alt Stoltzenfeld Maria BH hand pump 0.1
AS-3 Alt Stoltzenfeld Hoof Gat BH subm 1
AS-4 Alt Stoltzenfeld Berg Posten BH mono 1.8
AS-5 Alt Stoltzenfeld Kälberkamp BH subm 2
AS-6 Alt Stoltzenfeld BH mono 2
AS-7 Alt Stoltzenfeld Pos BH mono 2
SLR Environmental Consulting (Namibia) (Pty) Ltd
SLR Ref. 733.12017.00003 Report No.2013-G34
Groundwater Model Report – Dordabis Iron Ore Mine Project July 2013
Page 22
AS-8 Alt Stoltzenfeld House old BH subm 2
AS-9 Alt Stoltzenfeld House new BH subm 2
AS-10 Alt Stoltzenfeld Ooskamp BH subm 2
AS-10.2 Alt Stoltzenfeld Well BH mono 2
AS-10.3 Alt Stoltzenfeld Grenze Langbeen BH mono 2
AS-10.4 Alt Stoltzenfeld Engine Room BH open 2.5
AS_well1 Alt Stoltzenfeld Jonas Posten BH subm 3
AS-11 Alt Stoltzenfeld Pump 4 River BH subm 3
BK-1 Blaukranz near hothouse BH subm 4
BK-2 Blaukranz House BH subm 4
BK-3 Blaukranz Pit well subm 4
BK-4 Blaukranz Hoek Pos BH solar 8
BK-5 Blaukranz Fontein BH mono 10
EH-2 Elisenhöhe Kraal BH solar 1.5 - 2
EH-3 Elisenhöhe Gartenbohrloch BH solar 1.5 -2
EH-4 Elisenhöhe Middlepos BH solar 2000 l/day
EH-5 Elisenhöhe Tuin Pos BH mono 5000 l/day
EB-1 Emmabron Shikongo BH solar 5000 l/day
EB-2 Emmabron Bobbejan Pos BH mono 8000 l/day
EB-3 Emmabron Festus BH solar 8000 l/day
HAT-1 Hatsamas Damm up BH solar 8000 l/day
3 GROUNDWATER MODELLING SOFTWARE
The modelling software chosen for the numerical finite-element modelling work was the 3D groundwater
flow model FEFLOW (Finite Element subsurface FLOW system) (DHI - WASY, 2012).
FEFLOW is widely accepted by environmental scientists and associated professionals. It uses the finite-
element approximation to solve the groundwater flow equation. This means that the model area or
domain is represented by a number of nodes and elements. Hydraulic properties are assigned to these
nodes and elements and an equation is developed for each node, based on the surrounding nodes. A
series of iterations are then run to solve the resulting matrix problem, and the model is said to have
“converged” when errors reduce to within an acceptable range.
It is able to simulate steady and non-steady flow, in aquifers of irregular dimensions, as well as confined
and unconfined flow, or a combination of the two. Different model layers with varying thicknesses can be
implemented. The edges of the model domain, or boundaries, typically need to be carefully defined, and
fall into several standard categories
4 MODEL CONSTRUCTION
4.1 MODEL DOMAIN
All hydrogeological systems are ‘open’ and it is debatable whether the complete area of influence of the
hydrogeological system can be covered. As such, some form of compromise is inevitable in defining the
hydrogeological domain. In this case the model boundaries were chosen along the catchment border of
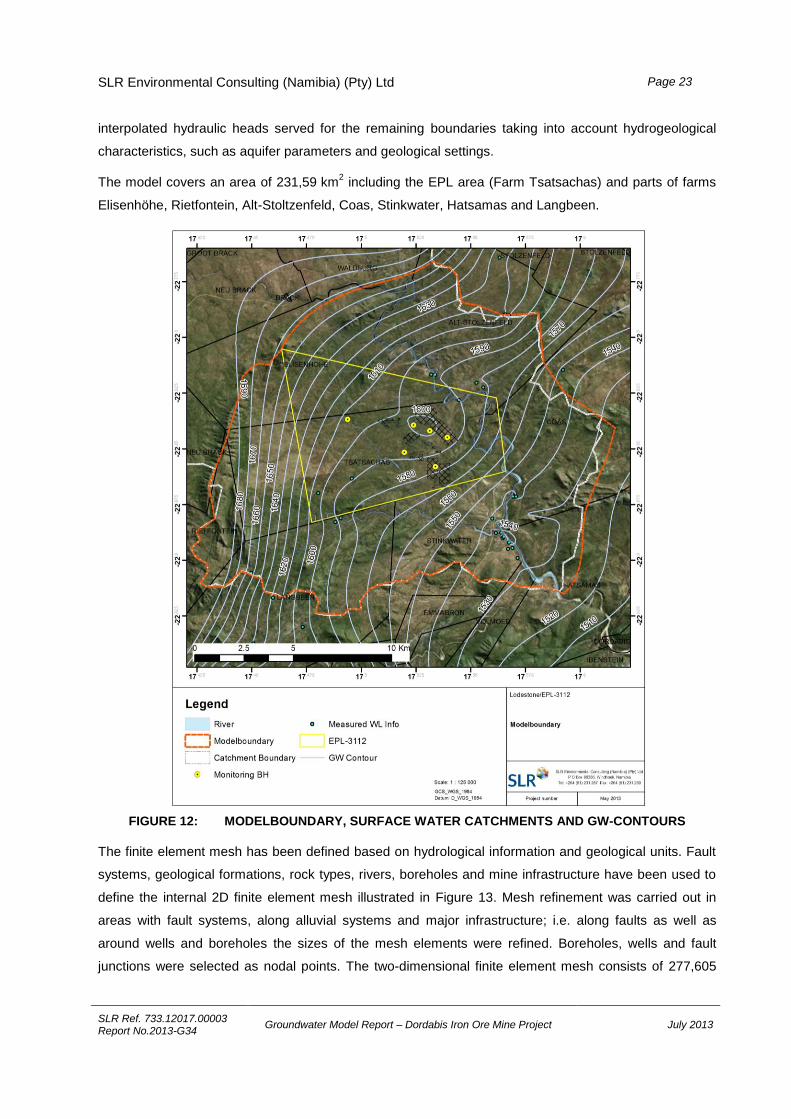
the Skaap River wherever possible. The model boundary delineated is illustrated in Figure 12. The north-
eastern, south-western and partly the north-western boundaries were set on surface water divides, while
SLR Environmental Consulting (Namibia) (Pty) Ltd
SLR Ref. 733.12017.00003 Report No.2013-G34
Groundwater Model Report – Dordabis Iron Ore Mine Project July 2013
Page 23
interpolated hydraulic heads served for the remaining boundaries taking into account hydrogeological
characteristics, such as aquifer parameters and geological settings.
The model covers an area of 231,59 km2 including the EPL area (Farm Tsatsachas) and parts of farms
Elisenhöhe, Rietfontein, Alt-Stoltzenfeld, Coas, Stinkwater, Hatsamas and Langbeen.
FIGURE 12: MODELBOUNDARY, SURFACE WATER CATCHMENTS AND GW-CONTOURS
The finite element mesh has been defined based on hydrological information and geological units. Fault
systems, geological formations, rock types, rivers, boreholes and mine infrastructure have been used to
define the internal 2D finite element mesh illustrated in Figure 13. Mesh refinement was carried out in
areas with fault systems, along alluvial systems and major infrastructure; i.e. along faults as well as
around wells and boreholes the sizes of the mesh elements were refined. Boreholes, wells and fault
junctions were selected as nodal points. The two-dimensional finite element mesh consists of 277,605

SLR Environmental Consulting (Namibia) (Pty) Ltd
SLR Ref. 733.12017.00003 Report No.2013-G34
Groundwater Model Report – Dordabis Iron Ore Mine Project July 2013
Page 24
mesh elements and 185,556 mesh nodes. Isosceles triangles are particularly suitable for numerical
accuracy - none of the mesh triangles violate the Delaunay criterion. Model details are summarised in
Table 7.
FIGURE 13: FINITE ELEMENT MESH
TABLE 7: MODEL DETAILS
No. Descriptors
1 Problem title : Lodestone GWM
2 Dimensions : 3
3 Flow type : Unsaturated / saturated
4 Number of layers : 3
5 Number of slices : 4
6 Time class : Steady flow / Transient transport
7 Element type : 6-noded triangular prism
8 Mesh elements : 277605
9 Mesh nodes : 185556
The 2D mesh was extended into 3D by introducing 3 layers. The layers are shown in Figure 14 and are
characterised as follows.
Layer 1 represents the alluvium of the Skaap River and its tributaries with interpolated thicknesses based
on a geostatistical analysis depending on river width and topsoil with a thickness of 0.1 m in all other
areas.

SLR Environmental Consulting (Namibia) (Pty) Ltd
SLR Ref. 733.12017.00003 Report No.2013-G34
Groundwater Model Report – Dordabis Iron Ore Mine Project July 2013
Page 25
Layer 2 corresponds to an assumed weathered zone in meta-sediments, marbles and plutonic rocks with
a thickness of 50 m.
Layer 3 represents fresh, unweathered meta-sediments, marbles and plutonic rock types extending to
300 m below surface.
FIGURE 14: MODEL DOMAIN – ELEVATIONS, HORIZONTAL AND VERTICAL DISCRETISATION
4.2 HYDRAULIC PARAMETERS
The subsurface was subdivided into hydrostratigraphic/hydrogeological units that have similar properties
from the point of view of storage and transmission of groundwater. The geological map and the Total
Magnetic Intensity (TMI) map served as a basis for the delineation of the hydrogeological units together
with information available in borehole logs. Since no prominent fault was identified during drilling

SLR Environmental Consulting (Namibia) (Pty) Ltd
SLR Ref. 733.12017.00003 Report No.2013-G34
Groundwater Model Report – Dordabis Iron Ore Mine Project July 2013
Page 26
activities and it is not clear if the structures indicated on the geological map exist and act as barriers or
conduits the model was build up based on the Equivalent Porous Medium approach (“EPM”). In the EPM
approach fractured material is treated as an equivalent continuous porous medium. However model
geometry and the finite element mesh facilitate the implementation of linear structures during updates of
the model once more information becomes available.
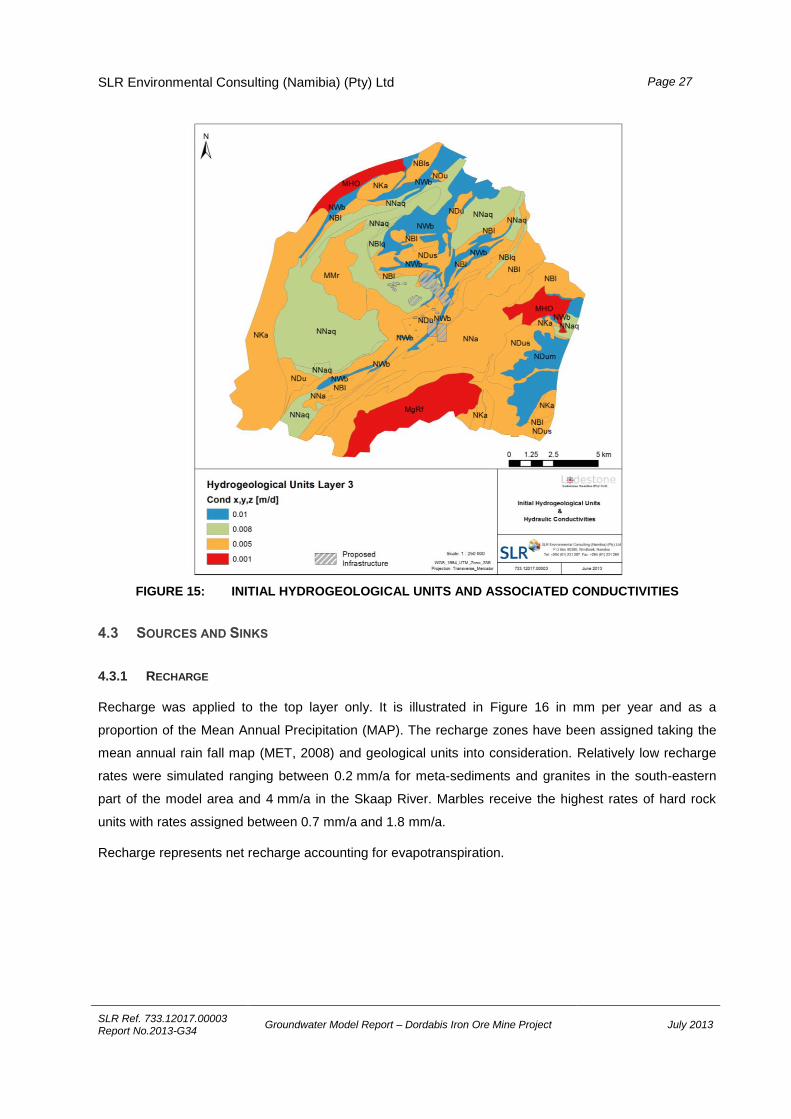
The hydrogeological units of Layer 2 and Layer 3 and the initial hydraulic conductivities assigned in
Layer 3 are illustrated in Figure 15. They were assigned based on pumping test results (Table 4, page
19) and literature values (Table 5, page 19). Due to the steep incline of the Formations equal
conductivities were assigned in all dimensions (kx, ky, kz) within a hydrogeological unit except in the
alluvial units where kz was set to 1/10 kx,y. The model layer summary including initial hydraulic
conductivity values are listed in Table 8.
TABLE 8: MODEL LAYER SUMMARY AND INITIAL HYDRAULIC CONDUCTIVITIES
Layer Main Type Rock type/Unit Kx,y,z [m/d] Aquifer Type Conditions
1 Alluvium Skaap River and
tributaries 0.4-1 Porous Unconfined
2
Weathered Zone
Marble 0.1 – 0.2
Double Porosity (Semi-) confined
Quartzite 0.01
Schist 0.005
Granite, Gneiss 0.001
Structures Conductors 0.2 Fractured
Barriers 0.0001 Aquitard
3
Fresh Zone
Marble 0.01
Double Porosity
Confined
Quartzite 0.008
Schist 0.005
Granite, Gneiss 0.001
Structures Conductors 0.2 Fractured
Barriers 0.0001 Aquitard
SLR Environmental Consulting (Namibia) (Pty) Ltd
SLR Ref. 733.12017.00003 Report No.2013-G34
Groundwater Model Report – Dordabis Iron Ore Mine Project July 2013
Page 27
FIGURE 15: INITIAL HYDROGEOLOGICAL UNITS AND ASSOCIATED CONDUCTIVITIES
4.3 SOURCES AND SINKS
4.3.1 RECHARGE
Recharge was applied to the top layer only. It is illustrated in Figure 16 in mm per year and as a
proportion of the Mean Annual Precipitation (MAP). The recharge zones have been assigned taking the
mean annual rain fall map (MET, 2008) and geological units into consideration. Relatively low recharge
rates were simulated ranging between 0.2 mm/a for meta-sediments and granites in the south-eastern
part of the model area and 4 mm/a in the Skaap River. Marbles receive the highest rates of hard rock
units with rates assigned between 0.7 mm/a and 1.8 mm/a.
Recharge represents net recharge accounting for evapotranspiration.

SLR Environmental Consulting (Namibia) (Pty) Ltd
SLR Ref. 733.12017.00003 Report No.2013-G34
Groundwater Model Report – Dordabis Iron Ore Mine Project July 2013
Page 28
FIGURE 16: RECHARGE RATES APPLIED TO LAYER 1
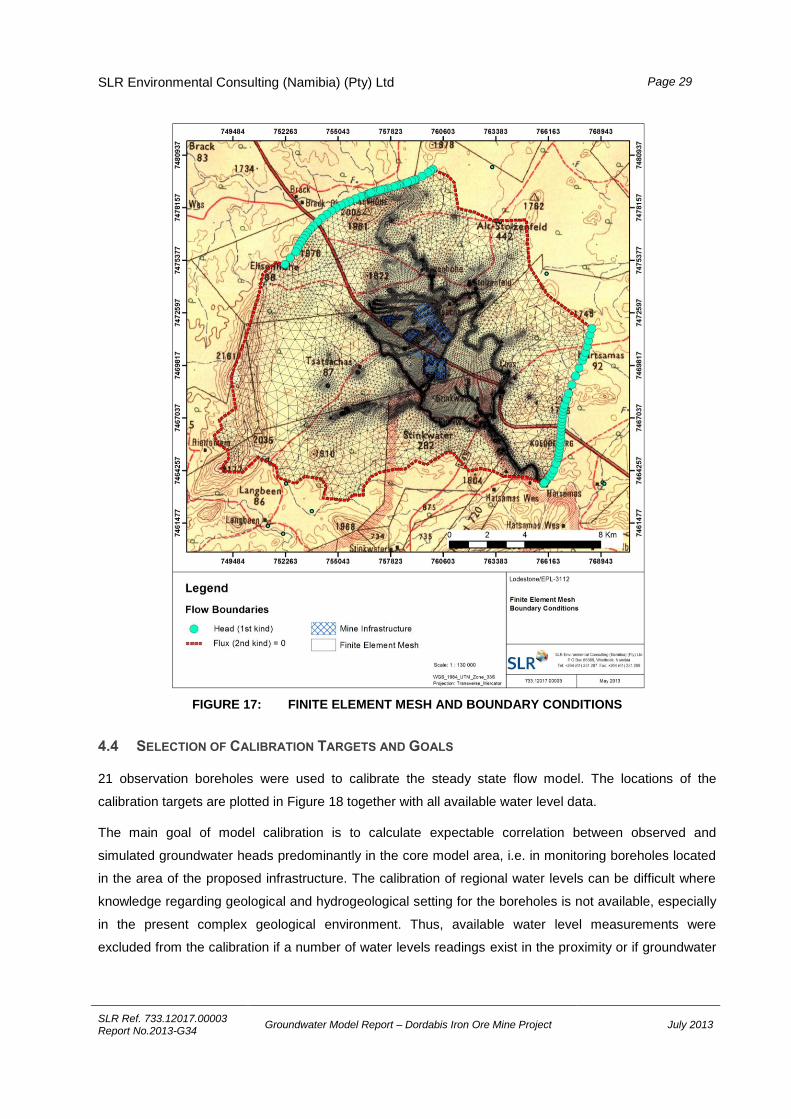
4.3.2 BOUNDARY CONDITIONS
The assigned boundary conditions are illustrated in Figure 17.
4.3.2.1 Head (1st
Kind)
Constant head boundary conditions have been assigned to nodes at the northern model boundary at the
contact to the Hohewarte Complex adjacent to the mountain ridge of the Kamtsas Formation (assigned
with a No-Flow Boundary) and to nodes at the south-eastern boundary. The heads have been
determined according to the groundwater contour map and nearby boreholes.
4.3.2.2 Flux (2nd
Kind)
The southern, south-western and northern eastern model boundaries, which are characterised by
subsurface water divides, were configured as no flow boundaries with a constant flux rate of zero.
SLR Environmental Consulting (Namibia) (Pty) Ltd
SLR Ref. 733.12017.00003 Report No.2013-G34
Groundwater Model Report – Dordabis Iron Ore Mine Project July 2013
Page 29
FIGURE 17: FINITE ELEMENT MESH AND BOUNDARY CONDITIONS
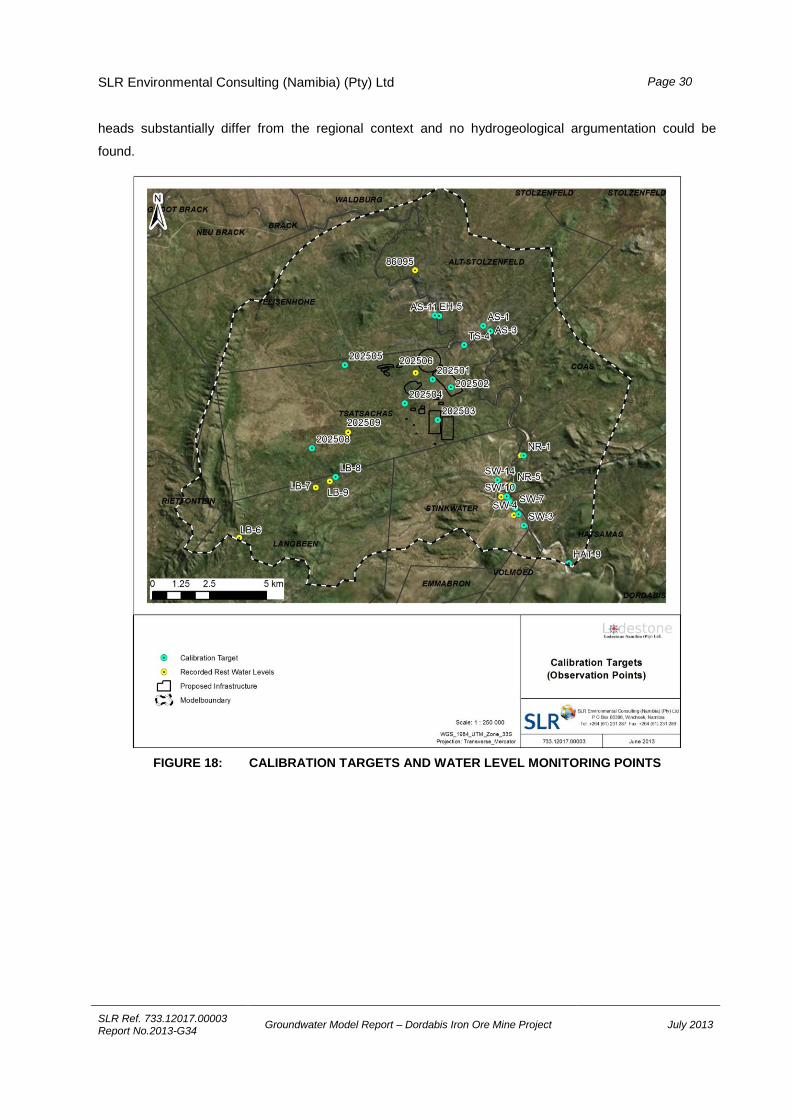
4.4 SELECTION OF CALIBRATION TARGETS AND GOALS
21 observation boreholes were used to calibrate the steady state flow model. The locations of the
calibration targets are plotted in Figure 18 together with all available water level data.
The main goal of model calibration is to calculate expectable correlation between observed and
simulated groundwater heads predominantly in the core model area, i.e. in monitoring boreholes located
in the area of the proposed infrastructure. The calibration of regional water levels can be difficult where
knowledge regarding geological and hydrogeological setting for the boreholes is not available, especially
in the present complex geological environment. Thus, available water level measurements were
excluded from the calibration if a number of water levels readings exist in the proximity or if groundwater
SLR Environmental Consulting (Namibia) (Pty) Ltd
SLR Ref. 733.12017.00003 Report No.2013-G34
Groundwater Model Report – Dordabis Iron Ore Mine Project July 2013
Page 30
heads substantially differ from the regional context and no hydrogeological argumentation could be
found.
FIGURE 18: CALIBRATION TARGETS AND WATER LEVEL MONITORING POINTS

SLR Environmental Consulting (Namibia) (Pty) Ltd
SLR Ref. 733.12017.00003 Report No.2013-G34
Groundwater Model Report – Dordabis Iron Ore Mine Project July 2013
Page 31
55 CCAALLIIBBRRAATTIIOONN
Model calibration was done by manual trial-and-error procedure by changing input parameters manually
in order to improve the correlation between model output parameters and field parameter values.
The steady-state flow solution depicts the initial conditions based on long-term hydraulic equilibrium in
place before mining started.
5.1 STATISTICAL CALIBRATION EVALUATION
Table 9 lists all calibration targets used and shows residuals and calibration statistics for the steady state
flow solution to underline the model performance and the reliability of the prediction scenarios. All
observed and computed heads, residuals and statistics are summarised in Table 10. Figure 19 displays
the scatterplot of residuals giving a graphical representation of the goodness of fit. The scatterplot shows
that there is no systematic error in the spatial differences between modelled and measured heads.
No expectable fit was achieved for boreholes LB-8, AS-11 and EH-5 and these have been excluded from
the statistics. The large residuals are due to lack of information, complex geology, unknown geometries
and hydraulic parameters.
LB-8 located on farm Langbeen is situated in the proximity of LB-7 and differ considerable from each
other with water levels of 27.75 m and 63.33 m, respectively due to inferred complex local
hydrogeological conditions. Apart from this inferred local feature a hydraulic barrier is assumed
separating the project area into a northern and southern part, hydraulically not connected, resulting in
regional groundwater head discrepancies.
Large residuals at boreholes AS-11 and EH-5 are assumed to be related to unknown river characteristics
(geometry, hydraulic conductivity) and the abstraction from boreholes in the proximity.
TABLE 9: STEADY STATE CALIBRATION STATISTICS
Description Unit Abbreviation Statistics
Residual mean [m] RM 2.24
Standard deviation [m] STD 5.71
Absolute residual mean [m] RMabs 4.70
Minimum residual [m] RMmin -5.62
Maximum residual [m] RMmax 12.92
Range in target values [m] Range 93.07
Standard deviation / target range STD / Range 0.06
Coefficient of determination CD 0.968

SLR Environmental Consulting (Namibia) (Pty) Ltd
SLR Ref. 733.12017.00003 Report No.2013-G34
Groundwater Model Report – Dordabis Iron Ore Mine Project July 2013
Page 32
The RM is calculated by dividing the sum of residuals by the number of residuals. Values close to zero
indicate good calibration. The RMabs is a measure of the average error in the model; in this case the
computed heads are on average 2.24 m off the observed water levels. The standard deviation divided by
the range of target values is a measure of error that indicates how all errors are related to the overall
gradient across the model. This value should be less than 10% (<0.1) for good calibration. The
groundwater model achieves 6%. The best measure of error to determine the calibration quality of
numerical models is generally considered to be the CD, which should be near 1 for good calibration
results. The steady-state model achieves 0.968. The statistics indicate reasonable calibration, especially
with regard to data availability and the complex environment in place. Observation boreholes (recently
drilled monitoring boreholes) located in the main area of interest show good calibration (except
WW202504 represents a major outlier, based on unclear hydraulic conditions due to the complex
prevailing hydrogeology).
FIGURE 19: SCATTERPLOT SHOWING OBSERVED VS. COMPUTED GROUNDWATER HEADS

SLR Environmental Consulting (Namibia) (Pty) Ltd
SLR Ref. 733.12017.00003 Report No.2013-G34
Groundwater Model Report – Dordabis Iron Ore Mine Project July 2013
Page 33
TABLE 10: CALIBRATION SUMMARY: RESIDUALS AND CALIBRATION STATISTICS
BH ID Observed head
[m AMSL] Simulated head
[m AMSL] Difference [m] Comment
HAT-9 1532.90 1527.277 -5.62
SW-3 1534.92 1540.6816 5.76
SW-4 1543.75 1542.7771 -0.97
SW-7 1545.90 1543.9591 -1.94
SW-16 1546.86 1545.8002 -1.06
SW-10 1549.70 1546.409 -3.29
NR-5 1548.37 1548.228 -0.14
SW-14 1548.02 1554.4641 6.44
LB-8* 1591.25 1612.2345 20.98 Unclear hydraulic conditions
NR-1 1548.74 1553.3313 4.59
202503 1590.40 1589.0807 -1.32
202504 1594.57 1606.6395 12.07 Unclear hydraulic conditions
202502 1601.25 1599.1914 -2.06
202501 1608.19 1605.6972 -2.49
202505 1621.32 1620.3459 -0.97
TS-4 1597.41 1600.4373 3.03
AS-3 1582.67 1595.2549 12.58
AS-1 1583.62 1596.5443 12.92
AS-11* 1596.03 1614.4401 18.41 Unclear water level
EH-5* 1594.93 1615.3026 20.37 Unclear water level
202508 1614.40 1617.2292 2.83
*Excluded from statistics
Number 18
Mean 2.24
Standard deviation 5.71
Sum of squares 645.51
Mean absolute error 4.70
Minimum -5.62
Maximum 12.92
Range in Target Values 93.07
Std. Dev./Range 0.06
Coefficient of determination R2 0.968
Relative error 6.14%
SLR Environmental Consulting (Namibia) (Pty) Ltd
SLR Ref. 733.12017.00003 Report No.2013-G34
Groundwater Model Report – Dordabis Iron Ore Mine Project July 2013
Page 34
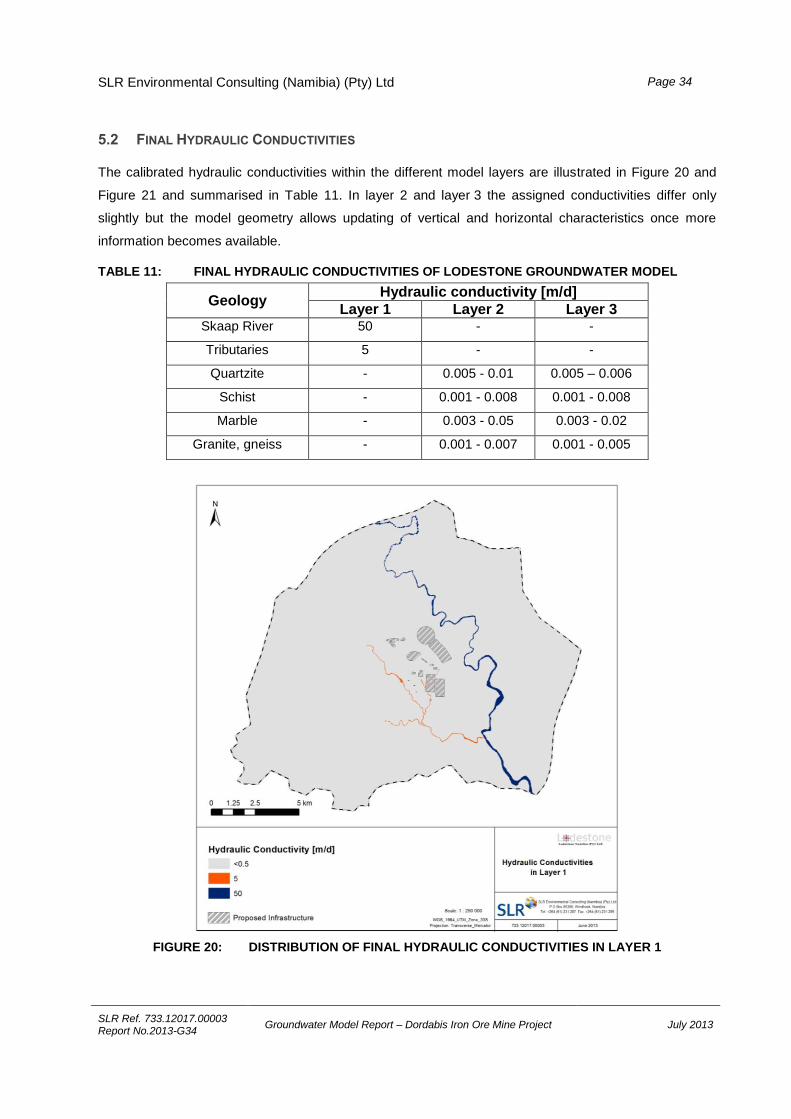
5.2 FINAL HYDRAULIC CONDUCTIVITIES
The calibrated hydraulic conductivities within the different model layers are illustrated in Figure 20 and
Figure 21 and summarised in Table 11. In layer 2 and layer 3 the assigned conductivities differ only
slightly but the model geometry allows updating of vertical and horizontal characteristics once more
information becomes available.
TABLE 11: FINAL HYDRAULIC CONDUCTIVITIES OF LODESTONE GROUNDWATER MODEL
Geology Hydraulic conductivity [m/d]
Layer 1 Layer 2 Layer 3 Skaap River 50 - -
Tributaries 5 - -
Quartzite - 0.005 - 0.01 0.005 – 0.006
Schist - 0.001 - 0.008 0.001 - 0.008
Marble - 0.003 - 0.05 0.003 - 0.02
Granite, gneiss - 0.001 - 0.007 0.001 - 0.005
FIGURE 20: DISTRIBUTION OF FINAL HYDRAULIC CONDUCTIVITIES IN LAYER 1

SLR Environmental Consulting (Namibia) (Pty) Ltd
SLR Ref. 733.12017.00003 Report No.2013-G34
Groundwater Model Report – Dordabis Iron Ore Mine Project July 2013
Page 35
FIGURE 21: DISTRIBUTION OF FINAL HYDRAULIC CONDUCTIVITIES IN LAYER 2 & 3
5.3 STEADY STATE FLOW CHARACTERISTICS
Computed groundwater head contours in model layer 3 (fresh bedrock aquifer) are illustrated in Figure
22, which correspond more or less to those in layer 2 (weathered bedrock). The simulated groundwater
flow pattern is similar to the one derived by analytical groundwater head interpolation (Figure 9,
page 14).
The main flow direction is from northwest to south east across the geological strike. The gradient is
rather flat in the area of the proposed developments and steep towards the south-eastern model
boundary, which can be attributed to the extents of hydrogeological units which are larger in the
upstream part of the model area compared to successive series of narrower, folded and faulted units in
the downstream part. The anticlinal structure located just southwest of the southern pit, striking NE-SW
and predominantly made up by the Nosib Group (Duruchaus Formation) acts as a prominent, local
barrier to groundwater flow.

SLR Environmental Consulting (Namibia) (Pty) Ltd
SLR Ref. 733.12017.00003 Report No.2013-G34
Groundwater Model Report – Dordabis Iron Ore Mine Project July 2013
Page 36
FIGURE 22: COMPUTED GROUNDWATER CONTOURS IN LAYER 3
5.4 WATER BALANCE
Water enters the system via recharge and at the northern model boundary (Constant Head Boundary).
Outflow takes places via the Constant Head Boundary. The fluid mass balance (water budget) of the
calibrated steady state groundwater model is as follows (Table 12):
286.20 m3/d groundwater recharge, i.e. 104,463 m3/a.
A volume of 29.09 m3/d is entering the system via the constant head boundary assigned at the
northern model boundary.

SLR Environmental Consulting (Namibia) (Pty) Ltd
SLR Ref. 733.12017.00003 Report No.2013-G34
Groundwater Model Report – Dordabis Iron Ore Mine Project July 2013
Page 37
A volume of 315.28 m3/d is leaving the system via the constant head boundary assigned at the
south-western model boundary.
TABLE 12: WATER BALANCE SUMMARY
66 PPRREEDDIICCTTIIVVEE SSIIMMUULLAATTIIOONNSS
Mine dewatering and (post operational) transient conservative contaminant transport scenarios were
simulated, with the calibrated steady state groundwater flow model serving as the basis. Relevant
assumption and limitations are detailed in the specific sections.
6.1 MINE DEWATERING SIMULATIONS
6.1.1 ASSUMPTIONS AND LIMITATIONS
In Figure 23 the proposed infrastructure of the Dordabis Iron Ore Mine and the approximate depth of the
southern pit are illustrated. It is assumed that mining activities would focus on the southern ore body with
the northern pits not intersecting the water table. Depths of the southern pit shown in Figure 23 are
earmarked as the end of mine-life (13 year pit shell) and based on the data provided by VBKOM
Consulting Engineers. The depth below surface in the southern ore body would increase as follows
(email communication with VBKOM, 12/07/2013):
• 5 years: 81 m
• 10 years: 153 m
• End of mine life: 193 m
Due to the complex geology prevailing and the lack of information on prominent water bearing structure
striking the ore body, mine dewatering was not simulated by abstraction from dewatering wells. Instead
inflow to the pit was calculated using hydraulic head boundary conditions assigned at the pit bottom,
acting as drains, removing water from the system without allowing flow back in to the system. In addition
no transient mine dewatering was simulated, i.e. constant and not time varying hydraulic head boundary
conditions in order to emulate the development of the pit over time were set. The dewatering results
show the system in equilibrium (including the modified parameters).
Flow In [m3/d] Flow Out [m
3/d]
Sources/Sinks
Recharge 286.20 0
Constant Head 29.09 -315.28
Total
Summary In-Out [m3/d] % difference
0.01 0.003

SLR Environmental Consulting (Namibia) (Pty) Ltd
SLR Ref. 733.12017.00003 Report No.2013-G34
Groundwater Model Report – Dordabis Iron Ore Mine Project July 2013
Page 38
FIGURE 23: PROPOSED DEVELOPMENTS AND DEPTH OF SOUTHERN PIT AT THE END OF LIFE OF MINE
6.1.2 SCENARIO 1: 5 YEARS OPERATIONAL PHASE
In scenario 1 the influence of lowering the water table below the pit bottom at 5 years of mining was
simulated. The top slice was updated with elevation information on pit depths after 5 years with
maximum pit depth of approx. 80 m. Hydraulic head boundary conditions were assigned to nodes located
in the pit area, acting as drains, removing water from the system without allowing flow back into the
system.
In Figure 24 derived groundwater head contours and the radius of influence (RoI) of dewatering over 5
years, i.e. water level drawdown compared to the steady state result are shown. The RoI is illustrated in
the area where a good fit between computed and observed heads was achieved in the steady state
calibration only. No predictions outside the 10 m radius are depicted or discussed due to uncertainty
based on complex geology and lack of information on hydraulic parameters and connections outside the
mining area. The maximum drawdown within the mine pit is calculated as approx. 35 m below the initial
water level.

SLR Environmental Consulting (Namibia) (Pty) Ltd
SLR Ref. 733.12017.00003 Report No.2013-G34
Groundwater Model Report – Dordabis Iron Ore Mine Project July 2013
Page 39
The 10 m drawdown radius extends approx. 3 km in an upstream direction towards the northwest, about
2.5 km to 3 km to the northeast and southwest and only 1.5 km in a downstream direction to the
southeast. The influence of the hydrogeological units is given, striking NE-SW and stretching further in
areas upstream of the proposed developments. In addition the impact of the anticlinal structure
(groundwater barrier, Nosib Group, Duruchaus Formation) is visible by the deformed shape of the 10 m -
RoI contour. The proposed location of the plant, half of the WRD and only a small part of the western
Slimes Dam are located within the cone of depression.
FIGURE 24: SCENARIO 1: GROUNDWATER HEAD CONTOURS AND RADIUS OF INFLUENCE

SLR Environmental Consulting (Namibia) (Pty) Ltd
SLR Ref. 733.12017.00003 Report No.2013-G34
Groundwater Model Report – Dordabis Iron Ore Mine Project July 2013
Page 40
The mine dewatering simulation indicated a volume of approx. 70 m3/d as inflow to the mine pit at 5
years of operation. The water balance of the entire model domain is listed in Table 13.
TABLE 13: SCENARIO 1: WATER BALANCE – 5 YEAR MINE DEWATERING
Flow In [m3/d] Flow Out [m
3/d]
Sources/Sinks
Recharge 286.20 0
Constant Head 51.63 268.13
Mine Dewatering 0 68.91
Total
Summary In-Out [m3/d] % difference
0.79 0.2
6.1.3 SCENARIO 2: END OF LIFE OF MINE (13 YEARS)
Figure 25 illustrates the results of scenario 2 simulating the impact of mine dewatering at a fully
excavated pit (year 13) with a maximum depth of approx. 190 m below surface. Groundwater head
contour lines and the radius of influence (RoI) are depicted.
Again, the entire RoI is not illustrated due to higher residuals outside the proposed mining area and
uncertainties due to lack of reliable geological information and the absence of water level data and
predictions should not be made. The 30 m drawdown radius is aprrox. 5 km when the final pit depth of
190 m is reached. The proposed infrastructure is located within the cone of depression characterised by
groundwater flow towards the pit, except the eastern Slimes Dam where groundwater still flows towards
the southeast. The influence of the continuous hydrogeological units striking NE-SW is visible by the
shape of the RoI as well as the impact of the anticlinal structure of the Nosib Group located southeast of
the southern pit.
The maximum drawdown was computed as 131 m below the initial rest water level. The mine dewatering
simulation indicates a volume of approx. 200 m3/d as inflow to the mine pit. The water balance of the
entire model domain is listed in Table 14.
TABLE 14: SCENARIO 2: WATER BALANCE – LOM MINE DEWATERING
Flow In [m3/d] Flow Out [m
3/d]
Sources/Sinks
Recharge 286.20 0
Constant Head 111.56 192.96
Mine Dewatering 0 206.62
Total
Summary In-Out [m3/d] % difference
-1.82 -0.46

SLR Environmental Consulting (Namibia) (Pty) Ltd
SLR Ref. 733.12017.00003 Report No.2013-G34
Groundwater Model Report – Dordabis Iron Ore Mine Project July 2013
Page 41
FIGURE 25: SCENARIO 2: GROUNDWATER HEAD CONTOURS AND RADIUS OF INFLUENCE
6.1.4 DISCUSSION
Although the RoI of both scenarios extend beyond the Tsatsachas farm border and in Scenario 2 even
across the Skaap River it is assumed that no influence will be observed to this extent, nor will water
levels in the Skaap River be seriously affected (see estimation in SECTION 6.1.4.1 below). Due to limited
information and the complex structure prevailing, hydrogeological units were represented as continuous
units based on the EPM approach. In addition assumptions and limitations exist for the Skaap River,
which is assumed to act as a distinct aquifer with only limited hydraulic connection to the bedrock aquifer,
with major groundwater exchange only in areas where faults are acting as water conduits, i.e. the model
assumes continuous bedrock units and that permeabilities measured in monitoring boreholes (which
intersected water) extend to the Skaap River.. The establishment of a comprehensive groundwater
monitoring network and routine monitoring is recommended observing the vertical and horizontal extend
SLR Environmental Consulting (Namibia) (Pty) Ltd
SLR Ref. 733.12017.00003 Report No.2013-G34
Groundwater Model Report – Dordabis Iron Ore Mine Project July 2013
Page 42
of the potential drawdown and impacts on other groundwater users. Subsequently the groundwater
model should be updated with the gathered information resulting in a better understanding of the
hydrogeological characteristics and processes.
6.1.4.1 Estimation of impact on Skaap River
Due to lack of information, the impact on the Skaap River alluvial aquifer could not be simulated
adequately. The dewatering simulation indicates that the potential cone of depression might extend close
to or even beyond the Skaap River during mining activities. The calculations below shall serve to
estimate average potential seepage rates (based on the EPM approach) out of the Skaap River towards
the mine pit due to lowering of the water table induced by mine dewatering.
Flow (Q) within the Skaap River alluvium can be estimated as approx. 175 m3/d based on an assumed
river width of 50 m, a saturated alluvial thickness of 5 m, a hydraulic conductivity of 50 m/d, a gradient of
0.01 and Darcy’s Law (EQUATION 1):
areagradienttyconductiviAikQ EQUATION 1
Seepage out of the Skaap River towards the pit would be in the order of 2.5m3/d, based on a 5 km
seepage front, a bedrock permeability of 0.001 m/day and a steep gradient of 0.1 (EQUATION 1).
This seepage loss towards the mine would have a very limited impact on the flow in the Skaap alluvial
aquifer (equal to 1.4% reduction in the flow within the Skaap River alluvial aquifer).
6.1.5 MINE DEWATERING DESIGN
Mine dewatering is expected to be effective from depths of 20 m to 30 m below surface. The inflow is
expected to be minor seepage via small fissures. Additional geophysical investigations are
recommended identifying potential major faults and fractures striking through the pit area for the
placement of dewatering boreholes if necessary.
If slope stability is not a problem, the water can be allowed to flow through the slope face into sumps
from where it can be reused in the mining circuit. If stability is a concern, then there are two options to
intersect the inflow of water. The first is vertical water boreholes and the second is horizontal or sub-
horizontal drain (core) holes or a combination. Conceptual mine dewatering designs are illustrated in
Figure 26.

SLR Environmental Consulting (Namibia) (Pty) Ltd
SLR Ref. 733.12017.00003 Report No.2013-G34
Groundwater Model Report – Dordabis Iron Ore Mine Project July 2013
Page 43
FIGURE 26: CONCEPTUAL MINE DEWATERING DESIGNS (AGES, 2013)
6.2 NON-REACTIVE TRANSPORT MODEL
6.2.1 ASSUMPTIONS AND LIMITATIONS
Main potential contamination sources are represented by the proposed Waste Rock Dump (WRD) with
an area of approximately 0.85 km2 and the proposed Slimes Dams with an area of approx. 1 Km
2 which
would be located to the east and the southeast of the main pit, respectively. The infrastructure is
illustrated and labelled in Figure 23 in detail.
A geochemical assessment report has been completed by SLR (2013d) in which potential of Acid Rock
Drainage (ARD) and the potential for poor mine drainage has been addressed. The results suggest no
potential for acid generation and that the concentrations of soluble components of the samples will be
predominantly within relevant water quality standards. However, given that the area has above-
background Fe and Mn concentrations in the geology, the presence of soluble Fe and Mn, possibly at
significant concentrations, in mine drainage cannot be excluded.
In the transient non-reactive transport modelling only advection, longitudinal and transversal dispersion
were considered. Adsorption, precipitation and retardation were not considered and the solute was
treated as a conservative tracer. Hence processes which could reduce transport of contaminants were
not modelled. In addition, since site specific porosities are not available, default values according to
empirical investigations and groundwater models in similar environments were assumed. No specific

SLR Environmental Consulting (Namibia) (Pty) Ltd
SLR Ref. 733.12017.00003 Report No.2013-G34
Groundwater Model Report – Dordabis Iron Ore Mine Project July 2013
Page 44
source concentration was modelled and the plumes are illustrated in percentages of the relative source
concentration applied in layer 1. A constant seepage concentration is assumed. This is a worst case
assumption as in reality seepage concentration will decline over time due to leaching.
In addition conservative porosity values of 0.1% - 1% were used in the bedrock units and 20% in the
alluvial units. The longitudinal dispersivity (DL) is assumed to range between 30 and 60 m. A DL of 60 m
was used in the simulations discussed below. For the longitudinal, transversal and vertical dispersivity
(DL, DT, DV) a reasonable ratio was specified with 100:10:1 (Kinzelbach et al., 1995).
Post operational simulations are dependent on the potential back filling of the open cast with tailings
residuals or waste rock or whether a pit lake will be formed. Since no major surface water contribution is
expected, groundwater would be the only source contributing to the formation of a possible lake. High
evaporation rates and the small inflow rates computed in Scenario 2 result in the assumption that the
mine pit will stay dry after closure.
Two post operational scenarios were calculated. Scenario 3 assumes a completely dry mine pit with
Scenario 2 serving as the basis.
Scenario 4 assumes a partly backfilled mine pit with Scenario 1 serving as the basis.
6.2.2 SCENARIO 3: POST OPERATIONAL NON-REACTIVE TRANSPORT ASSUMING A DRY MINE PIT
As aforementioned the development of a pit lake after mine closure was not investigated. The small
inflow rate simulated within Scenario 2 hints at a dry mine pit after closure, due to high potential
evaporation rates which would by far exceed the inflow of 200 m3/d. Therefore, Scenario 2 served as the
basis for the transient, non-reactive transport simulation in Scenario 3 assuming a dry pit after mine
closure which is assumed to be the most likely situation.
The spreading of the potential plume within the weathered zone (layer 2) and the fresh bedrock layer
(layer 3) is illustrated in Figure 27 and Figure 28, respectively by illustrating percentages of the source
concentration at four different times, namely 15, 50, 100 and 500 years.
Layer 2:
Concentrations are high at all depicted times, because of the locations of the dams since layer 2 starts
0.1 m below surface and a continuous seepage concentration was assigned.
After 15 years, the plume is predicted to spread mainly towards the mine pit. Concentrations decrease
rapidly. At a maximum distance of 400 m from the WRD 1% of the initial concentration can be found. Due
to the cone of depression potential leachate is captured.
At approx. 50 years after mine closure the narrow plumes originating from the WRD and the plant area
are predicted to reach the mine pit, nevertheless highly diluted with low percentages of the initial
concentration. The plume originating from the ROM ramp is predicted to have concentrations between
SLR Environmental Consulting (Namibia) (Pty) Ltd
SLR Ref. 733.12017.00003 Report No.2013-G34
Groundwater Model Report – Dordabis Iron Ore Mine Project July 2013
Page 45
5% and 10% of the source concentration at the edge of the mine pit. No major spreading originating from
the eastern Slimes Dam (“SD”) prevails. 100 m east of the SD the concentration decreased to 1% to 5%.
After 100 years the plume originating from the WRD is predicted to have a larger horizontal extent
compared to 50 years and is characterised by higher concentrations. 10% - 20% of the source
concentration applied to the WRD can be found at the mine pit, increasing to 50% approx. 500 m west of
the facility. Still no major spreading from the eastern SD (not located within the cone of depression) is
visible and potential leachates from the SDs seem to be captured.
At 500 years water quality within layer 2 outside the EPL area is still not affected by potential leachates
from the mining facilities. The plume originating from the eastern SD is predicted to reach the southern
EPL border with maximum 2% of the initial concentration applied. Potential leachate from all other
potential sources is captured in the pit due to the sink caused by evaporation.
Layer 3:
In general the plumes in layer 3 are characterised by lower concentrations but higher flow velocities due
to smaller porosity values assigned.
At 15 years only small concentrations and patterns are predicted due to infiltration in different
hydrogeological units and recharge rates applied. Highest concentration can be found in the western SD,
due to hydraulic properties of the underlying marble and higher recharge rates applied to the marble and
the creeks.
After 50 years max 30%-40% of the source concentration can be found in layer 3 underneath the WRD.
The infiltrated leachate is captured by the open pit.
After 100 years potential leachate migrated through the weathered zone underlying the eastern SD with
only low contaminant concentrations predicted to be found in the southeast spreading plume.
The transport scenario predicted for 500 years after mine closure elucidates that potential leachates
from the plant area, the WRD and the western SD would end up in the mine pit and only small
percentages of the source concentration seeping from the eastern SD might be observed at the southern
EPL boundary.

SLR Environmental Consulting (Namibia) (Pty) Ltd
SLR Ref. 733.12017.00003 Report No.2013-G34
Groundwater Model Report – Dordabis Iron Ore Mine Project July 2013
Page 46
FIGURE 27: SCENARIO 3 (DRY MINE PIT): SPREADING OF POTENTIAL PLUME IN LAYER 2
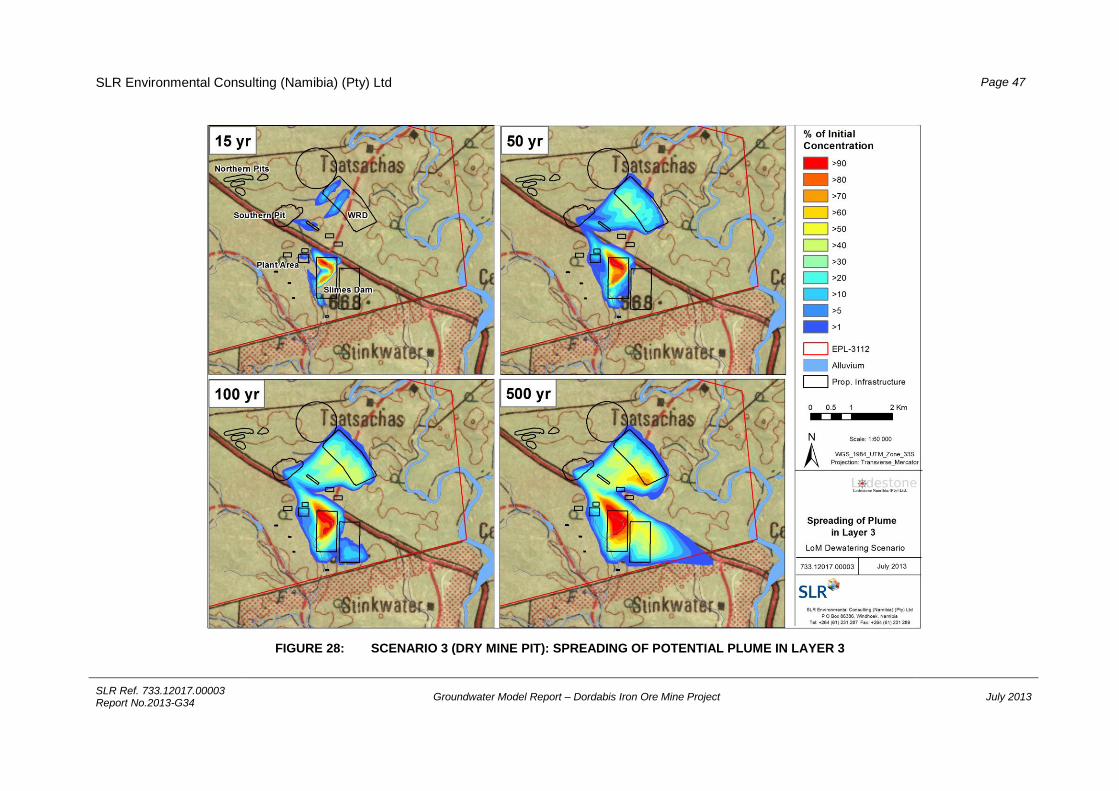
SLR Environmental Consulting (Namibia) (Pty) Ltd
SLR Ref. 733.12017.00003 Report No.2013-G34
Groundwater Model Report – Dordabis Iron Ore Mine Project July 2013
Page 47
FIGURE 28: SCENARIO 3 (DRY MINE PIT): SPREADING OF POTENTIAL PLUME IN LAYER 3
SLR Environmental Consulting (Namibia) (Pty) Ltd
SLR Ref. 733.12017.00003 Report No.2013-G?34
Groundwater Model Report – Dordabis Iron Ore Mine Project July 2013
Page 48
6.2.3 SCENARIO 4: POST OPERATIONAL NON-REACTIVE TRANSPORT (PARTIALLY BACKFILLED MINE PIT)
In Scenario 4 the migration of potential leachate was simulated by assuming the backfilling of tailings
residuals and waste rock into the open cast pit after mine closure. It is expected that there won’t be
sufficient material to recover the initial ground surface (especially with the ore body cropping out and
displaying a prominent topographic feature). Therefore Scenario 1, with a maximum pit depth of approx.
80 m below the initial ground surface and assuming a maximum residual drawdown below the initial rest
water level of approx. 30 m was assumed to be suitable to serve as the backfill scenario simulation
basis. The spreading of the potential plume within the weathered zone (layer 2) and the fresh bedrock
layer (layer 3) is illustrated in Figure 29 and Figure 30, respectively by illustrating percentages of the
source concentration at different times. Compared to Scenario 3 the cone of depression is less wide-
reaching and the gradient towards the mine pit not as steep. This involves slower flow and transport
velocities towards the mine pit and less influence on potential plumes originating from the different
potential contamination sources. As aforementioned in Scenario 1 the northern part of the WRD, the
plant area and parts of the western SD are located in the cone of depression.
Layer 2:
In the weathered bedrock horizon the potential plume only migrates slowly towards the mine pit.
After 100 years only the plume originating from the proposed ROM ramp is predicted to reach the mine
pit. In addition the migration from the WRD and the SD towards the south and southeast is minor and no
potential altering of water quality due to mining activities outside the EPL is predicted at this stage. At
approx. 300 m distance from the proposed Dams potential leachate decreased below 5% of its initial
concentration.
At 500 years the potential plume is predicted to spread beyond the EPL border and underneath the
Skaap River. Nevertheless percentages of the initial source concentration decrease rapidly outside the
EPL border and are predicted to be low where potential connection to the alluvium might exist.
Layer 3:
After 50 years potential leachate is predicted to have migrated through the weathered horizon
underneath the entire areas of the storage facilities. A maximum of 10% of the initial concentration might
be observed 200 m southeast of the WRD and east of the eastern SD.
After 100 years the plume originating at the ROM ramp is predicted within the mine pit, while the fronts of
plumes spreading from the WRD and the SD migrated approx. 700 m to the southeast and east
respectively.
At 500 years the potential plume is predicted to spread beyond the EPL border and underneath the
Skaap River characterised by low percentages of the source concentration. Due to the depth below
surface interaction with surface water features is excluded.
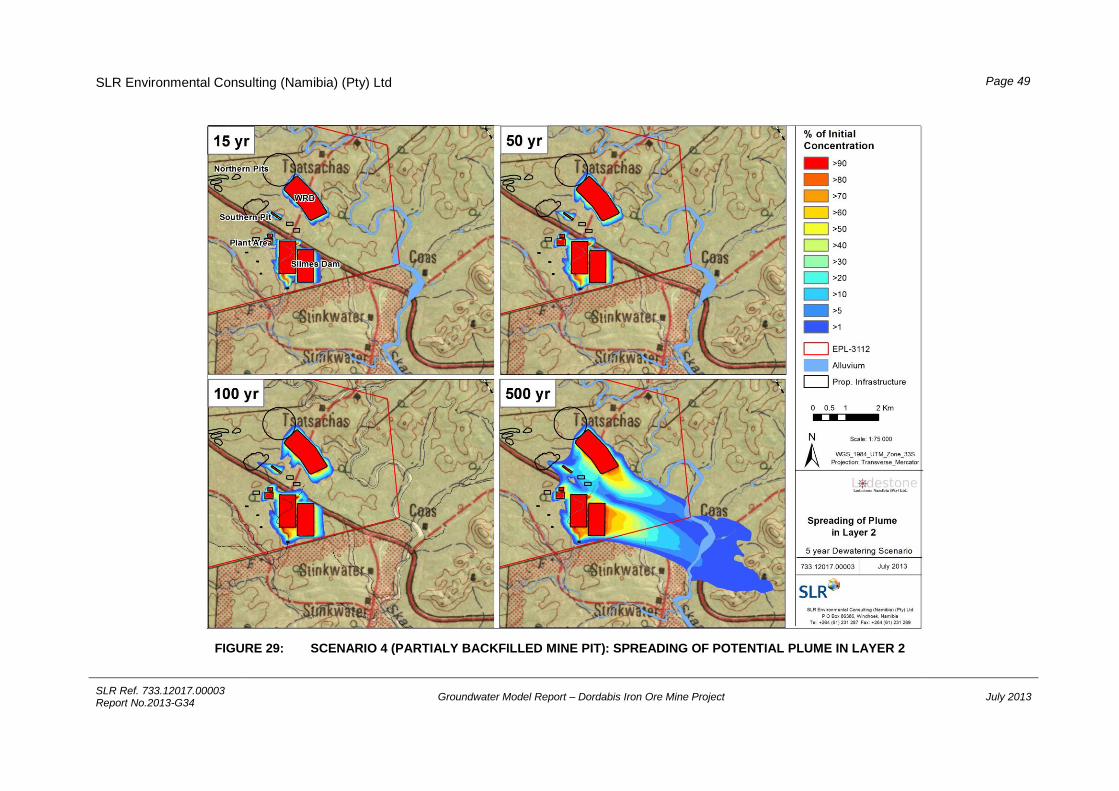
SLR Environmental Consulting (Namibia) (Pty) Ltd
SLR Ref. 733.12017.00003 Report No.2013-G34
Groundwater Model Report – Dordabis Iron Ore Mine Project July 2013
Page 49
FIGURE 29: SCENARIO 4 (PARTIALY BACKFILLED MINE PIT): SPREADING OF POTENTIAL PLUME IN LAYER 2

SLR Environmental Consulting (Namibia) (Pty) Ltd
SLR Ref. 733.12017.00003 Report No.2013-G34
Groundwater Model Report – Dordabis Iron Ore Mine Project July 2013
Page 50
FIGURE 30: SCENARIO 4 (PARTIALY BACKFILLED MINE PIT): SPREADING OF POTENTIAL PLUME IN LAYER 3

SLR Environmental Consulting (Namibia) (Pty) Ltd
SLR Ref. 733.12017.00003 Report No.2013-G34
Groundwater Model Report – Dordabis Iron Ore Mine Project July 2013
Page 51
6.2.4 DISCUSSION
The transient non-reactive transport simulations indicate potential leachates from the storage facilities will
be partially captured by the open cast pit. In addition flow velocities and travel times are predicted to be
low. Based on the geochemical investigation carried out (SLR, 2013d) potential solutes leaving the WRD
and SDs are expected to be within relevant groundwater quality guidelines and therefore no major impact
on groundwater quality is expected.
A dry mine pit would be favourable in terms of capturing potential leachates since most facilities of the
proposed infrastructure would be located within the induced cone of depression. Nevertheless, a less
extensive cone of depression due to backfilling is considered not to have a major impact on groundwater
quality, due to slow transport velocities, dilution, source concentrations most probably within relevant
water quality guidelines and neglecting processes which could reduce transport of contaminants in the
non-reactive transport modelling.
77 CCOONNCCLLUUSSIIOONN
A numerical steady state groundwater flow model was developed using the peer reviewed and
internationally recognized FeFlow software code. The calibration results of the model allowed the
simulation of dewatering and abstraction scenarios.
The radius of influence of mine dewatering is approximately 2.5 km after 5 years mining when a pit depth
of 80 m is reached and approximately 5 km, when the final pit depth of 190 m is reached after 13 years
mining. The outflow from the Skaap River alluvium towards the mine pit is considered to be negligible and
wells tapping the river alluvium and vegetation is not expected to be affected by the mine dewatering.
Boreholes intersecting the fissured basement aquifer on farms Tsatsachas, Stolzenfeld and Elisenhöhe,
which are located within the simulated radius of influence, might be affected by dropping water levels.
The probability that this will happen is, however, low. The inflow of groundwater into the mine pit is
estimated at 200 m3/day, when reaching the end depth of 190 m. The high potential evaporation will
result in a dry pit, which functions as a permanent sink also after mine closure.
The mass transport simulation of seepage water from potential pollution sources shows that seepage
water, after reaching the water level, will report to the mine pit, where it is evaporating. Modelled
backfilling of tailings- and/or waste rock into the mine pit will allow the groundwater level to recover to
about 30 m below the original level. The radius of influence of the dewatering will be reduced but at the
same time the potential to collect seepage water from the Slimes Dams and Waster Rock Dump will be
reduced.
SLR Environmental Consulting (Namibia) (Pty) Ltd
SLR Ref. 733.12017.00003 Report No.2013-G34
Groundwater Model Report – Dordabis Iron Ore Mine Project July 2013
Page 52
7.1 CONFIDENCE IN MODEL PREDICTIONS
Despite all efforts to account for data uncertainties, the values presented are intrinsically of low to
medium confidence and should be verified once more water level measurements, hydraulic conductivities
of different geological units and groundwater monitoring data become available. The goodness of fit
within the area of interest (mining area) can be described as adequate and predictions made for the focus
area are assumed to be authentic. Nevertheless local hydrogeological features within this area exist but
have not been identified and hydrogeological units were simulated as continuous porous media.
Therefore local hydraulic connections and features (e.g. at WW202504) were not depicted and resulted in
higher residuals.
In addition lack of information on the alluvial aquifer rendered a detailed representation and investigation
of the hydraulic connection impossible. Local groundwater flow patterns and predicted plume migration
rates for later years of mine development can be improved significantly by observation data and
subsequent updates of the groundwater model.
Despite the assumption and limitations given the results of the predictive simulations are assumed to be
worst case.
88 RREECCOOMMMMEENNDDAATTIIOONNSS
Based on the outcomes of the current groundwater modelling study, the following recommendations are
given:
Initiation of a ground- and surface water monitoring system with monthly monitoring of
groundwater levels and quarterly groundwater sampling intervals including full chemical analyses
(all major constituents and trace elements of concern).
A standard operating procedure for water level monitoring and water sampling should be
developed according to best practice (e.g. filters and acidify on site for metal analyses, purge
boreholes prior to sampling).
Drilling of additional monitoring boreholes strategically placed around final infrastructure and in
the Skaap River.
Initiation of additional hydraulic testing of the aquifers (especially in the alluvial aquifer) to assess
aquifer parameter and enable more accurate model calibration with subsequent reduction in
model uncertainty.
Annual updates of the groundwater model as groundwater level and quality data become
available.
SLR Environmental Consulting (Namibia) (Pty) Ltd
SLR Ref. 733.12017.00003 Report No.2013-G34
Groundwater Model Report – Dordabis Iron Ore Mine Project July 2013
Page 53
Kind regards
Florian Winker
(Groundwater Modeller)
Braam Van Wyk
(Project Manager)
Arnold Bittner
(Project Reviewer)
31 July 2013
SLR Environmental Consulting (Namibia) (Pty) Ltd
SLR Ref. 733.12017.00003 Report No.2013-G34
Groundwater Model Report – Dordabis Iron Ore Mine Project July 2013
Page 54
9 REFERENCES
Aquaterra (2005): Rössing Groundwater Model Updated Calibration. Aquaterra Consulting, Australia
Aquaterra (2010): Husab Project Hydrogeology. Prepaired for Swakop Uranium
Bardenhagen (2007): Platveld Aquifer Study. Conceptual Groundwater Modelling Report. Department of
Water Affairs. S&P.
CSIR (1997). An Assessment of the Potential Environmental Impacts of the Proposed Aquifer Recharge
Scheme on the Khan River, Namibia. Final Report. CSIR Division of Water, Environment & Forest
Technology to Rössing Uranium Limited.
BIWAC 2010: Numerical Groundwater Model Etango Project - Conceptual Model for Bannerman
Resources Limited.
DWAF (2001): Groundwater in Namibia . An Explanation to the Hydrogeological Map.
SLR (2012a): Numerical Groundwater Flow Model, Otjikoto Gold Mine – Conceptual Model. Report No.
2012-G1-V2
SLR (2012b): Trekkopje Mine, groundwater model report, regional steady-state groundwater model.
Report No.: 2012-G5-V1.
SLR (2012b): Trekkopje Mine, Non-reactive transport model. Report No.: 2012-G7-V1
SLR (2013a): Desk Study and Hydrocensus for EPL 3112. Report No.: 2013-G13.
SLR (2013b): Drilling and Test Pumping of Monitoring Boreholes at EPL 3112. Report No.: 2013-G10.
SLR (2013c): Hydrology Assessment for the proposed Dordabis Iron Ore Mine. Report No. 2013-S6
SLR (2013d): Preliminary geochemical Assessment report for EPL3112. Report No. 2013-G35
Heyns, P. (1992). Namibia’s water resource: A new approach needed. Namibia Review, 1: 17–29.
Külls, C. (2000). Groundwater of the North-Western Kalahari, Namibia – Estimation of Recharge and
Quantification of the Flow Systems. Dissertation, Julius-Maximilian University of Würzburg.
Kinzelbach et al. (1995): Grundwassermodellierung; Eine Einfuehrung mit Uebungen; Gebrueder
Borntraeger, Berlin, Stuttgart, 238 pp
Beak (2011): Numerical Groundwater Flow Model of the Proposed Omitiomire Copper Mine / Namibia
Mining Phase 1, Groundwater Specialist Input Report
MET (2002): Atlas of Namibia. Directorate of Environmental Affairs, Ministry of Environment and Tourism

SLR Environmental Consulting (Namibia) (Pty) Ltd
SLR Ref. 733.12017.00003 Report No.2013-G34
Groundwater Model Report – Dordabis Iron Ore Mine Project July 2013
Page 55
Mainardy, H. (1999): Grundwasserneubildung in der Übergangszone zwischen Festgesteinsrücken und
Kalahari-Lockersediment¨uberdeckung (Namibia). HU-Forschungsergebnisse aus dem Bereich
Hydrogeologie und Umwelt, 17: 1–145.
Klock, H. (2001): Hydrogeology of the Kalahari in north-easter Namibia with special emphasis on
groundwater recharge, flow modelling and hydrochemistry. Dissertation, Julius-Maximilians-University
of Würzburg.
AGES (2013): Otjikoto Gold Mine: Geohydrological and Geochemical Specialist Investigation. Technical
Report No. G12/162_14-06-2013.
(DHI - WASY, 2013): FEFLOW 6.1. Finite Element Simulation System for Subsurface Flow and Transport
Processes. DHI-WASY GmbH.
Wrabel, J. (1999). Ermittlung der Grundwasserneubildung im semiariden Bereich Namibias mittels der
Chlorid-Bilanz-Methode. HU-Forschungsergebnisse aus dem Bereich Hydrogeologie und Umwelt, 16:
1– 155.

SLR Environmental Consulting (Namibia) (Pty) Ltd
SLR Ref. 733.12017.00003 Report No.2013-G34
Groundwater Model Report – Dordabis Iron Ore Mine Project July 2013
Page 56
RECORD OF REPORT DISTRIBUTION
SLR Reference: 733.12017.00003
Title: Groundwater Model Report – Dordabis Iron Ore Mine Project
Report Number: 2013-G34
Proponent: Lodestone Namibia (Pty) Ltd.
Name Entity Copy No. Date issued Issuer
COPYRIGHT
Copyright for these technical reports vests with SLR Consulting unless otherwise agreed to in
writing. The reports may not be copied or transmitted in any form whatsoever to any person
without the written permission of the Copyright Holder. This does not preclude the authorities’
use of the report for consultation purposes or the applicant’s use of the report for project-
related purposes.