Ground-Water Potentialities in the Crescent Valley Eureka and … · 2012-10-29 · Ground-Water...
56
Ground-Water Potentialities in the Crescent Valley Eureka and Lander Countief Nevada By C. P. ZONES GEOLOGICAL SURVEY \VATER-SUPPLY PAPER 1581 Prepared in cooperation with the State of Nevada, Office of the State Engineer UNITED STATES GOVERNMENT PRINTING OFFICE, WASHINGTON : 1961
Transcript of Ground-Water Potentialities in the Crescent Valley Eureka and … · 2012-10-29 · Ground-Water...

Ground-Water Potentialities
in the Crescent Valley Eureka and Lander Countief
Nevada By C. P. ZONES
GEOLOGICAL SURVEY \VATER-SUPPLY PAPER 1581
Prepared in cooperation with the State of Nevada, Office of the State Engineer
UNITED STATES GOVERNMENT PRINTING OFFICE, WASHINGTON : 1961

UNITED STATES DEPARTMENT OF THE INTERIOR
STEWART L. UDALL, Secretary
GEOLOGICAL SURVEY
Thomas B. Nolan, Director
The U.S. Geological Survey Library has cataloged this publication as follows:
Zones, Christie Paul, 1926-Ground-water potentialities in the Crescent Valley, Eu
reka and Lander Counties, Nevada. Washington~ U.S. iv, 522 p. maps, diagrs., tables. 25 em. (U.S. Geological Survey.
Water-supply paper 1581) Prepared in cooperation with the State of Nevada, Office of the
State Engineer. Bibliography : p. 48.
1. Water, Underground-Nevada-Crescent Valley. 2. Water-supplyNevada-Crescent Valley. 3. Borings-Nevada-Crescent Valley. 4. Water-Analysis. I. Nevada. State Engineer. II. Title: Crescent Valley, Eureka and Lander Counties, Nevada. (Series)
For sale by the Superintendent of Documents, U.S. Government Printin~ Office WashlnJlton 25, D.C.

CONTENTS
Page
Abstract--------------------------------------------------------- 1 Introduction------------------------------------------------------ 2
Purpose and scope of the investigation___________________________ 2 CleographY--------------------------------------------------- 3 Numbering system for wells and springs__________________________ 5
Climate---------------------------------------------------------- 6 Landforms and drainage _________ ---------------- ___________ -----___ 8
~ountains-------------~------------------~------------------- 8 Piedmont slopes _______ -----___________________________________ 9
Valleyfloor--------------------------------------------------- 10 Streams------------------------------------------------------ 11
Cleologic formations and their water-bearing characteristics_____________ 12 Previous geologic investigations __ ------------------------------- 12 Types of rocks _______________________________________ -------__ 12 Rocks of the mountain ranges___________________________________ 12 Rocks of the pediment ____ ------------------ __________ --------- 13 Unconsolidated sediments of the valley fill________________________ 14
C1roundwater----------------------------------------------------- 18 Occurrence--------------------------------------------------- 18 Recharge----------------------------------------------------- 18
Precipitation at the higher elevations _____ --------- __ -------- 19 Precipitation on the valley floor_____________________________ 20 Infiltration of excess irrigation water_________________________ 20 Surface flow from the Carico Lake Valley_____________________ 20 Seepage from bedrock_____________________ _ _ _ _ _ _ _ _ _ _ _ _ _ _ _ _ _ 20
Discharge---------------------------------------------------- 20 Evapotranspiration________________________________________ 21 Springs and seeps__________________________________________ 22
UnderfloW------------------------------------------------ 22 Pumpage------------------------------------------------- 23
InventorY---------------------------------------------------- 23 Fluctuations of water levels_____________________________________ 24
Chemical quality of the ground water________________________________ 26 Water for irrigation _______________________________________ ----_ 26
Salinityhazard-------------------------------------------- 26 Sodiumhazard-------------------------------------------- 26 Bicarbonateion------------------------------------------- 30 Boron---------------------------------------------------- 30
Water for domestic use----------------------------------------- 30 Classification and interpretation of analyses_______________________ 31
Water for irrigation________________________________________ 31 Water for domestic use_____________________________________ 31
Local variations in the chemical quality of ground water___________ 32 m

IV CONTENTS
Page Development of ground water_______________________________________ 33
Present development___________________________________________ 33 Potential development_ _ _ _ _ _ _ _ _ _ _ _ _ _ _ _ _ _ _ _ _ _ _ _ _ _ _ _ _ _ _ _ _ _ _ _ _ _ _ _ _ 35
Areas suitable for development ____ ----------________________ 36 Quantity of ground water available locally________________ 37 Physical characteristics of the alluvium___________________ 37 Chemical quality of the water___________________________ 38 Other factors ______________ -- ______ --- __________ ---____ 38
SummarY------------------------------------------------- 39 Records of wells__ _ _ _ _ _ _ _ _ _ _ _ _ _ _ _ _ _ _ _ _ _ _ _ _ _ _ _ _ _ _ _ _ _ _ _ _ _ _ _ _ _ _ _ _ _ 40
References cited _________________________________ - _- _ _ _ _ _ _ _ _ _ _ _ _ _ _ _ 48
Index------------------------------------------------------------ 49
ILLUSTRATIONS
Page
PLATE 1. Map of the Crescent Valley, Eureka and Lander C-:--unties, Nev., showing location of wells and springs and areal extent ofphreatophytes----------------------------------- lnpocket
FIGURE 1. Map of Nevada showing area of present report and a:teas de-scribed in other ground-water reports___________________ 4
2. Average monthly precipitation and average monthly tempera-ture at the U.S. Weather Bureau climate station at B<'()wawe, Nev________________________________________________ 6
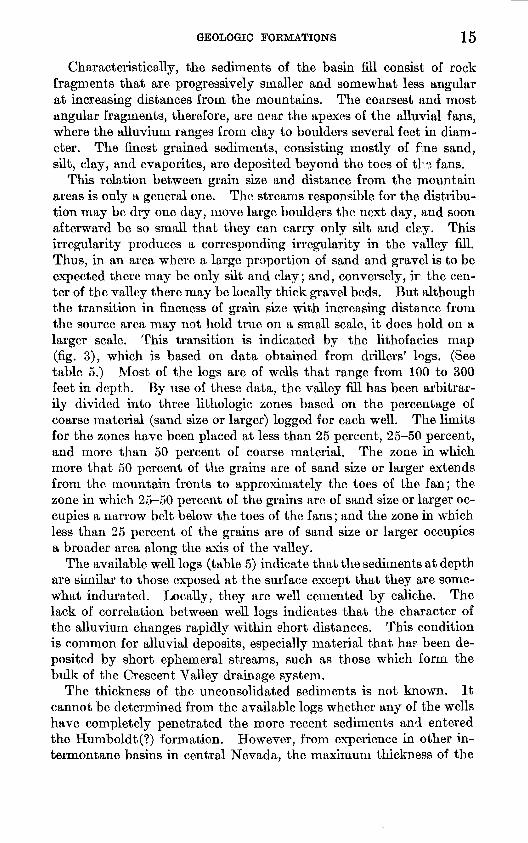
3. Areal distribution of sediments of the valley fill, classified ac-cording to grain size__________________________________ 16
4. Hydrographs of observation wells and monthly precipitation, 1948-57_____________________________________________ 25
5. Classification of irrigation water_________________________ 27 6. Map showing areas of prospective development of ground water
for irrigation or other large-scale uses_ _ _ _ _ _ _ _ _ _ _ _ _ _ _ _ _ _ _ 30
TABLES
Page
TABLE 1. Chemical analyses and classification of water in the Crescent Valley, Nev _____ ---- __ _ __ _ ___ _ __ _ __ __ _ __ __ ____ __ __ _ __ 28
2. Flow measurements of streams on the west side of the Cortez Mountains------------------------------------------- 37
3. Record of wells in the Crescent Valley ___ -----------______ 40 4. Water-level measurements in wells in the Crescent Vallf.y ------ 42 5. Logs of wells in the Crescent Valley __ --------------------- 44

GROUND-WATER POTENTIALITIES IN THE CRES~ENT VALLEY, EUREKA AND LANDER COUNTIES, NEVADA
By C. P. ZoNES
ABSTRACT
The Crescent Valley is an intermontane basin in Eureka and Lander C ')Unties, just south of the Humboldt River in north-central Nevada. The valley floor, with an area of about 150 square miles, has a shape that more nearly rE.sembles a Y than a crescent, although the valley apparently was named after the arc described by its southern part and northeastern arm. The northwestern arm of theY extends northward to the small railroad town of Beowawe on the Humboldt River; the northeastern arm lies east of the low Dry Hills. The leg of the Y extends southwestward toward a narrow gap which separates the Crescent Valley from the Carico Lake Valley. The total drainage area of the Crescent Valleyabout 700 square miles-includes also the slopes of the bordering rrountain ranges: the Shoshone Range to the west, the Cortez Mountains to the e1.st, and the Toiyabe Range to the south.
The early history of the Crescent Valley was dominated by mining of silver and gold, centered at Lander in the Shoshone Range and at Cortez and Mill Canyon in the Cortez Mountains, but in recent years the only major mining activity has been at Gold Acres; there open-pit mining of low-grade gold ore has supported a community of about 200. For many years the only agr:cultural enterprises in the valley were two cattle ranches, but recently additionl'l.l lands have been developed for the raising of crops in the west-central part of th0 valley.
The average annual precipitation upon the floor of the Crescent Valley is probably less than 7 inches, of which only a little more than 1 inch rormally falls during the growing season (from June through September). This is far less than the requirement of any plants of economic value, and irrigation is essential to agricultural development. Small perennial streams rising in the mountains have long been utilized for domestic supply, mining and milling activities of the past, and irrigation, and recently some large wells have been developed for irrigation. In 1956 the total pumpage from wells in tho. valley was 2,300 acre-feet.
The Crescent Valley is a basin in which has accumulated a large volume of sediments that had been eroded and transported by streams from the surrounding mountains. The deepest wells have penetrated only the upper 350 feet of these sediments, which on the basis of the known thickness of sediments in other intermontane basins in central Nevada may be as much as several thousa.nd feet thick. Because this valley fill is saturated practically to the level of th valley floor, the total volume of ground water in storage amounts to millions of f,cre-feet. In practically all wells drilled to date, the water has been of a quality satisfactory for irrigation and domestic use.
The amount of water that can be developed and used perennially is far smaller than the total in storage and is dependent upon the average annual recharge to the
1

2 GROUND-WATER POTENTIALITIES IN CRESCENT VALLEY, NEV.
ground-water reservoir. This recharge comes principally from streams, fed largely by snowmelt, that drain the higher mountains. The average annual recharge to the valley fill is estimated to be about 13,000 acre-feet. This natural supply, which is largely consumed by native vegetation on the valley floor, constitutes a perennial supply for beneficial use only to the extent th:~.t the natural discharge can be reduced. In time, much of the natural dischargE. can probably be salvaged, if it is economically feasible to pump ground wat{;r after water levels have been lowered as much as 100 feet in the areas that novr appear to be favorable for the development of irrigation supplies.
In 5 wells in the phreatophyte area, where the water table is within 3-8 feet of the land surface, the trends in water level have paralleled those in precipitation-downward during the dry years 1952-55, upward in wetter 1956 and 1957, and as high in 1957 as at any time since 1948. In most wells there is also a seasonal fluctuation of 1-3 feet, from a high in the spring to a low in the fall. There is no evidence to date that pumping has lowered the water table in the area of natural discharge. It is to be noted that all 9 of the large production wells are at the edge of the area of natural discharge.
The most favorable area for the development of ground water appears to be the west-central part of the Crescent Valley, from the Indian Crf.ek fan northward to about the latitude of Corral Canyon. All but one of the large wells already developed are in this area. The favorable areas on the ef.st side of the valley are likely to be at the toes of the fans of the larger flowing stre~.ms.
It is believed that any effect of ground-water development in Crescent Valley on the flow of the Humboldt River will be insignificant, because underflow from the valley to the Humboldt River probably is very small and ther8 is rarely any surface flow from the valley.
INTRODUCTION
A cooperative program for the study of the ground-water resources of Nevada was begun in 1944 by agreement between the Director of the U.S. Geological Survey and the State Engineer of Nevada. Since then, under a continuing program, hydrologic investigations have been carried out in selected areas in the State.
PURPOSE AND SCOPE OF THE INVESTIGATI(lN
This report, which is a part of the cooperative progran, describes the hydrology of the Crescent Valley. It is concerned primarily with the occurrence and potential development of ground-water supplies in the valley and attempts to answer such questions as: How much ground water can be withdrawn annually? and Which areas are most favorable for development? The section on geology is of limited scope, but the characteristics of the alluviun1 are c1iscussed as fully as the available data permit, because the alluviu1n contains the most important aquifers in the valley.
No geologic mapping was attempted in the mountain ar~as. However, the rocks are described briefly from data contained in both published and unpublished reports, principally because the nat·1re of these rocks determines to a large extent the water-bearing prr>perties of the alluvium that is derived from them.

INTRODUCTION 3
Most of the fieldwork was done in June and August 1948 by D. A. Phoeni.....: and in Novmnber 1953 and August 1954 by the writer. Many of the hydrologic data were collected by Phoenix, who also tnapped the phreatophyte areas. The section on the Humb'lldt(?) formation is based largely on the observations made by F'~.oenix. The investigation was first under the supervision ofT. W. Rcbinson, district engineer of the Ground Water Branch of the U.S. Geological Survey in Nevada. After December 1953 the project was supervised by 0. J. Loeltz, who succeeded Mr. Robinson as district engineer.
GEOGRAPHY
The Crescent Valley is in north-central Nevada in Lander and Eureka Counties. (See fig. 1.) The Valley trends northeast, is about 45 miles long, and includes approxhnately 700 square miles wthin its drainage area. The valley floor is shaped roughly like a Y. (See pl. 1.) One arm projects northward to the Humboldt River; the other projects northeastward between the Cortez Mountains and the Dry Hills, a low range of hills that separates the two arms of the Y. The leg of the Y extends southwestward toward Rocky Pass.. a narrow gap that separates the Crescent Valley fron1 the Carico Lake Valley.
Mountain ranges enclose the valley aln1ost completely. T\e Shoshone Range borders the valley on the west and the Cortez Mountains border it on the east. The south end of the valley is chsed by the north end of the Toiyabe Range, and the northeastern part of the valley is closed by the northern part of the Cortez Mount.11ins and the Dry Hills. The northwestern part is open to the flood plain of the Humboldt River.
The small railroad town of Beowawe, served by both the Western Pacific and the Southern Pacific Railroads, is just north of tr~ valley on the flood plain of the Humboldt River. A paved section of State Route 21links Beowawe with U.S. Route 40 at a point 5 miles north of the town. State Route 21 is gravel surfaced south of B~owawe. It traverses the length of the Crescent Valley, leaves tho, valley through Cortez Canyon, and continues south to Austin. A dryweather dirt road across the Shoshone Range enters the Crescent Valley through the canyon cut by Indian Creek.
Most of the residents of the Crescent Valley are engaged in mining or agriculture. Mining was started shortly after the middle of the last century,when rich silver-bearing deposits were discoverec. in 1863 in the Cortez and Mill Canyon districts at the south end of the Cortez Mountains. From the date of this discovery until 1908, ore variously valued at an estimated $10 million for both districts to $15 million for the Cortez district alone was taken from the mines (Lincoln, 1923, p. 86). After 1908, produetion from the Cortez and Mill Canyon

4 GROUND-WATER POTENTIALITIES IN CRESCENT VALLET, NEV.
120"
ASHOE/
P·i_ /.~:::):.-~ PERSHING
·~ .. : · . .:
EXPLANATION
0
I
-Area described in this report
Area described in other reports
40
118°
80 MILES
I
116"
FIGURE 1.-Map of Nevada showing area of present report and areas described in other ground-water reports.
districts was sporadic. Mills were erected at both towns, and when the Mill Canyon mines did not prove very productive, the n1ill at Mill Canyon treated ore from Cortez. In addition to silve;, the two districts produced gold, lead, zinc, copper, and turquoise.
INTRODUCTION 5
The Bullion district (Lincoln, 1923, p. 110-111), on the east slope of the Shoshone Range, is both north and south of Indian Creek. Lander is the oldest ca1np in the Bullion district and in the 1880's and 1890's was the n1illing center of the district. Silver, gold, lead, copper, and arsenic were mined in the district.
The only 1najor n1ining aetivity in the valley at the present tin1e is at Gold Aeres, a mining con1nnmity of about 200 inhabitants, 29 road n1iles south of Beowawe. Extensive open-pit n1ining at Gold Acres yields 150,000 tons of low-grade gold ore each year.
Two ranches in the Crescent Valley, the Dean Ranch and the Dewey Dann Ranch, raise cattle. The headquarters of tbe Dean Ranch is about 5 miles east of the old 1nining town of Tenabc. Two wells on this ranch furnish supplemental water for 240 acres of land ordinarily irrigated by water fron1 Indian Creek. The Dewey Dann Ranch is at the foot of the Cortez Mountains on the east side of the valley. Water for irrigating 120 acres of land at the ranch is obtained from one well and fro1n Duff and Hand-me-down Creeks. Northeast of the Dewey Dann Ranch, water is diverted from Sod Ho•1se and Frenchie Creeks for irrigating land owned by the Dean Rancl'.
Farming is being carried on in the west-central part of the valley, where several wells have been drilled and a few hundred acres of land has been placed under cultivation. Irrigation of crops is £ssential in this region of little rainfall.
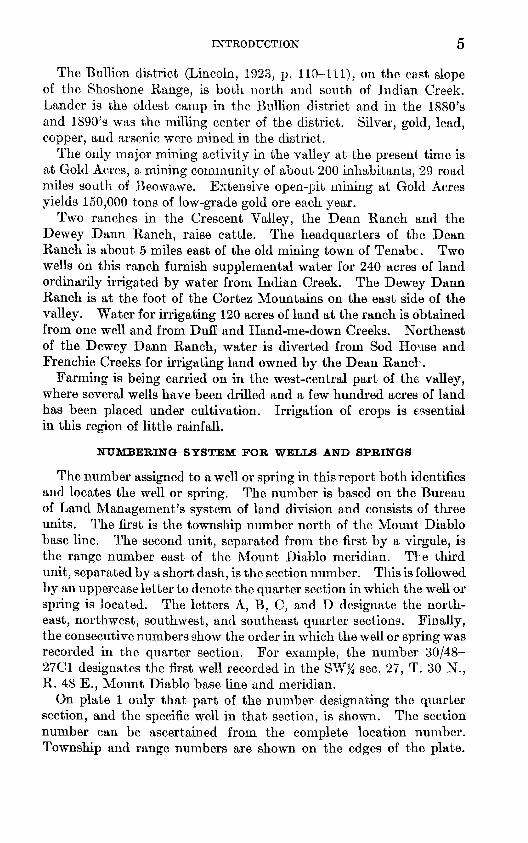
NUMBERING SYSTEM FOR WELLS AND SPRINGS
The number assigned to a well or spring in this report both identifies and locates the well or spring. The nun1ber is based on the Bureau of Land Management's system of land division and consists of three units. The first is the township nun1ber north of the Mount Diablo base line. The second unit, separated fron1 the first by a virgule, is the range number east of the Mount Diablo meridian. Tl'e third unit, separated by a short dash, is the section nu1nber. This is followed by an uppercase letter to denote the quarter section in which the well or spring is loeated. The letters A, B, C, and D designate the northeast, northwest, southwest, and southeast quarter sections. Finally, the consecutive numbers show the order in which the well or spring was recorded in the quarter section. For exan1ple, the nun1ber 30/48-2701 designates the first well recorded in the S"\VX: sec. 27, T. 30 N., R. 48 E., 11ount Diablo base line and meridian.
On plate 1 only that part of the number designating the quarter section, and the specific well in that section, is shown. The seetion number can be ascertained fro1n the con1plete loeation nun1ber. Township and range numbers are shown on the edges of the plate.

6 GROUND-WATER POTENTIALITIES IN CRESCENT VALLEY, NEV.
CLIMATE
The climate is characterized by low precipitation and hmnidity and extreme daily variations in temperature. Although tl'ere is no weather station in the Crescent Valley, climatological records are available for the U.S. Weather Bureau station at Beowawe, which is near the same altitude as the floor of the Crescent VaHey. The average annual precipitation at this station is 6.44 inches for the 79-year period of record. Only about 1 inch of this falls during the growing season from June through Septen1ber. Figure 2 shows
: en
0.80 LLJ l ~
:z: '-' r-----~
~ 0.70 ~
c' c~
~~
z-0 0.60 i= <( 1-0:: 0.50
~
;------ ~ ~~
i, c~ ·,,
--:-:-- ~· - ~c • •: ~ ~~ } u L&J 0:: a.. 0.40 >-...J :z: 1- 0.30 z 0 ::!! ..... 0.20 C!:l
"" a::: ..... 0.10 > <(
~· ~c ',
~' . ·~: :~ '
~:
~~ : ~~
: ~~ ~ :. ~: c ~~'
~~~
•:- ~ ~ 1' i·: ~~; I c~ :~ c ~ ' . ' ~~
~, ~: c : ::
•[: .~ .. c,, ,; : ~ ; ~c .:: .. , .... ,
~c ~~ .: ~ ~~ ·' ~ ~,~~~
i ~:
' c
~: . -; .;.,:'f'l
';,· ' .. :.: :::·.,
-~; c c ~ • :'~ c ~~ ~ • • :: C• • c\.t· .'c
c ,,;,
: ; ':
·:·. ·t:.·:. ::. '< :, ... . ,:
,,:,-': j_·.: · ... ... ~:= ,:;.
~' ·.::
1-u:; :z: z 90 1.1.1 a::: :z: < u.. 80 en 1.1.1 1.1.1 a::: 70 C!J LLJ
tz:Tr ~ ' ' . . ,:~ :c
c
~ 60 .....; a::: :::> 50 1-<·
.:::.: '· •,~ :, : ; : ::': :
~ ~'• ~,,
' ~' .
•• ' ·:~ ' ~~
~ : .
a::: 1.1.1
40 a.. ~:~
'• ,~
I ~
:::!!: 1.1.1
~· ~~ ~ ~
c~ :
c ~
1-
>- 30 ...J :z: 1-z 20 0 :::!!:
~ : ~~ ~'
~'~ . : ,, ~
~ ,, : '~ c ~ c
~~ ':•. '~
1.1.1 10 C!J
< a::: 1.1.1 > <-
<;.' ,. c~ ~ ~
~-' .
"1,· . ··,,, ':
:. : ~ :: ·:···,: :'·:·. .. :• .~.::: ' ~:: -~ ( J : :-:::;:·
JAN FEB MAR APR MAY JUNE JULY AUG SEPT OCT NOV DEC
FIGURE 2.-Average monthly precipitation and average monthly temperature at the U.S. Weather Bureau climate station at Beowawe, Nev. (Data from vVeather Bureau Summary for 1955.)

CLIMATE 7
graphically the average monthly precipitation at Beowawe as compiled from the U.S. Weather Bureau's annual summary for 1955. 1\fost of the precipitation occurs during the winter and spring, r,nd the least during July, August, and September. In the mountain ranges bordering the Crescent Valley the relation between the an1ount of precipitation and the season is similar, but the rate of precipitation is greater because of the higher altitudes. According to Hardman (1936), the highest peaks overlooking the Crescent Valley receive more than 20 inches of precipitation annually.
U.S. Weather Bureau records of the temperature at Beowawe are available for 60 years. Figure 2 gives the average ten1perature, by months. The average yearly temperature is 49.1 °F for the pe~iod of record.
The July average of 73.6°F is the highest 1nonthly average, and the January average of 26.6°F is the lowest. The highest and lowest temperatures ever recorded at Beowawe were 108°F and --42°F. However, the yearly high and low ten1peratures normally do r'lt approach such extremes. More representative yearly high and low temperatures covering 9 years, are shown below.
Temperature extremes for 191,5 throu.gh 1955 at Beowawe, Eureka County, Nev., from records of the U.S. Weather Burea'u,
Year Highest temperature (degrees Fahr
enheit)
Lowest temperature (degrees Fahr
enheit)
1945_________ 98 ----------1946_ -------- 99 -7 1947_________ 100 -27 1948- - - - - - - - - - - - - - - - - - - - - - - - - - - - -1949 _________ --------------------1950- - - - - --- - 98 - 22
Year Highest tern- Lowest tern- · perature (de- perature (de-grees Fahr- grees Fahr-
enheit e'lheit)
1951_________ 102 1952_________ 97 1953_________ 99 1954 _________ ----------1955_________ 101
-15 -14
2 -12 -9
Characteristically, daily variations of temperature are large, but they are smaller in winter than in sum1ner. In the winter they are usually about 30°F, whereas in the summer they average bf't,ween 40° and 50°F. Even during the warmest n1onths, night temperatures often drop into the 40's. Freezing temperatures, however, norn1ally do not occur fron1 late May or early June to about the middle of Septen1ber. The length of the frost-free season, or approximate1.y the growing season, at Beowawe has ranged from 41 to 193 days duri·1g the 40 )rears for which such estimates were made by the U.S. Weather Bureau. The median length of the frost-free season is betwef'n 105 and 108 days.

8 GR01JND-WATER POTENTIALITIES IN CRESCENT VALLEY, NEV.
LANDFORI\iS AND DRAINAGE
The Crescent Valley is in the Great Basin section of the Basin and Range physiographic province. The Great Basin was nmned by John C. Frmnont, who crossed the region in 1843 and 1845, and includes nearly all of Nevada and the western part of Utah. It is an area of alternating valleys and mountain ranges which generally trend nearly north. The ranges differ in size, but in f~neral they are 50-70 1niles long and 6-15 miles wide. Altitudes of the ranges eommonly are 3,000-5,000 feet above the valley floors and 7,000-10,000 feet above sea level. The typical range owes its relief to faulting and tilting of the mountain block. Ordinarily, one side of the block is a steep fault scrap, whereas the opposite side is a more gently dipping slope.
The intermontane valleys are characteristically clcsed basins, although some valleys are connected by drainage channels. Playas, present in most of the valleys, receive the excess runcff from the neighboring mountain ranges.
MOUNTAINS
The northeastward-trending ranges bordering the east and west sides of the Crescent Valley are fault-block mountains that rise n1ore than 4,000 feet above the valley floor. Each ran-se has been faulted on its west side and tilted to the east. The Cortez Mountains, which rise abruptly from the valley floor, have a fajrly uniform bulk. The crest is not deeply notched but is generally concordant, although it is progressively lower toward the north. The highest point on the crest is 9,162 feet on Mount Tenabo at the south end of the range.
The west face of the range shows 1nany features that are typical of fault-block 1nountains. Its base is essentially straight in plan view. The range is cut by deep V -shaped canyons separated by sharpcrested spurs that end abruptly in steep triangular facets. The slope of the facets does not flatten out near the base of the 1nountains but is fairly uniform. The facets probably represent a fault surface that has been son1ewhat subdued by erosion.
Dissection of the west side of the range is in a n1ature st11ge. Interstream divides have been reduced to sharp crests, even between the gullies and the strean1s that are tributary to the main drainage channels.
The Dry Hills are a spur of the Cortez Nlountains that nearly parallels the n1ain mountain block. Its origin is not kn~wn. However, a line of hot springs along the southwestern bas€, of the hills indicates the presence of a fault, which suggests that the Dry Hills

LANDFORMS AND DRAINAGE 9
1nay have originated as a block that was faulted along the west side and tilted to the east.
The Shoshone Range is about 150 1niles long, but only its northern part forms the western boundary of the Crescent Valley. The gently sloping east side of the Shoshone Range is in 1narked contrast to the steep west face of the Cortez Mountains. At the extreme north end of the Shoshone Range, a steep northeastward-trending scarp-probably a fault scarp-splits that part of the range into two spurs. Only the runoff from the smaller, eastern spur flows into the Crescent Valley. The runoff frmn the east side of the larger spur to the west enters the narrow valley between the two spurs and thence flows into the Humboldt River. The two spurs merge at about the latitude of Fire Creek. The east side of the spur at the north end of the valley is a dip slope. The spur is composed of lava flows that were extruded on a Tertiary erosion surface. Subsequent faulting and tilting, which formed the Shoshone Range, gave the lava flows an eastward dip of about 10°-15°. The eastern spur is low at its north end but its crest rises gradually to an altitude of n1ore than 7,500 feet near the head of Fire Creek. Deep dis~ection of the volcanics in the southern part of the spur has resulted in rugged topography, and the area has been appropriately named the Malpais. Streams that descend the Malpais have cut narrow steep-walled canyons, which range in depth fron1 several hundred to a thousand feet. The interstream divides are 1noderately rounded to flat. Dissection of the rocks near the northern end of the spur has been n1oderate.
Southwest of the Malpais the Shoshone Range is cmnposed of sedin1entary, metamorphic, and intrusive igneous rocks. This part of the range is higher than the Malpais and includes the highest point on the divide, Mount Lewis, altitude 9,680 feet. Tl'e area is in a n1ature stage of dissection. The interstrean1 areas have been rounded, and there are no sharp-crested divides as on tl'e west side of the Cortez Mountains.
PIEDMONT SLOPES
The pied1nont slopes of the ranges have gentler gradients than the n1ountain fronts and generally merge almost linperceptibly into the relatively flat floor of the valley. With one exception, a pediment in the southwestern part of the valley, the slopes are fo1T1ed by rubble that has been eroded from the uplands and deposited at the base of the ranges to form alluvial fans. Along the east side of the eastern valley the alluvial fans flanking the Cortez Mountains are distinct and well defined. In the interfan areas the valley floor is at places within a few hundred yards of the range front. ::rviost of

10 GROUND-WATER POTENTIALITIES IN CRESCENT VALLEY, NEV.
the fans extend 1-2 miles into the valley and have gradients that range from 200 to 250 feet per mile.
The alluvial fans at the base of the Shoshone Range ar~ considerably larger than those at the base of the Cortez Mountains. The former have coalesced to forn1 an alluvial apron along the base of the range. Their apexes are 600-700 feet above the valley flo'1r, whereas those at the base of the Cortez Mountains are only 300-400 feet above the floor. Indian Creek has deposited the largest alluvial fan in the valley. The fan extends eastward from the base of the Shoshone Range to the Dean Ranch, a distance of about 5 miles; it has a gradient of about 70 feet to the 1nile. North of the Inrlian Creek fan the alluvial apron becmnes progressively narrower and less distinct. At the base of the Malpais the upper limits of the apron are quite indistinct, because the weathered surface of the volcanic rocks on the dip slope of the Malpais closely resembles the boulder-strewn surface near the upper limits of the apron.
A north-south ridge that probably owes its relief to ver~ical movement along a fault on the west side of the ridge trends obliquely across the northern part of the Malpais, about 5 miles southwest of Beowawe. Surface runoff that flows down the dip slope of the Malpais is locally diverted by the ridge, where the ridge intersects what would be the nor1nal path of the drainage, so that several intermittent strean1s are channeled into a single stream that flows along the west side of the ridge. The sedin1ent transported by the corrbined flow of the Inerging strean1s has formed the only large alluvial fan at the foot of the Malpais. The fan extends about a mile onto the floor of the valley.
The only piedmont slope in the Crescent Valley that is definitely not an alluvial fan is in the southwestern part of the valley, in a reentrant in the Toiyabe Range. In this locality beds of Tertiary age have been beveled by lateral planation and covered with a veneer of alluvium to forn1 a pedin1ent that dips to the north. The pediment is now being dissected by ephemeral strean1s that have eroded valleys into it as deep as 200 feet.
VALLEY FLOOR
The valley floor is the relatively flat area downslope from the alluvial fans. Generally it is about 3 or 4 n1iles wide; it is abo'lt 30 miles long; and it covers an area of abemt 150 square miles, or less than onehalf of the total alluvial area of 330 square miles. The gradient is generally northward and ranges from less than 2 feet per mile in the northern part of the valley to about 40 feet per mile near the south end. Numerous playas that range in area from a few acres to In ore than 1 square mile occupy the lowest parts of the valley flo')r. S1nall
LANDFORMS AND DRAINAGE 11
dunes border some of the playas and locally forn1 barriers behind which water accumulates seasonally.
Much of the surfaee of the valley floor is enerusted with a white saline efflorescenee which has resulted from the evaporation of water fron1 the capillary zone.
Many areas of well-developed desert pavmnent are present in the valley, partieularly on the lower parts of the fans on the west. side of the valley. The presence of desert pavement indicates that wind erosion is active in the Crescent Valley to the degree that, locally, fine Inaterial is being removed faster than it is being deposited.
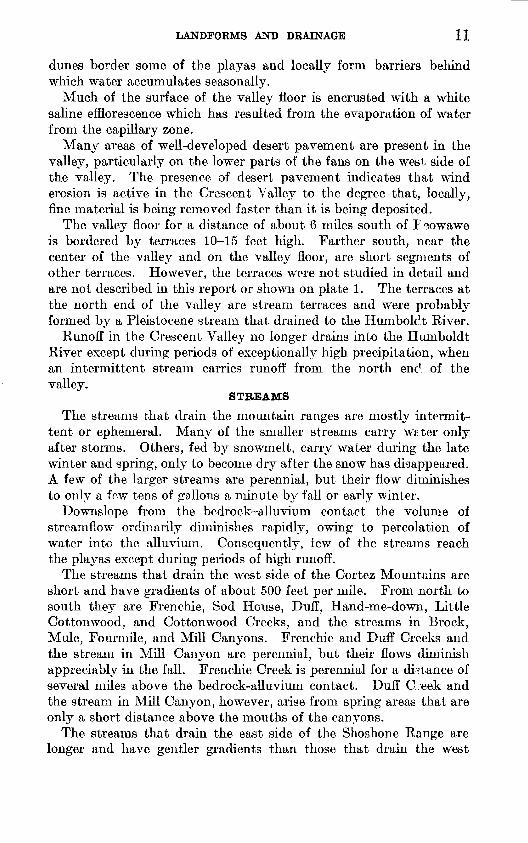
The valley floor for a distanee of about 6 n1iles south of E '30Wawe is bordered by terraees 10-15 feet high. Farther south, near the center of the valley and on the valley floor, are short segn1ents of other terraces. However, the terraces were not studied in detail and are not described in this report or shown on plate 1. The terraces at the north end of the valley are strean1 terraees and were probably formed by a Pleistoeene strean1 that drained to the Humbolc1t River.
Runoff in the Creseent Valley no longer drains into the Hun1boldt River exeept during periods of exceptionally high precipitation, when an intermittent strean1 carries runoff fron1 the north enc1. of the valley.
STREAMS
The strean1s that drain the mountain ranges are n1ostly intermittent or ephen1eral. Many of the sn1aller strean1s carry wt.ter only after storn1s. Others, fed by snowmelt, carry water during the late winter and spring, only to beeome dry after the snow has disappeared. A few of the larger streams are perennial, but their flow din1inishes to only a few tens of gallons a minute by fall or early winter.
Downslope from the bedroek-alluvium contact the volume of strean1flow ordinarily diminishes rapidly, owing to percolation of water into the alluvimn. Consequently, few of the streains reach the playas except during periods of high runoff.
The strean1s that drain the west side of the Cortez Mountains are short and have gradients of about 500 feet per n1ile. Fron1 north to south they are Frenchie, Sod House, Duff, Hand-n1e-down, Little Cottonwood, and Cottonwood Creeks, and the streams in Brock, Mule, Fourn1ile, and Mill Canyons. Frenchie and Duff Creeks and the strean1 in Mill Canyon are perennial, but their flows din1inish appreciably in the fall. Frenchie Creek is perennial for a di~tance of several n1iles above the beclrock-alluviun1 contac.t. Duff C':'eek and the strean1 in Mill Canyon, however, arise fron1 spring areas that are only a short distance above the Inouths of the canyons.
The strean1s that drain the east side of the Shoshone Range are longer and have gentler gradients than those that drain the west

12 GROUND-WATER POTENTIALITIES IN CRESCENT VALLEY, NEV.
side of the Oort~.."z Iviountains. Fro~n nortl1 to south the 11101e important streams are Fire Creek, the ereek in Corral Canyon, Indian Creek, and Cooks Creek. Of these, only Indian Creek iE perennial as far downstrean1 as the bedrock-alluviun1 contact. Cool-:s Creek is an interrupted strean1 which originates in the northern 1.= art of the Carico Lake Valley and enters the Crescent Valley through the gap at Rocky Pass. At the gap, underflow fron1 the Carico Lake Valley rises to the surface to forn1 a spring area, the discharge of whieh flows into the Creseent Valley at a rate esti1nated to average about 50 gpm (gallons per 1ninute) throughout the year.
GEOLOGIC FORMATIONS AND THEIR WATER-FEARING CHARACTERISTICS
PREVIOUS GEOLOGIC INVESTIGATIONS
The first geologic investigation of importance was made by Clarence King (1876) in the exploration of the 40th parallel. The exploration resulted in the first geologic n1ap of the area. Since then, En1n1ons (1910) and Lincoln (1923) have described briefly the n1ining districts in and near the Crescent Valley. The geology of n1ost of the northern part of the Cortez quadrangle, which eovers the northern end of the Toiyabe Range, the southern part of the Cortez Mountajns, and a small part of the Shoshone Range, was n1appecl in the sun1n~.er of 1949 by a field-geology class frmn the University of California at Los Angeles. The results have not been published.
TYPES OF ROCKS
For the purposes of this report the rocks in the area are divided into three units: (a) rocks of the n10untain ranges, (b) rocks of the pediment at the south end of the valley, and (c) alluviun1 of the valley fill. The units differ rnarkedly in lithologie and in water-bearing characteristics.
ROCKS OF THE MOUNTAIN RANGES
The rocks of the n1ountain ranges crop out above the b~droek-alluvium eontaet (pl. 1). For the most part they are well-indurated rocks of sedin1entary and igneous origin. 1'fetanlorphic aureoles surround the larger igneous intrusions.
The "Geologic Map of the United States" (1932 eel.) shows the 111ountains bordering the north half of the valley to be con1posed largely of igneous extrusive and intrusive rocks. Likewise, the mountains bordering the south half of the valley are largely lava flows and intrusive rocks, but they eontain also a thick section of seclinlentary rocks. In the Bullion district near Lander, the Shoshone Range consists of quartzite, shale, and limestone of Carboniferous B.ge, which are intruded by granodiorite and locally are capped by Tertiary ande-

GEOLOGIC FORMATIONS 13
sit3 (Lincoln, 1923, p. 111). Farther south, the rocks exposed in the northern part of the Cortez quadrangle consist largely of a thick Paleozoic sequence of dol01nite, lin1estone, shale, and ehert, and subordinate arnounts of sandstone, breccia, conglon1erate, and quartzite. A quartz monzonite stock of Mesozoic age and associated dil~es, sills, and apophyses have intruded the Paleozoic sedirnentary rocks and locally have altered then1. Conglon1erate, gravel, and lava flows of Tertiary age overlie the Paleozoic sedirnentary rocks. The lava flows consist of olivine basalt and n1assive to thin-sheeted flows of quartz latite. The basalt is highly shattered and is very vesicular at the upper and lower horizons.
The rocks of the mountain ranges are not an in1portant source of ground water. Ordinarily, they are well indurated and cemented and therefore do not transmit water readily. Moven1ent of ground water in consolidated rocks is eonfined largely to joints and other fractures, and to porous zones in lava flows. Of the consolidated rocks just described, the highly shattered and vesicular olivine basalt of the n1ountain ranges probably trans1nits water n1ost readily. Other consolidated roeks also n1ay transmit water freely in shattered zones near faults. As a rule, the eonsolidated rocks are not prospected for water, although wells that yield small supplies of water probably could be developed locally. However, the selection of well sites should be based on a detniled investigation of the stratigraphy and structure of the rocks in a particular area in order to inerease the chances for obtaining a successful well.
ROCKS OF THE PEDIMENT
Beds of late Tertiary age are exposed on a dissected gravel-veneered pedin1ent nt the south end of the valley. The exposures c-:msist of white, gray, and buff-eolored silt and diaton1ite, overlain by pink and terra cottn silt and fine sand. Locally the beds contain layers of caliehe. In general, the outeropping beds are eon1paeted and loosely een1ented and dip 4°-13° toward the southeast.
These beds ruay be eorrelative with the Hun1boldt forn1ation, which erops out in the area of the Ruby 1\tfountains (Sharp, 1939). The possible correlation is based on vertebrate fossils that were eolleeted by D. A. Phoenix as float on an outerop in see. 28, T. 26 N., R. 46 E. The fossils were exan1inecl by R. A. Stirton of Stanford University. Dr. Stirton (written comn1unieation to D. A. Phoenix, 1949) says of them:
The fossils~are not of such nature that we can offer very close identi4cation or correlation of the beds in which they occur. The parts are: parts of a. humerus, part of the cannon bone and astragalus, and a median phalanx of a camel, within the size range of those common to our upper Miocene and lower Pliocene faunas.
581735-61--2

14 GROUND-WATER POTENTIALITIES IN CRESCENT VALLE".:, NEV.
This, then, does not detract from a correlation of these beds with th'3 Humboldt formation as it was designated by Sharp.
The rocks of the Hun1bolclt forn1ation are of diverse lithology in the type area in the Ruby Mountains and East Hun1boldt Range. Sharp describes three 1nen1bers. The lower Inmnber consiE'ts of 800-1,000 feet of shale, oil shale, fresh-water lin1estone, sandftone, and conglmnerate. The n1iddle n1en1ber is charaeterized by rhyolitic tuff and ash, and its 1naximu1n measured thic,kness is 1,300 feet. The upper mmnber consists of at least 3,600 feet of fine conglmnerate, sandstone, n1udstone, siltstone, and shale.
Thus, although the Hun1boldt for1nation may underlie the more recent sediments in the Crescent Valley, there is little or no basis for estimating the character of the formation or the depth at which it is buried.
The water-bearing characteristics of different beds in a formation whose lithologic character is as diverse as that of the Humboldt(?) formation are certain to have a wide range. Wells that have nloderate to high yields have been drilled in the Humboldt formation near Elko, in Elko County (Fredericks and Loeltz, 1947). Therefore, there is a possibility that successful wells may be drilled in the Humboldt(?) formation in the Crescent Valley. However, no potentially good aquifers were observed in the outcrop. The exposec1 beds are too fine grained and too indurated to yield large quantities of ground water.
UNCONSOLIDATED SEDIMENTS OF THE VALLEY FILL
Unconsolidated sediments underlie the valley in an areu. of about 330 square n1iles downslope frmn the bedrock-alluviun1 contaet. Except for relatively sm.all eolian and lacustrine deposits along the axis of the valley, the sediments consist of stream-deposited det-ritus that has been eroded from the mountains. The eharacter of the alluvium depends in part on the nature of the strean1s that transport~d and deposited it. Alluviun1 deposited by perennial strean1s is sorted better than that deposited by ephemeral strean1s. The physical characteristics of the alluvium depend also on the type of rocks in the source area. Alluvium derived frmn the weathering of finer grained rocks, such as lava flows, generally has a large proportion of small grains. Therefore, the alluvium in the northwest branch of the vaUey, where the adjacent Inountains are eomposed largely of lava flows, probably contains a high percentage of small grains, though undoubtedly it contains also numerous large fragn1ents. Similarly, the alluvium derived from the fine-grained rocks of the Humboldt(?) formation at the south end of the valley probably contains a large proportion of small grains.
GEOLOGIC FORMATIONS 15
Characteristically, the sediments of the basin fill consist of rock fragments that are progressively smaller and somewhat less angular at increasing distances from the 1nountains. The coarsest and most angular fragments, therefore, are near the apexes of the alluvial fans, where the alluviun1 ranges from clay to boulders several feet in diameter. The finest grained sediments, consisting 1nostly of fne sand, silt, clay, and evaporites, are deposited beyond the toes of tl'~ fans.
This relation between grain size and distance frmn the 1nountain areas is only a general one. The streams responsible for the distribution may be dry one day, move large boulders the next day, and soon afterward be so small that they can carry only silt and clP.y. This irregularity produces a corresponding irregularity in the valley fill. Thus, in an area where a large proportion of sand and gravel is to be expected there 1nay be only silt and clay; and, conversely, ir the center of the valley there may be locally thick gravel beds. But although the transition in fineness of grain size with increasing distance from the source area may not hold true on a small scale, it does hold on a larger scale. This transition is indicated by the lithofacies map (fig. 3), which is based on data obtained from drillers' l0gs. (See table 5.) Nlost of the logs are of wells that range from 100 to 300 feet in depth. By use of these data, the valley fill has been arbitrarily divided into three lithologic zones based on the percentage of coarse 1naterial (sand size or larger) logged for each well. The limits for the zones have been placed at less than 25 percent, 25-50 percent, and more than 50 percent of coarse material. The zone in which more that 50 percent of the grains are of sand size or larger extends from the mountain fronts to approximately the toes of the fan; the zone in which 25-50 percent of the grains are of sand size or larger occupies a narrow belt below the toes of the fans; and the zone in which less than 25 percent of the grains are of sand size or larger occupies a broader area along the axis of the valley.
The available well logs (table 5) indicate that the sediments at depth are similar to those exposed at the surface except that they are somewhat indurated. Locally, they are well cemented by caliche. The lack of correlation between well logs indicates that the character of the alluvium changes rapidly within short distances. This condition is common for alluvial deposits, especially material that har been deposited by short ephemeral strea1ns, such as those which form the bulk of the Crescent Valley drainage system.
The thickness of the unconsolidated sediments is not known. It cannot be determined from the available logs whether any of the wells have completely penetrated the more recent sediments and entered the Humboldt(?) formation. However, from experience in other intermontane basins in central Nevada, the maximum thickness of the

16 GROUND-WATER POTENTIALITIES IN CRESCENT VALLEY, NEV.
T. 30 N.
T. 29 N.
R .. 47 E R.48 E. R.49 E.
'---···------ .. - """'-...._
./
4 MILES
EXPLANATION GRAIN SIZES OF THE UPPER FEW HUNDRED FEET OF SEDIMENT
OF THE VALLEY FILL. AS DETERMINED FROM DRILLERS" LOGS
Area in which less than 25 percent of grains are of sand size or larger
Area in which 25-50 percent of grains are of sani:l size or larger
Area in which more than 50 percent of grains are of sand size or larger
,,I[I//)/Jdlilllilnil11llit,, 0 34C2
Foot of hills or mountains Playa Well Approximate bedrock-all1wium cunta.ct Log was used for compiliri{J map
FIGURE 3.-Areal distribution of sediments of the valley fill, classified according to grain size.
fill in the Crescent Valley is likely to be several hundred feet and 1nay even be several thousand feet.
The valley fill is saturated with water almost up to the level of the valley floor and is the Inost important source of ground water in the valley. As the thickness of the valley fill is probably several hundred

GEOLOGIC FORMATIONS 17
or even several thousand feet, the volume of ground water in storage amounts to 1nillions of acre-feet. The hydraulic charactrristics of the alluviun1 n1ay vary greatly even within short distancer, so that predictions as to the water-bearing properties of the alluviun1 at a particular site for which no data are available are hazardouf,
Normally the better aquifers underlie the larger alluvial fans, which ordinarily are those deposited by perennial strean1s. Such fans probably contain many stringers of strean1-gravel deposits, vrhich can trans1nit water more readily than the intervening sediments. On the other hand, the short, steep fans that were formed by sn1all, f'"'Jhemeral strean1s consist principally of poorly sorted material that was deposited during floods. Beyond the fans the sedin1ents generally are too fine grained to yield large quantities of water.
Four aquifer tests were n1ade during the investigation ir order to determine the coefficients of transn1issibility of the aquifers tapped by wells in the central part of the valley. The coefficient of transmissibility, which may be defined as the rate of flow of water, in gallons per day, through a cross section of an aquifer having a width of 1 foot and a height equal to the thickness of the aquifer, under unit hydraulic gradient and at the prevailing water temperature, probably is the best indication of the water-transn1itting property of an aquifer. The four irrigation wells that were utilized in making the aquifer tests are (a) well 30/48-2701, on the valley floor below the toe of an indistinct fan opposite the Malpais; (b) well 30/48-33C1, on the lower part of the fan below Corral Canyon and 1% n1iles southwest of well 30/48-2701; (c) well 28/48-18A1, at the toe of the Indian Creek alluvial fan; and (d) well29/49-34C2, at the toe of the largest alluvial fan on the east side of the valley. Recovery tests of l-3 hours' duration were made at these wells. The values obtained for the coefficients of transmissibility are as follows:
Coefficient of transmissibility Well (gpd pe· foot)
30/48-27Cl _______________________________________ 6, 500 30/48-33Cl _______________________________________ 37,000 28/48-18Al _______________________________________ 6l,OOO 29/49-3402 _______________________________________ 30,000
The well in the aquifer of highest transmissibility is a,t the toe of the largest alluvial fan in the valley, the Indian Creek fan. Well 29/49-34C2, which penetrates aquifers that have an average transmissibility of 30,000 gpd per foot, is at the toe of the largest alluvial fan on the east side of the valley. Well 30/48-33C1, on the indistinct but large fan below Corral Canyon, penetrates aquifers that have a combined transmissibility of 37,000 gpd per foot. On the other hand, the aquifers tapped by well 30/48-27C1, on the valley floor beyond the alluvial fans, have a low average transmissibility. It

18 GROUND-WATER POTENTIALITIES IN CRESCENT VALLEY, NEV.
thus appears that the cmnparative transmissibilities of the wells correlate with the type of terrain in which they were drilled.
The transn1issibilities of the aquifers in the alluvium elsewhere in the valley are not known but n1ay be roughly estin1ated as low or high, largely on the basis of physiography. Although such estimates are subject to error, they n1a:y be useful where no nwre spe)ific data are available.
GROUND WATER
OCCURRENCE
Ground water in the rocks of the rnountain ranges cmnn1only occurs in sn1all quantities in joints, in fractures along fault zones, in porous zones in lava flows, and in other chance openings. Ordinarily, these rocks are not tapped for their water supply.
Ground water occurs also in the consolidated and semiconsolidated rocks of the Humboldt (?) forn1ation exposed in the souther:'l part of the valley. The I-Iun1boldt (?) forn1ation probably is present at depth beneath the floor of the valley also. The fineness of the grain and the degree of compac.tion of the exposed beds indicate that their permeability is low and that they would yield only small quantities of water. However, the water-bearing characteristics of the beds that rnay be buried under the rnore recent sedin1ents elsewhere in the valley are not known.
Most of the ground water is in the unconsolidated sedirnents of the valley fill. These sediments consist largely of clay, silt, sand, and gravel and are saturated below the water table. Although the clay yields only very sn1all quantities of water, the sand and gravel ordinarily transrnit water readily.
The depth to water in general is greatest near the bedrock-alluvium. contact and least beneath the lowest points in the valley, where the water table norn1ally is less than 10 feet below the land surface. Locally, the piezometric surface (i1naginary surface indicating the pressure head of water confined under pressure between beds of low pern1eability) is above the surface of the land. For example, east of the Indian Creek alluvial fan and near the axis of the valley, ground water in rnany of the aquifers is under sufficient artesian pressure to rise a few feet above the land surface.
Ground water, in general, moves fron1 the n1ountain rangeE' toward the axis of the valley, where it is transpired or evaporated, but in the extrerne northwestern part of the valley a small quantity of ground water rnoves northward into the valley of the Hun1boldt River.
RECHARGE
Precipitation at the higher elevations within the Crescent Valley drainage area is the n1ain source of water that recharges the ground-

GROUND WATER 19
water reservmr. Additional, but minor, sourees of reehB,rge are precipitation on the valley floor, excess irrigation water, surface flow fron1 the Carieo Lake Valley, and seepage from bedrock.
PRECIPITATION .AT THE HIGHER ELEV .ATIONS
A map compiled by Hardman (1936) shows approximately the precipitation zones in Nevada, esthnated largely on the basis of elevation and type of vegetation. In general, the valley floors are within the zones that receive the least precipitation; the higher elevations are within the zones that receive the greatest amounts. A con1parison of the map with recent topographic maps indicates that in the Crescent Valley drainage area the 8- to 12-inch precipitation zone is between altitudes of 5,500 and 6,500 feet; the 12- to 15-inch zone is between 6,500 and 8,000 feet; and the 15- to 20-inch zone is above 8,000 feet. The total annual precipitation tl1at falls within each zone is equal to the average annual precipitation in that zone multiplied by the area of the zone. On the basis of these computations, the annual precipitation above 5,500 feet is estimated at about 200,000 acre-feet. The limitations of this 111ethod for computing the total a1nount of precipitation should not be ovr~·looked. For instance, it is recognized that precipitation rates are influenced by factors other than altitude. Thus, many local variations are due to the rain-shadow effect of nearby high crests and to the direction of the prevailing winds. Owing to a lack of data. adjustments could not be made for the above factors. Accordingly, 200,000 acre-feet should be considered only an approximate figure.
Only a small part of the total precipitation on the mountain ranges reaches stream courses. Most of the moisture returns directly to the atmosphere through evaporation or enters the zone of soil n1oisture and is subsequently transpired by vegetation. Studies (Loeltz, Phoeni.x, and Robinson, 1949, p. 35) in the Martin Creek drainage area in the Paradise Valley, about 100 miles northwest of the Crescent Valley, indicate that in mountains con1parable in elevation and vegetative cover to those bordering the Crescent Valley, the yearly evapotranspiration requirement is 9 inches of preciptiation. Thus, only precipitation in excess of 9 inches is available for runoff. In the Crescent Valley the amount of such excess precipitation is estimated at 35,000 acre-feet.
From a study of the relation between runoff and recharge to the ground-water reservoir in the Paradise Valley (Loeltz, Phoenix, and Robinson, 1949) and in the Grass Valley (Robinson, Lo~ltz, and Phoeni.x, 1948), approximately 70 miles west of the Crescent Valley, it is estin1ated that only about 40 percent of the runoff in the Crescent Valley ultimately recharges the ground-water reservoir. The re-

20 GROUND-WATER POTENTIALITIES IN CRESCENT VALLEY, NEV.
n1ainder of the runoff is evaporntecl fron1 the strea1ns and other water surfaces such as ephmneral playa lakes or is transpired by the vegetation along strean1 eourses before it reaehes the groundwater reservoir. The average annual recharge in the Creseent Valley fron1 precipitation at altitudes above 5,500 feet ir therefore esti1nated to be about 14,000 acre-feet.
PRECIPITATION ON THE VALLEY FLOOR
Direet precipitation on the floor of the valley is son1evrhat n1ore than 6 inches a year. Ordinarily this is not enough to sati"fy evapotranspiration requiren1ents. Furthern1ore, downward movmnent of water beneath the floor of the valley is i1npeded by the nearly impermeable silt and clay that underlie the valley floor at lower elevations. For these reasons recharge fron1 precipitation on the valley floor is believed to be negligible.
INFILTRATION OF EXCESS IRRIGATION WATER
Owing to the relatively impermeable nature of the sediments for some distance below the floor of the valley, it is improb~.ble that appreciable quantities of excess irrigation water recharge tr~ groundwater reservoir. Most of the excess irrigation water evaporates or is transpired by vegetation outside the irrigated areas.
SURFACE FLOW FROM THE CARICO LAKE VALLEY
Ground water from the Carico Lake Valley surfaces at the gap at Rocky Pass and flows into the Crescent Valley. In additi')n, excess irrigation water from the Henry Filippini ranch at Reeky Pass enters the Crescent Valley through the gap. On the basir of a few 1neasurements of strea1nflow at Rocky Pass, it is estimated that during an average year 200-300 acre-feet of water enters the Crescent Valley as surface flow fron1 the Carico Lake Valley. Of thi~ amount, perhaps 100 acre-feet a year ultin1ately enters the ground-water reservoir in the Crescent Valley. The ren1ainder is loEt through evapotranspiration.
SEEPAGE FROM BEDROCK
The contribution of ground water to the valley fill fr01n the bedrock of the surrounding n1ountain blocks and fron1 the bedrock that underlies the alluvium is unknown. However, it is probably negligible.
DISCHARGE
Discharge fron1 the ground-water reservoir of the Crescent Valley is effected in several ways. Evaporation and transpiration, or evapotranspiration, account for the largest losses. Discharge by evaporation takes plaee in areas where the eapillary fringe (a belt of moisture

GROUND WATER 21
held above the water table by capillarity) reaches the land surface. Diseharge by transpiration oceurs in areas where the vegetation consists of phreatophytes (plants that normally send their roots to the water table or to the capillary fringe). Smaller quantities of ground water are discharged by springs and seeps, by underflow out of the valley, and by pumping and subsequent evaporation and tranEpiration of water from the ground-water reservoir.
EV .A.POTR.A.NSPIRATION
The quantity of ground water that is discharged by evapotranspiration is dependent on many faetors, including the depth to WP.ter, the species of plants and their density of growth, and the type of soil. Evapotranspiration does not proceed at a constant rate but varies with the season, the time of day, the temperature, hu1nidity, and wind velocity, and other climatic factors.
The two areas of evapotranspiration shown on plate 1 have been designated the greasewood area and the saltgrass area, after the species of phreatophytes that are dominant in those areas. Rabbitbrush, saltgrass, shadscale, and sagebrush are associated vrith the greasewood and are abundant locally. However, shadscale and sagebrush are not phreatophytes. The density of growth of the greasewood and associated phreatophytes varies locally but averages about 15 percent of the maximum possible density for the 33,300 acr,.~s of the greasewood area. The depth to water in the greasewood are5"!. ranges from about 8 to 20 feet below the land surface.
The saltgrass area of about 14,000 acres also includes otl,~r associated phreatophytes such as rabbitbrush, greasewood, and Ecattered saltbush. It contains several small pla.yas whose areas range from less than an acre to nearly a square mile. The depth to water in the saltgrass area is generally 3-10 feet below the land surface.
The surface of much of the saltgrass area is encrusted with a white saline efflorescence. Most of the saline material probably has been deposited from ground water that evaporated from the capillary fringe. Because the sedin1ents that underlie the saltgrass area are fine grained, the capillary fringe may extend to the land surface even though the water table is 5 feet or more below the land surface.
On the basis of data derived from evapotranspiration exp~riments conducted by White (1932) in the Escalante Valley, Utah, it is estimated that in the Crescent Valley the annual evapotranspiration rate in the greasewood area is about 0.15 acre-foot per acre, an<l in the saltgrass area about 0.5 acre-foot per acre. At these rate;;-, about 5,000 acre-feet a year of ground water is diseharged in the greasewood area and about 7,000 aere-feet in the saltgrass area.

22 GROUND-WATER POTENTIALITIES IN CRESCENT VALLEY, NEV.
SPRINGS AND SEEPS
There are both ther1nal and nonthermal springs and seeps in the area. None discharge large quantities of water. Th~ thermal springs include the Crescent Valley Hot Springs at the southwest end of the Dry Hills in sees. 1, 2, and 11, T. 29 N., R. 48 E., and the hot spring locally called the Chillis Hot Spring near the southv'"est end of the Crescent Valley in sec. 27, T. 27 N., R. 46 E. The 1;onthermal springs and seeps include small springs in the mountains and seepage areas on the lower fields of the Dean Ranch in sec. 5, 28, 32, and 33, T. 28 N., R. 48 E.; 2 s1nall seeps near the center of the valley floor in sees. 25 and36, T. 29 N., R. 48 E.; and 3 springs near the north end of the valley in sec. 36, T. 31 N., R. 48 E.
The Crescent Valley Hot Springs consist of 5 major sprngs which are along, or adjacent to, a probable fault zone at the base of the Dry Hills. The springs arise from alluvium and bedrocl~ in a line 1~ miles long and have a combined flow estimated at a litt]~ less than 100 gpm. Calcareous sinter is being deposited by the sprjngs. The temperatures of the water from all but 1 of the springs are between 124° and 138°F; 1 spring, on the valley floor, has a temr0rature of 79°F. An analysis of water from one of the largest sprinw- is shown in table 1.
The Chillis Hot Spring, at the bedrock-alluvium eontact at Roeky Pass, discharges 10 gpm. The temperature of the water is 102°F.
The two springs in sec. 36, T. 31 N., R. 48 E., diseharge a few gallons a minute. An analysis of water from the springs is shown in table 1. The temperature of the water, 66°F, was measured in the summer and may therefore be higher than the actual temperature of the water that seeps into the pools.
It is estimated that the eombined flow of all the springs and seeps in the Crescent Valley is not mueh more than 100 gpm, or about 150 acre-feet a year.
UNDERFLOW
Underflow from the Crescent Valley is believed to b~ confined to the extreme north end of the valley where an unknown, but probably small, quantity of ground water flows into the valley of the Humboldt River. That the underflow is small is suggested by the ccmbination of a low hydraulic gradient of only 1.5 feet per mile at the northeast end of the valley and the probably low permeability of the valley fill, which was derived from the low-lying mountains that flank the valley near its mouth.
A further indication that the underflow is small is the fact that the low flow of the Humboldt River and the canals through the gap at Beowawe is only 1~ efs (cubic feet per second) during dry years (Mr. George Hennan, supervising commissioner, Humboldt ·water

GROUND WATER 23
Distribution District, oral communication, 1958). BecB,use any substantial underflow fron1 the Crescent Valley into the Humboldt River would be evidenced by a pickup in the flow of the river, the underflow is included in the 1~ cfs and is probably only a small fraction of that amount, or only a few hundred acre-feet per year. The actual pickup is not known, as no data are available on the flow of the Humboldt River above the 1nouth of the Crescer.t Valley.
PUMP AGE
During 1956, several stock and domestic wells, 2 industrial wells, and 6 irrigation wells were in use in the Crescent Valley. It is estimated that the stock wells and domestic wells discharged about 50 acre-feet of water. Wells 28/47-33A1 and -33A2 supplied water to the homes and to the cyanide plant at Gold Acres at an ave~age rate of 275 gpm, or about 500 acre-feet a year. The two irrigation wells on the Dean Ranch were pumped about 169 days at a combined average rate of 1,000 gpm; thus, about 750 acre-feet of water was pumped from both wells. No pumpage data are available for irrigation wells 29/48-29C1 and 30/48-33C1, but it is estinated on the basis of the number of acres irrigated that about 350 acre-feet of water was pumped from them during the year. Well 30/48-27C1 discharged 400 acre-feet of water during the irrigatioll season. Well 29/49-34C2 reportedly discharged 250 acre-feet. The total discharge of ground water from all the wells in the valley was thus about 2,300 acre-feet in 1956.
INVENTORY
In a ground-water basin such as the Crescent Valley, the average annual recharge is equal to the average annual discharge plus or minus changes in ground-water storage. Unfortunately, the changes in ground-water storage resulting from the increased rate of pumping in recent years cannot be satisfactorily evaluated from tho, limited data available. Therefore, it is desirable to use a more favorable period, during which changes in ground-water storage were less significant, for checking estimates of recharge against estimates of discharge. The most favorable period appears to be abc~1t 1948, the year in which the phreatophytes were n1apped.
It is believed that the average annual discharge from the groundwater reservoir by evapotranspiration was greater then than it is now, or about 12,000 acre-feet. Underflow from the valley was probably about the same in amount as today-that is, probably orly a few hundred acre-feet, and springs annually discharged about the same quantity of water as today-about 150 acre-feet. Thus the average annual natural discharge was a little n1ore than 12,000 acre-feet.

24 GROUND-WATER POTENTIALITIES IN CRESCENT VALLEY, NEV.
To this should be added the estimated annual pumpage of about 600 acre-feet at the time the phreatophytes were mapped. The average annual discharge under equilibrium conditions thus is estimated to be about 13,000 acre-feet. In preceding sections of the report the average annual recharge was estimated at about 14,000 acre-feet. The estimates of recharge and discharge agree as closely as eould be eA."'})ected from the nature of the data and estimates used.
FLUCTUATIONS OF WATER LEVELS
The volume of ground water in storage does not remain constant but varies with changes in the amounts of recharge and diseharge. During periods when recharge exceeds discharge there is an increase in the quantity of water in storage. Conversely, when discharge exceeds recharge the amount of ground water in storage decreases. These changes in storage cause fluctuations of the water table and the piezometric surface, which ean be determined by 111eaf1Jren1ents of the water levels in wells.
In order to obtain an indication of the changes in ground-water storage, periodic measurements were made in 5 observat~on wells. In addition, 2 or 3 measurements were made in each of 8 other wells. Hydrographs of the fluctuations of water level in the 5 otgervation wells are shown in figure 4. Measurements made in the other wells are given in table 4.
The hydrographs indicate that the n1aximum fluctuation in groundwater levels during the year ranges from about 1 to 3 feet in the areas of natural discharge. Generally, the levels reach their highest stage in the spring or early sutnmer, and then decline until fall. The period during which ground-water levels rise in the spring corresponds with or lags slightly behind the period of maximum runoff. After the runoff period the gTound-water levels decline steadily owing to discharge of water by evapotranspiration.
In addition to the seasonal fluetuations in ground-water levels, long-tenn trends due to clin1atic variations also are evident. The long-term fluctuations result largely from annual changes in the amount of precipitation but are caused also, to a small extent, by other factors such as changes in temperature.
The hydrographs in figure 4 indicate a general decline of a few tenths of a foot from 1952 to 1955. During that period precipitation, and consequently recharge to the aquifers, was deficient. Nat ural discharge, however, continued at approximately the same rate. Therefore, a part of the total discharge was necessarily derived from storage. In 1956 the levels rose sharply, and they have continued to nse. This rise is believed to have resulted from increased precipitation. Over a period of many years, the fluctuations due to climatic

~1,-,N~=,I ~
EXPLANATION
{a) Recent pumping
~ sl - I 1 ca
iilr--r;J~\/t:~~-· P~=r====ll ij~~'1~~!S~tv~E I ; ;I ?ftl ~,~~>f~! I·F+~-1- _/f#f I ~,;I d\J?:~ .. I I I I I I I I ! ::I I I R I I I I I I I _ I l't I q I~J [
1948 1949 1950 1951 1952 1953 1954 1955 1956 1957
FIGURE 4.-Hydrographs of observation wells and monthly precipitation data, where available, for the period of record, 1948-57.
0 pj 0
~ t;j
~ t?:1 pj
~ ~

26 GROUND-WATER POTENTIALITIES IN CRESCENT VALLEY, NEV.
variations average out, so that the long-tern1 effect of these Yariations on ground-water levels is insignificant.
Of n1ore in1n1ediate concern to the economy of the valley is the effect of artificial withdrawals on the ground-water levels. Although insufficient data are available for evaluation of these effects, it is certain that water levels have been lowered smnewhat as a result of ground-water withdrawals. However, because the withclravrals until recently have been s1nall, their effect has been negligible.
CHEMICAL QUALITY OF THE GROUND WATER
WATER FOR IRRIGATION
In evaluating water to be used for irrigation, the salinity hazard, the sodiun1 (alkali) hazard, and the concentration of bicr.rbonate, boron, a,nd other ions must be considered. The above properties of water were discussed by Wilcox (1955) and the following d~~~ussion is based almost entirely on his report.
SALINITY HAZARD
The salinity hazard depends on the concentration of dissolved solids. It is comn1only measured in tern1s of the electrical conductivity of the water, expressed as n1icromhos per centimeter, or ECX 106, at 25° C. The electrical conductivity is an approxi1nate measure of the concentration of the ionized constituents of the water. Wilcox (1955) divides water into four classes with respect to its conductivity. The dividing points between the classes are at 250, 750, and 2,250 micromhos per centimeter. (See fig. 5.) Water of low conductivity is more suitable for irrigation than water of high conductivity, all other factors being equal. Wilcox provides the following c1assification of irrigation water with respect to salinity hazard:
1. Low-salinity water (Cl) can be used for irrigation with most cropf' on most soils with little likelihood that soil salinity will develop. Some leaching is required, but this occurs under normal irrigation practices except in soils of extremely low permeability.
2. Medium-salinity water (C2) can be used if a moderate amount of leaching occurs. Plants with moderate salt tolerance can be grown in most cases without special practices for salinity control.
3. High-salinity water (C3) cannot be used on soils with restricted drainage. Even with adequate drainage, special management for salinity control may be required and plants with good salt tolerance should be selected.
4. Very high salinity water (04) is not suitable for irrigation under ordinary conditions but may be used occasionally under very special circumstances.
SODIUM HAZARD
The sodium, or alkali, hazard is indicated by the sodiun1-adrorption
Na+ ratio (SAR), which n1ay be defined as SAR= .JCa+++ Mg++' In
2

CHEMICAL QUALITY OF THE GROUND WATER 27
100 500 1000 5000
>-I ffi5:2
""" >I
Cl-S4
C2-S4
I <!) (Y')
:E
C3-S4
Cl-S3
~ 0 e a: < 0 C2-S3 N i= < I < a: :J :::!: z < ::::> 0 ~ 5 N i= ...J
$ w a.. :::!: a:
:::!: 0 C3-S3 fJ)
::::> 0 Cl-S2 5 < 0 ~ fJ) ::::>
5 0 C2-S2 fJ)
Cl-Sl 31/48-3601
C2-Sl e
CONDUCTIVITY,IN MICROMHOS PER CENTIMETER (EC 106) AT 25"C
2 3 4
LOW MEDIUM HIGH VER'' HIGH
SALINITY HAZARD
FIGURE 5.-Classification of irrigation water on the basis of conductivity and sodium-ads'lrption ratio

28 GROUND-WATER POTENTIALITIES IN CRESCENT VALLEY, NEV.
Well or Spring No.
and location
-----28/48-9BL ___ 29/48-101__ ___
3BL ___
5A1. ____
3401_ ___
31j48-36BL ___
TABLE 1.-Chemical analyses and classification of waters
[Analysis by U.S. Geological Survey, Quality of Water Laboratory, Salt Lake City,
Cla~sification Cor~tituents {ppm)
----<:> :§ 6 ,;, <:>,-... §o s ~ ~
~ :§ ~
.... 0 0. 5s r;;;- §~ 8 ~ ... $ @. "0..., :3 so.
~ ~al I'll :::!~ .g 0. '0 81'/J '0 e :go s ~ QJ
~ 0 ~ ~ ~ '2
&5 !;j ..::; 0 6 8 ~ 0 s '0 "'OO :0 - .... ~ ::3 '0 '?......, ...... ~ ~ § ~ 0 0 .g~ QJ al- s
QJ [I 8 ~ s~ .a~ <l=l e. 0 ~ 0. j :::!~ ·~a "' :::!
!;j ~ s ~ 'E'§ :gs '1!1~ 0 ~ :§
"' ~--- al""' ~ 0 QJ .......... .§ al 00 A E-4 A 00 A 00 ~ 0 00 0
-----------------------------w 129 54 9-15-48 441 298 2.1 0.38 02-81 39 0.08 34 s ------ 138 6-1G-48 1, 750 1, 140 7.9 9.9 03-82 n .03 53
w 216 56 6-11-48 675 448 2.3 0 02-S1 34 .18 53
w 106 ----- 11- 3-54 456 276 1.8 .05 C2-S1 1:1 .11 34
w ------ 50 9-15-48 994 638 5.6 1.50 03-S2 68 .08 36
s ------ 66 6-14-48 584 424 3.9 1.12 C2-S1 90 ,03 30

CHEMICAL QUALITY OF THE GROUND WATER 29
in the Crescent Valley, Eureka and Lander Counties, Nev.
Utah. Source of sample: S, spring; W, well. Classification for irrigation: See fig. 5]
Constituents (ppm)-Continued
i 0 8. ~
0 as
~ '0 0
~ 0
Remarks e. '2 ~
§ s ~ 2S
i 2S a g as eg e 1:1 as
~ §: l~
.8 i ~ Q)
~~ ~ "0 2S 1-< ·c -~ !i ~ ~ .s 1:1 as o'fil .Cl .s 0 as z ~ ~ 00 IX! 00 0 r:..t z IX! ~ Pt
---------------------9.0 52 172 48 29 1.0 1.2 0.02 122 0 8. 7 COa not reported. 43 319 980 117 44 5.9 .0 .4 309 0 ------ Not suitable for irrigation or
domestic use. 17 75 246 121 26 . 3 .1 .06 202 0 ------ Hard water. Some softening
desirable for certain. domestic uses. 7.9 ppm F<l precipi-
10 46 157 53 32 .2 3.0 tated from sample.
------ 126 0 7.4 Zinc, 1.6 ppm; manganese, 0 ppm.
14 157 270 155 73 .9 .8 .04 148 0 8.2 Quality for irrigaticn is mar-ginal.
5. 7 89 188 71 42 1.4 2.4 .02 98 0 ------
5811815-61-8

30 GROUND-WATER POTENTIALITIES IN CRESCENT VALLEY, NEV.
which concentrations are expressed in equivalents per million (epm). If the proportion of sodiun1 a1nong the cations is high, the sodium hazard is high; but if calcium and magnesium predominate, the sodium hazard is low. Wilcox classifies irrigation waters, with respect to sodium hazard, as follows:
1. Low-sodium water (81) can be used for irrigation on almost all soils with little danger of the development of harmful levels of exchangeable sodium. However, sodium-sensitive crops such as stonefruit trees and avocados I"\ay accumulate injurious concentrations of sodium.
2. Medium-sodium water (82) will present an appreciable sodium hazard in fine-textured soils having high cation-exchange capacity, especially under lowleaching conditions, unless gypsum is present in the soil. This water may be used on coarse-textured or organic soils with good permeability.
3. High-sodium water (83) may produce harmful levels of exchang(','l.ble sodium in most soils and will require special soil management-good drainage, high leaching, and organic matter additions.
4. Very high sodium water (84) is generally unsatisfactorily for irrigation purposes except under special circumstances.
BICA.RBONATE ION
Residual sodiun1 carbonate (RSC) is a 1neasure of the hazard involved in the use of high-bicarbonate water and is defined by the formula RSC=(C03--+HC03-)-(Ca+++Mg++), in which concentrations are expressed in equivalents per million. Water in which the value for residual sodium carbonate is greater than 2.5 epm is not suitable for irrigation. Water that contains 1.25-2.5 epm is considered marginal, and water containing less than 1.25 epm i'1 probably safe.
BORON
Boron is present in nearly all natural water in amounts that range fron1 less than 1 to several parts per million. In small am':lunts it is essential to plant growth, but it is toxic at concentrations slightly higher than the optimum. Scofield (1935) has proposed limits for boron depending on the sensitivity of the crops to be irrigated.
WATER FOR DOMESTIC USE
The concentration lin1its of some chmnical substances in drinking water used on interstate carriers and for public supplies in general, as specified by the U.S. Public Health Service, follow:
Oonstit1Unt .1\-faximttm concentration (ppm) Iron and manganese (sum) _ _ _ _ _ _ _ _ _ _ _ _ _ _ 0. 3 Magnemum ____________________________ 125
8uUate-------------------------------- 250 Chloride _______________________________ 250 Fluoride_______________________________ 1. 5 Dissolved solids _________________________ 500 (1,000 permitted)
It should not be assumed, however, that all water containing dissolved mineral matter in concentrations exceeding these limits is

CHEMICAL QUALITY OF THE GROUND WATER 31
necessarily harmful. Rather, the limits should be used only as a guide in determining the suitability of water for human consumption.
Another factor for consideration is the hardne.ss. Hard water requires a large quantity of soap to produce suds, although this r .. oblen1 has been largely eliminated through the use of synthetic detergents; furth-er, hard water contributes to the formation of scale ir water heaters, radiators, and·pipes.
Hardness is caused almost entirely by the presence of calciwn and magnesium. Iron, 1nanganese, alun1inum, some other Jnetallic cations, and free acid also cause hardness, but generally they are not present in sufficient quantities to be objectionable. Altho11gh no rigid limits have been set as to what constitutes hard water, any water that has a hardness of 60 pp1n or less is generally consider,~d soft. Water that has a hardp.ess ranging frmn 61 to 200 ppm can be considered moderately hard to hard, and water having a hardness greater than 200 pp1n is considered very hard. Water having a harcness of more than 200 ppn1 is generally too hard for many purpos~s and therefore norn1ally is softened.
CLASSIFICATION AND INTERPRETATION OF ANALYSES
The chmnical analyses a.nd other significant characteristics <'f water from 4 wells and 2 springs are given in table 1.
WATER FOR IRRIGATION
As stated previously, consideration should be given first to the salinity and soclimn (alkali) hazards in appraising water for irrigatio~. Accordingly, in figure 5 the salinity and alkali hazards of all the waters that were analyzed are plotted on a diagram proposed by Wilcox for the elassification of irrigation water. As shown, tnost of the water is ~n class C2-Sl; that fron1 the Crescent Valley Hot Springs, 29/48-lCl, and fron1 well29/48-34Cl nre in class C3-S2. On the basis of salinity and sodiun1 hazards alone, then, all the water, exeept the water fron1 these two sources, can be safely used to irrigate most crops.
Water fron1 'veil 29/48-34Cl also contains 1.5 epm of residual sodimn earbonate and must therefore be considered marginal on that basis. Tbe high residual sodiun1 carbonate (9.9 ep1n) of the sample from the Crescent Valley Hot Springs, 29/48-101, is beyond the lilnit considered safe for irrigation. All the other samples analyzed are within safe limits Virith respect to residual sodium carbonate. The low boron content of all the samples is within the limits propC)scd by Scofield (193.5) for sensitive corps.
WATER FOR DOMESTIC USE
With the exception of the water from the Creseent Valley Hot Springs, all the waters that were analyzed are suitable for c0n1estic

32 GROUND-WATER POTENTIALITIES IN CRESCENT VALLmY, NEV.
use. However, all are Inoderately hard to hard, and it may therefore be desirable to soften some of the harder waters for certfl jn domestic uses.
The concentration of fluoride in the water from the Crescent Valley Hot Springs is much in excess of the mandatory limit of 1.5 ppm set by the U.S. Public Health Service for interstate carriers. The continual use of this water by young children during the forn1ation of their permanent teeth undoubtedly would result in mottling of the enamel (Dean, 1936). Mottling becomes more noticeable as the fluoride content exceeds 1.5 ppm.
LOCAL VARIATIONS IN THE CHEMICAL QUALITY OF GROUND WATER
All ground water carries 1ninerals in solution. A small part of the dissolved Ininerals is present originally in the rain and snow from which the ground water is derived, but most of the mineral matter is dissolved fron1 the rocks with which the water comes irto contac-t. The longer water is in contact with the rocks the more higHy nlineralized it becon1es, so that ordinarily the concentration of dissolved solids increases with increasing distance from the recharge area. In addition, the opportunity for solvent action is increased in fine-grained rocks having a high porosity, because the surface area of tl·o, rock that is e:xposed to the water is very large.
From these general principles and fron1 the results of the chemical analyses, it is possible to make son1e staten1ents concerning the quality of ground water in the valley. A study of the analyses indicates a marked increase in the concentration of dissolved solids no,ar the axis of the valley. For example, wells 29/48-3B1 and 29/48-3401 yield waters that contain respectively 448 and 638 ppn1 of dissolved solids. "\Vater from wells 29/48-5A1 and 28/48-9B1, which are closer to the recharge area, contain only 276 and 298 ppm of dissolved solids. It is inferred that the increase in dissolved solids with increa:::ed distanee from the recharge area is due to the solution of the clastic rock particles and evaporites of the valley fill by ground water percolating through them. It is probably safe to generalize that the ground water in and near the axis of the valley, or in the area shown on plate 1 as the saltgrass area, is more highly mineralized than ground water nearer the areas of recharge. It is more difficult, however, to predict the chemical composition of the dissolved solids.
On the basis of one analysis, that of the sample from spring 31/48-36B1, it is thought that the hardness of the water in tl·o, northern part of the valley probably is less than that in the central part of the valley. In the discussion of the geology of the mount~in ranges, it was stated that the mountains flanking the northwestern part of

DEVELOPMENT OF GROUND WATER 33
the valley are composed largely of volcanic rocks, whereas the mountains bordering the central part of the valley contain much lim~stone. Inasmuch as the chemical composition of the ground water is related to the chemical composition of the rocks from which the valley fill was derived, it may tentatively be assumed that ground water from the valley fill north of T. 29 N. contains proportionally less calcium and magnesium and more sodium than does the ground water farther south.
The amount of boron is low in all the samples that were analyzed, and it seems reasonable to assume that, as the samples were obtained from the central and northwestern parts of the valley, high concentrations of boron will not pose a problem in those areas.
DEVELOPMENT OF GROUND WATER
Small perennial streams rising in the mountains have been utilized for domestic supply, for mining and milling activities of the p2.st, and for irrigation, but the ultimate development of the valley will be based largely on its supply of ground water.
PRESENT DEVELOPMENT
About 2,300 acre-feet of ground water is presently being pumped from 6 irrigation wells and 2 industrial wells. Of the 8 wells, 7 are in the west-central part of the valley; the 8th is in the eastern part. All the wells obtain water from the unconsolidated sedimentf' of the valley fill. A few other wells have been drilled for irrigation but to date they have not been used for that purpose. In addition, several stock wells and a few domestic wells have been drilled or dug in the valley. All the known wells are shown on plate 1.
The two industrial wells, 28/47-33Al and -33A2, supply water for n1illing and domestic purposes at the Gold Acres mining cormnunity. Each well is 12 inches in diameter and 250 feet deep. T!-:-.ey are pun1ped throughout the year, either singly or together, and in 1956 yielded 500 ac.re-feet of water, according to data in the filer of the Office of the State Engineer. The water is pumped more than 3 n1iles throug·h a pipeline to Gold Acres.
The two irrigation wells at the Dean Ranch are at or near the toe of the Indian Creek fan. Well 28/48-18A1, which is betwf~en 300 and 350 feet deep, penetrates aquifers that have a transmissibility of about 60,000 gpd per foot. The specific capacity of the well is not kno"'rn but is estimated, on the basis of the transmissibirty, the type of well construc.tion, and an assumed coefficient of stC'~age of a few hundredths, to be between 20 and 30 gpm per foot of drawdown. No data relative to the transmissibility or specific capacity ar~ available for the other well, 28/48-17Bl, which is only 190 feet deep. Each

34 GROUND-WATER POTENTIALITIES IN CRESCENT VALLEY, NEV.
well is pumped at a rate of 1,000 gpm or more for a few weeks to 2 months or longer each year and is used to supplement surface water diverted from Indian Creek. Water from both surface and underground sources is used to irrigate 240 acres. Feed for cattle is the only crop raised at the ranch.
In 1956 an irrigation well, 29/49-3402, was drilled at the Dewey Dann Ranch in the northeastern part of the valley. The well is 228 feet deep and taps aquifers that have an average transmissibility of about 30,000 gpd per foot. Its specific capacity is about 13 gpm per foot of drawdown. At the beginning of the 1957 irrigation season, the well was pumped at the rate of about 1 cfs (cubic foot per second; about 450 gpm), but in 1956 it reportedly was pumped at the rate of 1,000 gpm for a period of 2 months.
Farming is presently carried on in the west-central part of the valley, where several irrigation wells are in use. Aquifer te~ts made at wells 30/48-2701 and -3301 indicate transmissibilities o~ 6,500 and 37,000 gpd per foot, respectively, for the aquifers penetrated by these wells. In August 1953, after 6 hours of pumping, the measured discharge from the latter well was 665 gpm and the pumping lift 122 feet, indicating a specific capacity of about 10 gpm per foot of drawdown. Well 30/48-2701 has a specific capacity of only 5 gpm per foot of drawdown. Both wells were drilled in 1952-well 30/48--3301 to a depth of 300 feet, and well 30/48-2701 to a depth of 352 feet. The number of acres irrigated by the two wells is not known but is estiInated to be between 200 and 300.
Well 29/48-2901 was drilled to a depth of 276 feet in 1953. Data ftu·nished by Mr. Arnold of Beowawe indicate that the specific capacity of the well is less than 10gpm per foot of drawdown. Water is pumped from the well at a rate of about 500 gpm into a reservoir, from which it is pumped into a sprinkler system, and irrigates 170 acres. In 1956 well 29/48-2902 was drilled to a depth of 300 feet, a quarter of a mile north of well 29/48-2901. Reports by the driller indicate that the specific capacity of the well may be as high as 40 gpm per foot of drawdown.
Relatively insignificant quantities of water are withcrawn frorn stock and domestic wells in the valley. In at least 6 wellf\. the water is under sufficient pressure to flow at the land surface. All the flowing wells are on the valley floor beyond the toes of the alluvial fans, and all but one are on the Dean Ranch in the central part of the valley. None has a large yield, their specific capacities ranging from 5 to less than 1 gpn1 per foot of drawdown.

DEVELOPMENT OF GROUND WATER 35
POTENTIAL DEVELOPMENT
Water can be pumped from the ground-water reservoir without causing a persistent decline in water levels only to the extent that an equal amount of water can be salvaged from natural discharge. Inasnluch as nearly all the natural discharge takes place by evapotranspiration from the phreatophyte areas, salvaging all the ground water for beneficial use would entail lowering the water table to a level below the root zone of the phreatophytes-possibly n1ore than 50 feet below the land surface.
At present, all the large producing wells are located at tLe periphery of the phreatophyte area, and any future large producers probably will be located there also. Pumping from wells in these areas might appear to intercept the water n1oving toward the areas of natural discharge on the floor of the valley, but pumping will not reduce that discharge until it has caused a significant lowering of the water table under the floor of the valley. This would require a far greater lowering of the water table--that is, a reduction in storage-in the area of pumping. In other words, before there can be salvage for beneficial use of the water now discharged by phreatophytes, there must be some depletion of the water that is stored in the groundwater reservoir.
illtimately, the lowering of water levels by pumping fron1 storage should result in a reduction of natural discharge; and theoretically, by continued pumping for a period of years it should be possible to stop all natural discharge. Annual withdrawals of ground water equal in amount to the annual recharge could then be made without a further continuing decline of ground-water levels. However, the degree to which such "mining" can be carried out is limited b~7 both economic and hydrologic considerations. To withdraw water fron1 wells in the more favorable areas of the valley (see fig. 6) until all natural discharge is stopped may necessitate lowering ground-water levels in those areas a hundred feet or more. Pumping costs n1ay become prohibitive before such a lowering can be effected, in view of the fact that crops normally grown in this part of the State 1'(\.ve a relatively low market value. Also, some water must be allovred to discharge naturally in order to maintain u salt balance"-that is, to carry off the salt deposited as a result of evaporation of the water, and thus prevent the salt content of the water from rising toe high.
If future exploration for ground water indicates that large quantities can be withdrawn also from the axial part of the vall€.y and from other areas now believed to be unfavorable for development, the quantity of water that can feasibly be developed may be eonsid-

36 GROUND-WATER POTENTIALITIES L.~ CRESCENT VALLEY, NEV.
T 31 N
T 30 N
T. 29 N.
T. 28 N.
T. 27 N.
T. 26 N.
R 46 E R 47 E R. 48 E R 49 E R 50 E R 51 E
.. Area in which wells may yield 1001' gpm or rnor•
~ Area in which wells maY yield se•reral hundred
to 1000 gpm
~~ Doubtful area, but wells may yield several
hundred gallons per minute
10 MILES
FIGURE 6.-Map showing areas of prospective development of gronnd water for irrigrtion or other large-scale uses.
erably greater than if large producing wells are confined tC' the favorable areas shown in figure 6.
It should be noted that, as the underflow frmn the Crescent Valley to the Hmnboldt River is probably very s1nall and as some outflow must continue if salt balance is to be 1naintained, deve~op1nent of the ground-water resources of the Crescent Valley will have no significant effect on the flow of the river.
AREAS SUITABLE FOR DEVELOPMENT
The suitability of an area for the development of ground water can be evaluated on the basis of (a) the quantity of ground wr.ter locally available; (b) the physical characteristics of the aquifer, ir this area; (c) the chmnical quality of the water, and the possibility that the

DEVELOPMENT OF GROUND WATER 37
quality may deteriorate after prolonged pumping; and (d) miscellaneous factors such as topography, depth to water, and type of soil.
QUANTITY OF GROUND WATER AVAILABLE LOCALLY
The total recharge to the valley is derived in varying amounts from different parts of the adjoining mountain areas. Generally, the larger and topographically higher watersheds in the mountains contribute the n1ost runoff and consequently the most recharge. Thus the large watershed drained by Indian Creek may contribute as much as one-fourth of the total recharge to the Crescent Valley, whereas the low hills of the Malpais contribute only a very small part.
Probably about one-third of the total recharge originates in the Cortez Mountains. Some watersheds in the Cortez Mountairs contribute considerably more recharge than others. The r;lative amount contributed by each is indicated by the streamflow c1ata in table 2, if the assumption is made that the recharge contributed by each stream is directly proportional to the volume of the streamflow. Although it is known that this assumption is not exactly true, owing to many variables, still it is useful as a guide in estimating the amount of recharge that is effected locally. The data in table 2 indicate that the major part of the recharge from the Cortez Mountains is derived from Duff and Frenchie Creeks and the stream in Mill Canyon.
TABLE 2.-Flow measurements of streams on the west side of the Cortez Mountains
Name of stream Date of Flow Remarks measurement (cfs)
~ill Canyon ___________________ 6- 9-48 2. 2 Fourrrrile Creek ________________ 6- 9-48 . 2 ~easured at m0uth of
canyon. Brock Canyon _________________ 6- 9-48 .7 Cottonwood Creek __ --------- __ 6- 9-48 . 6 Measured near toe of al-
luvial fan. Little Cottonwood Creek ________ 6- 9-48 . 3 Measured on alluvial fan. Hand-me-down Creek ___________ 6-lQ-48 . 8 J)uff Creek ____________________ 6-lQ-48 6. 9 ~easured at m"uth of
Sod House Creek _______________ canyon.
6-lQ-48 .8 Frenchie Creek ________________ 6-lQ-48 3.4
PHYSICAL CHARACTERISTICS OF THE ALLUVIUM
Insofar as the water-yielding properties of the saturated alluvium are concerned, its most important characteristics are the degree of sorting, the porosity, and the average grain size. A high degree of sorting increases the porosity of the alluvium, but a high porosity does not of itself deter1nine the quantity of water that a sr.turated
581735--,61-4

38 GROUND-WATER POTENTIALITIES IN CRESCENT VALfJEY, NEV.
deposit will yield to wells. A material may be highly p<:lrous, but if the average size of the mineral grains is small it will yield little water to wells. The yield of a sediment is reduced to the extert that water adheres to the walls of the mineral grains by molecular attraction. Because the total surface area of the component fragments of a finegrained sediment is greater than that of an equal volmne of coarse material, the quantity of water that is retained by moleculS\r attraction in the finer grained sediment is also greater.
The physical characteristics of the alluvium were discussed in the section on geologic formations. It was stated there that the alluvium becomes progressively finer grained toward the axis of the valley. Few data are available concerning the sorting of the alluvium in the Crescent Valley, but it is probable that the degree of sor~ing and the porosity of the alluvium that was deposited by perennial streams are greater than those of the deposits of intermittent streams. Therefore, the most favorable well sites probably are on the larger Blluvial fans, which normally are those traversed by perennial streams or by the larger intermittent streams. Ordinarily, the site should be selected o~ the lower part of the alluvial fan, as the alluvium nE,ar the apex may contain boulders several feet or more in diameter. Also, the depth to the permanent water body near the apex of the fan will usually be great and often may be excessive.
CHEMICAL QUALITY OF THE WATER
As previously stated, ground water becomes more highly mineralized with distance from the recharge area. This genE,ral relation between the amount of mineralization and distance from the recharge area should be considered in selecting a site for a well. Ordinarily ground water in the aquifers that underlie the alluvial fans is suitable for irrigation and industrial use, whereas water in the aouifers near the axis of the valley may contain dissolved minerals in ol~:~ctionable quantities.
The chemical quality of water pumped from a well will deteriorate if the withdrawals are sufficient to divert water of poor chemical quality to the well. Therefore, water pumped from wells near the axis of the valley may deteriorate somewhat in chemical quality if the pumping is sufficient to reverse the normal gradient and thus drvert water from the axis of the valley, and especially from the playa areas, to the wells.
OTHER FACTORS
Other factors, such as the depth to water, also govern the choice of a well site. Although the piezometric surface slopes downward toward the axis of the valley, its gradient usually is consic1,'3rably less than that of the land surface. Consequently, the depth to water is

DEVELOPMENT OF GROUND WATER 39
usually greater at the higher elevations and may be several hundred feet near the bedrock-alluvium contact. Locally, however, the ground water may occur under perched water-table conditions, and there the depth to water may be considerably less than expected, though the quantity of ground water would probably be small.
The choice of a site for an irrigation well is affected also by the type of soil. No data on soil types in the Crescent Valley are aTrailable, but it is apparent that much of the area that correspondr to the saltgrass area is now unsuitable for agriculture because of the presence in the soil of large quantities of soluble salts.
SUMMARY
The selection of favorable areas for the development ot ground water for irrigation in the Crescent Valley is based on the factors just discussed and on the known characteristics of existing wells in the valley. The most promising area for the development of ground water on the west side of the valley extends from the southern limit of the Indian Creek fan northward to Corral Canyon. (See fig. 6.) With proper construction, most wells drilled in the lower par~s of the alluvial fans in this area to depths of several hundred feet will be capable of yielding several hundred to more than 1,000 gpm with a reasonable lift. This area, and particularly the lower sectio"'l of the Indian Creek fan, appears to be the most favorable in the valley.
It is more difficult to evaluate the aquifers on the east side of the valley. Perhaps quantities of ground water on the order of several hundred acre-feet can be pumped annually from each of the alluvial fans traversed by the larger streams, such as Duff and Frenchie Creeks and the stream in Mill Canyon. The yields of well~ on the east side of the valley probably will be less than those in the more favorable areas on the west side of the valley.
A small area on a fan at the foot of the Malpais has been de,ignated as doubtful, but wells there ·may yield a few hundred gallons per minute. The fan is the only large one below the Mal pais and may contain alluvium of sufficient permeability to carry a moderately large quantity of water.

TABLE 3.-Record of wells in the Crescent Valley, Eureka and Lander Counties, Nev. t+:-. 0
[Type of well: B, bored; Dg, dug; Dr, drilled; J, jetted. Use of water: D, domestic; Ind, industrial; Irr, irrigation; N, none; 0, observation; S, stock. Asterisk (*) indicates reported J ~ =:tt
Measuring point I Pressure head or 0 water level ~
Well No. and I I Typo of I Dmm-~ I Tern- t:l location Owner well and (inches Depth Above Use per a- Remarks I
(pl. 1) year at land (feet) Alti- ~+)or Above(+) or ture ~ completed surface) tude elow Description below(-) Date (oF) (feet) (-)land measuring 1-3
surface point (feet) l'I:J (feet) =:tt
------ --- "'d 27/47-8CL ____ Unknown _________ Dg ________ 144 45 Dry ___________ N -------- 0
--4;846" ----+ii~5- -i'<>i>orcasiilg_-_:::: ··g:2i:.54" 1-3 17BL ••• Ed Filippini__ ____ Dr ________ 8 103 -70.17 ________ N -------- l'I:J 28/47-22DL _ -- Mill Gulch Placer Dr, 1934? .. 12 *300 4,838 0 Hole in pump -71.13 ________ 6- 9-48 N -------- .z Mining Co. base. 1-3 27AL ••• Scott Placer Co ___ Dr-------- 8 87 -------- -:Land surraca:::::: Dry ___________ ---------- N -------- 1-4
33AL ••. London Exten- Dr, 1941. .• 12 250 0 -90 to -95* ___ Ind, D Gravel-packed; water re- § sion Mining Co. ported "very hard;"
33A2 ••••• L •..• do_____________ Dr, 1950 ••. log.
12 250 --------- +2.1 Top of casing ______ -95.48 (see 8- 6-53 Ind, D -------- Well-33A1, 100ft away, remarks). being pumped at 240 l'I:J
gpm when water level Ul
35CL ••• Frances McCoy ___ N measured; log. z Dr, 1956 ... 14 200 -------- ---------- -------------------- ---------------- ---------- -------- To be used for irrigation; log.
@ 36DL .•• Dan FilippinL ____ Dr ________ 6 134 4, 768 +.8 Top of casing ______ -7.02 _________ 8-18-54 N --------28/48-SDL •••. _____ do _____________ Dr, 1949 •.• 4 151 -------------------- ---------------- N Reported flowing 15 gpm.
Destroyed; log. l'I:J 9BL ••.. ____ .do _____________ Dr ________ 4 *129 4, 737 +.8 Top of bushing •••• +5.66 _________ 9-22-54 s 54 Flow 15 gpm. Analysis. Ul llDL ••• _____ do _____________
Dr-------- 6 -------- -------- +I.O Top of l-in. pipe._ +La __________ 9-22-54 s 56 Flow 1-2 gpm. ~ 14BL •••• _____ do _____________ Dr ________
6 -------- 4, 740 +2.0 Top of concrete ---------------- s Flow 3 gpm from outlet .z block. 2.5 ft above land sur- 8 face. 14DL ••• _____ do _______ ------ Dr, 1949 .•. 16 180 4, 750 0 Land surface, -12.6 _________ 8-19-54 N -------- Log. ~ south side. 15CL ••. _____ do _____ ---·---- Dr, 1956 ••. 4 89 -------- 0 Land surface ______ +7* ----------- 12-21-56 s -------- Flows 15 gpm; log. t"' 16BL ••• _____ do .•••• ________ Dr, 1949 .•. 4 108 ___ .., __ -------------- ----- __ ... __ -- ---- N Reported flowing 20 gpm. t"'
Destroved; log. l'I:J 17:31__ ___ _____ do _____________ Dr, 1949 .•. 16 190 4, 764 +.3 Base of pump at -18.12 ________ 7-29-54 Irr 63 Pumped at 1,000 gpm; ...~ 18A1 _____ _____ do _____________ airline opening. log. z Dr-------- 12 •aoo- 4, 783 +2.0 Plug hole in top -38.52 ________ 11- 3-54 Irr 56~ Pumped at 1,000 gpm.
350 of discharge pipe. l'I:J 19DL •.• _____ do _____________
Dr-------- 4 158 4, 754 +.8 Top of casing +0.50--------- 11- 3-54 s 54 Flow less than 1 gpm. :=: collar. 27DL ••• _____ do _____________ Dr ________ 4 144 4, 739 +.6 Top of 4-in. casing. +3.04. -------- 8-11-48 s 54 Do.
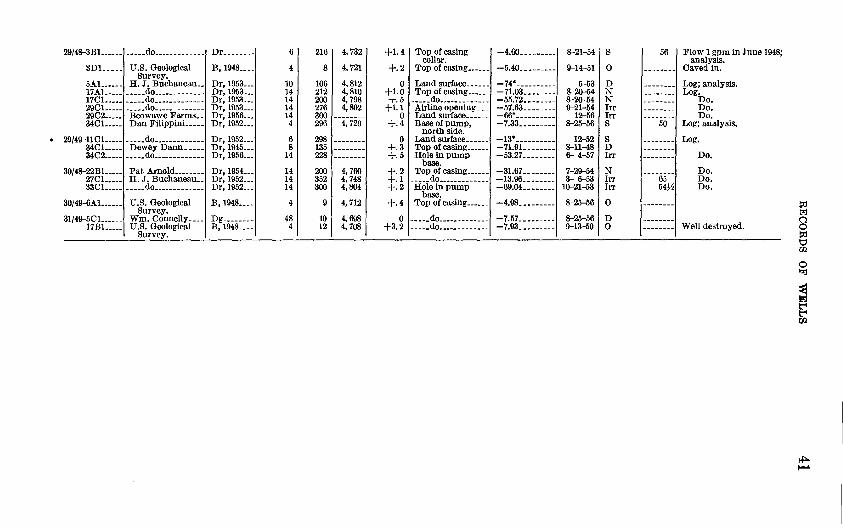
29/48-3BL ••.. _____ do_____________ Dr-------- 6 216 4, 732 +1.4 Top of casing collar. 3Dl _____ U.S. Geological B, 1948 ____ 4 8 4, 721 +.2 Top of casing ______
Survey. 5AL ••.. H. J. Buchaneau •• Dr, 1953 ___ 10 106 4,812 0 Land surface ______ 17AL-•.. _____ do _________ ---- Dr, 1953 ___ 14 212 4,810 +1.0 Top of casing ______ 17CL-••• _____ do ______ ------- Dr, 1953 ___ 14 200 4, 798 +.5 _____ do _____________ 29CL-••. _____ do _______ ------ Dr, 1953 ___ 14 276 4,802 +1.1 Airline opening ___ 29C2----- Beowawe Farms __ Dr, 1956 ___ 14 300 -------- 0 Land surface ______ 34CL •.. Dan Filippini-- ... Dr, 1952 ___ 4 296 4, 729 +.4 Base of pump,
north side. . 29/49-UCL ••• _____ do _____________ Dr, 1952 ___ 6 298 -------- 0 Land surface ______ 34CL ___ Dewey Dann _____ Dr, 1945 ___ 8 135 -------- +.3 To~ of casing ______ 34CL ••. -----do ••••• __ ------ Dr, 1956 ___ 14 228 -------- +.5 Ho einpump
base. 30/48-22BL. •.• Pat Arnold ________ Dr, 1954 ___ 14 200 4, 760 +.2 Top of casing ______
27CL ____ H. J. Buchaneau •• Dr, 1952 ___ 14 352 4, 748 +.1 _____ do _____ --------33CL ____ _____ do _____________ Dr, 1952 ___ 14 300 4,804 +.2 Hole in pump
base. 30/49-6AL _____ U.S. Geological B, 1948 ____ 4 9 4, 712 +.4 Top of casing ______ I Survey. 0 _____ do _____________ 31/49-501______ Wm. Connelly---- Dg ________ 48 10 4, 698
17BL. ___ U.S. Geological B, 1948 ____ 4 12 4, 708 +3.2 _____ do _____________ Survey.
-4.60 _________ 8-21-54 s -5.40.-------- 9-14-51 0
-74* ---------- 5-53 D -71.03 ________ 8-20-54 N -55.72 ________ 8-2Q-54 N -57.63 ________ 9-21-54 Irr -66* ---------- 12-56 lrr -7.33 _________ 8-25-56 s -13* -------·-· 12-52 s -71.91_ _______ 8-11-48 D -53.27 ________ 6- 4-57 Irr -31.67_ _______ 7-29-54 N -13.96.------- 3- 6-53 Irr -69.04 ________ 1Q-21-53 Irr -4.98 _________ 8-25-56 0 -7.57 _________ 8-25-56 D -7.93 _________ 9-13-50 0
56
---------------------------------
50
------------------------
----65--54~{!
----------------
Flow 1 gpm in June 1948; analysis.
Caved in.
Log; analysis. Log.
Do. Do. Do.
Log; analysis.
Log.
Do.
Do. Do. Do.
Well destroyed.
t:C t;j Q 0 ::tl t:;j Ul
0 lo.:l;l
~ t"4 t"4 rJl
J-!::o. ......

42 GROUND-WATER POTENTIALITIES IN CRESCENT VALLE;:, NEV.
TABLE 4.-Water-level rneasurernents in wells in the Crescent Valley, Eureka and Lander Counties, Nev.
27/47-17B1
Ed Filippini. Drilled, unused well, diam Sin, depth 103ft. Measuring point, top of cas:'ng, 0.5 ft above land surface. Water levrls, in feet below measuring point: Aug. 12, 1948, 70.09; Sept. 21. 1954, 70.17.
28/47-3601
Dan Filippini. Drilled, unused well, diam 6 in, depth 134ft. Measuring point, top of casing, 0.8 ft above land surface. Water levels, in feet bl:'low measuring point: July 8, 1948, 5.76; Aug.ll, 194f, 5.89; Aug, 18, 1954, 7.02.
28/48-9B1
Dan Filippini. Drilled stock well, diam 4 in, reported depth 129ft. Measuring point, top of bushing, 0.8 ft above land surface. Water levels, in feet above measuring point: Aug. 11, 1948, 7.02; Sept. 22, 1954, 5.66.
28/48-19Dl
Dan Filippini. Drilled stock well, diam 4 in, depth 158ft. Measuring point, top of castng collar, 0.8 ft above land surface. Water levels, in feet above measuring point: Aug. 11, 1948, 0.95; NoY. 3, 1954, 0.50.
29/48-3D1
U.S. Geological Survey. Bored observation well, diam 4 in, depth 8ft. Measuring poin<;, top of casing 0.2 Ct above land surface. Water levels, in feet below measuring point, 1948-51.
Date Water Date level
Aug. 12, 1948 5.85 July 21 Oct. 26 4.44 Sept. 7 Mar. 15, 1949 3.84
29/48-2901
Water Date level
5.15 Mar. 20, 1950 6.00 Sept. 14, 1951
Water level
4. 64 0 5.4
H. J. Bucbaneau. Drilled irrigation well, diam 14 in to 207ft, 12 in to 276ft. Measurins point, airline opening, 1.1 ft above land surface. Water levels, in feet below measuring point: Aug. 6, 1953, 56.45; Oct. 21, 1953, 57.14; Sept. 21, 1954, 57.63.
29/48-3401
Dan Filippini. Drilled stock well, diam 6 in, depth 296ft. Measuring point, base of punp, north side, 0.4 ft above land surface. Water levels, in feet below measuring point, 1948-56.
Date Water Date level
July 9, 1948 6. 74 Sept. 7 Aug.ll 7.37 Mar. 20, 1950 Oct. 26 7.87 Sept. 13 Mar. 15, 1949 6.48 Mar. 29, 1951 July 21 7.07 Sept. 14
-
29/49-3401
Water Date level
7.68 Sept. 29, 1952 7. 79 Sept. 21, 1954 8.10 Mar. 10, 1955 7.58 Sept. 20 7.55 Aug. 25, 1956
Water level
7.4 8
7 3 3
8.01 7.0 8.3 7.3
Dewey Dann. Drilled domestic well, diam 8 in, depth 135ft. Measuring point, top of casing, 0.3 ft above land surface. Water levels, in feet below measuring point: June 8, 1948, 72.40; Aug. 11, 19'~. 71.91.
30/48-3301
H. J. Buchaneau. Drilled irrigation well, diam 14 in, reported depth 300ft. Measuring point, bole in pump base, 0.2 ft above land surface. Water levels, in feet below measuring point: Ma-. 6, 1953, 58.60; Oct. 21, 1953, 69.04.

RECORDS OF VVELLS 43
TABLE 4.-Water-level measurements in wells in the Crescent Valley, Eureka and Lander Counties, N ev.-Continued
30/49-6Al
U.S. Geological Survey. Bored observation well, diam 4 in, depth 9ft. Measuring point, top of casing, 0.4 ft above land surface. Water levels, in feet below measuring point, 1948-56.
Date Water Date Water Date Water level level level
Aug. 12, 1948 4.90 Mar. 20, 1950 4.18 Sept. 22, 1954 5.95 Sept. 15 5.35 Sept. 13 5.22 Mar. 10, 1955 4.58 Oct. 25 5.16 Mar. 29, 1951 3.40 Sept. 20 5.63 Mar. 15, 1949 3.01 Sept. 14 5. 21 Mar. 27, 1956 3. 66 July 21 4.57 Sept. 29, 1952 5.01 Aug. 25 4.98 Sept. 7 5. 25 Mar. 6,1953 4.30
31/49-5Cl
Wm. Connelly. Dug domestic well, diam 4ft, depth 10ft. Measuring point, top of casing, at land surface. Water levels, in feet below measuring point, 1948-56.
Date Water Date level
Aug. 10, 1948 7.31 Sept. 13 Oct. 26 7.01 Mar. 29, 1951 Mar. 15, 1949 7.54 Sept. 14 July 21 6. 77 Sept. 29, 1952 Sept. 9 7.69 Mar. 6, 1953 Mar. 20, 1950 7.43
Water Date level
7.55 Sept. 22, 1954 6.58 Mar. 10, 1955 7.60 Sept. 20 7.41 Mar. 27, 1956 7.33 Aug. 25
Water level
8.3 8.1 8.3
3 7 2 9 7
7.0 7.5
31/49-17Bl
U.S. Geological Survey. Bored observation well, diam 4 in, depth 12ft. Measuring point, top of casing, 3.2 ft above land surface. Water levels, in feet below measuring point, 1948-50.
Date Water Date Water Date Water level level level
Aug. 12, 1948 7.99 July 21 7. 72 Mar. 20, 1950 6.64 Oct. 25 7. 74 Sept. 9 8.29 Sept. 13 7.93 Mar. 15, 1949 5.60
TABLE 5.-Drillers' logs of wells in the Crescent Valley, Eureka and Lande~ Counties, Nev.
Material Thickness (feet)
(feet)
I Depth II
28/47-33A2
Material
I Thick-~ Depth ness (feet) (feet)
London Extension Mining Co. Drilled industrial and domestic well; 12-in casing to 250 ft; perforated 150 to 240ft, with ~-by 2-in slots. First water at 93ft; static level reported at 94 ft. Drilled by John Champion, Reno, Nev. Completed Oct. 19, 1950.
Topsoil and graveL _________ _ "Hardpan"-------------------Gmvel, coarse, and clay _____ _ Clay and gravel, fine ________ _ Gravel, fine; water __________ _ Clay and graveL-------------Clay-------------------------Gmvel, fine; water __________ _
Clay ____ ---------------------Gmvel, coarse; water ________ _ Olay ____ ------------------- __ Clay and graveL ____________ _
3 4
18 68 2
14 3
17 3 6 2
11
3 7
25 93 95
109 112 129 132 138 140 151
Gravel, coarse. ______________ _ Olay and gravel, fine ________ _ Gravel, coarse.--------------Olay and graveL------------Gravel, fine .••• -------------Clay and graveL------------Gravel, ~-3 in. in diameter--Olay and graveL------------GmveL ___ -------------------Clay and graveL ___________ _
6 4
10 19
4 4
23 13 9 7
157 161 171 190 194 198 221 234 243 2liO
Total depth •• __________ ---------- 2liO

44 GROUND-WATER POTENTIALITIES IN CRESCENT VALLEY, NEV.
TABLE 5.-Drillers' logs of wells in the Crescent Valley, Eureka and Lan1-er Counties, Nev.-Continued
Material
28/47-3501
Material
I Tl •.ck-1 Depth n1ss (feet) (f•*lt)
Frances McCoy. Drilled irrigation well; 14-ln casing to 200ft; perforated 55 to 182ft with~- by 3-in slots. First water reported at 55 ft. Drilled by Carruthers Drilling Service, Beowawe, Nev. Completed June 26, 1956.
SoiL ____ ---------------------GraveL ___ -------------------Clay, brown _________________ _
Clay, gray-------------------Sand; water_-----------------Streaks of clay and sand _____ _ Sand.-----------------------Clay_------------------------Sand, coarse _________________ _ Clay-------------------------Sand. __ ----------------------Clay ___ ----------------------
2 10 13 30 3
12 7 4 6
14 8 6
2 Streaks of clay and sand______ 10 125 12 Sand, hard.------------------ 9 134 25 Clay and sand streaks________ 9 143 55 Clay, silty-------------------- 24 167 58 Sand·------------------------ 3 170 70 Clay ____ --------------------- 7 177 77 Sand._----------------------- 5 182 81 Clay, sandy------------------ 13 195 87 Clay __ ----------------------- 5 200
101 ------109 Total depth.----------- ---------- 200 115
28/48-8D1 Dan Fillppinl. Drilled, unused well; 4-in casing to 151 ft; perforated 100 to 140ft with Ys- by 6-in slots.
First water reported at 11ft. Flows 15 gpm. Drilled by Louis Clarkson, Elko, Nev. Completed Mar. 5, 1949.
Clay, yellow _________________ _ Gravel; water _______________ _ Clay, blue ___________________ _ Clay, yellow------------------Sand. ___ ---------------------Clay, yellow------------------Sand._-----------------------
11 5 9
11 4
28 11
Clay, yellow------------------Sand._-----------------------Clay, yellow _________________ _ Sand.------------------------Clay, yellow------------------
29 12 9 7
15
108 120 129 136 151
11 16 25 36 40 68 79 Total depth ____________ ---------- 151
28/48-14D1 Dan Filippini. Drilled, unused well; 16-in casing to 180ft; perforated 35 to 178ft with%- by 3~-in slots.
First water at 32ft; static level reported at 15ft; depth to water 12.6 ft, Aug. 19, 1954. Drilled by Mel Meyer. Completed Sept. 21, 1949.
Topsoil ______ --------------- __ Gravel and sand--------------
g~~ef"~tei_-::~============ Clay, gray-------------------_ Clay, white __________________ _ Clay, brown _________________ _ Clay, brown, and graveL ____ _ Clay, red ____________________ _ Clay, white _________________ _ Clay, red ____________________ _ Clay, brown _________________ _
2 3
27 4 8 4
12 32 13 5 5 5
2 5
32 36 44 48 60 92
Gravel and claY-------------Clay, red, and graveL-------Sand; water_-----------------Clay ____ ----------------- ___ _ Gravel; water _____ -----------Clay, red, and graveL _______ _ Gravel; water ___ -------------Clay, red ____________________ _ Clay and graveL_------------
4 9 2
20 1
14 1 4 5
124 133 135 155 156 170 171 175 180 105
110 115 120
Total depth._---------- ---------- 180
28/48-1501 Dan Filippini. Drilled stock well; 4-in. casing to 89 ft; pertorated 59 to 84 ft with%- by 4-ln. slots. First
water at 14ft; static level reported at +7ft. Flows 15 gpm. Drilled by Louis Clarks1n, Elko, Nev. Completed Dec. 21, 1956.
Clay, yellow------------------1 Sand; water _________________ _ Clay, yellow _________________ _ Mj 34
1411 Sand-------------------------1 151 89 ~ Total depth ____________ =-== ---8-9
28/48-16Bl Dan Filippini. Drilled, unused well; 4-in. casing to 108 ft; perforated 70 to 108 ft with Ys· by 6-ln. slots.
First water at 11ft. Flows 20 gpm. Drilled by Louis Clarkson, Elko, Nev. Completed Feb. 22, 1949.
Clay, yellow _________________ _
Sand __ -----------------------Clay, blue ___________________ _ Clay, yellow, sandy _________ _
11 9 8
44
11 20 28 72
Sand ________________ --------_ 36 108
Total depth.----------- ---------- 108

RECORDS OF VVELLS 45
TABLE 5.-Drillers' logs of wells in the Crescent Valley, Eureka and Lander Counties, N ev.-Continued
Material Material
28/48-17Bl I
Thick-~ Depth ness (feet) (feet)
Dan Filippini. Drilled irrigation wall; 16-in. casing to 168 ft; uncased 168 to 190 ft; perforated 75 to 166 ft with *'" by 3~in. slots. First water at 75ft; static level reported at 15ft. Drilled by Hel Meyer, Reno, Nev. Completed Oct. 27, 1949.
:f:&~Jbaii;'-~~=::::::::::::::: Sand and graveL ____________ _
Clay_------------------------
g~t;~~!~:~~==::::::::::: Clay_------------------------Sand and clay----------------
5 7
23 12 16 12 35 10 15
5 12 35 47 63 75
GraveL----------------------Sand and graveL ____________ _
GraveL---------------------Clay, red---------------------Sand, gray, fine _____________ _
Clay_------------------------
21 12 2 4 2
14
156 168 170 174 176 190
110 120 135
Total depth ____________ ---------- 190
29/48-5Al H. J. Buchaneau. Drilled domestic well; 10-in. casing to 106ft; perforated 75 to 106ft with~- by 12-in.
slots. First water at 97ft; static level reported at 74ft. Drilled by Carruthers Drilling Servioc, Beowawe, Nev. Completed May 25, 1953.
SoiL _________________________ _
GraveL---------------------Sand, hard_-----------------Clay, sandy_-----------------Clay_------------------------Clay, sticky------------------
~~~~ ~-~-~===:::::::::::::::: Clay, sandy_-----------------
2 21
5 16
6 4 6 4
11
Sand __ -----------------------Clay, sticky------------------Sand.-------------~----------Clay, sandy_-----------------Gravel and sand; water ______ _ Clay, sandy_-----------------
5 8 4 5 6 3
80 88 92 97
103 106
2 23 28 44 50 54 60 64 75
Total depth_----------- ---------- 106
29/48-17Al H. J. Buchaneau. Drilled unused well; 14-in. casing to 212ft; perforated 72 to 212ft with l}io- by 1~in.
slots. First water at 77 ft; static level reported at 70 ft; depth to water 71.03 ft, Aug. 20, 19~-1,. Drilled by Carruthers Drilling Service, Beowawe, Nev. Completed Oct. 14, 1953.
son __ -------------------------Clay and graveL ____________ _ Cobbles_---------------------Sand, hard, and graveL _____ _ Clay, sandy_----------------Gravel and claY--------------Clay, soft ____________________ _
"Conglomerate"--------------~lay, sandy_--;;---------- __ _
Conglomerate -------------Clay, sandy_----------------"Hard shell"_----------------Sand, hard; water ___________ _ Clay, sticky _________________ _ Sand and gravel; water ______ _
2 13 5 7
12 5 4 4
17 3 2 3 9 4
14
2 15 20 27 39 44 48 52 69 72 74 77 86 90
Clay, sandy _________________ _
Gravel; water_---------------Clay, hard __________________ _ Sand; water _________________ _ Clay, sandy _________________ _
Sand, silty_-----------------Clay, sticky, graveL----------Sand, fine, hard; water ______ _ Sand, coarse; water-----------Clay, sandy _________________ _
Sand; water_----------------Clay, sticky------------------Sand and clay; water ________ _
16 2
10 1 7 a ~ 7 7 6 a li €
120 122 132 133 140 148 177 184 191 197 200 206 212
104 Total depth ____________ ---------- 212
29/48-17Cl H. J. Buchaneau. Drilled, unused well; 14-in casing to 200 ft; perforated 54 to 192ft with H- by 3~-in
slots. First water reported at 54ft; depth to water 55.72 ft; Aug. 20, 1954. Drilled by Carruthers Drilling Service, Beowawe, Nev. Completed Nov. 24, 1953.
Soil ______________ ---- ___ ---- __ Clay and graveL-------------Clay, soft ____________________ _ Clay, sandY-----------------"Conglomerate" -------------Clay, sandy-----------------Sand; water __ ----------------Clay, sandy _________________ _
Sand _____ --------------------Clay, sandy _________________ _
Sand __ -----------------------Clay, soft--------------------Sand and graveL-------------Clay, sandy _________________ _ Sand and graveL ____________ _
2 16 10 8 3
15 6 7 2
14 4 4 4
13 11
2 18 28 36 39 54 60 67 69 83 87 91 95
108 119
Clay, sticky------------------Clay, sandy _________________ _
GraveL_---------------------Clay, sandy------------------Sand, fi,ne, hard _____________ _ Sand and graveL ____________ _ Clay, sandy------------------Sand.------------------------Clay, sandy _________________ _
Sand._-----------------------Clay, sticky------------------Sand and graveL ___________ _ Clay, sticky------------------
5 g .. 7 7 t'-
15 3 5 r 'i r
1('
124 132 134 141 148 154 169 172 177 180 187 190 200
Total depth ____________ ---------- 200

46 GROUND-WATER POTENTIALITIES IN CRESCENT VALLF·Y, NEV.
TABLE 5.-Drillers' logs of wells in the Crescent Valley, Eureka and Larder Counties, N ev.-Oontinued
Material Material
29/48-2901
I T'1 ick·i Depth
rt>,ss (feet) (J'a.et)
H. J. Buchaneau. Drilled irrigation well; 14-iu casing 0 to 207ft; 12-in, 200 to 276ft; 14-in casing perforated 55 to 207ft with 78- by 3:l-§-in slot.c;; 12-in casing perforated 200 to 276 ft with 78- by 1%-in s;ots. First water at 60 ft; static level reported at 55 ft; depth to water 57.63 ft, Sept. 21, 1954. Drill ~d by Carruthers Drilling Service, Beowawe, Nev. Completed Mar. 4,1953.
Clay_------------------------Sand, fine, hard.-------------Clay and cobbles ____________ _ Clay, sandy, and graveL ____ _ "Conglomerate"-------------Gravel; water_---------------Sand, fine, hard, and clay ___ _ GraveL---------------------Clay.------------------------Sand, coarse _________________ _ Clay and sand _______________ _ Clay and graveL ____________ _ GraveL---------------------Clay.------------------------
~!~-~~~-~================== Clay_------------------------
5 20 15 17 3
12 12 8 4 4
13 12
7 2
13 8 2
5 25 40 57 60 72 84 92 96
GraveL_------------·--------Clay and cobbles ____________ _ Clay, sandy-----------------Clay, red, stickY-------------Sand, coarse _________________ _ Clay, sandy, hard ___________ _ Sand, hard __ -----------------Silt_ ______ •••• ------.• -.------Sand, coarse _________________ _
Clay, sandY------------------Sand, coarse _________________ _
Clay .. -----------------------Sand, hard_------------------Sand and clay _______________ _
3 4
20 16 6
12 5 4 7
15 3 3 9
12
160 164 184 200 206 218 223 227 234 249 252 255 264 276
100 113 125 132 134 147 155 157
Total depth ____________ ---------- 276
29/48-2902 Beowawe Farms. Drilled irrigation well; 14-in casing 0 to 242 ft and 12-in, 232 to 300 ft: perforated 66 to
300 ft with %- by 3%-in slots. First water at 67 ft; static level reported at 66 ft. Drillr.d by Carruthers Drilling Service, Beowawe, Nev. Completed Dec. 20,1956.
Soil--------------------------GraveL----------------------Sand, hard __________________ _ Sand, fine, hard _____________ _
GraveL.---------------------
~~~:~ ~~================== g~~e~~~~~:::::::::::::::::: Clay, sandy------------------Sand, hard __________________ _
Sand, silty_------------------Sand, hard; water __ ---------Clay, sandy------------------Sand, coarse _________________ _
~~:~ ~~-~====::::::::::::::: Sand_------------------------!(lay and graveL .• :-·;;·-----
Decomposed gramte -------Clay, sandy _________________ _
2 4 4 7 4 9 6 9 3 6
11 2 8 5 8 9 8 4 5 7
14
2 6
10 17 21 30 36 45 48 54 65 67 75 80 88 97
"Decomposed granite"-------Clay and graveL ____________ _
Sand __ -----------------------Clay, sticky, and sand •••••••• Sand, hard __________________ _ Clay, sticky, and graveL ••••• Clay, sandY-----------------Clay, sticky, and graveL ••••• Sand.------------------------Clay, sticky, and graveL ••••• Sand.-----------------------Clay-------------------------Sand, hard._-----------------Clay.---------------------·--Clay, sandy-----------------"Decomposed granite".------Sand, hard, and clay ________ _ Clay, sticky-----------------Clay, sandy------------------
8 24 8 8 4
16 5 9 4 7 4 3 6 6
13 15 12 4 9
143 167 175 183 187 203 208 217 221 228 232 235 241 247 260 275 287 291 300
105 109 114 121 135 Total depth ____________ ---------- 300
29/48-3401 Dan Filippini. Drilled stock well; 4-in casing to 296ft; perforated 100 to 105 ft with ~-by 5-in slots. First
water at 12ft; static level reported at 3 It; depth to water 7.33 ft, Aug. 25, 1956. Drilled by Louis Clarkson, Elko, Nev. Completed Dec. 8, 1952.
Clay, yellow------------------Sand and graveL ____________ _ Clay, light-gray. __ -----------Clay, blue ___________________ _
100 5
100 63
Sand._-----------------------Clay, gray--------------------
3 25
271 296
100 105 205 268 Total depth.----------- ---------- 296
29/49-1101 Dan Filippini. Drilled stock well; 6-in casing to 109 ft; uncased 109 to 298 ft; perforated 68 to 107 ft with ~ by 5-in slots. First water at 15 ft; static level reported at 13 ft. Drilled by Louis Clarkson, Elko, Nev. Completed Dec.13, 1952.
Clay, yellow------------------Gravel and clay; water ______ _ Sand, yellow, coarse •••••••••• Clay, sandy, yellow __ --------
15 27 68
180
15 42
110 290
Sand and graveL------------ 8 298
Total depth ____________ ---------- 298

RECORDS OF WELLS 47 TABLE 5.-Drillers' logs of wells in the Crescent Valley, Eureka and Lander Counties,
N ev.-Oontinued
Material
I Thick-~ Depth II ness (feet) (feet)
29/49-3402
Material
I Thick-~ Depth
ness (feet) (feet)
Dewey Dann. Drilled irrigation well; 14-in casing to 228 ft; perforated 55 to 218 ft with ~- by 3-in slots. First water at 55ft; depth to water 53.27 ft, June 4, 1957. Drilled by Carruthers Drilling Service, Beowawe, Nev. Completed May 30, 1956.
SoiL _____ ----________________ _
GraveL----------------------Clay-------------------------Clay, sandy-----------------Sand, coarse; water-----------Clay, sticky _________________ _
Clay-------------------------Sand. ___ ---------------------Clay, sandy _________________ _
Sand._-----------------------Clay, sandy _________________ _ "Hard fine material"---------
8~~; ~~~=::::::::::::::::: Sand, hard __________________ _
6 6
33 13 12 8 8 3 6 3
16 11 7 4 6
6 12 45 58 70 78 86 89 95 98
Clay, silty-------------------"Decomposed granite" __ -----Clay, sandy------------------Sand, fine, hard _____________ _ Sand, coarse _________________ _ Clay, sandy_----------------"Decomposed granite"------Sand, silty_-----------------"Decomposed granite"-------Clay_------------------------Clay, sandy-----------------"Decomposed granite"_-----Clay, sandy_-----------------
5 3
12 5 4 4 2 3 8
14 12 4
10
147 150 162 167 171 175 177 180 188 202 214 218 228
114 125 132 136 142 Total depth._---------- ---------- 228
30/48-22Bl Pat Arnold. Drilled unused well; 14-in casing to 200ft; perforated 15 to 200ft with ~6- by H~-in slots.
First water at 59ft; depth to water 31.67 ft, July 29, 1954. Drilled by Carruthers Drilling Service, Beowawe, Nev. Completed May 2:7,1954.
Soil __________________________ _ Clay and graveL ____________ _ Clay_------------------------Sand; water_-----------------Clay-------------------------Sand; water __ ---------------Gravel; water_--------------Clay, sandy------------------
~~~-~~1~~:::::::::::::::::: Clay, sandy _________________ _ Sand, fine, hard _____________ _
2 8
49 2 3 8 8
15 3 2 8 5
2 Clay_------------------------ 17 130 10 Clay and graveL_____________ 12 142 59 Clay, sandy, soft_____________ 8 150 61 Clay ___ ---------------------- 14 164 64 Sand, hard___________________ 6 170 72 Clay, sandy, and graveL_____ 7 177 80 Clay, sandy------------------ 10 187 95 Sand, hard------------------- 3 190 98 Clay and graveL_____________ 10 200
100 ------108 Total depth ____________ ---------- 200 113
30/48-2701 H. J. Buchaneau. Drilled irrigation well; 14-in casing to 352ft; perforated 30 to 340ft with ~-by 3~-in
slots. First water at 30ft; static level reported at 13ft; depth to water 13.96 ft, Mar. 6, 19.5.~. Drilled by Carruthers Drilling Service, Beowawe, Nev. Completed Oct. 7, 1952.
Soil ___________________________ 3 3 Clay and streaks of sand ______ 17 257 Clay, sandy, and graveL _____ 15 18 Sand, fine, hard-------------- 5 262 Clay------------------------- 12 30 GraveL._-------------------- 5 267 Sand and gravel, coarse; water_ 3 33 Sand._----------------------- 23 290 Clay, sandy------------------ 25 58 GraveL __ -------------------- 2 292 Clay, gray ____________________ 20 78 Clay, sandy------------------ 15 307 Clay, red, and graveL ________ 13 91 Sand._----------------------- 5 312 "Conglomerate"-------------- 2 93 Clay, sandy_----------------- 17 329 Gravel; water_--------------- 5 98 Sand. _____________ ----- ______ 4 333 Clay, sandy------------------ 2 100 Clay--_---------------------- 3 336 Clay and graveL _____________ 103 203 Sand. _____ ---------__________ 3 339 Sand and graveL------------- 5 208 Clay, sticky------------------ 13 352 Clay and ~veL------------- 20 228 ------Clay, san y ------------------ 12 240 Total depth ____________ ---------- 352

48 GROUND-WATER POTENTIALITIES IN CRESCENT VALLEY, NEV.
TABLE 5.-Drillers' logs of wells in the Crescent Valley, Eureka and Lc.nder Counties, Nev. -Continued
Material
I Thick-~ ness (feet) ~~II Material I Thick-~ Depth
ness (feet) (feet)
30/48-33C1 H. J. Buchaneau. Drilled irrigation well; 14-in casing to 300 rt; perforated 70 to 295ft with ~8- by 2~8-in
slots. First water at 67ft; depth to water 69.04 ft, Oct. 21, 1953. Drilled by Carruthe·s Drilling Service, Beowawe, Nev. Completed Apr. 25, 1952.
SoiL ______ ------______________ 1 1 GraveL ___ ------------------- 4 164 GraveL __ -------------------- 1 2 Cobbles and clay, sandy------ 24 188 Clay- •• ---------------------- 2 4 Sand, hard; water ____________ 16 204 Clay and cobbles _____________ 26 30 Sand and claY---------------- 28 232 Sand, hard.------------------ 2 32 Gravel; water ____ ------------ 3 235 Clay and cobbles _____________ 16 48 Clay, sticky __________________ 2 237 Clay, sandy, and graveL _____ 12 60 Sand, hard, and gravel; water. 16 253 Clay ______ ------------------_ 7 67 Clay, sandy------------------ 7 260 Gravel and sand; water------- 11 78 GraveL ___ ------------------- 3 263 Clay ____ --------------------- 6 84 Clay, sticky __________________ 11 274 Clay, sandy __________________ 12 96 Sand and gravel; water _______ 6 280 Clay, sticky------------------ 8 104 Clay, sandy------------------ 7 287 Sand and gravel; water _______ 8 112 Sand, hard.------------------ 8 295 Sand and streaks of clay------ 34 146 Clay, sticky------------------ 5 300 Gravel; water ___ ------------- 4 150 ------Clay, sandy------------------ 10 160 Total depth.----------- ---------- 300
REFERENCES CITED
Dean, H. T., 1936, Chronic endemic dental fluorosis: Am. Med. Assoc. Jour., v 107, p. 1269-1272.
Emmons, W. H., 1910, A reconnaissance of some mining camps in Elko, Lander, and Eureka Counties, Nevada: U.S. Geol. Survey Bull. 408. 1ZO p.
Fredericks, J. C., and Loeltz, 0. J., 1947, Ground water in the vicinity of Elko, Nevada, in Contributions to the hydrology of eastern Nevada: Nevada Water Resources Bull. 12, p. 37-63. [1951]
Hardman, George, 1936, Nevada precipitation and acreages of land by rainfall zones: Nevada Univ. Agr. Expt. Sta. mimeo. rept. and map, 10 p.
King, Clarence, 1876, Atlas: U.S. Geol. Explor. 40th Parallel, 6 p. Lincoln, F. C., 1923, Mining districts and mineral resources of Nevada: Reno,
Nev., Nevada Newsletter Pub. Co, 295 p. Loeltz, 0. J., Phoenix, D. A., and Robinson, T. W., 1949, Ground YTater in Para
dise Valley, Humboldt County, Nevada: Nevada Water Resources Bull. 10, 61 p.
Robinson, T. W., Loeltz, 0. J., and Phoenix, D. A., 1948, Ground Vl·ater in Grass Valley and adjacent portions of the Humboldt River Valley, Pershing and Humboldt Counties, Nevada: U.S. Geol. Survey open-file rept.
Scofield, C. S., 1935, The salinity of irrigation water: Smithsonian Inst. Ann. Rept., p. 275-287.
Sharp, R. P., 1939, The Miocene Humboldt formation in northeastern Nevada: Jour. Geology, v. 47, no. 2, p. 133-160.
Stose, C. W., 1932, Geologic map of the United States: U.S. Geological Survey [1933].
Wilcox, L. V., 1955, Classification and use of irrigation waters: U.f'. Dept. Agriculture Circ. 969, 19 p.

INDEX
Page Page
Alluvial fans •••• ----------------------------- 9-10 Depth to water ••• --------------------------·- 18 aquifers of._______________________________ 17 factor in choice of well site •• -------------- 38-39
Alluvium, character in valley iill ••. ---------- 14-16 phreatophyte areas.---------------------- 21 relation of physical characteristics to po- Desert pa\'emenL-----------------------·---- 11
tential development. _____________ 37-38 Development of ground water .• -------------- 33-39 scope of present study____________________ 2 Dewey Dann Ranch, ground-water devElop-
Analyses of irrigation water ___________________ 28-29 ment.---------------------·------ 34
classification and interpretation •••••.•.•• 31-32 water supply----------------------------- 5 Aquifer tests, in irrigation wells. _____________ 17-18 Discharge from ground-water reservoir •••••••• 20-21
Aquifers, relation of physical characteristics to Dissection .• -----------------------~---------- 9 potential development. ________ 36,37-38 Domestic water, interpretation of analyser---- 31-32
Aquifers in area, evaluation__________________ 39 standards of quality---------------------- 30-31 Aquifers in valley 1ill.------------------------ 17 Drainage.------------------------------------ 8, 9
Drillers' logs, wells in Crescent Valley ________ 43-48 Beowawe, Nev,, geographic situation ________ _ 3 Dry Hills ••••• -------------------------------- 3, 8-9
streamflow in Humbolt River ___________ _ U.S. Weather Bureau records ___________ _
Bicarbonate ion, in irrigation water __________ _
22 ti-7 30
Crescent Valley Hot Springs •••••• -------- 22 Dunes.------------------------ ______ .---_____ 11
Boron in ground water ______________________ _ Boron ion in irrigation water ________________ _
33 Economic activities •••••• -------------------- 3 30 Effiorescence, saline .••• ---------------------- 11,21
Brock Canyon, drainage _____________________ _ 11 Evapotranspiration, discharge by ____ -------- 20-21 Bullion district, mining history ______________ _ 5 losses by •••• --------------------------- __ 19, 20
rocks of. ___ ------------------------------- 12
Caliche .•.• ----------------------------------- 13,15 Carboniferous rocks •• ------------------------ 12 Carico Lake ValleY--------------------------- 3, 12
source of recharge .•• ---------------------- 20 Chemical quality of water for irrigation _______ 26-33
local variations ___________________________ 32-33
relation to potential development _________ 36,38
Climate •• ------------------------------______ 6-7 Coefficient of transmissibilitY----------------- 17-18
relation to terrain_________________________ 18
Conductivity-------------------·----_________ 26 of irrigation water.----------------------- 26,27
Cooks Creek .•.•. ---------------------------- 12 Corral Canyon, area of potential development. 39
drainage·--------------------------------- 12 Cortez district, mining history---------------- 3-4 Cortez Moutains _____________________ 3, 5, 8, 9, 10,12
measurements of streamflow-------------- 37 Cottonwood Creek •• ------------------------- 11 Crescent Valley, geographic description_______ 3
ranching in.------------------------------ 5 scope of present report.___________________ 2
Crescent Valley Hot Springs, fluoride in water 32 water of.·-------------------------------- 31
Dean Ranch, alluvial fan--------------------- 10 ground-water development _______________ 33-34
pumpage. ----------------- _______ -------- 23 springs. ___ --------------- _______ --------- 22
Faults •• ------------------------------------- 8, 9,10 Fieldwork ____ ---------------------------_____ 3 Fire Creek .• _-------------------------------- 9, 12 Fluoride, Crescent Vally Hot Springs________ 32
Fossils, vertebrate •• -------------------------- 13 Fourmile Canyon, drainage__________________ 11
Frenchie Creek ••• ---------------------------- 5,11 potential development •••• ---------------- 39
Geography of area--------------------·-·----- 3-5 Geologic formations, water-bearing chara'lter-
istics. _ --------------------------- 12-18 Geologic investigations, previous_____________ 12 Gold Acres, mining___________________________ 5 Gold Acres community, ground-water develop-
ment.---------------------·------ 33 pumpage.-------------------------------- 23
Grain-size distribution, valley 1ill ••• ---------- 14-17 Ground water, chemical qualitY---·---------- 26-33
movement of.---------------------------- 18 occurrence ••• __ ••• ----------------------__ 18 relation of quantity to potential develop-
ment.------------------------·--·- 36, 37 sources.---------------------------------- 18-19 summary of potential development_._____ 39
Ground-water development, potential arers .•• 36-39 present.---------------------------------- 33-34
Ground-water storage ••••• -------------------- 17 changes in •• ------------------------------ 24
water supply_-------------------------- __ 5 Hand-me-down Creek •• ---------------------- 5,11
49

50 INDEX
Page Hot springs •••• -----·------------------ 8-9. 22, 31,32 Humboldt formation in the Ruby Mountains,
description.---------------------- 13-14 ground water in.------------------------- 18
Humboldt River. ----------------------------3.9, 11 streamflow and underflow ________________ 22-23
Igneous rocks ••• ------------------------------ 9,12 Indian Creek.------------------------------- 3, 5,12
· alluvial fan------------------------------- 10,39 potential development •• ------------------ 39 present development •.• ------------------ 33,34
Inventory, 1949 ••• --------------·------------- 23-24 Irrigation, water supply for .• ----------------- 5 Irrigation history, past sources of water------· 33 Irrigation water, interpretation of analyses.... 31
quality and classification ••• ----------- 26-30,31 Irrigation wells, pumpage____________________ 23
Landforms •• -------·-------------.------.---- 8-11 Lithofacies studies, valley filL •••...•••••....• 14-17
Little Cottonwood Creek ••• ----------··------ 11
Malpais •. ------------····------------------ 9, 10,17 Malpais area, potential ground-water yield... 39 Metamorphic rocks ••• ------------------------ 9, 12 Mill Canyon, drainage •.• -------------------- 11 Mill Canyon district, mining history--------- 3-4
potential development •• ------------------ 39 Mining in area, history ••••• ------------------ 3-5
past sources of water •••• ------------------ 33 Mountains ..• -------------------------------- 8-9 Mount Tenabo.------------------------------ 8 Mule Canyon, drainage •• -------------------- 11
Recharge sources- Continued !leepage from bedrock.------·-------------surface flow--·-··------------·-------------
Page
20 20
References cited •• ---------------------------- 48 Roads of area .•• ------------------------------ 3 Rocks of the mountain ranges, description .•• 12-13
ground water in-------------------------· 18 water-bearing characteristics ... ---------- 13
Rocks of the pediment, descrlpti1n ..•••••••• 13-14 ground water in----·--------------------- 18 water-bearing characteristics··---·--··-·· 14
Rocky Pass·--------------------------------- 3,12 Chillis Hot Spring._______________________ 22
sprin~----------------------------- ------ 12,22
Salinity hazard .•• --------------------------- 26 "Salt balance" __ ----------------------------- 35,36 Sedimentary rocks .•••• ---------------------- 9,12 Sediments of the valley fill, description ••••••• 14-18 Sharp, R. P., description of Hum')oldt forma-
tion, Ruby Mountaius ••••••••••• 13-14 Shoshone Range.------------------------ 3, 9, 10, 12 Silver, mining history------------------------ 3-5 Sod House Creek •.• ------------·····---------- 5, 11 Sodium (alkali) hazard.---------------------- 26-30 Sodium-adsorption ratio in irrigation water •• 26-28 Soil type, factor in choice of well site.------- 39 Springs, Rocky Pass.--------------------·--- 12,20 Springs and seeps, discharge by_._----------- 21, 22 Stirton, R. A., fossils indentified by---------- 13-14 Streams •• ----·------------------------- 11,12,14-15
Temperature.-------------------------------- 6-7 Tenabo, Nev.-------------------------------- 5
Nevada State Engineer, cooperative program. 2 Terraces ••.• ---------------------------------- 11
Observation wells, fluctuations in water leveL 24-26 Tertiary beds, planation oL----------------- 10 Tertiary erosion surface •••• ---·-------------- 9
rocks.------------------------------------ 12-14 Palezoic rocks.----------------·····---------- 13 Pediment ••• ---------------------------------
Topography, factor in choice of w~~u site-••••• 38-39 9,13
Piedmont slopes •• --------------------·------Phoenix, D. A., work in area----------------Phreatophyte root zone, relation to potential
9-10 Underflow, Crescent Valley to Humboldt 3, 13 River·------------------------- 22-23, 36
development ••• ---·-------------- 35 Phreatophytes ----------------------·-------- 21 Physical characteristics of alluvium, relation
to potential development of water •.• -----··-----·---------- 36,37-38
Piezometric surface.-------------------------- 18 Playas •••• -----------·-----------------·- 8, 1o-11, 21 Precipitation ••• ------------------------------ 6-7
relation to evapotranspiration____________ 19
relation to runoff ••••••• ------------------ 19-20 Pumpage ••• -----·---------------------------- 23 Pumping, presenL--------------------------- 33-34 Pumping and associated losses________________ 21 Purpose and scope offnvestigation____________ 2
Recharge sources, infiltration of irrigation water----------------------------- 20
precipitation at higher altitudes __________ 19-20
on valley floor---------·--·----------- 20
discharge bY--------------------------- 21,22-23 U.S. Weather Bureau, meteorologl ·~1 records.. 6-7
Valley fill, ground-water storage h• ..• --------- 17 thickness •• ---------------------------. __ - 15-17 unconsolidated sediments _________________ 14-18
water-bearing characteristics •.• ---------- 16-18 Valley floor----------------------------------- 1o-11 Volcanics, erosion oL------------------------- 9
Wells, development of .• ---------------------- 33,34 in basin fill_ ••••• ------------------------- 15 in Humboldt formation, near Elko .• ----- 14
Wells and springs, numbering sys ... .em ••••••• pl. 1; 5 Well sites, selection factors .••• --------------- 36-39 Water-level measurements, obsel"'7atlon wells
in Crescent Valley---------------- 42-43 Water levels, fluctuations ••••• ---------------- 24-26 Wind erosion.-------------------------------- 11 Withdrawals, effect on ground-wa+er levels... 26
0