Developing ground water level map for Dinajpur district, Bangladesh using geo-statistical analyst

GROUND WATER LEVEL SCENARIO
IN INDIA
(NOVEMBER - 2012)
CENTRAL GROUND WATER BOARD
MINISTRY OF WATER RESOURCES
GOVT OF INDIA

Contents
1. Introduction
2. Rainfall Pattern
3. Ground Water Level Scenario in India
4. State Wise Ground Water Level Scenario
4.01 Andhra Pradesh
4.02 Assam
4.03 Bihar
4.04 Chhattisgarh
4.05 Delhi
4.06 Goa
4.07 Gujarat
4.08 Haryana
4.09 Himachal Pradesh
4.10 Jammu & Kashmir
4.11 Jharkhand
4.12 Karnataka
4.13 Kerala
4.14 Madhya Pradesh
4.15 Maharashtra
4.16 Orissa
4.17 Punjab
4.18 Rajasthan
4.19 Tamil Nadu
4.20 Uttar Pradesh
4.21 Uttaranchal
4.22 West Bengal

1.0 Introduction
Monitoring of ground water regime is an effort to obtain information on ground water levels and
chemical quality through representative sampling. The important attributes of ground water regime
monitoring are ground water level, ground water quality and temperature. The primary objective of
establishing the ground water monitoring network stations is to record the response of ground regime
to the natural and anthropogenic stresses of recharge and discharge parameters with reference to
geology, climate, physiography, land use pattern and hydrologic characteristics. The natural conditions
affecting the regime involve climatic parameters like rainfall, evapotranspiration etc., whereas
anthropogenic influences include plumage from the aquifer, recharge due to irrigation systems and
other practices like waste disposal etc.
Ground water levels are being measured four times a year during January, April/May, November and
November. The ground water regime monitoring was started in the year 1969 by Central Ground Water
Board. At present a network of 15653 observation wells located all over the country is being monitored.
Ground water samples are being collected from these observation wells once a year during the month
of April/May to obtain background information of ground water quality changes on regional scale. The
database thus generated forms the basis for planning the ground water development and management
programme. The ground water level and quality monitoring is of particular importance in coastal as well
inland saline environment to assess the changes in salt water/fresh water interface as also the gradual
quality changes in the fresh ground water regime. This data is used for assessment of ground water
resources and changes in the regime consequent to various development and management activities.
2.0 Rainfall Pattern The actual season (June to September) rainfall over the country as a whole and four broad
geographical regions during the 2012 SW monsoon season are given in the table below along with
respective long period average (LPA) values. The rainfall during the 4 monsoon months and
the second of the monsoon season, August + September) over the country as whole are also given.
Season (June to September) rainfall
Region
LPA (mm) Actual Rainfall for 2012 SW Monsoon Season
Rainfall (mm) Rainfall (% of LPA) All India 887.5 819.8 92
Northwest India 615.0 569.3 93 Central India 975.5 935.5 96
Northeast India 1438.3 1275.3 89 South Peninsula 715.5 643.9 90
Monthly & second half of the monsoon season rainfall over the country as a whole (All India)
Month
LPA (mm) Actual Rainfall for 2012 SW Monsoon Season
Rainfall (mm) Rainfall (% of LPA) June 163.6 117.8 72 July 289.2 250.4 87
August 261.3 264.7 101 September 173.4 192.0 111
August + September
434.7
453.7
104
As seen in the table above the season rainfall over the country as whole and four geographical regions
of the country were less than the respective LPAs. Month wise the rainfall during the first two
months (June and July) was below its LPA values. However, monthly rainfall for August and
September as well as total rainfall during the second half monsoon season was higher than its LPA
values

Source: IMD
Sub-division wise rainfall distribution over India during southwest monsoon season (June to September) – 2012

3.0 Ground Water Level Scenario in India
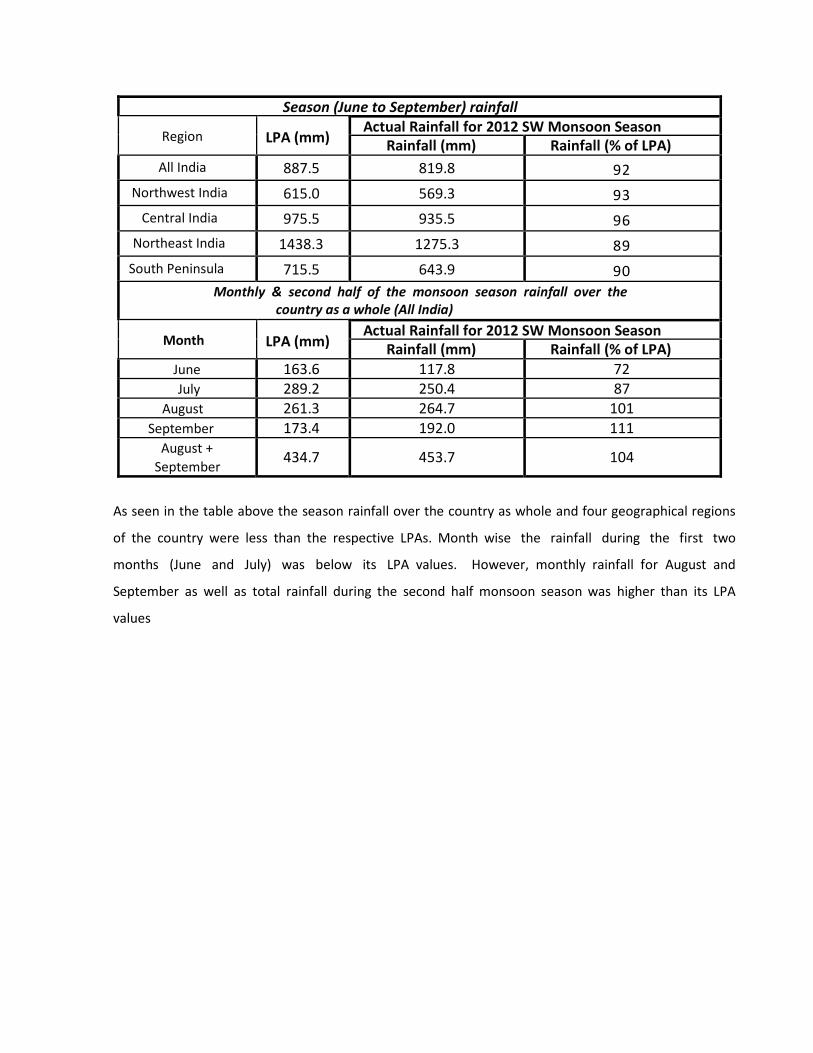
Depth to Water Level (November- 2012)
Perusal of the ground water level data for the November 2012 indicates that in Sub-Himalayan area,
north of river Ganges, eastern coast of Orissa, Andhra Pradesh, Kerala, Gujarat, Maharastra,
Chhattisgarh, Madhya Pradesh, Bihar, Jharkhand, entire northeast and Coastal Tamil Nadu states
generally the depth to water level varies from 2-5 meter below ground level. About 37 % wells are
showing water in the depth range of 2-5 m bgl. Shallow water level less than 2 m bgl have also been
observed in west Maharastra, Assam, North Bihar, Orissa and coastal area of Andhra Pradesh and Tamil
Nadu states. In major parts of north-western states depth to water level generally ranges from 10-20 m
bgl. In the western parts of the country deeper water level is recorded in the depth range of 20-40 m bgl
and more than 40 m bgl. In North Gujarat, part of Haryana and western Rajasthan water level more
than 40 m bgl is recorded. In the west coast water level is generally less than 5 m and in western parts
of Maharashtra State isolated pockets of water level less than 2 m has also been observed. In the east
coast i.e. coastal Andhra Pradesh, shallow water level of less than 2 m have been recorded. In eastern
states, water level in general ranges from 2-5 m bgl. However south-eastern part of West Bengal
recorded water level in the range of 10-20 m bgl and 5-10 m bgl. In south India water level generally
varies between 5-10 m bgl, except in isolated pockets where water level more than 10 m bgl has been
observed.
Out of total monitored wells 19% wells are showing water level less than 2 m bgl, 36 % wells are
showing water in the depth range of 2-5 m bgl, 27% wells are showing water level in the depth range of
5-10 m bgl, 14% wells are showing water level in the depth range of 10-20 m bgl, 3% wells are showing
water level in the depth range of 20-40 m and remaining wells are showing water level more than 40 m
bgl.
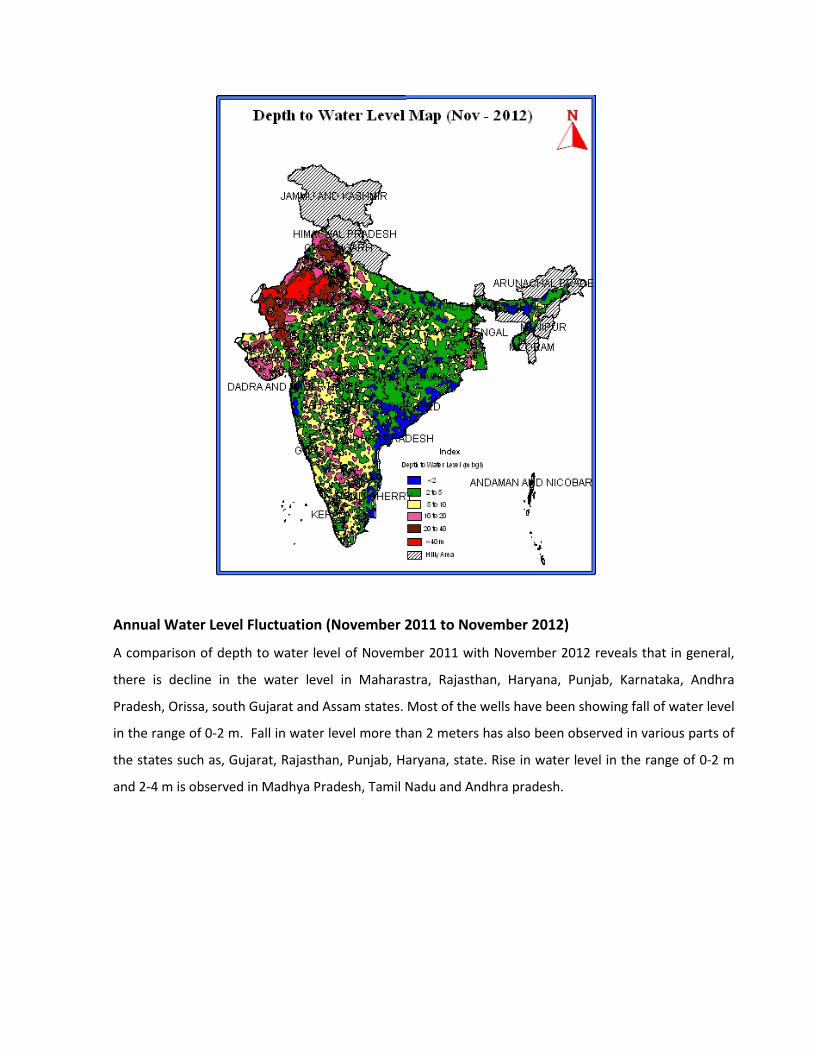
Annual Water Level Fluctuation (November 2011 to November 2012)
A comparison of depth to water level of November 2011 with November 2012 reveals that in general,
there is decline in the water level in Maharastra, Rajasthan, Haryana, Punjab, Karnataka, Andhra
Pradesh, Orissa, south Gujarat and Assam states. Most of the wells have been showing fall of water level
in the range of 0-2 m. Fall in water level more than 2 meters has also been observed in various parts of
the states such as, Gujarat, Rajasthan, Punjab, Haryana, state. Rise in water level in the range of 0-2 m
and 2-4 m is observed in Madhya Pradesh, Tamil Nadu and Andhra pradesh.
About 46% wells are showing rise in water level. Out of which 37% wells are shoring rise in the range of
water level less than 2 m. About 5% wells are showing rise in water level in 2-4 m range and 4% wells
showing rise in water level more than 4 m range. About 54 % wells are showing decline in water level,
out of which 40% wells are showing decline in water level in less than 2 m range. About 8% wells are
showing decline in water level in 2-4 m range. Only 6% wells are showing decline in water level more
than 4 m range.

Seasonal Water Level Fluctuation (Pre Monsoon 2012 to November 2012)
A comparison of depth to water level during Pre Monsoon 2012 with November 2012 reveals that in
general, there is rise in the water level in most parts of the country except in Punjab, Haryana, and
western Rajasthan, Karnataka and Tamil Nadu states. Most of the wells have been showing rise of water
level in the range of less than 4 m range. Rise in water level less than 2 meters and 2 to 4 m range is
observed mainly in alluvium formation. Decline in water level in the range of 0-2 m and 2-4 m is
observed in Punjab, Haryana, Western Rajasthan, Tamil Nadu, Andhra Pradesh and Karnataka states.
Decline in water level in the range of 4 m is observed in pockets in Punjab, Haryana, Western Rajasthan
and Karnataka states.

About 82% wells are showing rise in water level. Out of which 34% wells are shoring rise in water level
less than 2 m range. About 24% wells are showing rise in water level in 2-4 m range and 23% wells
showing rise in water level more than 4 m. About 16% wells are showing decline in water level, out of
which 12% wells are showing decline in water level in less than 2 m range. About 3% wells are showing
decline in water level in 2-4 m range. Only 1% wells are showing decline in water level more than 4 m
range.
Annual water level fluctuation (November 2011 to November 2012) and seasonal water level fluctuation
(Pre Monsoon 2012 to November 2012) maps depicts that rise in water level is more prominent, which
is a indication of extremely good rainfall.
Water Level Fluctuation with Decadal Mean [Nov (2002- 2011) to Nov – 2012]
A comparison of depth to water level of November 2012 with decadal mean November (2002-2011)
reveals that in general, there is decline as well as rise in the water level in north- west, east and north
eastern part of the country. In general there is rise in water level in central and Gujarat and Tamil Nadu
states. About 54% of wells showing rise in water level. Out of which 40.00% wells are showing rise in
water level less than 2 m range. About 8% wells are showing rise in water in range of 2-4 m. About 6%
wells are showing rise in water in range of more than 4 m. About 46% wells are showing decline in
water level, out of which 36% wells are showing decline in water in the range of 0-2 m, 9% wells are
showing decline in water level in depth range 2-4 m bgl and remaining wells are showing decline in
water level more than 2 m. Decline in water level more than 4 m is mostly prominent in the states of
Rajasthan, Punjab, Haryana, Delhi and west Bengal states. Rise in water level more than 4 m is observed
mostly in the Gujarat, southern Rajasthan, western Madhya Pradesh and Tamil Nadu state.

4.0 The State wise ground water level scenario
The state wise scenario of ground water level and comparison with previous year water level
as well as change with decadal average has been discussed in the following paragraphs.
4.01 Andhra Pradesh
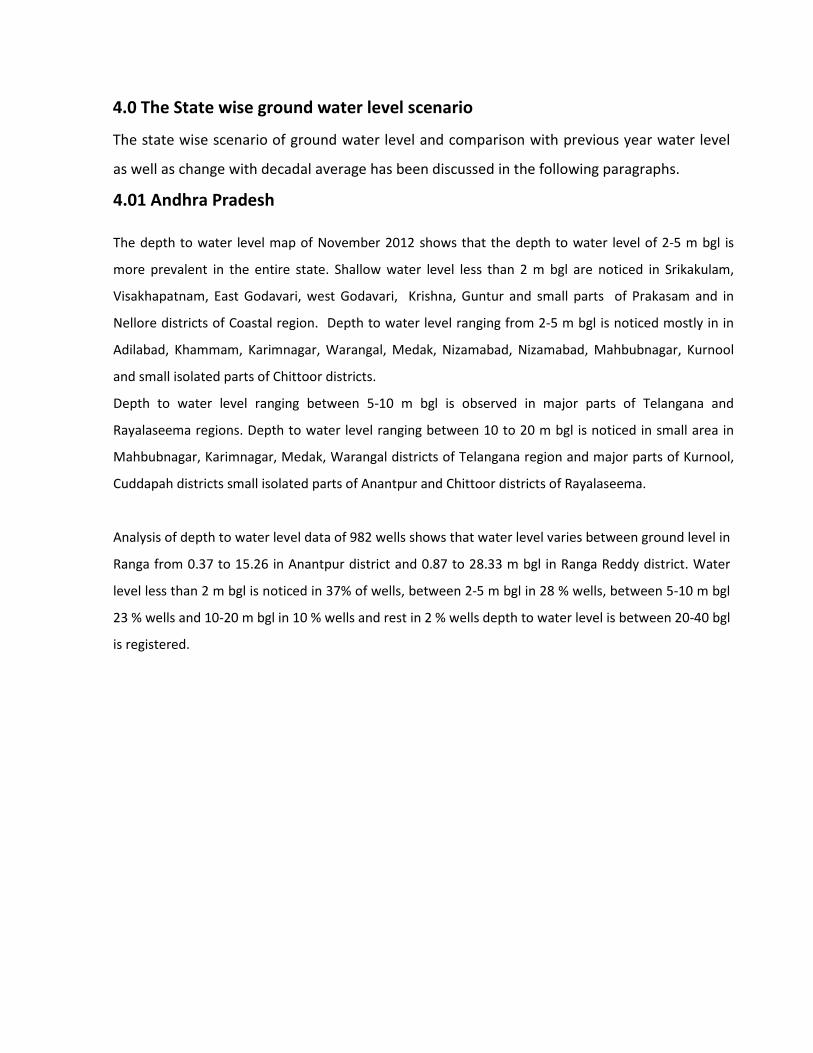
The depth to water level map of November 2012 shows that the depth to water level of 2-5 m bgl is
more prevalent in the entire state. Shallow water level less than 2 m bgl are noticed in Srikakulam,
Visakhapatnam, East Godavari, west Godavari, Krishna, Guntur and small parts of Prakasam and in
Nellore districts of Coastal region. Depth to water level ranging from 2-5 m bgl is noticed mostly in in
Adilabad, Khammam, Karimnagar, Warangal, Medak, Nizamabad, Nizamabad, Mahbubnagar, Kurnool
and small isolated parts of Chittoor districts.
Depth to water level ranging between 5-10 m bgl is observed in major parts of Telangana and
Rayalaseema regions. Depth to water level ranging between 10 to 20 m bgl is noticed in small area in
Mahbubnagar, Karimnagar, Medak, Warangal districts of Telangana region and major parts of Kurnool,
Cuddapah districts small isolated parts of Anantpur and Chittoor districts of Rayalaseema.
Analysis of depth to water level data of 982 wells shows that water level varies between ground level in
Ranga from 0.37 to 15.26 in Anantpur district and 0.87 to 28.33 m bgl in Ranga Reddy district. Water
level less than 2 m bgl is noticed in 37% of wells, between 2-5 m bgl in 28 % wells, between 5-10 m bgl
23 % wells and 10-20 m bgl in 10 % wells and rest in 2 % wells depth to water level is between 20-40 bgl
is registered.
The fluctuation of water level between November 2012 and the average water levels of past decade
(Decadal mean November 2002-2011) indicate in general there is decline and rise of water level in
different parts of the state. About 34% of monitored wells have registered decline in water level. The
decline of 0-2 m has been observed in about 23 % of the wells analyzed. About 7% of wells reported
decline in water level between 2-4 m. A decline of more than 4m has been recorded in 4% of monitored
wells. About 65% of wells analyzed have shown rise in water levels. Rise in the range of 0-2 m has been

recorded in 46% of monitored wells; Water level rise in order of 2-4m has been recorded 14% of wells
analyzed. About 5% of wells shows rise in water level in more than 4 m range.
4.02 Assam
In general depth to water level scenario in the state depicted a water level within 5 m bgl. Around 51%
stations recorded water level within 2 m bgl and around 45% wells recorded water level between 2-5 m
bgl. Around 4% wells recorded water level between 5-10 m bgl. Only three wells shows water level
between 10-20 m bgl.
Shallow water level within 2 m bgl was mostly recorded in Dhemaji, Tinsukia, parts of Dibrugarh,
Sonitpur, Marigaon, Barpeta and Kamrup districts in Brahamputra valley and in Cachar, Karimganj and
Hilakandi district in Barak valley. In general, in Brahmputra valley water level are recorded mostly
within 5 m bgl. The minimum depth to water level in the state has recorded as 0.01m bgl in Dhemaji
district and maximum depth to water level has been recorded as 18.96 m bgl in Karbi Anglong district.

Water level of November 2011 when compared to that of November 2012 shows that about 66 % of
the wells analyzed showings rise in water level and 33% of fall in the state. Out of this, 30% of the wells
showing fall in water level less than 2 m. A fall of 2-4 m is observed in 2% of the wells analyzed and fall
of >4 m is noticed in less than 1.0% of the wells. About 66% of wells analyzed have shown rise in water
level with majority of wells (65%) showing fall in the range of 0-2 m.
The fluctuation of water level during November 2012 when compared with the average water levels of
past decade (Decadal mean November 2002-2011) indicates in general there is decline and rise of
water level in different parts of the state. About 57% of monitored wells have registered decline in
water level. The decline of 0-2 m has been observed in about 50 % of the wells analyzed. About 5% of
wells reported decline in water level between 2-4 m. A decline of more than 4m has not been recorded
in of monitored wells. About 43% of wells analysed have shown rise in water levels. Rise in the range of
0-2 m has been recorded in 39% of monitored wells; Water level rise in order of 2-4m has been
recorded 4% of wells analyzed. No well shows rise in water level in more than 4 m range.
4.03 Bihar
During the month of November 2012 a total of 189 wells have been monitored. Water level ranges
from 0.35 m bgl in Rohtas district to 11.75 in Jamui district. About 17 % of the wells shows water level
in between 0 to 2 m bgl depth range. About 61% of the wells are showing water level in the range 2-5
m bgl and 20% of the wells analyzed are showing water level in the range of 5-10 m bgl. Only three
numbers of wells is showing water level more than 10 m bgl.

Water level data of November 2011 compared to November 2012 shows that in general there is decline
in water level in entire state. About 29% of the wells analyzed showing rise in the water level. Out of
this 27% wells have shown a rise in 0-2 m range. About 2% of the wells have shown rise in 2-4 m range.
About 54 of the wells analyzed showing falls in the water level. Out of this 49% of the total wells have
shown a fall within 0-2 m range. Only 3% of monitoring wells shows fall in water level in the range of 2-
4 m. Maximum 0.03 m rise in water level has been recorded in the State. Maximum 4.41m fall in water
level has been recorded in the State.
The fluctuation of water level during November 2012 when compared with the average water levels of
past decade (Decadal mean November 2002-2011) indicates in general there is decline and rise of
water level in entire state. About 61% of monitored wells have registered decline in water level. The
decline of 0-2 m has been observed in about 55 % of the wells analyzed. About 5% of wells reported

decline in water level between 2-4 m. A decline of more than 4m has been recorded in 1% of monitored
wells. About 37% of wells analysed have shown rise in water levels. Rise in the range of 0-2 m has been
recorded in 35% of monitored wells; Water level rise in order of 2-4m has been recorded 2% of wells
analyzed. About 0% of wells shows rise in water level in more than 4 m range.
4.04 Chhattisgarh
In general, the depth to water level ranges from 2-5 m bgl in approximately 82% of the observation
wells in the state. Deeper water levels ranging between 10 and 20 m bgl occur approximately in 6% of
the observation wells and mostly in parts of Kanker and Mahasamund, districts. The deepest water level
of 24.90 m bgl was monitored in Durg observation well of the Durg district
Around 36% of the monitored wells are showing water levels between 0-2 m bgl covering all the
districts of the state. Water levels in the range of 2-5 m bgl are recorded in about 82% of the
observation wells monitored. The highest percentages of wells in this range are in Bastar, Jaspur,
Kawardha, Raipur and Rajnandgaon districts. Nearly 223% of observation wells are exhibiting water level
in the range of 5-10 m bgl mostly in Kanker, Mahasamund and Sarguja districts.

When compared to water level in November 2011, about 19% of the observation wells are showing fall
in water level in November 2012, mostly in the range of 0-2m. Fall of water level in the range of 0-2m is
observed in 17% (approx.) of the observation wells and are distributed in almost all the districts. Fall of
water level in the range of 2-4 m is observed in about 1% of the wells monitored mostly in Bilaspur,
Mahasamund, Raigarh, Raipur and Rajnandgaon districts. Rise of water level is recorded in about 80 %
of the monitored wells the state. Rise of water level in the range of 0- 2 m. is observed in about 72% of
the monitored wells. Rise in the range of 2 to 4 m has been observed in 7% and >4 m in 1% monitoring
wells. Maximum fall of water level by 7.80 m as compared to November’11 is noted in Durg observation
well Durg district. Maximum rise of water level by 7.10 m is noted at Durg observation well.
The fluctuation of water level during November 2012 when compared with the average water levels of
past decade (Decadal mean November 2002-2011) indicates in general there is decline and rise of
water level in different parts of the state. About 33% of monitored wells have registered decline in
water level. The decline of 0-2 m has been observed in about 31 % of the wells analyzed. About 1% of
wells reported decline in water level between 2-4 m. A decline of more than 4m has been recorded in
1% of monitored wells. About 66% of wells analyzed have shown rise in water levels. Rise in the range
of 0-2 m has been recorded in 59% of monitored wells; Water level rise in order of 2-4m has been
recorded 6% of wells analyzed. About 1% of wells shows rise in water level in more than 4 m range.
4.05 Delhi
The depth to water level recorded in the state of Delhi during November 2012 ranged from 0.69 m bgl to
66.40. m bgl. It is observed that 6% of the wells analyzed have shown water level in the range of 0-2 m
bgl, 24% of the wells have shown water level in the range of 2-5 m bgl. About 27% of the wells analyzed
have shown water level in the range of 5-10 m bgl and 26% of the wells have shown water level in the
range of 10-20 m bgl. Deeper water level in the range of 20-40 m bgl and > 40 m bgl are shown by 8%
and 9% of the wells analyzed.

Water levels of November 2011 when compared to water level of November 2012 in the state indicates
that about 80% of the wells analyzed have recorded a fall in water level, out of which 65% of analyzed
wells have recorded a fall in the range of 0 to 2 m, 13% of analyzed wells have shown fall in the range of
2 to 4 m and 2% of the wells have shown fall > 4 m. About 20% of the wells have shown rise in water
level, out of this 1% have recorded rise in the range of 0 to 2m. About 2% of the wells have shown rise in
water level in the range of 2 to 4m and remaining 0% wells shows rise in water level more than 4 m
range.
The fluctuation of water level during November 2012 when compared with the average water levels of
past decade (Decadal mean November 2002-2011) indicates in general there is decline and rise of
water level in entire state. About 55% of monitored wells have registered decline in water level. The
decline of 0-2 m has been observed in all 27% monitoring wells analyzed. About 35% of wells analyzed
have shown rise in water levels. Rise in the range of 0-2 m has been recorded in 27% of monitored

wells; Water level rise in order of 2-4m has been recorded 3% of wells analyzed. About 1% of wells
shows rise in water level in more than 4 m range.
4.06 Goa
The depth to water level recorded in the state of Goa during November 2012 ranged from 0.21 m bgl in
North Goa to 14.65 m bgl in South Goa. It is observed that out of 40 stations monitored during the
month, 22% wells have less than 2 m bgl water level, 45% wells have 2 to 5 m bgl water level, 25% wells
have 5 to 10 m bgl water level and 8% wells have 10 to 20 m bgl water level.
Water levels of November 2012 when compared to water level of November 2011 in the state of Goa
indicate that about 46% of the wells analyzed have recorded a fall in water level and all these wells are
in the range of 0 to 2 m. The remaining 54% wells have shown rise in water level, out of this 51% wells
have recorded rise in the range of 0 to 2m.
The fluctuation of water level during November 2012 when compared with the average water levels of
past decade (Decadal mean November 2002-2011) indicates in general there is decline and rise of
water level in entire state. About 42% of monitored wells have registered decline in water level. The
decline of 0-2 m has been observed in all 42% monitoring wells analyzed. About 58% of wells analyzed
have shown rise in water levels. Rise in the range of 0-2 m has been recorded in 51% of monitored
wells; Water level rise in order of 2-4m has been recorded 5% of wells analyzed. About 3% of wells
shows rise in water level in more than 4 m range.
4.07 Gujarat
The depth to water level recorded in the state of Gujarat during November 2012 ranged from 0.15 m bgl
in Mehsana district to 99.83 m bgl in Kutch district. It is observed that 8% of the wells analyzed have
shown water level in the range of 0-2 m bgl, 27% of the wells have shown water level in the range of 2-5
m bgl. About 31% of the wells analyzed have shown water level in the range of 5-10 m bgl and 23% of the
wells have shown water level in the range of 10-20 m bgl. Deeper water level in the range of 20-40 m bgl
and > 40 m bgl are shown 10% and 1% of the wells analyzed.

Water level data of November 2011 compared to November 2012 shows that in general there is rise
and fall in water level in different parts of the state. About 42% of the wells analyzed shows rise in the
water level. Out of this 28% wells have shown a rise in 0-2 m range. About 9% of the wells have shown
rise in 2-4 m range and about 5% wells has shown rise in water in more than 4 m. About 58% of the
total wells have shown a fall in water level. Out of this 28% wells have shown a fall in 0-2 m range.
About 12% of the wells have shown fall in 2-4 m range and about 18% wells has shown fall in water
level in more than 4 m.
The fluctuation of water level during November 2012 when compared with the average water levels of
past decade (Decadal mean November 2002-2011) indicates in general there is decline and rise of
water level in entire state. About 58% of monitored wells have registered decline in water level. The
decline of 0-2 m has been observed in about 28 % of the wells analyzed. About 12% of wells reported
decline in water level between 2-4 m. A decline of more than 4m has been recorded in 18% of
monitored wells. About 42% of wells analyzed have shown rise in water levels. Rise in the range of 0-2
m has been recorded in 28% of monitored wells; Water level rise in order of 2-4m has been recorded
9% of wells analyzed. About 5% of wells shows rise in water level in more than 4 m range.
4.08 Haryana
The depth to water level during November 2012 varies from 0.14 m bgl in Gurgaon district to 70.90 m
bgl in Rewari district. Very shallow water levels of < 2 m bgl is observed in the central part of the State
covering parts of Rohtak, Jhajjar, and Sonipat districts and in isolated patches in Gurgaon district. About
9 % of wells monitored have reported water level up to 2 m bgl, 20 % of wells monitored have reported
water level from 2 to 5 m bgl, 20 % of wells monitored have reported water level from 5 to 10 m bgl, 31
% of wells monitored have reported water level from 20 to 40 m bgl 20 % of wells monitored have
reported water level more than 40 m bgl.

The water level data of November 2012 when compared with November 2011 indicates that there is
rise in water levels in about 35% of the wells monitored. In most of the area the rise is in the range of 0-
2 m. About 31 % of the wells monitored show rise in the range between 0-2 m. The water level rise in
the range between 2-4 m and >4 m have been observed in 2% and 2% of the wells monitored
respectively. Decline in water level has been recorded in 65% of the wells. Fall in range of 0-2m has
been recorded in 53 % wells. The 6% of wells in the wells shows fall in water level more than 2 m and
4% of wells shows fall more than 4 m bgl.
The fluctuation of water level during November 2012 when compared with the average water levels of
past decade (Decadal mean November 2001-2012) indicates in general there is decline and rise of
water level in different parts of the state. About 57% of monitored wells have registered decline in
water level. The decline of 0-2 m has been observed in about 29 % of the wells analyzed. About 14% of
wells reported decline in water level between 2-4 m. A decline of more than 4m has been recorded in
4% of monitored wells. About 43% of wells analyzed have shown rise in water levels. Rise in the range

of 0-2 m has been recorded in 36% of monitored wells; Water level rise in order of 2-4m has been
recorded 4% of wells analyzed. About 2% of wells shows rise in water level in more than 4 m range.
4.09 Himachal Pradesh
The depth to water level during November 2012 varies from 0.37 m bgl in Mandi district to 27.54 m bgl
in Solan district of the state. About 18% of the wells showing water level in range 0-2 m bgl and 40% of
the wells showing water level of less than 5 m bgl and occurs in Balh Valley of Mandi District, parts of
Kangra, Una, & Sirmaur districts and also in other localised areas of other districts. About 24% of the
wells are showing water level in the range of 5-10 m bgl while 13% of the wells are showing water level
in the range of 10-20 m bgl. Deep water levels of more than 20 m are shown by 5 % wells.
The water level data of November 2012 when compared with November 2011 indicates that there is
rise and fall in water levels in the state. About 44% of the wells are showing rise in water level
monitored. About 40 % of the wells monitored show rise in the range between 0-2 m. The water level
rise in the range between 2-4 m and >4 m have been observed in 0% and 4% of the wells monitored
respectively. Decline in water level has been recorded in 56% of the wells. Fall in range of 0-2m has
been recorded in 52 % wells. The 3% of wells in the wells shows fall in water level more than 2 m and
1% of wells shows fall more than 4 m bgl.
The fluctuation of water level during November 2012 when compared with the average water levels of
past decade (Decadal mean November 2001-2012) indicates in general there is decline and rise of
water level in entire state. About 34% of monitored wells have registered decline in water level. The
decline of 0-2 m has been observed in about 30% of the wells analyzed. About 4% of wells reported
decline in water level between 2-4 m. About 66% of wells analyzed have shown rise in water levels. Rise
in the range of 0-2 m has been recorded in 56% of monitored wells; Water level rise in order of 2-4m
has been recorded 6% of wells analyzed. About 4% of wells shows rise in water level in more than 4 m
range.
4.10 Jammu & Kashmir
The depth to water level recorded in the state of Jammu & Kashmir during November 2012 ranged from
0.31m bgl in Udhampur district to 32.52 m bgl in Jammu district. It is observed that about 35% wells
have less than 2 m bgl water level, mainly in outer plain areas. About 39% of the wells analyzed have

shown water level in the range of 2-5 m bgl. About 14% wells have shown water level in the range of 5-
10 m bgl. About 6% wells have 10 to 20 m bgl water level and the remaining 4% wells have > 20 m bgl
water level. All the areas of valley in Udhampur and Rajouri districts shows water level between 0-2
m and 2-5 m bgl. In outer plain areas most of the water level records are less than 2 m bgl. Some
parts of Jammu and Kathua districts water level are recorded between 2-5 m bgl and 5-10 m bgl.
Water levels of November 2012 when compared with water level of November 2011 in the state
indicates that about 41% of the wells analyzed have recorded a rise in water level, out of which 38% of
analyzed wells have recorded a rise in the range of 0 to 2 m, 2% of analyzed wells have shown rise in the
range of 2 to 4 m and 1% of the wells have shown rise > 4 m. About 59% of the wells have shown fall in
water level. Out of which 55% of analyzed wells have recorded a fall in the range of 0 to 2 m, 3% of
analyzed wells have shown fall in the range of 2 to 4 m.
The fluctuation of water level during November 2012 when compared with the decadal means
(November 2002-2011) indicates that about 43% of analyzed wells have shown a decline in water level.
Out of this 37% of the wells have shown decline in the range of 0 to 2 m, 5% have shown decline in the
range of 2 to 4 m and 1% have shown > 4 m decline. About 57% wells have shown a rise in water level,
out of which 54% have shown rise in the range of 0 to 2 m, 2% have shown rise in the range of 2to 4 m
and only 1% have shown rise in the range of more than 4 m bgl.
3.11 Jharkhand
During the month of November 2012 water level ranges from 0.55 m bgl in Paschimi Singh district to
13.85 m bgl in Purbi Singhbhu district. Out of the total wells, about 6% of wells have shown depth to
water level in the range of 0 to 2 m. About 55% of the wells water level was found between 2 to 5 m
depth ranges. About 37% of the wells analyzed are showing water level in the range of 5-10 m bgl.
Deeper water levels (> 10 m bgl) are observed in 2% wells.

In the state of Jharkhand there is an overall fall in water level in November 2012 in comparison to that
of November 2011. About 62% of the wells analyzed showings fall in the water level. Out of this 54%
wells have shown a rise in 0-2 m range. About 7% of the wells have shown fall in 2-4 m range. About
32% of the wells have shown rise in water level 0-2 m. About 5% of the total wells have shown a decline
in water level within 2-4 m range.
The fluctuation of water level during November 2012 when compared with the average water levels of
past decade (Decadal mean November 2002-2011) indicates in general there is decline and rise of
water level in entire state. About 51% of monitored wells have registered decline in water level. The
decline of 0-2 m has been observed in about 41 % of the wells analyzed. About 8% of wells reported
decline in water level between 2-4 m. A decline of more than 4m has been recorded in 3% of monitored
wells. About 49% of wells analyzed have shown rise in water levels. Rise in the range of 0-2 m has been
recorded in 43% of monitored wells; Water level rise in order of 2-4m has been recorded 5% of wells
analyzed. About 1% of wells shows rise in water level in more than 4 m range.

4.12 Karnataka
The depth to water level recorded in the state during November 20120 ranged from 0.03 m bgl in
Gulbarga district to 23.56 m bgl in Dharwad district. The analysis of monitored wells shows that 15%
wells have less than 2m bgl water level, 30% wells have 2 to 5 m bgl water level and 33% wells have 5 to
10 m bgl water level. Moderately deep water level of 10 to 20 m bgl are seen in 21% wells and deep
water level of > 20 m bgl found in about 1% of the analyzed wells.
Water levels of November 2012 when compared to that of November 2011 have shown that about 32%
of the analyzed wells have recorded a rise in water level. The remaining wells about 58% have recorded a
fall in water level. In the rise category, the rise of water level in the range 0-2m is observed in 30% of the
analyzed wells. Rise in water level in the range of 2-4 m and >4 m is recorded in 2% and 1% wells
respectively. In the fall category the fall in water level in the range of 0-2 m is observed in 36% of
analyzed wells. Fall of water level in the range of 2-4 m and >4 m are seen in 11% and 11% wells
respectively.
The fluctuation of water level during November 2012 when compared with the average water levels of
past decade (Decadal mean November 2002-2011) indicates in general there is decline and rise of
water level in entire state. About 51% of monitored wells have registered decline in water level. The
decline of 0-2 m has been observed in about 41% of the wells analyzed. About 8% of wells reported
decline in water level between 2-4 m. A decline of more than 4m has been recorded in 2% of monitored
wells. About 49% of wells analyzed have shown rise in water levels. Rise in the range of 0-2 m has been
recorded in 42% of monitored wells; Water level rise in order of 2-4m has been recorded 5% of wells
analyzed. About 2% of wells shows rise in water level in more than 4 m range.
4.13 Kerala
The depth to water level recorded in the state of Kerala during November 2012 ranged from 0.10 m bgl
in Alappuzha district to 38.28 m bgl in Idukki district. It is observed 18% of the wells have less than 2 m
bgl water level, mainly in coastal areas. About 32% of the wells analyzed have shown water level in the
range of 2-5 m bgl. About 37% wells have shown water level in the range of 5-10 m bgl, 11% wells have
shown 10 to 20 m bgl water level and the remaining 1% wells have > 20 m bgl water level. Deeper water
level > 20 m bgl are observed in Idukki district.

Water levels of November 2012 when compared to water level of November 2011 in the state indicates
that about 31% of the wells analyzed have recorded a rise in water level, out of which 27% of analyzed
wells have recorded a rise in the range of 0 to 2 m, 3% of analyzed wells have shown rise in the range of
2 to 4 m and 1% of the wells have shown rise > 4 m. About 69% of the wells have shown fall in water
level, out of this 59% wells have recorded fall in the range of 0 to 2m and 8.% have shown fall in the
range of 2-4 m and 2% recorded fall in water level > 4 m.
The fluctuation of water level during November 2012 when compared with the average water levels of
past decade (Decadal mean November 2002-2011) indicates in general there is decline and rise of
water level in entire state. About 43% of monitored wells have registered decline in water level. The
decline of 0-2 m has been observed in about 34 % of the wells analyzed. About 6% of wells reported
decline in water level between 2-4 m. A decline of more than 4m has been recorded in 3% of monitored
wells. About 57% of wells analyzed have shown rise in water levels. Rise in the range of 0-2 m has been
recorded in 48% of monitored wells; Water level rise in order of 2-4m has been recorded 5% of wells
analyzed. About 4% of wells shows rise in water level in more than 4 m range.

4.14 Madhya Pradesh The depth to water level during November 2012 varies from 0.37 m bgl to 47.0 m bgl. In general the
depth to water level ranges between 2-5 m bgl and 5-10 m bgl in most parts Madhya Pradesh state.
About 9% monitoring wells are showing water level in 0-2 m bgl range. Depth to water level ranging
between 2-5 m bgl was observed in all most in all districts of the state. About 43 % of monitoring wells
are showing water level in 2-5 m bgl range. The Depth to water level ranging between 5-10 m was
observed almost in western Madhya Pradesh. About 34 % of monitoring wells are showing water level
in 5-10 m bgl range. The Depth to water level ranging between 10-20 m bgl was observed almost in
pockets only. About 11 % of monitoring wells are showing water level in 10-20 m bgl range. Deep water
level more than 20 m bgl has been seen in Burhanpur, Gwalior, Bhind and Morena districts. Very deep
water level more than 40 m bgl has been observed in Bhind District.
Water levels of November 2012 when compared to water level of November 2011 in the state indicates
that about 45% of the wells analyzed have recorded a rise in water level, out of which 35% of analyzed
wells have recorded a rise in the range of 0 to 2 m, 6% of analyzed wells have shown rise in the range of
2 to 4 m and 4% of the wells have shown rise > 4 m. About 55% of the wells have shown fall in water
level, out of this 44% have recorded fall in the range of 0 to 2m and 7% have shown fall in the range of
2-4 m and 4% recorded fall in water level > 4 m.
The fluctuation of water level during November 2012 when compared with the average water levels of
past decade (Decadal mean November 2002-2011) indicates in general there is decline and rise of
water level in different parts of the state. About 23% of monitored wells have registered decline in
water level. The decline of 0-2 m has been observed in about 15% of the wells analyzed. About 4% of
wells reported decline in water level between 2-4 m. A decline of more than 4m has been recorded in
4% of monitored wells. About 77% of wells analyzed have shown rise in water levels. Rise in the range
of 0-2 m has been recorded in 42% of monitored wells; Water level rise in order of 2-4m has been
recorded 21% of wells analyzed. About 14% of wells shows rise in water level in more than 4 m range.
4.15 Maharashtra
The depth to water level during November 2012 in the state varies from 0.20 m bgl in Dhule districts to
55.20 m bgl in Jalgaon district. Water level less than 2 m bgl are shown by about 15% wells. Depth to
water level of 2 to 5 m bgl occurs in entire state with 42% of the wells falling in this range. About 32%
of the wells analyzed showing water level in the range of 5-10 m bgl. About 10% of the wells analyzed
showing water level in the range of 10-20 m bgl. About 1% of the wells analyzed showing water level in
the range of 20-40 m bgl.

Water levels of November 2012 when compared to water level of November 2011 in the state indicates
that about 60% of the wells analyzed have recorded a rise in water level, out of which 52% of analyzed
wells have recorded a rise in the range of 0 to 2 m, 8% of analyzed wells have shown rise in the range of
2 to 4 m and 0% of the wells have shown rise > 4 m. About 40% of the wells have shown fall in water
level, out of this 32% have recorded fall in the range of 0 to 2m and 12% have shown fall in the range of
2-4 m and 0% recorded fall in water level > 4 m.
The fluctuation of water level during November 2012 when compared with the average water levels of
past decade (Decadal mean November 2002-2011) indicates in general there is decline and rise of
water level in different parts of the state. About 52% of monitored wells have registered decline in
water level. The decline of 0-2 m has been observed in about 37 % of the wells analyzed. About 10% of
wells reported decline in water level between 2-4 m. A decline of more than 4m has been recorded in
5% of monitored wells. About 48% of wells analyzed have shown rise in water levels. Rise in the range
of 0-2 m has been recorded in 38% of monitored wells; Water level rise in order of 2-4m has been
recorded 6% of wells analyzed. About 4% of wells shows rise in water level in more than 4 m range.
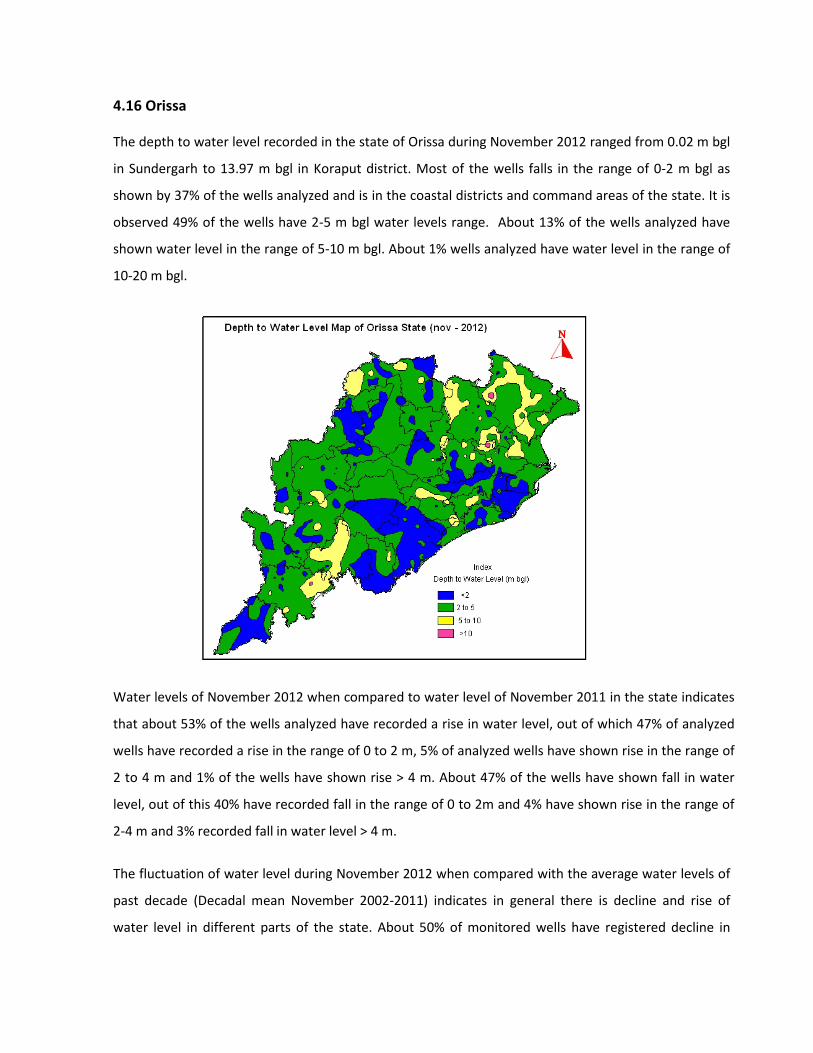
4.16 Orissa
The depth to water level recorded in the state of Orissa during November 2012 ranged from 0.02 m bgl
in Sundergarh to 13.97 m bgl in Koraput district. Most of the wells falls in the range of 0-2 m bgl as
shown by 37% of the wells analyzed and is in the coastal districts and command areas of the state. It is
observed 49% of the wells have 2-5 m bgl water levels range. About 13% of the wells analyzed have
shown water level in the range of 5-10 m bgl. About 1% wells analyzed have water level in the range of
10-20 m bgl.
Water levels of November 2012 when compared to water level of November 2011 in the state indicates
that about 53% of the wells analyzed have recorded a rise in water level, out of which 47% of analyzed
wells have recorded a rise in the range of 0 to 2 m, 5% of analyzed wells have shown rise in the range of
2 to 4 m and 1% of the wells have shown rise > 4 m. About 47% of the wells have shown fall in water
level, out of this 40% have recorded fall in the range of 0 to 2m and 4% have shown rise in the range of
2-4 m and 3% recorded fall in water level > 4 m.
The fluctuation of water level during November 2012 when compared with the average water levels of
past decade (Decadal mean November 2002-2011) indicates in general there is decline and rise of
water level in different parts of the state. About 50% of monitored wells have registered decline in
water level. The decline of 0-2 m has been observed in about 43% of the wells analyzed. About 6% of
wells reported decline in water level between 2-4 m. A decline of more than 4m has been recorded in
1% of monitored wells. About 50% of wells analyzed have shown rise in water levels. Rise in the range
of 0-2 m has been recorded in 46% of monitored wells; Water level rise in order of 2-4m has been
recorded 3% of wells analyzed. About 1% of wells shows rise in water level in more than 4 m range.
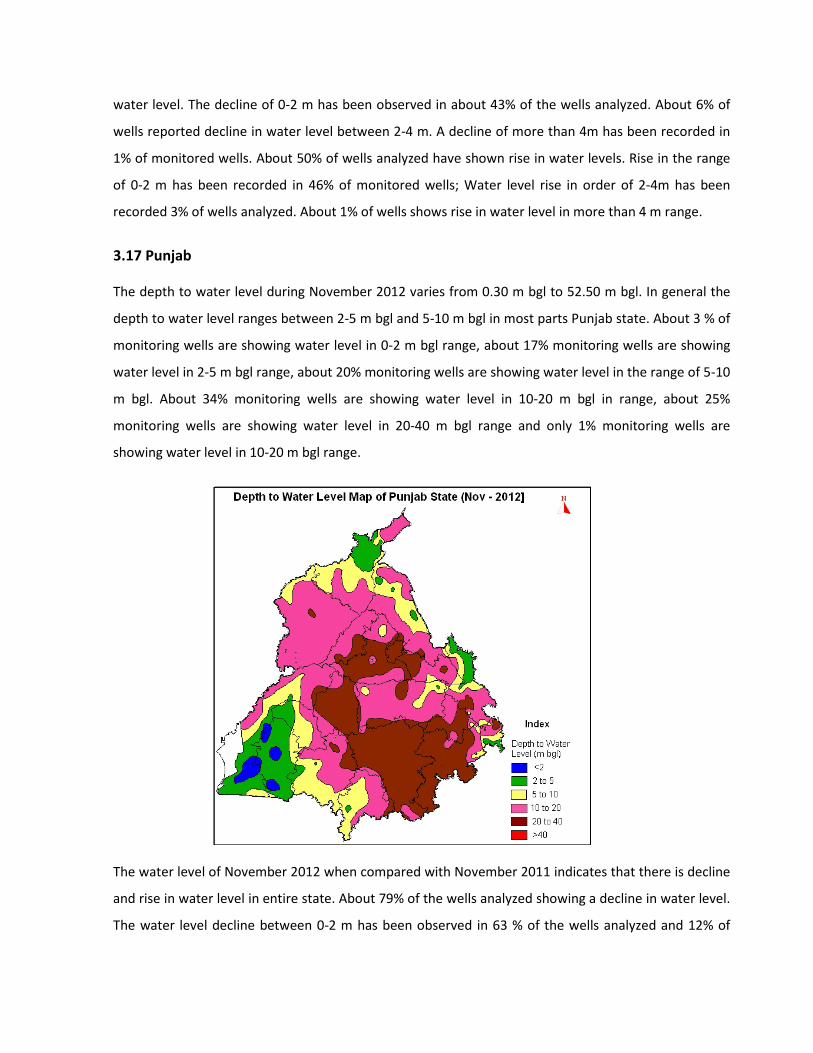
3.17 Punjab
The depth to water level during November 2012 varies from 0.30 m bgl to 52.50 m bgl. In general the
depth to water level ranges between 2-5 m bgl and 5-10 m bgl in most parts Punjab state. About 3 % of
monitoring wells are showing water level in 0-2 m bgl range, about 17% monitoring wells are showing
water level in 2-5 m bgl range, about 20% monitoring wells are showing water level in the range of 5-10
m bgl. About 34% monitoring wells are showing water level in 10-20 m bgl in range, about 25%
monitoring wells are showing water level in 20-40 m bgl range and only 1% monitoring wells are
showing water level in 10-20 m bgl range.
The water level of November 2012 when compared with November 2011 indicates that there is decline
and rise in water level in entire state. About 79% of the wells analyzed showing a decline in water level.
The water level decline between 0-2 m has been observed in 63 % of the wells analyzed and 12% of

wells showing fall >2 m. Rise in water levels is observed in 21% of the wells analyzed. The rise of 0-2 m
has been observed in 15% of the wells monitored. About 2% of the wells shows rise > 2 m. In general
most of the area has decline as well as rise is in the range of 0-2 m.
The fluctuation of water level during November 2012 when compared with the average water levels of
past decade (Decadal mean November 2002-2011) indicates in general there is decline and rise of
water level in different parts of the state. About 76% of monitored wells have registered decline in
water level. The decline of 0-2 m has been observed in about 41 % of the wells analyzed. About 19% of
wells reported decline in water level between 2-4 m. A decline of more than 4m has been recorded in
16% of monitored wells. About 24% of wells analysed have shown rise in water levels. Rise in the range
of 0-2 m has been recorded in 18% of monitored wells; Water level rise in order of 2-4m has been
recorded 4% of wells analyzed. About 2% of wells shows rise in water level in more than 4 m range.
4.18 Rajasthan
The depth to water level recorded in the state of Rajasthan during November 2012ranged from 0.01 in
Ajmer district to 113.53 m bgl in Bikaner district. It is observed that 9% of the wells analyzed have
shown water level in the range of 0-2 m bgl, 19% of the wells have shown water level in the range of 2-
5 m bgl. About 20% of the wells analyzed have shown water level in the range of 5-10 m bgl and 17% of
the wells have shown water level in the range of 10-20 m bgl. Deeper water level in the range of 20-40
m bgl is shown by 17% of the wells analyzed and water level more than 40 m bgl is shown by 18% of the
wells analyzed.
Water levels of November 2012 when compared to water level of November 2011 in the state
indicates that about 52% of the wells analyzed have recorded a fall in water level, out of which 35% of
analyzed wells have recorded a fall in the range of 0 to 2 m, 8% of analyzed wells have shown fall in the
range of 2 to 4 m and 10% of the wells have shown fall > 4 m. About 48% of the wells have shown rise
in water level, out of this 32% have recorded rise in the range of 0 to 2m, 8% have shown rise in the
range of 2 to 4 m and 8% have shown rise > 4 m.

The fluctuation of water level during November 2012 when compared with the average water levels of
past decade (Decadal mean November 2002-2011) indicates in general there is decline and rise of
water level in entire state. About 35% of monitored wells have registered decline in water level. The
decline of 0-2 m has been observed in about 15 % of the wells analyzed. About 8% of wells reported
decline in water level between 2-4 m. A decline of more than 4m has been recorded in 12% of
monitored wells. About 65% of wells analyzed have shown rise in water levels. Rise in the range of 0-2
m has been recorded in 31% of monitored wells; Water level rise in order of 2-4m has been recorded
17% of wells analyzed. About 13% of wells shows rise in water level in more than 4 m range.
4.19 Tamil Nadu
The depth to water level during November 2012 varies from 0.02 m bgl at Theni to 50.40 m bgl in
Salem district. Water level in the range of 0 to2 m bgl has been recorded in 23% of wells analyzed,
Water level in the range of 2 to 5 m bgl has been recorded in 28% of wells analyzed and noted in most
of the districts except in few patches. Depth to water level in the range of 5 to 10 m bgl has been
recorded in 32% of wells analyzed and noted in most of the districts. Depth to water level in the range
of 10 to 20 m bgl has been observed in 16% of wells analyzed and 1% of wells showing more than 20 m
bgl.
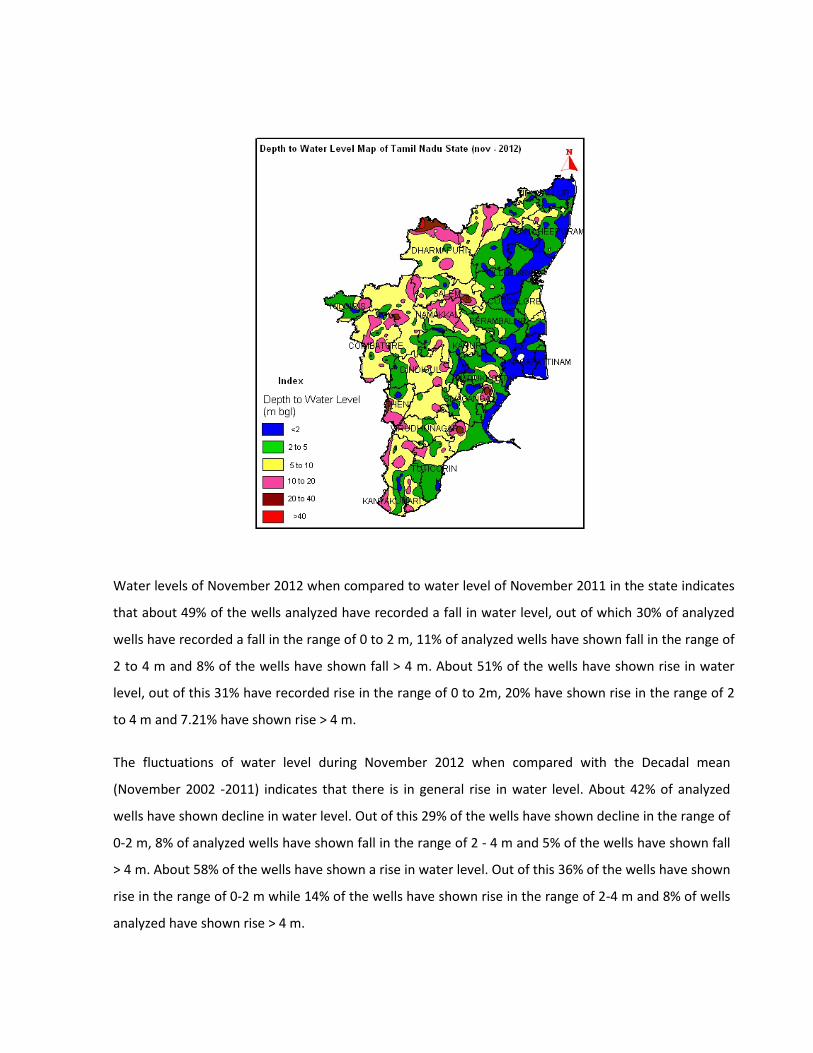
Water levels of November 2012 when compared to water level of November 2011 in the state indicates
that about 49% of the wells analyzed have recorded a fall in water level, out of which 30% of analyzed
wells have recorded a fall in the range of 0 to 2 m, 11% of analyzed wells have shown fall in the range of
2 to 4 m and 8% of the wells have shown fall > 4 m. About 51% of the wells have shown rise in water
level, out of this 31% have recorded rise in the range of 0 to 2m, 20% have shown rise in the range of 2
to 4 m and 7.21% have shown rise > 4 m.
The fluctuations of water level during November 2012 when compared with the Decadal mean
(November 2002 -2011) indicates that there is in general rise in water level. About 42% of analyzed
wells have shown decline in water level. Out of this 29% of the wells have shown decline in the range of
0-2 m, 8% of analyzed wells have shown fall in the range of 2 - 4 m and 5% of the wells have shown fall
> 4 m. About 58% of the wells have shown a rise in water level. Out of this 36% of the wells have shown
rise in the range of 0-2 m while 14% of the wells have shown rise in the range of 2-4 m and 8% of wells
analyzed have shown rise > 4 m.
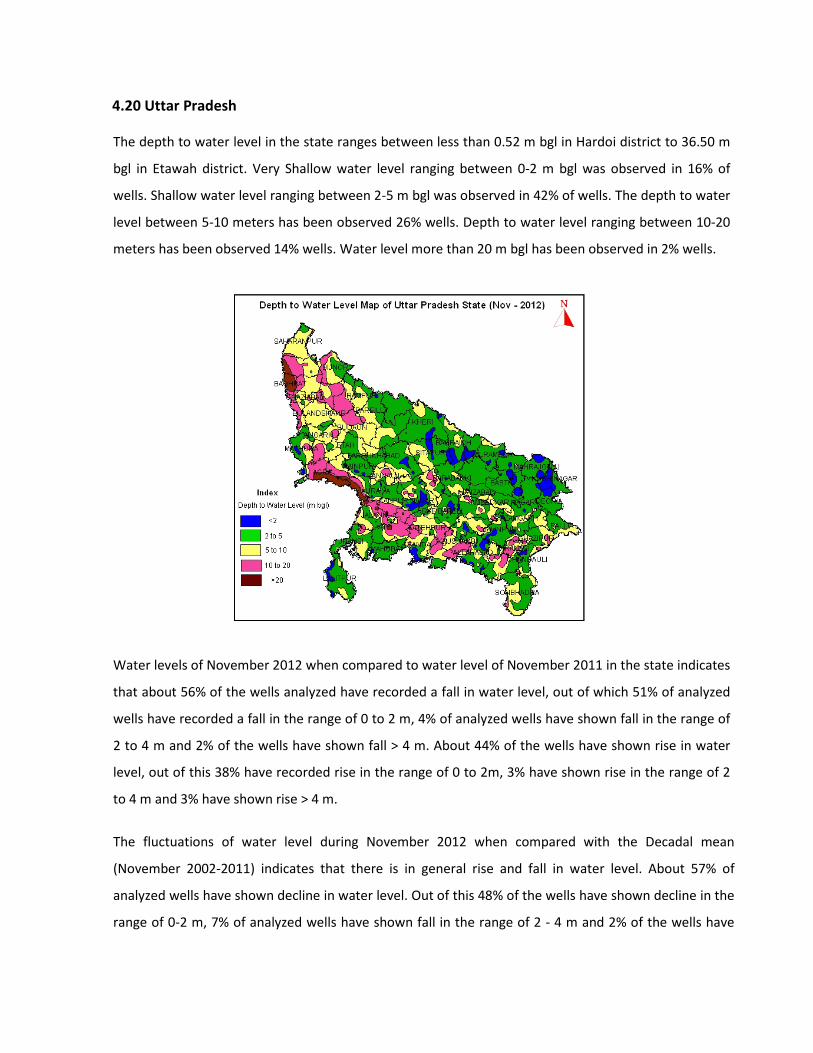
4.20 Uttar Pradesh
The depth to water level in the state ranges between less than 0.52 m bgl in Hardoi district to 36.50 m
bgl in Etawah district. Very Shallow water level ranging between 0-2 m bgl was observed in 16% of
wells. Shallow water level ranging between 2-5 m bgl was observed in 42% of wells. The depth to water
level between 5-10 meters has been observed 26% wells. Depth to water level ranging between 10-20
meters has been observed 14% wells. Water level more than 20 m bgl has been observed in 2% wells.
Water levels of November 2012 when compared to water level of November 2011 in the state indicates
that about 56% of the wells analyzed have recorded a fall in water level, out of which 51% of analyzed
wells have recorded a fall in the range of 0 to 2 m, 4% of analyzed wells have shown fall in the range of
2 to 4 m and 2% of the wells have shown fall > 4 m. About 44% of the wells have shown rise in water
level, out of this 38% have recorded rise in the range of 0 to 2m, 3% have shown rise in the range of 2
to 4 m and 3% have shown rise > 4 m.
The fluctuations of water level during November 2012 when compared with the Decadal mean
(November 2002-2011) indicates that there is in general rise and fall in water level. About 57% of
analyzed wells have shown decline in water level. Out of this 48% of the wells have shown decline in the
range of 0-2 m, 7% of analyzed wells have shown fall in the range of 2 - 4 m and 2% of the wells have

shown fall > 4 m. About 43% of the wells have shown a rise in water level. Out of this 36% of the wells
have shown rise in the range of 0-2 m while 6% of the wells have shown rise in the range of 2-4 m and
1% of wells analyzed have shown rise > 4 m.
4.21 Uttaranchal
Uttarakhand state is mainly covered by hilly/ mountainous areas. About 85% of the area is hilly and has
no appreciable ground water potential whereas about 15% of the State comprising 5263 Km2 is plain
where ground water is developed. In general depth to water in November 2012 varies from 0.70 m bgl
in Udhamsingh Nagar to 10.89 m bgl in Hardwar district.
The depth to water level in the state ranging between 0-2 m bgl was observed in 26% of wells. Shallow
water level ranging between 2-5 m bgl was observed in 31% of wells. The depth to water level between
5-10 meters has been observed 39% wells. Depth to water level ranging between 10-20 meters has
been observed 4% wells. Water level more than 20 m bgl has been observed.
The comparison of November 2012 water levels with November 2011 reveals that there is general rise
and fall in water level. About 33% of the well analyzed have shown fall in water level. Out of this the fall
in water level for 0-2 m has been observed for 24% of wells whereas the fall in water levels for 2-4 m
has been observed for 9 % wells. The rise in water level is observed in 66% of the wells analyzed. Out of
this the rise in water level for 0-2 m has been observed for 43% of wells whereas the fall in water levels
for 2-4 m has been observed for 19% wells and 4% has been observed in depth range more than 4 m
bgl.
The fluctuations of water level during November 2012 when compared with the Decadal mean
(November 2002-2011) indicates that there is in general rise and fall in water level. About 68% of
analyzed wells have shown decline in water level. Out of this 57% of the wells have shown decline in the
range of 0-2 m, 11% of analyzed wells have shown fall in the range of 2 - 4 m and 1% of the wells have
shown fall > 4 m. About 32% of the wells have shown a rise in water level. Out of this 28% of the wells
have shown rise in the range of 0-2 m while 2% of the wells have shown rise in the range of 2-4 m and
1% of wells analyzed have shown rise > 4 m.
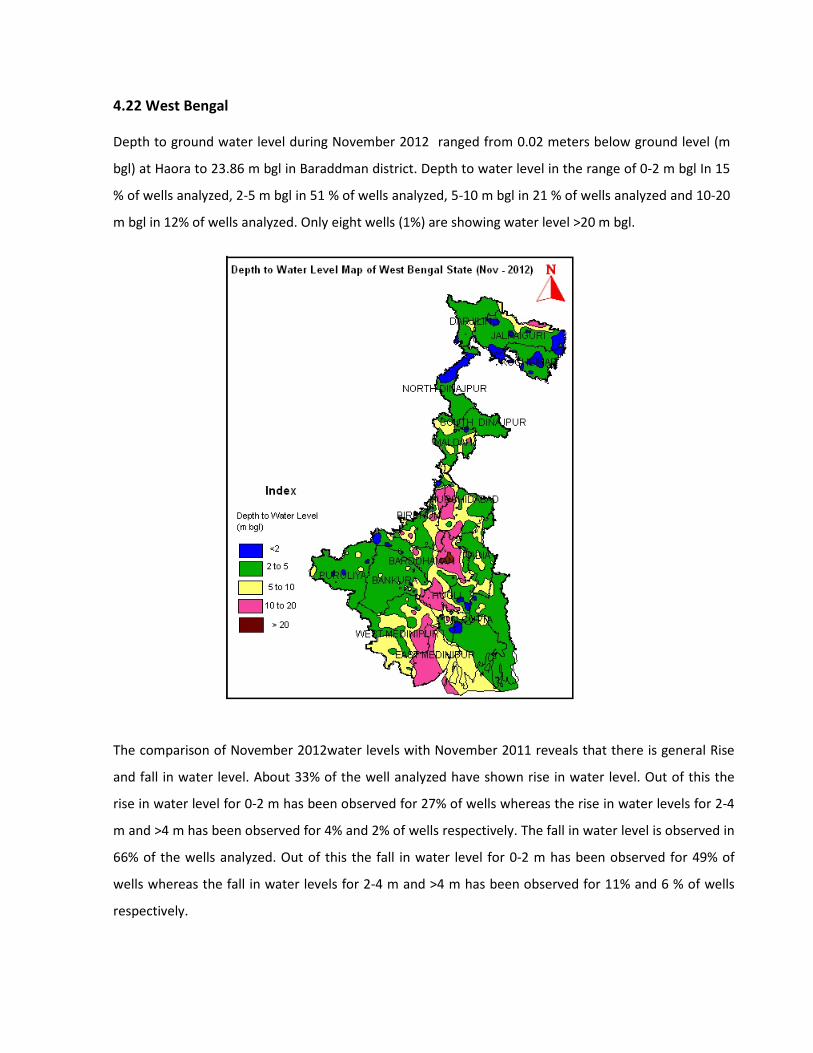
4.22 West Bengal
Depth to ground water level during November 2012 ranged from 0.02 meters below ground level (m
bgl) at Haora to 23.86 m bgl in Baraddman district. Depth to water level in the range of 0-2 m bgl In 15
% of wells analyzed, 2-5 m bgl in 51 % of wells analyzed, 5-10 m bgl in 21 % of wells analyzed and 10-20
m bgl in 12% of wells analyzed. Only eight wells (1%) are showing water level >20 m bgl.
The comparison of November 2012water levels with November 2011 reveals that there is general Rise
and fall in water level. About 33% of the well analyzed have shown rise in water level. Out of this the
rise in water level for 0-2 m has been observed for 27% of wells whereas the rise in water levels for 2-4
m and >4 m has been observed for 4% and 2% of wells respectively. The fall in water level is observed in
66% of the wells analyzed. Out of this the fall in water level for 0-2 m has been observed for 49% of
wells whereas the fall in water levels for 2-4 m and >4 m has been observed for 11% and 6 % of wells
respectively.

The comparison of November 2012 water levels with decadal mean of (November 2002-2011) reveals
that about 72% of the analyzed have shown decline in water level. Out of this 49% of the wells shown
decline in the range of 0-2 m, 11% of the wells shown decline in the range of 2-4 m and about 12% of
the wells shown decline in the range of more than 4 m of the analyzed wells.
About 28 % of the analyzed have shown Rise in water level. Out of this 25% of the wells shown rise in
the range of 0-2 m, 2% of the wells shown rise in the range of 2-4 m and about 1% of the wells shown
rise in the range of more than 4 m of the analyzed wells.
*********************

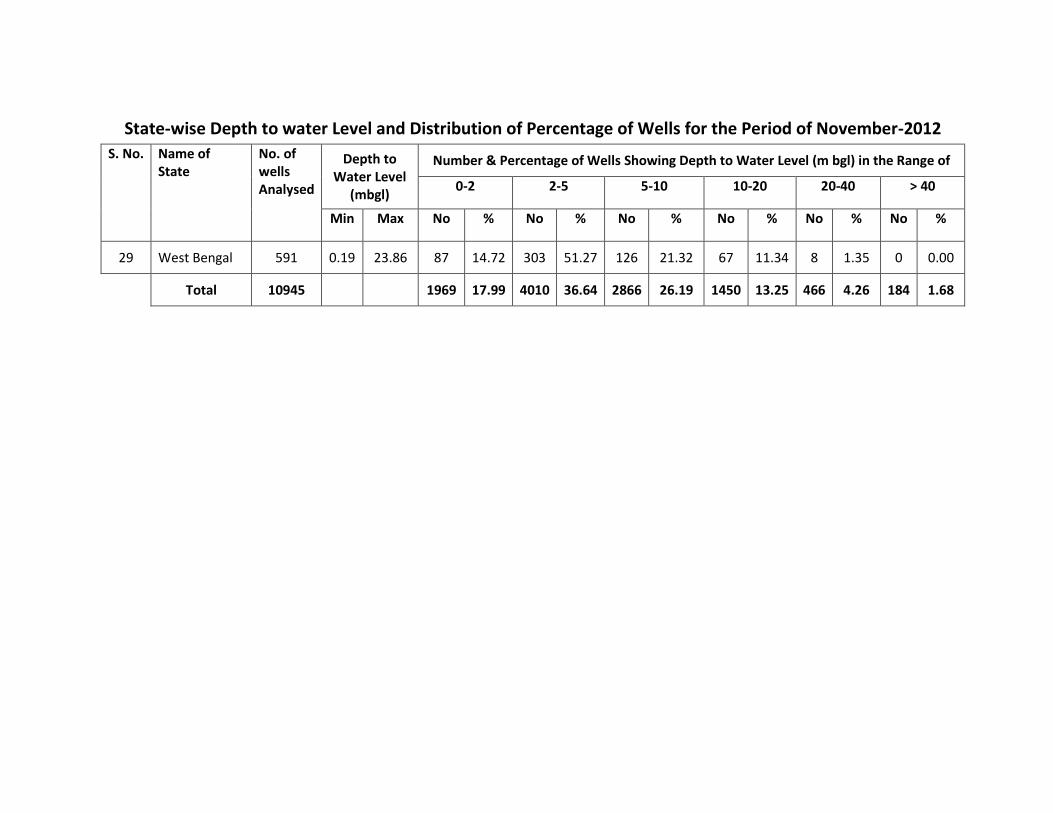
State-wise Depth to water Level and Distribution of Percentage of Wells for the Period of November-2012 S. No. Name of
State No. of wells Analysed
Depth to Water Level
(mbgl)
Number & Percentage of Wells Showing Depth to Water Level (m bgl) in the Range of
0-2 2-5 5-10 10-20 20-40 > 40
Min Max No % No % No % No % No % No %
1 Andhra Pradesh
760 0.37 28.32 284 37.37 215 28.29 177 23.29 78 10.26 6 0.79 0 0.00
2 Arunachal Pradesh
11 1.44 8.00 1 9.09 8 72.73 2 18.18 0 0.00 0 0.00 0 0.00
3 Assam 204 0.01 18.96 98 48.04 87 42.65 16 7.84 3 1.47 0 0.00 0 0.00
4 Bihar 223 0.35 11.75 38 17.04 137 61.43 45 20.18 3 1.35 0 0.00 0 0.00
5 Chandigarh 19 2.03 47.78 0 0.00 4 21.05 5 26.32 5 26.32 4 21.05 1 5.26
6 Chhattisgarh 438 0.19 24.90 106 24.20 242 55.25 70 15.98 17 3.88 3 0.68 0 0.00
7 Dadra & Nagar Haveli
6 1.75 7.96 1 16.67 4 66.67 1 16.67 0 0.00 0 0.00 0 0.00
8 Delhi 127 0.69 66.40 7 5.51 30 23.62 34 26.77 32 25.20 10 7.87 14 11.02
9 Goa 40 0.21 14.65 9 22.50 18 45.00 10 25.00 3 7.50 0 0.00 0 0.00
10 Gujarat 760 0.13 99.83 59 7.76 207 27.24 239 31.45 170 22.37 77 10.13 8 1.05
11 Haryana 404 0.14 70.90 38 9.41 79 19.55 78 19.31 125 30.94 72 17.82 12 2.97
12 Himachal Pradesh
73 0.37 27.54 13 17.81 29 39.73 18 24.66 9 12.33 4 5.48 0 0.00
13 Jammu & Kashmir
139 0.31 32.52 48 34.53 55 39.57 20 14.39 8 5.76 8 5.76 0 0.00
14 Jharkhand 122 0.55 13.85 7 5.74 68 55.74 45 36.89 2 1.64 0 0.00 0 0.00

State-wise Depth to water Level and Distribution of Percentage of Wells for the Period of November-2012 S. No. Name of
State No. of wells Analysed
Depth to Water Level
(mbgl)
Number & Percentage of Wells Showing Depth to Water Level (m bgl) in the Range of
0-2 2-5 5-10 10-20 20-40 > 40
Min Max No % No % No % No % No % No %
15 Karnataka 872 0.03 23.56 129 14.79 271 31.08 291 33.37 180 20.64 1 0.11 0 0.00
16 Kerala 663 0.10 38.28 120 18.10 211 31.83 251 37.86 73 11.01 8 1.21 0 0.00
17 Madhya Pradesh
965 0.37 47.00 82 8.50 417 43.21 336 34.82 107 11.09 21 2.18 2 0.21
18 Maharastra 1107 0.20 55.20 166 15.00 459 41.46 350 31.62 118 10.66 13 1.17 1 0.09
19 Manipur 1 5.89 5.89 0 0.00 0 0.00 1 100.00 0 0.00 0 0.00 0 0.00
20 Meghalaya 27 0.15 7.13 11 40.74 15 55.56 1 3.70 0 0.00 0 0.00 0 0.00
21 Orissa 829 0.02 13.97 309 37.27 408 49.22 107 12.91 5 0.60 0 0.00 0 0.00
22 Pondicherry 4 1.83 3.85 1 25.00 3 75.00 0 0.00 0 0.00 0 0.00 0 0.00
23 Punjab 247 0.30 52.50 8 3.24 42 17.00 50 20.24 84 34.01 62 25.10 1 0.40
24 Rajasthan 826 0.01 113.53 73 8.84 158 19.13 166 20.10 145 17.55 141 17.07 143 17.31
25 Tamil Nadu 587 0.02 50.40 132 22.49 165 28.11 188 32.03 94 16.01 6 1.02 2 0.34
26 Tripura 27 1.43 6.40 3 11.11 16 59.26 8 29.63 0 0.00 0 0.00 0 0.00
27 Uttar Pradesh 850 0.63 36.50 133 15.65 352 41.41 222 26.12 121 14.24 22 2.59 0 0.00
28 Uttaranchal 23 0.70 10.89 6 26.09 7 30.43 9 39.13 1 4.35 0 0.00 0 0.00
State-wise Depth to water Level and Distribution of Percentage of Wells for the Period of November-2012 S. No. Name of
State No. of wells Analysed
Depth to Water Level
(mbgl)
Number & Percentage of Wells Showing Depth to Water Level (m bgl) in the Range of
0-2 2-5 5-10 10-20 20-40 > 40
Min Max No % No % No % No % No % No %
29 West Bengal 591 0.19 23.86 87 14.72 303 51.27 126 21.32 67 11.34 8 1.35 0 0.00
Total 10945 1969 17.99 4010 36.64 2866 26.19 1450 13.25 466 4.26 184 1.68

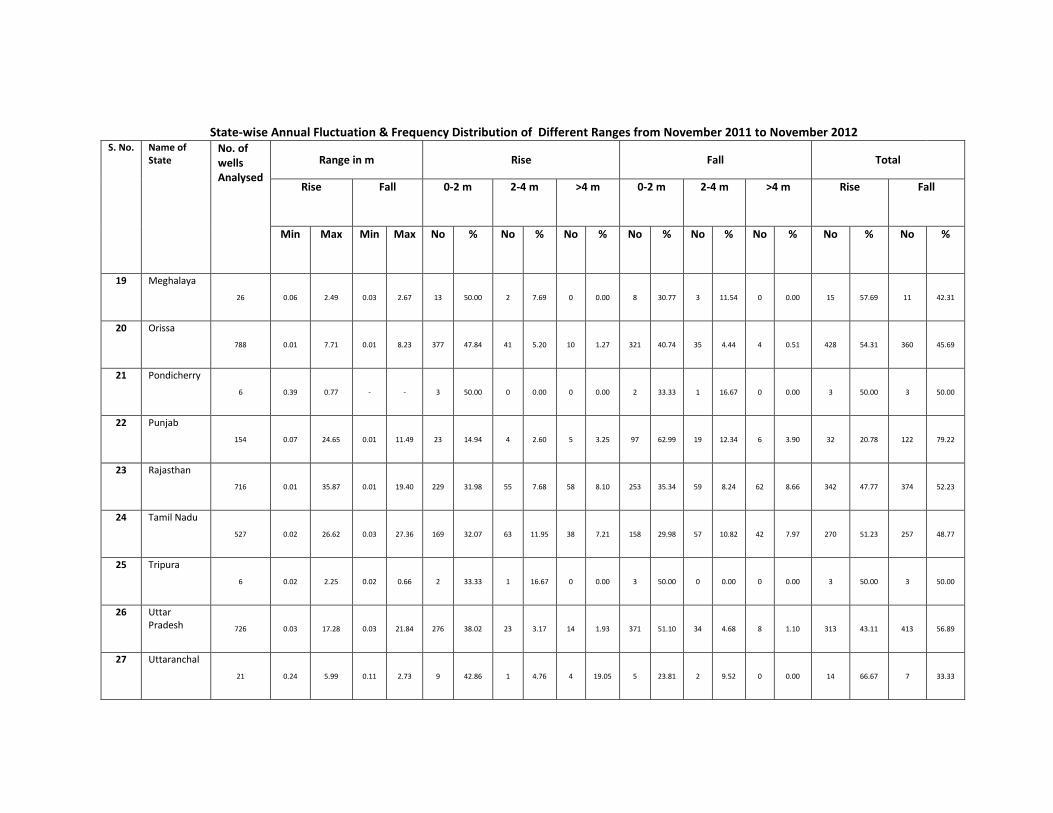
State-wise Annual Fluctuation & Frequency Distribution of Different Ranges from November 2011 to November 2012
S. No. Name of State
No. of wells Analysed
Range in m Rise Fall Total
Rise Fall 0-2 m 2-4 m >4 m 0-2 m 2-4 m >4 m Rise Fall
Min Max Min Max No % No % No % No % No % No % No % No %
1 Andhra Pradesh 693 0.02 12.63 0.03 13.39 322 46.46 99 14.29 33 4.76 158 22.80 47 6.78 34 4.91 454 65.51 239 34.49
2 Arunachal Pradesh 10 0.96 1.40 0.03 0.79 6 60.00 1 10.00 0 0.00 2 20.00 1 10.00 0 0.00 7 70.00 3 30.00
3 Assam
191 0.04 1.22 0.04 11.68 125 65.45 2 1.05 0 0.00 58 30.37 5 2.62 1 0.52 127 66.49 64 33.51
4 Bihar
186 0.02 6.26 0.03 3.75 61 32.80 3 1.61 1 0.54 111 59.68 7 3.76 3 1.61 65 34.95 121 65.05
5 Chandigarh
19 0.02 4.05 0.50 0.89 14 73.68 2 10.53 1 5.26 2 10.53 0 0.00 0 0.00 17 89.47 2 10.53
6 Chhattisgarh
293 0.05 7.10 0.03 7.80 212 72.35 20 6.83 5 1.71 52 17.75 1 0.34 3 1.02 237 80.89 56 19.11
7 Dadra & Nagar Haveli 6 0.72 1.06 0.00 0.00 5 83.33 0 0.00 0 0.00 1 16.67 0 0.00 0 0.00 5 83.33 1 16.67
8 Delhi
119 0.04 3.85 0.02 4.26 21 17.65 1 0.84 1 0.84 78 65.55 15 12.61 3 2.52 23 19.33 96 80.67
9 Goa
39 0.01 2.13 0.02 1.68 20 51.28 1 2.56 0 0.00 18 46.15 0 0.00 0 0.00 21 53.85 18 46.15

State-wise Annual Fluctuation & Frequency Distribution of Different Ranges from November 2011 to November 2012
S. No. Name of State
No. of wells Analysed
Range in m Rise Fall Total
Rise Fall 0-2 m 2-4 m >4 m 0-2 m 2-4 m >4 m Rise Fall
Min Max Min Max No % No % No % No % No % No % No % No %
10 Gujarat
728 0.03 42.73 0.01 30.26 202 27.75 62 8.52 44 6.04 204 28.02 86 11.81 130 17.86 308 42.31 420 57.69
11 Haryana
288 0.01 11.36 0.02 25.95 89 30.90 6 2.08 5 1.74 155 53.82 20 6.94 13 4.51 100 34.72 188 65.28
12 Himachal Pradesh 73 0.02 8.89 0.02 4.37 29 39.73 0 0.00 3 4.11 38 52.05 2 2.74 1 1.37 32 43.84 41 56.16
13 Jammu & Kashmir 123 0.02 7.36 0.01 4.90 47 38.21 3 2.44 1 0.81 68 55.28 3 2.44 1 0.81 51 41.46 72 58.54
14 Jharkhand
97 0.10 3.34 0.07 2.80 31 31.96 5 5.15 0 0.00 54 55.67 7 7.22 0 0.00 36 37.11 61 62.89
15 Karnataka
753 0.01 8.38 0.09 16.58 243 32.27 26 3.45 10 1.33 293 38.91 91 12.08 90 11.95 279 37.05 474 62.95
16 Kerala
580 0.01 4.80 0.01 8.40 159 27.41 17 2.93 3 0.52 341 58.79 47 8.10 13 2.24 179 30.86 401 69.14
17 Madhya Pradesh 859 0.02 38.45 0.05 34.48 308 35.86 48 5.59 33 3.84 376 43.77 62 7.22 32 3.73 389 45.29 470 54.71
18 Maharastra
932 0.02 20.49 0.05 17.75 331 35.52 53 5.69 27 2.90 334 35.84 115 12.34 72 7.73 411 44.10 521 55.90
State-wise Annual Fluctuation & Frequency Distribution of Different Ranges from November 2011 to November 2012
S. No. Name of State
No. of wells Analysed
Range in m Rise Fall Total
Rise Fall 0-2 m 2-4 m >4 m 0-2 m 2-4 m >4 m Rise Fall
Min Max Min Max No % No % No % No % No % No % No % No %
19 Meghalaya
26 0.06 2.49 0.03 2.67 13 50.00 2 7.69 0 0.00 8 30.77 3 11.54 0 0.00 15 57.69 11 42.31
20 Orissa
788 0.01 7.71 0.01 8.23 377 47.84 41 5.20 10 1.27 321 40.74 35 4.44 4 0.51 428 54.31 360 45.69
21 Pondicherry
6 0.39 0.77 - - 3 50.00 0 0.00 0 0.00 2 33.33 1 16.67 0 0.00 3 50.00 3 50.00
22 Punjab
154 0.07 24.65 0.01 11.49 23 14.94 4 2.60 5 3.25 97 62.99 19 12.34 6 3.90 32 20.78 122 79.22
23 Rajasthan
716 0.01 35.87 0.01 19.40 229 31.98 55 7.68 58 8.10 253 35.34 59 8.24 62 8.66 342 47.77 374 52.23
24 Tamil Nadu
527 0.02 26.62 0.03 27.36 169 32.07 63 11.95 38 7.21 158 29.98 57 10.82 42 7.97 270 51.23 257 48.77
25 Tripura
6 0.02 2.25 0.02 0.66 2 33.33 1 16.67 0 0.00 3 50.00 0 0.00 0 0.00 3 50.00 3 50.00
26 Uttar Pradesh 726 0.03 17.28 0.03 21.84 276 38.02 23 3.17 14 1.93 371 51.10 34 4.68 8 1.10 313 43.11 413 56.89
27 Uttaranchal
21 0.24 5.99 0.11 2.73 9 42.86 1 4.76 4 19.05 5 23.81 2 9.52 0 0.00 14 66.67 7 33.33

State-wise Annual Fluctuation & Frequency Distribution of Different Ranges from November 2011 to November 2012
S. No. Name of State
No. of wells Analysed
Range in m Rise Fall Total
Rise Fall 0-2 m 2-4 m >4 m 0-2 m 2-4 m >4 m Rise Fall
Min Max Min Max No % No % No % No % No % No % No % No %
28 West Bengal
346 0.01 15.62 16.99 20.13 94 27.17 13 3.76 7 2.02 171 49.42 38 10.98 23 6.65 114 32.95 232 67.05
Total
9305 3420 36.75 552 5.93 303 3.26 3732 40.11 757 8.14 541 5.81 4275 45.94 5030 54.06

State-wise Decadal Water Level Fluctuation With Mean [Nov(2002 to 2011)] and Nov 2012
S. No. Name of State No. of wells Analysed
Range in m Rise Fall
Rise Fall Rise Fall 0-2 m 2-4 m >4 m 0-2 m 2-4 m >4 m
Min Max Min Max No % No % No % No % No % No % No % No %
1 Andhra Pradesh 693 0.02 12.63 0.02 13.39 322 46.46 99 14.29 33 4.76 158 22.80 47 6.78 34 4.91 454 65.51 239 34.49
2 Arunachal Pradesh 11 0.23 0.92 0.34 1.89 8 72.73 0 0.00 0 0.00 3 27.27 0 0.00 0 0.00 8 72.73 3 27.27
3 Assam
121 0.05 2.08 0.01 2.28 48 39.67 4 3.31 0 0.00 61 50.41 6 4.96 2 1.65 52 42.98 69 57.02
4 Bihar
219 0.04 3.66 0.10 4.77 77 35.16 5 2.27 1 0.46 123 56.16 10 4.57 3 1.37 83 37.90 136 62.10
5 Chandigarh
19 0.14 4.83 0.22 4.28 6 31.58 1 5.26 1 5.26 10 52.63 0 0.00 1 5.26 8 42.11 11 57.89
6 Chhattisgarh
373 0.01 8.00 0.00 2.61 220 58.98 23 6.17 6 1.61 117 31.37 4 1.07 3 0.80 249 66.76 124 33.24
7 Dadra & Nagar Haveli 5 0.39 0.69 0.00 0.63 3 60.00 0 0.00 0 0.00 2 40.00 0 0.00 0 0.00 3 60.00 2 40.00
8 Delhi
127 0.01 4.04 0.02 6.08 33 25.98 3 2.36 1 0.79 55 43.31 17 13.39 18 14.17 37 29.13 90 70.87
9 Goa
35 0.06 6.81 0.00 1.30 18 51.43 2 5.71 0 0.00 15 42.86 0 0.00 0 0.00 20 57.14 15 42.86

State-wise Decadal Water Level Fluctuation With Mean [Nov(2002 to 2011)] and Nov 2012
S. No. Name of State No. of wells Analysed
Range in m Rise Fall
Rise Fall Rise Fall 0-2 m 2-4 m >4 m 0-2 m 2-4 m >4 m
Min Max Min Max No % No % No % No % No % No % No % No %
10 Gujarat
728 0.00 16.07 0.01 29.21 202 27.75 62 8.52 44 6.04 204 28.02 86 11.81 130 17.86 308 42.31 420 57.69
11 Haryana
317 0.01 10.18 0.03 18.52 115 36.28 12 3.79 8 2.52 92 29.02 44 13.88 46 14.51 135 42.59 182 57.41
12 Himachal Pradesh 73 0.00 13.25 0.01 2.76 41 56.16 4 5.48 3 4.11 22 30.14 3 4.11 0 0.00 48 65.75 25 34.25
13 Jammu & Kashmir 129 0.01 4.91 0.01 4.45 69 53.49 3 2.33 1 0.78 48 37.21 6 4.65 2 1.55 73 56.59 56 43.41
14 Jharkhand
118 0.08 9.39 0.11 5.52 51 43.22 6 5.08 1 0.85 49 41.53 10 8.47 1 0.85 58 49.15 60 50.85
15 Karnataka
868 0.01 5.72 0.01 15.85 264 30.41 47 5.41 19 2.19 332 38.25 131 15.09 75 8.64 330 38.02 538 61.98
16 Kerala
677 0.01 6.70 0.02 10.56 331 48.89 34 5.02 23 3.40 231 34.12 42 6.20 16 2.36 388 57.31 289 42.69
17 Madhya Pradesh 945 0.03 14.44 0.05 33.53 422 44.66 155 16.40 74 7.83 231 24.44 41 4.34 22 2.33 651 68.89 294 31.11
18 Maharastra
1042 0.03 19.64 0.10 10.87 398 38.20 65 6.24 29 2.78 387 37.14 102 9.79 61 5.85 492 47.22 550 52.78

State-wise Decadal Water Level Fluctuation With Mean [Nov(2002 to 2011)] and Nov 2012
S. No. Name of State No. of wells Analysed
Range in m Rise Fall
Rise Fall Rise Fall 0-2 m 2-4 m >4 m 0-2 m 2-4 m >4 m
Min Max Min Max No % No % No % No % No % No % No % No %
19 Meghalaya
26 0.02 1.58 0.04 2.67 17 65.38 0 0.00 0 0.00 7 26.92 2 7.69 0 0.00 17 65.38 9 34.62
20 Orissa
827 0.01 5.35 0.10 8.23 379 45.83 32 3.87 1 0.12 359 43.41 50 6.05 6 0.73 412 49.82 415 50.18
21 Pondicherry
7 0.79 1.30 0.23 2.44 2 28.57 0 0.00 0 0.00 4 57.14 1 14.29 0 0.00 2 28.57 5 71.43
22 Punjab
176 0.03 15.05 0.01 11.72 32 18.18 7 3.98 3 1.70 72 40.91 34 19.32 28 15.91 42 23.86 134 76.14
23 Rajasthan
809 0.00 59.49 0.01 24.26 248 30.66 135 16.69 136 16.81 123 15.20 67 8.28 100 12.36 519 64.15 290 35.85
24 Tamil Nadu
581 0.01 29.99 0.00 32.57 210 36.14 83 14.29 39 6.71 167 28.74 51 8.78 31 5.34 332 57.14 249 42.86
25 Tripura
6 0.07 2.04 0.02 1.46 4 66.67 1 16.67 0 0.00 1 16.67 0 0.00 0 0.00 5 83.33 1 16.67
26 Uttar Pradesh
815 0.01 5.25 0.01 8.73 296 36.32 45 5.52 10 1.23 388 47.61 56 6.87 20 2.45 351 43.07 464 56.93
27 Uttaranchal
35 0.03 7.91 0.03 2.61 10 28.57 1 2.86 0 0.00 20 57.14 4 11.43 0 0.00 11 31.43 24 68.57

State-wise Decadal Water Level Fluctuation With Mean [Nov(2002 to 2011)] and Nov 2012
S. No. Name of State No. of wells Analysed
Range in m Rise Fall
Rise Fall Rise Fall 0-2 m 2-4 m >4 m 0-2 m 2-4 m >4 m
Min Max Min Max No % No % No % No % No % No % No % No %
28 West Bengal
574 0.01 4.33 0.01 18.21 140 24.39 13 2.26 3 0.52 283 49.30 65 11.32 70 12.20 156 27.18 418 72.82
Total
10356 3966 38.30 842 8.13 436 4.21 3564 34.41 879 8.49 669 6.46 5244 50.64 5112 49.36

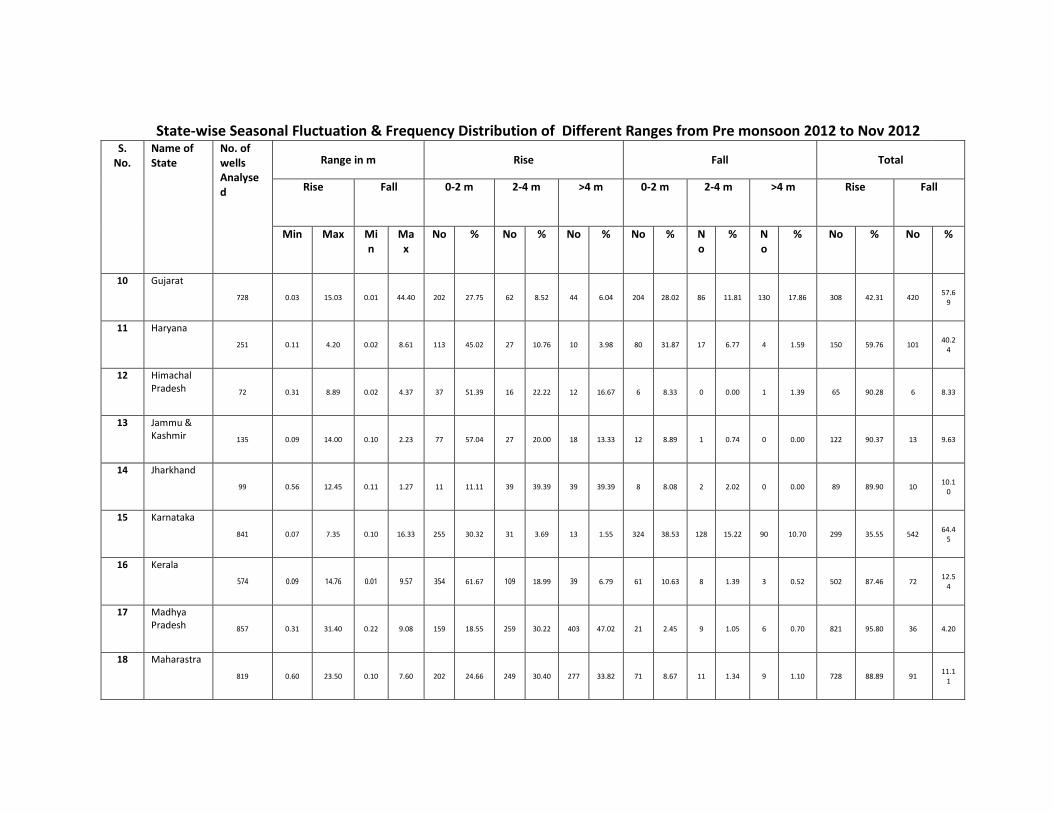
State-wise Seasonal Fluctuation & Frequency Distribution of Different Ranges from Pre monsoon 2012 to Nov 2012
S. No.
Name of State
No. of wells Analysed
Range in m Rise Fall Total
Rise Fall 0-2 m 2-4 m >4 m 0-2 m 2-4 m >4 m Rise Fall
Min Max Min
Max
No % No % No % No % No
% No
% No % No %
1 Andhra Pradesh 647 1.69 3.52 0.01 20.84 292 45.13 107 16.54 32 32.00 151 23.34 40 6.18 25 3.86 431 66.62 216
33.38
2 Arunachal Pradesh 5 0.96 1.40 0.03 0.79 3 60.00 0.00 0.00 2 40.00 0.00 0.00 3 60.00 2
40.00
3 Assam
203 1.89 3.52 0.03 2.53 123 60.59 5 2.46 0 0.00 70 34.48 3 1.48 2 0.99 128 63.05 75 36.9
5
4 Bihar
202 0.39 10.55 0.02 9.00 101 50.00 64 31.68 29 14.36 8 3.96 0 0.00 0 0.00 194 96.04 8 3.96
5 Chandigarh
33 0.20 1.87 0.01 3.18 8 24.24 0 0.00 0 0.00 24 72.73 1 3.03 0 0.00 8 24.24 25 75.7
6
6 Chhattisgarh 342 12.40 0.02 7.20 65 19.01 127 37.13 144 42.11 4 1.17 2 0.58 0 0.00 336 98.25 6 1.75
7 Dadra & Nagar Haveli
5 0.30 2.90 0.30 0.30 3 60.00 1 20.00 0 0.00 1 20.00 0 0.00 0 0.00 4 80.00 1 20.0
0
8 Delhi
123 0.02 4.06 0.02 8.01 52 42.28 1 0.81 3 2.44 66 53.66 1 0.81 0 0.00 56 45.53 67 54.4
7
9 Goa
39 0.20 1.79 0.01 3.18 21 53.85 10 25.64 3 7.69 4 10.26 1 2.56 0 0.00 34 87.18 5 12.8
2
State-wise Seasonal Fluctuation & Frequency Distribution of Different Ranges from Pre monsoon 2012 to Nov 2012
S. No.
Name of State
No. of wells Analysed
Range in m Rise Fall Total
Rise Fall 0-2 m 2-4 m >4 m 0-2 m 2-4 m >4 m Rise Fall
Min Max Min
Max
No % No % No % No % No
% No
% No % No %
10 Gujarat
728 0.03 15.03 0.01 44.40 202 27.75 62 8.52 44 6.04 204 28.02 86 11.81 130 17.86 308 42.31 420 57.6
9
11 Haryana
251 0.11 4.20 0.02 8.61 113 45.02 27 10.76 10 3.98 80 31.87 17 6.77 4 1.59 150 59.76 101 40.2
4
12 Himachal Pradesh 72 0.31 8.89 0.02 4.37 37 51.39 16 22.22 12 16.67 6 8.33 0 0.00 1 1.39 65 90.28 6 8.33
13 Jammu & Kashmir 135 0.09 14.00 0.10 2.23 77 57.04 27 20.00 18 13.33 12 8.89 1 0.74 0 0.00 122 90.37 13 9.63
14 Jharkhand
99 0.56 12.45 0.11 1.27 11 11.11 39 39.39 39 39.39 8 8.08 2 2.02 0 0.00 89 89.90 10 10.1
0
15 Karnataka
841 0.07 7.35 0.10 16.33 255 30.32 31 3.69 13 1.55 324 38.53 128 15.22 90 10.70 299 35.55 542 64.4
5
16 Kerala
574 0.09 14.76 0.01 9.57 354 61.67 109 18.99 39 6.79 61 10.63 8 1.39 3 0.52 502 87.46 72 12.5
4
17 Madhya Pradesh 857 0.31 31.40 0.22 9.08 159 18.55 259 30.22 403 47.02 21 2.45 9 1.05 6 0.70 821 95.80 36 4.20
18 Maharastra
819 0.60 23.50 0.10 7.60 202 24.66 249 30.40 277 33.82 71 8.67 11 1.34 9 1.10 728 88.89 91 11.1
1

State-wise Seasonal Fluctuation & Frequency Distribution of Different Ranges from Pre monsoon 2012 to Nov 2012
S. No.
Name of State
No. of wells Analysed
Range in m Rise Fall Total
Rise Fall 0-2 m 2-4 m >4 m 0-2 m 2-4 m >4 m Rise Fall
Min Max Min
Max
No % No % No % No % No
% No
% No % No %
19 Meghalaya
23 0.51 3.86 0.11 1.62 17 73.91 4 17.39 0 0.00 2 8.70 0 0.00 0 0.00 21 91.30 2 8.70
20 Orissa
707 0.11 9.34 0.07 2.37 202 28.57 303 42.86 159 22.49 42 5.94 1 0.14 0 0.00 664 93.92 43 6.08
21 Pondicherry
6 0.39 0.77 - - 3 50.00 0 0.00 0 0.00 2 33.33 1 16.67 0 0.00 3 50.00 3 50.0
0
22 Punjab
162 0.01 13.03 0.02 9.30 55 33.95 4 2.47 5 3.09 78 48.15 15 9.26 5 3.09 64 39.51 98 60.4
9
23 Rajasthan
698 0.08 36.85 0.00 36.00 229 32.81 102 14.61 172 24.64 142 20.34 27 3.87 26 3.72 503 72.06 195 27.9
4
24 Tamil Nadu
483 0.09 25.89 0.04 18.90 176 36.44 101 20.91 56 11.59 92 19.05 29 6.00 29 6.00 333 68.94 150 31.0
6
25 Tripura
6 0.01 2.79 0.23 0.96 2 33.33 1 16.67 0 0.00 3 50.00 0 0.00 0 0.00 3 50.00 3 50.0
0
26 Uttar Pradesh 784 0.20 19.28 0.05 11.92 388 49.49 220 28.06 85 10.84 80 10.20 9 1.15 2 0.26 693 88.39 91
11.61
27 Uttaranchal
19 1.00 11.31 0.16 4.85 9 47.37 3 15.79 7 36.84 0 0.00 0 0.00 0 0.00 19 100.00 0 0.00

State-wise Seasonal Fluctuation & Frequency Distribution of Different Ranges from Pre monsoon 2012 to Nov 2012
S. No.
Name of State
No. of wells Analysed
Range in m Rise Fall Total
Rise Fall 0-2 m 2-4 m >4 m 0-2 m 2-4 m >4 m Rise Fall
Min Max Min
Max
No % No % No % No % No
% No
% No % No %
28 West Bengal
331 0.07 12.21 0.03 10.09 159 48.04 84 25.38 52 15.71 28 8.46 3 0.91 5 1.51 295 89.12 36 10.8
8
Total
9194 3318 36.09 1956 21.27 160
2 17.42
1586
17.25 395 4.30 337 3.67 6876 74.79 2317 25.2
0