Ground Water in Fountain and Jimmy Camp Valleys El … · Ground Water in Fountain and Jimmy Camp...
76
Ground Water in Fountain and Jimmy Camp Valleys El Paso County Colorado By EDWARD D. JENKINS With a section on COMPUTATIONS OF DRAWDOWNS CAUSED BY THE PUMPING OF WELLS IN FOUNTAIN VALLEY By ROBERT E. GLOVER and EDWARD D. JENKINS GEOLOGICAL SURVEY WATER-SUPPLY PAPER 1583 Prepared in cooperation with the city of Colorado Springs and the Fountain Valley Water Users Association UNITED STATES GOVERNMENT PRINTING OFFICE, WASHINGTON : 1964
Transcript of Ground Water in Fountain and Jimmy Camp Valleys El … · Ground Water in Fountain and Jimmy Camp...

Ground Water in Fountain and Jimmy Camp Valleys El Paso County ColoradoBy EDWARD D. JENKINS
With a section on COMPUTATIONS OF DRAWDOWNS CAUSED BY THE PUMPING OF WELLS IN FOUNTAIN VALLEY
By ROBERT E. GLOVER and EDWARD D. JENKINS
GEOLOGICAL SURVEY WATER-SUPPLY PAPER 1583
Prepared in cooperation with the city of Colorado Springs and the Fountain Valley Water Users Association
UNITED STATES GOVERNMENT PRINTING OFFICE, WASHINGTON : 1964

UNITED STATES DEPARTMENT OF THE INTERIOR
STEWART L. UDALL, Secretary
GEOLOGICAL SURVEY
Thomas B. Nolan, Director
The U.S. Geological Survey Library has cataloged this publication as follows:
Jenkins, Edward D., 1916-
Ground water in Fountain and Jimmy Camp Valleys, El Paso County, Colorado. With a section on Computations of drawdowns caused by the pumping of wTells in Fountain Valley, by Robert E. Glover and Edward D. Jenkins. Washington, U.S. Govt. Print. Off., 1964.
v, 66 p. illus., maps (1 col.) diagrs., tables. 24 cm. (U.S Geological Survey. Water-supply paper 1583)
Part of illustrative matter fold, in pocket.
Prepared in cooperation with the city of Colorado Springs and the Fountain Valley Water Users Association.
Bibliography: p. 62-64.
1. Water-supply Colorado El Paso Co. 2. Water, Underground Colorado El Paso Co. I. Glover, Robert Ellsworth, 1896-. II. Title: Fountain and Jimmy Camp Valleys, El Paso County, Colorado. III. Colorado Springs, Colorado. IV. Fountain Valley Water Users Association. (Series)
For sale by the Superintendent of Documents. U. S. Government Printing Office Washington, D.C. 20402
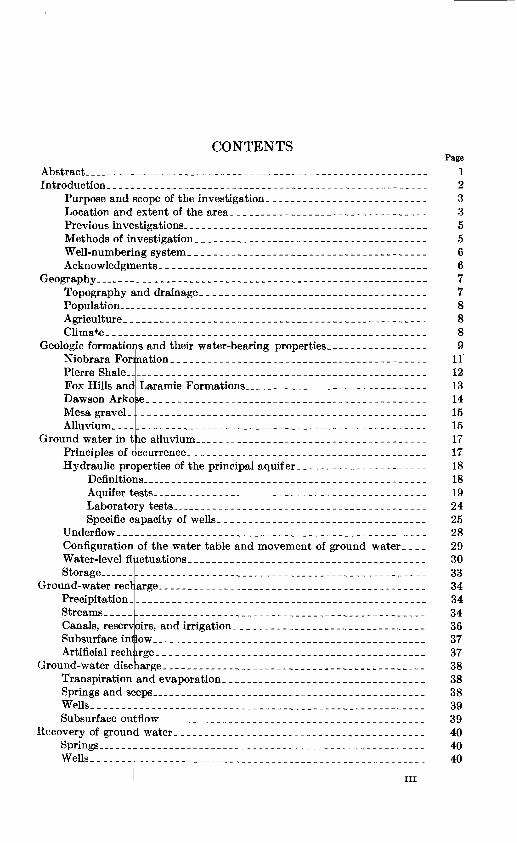
CONTENTSPage
Abstract------------------_------_---_----------------_----------- 1Introduction. -_--____________-_______--____-____-___--___-----____ 2
Purpose and scope of the investigation._____-____-_-__---__--___- 3Location and extent of the area-________________-_-___--_---____ 3Previous investigations.___________-_____-______-_____-_--_-_-__ 5Methods of investigation__--_--__---_----__---------_-_-------- 5Well-numbering system._______________________________________ 6Acknowledgments-______-_-----___------__-_--------_--_-----_ 6
Geography___ ___-____-__-----_---_---___--__-___--_-___------__- 7Topography and drainage._____________________________________ 7Population _________________________________________________ 8Agriculture-__________________________________________________ 8Climate.__________________________________________.-_-.-_-- 8
Geologic formations and their water-bearing properties._-____--------_- 9Niobrara Formation._______-__--______--____-_---____---_-_-__ 11Pierre Shale________________________________________________ 12Fox Hills and Laramie Formations----.----------.---------------- 13Dawson Arkose,______________________________________________ 14Mesa gravel___________________________________________________ 15Alluvium. _____________________________________________________ 15
Ground water in tie alluvium.----_____-__-_______-_____-_-___-__-_- 17Principles of occurrence.-____----__-______-__-___-___--_--_-_-_ 17Hydraulic properties of the principal aquifer______-_-___-___--____ 18
Definitions-----------------_-_---------------_-_---------- 18Aquifer tests.__-_-___.___--________-______---_____---_-_-_ 19Laboratory te8ts_---_----_----_-___-_______---_-_-_--__---_ 24Specific capacity of wells.__-__-____--______-_____-_-_-_-___ 25
Underflow----__-_-__-__..__.___.____________--_-_______-_____ 28Configuration of the water table and movement of ground water. _ _ _ 29Water-level fluctuations__----__-_-______-_____________-__-____- 30Storage__-__----_-____-_.--_____.________________.__--__--_ 33
Ground-water recharge.--_-_______--___-____-________._-__-__-_____ 34Precipitation __________________________________________________ 34Streams._____________________________________________________ 34Canals, reservoirs, and irrigation._______________________________ 36Subsurface inilow______________________________________________ 37Artificial recharge_____________________________________________ 37
Ground-water disc iarge____________________________________________ 38Transpiration and evaporation._________________________________ 38Springs and seeps..____________________________________________ 38Wells. _________________________________________________ 39Subsurface outflow___________________________________________ 39
Recovery of grouni water. ---______-_--_____-______-_-______-__-___ 40Springs, ______________________________________________________ 40Wells_ ____________________________________________________ 40
in

IV CONTENTS
PageUtilization of water._______________________________________________ 40
Domestic and stock supplies____________________-__---__---____ 40Industrial supplies-_-___________-_-_____________-_-__-_-__-__-- 40Public supplies._______________________________________________ 41
Colorado Springs._________________________________________ 41Fountain _________________________________________________ 42Security Village. __________________________________________ 44
Irrigation supplies__________________________________________ __ 44Yields of irrigation wells____.____-_______-___---_--_.-._____ 45Construction of large-capacity wells._________________________ 45
Quality of water______________--__-_______-_____--__-_-________ 46Composition of natural water. ______________________________ 47Expression of results.______________________________________ 47Suitability of water for domestic and irrigation use.___________ 48
Dissolved solids and specific conductance.________________ 48Sodium-adsorption-ratio- _ ______________________________ 49Hardness. _ ___________________________________________ 49Iron _________________________________________________ 51Fluoride___-___-___-___________________-------_-____ 51Nitrate_ ____________-____________-_______--------___ 51Sulfate_______________________________________________ 52
Changes in chemical content._______________-_--_-------____ 52Effects of further development of large supplies of water from wells. __ __ 52
Widefield area of Fountain Valley _ ___-____________---_-__---_-_- 52Widefield water controversy. _______________________________ 54
Fountain Valley below the Widefield area_______________________ 56Jimmy Camp Valley___________________________________________ 56
Computations of drawdowns caused by the pumping of wells in FountainValley, by Robert E. Glover and Edward D. Jenkins__________.__.. 57
First approximation_____ _______________________________________ 58Basis of the computations_____-___-______-___----__-__-__-_ 58
Second approximation __________________________________________ 58Summary. ____________________________________________________ 59
Conclusions-_ _____________________________________________________ 60Selected bibliography._____________________________________________ 62Index.___________________________________________________________ 65
CONTENTS
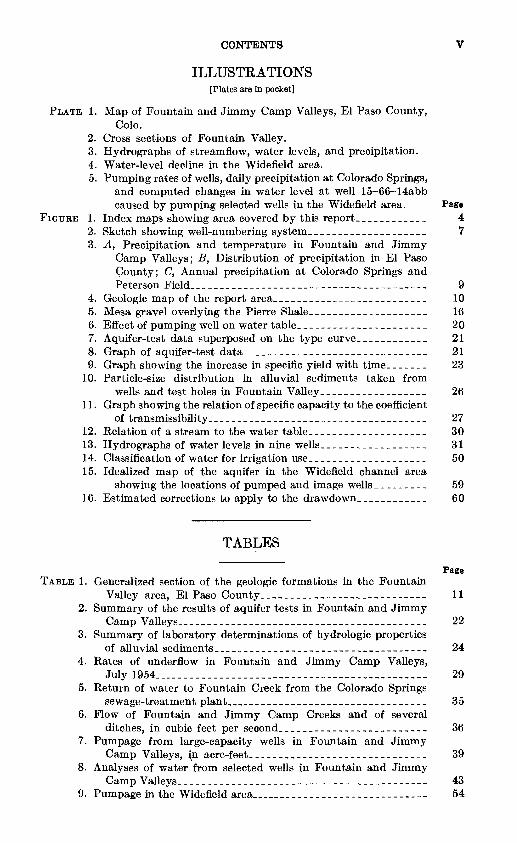
ILLUSTRATIONS[Plates are in pocket]
PLATE 1. Map of Fountain and Jimmy Camp Valleys, El Paso County, Colo.
2. Cross sections of Fountain Valley.3. Hydrographs of streamflow, water levels, and precipitation.4. Water-level decline in the Widefield area.5. Pumping rates of wells, daily precipitation at Colorado Springs,
and computed changes in water level at well 15-66-14abb caused by pumping selected wells in the Widefield area. Pags
FIGURE 1. Index maps showing area covered by this report....________ 42. Sketch showing well-numbering system__ _______ ___________ 73. A, Precipitation and temperature in Fountain and Jimmy
Camp Valleys; B, Distribution of precipitation in El Paso County; C, Annual precipitation at Colorado Springs and Peterson Field_---_------_-----_ -------------------- 9
4. Geologic map of the report area_______________.___._.____ 105. Mesa gravel overlying the Pierre Shale____________________ 166. Effect of pumping well on water table___-______-__-_______- 207. Aquifer-test data superposed on the type curve____________ 218. Graph of aquifer-test data_______________--__-_________-_ 219. Graph showing the increase in specific yield with time.______ 23
10. Particle-size distribution in alluvial sediments taken fromwells and test holes in Fountain Valley._________________ 26
11. Graph showing the relation of specific capacity to the coefficientof transmissibility____________--_-__-_-____-_.___--___- 27
12. Relation of a stream to the water table..__________________ 3013. Hydrographs of water levels in nine wells__________________ 3114. Classification of water for irrigation use____________________ 5015. Idealized map of the aquifer in the Widefield channel area
showing the locations of pumped and image wells __ _______ 5916. Estimated corrections to apply to the drawdown, ___________ 60
TABLES
TABLE 1. Generalized section of the geologic formations in the Fountain Valley area, El Paso County____________________________
2. Summary of the results of aquifer tests in Fountain and Jimmy Camp Valleys.._____.____________________---___-_-----_
3. Summary of laboratory determinations of hydrologic properties of alluvial sediments_____________-__-_-_-----___--------
4. Rates of underflow in Fountain and Jimmy Camp Valleys, July 1954___________________________________
5. Return of water to Fountain Creek from the Colorado Springs sewage-treatment plant________________________________
6. Flow of Fountain and Jimmy Camp Creeks and of several ditches, in cubic feet per second_________________________
7. Pumpage from large-capacity wells in Fountain and Jimmy Camp Valleys, in acre-f eet_ _______________________ ______
8. Analyses of water from selected wells in Fountain and Jimmy Camp Valleys._________________________________________
9. Pumpage in the Widefield area____________________________
Page
11
22
24
29
35
36
39
4354

GROUND WATER IN FOUNTAIN AND JIMMY GAMP VALLEYS, EL PASO COUNTY, COLORADO
By EDWARD D. JENKINS
ABSTRACT
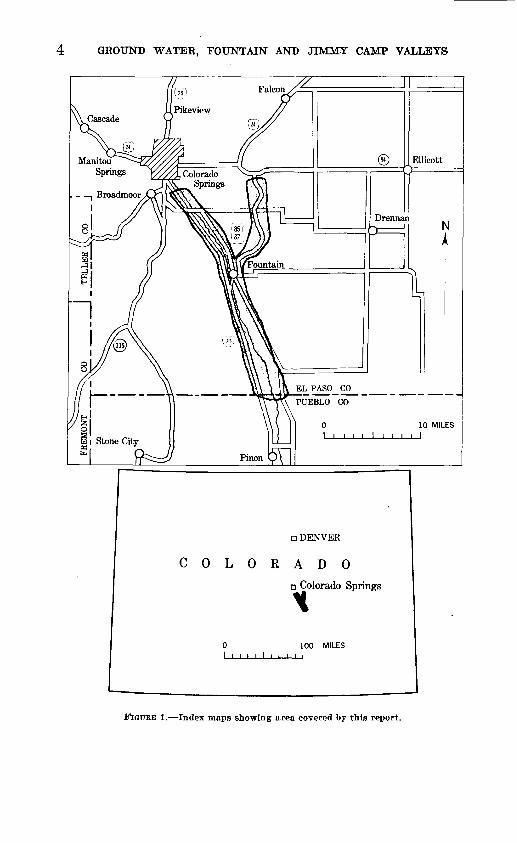
The part of Fountain Valley considered in this report extends from Colorado Springs to the Pueblo County line. It is 23 miles long and has an area of 26 square miles. The part of Jimmy Camp Valley discussed is 11 miles long and has an area of 9 square miles. The topography is characterized by level flood plains and alluvial terraces that parallel the valley and by rather steep hills along the valley sides. The climate is semiarid, average annual precipitation being about 13 inches. Farming and stock raising are the principal occupations in the valleys; however, some of the agricultural land near Colorado Springs is being used for housing developments.
The Pierre Shale and alluvium underlie most of the area, and mesa gravel caps the shale hills adjacent to Fountain Valley. The alluvium yields water to domestic, stock, irrigation, and public-supply wells and is capable of yielding large quantities of water for intermittent periods. Several springs issue along the sides of the valley at the contact of the mesa gravel and the underlying Pierre Shale.
The water table ranges in depth from less than 10 feet along the bottom lands to about 80 feet along the sides of the valleys; the saturated thickness ranges from less than a foot to about 50 feet.
The ground-water reservoir in Fountain Valley is recharged by precipitation that falls within the area, by percolation from Fountain Creek, which originates in the Pikes Peak, Monument Valley, and Rampart Range areas, and by seepage from irrigation water. This reservoir contains about 70,000 acre-feet of ground water in storage. The ground-water reservoir in Jimmy Camp Valley is recharged from precipitation that falls within the area, by percolation from Jimmy Camp Creek during periods of streamflow, and by seepage from irri gation water. The Jimmy Camp ground-water reservoir contains about 25,000 acre-feet of water in storage. Ground water is discharged from the area by movement to the south, by evaporation and transpiration in areas of shallow water table, by seepage into Fountain and Jimmy Camp Creeks, and through wells. About 3 to 4 mgd (million gallons per day) of ground water moves through the Fountain Valley alluvium at a velocity of about 15 feet per day. About 1 mgd 'of ground water moves through the Jimmy Camp Valley alluvium at a velocity of about 6 feet per day.
Most of the wells in the area are drilled, but a few are dug. Many large- diameter wells are used for irrigation and public supply; one of the wells

2 GROUND WATER, FOUNTAIN AND JIMMY CAMP VALLEYS
yields as much as 1,340 gpm (gallons per minute). Wells are used as a source of water or as a supplement to the deficiency in surface-water supply for the irrigation of about 5,000 acres of land in Fountain Valley and about 2,000 acres in Jimmy Camp Valley. Heavy pumping in certain areas causes a rapid decline in the water level, but when pumping ceases, the water table recovers rapidly. A special section on the effects of pumping selected wells in the valley is included in this report.
The chemical analyses of samples of water from 13 representative wells and of a composite sample of surface and ground water from one town supply show that ground water along the valleys is generally hard and becomes harder and more highly mineralized downstream. Water in the stream is of better quality than ground water.
INTRODUCTION
The development of water in the Fountain Valley watershed began with the influx of gold seekers following the discovery of gold in the Pikes Peak region in 1858. Early settlers found a small stream, then known as "Fontaine Que Bouille" (Boiling Spring Creek), lined with a heavy growth of cottonwood and willow, luxuriant grass in the valley, and ample grass cover on the plains and on the mountain side. A further discussion of Fontaine Que Bouille, or Fountain Creek, is taken from Sheldon's History of El Paso County (Sheldon, 1881, p. 416):
Contributing more than all the other streams of the county, to the sanitary and industrial welfare of its people, comes the beautiful and poetically chris tened "Fontaine Que Bouille." Beginning its brief career virtually in the clouds, and first condescending to contact with terra firma at an elevation of over fourteen thousand feet above the sea, by numerous rills and brooklets, which flow from the north and east declivities of Pikes Peak, it finds its way to the plains through the Ute Pass and the canon of Ruxton Creek, through Manitou and Colorado City, by Colorado Springs and Fountain City, and joins its fortunes with the Arkansas at Pueblo. Its approximate minimum volume at Colorado City as determined in 1862, is represented by a cross section of the stream measuring 2,200 inches, with a flow of 150 feet per minute. Its principal tributary, Monument Creek, at times an ugly channel, and at times a devastating flood, has its origin in the mountains of the northwestern part of the county, and flows thence along their base in a southerly direction to the neighborhood of Colorado Springs, and there looses itself in, or pollutes, with its muddy ichor, the waters of the fountain. It is utilized to considerable extent for purposes of irrigation, but like all kindred streams, fails of efficiency when the need is greatest.
Prior to 1858 Fountain Valley was the hunting ground of the Indian; the range of the trapper, hunter, and trader; and the habitat of buffalo, deer, elk, beaver, and other wild game. Domestic livestock rapidly replaced the wild game.

INTRODUCTION 3
The influx of gold seekers increased the demand for agricultural products. A small tract of land in Fountain Valley was irrigated with surface water as early as 1860; by 1861 much of the arable land in the valley was taken up by settlers, an$ wheat, oats, corn, and some vegetables were being grown. The establishment of a flour mill in 1862 added incentive to the production of grain (Howbert, 1925). The surface-water supply was supplemented in 1912 by the construc tion of the first well to be used for irrigation. Industrialization also began after the discovery of gold, but was less rapid than the change in land use. The Denver and Rio Grande Western Railroad started construction of a line to Colorado Springs in 1871, and General Palmer and a group of business men organized the Colorado Springs Co. to attract settlers. Colorado Springs was incorporated in 1886 and the community of Colorado City on the west was annexed to Colorado Springs in 1892.
PURPOSE AND SCOPE OF THE INVESTIGATION
An investigation of the ground-water resources of Fountain and Jimmy Camp Valleys was begun in July 1954 by the U.S. Geological Survey in cooperation with the city of Colorado Springs and the Fountain Valley Water Users Association. The objective was to determine the origin, movement, and availability of ground water for domestic, stock, industrial, irrigation, and public supplies, and to determine the effects of pumping the wells that supply Colorado Springs on other wells in the valley and on the flow of Fountain Creek. The program was under the direct supervision of T. G. Mc- Laughlin, district geologist for Colorado. E. A. Moulder, district engineer, who succeeded Mr. McLaughlin in 1959, critically reviewed the report and supervised its final compilation.
Ground water is one of the principal natural resources of the Foun tain and Jimmy Camp Valleys because almost all domestic, stock, and industrial supplies, much of the irrigation and public supplies for the valley, and part of the public supply for Colorado 'Springs are derived from this source. There is, therefore, a need for an adequate understanding of this important natural resource and its relation to the streamflow of Fountain Creek in order to facilitate its orderly development.
LOCATION AND EXTENT OF THE AREA
The Fountain and Jimmy Camp Valleys area includes that part of El Paso County lying in Tps. 14 through 17 S., Rs. 65 and 66 W. The area lies between lat 38°30' and 38°50' N. and long 104°35' and 104°50' W. and contains about 35 square miles (fig. 1).
4 GROUND WATER, FOUNTAIN AND JIMMY CAMP VALLEYS
D DENVER
COLORADO
o Colorado Springs
0 100 MILES I i i i i I i i i i I
FIGURE 1. Index maps showing area covered by this report.

INTRODUCTION 5
PREVIOUS INVESTIGATIONS
Several studies relating to the geology or ground-water resources of all or part of the area under consideration have been made. Darton (1905; 1906) made a reconnaissance of the geology and ground-water resources of the central Great Plains and the Arkansas Valley, which included the Fountain Creek area. Finlay (1916) mapped the geol ogy of the Colorado Springs quadrangle, and Dane, Pierce, and Ree- side (1937) described the geology of a large area north of the Arkansas River in eastern Colorado; Dane also described the Pierre Shale underlying Fountain Valley. Griswold (1948) made a brief survey of geology and ground water in the Fountain Valley as a part of the Department of Agriculture watershed-management program. 'Code (1958) reported on the water-level fluctuations in eastern Colo rado, which included measurements of several wells along Fountain Valley.
Records of wells, logs of wells and test holes, water level measure ments of selected wells, and chemical analyses of water samples col lected during the course of the investigation can 'be found in Basic Data Report Number 3 of the Ground Water Series (Jenkins, 1961), prepared cooperatively by the city of Colorado Springs, the Fountain Valley Water Users Association, the Colorado Water Conservation Board, and the U.S. Geological Survey. Chemical analyses are reported herein.
METHODS OF INVESTIGATION
Fieldwork on the project reported here was done between July 1954 and June 1955 by the writer, who was assisted by V. Foster during November and December 1954. Records of 218 wells and springs were obtained during the investigation. Information recorded includes measured and reported depths of wells, depths to water, yields of wells, drawdowns of water levels, thicknesses of materials penetrated in drilling, and the use and general chemical character of the water.
Samples of water collected from 13 representative wells and from 1 town supply in the area were analyzed to determine their mineral content. Most of the samples were analyzed in the chemical labora tory of the Quality of Water Branch of the Geological Survey at Denver, but a few were analyzed by the Utilities Department of the city of Colorado Springs and the 'Colorado Department of Public Health.
During the fieldwork, 36 test holes were drilled in Fountain Valley with a portable auger furnished by the Survey's Hydrologic Labora tory at Denver. Samples of the cuttings from the test holes were collected and studied by the writer, and the physical and hydrologic

6 GROUND WATER, FOUNTAIN AND JIMMY CAMP VALLEYS
properties of selected samples were determined in the Hydrologic Laboratory. Altitudes of the test holes were determined by instru mental leveling. Additional logs of wells drilled in the area were furnished by well owners and well drillers.
Aquifer tests were made of 12 wells in the area to determine the coefficient of transmissibility and the specific yield of the aquifer.
The flow of Fountain Creek was measured at several points by G. N. Mesnier and C. B. Hamm of the Surface Water Branch and by the writer to determine changes in streamflow along the valley, especially in the areas of heavy pumping. Estimates of the amount of water pumped from large-capacity wells were determined from discharge and power records.
Field data were compiled on U.S. Geological Survey topographic quadrangles, scale, 1: 24,000. Plate 1 shows the locations of wells and test holes. The altitudes of selected wells were determined by a level crew headed by V. M. Burtis.
WELL-NUMBERING SYSTEM
In this report all wells and test holes are numbered according to their location within the federal system of land subdivisions (fig. 2). The well number is composed of the township number, the range num ber, the section number, and lower-case letters that indicate the sub division of the section in which the well is located. The first letter denotes the quarter section; the second, the quarter-quarter section or 40-acre tract; and the third, the quarter-quarter-quarter section or 10-acre tract. The letters are assigned in a counterclockwise direction beginning in the northeast quarter of the section or quarter-quarter section. Where two or more welis are within the smallest subdivision shown, the wells are numbered serially according to the order in which they were inventoried.
ACKNOWLEDGMENTS
The writer is indebted to the many residents of Fountain and Jimmy Camp Valleys who supplied information about their wells and who permitted test drilling on their land. Thanks are extended to J. M. Biery, F. T. Henry, and J. S. Nichols, officials of Colorado Springs, and to Hatfield Chilson, Clark Hanna, and R. J. Moses, who represented the Fountain Valley Water Users Association, for their cooperation in making much information available during the investi gation. J. Coniff, E. F. Gobatti, and Mateyka Brothers, drillers, and several oil companies supplied many records including logs of wells and test holes drilled in the area. Many power-consumption records of irrigation wells were supplied by the Mountain View Electric As-

GEOGRAPHY
BASE LINE
13
14
15
16
72 71 70 69 68 67 66 /65
Well 14-65-22abc
R.65 W.
6
7
18
19
30
31
5
8
17
20
29
32
4
9
16
21
28
33
3
10
15/
rf22
27
34
2
11
/x 14
23
26
35
1
/12
/
13
24
25
36
- b H J-- a
- c d
FIGURE 2. Sketch showing well-numbering system.
sociation, Inc., the Utilities Department of the city of Colorado Springs, and the town of Fountain. Special thanks are extended to W. E. Code of Colorado State University for his helpful advice and for making available his record of observation wells in Fountain Valley, which he has maintained since 1944.
GEOGRAPHYTOPOGRAPHY AND DRAINAGE
All the area described herein lies in the Colorado Piedmont section of the Great Plains physiographic province. The total relief of the area is about 900 feet. Fountain Valley has a gradient of about 30 feet per mile and Jimmy Camp Valley about 45 feet per mile within the area of this report.

8 GROUND WATER, FOUNTAIN AND JIMMY CAMP VALLEYS
The headwaters of Fountain and Jimmy Camp are outside the area, as is the confluence of the Fountain and the Arkansas Valleys at Pueblo. Fountain Creek rises to the northwest in the Monument Valley, Pikes Peak, and Rampart Range areas; its tributary, Jimmy Camp Creek, rises in the Black Forest area to the northeast.
POPULATION
The population of the report area is largely urban and was between 10,000 and 15,000 in 1958. Fountain, the only town in the area of the report, had a population of 1,600 in 1960. Since the beginning of the investigation a new housing development, the community of Security Village, has been under construction and it had an estimated popula tion of 9,000 in 1960. The metropolitan area of Colorado Springs, which is just outside the area of this report, had a population of about 100,000 in 1960.
AGRICULTURE
Livestock, dairy products, corn, and alfalfa are the principal agri cultural products of the valleys; sweet corn and asparagus are lesser crops. Most of the irrigated lands in both valleys are irrigated with water from Fountain Creek and with water pumped from wells. More wells are drilled each year to supply the increasing demand for water within the report area. About 5,000 acres of land was irri gated from wells and surface water along Fountain Valley, and about 2,000 acres was irrigated along Jimmy Camp Valley in 1955.
CLIMATE
The climate of Fountain and Jimmy Camp Valleys is semiarid. The precipitation generally is low to moderate, the heaviest rains falling during the principal growing season May, June, July, and August (fig. 3A). The normal annual precipitation in the valleys ranges from 11 inches in the southern part to 15 inches in the northern part (fig. 3B). The normal precipitation at the Colorado Springs weather station for the period 1921 through 1950 was adjusted because of the change in location from downtown to Peterson Field in 1949. The normal annual precipitation for this period is 14.26 inches. The annual precipitation at Colorado Springs and Peterson Field is shown in figure 36".
The temperatures in the area are moderate during the summer. The days are warm and the nights generally are cool. The winters are moderate, and the snowfall is light. The highest monthly normal temperature is 71.2°F., in July, and the lowest is 28.8°F., in January.

GEOLOGIC FORMATIONS AND THEIR WATER-BEARING PROPERTIES 9
2.5
2.0
1.0
0.5
« s s5S=== ; u_ s <c s , , <cs§
20
NORMAL MONTHLY PRECIPITATION NORMAL MONTHLY TEMPERATURE
20 -
IS -
10 -
5 -
n
C
-,-"
-
-
Colorado Springs
Normal _ 14.26 in H
_!_[]_ l UUU-Jl
- -
-1"
n rT
.- : -
: . ;;"
-. -
i- + 15
- + 10
- + 5
- 0
--5
--10
FIGURE 3. A, Normal monthly precipitation and temperature in Fountain and Jimmy Camp Valleys ; B, Distribution of precipitation in El Paso County; C, Annual precipita tion at Colorado Springs from 1872 to 1947 and at Peterson Field from 1949 to 1958. Normals adjusted for the period 1921 through 1950. (Records from the U.S. Weather Bureau.)
GEOLOGIC FORMATIONS AND THEIK WATER BEARING PROPERTIES
The rocks that crop out in the Fountain and Jimmy Camp Valleys are sedimentary and range in age from Late Cretaceous to Recent. The outcrop areas are shown in figure 4. The consolidated rocks, mostly of Late Cretaceous but in part of Tertiary age, consist of the Niobrara, Pierre, Fox Hills, Laramie, and Dawson Formations. The unconsolidated sediments are of Pleistocene and Recent age and in clude the alluvium underlying the flood plains and terraces of the valleys and scattered deposits of gravel that cap some of the mesas.

10 GROUND WATER, FOUNTAIN AND JIMMY CAMP VALLEYS
A generalized section of the geologic formations exposed in the area is given in table 1. The following descriptions of the geologic formations and their water-bearing properties are adapted in part fromFinlay (1916) and McLaughlin (1946).
R. 66 W.
EXPLANATION
FIGURE 4. Sketch map of the geology of the report area. (Modified from Finlay, 1916.)

GEOLOGIC FORMATIONS AND THEIR WATER-BEARING PROPERTIES 11
TABLE 1. Generalised section of the geologic formations in the Fountain Valley area, El Paso County, Colo.
System
Quaternary
Tertiary and
Cretaceous
Cretaceous
Series
Recent and
Pleistocene
Paleocene and
Upper Cretaceous
Upper Cretaceous
Formation
Alluvium
Mesa gravel
Dawson Arkose
Laramie
Fox Hills Sandstone 1
Pierre Shale
Niobrara
Thick ness (feet)
0-100
0-75±
1,000±
150-250
700
2,700- 4,000+
400-500
Physical characteristics
Gravel and sand, containing thin beds of silt and clay.
Poorly sorted boul ders, cobbles, and gravel containing sand layers.
Coarse varicolored conglomeratic sandstone with lenses of clay in upper part; arko- sic sand and shale containing lignite, in lower part.
Black shale and seams of lignite interbedded with irregular beds of sandstone.
Massive white fine grained sandstone in the upper part; underlain by greenish and brown fine grained sand stone; inter- bedded with shale in lower part.
Dark-gray and blue- gray shale; cal careous concre tions locally abundant.
Upper part gray shale with dis seminated gypsum; middle part fine-grained sandy limestone and shale; lower part light-gray calcareous shale; bluish-gray lime stone at base.
Water yield
Large quantities to domestic, irriga tion, public- supply, and stock wells and to springs and seeps.
Small quantities from springs for domes tic and stock use.
Small to moderate quantities to domestic and stock wells.
Small quantities to domestic and stock wells.
Moderate quantities to domestic and stock wells.
Very small quan tities to a few wells, principally from weathered zones. Yields no water in most places.
Small quantities.
i For the purpose of this report, the Fox Hills includes the massive A and B sandstones of the Laramie.
NIOBRARA FORMATION
The Niobrara Formation of Late Cretaceous age overlies the Carlile Shale in the southwest part of the area. The base of the formation consists of about 50 feet of bluish-gray limestone in beds as much as 2 feet thick, which are separated by calcareous shale. The beds of lime-
695-548 O 63-

12 GROUND WATER, FOUNTAIN AND JIMMY CAMP VALLEYS
stone are crossed by innumerable small veins of calcite. The out crops of these basal beds in places form low ridges. Beds near the middle of the formation locally contain fine-grained sandy limestone and shale. The upper two-thirds of the formation consists of gray calcareous shale.
No wells tapping the Mobrara Formation were inventoried, al though possibly small quantities of water can be obtained from wells drilled into the limestone beds of the lower part or into the sandy limestone and shale beds near the middle. Water obtained from this formation is usually of poor quality because of the mineral matter dissolved from the shale and limestone.
PIERRE SHALE
The Pierre Shale conformably overlies the Niobrara Formation. Only the upper part crops out in the area and it is poorly exposed owing to the moderately thick cover of soil masking the gentle slopes. Outcrops are difficult to find except in places where streams or gullies have made fresh cuts into the bedrock. The Pierre, where exposed in this area, consists of dark-gray to blue shale and sandy shale contain ing calcareous concretions. The formation is about 2,700 feet thick in the vicinity of sec. 4, T. 15 S., R. 66 W. Farther east the formation thickens to more than 4,000 feet. It is overlain in most of the area by mesa gravels and alluvium. At the head waters of Jimmy Camp Valley the Fox Hills Sandstone lies conformably upon the Pierre Shale.
The lowermost 500 feet of the Pierre is lead-gray shale which con tains gypsum in fractures that cross the beds. Numerous layers of limonite-stained clayey fossiliferous limestone concretions, some of them as much as 3 feet in diameter, are found in this lowermost zone. The upper 500 feet of the formation contains limestone cores that are more resistant to weathering than the surrounding shale. The cores form small sharp conical hills about 50 feet in diameter, which were called "tepee buttes" by Gilbert and Gulliver (1895, p. 333-342). Such buttes are abundant in sees. 3 and 11, T. 17 S., R. 65 W. The limestone cores of the buttes are cylindrical or lenticular. Smaller limestone concretions are also abundant in the same upper zone.
The Pierre Shale and the Niobrara Formation are the least pro ductive water-bearing formations in the area and generally yield water of very poor quality that is unsuitable for most uses. The minute pore spaces between the grains of clay, silt, and very fine sand, because of capillary attraction, will yield little or no water to wells. Where the exposed part of the formations has been weathered, water may fill the small spaces in joints or along bedding planes. Elsewhere solution openings in limestone lenses and concretions may store and transmit small amounts of water. In such places dug wells having a

GEOLOGIC FORMATIONS AND THEIR WATER-BEARING PROPERTIES 13
large storage capacity may produce enough water for domestic or stock use. Small quantities of water may be obtained from beds of fine-grained clayey sandstone near the top of the Pierre Shale.
Ability to recognize the Pierre Shale in the areas of outcrop and from well cuttings may prevent useless exploration for water. Some wells have been drilled deep into the Pierre in this area in fruitless attempts to find supplies of water; the Pierre Shale is practically barren of water except in a few sandy zones and in zones of surficial weathering. The Pierre Shale is more than 2,700 feet thick in this area and, if no water is found in the upper sandy and weathered zones, deeper drilling is generally useless.
FOX HILLS AND LARAMIE FORMATIONS
Three aquifers in the Fox Hills Sandstone in the report area are described here. These units are designated as the Milliken Sandstone Member and the A sandstone and B sandstone of the Laramie Forma tion. For the purpose of this report, the sandstone units of the Laramie Formation are included with the Fox Hills Sandstone.
The writer in some instances has met laymen, who misunderstanding the term "Fox Hills Sandstone," have failed to complete their wells through the three sandstone units. They believed they had penetrated the entire formation when the drill hole actually had penetrated only the uppermost unit. On the basis of mappability and hydrologic unity, G. H. Chase, (1960, oral communication) has found that placing the top of the Fox Hills Formation to include the massive sandstones of the Laramie A and B provides a logical contact, permits more satis factory surface and subsurface mapping, and prevents misunder standing of the hydrology.
Lovering and others (1932, p. 702-703) have spoken of the Fox Hills Formation rather than the Fox Hills Sandstone, and have so defined the formation to include several thick sandstone units. These include the units formerly known as the A sandstone and the B sand stone in ascending order of the Laramie Formation and the Milliken Sandstone Member of the Fox Hills. Van Horn (1957) has referred to the unit previously known as the B sandstone of the Laramie Formation as the top of the Fox Hills. Other geologists have adopted a similar nomenclature.
The Fox Hills Sandstone overlies the Pierre Shale in the northeast ern part of the area. The lower part of the formation consists largely of interbedded greenish-gray sandstone and sandy shale. The upper part consists principally of three fairly thick sandstone units sep arated by varying thicknesses of shale. The lowermost of the three sandstone units is a uniform-grained, finely laminated to massive well- bedded sandstone. This unit, which has a thickness of about 50 feet, was named the Milliken Sandstone Member by Henderson (1920, p.

14 GROUND WATER, FOUNTAIN AND JIMMY CAMP VALLEYS
22-23). Fresh surfaces of this sandstone are dull green to yellowish green; many weathered surfaces are rich brown. The middle sand stone unit, which is the least massive of the three, includes lenticular sandstone interbedded with shale, some of which is carbonaceous. The uppermost sandstone, which has an average thickness of about 60 feet, is the most extensive of the three. It is massive, thick bedded, and resistant to weathering. The average grain size of this unit is greater than that of the other two sandstone units. Uniformity of grain size is characteristic of the unit. The quartzose sandstone of the upper two units generally has a white color; however conspicuous grains of black chert giAre it a characteristic salt and pepper appear ance when it is examined closely. Locally it is iron stained.
No wells tapping the Fox Hills Sandstone were inventoried in this area; however it is known that many wells obtain water from the Mil- liken Sandstone Member and from the two sandstone units above it north and east of the report area. Wells drilled for the Air Force Academy, several miles north of Colorado Springs, were perforated opposite these sandstones and produce about 80 gpm each. Wells drilled into the Milliken Sandstone Member should each yield 10 to 30 gpm. Wells tapping the upper salt and pepper sandstone units yield 10 to 50 gpm.
The Laramie Formation consists of brownish-black or black shale interbedded with lenticular beds of sandstone and coal. The shale is silty, sandy, and lignitic. At certain horizons, thin beds of ex tremely fine-grained ferruginous sandstone are conspicuous. Com mercial deposits of coal in the Laramie have been exploited in mines in Jimmy Camp Valley.
No wells tapping the Laramie Formation were inventoried in the report area; however, the writer knows of wells tapping this formation north and east of the report area. Water is obtained in small quanti ties from its many thin beds of sandstone. It is difficult to obtain water from the formation in some areas because of the thinness, len- ticularity, and low permeability of the sandstone beds.
DAWSON ARKOSE
The Dawson Arkose of Paleocene and Late Cretaceous age overlies the Laramie Formation in the northernmost part of the area. It con sists principally of varicolored arkosic conglomerate, sandstone, clay- shale, carbonaceous shale, and coal. The lowermost part (about 100 feet) of the formation consists chiefly of clay and sandy clay contain ing many lenticular beds of siliceous, andesitic, and cherty sandstone. Above these lenses are many massive beds of arkose interbedded with carbonaceous materials and light-colored clay and shale. The upper most part consists of coarse varicolored conglomeratic sandstones and lenses of clay. Some of the beds of the formation have been cemented

GEOLOGIC FORMATIONS AND THEIR WATER-BEARING PROPERTIES 15
by limonite. The Dawson Arkose has a maximum thickness of more than 2,500 feet 30 miles north of the area of this report. About 1,000 feet of the lower part of this formation has escaped erosion in the report area.
No wells tapping the Dawson Arkose were inventoried; however, water is obtained from wells in this formation. Yields of the wells generally are small to moderate, but in places north and east of the area, yields may be as much as 300 gpm. The Dawson Arkose is an important potential aquifer for the development of domestic and public-supply wells north of Colorado Springs.
MESA GRAVEL
Mesa gravel is found along the side of the valley of Fountain Creek, unconformably overlying the Pierre Shale (fig. 5) and the Niobrara Formation. The gravel consists mainly of angular fragments of granite. The larger pieces have rounded surfaces and show abrasion from stream transport. Particle sizes vary greatly; the largest are 3 to 4 feet, but most are less than an inch in diameter. The mesa gravel is poorly sorted and interbedded with numerous sandy layers. In addition to granite, the deposit includes many fragments of gneiss, schist, sandstone, limestone, quartz, and pegmatite. The formation is nearly everywhere unconsolidated. In places the grains and the surfaces of many particles have a caliche coating.
Several springs, which yield as much as 10 gpm each, issue along the west side of Fountain Valley at the contact of the mesa gravel and the Pierre Shale. Although the gravel is as much as 75 feet thick, it averages about 10 feet. This gravel is largely drained and contains only relatively small amounts of ground water.
ALLUVIUM:The alluvium in Fountain Valley consists of deposits of gravel and
sand containing minor amounts of silt and clay. The materials were derived largely from the weathered granite, sandstone, limestone, and shale of the nearby mountain and upland areas. Some boulders have worked down from the mesa gravel onto the flood plain and the ter races. The coarsest materials were deposited in the bottom of a buried channel that extends the length of the valley. The materials in the alluvium of Fountain Valley range in size from fine sand to cobbles. Particle-size analyses of several samples of alluvium are discussed in the section on hydrologic and physical properties of alluvial sediments (p. 24) and are shown in figure 10. Additional information on the physical character of the alluvium of Fountain Valley was derived from logs of test holes drilled in Fountain Valley as a part of this investigation. Cross sections prepared from these and other logs show the relation of the alluvium to the underlying Pierre Shale and

16 GROUND WATER, FOUNTAIN AND JIMMY CAMP VALLEYS
FIGURE 5. Mesa gravel (Qmg) overlying the Pierre Shale (Kp) in road cut along new U.S. Interstate Highway 25 about 10 miles southeast of Colorado Springs.
the position of the water table relative to the stream (pi. 2). The cross sections show that the valley was cut deeply into the underlying shale and was then partly filled with sand and gravel to form the pres ent alluvial aquifer, which yields abundant supplies of water to wells. Springs and seeps occur where the land surface intersects the water table. The thickness of the alluvium ranges from a few feet to 100 feet; the width of the aquifer ranges from about % to l1/^ miles.
The alluvium of Jimmy Camp Creek Valley consists mainly of reworked deposits of sand, gravel, silt, and clay that have been derived primarily from the Fox Hills, Laramie, and Dawson Formations in adjacent upland areas. These alluvial deposits are finer grained and less permeable than those in Fountain Valley because of the finer grain size of the materials from which they were derived. The thickness of the alluvium ranges from a few feet to 100 feet. The width of the aquifer ranges from % to 1 mile.
Small areas of alluvium are found in draws or along small streams. The alluvium generally contains small amounts of sand and gravel derived from one or more of the following: the mesa gravel, the Fox Hills Sandstone, the Laramie Formation, or the Dawson Arkose.
Where saturated, the alluvial sediments will yield small to moderate quantities of water to wells. In the areas underlain by Pierre Shale, small deposits of alluvium that will supply water for domestic or stock supply can be located by test drilling, particularly in draws or along small streams.

GROUND WATER, FOUNTAIN AND JIMMY CAMP VALLEYS 17
GROUND WATER IN THE ALLUVIUM
PRINCIPLES OF OCCURRENCE
The following discussion of the occurrence of ground water refers to the report area. A more detailed discussion of the general occurrence can be found in Meinzer (1923, p. 2-102).
Below a certain level, which in the Fountain and Jimmy Camp Valleys area ranges from the land surface to about 80 feet below the surface, the permeable rocks are saturated with water. These satu rated rocks are said to be in the zone of saturation, and the upper sur face of this zone is called the "water table." Wells dug or drilled into the zone of saturation will become filled with ground water to the level of the water table.
The rocks that lie above the zone of saturation are said to be in the zone of aeration. The zone of aeration contains varying amounts of water whose movement is controlled chiefly by gravitational and capil lary forces. The capillary forces vary in a given material, increasing as the moisture content decreases. In a fine-grained material the capil lary forces may be many times greater than the gravitational forces. The resultant of these two forces determines the direction of move ment. When the capillary forces are greater than the gravitational forces, the water may move in any direction, usually toward the area of least moisture content.
All the rocks penetrated by water wells in the Fountain and Jimmy Camp Valleys area are sedimentary and include sand, gravel, sand stone, silt, clay, and shale. The principal water-bearing rocks in the area are sand and gravel.
Gravel is superior to any other type of material in its ability to store and yield water in the report area. Coarse clean well-sorted gravel, such as is found in Fountain Valley, has high effective porosity, high permeability, and high specific yield. It can absorb water readily, store it in large quantities, and yield it to wells freely. In most parts of Jimmy Camp Valley, however, silt or sand is mixed with the gravel and reduces its porosity and permeability.
Sand ranks next to gravel as a water-bearing material. It differs from gravel in having smaller interstices; therefore, it will conduct water less readily and will yield water to wells less rapidly. Fine sand particles, which are more readily carried into wells by the water, cause problems in drilling and pumping hi some wells. Proper well construction is especially important where fine sand is the main aquifer.
Sandstone is moderately good water-bearing material. A coarse grained well-sorted sandstone, such as occurs locally in the Dawson Arkose, generally yields water freely, whereas the well-sorted fine grained Fox Hills Sandstone yields water less readily.

18 GROUND WATER, FOUNTAIN AND JIMMY CAMP VALLEYS
Several wells in the valleys obtain all or part of their water from the Pier re Shale, but most of them have very small yields, for shale is one of the poorest water-bearing materials. If shale is not too tightly compacted, it may have a fairly high porosity and may contain considerable water; however, the interstices between the individual particles are so small that the water is held by molecular attraction and hence is not available to wells. Water available to wells in the shale is largely in joints, along bedding planes, or in weathered zones near the surface.
The yields of wells drilled into the alluvium of Fountain Valley range from a few to more than 1,300 gpm. The alluvial valley is narrow generally less than 1 mile and the buried channel is sepa rated from the stream in many places by a shale ridge or barrier; thus, wells of large capacity can rapidly deplete the aquifer locally when many of them are pumped heavily for long periods of time. However, the buried channel meanders gently back and forth across the valley and lies beneath the present stream channel at several places where it is recharged by the stream, which tends to replace water removed by pumping (pis. 1 and 2). Water moves from the stream into the aqui fer, where the water table is lower than the level of the stream, and water discharges from the aquifer into the stream, where the water table is higher than the level of the stream. (See fig. 12.)
Heavy pumping along Jimmy Camp Valley also causes a rapid decline in the water level. In the northern part of the report area in Jimmy Camp Valley, large-diameter wells have an average yield of about 300 gpm; those in the southern part have an average yield of about 600 gpm. The periods of recharge from the intermittent stream are limited to periods of streamflow following heavy precipitation.
Because this report is concerned almost entirely with the principal aquifer in heavily developed areas in Fountain and Jimmy Camp Valleys, the sections that follow pertain only to ground water in the alluvium.
HYDRAULIC PROPERTIES OF THE PRINCIPAL AQUIFER
DEFINITIONS
Field and laboratory tests were made to determine the ability of the alluvium to transmit and store water.
The capacity of water-bearing material for transmitting water un der a hydraulic gradient is known as its "permeability." The field coefficient of permeability may be expressed as the number of gallons of water per day at the prevailing temperature that is transmitted through each mile-wide section of the water-bearing bed under investi gation (measured at right angles to the direction of flow), for each foot of thickness of the bed and for each foot per mile of hydraulic gradient. The coefficient of transmissibility is a similar measure for the entire

GROUND WATER IN THE ALLUVIUM 19
thickness of the water-bearing formation and may be expressed as the number of gallons of water per day transmitted through a mile- wide section of the aquifer under a gradient of 1 foot per mile it is the field coefficient of permeability multiplied by the thickness of the aquifer in feet.
The volume of water that an aquifer releases from or takes into storage per unit of surface area of the aquifer per unit change in the component of head normal to that surface is called the "coefficient of storage." Under water-table conditions this coefficient is approxi mately equal to the "specific yield," which is the ratio of (1) the volume of water that a rock or soil, after being saturated, will yield by gravity to (2) its own volume. Under artesian conditions, in which aquifers are not dewatered by the withdrawal of water through wells, the coefficient of storage represents the water released from storage by the compression of the aquifer and by expansion of the water itself, and it is proportional to the thickness of the aquifer.
Not all water contained in the interstices of material, however, will be drained by gravity; some will be retained by molecular attraction. The volume of retained water, expressed as the ratio to the total volume of the material, is called the "specific retention" of the material. The specific yield and specific retention are together equal to the "poros ity," which is the percentage of void space contained in a material. Thus, if 100 cubic feet of a saturated formation yields 25 cubic feet and retains 10 cubic feet of water under gravity, the specific yield is 0.25 or 25 percent, the specific retention is 0.10 or 10 percent, and the porosity is 0.35 or 35 percent.
AQUIFER TESTS
The coefficients of transmissibility and storage of the alluvial de posits of Fountain and Jimmy Camp Valleys were determined at 12 aquifer test sites and from analyses of samples at selected sites that were tested in the Geological Survey Hydrologic Laboratory at Den ver. During the aquifer tests, the wells were pumped at a nearly uniform rate for a period of several hours to several days. The dis charges of the wells and the depths to water level were measured at periodic intervals throughout the duration of pumping. For some tests, observation wells were drilled at selected distances from the pumped wells; their water levels also were measured periodically during pumping and drawdowns were determined (fig. 6). After pumping stopped, the water levels were measured periodically until they reached or approached their original position.
From the data gathered during the tests, the coefficient of transmis sibility and the specific yield were computed by the Theis nonequilib- rium formula (Theis, 1935, p. 519-524), the modified nonequilibrium formula described by Jacob (1946, p. 629-646), Cooper and Jacob (1946, p. 526-534), and the Thiem equilibrium formula (Thiem, 1906).

20 GROUND WATER, FOUNTAIN AND JIMMY CAMP VALLEYS
Pumped well
on well Observation well
before pumping
Drawdown '' ?*'
in pumped :,";
.Drawdown curve de-
.^'scribing the cone of depression around the pumped well \0'. f : ' "--'' ' '"Q-°
. <>.' \'<j...o.- _-.. $ o ^'rU':' :''*v:.-6-.V.°-'.(>-;
. . -o, . .o -' : ' K' . v
^--E^-T 1!^ Z ZV^-^-2. I-^l-Irlr J T Pi^ea b[e_bed rp_ck_ £"-Z'-i^^-^Z-iH^fjrZr^r^^JriJriiftlf^lf^
FIGURE 6. Effect of pumping well on water table.
The Theis nonequilibrium formula is represented by the curve marked "type-curve trace" on figure 7. The points plotted on the graph show how closely the data conforms to the formula. The factors in this formula and others used in this report are as follows:
T= coefficient of transmissibility, in gallons per day per foot; P= coefficient of permeability, in gallons per day per square foot; S= coefficient of storage, or specific yield, dimensionless;r= distance of observation point from pumped well, in feet;t= time since pumping started, in days;s= drawdown or recovery at any point in the cone of influence,
in feet;Q = discharge of pumped well, in gallons per minute; m= saturated thickness of the aquifer, in feet.
The modified nonequilibrium formula described by Jacob was also used for determining coefficient of transmissibility and specific yield and is shown in figure 8.
A summary of the results of the aquifer tests is given in table 2. The coefficients of transmissibility ranged from 10,000 to 220,000 gpd per foot. The coefficients obtained from tests in Fountain Valley were larger than those from tests in Jimmy Camp Valley because the alluvial materials in Fountain Valley are much coarser. The specific yields, as indicated by the aquifer tests, ranged from 0.01 to 0.27 and are generally indicative of water-table conditions. Only two of the values are shown in table 2, however, because the others probably are in error owing to the fact that the other tests were not of sufficient duration to permit complete or nearly complete drainage of the sediments in the cone of depression.

GROUND WATER IN THE ALLUVIUM 21
10.0
1.0
0.1
0.01
r j*
_0 = Mate
Type-curve trace
-a. Q. 0. » , ~~
267ft 510 gpm :h-point coordir
-^
rates
T>».
u =0.26 Wfu) = 1.0 rVf =3.5xl05 5 = 0.28 T- 114.6 Q W(u)l s- 210,00
~ S- uT
5
~ m = P -
1.8"
0.2 1.8 341 62C
r&X 7xft Of
r''
2 3
!P
// 10 5
d
.00 XK
>er
^- = O.OJ
sqft
J
Tl*
Ogpd
*e
F
L? S
wr
<VXQ
ft
Ss *fcss
Xi-s
p- Matcl-
« Field c
5,:! ^K
V\\- \
) point
-itbse
^
va tic n
.... .
103 10* 105 106 107
FIGURE 7. Aquifer-test data superposed on the type curve. Data from test of well15-66-14aacl.
.u
.5
1.0
1.5
2.0
2.5
X
fi anr =1
Q=5 t0 =l
2
X
d fz 011 10 i 2 m 64
\
=tift 5pn in, Q
^
m
i ti Lc
S
5
n
g
s >
sine
e in
10~ T~ As
T 264x510x10.58
,_°-3 T'o
^x
e pumpi
tercept o
^L
S
igb
n ze
230,000 gpc
- ^ r 2 x 1440 ,-_ 0.3x230.000x12 _ 0- _.,(101)2 X1440 U /??=34 ftP=6800gpdpersqft
.06
^ eg<
ro-
P<
an
Jr
r
rjwdo
t
Ikwn axisa
II Log 10<n
<
X i%:
N
= 1s0 - s ^
X0 o
0
V
1
s
10 100 1000 10,000 TIME SINCE PUMPING BEGAN, IN MINUTES
FIGURE 8. Graph of aquifer-test data for application of modified Theis formula. Data from test of well 15-66-14aacl.

to
to
TAB
LE 2
. Sum
mary
of
the
resu
lts
of
aq
uif
er t
ests
in
Founta
in a
na J
imm
y C
amp
Vall
eys
[Prin
cipa
l aqu
ifer:
AF,
allu
vium
of F
ount
ain
Val
ley;
AJ,
allu
vium
of J
imm
y C
amp
Val
ley;
AS,
allu
vium
of S
and
Cre
ek]
Wel
l loc
atio
n
14-6
5-27
ddbl
... ..
..
14-6
6-3
4cd
d- .
....
..16-6
5-3
dcd
4... ......
22db
bl ..
....
.
14ab
b _
. ...
.16
-65-
16bb
a2...
.....
32ad
al .
....
17-6
5-3c
cb _
_ . .
...
23dd
a _
-.-.
.18
-65-
lbba
l
Ow
ner
Ran
ches
...
...d
o -
. -..
K. J
. M
. Cor
mac
k ...
.
H. W
. Hou
f- ..
....
...
Cla
rk H
anna
..........
.....d
o .
...
. ---
Dan
Hob
nes _
. .
Prin
ci
pal
aqui
fer
AJ
AJ
AS
AJ
AJ
AF
AF
AF
AF
AF
AF
AF
Dep
thof wel
l(f
eet)
80.8
82 97 61.8
78.8
76.0
55.7
59.9
52.3
37.3
28.8
129
Dep
thto
bed
ro
ck(f
eet) 80 82 88 66 87 74 55 60 49 37 29
129
Dep
thto
wat
erbe
low
mea
sur
ing
poin
t(f
eet)
27.3
25.9
72.9
23.3
23.8
42.3
26.8
45.2
24.4
13.5
14.3
14.0
Tota
lsa
tu
rate
dth
ick
ness
(fee
t) 53 57 16 44 64 34 29 17 27 24 1512
5
Dur
atio
nof
pum
pin
g(h
ours
) 79
4 5 96 24A
nn 56 10 79 51 76 600
Ave
rag
epu
mp
ing
rate
(gpm
)
330
Qfl
fl 78 275
690
Rnn
670
495
525
460
280
nn
n
Dra
w
dow
n(f
eet) 35 38 10 29 9
9 15 10 13 14 17 10 10
Spe
cific
capa
cit
y(g
pmpe
r ft) 8 9 31 33 67 38 38 27 28 47
Coe
ffi
cien
t of
tran
s-m
issi
-bi
lity
(gpd
per f
t)
40, 0
00
20, 0
0010
,000
60,0
00in
n nn
n22
0,00
014
0, 0
0020
0, 0
0015
0, 0
0012
0,00
050
,000
180,
000
Ave
rag
eco
effi
cien
t of
perm
eab
ility
(gpd
per
sqft) 75
0
ocn 620
1 36
01,
560
6,50
04
800
ll',
800
5,00
03,
300
7 20
0'
Rad
ius
of in
flu
ence
at e
nd ofpu
mp
ing
peri
od(f
eet)
i nn
n
9 nn
n
1,20
070
03
nnn
500
1,20
070
0
2K
AH
Spe
cific
yiel
d(p
er
cent
) 20 27
Wat
erte
m
pera
tu
re(°
F) 55 55 55 54 t>i
55 53 55 55 54 54 63
Dat
e
3-18
-55
3-17
-55
7-29
-55
4-11
-55
5-19
-56
9-10
-54
7-19
-54
10-2
0-54
10-2
7-54
11-
1-54
10-6
-54
10-2
2-54
o
1 Ave
rage
bat
tery
of 2
wel
ls.

GROUND WATER IN THE ALLUVIUM 23
Under water-table conditions, the apparent specific yield increases with time as additional water drains from that part of the aquifer within the cone of depression. Figure 9 shows the increase in specific yield with time as computed by modification of the Theis method for well 15-66-14aacl. An extension of the curve, thus plotted, approaches the probable value of 20 percent.
Field measurements of depletion were used to facilitate another method for computing specific yield. Records show that 1,550 acre- feet of ground water was pumped from the four city of Colorado Springs wells in the Widefield area during a 7-month period, August 1954 through February 1955, and that the pumping caused the water table to decline more than 9 feet in some areas (see pi. 4). The volume of dewatered sediments in the cone of depression that developed around the pumped wells was determined by planimetering the areas enclosed by lines of equal water-level decline (pi. 4) and amounted to 5,200 acre-feet. An approximate value for specific yield of the aquifer in that locality was computed by dividing the volume of water pumped by the volume of sediments in the cone of depression, that is,
= '~30 percent. The approximate value of specific yield in
15 20 25
PERIOD OF PUMPING, IN DAYS
FIGURE 9. Graph showing the increase in specific yield with time. Data from test ofwell 15-66-14aacl.

24 GROUND WATER, FOUNTAIN AND JIMMY CAMP VALLEYS
the southern part of the area was computed to be 27 percent at well 18-65-lbba. This value was determined by dividing the volume of water pumped by the volume of the cone of depression around a single
pumped well after 25 days of pumping, that is, #=-=-=27 per
cent. These values show that the amount of recoverable water from this aquifer is great.
Measurements of water levels in observation wells within the cone of depression around the city of Colorado Springs wells showed that pumping effects did not extend to Fountain Creek. During this 7- month period, no significant amounts of water were added to, or with drawn from, the volume of water in the aquifer, other than the amount pumped by the city of Colorado Springs. During the period only 5.4 inches of precipitation fell, of which 3.9 inches fell in August and September, a time of high evaporation; consequently the amount of recharge to the aquifer probably was small.
LABORATORY TESTS
Several representative samples of water-bearing materials from the alluvium in Fountain Valley were analyzed in the Geological Survey Hyclrologic Laboratory; results are shown in table 3. These analyses were made for comparison with the results obtained from the field aquifer tests. The specific yields of these samples ranged from 18.6 to 35.3 percent, the specific retention ranged from 0.6 to 12.0 percent, and the porosity ranged from 28.7 to 39.6 percent. The coefficients of permeability ranged from 860 to 10,000 gpd per sq ft. These results
TABLE 3. Summary of laboratory determinations of hydrologic properties ofalluvial sediment^
Location
15-66-3acc- ______15-66-10aab... ......
15-66-llbcd..... .......
16-66-14aacl. ..........
15-66-14aac2._ .........16-65-16bbb2__.__ ....16-65-17aaa3._ .........17-66-3cdbl _-..._.__17-65-4dda. ...........18-65-lbba.. ..........
Depth of sample (feet)
35-4515253545 4252 62 72 79 3870 60
5216-1924-26
7
Specific reten tion (percent)
9.4
1.6 2.1 1.2.7 .6
1.2 3.0 6.32.0 d ^
11.911.612.05.4
Porosity (percent)
37.4
31.3 30.528.730.2 30.5 30.5 29.8 32.134.0 39.635.835.530.635.1
Specific yield (percent)
28.0
29.7 28.4 27.529.5 29.9 29.3 26.8 25.832.0 35.323.923.918.629.7
Coefficient of permeability
(gpd per sq ft)
4,2003,6001,7003,500 1,300 3,1005 800 5,900 8,600 5,200 6,5001,800
10,0001,300
8601,3004,8008,000

GROUND WATER IN THE ALLUVIUM 25
were consistent with the results of the field aquifer test given in table 2. A comparison between laboratory and field results at the location (15-66-14aac) is shown in the following tabulation:
Comparison of laboratory and field determinations
Saturated interval
42-49 _____ ....... _ ...........49-65...... ___ ......... ___ ....65-76...... __ ..................
Thickness(feet)
71611
34
Coefficient ofpermeability (gpd per sq ft)
6,50010,0001,800
Laboratory de terminations
Coefficient of transmissibility
(gpd per ft)
45, 500160,00019,800
225,300
Field deter mination
Coefficient of transmissibility
(gpd per ft)
220,000
From the results of the field and laboratory tests, a value of 25 percent was selected for use in all computations in this report that require the use of the factor of specific yield.
In addition to the hydrologic properties mentioned above, the particle-size distribution in five samples of alluvial materials from Fountain Valley was determined in the laboratory, and the results are shown in figure 10. The curves of the samples indicate materials of high permeability. Such curves are also useful in selecting well screens.
SPECIFIC CAPACITY OF WEIJjS
The "specific capacity" of a well is the rate of its yield per unit of drawdown and is determined by dividing the pumping rate in gallons per minute by the drawdown in feet. For example, if a well yields 100 gpm with a drawdown of 10 feet, it has a specific capacity
of or 10 gpm per foot. Specific capacity is a measure of well
performance; its value will vary with the hydraulic properties of the aquifer and with well-construction factors, such as the diameter of the well, its depth of penetration into the aquifer, the type and amount of perforations in the casing, and the amount and type of well development.
The relation of the specific capacities of wells to the coefficients of transmissibility, as determined by 12 aquifer tests, is shown in figure 11. The scatter of points reflects differences in well construction, the effects of change in saturated thickness near the pumping well, and, to a small degree, the differences in the time that measurements were made. The average line drawn through the points expresses a relation that can be used to estimate the transmissibility of other wells

PERCENT OF PARTICLES FINER THAN INDICATED SIZE
4 0CM
1
O 00
o
4*
-
CM
*U3
rora00
o
or?or"> o"5"*- -P^to
Z I[T>* >«
2
O 0
220^
ou> o>r;
f
p§f IV)"5 J.Sgs
o
S«l 5? 0 g 2
iv f o
si| 00°'
0" 0-i_ "^
O fl>
0^
(N3 S
<[M2|
* a-
^ o
00" g
>«|r
3 N
sf-Ol<»ro»
o-l PG~g
<n s
0.001?
SiSTTVA dISEVO AHWIf dNV NIVUSLfKM "H31V.M.

GROUND WATER IN THE ALLUVIUM 27
15-66-14abb 15-66-14aacl
50
40
30
20
£ 10
0 50,000 100,000 150,000 200,000
COEFFICIENT OF TRANSMISSIBILITY, IN GALLONS PER DAY PER FOOT
FIGURE 11. Graph showing the relation of specific capacity of wells tapping the alluvium to the coefficient of transmissibility of the aquifer in the vicinity of the wells.
in the same general area from their specific capacities. This relation can be expressed by the following equation:
r=4,000 C where
T=coefficient of transmissibility, C= specific capacity.
For example, if the specific capacity of a well is 50 gpm per foot, then the coefficient of transmissibility of the aquifer adjacent to the well would be about 4,000X50, or 200,000, gpd per foot.
This method of estimating transmissibility should be used with caution because of the possible large error that may result from the affecting factors. One of the factors that may cause considerable error in this area is the reduction of saturated thickness. Many of the wells are pumped at near-capacity, and water levels are lowered to near the bottoms of the wells. The resulting decrease in saturated thickness causes greater drawdowns than assumed, which in turn yield a smaller value for specific capacity than would be indicated by the transmissibility.
Although the tune of measurement is probably unimportant for most of the tests used to construct figure 11, a test on one well (15-66- 14aacl) in Fountain Valley suggests that time can be an important factor. This well, which penetrated alluvium having a transmissi bility of about 220,000 gpd per foot, had a specific capacity of 62 gpm per foot after pumping 1 day and 33 gpm per foot after pumping 29 days, during which time the water level in the aquifer was lowered about 2 feet and less saturation and a slightly lower transmissibility resulted.
695-548 O 63 3
-65-22dbbl 16-65-32adal 16-65-16bba2
17-65-23dda 17-65-3ccb

28 GROUND WATER, FOUNTAIN AND JIMMY CAMP VALLEYS
The specific capacity value obtained after a pumping period of about 12 hours is suggested for general use with the equation.
The wells in this area generally are of similar construction and the error due to this factor probably is small.
UNDERFLOW
The determination of the permeability of the alluvium in a valley makes possible the determination of the underflow in that valley, if the cross-sectional area of the water-bearing materials and the gradient of the water table are also known. Estimates of the underflow at several places through the alluvium of Fountain and Jimmy Camp Valleys were made by substituting measured and estimated values in a modified form of Darcy's law, which may be written as:
Q=quantity of water passing through the cross section in gallons in which
Q = quantity of water passing through the cross section in gallonsper day;
P =coefficient of permeability, in gallons per day per square foot; 7=hydraulic gradient of the water table, in feet per mile;
.4 = area of cross section, in mile-feet (width, in miles, times thethickness, in feet);
a=angle between the given cross section and a cross section ori ented normal to the direction of the valley.
The coefficient of permeability was determined by means of acquif er tests (table 2) near the selected cross section; the hydraulic gradi ents and the angles a were determined from plate 1; and the areas were determined from the cross sections in plate 2 and from the data on saturated thickness in plate 1.
A summary of the rates of underflow in the alluvium and the changes in underflow that would occur from changes in water level are given in table 4. The rate of underflow through the four cross sections ranged from 2.7 to 4 mgd or about 3,000 to 4,500 acre-feet per year, and averaged about 3,500 acre-feet per year. The change in rate of under flow per foot of water-level decline ranged from 130 to 250 acre-feet per year and averaged about 190 acre-feet per year. The average change in rate of underflow per foot of change in water level in the aquifer along sections A-A' and B-B' is about 130,000 gpd or about 140 acre-feet per year. The hydrograph of plate 3 shows that the water level in the vicinity of these sections was about 4 feet higher in the fall of 1948 than in July 1954. Thus, lowering of the water level in this heavily pumped part of the Widefield channel during that period probably caused a reduction in underflow of about 600 acre-feet per year. The water-level decline and, hence, the decrease in underflow was caused in part by lower precipitation and stream- flow but chiefly by the increased withdrawals of water from wells.

GROUND WATER IN THE ALLUVIUM 29
The underflow along Jimmy Camp Valley was computed to be 800,000 and 900,000 gpd, respectively, through cross sections E-E' and F~F' (pi. 1). The increase in underflow between these sections indicates that the maximum underflow of Jimmy Camp Valley may be about 1 mgd, or about 1,100 acre-feet per year near its confluence with Fountain Valley.
TABLE 4. Rates of underflow in Fountain and Jimmy Camp Valleys, July 1954
Cross section (pl. 1)
A-A'. .........B-B'.._. .......C-C".....___...D-D'.. ........E-E'.. ..... ..F-F'_. .........
Cross section of
alluvium
Aver age
width (miles)
0.85 .70 .80
1.5 .70 .6
Aver age
thick ness (feet)
26 20 12 19 16 25
Aver age
gradi ent
(feet per
mile)
30 30 2828 50 38
Aver age
coeffi cient of permea bility (gpd
per so. ft)
6,500 6,500
10,000 5,000 1,400 1,600
Cosine a
0.707 1.0 1.0 1.0 1.0 .996
Approximate underflow
Gal lons per
minute
2,080 1,870 1,870 2,780
550 630
Gallons per day
3,000,000 2, 700, 000 2, 700, 000 4,000,000
800,000 900,000
Acre- feet per
year
3,400 3,000 3,000 4,500
900 1,000
Change in underflow rep resented by 1- foot rise or de
cline of the water table
Gallons per day
120,000 140,000 220,000 210,000 50,000 35,000
Acre- feet per
year
130 150 250 240
56 40
CONFIGURATION OF THE WATER TABLE AND MOVEMENT OFGROUND WATER
The water table in the Jimmy Camp and Fountain Valleys is an irregular surface that slopes in a general downstream direction. The irregularities reflect changes in recharge conditions from place to place, differences in permeabilities and thicknesses of water-bearing mate rials, and differences in the concentration of pumpage of ground water. The surface is mounded in areas where recharge is concentrated. Losses of irrigation water from ditches and fields, and concentration of water flowing into the valleys from tributaries, are typical conditions in areas of concentrated recharge.
Although the slope of the water table and hence the movement of ground water are in a general downstream direction, there is also movement to and from the stream depending upon whether the stream is a "gaining" or "losing" stream. Figure 12 shows the two conditions. Jimmy Camp Creek is a losing stream above Fountain, and Fountain Creek in most places is a gaining stream. Numerous seeps in the vicin ity of the Barnes Eanch (sec. 25, T. 15 S., R. 66 W.) are visual evidence that this part of Fountain Creek is a gaining stream. During periods of heavy pumping in areas where the wells are concentrated, Fountain Creek becomes a losing stream because pumping lowers the water table below the level of the stream.
Calculations based on field and laboratory measurements of hydro- logic properties indicate that water moves downstream through the

30 GROUND WATER, FOUNTAIN AND JIMMY CAMP VALLEYS
Influent stream (Stream loses water)
Effluent stream (Stream gains water)
Water table
A. PROFILE OF STREAM CHANNEL
C. EFFLUENT STREAM
FIGURE 12. Diagrammatic section showing the relation of a stream to the water table. A, Longitudinal section showing how stream loses and gains water; B, Transverse sec tion across influent or losing part of the stream; C, Transverse section across effluent or gaining part of the stream.
alluvium of Fountain Valley at the rate of about 15 feet per day, or about 1 mile per year. Ground water moves more slowly in Jimmy Camp Valley owing to the lower permeability of the alluvial materials in this area. Calculations indicate that the rate of movement is about 6 feet per day or about i/2 m^& Per year. These figures represent aver age values; actual values may be much more or less in local areas where gradients are considerably different than the average gradient.
WATER-LEVEL FLUCTUATIONS
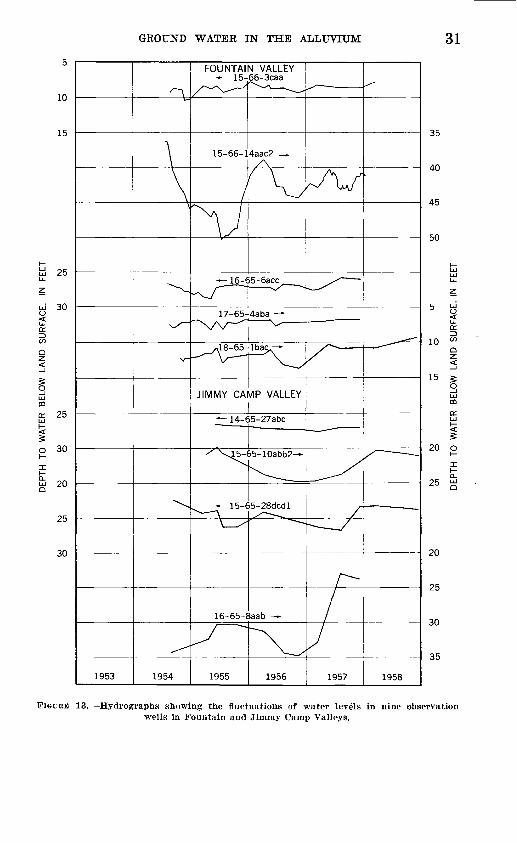
Records of water levels in 51 wells were studied for this report and are published separately (Jenkins, 1961). The records for four of the wells extend back to 1944, and the balance cover the period 1954 through 1958. Selected records are shown graphically in plate 3 and figure 13. Some of the water level measurements have been published previously in Water-Supply Papers 1027, 1075, 1100, 1130, 1160, 1169, 1195,1225, 1269, 1325, and 1408 (U.S. Geological Survey, 1945- 55) and in Bulletin 500-S (Colorado State University, 1968). Sub sequent measurements for these wells will be published in future reports of the U.S. Geological Survey and the State of Colorado.
Plate 3 shows that the decline for the period 1944-58 was slight. It also shows that in heavily pumped areas the water level can be lowered substantially; however, the water levels recover rapidly dur ing periods of above-normal recharge and reduced pumping. An examination of the records of individual wells representative of dif ferent areas shows how the water table responds to various influencing factors.
GROUND WATER IN THE ALLUVIUM 31
FOUNTAIN VALLEY 15-66-3caa
30
35
FIGURE 13. Hydrographs showing the fluctuations of water levels in nine observation wells in Fountain and Jimmy Camp Valleys.
32 GROUND WATER, FOUNTAIN AND JIMMY CAMP VALLEYS
The water levels in wells 15-16-llbdc and 15-66-14abb, which are near the heavily pumped area in the Widefield channel, first declined and then rose sharply during the period 1954r-58. The water levels declined abruptly during periods of heavy pumping by municipal users that began in 1954, and then rose rapidly after the pumping was decreased greatly or discontinued. The water level in well 15-66-25aaa, near the confluence of the Widefield channel and Fountain Creek and about 2y2 miles downstream from the heavily pumped area, declined gradually from 1950 through 1956, and then rose rapidly during 1957. The rise during 1957 was due to above- normal precipitation and the resulting decrease in pumping.
The hydrographs show that the water level in the aquifer in the Widefield channel recovers rapidly after periods of heavy pumping; this rapid recovery indicates a high potential recharge rate. The aquifer is continually being recharged by percolation of water from the stream at two places (sec. 4, T. 15 S., R. 66 W. and sec. 24, T. 15 'S., R. 66 W.) between which the depleted zone is rapidly replenished.
The water level in well 15-66-3caa (fig. 13) fluctuated only slightly because it is near the stream at the upper end of the Widefield chan nel where stream losses, quickly increase or decrease in response to varying demands imposed by pumping. Well 15-66-14aac2 is in the heavily pumped area farther from the stream; its water level rose and declined rapidly in response to changes in the amount pumped. The water levels in wells 16-65-6acc and l7-65-4aba, which are near the stream, appear to be related to changes in streamflow. An increase in flow causes a rise in the stage of the stream, which in turn causes a rise in water level where the aquifer is hydraulically connected with the stream. The streamflow records shown on plate 3 are from a sta tion about 6 miles southeast of Fountain.
The abrupt rises in water levels during 1957 in wells 16-65-l7aaal (pi. 3) and 16-65-8aab (fig. 13) were caused chiefly by above-normal flow in Jimmy Camp Creek and by above-normal applications of sur face water for irrigation. Jimmy Camp Creek, an intermittent stream, loses much of its flow to the ground-water reservoir. Meas urements made along a 2-mile reach of the stream bed showed that 60 percent of an original flow of 10 second-feet was lost in that reach. In 1957, when above-average precipitation caused an abundance of surface water, a part of the flow from Fountain Creek was diverted into Jimmy Camp Creek: a part of it was used to irrigate land along Jimmy Camp Creek, and a part was used for irrigation in Fountain Valley. The large losses of the diverted water from Fountain Creek to Jimmy Camp Creek and flood flows in Jimmy Camp Creek ac counted for a substantial part, of the rise in water levels in the al-

GROUND WATER IN THE ALLUVIUM 33
luvium of Jimmy Camp Valley. The infiltration of water applied to the lands for irrigation and the heavy precipitation account for the remainder of the rise.
Well 18-65-lbac is in the southern part of the area where the land is irrigated with both surface water and ground water. During the pumping season the recharge to the ground-water reservoir tends to balance the depletion of the reservoir by pumping, and the water levels remain relatively stable.
Well 14-65-27abc is in the upper part of Jimmy Camp Valley in an area of little pumping, and its water level fluctuated very little during the period of record. The water level in well 15-65-10abb2, which is south of the area of heaviest pumping in Jimmy Camp Val ley, shows the effect of heavy pumping from April 1955 to April 1957. The rise in water level in 1957 can be attributed both to the cessation of pumping by the city of Colorado Springs and to the in creased precipitation. The water level in well 15-65-28dcdl in Jimmy Camp Valley fluctuates in agreement with the seasonal pumping of ground water for irrigation, the fluctuations being typical in several areas. Surface water diverted from Fountain Creek enters Jimmy Camp Valley about iy2 miles downstream from well 15-65-10abb2, or about 21/£ miles upstream from well 15-65-28dcdl, as shown in plate 1.
STORAGE
The maximum amount of ground-water storage in the valley de posits can be estimated by multiplying the volume of saturated mate rials by the specific yield. Estimates of the volume were obtained by multiplying the length of the valley by the average cross-sectional area as determined from the four cross sections shown in plate 2 and other cross-sectional areas determined from data on saturated thick ness shown on plate 1. The calculations show that about 70,000 acre- feet of ground water is stored in Fountain Valley and about 25,000 acre-feet is stored in Jimmy Camp Valley.
The ground water stored in the alluvial deposits is especially use ful during drought periods. When the amount of water being re charged to the aquifer is less than the combined rates of withdrawal and natural discharge, water is removed from storage. Thus, the amount of water that can be pumped during droughts is dependent largely on the amount in storage.
Only a part of the stored water can be recovered economically. The yield of wells decreases as the water level is lowered in the aquifer, and the well becomes impractical and uneconomical to pump, al though a substantial quantity of water may remain in storage. The usable amount may be only half that shown by the computations.

34 GROUND WATER, FOUNTAIN AND JIMMY CAMP VALLEYS
GROUND-WATER RECHARGE
The ground-water reservoir of the alluvium of Fountain and Jim my Camp Valleys in the area of this report is recharged by precipi tation, by infiltration from streams, by seepage from canals, reser voirs, and irrigated fields, and by subsurface inflow from adjacent areas. The importance of each source varies from area to area.
PRECIPITATION
Precipitation is the initial source of all the recharge in the report area. Probably not more than iy2 inches of the normal annual pre cipitation in the area, however, recharges the aquifer; the remaining 12 to 15 inches runs off to the streams or is lost by evaporation and transpiration.
Recharge rates from precipitation probably are greatest during the early spring when the thawed ground is moist and evapotranspiration rates are low. Recharge during the summer months is more pro nounced in the irrigated parts of the two valleys. The water has more opportunity to percolate to the water table when the soil is moist. In dryland areas most of the moisture is held by capillarity in the zone of aeration and, subsequently, is used by plants before is has an opportunity to percolate downward to the water table.
STREAMS
Most of the recharge from streams occurs where the creek bed is above the water table. The water table in most of the Fountain Valley alluvium is above stream level, and, therefore, water discharges from the aquifer to the stream. However, during periods of heavy pump ing in areas where the wells are concentrated, the movement of water is from the stream to the aquifer.
The perennial flow of Fountain Creek is derived from precipitation in its drainage area of about TOO square miles, which includes the Pikes Peak, Rampart Range, and the Monument Valley areas. The makeup of the flow through the area of investigation is affected by the inflow from the Blue River watershed and upstream diversions within the Fountain Creek watershed. A part of the diverted water returns to the stream from sewage-treatment plants along the valley. The amount returned from the largest of these, the Colorado Springs plant, is shown in table 5. The increase in flow from the sewage plant reflects increased water consumption by the city. Other treatment plants that discharge to Fountain Creek include those serving Se curity Village and Fort Carson. The town of Fountain has a lagoon- type treatment plant; the effluent seeps into the shale or evaporates, but does not reach the stream. Below the Colorado Springs plant the owners of canal ± have a right to divert 9.8 second-feet of stream-

GROUND WATER IN THE ALLUVIUM 35
flow, which includes the sewage effluent, for irrigation in Fountain and Jimmy Camp Valleys and on the upland area between the valleys.
The flows of Fountain Creek, Jimmy Camp Creek, and several irri gation ditches were measured at several temporary gaging stations in an attempt to detect changes in flow caused by ground-water dis charge or recharge (pi. 1; table 6). Station L was at the site of a per manent gaging station maintained by the U.S. Geological Survey from 1938 to 1954, and a hydrograph of the flow at that station is given on plate 3. The records indicate that at the time of this study there was no appreciable loss or gain in streamflow along Fountain Creek, that the movement of water from the stream to the Widefield channel (pi. 1) was effectively prevented by the intervening shale barrier, and that the stream did not lose large quantities of water into the large cone of depression developed around the heavily pumped wells in the Widefield channel.
The record of the permanent gaging station (station L) shows that the average annual discharge at the station is about 40,000 acre-feet. Upstream from this gaging station are several canals that divert 15,000 to 25,000 acre-feet per year. Table 4 shows the ground-water under flow to be about 4,000 acre-feet per year, and table 7 shows the pump- age of ground water to be about 10,000 acre-feet per year. Most of the surface water diverted by canals and the ground water pumped from wells is used within the area. It is estimated that one-half of this amount returns to the stream or ground-water underflow above the gaging station. Consequently, the possible water development in Fountain Valley from both surface and underground sources is about 60,000 acre-feet per year.
The entire flow of Jimmy Camp Creek is diverted for irrigation near its confluence with Fountain Creek and does not normally contribute to the flow of Fountain Creek, except during periods of high runoff. The flow of Jimmy Camp Creek was measured twice during this in vestigation; the-results are listed in table 6.
The wide sandy stream bed of Jimmy Camp Creek is dry most of the time. During periods of excessive rainfall, however, it may carry
TABLE 5. Return of water to Fountain Creek from the Colorado Springssewage-treatment plant
Year
1956.... ................ ......... .... 1956............................................1957 ._- _1968
Daily average return
Million gallons
7 7.2 8 9.6
Cubic feet per second
11 111215
Acre-feet
22 22 25 30
Total annual return
acre-feet
7,800 8,100 9,000
11,000

36 GROUND WATER, FOUNTAIN AND JIMMY CAMP VALLEYS
TABLE 6. Flow of Fountain and Jimmy Camp Creeks and of several ditches,in cubic feet per second, at various d,ates
[Station locations shown on pi. 1]
Station
A........B_. ......C. .......D........E. .......F. .......G. ...... .
H.. ......
I ......J ......K.. ......
L.. ......
M........N........
July 20, 1954
3.023.28
4.40
2.35
2.62
4.68
6.45
1.39
1.331.16
Jan. 13, 1955
2.142.41
Apr. 18, 1955
9.008.589.449.39
13.8312.73
.75
Apr. 19, 1955
8.118.649 no
July 9, 1955
5.49
June 27, 1956
0.70
Remarks
Fountain Creek.Do.Do.Do.Do.Do.
Clover ditch return and FortCarson sewage discharge.
Irrigation ditch diversion fromFountain Creek.
Irrigation ditch diversion fromFountain Creek.
Fountain Creek. Permanentgaging station.
Fountain Creek.
large quantities of water, some of which percolates through the perme able sandy channel and reaches the water table. The amount of water that percolates to the water table depends upon the size and duration of the flood, the amount and type of sediment carried by the flood, the condition and gradient of the channel, and the permeability of the underlying material.
CANALS, RESERVOIRS, AND IRRIGATION
The ground-water reservoir in this area is recharged substantially by the seepage of water from canals and reservoirs and from irrigated land supplied by the canals. Canal 4, which carries water from Foun tain Creek to Little Johnson and Big Johnson Reservoirs, crosses sandy soil and probably loses large amounts of water to the underlying ground-water reservoir. The reservoirs also lose water, as shown by the seepage to the surface directly downstream from Big Johnson Reservoir, along the valley on the Fountain Valley School property, and along the draw in the SE% sec. 18 T. 15 S., R. 65 W. Water from Big Johnson Reservoir is used to irrigate some upland areas between Fountain and Jimmy Camp Valleys and areas in Fountain and Jimmy Camp Valleys. Part of this irrigation water eventually recharges the aquifers underlying the areas described. Several canals below the Widefield area divert water from Fountain Creek and cross the buried alluvial channel farther down the valley where the water has an opportunity to recharge the underlying aquifer.
Because the pumping of wells tends to lower it and the recharge from the application of surface water tends to raise it, the water table remains at a relatively constant level in areas where the land is ir-

GROUND WATER IN" THE ALLUVIUM 37
rigated with both surface and ground water. Where irrigation is with ground water alone, the water level tends to fluctuate more sharply as large quantities of water are pumped out of the aquifer and as a considerable part (perhaps 60 percent) of the water pumped returns to the aquifer by percolation through irrigated soils (see hydrographs in pi. 3 and fig. 13).
SUBSURFACE INFLOW
A considerable quantity of ground water enters the area by under flow through the alluvium of Fountain and Jimmy Camp Valleys, and smaller quantities enter through the tributary valleys. A small quantity of water is contributed along the sides of the valley by the mesa gravel and other surficial materials overlying the Pierre Shale. An estimate of the underflow at several locations across the valley is given in table 4. The underflow may differ from place to place and from time to time, because of the difference in cross-sectional areas, ground-water gradients, and permeabilities. The underflow along Fountain Creek ranged from 2.7 to 4 mgd, whereas the underflow along Jimmy Camp Creek ranged from 0.8 to 0.9 mgd (table 4).
The alluvial deposits are underlain by Pierre Shale, which does not readily transmit water; therefore, there is little or no subsurface inflow or outflow through the underlying shale. Interformational leakage between alluvium of the upper part of Jimmy Camp Valley and the Fox Hills Sandstone, Laramie Formation, and the Dawson Arkose is small because of the low permeability of the underlying consolidated rocks.
ARTIFICIAL RECHARGE
The alluvial aquifer in Fountain and Jimmy Camp Valleys could be recharged artificially by injection through wells and by spreading or ponding, if a supply of water were available. Fountain Valley should be a favorable area for artificial recharge because of the high coefficient of permeability and the specific yield of the aquifer. The aquifer in Jimmy Camp Valley could be recharged by these methods also, but at a lower rate because of the lower coefficient of permeability and the specific yield of the aquifer.
If the city of Colorado Springs should have an excess of water from its surface diversions at certain times in the year or during pe riods of above-normal runoff, treated water from their municipal sys tem could be injected directly into the alluvial aquifer in Fountain Valley through the city's wells near Widefield. The unsaturated deposits of the alluvium could be used as an underground reservoir that is largely free from evaporation and from construction costs. Water could be injected into the aquifer through the wells at a rate

38 GROUND WATER, FOUNTAIN AND JIMMY CAMP VALLEYS
comparable to the normal discharge of the wells, that is, at about 400 to 700 gpm per well, or an average of about 6 acre-feet per day through four wells. It is estimated, on the basis of data collected during this investigation, that an additional 5,000 acre-feet of water could be stored in the Widefield channel without causing waterlogging of the lowlands. Because ground water moves slowly (about 15 feet per day) and because the channel is bounded by shale on both sides (pi. 2, sections A-A', B-B'), a large part of the recharge water in jected during one season could be recovered in periods of heavy demand during the remainder of the year. Water could be withdrawn from the four injection wells or from a system of additional wells along the Widefield channel.
Although artificial recharge to the aquifer is physically possible, many problems would have to be overcome. The primary problem is legal: the securing of proper agreements with ground-water users in the Widefield area.
GROUND-WATER DISCHARGE
Water is discharged from the underground reservoirs of the Foun tain and Jimmy Camp Valley area by transpiration and evaporation, by springs and seeps, by wells, and by subsurface outflow.
TRANSPIRATION AND EVAPORATION
Ground water may be taken into the roots of plants directly from the zone of saturation or from the capillary fringe, and be discharged from the plants by transpiration. The depth from which plants will lift ground water varies according to the species of plants and the type of soil. The limit of lift by ordinary grasses and field crops is not more than a few feet; however, alfalfa, willows, cottonwoods, and certain types of desert plants may send their roots to depths of several tens of feet to reach the water table.
The discharge of ground water by transpiration and evaporation in the valleys is limited primarily to the areas where the water table is shallow. These areas generally are indicated by an abundance of cottonwood trees, such as are found along Fountain Valley and the lower part of Jimmy Camp Valley and which occupy about one-tenth of the total valley area. Where the water table is more than 20 feet below the land surface, the amount of water discharged from the ground-water reservoirs by these processes probably is negligble, but in the valley bottoms the discharge is considerable.
SPRINGS AND SEEPS
Some ground water is discharged from the ground-water reservoir through springs and seeps. Part of this loss is to perennial streams

GROUND-WATER DISCHARGE 39
in those places where the level of the stream is below that of the adja cent water table, and part occurs as springs and effluent seepage along the sides of Fountain Valley at the contact of the mesa gravel and the underlying Pierre Shale. Springs from the mesa gravel are most common along the west side of the valley between the town of Fountain and the Pueblo County line. The measured yield of individ ual springs and seeps ranged from less than 1 to 360 gpm, as shown in plate 1.
WELLS
Another form of discharge from the ground-water reservoir is by pumping from wells drilled for irrigation and public supply. These wells penetrate all the water-bearing alluvial materials; they range in diameter from 16 to 24 inches and in yield from about 40 to more than 1,300 gpm. The combined yield of all the large-capacity wells in the valley is a major part of the total discharge, which has increased greatly since 1950 because of the increased use of ground water for irrigation and public supplies. Estimates of the amount of water pumped from these large-capacity wells from 1954 through 1956, as determined from discharge and power records, are given in table 7. It is possible to pump ground water at a rate exceeding the underflow (table 4), without seriously depleting the aquifer, for intermittent periods because of the large amount of ground water in storage (p. 33) compared to the amount pumped and because of the avail ability of recharge from streams of Fountain Creek at those places where the stream overlies the main part of the buried channel.
TABLE 7. Pumpage from large-capacity wells in Fountain and, Jimmy CampValleys, in acre-feet
Location
Fountain Valley _____________ . ___________Jimmy Camp Valley
Pumpage, in acre-feet
1954
6,200 2,900
1955
7,700 3,300
1956
7,400 5,200
SUBSURFACE OUTFLOW
Water in the aquifer moves generally southward through the allu vium and leaves the area at the south boundary of the project area at the rate of about 4 mgd (4,500 acre-feet per year). Although the underflow at this point represents a loss of water from the project area, it does not represent a loss from the aquifer; rather, it is the water that moves through the aquifer across the south boundary of the project area into Pueblo County.

40 GROUND WATER, FOUNTAIN AND JIMMY CAMP VALLEYS
RECOVERY OF GROUND WATER
SPRINGS
Springs and seeps supply small quantities of water that are used for domestic purposes, for stock watering, and occasionally for irriga tion. Springs that yield as much as 10 gpm each issue at the contact of the mesa gravel and the underlying Pierre Shale along the sides of Fountain Valley. Along Fountain and Jimmy Camp Creeks, where the land surface coincides with or intersects the water table, springs and seeps are found. A tile drain along the seep in sec. 34, T. 14 S., K. 66 W. was flowing at a rate of 360 gpm when measured.
WELLS
Nearly all the wells in the project area are equipped with pumps. Most irrigation and public-supply wells are equipped with vertical turbine pumps; however, a few wells are equipped with centrifugal pumps. Domestic and stock wells usually are equipped with a cylin der, jet, submersible turbine, or centrifugal pump. Most of the pumps are powered by electricity, but a few are operated by combustion engines, by windmills, or by hand. The horsepower of electric motors on irrigation pumps ranges from 5 to 30, and that of the motors on municipal pumps ranges from 5 to as much as 75.
UTILIZATION OP WATER
Specific data on 209 wells and 9 springs in the Fountain and Jimmy Camp Valleys area were obtained during this investigation. Of the wells, about 41 were used for domestic and stock supplies, 100 for irrigation, and 25 for public supplies. The remainder were unused or their use was in doubt. The inventory included most of the irri gation and public-supply wells, but only some of the domestic and stock wells and springs.
DOMESTIC AND STOCK SUPPLIES
Domestic wells supply water to homes for cooking, drinking, water ing lawns and gardens, and washing. Stock wells supply a large part of the water for livestock principally cattle, hogs, poultry, and sheep; some is supplied from surface source. Most of the domestic and stock wells are small-diameter drilled wells. Water used for domestic and stock supplies commonly is hard but otherwise is satis factory. Withdrawals by wells for domestic and stock consumption constitute only a small part of the total ground-water use.
INDUSTRIAL SUPPLIES
The only industrial well in the area is used by the Daniels Sand Co. for washing commercial sand and gravel. The well (15-66-3bcc) is

UTILIZATION OF WATER 41
24 inches in diameter and was drilled to a depth of 35 feet in the allu vium of Fountain Valley. The discharge was reported to be 250 gpm, the measured drawdown was 10 feet, and the annual pumpage was estimated to be 140 acre-feet per year.
PUBLIC SUPPLIES
The city of Colorado Springs, the town of Fountain, and Security Village have a total of 15 municipal wells in Fountain Valley, and the city of Colorado Springs had 27 additional municipal wells in Jimmy Camp Valley. Withdrawals for municipalities is a major part of the total ground-water use.
COLORADO SPRINGS
The Colorado Springs metropolitan area, which had an estimated population of 100,000 in 1960, is supplied primarily by surface water from the Pikes Peak, Rampart Range, Blue River, and South Platte River watersheds. Because of severe drought, an emergency ground- water supply was developed during 1954 to supplement the failing surface-water supply. Agreements were negotiated with landowners in Fountain Valley to permit the city to pump water from three irri gation wells and from one new well all in the Widefield channel. The wells penetrate the alluvium and are bottomed in Pierre Shale at depths ranging from 69 to 75 feet. The wells have 24-inch casings and are equipped with 8-inch turbine pumps set at 66 feet and powered by 30-horsepower electric motors. The pump discharge was con trolled by valves to prevent surging.1 A nearby pumping station pro vided additional pressure to deliver the water to the city.
Before pumping into the Colorado Springs system began in July 1954, water levels in the wells ranged from 32 to 40 feet below land surface; after 15 months of continuous pumping at an average rate of 1,500 gpm, the depth to water in the four wells when the pumps were off ranged from 41 to 49 feet. A total of 2,960 acre-feet of ground water was supplied to the city from these wells during the period August 1, 1954, to October 24, 1955.
Water was also pumped from 27 smaller capacity wells in Jimmy Camp Valley. According to an agreement between Colorado Springs and three land owners in Jimmy Camp Valley, the wells were to be pumped for a period of 20 months beginning in April 1955. These wells had been drilled through the alluvium into the underlying Pierre Shale to depths ranging from 36 to 79 feet. They were equipped with 4- to 8-inch turbine pumps having bowl settings 5 to 10 feet above the base of the aquifer. Valves were placed on the
1 "Surging" refers to the phenomena that occurs when the pumping rate exceeds the yield of the well. The water level in the well falls below the bottom of the pump, and air is pumped until suction lift is regained ; this causes the discharge from the pump to fluctuate.

42 GROUND WATER, FOUNTAIN AND JIMMY CAMP VALLEYS
discharge pipe from each well to control the pumping rate. Water was discharged from the pumps into a 16-inch main and then flowed by gravity to the pumping station in Fountain Valley. The water levels in March 1955, before pumping into the Colorado Springs sys tem began, ranged from 16 to 28 feet below land surface. By Novem ber 1956, 2,400 acre-feet of water had been withdrawn from the allu vium in Jimmy Camp Valley and the water table in the vicinity had declined 8 to 11 feet.
The water from the wells in both valleys is carried to a sump and booster station near the Widefield well field where it is chlorinated and pumped through a 16-inch main to the Colorado Springs water system. This system also supplies all or part of the water used by Fort Carson, the Broadmoor Hotel, South Suburban Water Co., and Stratton Meadows.
Water from wells 15-66-llcdal and 15-66-14aacl in Fountain Val ley was analyzed as a part of this investigation and found to be hard; the concentration of other constituents is shown in table 8. A partial analysis of a sample of the water from well 14-65-34aacl in Jimmy Camp Valley indicated that the water is hard.
The return flow from the city's water system is measured at the sewage-treatment plant. The plant is built on alluvium and Pierre Shale along the north side of Fountain Creek. The treated sewage from the plant discharges into Fountain Creek (table 5) and irriga tion canal 4.
FOUNTAIN
Fountain (population 1,600 in 1960) formerly obtained its entire water supply from three reservoirs about 12 miles west of town, near the foothills. The reservoirs have a combined storage capacity of 19 million gallons. As the town grew, the supply became less ade quate. Because the reservoirs were adequate to supply the town for only about 9 months a year, an additional supply was developed by drilling wells into the alluvium of Fountain Valley to supplement the surface-water supply during the 3 months of peak demand. Four wells were owned by the town in 1955. Three wells pump directly into the 6-inch mains that are connected to reservoirs west of town; the other well is not connected to the system and therefore is not used. One of the wells connected to the system (16-65-6daa) and the unused well lfr-65-6acc were drilled prior to 1953. Well 16-65-6adc2, drilled in 1953, originally supplied only the high school but was later con nected to the distribution system. Well 16-65-6adcl was drilled in 1954 and connected to the system at that time. The unused well 16-65-6acc can supply an additional 200 to 500 gpm if needed. The average daily consumption of water in Fountain is about 166,000 gallons.

TAB
LE 8
. A
naly
ses
of
wa
ter
fro
m
sele
cted
w
ells
in
F
ou
nta
in
and
Jim
my
Ca
mp
V
all
eys
[Ana
lytic
al re
sults
in p
arts
per
mill
ion.
G
eolo
gica
l sou
rce:
AJ,
Jim
my
Cam
p A
lluvi
um; A
F, F
ount
ain
Val
ley
Allu
vium
]
Wel
l loc
atio
n
14-6
5-27
ddbl
» .
....
.. ..
.
34aa
cl _
_
_______ _
_ .
-
14-6
6-2S
ccC
-_- _
. ____
... ... . _
__
__
_ ..
16-6
5-28
dcdl
--~
_
- ____ - _ - _
---
33cb
d» _
_ . _
__ . _
..
llcd
al*
-
16-6
5-5a
da
. _
____________
. ...
(3)
17
-65-3
cca
-
Dep
th
(fee
t) 80.8
82 55.8
58.8
15.7
39.4
28.8
69.5
76.0
42.3
59.9
31.9
46.2
Geo
logi
c so
urce
AJ
AJ
AF
AJ
AF
AJ
AF
AF
AF
AJ
AF
AF
AF
Dat
e of
co
llec
tio
n
5-4-
555-
6-55
5-6-
555-
6-55
5-6-
555-
4-55
5-5-
5511
-23-
54
5-6-
555-
6-55
5-6-
555-
6-55
5-6-
55
Tem
per
at
ure
(°F)
55 55 54 54 53 53 55 53 KK 54 57 55 54 55
PH
7.9
7.9
7.2
7.7
7.9
7.6
7.5
7.1
7.7
7.7
7.7
7.6
7.7
7.6
Spec
ific
cond
uct
an
ce, i
n m
icro
- m
hos
at
25° C
740
807
735
1,60
01,
110
805
610
620
3,10
019
52,
730
1,68
0I
fl
Sil
ica
(Sld
)
14 21 9.5
16
Iron
(F
e) 0.14 .04
.09
.22
.85
Cal
cium
(C
a)
73 75 83 144
105
102 88 82 R/L
394 20 296
162
226
Mag
ne
sium
(M
g) 18 6.8
18 27 30 15 18 3.9
11 88 4.4
66 47 RQ
Sodi
um
(Na)
62 188 6
Kft 12 180
Pot
as
sium
(K
) 1.8
2.9
02
O
1 ft
q
Q
d H 1-4
f
I I ts * o *4 I &
Wel
l loc
atio
n
34aa
cl.-
- __ . .. _
____ - __ .
14-6
6-28
CC
C.-
15-6
6-2
8dcd
l
30cd
a ____________ -
-
33cb
d 1
...
16-6
6-3
caa._
llcd
al *
- ...
....
....
....
....
....
.. -
16-6
6-5a
da
(»)
16-6
5-16
bba2
.
__
__
.... _
. _ . __ . _
_ ..
.17
-65-
3cca
. ____________
_ ..
26dc
d... _
. ...... ..
....
....
...
Bic
arbo
n
ate
(HC
Os)
252
138
310
210
220
183
177
228 71
276
295
334
Sul
fate
(S
04) 160
430 50
14
1 26 854
Chl
orid
e (C
l) 11
11 18
23
28
25
25
18
13
48 2.8
40
40
32
Flu
orid
e (F
)
0.4 .2 .8
.5 2.8
2.4
Nit
rate
(N
Os) 1.
0 .8 5.2
13
.7 7.8
Perc
ent
sodi
um
34 56 6 37 27 31
SA
K
1.7
4.6 .2
1.7 .6 2.7
Dis
olve
d so
lids 84
0
1,07
5
500
409
115
1,56
0
Har
dnes
s as
CaC
Os
Tot
al 256
215
281
470
386
318
294
237
204
1,34
0 68
1,01
0 59
8 84
8
Non
- ca
rbon
ate 46
8 16
8 21
6 21
4 12
113 72
60
1,
160 10
78
4 35
6 57
4
1 A
naly
sis
furn
ishe
d by t
he C
ity
of C
olor
ado
Spr
ings
.2
Ana
lyze
d by t
he C
olor
ado
Sta
te B
oard
of H
ealt
h.3 T
own
of F
ount
ain,
com
posi
te s
ampl
e of
surf
ace
and
grou
nd w
ater
take
n fr
om t
ap.
CO

44 GROUND WATER, FOUNTAIN AND JIMMY CAMP VALLEYS
Results of this study show that additional wells capable of yielding 200 to 500 gpm can be developed in the buried channel extending southeastward through the town.
A sample of water from the municipal supply at Fountain was analyzed and found to be soft. Inasmuch as ground water in the alluvium of Fountain Valley is hard, the sample probably represents largely surface water from the reservoirs. The results of the analysis are given in table 8.
To provide for sewage treatment, the town of Fountain in 1956 constructed two lagoons on the relatively impermeable Pierre Shale that reportedly prevent leakage into the alluvium and contamination of the ground-water reservoir.
SECURITY VILLAGE
Security Village (population 9,000 in 1960) is an unincorporated suburban housing development begun in 1954. It is in the Wiclefield School area and is supplied by four wells formerly used for irrigation and by five new wells. The wells are all drilled through the alluvial gravel of the Widefield channel and are bottomed in the underlying Pierre Shale. The wells range from 50 to 80 feet in depth and had water levels of about 40 feet, in July 1954, before heavy pumping for municipal use began. The Security Village wells have 24-inch casings and are equipped with 4- to 8-inch turbine pumps powered by 30- to 75-horsepower electric motors. Water from the wells is pumped di rectly into 8- to 12-inch mains. An elevated storage tank and reser voir attached to the system have a capacity of 2 million gallons. At the beginning of this investigation, the four original wells had a combined yield of about 2,000 gpm. During periods of heavy pump ing the yields declined, and the water table declined 5 to 13 feet but recovered to near their original levels and capacities after cessation of heavy pumping. In 1956 the wells pumped 720 acre-feet, or an average of 640,000 gpd. Although no samples of water from the Security Village wells were collected for chemical analysis, samples from nearby wells 15-66-llcdal and 15-66-14aacl were analyzed; the results are given in table 8 and are discussed on p. 46-52.
Security Village has a complete sewage-treatment plant that is built on Pierre Shale near Fountain Creek. The treated sewage from the plant discharges into Fountain Creek and contributes to its flow; the total discharge in 1956 was 150 acre-feet.
Water diverted from Fountain Creek has been used for irrigation in Fountain and Jimmy Camp Valleys for a hundred years; however, the stream was soon overappropriated because the water rights granted exceeded the normal streamflow. Several of the early rights were

UTILIZATION OP WATER 45
purchased by the city of Colorado Springs. The lands served by these rights were then retired from irrigation until well development began, after which they were irrigated with water pumped from wells.
The first well to be used for irrigation in Fountain Valley (15-66- Sdcal) was developed on the Pinello Kanch in 1912; the second irri gation well was constructed on the Bender Kanch in 1930 and was re placed by the present Bender well in 1948. Irrigation with water from wells increased rather slowly until 1940, after which it increased rapidly. By 1955 more than 70 irrigation wells in the Fountain Valley part of the project area were used to irrigate or to supplement the irrigation of about 5,000 acres. In 1955,43 large-capacity wells along Jimmy Camp Valley were used as the sole source of supply or as a supplemental supply for the irrigation of about 2,000 acres. A few of these wells have been used for both irrigation and public supply.
Some of the irrigable land in the vicinity of Widefield and Fountain has been taken out of production and used as sites for housing devel opments. These developments use either the existing or new wells for municipal water supply.
YIELDS OF IRRIGATION WELLS
Irrigation wells in Fountain Valley yield from 70 to 1,340 gpm, and those in Jimmy Camp Valley yield from 40 to about 700 gpm. The average specific capacity (yield per foot of drawdown) of wells in Fountain Valley is about 38 gpm per foot, and the average of those in Jimmy Camp Valley is about 14 gpm per foot.
CONSTRUCTION OP LARGE-CAPACITY WELLS
Several methods have been used in constructing irrigation, public- supply, or other large-capacity wells in the Fountain and Jimmy Camp Valleys area. Some wells were drilled or dug by the owners, and others were constructed by excavating a sump where the water table is near the surface. However, most of the wells were drilled by professional well drillers by means of cable-tool, standard hydraulic- rotary, reverse hydraulic-rotary, and sand-pump methods.
Most of the large-capacity drilled wells in the area have casings 16 to 24 inches in diameter. Most irrigation wells use perforated casing, and many have gravel-pack type construction. Gravel-packed wells generally are drilled 8 to 12 inches larger than the casing diameter to accommodate the gravel pack. Most municipal-supply wells are similarly constructed, but some use screens instead of perforated pipe.
Following their completion and development, wells in this area gen erally are tested to determine the yield and drawdown. A pump is installed in such a manner that its intake is below the point of draw down. The installation generally is completed by laying a concrete slab level with the top of the well casing. A 6-inch hole through the
46 GROUND WATER, FOUNTAIN AND JIMMY CAMP VALLEYS
concrete slab at the side of the casing is sometimes provided so the well owner can add to the gravel pack; the pumping of fine material from the aquifer causes settlement of the gravel.
The wells that perform best in the report area generally have in corporated a combination of desirable features. These wells are drilled to bedrock (Pierre Shale), their casings are slotted or screened opposite all permeable material, the screen, slots, or gravel pack is de signed to keep out all or nearly all the fine material after the well has been properly developed, and the space occupied by openings is great enough to minimize water entrance-losses without reducing the struc tural strength to the point of hazarding collapse of the casing.
Some well construction in the area violates some of these criteria and results in low yields, poor performance, pumping of sand, or short lived wells. Careful attention to these pertinent points by both the owners and drillers can materially improve the efficiency of future wells.
Screen size and aggregate for gravel packs can be better selected if selection is based on sample analyses from the well. One way of analyzing particle-size distribution is shown on figure 10.
The interference effect among closely spaced wells can reduce the yield of the affected wells substantially. Some closely spaced wells in the area are less efficient than they would be if they had been spaced farther apart. Although the spacing problem is largely one of eco nomics, data in this report suggest that spacing of 1,000 feet or more between large-capacity wells would reduce interference effects substan tially throughout most, of the area.
The reader is referred to the following reports for additional de tails on the methods of constructing and developing wells: Code (1929), Tolman (1937), Kohwer (1940), Bennison (1947), Wood (1950), Meeks (1952), Lockman 2 (1954), Gordon (1958), and Vaadia and Scott (1958).
QUALITY OF WATER
The samples analyzed (table 8) probably have a chemical quality representative of that of the ground water in the alluvium of Foun tain and Jimmy Camp Valleys. The one tap sample suggests that the surface-water supply of the town of Fountain is of better quality than the best ground water in the area. Because some of the samples contain certain constituents in undesirable amounts, wells intended to furnish water for public supply and industrial purposes should be sampled and the water analyzed to determine its suitability for the intended use. Some of the common criteria that may affect the
3 Lockman, J. R., 1954, Selection of gravel pack for water wells in fine, uniform, un- consolidated aquifers : M. S. thesis in Colorado State Univ. Library.

UTILIZATION OF WATER 47
use of water are summarized herein. An explanation of the many requirements of water for industrial use are beyond the scope of this report, as is a study of the properties of water that may affect its use for sanitary purposes; to insure against bacterial contamina tion users should avail themselves of the services of their appropriate public health agencies.
COMPOSITION OF NATU&AJ, WATER
All natural water contains dissolved mineral matter. Water in contact with soils and rocks even for only a few hours will dissolve some mineral matter. The quantity of mineral matter dissolved by natural water depends chiefly on the type of rocks and soils with which the water comes in contact and the duration of the contact. Ground water usually contains more dissolved mineral matter than surface runoff because it remains in contact with soils and rocks for longer periods of time. The concentration of dissolved solids in a river water may be increased by drainage from mines and oil fields and by discharge of industrial and municipal wastes into the streams, and in irrigated areas by return drain waters.
EXPRESSION OF RESULTS
The dissolved mineral constituents in table 8 are reported in parts per million. A part per million is a unit of weight of a constituent in a million unit weights of water. Equivalents per million, though not given in this report, are sometimes preferred to the expression of results in parts per million. An equivalent per million is a unit chemical combining weight of a constituent in a million unit weights of water. Equivalents per million for any constituent are obtained by dividing the concentration of the constituent in parts per million by the chemical combining weight of the constituent. For conven ience in making this conversion, the reciprocals of chemical combin ing weights of the most commonly reported constituents are given in the following tabulation.
Constituent
Iron (F+3)_. ________________Manganese (Mn+2)___Calcium (Ca+2)_._ ______Magnesium (Mg+2)Sodium (Na+1)-------------Potassium (K+»)___. _________
Beciprocals
0 537036404QQ082204350256
Constituent
Carbonate (C O3-2)__ _______Bicarbonate (HCOs- 1 ) ------Sulfate (SOr2)------------Chloride (Cl-1 )- - ----------Fluoride (F- 1 ) ----------Nitrate (NO.- 1) -------
Eeclprocals
0 033301640208028205260161
Results in parts per million can be converted to grains per U.S. gallon by dividing by 17.12.
Total hardness as used in this report means the hardness ex pressed as calcium carbonate caused by calcium and magnesium in

48 GROUND WATER, FOUNTAIN AND JIMMY CAMP VALLEYS
the water. The hardness equivalent to the carbonate and bicarbonateis called carbonate hardness and can be found by subtracting non-carbonate hardness from total hardness (table 8). Hydrogen-ion concentration is expressed on the pH scale. Specific-conductance values are expressed as micromhos per centimeter at 25°C. In many reports conductance is designated by the letter K and values ex pressed as above may be written K X 106 at 25°C. A micromho is a millionth of a reciprocal ohm.
SUITABILITY OF WATER FOB DOMESTIC AND IRRIGATION USE
The chemical properties and constituents most likely to be of con cern to residents of the report area are (1) dissolved solids, (2) specific conductance, (3) sodium-adsorption-ratio, (4) hardness, (5) iron, (6) fluoride, (7) nitrate, and (8) sulfate. For further informa tion the reader is referred to the publication "Water Quality Cri teria" (California State Water Pollution Control Board, 1952).
DISSOLVED SOLIDS AND SPECIFIC CONDUCTANCE
Dissolved solids is a measure of the total mineralization of water and is a significant criteria for most uses. In general, the suitability of water for most uses decreases with an increase in its mineral content. State and municipal authorities have widely adopted the standards set by the U.S. Public Health Service (1946) for drink ing water used on common carriers in interstate commerce. The standards indicate that dissolved solids should not exceed 500 ppm, but, if such water is not available, as much as 1,000 ppm may be permitted. In some areas, the residents accustomed to more highly mineralized water appear to suffer no ill effects, though the water may be toxic to transient visitors. Stock have been known to sur vive on water containing as much as 10,000 ppm dissolved solids; however, their well-being may be noticeably affected by water con taining more than 3,000 ppm.
The specific conductance of water samples from a number of wells in Fountain and Jimmy Camp Valleys (Jenkins, 1961) was deter mined in the field by means of a field conductivity set. The con centration in parts per million of dissolved solids in a solution is roughly equal to two-thirds of the specific conductance in micromhos at 25°C. For example, if the specific conductance were 600, then the amount of dissolved solids in solution would be about 400 parts per million. The amount of dissolved solids is given for the sam ples from only six wells in table 8, but the concentration of dissolved solids in samples from additional wells can be estimated by means of the specific conductance determination.
The concentrations of dissolved solids in the samples of water that was determined in the laboratory (table 8) ranged from 115 to 1,560

UTILIZATION OF WATER 49
ppm and the specific conductance ranged from 195 to 3,100 micromhos at 25 °C. The specific conductance and the dissolved-solids content increases downstream because the return flow of underground drainage water from irrigated lands is more highly mineralized than the natural flow. The return flow becomes highly mineralized because of the rela tively slow movement of the water through the interstices of the uncon- solidated alluvial materials and over the underlying shale bedrock and because of concentration by evaporation and transpiration of ground water that lies near the surface. The specific conductance of ground water along Fountain Valley, determined by field determina tions, increased from 480 at well 14-66-33bca to 1,800 at well 18-65- Ibbal, and the specific conductance along Jimmy Camp Valley increased from 740 at well 14-65-27ddbl to 3,100 at well 16-65-5ada.
SODIUM-ADSORPTION-RATIO
The three indices used to show the suitability of water for irrigation in this report are percent sodium, sodium-adsorption-ratio (SAK), and specific conductance. Percent sodium and SAR are related to the sodium hazard; the specific conductance is related to the salinity hazard. The hazard increases as the numerical value of the indices increase. Although boron in relatively small concentrations can be a hazard to irrigated crops, no determinations of boron content were made. Six determinations plotted on figure 14, according to the stand ards suggested by the U.S. Salinity Laboratory (1954) for irrigation water in arid areas, show the water to be low in sodium, but three of the six determinations show that the water to be high in salinity. High salinity waters can be used successfully on soils having adequate drainage. Most of the soils in the valleys are permeable and afford good drainage. The good drainage and the dilution from rainfall and periodic surface-water applications suggest that even the high salinity water would be suitable. Supplemental measurements of conductance suggest that most of the ground water in the alluvial deposits is within the range indicated by the analyses in table 8 and, therefore, is suitable for irrigating land in the valleys.
HARDNESS
Water having a hardness of less than about 50 ppm generally is rated soft, and its treatment for the removal of hardness generally is not necessary. Hardness between 50 and 150 ppm does not seriously inter fere with the use of water for most purposes, but it does increase the consumption of soap; its removal by a softening process is profitable for domestic use for laundries, and for some other industries. The ground-water samples collected in this area ranged in hardness from

50 GROUND WATER, FOUNTAIN AND JIMMY CAMP VALLEYS
204 to 1,340 ppm. None of the samples of water were soft, although the sample of tap water collected from the water supply of the town of Fountain, which was a mixture of surface and ground water, had a hardness of only 68 ppm. The water for the municipal supply of Fountain is therefore only slightly harder than the upper limit for soft water.
100 4 5000
- 30
100 250 750 2250SPECIFIC CONDUCTANCE, IN MICROMHOS PER CENTIMETER
SALINITY HAZARD
FIGURE 14. Classification of water for irrigation use with regard to the sodium and salinity hazards. After U.S. Salinity Laboratory Staff (1954).

UTILIZATION OF WATER 51
IRON
Next to hardness, iron is the constituent of natural water that in general receives the most attention. The quantity of iron in ground water may differ greatly from place to place, even though the water is derived from the same formation. If water contains more than 0.3 ppm, the excess may precipitate as a reddish sediment. Iron, which may be present in sufficient quantity to give a disagreeable taste to water and to stain cooking utensils, may be removed from most water by simple aeration and filtration, but some water requires the addition of lime or some other treatment.
The amount of iron in the samples of ground water from the allu vium in Fountain and Jimmy Camp Valleys ranged from 0.04 to 0.85 ppm, but only one of the five samples tested contained more than 0.3 ppm.
FLUORIDE
Fluoride in water has been shown to be associated with the dental defect known as mottled enamel, which may appear on the teeth of children who drink water containing excessive concentrations of fluo- ride during the period of formation of the permanent teeth. This con dition becomes more noticeable as the quantity of fluoride in the water exceeds 1.5 ppm. Recent reports indicate that the incidence of tooth decay is decreased or prevented by use of water containing concentra tions of fluoride of 0.8 to 1.5 ppm (California State Water Pollution Control Board, 1952, p. 257).
The concentration of fluoride as determined from six samples, ranged from 0.2 to 2.8 ppm, the highest concentration being from the municipal supply at Fountain, where a mixture of ground water and surface water is used. Additional sampling is needed to determine whether high fluoride content is a problem.
NITRATE
The concentration of nitrate in water used for drinking receives attention because nitrate-rich water may cause illness in infants when used in the preparation of formulas. Some nitrate can be dissolved from nitrate-bearing formations, but more commonly large concentra tions of nitrate are derived from surficial sources. Nitrate compounds are very soluble and may be readily dissolved from soils having high concentrations of nitrate (in some cases from fertilizer) or from nitro genous materials in privies, cesspools, and barnyards; hence, high con centrations of nitrate may indicate that the water contains harmful bacteria also. Large amounts of nitrate are commonly found in waters from dug wells and springs, which generally are not as well sealed from surface contamination as are deeper drilled wells.
Ninety parts per million of nitrate in water is considered by some authorities to be the lower limit dangerous to infants, whereas a con-

52 GROUND WATER, FOUNTAIN AND JIMMY CAMP VALLEYS
centration of 45 ppm is considered dangerous by others (Comly, 1945). The concentration of nitrate was determined for six samples of
water in Fountain and Jimmy Camp Valleys, including the composite sample of trap water collected from the municipal supply at Fountain. The concentration of nitrate ranged from 0.8 to 13 ppm and was well within the safe limits for human consumption.
STJLFATE
Sodium and magnesium sulfate in heavy concentrations produce a cathartic effect on people and stock. Concentrations of sulfate less than 250 ppm are considered safe from this hazard. Two of the samples tested exceeded this amount, one sample from the south part of the area, in Fountain Valley, and one from the south part of Jimmy Cnmp Valley.
CHANGES IN CHEMICAL. CONTENT
The chemical content of water in the report area may be expected to change from time to time and from place to place. The surface water used for irrigation undoubtedly varies in quality; the mineral content of the water subsequently is concentrated to varying degrees by evapotranspiration. These and other factors tend to modify the quality of the water percolating through the ground. Periodic sam pling, especially in problem areas, should be begun to show the varia tions and trends.
EFFECTS OF FURTHER DEVELOPMENT OF LARGE SUPPLIES OF WATER FROM WELLS
Further development of large supplies of water from wells may reduce the availability of surface water from Fountain Creek, deplete storage in the alluvium of Jimmy Camp Creek, create problems of re duced well yields periodically, and necessitate carefully planned pumping schedules to obtain maximum benefits. Proper use of the ground-water reservoir, however, can substantially increase the overall utility of the water resources in the valleys.
Special detailed studies in the Widefield area made as part of this investigation are most helpful for better understanding the hydraulic functions of the reservoir under certain pumping regimens.
WIDEFIELD AREA OF FOUNTAIN VALLEY
The problems in the Widefield area will become greater unless fur ther development is carefully planned. Factors to consider in plan ning future developments are (1) the boundaries of the reservoir, (2) the usable storage space, (3) the amount, distribution, and times of withdrawals, (4) the effects on water levels from recharge and inter mittent pumping, and (5) possible legal problems.

EFFECTS OF FURTHER DEVELOPMENT 53
The aquifer in the Widefield area consists of an alluvial-filled for mer channel (Widefield channel) of Fountain Creek. It is cut in shale and hydraulically connected with the present-day perennial stream only at the upper and lower ends of the area where the stream crosses the old channel.
A part of the 10,000 acre-feet of storage is available for use during extended droughts and peak seasonal withdrawal periods. Its maxi mum utility, however, is dependent upon the distribution of with drawals, but under any practical plan it probably would not exceed half the total storage.
Further development should be made near either the upper or lower ends of the Widefield area because the center part already is heavily developed. The opportunities for large sustained yields are best near the upper crossing of the stream and next best near the lower crossing. Yields near the upper end of the Widefield channel probably would be affected very little by existing pumping, whereas those at the lower end, away from the stream, may be affected appreci ably by upgradient withdrawals, the effect being dependent upon the amount, timing, and proximity of upstream pumping.
The demands for water from the area are and probably will con tinue to be variable during the year and from year to year owing to the types of water uses. Because the major users are municipalities and irrigators, all of whom use much more water during the summer than in the winter, further development generally would be more ef fective if the new demands were greater during the winter. The pumpage records for 1954-56 (table 9) show marked variations in annual pumpage. Heavy pumping by the city of Colorado Springs began in the Widefield area on Aug. 2,1954, during a period of serious drought, and continued for 15 months, the total withdrawal being 2,960 acre-feet.
Kecharge to the buried channel can be substantially increased at either end when water levels in the vicinity of the stream are lowered by pumping. An increase in recharge, of course, reduces the amount of streamflow. Although insufficient data are available for an esti mate, recharge from the stream probably would be at least 5,000 acre- feet per year under optimum conditions, and might be considerably more.
The availability of water in the central and lower parts of the Widefield channel may be substantially affected by upgradient with drawals. These effects were carefully studied and are reported in de tail in the following section.
Plate 4 shows the water-level decline at several intervals due to pumping during the period from Aug. 1, 1954, to November 1956. Successive maps show how the area of substantial water-level decline increased in size, especially in the downstream direction. The anoma-
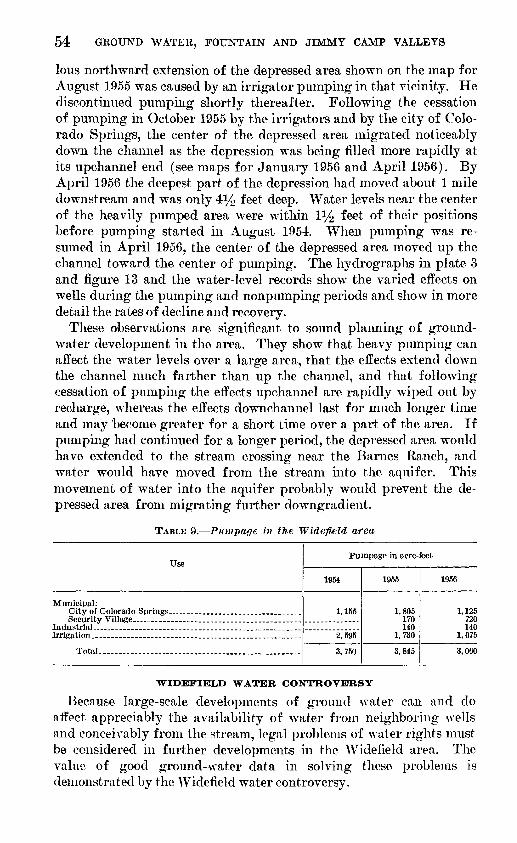
54 GROUND WATER, FOUNTAIN AND JIMMY CAMP VALLEYS
Ions northward extension of the depressed area shown on the map for August 1955 was caused by an irrigator pumping in that vicinity. He discontinued pumping shortly thereafter. Following the cessation of pumping in October 1955 by the irrigators and by the city of Colo rado Springs, the center of the depressed area migrated noticeably down the channel as the depression was being filled more rapidly at its upchannel end (see maps for January 1956 and April 1956). By April 1956 the deepest part of the depression had moved about 1 mile downstream and was only 4iy2 feet deep. Water levels near the center of the heavily pumped area were within iy2 feet of their positions before pumping started in August 1954. When pumping was re sumed in April 1956, the center of the depressed area moved up the channel toward the center of pumping. The hydrographs in plate 3 and figure 13 and the water-level records show the varied effects on wells during the pumping and nonpumping periods and show in more detail the rates of decline and recovery.
These observations are significant to sound planning of ground- water development in the area. They show that heavy pumping can affect the water levels over a large area, that the effects extend down the channel much farther than up the channel, and that following cessation of pumping the effects upchannel are rapidly wiped out by recharge, whereas the effects downchannel last for much longer time and may become greater for a short time over a part of the area. If pumping had continued for a longer period, the depressed area would have extended to the stream crossing near the Barnes Ranch, and water would have moved from the stream into the aquifer. This movement of water into the aquifer probably would prevent the de pressed area from migrating further downgradient.
TABLE 9. Pumpage in the Widefield area
Use
Municipal:
Irrigation. . .. _____ ____________ ..
Total. , . .............. ..........
Pumpage in acre-feet
1954
1,155
2,595
3,750
1955
1,805 170 140
1,730
3,845
1956
1,125 720 140
1,075
3,060
WIDEFIELD WATER CONTROVERSY
Because large-scale developments of ground water can and do affect appreciably the availability of water from neighboring wells and conceivably from the stream, legal problems of water rights must be considered in further developments in the Widefield area. The value of good ground-water data in solving these problems is demonstrated by the Widefield water controversy.

EFFECTS OF FURTHER DEVELOPMENT 55
During the course of this study, a controversy arose between the owner of well 15-66-14abb (Bender well) and the city of Colorado Springs, which was pumping from wells 15-66-llcdal and 2 (Vene- tucci wells), 15-66-lldcd (North Hayes well), and 15-66-14aacl (South Hayes well). An agreement was drawn up in May 1957 whereby the city of Colorado Springs agreed to measure the water levels periodically in seven observation wells (15-66-llbca, 15-66- llcaal, 15-66-lldcbl, 15-66-13bcc2, 15-66-13cddl, 15-66-14aac2, and 15-66-14abal) and to refrain from pumping their production wells when the water levels in the observation wells declined below specified levels. The purpose of the stipulation was to maintain a gro. d-water reservoir level that was adequate to allow the Bender well to pump 600 gpm. The text of the civil action reads as follows:
COUNTY OF EL PASO CIVIL ACTION No. 33752
Findings by Engineers in regard to pumping by the Defendants to be permitted in 1957.
The following findings are herewith submitted to the parties in the above action as a guide to pumping operations by the Defendants in accordance with the stipulation entered therein some months ago.
(1) Interference with pumping at full capacity at the Bender Well occurs when the depth to the water table thereat in the absence of pump is thirty-one (31) feet or more below the elevation of the ground at the well.
(2) To avoid interference by the Defendants with full-capacity pumping at the Bender Well, as defined in the aforesaid stipulation, pumping by the Defendants for the present should be limited as follows:
(a) The South Hayes Well (15-66-14aacl) may be pumped continu ously until the Engineers otherwise determine. No interference by this well is expected this year because of its distance downgradient from the Bender Well.
(b) At the North Hayes Well (15-66-lldcd) pumping is to be discon tinued when the water table in test well 15-66-14aba is 45.5 feet below the top of the casing thereat, and may be resumed when such water table reaches an elevation 44.5 feet below the top of the casing thereat.
(c) At the Venetucci Wells (15-66-llcdal&2) pumping is to be discon tinued when the water table in test well 15-66-lldcb is 44.75 feet below the top of the casing aid may be resumed when such water table reaches an elevation 44.00 feet below the top of the casing. The guides at this well may be changed if and when Security pumps its new well, which is approximately 400 feet North of test well 15-66-lldcb.
The pumping guides herein presented are based on capacity pumping by Bender as practiced until some time in August. New guides should be adopted for the later portion of the year.
Colorado Springs, Colorado May 1,1957

56 GROUND WATER, FOUNTAIN AND JIMMY CAMP VALLEYS
This agreement proved satisfactory, and the yield of the Bender well exceeded 600 gpm during the 1957 irrigation season. A more detailed history of this case is discussed by Jenkins and Moulder (1962, p. 21-32).
FOUNTAIN VALLEY BELOW THE WIDEFIELD AREA
There was no great increase in pumping of ground water down stream from the Widefield area during the course of this investigation. The hydrographs in figure 13 and the water-level measurements (Jenkins, 1961) show seasonal fluctuations of the water levels in this part of the valley but no serious lowering of the water table. The buried alluvial channel meanders across the valley and underlies Fountain Creek at several places where it can receive recharge by infiltration of streamflow in the creek (pi. 2). The buried channel is a continuation of the Widefield channel and is fairly well identified on plate 1 by the pattern of irrigation and public-supply wells.
Large amounts of water can be withdrawn from Fountain Valley in this area by seasonal pumping, or moderate amounts can be with drawn continuously. If there is further development along this part of the valley and if large amounts of water are pumped continually, water-level declines comparable to those in the Widefield area may result. Some of the valley below the Widefield area is still irrigated by surface water, a part of which recharges the aquifer and helps sustain ground-water levels.
Both the ground-water underflow and the return flow to the stream would be affected if the surface-water rights in this area were sold and used elsewhere, because there would 110 longer be replenishment from irrigation.
JIMMY CAMP VALLEY
The city of Colorado Springs pumped water from wells in Jimmy Camp Valley from April 1955 to April 1957. The hydrographs in figure 13 and the water-level measurements (Jenkins, 1961) show that the water table declined as much as 13 feet in the vicinity of the pumped wells during this period. The cone of depression around each well enlarged and eventually coalesced into one large cone-shaped depression that migrated downstream, as did the cone of depression in the Widefield area. The cone in Jimmy Camp Valley did not move downstream far enough, however, to affect neighboring wells, for the wells here are more widely spaced than those in Fountain Valley. By the spring of 1958, after heavy pumping had ceased, the water levels had recovered almost to their position of 1955. Outside the area of heavy pumping in Jimmy Camp Valley, there was no serious lowering of water levels. Much of the land is irrigated with surface water diverted from Fountain Creek and with water pumped from wells; the water levels in these areas fluctuate seasonally.

COMPUTATIONS OF DRAWDOWNS 57
The sediments from which the water is pumped in Jimmy Camp Valley lie in a former channel of Jimmy Camp Creek. The channel can be fairly well identified on plate 1 by the pattern of irrigation and other large-capacity wells. Jimmy Camp Creek is intermittent except in a short reach near its confluence with Fountain Creek, where ground water seeps into the creek at less than 1 cfs. For this reason, pumping can cause very little depletion of streamflow and the creek cannot be a continuous source of recharge to the aquifer.
Moderate amounts of water can be withdrawn from the alluvium in Jimmy Camp Valley by intermittent pumping, but the pumping of large amounts of water for long periods of time would cause a serious lowering of the water table and a corresponding reduction in the amount of water in storage. The aquifer would be recharged in part, however, by precipitation, by infiltration from canals and reservoirs, and from streamflow during periods of storm runoff and by irrigation.
COMPUTATIONS OF DRAWDOWNS CAUSED BY THE PUMPING OF WELLS IN FOUNTAIN VALLEY
By ROBERT E. GLOVEB and EDWARD D. JENKINS
Because of pending litigation (see p. 54r-56), special computations were made as a part of this study to determine the cause of the lower ing of the water level in the vicinity of well 15-66-14abb.
Though all wells in the Widefield area were considered to be con tributing to the lowering of the water level in well 15-66-14abb, some were found to have no appreciable effect and were not used in the computations because (1) the amount of water pumped from them was small, (2) the amount pumped from them in previous years had had no adverse effects on well 15-66-14abb, and (3) their distance from well 15-66-14abb was considerable. The wells that contributed significantly to the lowering of the water level in the vicinity of well 15-66-14abb during 1954 and 1955 were 15-66-llbcd, 15-66-llcdal and 2, 15-66-lldcd, 15-66-14aacl, and 15-66-14abb.
Computations were made to estimate the effects that the pumping of these principal wells had on the lowering of the water table in well 15-66-14abb during parts of 1954-55; the results compared favorably with the measured water levels.
The area of lowered water table is a few miles southeast of Colo rado Springs in the vicinity of Widefield School and includes Security Village. As described previously (p. 53), the sediments from which the water is pumped lie in a former channel of Fountain Creek,- which is referred to as the Widefield channel (pi. 1). The sediments are separated locally from Fountain Creek by a shale barrier that effectively prevents the movement of water between the stream and

58 GROUND WATER, FOUNTAIN AND JIMMY CAMP VALLEYS
the aquifer adjacent to the stream, but they underlie and are in hy draulic continuity with the creek a few miles upstream and downstream from the area of heavy pumping (pis. 1 and 2). The Widefield channel has an average width of about 3,000 feet, and the sediments extend as much as 30 feet 'below the water table. The large-capacity wells are located at points where the sediments are thickest.
FIRST APPROXIMATION
BASIS OF THE COMPUTATIONS
The computations are based on the following assumptions, idealizations, and procedures:
1. It is assumed that all the water pumped comes from storage in the aquifer or from the points of contact with Fountain Creek.
2. The first approximation neglects the effect of drawdowns in reduc ing the cross-sectional areas of the saturated part of the aquifer and is made as a concession to mathematical difficulties. Later, a computation is made to evaluate the effect of the shortcomings of the first approximation.
3. It is assumed that the wells for which drawdowns are computed superimpose their effect upon an aquifer that has become stabi lized under the effects of pumping from the other older wells in the general area.
4. The trench is bounded laterally by relatively impervious shale barriers, and the drawdown from pumping is increased by the hydrologic boundaries created by these barriers. The method of images is used to compute the additional drawdown caused by the hydrologic boundaries. In order to simplify computations, the irregular boundaries of the trench were replaced by straight, parallel boundaries, as shown in figure 15.
5. The monthly pumpage is idealized in making the computations shown in plate 5, but the total quantity of water withdrawn from the aquifer by the wells is taken into account.
6. The water pumped is removed completely from the aquifer and none returns to the aquifer.
7. Drawdowns are computed by use of the Theis formula (Theis, 1935, p. 519-24).
SECOND APPROXIMATION
The second approximation was made to evaluate the effect of the shortcomings of the first approximation; the effect at well 15-66-14abb, less than one-half foot, was considered to "be negligible.
Field observations of the drawdowns indicate that the cone of de pression of the water table produced by pumping the wells has a tendency to migrate southward down the valley, which has a gradient of about 30 feet to the mile. Inasmuch as the computations of the first approximation do not show the effect of the migration of the
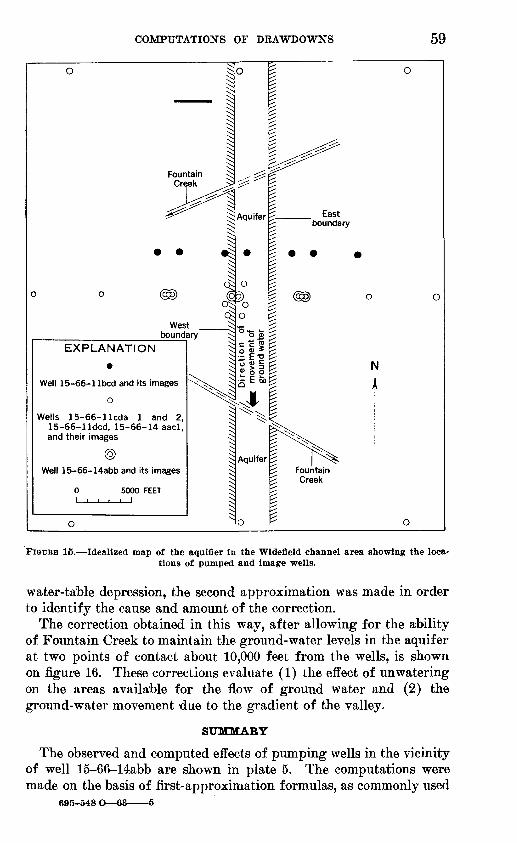
COMPUTATIONS OF DRAWDOWNS 59
o
Fountain Creek
West boundary
EXPLANATION
Well 15-66-1 Ibcd and its images
o
Wells 15-66-1 lcda 1 and 2, 15-66-lkJcd, 15-66-14 aacl, and their images
©
Well 15-66-14abb and its images
5000 FEET
Aquifer
Aquifer
O
East boundary
FIGURE IB. Idealized map of the aquifler in the Widefleld channel area showing the loca tions of pumped and image wells.
water-table depression, the second approximation was made in order to identify the cause and amount of the correction.
The correction obtained in this way, after allowing for the ability of Fountain Creek to maintain the ground-water levels in the aquifer at two points of contact about 10,000 feet from the wells, is shown on figure 16. These corrections evaluate (1) the effect of unwatering on the areas available for the flow of ground water and (2) the ground-water movement due to the gradient of the valley.
SUMMARY
The observed and computed effects of pumping wells in the vicinity of well 15-66-14abb are shown in plate 5. The computations were made on the basis of first-approximation formulas, as commonly used
695-548 O 63 5
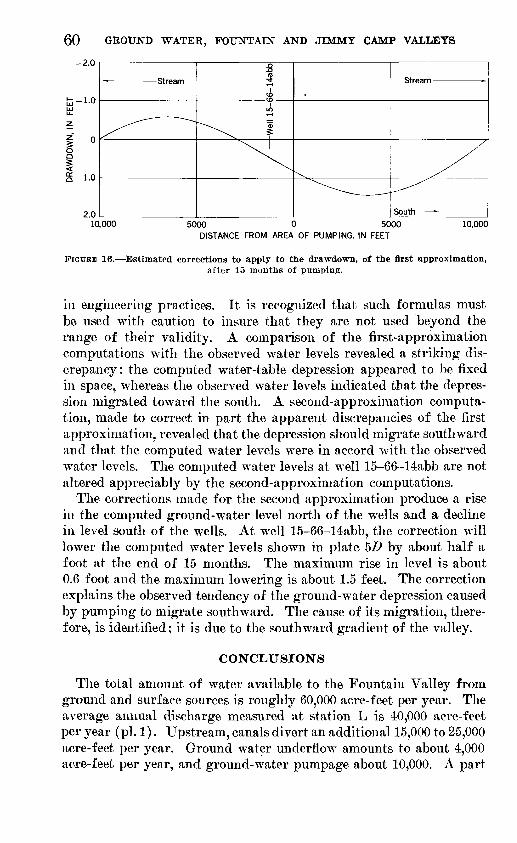
60 GROUND WATER, FOUNTAIN AND JIMMY CAMP VALLEYS
1.0
2.010,000 5000 0 5000
DISTANCE FROM AREA OF PUMPING, IN FEET10,000
FIGURE 16. Estimated corrections to apply to the drawdown, of the first approximation, after 15 months of pumping.
in engineering practices. It is recognized that such formulas must be used with caution to insure that they are not used beyond the range of their validity. A comparison of the first-approximation computations with the observed water levels revealed a striking dis crepancy: the computed water-table depression appeared to be fixed in space, whereas the observed water levels indicated that the depres sion migrated toward the south. A second-approximation computa tion, made to correct in part the apparent discrepancies of the first approximation, revealed that the depression should migrate southward and that the computed water levels were in accord with the observed water levels. The computed water levels at well 15-66-14abb are not altered appreciably by the second-approximation computations.
The corrections made for the second approximation produce a rise in the computed ground-water level north of the wells and a decline in level south of the wells. At well 15-66-14abb, the correction will lower the computed water levels shown in plate 5Z> by about half a foot at the end of 15 months. The maximum rise in level is about 0.6 foot and the maximum lowering is about 1.5 feet. The correction explains the observed tendency of the ground-water depression caused by pumping to migrate southward. The cause of its migration, there fore, is identified; it is due to the southward gradient of the valley.
CONCLUSIONS
The total amount of water available to the Fountain Valley from ground and surface sources is roughly 60,000 acre-feet per year. The average annual discharge measured at station L is 40,000 acre-feet per year (pi. 1). Upstream, canals divert an additional 15,000 to 25,000 acre-feet per year. Ground water underflow amounts to about 4,000 acre-feet per year, and ground-water pumpage about 10,000. A part

CONCLUSIONS 61
of the diverted and pumped water is not consumptively used and re turns to the flow system above station L.
Ground water is available for irrigation and intermittent large- scale uses from the alluvial deposits that underlie the Fountain and Jimmy Camp Valleys. An estimated 95,000 acre-feet of ground water is stored in the alluvium of these two valleys in the report area. Wells that yield more than 1,000 gpm have been developed in the alluvium of Fountain Valley, and wells that yield as much as 700 gpm have been developed in the alluvium of Jimmy Camp Valley. The coeffi cient of permeability for the alluvium of Fountain Valley averages about 6,000 gpd per sq ft; that of Jimmy Camp Valley averages about 1,000 gpd per sq ft. The specific yield is about 25 percent in both valleys. The alluvium is recharged by precipitation, by infiltra tion from streams, canals, and irrigation, and by subsurface inflow from adjacent areas. Water is discharged from the alluvium by trans piration and evaporation, springs and seeps, wells, and subsurface out flow.
The aquifer can be depleted as well as replenished quite rapidly because of the limited amount of ground-water storage. Heavy pump ing causes a lowering of the water level in the immediate area. If pumping continues for a long enough period, the depressed area will migrate downgradient, and yields of downgradient wells will be thereby reduced. Upgradient users are affected to a lesser degree by the downgradient users. Unsaturated deposits of the alluvium could be recharged artificially by injection through wells, or by spreading and flooding, if a supply of water were available; an underground re servoir essentially free from evaporation and construction costs would be created. Water so stored could be recovered within 1 to 2 years during periods of heavy demand without much loss to the stream.
The alluvial deposits yield hard water having moderate to high concentrations of dissolved solids. Ground water becomes harder and more mineralized down the valleys but generally is satisfactory for irrigation and domestic uses. The bedrock deposits of the Pierre Shale yield very small amounts of water of poor quality. The mesa gravel along the sides of the valleys yield small amounts of water through springs. The water is satisfactory for domestic and stock uses.
Additional hydrologic problems are anticipated in the future be cause of the relatively large number of irrigation and public-supply wells withdrawing large quantities of water from an aquifer that has a very limited extent and storage -capacity and that is in contact with the present stream. Periodic measurements of water levels in selected observation wells and of the flow of Fountain Creek at selected sites should be continued to enable detection of the problems before they be come serious and to provide information for planning further develop ments.
62 GROUND WATER, FOUNTAIN AND JIMMY CAMP VALLEYS
SELECTED BIBLIOGRAPHY
Bennison, E. W., 1947, Ground water, its development, uses, and conservation:St. Paul, Minn., Edward E. Johnson, Inc., 509 p.
Burgy, R. H., 1958, Water yields as influenced by watershed management: Am.Soc. Civil Engineers Proc., v. 84, no. IR2, Paper 1590, p. 1-10, 4 figs.
California State Water Pollution Control Board, 1952, Water quality criteria:State Water Pollution Control Board Pub. 3, 512 p., 4 figs., 31 tables.
Code, W. E., 1929, Construction of irrigation wells in Colorado: Colorado Expt.Sta. Bull. 350, p. 1-22.
1958, Water-table fluctuations in eastern Colorado: Colo. State Univ.Expt. Sta. Bull. 500-S, 34 p., 3 figs., 17 pis.
Collingwood, D. M., and Bethaneourt, R. J., 1953, Waterflooding in north govern ment wells field, Duval County, Texas: Am. Inst Mining Metall. EngineersTrans., v. 198, p. 157-164.
Comly, H. H., 1945, Cyanosis in infants caused by nitrates in well water: Am.Med. Assoc. Jour., v. 129, p. 112-116.
Cooper, H. H., Jr., and Jacob, C. E., 1946, A generalized graphical method forevaluating formation constants and summarizing well-field history: Am.Geophys. Union Trans. v. 27, no. 4, p. 526-534.
Dane, C. H., Pierce, W. G., and Reeside, J. B., Jr., 1937, The stratigraphy of theUpper Cretaceous rocks north of the Arkansas River in eastern Colorado:U.S. Geol. Survey Prof. Paper 186-K, p. 207-232, figs. 9-11, pis. 64, 65.
Darton, N. H., 1905, Preliminary report on the geology and underground waterresources of the central Great Plains: U.S. Geol. Survey Prof. Paper 32, 433p., 72 pis., 18 figs.
1906, Geology and underground waters of the Arkansas Valley in eastern Colorado: U.S. Geol. Survey Prof. Paper 52, 90 p., 28 pis.
Ferris, J. G., 1950, A quantitative method for determining ground-water charac teristics for drainage design: Agr. Eng., v. 31, no. 6, p. 285-289, 291.
Finlay, G. I., 1916, Description of the Colorado Springs quadrangle [Colorado] : U.S. Geol. Survey Geol. Atlas, Folio 203.
Gilbert, G. K., and Gulliver, E. P., 1895, Tepee Buttes: Geol. Soc. America Bull., v. 6, p. 333-342.
Glover, R. E. and B aimer, G. G., 1954 River depletion resulting from pumping a well near a river : Am. Geophys. Union Trans., v. 35, no. 3, p. 468-470.
Glover, R. E., and Bittinger, M. W., 1960, Drawdown due to pumping from an unconfined aquifer: Am. Soc. Civil Engineers Proc. v. 86, no. IR3, Paper 2594, p. 63-70, 1 fig.
Gordon, R. W:, 1958, Water-well drilling with cable tools: South Milwaukee, Wis., Bucyrus Erie Co., 230 p.
Griswold, D. H., 1948, Fountain River watershed Colorado geology and ground water: U.S. Dept. Agriculture, Soil Conserv. Service; mimeo, rept., 19 p.
Henderson, Junius, 1920, The Cretaceous formations of the northeastern Colo rado plains: Colorado Geol. Survey Bull. 19, p. 22-23.
Howbert, Irving, 1925, Memories of a lifetime in the Pikes Peak region: New York, G. P. Putnam's Sons, 298 p.
Jacob, C. E., 1946, Drawdown test to determine effective radius of artesian well: Am. Soc. Civil Engineers Proc., v. 72, no. 5, p. 629-646.
Jenkins, E. D., 1961, Records, logs, and water-level measurements of selected wells and test holes and chemical analyses of ground water in Fountain, Jimmy Camp, and Black Squirrel Valleys, El Paso County, Colorado: Colorado Water Conserv. Board and U.S. Geol. Survey Ground-Water Ser., Basic Data Rept. 3, 25 p., 1 fig., 2 pis.

SELECTED BIBLIOGRAPHY 63
Jenkins, E. D. and Moulder, E. A., 1962, Ground-water technology and litiga tion problems: Am. Soc. Civil Engineers Ptoc., v. 88, no. IR2, paper 3166, 5 figs.
Laverty, F. B., 1958, Recharging ground water with reclaimed sewage effluent: Civil Engr., v. 28, no. 8, p. 585-587.
Lovering, T. S., Aurand, H. A., Lavington, C. S., and Wilson, J. H, 1932, Fox Hills formation, northeastern Colorado: Am. Assoc. Petroleum Geologists Bull., v. 16, no. 7, p. 702-703, July, 1932.
McLaughlin, T. G., 1946, Geology and ground-water resources of parts of Lin coln, Elbert, and El Paso Counties, Colorado: Colorado Water Conserv. Board, Ground-Water Ser. Bull. 1,139 p., 6 pis., 15 figs.
Meeks, T. O., 1952, Developing and testing irrigation wells: U.S. Dept. Agri culture, Soil Conserv. Service Reg. 6, Bull. 114, Geol. Ser. 4, p. 1-42, 9 figs., 1 chart.
Meinzer, O. E., 1923, The occurrence of ground water in the United States, with a discussion of principles: U.S. Geol. Survey Water-Supply Paper 489, 321 p., 31 pis., 110 fig.
ed., 1942, Hydrology: New York, McGraw-Hill Book Co., Inc., 712 p.Moulder, E. A. and Frazor, D. R., 1957, Artificial-recharge experiments at
McDonald well field, Amarillo, Texas: Texas Board of Water Engineers Bull. 5701.
Piaggio, T. T. H., 1929, Differential equations: [new ed.] London, Bell and Sons, 256 p.
Piper, A. M., 1933, Notes on the relation between the moisture equivalent and the specific retention of water-bearing materials: Am. Geophys. Union Trans., v. 14, p. 481-487.
Rohwer, Carl, 1940, Small irrigation pumping plants: U.S. Dept. Agriculture Farmers Bull. 1857, 30 p.
Scofield, C. S., 1933, Quality of irrigation waters: California Dept. Public Works, Div. Water Resources Bull. 40, p. 1-95.
Sheldon, A. Z., 1881, History of the Arkansas Valley, Colorado (history of El Paso Co.) : Chicago, O. L. Baskin and Co., p. 416.
Shreve, D. R., and Welch, L. W., Jr., 1956, Gas drive and gravity drainage analysis for pressure maintenance operations: Am. Inst. Mining, Metall. Petroleum Engineers Trans., v. 207, p. 136-143, 7 figs.
Theis, C. V., 1935, The relation between the lowering of the piezometric surface and the rate and duration of discharge of a well using ground-water stor age : Am. Geophys. Union Trans., 16th Ann. Meeting, pt. 2, p. 519-524, 3 figs.
Thiem, G., 1906, Hydrologische methoden [Hydrologic methods] : Leipzig, J. M. Gebhardt, 56 p.
Tolman, C. F., 1937, Ground water: New York, McGraw-Hill Book Co., Inc., 593 p., 188 figs.
U.S. Public Health Service and Colorado State Dept. Public Health, 1955, Re port on the joint sanitary engineering survey of the public water supply of Colorado Springs, Colorado : Mimeo. rept., 80 p.
U.S. Public Health Service, 1946, Drinki, g water standards: Public Health Repts., v. 61, no. 11, p. 371-384.
U.S. Salinity Laboratory Staff, 1954, Saline and alkali soils: U.S. Dept. Agri culture Handb. 60, 160 p.
Vaadia, Yoash and Scott, V. H., 1958, Hydraulic properties of perforated well casings: Am. Soc. Civil Engineers Proc., v. 84, no. IR1, Paper 1505, 26 p., 12 figs.
Van Horn, Richard, 1957, Bedrock geology of the Golden quadrangle, Colorado: U.S. Geol. Survey Geol. Quad. Map GQ-103.
64 GROUND WATER, FOUNTAIN AND JIMMY CAMP VALLEYS
Welge, H. J., 1952, A simplified method for computing oil recovery by gas or water drive: Am. Inst. Mining Metall. Engineers Trans., v. 198, p. 157-164.
Wenzel, L. K., and Kazmann, R. G., 1944, Well-discharge: A method of comput ing the quantity of water derived from storage within a given radius of a discharging well: Am. Geophys. Union Trans., 25th Ann. Meeting, pt. 6, p. 940-944, 3 figs.
Wood, I. D., 1950, Pumping for irrigation: U.S Dept Agriculture, Soil Conserv. Service Tech. Paper 89, 40 p.

INDEX
[Italic page numbers indicate major references]
PageAbstract ___________________ .. 1Acknowledgments _________ _____ 6Agriculture __________________ 8Alluvium, description ______________ IS
occurrence of ground water. ________ 17recharge, artificial. ___________ ... 37storage of water... ___________ .. 33subsurface inflow ___ __________ 37underflow.. ... ______ ... .. ___ USwells.. __ .. __ ... __ . _ ..... __ ... 18
Analyses.. ___________________ 48Aquifer, Dawson Arkose. . . __________ 14
Fox HiUs Sandstone __ . __ . _ ........ ISJimmy Camp Valley ___ ... _____ .. 57Laramie Formation... ___________ IStests...- ___ ... ___ .... _ - __ . __ 19Widefield area _ . ____ . ___ . ___ 53
Artificial recharge. . _______________ 37 Availability of water, Fountain Valley, below
Widefield area.... __ . _ ........ 56Fountain Valley, Widefield area. . . ___ 52Jimmy Camp Valley. __________ .. 56
Canals. _... _ .... _ . _ .....---.-.-.- ..-. 36Chemical content of water, changes ______ BSClimate. _____________________ 8Coefficient of permeability, denned ______ 18
general ______ . _______ . ____ 22,24,25relation to underflow. __________ .. 28
Coefficient of storage, defined. _________ 19Coefficient of transmissibility, alluvium. .. 20, 22, 25
defined ___________ . ________ 18relation to specific capacity ______ _ 25
Colorado Springs, water supply.. ______ .. 41Colorado Springs sewage plant, return of water
to Fountain Creek. ______ .... 35 Composition of natural water __ . _____ .. 4? Conclusions.. __ . ___ . __ _____ ___ 60 Construction of large-capacity wells. ___ .. 46 Cross section, alluvium __ . ________ .. 15
Dawson Arkose, description _________ .. 14Definitions. ___ _______ ________ /8Discharge.. _________ . _________ 38Dissolved solids. _______________ 48Domestic supplies, description _______ .. If)
suitability of water _____________ 48Drainage ___ . _________________ 7Drawdown, computation ________ _ _ 57
Evaporation, effect on discharge of groundwater... __ . __ .. ____ .. __ 38
Extent of area __ ______ ___ ____ 3
Fieldwork__.____. Fluoride content of water.
PageFormulas used in aquifer tests________. 19Fountain, hardness of water__.. 50
nitrate content of water__________ 52water supply. ....._ J$
Fountain Valley, acres under irrigation- 8 gradient 7 rate of ground-water movement-- 30 Widefield area.._..____.- 51
Fountain Valley below Widefield area, effects of further development of large supplies of water from wells.__ 56
Fox Hills Formation, description_.__ 13 Fox Hills Sandstone, contact with Pierre
Shale . . 12description-.._ ._... IS
Geography.. 7 Geologic formations and their water-bearing
characteristics________..... 9 Gradient.-...______. __.__._-- 7,28,29 Gravel, water-bearing properties_ 17
Hardness, defined. .__......... ..description,___.___________..
History of area... .--..- .. Hydraulic gradient, relation to underflow- _.. Hydraulic properties, principal aquifer.......Hydrologic properties, alluvial sediments,....
Industrial supplies....._________....Inflow, subsurface- _-- -. Introduction.-____..______...... Iron content of water.________..........Irrigation, diversion of stream flow....
general.______.._______..... Irrigation area, Fountain and Jimmy Camp
Valleys______.____.............Irrigation supplies, general------ ___ ___
suitability of water...___ ..
Jimmy Camp Valley, acres under irri?ation_. effects of further development of larpe sup
plies of water from wells..........gradient . rate of ground-water movement-....--....
Laboratory tests. _.__.........Laramie Formation, description. Lithology, alluvium___.....
Dawson Arkose....__.....Fox Hills Sandstone.........Laramie Formation--.......mesa gravel... ..........Niobrara Formation__.....Pierre Shale............._.
Location of area.- .....
47
281824
37*
513536
65
66 INDEX
PageMesa gravel, description____________ IS Methods of investigation. ___________ 5 Movement of water__________.__ 17,29,54
Niobrara Formation, contact with mesagravel.______________ 15
description--_____________.__ //Nitrate content of water_________ ___ 61
Outflow, subsurface.
Permeability, alluvium.. _____ ..... 16, 22,defined.... ____________ . ___ ...Laramie Formation.-. ___________
Pierre Shale, contact with mesa gravel-.. __description- __________ . ______subsurface inflow ______________
Population _____________ ______Porosity, alluvium... ______________
defined-..-..- .- _ ....................Precipitation, effect on recharge .. ______ .
general. _____ . ______ . ______Previous investigations. _______ . ____Public supplies. _________________Pumping, computation of drawdowns. ___
effects on water-level fluctuation.. ____Fountain Valley below Widefield area....Jimmy Camp Valley __ . _________ Wideflcld area.... __ . __ . _______
Purpose and scope of investigation ______
24, 29181415 IS 37
8 24 19 S4
8S
41 67 32 56 56 53S
Quality of water, general...... .. __ 46Niobrara Formation.. _____ . ____ ... 12Pierre Shale.. ________________ 12
Recharge, artificial ________________ 37description ___ . _______ , _____ 34Fountain Valley below Widefleld area __ 56Jimmy Camp Valley ____________ 57Widefield area. .. . . . . 53
Recovery of ground water. __________ if)Reservoirs.. ____________ . ______ 36
Sandstone , water-bearing properties . _____ 17 SAR. See Sodium-adsorption-ratio.Security Village, water supply ______ . 44Seeps, effect on discharge of ground water. ... 38Sheldon, A.. Z., quoted.. ____________ 2Sodium-adsorption-ratio- _____ ... ___ .. 49Specific capacity, defined- ___________ 25
wells.. ____________ . _______ .. 26Specific conductance _______________ 48Specific retention, alluvium .... _____ .._.. 24
defined ___________________ 19 Specific yield, alluvium.... __ . _ . __ 20,22,23,24
defined..... _ . _ . ___ ..... __ .. 19
PageSprings, alluvium..__ . 16
effect on discharge of ground water.---... 38mesa gravel 15recovery of ground water. . 40
Stock supplies 40Storage of ground water, general. S3
Widefield area..__... ........ 53Stream discharge 35 Stream flow, effect on water-level fluctuation. 32 Streams, effect on recharge - 34 Suitability of water for domestic and irriga
tion use -__ ._- 48 Sulfate content of water.. 58
Temperature___ 8 Topography 7 Transmissibility, methods of estimating---... 27 Transpiration, effect on discharge of ground
water. .. ..... 38
Underflow...._..........-. ..-..... 28,37,39Utilization of water. . 40
Water-bearing properties, Niobrara Forma tion.--_ _ -_-_ 12
Pierre Shale 12Water level, Colorado Springs public-supply
wells.-_____ ____-.-. 41 decline, Widefield area.. . . 53 effects of irrigation-__ ... 36
Water-level fluctuations, alluvium.__ . 18 description 30 Fountain Valley below Widefield area._ 56 Jimmy Camp Valley.. . 56
Water-table conditions, effect on specificyield--. - 23
Water-table configuration. . 29Well-numbering system____ ___ ffWells, alluvium .......__.__.__.. 16,18
Colorado Springs public-supply. 41 Dawson Arkose. - 15 effect of further development- 52 Fountain public-supply.. . 4& Fox Hills Sandstone.___ __ 14 Laramie Formation--. . __ 14 large-capacity, construction.-..___.... 46Niobrara Formation. 12 Pierre Shale..._.......... 12pumpage 39 recovery of ground water. Jfl Security Village public-supply... 44 yields for Irrigation.__ - .. 4&
Widefield area, computations of drawdownscaused by pumping. ___ 67
effects of further development of largesupplies of water from wells... _ 52
Widefield water controversy.. 54
o

UNITED STATES DEPARTMENT OF THE INTERIOR GEOLOGICAL SURVEY
WATER-SUPPLY PAPER 1583 PLATE 1 (SOUTH HALF)
40* R.65W. 104 a 37'3038 37'30"
R.65W.Base from U.S. Geological Survey topographic quadrangles
104°37'30"INTERIOR GEOLOGICAL SURVEY. WASHINGTON. D. C. 62154
38°30f
MAP OF FOUNTAIN AND JIMMY CAMP VALLEYS, EL PASO COUNTY, COLORADOSHOWING TOPOGRAPHY, LOCATION OF WELLS, TEST HOLES, AND
STREAM-GAGING STATIONS, DEPTH TO WATER, SATURATEDTHICKNESS, MEASURED YIELD, AND MEASURED DRAWDOWN
SCALE 1:24000o 1 MILE
1 KILOMETER
CONTOUR INTERVAL 20 FEET DATUM IS MEAN SEA LEVEL

UN
ITE
D ST
AT
ES
DE
PAR
TM
EN
T
OF T
HE
IN
TE
RIO
R
GEO
LOG
ICA
L SUR
VE
YW
AT
ER
-SUPPL
Y
PAPE
R
1583 PL
AT
E
2
57OO
5650
9X
0
5500
5450
\°
° 0-JT5T
£~
~
V<
o
. ° .
.
X
-iS
-o
...;^
../.-;,
.' ' ' '
' ' '<=
' ' 'O
' -a 'A
*-
& -
*- '..
f*..° ^ Ti^?*'^
«5 *v
0
, 0
00
a.'no '- :0.-±<:>.-z-
Wo
te r ta
ble
Li
10002000
FEE
T
Sand
en
d
gra
vel
SC
AL
E
IN
FE
ET
D
ATUM
IS ME
AN
SEA LEV
EL
5400
5350
5300
CR
OftS SE
CT
ION
S O
F F
OU
NT
AIN
VA
LL
EY
SHO
WIN
G T
HE
RE
SUL
TS O
F T
EST
DR
ILL
ING
AL
L SE
CT
ION
S AR
E V
IEW
ED
LO
OK
ING
U
PST
RE
AM
695-548 O
- 64 (In pocket)

UNITED STATES DEPARTMENT OF THE INTERIOR GEOLOGICAL SURVEY
WATER-SUPPLY PAPER 1583 PLATE 3
50.000
Precipitation data from U.S. Weather Bureau
HYDROGRAPHS SHOWING THE MONTHLY FLOW OF FOUNTAIN CREEK NEAR FOUNTAINTHE FLUCTUATIONS IN FOUR OBSERVATION WELLS IN FOUNTAIN VALLEY
AND MONTHLY PRECIPITATION AT THE COLORADO SPRINGS AIRPORT
695-548 O - 64 (In pocket)

UNITED STATES DEPARTMENT OF THE INTERIOR GEOLOGICAL SURVEY
WATER-SUPPLY PAPER 1583 PLATE 4
EXPLANATION
Water-level decline, in feet
NOVEMBER 1956
JANUARY 1956
WATER-LEVEL DECLINE IN THE WIDEFIELD AREA AFTER AUGUST 1, 1954695-548 O - 64 (In pocket)
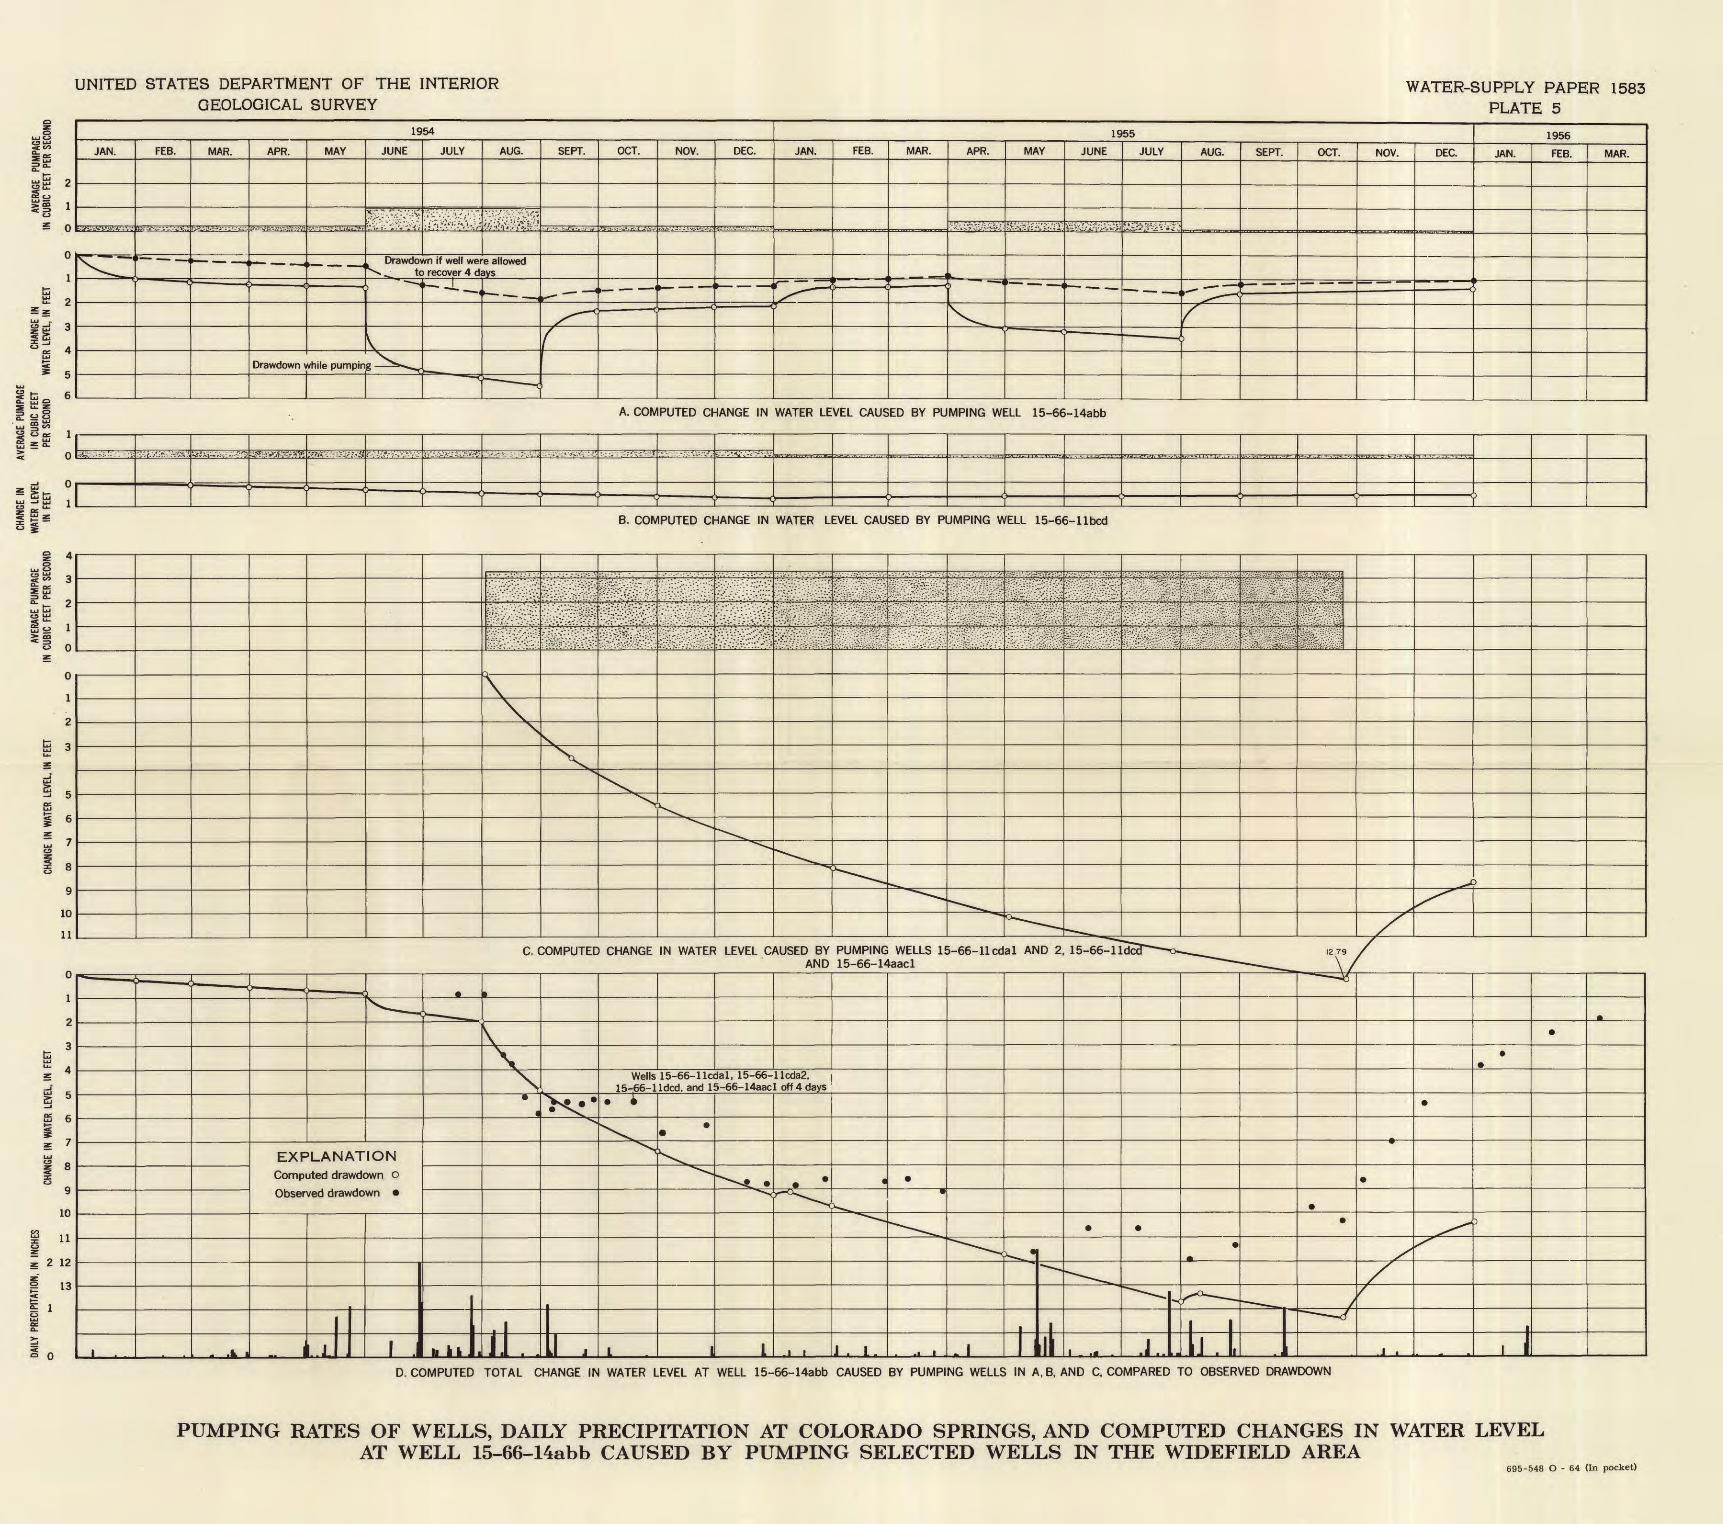
UNITED STATES DEPARTMENT OF THE INTERIOR GEOLOGICAL SURVEY
WATER-SUPPLY PAPER 1583 PLATE 5
2
z 0
£ 2
1954
JAN.
^v """'
FEB. MAR.
^^^^ ^^^ ^M^^
APR.
1^^^ ^^^ M^^
MAY
>^ » ^B^ M^^V^
' 1
JUNE JULY
, ; :. ,: ,;' ;,_ ',' ; '.
AUG.
i/'-'i''^.''-^;.--*
Drawdown if well were allowed \ to recover 4 days
\Drawdown while pumping ^*»^
-*--- <
1 . 1
SEPT.
_ < >
X"*~1
(11 \
OCT.
i i
NOV.
, «
DEC. JAN.
*~^~~*
1955
FEB. MAR.
, _ <) d
APR.
.,- ,,,..
i^ __ _i '
V^
MAY
..;...-...,... Y-
' V
JUNE
.,..,,..,..,..
JULY
yt-w^ ,...,... -^
AUG.
f
i
SEPT. OCT. NOV. DEC.
- c
1956
JAN. FEB. MAR.
5
A. COMPUTED CHANGE IN WATER LEVEL CAUSED BY PUMPING WELL 15-66-14abb
1\^;. .-..:. -- ::-:.;: 'r/. i-/:^ - .=- .' - -
' ' ' 1 1 ^ ' ' -1r
' C
P
B. COMPUTED CHANGE IN WATER LEVEL CAUSED BY PUMPING WELL 15-66-1 Ibcd
Sit!
s\s
10
11
0
1
2
3
5
6
7
9
10
11
12
13
C. COMPUTED CHANGE IN WATER LEVEL CAUSED BY PUMPING WELLS 15-66-11 cdal AND 2,AND 15-66-14aacl
\\
gS
Wells 15-66-1 lcdal, 15-66-1 Icda2, 15-66-1 Idcd, and 15-66-14aacl off 4 days
EXPLANATION
Computed drawdown o
Observed drawdown
-X
IPI -
n: t3 0 .L 1 Juki L J , L . 1 1 ... .J..D. COMPUTED TOTAL CHANGE IN WATER LEVEL AT WELL 15-66-14abb CAUSED BY PUMPING WELLS IN A, B, AND C, COMPARED TO OBSERVED DRAWDOWN
PUMPING RATES OF WELLS, DAILY PRECIPITATION AT COLORADO SPRINGS, AND COMPUTED CHANGES IN WATER LEVELAT WELL 15-66-14abb CAUSED BY PUMPING SELECTED WELLS IN THE WIDEFIELD AREA
695-548 O - 64 (In pocket)