Ground Vibration Measurement at TPS Site - nsrrc.org.tCHINESE\PUBLISH_YEARLY\2005... · Facility...
4
Facility 120 Ground Vibration Measurement at TPS Site For the future TPS project in the NSRRC, ground vibration is an important issue for the new machine. We have measured ground vibration under various locations and conditions at NSRRC site. Sensors were installed in three sites, on the ground and under- ground in different level down to 40 meters below the surface. From the measurement, we compare the effect of day and night, peak traffic effect, and the propagation of internal machine vibration. Specific vibration sources and their propagations are also dis- cussed. I. Introduction In the TPS project, this synchrotron is designed to have features of low emittance, high brightness, high stability etc. The mentioned para- meters are sensitive to the vibration. In the planning phase, we per- formed the measurement of ground vibration at different locations of TPS site in different underground levels to identify the vibration source and distribution. The measured data provides valuable information to civil engineer and accelerator physicist in their design consideration and simulation. II. Measurement method and process The measurement were made using seisometers of Guralp CMG 6TD and Tokyosokushin VSE-15D for the ground measurement; Tokyo- sokushin VSE-355D for the underground measurement. The mentioned sensors were velocity types in three axes with flat response from 0.1 Hz and upwards. A chart recorder or build-in hard disk was programmed to record the ground vibration with sampling rate of 200Hz. The sensors were calibrated with laser interferometer and the error bars of the read- ing were within 10%. We selected three measurement points around the planed site of TPS as shown in Figure 1. For the underground measure- ment, we prepared three down holes in different depth and measured underground 5 meters for BH10, 15 meters for BH11, and 40 meters for BH8. To study the peak traffic effect, we selected the measuring point of vibration which is about five meters from the road. The measurements were taken once or twice per hour. After reading time domain data from recorder, we set the time interval of 2048 data points to perform Fast Fourier Transform (FFT) and using 10 times ave- raging to calculate Power Spectrum Density (PSD). The integrated Root Mean Square (RMS) displacement was defined as the integrated PSD from specific frequency up to 100Hz and takes square root. III. Measurement Result 1. Power spectrum density Figure 2 shows typical results of PSD on the site surface in vertical directions. We can find a peak around 3 Hz, which can be found in the Authors D. J. Wang, J. Wang, J. P. Wang, and J. R. Chen National Synchrotron Radiation Research Center, Hsinchu, Taiwan
Transcript of Ground Vibration Measurement at TPS Site - nsrrc.org.tCHINESE\PUBLISH_YEARLY\2005... · Facility...

Facility
120
Ground Vibration Measurement at TPS Site
For the future TPS project in the NSRRC, ground vibration is animportant issue for the new machine. We have measured groundvibration under various locations and conditions at NSRRC site.Sensors were installed in three sites, on the ground and under-ground in different level down to 40 meters below the surface. Fromthe measurement, we compare the effect of day and night, peaktraffic effect, and the propagation of internal machine vibration.Specific vibration sources and their propagations are also dis-cussed.
I. Introduction
In the TPS project, this synchrotron is designed to have features oflow emittance, high brightness, high stability etc. The mentioned para-meters are sensitive to the vibration. In the planning phase, we per-formed the measurement of ground vibration at different locations ofTPS site in different underground levels to identify the vibration sourceand distribution. The measured data provides valuable information tocivil engineer and accelerator physicist in their design consideration andsimulation.
II. Measurement method and process
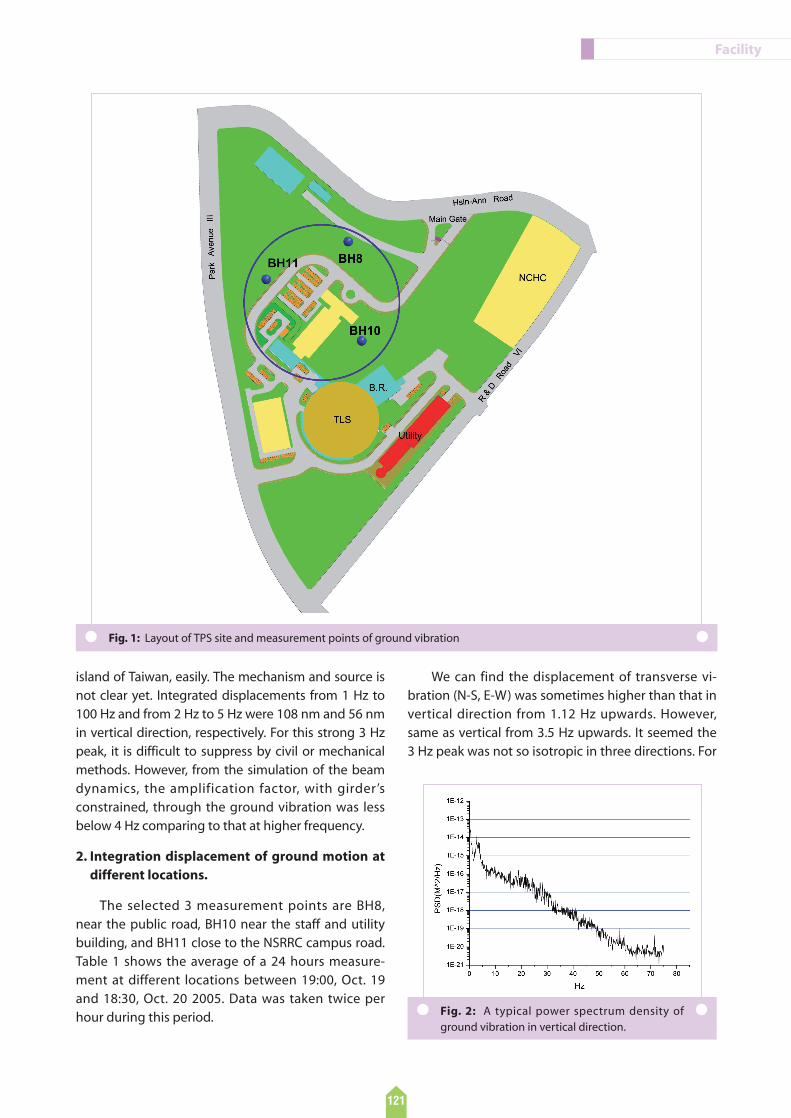
The measurement were made using seisometers of Guralp CMG 6TDand Tokyosokushin VSE-15D for the ground measurement; Tokyo-sokushin VSE-355D for the underground measurement. The mentionedsensors were velocity types in three axes with flat response from 0.1 Hzand upwards. A chart recorder or build-in hard disk was programmed torecord the ground vibration with sampling rate of 200Hz. The sensorswere calibrated with laser interferometer and the error bars of the read-ing were within 10%. We selected three measurement points around theplaned site of TPS as shown in Figure 1. For the underground measure-ment, we prepared three down holes in different depth and measuredunderground 5 meters for BH10, 15 meters for BH11, and 40 meters forBH8. To study the peak traffic effect, we selected the measuring point ofvibration which is about five meters from the road.
The measurements were taken once or twice per hour. After readingtime domain data from recorder, we set the time interval of 2048 datapoints to perform Fast Fourier Transform (FFT) and using 10 times ave-raging to calculate Power Spectrum Density (PSD). The integrated RootMean Square (RMS) displacement was defined as the integrated PSDfrom specific frequency up to 100Hz and takes square root.
III. Measurement Result
1. Power spectrum density
Figure 2 shows typical results of PSD on the site surface in verticaldirections. We can find a peak around 3 Hz, which can be found in the
Authors
D. J. Wang, J. Wang, J. P. Wang, and J. R. ChenNational Synchrotron RadiationResearch Center, Hsinchu, Taiwan
island of Taiwan, easily. The mechanism and source isnot clear yet. Integrated displacements from 1 Hz to100 Hz and from 2 Hz to 5 Hz were 108 nm and 56 nmin vertical direction, respectively. For this strong 3 Hzpeak, it is difficult to suppress by civil or mechanicalmethods. However, from the simulation of the beamdynamics, the amplification factor, with girder’sconstrained, through the ground vibration was lessbelow 4 Hz comparing to that at higher frequency.
2. Integration displacement of ground motion atdifferent locations.
The selected 3 measurement points are BH8,near the public road, BH10 near the staff and utilitybuilding, and BH11 close to the NSRRC campus road.Table 1 shows the average of a 24 hours measure-ment at different locations between 19:00, Oct. 19and 18:30, Oct. 20 2005. Data was taken twice perhour during this period.
We can find the displacement of transverse vi-bration (N-S, E-W) was sometimes higher than that invertical direction from 1.12 Hz upwards. However,same as vertical from 3.5 Hz upwards. It seemed the3 Hz peak was not so isotropic in three directions. For
Facility
121
Fig. 1: Layout of TPS site and measurement points of ground vibration
Fig. 2: A typical power spectrum density ofground vibration in vertical direction.

the vertical vibration displacement from 1.1Hz up-ward, BH8 was highest about 10% above average;BH10 was highest from 3.5 Hz upwards. It suggestedthe internal noise contribute to the vibration ampli-tude.
3. Vibration at different latitudes of underground
Before comparing the vibration at differentgdepth, the level of BH8, BH10, and BH11 were 109,118, and 119 meters above the sea level, respectively.Table 2 shows the summary of one day’s measure-ment at different level of underground. We can com-pare the displacement from 3.5 Hz upwards at differ-ent depth. There was a decaying trend as the downhole going deeper and deeper. But there was no sig-nificant attenuation in vibration amplitude between1.1 Hz to 3.5 Hz. It seemed that the high frequencypart generated from the ground surface attenuatedas it propagated deeper and deeper. It could reduceto half that amount as it propagated 40 meter indepth. Comparing with Table 1, on the ground withdifferent sea level, the vibration was not so big differ-ent, it suggested the vibration propagating is surfacewave dominant.
4. Culture and traffic induce vibration effect
In order to study the traffic effect, we measured apoint which is about five meters away from the pub-lic road. Figure 3 shows the measurement result invertical direction for one day. During rush hour, vibra-tion increased by a factor of two comparing to aver-aged value. Vibration amplitude was reduced signifi-cantly during mid-night. From Fig. 3, we can con-clude that the traffic effect increased the vibrationamplitude not only the low frequency part (1 Hzupwards) but also high frequency (4 Hz upwards)part. Fig. 4 shows the vibration amplitude in 4-100Hzat different distance from the public road. Vibrationpeak in the rush hour time at nine o'clock drops sig-nificantly as distance 20 meters away from the road.It is attributed to the damping effect of distance.
5. Internal vibration source
There was internal source such as utility vibrationand some pumps etc. BH8 stands for the outside traf-fic contribution. Comparing the lowest background,the vibration amplitude of Fig. 3 or Fig. 4 was about20nm from 4 Hz and above during the midnight.Figure 5 shows the vertical displacement in a point
Facility
122
Table 1: Average of ground vibration measurement innm at different locations
1.12 Hz upwards
0 m
-5 m
-15 m
-40 m
(BH8)
(BH10)
(BH11)
(BH8)
113 nm
101 nm
87 nm
81 nm
46 nm
50 nm
28 nm
20 nm
3.55 Hz upwards
Table 2: Summary of vertical vibration at different latitudefrom surface.
Fig. 3: Ground vibration at 5 meters away from thepublic road.
Fig. 4: Vertical vibration at different distance from thePark Avenue III public road.

near the TLS tunnel. The vibration amplitude wasabout 30nm from 4 Hz and above. It seemed that10nm of vibration amplitude came from the internalsource such as utility, water or air-condition flow.Comparing the vibration amplitude of Fig. 3 and Fig. 5, we can conclude that the vibration amplitudeof frequency higher than 10 Hz was about 8nm forthe different site and tunnel during midnight. One ofinternal vibration source, induced by water, has beenanalyzed and reported.
IV. Summary
The measurement of vibration at TPS site is sum-marized as following.1. Vibration amplitude in vertical direction was about
50nm from 4 Hz and above at three measurementpoints in different latitude above sea level.
2. Vibration amplitude in vertical direction decreasedas the underground measuring going deeper anddeeper. The amplitude of vibration is only 20nmfrom 4 Hz upwards in the depth of 40 m below sur-face.
3. The internal noise was estimated to be about10nm from 4 Hz upwards in the TLS tunnel.
Facility
123
References
.C. C. Kuo, "Beam Dynamics", TPS Designreport, (2006)..CECI report, March (2006)..D. J. Wang et al., "Water Induced Vibration in
the NSRRC", PAC, (2005)..S. Redaelli et al., EPAC, 2275 (2004)..J. S. Bendat et al., "Engineering Applications
of Correlation and Spectral Analysis", John Wiley & Sons Inc., New York (1993).
Contact E-mail
Fig. 5: Vertical vibrations near the TLS tunnel.