GROUND-PENETRATING RADAR STUDIES AT THE …mysite.du.edu/~lconyers/nw_archaeology_hammer.pdf ·...
14
Journal of Northwest Anthropology, 47(2):153–166 2013 GROUND-PENETRATING RADAR STUDIES AT THE HAMMER TEST BED FACILITY, RICHLAND, WASHINGTON Lawrence B. Conyers ABSTRACT The HAMMER geophysical test bed in Richland, Washington provides a facility to compare ground-penetrating radar (GPR) reflection images to known archaeological features in the ground. The test bed provides simulated buried features, including stone cairns and rings, burials, trash middens, artifacts and other materials, that were buried at depths from 12–36 inches in sandy ground and then re-buried with the same material. In 2002, grids of GPR data were collected in dry and wet ground conditions, and the amplitude maps from each were compared to the known buried features using 900, 500 and 400 MHz frequency reflection maps and profiles. The stone and metal objects and features were visible in most images, with only the 900 MHz maps failing to identify the deepest buried features due to energy attenuation with depth. When the ground was wet the metal features were still visible, but water hampered delineation of some features due to differential water distribution in some areas of the grid that had been compacted by mechanized machinery. The wooden features were invisible when the ground was dry, but visible when wet, as they retained water and produced distinct radar energy reflection surfaces. These variations in feature definition during different ground conditions are very important for GPR exploration and mapping in sandy ground and can be readily applied to many field conditions. The differences in antenna frequency also played a role in feature definition, especially with regard to depth. Features with no difference in materials along their boundaries, such as burials and the un-fired earth oven, were invisible with GPR as there were no differences in materials from which to reflect radar energy. Introduction Geophysical archaeology has long been used as a way to explore for and map buried archaeological features and associated geological units in the ground (Conyers 2013; Gaffney and Gater 2003). The most common methods used today are ground-penetrating radar (GPR) (Conyers 2013), magnetics (Aspinall et al. 2009), and earth-resistance (resistivity) (Schmidt 2013). In many cases data sets produced from these methods can go far beyond finding buried materials and be used to construct past landscapes (Campana and Piro 2009; Conyers 2009) and test hypotheses about cultural change and history (Conyers 2010). Ground-penetrating radar is being increasingly employed by archaeologists and other scientists to explore for and to locate three-dimensional archaeological features, artifacts, and
Transcript of GROUND-PENETRATING RADAR STUDIES AT THE …mysite.du.edu/~lconyers/nw_archaeology_hammer.pdf ·...
Journal of Northwest Anthropology, 47(2):153–166 2013
GROUND-PENETRATING RADAR STUDIES AT THE HAMMER
TEST BED FACILITY, RICHLAND, WASHINGTON
Lawrence B. Conyers
ABSTRACT
The HAMMER geophysical test bed in Richland, Washington provides a facility to compare ground-penetrating radar (GPR) reflection images to known archaeological features in the ground. The test bed provides simulated buried features, including stone cairns and rings, burials, trash middens, artifacts and other materials, that were buried at depths from 12–36 inches in sandy ground and then re-buried with the same material. In 2002, grids of GPR data were collected in dry and wet ground conditions, and the amplitude maps from each were compared to the known buried features using 900, 500 and 400 MHz frequency reflection maps and profiles. The stone and metal objects and features were visible in most images, with only the 900 MHz maps failing to identify the deepest buried features due to energy attenuation with depth. When the ground was wet the metal features were still visible, but water hampered delineation of some features due to differential water distribution in some areas of the grid that had been compacted by mechanized machinery. The wooden features were invisible when the ground was dry, but visible when wet, as they retained water and produced distinct radar energy reflection surfaces. These variations in feature definition during different ground conditions are very important for GPR exploration and mapping in sandy ground and can be readily applied to many field conditions. The differences in antenna frequency also played a role in feature definition, especially with regard to depth. Features with no difference in materials along their boundaries, such as burials and the un-fired earth oven, were invisible with GPR as there were no differences in materials from which to reflect radar energy.
Introduction
Geophysical archaeology has long been used as a way to explore for and map buried archaeological features and associated geological units in the ground (Conyers 2013; Gaffney and Gater 2003). The most common methods used today are ground-penetrating radar (GPR) (Conyers 2013), magnetics (Aspinall et al. 2009), and earth-resistance (resistivity) (Schmidt 2013). In many cases data sets produced from these methods can go far beyond finding buried materials and be used to construct past landscapes (Campana and Piro 2009; Conyers 2009) and test hypotheses about cultural change and history (Conyers 2010). Ground-penetrating radar is being increasingly employed by archaeologists and other scientists to explore for and to locate three-dimensional archaeological features, artifacts, and
important cultural strata in the near-surface. The GPR method has been especially effective in certain sediments and soils within 1–5 meters of the ground surface, where the archaeological targets to be imaged have significant physical and chemical contrasts with the surrounding medium. Site conditions such as moisture, soil types, clay mineralogy, and matrix stratigraphy are factors affecting the success of a GPR survey (Conyers 2013). It is usually not known in advance if a GPR survey will be successful, and there have been many failures, few of which have entered the published record. As a result, there are common misconceptions about the utility of GPR in different environments, and often unsubstantiated “rules of thumb” are cited as reasons why GPR should or should not be used in any given area. Previous studies from many sites all over the world indicate that many of these preconceptions regarding GPR technology are incorrect, misleading, or uninformed (Conyers 2012). For this reason direct comparisons between known features in the ground, such as at the HAMMER site, and the produced GPR images can be especially valuable. Before geophysics can be used as a primary database in attempting to understand the past (Kvamme 2003), datasets must be calibrated with and compared to known features in the ground. There are a number of ways to interpret often complex images produced from geophysics, the most straightforward being spatial analysis of the resulting maps (Conyers 2012: 20). Sometimes geophysical results produce maps or images that are exactly as would be expected if buried features were excavated and exposed to the human eye (Goodman and Piro 2013). Most often, some type of more complex interpretation is necessary in order to differentiate cultural “anomalies” from those that might have been produced from associated features or other origins, background “noise” or post-depositional disruptions of modifications. One very useful method, which is a type of “geophysical experimental archaeology,” is to collect data over test beds where simulated archaeological features have been buried (Conyers 2004). The HAMMER Geophysical Test Bed provides one excellent resource for this type of comparison. In 2002, a GPR research experiment was conducted at the Remote Target Test Bed component of the HAMMER facility, funded by the Strategic Environmental Research and Development Program (SERDP), a Department of Defense environmental research program.
The HAMMER Test Site The HAMMER Geophysical Test Bed, near Richland, Washington, dates to 1994 when the Hazardous Materials Management and Emergency Response Training Facility (HAMMER) responded to a request from Hanford Area Tribes to help develop non-destructive tools to assist in the location of human burials and other important resources. A 7-acre parcel was set aside for cultural resources research and training. Planning for a geophysical test bed commenced. Through consultation with the tribes, the idea for a surface component also emerged to assist in educating people, for example, law enforcement officers, in the identification of archaeological sites, artifacts, and looted sites. The Cultural Resource Test Bed is described in detail on Confederated Tribes of the Umatilla Indian Reservation (CTUIR) website: http://www.umatilla.nsn.us/crpp/tr_hammer.htm). Briefly, the Test bed has two major components: .
1. The “surface” component consists of approximately 12 sites, constructed by the Cultural Resource Protection Program, includes housepits, burials, lithic scatters, and historic

dumps. The surface component is used primarily for trainings where it provides opportunities for people to see artifacts (reproductions) in context.
2. The “subsurface” component, named the Remote Target Test Bed, contains 30 buried archaeological features buried in sandy ground, including simulated burials, pre-historic and historic trash dumps, a lithic cache, a brick well, and an earth oven (Woody and Stapp 2002). The subsurface component is used for geophysical experimentation with technologies such as ground penetrating radar, magnetometry, and electro-resistivity.
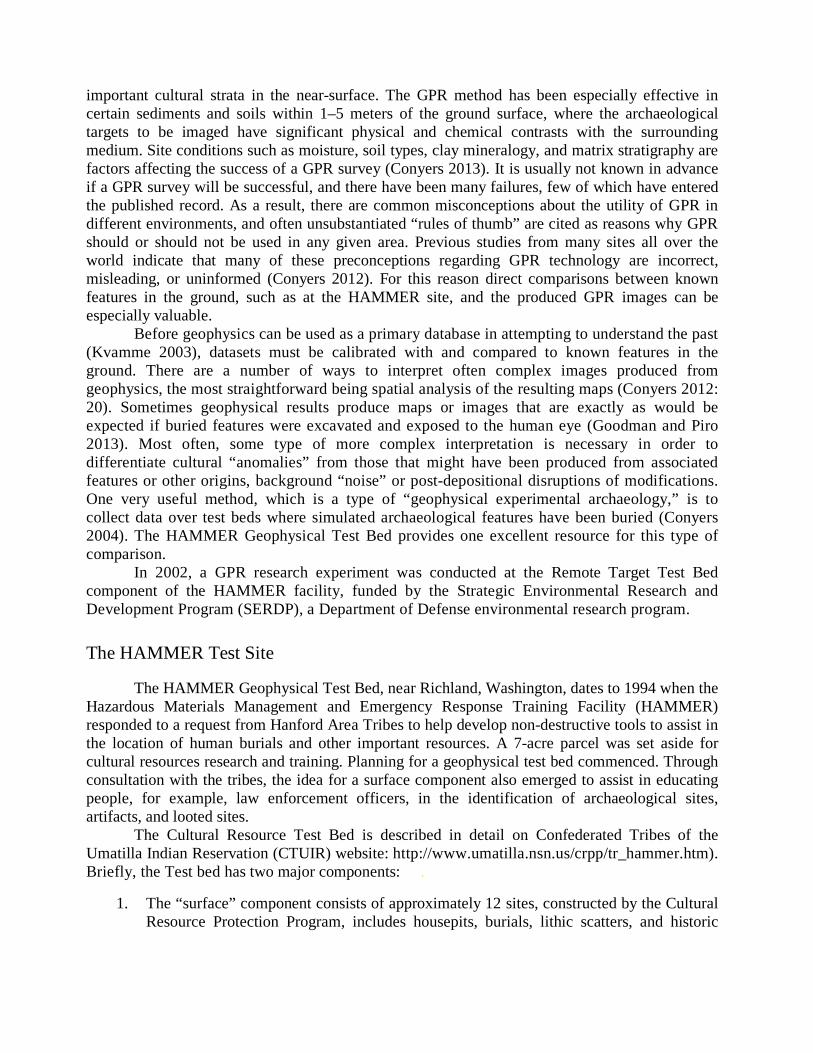
The Remote Target Test Bed was designed and constructed by scientists at Pacific Northwest National Laboratory (PNNL) in consultation with cultural resource professionals from the Confederated Tribes of the Umatilla Indian Reservation (CTUIR) and the Wanapum of Priest Rapids. The goal was to bury materials to simulate both pre-historic and historic archaeological deposits in a test bed 100x30 ft. in dimension. The ground was first excavated using heavy equipment and divided into three general areas with a shallow bed 12 in. below the surface, a moderate depth 24 in. deep and a deep area 36 in. below the ground surface (Fig. 1). The three floors of the trench were not modified and the materials were placed on or within the exposed sand sediment. The excavated surfaces of these units were treated as the original paleo-surfaces, on which artifacts were deposited and some caches and simulated burials were dug. Filling of the test bed by the same sediment originally in the trench would simulate the passage of time and the subsequent burial of the archaeological features. A variety of materials were then placed or constructed on the three surfaces to simulate a shell midden, rock cairn, rock rings and piles and a cairn, lithic scatters and caches, an historic dump, earth oven (un-fired), wooden railroad ties and a tree stump (Fig. 2). These, and other simulated features were then measured in space (depth being determined by the depth of the excavations within which the features were placed), and then re-buried by mechanized machinery (Fig. 3).
Fig. 1. The Remote Target Test Bed after trenching and placement of artifacts and features on the three excavation surface. The deeper zone (36 in.) is in the foreground, with the medium (24 in.) and shallow depth (12 in.) areas in the distance (looking north). September 2002.
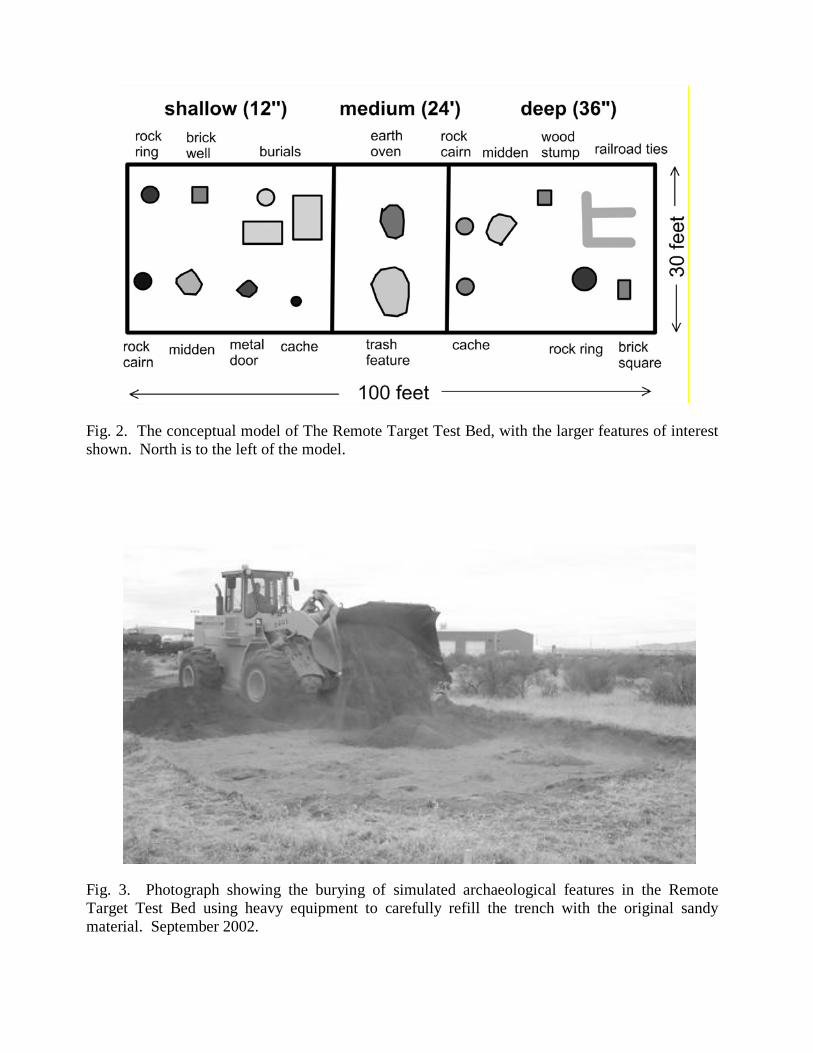
Fig. 2. The conceptual model of The Remote Target Test Bed, with the larger features of interest shown. North is to the left of the model.
Fig. 3. Photograph showing the burying of simulated archaeological features in the Remote Target Test Bed using heavy equipment to carefully refill the trench with the original sandy material. September 2002.
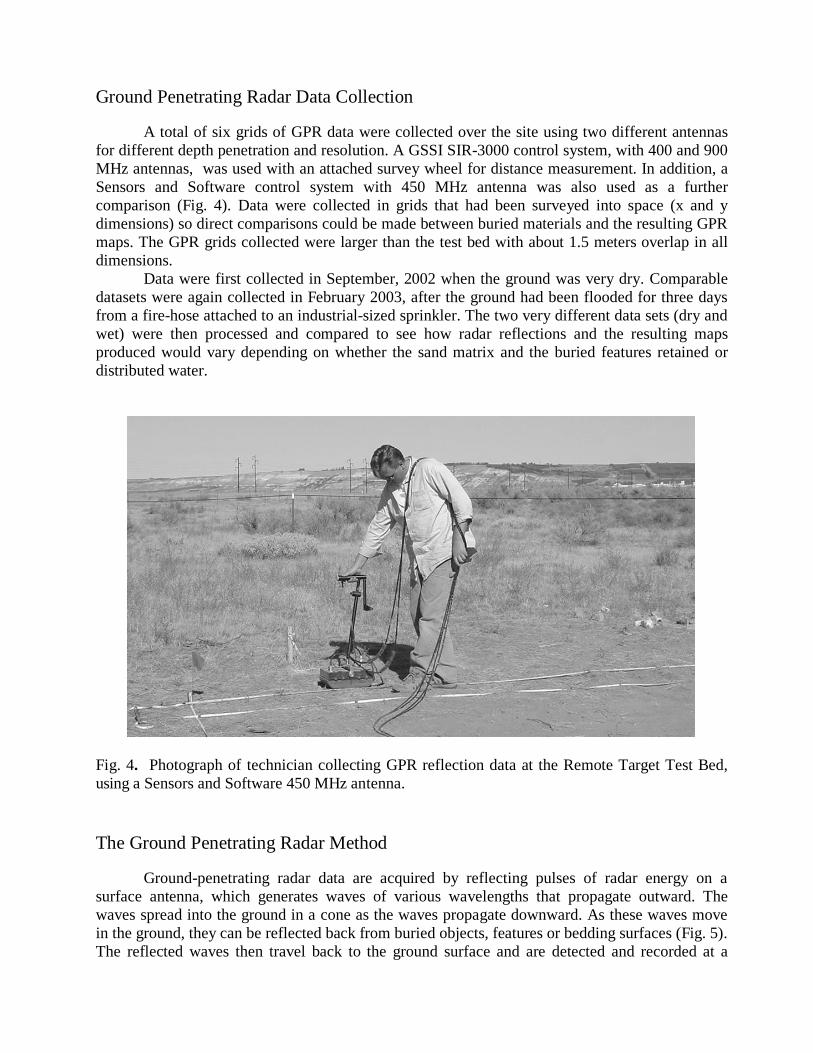
Ground Penetrating Radar Data Collection A total of six grids of GPR data were collected over the site using two different antennas for different depth penetration and resolution. A GSSI SIR-3000 control system, with 400 and 900 MHz antennas, was used with an attached survey wheel for distance measurement. In addition, a Sensors and Software control system with 450 MHz antenna was also used as a further comparison (Fig. 4). Data were collected in grids that had been surveyed into space (x and y dimensions) so direct comparisons could be made between buried materials and the resulting GPR maps. The GPR grids collected were larger than the test bed with about 1.5 meters overlap in all dimensions. Data were first collected in September, 2002 when the ground was very dry. Comparable datasets were again collected in February 2003, after the ground had been flooded for three days from a fire-hose attached to an industrial-sized sprinkler. The two very different data sets (dry and wet) were then processed and compared to see how radar reflections and the resulting maps produced would vary depending on whether the sand matrix and the buried features retained or distributed water.
Fig. 4. Photograph of technician collecting GPR reflection data at the Remote Target Test Bed, using a Sensors and Software 450 MHz antenna. The Ground Penetrating Radar Method Ground-penetrating radar data are acquired by reflecting pulses of radar energy on a surface antenna, which generates waves of various wavelengths that propagate outward. The waves spread into the ground in a cone as the waves propagate downward. As these waves move in the ground, they can be reflected back from buried objects, features or bedding surfaces (Fig. 5). The reflected waves then travel back to the ground surface and are detected and recorded at a
receiving antenna that is paired with the transmiting antenna. The two-way travel times of the waves into the ground to the reflection surface and back to the receiving antenna are recorded in nanoseconds. As the radar waves propagate through various materials in the ground, their velocity will change depending on the physical and chemical properties of the material through which they are traveling (Conyers 2013). At contacts between different materials in the ground the waves’ propagating velocity can change and when this occurs a reflected wave is generated. Some reflected waves will then travel back to the ground surface and recorded while the remaining energy continues to propagate deeper and can be reflected again from additional interfaces, until all the energy finally dissipates with depth. Only the reflected energy that travels back to the surface antenna is recorded and visible for interpretation. If buried surfaces that reflect energy are oriented in a way that waves move away from the surface antenna, that reflected energy will not be recorded, making those interfaces effectively invisible using the GPR method.
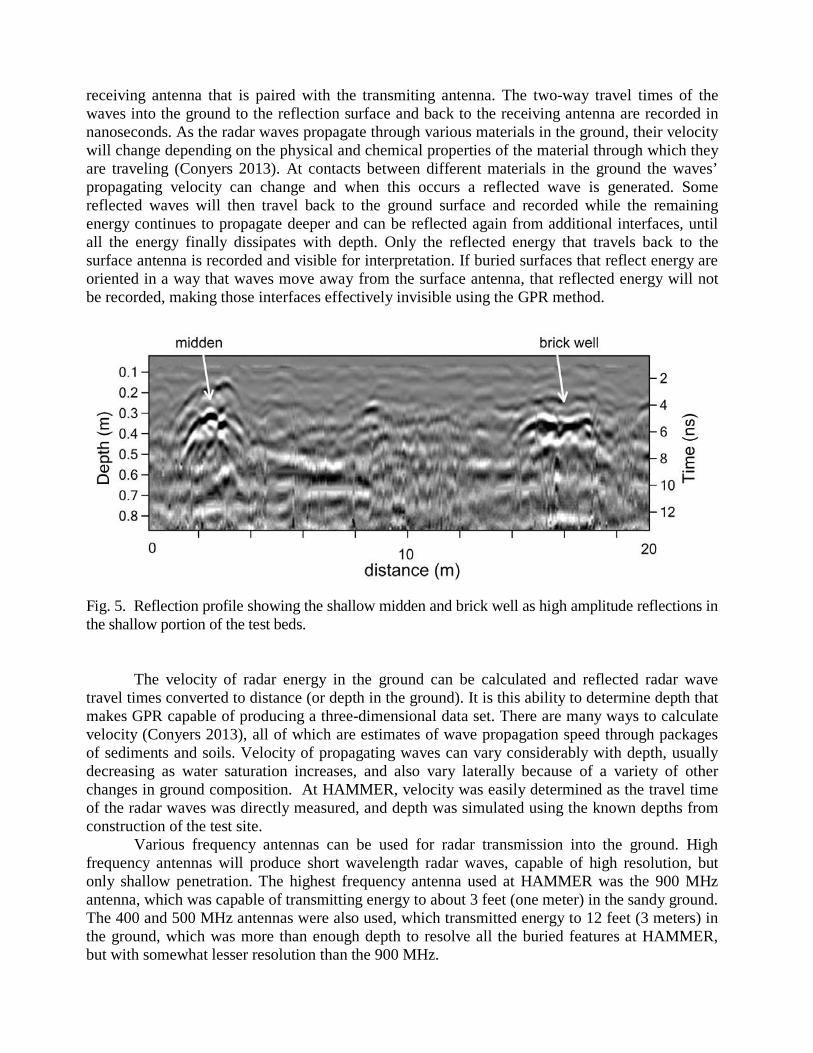
Fig. 5. Reflection profile showing the shallow midden and brick well as high amplitude reflections in the shallow portion of the test beds. The velocity of radar energy in the ground can be calculated and reflected radar wave travel times converted to distance (or depth in the ground). It is this ability to determine depth that makes GPR capable of producing a three-dimensional data set. There are many ways to calculate velocity (Conyers 2013), all of which are estimates of wave propagation speed through packages of sediments and soils. Velocity of propagating waves can vary considerably with depth, usually decreasing as water saturation increases, and also vary laterally because of a variety of other changes in ground composition. At HAMMER, velocity was easily determined as the travel time of the radar waves was directly measured, and depth was simulated using the known depths from construction of the test site. Various frequency antennas can be used for radar transmission into the ground. High frequency antennas will produce short wavelength radar waves, capable of high resolution, but only shallow penetration. The highest frequency antenna used at HAMMER was the 900 MHz antenna, which was capable of transmitting energy to about 3 feet (one meter) in the sandy ground. The 400 and 500 MHz antennas were also used, which transmitted energy to 12 feet (3 meters) in the ground, which was more than enough depth to resolve all the buried features at HAMMER, but with somewhat lesser resolution than the 900 MHz.
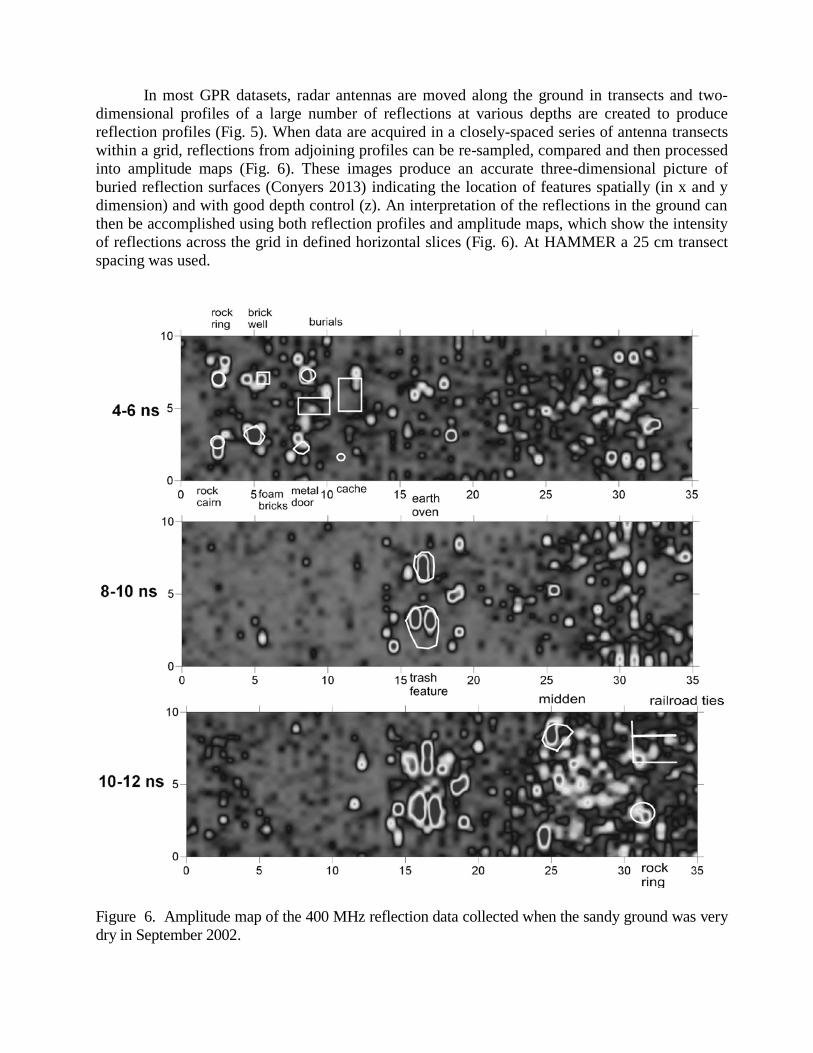
In most GPR datasets, radar antennas are moved along the ground in transects and two-dimensional profiles of a large number of reflections at various depths are created to produce reflection profiles (Fig. 5). When data are acquired in a closely-spaced series of antenna transects within a grid, reflections from adjoining profiles can be re-sampled, compared and then processed into amplitude maps (Fig. 6). These images produce an accurate three-dimensional picture of buried reflection surfaces (Conyers 2013) indicating the location of features spatially (in x and y dimension) and with good depth control (z). An interpretation of the reflections in the ground can then be accomplished using both reflection profiles and amplitude maps, which show the intensity of reflections across the grid in defined horizontal slices (Fig. 6). At HAMMER a 25 cm transect spacing was used.
Figure 6. Amplitude map of the 400 MHz reflection data collected when the sandy ground was very dry in September 2002.
The buried discontinuities where reflections occur are usually created by changes in electrical properties of the sediment or soil, lithologic changes, and differences in bulk density at stratigraphic interfaces. Those measurable (and sometimes visible) differences in materials in the ground create water saturation variation within those buried units, which is what usually produces the velocity changes that generate wave reflections. Reflections can also be created by void spaces in the ground, which may be encountered with burials, tombs, tunnels. In theory, any variation in buried material that produces an abrupt radar wave velocity change will create reflections. Metal is a perfect radar reflection surface and almost always produces high amplitude features in both profiles and amplitude maps. Wood and other organic materials rarely reflect radar waves, except if they have retained water. The most common GPR processing step is the production of amplitude slice-maps, which produce horizontal images of all reflection amplitudes in defined levels. These are similar to arbitrary excavation levels in standard archaeological excavations, with the depth thickness defined by the radar travel times (and then converted to approximate depth in the ground using velocity calculations). Every reflection in every profile is compared, contrasted, averaged and gridded spatially across the grid in each slice, and then the relative amplitudes of those waves are displayed in maps. Color or gray scales can be applied to the relative strength of the recorded waves as a way to display the reflection features. Those reflection features were then directly correlated to the known features in the ground at HAMMER.
Analysis and Comparison of GPR Images to the Known Features
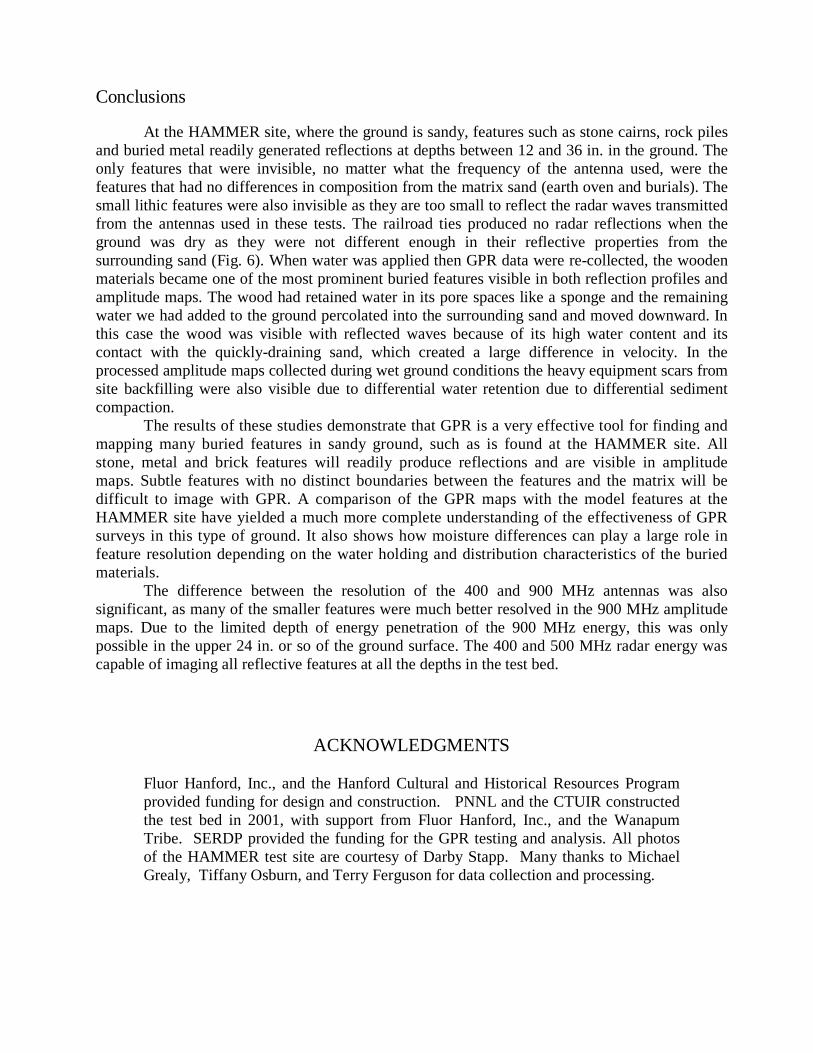
The high resolution 900 MHz antennas readily resolved all the features in the shallowest portion of the test bed including the rock ring, brick well, rock cairn and midden (Fig. 7). These features (Fig. 8) are mostly composed of reflective stones or metal trash, all of which was highly reflective especially at this shallow depth. The slice within which these features was sampled to produce the amplitude map was between 4 and 6 nanoseconds (two-way travel time), which corresponds to the 12 in. burial depths of these materials. In the 24 in. burial depth at HAMMER, the 8–10 nanosecond slice showed only the trash feature. The earth oven was effectively invisible with GPR (Fig. 7) as it had not been burned and was only an excavated pit in sand, filled with the same sand. As a result there is no discontinuity from which to reflect radar waves. Because reflections are only produced along interfaces of materials that have very distinct differences in composition (Conyers 2013), small features such as the lithic cache (Fig. 10) were too small to reflect energy from the 900, 500 or 400 MHz antennas and produced no distinct reflections. The burials (Fig. 7) were also invisible for the same reasons as the un-fired earth oven (Fig. 11). There are interesting broad features in the shallowest slice (4–6 nanoseconds) within the 900 MHz maps (Fig. 7), which are compaction scars produced by the wheels of the earth mover that filled in the test bed (Fig. 3). These types of reflection features have been commonly seen elsewhere in areas that have been disturbed by heavy machinery (Conyers 2012: 91). The 400 and 500 MHz radar energy was used primarily to map the deepest buried materials at HAMMER. These frequencies were suitable for the 36 in. depths where a number of features were buried (Fig. 2). The wooden railroad ties buried in the deepest area of the test bed (Fig. 12) were invisible in the 400 MHz amplitude maps (Fig. 6) when the ground was dry. Wood and dry sand are comparable in their porosity and therefore retain similar amounts of water when dry. As in most usual ground materials it is differences in the water saturation that accounts for much of the reflectivity at their interfaces (Conyers 2012: 38), and the wood and sand contacts produced no reflections that could be resolved.
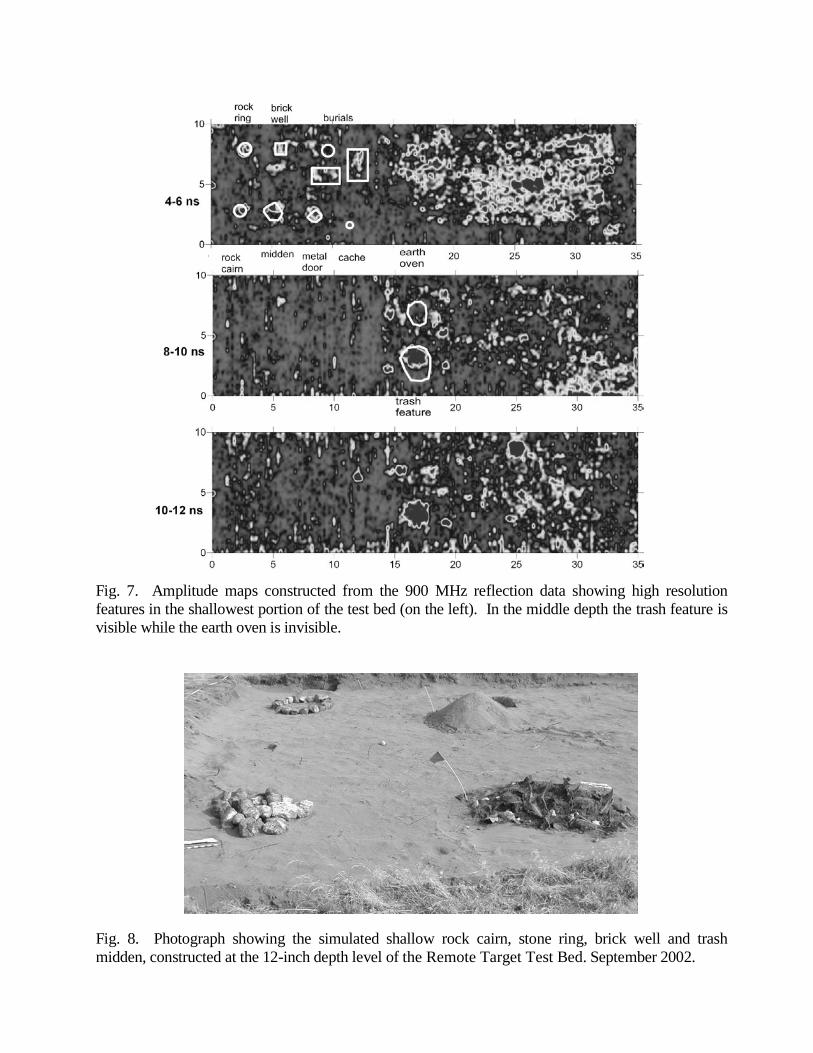
Fig. 7. Amplitude maps constructed from the 900 MHz reflection data showing high resolution features in the shallowest portion of the test bed (on the left). In the middle depth the trash feature is visible while the earth oven is invisible.
Fig. 8. Photograph showing the simulated shallow rock cairn, stone ring, brick well and trash midden, constructed at the 12-inch depth level of the Remote Target Test Bed. September 2002.
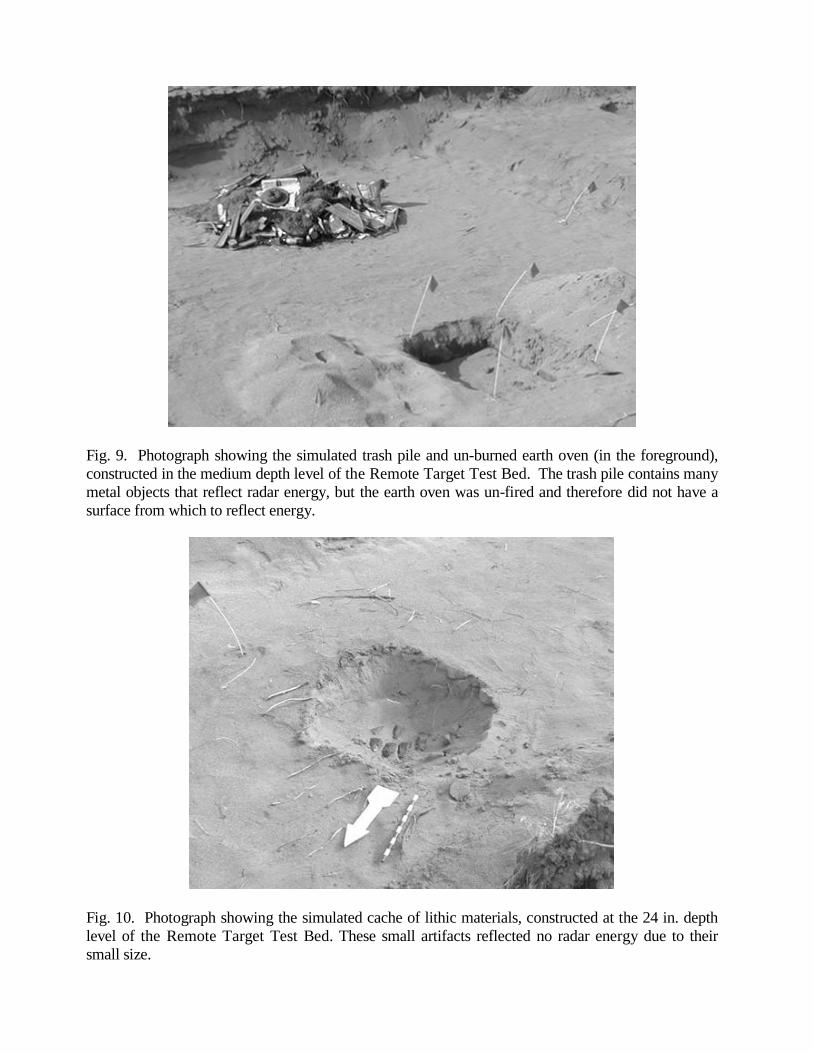
Fig. 9. Photograph showing the simulated trash pile and un-burned earth oven (in the foreground), constructed in the medium depth level of the Remote Target Test Bed. The trash pile contains many metal objects that reflect radar energy, but the earth oven was un-fired and therefore did not have a surface from which to reflect energy.
Fig. 10. Photograph showing the simulated cache of lithic materials, constructed at the 24 in. depth level of the Remote Target Test Bed. These small artifacts reflected no radar energy due to their small size.

Fig. 11. Photograph showing one of three simulated human burials, constructed in the shallow level of the Remote Target Test Bed using organic material. These features produced no reflections because there is not a distinct surface from which to reflect radar energy.
Fig. 12. Photograph showing the railroad ties placed at the deepest portion of the Remote Target Test Bed. The railroad tie feature produced no reflections when the ground was dry. When the ground had been saturated with water and then left to drain for 2 days, these ties retained water like a porous sponge, while the water drained readily from the surrounding sand. As expected, the saturated railroad ties reflected radar waves.

The site was sprinkled with a high volume of water from a fire hydrant for 3 days and the ground was then let to dry for 2 days before GPR data were collected again. When the GPR grid was re-collected in these wet conditions the railroad ties were visible, as well as the heavy equipment scars in the shallower slices (Fig. 13). The compaction scars were visible because they had differentially retained the water. A similar condition was visible with the railroad ties, which also retained water in their pore spaces, while the surrounding sand readily drained water due to its permeability. In the deep slices, the wooden materials therefore produced high amplitude reflections as they had a high retained moisture content. While many of the more reflective features, especially those that contained metal, reflected energy and were visible in the amplitude maps produced from data collected in “wet” conditions. The “wet” amplitude maps were much “noisier” due to the differentially retained water in the sandy ground (Fig. 13). This complexity of differential water retention in the ground has been documented elsewhere (Conyers 2012: 95).
Fig. 13. 400 MHz slices from data collected after the ground was saturated with water. The shallow heavy equipment scars were visible and the railroad ties also produced reflection in the 12-14 nanosecond slice.
Conclusions
At the HAMMER site, where the ground is sandy, features such as stone cairns, rock piles and buried metal readily generated reflections at depths between 12 and 36 in. in the ground. The only features that were invisible, no matter what the frequency of the antenna used, were the features that had no differences in composition from the matrix sand (earth oven and burials). The small lithic features were also invisible as they are too small to reflect the radar waves transmitted from the antennas used in these tests. The railroad ties produced no radar reflections when the ground was dry as they were not different enough in their reflective properties from the surrounding sand (Fig. 6). When water was applied then GPR data were re-collected, the wooden materials became one of the most prominent buried features visible in both reflection profiles and amplitude maps. The wood had retained water in its pore spaces like a sponge and the remaining water we had added to the ground percolated into the surrounding sand and moved downward. In this case the wood was visible with reflected waves because of its high water content and its contact with the quickly-draining sand, which created a large difference in velocity. In the processed amplitude maps collected during wet ground conditions the heavy equipment scars from site backfilling were also visible due to differential water retention due to differential sediment compaction.
The results of these studies demonstrate that GPR is a very effective tool for finding and mapping many buried features in sandy ground, such as is found at the HAMMER site. All stone, metal and brick features will readily produce reflections and are visible in amplitude maps. Subtle features with no distinct boundaries between the features and the matrix will be difficult to image with GPR. A comparison of the GPR maps with the model features at the HAMMER site have yielded a much more complete understanding of the effectiveness of GPR surveys in this type of ground. It also shows how moisture differences can play a large role in feature resolution depending on the water holding and distribution characteristics of the buried materials. The difference between the resolution of the 400 and 900 MHz antennas was also significant, as many of the smaller features were much better resolved in the 900 MHz amplitude maps. Due to the limited depth of energy penetration of the 900 MHz energy, this was only possible in the upper 24 in. or so of the ground surface. The 400 and 500 MHz radar energy was capable of imaging all reflective features at all the depths in the test bed.
ACKNOWLEDGMENTS Fluor Hanford, Inc., and the Hanford Cultural and Historical Resources Program provided funding for design and construction. PNNL and the CTUIR constructed the test bed in 2001, with support from Fluor Hanford, Inc., and the Wanapum Tribe. SERDP provided the funding for the GPR testing and analysis. All photos of the HAMMER test site are courtesy of Darby Stapp. Many thanks to Michael Grealy, Tiffany Osburn, and Terry Ferguson for data collection and processing.

REFERENCES CITED Aspinall, Arnold, Gaffney, Chris and Armin Schmidt 2009 Magnetometry for Archaeologists. AltaMira Press, Latham, MD.
Campana, Stefano and Salvatore Piro. 2009 Seeing the Unseen. Geophysics and Landscape Archaeology. Taylor & Francis, London.
Conyers, Lawrence B. 2004 Moisture and Soil Differences as Related to the Spatial Accuracy of GPR Amplitude Maps at Two Archaeological Test Sites. In Proceedings of the Tenth International Conference on Ground Penetrating Radar: June 21–24, Delft, The Netherlands, edited by Evert Slob, Alex Yarovoy and Jan Rhebergen, pp. 435–438. Delft University of Technology, The Netherlands and the Institute of Electrical and Electronics Engineers, Inc., Piscataway, NJ.
2009 Ground-Penetrating Radar for Landscape Archaeology. In Seeing the Unseen-Geophysics and Landscape Archaeology, edited by Stefano Campana and Salvatore Piro, pp. 245–256. CRC Press/Balkema: Taylor and Francis Group, London.
2010 Ground-penetrating Radar for Anthropological Research. Antiquity, 84(323):175–184.
2012 Interpreting Ground-penetrating Radar for Archaeology. Left Coast Press, Walnut Creek, CA.
2013 Ground-penetrating Radar for Archaeology, 3rd Edition. AltaMira Press, Latham, MD.
Gaffney, Chris and John Gater 2003 Revealing the Buried Past: Geophysics for Archaeologists. Tempus Publishing, Stroud, Gloucestershire, England.
Goodman, Dean and Salvatore Piro 2013 GPR Remote Sensing in Archaeology, Geotechnologies and the Environment, Volume 9,
Springer Science, NY.
Kvamme, Kenneth L. 2003 Geophysical Surveys as Landscape Archaeology. American Antiquity, 63(3):435–457.
Schmidt, Armin 2013 Earth Resistance for Archaeologists. AltaMira Press, Lanham, MD.
Woody, Dave and Darby Stapp. 2002 The HAMMER Geophysical Target Area Construction. Letter Report. Hanford Cultural Resources Laboratory. Pacific Northwest National Laboratory. Richland, WA. Lawrence Conyers, Department of Anthropology, University of Denver, 2000 E. Asbury St., Denver, Colorado 80208l ; [email protected]; http://mysite.du.edu/~lconyer/ Lawrence Conyers is a professor of anthropology in the Anthropology Department at University of Denver. He was one of the first to apply the GPR technology to archaeological applications, beginning in the late 1980s. He and his students have developed many software programs and data analysis applications for GPR image processing.