Ground Penetrating Radar Slice Reconstruction for … · Ground Penetrating Radar Slice...
10
Ground Penetrating Radar Slice Reconstruction for Embedded Object in Media with Target Follow QEETHARA KADHIM AL-SHAYEA ITEDAL S. H. BAHIA MIS Department MIS Department Al Zaytoonah University of Jordan Al Zaytoonah University of Jordan Amman Jordan Amman Jordan [email protected] [email protected] Abstract: - The detection of embedded object from ground penetrating radar GPR imagery is our goal. The GPR image is a cross sectional slices. The embedded objects are metal and/or plastic type. In many fields demand for visualizing objects scanned as cross sectional slices is growing. This research has many real world applications, such as robotic environments, medicine, remote sensing, inspection of industrial parts and geology. An even better way is to visualize the underground object by reconstruction a three- dimensional model of those objects from the slices. Objects here are stable underground while, camera is moving. The task of object track in a cross sectional slices consists of two parts: first gather information on changes between succeeding slices (object detection), and second process this information appropriately to obtain the track of an object. If the object is like cable or pipe. The proposed method starts with two dimensional 2D image preprocessing for each slice. The preprocessing involves multispectral to gray conversion, contrast enhancement, segmenting, thresholding and denoising to modify each 2D image slice individually. Preprocessing algorithms involved in this paper are chosen appropriately to have image without noise, with object detected and with object eliminated. After a preprocessing step the proposed algorithm for object detection starts with objects contour finding in each slice, 2D objects transparency and transformation. The last step is the proposed interpolation technique to build the successive slices until the spaces is filled to find out the embedded object. Key-Words: - Object Detection, Object Recognition, Ground Penetrating Radar (GPR), Volume Reconstruction, Interpolation, Image Processing, Target Follow. 1 Introduction GPR is one of nondestructive methods for physical detection, which utilizes similar principles to the reflection seismic method. Compared with the reflection seismic method, the GPR method might provide high-resolution images of characterized stratigraphy because it propagates a pulse of electromagnetic _EM_ energy, with a high frequency ranging from 10 MHz to 1 GHz, through the subsurface. A pulse-mode GPR system was operated in such a way that a high frequency and short pulse EM wave was transmitted into the earth and reflected radar pulse was received using one or more antennas on the ground [1]. GPR deliver vertical two dimensional 2D images slice of the ground Wong and Cipolla [2] choose the volume intersection approach due to its ability to describe objects with more complex topologies (e.g., object with holes). Based on Szeliski, an algorithm for generating an octree using profiles from multiple views is developed. The main difference between the work presented by Szeliski and the technique developed in [3] is that instead of using a background subtraction technique as described by Szeliski, the object / backtracking binary images are computed directly from the B-spline snakes which are used to extract and represent the profiles during motion estimation. Marabin, Sorzano, Matej, Fernadez, Carazo, and Herman [3] propose an iterative method for performing 3D reconstruction of 2D crystals in real space. Dell'Acqua, Sarti, Tubaro and Zanzi [4] propose a semi-automatic approach to the detection of linear scattering objects in geo-radar data sets, based on the 3D radon transform. The method that we propose is iterative, as each detected object is removed from the data set before the next iteration, in order to avoid mutual interference or masking. Ristic, Petrovacki and Govedarica [5] present a new method to simultaneously estimate cylindrical object radius (R) and electromagnetic (EM) wave propagation velocity (v) from ground penetrating radar (GPR) data. Fruehauf, Heilig ,Schneebeli ,Fellin and Scherzer [6] studied a two-step algorithm to locate avalanche WSEAS TRANSACTIONS on COMPUTERS Qeethara Kadhim Al-Shayea, Itedal S. H. Bahia ISSN: 1109-2750 496 Issue 5, Volume 9, May 2010
Transcript of Ground Penetrating Radar Slice Reconstruction for … · Ground Penetrating Radar Slice...
Ground Penetrating Radar Slice Reconstruction for Embedded Object in
Media with Target Follow
QEETHARA KADHIM AL-SHAYEA ITEDAL S. H. BAHIA
MIS Department MIS Department
Al Zaytoonah University of Jordan Al Zaytoonah University of Jordan
Amman Jordan Amman Jordan
[email protected] [email protected]
Abstract: - The detection of embedded object from ground penetrating radar GPR imagery is our goal. The
GPR image is a cross sectional slices. The embedded objects are metal and/or plastic type. In many fields
demand for visualizing objects scanned as cross sectional slices is growing. This research has many real
world applications, such as robotic environments, medicine, remote sensing, inspection of industrial parts
and geology. An even better way is to visualize the underground object by reconstruction a three-
dimensional model of those objects from the slices. Objects here are stable underground while, camera is
moving. The task of object track in a cross sectional slices consists of two parts: first gather information on
changes between succeeding slices (object detection), and second process this information appropriately to
obtain the track of an object. If the object is like cable or pipe. The proposed method starts with two
dimensional 2D image preprocessing for each slice. The preprocessing involves multispectral to gray
conversion, contrast enhancement, segmenting, thresholding and denoising to modify each 2D image slice
individually. Preprocessing algorithms involved in this paper are chosen appropriately to have image
without noise, with object detected and with object eliminated. After a preprocessing step the proposed
algorithm for object detection starts with objects contour finding in each slice, 2D objects transparency and
transformation. The last step is the proposed interpolation technique to build the successive slices until the
spaces is filled to find out the embedded object.
Key-Words: - Object Detection, Object Recognition, Ground Penetrating Radar (GPR), Volume Reconstruction,
Interpolation, Image Processing, Target Follow.
1 Introduction GPR is one of nondestructive methods for physical
detection, which utilizes similar principles to the
reflection seismic method. Compared with the
reflection seismic method, the GPR method might
provide high-resolution images of characterized
stratigraphy because it propagates a pulse of
electromagnetic _EM_ energy, with a high frequency
ranging from 10 MHz to 1 GHz, through the
subsurface. A pulse-mode GPR system was operated
in such a way that a high frequency and short pulse
EM wave was transmitted into the earth and reflected
radar pulse was received using one or more antennas
on the ground [1]. GPR deliver vertical two
dimensional 2D images slice of the ground
Wong and Cipolla [2] choose the volume intersection
approach due to its ability to describe objects with
more complex topologies (e.g., object with holes).
Based on Szeliski, an algorithm for generating an
octree using profiles from multiple views is developed.
The main difference between the work presented by
Szeliski and the technique developed in [3] is that
instead of using a background subtraction technique as
described by Szeliski, the object / backtracking binary
images are computed directly from the B-spline snakes
which are used to extract and represent the profiles
during motion estimation.
Marabin, Sorzano, Matej, Fernadez, Carazo, and
Herman [3] propose an iterative method for
performing 3D reconstruction of 2D crystals in real
space.
Dell'Acqua, Sarti, Tubaro and Zanzi [4] propose a
semi-automatic approach to the detection of linear
scattering objects in geo-radar data sets, based on the
3D radon transform. The method that we propose is
iterative, as each detected object is removed from the
data set before the next iteration, in order to avoid
mutual interference or masking.
Ristic, Petrovacki and Govedarica [5] present a new
method to simultaneously estimate cylindrical object
radius (R) and electromagnetic (EM) wave propagation
velocity (v) from ground penetrating radar (GPR) data.
Fruehauf, Heilig ,Schneebeli ,Fellin and Scherzer [6]
studied a two-step algorithm to locate avalanche
WSEAS TRANSACTIONS on COMPUTERS Qeethara Kadhim Al-Shayea, Itedal S. H. Bahia
ISSN: 1109-2750 496 Issue 5, Volume 9, May 2010

victims in real time. The algorithm was validated using
realistic test arrangements and conditions using an
aerial tramway. The distance dependence the reflection
energy with increased flight heights, the coherence
between the use of more antennas and the detectable
range, and the reflection images of different avalanche
victims were measured. The algorithm detected an
object for each investigated case, where the reflection
energy of the scans was higher than for the scans of
pure snow. Airborne GPR has a large potential become
a rapid search method in dry snow avalanches.
However, a fully operational version still requires
substantial improvements in hardware and software.
Jeng , Li, Chen and Chien [7] are designed two filters
by adopting adaptive algorithms, the optimum 2D
median filter, (a 2D median filter with an optimum
window size), and the 2D adaptive Wiener filter (a real
time optimal filter renovated from the conventional
Wiener filter technology) to investigate the advantages
of using adaptive filters in processing ultra-shallow
seismic and ground-penetrating radar data.
Mohamed K., Abdullah, R. and Raseed M. [8] have
presented an analytical and experimental study for
extracting the Doppler signature in FSR for ground
target detection. Target signal under the influenced of
high clutter has been successfully detected using the
proposed method. The detection using Hilbert
Transform is only applicable if the target's signal has
significant difference from the average noise level.
But, detection using Wavelet de-noising is more robust
against any clutter and noise. The results again
confirmed the feasibility of FSR to be employed as an
automatic ground target detection system.
Pasolli, Melgani and Donelli [9] propose a novel
pattern-recognition system to identify and classify
buried objects from ground-penetrating radar (GPR)
imagery. The entire process is subdivided into four
steps. After a preprocessing step, the GPR image is
thresholded to put under light the regions containing
potential objects. The third step of the system consists
of automatically detecting the objects in the obtained
binary image by means of a search of linear/hyperbolic
patterns formulated within a genetic optimization
framework.
Negahdaripour, Sekkati and Pirsiavash [10] propose
methods for system calibration and 3D scene
reconstruction by maximum likelihood estimation
from noisy image measurements. The recursive 3D
reconstruction method utilized as initial condition a
closed form solution that integrates the advantages of
two other closed form solution. Yang, Wang, Liu, Tang and Chen [11] present a novel
method for the 3D reconstruction of coronary arteries
from two uncalibrated monoplane angiographic
images. A non-linear optimization method is
developed which takes the influence of the table
movement into account for the refinement of 3D
structure of vessel skeletons. Shihab and Al-Nuaimy [12] present an automatic
target-detection and localization system based on
unsupervised neural network classifier along with
some image processing techniques to extract useful
data representing targets (such as pipes, tanks,
reinforcement bars, and voids) and discard undesirable
data (such as noise and clutter). The neural classifier is
capable of returning 3-dimensional images outlining
regions of extended targets and pinpointing the
location of localized targets such as mines and pipes.
This classifier was applied to a variety of GPR data
sets gathered from a number of sites, and it achieved
rapid and accurate results.
H. Parsiani, E. Mattei [13] have presented open field
soil moisture determination based on the MCFD/NN
algorithm is further explored with data obtained from a
four-day campaign at the University of Puerto Rico
Mayagüez Campus’ baseball field.
L. Yun, W. Seng, B. Yong and L. Ping [14] present an
architecture which enables 3D heart model
visualization tasks to be performed efficiently in
collaboration environment.
S. Rashwan, M. Ismail and S. Fouad [15] have
proposed an approach based on possibility theory. The
approach is based on computing the correlation among
different images taken at different times to study the
change of the environment and use it as a parameter in
four T-Norm Correlation-Dependent fusion techniques
to handle the problem of high correlation by
introducing the correlation parameter in the fusion
process.
2 Multidimensional image Preprocessing The preprocessing algorithms, techniques, and
operators are used to perform initial processing that
makes the primary data reduction and analysis task
easier. They include operations related to extracting
regions of interest, performing basic algebraic
operations on images and enhancing specific image
features [16].
The goal of image enhancement is to prepare raster
images for further processing or for display by
removing noise or enhancing contrast. It is usually
performed by applying some functions to the image, so
that the input image f is transformed into an output
image g using a filter functional T [17].
Digital volumetric image are stacks of 2D image
slices. We can think of these slices as serial cross–
sections through a scene depicting objects in a
digitized 3D world. The set of addresses is sometimes
WSEAS TRANSACTIONS on COMPUTERS Qeethara Kadhim Al-Shayea, Itedal S. H. Bahia
ISSN: 1109-2750 497 Issue 5, Volume 9, May 2010

referred to as the image lattice. More precisely, the
image lattice is the set:
{(s,r,c)| 0≤s< nslices, 0 ≤ r < nrows, 0 ≤ n < ncolumns}
where nslices, nrows, ncolums denote the number of
slices, rows and columns [17]. Fig. 1 illustrates a stack
of slices.
Fig. 1 A stack of slices.
3 The Proposed image Preprocessing Some image data collecting techniques such as Ground
Penetrating Radar image (GPR) generate a series of
cross sectional images from which 3D object geometry
and density features have to be extracted and
reconstructed. Our data are 2D slices GPR images of
underground viewed in sagittal direction as in Fig. 2.
Fig. 2
The microwave images of the objects embedded in the
ground are included the soil effected and unwanted
objects in addition to the wanted objects. However
some preprocessing can be used to distinguish the
required objects in the 2D images. Fig. 3 shows a GPR
image slice 1. Fig. 4 shows a GPR image slice 2.
Fig. 3 GPR slice 1
Fig. 4 GPR slice 2
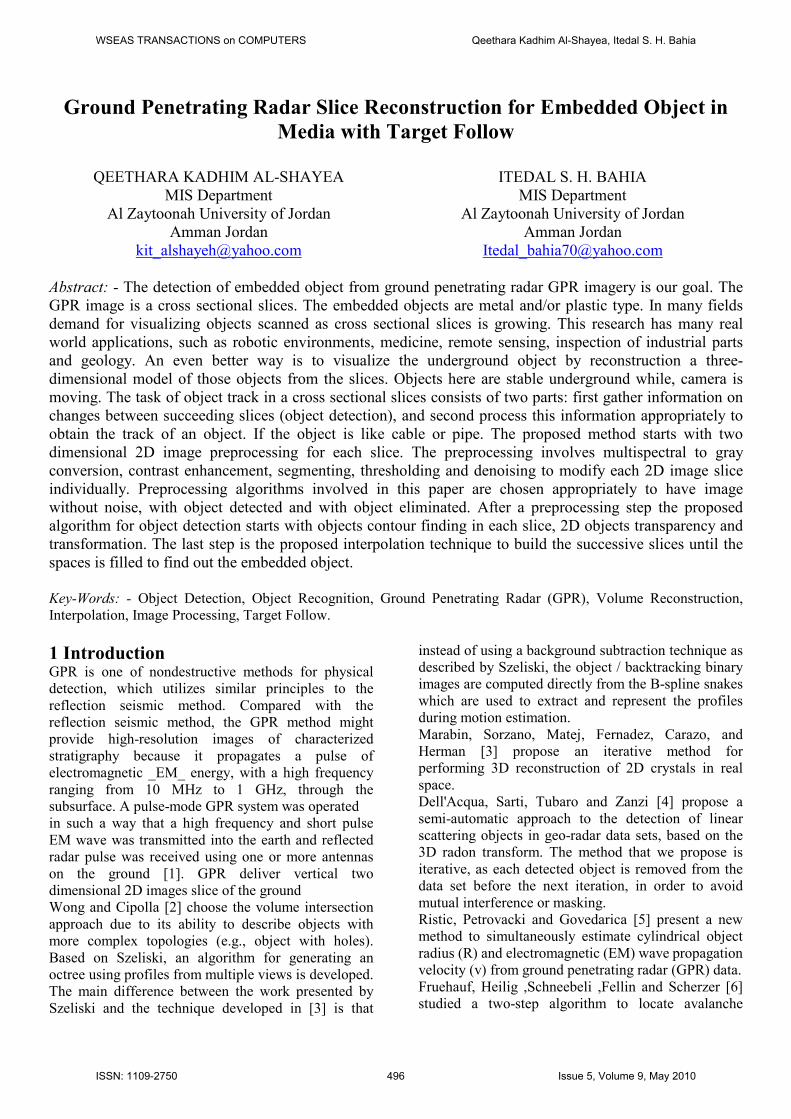
Image preprocessing is used to have appropriate slices.
The resultant slices will be taken to reconstruct 3D
image. Fig. 5 demonstrates the flowchart for image
preprocessing proposed.
After the slice is read, the proposed conversion method
to multispectral slice is done. The proposed conversion
depends on display the metallic and plastic objects in
the image. Since the image size must be compatible
with the real world, image resize is chosen to be the
next preprocessing stage. Then draw the histogram for
each slice to study it. From studying the histogram of
images, as shown in Fig. 6 it is obvious that the
contrast is very low. So, to enhance the contrast of an
image there are more than one way. Since images are
better to be enhanced using histogram equalization
compared with high pass filter as practical experiment
proved, it is chosen.
WSEAS TRANSACTIONS on COMPUTERS Qeethara Kadhim Al-Shayea, Itedal S. H. Bahia
ISSN: 1109-2750 498 Issue 5, Volume 9, May 2010
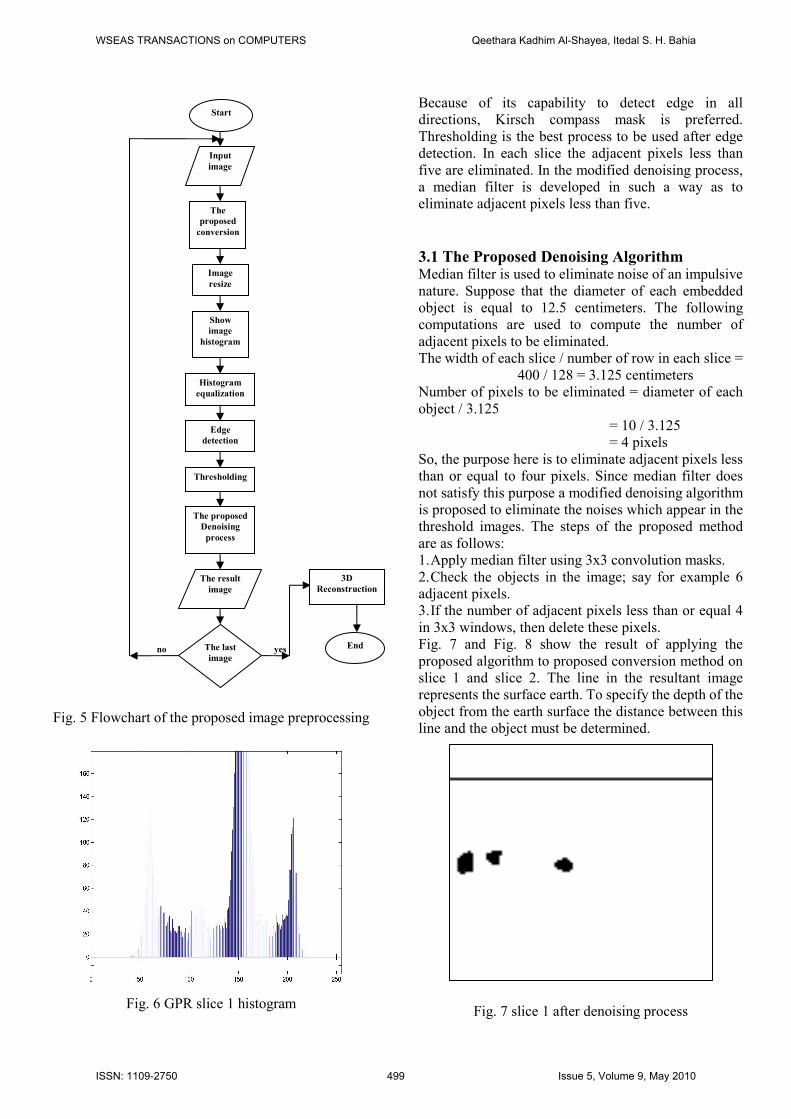
Fig. 5 Flowchart of the proposed image preprocessing
Fig. 6 GPR slice 1 histogram
Because of its capability to detect edge in all
directions, Kirsch compass mask is preferred.
Thresholding is the best process to be used after edge
detection. In each slice the adjacent pixels less than
five are eliminated. In the modified denoising process,
a median filter is developed in such a way as to
eliminate adjacent pixels less than five.
3.1 The Proposed Denoising Algorithm Median filter is used to eliminate noise of an impulsive
nature. Suppose that the diameter of each embedded
object is equal to 12.5 centimeters. The following
computations are used to compute the number of
adjacent pixels to be eliminated.
The width of each slice / number of row in each slice =
400 / 128 = 3.125 centimeters
Number of pixels to be eliminated = diameter of each
object / 3.125
= 10 / 3.125
= 4 pixels
So, the purpose here is to eliminate adjacent pixels less
than or equal to four pixels. Since median filter does
not satisfy this purpose a modified denoising algorithm
is proposed to eliminate the noises which appear in the
threshold images. The steps of the proposed method
are as follows:
1. Apply median filter using 3x3 convolution masks.
2. Check the objects in the image; say for example 6
adjacent pixels.
3. If the number of adjacent pixels less than or equal 4
in 3x3 windows, then delete these pixels.
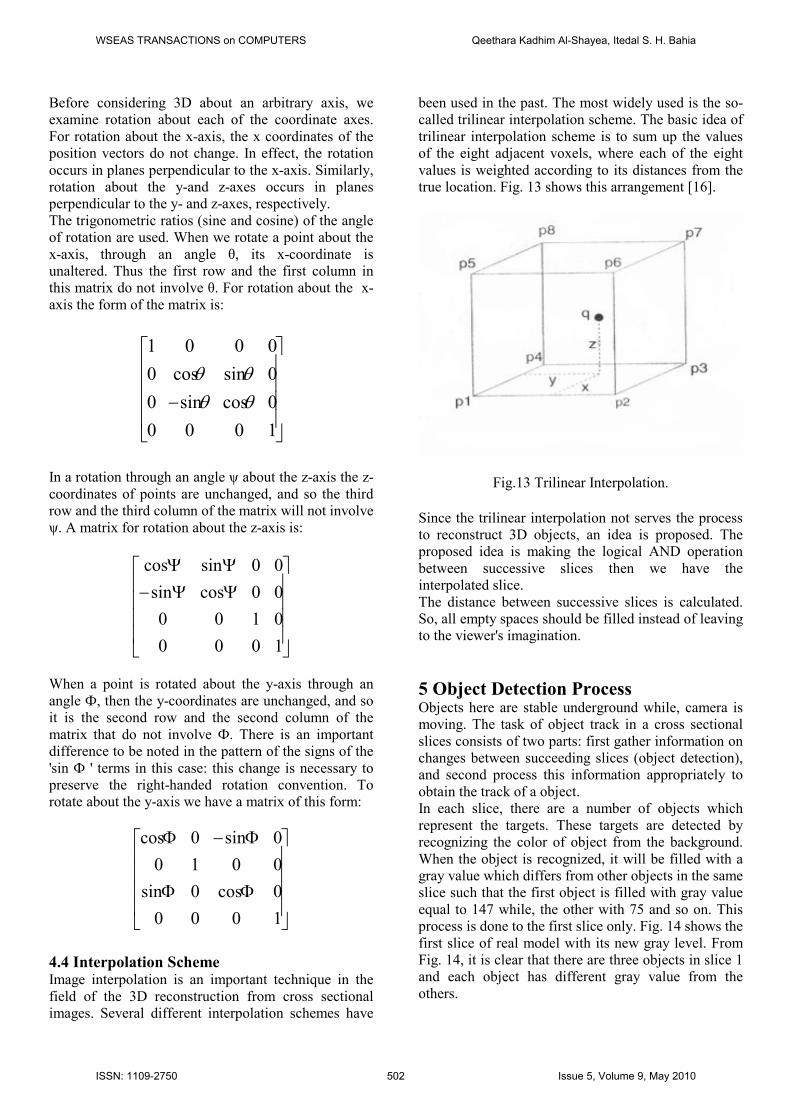
Fig. 7 and Fig. 8 show the result of applying the
proposed algorithm to proposed conversion method on
slice 1 and slice 2. The line in the resultant image
represents the surface earth. To specify the depth of the
object from the earth surface the distance between this
line and the object must be determined.
Fig. 7 slice 1 after denoising process
no yes
Input
image
The
proposed
conversion
Show
image
histogram
Histogram
equalization
Edge
detection
Thresholding
Start
Image
resize
The last
image
The proposed
Denoising
process
The result
image
3D
Reconstruction
End
WSEAS TRANSACTIONS on COMPUTERS Qeethara Kadhim Al-Shayea, Itedal S. H. Bahia
ISSN: 1109-2750 499 Issue 5, Volume 9, May 2010

Fig. 8 slice 2 after denoising process
4 The proposed Methodology Algorithm for a visible volume reconstruction from 2D
image slices is proposed. This algorithm consists of
contour generation, objects transparency, image
translation and rotation.
The volume visualization means a generation of
comprehensible representations from 3D scalar fields
for a variety of application fields. Currently every GPR
data set consists of an arbitrary number of slice images
which are scanned at equidistant locations. Therefore,
all slices together represent a volume if they are
arranged according to their spatial positions.
Therefore, every slice forms a matrix of MxN where
M=128,256,… N=128,256,… and in some cases even
10242 sample points [18]. However, the visible volume
reconstruction forms a matrix of MxNxL.
The proposed method of the volume reconstruction
will be described to reconstruct the 3D image from
2Dslices. Schematic diagram of image data collecting
is shown in Fig. 9.
Fig. 9 Schematic diagram of image data collecting.
An algorithm for the proposed methodology is
described as follows:
1- Input the binary level image Iinp
of size nrxnc. Also,
input the number of images nb.
2- Put the data image of size jxi one after the other in a
stack.
3- for j= 0,1,2,…,nr
for i= 0,1,2,…,nc
for k= 0,1,2,…,nb
Indicate the image with knb
4- for j= 0,1,2,…,nr
for i= 0,1,2,…,nc
for k= 0,1,2,…,nb
Find contour for each object in the image.
5- for j= 0,1,2,…,nr
for i= 0,1,2,…,nc
for k= 0,1,2,…,nb
Translate the image with the number of spaces
between them to the x-axis and y-axis.
6- for j= 0,1,2,…,nr
for i= 0,1,2,…,nc
for k= 0,1,2,…,nb
Rotate the image by an angel θ0.
7- Find the interpolation between two images.
8- Insert the interpolated images between the original
data.
4.1 Contour Generators If the number of quantization levels is not sufficient, a
phenomenon called contouring becomes visible.
Fig. 10 shows the 8-connected neighbors.
Fig. 10 8-connected neighbors.
Tracing of closed boundaries in images is as follows:
1- Scan the image.
2- If object is found label it by object A.
3- Start inside object A.
4- Turn left and step to next pixel if in region A,
otherwise turn right and step to next pixel.
5- Continue until arrive at starting point.
WSEAS TRANSACTIONS on COMPUTERS Qeethara Kadhim Al-Shayea, Itedal S. H. Bahia
ISSN: 1109-2750 500 Issue 5, Volume 9, May 2010

[ ]
=
1
0100
0010
0001
lkh
T
The contour is the first step in reconstruction process.
The contours are found by scanning the whole image
for values other than 255 and if this pixel has a
neighbor which is a background 255 then it is recorded
as contour pixel, otherwise it is not contour pixel.
When we look for neighboring background pixels, the
algorithm examines the up, down, right, left, upper
right, upper left, down right, and down left pixels only
so that the produced contour is 8-connected with the
background.
4.2 3D Image Transformation The ability to represent or display a 3D object is
fundamental to the understanding of the shape of that
object. Furthermore, the ability to rotate, translate, and
project views of that object is also, in many cases,
fundamental to the understanding of its shape [19].
3D translation matrix is:
Depending on the distances between successive slices
the translated homogeneous coordinates are obtained
by writing
so,
Fig. 11 shows the translation to two successive slices
without transparency, while l=6, m=6 and n=1. This
yield
It is obvious that the last slice displayed on the screen
is hiding the first one.
Fig. 11 Translation without transparency.
4.3 Object Transparency When an image is displayed on the screen and the next
image is displayed in sharing location with the
previous image on the screen, the objects in the next
image will hide the first one. This means that sharing
locations between images are dedicated to the last one
with hiding of the others. To overcome this situation a
new method is presented. This method is the
transparency which is to be after contour process.
Therefore, transparency method is done to display the
sharing pixels between slices. The result of transparent
method between two slices is shown in Fig. 12. By
comparing between translation with transparency as
shown in Fig. 12 and translation without transparency
as shown in Fig. 11, it is clear that volumetric is not
possible to make without transparency.
Fig. 12 Transparency between two slices after
translation.
Slice 1
Slice 2
[ ] [ ]
=
1
0100
0010
0001
1'''
nml
zyxhzyx
[ ] ( )( )( )[ ]1''' nzmylxmzyx +++=
nzz
myy
lxx
+=
+=
+=
'
'
'
1'
6'
6'
+=
+=
+=
zz
yy
xx
WSEAS TRANSACTIONS on COMPUTERS Qeethara Kadhim Al-Shayea, Itedal S. H. Bahia
ISSN: 1109-2750 501 Issue 5, Volume 9, May 2010
−
1000
0cossin0
0sincos0
0001
θθθθ
ΨΨ−
ΨΨ
1000
0100
00cossin
00sincos
ΦΦ
Φ−Φ
1000
0cos0sin
0010
0sin0cos
Before considering 3D about an arbitrary axis, we
examine rotation about each of the coordinate axes.
For rotation about the x-axis, the x coordinates of the
position vectors do not change. In effect, the rotation
occurs in planes perpendicular to the x-axis. Similarly,
rotation about the y-and z-axes occurs in planes
perpendicular to the y- and z-axes, respectively.
The trigonometric ratios (sine and cosine) of the angle
of rotation are used. When we rotate a point about the
x-axis, through an angle θ, its x-coordinate is
unaltered. Thus the first row and the first column in
this matrix do not involve θ. For rotation about the x-
axis the form of the matrix is:
In a rotation through an angle ψ about the z-axis the z-
coordinates of points are unchanged, and so the third
row and the third column of the matrix will not involve
ψ. A matrix for rotation about the z-axis is:
When a point is rotated about the y-axis through an
angle Ф, then the y-coordinates are unchanged, and so
it is the second row and the second column of the
matrix that do not involve Ф. There is an important
difference to be noted in the pattern of the signs of the
'sin Ф ' terms in this case: this change is necessary to
preserve the right-handed rotation convention. To
rotate about the y-axis we have a matrix of this form:
4.4 Interpolation Scheme Image interpolation is an important technique in the
field of the 3D reconstruction from cross sectional
images. Several different interpolation schemes have
been used in the past. The most widely used is the so-
called trilinear interpolation scheme. The basic idea of
trilinear interpolation scheme is to sum up the values
of the eight adjacent voxels, where each of the eight
values is weighted according to its distances from the
true location. Fig. 13 shows this arrangement [16].
Fig.13 Trilinear Interpolation.
Since the trilinear interpolation not serves the process
to reconstruct 3D objects, an idea is proposed. The
proposed idea is making the logical AND operation
between successive slices then we have the
interpolated slice.
The distance between successive slices is calculated.
So, all empty spaces should be filled instead of leaving
to the viewer's imagination.
5 Object Detection Process Objects here are stable underground while, camera is
moving. The task of object track in a cross sectional
slices consists of two parts: first gather information on
changes between succeeding slices (object detection),
and second process this information appropriately to
obtain the track of a object.
In each slice, there are a number of objects which
represent the targets. These targets are detected by
recognizing the color of object from the background.
When the object is recognized, it will be filled with a
gray value which differs from other objects in the same
slice such that the first object is filled with gray value
equal to 147 while, the other with 75 and so on. This
process is done to the first slice only. Fig. 14 shows the
first slice of real model with its new gray level. From
Fig. 14, it is clear that there are three objects in slice 1
and each object has different gray value from the
others.
WSEAS TRANSACTIONS on COMPUTERS Qeethara Kadhim Al-Shayea, Itedal S. H. Bahia
ISSN: 1109-2750 502 Issue 5, Volume 9, May 2010
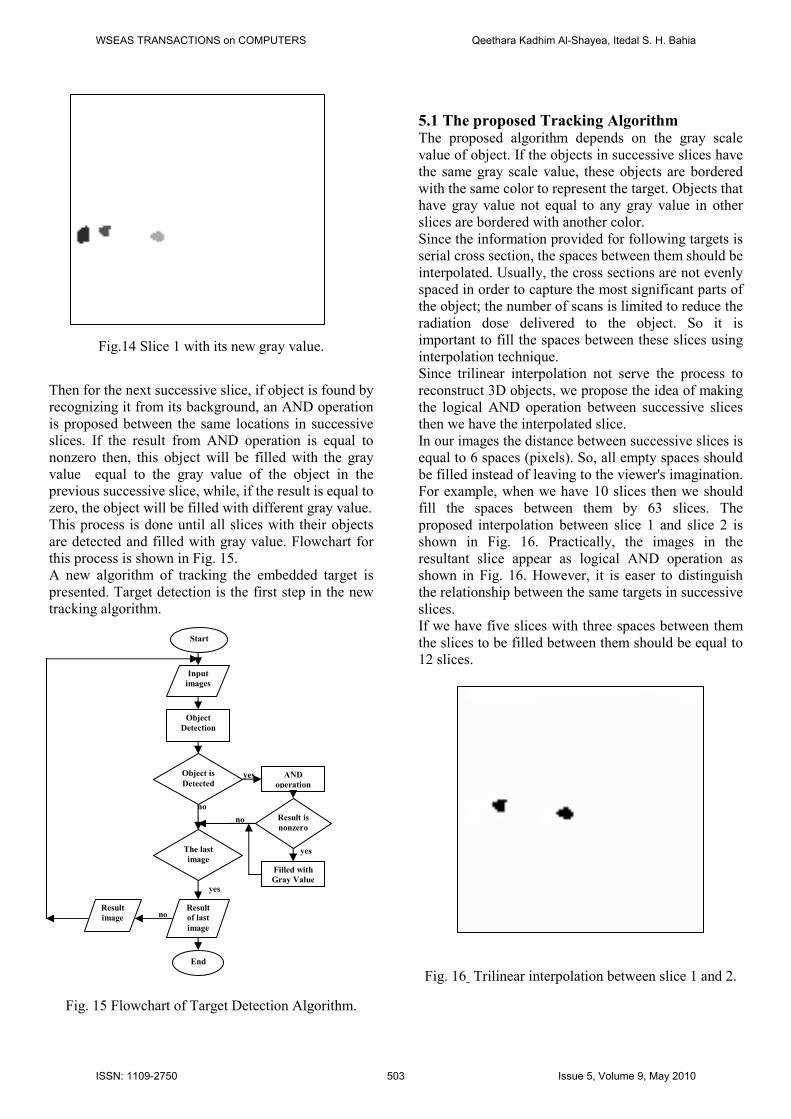
Fig.14 Slice 1 with its new gray value.
Then for the next successive slice, if object is found by
recognizing it from its background, an AND operation
is proposed between the same locations in successive
slices. If the result from AND operation is equal to
nonzero then, this object will be filled with the gray
value equal to the gray value of the object in the
previous successive slice, while, if the result is equal to
zero, the object will be filled with different gray value.
This process is done until all slices with their objects
are detected and filled with gray value. Flowchart for
this process is shown in Fig. 15.
A new algorithm of tracking the embedded target is
presented. Target detection is the first step in the new
tracking algorithm.
Fig. 15 Flowchart of Target Detection Algorithm.
5.1 The proposed Tracking Algorithm The proposed algorithm depends on the gray scale
value of object. If the objects in successive slices have
the same gray scale value, these objects are bordered
with the same color to represent the target. Objects that
have gray value not equal to any gray value in other
slices are bordered with another color.
Since the information provided for following targets is
serial cross section, the spaces between them should be
interpolated. Usually, the cross sections are not evenly
spaced in order to capture the most significant parts of
the object; the number of scans is limited to reduce the
radiation dose delivered to the object. So it is
important to fill the spaces between these slices using
interpolation technique. Since trilinear interpolation not serve the process to
reconstruct 3D objects, we propose the idea of making
the logical AND operation between successive slices
then we have the interpolated slice.
In our images the distance between successive slices is
equal to 6 spaces (pixels). So, all empty spaces should
be filled instead of leaving to the viewer's imagination.
For example, when we have 10 slices then we should
fill the spaces between them by 63 slices. The
proposed interpolation between slice 1 and slice 2 is
shown in Fig. 16. Practically, the images in the
resultant slice appear as logical AND operation as
shown in Fig. 16. However, it is easer to distinguish
the relationship between the same targets in successive
slices.
If we have five slices with three spaces between them
the slices to be filled between them should be equal to
12 slices.
Fig. 16 Trilinear interpolation between slice 1 and 2.
no
yes
yes
yes
no
no
Input
images
Object
Detection
The last
image
Start
End
Object is
Detected AND
operation
Filled with
Gray Value
Result is
nonzero
Result
image
Result
of last
image
WSEAS TRANSACTIONS on COMPUTERS Qeethara Kadhim Al-Shayea, Itedal S. H. Bahia
ISSN: 1109-2750 503 Issue 5, Volume 9, May 2010

6 Conclusions This work presents a technique for 3D reconstruction
from 2D cross sectional slices. The purpose of this
reconstruction is object detection. The input is GPR
successive slices. Specific points of interest of the
proposed methods are the use of 2D image
preprocessing with its technique as robust methods for
the automatic determination of effective starting points
of the 3D reconstruction algorithm.
The first algorithm is image preprocessing for each
slice. The preprocessing involves multispectral to gray
conversion, contrast enhancement, segmenting,
thresholding and denoising to modify each 2D image
slice individually. Preprocessing algorithms proposed
in this paper are chosen appropriately to have image
without noise, with object detected and with object
eliminated.
After preprocessing a proposed 3D reconstruction
methodology is presented. The first stage in the
proposed methodology is contour finding. The second
stage is to cumulate the data images in stack. It is note
from practical implantation that the intersection of two
contour generators from two distinct view points
generates a point that is visible in both images as a
fixed point. Object transparency is the third stage that
makes the intersected slices visible. Then translate the
images depending on the distances between slices. The
translation is to x-axis and y-axis. Rotation will be by
an angel θ0 is the last process in our proposed method.
The modified interpolation is needed to improve the
proposed volume reconstructing objects from serial
cross sections.
References
[1] W. Ting-Nien and H. Yi-Chu, Detection of Illegal
Dump Deposit with GPR: Case Study, Practice
Periodical of Hazardous, Toxic & Radioactive Waste
Management, Vol.10, No.3, Jul 2006, pp144-149.
[2] K. K. Wong and R. Cipolla, Reconstruction of
Sculpture from its Profiles With Unknown Camera
Positions, IEEE TRASACTIONS on Image
Processing, Vol.13, No.3, March 2004, PP. 381-389.
[3] R. Marabini, C. S. Sorzano, S. Matej, J. J. Fernadez
, J. M. Carazo and G. T. Herman, 3D Reconstruction
of 2D Crystals in Real Space, IEEE TRANSACTIONS
on Image Processing, Vol.13, No.4, Apr 2004, PP.
549-561.
[4] A. Dell'Acqua, A. Sarti, S. Tubaro and L. Zanzi,
Detection of linear objects in GPR data, Signal
Processing, Vol.84, No.4, Apr 2004,pp785-800.
[5] A. V. Ristic, D. Petrovacki and M. A. Govedarica,
new method to simultaneously estimate the radius of a
cylindrical object and the wave propagation velocity
from GPR data, Computers & Geosciences,Vol.35,
No.8, Aug 2009, pp1620-1630.
[6] F. Fruehauf, A. Heilig, M. Schneebeli, W. Fellin
and O. Scherzer, Experiments and Algorithms to
Detect Snow Avalanche Victims Using Airborne
Ground-Penetrating Radar, IEEE Transactions on
Geoscience & Remote Sensing, Vol.47, No.7, Jul
2009, pp2240-2251.
[7] Y. Jeng, Y. Li, C. Chen and H. Chien, Adaptive
filtering of random noise in near-surface seismic and
ground-penetrating radar data, Journal of Applied
Geophysics, Vol.68, No.1, May 2009, p p36-46.
[8] K. Mohamed, R. Abdullah and M Raseed,
Detection of Ground Target in Forward Scattering
RADAR Using Hubert Transform and Wavelet
Technique, International Review of Electrical
Engineering (LR.E.E.), Vol.4, No.2, March-April
2009, pp320-326.
[9] E. Pasolli, F. Melgani and M. Donelli, Automatic
Analysis of GPR Images: A Pattern-Recognition
Approach, IEEE Transactions on Geoscience &
Remote Sensing, Vol.47, No.7, Jul 2009, pp. 2206-
2217.
[10] S. Negahdaripour, H. Sekkati and H. Pirsiavash,
Opti-Acoustic Stereo Imaging: On System Calibration
and 3-D Target Reconstruction, IEEE
TRANSACTIONS on Image Processing, Vol.18,
No.6, June 2009, PP. 1203-1214.
[11] J. Yang, Y. Wang, Y. Liu, S. Tang and W. Chen,
Novel Approach for 3-D Reconstruction of Coronary
Arteries From Two Uncalibrated Angiographic
Images, IEEE TRANSACTIONS on Image
Processing, Vol.18, No.7, July 2009, PP. 1563-1572.
[12] S. Shihab, and W. Al-Nuaimy, Image Processing
and Neural Network Techniques for Automatic
Detection and Interpretation of Ground Penetrating
Radar Data, www.wseas.us/e-
library/conferences/crete2002/papers/444-717.pdf.
[13] H. Parsiani, E. Mattei, Open field soil moisture
measurements with Radar, WSEAS Int. Conf. on
REMOTE SENSING, Venice, Italy, Nov 2-4, 2005,
pp 61-64.
[14] L. Yun, W. Seng, B. Yong and L. Ping, A Tele
collaborative Surgery Framework for 3D Heart Model,
7th WSEAS International Conference on APPLIED
COMPUTER SCIENCE, Venice, Italy, November 21-
23, 2007, pp 173-177.
[15] S. Rashwan, M. Ismail and S. Fouad, Detection
of Buried Landmines using the Possibilistic
Correlation-Dependent Fusion Methods, Proceedings
of the 6th WSEAS International Conference on Signal
Processing, Robotics and Automation, Corfu Island,
Greece, February 16-19, 2007, pp 42-47.
[16] S. E. Umbaugh, Computer Vision and Image
Processing: A Practical Approach Using CVIPtools,
WSEAS TRANSACTIONS on COMPUTERS Qeethara Kadhim Al-Shayea, Itedal S. H. Bahia
ISSN: 1109-2750 504 Issue 5, Volume 9, May 2010

Prentice Hall PTR, A Simon and Schuster Company,
1998.
[17] G. Lohmann ., Volumetric Image Analysis, John
Wiley & Sons Ltd & T. G. Teubner, 1998.
[18] B. Girod , G. Greiner and H. Niemann, Principles
of 3D Image Analysis & Synthesis, Kluwer Academic
Publishers, 2000.
[19] D. F. Rogers and J A. Adams, Mathematical
Elements for Computer Graphics, McGraw-Hill, Inc.,
1990.
WSEAS TRANSACTIONS on COMPUTERS Qeethara Kadhim Al-Shayea, Itedal S. H. Bahia
ISSN: 1109-2750 505 Issue 5, Volume 9, May 2010