"Ground Clutter as a Monitor of Radar Stability at Kwajalein, RMI"
43
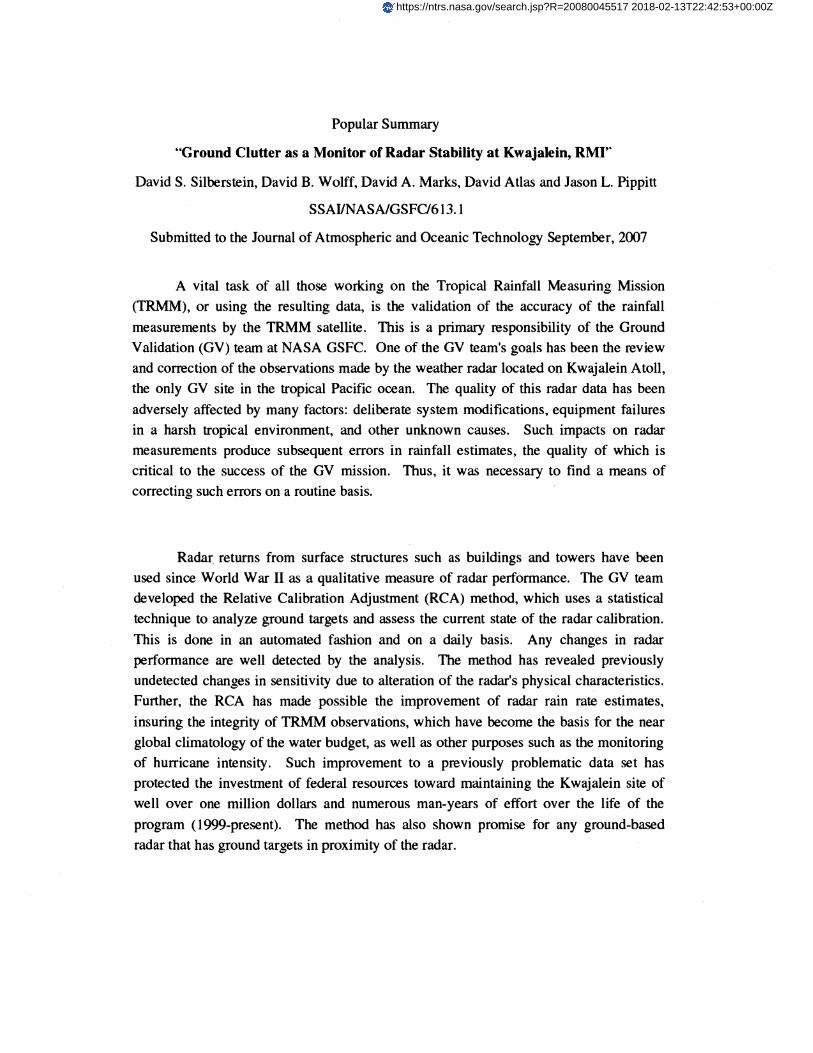
Popular Summary "Ground Clutter as a Monitor of Radar Stability at Kwajalein, RMI" David S. Silberstein, David B. Wolff, David A. Marks, David Atlas and Jason L. Pippitt SSAIiNASNGSFU6 13.1 Submitted to the Journal of Atmospheric and Oceanic Technology September, 2007 A vital task of all those working on the Tropical Rainfall Measuring Mission (TRMM), or using the resulting data, is the validation of the accuracy of the rainfall measurements by the TRMM satellite. This is a primary responsibility of the Ground Validation (GV) team at NASA GSFC. One of the GV team's goals has been the review and correction of the observations made by the weather radar located on Kwajalein Atoll, the only GV site in the tropical Pacific ocean. The quality of this radar data has been adversely affected by many factors: deliberate system modifications, equipment failures in a harsh tropical environment, and other unknown causes. Such impacts on radar measurements produce subsequent errors in rainfall estimates, the quality of which is critical to the success of the GV mission. Thus, it was necessary to find a means of correcting such errors on a routine basis. Radar returns from surface structures such as buildings and towers have been used since World War I1 as a qualitative measure of radar performance. The GV team developed the Relative Calibration Adjustment (RCA) method, which uses a statistical technique to analyze ground targets and assess the current state of the radar calibration. This is done in an automated fashion and on a daily basis. Any changes in radar performance are well detected by the analysis. The method has revealed previously undetected changes in sensitivity due to alteration of the radar's physical characteristics. Further, the RCA has made possible the improvement of radar rain rate estimates, insuring the integrity of TRMM observations, which have become the basis for the near global climatology of the water budget, as well as other purposes such as the monitoring of hurricane intensity. Such improvement to a previously problematic data set has protected the investment of federal resources toward maintaining the Kwajalein site of well over one million dollars and numerous man-years of effort over the life of the program (1999-present). The method has also shown promise for any ground-based radar that has ground targets in proximity of the radar. https://ntrs.nasa.gov/search.jsp?R=20080045517 2018-02-13T22:42:53+00:00Z
Transcript of "Ground Clutter as a Monitor of Radar Stability at Kwajalein, RMI"
Popular Summary
"Ground Clutter as a Monitor of Radar Stability at Kwajalein, RMI"
David S. Silberstein, David B. Wolff, David A. Marks, David Atlas and Jason L. Pippitt
SSAIiNASNGSFU6 13.1
Submitted to the Journal of Atmospheric and Oceanic Technology September, 2007
A vital task of all those working on the Tropical Rainfall Measuring Mission (TRMM), or using the resulting data, is the validation of the accuracy of the rainfall
measurements by the TRMM satellite. This is a primary responsibility of the Ground Validation (GV) team at NASA GSFC. One of the GV team's goals has been the review and correction of the observations made by the weather radar located on Kwajalein Atoll, the only GV site in the tropical Pacific ocean. The quality of this radar data has been
adversely affected by many factors: deliberate system modifications, equipment failures in a harsh tropical environment, and other unknown causes. Such impacts on radar measurements produce subsequent errors in rainfall estimates, the quality of which is critical to the success of the GV mission. Thus, it was necessary to find a means of correcting such errors on a routine basis.
Radar returns from surface structures such as buildings and towers have been used since World War I1 as a qualitative measure of radar performance. The GV team developed the Relative Calibration Adjustment (RCA) method, which uses a statistical technique to analyze ground targets and assess the current state of the radar calibration.
This is done in an automated fashion and on a daily basis. Any changes in radar performance are well detected by the analysis. The method has revealed previously undetected changes in sensitivity due to alteration of the radar's physical characteristics. Further, the RCA has made possible the improvement of radar rain rate estimates,
insuring the integrity of TRMM observations, which have become the basis for the near global climatology of the water budget, as well as other purposes such as the monitoring of hurricane intensity. Such improvement to a previously problematic data set has protected the investment of federal resources toward maintaining the Kwajalein site of well over one million dollars and numerous man-years of effort over the life of the
program (1999-present). The method has also shown promise for any ground-based radar that has ground targets in proximity of the radar.
https://ntrs.nasa.gov/search.jsp?R=20080045517 2018-02-13T22:42:53+00:00Z
Ground Clutter as a Monitor of Radar Stability at Kwajalein, RMI
David S. ~ilberstein"~, David B. wolffls2, David A. ~ a r k s " ~ ,
David ~ t l a s l , and Jason L. ~ ipp i t t "~
'NASA Goddard Space Flight Center, Laboratoy for Atmospheres, Greenbelt, Mayla?zd
2Science Svstems and Applications, Inc., Lanham, Mayland
Corresponding Author's Address: David S. Silberstein NASAIGSFC, Code 613, Greenbelt, MD 2077 1.
Abstract
There are many applications in which the absolute and day-to-day calibration of
radar sensitivity is necessary. Thls is particularly so in the case of quantitative radar
measurements of precipitation. While absolute calibrations can be done periodically
using solar radiation, variations that occur between such absolute checks are required to
maintain the accuracy of the data. The authors have developed a method for h s purpose
using the radar on Kwajalein Atoll, which has been used to provide a baseline cahbration
for control of measurements of ramfall made by the Tropical Rainfall Measuring Mission
0. The method uses echoes from a multiplicity of ground targets. The average
clutter echoes at the lowest elevation scan have been found to be remarkably stable from
hour to hour, day to day, and month to month within better than +1 dB. They vary
significantly only after either deliberate system modifications, equipment failure or
unknown causes. A cumulative probability distribution of echo reflectivities (Ze in dBZ)
is obtained on a daily basis. Thls CDF includes both the precipitation and clutter echoes.
Because the precipitation echoes at Kwajalein rarely exceed 45 dBZ, selecting an upper
percentile of the CDF associated with intense clutter reflectivities permits monitoring of
radar stabihty. The reflectivity level at which the CDF attains 95% is our reference.
Dady measurements of the CDFs have been made since August 1999 and have been used
to correct the 7 M years of measurements and thus enhance the integrity of the global
record of precipitation observed by TRMM. The method also has potential applicability
to other pound radar sites.
1. Introduction
A vital task of all those working on the Tropical Ramfall Measuring Mission
0 or using the resulting data is the validation of the accuracy of the rainfall
measurements by the Precipitation Radar (PR). Thls is a primary responsibility of the
Ground Validation (GV) team. One of our goals has been the review and correction of
the observations made by the KPOL radar on Kwajalein Atoll. Radar specifications are
outlined in Table 1. Changes in radar sensitivity can be caused by either deliberate
system modifications, equipment failures or unknown causes.
The best checks of absolute system sensitivity have been made from time to time
using observations of solar radiation. However, sensitivity changes have occurred on
other occasions that have produced errors in the precipitation reflectivity and thus in the
ramfall. It was therefore necessary to find a means of correcting such errors on a routine
basis, even daily. We then chose to use echoes from fixed ground structures or ground
clutter, as had been done previously in a more limited manner by Rinehart (1978).
Indeed, echoes from well defined structures have been used since WW I1 as a qualitative
measure of radar performance.
The present approach involves use of the statistics of the clutter reflectivities at
the lowest level of scan on rain-free days and similar statistics of the combination of
clutter and precipitation reflectivities when raining. A change in system sensitivity alters
the features of the probability distributions in a wen-defmed manner. The goals of this
work are: 1) to develop the method; 2) to demonstrate the manner in which it determines
changes in system sensitivity whenever they occur; 3) to provide a long term record of
the system sensitivity changes; and 4) to indicate how we plan to correct the KPOL
observations and thereby enhance the intepty of the 7 112 year global archive of rainfall
measured by TRMM.
2. Background
A comprehensive review of the nature of ground clutter in a variety of
environments is available in Skolnik (2001, Chapter 7). Further details may be found in
the papers by Billingsley and Larrabee (1991) and Billingsley (1993) as well as others in
the Skolnik review. For present purposes it suffices to know that most of the sipficant
clutter echoes at low angles come from spatially localized or discrete vertical features
associated with high regions of the visible landscape (e.g. trees, buildings, or multiple
towers). An aerial view of Kwajalein Island is shown in Figure 1. Except for the case of
echoes from wind-driven trees, the echoes do not fluctuate as do those from precipitation.
The reflections from clutter do not behave as those from point targets with inverse fourth
power range dependence. Rather, they depend upon the range dependence of the target
characteristics. Each echo is the cumulative sum of the reflections from structures within
a half pulse length. Those from structures with flat surfaces normal to the radar beam are
the strongest. The reader is referred to S k o l d (2001, Table 7.1 and Figs. 7.4 and 7.5)
for details on the typical strength of clutter echoes from various types of terrain as a
function of wavelength.
A sigmficant study indicative of the utility of ground clutter in the present context
is the work of Fabry et al. (1997) and Fabry (2004) in which they have used the phase
shift of the echoes from various ground targets to measure the path average refractive
index and thus the relative humidity between target and radar. T h ~ s requires that the
selected targets produce strong and stable echoes. We shall see that the latter features
characterize the nature of the clutter targets in this work.
In what follows the Signet 8 Corporation RVP8 signal processor averages the
echoes and produces a >al measure of the reflectivity factor lOLogZ in dBZ. The
processor does the same for ground clutter with or without the presence of precipitation.
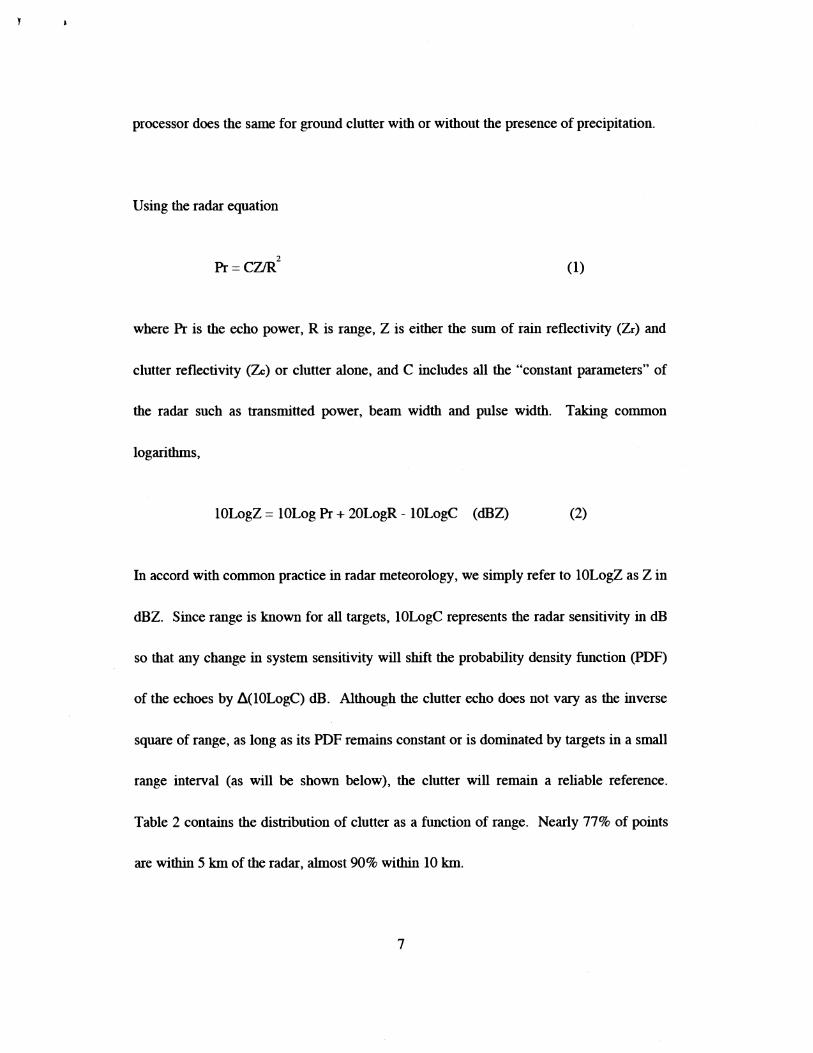
Using the radar equation
where Pr is the echo power, R is range, Z is either the sum of rain reflectivity (Zr) and
clutter reflectivity (ZC) or clutter alone, and C includes all the "constant parameters" of
the radar such as transmitted power, beam width and pulse width. Taking colnmon
logarithms,
In accord with common practice in radar meteorology, we simply refer to lOLogZ as Z in
dBZ. Since range is known for all targets, 10LogC represents the radar sensitivity in dB
so that any change in system sensitivity will shift the probability density function (F'DF)
of the echoes by A(1OLogC) dB. Although the clutter echo does not vary as the inverse
square of range, as long as its PDF remains constant or is dominated by targets in a small
range interval (as will be shown below), the clutter will remain a reliable reference.
Table 2 contains the distribution of clutter as a function of range. Nearly 77% of points
are withm 5 km of the radar, almost 90% withm 10 km.
Because the method requires constancy of the PDF of the clutter reflectivity we
have examined the possible affects of anomalous propagation over all relevant intervals
fiom hours to months and found no sipficant variations. This is probably due to the
oceanic tropical environment of Kwajalein.
3. The RCA Method Defined
In order to arrive at the most reliable estimates of reflectivity, the GV team must
address numerous sources of non-precipitation related reflectivity returns. One of these
sources is ground clutter in the vicinity of the radar that can be generated by buildmgs
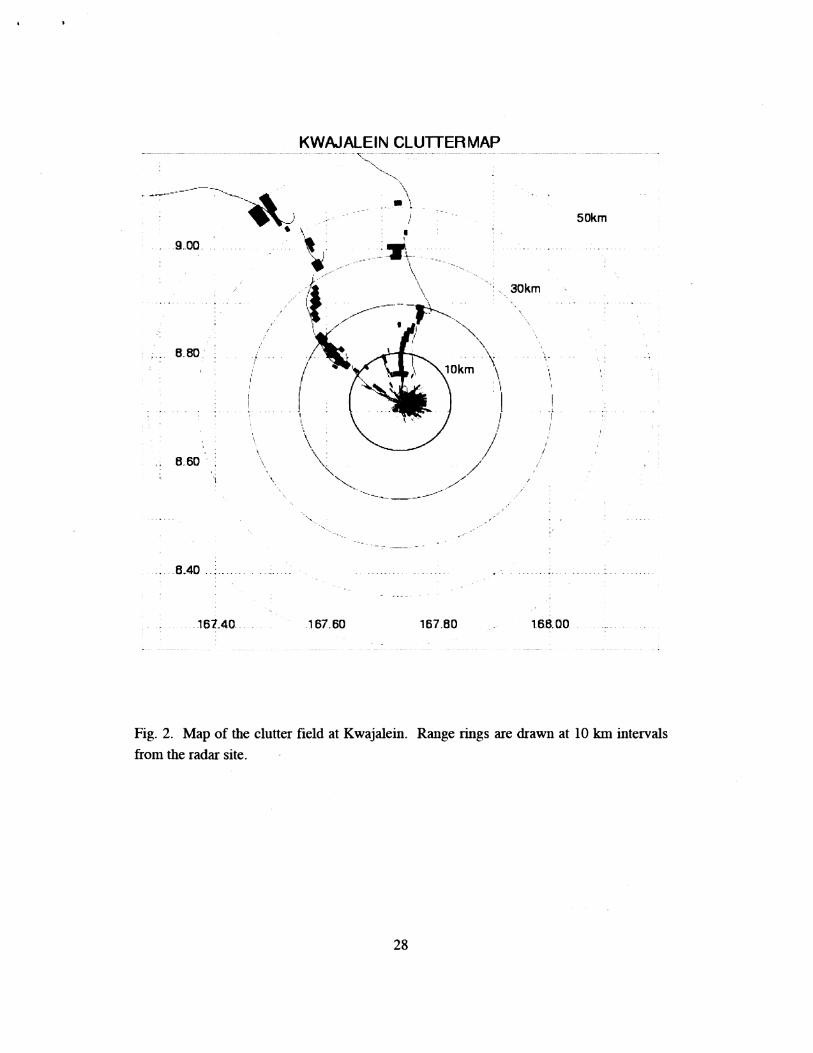
and other physical structures. A clutter map was developed by constructing a mask
where there was a relatively high probability of echo detection in the absence of
precipitation. These regions were identified according to range and azimuth from the
radar and a database was constructed containing 1323 range-azimuth pairs. This database
was used to establish a clutter map, displayed in Fig. 2, that is used to eliminate echoes
for purposes of quality control. The outline of the clutter does not correspond to the
Kwajalein island alone but to the group of islands comprising the entire atoll.
The 1323 range-azimuth pairs are from observations at 1 degree of azimuth and 1
km in range. For each degree of azimuth, observed reflectivity, hereafter referred to as
reflectivity, is recorded at individual gates with 264 m spacing (200 m gate spacing after
1 March 2005). The reflectivity at each gate was extracted from the TRMM standard
product 1C-51 data. Thls product is described more fully in Wolff et al. (2005).
Because there are roughly four gates kml, this extraction provides approximately 5000
reflectivity measurements (more than 6500 after 1 March 2005) withln the clutter repon
for a full sweep of the radar. During the course of a day, with volume scans
approximately every 6 minutes, there can be up to 240 sweeps resulting in daily clutter
6 data sets containing over 10 samples.
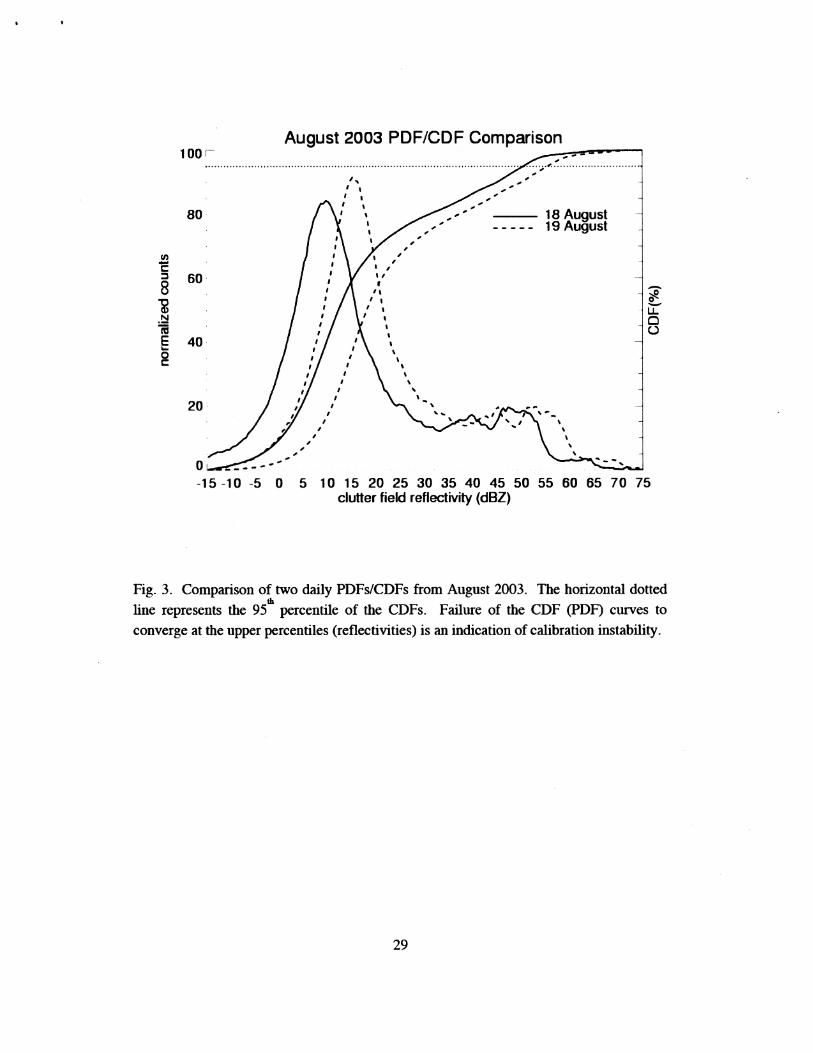
The PDFs and CDFs for consecutive days from August 2003 are depicted in Fig.
3. The shift in the mode of the PDF between 18 August (solid lines) and 19 August
(dashed lines) is the same as that throughout the entire CDF. (Each PDF is based on a11
entire day of data.) It is worth noting that the meteorology on these two dates is quite
similar with only widely scattered rainfall on both dates; however, the CDFs for these
two consecutive dates differ considerably at hlgher reflectivities, indicating a change in
ZC. Independent engineering logs provided by 3D Research Corporation (3DRC) reveal
that this particular change is directly tied to the replacement of a directional coupler on
19 August.
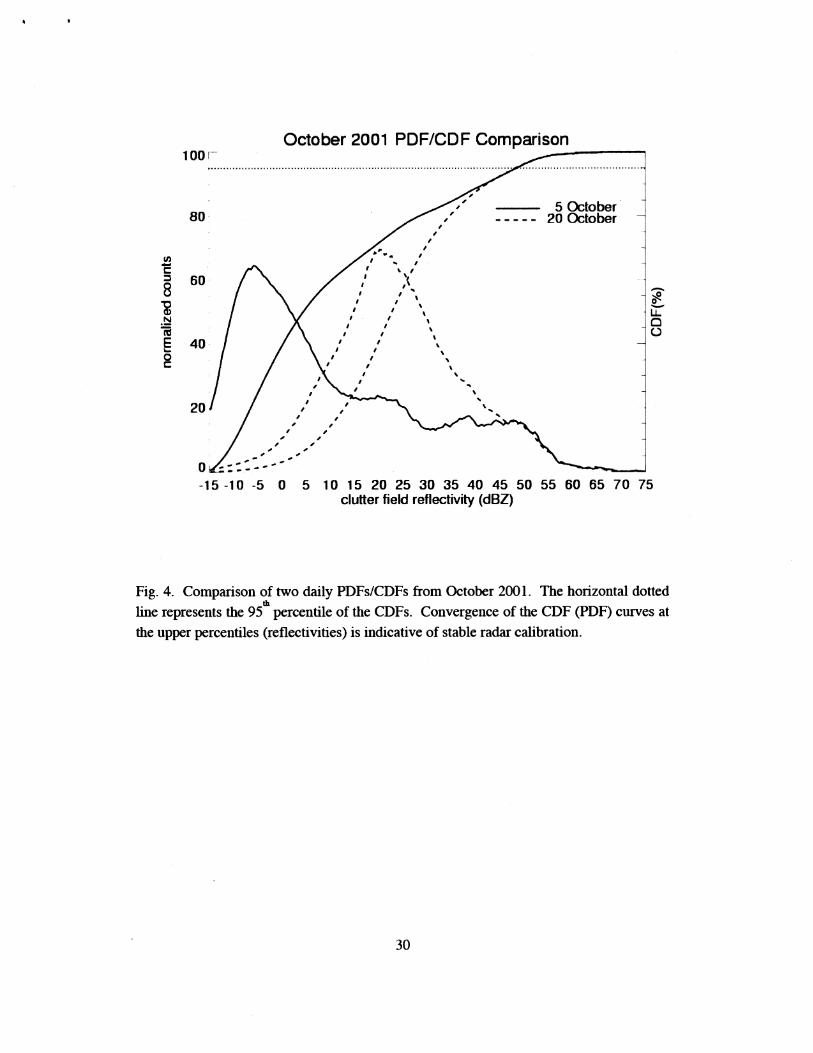
In the second half of 2001, it was generally accepted that the KPOL radar was
operating in a relatively stable mode as determined by engineering logs. The PDFs and
CDFs for 5 October and 20 October are displayed in Fig. 4. It is known from a visual
inspection of radar images that very different meteorological conhtions existed on these
two days. On 5 October (solid lines), numerous organized rain bands traversed the site,
whlle on 20 October (dashed lines), precipitation was generally light and widely
scattered. Because reflectivity associated with precipitation rarely exceeds 45 dBZ at
Kwajalein, the combined CDF of ZC and Zr will reach 100% close to that level under
ordinary circumstances, i.e. the best absolute value of C. However when C changes with
a sensitivity change, the new combined CDF will attain 100% at either a smaller or larger
reflectivity value dependng upon whether lOLogC increases or decreases, respectively.
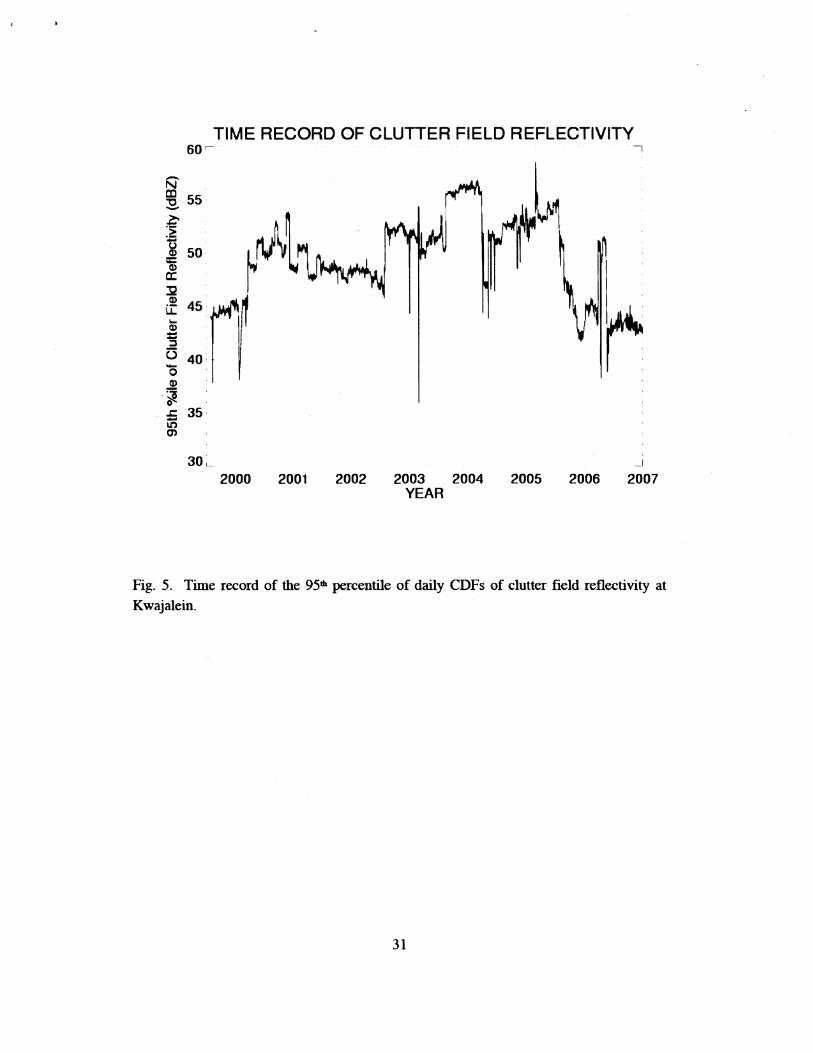
Empirical tests have shown that the 95* percentile of the CDF is a very reliable indicator
of such changes and provides robust sampling (- 50000 values per day). This is the
m level to which we refer through the remainder of this paper. An evaluation of the 95
percentile of daily CDFs over the 7 M years of data processed is displayed in Fig. 5. It is
evident that there are periods of relative calibration stability as well as periods where the
calibration undergoes significant changes. Most of these readily apparent calibration
changes have been directly tied to significant engineering events such as the failure or
replacement of major radar components. These relationships between time record
behavior and engineering indicate that changes in radar calibration can be clearly
detected by the RCA method, and thus prevent their misinterpretation as meteorological
phenomena.
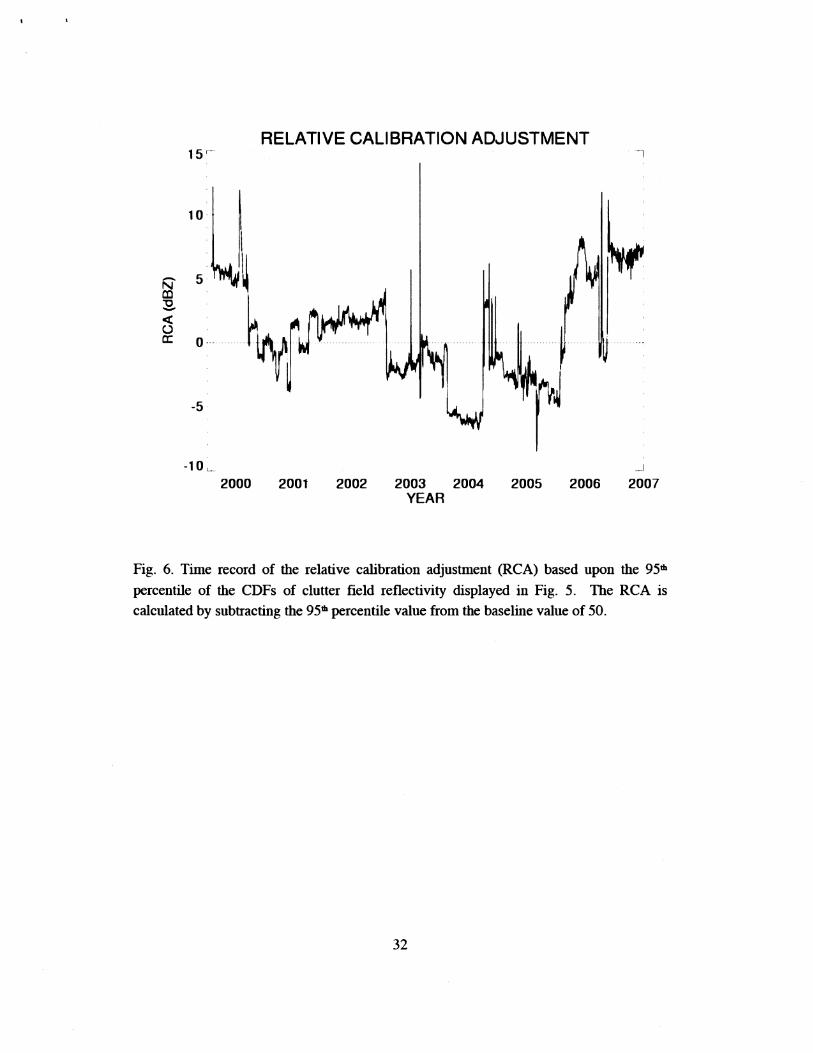
m In order to provide daily data adjustments, knowing the 95 percentile time record
is an essential requirement. However, it is also necessary to establish a baseline and that
can only be accomplished if there is a high degree of confidence in the calibration at a
particular time. Fortunately, as a result of the intensive KWAJEX field campaign
conducted in 1999 (Yuter et al. 2005) and subsequent collaboration among several
institutions (NASA, Colorado State Univ., Univ. of Washington), a consensus was
reached among researchers that the radar was running about 6 dB too low, based on
comparisons with the TRMM precipitation radar (PR), and other methods, during the
month of August 1999. The RCA baseline was thus established by adding 6 dB to the
95. percentile value of 1 August 1999, making that summation the reading to which all
subsequent days would be compared. The o r i p a l value on 1 August is 44 dBZ,
th therefore the baseline value was set to 50 dBZ. To calculate the RCA, the dady 95
percentde value is subtracted from the baseline value. The result of this calculation for
the period of August 1999 through 2006 is plotted in Fig. 6. It is clear that there are
periods where the radar sensitivity runs low and positive adjustments are required; the
converse in true when the sensitivity is hlgh. Even though there are relatively stable
periods, it is worth noting that almost every day may require some adjustment, as the
RCA is rarely equal to zero. Given that the majority of the druly data will undergo at
least some revision with major adjustments in certain cases, it is vital to assess the extent
to which engineering issues affect the continuity and stability of KPOL data and
demonstrate how the RCA can produce accurate precipitation reflectivities.
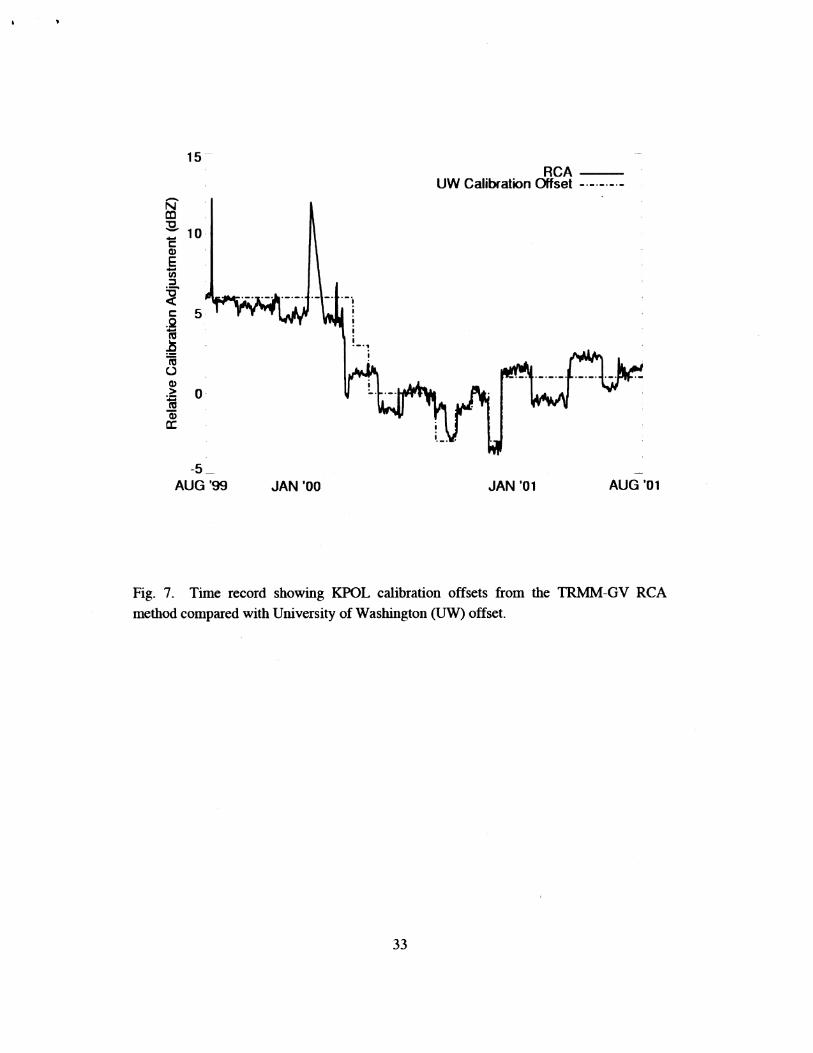
To initially check the v&&ty of the RCA results, a comparison was made with
the KPOL calibration corrections presented in Houze et al. (2004) (their Table 2), which
relied on the documented stability of the TRMM PR (Kozu et al. 2001). For several
periods in the above referenced table, the RCA results compared quite favorably. As
shown in Fig. 7, both RCA and UW adjustments were initially +6 dB in early August
1999. Both RCA and UW offsets track each other within 1-2 dB. The UW offsets
remain constant over long time periods (e.g. December 2000 to August 2001) untll the
analysis of the next rainy PR overpass in combination with engineering logs. Because
only a small number of TRMM overpasses with substantial rain occur in any month, the
nearly 95% of the clutter field. This may be due to the fact that there are multiple targets
in the pulse volume or that specific targets may consist of more complicated geometries
not properly characterized by a point target formulation. Another way to examine the
potential effect of range is to examine the actual day-to-day changes in the RCA (ARCA)
for different ranges of data accepted. Table 4 &splays the ARCA values for ten days in
July 2007 for data w i t . 1, 5 and 10 km. It can be seen that the day-to-day differences
across the various ranges Mfer only slightly, an indication that range effects are minimal.
Given this outcome, and in the interest of obtaining as many samples as possible, the
entire clutter field is considered in the RCA analysis.
5. Calibration Case Study
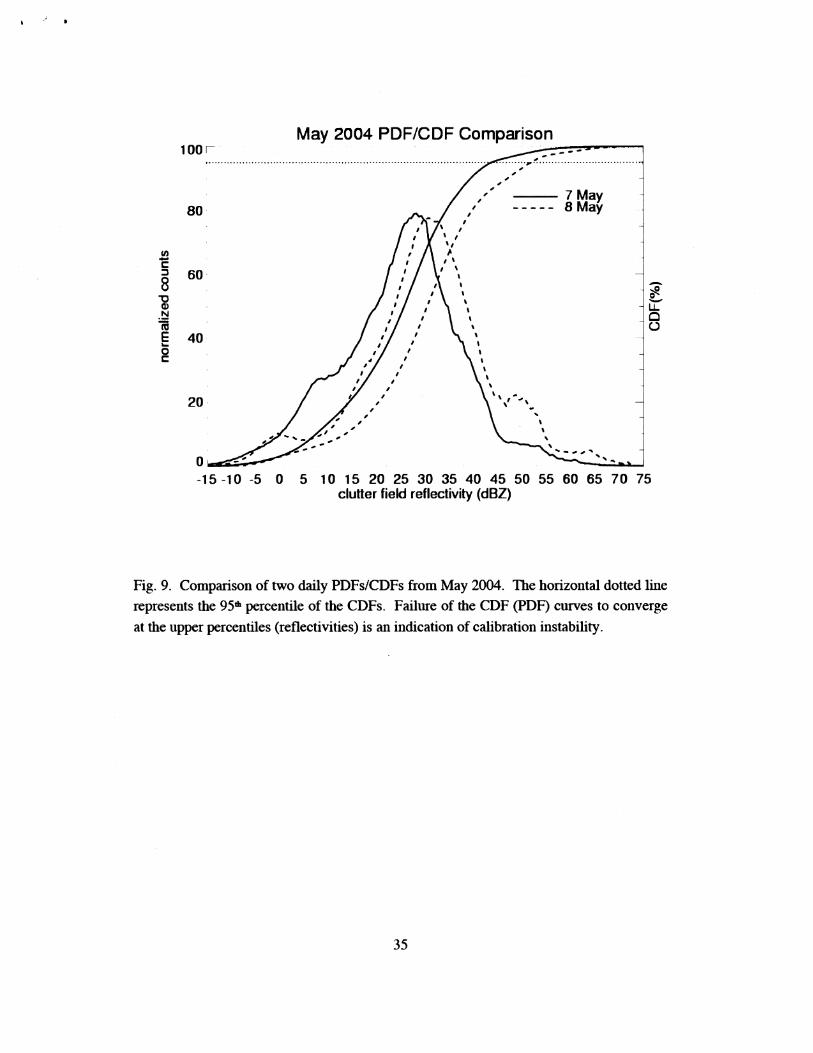
The PDFs and CDFs for two days in May 2004, another period of unstable radar
calibration, are displayed in Fig. 9. Although the meteorological condtions on these two
days are similar with widely scattered showers, the PDFs reveal that there is a substantial
jump in the calibration from 7 May (solid lines) to 8 May (dashed lines). The increase in
m Zc of approximately 8 dB at the 95 percentile is one of the largest changes observed on
consecutive days. As was the case with the August 2003 example described in Section 3,
the calibration change during May 2004 can be directly tied to a documented engineering
event: the changng of the directional coupler loss from 50.47 dBZ to 48.1 dBZ on 7
May.
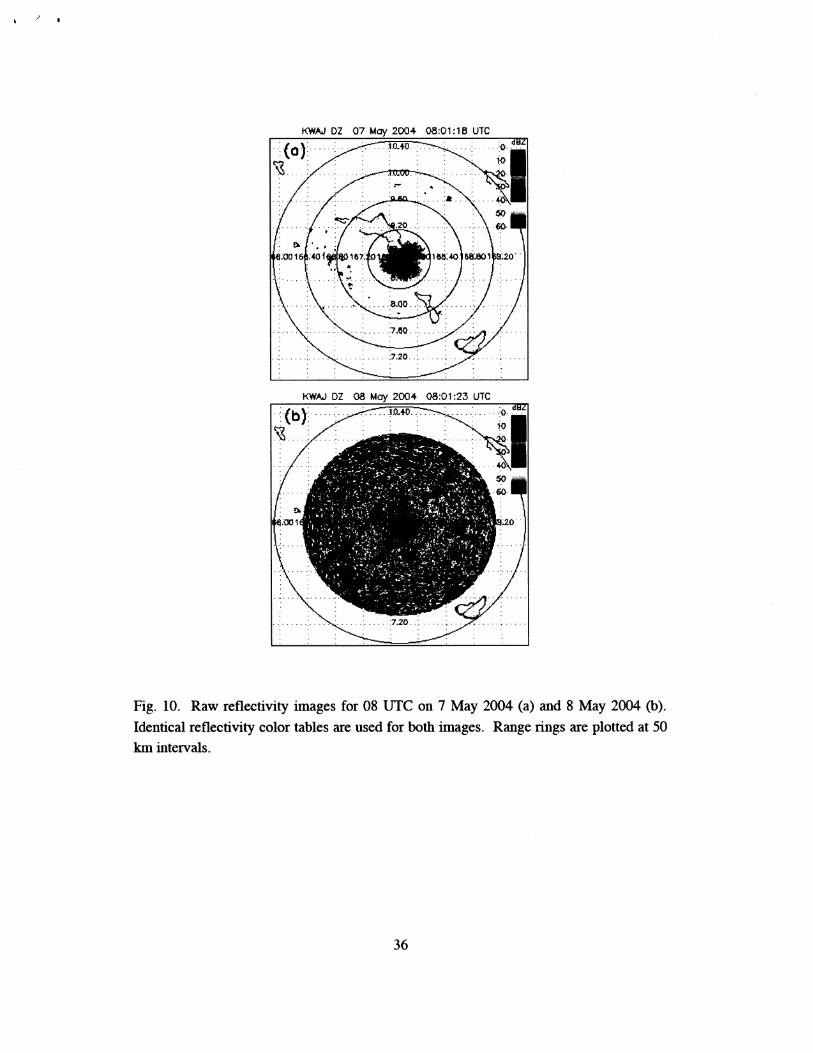
The impact of such a sudden and extreme change in calibration can also be seen in
the actual radar imagery. Two radar images, taken almost exactly 24 hours apart, are
presented in Figs. 10a, b. It is evident from a comparison of these two figures that a
significant calibration event had occurred. Not only are the 8 May reflectivities higher in
the region of the clutter field but across the entire radar domain as well, an indication that
what was happening in the clutter region was also affecting the entire reflectivity field.
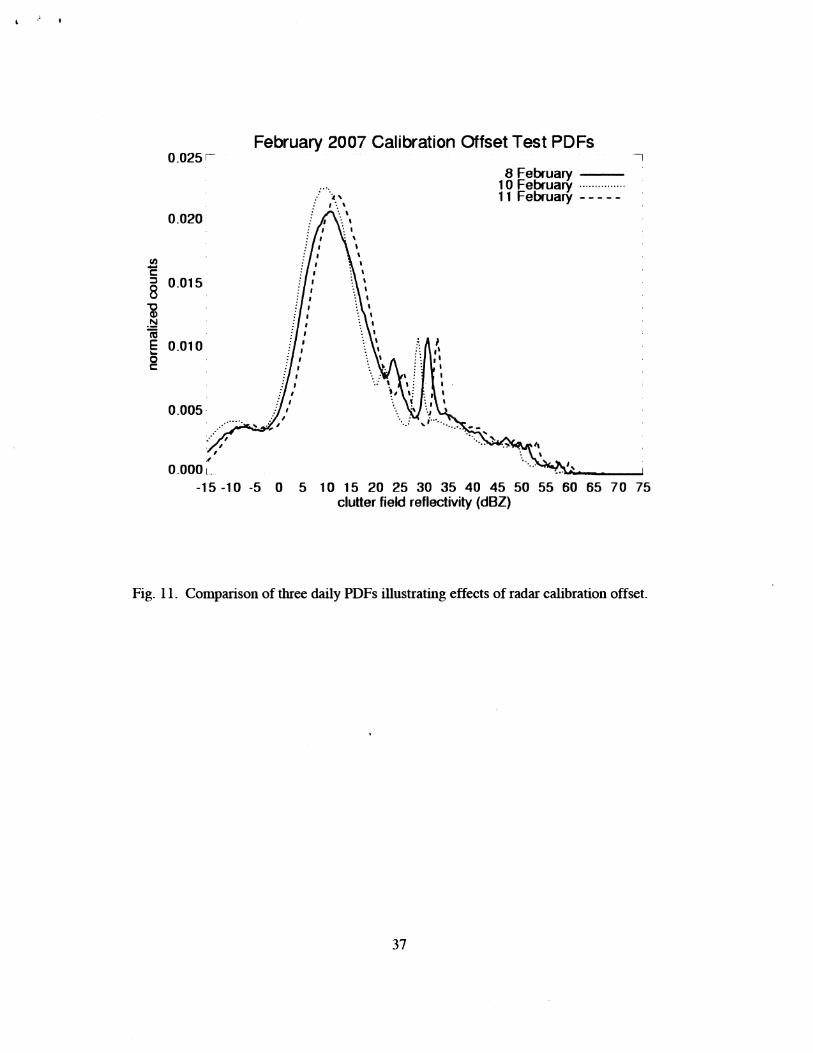
6. Controlled KPOL Calibration Offset Test
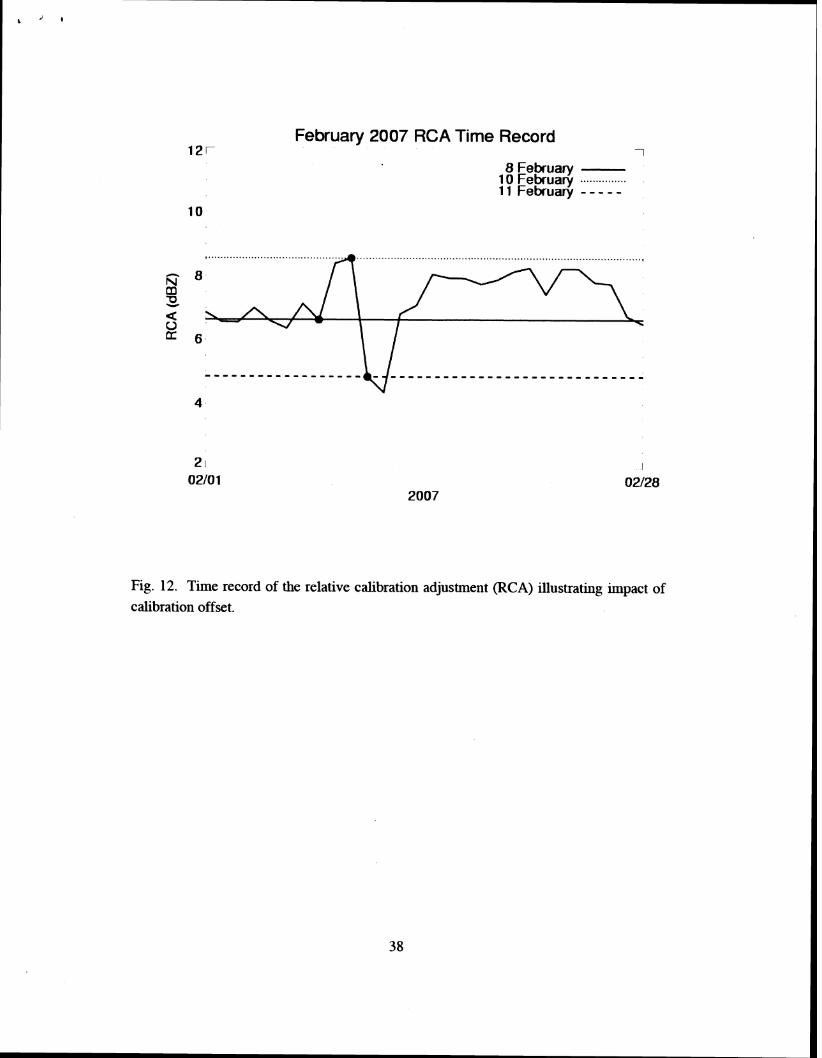
In February 2007, in cooperation with the 3DRC radar operations staff, a test was
performed to examine whether the RCA could accurately depict a prescribed calibration
offset at KPOL. The test was structured so that within a span of three days, during a
meteorologically quiescent period with no other engineering tasks scheduled, the operator
first decreased both the horizontal and vertical calibration offset factors by 2 dB from
their nominal values and then increased calibration offset factors by 2 dB above their
nominal values. The PDFs for three days are presented in Fig. 11. The results clearly
show that for reflectivities typical of clutter there is an approximate s M about the 8
February PDF of & 2 dB. The direct impact of this shift in the PDFs can be seen more
clearly in the plot of the h l y RCA values over this period, depicted in Fig. 12. The
RCA value on 10 February is approximately 2 dB greater than the 8 February value as
one would expect for a decrease in calibration offset (a leftward shift of the PDF), while
the 11 February RCA value is approximately 2 dB less than the 8 February value as one
would expect for an increase in calibration offset (a rightward shift of the PDF). This
result seems to indicate that in the absence of major enpeering issues, such as an
inaccurately pointed radar beam, the RCA has the capability to track calibration related
drift that may occur for any number of reasons directly or indirectly impacting the power
output of the radar.
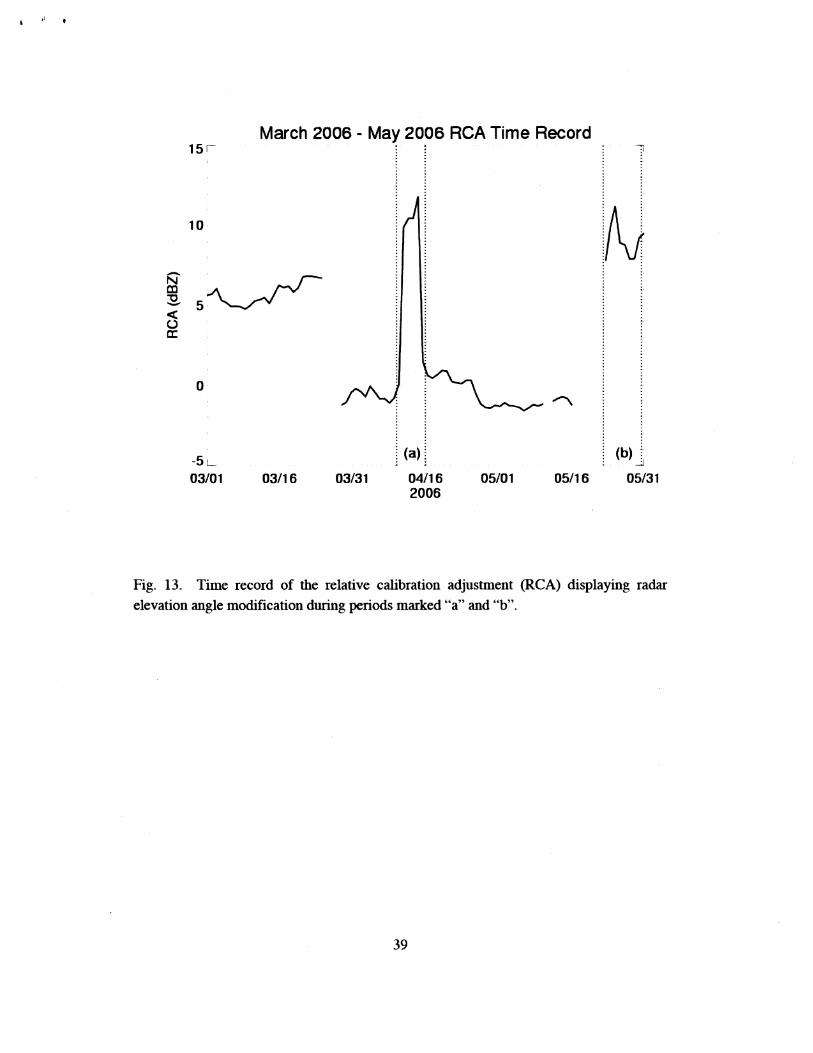
7. Elevation Angle Inconsistencies Detected By The RCA
A series of events occurred in 2006 that further highlighted the capability of the
RCA to detect not only changes in calibration, but also changes in the actual pointing
angle of the KPOL radar. Two prominent splkes in the RCA time record can be seen in
Fig. 6 during early 2006. This portion of the time record is expanded in Fig. 13 to
display the period from March through May of 2006. In the first period of interest
(marked "a"), the RCA jumps over 10 dB to a value approachmg 12 dBZ before set thg
back to a value near 0 dBZ, all of this happening in a span of five days. Clearly, a major
engneering event occurred during this period and a careful examination of the radar logs
provided the explanation. Testing of a new solar calibration software utility (SIGMET 8
SUNCAL) indicated that the antenna's offset was not on track. On 10 April, the antenna
offset was adjusted from -18 to -17.2 degrees, and then reset to -18 degrees on 15 April.
As a result of h s particular incident, the authors realized that they were not only dealing
with changes in cahbration, but also with a separate issue related to the changes in the
elevation angle of the radar beam. The sensitivity is such that for every 0.1 degree
increase in beam elevation angle, the RCA increases approximately 1 dB. In addition to
this event, another would occur at the end of May that would prove that changes in the
elevation angle of the radar antenna strongly impact RCA calculations. During May
2006, a calibration team arrived at Kwajalein to perform their yearly investigation (Smith
et al. 2007). W l e there, they ran the SIGMET @ solar calibration utility and as a result
of their findings the antenna offset was adjusted from -18 to -17.25 degrees. The impact
of this change is clearly evident in Fig. 13 (marked "b"), concurrent with another
substantial increase in the RCA. This confirms that elevation angle modification can
greatly alter the RCA. Based upon preliminary analysis, the authors believe that during
these identified periods as well as others impacted by angular inconsistency, it is
inappropriate to dlrectly apply the RCA to precipitation related reflectivity
measurements; the effect of overshooting ground clutter targets dwarfs the effect of
angular error on meteorologically based reflectivities. During periods characterized by
elevation angle stability, the RCA measurement should serve as an excellent proxy for
calibration change.
8. Summary and Conclusions
This paper presents a method for monitoring the sensitivity of a radar from day to
day. It uses a large set of echoes from ground clutter at the lowest beam elevation to
provide a stable reference cumulative probability distribution (CDF) of equivalent
reflectivity Zc of the clutter echoes. This is done automatically daily with and without
rain. The CDF in the presence of rain is due to the sum of the rain reflectivities Zr plus
Zc. Any change in radar sensitivity displaces the cumulative percentiles by an amount
m corresponding to that change. The 95 percentile of the CDF of (Zr+Zc) is found to be a
reliable measure of the change in sensitivity.
This method for Relative Calibration Adjustment (RCA) has been used to provide
a long term record of system sensitivity for the KPOL radar at Kwajalein, the only
rainfall ground truth radar in the tropical Pacific for the Tropical Ramfall Measuring
Mssion (TRMM). It has revealed previously undetected changes in sensitivity due either
to intentional or unknown causes, such as system modifications, antenna offsets,
alterations of the receiver, or the data processor. It is thus malung possible the correction
of the radar rainfall measurements and insuring the integrity of 7 112 years of TRMM
observations which have become the basis for the near global climatology of the water
budget as well as other purposes such as the monitoring of hurricane intensity. The
method is applicable to any ground based radar which does not use Doppler filtering of
clutter. Readers interested in learning more about the GV program's near-real-time
monitoring of KPOL performance may access http://trmm-fc.~sfc.nasa.aov/KWAJ/RCA
for further information.
9. Acknowledgments
This study was funded by NASA Grants NNG07E150C and NNG06HX18C. The
authors would hke to thank Dr. Ramesh Kakar (NASA Headquarters), Dr. Robert Adler
(TRMM Project Scientist) and Mr. Richard Lawrence (Chef, TRMM Satellite Validation
Office) for their guidance and support of h s effort. We are grateful to Dr. Memll
Skolnik for discussions of ground clutter and to Mr. Bartie Kelley for developing the
suite of routines in the RSL in IDL library which were the foundation for the
programming effort undertaken in this project. We also appreciate the support staff of
the TSVO, including David Makofski and Marcella Shupp.
REFERENCES
Billingsley, J. B., 1993,: Ground Clutter Measurements for Surface-Sited Radar, MIT
Lincoln Laboratories, Lexington, Mass., Tech. Rep. 786, 81 pp.
Bdingsley, J. B. and J. F. Larrabee, 1991: Multifrequency Measurements of Radar
Ground Clutter at 42 Sites, MIT Lincoln Laboratories, Lexington, Mass., Tech.
Rep. 916, Vol. 1,279 pp.
Fabry, F., 2004: Meteorologcal value of ground target measurements by radar. J. Atmos.
Oceanic Teclznol., 21, 560-573.
Fabry, F., G. Frush, A. Kilambi, and I. Zawadzki, 1997: On the extraction of near-surface
index of refraction using radar measurements of ground targets. J. Amos.
Oceanic Teclznol., 14,978-987.
Houze, R. A., Jr., S. Brodzlk, C. Schumacher, S. E. Yuter, and C. R. Williams, 2004:
Uncertainties in Oceanic Radar Rain Maps at Kwajalein and Implications for
Satellite Validation. J. Appl. Meteor., 43, 11 14-1 132.
Kozu, T., and Coauthors, 2001: Development of Precipitation Radar Onboard the
Tropical Rainfall Measuring Mission (TRMM) Satellite, IEEE Trans. Geosci.
Rernote Sens., 39, 102-1 16.
Rinehart, R. E., 1978: On The Use of Ground Return Targets for Radar Reflectivity
Calibration Checks. J. Appl. Meteor., 17, 1342-1350.
Skolnik, M., 2001: Introduction to Radar Systems, McGraw-Hill, 772 pp.
Smith, P. L., V. Chandrasekar and E. A. Mueller, 2007: Alignment and Calibration
Studies of The KPOL Weather Radar - 2006, 78 pp. [ Available from 3D
Research Corporation, Huntsville, Alabama 35806. ]
Wolff, D. B., D. A. Marks, E. Atnitai, D. S. Silberstein, B. L. Fisher, A. Tokay, J. Wang,
and J. L. Pippitt, 2005: Ground Validation for the Tropical Rainfall Measuring
Mission (TRMM). J. Amos. Oceanic Teclznol., 22, 365-380.
Yuter, S. E., R. A. Houze Jr., E. A. Smith, T. T. Wilheit, and E. Zipser, 2005: Physical
Characterization of Tropical Oceanic Convection Observed in KWAJEX J. Appl.
Meteor., 44, 385-415.
LIST OF FIGURES
Fig. 1. Aerial view of Kwajalein Island. The KPOL radar is located at the southern edge
of the island, near the airport runway.
Fig. 2. Map of the clutter field at Kwajalein. Range rings are drawn at 10 km intervals
from the radar site.
Fig. 3. Comparison of two daily PDFsICDFs from August 2003. The horizontal dotted
line represents the 95& percentile of the CDFs. Failure of the CDF (PDF) curves to
converge at the upper percentiles (reflectivities) is an indication of calibration instability.
Fig. 4. Comparison of two daily PDFsICDFs from October 2001. The horizontal dotted
th line represents the 95 percentile of the CDFs. Convergence of the CDF (PDQ curves at
the upper percentiles (reflectivities) is indicative of stable radar calibration.
Fig. 5. Time record of the 95* percentile of daily CDFs of clutter field reflectivity at
Kwajalein.
Fig. 6. Time record of the relative calibration adjustment (RCA) based upon the 95&
percentile of the CDFs of clutter field reflectivity displayed in Fig. 5. The RCA is
calculated by subtracting the 95& percentile value from the baseline value of 50.
Fig. 7. Time record showing KPOL calibration offsets from the TRMM-GV RCA
method compared with University of Washington 0 offset.
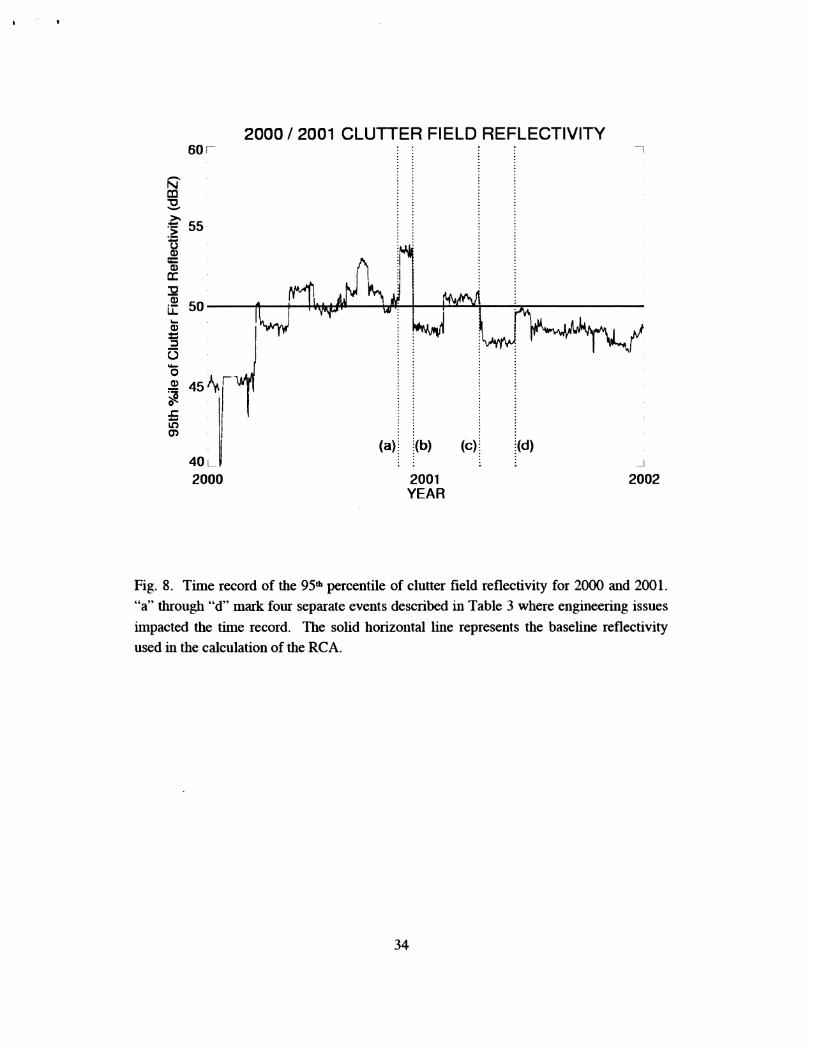
Fig. 8. Time record of the 95* percentile of clutter field reflectivity for 2000 and 2001.
"a" through " d mark four separate events described in Table 3 where engneering issues
impacted the time record. The solid horizontal h e represents the baseline reflectivity
used in the calculation of the RCA.
Fig. 9. Comparison of two daily PDFsICDFs from May 2004. The horizontal dotted line
represents the 95& percentile of the CDFs. Failure of the CDF (PDF) curves to converge
at the upper percentiles (reflectivities) is an indication of calibration instability.
Fig. 10. Raw reflectivity images for 08 UTC on 7 May 2004 (a) and 8 May 2004 (b).
Identical reflectivity color tables are used for both images. Range rings are plotted at 50
km intervals.
Fig. 11. Comparison of three daily PDFs dustrating effects of radar calibration offset.
Fig. 12. Time record of the relative calibration adjustment (RCA) illustrating impact of
calibration offset.
Fig. 13. Time record of the relative calibration adjustment (RCA) displaying radar
elevation angle modification during periods marked "a" and "b".
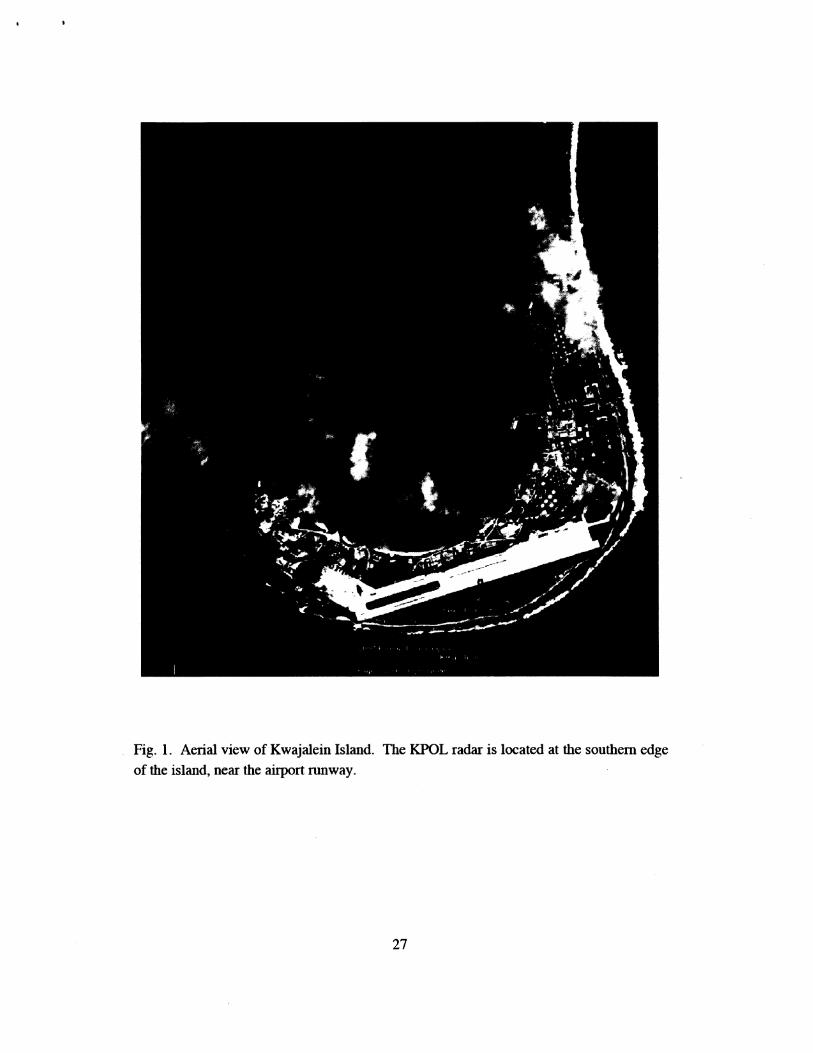
Fig. 1. Aerial view of Kwajalein Island. The KPOL radar is located at the southern edge of the island, near the W r t runway.
KWAJALEIN CLUTTER MAP
Fig. 2. Map of the clutter field at Kwajalein. Range rings are drawn at 10 km intervals from the radar site.
August 2003 PDFICDF Comparison 00 :- - - / " 1
-15 -10 -5 0 5 10 15 20 25 30 35 40 45 50 55 60 65 70 75 clutter field reflectivity (dBZ)
Fig. 3. Comparison of two daily PDFsICDFs from August 2003. The horizontal dotted line represents the 95& percentile of the CDFs. Failure of the CDF (PDF) curves to converge at the upper percentiles (reflectivities) is an indication of calibration instability.
-15-10 -5 0 5 10 15 20 25 30 35 40 45 50 55 60 65 70 75 clutter field reflectivity (dBZ)
Fig. 4. Comparison of two druly PDFsICDFs from October 2001. The horizontal dotted line represents the 95. percentile of the CDFs. Convergence of the CDF (PDF) curves at the upper percentiles (reflectivities) is indicative of stable radar calibration.
TIME RECORD OF CLUTTER FIELD REFLECTIVITY 60 '- 1
30, I
2000 2001 2002 2003 2004 2005 2006 2007 YEAR
Fig. 5. Time record of the 95* percentile of diuly CDFs of clutter field reflectivity at Kwajalein.
RELATIVE CALIBRATION ADJUSTMENT 15 ' 1
I
-1 0 . I
2000 2001 2002 2003 2004 2005 2006 2007 YEAR
Fig. 6. Time record of the relative calibration adjustment (RCA) based upon the 95& percentde of the CDFs of clutter field reflectivity displayed in Fig. 5. The RCA is calculated by subtracting the 95& percentile value from the baseline value of 50.
RCA - UW Calibration Offset -.-.-.-.-
-5 - AUG '99 JAN '00 JAN '01 AUG '01
Fig. 7. Time record showing KPOL calibration offsets from the TRMM-GV RCA method compared with University of Washington (UW) offset.
2000 1 2001 CLUTTER FIELD REFLECTIVITY
2001 YEAR
Fig. 8. Time record of the 95* percentile of clutter field reflectivity for 2000 and 2001. "a" through "d" mark four separate events described in Table 3 where engineering issues impacted the time record. The solid horizontal h e represents the baseline reflectivity used in the calculation of the RCA.
May 2004 PDF/CDF Comparison 100 r
I - I 7 May
Qn - - - - - 8 May 1 i
-1 5 -1 0 -5 0 5 10 15 20 25 30 35 40 45 50 55 60 65 70 75 clutter field reflectivity (dBZ)
Fig. 9. Comparison of two daily PDFsICDFs from May 2004. The horizontal dotted line represents the 95& percentile of the CDFs. Failure of the CDF (PDF) curves to converge at the upper percentiles (reflectivities) is an indication of calibration instability.
KWAJ DZ 07 Mav 2004 08:Ol: 1 B UTC
KWAJ DZ 08 Mw 2004 08:01:23 UTC
Fig. 10. Raw reflectivity images for 08 UTC on 7 May 2004 (a) and 8 May 2004 (b). Identical reflectivity color tables are used for both images. Range rings are plotted at 50 km intervals.
February 2007 Calibration Offset Test PDFs 0 -025 ' -
8 February - .... . . 1 0 February ..............,
..' > \ : I.., \
1 1 February - - - - - 0.020
V) Y
0.015
3 N . - - m
0.010 e
0.005
0.000 l -1 5 -1 0 -5 0 5 10 15 20 25 30 35 40 45 50 55 60 65 70 75
clutter field reflectivity (dBZ)
Fig. 11. Corllparison of three daily PDFs illustrating effects of radar calibration offset.
February 2007 RCA Time Record -
8 February - 1 0 February ............... 1 1 February - - - - -
Fig. 12. Time record of the relative cahbration adjustment (RCA) illustrating impact of calibration offset.
March 2006 - May 2006 RCA Time Record
(a)
0311 6 0313 1 0411 6 05/01 0511 6 2006
Fig. 13. Time record of the relative calibration adjustment (RCA) displaying r a h elevation angle modification during periods marked "a" and "b.
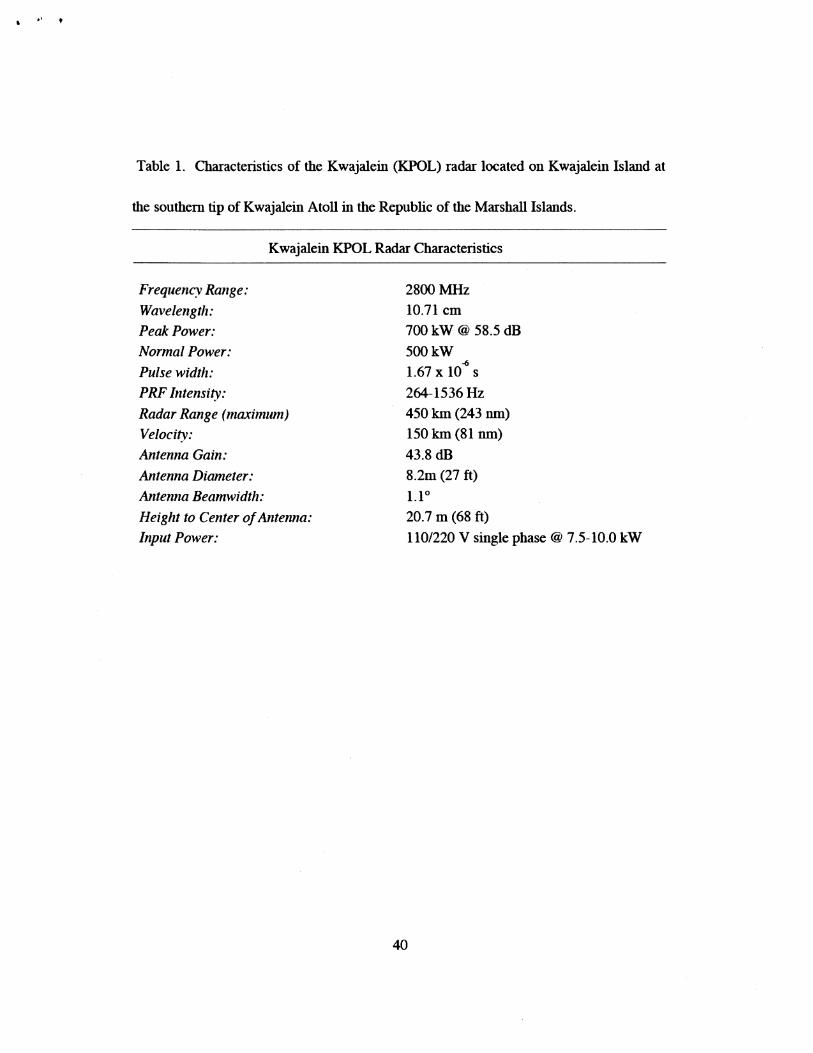
Table 1. Characteristics of the Kwajalein (KPOL) radar located on Kwajalein Island at
the southern tip of Kwajalein Atoll in the Republic of the Marshall Islands.
Kwajalein KPOL Radar Characteristics
Frequency Range: Wavelengtlz: Peak Power: Normal Power: Pulse width: PRF htensity: Radar Range (maximum) VelociQ: Antenna Gain: Antenna Diameter: Antenna Beamwidtlz: Height to Center of Antenna: Irput Power:
2800 MHz 10.71 cm 700 k W @ 58.5 dB 500 k W 1.67 x lo6 s 264-1536 HZ 450 km (243 nm) 150 km (81 nm) 43.8 dB 8.2m (27 ft) 1.1" 20.7 m (68 ft) 1 10/220 V single phase @ 7.5- 10.0 k W
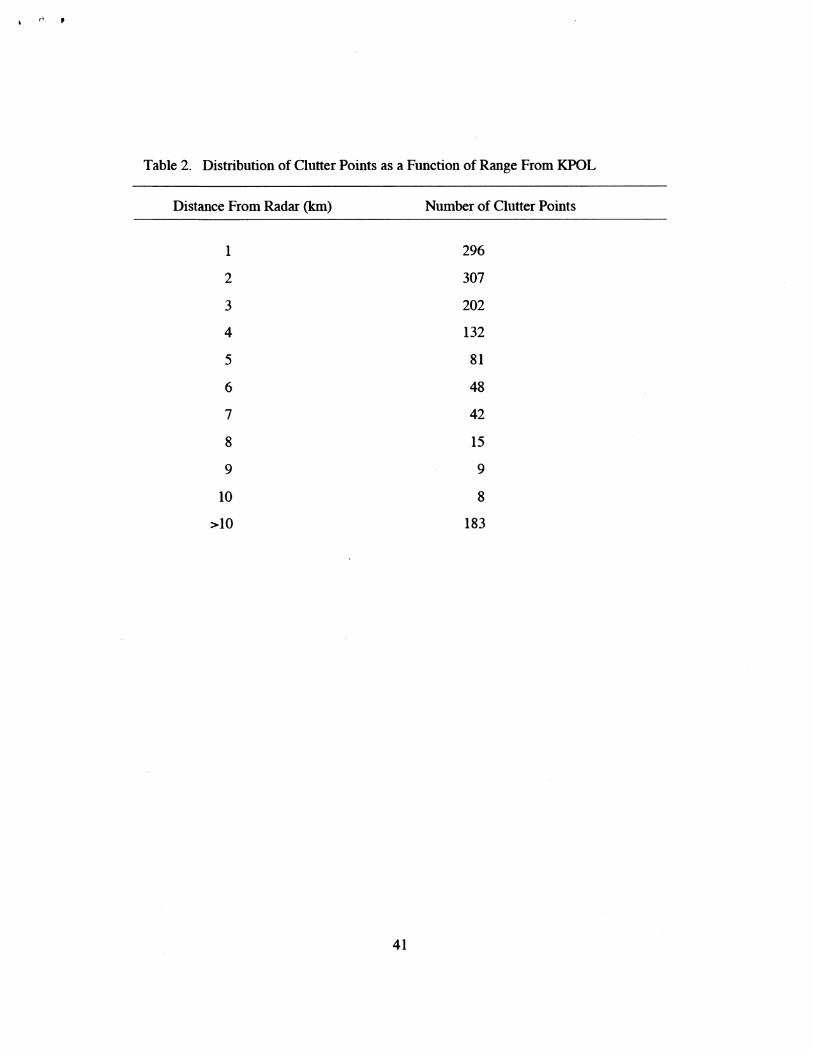
Table 2. Distribution of Clutter Points as a Function of Range From KPOL
Distance From Radar (km) Number of Clutter Points
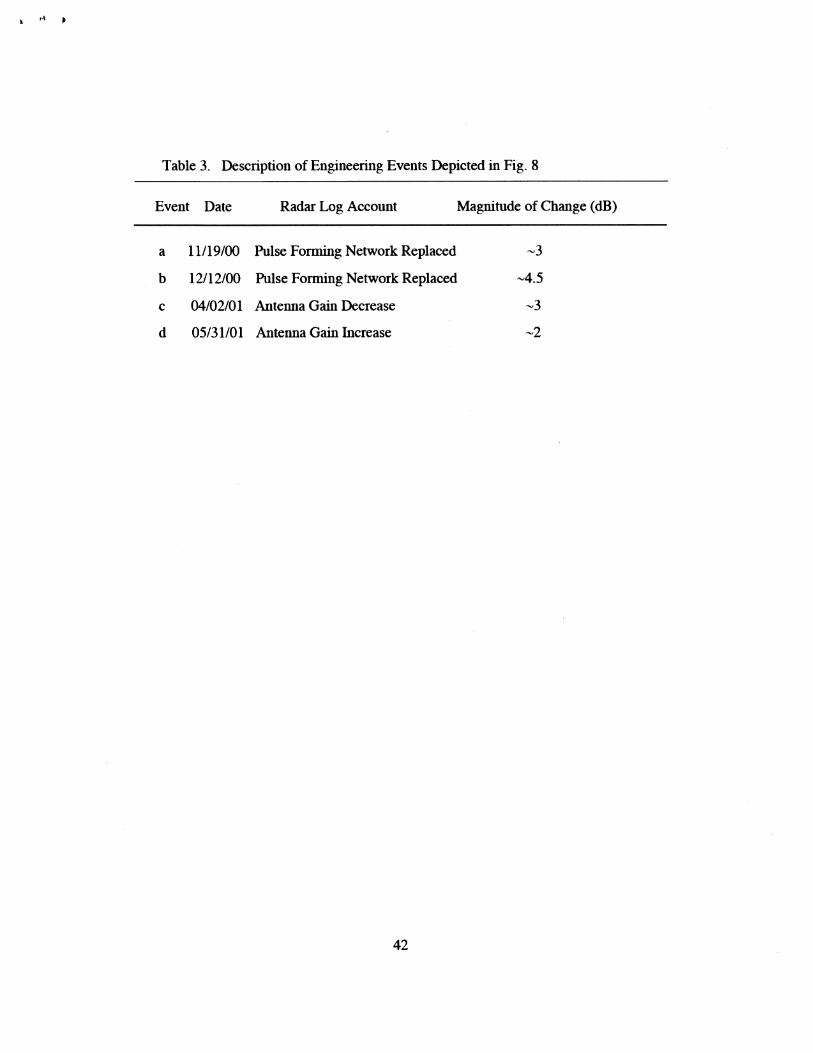
Table 3. Description of Engineering Events Depicted in Fig. 8
Event Date Radar Log Account Magnitude of Change (dB)
a 1 1/19/00 Pulse Forming Network Replaced -3
b 1211 2/00 Pulse Forming Network Replaced -4.5
c 04/02/01 Antenna Gain Decrease -3
d 0513 1 10 1 Antenna Gain Increase -2
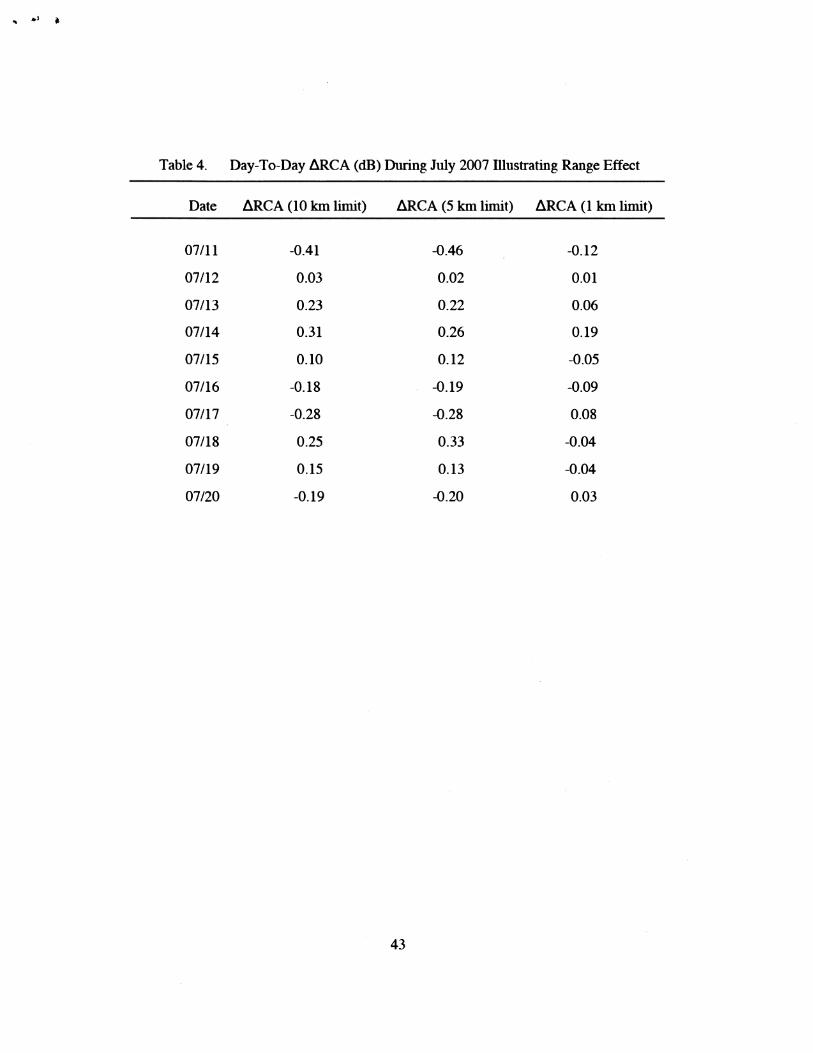
Table 4. Day-To-Day ARCA (dB) Dumg July 2007 Illustrating Range Effect
Date ARCA (10 km limit) ARCA (5 km limit) ARCA (1 km h i t )