
Groove Design and Microstructure Research of Ultra...
9
Modeling and Numerical Simulation of Material Science, 2012, 2, 67-75 http://dx.doi.org/10.4236/mnsms.2012.24008 Published Online October 2012 (http://www.SciRP.org/journal/mnsms) Groove Design and Microstructure Research of Ultra-Fine Grain Bar Rolling * Xuetong Li, Lei Cao, Minting Wang, Fengshan Du College of Mechanical Engineering, National Engineering Research Center for Equipment and Technology of Cold Rolling Strip, Yanshan University, Qinhuangdao, China Email: [email protected] Received August 8, 2012; revised September 10, 2012; accepted September 23, 2012 ABSTRACT New flat-oval groove rolling process of multi-direction deformation is proposed to manufacture ultra-fine grain bar. Application of new groove series can introduce uniform large plastic strain into whole cross section of the material, and meanwhile satisfy the requirements of shape and size. Principle of grain refinement, based on experimental research of small specimen, is that grain refinement of ferrite is mainly dynamic recrystallization when low-carbon alloy steel is at low temperature deformation. Relationship of grain size and z-factor is also obtained through experimental research, as well as ultra-fine ferrite grain less than 1 micron. To predict strain, shape, dimensions and grain size of the material in rolling process, numerical simulation model of the warm groove bar rolling process is established via nonlinear finite element method, and distribution of grain size of the final section is obtained via finite element subroutine. The result indicates that ultra-fine grain bar rolling can accomplish at low temperature region. Keywords: Bar; FEM; Flat-Oval Groove; Large Plastic Strain; Low Temperature; Ultra-Fine Grain 1. Introduction After entering the 21st century, countries in the world begin to concentrate on the study of fine-grain strength- ening, such as “Super Steel” Project in Japan, “High- performance Structural Steel in 21st Century” Project in Korea, and the national 973 project “Major Basic Re- search of New Generation Steel and Iron Materials” and et al. in China [1], which have made great breakthroughs in theory, and achieved a high degree of economic effi- ciency. Research shows that effective ways to manufac- ture ultra-fine grain is to reduce the deformation tem- perature and increase the plastic deformation. At present, it is an effective way to improve product performance obtaining steel of ultra-fine grain organization through control of thermal physical process, which avoids disad- vantages of previous way of improving the properties of steel by adding alloying elements, such as rising costs, increased difficulty in smelting, poor property in welding. Steel of ultra-fine grained microstructures has excellent mechanical properties, such as high strength and good low-temperature impact toughness, which will be widely used as engineering structure materials for the future [2-4]. There are several factors relating to refining of iron and steel material microstructures, among which large strain is necessary condition to produce ultra-fine grain micro- structures. And there have been a number of reports of multi-pass and severe plastic deformation technologies in access to ultra-fine grain, such as equal channel angular pressing method, high pressure torsion method, and ac- cumulative roll bonding method [5-7]. Bar caliber continuous rolling technology is very suit- able for making ultra-fine grain microstructures, because of characteristic of large strain in multi-pass and multi- direction manufacturing. The groove design is the key link in bar production, which directly relates to the ra- tionality of metal deformation and products’ microstruc- tures and properties after rolling. In the present in order to improve the precision and efficiency of groove design, finite element method has been used more and more widely in metal plastic working field, and gradually be- come effective method in the rolling process of scientific prediction, process optimization and quantitative control Xu et al. [8] analysed the rolled piece shape size, tem- perature field, strain field and stress field in the bar roll- ing process on any position and anytime through finite element method, Mei et al. [9] by using finite element method analyzed the temperature distribution between hot strip and roller in different conditions, Wang et al. [10] combined finite element method with physical met- allurgy which not only can predict the temperature, strain and stress distribution, but also can forecast the law of * Item Sponsored by Heibei National Science Foundation of China (E2011203090, E2012203028). Copyright © 2012 SciRes. MNSMS
Transcript of Groove Design and Microstructure Research of Ultra...
Modeling and Numerical Simulation of Material Science 2012 2 67-75 httpdxdoiorg104236mnsms201224008 Published Online October 2012 (httpwwwSciRPorgjournalmnsms)
Groove Design and Microstructure Research of Ultra-Fine Grain Bar Rolling
Xuetong Li Lei Cao Minting Wang Fengshan Du College of Mechanical Engineering National Engineering Research Center for Equipment and Technology of Cold Rolling Strip
Yanshan University Qinhuangdao China Email caoleiysufoxmailcom
Received August 8 2012 revised September 10 2012 accepted September 23 2012
ABSTRACT
New flat-oval groove rolling process of multi-direction deformation is proposed to manufacture ultra-fine grain bar Application of new groove series can introduce uniform large plastic strain into whole cross section of the material and meanwhile satisfy the requirements of shape and size Principle of grain refinement based on experimental research of small specimen is that grain refinement of ferrite is mainly dynamic recrystallization when low-carbon alloy steel is at low temperature deformation Relationship of grain size and z-factor is also obtained through experimental research as well as ultra-fine ferrite grain less than 1 micron To predict strain shape dimensions and grain size of the material in rolling process numerical simulation model of the warm groove bar rolling process is established via nonlinear finite element method and distribution of grain size of the final section is obtained via finite element subroutine The result indicates that ultra-fine grain bar rolling can accomplish at low temperature region Keywords Bar FEM Flat-Oval Groove Large Plastic Strain Low Temperature Ultra-Fine Grain
1 Introduction
After entering the 21st century countries in the world begin to concentrate on the study of fine-grain strength- ening such as ldquoSuper Steelrdquo Project in Japan ldquoHigh- performance Structural Steel in 21st Centuryrdquo Project in Korea and the national 973 project ldquoMajor Basic Re- search of New Generation Steel and Iron Materialsrdquo and et al in China [1] which have made great breakthroughs in theory and achieved a high degree of economic effi- ciency Research shows that effective ways to manufac- ture ultra-fine grain is to reduce the deformation tem- perature and increase the plastic deformation At present it is an effective way to improve product performance obtaining steel of ultra-fine grain organization through control of thermal physical process which avoids disad- vantages of previous way of improving the properties of steel by adding alloying elements such as rising costs increased difficulty in smelting poor property in welding Steel of ultra-fine grained microstructures has excellent mechanical properties such as high strength and good low-temperature impact toughness which will be widely used as engineering structure materials for the future [2-4] There are several factors relating to refining of iron and steel material microstructures among which large strain
is necessary condition to produce ultra-fine grain micro- structures And there have been a number of reports of multi-pass and severe plastic deformation technologies in access to ultra-fine grain such as equal channel angular pressing method high pressure torsion method and ac- cumulative roll bonding method [5-7]
Bar caliber continuous rolling technology is very suit- able for making ultra-fine grain microstructures because of characteristic of large strain in multi-pass and multi- direction manufacturing The groove design is the key link in bar production which directly relates to the ra- tionality of metal deformation and productsrsquo microstruc- tures and properties after rolling In the present in order to improve the precision and efficiency of groove design finite element method has been used more and more widely in metal plastic working field and gradually be- come effective method in the rolling process of scientific prediction process optimization and quantitative control Xu et al [8] analysed the rolled piece shape size tem- perature field strain field and stress field in the bar roll- ing process on any position and anytime through finite element method Mei et al [9] by using finite element method analyzed the temperature distribution between hot strip and roller in different conditions Wang et al [10] combined finite element method with physical met- allurgy which not only can predict the temperature strain and stress distribution but also can forecast the law of
Item Sponsored by Heibei National Science Foundation of China (E2011203090 E2012203028)
Copyright copy 2012 SciRes MNSMS
X T LI ET AL 68
microstructure evolution in the process of metal forming that solved the problems in industrial production Inoue et al [11] used numerical simulation to design groove system to calculate the strain and temperature distribu- tion of bar rolling process and then observed micro- structure by practical rolling which agreed with simula- tion results The trend of new groove and new techno- logy is to get large strain of cross section by technology of improvement and innovation of groove design and realize ultra-fine grain organization especially to design new groove by numerical simulation and test and verify by experiments
In recent years a lot of research work on ultra-fine grain steel bar rolling technology has been carried out [1213] In order to obtain ultra-fine grain steel products added alloying elements and controlled method imple- mentations are used such as mild cooling-controlled process on grain refinement and strength [12] However similarity of these researches is in high temperature aus- tenitic region while there has been rare report of obtain- ing smaller ultra-fine grains products by grain refinement in bar rolling process via warm processing method in ferrite region [14]
Hence this article presents to introduce internal quality factors into the groove design and through experimental study on small specimens the relationship between grain size and processing parameters is obtained And numeri- cal simulation technology is used to guide groove design to utmost meet deformation parameters that obtain ultra- fine grain on condition that the precision criteria are met Based on finite element analysis model of bar continuous rolling warm forming deformation evolution rules of tra- ditional groove and new flat-oval groove in rolling pro- cess are compared to conclude that the new type of flat- oval groove can better introduce large strain into center of the section than the traditional groove and its multi- directional plastic strain value meets conditions of ultra- fine grain
2 Groove Design of Bar Rolling
21 The Finite Element Model of Continuous Rolling
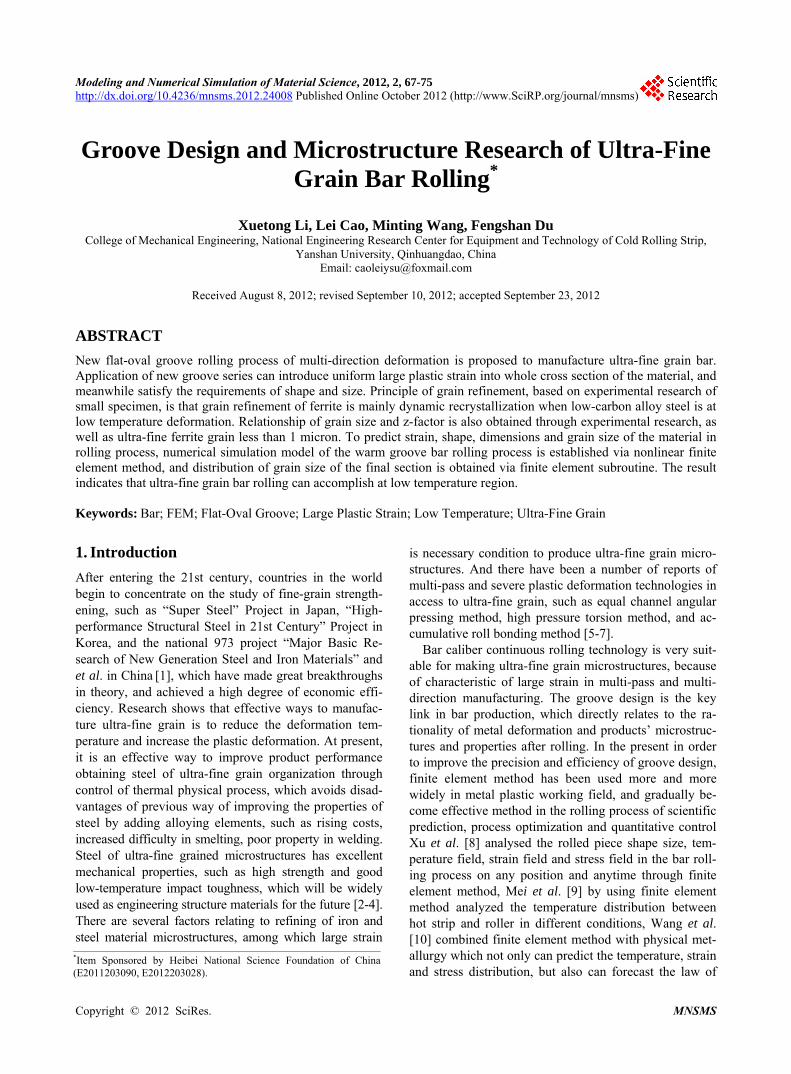
The coupled thermo-mechanical finite element model of multi-passes continuous rolling bar was established based on the platform of Abaqus as shown in Figure 1 where the mill rolls were rigid body and the rolled piece was elastic-plastic deformable body They are meshed using 8-noded hexahedron elements
Because the rolling temperature must be kept ferrite region at low temperature the initial temperature of roll- ed piece was 450˚C The temperature of mill roll was 200˚C and the temperature of air was 30˚C The surface radiation coefficient of rolled piece was 08 Due to a lot
Figure 1 The model of flat-ovalsquare caliber series
of cooling water in the practical rolling process the con- vection heat transfer coefficient was empirically given 40 kWm2˚C The thermal contact conductance coefficient between rolled piece and mill roll was given 10 kWm2˚C The contact friction model obeyed the coulombrsquos law of friction and the friction coefficient was given 03 The rolling velocity was 2500 mms
22 Traditional Groove Discussion and Finite Element Simulation Analysis
Traditional groove design was based on the premise of hot rolling and shape controlling Figure 2 is rhomb square groove system which is used to roll square steel of quadrate section and the direction of arrow is the direc- tion of rolling The initial cross section shape of rolled piece of was quadrate of 24 mm by side and 6 mm by curvature radius In 450˚C and after 8 passes rolling the cross section shape of final rolled piece was 13 mm by side The accumulation of the strain distribution rule was gotten by the finite element simulation and the accumu- lation of strain distribution of final cross section is shown in Figure 3(a)
In addition this paper applies squaresquare groove shape to simulate the rolling process Figure 3(b) is the rolling result of the finite element simulation of square square groove shape system of which the initial condi- tions were the same as rhombsquare groove system Af- ter 7 passes rolling the cross section shape of final piece was quadrate of 13 mm by side In the squaresquare groove system ldquoearsrdquo appeared at the corners of the rolled piece which were affected by the broadsiding conditions In the subsequent rolling the phenomenon of fold easily appeared
The above finite element simulation results show that due to influence by biting conditions and shape control small strain appeared in the centre of rolled piece and large strain appeared on the edge of rolled piece in tradi- tional groove rolling As a result there was restriction to get large plastic strain when making ultra-fine grain bar used traditional groove system
23 The Design of the New Flat-Oval Groove
The flat-ovalsquare groove system proposed in this pa- per which has feature of so great elongation coefficient
Copyright copy 2012 SciRes MNSMS
X T LI ET AL
Copyright copy 2012 SciRes MNSMS
69
Figure 2 Rhomb-square caliber
0 4 8 12 1616
20
24
28
32
Distancemm
Equ
ival
ent s
trai
n
0 4 8 12 1612
16
20
24
28
32
Distancemm
Equ
ival
ent s
trai
n
Figure 3 The final cross section of rolling strain distribution situation (a) rhombsquare caliber and (b) squaresquare caliber
that can reduce the number of rolling passes Meanwhile in the rolling process the rhomb edge and side edge con- verted with each other which made the effect multi-direc- tion processing more apparent than rhombsquare groove system The rolled piece was first rolled by flat-oval groove and then by square groove which can achieve multi-direction and not simultaneously process and more effectively import large plastic strain into centre of mate- rials
In order to roll the square steel with the initial cross section shape of side of 24 mm the curvature radius of 6 mm to square steel with final cross section shape of side of 18 mm through two passes of flat-ovalsquare groove system this paper designed three kinds of flat-oval square groove system the height of the flat-oval grooves were 8 mm 12 mm 16 mm respectively the widths were the same and the square grooves were all the same in shape The rolling process of three grooves system was simulated using finite element method and the accumu- lation of strain distribution is shown in Figure 4 In the graph the arrow direction is the rolling direction
From the strain distribution in Figure 4 it can be clearly seen that when the flat-oval groove height (H) was 8 mm the entire section introduced the largest de- formation among three grooves system because of big rolling reduction When the rolled piece went through the second pass of square groove due to the influence of the pattern of metal plastic flow the groove cannot be totally filled and the strain cannot reach the centre of rolled piece When the flat-oval groove height (H) was 12 mm the cross section was smaller after the first rolling pass but after the second square groove the largest stain in the centre of rolled piece and the groove can be totally filled When the flat-oval groove height (H) was 16 mm due to
duced small strain After the second rolling pass the
small rolling reduction the whole cross section intro
lement si
3 Experimental Study on Microstructure
s article is based on ex-
is 0 - 4 and in the same specimen microstructure and
strain cannot reach the centre of rolled piece and fullness degree of the rolled piece was large ldquoEarsrdquo appeared in the roll gap which was not beneficial to next rolling Therefore the flat-oval groove height (H) of 12 mm not only realized the cross section centre to get large strain but also guaranteed the rolled piece to totally filled of groove and realized to control the shape and size
Based on the result of several times of finite emulations the author proposed new groove system of
getting large strain as shown in Figure 5 The blank of square steel with side of 24 mm flipped 90˚ after first of flat-oval groove passed into the second pass of square groove with side of 18 mm then flipped 45˚ passed into the third pass of flat-oval groove then flipped 90˚ passed into the fourth pass of square groove with side of 13 mm and then flipped 45˚ passed into the fifth pass of preci- sion rolling of flat-oval groove and finally flipped 90˚ passed into the round groove to finish the bar rolling
31 Experimental Method
Study on micro-structure in thiperimental study on small specimen using low-tem- perature single-pass large-strain plane-strain compression experiment Figure 6 is a diagram of plane strain com- pression experiment Compared with cylindrical com- pression experiment it allows importing greater strain into materials and there is no ldquobulgingrdquo issue with more accurate and convenient determination of the stress-strain curve In the experiment of plane strain compression the resulting strain concentrates at the fixed end strain varia- tion range from compressed surface to the fixed surface
X T LI ET AL 70
Figure 4 The shape of three calibers and strain distribution situation
Figure 5 The new grooves of bar rolling
Figure 6 Schematic plot of plane strain compression
grain size under different strains cMaterials used in this experiment are part cutting from
sition (m
Quenching treatment is immediately after compression
en is cut in the compression di- rection Cross-section after compression is drawn with a
en This compres- that distribution of com- strain is concentrated at
an be observed and deformation specim
Q345 hot-rolled steel plate chemical compoass) is C 016 Si 03 Mn 15 P 0016 S 0004
Three dimensions after machining are namely length 20 mmtimeswidth 10 mmtimesheight 10 mm direction of compres- sion is perpendicular to the rolling direction and through thermal simulation testing machine the temperature strain and strain rate of the specimen can be controlled Figure 7 is schematic of hot working technology speci- men is heated to the deformation temperature range of 700˚C - 500˚C below the Ac1 by 10˚Cs by means of thermal resistance to make specimen heated evenly it is insulated 3min in this temperature and then unidirec- tional compressed where strain rates are 1 sndash1 01 sndash1 001 sminus1 respectively reduction is 80 and corresponded deformation time are 161 s 161 s 161 s respectively
dotted line in Figure 6 corrosion with nitric acid alcohol after mechanical polishing and structure observation on the scanning electron microscope
32 Result and Discussion
In order to obtain the relationship between microstructure and deformation parameters first is to clarify the distri- bution of internal strain in the specimsion method research indicatespressive stress and compressivethe bottom of the specimen that is the side without de- formation and that distribution of strain in the specimen is continuous Finite element method is used in this arti- cle for numerical simulation of the compression process and Figure 8 is the result of finite element simulation
Copyright copy 2012 SciRes MNSMS
X T LI ET AL 71
Figure 7 Schematic of hot working
Figure 8 Simulation result of single direction compression
which mainly studies the distribution of strain From the result of the simulation there is rigid zone where the indenter and specimen contact so strain is very little as
larg
ness direction of observation area under temperature of
pressed surface to the bottom which indicates that th
finite element simulation results become 4 ar
le st
for large am
an provide more nucleation of recrystallization lo
rocess and can be expressed as
blue area indicated by the arrow in the picture while e strain mainly distribut th sides and the bottomes bo
of rigid zone Along the compression direction strain becomes gradient distribution with variation range of 0 - 4
Figure 9 is scanning electron micrograph along thick-
600˚C and strain rate of 01 sndash1 region of deformation belt is the region in red box in Figure 8 From the picture we can know that the deformation belt tapers from the com
e large deformation occurs at the bottom while large strain concentrates at the bottom The same results were obtained via the same observation of the specimen under other deformation condition This is the same result with finite element simulation so it is reliable of numerical distribution of plastic strain obtained by finite element simulation
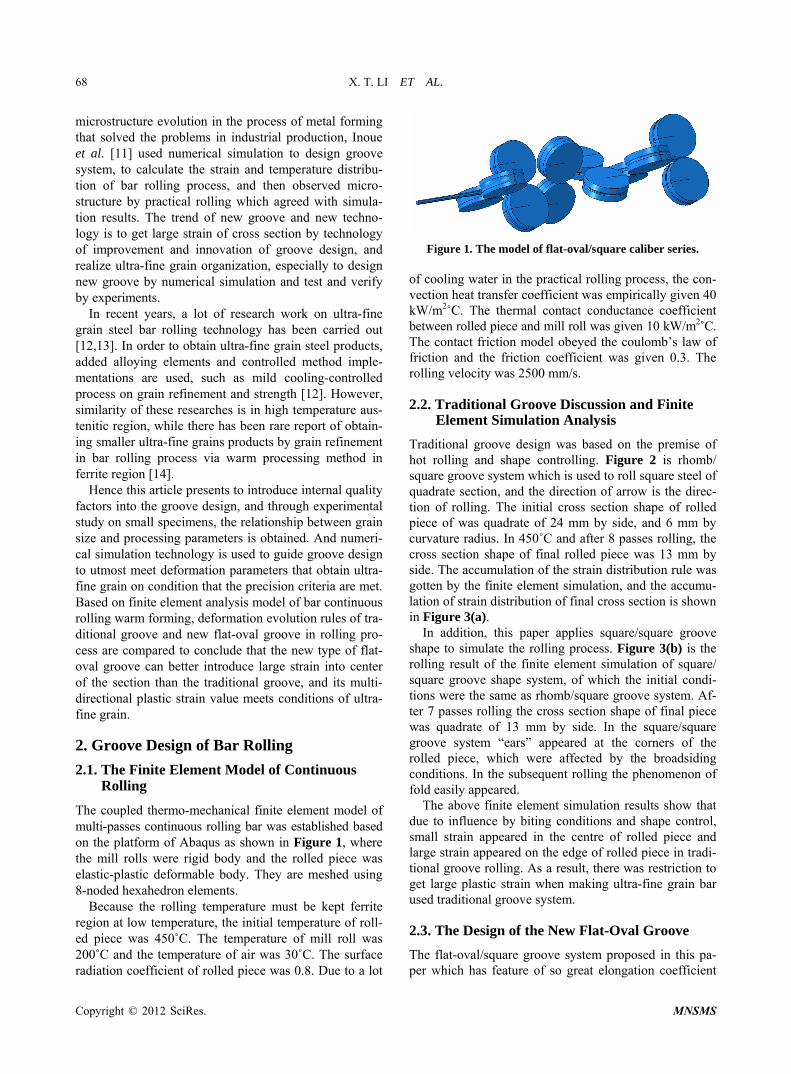
Initial microstructure is the layer laminated structure of distribution of ferrite and pearlite as shown in Figure 10 content of pearlite is relatively little initial grain size of ferrite is 20 microns and it is equiaxed distribution
Figure 11 shows that under different deformation conditions
eas and microstructures obtained by scanning electron microscope Pronounced equiaxed grains can be seen from every figure which indicates that ferrite grain fi- nally formed under these conditions has been in a stab
ate and is basically equiaxed grain after quenching Ferrite grain can be very small by observation and the smallest grain size is hundreds of nanometers
Figures 11(a) and (b) are in conditions of 600˚C and strain rate of 01 sndash1 and 001 sndash1 respectively Through observation of grain size in the picture it is apparent that grain size is smaller than that in strain rate of 001 sndash1 after compression in strain rate of 01 sndash1 Because under large strain rate it is more prone to appear
ount of strain belts under large strain rate and defect such as twinning and dislocations which provide energy and location for nucleation increase the nucleation rate and lead to grain refinement Under condition of 600˚C grain size is less than 1 micron at strain rate of 01 sndash1 and 001 sndash1
Figures 11(a) and (c) are compression in strain rate of 01 sndash1 and temperature of 600˚C and 650˚C respectively Grain size at temperature of 600˚C is apparently less than grain size at 650˚C and lower temperatures lead to smaller grain size Because the deformation at low tem- perature c
cations as well as higher rate of nucleation and low temperature can effectively reduce growth speed of grain Under the condition of 650˚C average grain size is around 1 micron
In order to illustrate the relationships between grain size and parameters of processing process the processing parameter Z is introduced which is an important pa- rameter that comprehensively describes deformation tem- perature strain and effects of strain rate on deformation characteristics in p
Z exp Q RT (1)
Copyright copy 2012 SciRes MNSMS
X T LI ET AL
Copyright copy 2012 SciRes MNSMS
72
Figure 9 The distribution of deformation band
(a)
Figure 10 Initial microstructure
where is strain rate Q is surface deformation activa- tion energy dition Q = 254 kJmol) R is gas const T is a deformation tem-
e
the grain size after recrystallization is taken av
ant Average grain sizes of several
ferent conditions of temperature anZ-value is calculated under
co
relationship between dynamic re- crystallization grain size and Z valu
Judging from the relationship betZ
nder large strain la
(independent from the stress conant
peraturIn dynamic recrystallization process each grain is at
different stages of recrystallization so grain size is dif- ferent and
erage grain size Its average grain size is related to d and Z values it can be determined according to the fol- lowing relationship
ndashmd A Z (2)
where A m are const(b)
specimens under dif- d strain rate are mea-
sured in this article while rresponding conditions according to the iterative ana-
lysis in Formula (2) relationship between grain size and Z value is as follows
01d 20 Z (3)
Figure 12 is curve es ween grain size d and
value grain size gradually decreases as the Z value increases At low temperature and u
rge strain rate is needed to access small grain size however when the Z value increases to a certain extent it is not obvious that grain size decreases as the Z value increases From the perspective of manufacturing ul- tra-fine grain Figure 12 also has a certain engineering
(c)
Figure 11 The final grain size under different deformation conditions (a) T = 600˚C (b) T = 600˚C (c) T = 650˚C
= 01ε = 01ε = 01ε
X T LI ET AL 73
Figure 12 The relationship between grain size and Z factor
value at th e o
e tim f metal plastic processing such as- rolling forging important deformation and machining parameters such as strain strain rate and temperature can be obtained though certain grain size in metal pro- cessing Desired grain size can be achieved by control- ling these parameters If grain of 1 micron is needed in the engineering application the desired Z-value can be obtained to be 217 times 1013 through Figure 12
Relationship between the deformation par ameter can be obtained by Equation (1) according to the require- ments of the designers the control of grain size can be ultimately realized by controlling deformation process pa- rameters such as strain strain rate and temperature
4 Finite Element Simulation Results
87 195 2
dia- s smaller oove gets
bu- eart
ield(nblocknfieldv) character80 cmname
41 Shape and Size Strain and Temperature Simulation Results of Bar Rolling
According to new flat-oval-square groove in the earlier design using simulation of rolling process by finite ele- ment software the cross section shape and strain distri- bution after each pass rolling of flat-oval groove are shown in Figure 13 where the equivalent plastic strain curves were distribution of rolled piece section of arrow position from left to right The centre equivalent plastic strain of these rolled piece cross sections were 0
90 420 475 525 respectively These cross sections strain distribution cloud pictures show that the strain was gradually introduced into the inside cross section and the largest accumulation of strain was more than 50 Strain value at the center of section in the traditional mond-square groove and square-section rolling iand large on the boundary and new flat-oval grlarge strain in the center and gradient of strain distrition changes small And large plastic strain in the hhelps control heart defect which leads to efficient com- paction in the center
To make the ultra-fine grain bar not only the strain should be considered but also the temperature change of rolling process Generally speaking in the process of rolling temperature changes were caused by three aspects 1) Plastic work generated heat during the rolled piece deformation 2) Frictional heat generated between rolled piece and mill roll 3) Rolled piece had heat transfer it- self including contact heat transfer between rolled piece and mill roll rolled piece of radiation and convection heat transfer Compared with plate rolling result in the temperature was hard to predict in bar rolling because the rolled piece deformation was not uniform which was influenced by the groove Therefore it was necessary to compare the numerical simulations and experiments and then repeatedly revised the parameters of model Figure 14 shows the rolled piece surface temperature distribu- tion of each pass after rolling
From temperature change of exit of the groove system workpiece there is little difference between temperature changes of each pass temperature rises of workpiece during the previous four times are large because large deformation leads to high heat by plastic work The latter two passes are mainly control of the shape and size of workpiece the deformation is relatively small so the temperature is lower than the first few passes
42 Prediction Simulation of Microstructure
Microstructure prediction method used here is VUSD- FLD subroutine of ABAQUS which is open program interface ABAQUS provided for users new output vari- able that user definite under dynamic conditions at the material point and user writes subroutine to implement the required functions Generally FORTRAN language is used as its compile language Its code interface is
subroutine vusdfld( c Read only variables - 1 nblock nstatev nfieldv nprops ndir nshr 2 jElem kIntPt kLayer kSecPt 3 stepTime totalTime dt cmname 4 coordMp direct T charLength props 5 stateOld c Write only variables - 6 stateNew field ) c include vaba_paraminc c dimension jElem(nblock) coordMp(nblock) 1 direct(nblock33) T(nblock33) 2 charLength(nblock)
props(nprops) 3 stateOld(nblocknstatev) 4 stateNew(nblocknstatev) 5 f
Copyright copy 2012 SciRes MNSMS
X T LI ET AL
Copyright copy 2012 SciRes MNSMS
74
axblknrData) rData(maxblknrData)
jD
100 continue
grain size is mainly based on experi- m hrough rel rameter fr od for pro- ce the analysis result of ABAQUS with calculation formula of grain size its pro- gr
gr nd its forecast form is shown in Figure 15
5
e all section obtained bigger strain between grain size and value of Z
c am of system ac Local arrays from vgetvrm are dimensioned to c maximum block size (maxblk) Above cloud of grain forecast indicates that ultra-fine
grain has been introduced to the entire section eventually and grain sizes are all smaller than 1 micron The Figure shows grain size in the center of the bar is larger than grain size around because in the rolling process the strain in the center is large the temperature is high caused by more plastic work heat which matches the
c parameter( nrData=6 ) character3 cData(m dimension ata(maxblknrData) c do 100 k = 1 nblock actual situation c Conclusions
1) The bar continuous rolling process of thermo-me- chanical coupling model was established through finite element method The law of strain distribution of tradi- tional and new flat-oval groove system on the cross sec-
return end Simulation of ental research of micro-structure of specimen tationship of grain size and deformation pa
tion in bar rolling contrastively was analyzed and the new flat-oval groove can better introduce strain into core at the same time th
om Equation (3) it can be simply understoss of calculation combined
2) Relationship am is written by FORTRAN language in interface pro-
0 2 4 6 8 10 12068
072
076
080
088
084
Distancemm
Equ
ival
ent s
trai
n
0 5 10 15 20 2510
Distancemm
12
14
16
18
20
Equ
ival
ent s
trai
n
(a) (b)
0 2 4 6 8 1025
30
35
40
45
50
Equ
ival
ent s
trai
n
Distancemm
0 4 8 1224
28
32
36
40
44
Distancemm
Equ
ival
ent s
trai
n
(c) (d)
0 2 4 6 8 1025
30
35
40
45
50
Distancemm
Equ
ival
ent s
trai
n
0 3 6 9 12243036424854
Distancemm
Equ
ival
ent s
trai
n
(e) (f)
Figure 13 Strain distribution at each pass using the flat-oval passes (a) First pass (b) Second pass (c) Third pass (d) Fourth pass (e) Fifth pass (f) Sixth pass
X T LI ET AL 75
Deformation and Annealingrdquo Acta Materialia Vol 53 No 18 2005 pp 4881-4892 doi101016jactamat200507009
1 2 3 4 5 6300330360390420450480510
Exi
t te
mpe
ratu
re
[5] R Rodriacuteguez-Baracaldoa R Tejedord J A Benito J M Cabrera and J M Prado ldquoMicrostructural Evolution and Mechanical Response of Nanocrystalline and Ultrafine- Grained Steel Obtained by Mechanical Millingrdquo Mate- rials Science and Engineering A Vol 493 No 1-2 2008 pp 215-220 doi101016jmsea200708087
u Ma and Guocheng Ren
ed Materialsrdquo Journal of Materials Processing Techno-
Every pass
Figure 14 Temperature at exit of each pass
Figure 15 The clou of grain forecast d
(processing parameter) was obtained based on study ongrain refinement of a small sample which substitutedinto finite element model through subroutine to comand finally forecasted the grain size distribution of cross section after rolling That makes the production of ul-tra-fine grain bar possible in the future
REFERENCES [1] T Shinokura and K Takai ldquoMathematical Models of
Roll The Iron and Steel Institute of Japan Vol 72 No 14 1986 pp
pute
Force and Torque in Steel Bar Rollingrdquo
1870-1876
[2] Y Okitsu N Takata and N Tsuji ldquoA New Route to Fab- ricate Ultrafine-Grained Structures in Carbon Steels with- out Severe Plastic Deformationrdquo Scripta Materialia Vol 60 No 2 2009 pp 76-79 doi101016jscriptamat200809002
[3] T Inoue F Yin and Y Kimura ldquoStrain Distribution andMicrostructural Evolution in Multi-Pass Warm CaliberRollingrdquo Mate ering A Vol 466 No 1-2 2007
rials Science and Engine pp 114-122
doi101016jmsea200702098
[4] R Song D Ponge and D Raabe ldquoMechanical Properties of an Ultrafine Grained C-Mn Steel Processed by Warm
[6] Shubo Xu Guoqun Zhao XinwldquoFinite Element Analysis and Optimization of Equal Channel Angular Pressing for Producing Ultra-Fine Grain-
logy Vol 184 No 1-3 2007 pp 209-216 doi101016jjmatprotec200611025
[7] N Tsuji Y Saito H Utsunomiytra-Fine Grained Bulk Steel Pro
a and S Tanigawa ldquoUl- duced by Accumulative
Roll-Bonding (ARB) Processrdquo Scripta Materialia Vol 40 No 7 1999 pp 795-800 doi101016S1359-6462(99)00015-9
[8] C G Xu G H Liu G S Ren Z SW Ren ldquoFinite Element Analysis
hen C P Ma and W of Axial Feed Bar
Rollingrdquo Acta Metallurgica Sinica (English Letters) Vol 20 No 6 2007 pp 463-468 doi101016S1006-7191(08)60011-3
[9] R B Mei C S Li X H Liu and B Han ldquoAnalysis of Strip Temperature in Hot Rolling Process by Finite Ele- ment Methodrdquo Journal of Iron and Steel Research In- ternational Vol 17 No 2 2010 pp 17-21 doi101016S1006-706X(10)60052-0
[10] M T Wang X L Zhang and X T Li and F S Du ldquoFi- nite Element Simulation of Hot Strip Continuous Rolling Process Coupling Microstructural EvolutionIron and Steel Research Internationa
rdquo Journal of l Vol 14 No 3
2007 pp 30-36 doi101016S1006-706X(07)60039-9
[11] C G Xu G H Liu G S Ren Z Shen C P Ma and W W Ren ldquoFinite Element Analysis of Axial Feed Bar Rollingrdquo Acta Metallurgica Sinica Vpp 463-468
ol 20 No 6 2007 08)60011-3doi101016S1006-7191(
d S C Feng ldquoKey
Vol 65 No
[12] G D Wang D Wu Z Y Liu and Z D Wang ldquoPresent Status and Prospect of Steel Rolling Technology in Chinardquo China Metallurgy Vol 19 No 12 2009 pp 1-13
[13] X L Pan Y H Wang H Z Liang anTechnology of Ultrafine Grain Steelrdquo World Iron amp Steel Vol 11 No 4 2011 pp 31-36
[14] K Hase and N Tsuji ldquoEffect of Initial Microstructure on Ultrafine Grain Formation through Warm Deformation in Medium-Carbon Steelsrdquo Scripta Materialia5 2011 pp 404-407 doi101016jscriptamat201105018
Copyright copy 2012 SciRes MNSMS
X T LI ET AL 68
microstructure evolution in the process of metal forming that solved the problems in industrial production Inoue et al [11] used numerical simulation to design groove system to calculate the strain and temperature distribu- tion of bar rolling process and then observed micro- structure by practical rolling which agreed with simula- tion results The trend of new groove and new techno- logy is to get large strain of cross section by technology of improvement and innovation of groove design and realize ultra-fine grain organization especially to design new groove by numerical simulation and test and verify by experiments
In recent years a lot of research work on ultra-fine grain steel bar rolling technology has been carried out [1213] In order to obtain ultra-fine grain steel products added alloying elements and controlled method imple- mentations are used such as mild cooling-controlled process on grain refinement and strength [12] However similarity of these researches is in high temperature aus- tenitic region while there has been rare report of obtain- ing smaller ultra-fine grains products by grain refinement in bar rolling process via warm processing method in ferrite region [14]
Hence this article presents to introduce internal quality factors into the groove design and through experimental study on small specimens the relationship between grain size and processing parameters is obtained And numeri- cal simulation technology is used to guide groove design to utmost meet deformation parameters that obtain ultra- fine grain on condition that the precision criteria are met Based on finite element analysis model of bar continuous rolling warm forming deformation evolution rules of tra- ditional groove and new flat-oval groove in rolling pro- cess are compared to conclude that the new type of flat- oval groove can better introduce large strain into center of the section than the traditional groove and its multi- directional plastic strain value meets conditions of ultra- fine grain
2 Groove Design of Bar Rolling
21 The Finite Element Model of Continuous Rolling
The coupled thermo-mechanical finite element model of multi-passes continuous rolling bar was established based on the platform of Abaqus as shown in Figure 1 where the mill rolls were rigid body and the rolled piece was elastic-plastic deformable body They are meshed using 8-noded hexahedron elements
Because the rolling temperature must be kept ferrite region at low temperature the initial temperature of roll- ed piece was 450˚C The temperature of mill roll was 200˚C and the temperature of air was 30˚C The surface radiation coefficient of rolled piece was 08 Due to a lot
Figure 1 The model of flat-ovalsquare caliber series
of cooling water in the practical rolling process the con- vection heat transfer coefficient was empirically given 40 kWm2˚C The thermal contact conductance coefficient between rolled piece and mill roll was given 10 kWm2˚C The contact friction model obeyed the coulombrsquos law of friction and the friction coefficient was given 03 The rolling velocity was 2500 mms
22 Traditional Groove Discussion and Finite Element Simulation Analysis
Traditional groove design was based on the premise of hot rolling and shape controlling Figure 2 is rhomb square groove system which is used to roll square steel of quadrate section and the direction of arrow is the direc- tion of rolling The initial cross section shape of rolled piece of was quadrate of 24 mm by side and 6 mm by curvature radius In 450˚C and after 8 passes rolling the cross section shape of final rolled piece was 13 mm by side The accumulation of the strain distribution rule was gotten by the finite element simulation and the accumu- lation of strain distribution of final cross section is shown in Figure 3(a)
In addition this paper applies squaresquare groove shape to simulate the rolling process Figure 3(b) is the rolling result of the finite element simulation of square square groove shape system of which the initial condi- tions were the same as rhombsquare groove system Af- ter 7 passes rolling the cross section shape of final piece was quadrate of 13 mm by side In the squaresquare groove system ldquoearsrdquo appeared at the corners of the rolled piece which were affected by the broadsiding conditions In the subsequent rolling the phenomenon of fold easily appeared
The above finite element simulation results show that due to influence by biting conditions and shape control small strain appeared in the centre of rolled piece and large strain appeared on the edge of rolled piece in tradi- tional groove rolling As a result there was restriction to get large plastic strain when making ultra-fine grain bar used traditional groove system
23 The Design of the New Flat-Oval Groove
The flat-ovalsquare groove system proposed in this pa- per which has feature of so great elongation coefficient
Copyright copy 2012 SciRes MNSMS
X T LI ET AL
Copyright copy 2012 SciRes MNSMS
69
Figure 2 Rhomb-square caliber
0 4 8 12 1616
20
24
28
32
Distancemm
Equ
ival
ent s
trai
n
0 4 8 12 1612
16
20
24
28
32
Distancemm
Equ
ival
ent s
trai
n
Figure 3 The final cross section of rolling strain distribution situation (a) rhombsquare caliber and (b) squaresquare caliber
that can reduce the number of rolling passes Meanwhile in the rolling process the rhomb edge and side edge con- verted with each other which made the effect multi-direc- tion processing more apparent than rhombsquare groove system The rolled piece was first rolled by flat-oval groove and then by square groove which can achieve multi-direction and not simultaneously process and more effectively import large plastic strain into centre of mate- rials
In order to roll the square steel with the initial cross section shape of side of 24 mm the curvature radius of 6 mm to square steel with final cross section shape of side of 18 mm through two passes of flat-ovalsquare groove system this paper designed three kinds of flat-oval square groove system the height of the flat-oval grooves were 8 mm 12 mm 16 mm respectively the widths were the same and the square grooves were all the same in shape The rolling process of three grooves system was simulated using finite element method and the accumu- lation of strain distribution is shown in Figure 4 In the graph the arrow direction is the rolling direction
From the strain distribution in Figure 4 it can be clearly seen that when the flat-oval groove height (H) was 8 mm the entire section introduced the largest de- formation among three grooves system because of big rolling reduction When the rolled piece went through the second pass of square groove due to the influence of the pattern of metal plastic flow the groove cannot be totally filled and the strain cannot reach the centre of rolled piece When the flat-oval groove height (H) was 12 mm the cross section was smaller after the first rolling pass but after the second square groove the largest stain in the centre of rolled piece and the groove can be totally filled When the flat-oval groove height (H) was 16 mm due to
duced small strain After the second rolling pass the
small rolling reduction the whole cross section intro
lement si
3 Experimental Study on Microstructure
s article is based on ex-
is 0 - 4 and in the same specimen microstructure and
strain cannot reach the centre of rolled piece and fullness degree of the rolled piece was large ldquoEarsrdquo appeared in the roll gap which was not beneficial to next rolling Therefore the flat-oval groove height (H) of 12 mm not only realized the cross section centre to get large strain but also guaranteed the rolled piece to totally filled of groove and realized to control the shape and size
Based on the result of several times of finite emulations the author proposed new groove system of
getting large strain as shown in Figure 5 The blank of square steel with side of 24 mm flipped 90˚ after first of flat-oval groove passed into the second pass of square groove with side of 18 mm then flipped 45˚ passed into the third pass of flat-oval groove then flipped 90˚ passed into the fourth pass of square groove with side of 13 mm and then flipped 45˚ passed into the fifth pass of preci- sion rolling of flat-oval groove and finally flipped 90˚ passed into the round groove to finish the bar rolling
31 Experimental Method
Study on micro-structure in thiperimental study on small specimen using low-tem- perature single-pass large-strain plane-strain compression experiment Figure 6 is a diagram of plane strain com- pression experiment Compared with cylindrical com- pression experiment it allows importing greater strain into materials and there is no ldquobulgingrdquo issue with more accurate and convenient determination of the stress-strain curve In the experiment of plane strain compression the resulting strain concentrates at the fixed end strain varia- tion range from compressed surface to the fixed surface
X T LI ET AL 70
Figure 4 The shape of three calibers and strain distribution situation
Figure 5 The new grooves of bar rolling
Figure 6 Schematic plot of plane strain compression
grain size under different strains cMaterials used in this experiment are part cutting from
sition (m
Quenching treatment is immediately after compression
en is cut in the compression di- rection Cross-section after compression is drawn with a
en This compres- that distribution of com- strain is concentrated at
an be observed and deformation specim
Q345 hot-rolled steel plate chemical compoass) is C 016 Si 03 Mn 15 P 0016 S 0004
Three dimensions after machining are namely length 20 mmtimeswidth 10 mmtimesheight 10 mm direction of compres- sion is perpendicular to the rolling direction and through thermal simulation testing machine the temperature strain and strain rate of the specimen can be controlled Figure 7 is schematic of hot working technology speci- men is heated to the deformation temperature range of 700˚C - 500˚C below the Ac1 by 10˚Cs by means of thermal resistance to make specimen heated evenly it is insulated 3min in this temperature and then unidirec- tional compressed where strain rates are 1 sndash1 01 sndash1 001 sminus1 respectively reduction is 80 and corresponded deformation time are 161 s 161 s 161 s respectively
dotted line in Figure 6 corrosion with nitric acid alcohol after mechanical polishing and structure observation on the scanning electron microscope
32 Result and Discussion
In order to obtain the relationship between microstructure and deformation parameters first is to clarify the distri- bution of internal strain in the specimsion method research indicatespressive stress and compressivethe bottom of the specimen that is the side without de- formation and that distribution of strain in the specimen is continuous Finite element method is used in this arti- cle for numerical simulation of the compression process and Figure 8 is the result of finite element simulation
Copyright copy 2012 SciRes MNSMS
X T LI ET AL 71
Figure 7 Schematic of hot working
Figure 8 Simulation result of single direction compression
which mainly studies the distribution of strain From the result of the simulation there is rigid zone where the indenter and specimen contact so strain is very little as
larg
ness direction of observation area under temperature of
pressed surface to the bottom which indicates that th
finite element simulation results become 4 ar
le st
for large am
an provide more nucleation of recrystallization lo
rocess and can be expressed as
blue area indicated by the arrow in the picture while e strain mainly distribut th sides and the bottomes bo
of rigid zone Along the compression direction strain becomes gradient distribution with variation range of 0 - 4
Figure 9 is scanning electron micrograph along thick-
600˚C and strain rate of 01 sndash1 region of deformation belt is the region in red box in Figure 8 From the picture we can know that the deformation belt tapers from the com
e large deformation occurs at the bottom while large strain concentrates at the bottom The same results were obtained via the same observation of the specimen under other deformation condition This is the same result with finite element simulation so it is reliable of numerical distribution of plastic strain obtained by finite element simulation
Initial microstructure is the layer laminated structure of distribution of ferrite and pearlite as shown in Figure 10 content of pearlite is relatively little initial grain size of ferrite is 20 microns and it is equiaxed distribution
Figure 11 shows that under different deformation conditions
eas and microstructures obtained by scanning electron microscope Pronounced equiaxed grains can be seen from every figure which indicates that ferrite grain fi- nally formed under these conditions has been in a stab
ate and is basically equiaxed grain after quenching Ferrite grain can be very small by observation and the smallest grain size is hundreds of nanometers
Figures 11(a) and (b) are in conditions of 600˚C and strain rate of 01 sndash1 and 001 sndash1 respectively Through observation of grain size in the picture it is apparent that grain size is smaller than that in strain rate of 001 sndash1 after compression in strain rate of 01 sndash1 Because under large strain rate it is more prone to appear
ount of strain belts under large strain rate and defect such as twinning and dislocations which provide energy and location for nucleation increase the nucleation rate and lead to grain refinement Under condition of 600˚C grain size is less than 1 micron at strain rate of 01 sndash1 and 001 sndash1
Figures 11(a) and (c) are compression in strain rate of 01 sndash1 and temperature of 600˚C and 650˚C respectively Grain size at temperature of 600˚C is apparently less than grain size at 650˚C and lower temperatures lead to smaller grain size Because the deformation at low tem- perature c
cations as well as higher rate of nucleation and low temperature can effectively reduce growth speed of grain Under the condition of 650˚C average grain size is around 1 micron
In order to illustrate the relationships between grain size and parameters of processing process the processing parameter Z is introduced which is an important pa- rameter that comprehensively describes deformation tem- perature strain and effects of strain rate on deformation characteristics in p
Z exp Q RT (1)
Copyright copy 2012 SciRes MNSMS
X T LI ET AL
Copyright copy 2012 SciRes MNSMS
72
Figure 9 The distribution of deformation band
(a)
Figure 10 Initial microstructure
where is strain rate Q is surface deformation activa- tion energy dition Q = 254 kJmol) R is gas const T is a deformation tem-
e
the grain size after recrystallization is taken av
ant Average grain sizes of several
ferent conditions of temperature anZ-value is calculated under
co
relationship between dynamic re- crystallization grain size and Z valu
Judging from the relationship betZ
nder large strain la
(independent from the stress conant
peraturIn dynamic recrystallization process each grain is at
different stages of recrystallization so grain size is dif- ferent and
erage grain size Its average grain size is related to d and Z values it can be determined according to the fol- lowing relationship
ndashmd A Z (2)
where A m are const(b)
specimens under dif- d strain rate are mea-
sured in this article while rresponding conditions according to the iterative ana-
lysis in Formula (2) relationship between grain size and Z value is as follows
01d 20 Z (3)
Figure 12 is curve es ween grain size d and
value grain size gradually decreases as the Z value increases At low temperature and u
rge strain rate is needed to access small grain size however when the Z value increases to a certain extent it is not obvious that grain size decreases as the Z value increases From the perspective of manufacturing ul- tra-fine grain Figure 12 also has a certain engineering
(c)
Figure 11 The final grain size under different deformation conditions (a) T = 600˚C (b) T = 600˚C (c) T = 650˚C
= 01ε = 01ε = 01ε
X T LI ET AL 73
Figure 12 The relationship between grain size and Z factor
value at th e o
e tim f metal plastic processing such as- rolling forging important deformation and machining parameters such as strain strain rate and temperature can be obtained though certain grain size in metal pro- cessing Desired grain size can be achieved by control- ling these parameters If grain of 1 micron is needed in the engineering application the desired Z-value can be obtained to be 217 times 1013 through Figure 12
Relationship between the deformation par ameter can be obtained by Equation (1) according to the require- ments of the designers the control of grain size can be ultimately realized by controlling deformation process pa- rameters such as strain strain rate and temperature
4 Finite Element Simulation Results
87 195 2
dia- s smaller oove gets
bu- eart
ield(nblocknfieldv) character80 cmname
41 Shape and Size Strain and Temperature Simulation Results of Bar Rolling
According to new flat-oval-square groove in the earlier design using simulation of rolling process by finite ele- ment software the cross section shape and strain distri- bution after each pass rolling of flat-oval groove are shown in Figure 13 where the equivalent plastic strain curves were distribution of rolled piece section of arrow position from left to right The centre equivalent plastic strain of these rolled piece cross sections were 0
90 420 475 525 respectively These cross sections strain distribution cloud pictures show that the strain was gradually introduced into the inside cross section and the largest accumulation of strain was more than 50 Strain value at the center of section in the traditional mond-square groove and square-section rolling iand large on the boundary and new flat-oval grlarge strain in the center and gradient of strain distrition changes small And large plastic strain in the hhelps control heart defect which leads to efficient com- paction in the center
To make the ultra-fine grain bar not only the strain should be considered but also the temperature change of rolling process Generally speaking in the process of rolling temperature changes were caused by three aspects 1) Plastic work generated heat during the rolled piece deformation 2) Frictional heat generated between rolled piece and mill roll 3) Rolled piece had heat transfer it- self including contact heat transfer between rolled piece and mill roll rolled piece of radiation and convection heat transfer Compared with plate rolling result in the temperature was hard to predict in bar rolling because the rolled piece deformation was not uniform which was influenced by the groove Therefore it was necessary to compare the numerical simulations and experiments and then repeatedly revised the parameters of model Figure 14 shows the rolled piece surface temperature distribu- tion of each pass after rolling
From temperature change of exit of the groove system workpiece there is little difference between temperature changes of each pass temperature rises of workpiece during the previous four times are large because large deformation leads to high heat by plastic work The latter two passes are mainly control of the shape and size of workpiece the deformation is relatively small so the temperature is lower than the first few passes
42 Prediction Simulation of Microstructure
Microstructure prediction method used here is VUSD- FLD subroutine of ABAQUS which is open program interface ABAQUS provided for users new output vari- able that user definite under dynamic conditions at the material point and user writes subroutine to implement the required functions Generally FORTRAN language is used as its compile language Its code interface is
subroutine vusdfld( c Read only variables - 1 nblock nstatev nfieldv nprops ndir nshr 2 jElem kIntPt kLayer kSecPt 3 stepTime totalTime dt cmname 4 coordMp direct T charLength props 5 stateOld c Write only variables - 6 stateNew field ) c include vaba_paraminc c dimension jElem(nblock) coordMp(nblock) 1 direct(nblock33) T(nblock33) 2 charLength(nblock)
props(nprops) 3 stateOld(nblocknstatev) 4 stateNew(nblocknstatev) 5 f
Copyright copy 2012 SciRes MNSMS
X T LI ET AL
Copyright copy 2012 SciRes MNSMS
74
axblknrData) rData(maxblknrData)
jD
100 continue
grain size is mainly based on experi- m hrough rel rameter fr od for pro- ce the analysis result of ABAQUS with calculation formula of grain size its pro- gr
gr nd its forecast form is shown in Figure 15
5
e all section obtained bigger strain between grain size and value of Z
c am of system ac Local arrays from vgetvrm are dimensioned to c maximum block size (maxblk) Above cloud of grain forecast indicates that ultra-fine
grain has been introduced to the entire section eventually and grain sizes are all smaller than 1 micron The Figure shows grain size in the center of the bar is larger than grain size around because in the rolling process the strain in the center is large the temperature is high caused by more plastic work heat which matches the
c parameter( nrData=6 ) character3 cData(m dimension ata(maxblknrData) c do 100 k = 1 nblock actual situation c Conclusions
1) The bar continuous rolling process of thermo-me- chanical coupling model was established through finite element method The law of strain distribution of tradi- tional and new flat-oval groove system on the cross sec-
return end Simulation of ental research of micro-structure of specimen tationship of grain size and deformation pa
tion in bar rolling contrastively was analyzed and the new flat-oval groove can better introduce strain into core at the same time th
om Equation (3) it can be simply understoss of calculation combined
2) Relationship am is written by FORTRAN language in interface pro-
0 2 4 6 8 10 12068
072
076
080
088
084
Distancemm
Equ
ival
ent s
trai
n
0 5 10 15 20 2510
Distancemm
12
14
16
18
20
Equ
ival
ent s
trai
n
(a) (b)
0 2 4 6 8 1025
30
35
40
45
50
Equ
ival
ent s
trai
n
Distancemm
0 4 8 1224
28
32
36
40
44
Distancemm
Equ
ival
ent s
trai
n
(c) (d)
0 2 4 6 8 1025
30
35
40
45
50
Distancemm
Equ
ival
ent s
trai
n
0 3 6 9 12243036424854
Distancemm
Equ
ival
ent s
trai
n
(e) (f)
Figure 13 Strain distribution at each pass using the flat-oval passes (a) First pass (b) Second pass (c) Third pass (d) Fourth pass (e) Fifth pass (f) Sixth pass
X T LI ET AL 75
Deformation and Annealingrdquo Acta Materialia Vol 53 No 18 2005 pp 4881-4892 doi101016jactamat200507009
1 2 3 4 5 6300330360390420450480510
Exi
t te
mpe
ratu
re
[5] R Rodriacuteguez-Baracaldoa R Tejedord J A Benito J M Cabrera and J M Prado ldquoMicrostructural Evolution and Mechanical Response of Nanocrystalline and Ultrafine- Grained Steel Obtained by Mechanical Millingrdquo Mate- rials Science and Engineering A Vol 493 No 1-2 2008 pp 215-220 doi101016jmsea200708087
u Ma and Guocheng Ren
ed Materialsrdquo Journal of Materials Processing Techno-
Every pass
Figure 14 Temperature at exit of each pass
Figure 15 The clou of grain forecast d
(processing parameter) was obtained based on study ongrain refinement of a small sample which substitutedinto finite element model through subroutine to comand finally forecasted the grain size distribution of cross section after rolling That makes the production of ul-tra-fine grain bar possible in the future
REFERENCES [1] T Shinokura and K Takai ldquoMathematical Models of
Roll The Iron and Steel Institute of Japan Vol 72 No 14 1986 pp
pute
Force and Torque in Steel Bar Rollingrdquo
1870-1876
[2] Y Okitsu N Takata and N Tsuji ldquoA New Route to Fab- ricate Ultrafine-Grained Structures in Carbon Steels with- out Severe Plastic Deformationrdquo Scripta Materialia Vol 60 No 2 2009 pp 76-79 doi101016jscriptamat200809002
[3] T Inoue F Yin and Y Kimura ldquoStrain Distribution andMicrostructural Evolution in Multi-Pass Warm CaliberRollingrdquo Mate ering A Vol 466 No 1-2 2007
rials Science and Engine pp 114-122
doi101016jmsea200702098
[4] R Song D Ponge and D Raabe ldquoMechanical Properties of an Ultrafine Grained C-Mn Steel Processed by Warm
[6] Shubo Xu Guoqun Zhao XinwldquoFinite Element Analysis and Optimization of Equal Channel Angular Pressing for Producing Ultra-Fine Grain-
logy Vol 184 No 1-3 2007 pp 209-216 doi101016jjmatprotec200611025
[7] N Tsuji Y Saito H Utsunomiytra-Fine Grained Bulk Steel Pro
a and S Tanigawa ldquoUl- duced by Accumulative
Roll-Bonding (ARB) Processrdquo Scripta Materialia Vol 40 No 7 1999 pp 795-800 doi101016S1359-6462(99)00015-9
[8] C G Xu G H Liu G S Ren Z SW Ren ldquoFinite Element Analysis
hen C P Ma and W of Axial Feed Bar
Rollingrdquo Acta Metallurgica Sinica (English Letters) Vol 20 No 6 2007 pp 463-468 doi101016S1006-7191(08)60011-3
[9] R B Mei C S Li X H Liu and B Han ldquoAnalysis of Strip Temperature in Hot Rolling Process by Finite Ele- ment Methodrdquo Journal of Iron and Steel Research In- ternational Vol 17 No 2 2010 pp 17-21 doi101016S1006-706X(10)60052-0
[10] M T Wang X L Zhang and X T Li and F S Du ldquoFi- nite Element Simulation of Hot Strip Continuous Rolling Process Coupling Microstructural EvolutionIron and Steel Research Internationa
rdquo Journal of l Vol 14 No 3
2007 pp 30-36 doi101016S1006-706X(07)60039-9
[11] C G Xu G H Liu G S Ren Z Shen C P Ma and W W Ren ldquoFinite Element Analysis of Axial Feed Bar Rollingrdquo Acta Metallurgica Sinica Vpp 463-468
ol 20 No 6 2007 08)60011-3doi101016S1006-7191(
d S C Feng ldquoKey
Vol 65 No
[12] G D Wang D Wu Z Y Liu and Z D Wang ldquoPresent Status and Prospect of Steel Rolling Technology in Chinardquo China Metallurgy Vol 19 No 12 2009 pp 1-13
[13] X L Pan Y H Wang H Z Liang anTechnology of Ultrafine Grain Steelrdquo World Iron amp Steel Vol 11 No 4 2011 pp 31-36
[14] K Hase and N Tsuji ldquoEffect of Initial Microstructure on Ultrafine Grain Formation through Warm Deformation in Medium-Carbon Steelsrdquo Scripta Materialia5 2011 pp 404-407 doi101016jscriptamat201105018
Copyright copy 2012 SciRes MNSMS

X T LI ET AL
Copyright copy 2012 SciRes MNSMS
69
Figure 2 Rhomb-square caliber
0 4 8 12 1616
20
24
28
32
Distancemm
Equ
ival
ent s
trai
n
0 4 8 12 1612
16
20
24
28
32
Distancemm
Equ
ival
ent s
trai
n
Figure 3 The final cross section of rolling strain distribution situation (a) rhombsquare caliber and (b) squaresquare caliber
that can reduce the number of rolling passes Meanwhile in the rolling process the rhomb edge and side edge con- verted with each other which made the effect multi-direc- tion processing more apparent than rhombsquare groove system The rolled piece was first rolled by flat-oval groove and then by square groove which can achieve multi-direction and not simultaneously process and more effectively import large plastic strain into centre of mate- rials
In order to roll the square steel with the initial cross section shape of side of 24 mm the curvature radius of 6 mm to square steel with final cross section shape of side of 18 mm through two passes of flat-ovalsquare groove system this paper designed three kinds of flat-oval square groove system the height of the flat-oval grooves were 8 mm 12 mm 16 mm respectively the widths were the same and the square grooves were all the same in shape The rolling process of three grooves system was simulated using finite element method and the accumu- lation of strain distribution is shown in Figure 4 In the graph the arrow direction is the rolling direction
From the strain distribution in Figure 4 it can be clearly seen that when the flat-oval groove height (H) was 8 mm the entire section introduced the largest de- formation among three grooves system because of big rolling reduction When the rolled piece went through the second pass of square groove due to the influence of the pattern of metal plastic flow the groove cannot be totally filled and the strain cannot reach the centre of rolled piece When the flat-oval groove height (H) was 12 mm the cross section was smaller after the first rolling pass but after the second square groove the largest stain in the centre of rolled piece and the groove can be totally filled When the flat-oval groove height (H) was 16 mm due to
duced small strain After the second rolling pass the
small rolling reduction the whole cross section intro
lement si
3 Experimental Study on Microstructure
s article is based on ex-
is 0 - 4 and in the same specimen microstructure and
strain cannot reach the centre of rolled piece and fullness degree of the rolled piece was large ldquoEarsrdquo appeared in the roll gap which was not beneficial to next rolling Therefore the flat-oval groove height (H) of 12 mm not only realized the cross section centre to get large strain but also guaranteed the rolled piece to totally filled of groove and realized to control the shape and size
Based on the result of several times of finite emulations the author proposed new groove system of
getting large strain as shown in Figure 5 The blank of square steel with side of 24 mm flipped 90˚ after first of flat-oval groove passed into the second pass of square groove with side of 18 mm then flipped 45˚ passed into the third pass of flat-oval groove then flipped 90˚ passed into the fourth pass of square groove with side of 13 mm and then flipped 45˚ passed into the fifth pass of preci- sion rolling of flat-oval groove and finally flipped 90˚ passed into the round groove to finish the bar rolling
31 Experimental Method
Study on micro-structure in thiperimental study on small specimen using low-tem- perature single-pass large-strain plane-strain compression experiment Figure 6 is a diagram of plane strain com- pression experiment Compared with cylindrical com- pression experiment it allows importing greater strain into materials and there is no ldquobulgingrdquo issue with more accurate and convenient determination of the stress-strain curve In the experiment of plane strain compression the resulting strain concentrates at the fixed end strain varia- tion range from compressed surface to the fixed surface
X T LI ET AL 70
Figure 4 The shape of three calibers and strain distribution situation
Figure 5 The new grooves of bar rolling
Figure 6 Schematic plot of plane strain compression
grain size under different strains cMaterials used in this experiment are part cutting from
sition (m
Quenching treatment is immediately after compression
en is cut in the compression di- rection Cross-section after compression is drawn with a
en This compres- that distribution of com- strain is concentrated at
an be observed and deformation specim
Q345 hot-rolled steel plate chemical compoass) is C 016 Si 03 Mn 15 P 0016 S 0004
Three dimensions after machining are namely length 20 mmtimeswidth 10 mmtimesheight 10 mm direction of compres- sion is perpendicular to the rolling direction and through thermal simulation testing machine the temperature strain and strain rate of the specimen can be controlled Figure 7 is schematic of hot working technology speci- men is heated to the deformation temperature range of 700˚C - 500˚C below the Ac1 by 10˚Cs by means of thermal resistance to make specimen heated evenly it is insulated 3min in this temperature and then unidirec- tional compressed where strain rates are 1 sndash1 01 sndash1 001 sminus1 respectively reduction is 80 and corresponded deformation time are 161 s 161 s 161 s respectively
dotted line in Figure 6 corrosion with nitric acid alcohol after mechanical polishing and structure observation on the scanning electron microscope
32 Result and Discussion
In order to obtain the relationship between microstructure and deformation parameters first is to clarify the distri- bution of internal strain in the specimsion method research indicatespressive stress and compressivethe bottom of the specimen that is the side without de- formation and that distribution of strain in the specimen is continuous Finite element method is used in this arti- cle for numerical simulation of the compression process and Figure 8 is the result of finite element simulation
Copyright copy 2012 SciRes MNSMS
X T LI ET AL 71
Figure 7 Schematic of hot working
Figure 8 Simulation result of single direction compression
which mainly studies the distribution of strain From the result of the simulation there is rigid zone where the indenter and specimen contact so strain is very little as
larg
ness direction of observation area under temperature of
pressed surface to the bottom which indicates that th
finite element simulation results become 4 ar
le st
for large am
an provide more nucleation of recrystallization lo
rocess and can be expressed as
blue area indicated by the arrow in the picture while e strain mainly distribut th sides and the bottomes bo
of rigid zone Along the compression direction strain becomes gradient distribution with variation range of 0 - 4
Figure 9 is scanning electron micrograph along thick-
600˚C and strain rate of 01 sndash1 region of deformation belt is the region in red box in Figure 8 From the picture we can know that the deformation belt tapers from the com
e large deformation occurs at the bottom while large strain concentrates at the bottom The same results were obtained via the same observation of the specimen under other deformation condition This is the same result with finite element simulation so it is reliable of numerical distribution of plastic strain obtained by finite element simulation
Initial microstructure is the layer laminated structure of distribution of ferrite and pearlite as shown in Figure 10 content of pearlite is relatively little initial grain size of ferrite is 20 microns and it is equiaxed distribution
Figure 11 shows that under different deformation conditions
eas and microstructures obtained by scanning electron microscope Pronounced equiaxed grains can be seen from every figure which indicates that ferrite grain fi- nally formed under these conditions has been in a stab
ate and is basically equiaxed grain after quenching Ferrite grain can be very small by observation and the smallest grain size is hundreds of nanometers
Figures 11(a) and (b) are in conditions of 600˚C and strain rate of 01 sndash1 and 001 sndash1 respectively Through observation of grain size in the picture it is apparent that grain size is smaller than that in strain rate of 001 sndash1 after compression in strain rate of 01 sndash1 Because under large strain rate it is more prone to appear
ount of strain belts under large strain rate and defect such as twinning and dislocations which provide energy and location for nucleation increase the nucleation rate and lead to grain refinement Under condition of 600˚C grain size is less than 1 micron at strain rate of 01 sndash1 and 001 sndash1
Figures 11(a) and (c) are compression in strain rate of 01 sndash1 and temperature of 600˚C and 650˚C respectively Grain size at temperature of 600˚C is apparently less than grain size at 650˚C and lower temperatures lead to smaller grain size Because the deformation at low tem- perature c
cations as well as higher rate of nucleation and low temperature can effectively reduce growth speed of grain Under the condition of 650˚C average grain size is around 1 micron
In order to illustrate the relationships between grain size and parameters of processing process the processing parameter Z is introduced which is an important pa- rameter that comprehensively describes deformation tem- perature strain and effects of strain rate on deformation characteristics in p
Z exp Q RT (1)
Copyright copy 2012 SciRes MNSMS
X T LI ET AL
Copyright copy 2012 SciRes MNSMS
72
Figure 9 The distribution of deformation band
(a)
Figure 10 Initial microstructure
where is strain rate Q is surface deformation activa- tion energy dition Q = 254 kJmol) R is gas const T is a deformation tem-
e
the grain size after recrystallization is taken av
ant Average grain sizes of several
ferent conditions of temperature anZ-value is calculated under
co
relationship between dynamic re- crystallization grain size and Z valu
Judging from the relationship betZ
nder large strain la
(independent from the stress conant
peraturIn dynamic recrystallization process each grain is at
different stages of recrystallization so grain size is dif- ferent and
erage grain size Its average grain size is related to d and Z values it can be determined according to the fol- lowing relationship
ndashmd A Z (2)
where A m are const(b)
specimens under dif- d strain rate are mea-
sured in this article while rresponding conditions according to the iterative ana-
lysis in Formula (2) relationship between grain size and Z value is as follows
01d 20 Z (3)
Figure 12 is curve es ween grain size d and
value grain size gradually decreases as the Z value increases At low temperature and u
rge strain rate is needed to access small grain size however when the Z value increases to a certain extent it is not obvious that grain size decreases as the Z value increases From the perspective of manufacturing ul- tra-fine grain Figure 12 also has a certain engineering
(c)
Figure 11 The final grain size under different deformation conditions (a) T = 600˚C (b) T = 600˚C (c) T = 650˚C
= 01ε = 01ε = 01ε
X T LI ET AL 73
Figure 12 The relationship between grain size and Z factor
value at th e o
e tim f metal plastic processing such as- rolling forging important deformation and machining parameters such as strain strain rate and temperature can be obtained though certain grain size in metal pro- cessing Desired grain size can be achieved by control- ling these parameters If grain of 1 micron is needed in the engineering application the desired Z-value can be obtained to be 217 times 1013 through Figure 12
Relationship between the deformation par ameter can be obtained by Equation (1) according to the require- ments of the designers the control of grain size can be ultimately realized by controlling deformation process pa- rameters such as strain strain rate and temperature
4 Finite Element Simulation Results
87 195 2
dia- s smaller oove gets
bu- eart
ield(nblocknfieldv) character80 cmname
41 Shape and Size Strain and Temperature Simulation Results of Bar Rolling
According to new flat-oval-square groove in the earlier design using simulation of rolling process by finite ele- ment software the cross section shape and strain distri- bution after each pass rolling of flat-oval groove are shown in Figure 13 where the equivalent plastic strain curves were distribution of rolled piece section of arrow position from left to right The centre equivalent plastic strain of these rolled piece cross sections were 0
90 420 475 525 respectively These cross sections strain distribution cloud pictures show that the strain was gradually introduced into the inside cross section and the largest accumulation of strain was more than 50 Strain value at the center of section in the traditional mond-square groove and square-section rolling iand large on the boundary and new flat-oval grlarge strain in the center and gradient of strain distrition changes small And large plastic strain in the hhelps control heart defect which leads to efficient com- paction in the center
To make the ultra-fine grain bar not only the strain should be considered but also the temperature change of rolling process Generally speaking in the process of rolling temperature changes were caused by three aspects 1) Plastic work generated heat during the rolled piece deformation 2) Frictional heat generated between rolled piece and mill roll 3) Rolled piece had heat transfer it- self including contact heat transfer between rolled piece and mill roll rolled piece of radiation and convection heat transfer Compared with plate rolling result in the temperature was hard to predict in bar rolling because the rolled piece deformation was not uniform which was influenced by the groove Therefore it was necessary to compare the numerical simulations and experiments and then repeatedly revised the parameters of model Figure 14 shows the rolled piece surface temperature distribu- tion of each pass after rolling
From temperature change of exit of the groove system workpiece there is little difference between temperature changes of each pass temperature rises of workpiece during the previous four times are large because large deformation leads to high heat by plastic work The latter two passes are mainly control of the shape and size of workpiece the deformation is relatively small so the temperature is lower than the first few passes
42 Prediction Simulation of Microstructure
Microstructure prediction method used here is VUSD- FLD subroutine of ABAQUS which is open program interface ABAQUS provided for users new output vari- able that user definite under dynamic conditions at the material point and user writes subroutine to implement the required functions Generally FORTRAN language is used as its compile language Its code interface is
subroutine vusdfld( c Read only variables - 1 nblock nstatev nfieldv nprops ndir nshr 2 jElem kIntPt kLayer kSecPt 3 stepTime totalTime dt cmname 4 coordMp direct T charLength props 5 stateOld c Write only variables - 6 stateNew field ) c include vaba_paraminc c dimension jElem(nblock) coordMp(nblock) 1 direct(nblock33) T(nblock33) 2 charLength(nblock)
props(nprops) 3 stateOld(nblocknstatev) 4 stateNew(nblocknstatev) 5 f
Copyright copy 2012 SciRes MNSMS
X T LI ET AL
Copyright copy 2012 SciRes MNSMS
74
axblknrData) rData(maxblknrData)
jD
100 continue
grain size is mainly based on experi- m hrough rel rameter fr od for pro- ce the analysis result of ABAQUS with calculation formula of grain size its pro- gr
gr nd its forecast form is shown in Figure 15
5
e all section obtained bigger strain between grain size and value of Z
c am of system ac Local arrays from vgetvrm are dimensioned to c maximum block size (maxblk) Above cloud of grain forecast indicates that ultra-fine
grain has been introduced to the entire section eventually and grain sizes are all smaller than 1 micron The Figure shows grain size in the center of the bar is larger than grain size around because in the rolling process the strain in the center is large the temperature is high caused by more plastic work heat which matches the
c parameter( nrData=6 ) character3 cData(m dimension ata(maxblknrData) c do 100 k = 1 nblock actual situation c Conclusions
1) The bar continuous rolling process of thermo-me- chanical coupling model was established through finite element method The law of strain distribution of tradi- tional and new flat-oval groove system on the cross sec-
return end Simulation of ental research of micro-structure of specimen tationship of grain size and deformation pa
tion in bar rolling contrastively was analyzed and the new flat-oval groove can better introduce strain into core at the same time th
om Equation (3) it can be simply understoss of calculation combined
2) Relationship am is written by FORTRAN language in interface pro-
0 2 4 6 8 10 12068
072
076
080
088
084
Distancemm
Equ
ival
ent s
trai
n
0 5 10 15 20 2510
Distancemm
12
14
16
18
20
Equ
ival
ent s
trai
n
(a) (b)
0 2 4 6 8 1025
30
35
40
45
50
Equ
ival
ent s
trai
n
Distancemm
0 4 8 1224
28
32
36
40
44
Distancemm
Equ
ival
ent s
trai
n
(c) (d)
0 2 4 6 8 1025
30
35
40
45
50
Distancemm
Equ
ival
ent s
trai
n
0 3 6 9 12243036424854
Distancemm
Equ
ival
ent s
trai
n
(e) (f)
Figure 13 Strain distribution at each pass using the flat-oval passes (a) First pass (b) Second pass (c) Third pass (d) Fourth pass (e) Fifth pass (f) Sixth pass
X T LI ET AL 75
Deformation and Annealingrdquo Acta Materialia Vol 53 No 18 2005 pp 4881-4892 doi101016jactamat200507009
1 2 3 4 5 6300330360390420450480510
Exi
t te
mpe
ratu
re
[5] R Rodriacuteguez-Baracaldoa R Tejedord J A Benito J M Cabrera and J M Prado ldquoMicrostructural Evolution and Mechanical Response of Nanocrystalline and Ultrafine- Grained Steel Obtained by Mechanical Millingrdquo Mate- rials Science and Engineering A Vol 493 No 1-2 2008 pp 215-220 doi101016jmsea200708087
u Ma and Guocheng Ren
ed Materialsrdquo Journal of Materials Processing Techno-
Every pass
Figure 14 Temperature at exit of each pass
Figure 15 The clou of grain forecast d
(processing parameter) was obtained based on study ongrain refinement of a small sample which substitutedinto finite element model through subroutine to comand finally forecasted the grain size distribution of cross section after rolling That makes the production of ul-tra-fine grain bar possible in the future
REFERENCES [1] T Shinokura and K Takai ldquoMathematical Models of
Roll The Iron and Steel Institute of Japan Vol 72 No 14 1986 pp
pute
Force and Torque in Steel Bar Rollingrdquo
1870-1876
[2] Y Okitsu N Takata and N Tsuji ldquoA New Route to Fab- ricate Ultrafine-Grained Structures in Carbon Steels with- out Severe Plastic Deformationrdquo Scripta Materialia Vol 60 No 2 2009 pp 76-79 doi101016jscriptamat200809002
[3] T Inoue F Yin and Y Kimura ldquoStrain Distribution andMicrostructural Evolution in Multi-Pass Warm CaliberRollingrdquo Mate ering A Vol 466 No 1-2 2007
rials Science and Engine pp 114-122
doi101016jmsea200702098
[4] R Song D Ponge and D Raabe ldquoMechanical Properties of an Ultrafine Grained C-Mn Steel Processed by Warm
[6] Shubo Xu Guoqun Zhao XinwldquoFinite Element Analysis and Optimization of Equal Channel Angular Pressing for Producing Ultra-Fine Grain-
logy Vol 184 No 1-3 2007 pp 209-216 doi101016jjmatprotec200611025
[7] N Tsuji Y Saito H Utsunomiytra-Fine Grained Bulk Steel Pro
a and S Tanigawa ldquoUl- duced by Accumulative
Roll-Bonding (ARB) Processrdquo Scripta Materialia Vol 40 No 7 1999 pp 795-800 doi101016S1359-6462(99)00015-9
[8] C G Xu G H Liu G S Ren Z SW Ren ldquoFinite Element Analysis
hen C P Ma and W of Axial Feed Bar
Rollingrdquo Acta Metallurgica Sinica (English Letters) Vol 20 No 6 2007 pp 463-468 doi101016S1006-7191(08)60011-3
[9] R B Mei C S Li X H Liu and B Han ldquoAnalysis of Strip Temperature in Hot Rolling Process by Finite Ele- ment Methodrdquo Journal of Iron and Steel Research In- ternational Vol 17 No 2 2010 pp 17-21 doi101016S1006-706X(10)60052-0
[10] M T Wang X L Zhang and X T Li and F S Du ldquoFi- nite Element Simulation of Hot Strip Continuous Rolling Process Coupling Microstructural EvolutionIron and Steel Research Internationa
rdquo Journal of l Vol 14 No 3
2007 pp 30-36 doi101016S1006-706X(07)60039-9
[11] C G Xu G H Liu G S Ren Z Shen C P Ma and W W Ren ldquoFinite Element Analysis of Axial Feed Bar Rollingrdquo Acta Metallurgica Sinica Vpp 463-468
ol 20 No 6 2007 08)60011-3doi101016S1006-7191(
d S C Feng ldquoKey
Vol 65 No
[12] G D Wang D Wu Z Y Liu and Z D Wang ldquoPresent Status and Prospect of Steel Rolling Technology in Chinardquo China Metallurgy Vol 19 No 12 2009 pp 1-13
[13] X L Pan Y H Wang H Z Liang anTechnology of Ultrafine Grain Steelrdquo World Iron amp Steel Vol 11 No 4 2011 pp 31-36
[14] K Hase and N Tsuji ldquoEffect of Initial Microstructure on Ultrafine Grain Formation through Warm Deformation in Medium-Carbon Steelsrdquo Scripta Materialia5 2011 pp 404-407 doi101016jscriptamat201105018
Copyright copy 2012 SciRes MNSMS
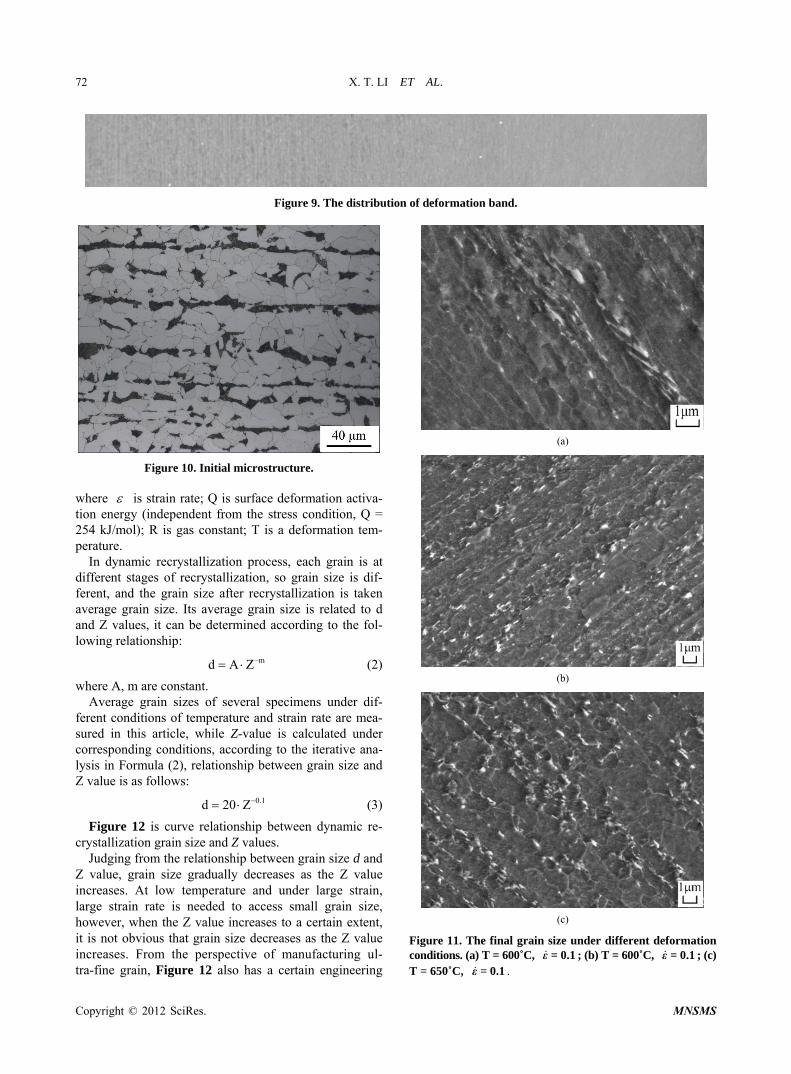
X T LI ET AL
Copyright copy 2012 SciRes MNSMS
72
Figure 9 The distribution of deformation band
(a)
Figure 10 Initial microstructure
where is strain rate Q is surface deformation activa- tion energy dition Q = 254 kJmol) R is gas const T is a deformation tem-
e
the grain size after recrystallization is taken av
ant Average grain sizes of several
ferent conditions of temperature anZ-value is calculated under
co
relationship between dynamic re- crystallization grain size and Z valu
Judging from the relationship betZ
nder large strain la
(independent from the stress conant
peraturIn dynamic recrystallization process each grain is at
different stages of recrystallization so grain size is dif- ferent and
erage grain size Its average grain size is related to d and Z values it can be determined according to the fol- lowing relationship
ndashmd A Z (2)
where A m are const(b)
specimens under dif- d strain rate are mea-
sured in this article while rresponding conditions according to the iterative ana-
lysis in Formula (2) relationship between grain size and Z value is as follows
01d 20 Z (3)
Figure 12 is curve es ween grain size d and
value grain size gradually decreases as the Z value increases At low temperature and u
rge strain rate is needed to access small grain size however when the Z value increases to a certain extent it is not obvious that grain size decreases as the Z value increases From the perspective of manufacturing ul- tra-fine grain Figure 12 also has a certain engineering
(c)
Figure 11 The final grain size under different deformation conditions (a) T = 600˚C (b) T = 600˚C (c) T = 650˚C
= 01ε = 01ε = 01ε
X T LI ET AL 73
Figure 12 The relationship between grain size and Z factor
value at th e o
e tim f metal plastic processing such as- rolling forging important deformation and machining parameters such as strain strain rate and temperature can be obtained though certain grain size in metal pro- cessing Desired grain size can be achieved by control- ling these parameters If grain of 1 micron is needed in the engineering application the desired Z-value can be obtained to be 217 times 1013 through Figure 12
Relationship between the deformation par ameter can be obtained by Equation (1) according to the require- ments of the designers the control of grain size can be ultimately realized by controlling deformation process pa- rameters such as strain strain rate and temperature
4 Finite Element Simulation Results
87 195 2
dia- s smaller oove gets
bu- eart
ield(nblocknfieldv) character80 cmname
41 Shape and Size Strain and Temperature Simulation Results of Bar Rolling
According to new flat-oval-square groove in the earlier design using simulation of rolling process by finite ele- ment software the cross section shape and strain distri- bution after each pass rolling of flat-oval groove are shown in Figure 13 where the equivalent plastic strain curves were distribution of rolled piece section of arrow position from left to right The centre equivalent plastic strain of these rolled piece cross sections were 0
90 420 475 525 respectively These cross sections strain distribution cloud pictures show that the strain was gradually introduced into the inside cross section and the largest accumulation of strain was more than 50 Strain value at the center of section in the traditional mond-square groove and square-section rolling iand large on the boundary and new flat-oval grlarge strain in the center and gradient of strain distrition changes small And large plastic strain in the hhelps control heart defect which leads to efficient com- paction in the center
To make the ultra-fine grain bar not only the strain should be considered but also the temperature change of rolling process Generally speaking in the process of rolling temperature changes were caused by three aspects 1) Plastic work generated heat during the rolled piece deformation 2) Frictional heat generated between rolled piece and mill roll 3) Rolled piece had heat transfer it- self including contact heat transfer between rolled piece and mill roll rolled piece of radiation and convection heat transfer Compared with plate rolling result in the temperature was hard to predict in bar rolling because the rolled piece deformation was not uniform which was influenced by the groove Therefore it was necessary to compare the numerical simulations and experiments and then repeatedly revised the parameters of model Figure 14 shows the rolled piece surface temperature distribu- tion of each pass after rolling
From temperature change of exit of the groove system workpiece there is little difference between temperature changes of each pass temperature rises of workpiece during the previous four times are large because large deformation leads to high heat by plastic work The latter two passes are mainly control of the shape and size of workpiece the deformation is relatively small so the temperature is lower than the first few passes
42 Prediction Simulation of Microstructure
Microstructure prediction method used here is VUSD- FLD subroutine of ABAQUS which is open program interface ABAQUS provided for users new output vari- able that user definite under dynamic conditions at the material point and user writes subroutine to implement the required functions Generally FORTRAN language is used as its compile language Its code interface is
subroutine vusdfld( c Read only variables - 1 nblock nstatev nfieldv nprops ndir nshr 2 jElem kIntPt kLayer kSecPt 3 stepTime totalTime dt cmname 4 coordMp direct T charLength props 5 stateOld c Write only variables - 6 stateNew field ) c include vaba_paraminc c dimension jElem(nblock) coordMp(nblock) 1 direct(nblock33) T(nblock33) 2 charLength(nblock)
props(nprops) 3 stateOld(nblocknstatev) 4 stateNew(nblocknstatev) 5 f
Copyright copy 2012 SciRes MNSMS
X T LI ET AL
Copyright copy 2012 SciRes MNSMS
74
axblknrData) rData(maxblknrData)
jD
100 continue
grain size is mainly based on experi- m hrough rel rameter fr od for pro- ce the analysis result of ABAQUS with calculation formula of grain size its pro- gr
gr nd its forecast form is shown in Figure 15
5
e all section obtained bigger strain between grain size and value of Z
c am of system ac Local arrays from vgetvrm are dimensioned to c maximum block size (maxblk) Above cloud of grain forecast indicates that ultra-fine
grain has been introduced to the entire section eventually and grain sizes are all smaller than 1 micron The Figure shows grain size in the center of the bar is larger than grain size around because in the rolling process the strain in the center is large the temperature is high caused by more plastic work heat which matches the
c parameter( nrData=6 ) character3 cData(m dimension ata(maxblknrData) c do 100 k = 1 nblock actual situation c Conclusions
1) The bar continuous rolling process of thermo-me- chanical coupling model was established through finite element method The law of strain distribution of tradi- tional and new flat-oval groove system on the cross sec-
return end Simulation of ental research of micro-structure of specimen tationship of grain size and deformation pa
tion in bar rolling contrastively was analyzed and the new flat-oval groove can better introduce strain into core at the same time th
om Equation (3) it can be simply understoss of calculation combined
2) Relationship am is written by FORTRAN language in interface pro-
0 2 4 6 8 10 12068
072
076
080
088
084
Distancemm
Equ
ival
ent s
trai
n
0 5 10 15 20 2510
Distancemm
12
14
16
18
20
Equ
ival
ent s
trai
n
(a) (b)
0 2 4 6 8 1025
30
35
40
45
50
Equ
ival
ent s
trai
n
Distancemm
0 4 8 1224
28
32
36
40
44
Distancemm
Equ
ival
ent s
trai
n
(c) (d)
0 2 4 6 8 1025
30
35
40
45
50
Distancemm
Equ
ival
ent s
trai
n
0 3 6 9 12243036424854
Distancemm
Equ
ival
ent s
trai
n
(e) (f)
Figure 13 Strain distribution at each pass using the flat-oval passes (a) First pass (b) Second pass (c) Third pass (d) Fourth pass (e) Fifth pass (f) Sixth pass
X T LI ET AL 75
Deformation and Annealingrdquo Acta Materialia Vol 53 No 18 2005 pp 4881-4892 doi101016jactamat200507009
1 2 3 4 5 6300330360390420450480510
Exi
t te
mpe
ratu
re
[5] R Rodriacuteguez-Baracaldoa R Tejedord J A Benito J M Cabrera and J M Prado ldquoMicrostructural Evolution and Mechanical Response of Nanocrystalline and Ultrafine- Grained Steel Obtained by Mechanical Millingrdquo Mate- rials Science and Engineering A Vol 493 No 1-2 2008 pp 215-220 doi101016jmsea200708087
u Ma and Guocheng Ren
ed Materialsrdquo Journal of Materials Processing Techno-
Every pass
Figure 14 Temperature at exit of each pass
Figure 15 The clou of grain forecast d
(processing parameter) was obtained based on study ongrain refinement of a small sample which substitutedinto finite element model through subroutine to comand finally forecasted the grain size distribution of cross section after rolling That makes the production of ul-tra-fine grain bar possible in the future
REFERENCES [1] T Shinokura and K Takai ldquoMathematical Models of
Roll The Iron and Steel Institute of Japan Vol 72 No 14 1986 pp
pute
Force and Torque in Steel Bar Rollingrdquo
1870-1876
[2] Y Okitsu N Takata and N Tsuji ldquoA New Route to Fab- ricate Ultrafine-Grained Structures in Carbon Steels with- out Severe Plastic Deformationrdquo Scripta Materialia Vol 60 No 2 2009 pp 76-79 doi101016jscriptamat200809002
[3] T Inoue F Yin and Y Kimura ldquoStrain Distribution andMicrostructural Evolution in Multi-Pass Warm CaliberRollingrdquo Mate ering A Vol 466 No 1-2 2007
rials Science and Engine pp 114-122
doi101016jmsea200702098
[4] R Song D Ponge and D Raabe ldquoMechanical Properties of an Ultrafine Grained C-Mn Steel Processed by Warm
[6] Shubo Xu Guoqun Zhao XinwldquoFinite Element Analysis and Optimization of Equal Channel Angular Pressing for Producing Ultra-Fine Grain-
logy Vol 184 No 1-3 2007 pp 209-216 doi101016jjmatprotec200611025
[7] N Tsuji Y Saito H Utsunomiytra-Fine Grained Bulk Steel Pro
a and S Tanigawa ldquoUl- duced by Accumulative
Roll-Bonding (ARB) Processrdquo Scripta Materialia Vol 40 No 7 1999 pp 795-800 doi101016S1359-6462(99)00015-9
[8] C G Xu G H Liu G S Ren Z SW Ren ldquoFinite Element Analysis
hen C P Ma and W of Axial Feed Bar
Rollingrdquo Acta Metallurgica Sinica (English Letters) Vol 20 No 6 2007 pp 463-468 doi101016S1006-7191(08)60011-3
[9] R B Mei C S Li X H Liu and B Han ldquoAnalysis of Strip Temperature in Hot Rolling Process by Finite Ele- ment Methodrdquo Journal of Iron and Steel Research In- ternational Vol 17 No 2 2010 pp 17-21 doi101016S1006-706X(10)60052-0
[10] M T Wang X L Zhang and X T Li and F S Du ldquoFi- nite Element Simulation of Hot Strip Continuous Rolling Process Coupling Microstructural EvolutionIron and Steel Research Internationa
rdquo Journal of l Vol 14 No 3
2007 pp 30-36 doi101016S1006-706X(07)60039-9
[11] C G Xu G H Liu G S Ren Z Shen C P Ma and W W Ren ldquoFinite Element Analysis of Axial Feed Bar Rollingrdquo Acta Metallurgica Sinica Vpp 463-468
ol 20 No 6 2007 08)60011-3doi101016S1006-7191(
d S C Feng ldquoKey
Vol 65 No
[12] G D Wang D Wu Z Y Liu and Z D Wang ldquoPresent Status and Prospect of Steel Rolling Technology in Chinardquo China Metallurgy Vol 19 No 12 2009 pp 1-13
[13] X L Pan Y H Wang H Z Liang anTechnology of Ultrafine Grain Steelrdquo World Iron amp Steel Vol 11 No 4 2011 pp 31-36
[14] K Hase and N Tsuji ldquoEffect of Initial Microstructure on Ultrafine Grain Formation through Warm Deformation in Medium-Carbon Steelsrdquo Scripta Materialia5 2011 pp 404-407 doi101016jscriptamat201105018
Copyright copy 2012 SciRes MNSMS
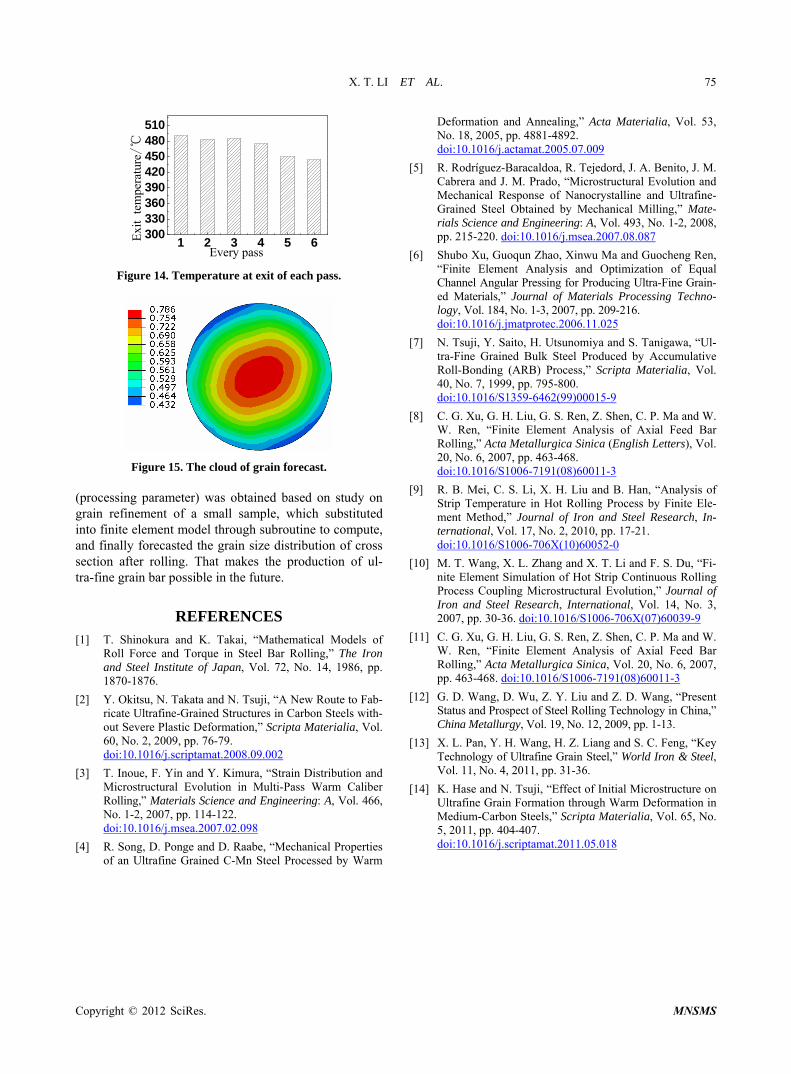