Grin and Bear It: Producer- nanced Exports from an ... · Grin and Bear It: Producer- nanced...
32
Grin and Bear It: Producer-financed Exports from an Emerging Market Banu Demir Bilkent University Beata Javorcik University of Oxford and CEPR May 2014 Abstract This study uses a unique dataset to provide the first comprehensive test of the theory of export financing. We extend the existing literature by drawing attention to the theoretical and empirical relationship between the extent of competition in the export market and the choice of financing terms. Our dataset covers the universe of Turkey’s exports disaggregated by product, destination, and financing terms for the period 2004-2012. The results support theoretical predictions. The prevalence of exporter-financed exports (relative to importer or bank-financed exports) increases with the institutional quality in the importing country, with this effect being stronger for differentiated products. Exporter-financed exports are more likely to be destined for countries with a less efficient banking sector and increase with the competition level in the destination country. Our identification strategy takes advantage of two exogenous shocks: the end of the Multi-fiber Arrangement (MFA) and the Great Recession. Using a difference-in-differences approach, we find that exporter-financed exports to the European Union disproportionately increased relative to exports on other financing terms in the post-MFA period in prod- ucts where Turkish competitors initially faced binding quotas. As Turkey was not bound by EU quotas before the end of the MFA, these results are consistent with an increase in competition pushing Turkish exporters to offer trade financing. We also find that exporter-financed exports increased relative to other exports when destined for countries afflicted by the recent financial crisis. JEL Codes: FXX. Keywords: trade financing, competition, Multi-fiber Arrangement, Great Reces- sion.
Transcript of Grin and Bear It: Producer- nanced Exports from an ... · Grin and Bear It: Producer- nanced...
Grin and Bear It:Producer-financed Exports from an Emerging Market
Banu Demir
Bilkent University
Beata Javorcik
University of Oxford and CEPR
May 2014
Abstract
This study uses a unique dataset to provide the first comprehensive test ofthe theory of export financing. We extend the existing literature by drawingattention to the theoretical and empirical relationship between the extent ofcompetition in the export market and the choice of financing terms. Ourdataset covers the universe of Turkey’s exports disaggregated by product,destination, and financing terms for the period 2004-2012. The results supporttheoretical predictions. The prevalence of exporter-financed exports (relativeto importer or bank-financed exports) increases with the institutional qualityin the importing country, with this effect being stronger for differentiatedproducts. Exporter-financed exports are more likely to be destined for countrieswith a less efficient banking sector and increase with the competition levelin the destination country. Our identification strategy takes advantage oftwo exogenous shocks: the end of the Multi-fiber Arrangement (MFA) andthe Great Recession. Using a difference-in-differences approach, we find thatexporter-financed exports to the European Union disproportionately increasedrelative to exports on other financing terms in the post-MFA period in prod-ucts where Turkish competitors initially faced binding quotas. As Turkeywas not bound by EU quotas before the end of the MFA, these results areconsistent with an increase in competition pushing Turkish exporters to offertrade financing. We also find that exporter-financed exports increased relativeto other exports when destined for countries afflicted by the recent financial crisis.
JEL Codes: FXX.Keywords: trade financing, competition, Multi-fiber Arrangement, Great Reces-sion.
1 Introduction
This study provides the first comprehensive empirical test of the theory of financing termsin international trade. In additional to considering the standard determinants of exportfinancing terms, it examines the link between competition in the export market and thechoice of financing terms, an issue that has not been explored in the existing literature.Our exercise is motivated with a simple model in the spirit of Antras and Foley (2013) andSchmidt-Eisenlohr (2013) and tested using Turkish export data disaggregated by financingterms, destination country and the 10-digit Harmonized System (HS) product, available forthe period 2004-2012.
We consider three broad payment methods (financing terms): open account (OA), cash inadvance (CIA), and letter of credit (LC). In transactions financed with OA, the importer paysafter the arrival of the goods in the destination. In CIA-financed transactions, the importerpays before the exporter ships the goods to the destination. In LC-financed transactions,the importer’s bank promises to pay for the goods on behalf of the importer provided theexporter meets all requirements specified in the contract.
The model yields several predictions. First, the attractiveness of exporter financing (OA)relative to other financing terms increases with the institutional quality in the importingcountry, and the magnitude of the effect rises as the degree of product differentiation in-creases. The intuition is simple. The more differentiated the product the more tailoredits specifications are to the buyer’s needs, and hence the lower the price it commands out-side the relationship. Therefore, for highly differentiated products, an improvement in thequality of institutions in the importing country exerts a greater positive marginal effect onthe exporter’s expected profits in exporter-financed (OA) transactions. Second, the modelsuggests that trade destined for countries with higher financing costs is more likely to befinanced by exporters. This is because higher costs of financing in the destination countrymake importer financing less attractive. Third, the model predicts that an increase in theimporters bargaining power will make exporter financing more likely because it is more ad-vantageous to the importer. As higher competition is associated with a greater bargainingpower of the importer, exporter-financed exports are predicted to increase with the level ofcompetition in the destination country.1
Our empirical analysis proceeds in three steps. We start by testing the first two the-oretical predictions, both of which find support in the data. The results suggest that aone-standard-deviation increase in the importer’s institutional quality is associated with a18 percent increase in exporter-financed (OA) trade relative to importer-financed (CIA) orbank-financed (LC) trade. The effect differs between differentiated and non-differentiatedgoods: the estimate is 9 percentage points larger for differentiated products. Our results arerobust to using several measures of institutional quality, alternative specifications and vari-ous robustness checks. Further, we find that exports to countries with less efficient bankingsectors are more likely to place on OA terms.
In the second part of our analysis, we focus on the prediction related to competition. Wefollow the earlier literature and proxy for competition using (i) the total GDP, (ii) a measure
1This prediction echoes the advice given by the US Department of Commerce to American exporters:”Open account terms may help win customers in competitive markets.”
1
of foreign supplier access developed by Redding and Venables 2004 and used recently byMayer, Melitz and Ottaviano 2014; (iii) the number of countries supplying a given 6-digit HSproduct to a given destination country. As the last two measures are potentially endogenouswe lag them by three periods. In all three cases, the data indicate that exports to morecompetitive markets are more likely to be financed by Turkish exporters. In an alternativeexercise, we argue that when Turkish producers are disadvantaged by higher tariffs relativeto their competitors, more of their exports will be financed through open account. The dataconfirm that this is indeed the case.
In the third part of our analysis, the identification strategy takes advantage of two ex-ogenous shocks: the end of the Multi-Fiber Arrangement (MFA) and the Great Recession of2009. Until January 1, 2005, exports of clothing and textiles from developing countries to theUnited States, the European Union and Canada were subject to bilateral quotas under theglobal Agreement on Textile and Clothing, previously known (and referred to in this article)as the Multi-Fiber Arrangement. After forming a customs union with the EU in 1996, Turkeywas not subject to any quota restrictions in the EU market. Thus removal of the MFA quotason large textile and clothing producers such as China, India and Bangladesh, constituted alarge shock to the competitive pressures faced by Turkish suppliers of these products to theEU market. Our identification strategy takes advantage of the fact that quotas were bindingin some, but not other, products. The estimation focuses on exports of products coveredby the MFA destined for the EU market. The results from this difference-in-differencesapproach suggest that in the post-MFA period Turkish exporter-financed exports increasedrelative to exports on other financing terms in products where quota were binding in 2004,as compared to products where the quotas were not filled at that time. These findings areconsistent with the view that an increase in competitive pressures pushed Turkish exportersto offer trade financing.
The second exercise explores the implications of the Great Recession for the choice offinancing terms. The Great Recession can be viewed as a negative shock to the supply oftrade financing and a negative demand shock in some destination markets. Unlike many ofits crisis-afflicted trading partners, Turkey and its banking sector have weathered the crisisquite well. Here again a difference-in-difference approach is employed, relating the volumeof exports financed by Turkish exporters relative to exports financed through other meansin the pre- versus post-crisis period to whether or not a destination country was afflictedby the crisis . The results suggest that exports financed by Turkish producers expanded inrelative terms to crisis affected countries. This is consistent with Turkish producers beingable to offer financing when their trading partners were less able to do so and with Turkishproducers using export financing to become more competitive suppliers in the face of anegative demand shock.
The contribution of our study is threefold. First, it is the first comprehensive empirical testof the theory of financing terms in international trade. In contrast to the earlier work, whichrelied either on aggregate data (Schmidt-Eisenlohr 2013), could not distinguish between thetype of financing used in domestic and international trade transaction (Hoefele, Schmidt-Eisenlohr and Yu 2013) or used information on exports of a single firm (Antras and Foley2013), we rely on the universe of Turkish exports. Second, we document that the extentof competition in the export market matters for export financing, which is a question thathas not been explored in the existing literature. Third, by focusing on exogenous shocks
2
and employing a difference-in-differences approach we are able to employ a more reliableidentification strategy. Our focus on an emerging market is also an interesting question initself due to its less developed financial sector. It allows us to shed light on how creditsqueeze in crisis-affected countries impacted exporters in emerging markets.
Breaking into foreign markets is difficult and costly, even more so for firms wishing to sup-ply differentiated products where greater trust is needed between trading partners (Rauchand Trindade 2002, Ranjan and Lee 2007). Our results suggest that producers of differenti-ated products may face an additional obstacle in the form of more limited access to importeror bank financing. This may be one of the reasons why export diversification may be difficultin countries with underdeveloped financial markets.
Our paper is related to several strands of the existing literature. First, we contribute tothe work on the role of institutional quality for the choice of financing terms in internationaltrade transactions (Antras and Foley 2013, Schmidt-Eisenlohr 2013, Glady and Potin 2011,Hoefele, Schmidt-Eisenlohr and Yu 2013). Second, we add to a broader literature whichdocuments a link between access to credit and exporting (Chaney 2013, Greenaway et al.2007; Manova 2013, Amiti and Weinstein 2011).
The rest of the paper is organized as follows. The next section presents the model and itsmain predictions. Section 2 discusses the data and presents some stylized facts. Section 3reports the empirical results. In Section 4, we describe the exercises based on the MFA endand the Great Recession. Section 5 concludes.
2 Theoretical Framework
We present a simple Nash bargaining model in which a Turkish seller and a foreign buyershare the surplus generated by an international trade transaction. In terms of the generalframework the model presented here is similar to the static version of the model of Antrasand Foley 2013 who extend the model developed by Schmidt-Eisenlohr 2013. Here, we arenot interested in the bargaining process itself. Instead, we try to understand the propertiesof possible outcomes that are mutually beneficial to both sides.
In the model, a given Turkish exporter sells product p to a given importer in destinationcountry c. Both firms are risk-neutral. The exporter incurs a constant marginal cost that isnormalized to one.2 S denotes the price at which the importer sells product p in destinationcountry c. When the transaction takes place between the two partners, their payoffs areequal to their expected profits as the bargaining takes place before the transaction takesplace.
In the case where both parties fulfill their contractual obligations the timing of the eventsunder different payment terms is as follows. Under CIA terms the importer makes thepayment before the exporter produces and ships the goods which arrive at the destinationafter t periods. Under OA terms the exporter first produces and ships the goods, andthe importer makes the payment upon their arrival. Under LC terms the importer’s bankguarantees payment to the exporter after the arrival of goods at the destination. Regardless
2One can also add an iceberg-type trade cost to the model. Such modification does not change any ofthe results.
3
of the method of payment, there is a time lag (t periods) between the time goods areproduced/shipped and their arrival at the destination.
We assume limited commitment. When the transaction is on cash in advance termsthe exporter may have an incentive to deviate from the specifications set in the contract.Imperfect enforcement on the exporter’s side implies that contracts in Turkey are enforcedwith probability λ. So, with probability (1−λ) the contract is not enforced, and the exporteravoids a small effort cost.3 Thus the value of the transaction falls to a fraction δ(e) ∈ (0, 1)of the initial value. The fraction is an increasing function of product differentiation asbuyer-specific features and quality considerations should exist for differentiated rather thannon-differentiated products i.e. δ(e)′ > 0. The following gives the expected profits of theexporter and the importer, respectively, under CIA terms:
E[ΠCIAE ] = Q(PCIA − 1),
E[ΠCIAI ] = Q
λ+ (1− λ)(1− δ(e))
(1 + rc)tS − PCIA
,
where Q denotes the volume of the transaction, PCIA the price agreed when the contractwas concluded, and rc the cost of financing in the importer’s country.
For transactions on open account terms, the contract is enforced with probability λc ∈(0, 1), which depends positively on the quality of institutions in country c.4 If the contractis not enforced, and the importer does not accept the goods and pay, the exporter can sellthe goods to a third party. If the goods are tailored to the importer’s requirements, resellingthem may be difficult as they do not command the same value outside the importer-exporterrelationship. We assume that the loss the exporter incurs when selling the goods to a thirdparty is increasing in the degree of product differentiation. The new price is a fraction(1 − γ(e)) of the price set in the initial contract, where e denotes the degree of productdifferentiation, and γ(e) ∈ (0, 1), γ(e)′ > 0.5 Given limited commitment expected profits ofthe trade partners are given by:
E[ΠOAE ] = Q
λc + (1− λc)(1− γ(e))
(1 + r)tPOA − 1
,
E[ΠOAI ] = Q(S − POA),
where r denotes the cost at which the exporter finances the transaction.Under LC terms, it is assumed that the exporter receives payment with certainty, and
the exporter’s incentive not to comply with the contract terms is negligible. While bankfinancing (almost) eliminates the moral hazard problem on both sides, it is costly. Theimporter’s bank charges a processing fee fLC > 1, which is assumed to increase the cost of
3Following Antras and Foley (2013), we do not model the effort cost explicitly.4In this case the exporter has no incentive to shave the quality of the product, δ(e) = 0.5Nunn (2007) relies on a similar idea when classifying inputs according to their contract intensity. He
argues that for inputs that are sold on organized exchange (low differentiation), there are potential buyersoutside of the buyer-seller relationship, therefore the value of such inputs outside of the relationship is closeto the value specified in the initial contract. This is not the case for differentiated products.
4

financing. Expected profits of the exporter and the importer are
E[ΠLCE ] = Q
1
(1 + r)tPLC − 1
,
E[ΠLCI ] = Q
1
fLC(1 + rc)tS − PLC
.
Under LC terms, there is pre-financing on both sides because the exporter needs to procureworking capital.
The price set in the contract under each financing term is determined by Nash bargainingsolution. We consider a general Nash bargaining solution where the transaction price ischosen to maximize a geometric average of the importer’s and the exporter’s surpluses. Theweights are assumed to represent the bargaining power of the two parties. For simplicity,we assume that the payoff of the outside option for each party is zero. Given a financingterm, trade partners first determine the price that maximizes their joint surplus (transactionsurplus). Then they choose the financing term that generates the largest joint surplus. Sothe bargaining problem we consider is as follows
maxP f
Ωf = E[ΠfI ]
αE[ΠfE]1−α,
where α ∈ (0, 1) is positively related to the bargaining power of the importer, and f =CIA,OA,LC. Setting the first-order condition with respect to P f to zero under eachfinancing term, we obtain the following expressions for the transaction prices
PCIA = (1− α)λ+ (1− λ)(1− δ(e))
(1 + rc)tS + α,
POA = (1− α)S + α(1 + r)t
λc + (1− λc)(1− γ(e)),
PLC = (1− α)1
fLC(1 + rc)tS + α(1 + r)t.
Substituting these prices into the respective expressions for expected profits yields the fol-lowing joint surpluses
Ω∗CIA = Q(1− α)1−ααα(λ+ (1− λ)(1− δ(e))
(1 + rc)tS − 1
),
Ω∗OA = Q(1− α)1−ααα(
(1 + r)t
λc + (1− λc)(1− γ(e))
)α(λc + (1− λc)(1− γ(e))
(1 + r)tS − 1
),
Ω∗LC = Q(1− α)1−ααα(1 + r)tα(
1
(1 + rc)t(1 + r)tfLCS − 1
).
We use these expressions to do comparative statics with respect to the main parametersin the model. Our first result is already well-known from Schmidt-Eisenlohr 2013 and Antrasand Foley 2013, but we state it for completeness.
5
Result 1 Consider the expected joint surplus under OA terms relative to CIA and LC terms:Ω∗OA/Ω
∗CIA, Ω∗OA/Ω
∗LC. Both ratios are increasing functions of λc and rc. In words, OA
becomes more attractive relative to CIA and LC terms as the quality of institutions improves,or cost of financing increases in the importing country.
The dependence of the choice between OA and non-OA terms on the quality of institutionsand cost of financing in the importing country vary with the degree of differentiation of theproduct shipped:
∂2(Ω∗OA/Ω∗CIA)
∂e∂λc,∂2(Ω∗OA/Ω
∗LC)
∂e∂λc> 0,
∂2(Ω∗OA/Ω∗CIA)
∂e∂rc,∂2(Ω∗OA/Ω
∗LC)
∂e∂rc< 0.
Result 2 Product differentiation reinforces (weakens) the positive effect of the quality ofinstitutions (cost of financing) in the importing country on the use of OA relative to otherfinancing terms (CIA and LC).
Product differentiation decreases the expected joint surplus generated by the transactionfor two reasons. First, if the importer does not make the payment, and the product ishighly differentiated, the exporter is less likely to find another buyer for the product as theproduct is tailored to the initial buyer’s requirements. Thus the expected loss of the exporteris increasing, or the value of the joint surplus generated by the transaction is decreasing,in the degree of product differentiation. Second, product differentiation also increases theloss in the value of the product in case the exporter deviates from the specifications setin the contract. So, when the product is highly differentiated, an improvement in contractenforcement in the importing country exerts a greater marginal effect on the expected profitsof the exporter under OA terms. In short, product differentiation increases the sensitivityof the choice between OA and other financing terms on the quality of institutions in theimporting country.
The attractiveness of OA terms relative to the other two terms also depends on thebargaining power of the importer in an intuitive way.
Result 3 The relative surplus generated under OA terms increases in the bargaining powerof the importer.
∂(Ω∗OA/Ω∗CIA)
∂α,∂(Ω∗OA/Ω
∗LC)
∂α> 0.
As the bargaining power of the importer increases at the expense of the exporter’s, thejoint expected surplus depends more on the surplus obtained by the importer. Under CIAterms the importer pre-finances the transaction. Under LC terms, there is an extra cost,bank fee, born by the importer. So, under both cases, the expected profit of the importer issmaller relative to OA terms. Therefore, OA becomes more likely as the bargaining powerof the importer increases.
6
3 Data and Stylized Facts
The lack of data has hindered extensive empirical validation of the theory of financing terms.An ideal dataset should provide a break-down of trade flows by financing terms and containinformation on destination and origin countries. So far such information has been availableonly for a single exporter (see Antras and Foley 2013). Our unique dataset, provided bythe Turkish Statistical Institute, contains all such information for the universe of Turkishmanufacturing exports during the period 2004-2012.6 The information is broken down intothree main financing terms (OA, CIA, and LC), the destination country and the 10-digit HSproduct code. We have information on both value (free-on-board) and quantity of exports.
In addition to being unique in terms of the data availability, Turkey is an appropriatesetting for our exercise for other reasons. It is a fast-growing economy, a member of OECD,ranking among the top twenty largest economies in the world. Over the past ten years,Turkey has become increasingly integrated into global markets; its exports increased three-fold since 2003 to reach USD152.6 billion in 2012. In 1996, Turkey has signed a customsunion for manufactured goods with the EU. Exports to the EU, on average, accounted for43 percent of total exports during 2004-2012. The country is the 5th largest exporter to theregion. During the period under consideration, a total of 12,480 manufacturing productswere exported to 249 destination countries, thus giving us a lot of variation to be exploit inour analysis.7
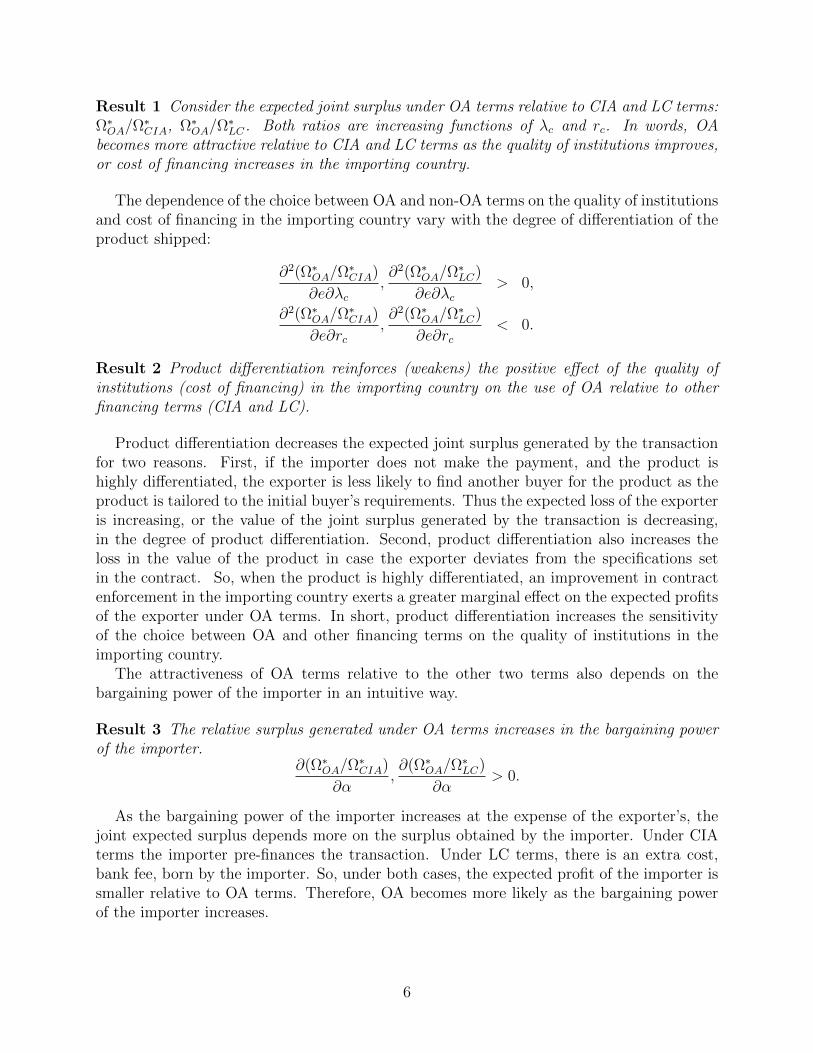
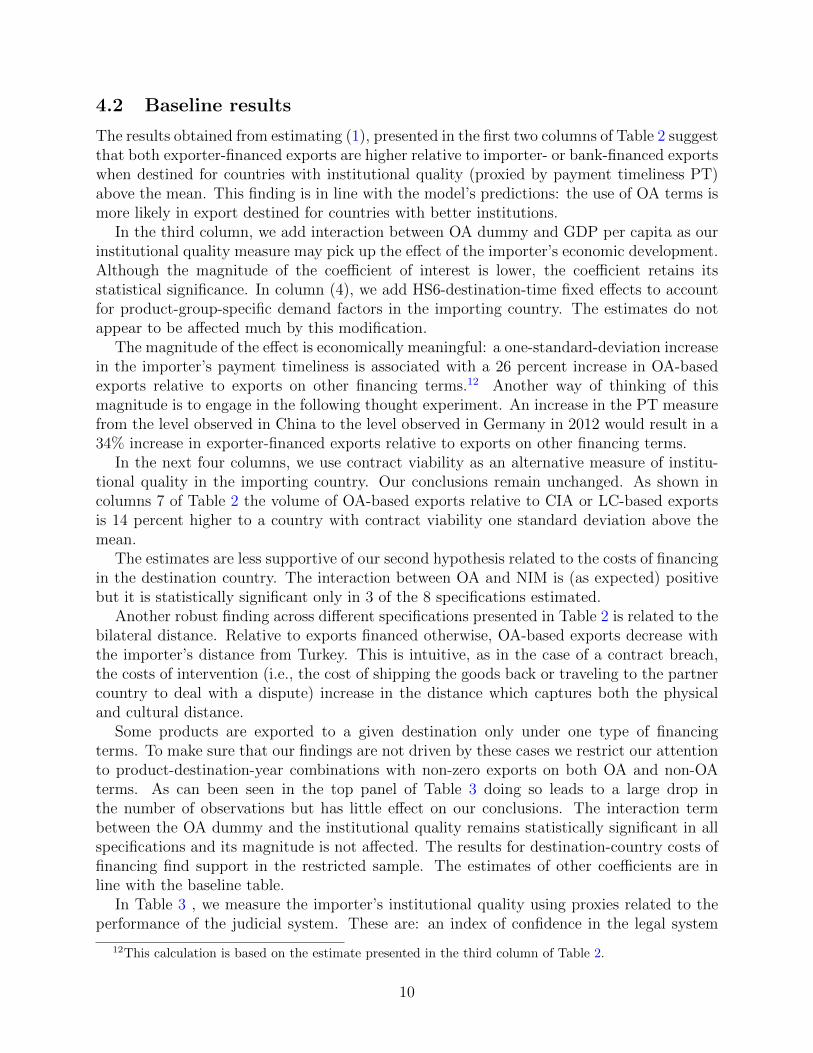
Figure 1 shows the share of each financing term in total exports over the period 2004-2012.Exporter-financed exports (OA) account for about 80 percent of the total. This pattern isin line with the theoretical prediction: OA becomes attractive when institutional quality isbetter in the importing than in the exporting country. In the Turkish context, the extensiveuse of OA can be justified by the fact that OECD countries, which tend to have betterinstitutions than Turkey, receive more than half of Turkey’s exports.
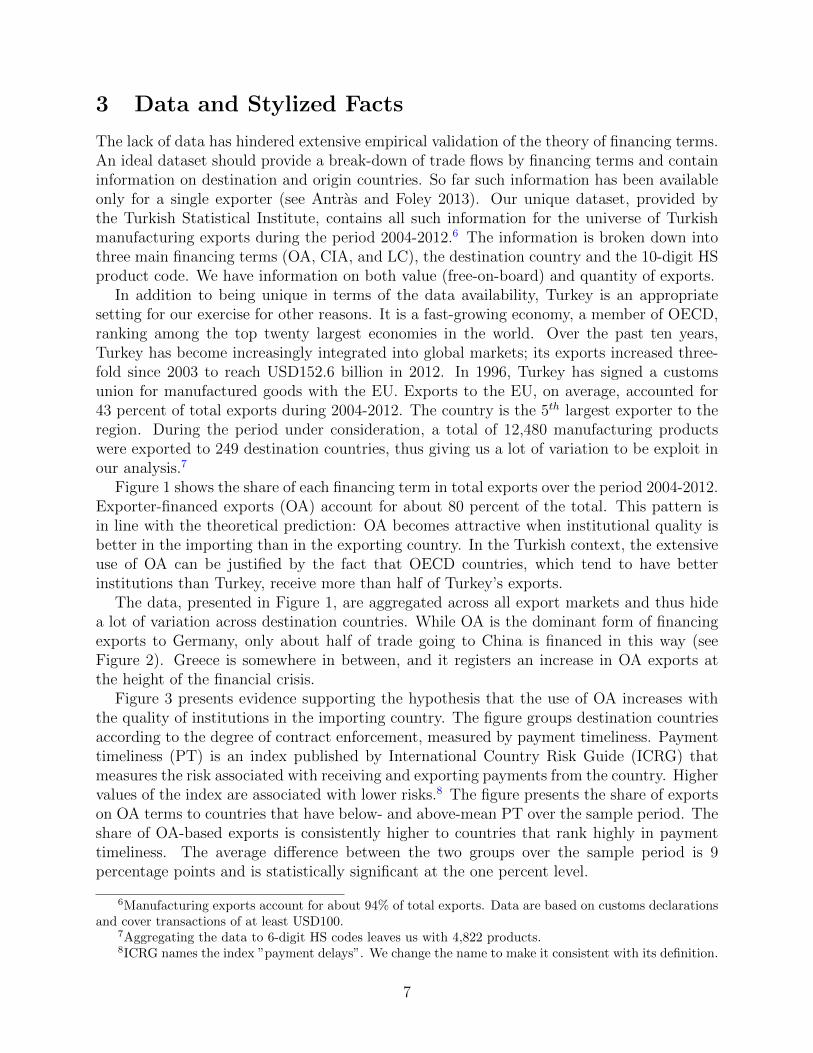
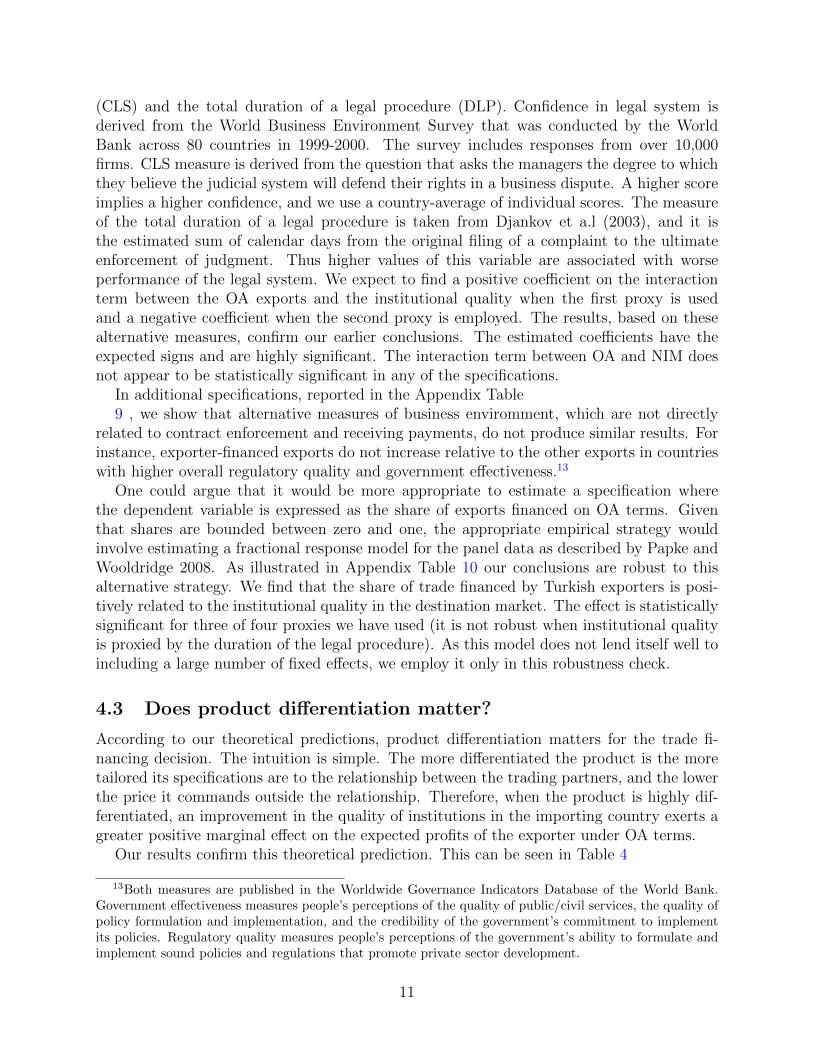
The data, presented in Figure 1, are aggregated across all export markets and thus hidea lot of variation across destination countries. While OA is the dominant form of financingexports to Germany, only about half of trade going to China is financed in this way (seeFigure 2). Greece is somewhere in between, and it registers an increase in OA exports atthe height of the financial crisis.
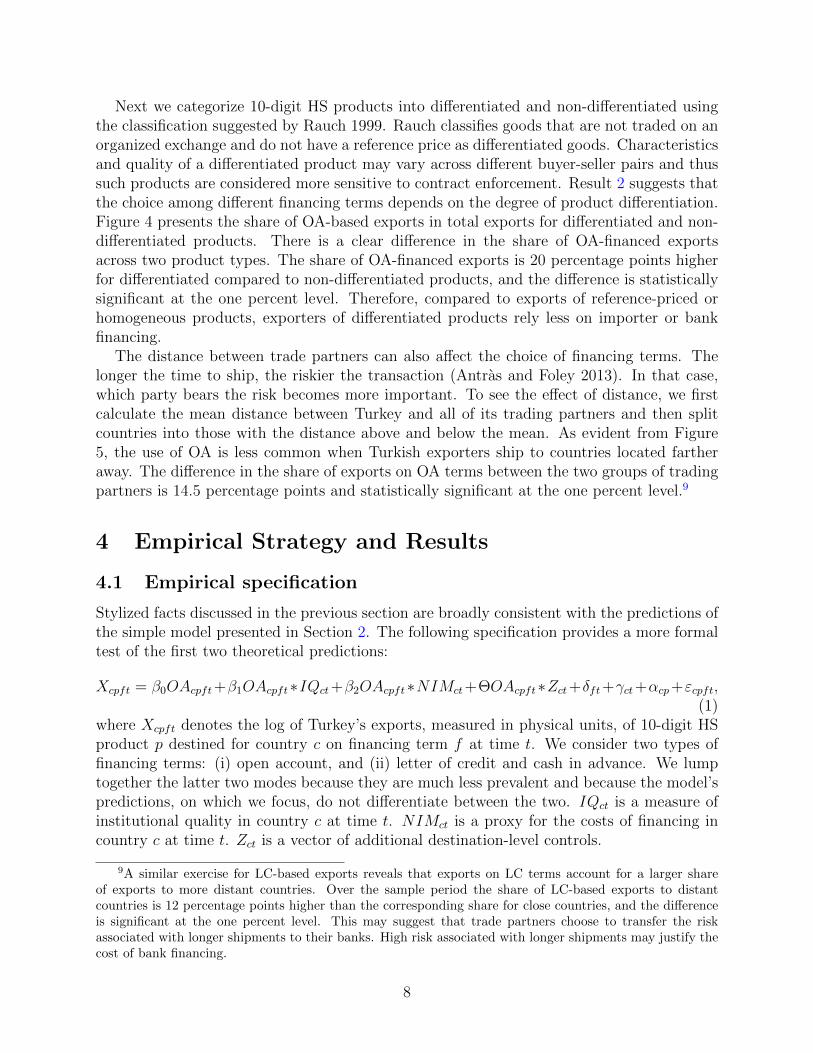
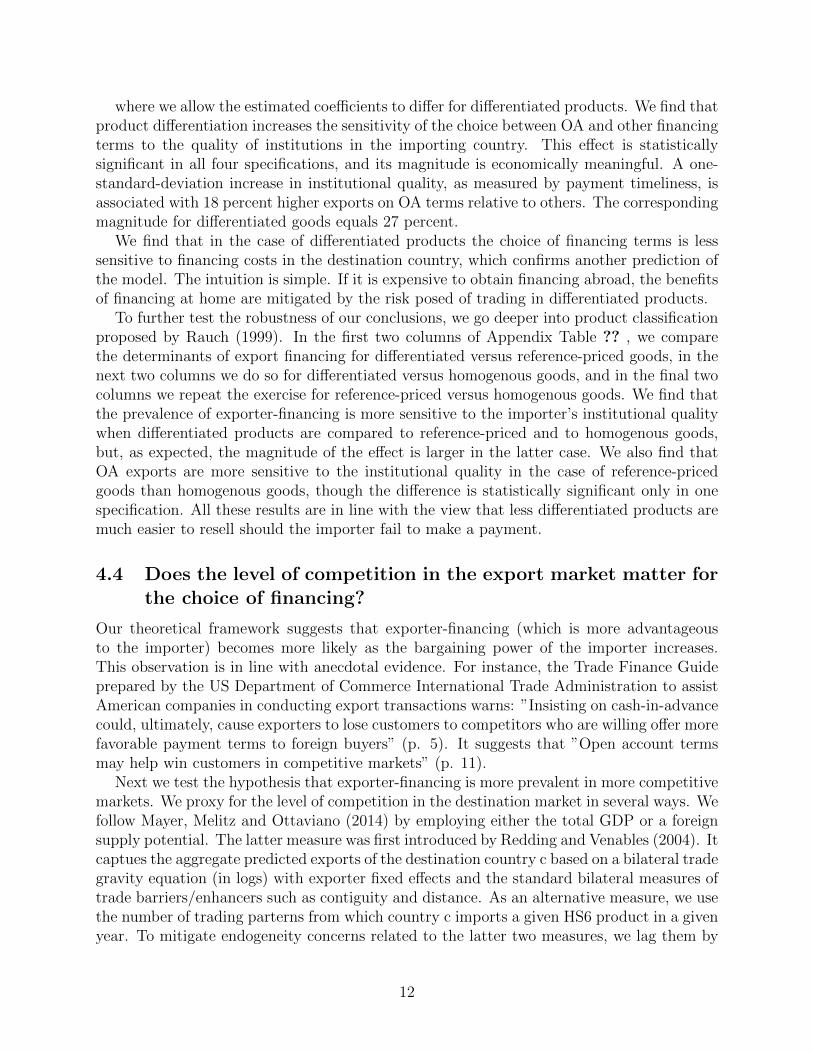
Figure 3 presents evidence supporting the hypothesis that the use of OA increases withthe quality of institutions in the importing country. The figure groups destination countriesaccording to the degree of contract enforcement, measured by payment timeliness. Paymenttimeliness (PT) is an index published by International Country Risk Guide (ICRG) thatmeasures the risk associated with receiving and exporting payments from the country. Highervalues of the index are associated with lower risks.8 The figure presents the share of exportson OA terms to countries that have below- and above-mean PT over the sample period. Theshare of OA-based exports is consistently higher to countries that rank highly in paymenttimeliness. The average difference between the two groups over the sample period is 9percentage points and is statistically significant at the one percent level.
6Manufacturing exports account for about 94% of total exports. Data are based on customs declarationsand cover transactions of at least USD100.
7Aggregating the data to 6-digit HS codes leaves us with 4,822 products.8ICRG names the index ”payment delays”. We change the name to make it consistent with its definition.
7
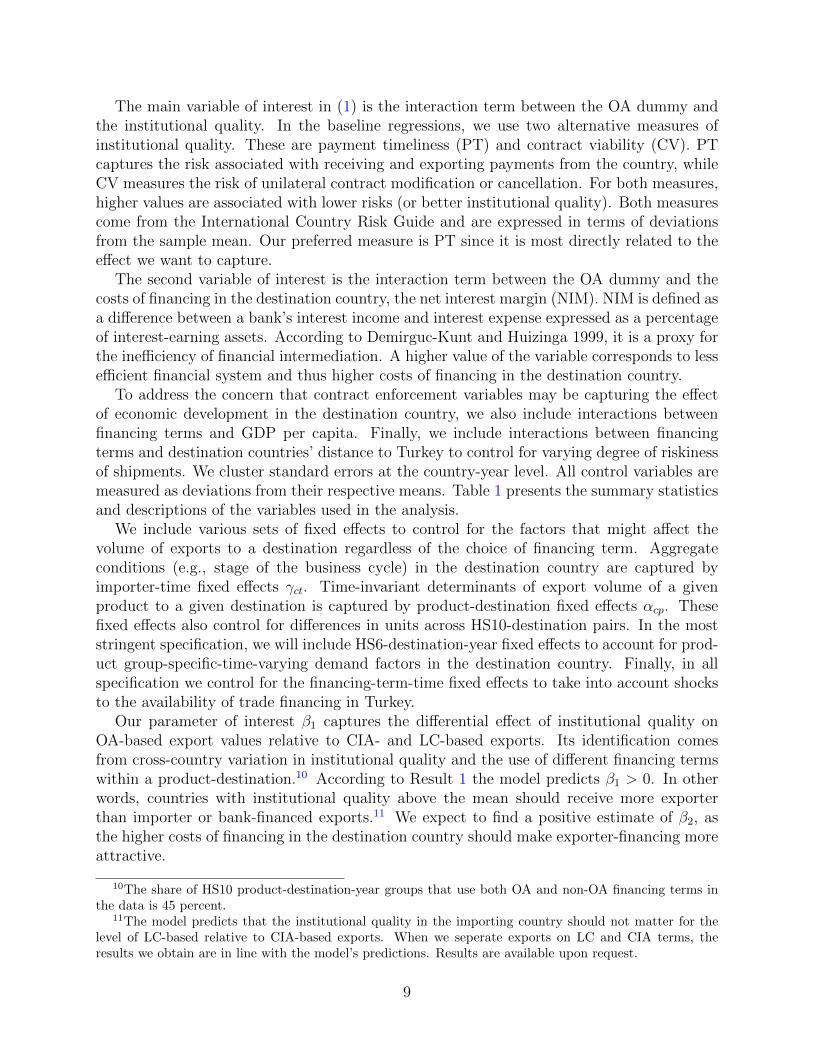
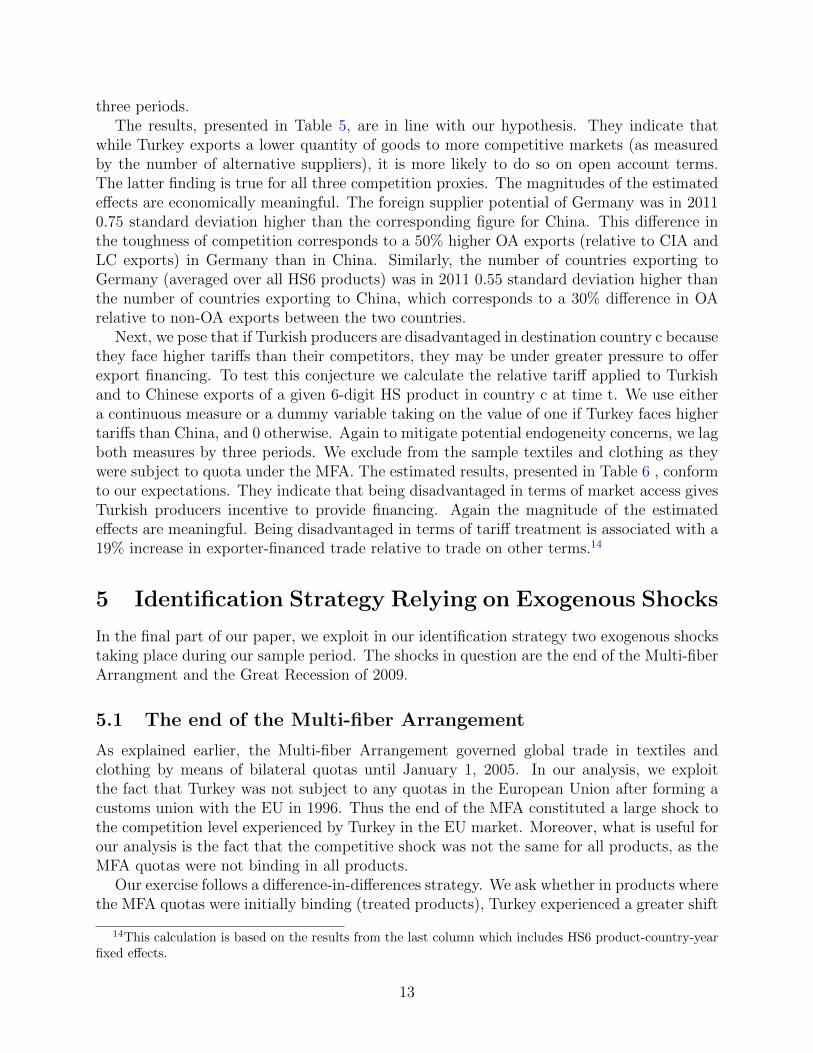
Next we categorize 10-digit HS products into differentiated and non-differentiated usingthe classification suggested by Rauch 1999. Rauch classifies goods that are not traded on anorganized exchange and do not have a reference price as differentiated goods. Characteristicsand quality of a differentiated product may vary across different buyer-seller pairs and thussuch products are considered more sensitive to contract enforcement. Result 2 suggests thatthe choice among different financing terms depends on the degree of product differentiation.Figure 4 presents the share of OA-based exports in total exports for differentiated and non-differentiated products. There is a clear difference in the share of OA-financed exportsacross two product types. The share of OA-financed exports is 20 percentage points higherfor differentiated compared to non-differentiated products, and the difference is statisticallysignificant at the one percent level. Therefore, compared to exports of reference-priced orhomogeneous products, exporters of differentiated products rely less on importer or bankfinancing.
The distance between trade partners can also affect the choice of financing terms. Thelonger the time to ship, the riskier the transaction (Antras and Foley 2013). In that case,which party bears the risk becomes more important. To see the effect of distance, we firstcalculate the mean distance between Turkey and all of its trading partners and then splitcountries into those with the distance above and below the mean. As evident from Figure5, the use of OA is less common when Turkish exporters ship to countries located fartheraway. The difference in the share of exports on OA terms between the two groups of tradingpartners is 14.5 percentage points and statistically significant at the one percent level.9
4 Empirical Strategy and Results
4.1 Empirical specification
Stylized facts discussed in the previous section are broadly consistent with the predictions ofthe simple model presented in Section 2. The following specification provides a more formaltest of the first two theoretical predictions:
Xcpft = β0OAcpft+β1OAcpft∗IQct+β2OAcpft∗NIMct+ΘOAcpft∗Zct+δft+γct+αcp+εcpft,(1)
where Xcpft denotes the log of Turkey’s exports, measured in physical units, of 10-digit HSproduct p destined for country c on financing term f at time t. We consider two types offinancing terms: (i) open account, and (ii) letter of credit and cash in advance. We lumptogether the latter two modes because they are much less prevalent and because the model’spredictions, on which we focus, do not differentiate between the two. IQct is a measure ofinstitutional quality in country c at time t. NIMct is a proxy for the costs of financing incountry c at time t. Zct is a vector of additional destination-level controls.
9A similar exercise for LC-based exports reveals that exports on LC terms account for a larger shareof exports to more distant countries. Over the sample period the share of LC-based exports to distantcountries is 12 percentage points higher than the corresponding share for close countries, and the differenceis significant at the one percent level. This may suggest that trade partners choose to transfer the riskassociated with longer shipments to their banks. High risk associated with longer shipments may justify thecost of bank financing.
8
The main variable of interest in (1) is the interaction term between the OA dummy andthe institutional quality. In the baseline regressions, we use two alternative measures ofinstitutional quality. These are payment timeliness (PT) and contract viability (CV). PTcaptures the risk associated with receiving and exporting payments from the country, whileCV measures the risk of unilateral contract modification or cancellation. For both measures,higher values are associated with lower risks (or better institutional quality). Both measurescome from the International Country Risk Guide and are expressed in terms of deviationsfrom the sample mean. Our preferred measure is PT since it is most directly related to theeffect we want to capture.
The second variable of interest is the interaction term between the OA dummy and thecosts of financing in the destination country, the net interest margin (NIM). NIM is defined asa difference between a bank’s interest income and interest expense expressed as a percentageof interest-earning assets. According to Demirguc-Kunt and Huizinga 1999, it is a proxy forthe inefficiency of financial intermediation. A higher value of the variable corresponds to lessefficient financial system and thus higher costs of financing in the destination country.
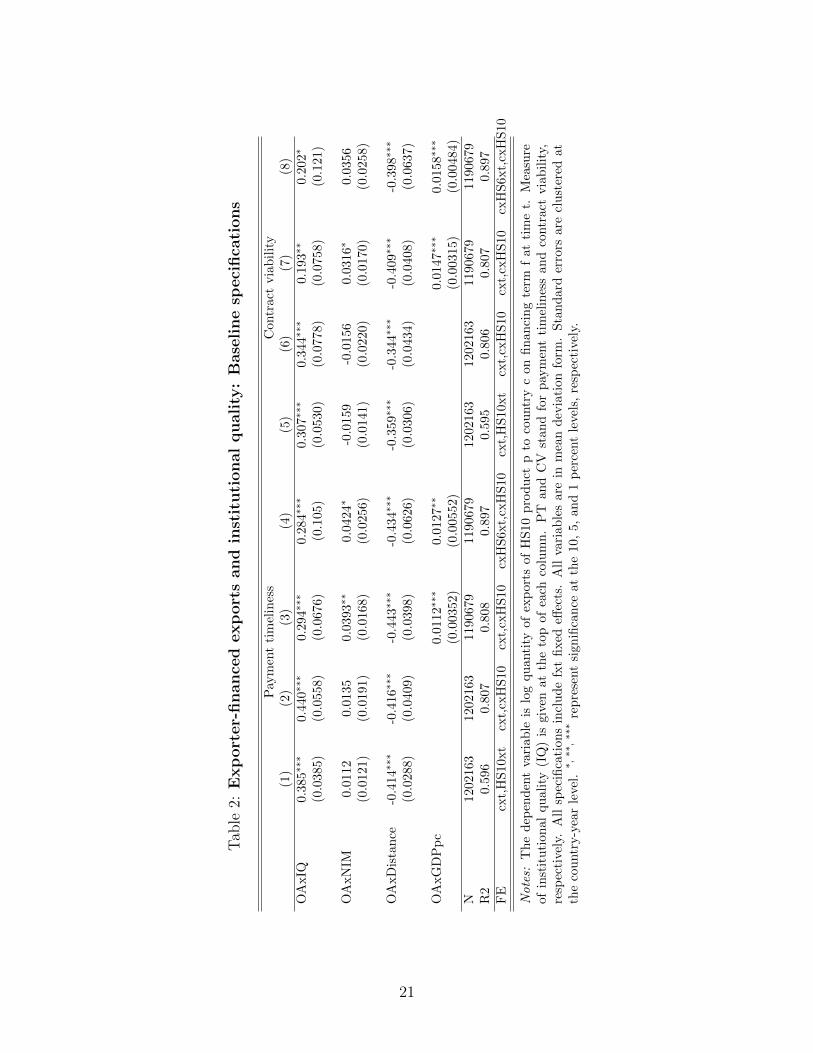
To address the concern that contract enforcement variables may be capturing the effectof economic development in the destination country, we also include interactions betweenfinancing terms and GDP per capita. Finally, we include interactions between financingterms and destination countries’ distance to Turkey to control for varying degree of riskinessof shipments. We cluster standard errors at the country-year level. All control variables aremeasured as deviations from their respective means. Table 1 presents the summary statisticsand descriptions of the variables used in the analysis.
We include various sets of fixed effects to control for the factors that might affect thevolume of exports to a destination regardless of the choice of financing term. Aggregateconditions (e.g., stage of the business cycle) in the destination country are captured byimporter-time fixed effects γct. Time-invariant determinants of export volume of a givenproduct to a given destination is captured by product-destination fixed effects αcp. Thesefixed effects also control for differences in units across HS10-destination pairs. In the moststringent specification, we will include HS6-destination-year fixed effects to account for prod-uct group-specific-time-varying demand factors in the destination country. Finally, in allspecification we control for the financing-term-time fixed effects to take into account shocksto the availability of trade financing in Turkey.
Our parameter of interest β1 captures the differential effect of institutional quality onOA-based export values relative to CIA- and LC-based exports. Its identification comesfrom cross-country variation in institutional quality and the use of different financing termswithin a product-destination.10 According to Result 1 the model predicts β1 > 0. In otherwords, countries with institutional quality above the mean should receive more exporterthan importer or bank-financed exports.11 We expect to find a positive estimate of β2, asthe higher costs of financing in the destination country should make exporter-financing moreattractive.
10The share of HS10 product-destination-year groups that use both OA and non-OA financing terms inthe data is 45 percent.
11The model predicts that the institutional quality in the importing country should not matter for thelevel of LC-based relative to CIA-based exports. When we seperate exports on LC and CIA terms, theresults we obtain are in line with the model’s predictions. Results are available upon request.
9
4.2 Baseline results
The results obtained from estimating (1), presented in the first two columns of Table 2 suggestthat both exporter-financed exports are higher relative to importer- or bank-financed exportswhen destined for countries with institutional quality (proxied by payment timeliness PT)above the mean. This finding is in line with the model’s predictions: the use of OA terms ismore likely in export destined for countries with better institutions.
In the third column, we add interaction between OA dummy and GDP per capita as ourinstitutional quality measure may pick up the effect of the importer’s economic development.Although the magnitude of the coefficient of interest is lower, the coefficient retains itsstatistical significance. In column (4), we add HS6-destination-time fixed effects to accountfor product-group-specific demand factors in the importing country. The estimates do notappear to be affected much by this modification.
The magnitude of the effect is economically meaningful: a one-standard-deviation increasein the importer’s payment timeliness is associated with a 26 percent increase in OA-basedexports relative to exports on other financing terms.12 Another way of thinking of thismagnitude is to engage in the following thought experiment. An increase in the PT measurefrom the level observed in China to the level observed in Germany in 2012 would result in a34% increase in exporter-financed exports relative to exports on other financing terms.
In the next four columns, we use contract viability as an alternative measure of institu-tional quality in the importing country. Our conclusions remain unchanged. As shown incolumns 7 of Table 2 the volume of OA-based exports relative to CIA or LC-based exportsis 14 percent higher to a country with contract viability one standard deviation above themean.
The estimates are less supportive of our second hypothesis related to the costs of financingin the destination country. The interaction between OA and NIM is (as expected) positivebut it is statistically significant only in 3 of the 8 specifications estimated.
Another robust finding across different specifications presented in Table 2 is related to thebilateral distance. Relative to exports financed otherwise, OA-based exports decrease withthe importer’s distance from Turkey. This is intuitive, as in the case of a contract breach,the costs of intervention (i.e., the cost of shipping the goods back or traveling to the partnercountry to deal with a dispute) increase in the distance which captures both the physicaland cultural distance.
Some products are exported to a given destination only under one type of financingterms. To make sure that our findings are not driven by these cases we restrict our attentionto product-destination-year combinations with non-zero exports on both OA and non-OAterms. As can been seen in the top panel of Table 3 doing so leads to a large drop inthe number of observations but has little effect on our conclusions. The interaction termbetween the OA dummy and the institutional quality remains statistically significant in allspecifications and its magnitude is not affected. The results for destination-country costs offinancing find support in the restricted sample. The estimates of other coefficients are inline with the baseline table.
In Table 3 , we measure the importer’s institutional quality using proxies related to theperformance of the judicial system. These are: an index of confidence in the legal system
12This calculation is based on the estimate presented in the third column of Table 2.
10
(CLS) and the total duration of a legal procedure (DLP). Confidence in legal system isderived from the World Business Environment Survey that was conducted by the WorldBank across 80 countries in 1999-2000. The survey includes responses from over 10,000firms. CLS measure is derived from the question that asks the managers the degree to whichthey believe the judicial system will defend their rights in a business dispute. A higher scoreimplies a higher confidence, and we use a country-average of individual scores. The measureof the total duration of a legal procedure is taken from Djankov et a.l (2003), and it isthe estimated sum of calendar days from the original filing of a complaint to the ultimateenforcement of judgment. Thus higher values of this variable are associated with worseperformance of the legal system. We expect to find a positive coefficient on the interactionterm between the OA exports and the institutional quality when the first proxy is usedand a negative coefficient when the second proxy is employed. The results, based on thesealternative measures, confirm our earlier conclusions. The estimated coefficients have theexpected signs and are highly significant. The interaction term between OA and NIM doesnot appear to be statistically significant in any of the specifications.
In additional specifications, reported in the Appendix Table9 , we show that alternative measures of business enviromment, which are not directly
related to contract enforcement and receiving payments, do not produce similar results. Forinstance, exporter-financed exports do not increase relative to the other exports in countrieswith higher overall regulatory quality and government effectiveness.13
One could argue that it would be more appropriate to estimate a specification wherethe dependent variable is expressed as the share of exports financed on OA terms. Giventhat shares are bounded between zero and one, the appropriate empirical strategy wouldinvolve estimating a fractional response model for the panel data as described by Papke andWooldridge 2008. As illustrated in Appendix Table 10 our conclusions are robust to thisalternative strategy. We find that the share of trade financed by Turkish exporters is posi-tively related to the institutional quality in the destination market. The effect is statisticallysignificant for three of four proxies we have used (it is not robust when institutional qualityis proxied by the duration of the legal procedure). As this model does not lend itself well toincluding a large number of fixed effects, we employ it only in this robustness check.
4.3 Does product differentiation matter?
According to our theoretical predictions, product differentiation matters for the trade fi-nancing decision. The intuition is simple. The more differentiated the product is the moretailored its specifications are to the relationship between the trading partners, and the lowerthe price it commands outside the relationship. Therefore, when the product is highly dif-ferentiated, an improvement in the quality of institutions in the importing country exerts agreater positive marginal effect on the expected profits of the exporter under OA terms.
Our results confirm this theoretical prediction. This can be seen in Table 4
13Both measures are published in the Worldwide Governance Indicators Database of the World Bank.Government effectiveness measures people’s perceptions of the quality of public/civil services, the quality ofpolicy formulation and implementation, and the credibility of the government’s commitment to implementits policies. Regulatory quality measures people’s perceptions of the government’s ability to formulate andimplement sound policies and regulations that promote private sector development.
11
where we allow the estimated coefficients to differ for differentiated products. We find thatproduct differentiation increases the sensitivity of the choice between OA and other financingterms to the quality of institutions in the importing country. This effect is statisticallysignificant in all four specifications, and its magnitude is economically meaningful. A one-standard-deviation increase in institutional quality, as measured by payment timeliness, isassociated with 18 percent higher exports on OA terms relative to others. The correspondingmagnitude for differentiated goods equals 27 percent.
We find that in the case of differentiated products the choice of financing terms is lesssensitive to financing costs in the destination country, which confirms another prediction ofthe model. The intuition is simple. If it is expensive to obtain financing abroad, the benefitsof financing at home are mitigated by the risk posed of trading in differentiated products.
To further test the robustness of our conclusions, we go deeper into product classificationproposed by Rauch (1999). In the first two columns of Appendix Table ?? , we comparethe determinants of export financing for differentiated versus reference-priced goods, in thenext two columns we do so for differentiated versus homogenous goods, and in the final twocolumns we repeat the exercise for reference-priced versus homogenous goods. We find thatthe prevalence of exporter-financing is more sensitive to the importer’s institutional qualitywhen differentiated products are compared to reference-priced and to homogenous goods,but, as expected, the magnitude of the effect is larger in the latter case. We also find thatOA exports are more sensitive to the institutional quality in the case of reference-pricedgoods than homogenous goods, though the difference is statistically significant only in onespecification. All these results are in line with the view that less differentiated products aremuch easier to resell should the importer fail to make a payment.
4.4 Does the level of competition in the export market matter forthe choice of financing?
Our theoretical framework suggests that exporter-financing (which is more advantageousto the importer) becomes more likely as the bargaining power of the importer increases.This observation is in line with anecdotal evidence. For instance, the Trade Finance Guideprepared by the US Department of Commerce International Trade Administration to assistAmerican companies in conducting export transactions warns: ”Insisting on cash-in-advancecould, ultimately, cause exporters to lose customers to competitors who are willing offer morefavorable payment terms to foreign buyers” (p. 5). It suggests that ”Open account termsmay help win customers in competitive markets” (p. 11).
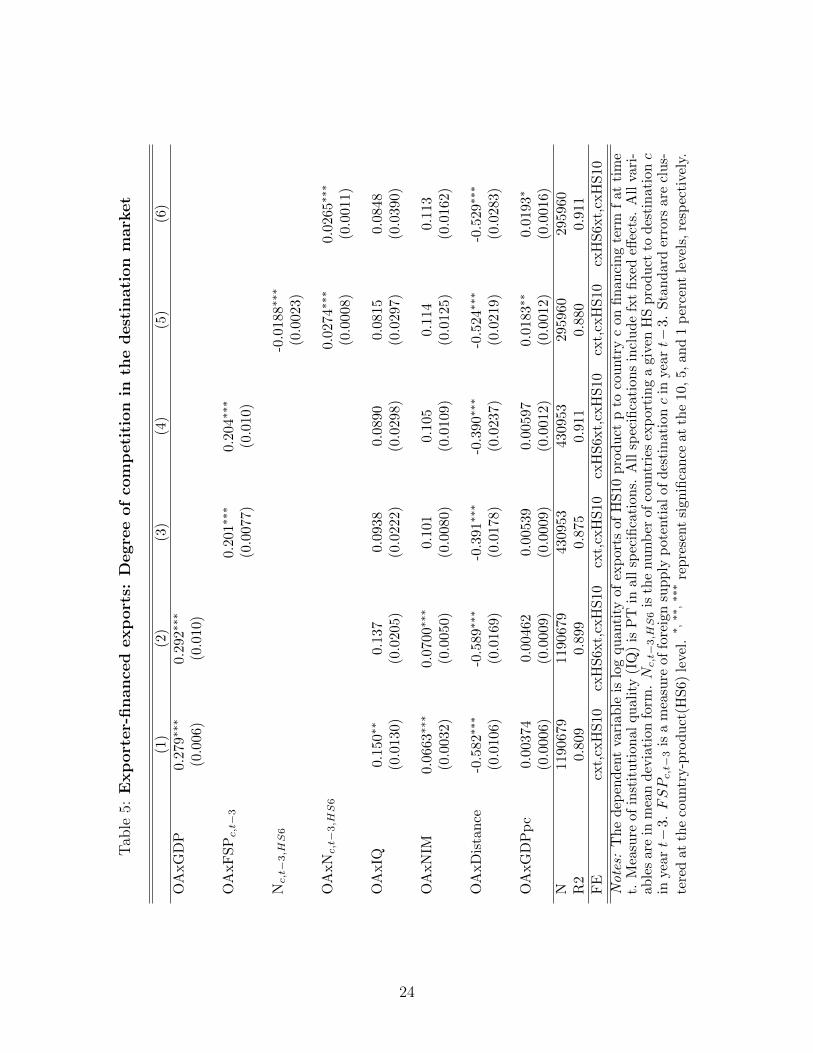
Next we test the hypothesis that exporter-financing is more prevalent in more competitivemarkets. We proxy for the level of competition in the destination market in several ways. Wefollow Mayer, Melitz and Ottaviano (2014) by employing either the total GDP or a foreignsupply potential. The latter measure was first introduced by Redding and Venables (2004). Itcaptues the aggregate predicted exports of the destination country c based on a bilateral tradegravity equation (in logs) with exporter fixed effects and the standard bilateral measures oftrade barriers/enhancers such as contiguity and distance. As an alternative measure, we usethe number of trading parterns from which country c imports a given HS6 product in a givenyear. To mitigate endogeneity concerns related to the latter two measures, we lag them by
12
three periods.The results, presented in Table 5, are in line with our hypothesis. They indicate that
while Turkey exports a lower quantity of goods to more competitive markets (as measuredby the number of alternative suppliers), it is more likely to do so on open account terms.The latter finding is true for all three competition proxies. The magnitudes of the estimatedeffects are economically meaningful. The foreign supplier potential of Germany was in 20110.75 standard deviation higher than the corresponding figure for China. This difference inthe toughness of competition corresponds to a 50% higher OA exports (relative to CIA andLC exports) in Germany than in China. Similarly, the number of countries exporting toGermany (averaged over all HS6 products) was in 2011 0.55 standard deviation higher thanthe number of countries exporting to China, which corresponds to a 30% difference in OArelative to non-OA exports between the two countries.
Next, we pose that if Turkish producers are disadvantaged in destination country c becausethey face higher tariffs than their competitors, they may be under greater pressure to offerexport financing. To test this conjecture we calculate the relative tariff applied to Turkishand to Chinese exports of a given 6-digit HS product in country c at time t. We use eithera continuous measure or a dummy variable taking on the value of one if Turkey faces highertariffs than China, and 0 otherwise. Again to mitigate potential endogeneity concerns, we lagboth measures by three periods. We exclude from the sample textiles and clothing as theywere subject to quota under the MFA. The estimated results, presented in Table 6 , conformto our expectations. They indicate that being disadvantaged in terms of market access givesTurkish producers incentive to provide financing. Again the magnitude of the estimatedeffects are meaningful. Being disadvantaged in terms of tariff treatment is associated with a19% increase in exporter-financed trade relative to trade on other terms.14
5 Identification Strategy Relying on Exogenous Shocks
In the final part of our paper, we exploit in our identification strategy two exogenous shockstaking place during our sample period. The shocks in question are the end of the Multi-fiberArrangment and the Great Recession of 2009.
5.1 The end of the Multi-fiber Arrangement
As explained earlier, the Multi-fiber Arrangement governed global trade in textiles andclothing by means of bilateral quotas until January 1, 2005. In our analysis, we exploitthe fact that Turkey was not subject to any quotas in the European Union after forming acustoms union with the EU in 1996. Thus the end of the MFA constituted a large shock tothe competition level experienced by Turkey in the EU market. Moreover, what is useful forour analysis is the fact that the competitive shock was not the same for all products, as theMFA quotas were not binding in all products.
Our exercise follows a difference-in-differences strategy. We ask whether in products wherethe MFA quotas were initially binding (treated products), Turkey experienced a greater shift
14This calculation is based on the results from the last column which includes HS6 product-country-yearfixed effects.
13
towards exported-financed exports in the post-MFA period. We narrow our attention to theproducts falling under the MFA rules and to Turkish exports destined for the EU market.More specifically, we estimate the following model:
ln(Xcpt,OA)− ln(Xcpt,nonOA) = γ0 + γ1Postt ∗ TreatedHS6 + γ2Postt + αp + αc + ΘZct + εcpt
where Treated = QuotafilledHS6,Max fill rateHS6 and t = 2004, 2008
When defining treated products we focus on the three largest suppliers of textiles andclothing to the EU: China, India and Bangladesh. We use the standard definition of a quotabeing binding if its fill rate exceeded 90 percent. More precisely, we define a treated productas a 6-digit HS product in which the quota faced by at least one of the three suppliersmentioned was binding:
QuotafilledHS6 = 1 if ∃ i ∈ CHN,BGD, IND s.t. fill ratei,HS6,2004> 0.9
QuotafilledHS6 = 0 if ∀ fill ratei,HS6,2004< 0.9
In the analysis, we use a dummy for treated 6-digit HS products or a continuous variablecapturing the highest quota fill rate in a given 6-digit HS product in 2004 relevant to the threecountries mentioned. The data on quota fill rates come from Systeme Integre de Gestion deLicenses which publishes quota levels for EU imports of all textile and clothing categoriesby source country.15
Even though the MFA formally ended in 2005, China continued to face quotas in the EUuntil 2007. Therefore, in our analysis we compare trade in 2004 (last year under the MFA)to trade in 2008 (first year with no quota faced by the three countries considered).
The model includes the other determinants of financing terms used in our earlier specifi-cations as well as country fixed effects and 10-digit HS product fixed effects.16 Note that wedo not need to include a dummy for treated products, as our specification includes productfixed effects.
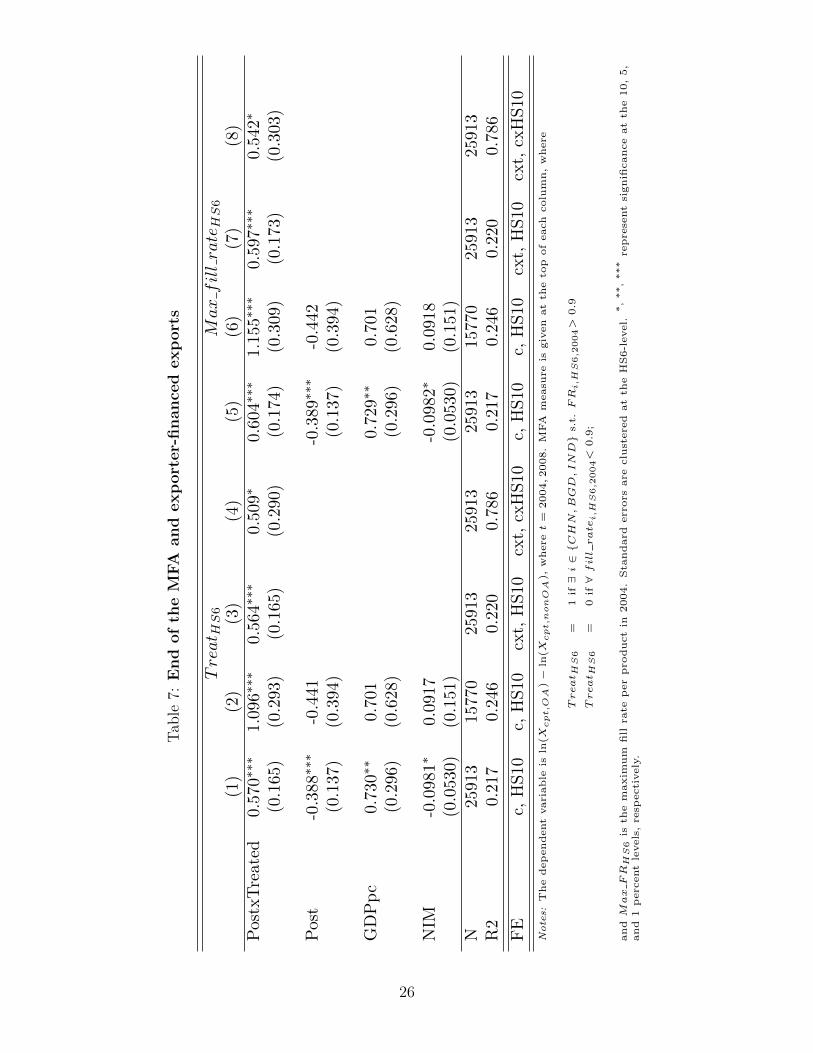
The estimation results, based on the treatment dummy and presented in the first column ofTable 7 , confirm our theoretical predictions. Turkish exporters disproportionately increasedtheir OA exports (relative to exports financed in other ways) in products in which theyexperienced a competitive shock. Our post-MFA year, 2008, coincides with the beginningof the financial criss. To ensure that our results capture the shock we intend to capturerather than the effects of the crisis, we exclude from the sample countries affected by thecrisis.17 Our results are robust to this modification. In column 3 we include country-yearfixed effects, and in column 4 we additionally include country-product fixed effects. Ourresults remain unchanged. In the subsequent four columns, we replicate the same estimation
15We would like to thank Amit Khandelwal, Peter Schott, and Shang-Jin Wei for kindly sharing additionaldata they used in Khandelwal et al. 2013
16We exclude distance which does not vary over time and institutional quality which varies very littlebetween 2004 and 2008.
17We identify crisis-affected countries based on the database constructed by Laeven and Valencia (2013).
14
but use the maximum fill rate (instead of the treatment dummy). The results again supportour theoretical prediction by suggesting that increase in competition is associated with ashift towards exporter-financed trade.
5.2 What happened during the recent crisis?
In the final exercise, we investigate how financing of Turkish exports changed during therecent financial crisis. In contrast to many of its trading partners, the Turkish economyrecovered relatively quickly from the Great Recession with its banking sector weathering thecrisis times unscathed (Uygur 2010).
In our view, the crisis had two implications for Turkish exporters. The negative demandshock taking place in crisis-afflicted countries meant tougher competitive environment forTurkish suppliers. The crisis also meant more restricted access to credit (or even creditdrying out) for many of Turkey’s trading partners. We would expect both shocks to moveTurkish exports toward being financed by Turkish producers.
To examine the above hypothesis we again engage in a difference-in-differences estimation.We examine whether Turkish exports on OA terms increased relative to non-OA exportswhen destined to crisis-affected countries in the post-crisis period:
ln(Xcpt,OA)− ln(Xcpt,nonOA) = δ0 + δ1Postt ∗ In crisisc + δ2Postt + αc,HS6 + αHS10 + ΠZct + εcpt
where t = 2006, 2009
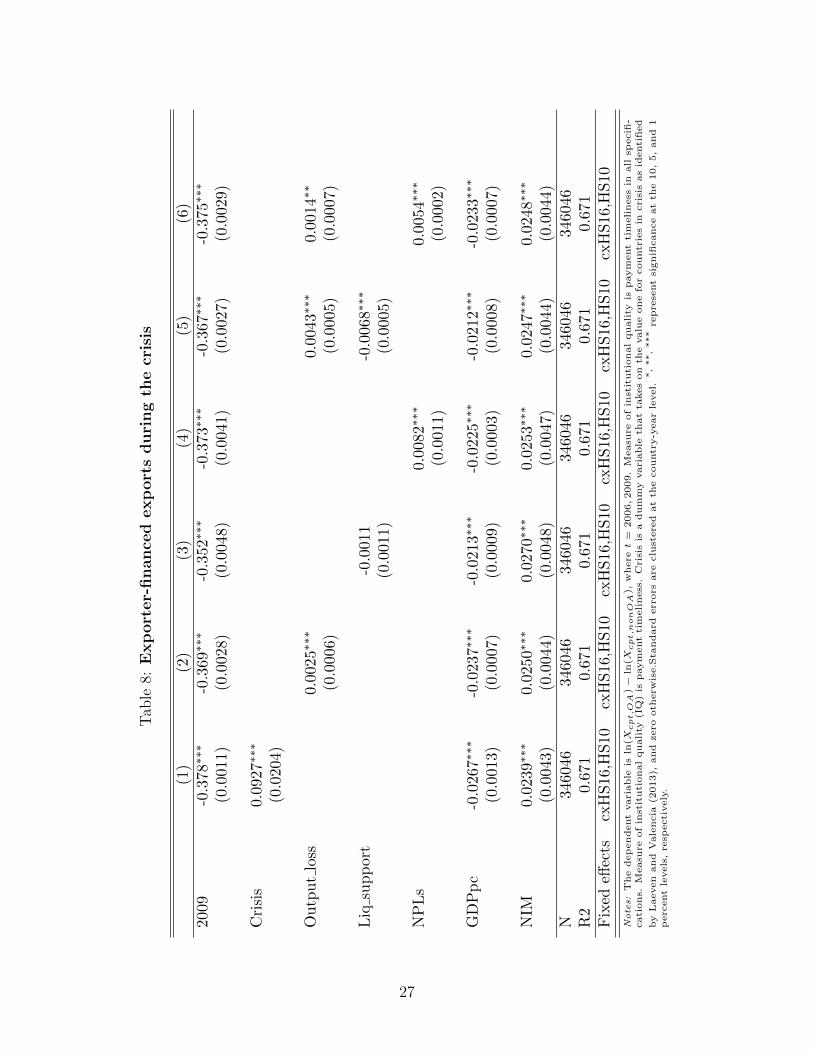
Our pre-crisis period is defined as 2006, while 2009 is denoted as the crisis time. The modelincludes country-HS6-product and HS10-product fixed effects. The indicator In crisis takeson the value one if country c is affected by a financial crisis at time t, and zero otherwise,where crises are identified as in Laeven and Valencia (2013).
Laeven and Valencia 2013 focus on systemic banking sector crises that are characterizedby (i) noticeable signs of financial distress (such as bank runs, losses suffered by the bankingsector, and bank liquidations), and (ii) significant banking sector intervention measurestaken as a response to realized losses in the banking system. Such interventions includeat least three out of the following: six deposit freezes and/or bank holidays, significantbank nationalizations, bank restructuring gross costs, extensive liquidity support, significantguarantees put in place, and significant asset purchases. Laeven and Valencia 2013 considerthe second criterion, if significant, as a sufficient condition for identifying a banking crisis.The results, presented in Table 8 , are in line with our expectations. While we find that in2009 OA exports declined relative to exports on other financing terms, OA exports increasedin relative terms to countries afflicted by the financial crisis (see column 1).
In the subsequent columns, we control for the depths of the crisis by multiplying theIn crisis indicator with the variables capturing the depth of the crisis in terms output loss,liquidity support, and peak non-performing loans (NPLs), all obtained from Laeven andValencia (2013). Output loss is defined as the cumulative sum of the differences between theactual and the trend real GDP over the period [T ;T + 3], expressed as a percentage of thetrend real GDP, where T denotes the starting year of the crisis. Liquidity support is defined
15
as the ratio of central bank claims on deposit money banks and liquidity support from theTreasury to total deposits and liabilities to non-residents. NPLs measure the share of non-performing loans to total loans. All of these time-invariant variables are expressed in meandeviation form. During the non-crisis years (as defined by Laeven and Valencia), they areset to zero. As expected, we find that severity of the crisis affecting the importer increasesthe prevalence of exporter financing. The estimated effects are statistically significant in twoof three specifications.
In an attempt to shed light on which of the channels pushed Turkish exports towards OAterms, we estimate specifications including: (i) both output loss and liquidity support, and(ii) both output loss and NPL. We view output loss as a proxy for the negative demandshock and the two other variables as proxies for the trading partners’ restrictions in accessto credit. As evident from columns 5 and 6, both channels appeared to have been at work.
6 Conclusions
This study conducts the first comprehensive empirical test of the theory of financing termsin international trade. To do so, we use a unique dataset that provides a break-down ofTurkey’s exports by three main financing terms (OA, CIA, and LC), destination countryand the 10-digit HS product during the period 2004-2012.
In addition to examining the existing predictions on the impact of institutional qualityand financial sector development in the export market on the choice of trade financing, wealso examine, for the first time, the link between the extent of competition in the destinationcountry and the choice of financing terms. To do so, we exploit two exogenous shocks takingplace during our sample period: the end of the MFA and the Great Recession.
Our results give support to the theoretical predictions. They suggest that exporter-financed exports increase relative to importer/bank-financed exports when destined for coun-tries with better institutions. The magnitude of this effect is larger for differentiated prod-ucts. We also find that exporter-financing increases with the cost of financing in the desti-nation market and that this effect is weaker for differentiated products. Most importantly,we show that higher competition in export markets, and thus greater bargaining power ofimporters, is associated with more exporter-financed trade.
References
Amiti, Mary, and David E. Weinstein. 2011. “Exports and Financial Shocks.” TheQuarterly Journal of Economics, 126(4): 1841–1877.
Antras, Pol, and C. Fritz Foley. 2013. “Poultry in Motion: A Study of InternationalTrade Finance Practices.” Mimeo, Harvard University.
Chaney, Thomas. 2013. “Liquidity Constrained Exporters.” National Bureau of EconomicResearch Working Paper 19170.
16
Demirguc, Asli, and Harry Huizinga. 1999. “Determinants of Commercial Bank InterestMargins and Profitability: Some International Evidence.” World Bank Economic Review,13(2): 379–408.
Greenaway, David, Alessandra Guariglia, and Richard Kneller. 2007. “Financialfactors and exporting decisions.” Journal of International Economics, 73(2): 377–395.
Hoefele, Andreas, Tim Schmidt-Eisenlohr, and Zhihong Yu. 2013. “Payment Choicein International Trade: Theory and Evidence from Cross-country Firm Level Data.”
Khandelwal, Amit K., Peter K. Schott, and Shang-Jin Wei. 2013. “Trade Liberaliza-tion and Embedded Institutional Reform: Evidence from Chinese Exporters.” AmericanEconomic Review, 103(6): 2169–95.
Laeven, L., and F. Valencia. 2013. “Systemic Banking Crises Database.” IMF EconomicReview, 61(2): 225–270.
Manova, Kalina. 2013. “Credit Constraints, Heterogeneous Firms, and InternationalTrade.” Review of Economic Studies, 80: 711–744.
Mayer, Thierry, Marc J. Melitz, and Gianmarco I. P. Ottaviano. 2014. “Mar-ket Size, Competition, and the Product Mix of Exporters.” American Economic Review,104(2): 495–536.
Papke, Leslie E., and Jeffrey M. Wooldridge. 2008. “Panel data methods for fractionalresponse variables with an application to test pass rates.” Journal of Econometrics, 145(1-2): 121–133.
Rauch, James E. 1999. “Networks versus markets in international trade.” Journal of In-ternational Economics, 48(1): 7–35.
Rauch, James E., and Vitor Trindade. 2002. “Ethnic Chinese Networks In InternationalTrade.” The Review of Economics and Statistics, 84(1): 116–130.
Redding, Stephen, and Anthony J. Venables. 2004. “Economic geography and inter-national inequality.” Journal of International Economics, 62(1): 53–82.
Schmidt-Eisenlohr, Tim. 2013. “Towards a theory of trade finance.” Journal of Interna-tional Economics, 91(1): 96–112.
Uygur, Ercan. 2010. “The Global Crisis And The Turkish Economy.”
17
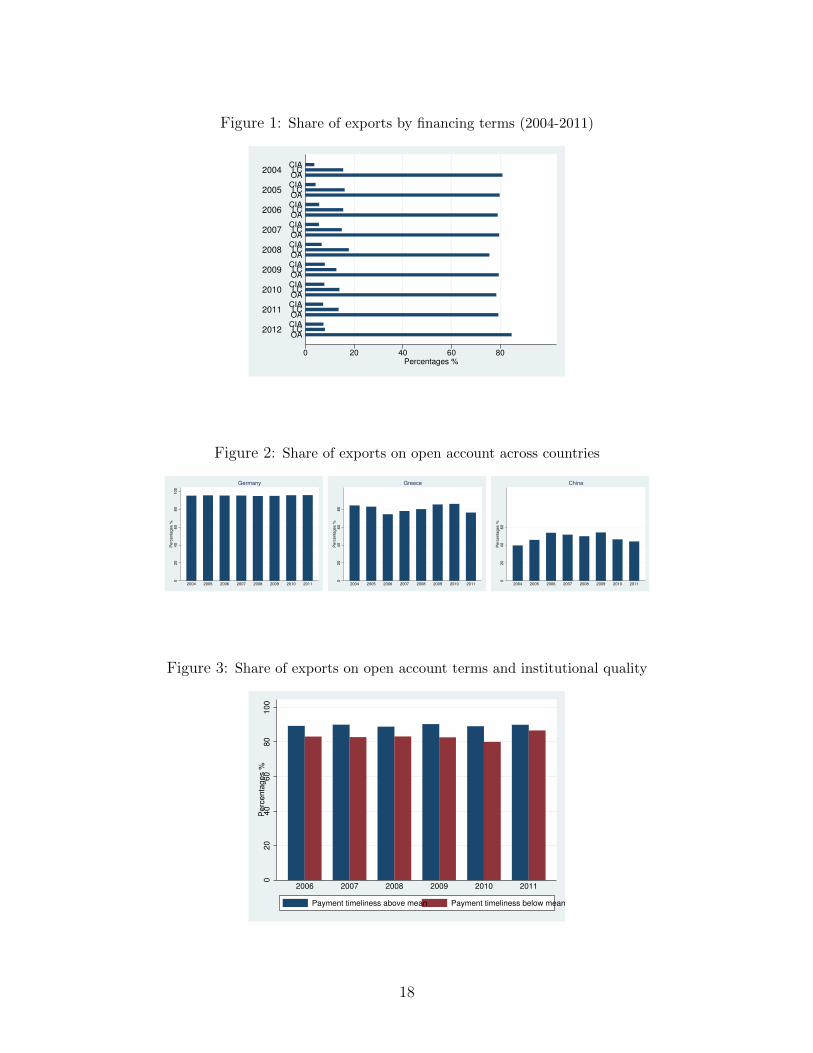
Figure 1: Share of exports by financing terms (2004-2011)
0 20 40 60 80Percentages %
2012
2011
2010
2009
2008
2007
2006
2005
2004
OALC
CIAOALC
CIAOALC
CIAOALC
CIAOALC
CIAOALC
CIAOALC
CIAOALC
CIAOALC
CIA
Figure 2: Share of exports on open account across countries
020
40
60
80
100
Perc
enta
ges %
2004 2005 2006 2007 2008 2009 2010 2011
Germany
020
40
60
80
Perc
enta
ges %
2004 2005 2006 2007 2008 2009 2010 2011
Greece
020
40
60
Perc
enta
ges %
2004 2005 2006 2007 2008 2009 2010 2011
China
Figure 3: Share of exports on open account terms and institutional quality
020
40
60
80
100
Perc
enta
ges %
2006 2007 2008 2009 2010 2011
Payment timeliness above mean Payment timeliness below mean
18
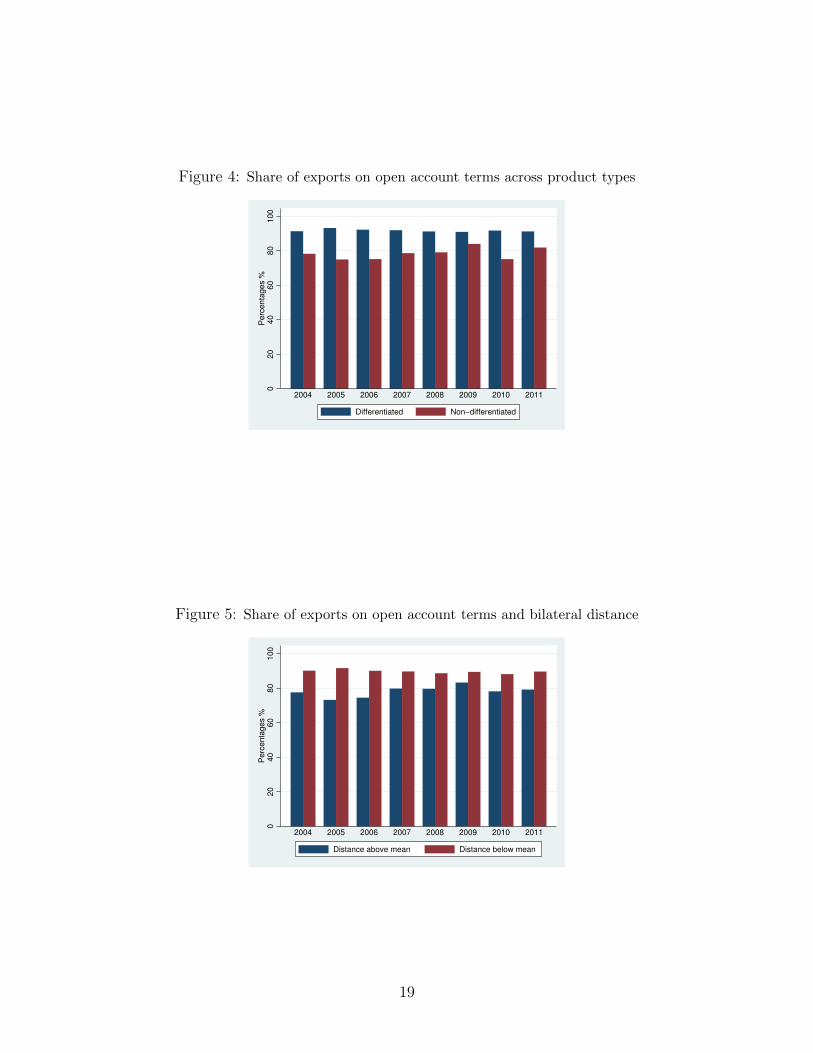
Figure 4: Share of exports on open account terms across product types
020
40
60
80
100
Perc
enta
ges %
2004 2005 2006 2007 2008 2009 2010 2011
Differentiated Non−differentiated
Figure 5: Share of exports on open account terms and bilateral distance
020
40
60
80
100
Perc
enta
ges %
2004 2005 2006 2007 2008 2009 2010 2011
Distance above mean Distance below mean
19
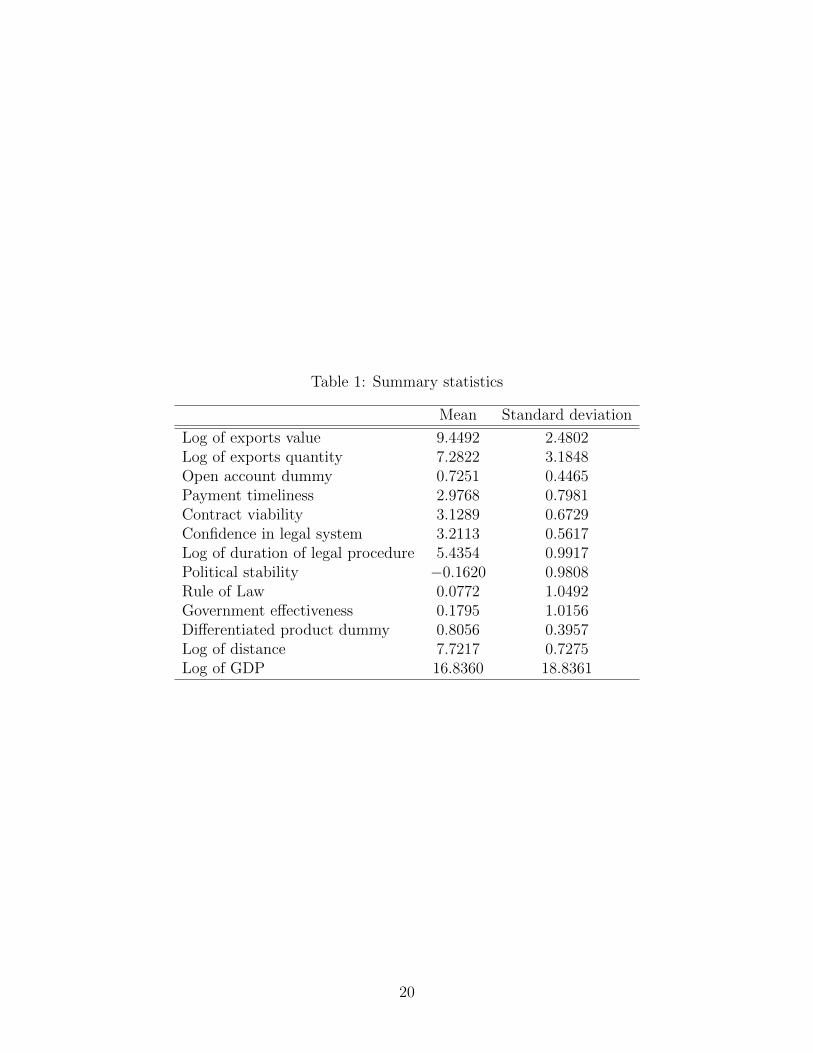
Table 1: Summary statistics
Mean Standard deviation
Log of exports value 9.4492 2.4802Log of exports quantity 7.2822 3.1848Open account dummy 0.7251 0.4465Payment timeliness 2.9768 0.7981Contract viability 3.1289 0.6729Confidence in legal system 3.2113 0.5617Log of duration of legal procedure 5.4354 0.9917Political stability −0.1620 0.9808Rule of Law 0.0772 1.0492Government effectiveness 0.1795 1.0156Differentiated product dummy 0.8056 0.3957Log of distance 7.7217 0.7275Log of GDP 16.8360 18.8361
20
Tab
le2:
Exp
ort
er-
finan
ced
exp
ort
sand
inst
ituti
onal
quali
ty:
Base
line
speci
fica
tions
Pay
men
tti
mel
ines
sC
ontr
act
via
bil
ity
(1)
(2)
(3)
(4)
(5)
(6)
(7)
(8)
OA
xIQ
0.38
5∗∗∗
0.44
0∗∗
∗0.2
94∗∗
∗0.2
84∗
∗∗0.3
07∗∗
∗0.3
44∗∗
∗0.1
93∗∗
0.2
02∗
(0.0
385)
(0.0
558)
(0.0
676)
(0.1
05)
(0.0
530)
(0.0
778)
(0.0
758)
(0.1
21)
OA
xN
IM0.
0112
0.01
350.0
393∗
∗0.0
424∗
-0.0
159
-0.0
156
0.0
316∗
0.0
356
(0.0
121)
(0.0
191)
(0.0
168)
(0.0
256)
(0.0
141)
(0.0
220)
(0.0
170)
(0.0
258)
OA
xD
ista
nce
-0.4
14∗∗
∗-0
.416
∗∗∗
-0.4
43∗
∗∗-0
.434∗∗
∗-0
.359∗∗
∗-0
.344∗∗
∗-0
.409∗
∗∗-0
.398∗∗
∗
(0.0
288)
(0.0
409)
(0.0
398)
(0.0
626)
(0.0
306)
(0.0
434)
(0.0
408)
(0.0
637)
OA
xG
DP
pc
0.0
112∗∗
∗0.0
127∗
∗0.0
147∗
∗∗0.0
158∗
∗∗
(0.0
0352)
(0.0
0552)
(0.0
0315)
(0.0
0484)
N12
0216
312
0216
31190679
1190679
1202163
1202163
1190679
1190679
R2
0.59
60.
807
0.8
08
0.8
97
0.5
95
0.8
06
0.8
07
0.8
97
FE
cxt,
HS
10xt
cxt,
cxH
S10
cxt,
cxH
S10
cxH
S6xt,
cxH
S10
cxt,
HS
10xt
cxt,
cxH
S10
cxt,
cxH
S10
cxH
S6xt,
cxH
S10
Notes:
Th
ed
epen
den
tva
riab
leis
log
qu
anti
tyof
exp
ort
sof
HS
10
pro
du
ctp
toco
untr
yc
on
fin
an
cin
gte
rmf
at
tim
et.
Mea
sure
ofin
stit
uti
onal
qu
alit
y(I
Q)
isgi
ven
atth
eto
pof
each
colu
mn
.P
Tan
dC
Vst
an
dfo
rp
aym
ent
tim
elin
ess
an
dco
ntr
act
via
bil
ity,
resp
ecti
vely
.A
llsp
ecifi
cati
ons
incl
ud
efx
tfi
xed
effec
ts.
All
vari
ab
les
are
inm
ean
dev
iati
on
form
.S
tan
dard
erro
rsare
clu
ster
edat
the
cou
ntr
y-y
ear
leve
l.*,**,***
rep
rese
nt
sign
ifica
nce
at
the
10,
5,
an
d1
per
cent
leve
ls,
resp
ecti
vely
.
21
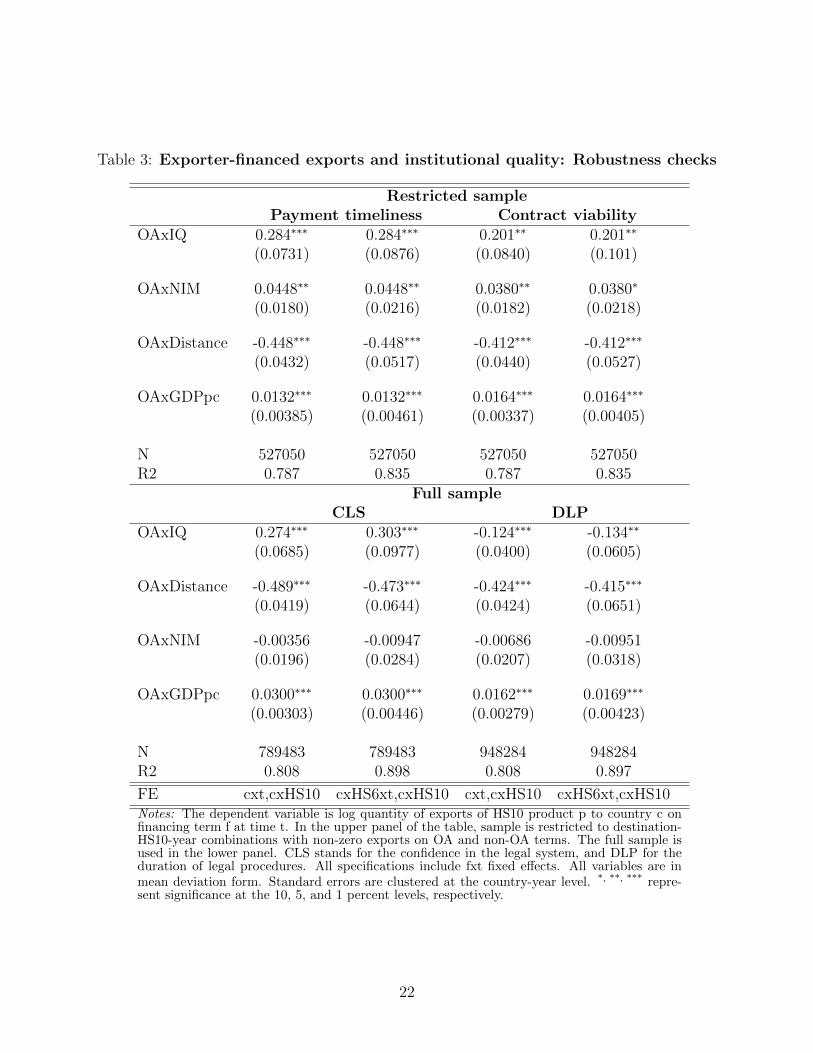
Table 3: Exporter-financed exports and institutional quality: Robustness checks
Restricted samplePayment timeliness Contract viability
OAxIQ 0.284∗∗∗ 0.284∗∗∗ 0.201∗∗ 0.201∗∗
(0.0731) (0.0876) (0.0840) (0.101)
OAxNIM 0.0448∗∗ 0.0448∗∗ 0.0380∗∗ 0.0380∗
(0.0180) (0.0216) (0.0182) (0.0218)
OAxDistance -0.448∗∗∗ -0.448∗∗∗ -0.412∗∗∗ -0.412∗∗∗
(0.0432) (0.0517) (0.0440) (0.0527)
OAxGDPpc 0.0132∗∗∗ 0.0132∗∗∗ 0.0164∗∗∗ 0.0164∗∗∗
(0.00385) (0.00461) (0.00337) (0.00405)
N 527050 527050 527050 527050R2 0.787 0.835 0.787 0.835
Full sampleCLS DLP
OAxIQ 0.274∗∗∗ 0.303∗∗∗ -0.124∗∗∗ -0.134∗∗
(0.0685) (0.0977) (0.0400) (0.0605)
OAxDistance -0.489∗∗∗ -0.473∗∗∗ -0.424∗∗∗ -0.415∗∗∗
(0.0419) (0.0644) (0.0424) (0.0651)
OAxNIM -0.00356 -0.00947 -0.00686 -0.00951(0.0196) (0.0284) (0.0207) (0.0318)
OAxGDPpc 0.0300∗∗∗ 0.0300∗∗∗ 0.0162∗∗∗ 0.0169∗∗∗
(0.00303) (0.00446) (0.00279) (0.00423)
N 789483 789483 948284 948284R2 0.808 0.898 0.808 0.897
FE cxt,cxHS10 cxHS6xt,cxHS10 cxt,cxHS10 cxHS6xt,cxHS10Notes: The dependent variable is log quantity of exports of HS10 product p to country c onfinancing term f at time t. In the upper panel of the table, sample is restricted to destination-HS10-year combinations with non-zero exports on OA and non-OA terms. The full sample isused in the lower panel. CLS stands for the confidence in the legal system, and DLP for theduration of legal procedures. All specifications include fxt fixed effects. All variables are inmean deviation form. Standard errors are clustered at the country-year level. *, **, *** repre-sent significance at the 10, 5, and 1 percent levels, respectively.
22
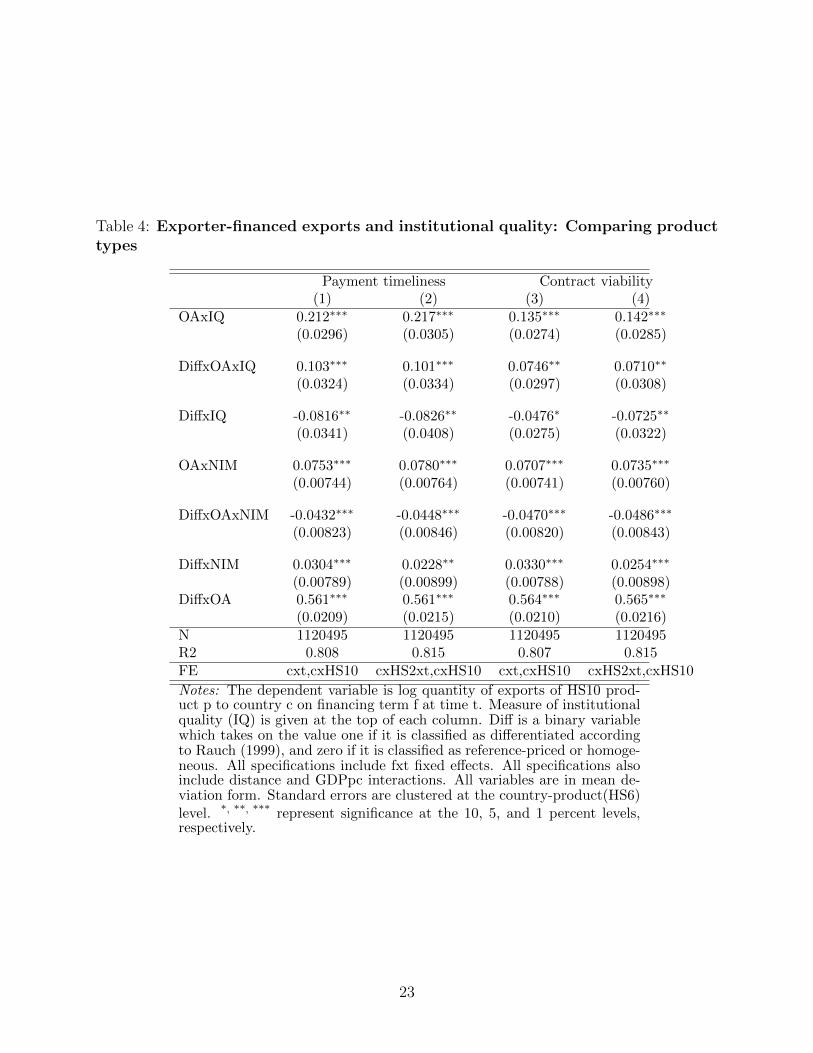
Table 4: Exporter-financed exports and institutional quality: Comparing producttypes
Payment timeliness Contract viability(1) (2) (3) (4)
OAxIQ 0.212∗∗∗ 0.217∗∗∗ 0.135∗∗∗ 0.142∗∗∗
(0.0296) (0.0305) (0.0274) (0.0285)
DiffxOAxIQ 0.103∗∗∗ 0.101∗∗∗ 0.0746∗∗ 0.0710∗∗
(0.0324) (0.0334) (0.0297) (0.0308)
DiffxIQ -0.0816∗∗ -0.0826∗∗ -0.0476∗ -0.0725∗∗
(0.0341) (0.0408) (0.0275) (0.0322)
OAxNIM 0.0753∗∗∗ 0.0780∗∗∗ 0.0707∗∗∗ 0.0735∗∗∗
(0.00744) (0.00764) (0.00741) (0.00760)
DiffxOAxNIM -0.0432∗∗∗ -0.0448∗∗∗ -0.0470∗∗∗ -0.0486∗∗∗
(0.00823) (0.00846) (0.00820) (0.00843)
DiffxNIM 0.0304∗∗∗ 0.0228∗∗ 0.0330∗∗∗ 0.0254∗∗∗
(0.00789) (0.00899) (0.00788) (0.00898)DiffxOA 0.561∗∗∗ 0.561∗∗∗ 0.564∗∗∗ 0.565∗∗∗
(0.0209) (0.0215) (0.0210) (0.0216)N 1120495 1120495 1120495 1120495R2 0.808 0.815 0.807 0.815FE cxt,cxHS10 cxHS2xt,cxHS10 cxt,cxHS10 cxHS2xt,cxHS10
Notes: The dependent variable is log quantity of exports of HS10 prod-uct p to country c on financing term f at time t. Measure of institutionalquality (IQ) is given at the top of each column. Diff is a binary variablewhich takes on the value one if it is classified as differentiated accordingto Rauch (1999), and zero if it is classified as reference-priced or homoge-neous. All specifications include fxt fixed effects. All specifications alsoinclude distance and GDPpc interactions. All variables are in mean de-viation form. Standard errors are clustered at the country-product(HS6)level. *, **, *** represent significance at the 10, 5, and 1 percent levels,respectively.
23
Tab
le5:
Exp
ort
er-
finan
ced
exp
ort
s:D
egre
eof
com
peti
tion
inth
edest
inati
on
mark
et
(1)
(2)
(3)
(4)
(5)
(6)
OA
xG
DP
0.27
9∗∗
∗0.
292∗∗
∗
(0.0
06)
(0.0
10)
OA
xF
SPc,t−3
0.2
01∗∗
∗0.2
04∗∗
∗
(0.0
077
)(0
.010)
Nc,t−3,H
S6
-0.0
188∗∗
∗
(0.0
023)
OA
xN
c,t−3,H
S6
0.02
74∗∗
∗0.
0265
∗∗∗
(0.0
008
)(0
.001
1)
OA
xIQ
0.15
0∗∗
0.13
70.
0938
0.0
890
0.0
815
0.08
48
(0.0
130
)(0
.020
5)(0
.0222)
(0.0
298)
(0.0
297)
(0.0
390
)
OA
xN
IM0.
0663
∗∗∗
0.07
00∗∗
∗0.
101
0.10
50.
114
0.11
3(0
.003
2)(0
.005
0)(0
.0080
)(0
.010
9)
(0.0
125)
(0.0
162
)
OA
xD
ista
nce
-0.5
82∗∗
∗-0
.589∗
∗∗-0
.391∗∗
∗-0
.390
∗∗∗
-0.5
24∗∗
∗-0
.529
∗∗∗
(0.0
106)
(0.0
169)
(0.0
178)
(0.0
237
)(0
.021
9)(0
.0283
)
OA
xG
DP
pc
0.00
374
0.00
462
0.005
390.0
0597
0.0
183∗
∗0.
0193
∗
(0.0
006)
(0.0
009)
(0.0
009)
(0.0
012
)(0
.001
2)(0
.0016
)N
119
0679
1190
679
43095
3430
953
2959
6029
5960
R2
0.80
90.
899
0.875
0.91
10.
880
0.9
11F
Ecx
t,cx
HS10
cxH
S6x
t,cx
HS10
cxt,
cxH
S10
cxH
S6x
t,cx
HS10
cxt,
cxH
S10
cxH
S6xt,
cxH
S10
Notes:
The
dep
enden
tva
riab
leis
log
quanti
tyof
exp
orts
ofH
S10
pro
duct
pto
countr
yc
onfinanci
ng
term
fat
tim
et.
Mea
sure
ofin
stit
uti
onal
qual
ity
(IQ
)is
PT
inal
lsp
ecifi
cati
ons.
All
spec
ifica
tion
sin
clude
fxt
fixed
effec
ts.
All
vari
-ab
les
are
inm
ean
dev
iati
onfo
rm.N
c,t−3,H
S6
isth
enum
ber
of
countr
ies
exp
orti
ng
agiv
enH
Spro
duct
todes
tinat
ionc
inye
art−
3.FSPc,t−3
isa
mea
sure
offo
reig
nsu
pply
pot
enti
al
of
des
tinati
onc
inye
art−
3.
Sta
ndard
erro
rsare
clus-
tere
dat
the
countr
y-p
roduct
(HS6)
leve
l.*,**,***
repre
sent
sign
ifica
nce
atth
e10,
5,
and
1p
erce
nt
leve
ls,
resp
ecti
vel
y.
24
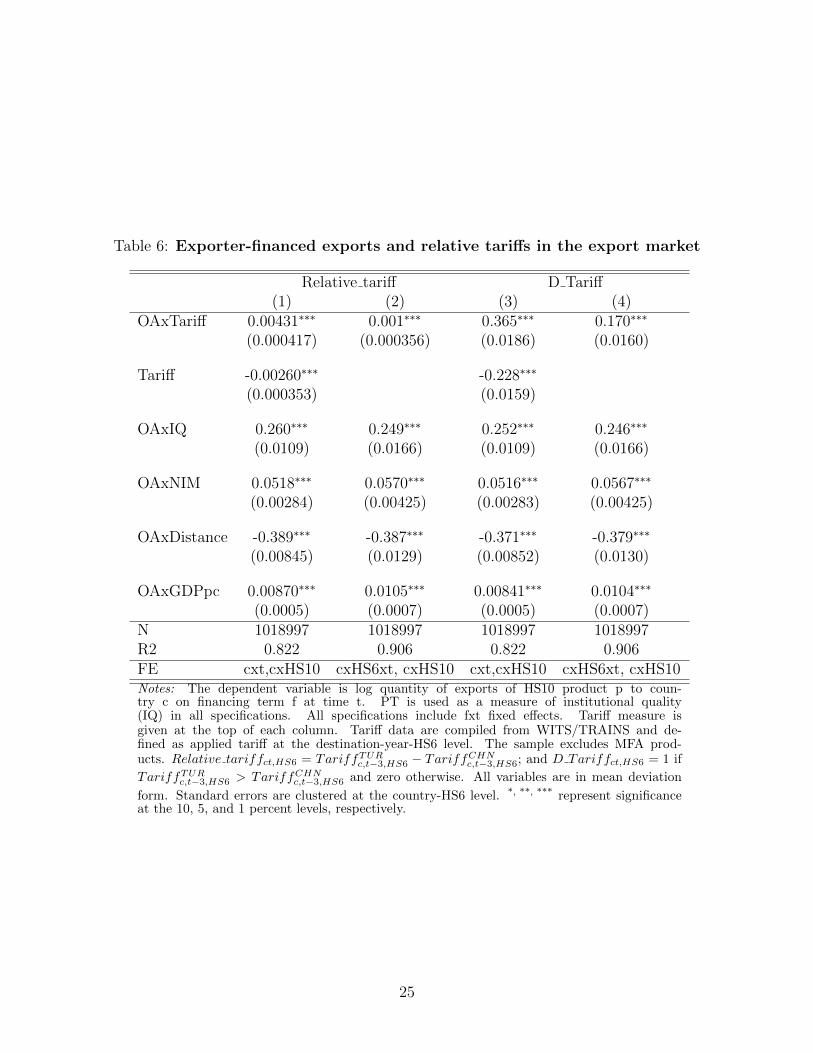
Table 6: Exporter-financed exports and relative tariffs in the export market
Relative tariff D Tariff(1) (2) (3) (4)
OAxTariff 0.00431∗∗∗ 0.001∗∗∗ 0.365∗∗∗ 0.170∗∗∗
(0.000417) (0.000356) (0.0186) (0.0160)
Tariff -0.00260∗∗∗ -0.228∗∗∗
(0.000353) (0.0159)
OAxIQ 0.260∗∗∗ 0.249∗∗∗ 0.252∗∗∗ 0.246∗∗∗
(0.0109) (0.0166) (0.0109) (0.0166)
OAxNIM 0.0518∗∗∗ 0.0570∗∗∗ 0.0516∗∗∗ 0.0567∗∗∗
(0.00284) (0.00425) (0.00283) (0.00425)
OAxDistance -0.389∗∗∗ -0.387∗∗∗ -0.371∗∗∗ -0.379∗∗∗
(0.00845) (0.0129) (0.00852) (0.0130)
OAxGDPpc 0.00870∗∗∗ 0.0105∗∗∗ 0.00841∗∗∗ 0.0104∗∗∗
(0.0005) (0.0007) (0.0005) (0.0007)N 1018997 1018997 1018997 1018997R2 0.822 0.906 0.822 0.906FE cxt,cxHS10 cxHS6xt, cxHS10 cxt,cxHS10 cxHS6xt, cxHS10Notes: The dependent variable is log quantity of exports of HS10 product p to coun-try c on financing term f at time t. PT is used as a measure of institutional quality(IQ) in all specifications. All specifications include fxt fixed effects. Tariff measure isgiven at the top of each column. Tariff data are compiled from WITS/TRAINS and de-fined as applied tariff at the destination-year-HS6 level. The sample excludes MFA prod-ucts. Relative tariffct,HS6 = TariffTUR
c,t−3,HS6 − TariffCHNc,t−3,HS6; and D Tariffct,HS6 = 1 if
TariffTURc,t−3,HS6 > TariffCHN
c,t−3,HS6 and zero otherwise. All variables are in mean deviation
form. Standard errors are clustered at the country-HS6 level. *, **, *** represent significanceat the 10, 5, and 1 percent levels, respectively.
25
Tab
le7:
End
of
the
MFA
and
exp
ort
er-
finance
dexp
ort
s
Treat H
S6
Maxfillrate
HS6
(1)
(2)
(3)
(4)
(5)
(6)
(7)
(8)
Pos
txT
reat
ed0.
570∗
∗∗1.
096∗∗
∗0.
564
∗∗∗
0.5
09∗
0.6
04∗∗
∗1.1
55∗∗
∗0.5
97∗∗
∗0.5
42∗
(0.1
65)
(0.2
93)
(0.1
65)
(0.2
90)
(0.1
74)
(0.3
09)
(0.1
73)
(0.3
03)
Pos
t-0
.388
∗∗∗
-0.4
41-0
.389∗
∗∗-0
.442
(0.1
37)
(0.3
94)
(0.1
37)
(0.3
94)
GD
Pp
c0.
730∗∗
0.70
10.7
29∗∗
0.7
01
(0.2
96)
(0.6
28)
(0.2
96)
(0.6
28)
NIM
-0.0
981∗
0.09
17-0
.0982∗
0.0
918
(0.0
530)
(0.1
51)
(0.0
530)
(0.1
51)
N25
913
1577
025
913
25913
25913
15770
25913
25913
R2
0.21
70.
246
0.2
200.7
86
0.2
17
0.2
46
0.2
20
0.7
86
FE
c,H
S10
c,H
S10
cxt,
HS10
cxt,
cxH
S10
c,H
S10
c,H
S10
cxt,
HS10
cxt,
cxH
S10
Notes:
The
dep
endent
vari
able
isln
(Xcpt,O
A)−
ln(X
cpt,n
onO
A),
where
t=
2004,2008.
MFA
measu
reis
giv
en
at
the
top
of
each
colu
mn,
where
Treat H
S6
=1
if∃
i∈C
HN
,BGD
,IN
D
s.t.
FR
i,H
S6,2
004>
0.9
Treat H
S6
=0
if∀
fill
rate
i,H
S6,2
004<
0.9
;
and
Max
FR
HS6
isth
em
axim
um
fill
rate
per
pro
duct
in2004.
Sta
ndard
err
ors
are
clu
stere
dat
the
HS6-l
evel.
*,**,***
repre
sent
signifi
cance
at
the
10,
5,
and
1p
erc
ent
levels
,re
specti
vely
.
26
Tab
le8:
Exp
ort
er-
finance
dexp
ort
sduri
ng
the
cris
is
(1)
(2)
(3)
(4)
(5)
(6)
200
9-0
.378∗∗
∗-0
.369
∗∗∗
-0.3
52∗
∗∗-0
.373∗∗
∗-0
.367∗
∗∗-0
.375∗∗
∗
(0.0
011
)(0
.002
8)(0
.0048)
(0.0
041)
(0.0
027
)(0
.002
9)
Cri
sis
0.092
7∗∗
∗
(0.0
204
)
Ou
tpu
tlo
ss0.
0025
∗∗∗
0.00
43∗∗
∗0.
001
4∗∗
(0.0
006)
(0.0
005
)(0
.0007
)
Liq
sup
por
t-0
.0011
-0.0
068
∗∗∗
(0.0
011)
(0.0
005
)
NP
Ls
0.0
082
∗∗∗
0.005
4∗∗∗
(0.0
011)
(0.0
002)
GD
Pp
c-0
.026
7∗∗∗
-0.0
237∗∗
∗-0
.0213∗∗
∗-0
.022
5∗∗∗
-0.0
212∗∗
∗-0
.023
3∗∗
∗
(0.0
013)
(0.0
007)
(0.0
009)
(0.0
003)
(0.0
008)
(0.0
007
)
NIM
0.02
39∗∗
∗0.0
250∗
∗∗0.0
270∗
∗∗0.0
253∗
∗∗0.
024
7∗∗
∗0.0
248
∗∗∗
(0.0
043)
(0.0
044
)(0
.0048)
(0.0
047)
(0.0
044)
(0.0
044
)N
3460
4634
6046
346046
346046
346
046
346
046
R2
0.67
10.
671
0.6
71
0.6
71
0.671
0.6
71F
ixed
effec
tscx
HS
16,H
S10
cxH
S16
,HS
10cx
HS
16,H
S10
cxH
S16
,HS
10
cxH
S16
,HS
10cx
HS
16,
HS
10
Notes:
The
dep
endent
vari
able
isln
(Xcpt,O
A)−
ln(X
cpt,n
onO
A),
where
t=
2006,2009.
Measu
reof
inst
ituti
onal
quality
ispaym
ent
tim
eliness
inall
specifi
-cati
ons.
Measu
reof
inst
ituti
onal
quality
(IQ
)is
paym
ent
tim
eliness
.C
risi
sis
adum
my
vari
able
that
takes
on
the
valu
eone
for
countr
ies
incri
sis
as
identi
fied
by
Laeven
and
Vale
ncia
(2013),
and
zero
oth
erw
ise.S
tandard
err
ors
are
clu
stere
dat
the
countr
y-y
ear
level.
*,**,***
repre
sent
signifi
cance
at
the
10,
5,
and
1p
erc
ent
levels
,re
specti
vely
.
27

Appendix
28
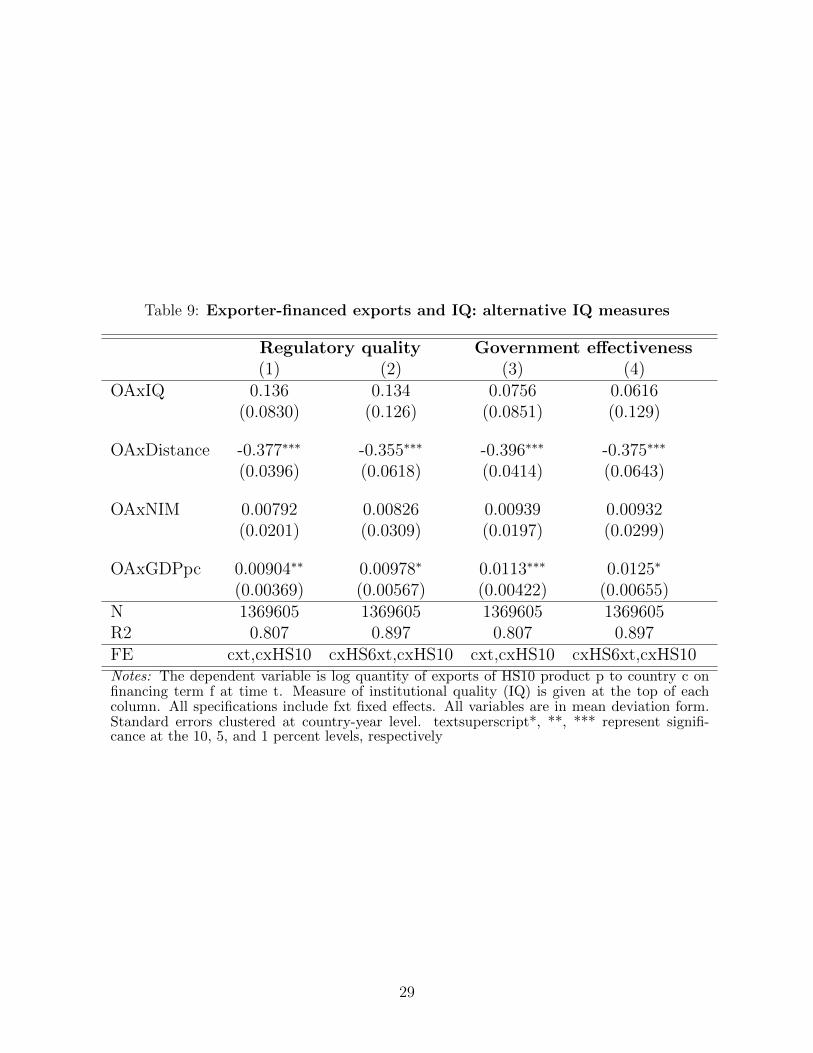
Table 9: Exporter-financed exports and IQ: alternative IQ measures
Regulatory quality Government effectiveness(1) (2) (3) (4)
OAxIQ 0.136 0.134 0.0756 0.0616(0.0830) (0.126) (0.0851) (0.129)
OAxDistance -0.377∗∗∗ -0.355∗∗∗ -0.396∗∗∗ -0.375∗∗∗
(0.0396) (0.0618) (0.0414) (0.0643)
OAxNIM 0.00792 0.00826 0.00939 0.00932(0.0201) (0.0309) (0.0197) (0.0299)
OAxGDPpc 0.00904∗∗ 0.00978∗ 0.0113∗∗∗ 0.0125∗
(0.00369) (0.00567) (0.00422) (0.00655)N 1369605 1369605 1369605 1369605R2 0.807 0.897 0.807 0.897FE cxt,cxHS10 cxHS6xt,cxHS10 cxt,cxHS10 cxHS6xt,cxHS10Notes: The dependent variable is log quantity of exports of HS10 product p to country c onfinancing term f at time t. Measure of institutional quality (IQ) is given at the top of eachcolumn. All specifications include fxt fixed effects. All variables are in mean deviation form.Standard errors clustered at country-year level. textsuperscript*, **, *** represent signifi-cance at the 10, 5, and 1 percent levels, respectively
29
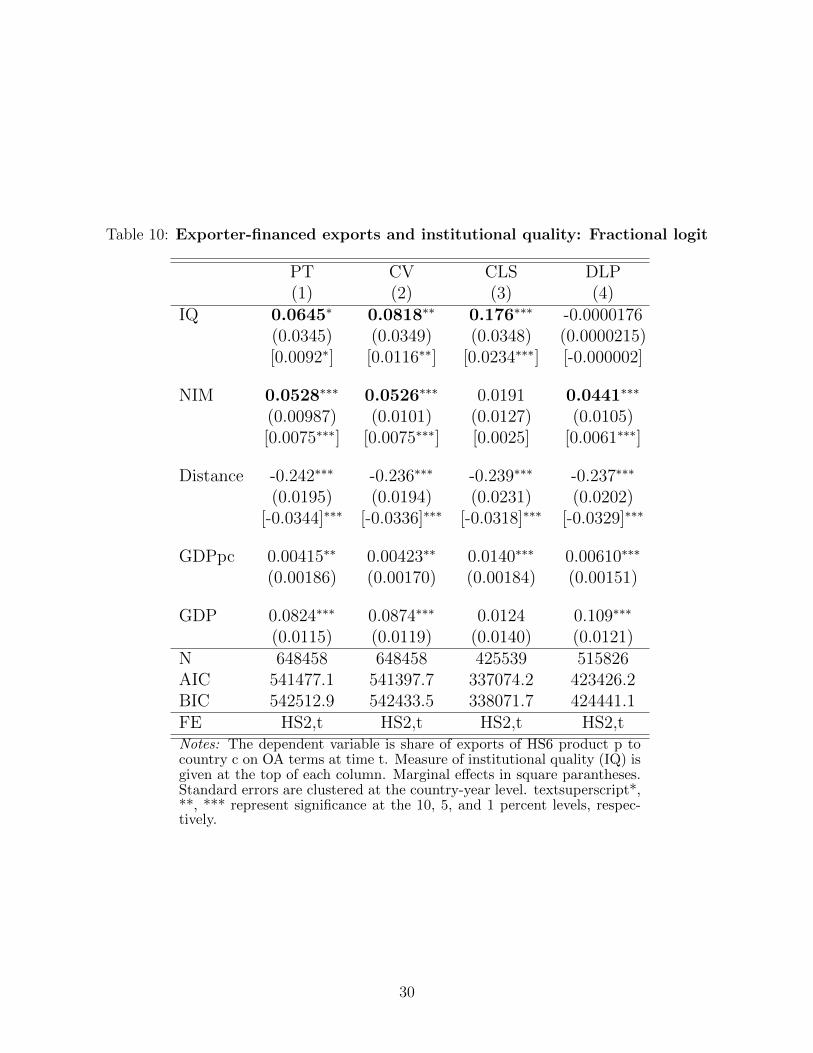
Table 10: Exporter-financed exports and institutional quality: Fractional logit
PT CV CLS DLP(1) (2) (3) (4)
IQ 0.0645∗ 0.0818∗∗ 0.176∗∗∗ -0.0000176(0.0345) (0.0349) (0.0348) (0.0000215)[0.0092∗] [0.0116∗∗] [0.0234∗∗∗] [-0.000002]
NIM 0.0528∗∗∗ 0.0526∗∗∗ 0.0191 0.0441∗∗∗
(0.00987) (0.0101) (0.0127) (0.0105)[0.0075∗∗∗] [0.0075∗∗∗] [0.0025] [0.0061∗∗∗]
Distance -0.242∗∗∗ -0.236∗∗∗ -0.239∗∗∗ -0.237∗∗∗
(0.0195) (0.0194) (0.0231) (0.0202)[-0.0344]∗∗∗ [-0.0336]∗∗∗ [-0.0318]∗∗∗ [-0.0329]∗∗∗
GDPpc 0.00415∗∗ 0.00423∗∗ 0.0140∗∗∗ 0.00610∗∗∗
(0.00186) (0.00170) (0.00184) (0.00151)
GDP 0.0824∗∗∗ 0.0874∗∗∗ 0.0124 0.109∗∗∗
(0.0115) (0.0119) (0.0140) (0.0121)N 648458 648458 425539 515826AIC 541477.1 541397.7 337074.2 423426.2BIC 542512.9 542433.5 338071.7 424441.1FE HS2,t HS2,t HS2,t HS2,tNotes: The dependent variable is share of exports of HS6 product p tocountry c on OA terms at time t. Measure of institutional quality (IQ) isgiven at the top of each column. Marginal effects in square parantheses.Standard errors are clustered at the country-year level. textsuperscript*,**, *** represent significance at the 10, 5, and 1 percent levels, respec-tively.
30
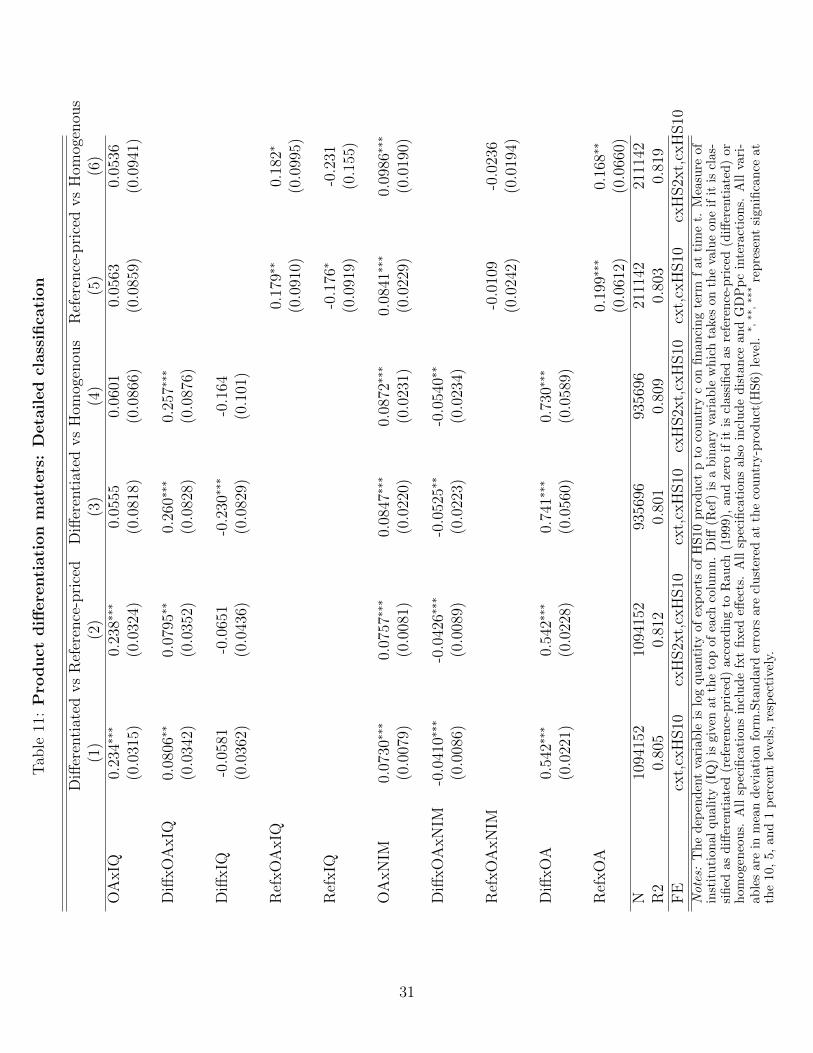
Tab
le11
:P
roduct
diff
ere
nti
ati
on
matt
ers
:D
eta
iled
class
ifica
tion
Diff
eren
tiat
edvs
Ref
eren
ce-p
rice
dD
iffer
enti
ated
vs
Hom
ogen
ous
Ref
eren
ce-p
rice
dvs
Hom
ogen
ous
(1)
(2)
(3)
(4)
(5)
(6)
OA
xIQ
0.23
4∗∗∗
0.23
8∗∗∗
0.05
550.
0601
0.05
630.
0536
(0.0
315)
(0.0
324)
(0.0
818)
(0.0
866)
(0.0
859)
(0.0
941)
Diff
xO
AxIQ
0.08
06∗∗
0.07
95∗∗
0.26
0∗∗∗
0.25
7∗∗∗
(0.0
342)
(0.0
352)
(0.0
828)
(0.0
876)
Diff
xIQ
-0.0
581
-0.0
651
-0.2
30∗∗∗
-0.1
64(0
.036
2)(0
.043
6)(0
.082
9)(0
.101
)
Ref
xO
AxIQ
0.17
9∗∗
0.18
2∗
(0.0
910)
(0.0
995)
Ref
xIQ
-0.1
76∗
-0.2
31(0
.091
9)(0
.155
)
OA
xN
IM0.
0730∗∗∗
0.07
57∗∗∗
0.08
47∗∗∗
0.08
72∗∗∗
0.08
41∗∗∗
0.09
86∗∗∗
(0.0
079)
(0.0
081)
(0.0
220)
(0.0
231)
(0.0
229)
(0.0
190)
Diff
xO
AxN
IM-0
.041
0∗∗∗
-0.0
426∗∗∗
-0.0
525∗∗
-0.0
540∗∗
(0.0
086)
(0.0
089)
(0.0
223)
(0.0
234)
Ref
xO
AxN
IM-0
.010
9-0
.023
6(0
.024
2)(0
.019
4)
Diff
xO
A0.
542∗∗∗
0.54
2∗∗∗
0.74
1∗∗∗
0.73
0∗∗∗
(0.0
221)
(0.0
228)
(0.0
560)
(0.0
589)
Ref
xO
A0.
199∗∗∗
0.16
8∗∗
(0.0
612)
(0.0
660)
N10
9415
210
9415
293
5696
9356
9621
1142
2111
42R
20.
805
0.81
20.
801
0.80
90.
803
0.81
9F
Ecx
t,cx
HS10
cxH
S2x
t,cx
HS10
cxt,
cxH
S10
cxH
S2x
t,cx
HS10
cxt,
cxH
S10
cxH
S2x
t,cx
HS10
Notes:
Th
ed
epen
den
tva
riab
leis
log
qu
anti
tyof
exp
ort
sof
HS
10
pro
du
ctp
toco
untr
yc
on
fin
an
cin
gte
rmf
at
tim
et.
Mea
sure
of
inst
itu
tion
alqu
alit
y(I
Q)
isgi
ven
atth
eto
pof
each
colu
mn
.D
iff(R
ef)
isa
bin
ary
vari
ab
lew
hic
hta
kes
on
the
valu
eon
eif
itis
clas-
sifi
edas
diff
eren
tiat
ed(r
efer
ence
-pri
ced
)acc
ord
ing
toR
au
ch(1
999),
an
dze
roif
itis
class
ified
as
refe
ren
ce-p
rice
d(d
iffer
enti
ate
d)
or
hom
ogen
eou
s.A
llsp
ecifi
cati
ons
incl
ud
efx
tfi
xed
effec
ts.
All
spec
ifica
tion
sals
oin
clu
de
dis
tan
cean
dG
DP
pc
inte
ract
ion
s.A
llva
ri-
able
sar
ein
mea
nd
evia
tion
form
.Sta
nd
ard
erro
rsare
clu
ster
edat
the
cou
ntr
y-p
rodu
ct(H
S6)
leve
l.*,**,***
rep
rese
nt
sign
ifica
nce
at
the
10,
5,an
d1
per
cent
leve
ls,
resp
ecti
vel
y.
31