GRIDA3 a shared resources manager for environmental … · GRIDA3—a shared resources manager for...
17
RESEARCH ARTICLE GRIDA3—a shared resources manager for environmental data analysis and applications Fabrizio Murgia & Riccardo Biddau & Alessandro Concas & Roberto Demontis & Luca Fanfani & Zeno Heilmann & Cristian Lai & Giuditta Lecca & Eva Lorrai & Marino Marrocu & Vittorio Alessandro Marrone & Laura Muscas & Elisaveta Peneva & Andrea Piras & Massimo Pisu & Gabriella Pusceddu & Guido Satta & Daniela Theis & Andrea Vacca & Paolo Valera & Ana Melina Vallenilla Ferrara & Ernesto Bonomi Received: 12 September 2008 / Accepted: 16 February 2009 / Published online: 18 March 2009 # Springer-Verlag 2009 Abstract GRIDA3 (Shared Resources Manager for Envi- ronmental Data Analysis and Applications) is a multidisci- plinary project designed to deliver an integrated system to forge solutions to some environmental challenges such as the constant increase of polluted sites, the sustainability of natural resources usage and the forecast of extreme meteorological events. The GRIDA3 portal is mainly based on Web 2.0 technologies and EnginFrame framework. The portal, now at an advanced stage of development, provides end-users with intuitive Web-interfaces and tools that simplify job submission to the underneath computing resources. The framework manages the user authentication and authorization, then controls the action and job exe- cution into the grid computing environment, collects the results and transforms them into an useful format on the client side. The GRIDA3 Portal framework will provide a problem- solving platform allowing, through appropriate access poli- cies, the integration and the sharing of skills, resources and tools located at multiple sites across federated domains. Keywords Environmental sciences . E-science . Grid technologies . Interdisciplinarity Introduction Some leading challenges of environmental sciences are: sustainable use of natural resources; environmental pollu- tion and degradation; forecast of extreme meteorological events; tapping new non-renewable sources of energy. They require computing power, sensing devices and storage capacity that a single organization, public or private, hardly might acquire. E-science, i.e. the systematic development of research methods that exploit advances in Information and Communication Technologies (ICT) to enable better re- search (Atkinson et al. 2008), can be seen as the com- bination of three different features: the large-scale sharing of computational resources, the provision of access to massive, distributed and heterogeneous datasets (in the order of Tera to Petabytes) and the use of digital platforms for collaboration and communication (Wouters 2004). According to the definitions given by Kesselman and Foster (2001), grid computing is a kind of coordinated resource sharing (data, hardware, application) and problem solving, across active and geographically dispersed, multi- institutional virtual organizations. In general, e-science and grid technology promise to change the way organizations Earth Sci Inform (2009) 2:5–21 DOI 10.1007/s12145-009-0020-0 Work presented at the EGU2008 Communicated by: H. A. Babaie F. Murgia (*) : A. Concas : R. Demontis : Z. Heilmann : C. Lai : G. Lecca : E. Lorrai : M. Marrocu : L. Muscas : E. Peneva : A. Piras : M. Pisu : G. Pusceddu : G. Satta : D. Theis : A. M. Vallenilla Ferrara : E. Bonomi CRS4 (Center for Advanced Studies, Research and Development in Sardinia), Parco Tecnologico, Sardegna Ricerche, Edificio 1, 09010 Pula, Cagliari, Italy e-mail: [email protected] URL: http://grida3.crs4.it/ R. Biddau : L. Fanfani : V. A. Marrone : A. Vacca DISTER, Department of Earth Sciences, University of Cagliari, Via Trentino 51, 09127 Cagliari, Italy P. Valera DIGITA, Department of Geoengineering and Environmental Technologies, University of Cagliari, Piazza d’Armi 16, 09125 Cagliari, Italy
Transcript of GRIDA3 a shared resources manager for environmental … · GRIDA3—a shared resources manager for...
RESEARCH ARTICLE
GRIDA3—a shared resources manager for environmentaldata analysis and applications
Fabrizio Murgia & Riccardo Biddau & Alessandro Concas & Roberto Demontis &
Luca Fanfani & Zeno Heilmann & Cristian Lai & Giuditta Lecca & Eva Lorrai &Marino Marrocu & Vittorio Alessandro Marrone & Laura Muscas & Elisaveta Peneva &
Andrea Piras & Massimo Pisu & Gabriella Pusceddu & Guido Satta & Daniela Theis &
Andrea Vacca & Paolo Valera & Ana Melina Vallenilla Ferrara & Ernesto Bonomi
Received: 12 September 2008 /Accepted: 16 February 2009 /Published online: 18 March 2009# Springer-Verlag 2009
Abstract GRIDA3 (Shared Resources Manager for Envi-ronmental Data Analysis and Applications) is a multidisci-plinary project designed to deliver an integrated system toforge solutions to some environmental challenges such asthe constant increase of polluted sites, the sustainability ofnatural resources usage and the forecast of extrememeteorological events. The GRIDA3 portal is mainly basedon Web 2.0 technologies and EnginFrame framework. Theportal, now at an advanced stage of development, providesend-users with intuitive Web-interfaces and tools thatsimplify job submission to the underneath computingresources. The framework manages the user authenticationand authorization, then controls the action and job exe-
cution into the grid computing environment, collects theresults and transforms them into an useful format on the clientside. The GRIDA3 Portal framework will provide a problem-solving platform allowing, through appropriate access poli-cies, the integration and the sharing of skills, resources andtools located at multiple sites across federated domains.
Keywords Environmental sciences . E-science .
Grid technologies . Interdisciplinarity
Introduction
Some leading challenges of environmental sciences are:sustainable use of natural resources; environmental pollu-tion and degradation; forecast of extreme meteorologicalevents; tapping new non-renewable sources of energy. Theyrequire computing power, sensing devices and storagecapacity that a single organization, public or private, hardlymight acquire. E-science, i.e. the systematic development ofresearch methods that exploit advances in Information andCommunication Technologies (ICT) to enable better re-search (Atkinson et al. 2008), can be seen as the com-bination of three different features: the large-scale sharingof computational resources, the provision of access tomassive, distributed and heterogeneous datasets (in theorder of Tera to Petabytes) and the use of digital platformsfor collaboration and communication (Wouters 2004).
According to the definitions given by Kesselman andFoster (2001), grid computing is a kind of coordinatedresource sharing (data, hardware, application) and problemsolving, across active and geographically dispersed, multi-institutional virtual organizations. In general, e-science andgrid technology promise to change the way organizations
Earth Sci Inform (2009) 2:5–21DOI 10.1007/s12145-009-0020-0
Work presented at the EGU2008
Communicated by: H. A. Babaie
F. Murgia (*) :A. Concas :R. Demontis : Z. Heilmann : C. Lai :G. Lecca : E. Lorrai :M. Marrocu : L. Muscas : E. Peneva :A. Piras :M. Pisu :G. Pusceddu :G. Satta :D. Theis :A. M. Vallenilla Ferrara : E. BonomiCRS4 (Center for Advanced Studies, Research and Developmentin Sardinia), Parco Tecnologico, Sardegna Ricerche,Edificio 1,09010 Pula, Cagliari, Italye-mail: [email protected]: http://grida3.crs4.it/
R. Biddau : L. Fanfani :V. A. Marrone :A. VaccaDISTER, Department of Earth Sciences, University of Cagliari,Via Trentino 51,09127 Cagliari, Italy
P. ValeraDIGITA, Department of Geoengineering and EnvironmentalTechnologies, University of Cagliari,Piazza d’Armi 16,09125 Cagliari, Italy

deals with complex computational problems. Unfortunately,the vision of large scale resource sharing is not yet a realityin many areas. Grid computing is an evolving area ofcomputing, where standards and technology are still beingdeveloped to enable this new paradigm.
GRIDA3, a shared resources manager for environmentaldata analysis and applications (http://grida3.crs4.it), is amultidisciplinary project whose framework—EnginFrame—is designed to deliver, through the use of distributedcomputing and datagrid technologies, an integrated systemto support the solution of a variety of environmental issues.
The main technological objectives of the framework are:
& the adoption of the paradigm of distributed informa-tion system made up of acquisition devices, databaseand software for simulation, data management andvisualization;
& the supply of a wide area virtual organization system insupport of involved institutions, for the coordinated andreliable sharing of computing resources and data, bothfrom literature and from data acquisition surveys, andsharing of innovative numerical applications;
& the provision of a uniform, transparent, easy and yetprotected access to all available resources.
The final project result will be an advanced problem-solving platform allowing the integration of human know-how, simulation and visualization software, instrumentationand high performance resources for data communication,storage, and computation via a Web portal.
GRIDA3 is developed to deliver services to a wide rangeof users from decision makers without technologicalexpertise to technical and scientific experts.
The users can access, set up, run, and control ready-made applications on GRIDA3 computing resources via astandard compliant Web interface, virtually from anywhereusing a Web browser.
The grid-enabled Web applications currently underdevelopment span over five domains:
& AGISGRID, dealing with the development of a series ofapplications based on GIS (Geographic InformationSystem) technologies;
& AQUAGRID, focused on subsurface hydrology andwater resources management;
& BONGRID, related to remediation and monitoring ofcontaminated sites;
& EIAGRID, aimed to enable geophysicists to perform areal-time subsurface characterization by an on-the-flyseismic data processing (e.g. applied to hydrogeologicalresearch);
& PREMIAGRID, centred on the implementation of aprobabilistic system in order to forecast extreme events.
Each tool was implemented using previously developedstand alone applications which performed for each field therequired computation and provided solutions on a specificarea. Such applications have been ported within theframework, namely the grid portal, thus shifting the userinteraction from desktop oriented to Web based paradigmfostering user participation.
The next section describes the enabling technologieswhich allowed us to build GRIDA3, and the following oneis dedicated to a detailed description of each environmentalapplication deployed on the portal. Finally, the conclusionsfrom completed tasks and future developments are dis-cussed in the last section.
GRIDA3 infrastructure
The GRIDA3 infrastructure comprises a complex set oftechnologies structured in a four-layer system architecture(Fig. 1), completely transparent to end-users.
The lowest level infrastructure provides the computing,the storage, net connections, and the basic services systems,all shown in Fig. 2.
The computing system, currently under test, guarantees alow latency grid with 32 nodes (able to reach 1.1 Tflopsperformance), connected at 2Gbps and using IPMI (Intel-ligent Platform Management Interface) (Hewlett Packard1998) to allow node re-configuration. The high speedstorage, based on a distributed file system, is directly con-nected to the grid, sharing the same network switch. Thebackup and snapshot management are provided by amedium speed storage. Basic services consist of user
INFRASTRUCTURE
COMPUTING BASIC SERVICES STORAGE
GRID MANAGEMENT
EnginFrame LSF
GRIDA3 APPLICATIONS
Agisgrid Aquagrid Bongrid Eiagrid Premiagrid
Web user interaction
Javascript AJAX Mashup
Data Virtualization
SRB
Fig. 1 Multi-tier architecture of the GRIDA3 infrastucture
6 Earth Sci Inform (2009) 2:5–21

authentication and authorization (LDAP—LightweightDirectory Access Protocol), Web servers (Apache HTTPServer and Apache Tomcat), security (DMZ—DeMilitarizedZone and firewalls).
The second level is the grid management. The GRIDA3portal is based on the EnginFrame framework, which isavailable through a proprietary licence, except for theacademic and research worlds that have free of charges licence(http://www.enginframe.com/docum/). The main buildingblock of EnginFrame is the service, based on an XML(eXtensible Mark-up Language) (Goldfarb and Prescod 2000)representation of any computing related facility (e.g. a FiniteElement Model (FEM) solver, a parallel Computational FluidDynamics (CFD) solver, a query to Load Sharing Facility(LSF) to find pending jobs).
The use of XML allows the decoupling of EnginFramefrom the current grid environment, hiding the specific gridtechnology solution (Beltrame et al. 2006).
EnginFrame (Fig. 3) offers a user-friendly layout thatallows the end user to access distributed computing andstorage resources through all kind of appliances (desktop,laptop, mobile phone) using Web browsers, to provide thesame Graphic User Interface (GUI) to several back-ends,and to ensure security at all levels.
The architecture of EnginFrame is logically divided intothree tiers:
– Client Tier, user’s browser and application software;– Server Tier, built on top of APACHE/TOMCAT
servlet-enabled Web server for supporting Java server-
Fig. 2 Hardware infrastructure
Earth Sci Inform (2009) 2:5–21 7
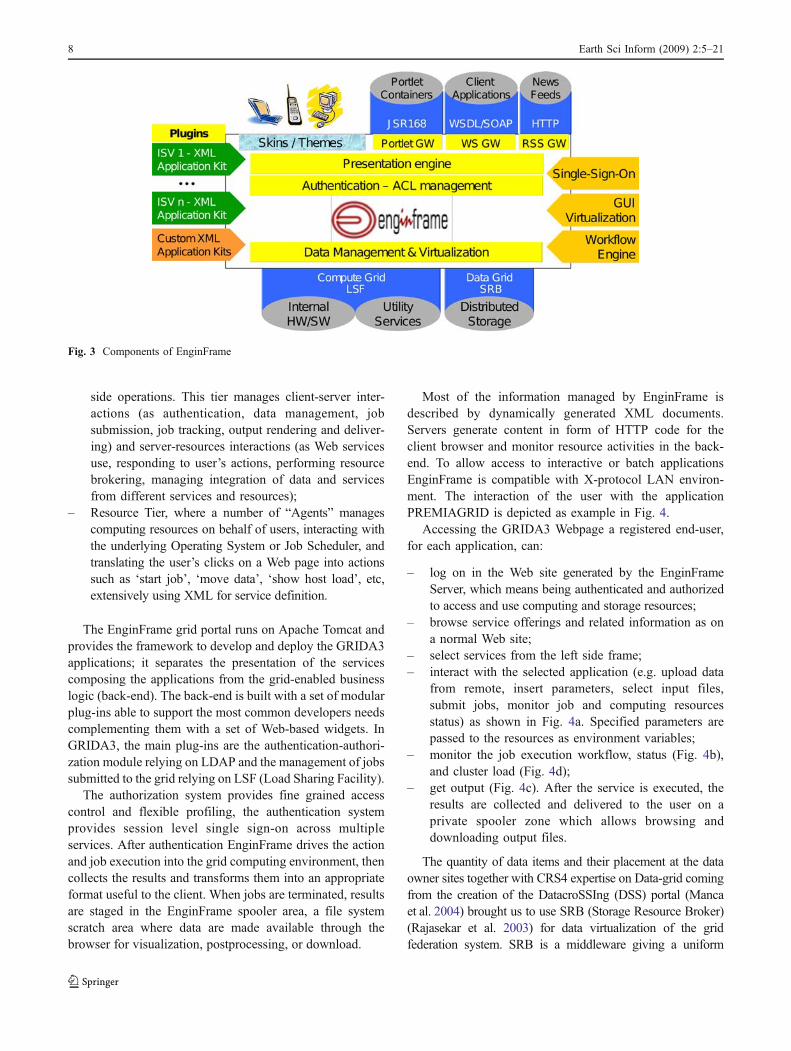
side operations. This tier manages client-server inter-actions (as authentication, data management, jobsubmission, job tracking, output rendering and deliver-ing) and server-resources interactions (as Web servicesuse, responding to user’s actions, performing resourcebrokering, managing integration of data and servicesfrom different services and resources);
– Resource Tier, where a number of “Agents” managescomputing resources on behalf of users, interacting withthe underlying Operating System or Job Scheduler, andtranslating the user’s clicks on a Web page into actionssuch as ‘start job’, ‘move data’, ‘show host load’, etc,extensively using XML for service definition.
The EnginFrame grid portal runs on Apache Tomcat andprovides the framework to develop and deploy the GRIDA3applications; it separates the presentation of the servicescomposing the applications from the grid-enabled businesslogic (back-end). The back-end is built with a set of modularplug-ins able to support the most common developers needscomplementing them with a set of Web-based widgets. InGRIDA3, the main plug-ins are the authentication-authori-zation module relying on LDAP and the management of jobssubmitted to the grid relying on LSF (Load Sharing Facility).
The authorization system provides fine grained accesscontrol and flexible profiling, the authentication systemprovides session level single sign-on across multipleservices. After authentication EnginFrame drives the actionand job execution into the grid computing environment, thencollects the results and transforms them into an appropriateformat useful to the client. When jobs are terminated, resultsare staged in the EnginFrame spooler area, a file systemscratch area where data are made available through thebrowser for visualization, postprocessing, or download.
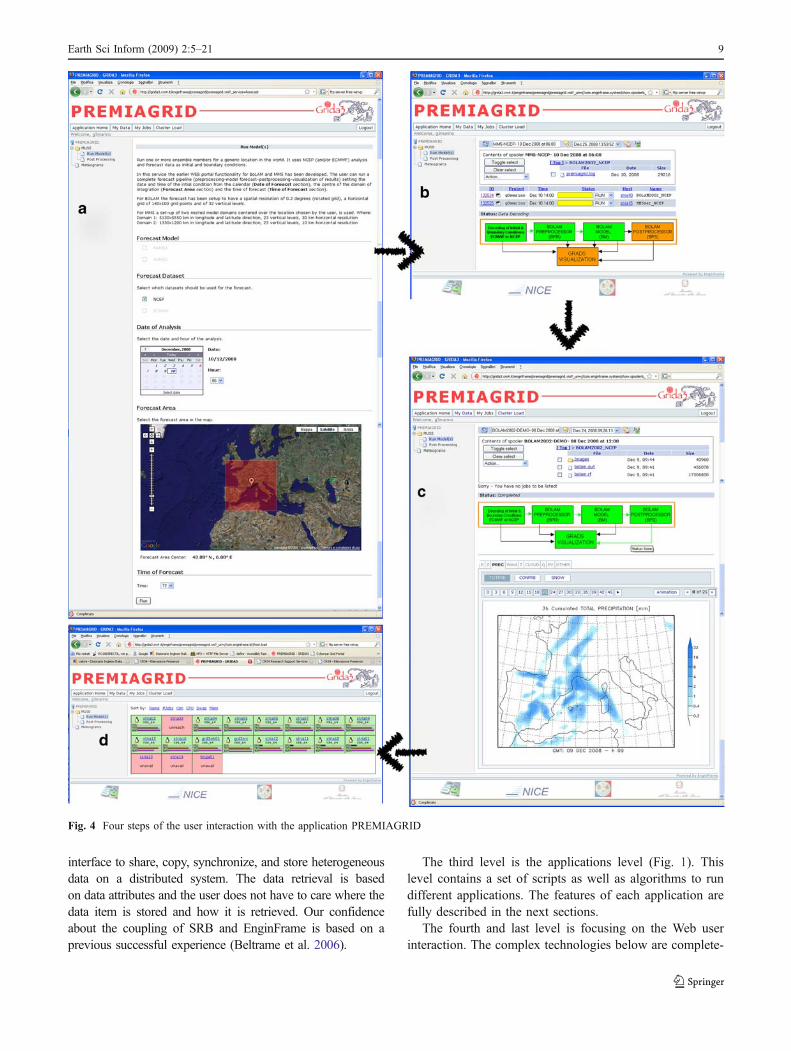
Most of the information managed by EnginFrame isdescribed by dynamically generated XML documents.Servers generate content in form of HTTP code for theclient browser and monitor resource activities in the back-end. To allow access to interactive or batch applicationsEnginFrame is compatible with X-protocol LAN environ-ment. The interaction of the user with the applicationPREMIAGRID is depicted as example in Fig. 4.
Accessing the GRIDA3 Webpage a registered end-user,for each application, can:
– log on in the Web site generated by the EnginFrameServer, which means being authenticated and authorizedto access and use computing and storage resources;
– browse service offerings and related information as ona normal Web site;
– select services from the left side frame;– interact with the selected application (e.g. upload data
from remote, insert parameters, select input files,submit jobs, monitor job and computing resourcesstatus) as shown in Fig. 4a. Specified parameters arepassed to the resources as environment variables;
– monitor the job execution workflow, status (Fig. 4b),and cluster load (Fig. 4d);
– get output (Fig. 4c). After the service is executed, theresults are collected and delivered to the user on aprivate spooler zone which allows browsing anddownloading output files.
The quantity of data items and their placement at the dataowner sites together with CRS4 expertise on Data-grid comingfrom the creation of the DatacroSSIng (DSS) portal (Mancaet al. 2004) brought us to use SRB (Storage Resource Broker)(Rajasekar et al. 2003) for data virtualization of the gridfederation system. SRB is a middleware giving a uniform
Fig. 3 Components of EnginFrame
8 Earth Sci Inform (2009) 2:5–21
interface to share, copy, synchronize, and store heterogeneousdata on a distributed system. The data retrieval is basedon data attributes and the user does not have to care where thedata item is stored and how it is retrieved. Our confidenceabout the coupling of SRB and EnginFrame is based on aprevious successful experience (Beltrame et al. 2006).
The third level is the applications level (Fig. 1). Thislevel contains a set of scripts as well as algorithms to rundifferent applications. The features of each application arefully described in the next sections.
The fourth and last level is focusing on the Web userinteraction. The complex technologies below are complete-
Fig. 4 Four steps of the user interaction with the application PREMIAGRID
Earth Sci Inform (2009) 2:5–21 9
ly transparent to end-users; this feature is realized thanks toWeb interfaces tailored to end-users that access and controltheir computing and engineering resources via intuitiveWeb2.0 interfaces, virtually from any device using a standardWeb browser (e.g. desktop, laptop, PDA or smartphone).
This also holds for users with neither specific expertise ofphysical models nor technological background. “Web2.0”refers to the second generation of Web-based communitiesand services, giving theWeb developers the capability to realizegraphical interfaces with the same level of interactivity asdesktop applications and create mash-ups using servicesprovided in the Web by third parties. A mash-up is a Webapplication that combines data frommore than one source into asingle integrated tool1 (Blake and Nowlan 2008). TheGRIDA3 framework integrates Google Maps and GeoNames2
services. Embedding Google Maps makes it possible tomanipulate points of interest, add content and overlap sub-layers. For instance, in the AQUAGRID-PHREEQC applica-tion the user can obtain geographical coordinates of the watersample to insert into the database, just by clicking on the map.
The structure of the currently displayed Web page (Fig. 4)is completely accessible and can be modified on-the-fly bythe command processing performed directly by the browserwithout any server request for new pages. On the other hand,the server interaction takes advantage from the Asynchro-nous JavaScript and XML (AJAX) paradigm. A browserutility creates JavaScript functions sending requests toservices exposed by the same server where the Web pagehas been downloaded. The response of an AJAX requestranges from a simple URI to a block of XML/HTML, fromJSON data to a JavaScript code.
Project results
Porting the five applications to the grid via the portalframework is an interesting challenge in front of the alreadystable conception of desktop stand alone oriented software.The already living experiences has been gone over in order tofit on the Web design. When moving the applications to theWeb and in particular to the EnginFrame framework it isnecessary to think on different aspects, which were lessimportant in the past implementation. No changes wereneeded in the core of each application. In fact most of theattention was dedicated to user interaction, participation,needs, etc. bringing us to focus on user profiling and toidentify user categories. This concept drove the applicationdevelopment adding new functionalities and enlarging the
required framework features to make them cross-usable (e.g.Mapserver, msCross (Manca et al. 2006), PostgreSQL). Forinstance, it is important to think the application consideringdifferent user experience levels such as guest users, basic,experts, etc. Such considerations impact on the design ofuser interfaces, more and more affected by the sequences oftransactions the user might perform, by the allowed actionsfor each category of users, by the type of input/output data.
GUI and EnginFrame developers wrote XML scripts todescribe and implement all these applications: actions in theXML file call external shell scripts written by applicationdevelopers in several languages as XML, Perl, shell or Javathrough which input parameters are read and commandsrelated to the requested service are executed.
For customizing more complex services the XML filecalls auxiliary Java files that define specific features likeincluding descriptive figures into the input parameter fields,choosing dates from a pop-up calendar, or displaying aprogress bar for file uploading.
The integration of LSF middleware for job managementwas carried out by including LSF commands into theexecutable instructions. Using LSF under EnginFrameenables useful features such as displaying the job evolutionor cluster load directly in the browser.
The quality of the framework was obviously improvedbecause of the expertise gained during the plugging of thetool in a specific field like earth sciences is. More oversome features requested by application porting has beenintegrated in Enginframe.
AGISGRID deployment
The aim of AGISGRID (http://grida3.crs4.it/enginframe/agisgrid/index.xml) is to provide authorized users theaccess to environmental databases and applications basedon GIS technologies. AGISGRID is dedicated to supportpublic and private users, such as local administrations anduniversities, about land planning and addressing thelocalization of specific environmental problems.
Apart from SRB and EnginFrame, the AGISGRIDenabling technologies are:
& GRASS (Neteler and Mitasova2002), a Free Software/Open Source GIS released under GNU license (GeneralPublic License—Smith 2007) used to build and run thecodes for the specific applications;
& PostgreSQL (PostgreSQL Global Development Group2007), a Free Software/Open-Source object-relationaldatabase system that has the features of traditionalcommercial database systems with enhancements to befound in next-generation DBMS systems. Here it isused to store the soil and geochemical database;
1 http://en.wikipedia.org/wiki/Mashup_(web_application_hybrid)—accessed September 01, 2008.2 GeoNames is a geographical database freely accessible throughvarious Web services.
10 Earth Sci Inform (2009) 2:5–21
& Mapserver (Kropla 2005) to visualize the outputs of theapplications execution.
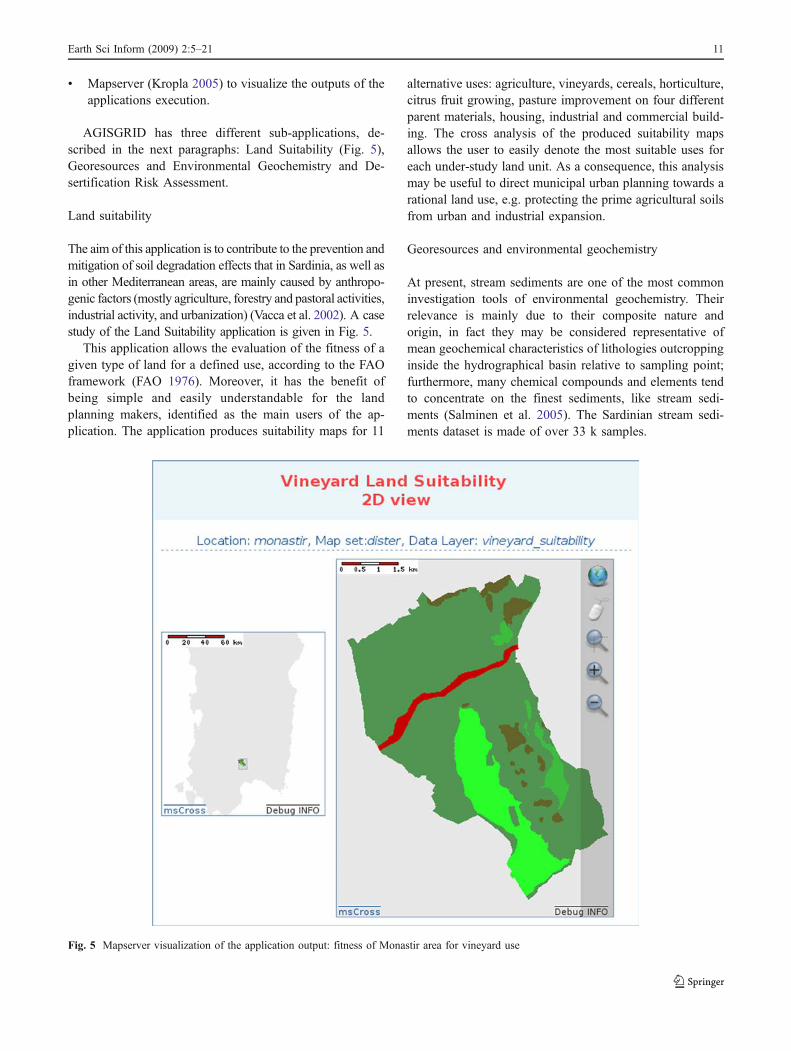
AGISGRID has three different sub-applications, de-scribed in the next paragraphs: Land Suitability (Fig. 5),Georesources and Environmental Geochemistry and De-sertification Risk Assessment.
Land suitability
The aim of this application is to contribute to the prevention andmitigation of soil degradation effects that in Sardinia, as well asin other Mediterranean areas, are mainly caused by anthropo-genic factors (mostly agriculture, forestry and pastoral activities,industrial activity, and urbanization) (Vacca et al. 2002). A casestudy of the Land Suitability application is given in Fig. 5.
This application allows the evaluation of the fitness of agiven type of land for a defined use, according to the FAOframework (FAO 1976). Moreover, it has the benefit ofbeing simple and easily understandable for the landplanning makers, identified as the main users of the ap-plication. The application produces suitability maps for 11
alternative uses: agriculture, vineyards, cereals, horticulture,citrus fruit growing, pasture improvement on four differentparent materials, housing, industrial and commercial build-ing. The cross analysis of the produced suitability mapsallows the user to easily denote the most suitable uses foreach under-study land unit. As a consequence, this analysismay be useful to direct municipal urban planning towards arational land use, e.g. protecting the prime agricultural soilsfrom urban and industrial expansion.
Georesources and environmental geochemistry
At present, stream sediments are one of the most commoninvestigation tools of environmental geochemistry. Theirrelevance is mainly due to their composite nature andorigin, in fact they may be considered representative ofmean geochemical characteristics of lithologies outcroppinginside the hydrographical basin relative to sampling point;furthermore, many chemical compounds and elements tendto concentrate on the finest sediments, like stream sedi-ments (Salminen et al. 2005). The Sardinian stream sedi-ments dataset is made of over 33 k samples.
Fig. 5 Mapserver visualization of the application output: fitness of Monastir area for vineyard use
Earth Sci Inform (2009) 2:5–21 11
For a certain area, this application achieves the automaticidentification of some heavy metals natural anomaliesthrough four steps:
& implementation of a high-resolution Digital ElevationModel (DEM), a digital representation of groundsurface topography, for the morphological definition ofarea of interest;
& automatic reconstruction of the hydrography for thesettlement of river basins underlying the point of sampling;
& identification of the background for each element throughgeostatistical analysis and of any lithology in theconsidered area, providing lithological data are available;
& definition of anomalies at different scales.
This work would provide decision makers a tool forplanning the regional areas.
Desertification risk assessment
This is an application based on ESAs (EnvironmentallySensitive Areas) methodology (Kosmas et al. 1999). Toobtain the ESAs Desertification Index (ESA_DI), fourquality maps must be produced: Soil Quality Index (SQI),Climate Quality Index (CQI), Vegetation Quality Index(VQI) and Management Quality Index (MQI). Combiningthe above mentioned geographic layers in a formula
ESA DI ¼ffiffiffiffiffiffiffiffiffiffiffiffiffiffiffiffiffiffiffiffiffiffiffiffiffiffiffiffiffiffiffiffiffiffiffiffiffiffiffiffiffiffi
SQI*CQI*VQI*MQI4p
;
the resulting output is a map showing critical, fragile, andpotential Environmentally Sensitive Areas to desertification.The Quality Index maps and the final ESAs map can be reallyuseful to direct land planning at catchment basin scale.
AQUAGRID deployment
AQUAGRID (http://grida3.crs4.it/enginframe/aquagrid/index.xml) is a computational service for subsurfacehydrology and water resources management.
It is based on two different modules:
– the CODESA-3D module focused on groundwatermodelling and contaminant transport;
– the PHREEQC module related to geochemical dataanalysis and interpretation.
The AQUAGRID application allows registered end-users to execute a set of services related to some pilot sitesby simply selecting them on a Google Maps (Lecca et al.2007). Its main objective is to provide an instrument tofoster the quality of freshwater resource management,especially in coastal regions and in abandoned mines.
This service targets researchers, water managers anddecision makers, helping them to find solutions to problemslike the planning and management of optimal aquiferdevelopment and exploitation schemes, the design ofoperative monitoring networks, and the selection of themost effective remediation modus operandi.
CODESA-3D module
Based on the CODESA-3D hydrogeological model, thismodule aims to simulate complex and large density-dependent groundwater flow and contaminant transportproblems in aquifer systems (Lecca 2000).
Probabilistic techniques based on Montecarlo methodsare implemented in order to assess and quantify the impactof input uncertainty connected with field-data into theoutput of the model.
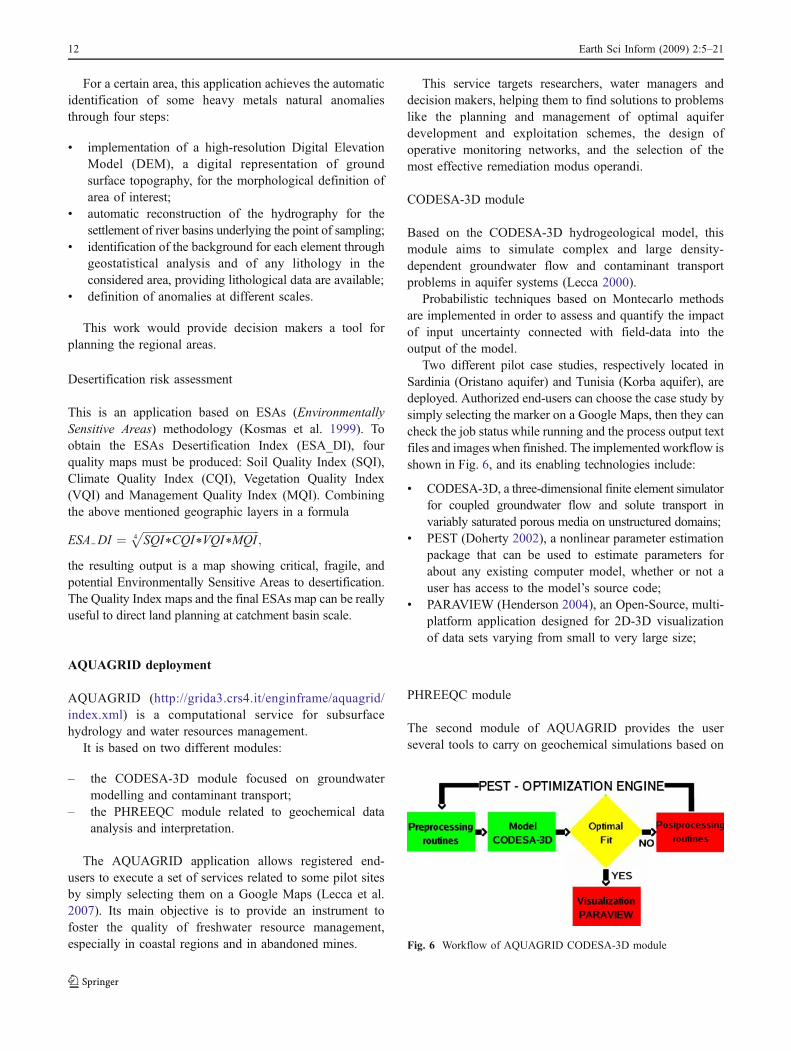
Two different pilot case studies, respectively located inSardinia (Oristano aquifer) and Tunisia (Korba aquifer), aredeployed. Authorized end-users can choose the case study bysimply selecting the marker on a Google Maps, then they cancheck the job status while running and the process output textfiles and images when finished. The implemented workflow isshown in Fig. 6, and its enabling technologies include:
& CODESA-3D, a three-dimensional finite element simulatorfor coupled groundwater flow and solute transport invariably saturated porous media on unstructured domains;
& PEST (Doherty 2002), a nonlinear parameter estimationpackage that can be used to estimate parameters forabout any existing computer model, whether or not auser has access to the model’s source code;
& PARAVIEW (Henderson 2004), an Open-Source, multi-platform application designed for 2D-3D visualizationof data sets varying from small to very large size;
PHREEQC module
The second module of AQUAGRID provides the userseveral tools to carry on geochemical simulations based on
Fig. 6 Workflow of AQUAGRID CODESA-3D module
12 Earth Sci Inform (2009) 2:5–21
field campaigns conducted by the Department of EarthSciences of Cagliari University.
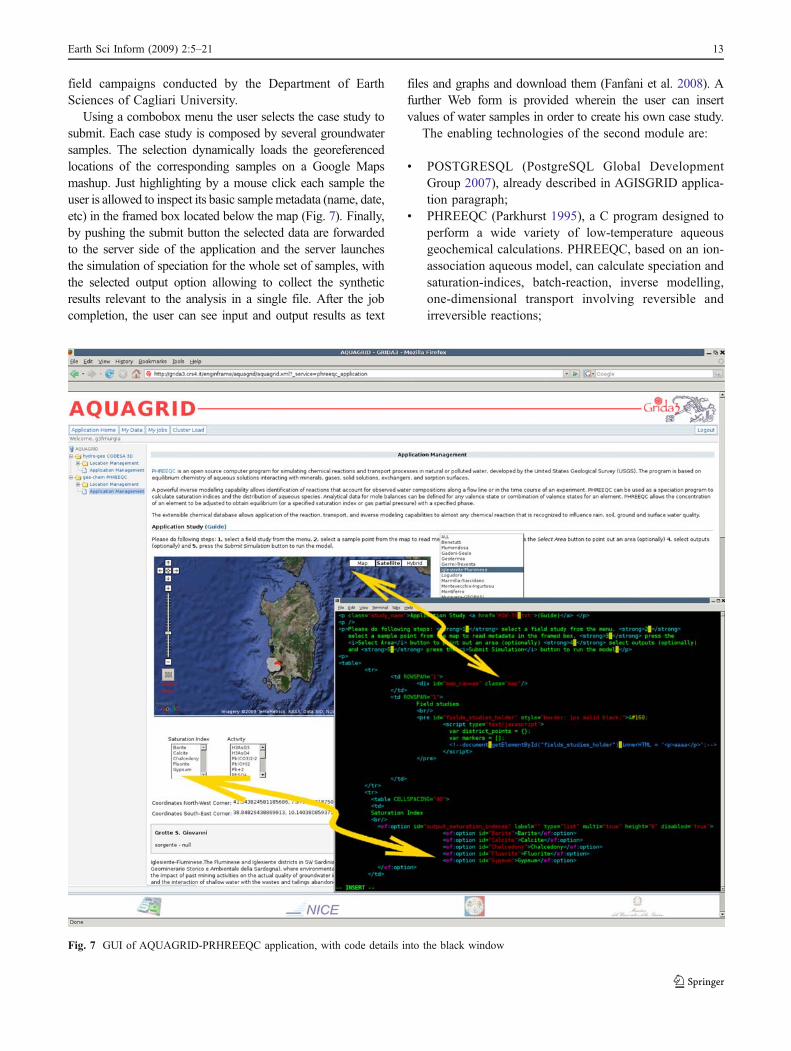
Using a combobox menu the user selects the case study tosubmit. Each case study is composed by several groundwatersamples. The selection dynamically loads the georeferencedlocations of the corresponding samples on a Google Mapsmashup. Just highlighting by a mouse click each sample theuser is allowed to inspect its basic samplemetadata (name, date,etc) in the framed box located below the map (Fig. 7). Finally,by pushing the submit button the selected data are forwardedto the server side of the application and the server launchesthe simulation of speciation for the whole set of samples, withthe selected output option allowing to collect the syntheticresults relevant to the analysis in a single file. After the jobcompletion, the user can see input and output results as text
files and graphs and download them (Fanfani et al. 2008). Afurther Web form is provided wherein the user can insertvalues of water samples in order to create his own case study.
The enabling technologies of the second module are:
& POSTGRESQL (PostgreSQL Global DevelopmentGroup 2007), already described in AGISGRID applica-tion paragraph;
& PHREEQC (Parkhurst 1995), a C program designed toperform a wide variety of low-temperature aqueousgeochemical calculations. PHREEQC, based on an ion-association aqueous model, can calculate speciation andsaturation-indices, batch-reaction, inverse modelling,one-dimensional transport involving reversible andirreversible reactions;
Fig. 7 GUI of AQUAGRID-PRHREEQC application, with code details into the black window
Earth Sci Inform (2009) 2:5–21 13
& XMGRACE (Grace 2008), a 2D plotting tool for the XWindow System and M*tif that runs on virtually anyversion of Unix-like OS. In AQUAGRID it is used toplot binary e ternary graphs for input and output data.
BONGRID deployment
BONGRID (http://grida3.crs4.it/enginframe/bongrid/index.xml) is a site-remediation service oriented towards allpotential stakeholders (engineers or decision makers)providing them tools to solve concerns in the contaminatedsoil and groundwater remediation field.
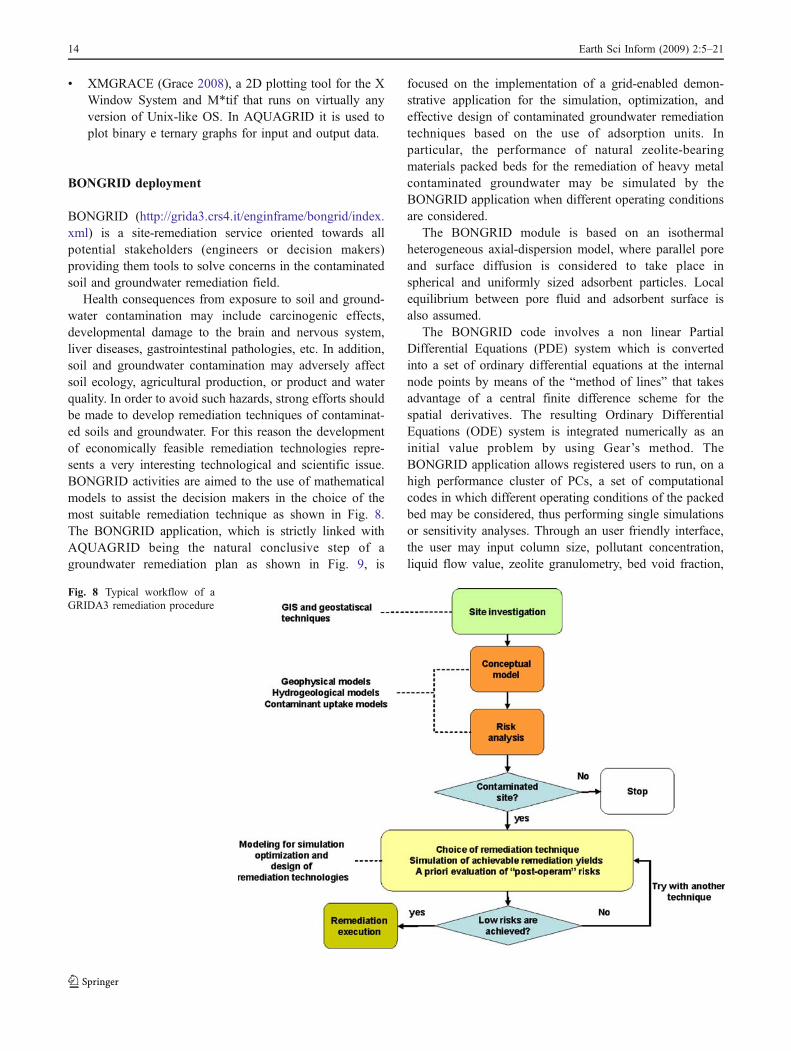
Health consequences from exposure to soil and ground-water contamination may include carcinogenic effects,developmental damage to the brain and nervous system,liver diseases, gastrointestinal pathologies, etc. In addition,soil and groundwater contamination may adversely affectsoil ecology, agricultural production, or product and waterquality. In order to avoid such hazards, strong efforts shouldbe made to develop remediation techniques of contaminat-ed soils and groundwater. For this reason the developmentof economically feasible remediation technologies repre-sents a very interesting technological and scientific issue.BONGRID activities are aimed to the use of mathematicalmodels to assist the decision makers in the choice of themost suitable remediation technique as shown in Fig. 8.The BONGRID application, which is strictly linked withAQUAGRID being the natural conclusive step of agroundwater remediation plan as shown in Fig. 9, is
focused on the implementation of a grid-enabled demon-strative application for the simulation, optimization, andeffective design of contaminated groundwater remediationtechniques based on the use of adsorption units. Inparticular, the performance of natural zeolite-bearingmaterials packed beds for the remediation of heavy metalcontaminated groundwater may be simulated by theBONGRID application when different operating conditionsare considered.
The BONGRID module is based on an isothermalheterogeneous axial-dispersion model, where parallel poreand surface diffusion is considered to take place inspherical and uniformly sized adsorbent particles. Localequilibrium between pore fluid and adsorbent surface isalso assumed.
The BONGRID code involves a non linear PartialDifferential Equations (PDE) system which is convertedinto a set of ordinary differential equations at the internalnode points by means of the “method of lines” that takesadvantage of a central finite difference scheme for thespatial derivatives. The resulting Ordinary DifferentialEquations (ODE) system is integrated numerically as aninitial value problem by using Gear’s method. TheBONGRID application allows registered users to run, on ahigh performance cluster of PCs, a set of computationalcodes in which different operating conditions of the packedbed may be considered, thus performing single simulationsor sensitivity analyses. Through an user friendly interface,the user may input column size, pollutant concentration,liquid flow value, zeolite granulometry, bed void fraction,
Fig. 8 Typical workflow of aGRIDA3 remediation procedure
14 Earth Sci Inform (2009) 2:5–21
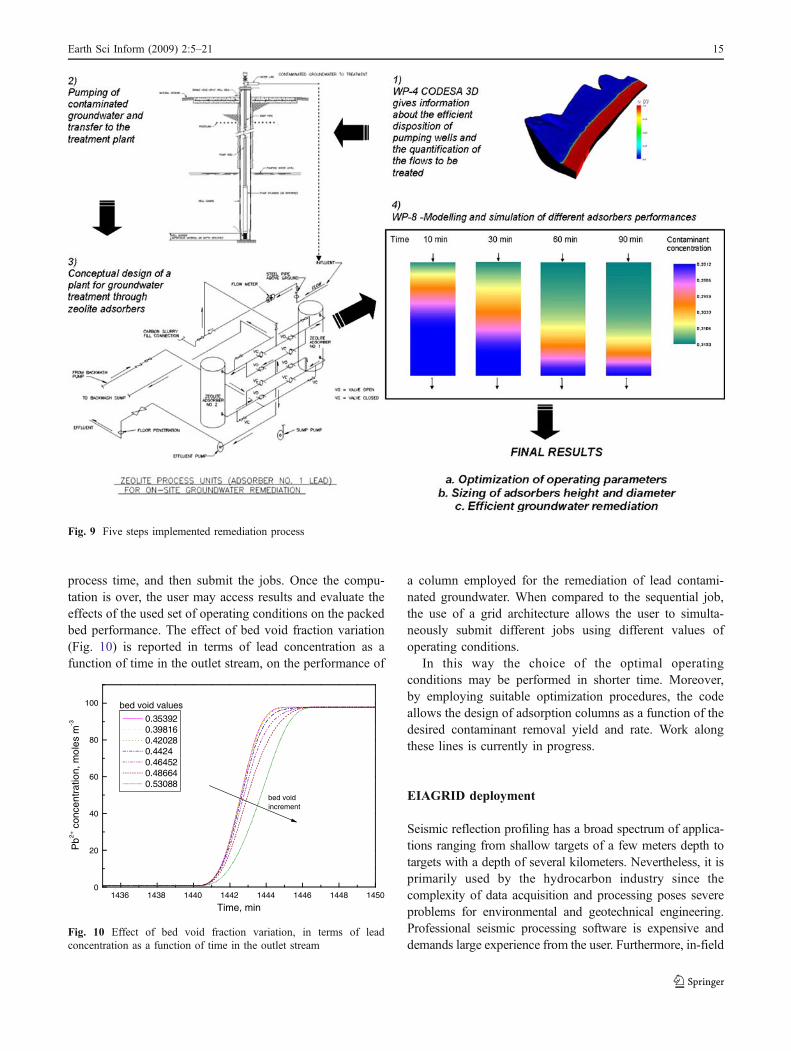
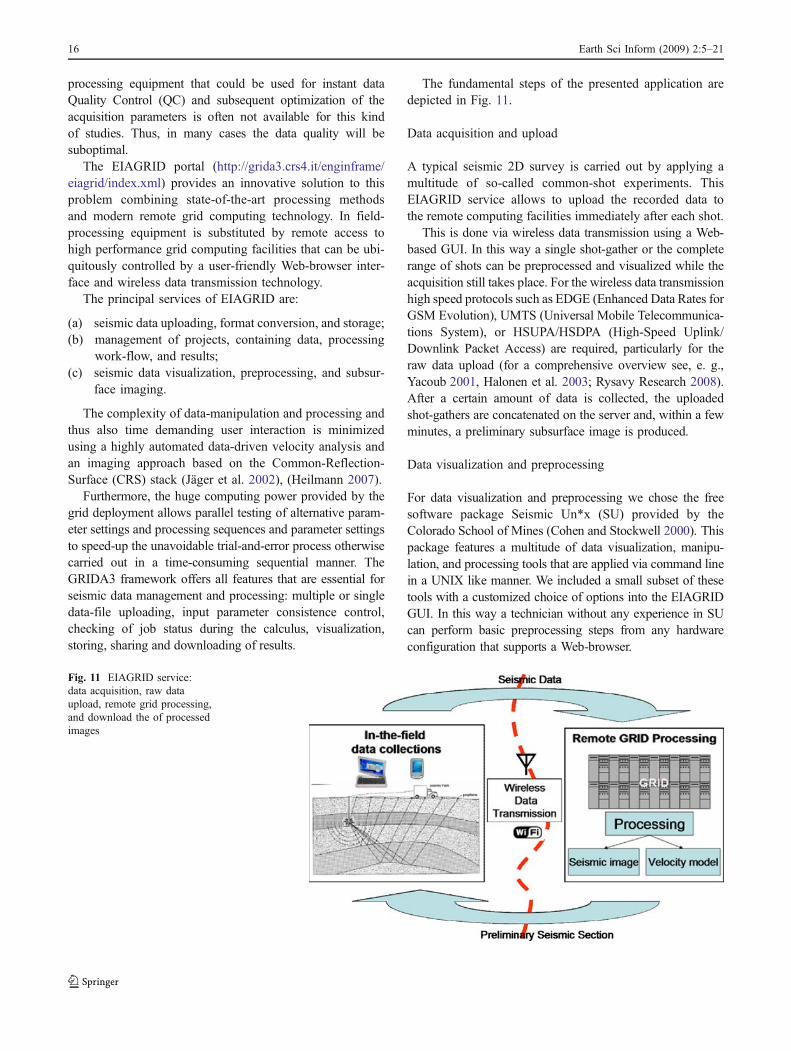
process time, and then submit the jobs. Once the compu-tation is over, the user may access results and evaluate theeffects of the used set of operating conditions on the packedbed performance. The effect of bed void fraction variation(Fig. 10) is reported in terms of lead concentration as afunction of time in the outlet stream, on the performance of
a column employed for the remediation of lead contami-nated groundwater. When compared to the sequential job,the use of a grid architecture allows the user to simulta-neously submit different jobs using different values ofoperating conditions.
In this way the choice of the optimal operatingconditions may be performed in shorter time. Moreover,by employing suitable optimization procedures, the codeallows the design of adsorption columns as a function of thedesired contaminant removal yield and rate. Work alongthese lines is currently in progress.
EIAGRID deployment
Seismic reflection profiling has a broad spectrum of applica-tions ranging from shallow targets of a few meters depth totargets with a depth of several kilometers. Nevertheless, it isprimarily used by the hydrocarbon industry since thecomplexity of data acquisition and processing poses severeproblems for environmental and geotechnical engineering.Professional seismic processing software is expensive anddemands large experience from the user. Furthermore, in-field
1436 1438 1440 1442 1444 1446 1448 14500
20
40
60
80
100
bed void increment
Pb2+
con
cent
ratio
n, m
oles
m-3
Time, min
0.35392 0.39816 0.42028 0.4424 0.46452 0.48664 0.53088
bed void values
Fig. 10 Effect of bed void fraction variation, in terms of leadconcentration as a function of time in the outlet stream
Fig. 9 Five steps implemented remediation process
Earth Sci Inform (2009) 2:5–21 15
processing equipment that could be used for instant dataQuality Control (QC) and subsequent optimization of theacquisition parameters is often not available for this kindof studies. Thus, in many cases the data quality will besuboptimal.
The EIAGRID portal (http://grida3.crs4.it/enginframe/eiagrid/index.xml) provides an innovative solution to thisproblem combining state-of-the-art processing methodsand modern remote grid computing technology. In field-processing equipment is substituted by remote access tohigh performance grid computing facilities that can be ubi-quitously controlled by a user-friendly Web-browser inter-face and wireless data transmission technology.
The principal services of EIAGRID are:
(a) seismic data uploading, format conversion, and storage;(b) management of projects, containing data, processing
work-flow, and results;(c) seismic data visualization, preprocessing, and subsur-
face imaging.
The complexity of data-manipulation and processing andthus also time demanding user interaction is minimizedusing a highly automated data-driven velocity analysis andan imaging approach based on the Common-Reflection-Surface (CRS) stack (Jäger et al. 2002), (Heilmann 2007).
Furthermore, the huge computing power provided by thegrid deployment allows parallel testing of alternative param-eter settings and processing sequences and parameter settingsto speed-up the unavoidable trial-and-error process otherwisecarried out in a time-consuming sequential manner. TheGRIDA3 framework offers all features that are essential forseismic data management and processing: multiple or singledata-file uploading, input parameter consistence control,checking of job status during the calculus, visualization,storing, sharing and downloading of results.
The fundamental steps of the presented application aredepicted in Fig. 11.
Data acquisition and upload
A typical seismic 2D survey is carried out by applying amultitude of so-called common-shot experiments. ThisEIAGRID service allows to upload the recorded data tothe remote computing facilities immediately after each shot.
This is done via wireless data transmission using a Web-based GUI. In this way a single shot-gather or the completerange of shots can be preprocessed and visualized while theacquisition still takes place. For the wireless data transmissionhigh speed protocols such as EDGE (Enhanced Data Rates forGSM Evolution), UMTS (Universal Mobile Telecommunica-tions System), or HSUPA/HSDPA (High-Speed Uplink/Downlink Packet Access) are required, particularly for theraw data upload (for a comprehensive overview see, e. g.,Yacoub 2001, Halonen et al. 2003; Rysavy Research 2008).After a certain amount of data is collected, the uploadedshot-gathers are concatenated on the server and, within a fewminutes, a preliminary subsurface image is produced.
Data visualization and preprocessing
For data visualization and preprocessing we chose the freesoftware package Seismic Un*x (SU) provided by theColorado School of Mines (Cohen and Stockwell 2000). Thispackage features a multitude of data visualization, manipu-lation, and processing tools that are applied via command linein a UNIX like manner. We included a small subset of thesetools with a customized choice of options into the EIAGRIDGUI. In this way a technician without any experience in SUcan perform basic preprocessing steps from any hardwareconfiguration that supports a Web-browser.
Fig. 11 EIAGRID service:data acquisition, raw dataupload, remote grid processing,and download the of processedimages
16 Earth Sci Inform (2009) 2:5–21
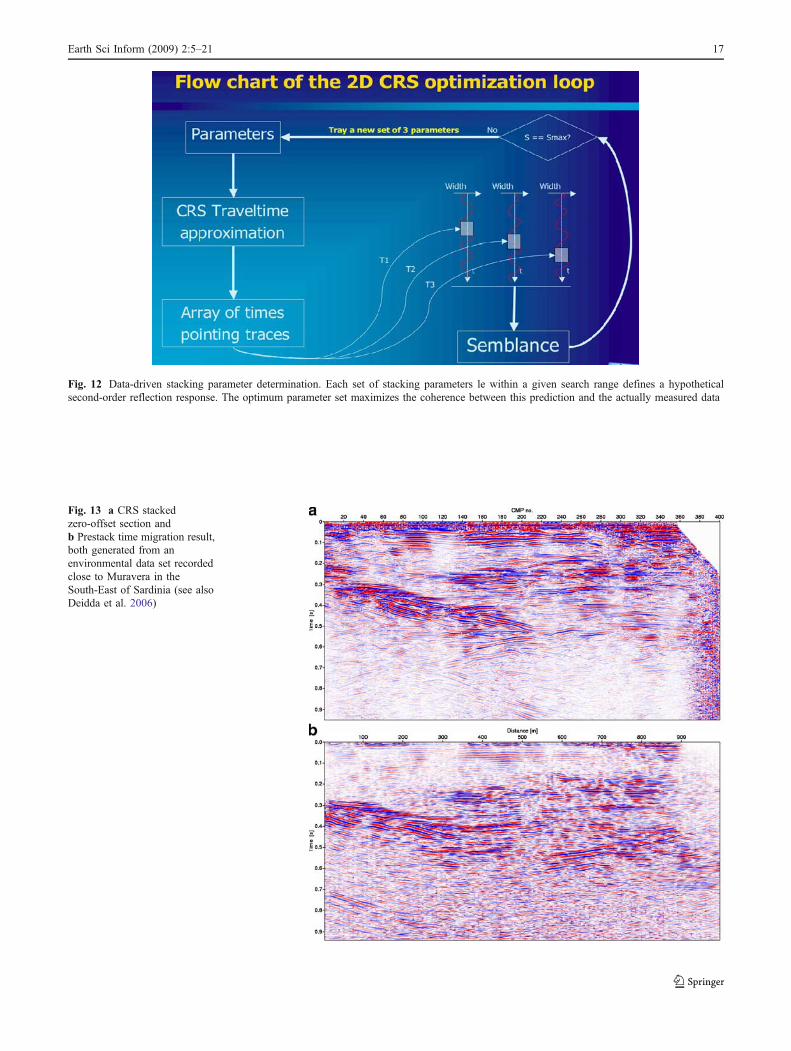
Fig. 13 a CRS stackedzero-offset section andb Prestack time migration result,both generated from anenvironmental data set recordedclose to Muravera in theSouth-East of Sardinia (see alsoDeidda et al. 2006)
Fig. 12 Data-driven stacking parameter determination. Each set of stacking parameters le within a given search range defines a hypotheticalsecond-order reflection response. The optimum parameter set maximizes the coherence between this prediction and the actually measured data
Earth Sci Inform (2009) 2:5–21 17
CRS stack and migration
The CRS theory provides a framework to derive a formulaapproximating the time of flight of signals traveling in aheterogeneous 2D medium. Stacking is applied in a data-driven manner: for each sample of the Zero-Offset (ZO)section three physically interpretable stacking parameters aredetermined from the seismic signals by means of a data-drivenoptimization loop as depicted in Fig. 12.
As a result, neither manual picking in velocity spectranor a priori information concerning the unknown macro-velocity model are required. The stacked ZO sectionobtained for a test data set acquired in the FlumendosaRiver Delta, Sardinia (Italy), is depicted in Fig. 13a. Thestacking parameter sections (picture omited) were used forCRS-based residual static correction (Koglin et al. 2006) tobuild a time migration velocity model and to defineoptimum migration apertures (Spinner 2007). By thismeans, user interaction is reduced and imaging errors dueto a wrong choice of processing parameters are prevented.A result of the limited aperture Kirchhoff time migrationscheme is depicted in Fig. 13b. A newly developed
georeferencing tool will soon allow to correlate theseresults with georeferenced data from other applications.
PREMIAGRID deployment
PREMIAGRID (http://grida3.crs4.it/enginframe/premiagrid) aims at the implementation of a grid-enabled Webdemonstrative application focused on meteorological mod-elling. More specifically, the main goal is the implementa-tion of an eight-member ensemble made up of threemesoscale models: Bolam (Buzzi et al. 1994), MM5 (Grellet al. 1994), RAMS (Pielke et al. 1992), the last one usedtwice with different setups. All of them can be fed with twosets of boundary and initial conditions originating fromECMWF (European Centre for Medium-Range WeatherForecasts, UK) and NCEP (National Centers for Environ-mental Prediction, USA). The results from the runs areaccessible in various numerical or graphical formatsthrough a user friendly Web portal.
The multi-model multi-analysis approach is a relativelynew method in the limited area ensemble meteorological
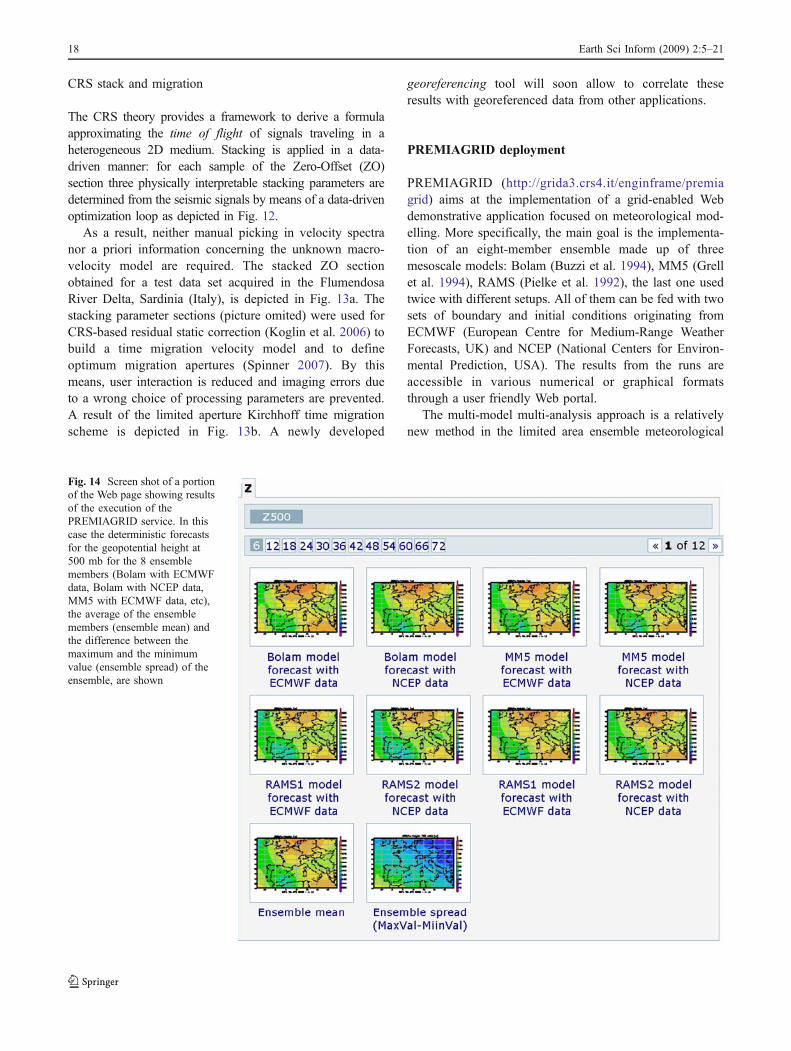
Fig. 14 Screen shot of a portionof the Web page showing resultsof the execution of thePREMIAGRID service. In thiscase the deterministic forecastsfor the geopotential height at500 mb for the 8 ensemblemembers (Bolam with ECMWFdata, Bolam with NCEP data,MM5 with ECMWF data, etc),the average of the ensemblemembers (ensemble mean) andthe difference between themaximum and the minimumvalue (ensemble spread) of theensemble, are shown
18 Earth Sci Inform (2009) 2:5–21

forecast: the single deterministic forecasts can be combinedusing specific techniques to get a probabilistic forecast(Palmer 1993), and thus to estimate the probability ofcertain events to develop. An assessment of the probabilis-tic skill of the PREMIAGRID ensemble has already beenaddressed and a detailed discussion of the results can befound in (Marrocu and Chessa 2008).
The PREMIAGRID application involves the implemen-tation of a complex pipeline whose main items can besummarized as follow:
& data from the ECMWF and NCEP global models aredownloaded using crontab scripts at four synoptic hours(00,06,12,18 UMT) and stored locally in a dedicateddatabase;
& these data are then passed to the pre-processing modulethat generates for each of the ensemble members theproper initial and boundary conditions;
& from this point each of the eight model-configurationscan be run and the output results are post-processed toget eight different forecasts;
& these individual deterministic forecasts are then com-bined using appropriate post-processing techniques toget a probabilistic forecast;
& at the end of the computation, the results of the eightdeterministic forecasts and the ensemble post-processingtechniques are shown automatically on the Web page ingraphical form. Figure 14 shows the geopotential heightat the 500mb pressure level as an example. The modeloutput data can be also accessed and downloaded indifferent binary formats by authorized users with theappropriate credentials.
The service PREMIAGRID can be run on demand bythe user who only has to set three parameters:
1. a generic location on the world where to centre thedomain of integration, by a simple clicking on a GoogleMaps of the globe;
2. the starting date of integration, by available data forinitial and boundary conditions shown on the calendar;
3. the period of integration, from 6 h to 72 h.
These features make the system very flexible andcustomizable to the needs of different users.
The access to the available computational resourcesthrough the portal offers an opportunity to use a servicebased on operational models, as well as a way to sharemeasured and/or forecast meteorological data within theVirtual Organization.After customization and implementa-tion of the appropriate access policies, this service can bemade available to different end users: public (civilprotection) and/or private (e.g. newspapers, televisionstations, tour operators). It also can be used for operational
purposes, running meteorological models at higher spatialresolution and/or nested over different sub-regions.
Conclusions and future work
The most valuable arguments for deploying typical standalone applications Earth Sciences in a grid problem solvingenvironment are the improvement of the quality of researchand the widening of the scientific goals. Here we illustratedhow these objectives are achieved using tools like GRIDA3where developers and researchers have the possibility to beorganically linked, overcoming the fragmentation of knowl-edge, in order to share know-how, skills, data, computa-tional models, simulation results, and other projectresources. We also showed that flexible, reliable and usablein a quite easy way tools of GRIDA3 can be customized tothe needs of applications coming from different fields.
For each application analyzed in the GRIDA3 project,the use of grid technology have lead to significantimprovements:
& integrating geochemical and soil data, located in severalUniversity nodes, in a single application helps tovalidate the outcomes of the stream sediments samplesand to study new correlations between chemicalelements and several parameters such as human healthand food quality (AGISGRID);
& reducing the in-the-field data acquisition time ofseismic data through optimization of the turnaround,entails a high decrease of the costs of acquisitioncampaigns and minimizes their impact especially oninhabited areas (EIAGRID);
& giving easy access to distributed computational and dataresources offers the opportunity to implement method-ologies as ensemble prediction systems not only to biginternational institutions, but also to national or regionalones (PREMIAGRID);
& deploying typical desktop tools within a grid infrastructureallows the extension of functionalities through the re-use and integration of packages (e.g. render simulationoutputs as thematic maps overlaying geographical infor-mation layers on the project Web-GIS platform) and thechaining between different applications (AQUAGRID,BONGRID).
The integration of tools specifically needed for eachapplication stimulated the enlargement of the features of theframework and the cross-usability of the tools.
GRIDA3 is still under development. At this stage and forthe aims of the project, external users can only benefit fromalready deployed applications with a small level of inter-activity. The future work will be devoted to widen the
Earth Sci Inform (2009) 2:5–21 19

potentialities of each deployed application (e.g. workflowengines; a data management tool to facilitate user-friendlyWeb access and management of large amounts of data; testson Integrated Rule-Oriented Data System—iRODS datagridmiddleware; GUI usability tests) and to enlarge the number ofGRIDA3 applications, allowing also external users to inte-grate their ones into the system.
Acknowledgements This work is funded by the government of theRegione Autonoma della Sardegna (RAS) and by GRIDA3 (ItalianMinistry of Research and Education—MIUR prog. n. 1,433/2006)project. The support of the colleagues of the Network and HighPerformance Computing Program and of NICE-s.r.l is gratefullyacknowledged.
References
AtkinsonMP, Britton D, Coveney P, De Roure DE, Garnett N, Geddes N,Gurney R, Ingram D, Haines K, Hughes L, Jeffreys P, Lyon LJ,Osborne I, Perrott R, Procter RN, Trefethen AE (2008) Century-of-information research—a strategy for research and innovation inthe century of information (CIR3). Available at the Web site ofNational e-Science Centre. http://wikis.nesc.ac.uk/escienvoy/Century_of_Information_Research_Strategy_%28CIR%29:_a_strategy_to_meet_the_research_challenges_and_opportunities_in_the_century_of_information. Accessed September 01, 2008
Beltrame F, Maggi P, Melato M, Molinari E, Sisto R, Torterolo L(2006) SRB data grid and compute grid integration via theenginframe grid portal. Technical Report SDSC TR-2006–1,February 2006, pp 15–20
Blake MB, Nowlan MF (2008) Predicting service mashup candidatesusing enhanced syntactical message management, scc, pp 229–236, 2008 IEEE International Conference on Services ComputingVol. 1, 2008
Buzzi A, Fantini M, Malguzzi P, Nerozzi F (1994) Validation of a limitedarea model in cases of Mediterranean cyclogenesis: surface fieldsand precipitation scores. Meteorol Atmos Phys 53:137–153
Cohen JK, Stockwell JJW (2000) Seismic Un*x Release 34: a freepackage for seismic research and processing. Center for WavePhenomena, Colorado School ofMines. Geophys J Int 125:431–442
Deidda GP, Ranieri G, Uras G, Cosentino P, Martorana R (2006)Geophysical investigations in the Flumendosa River Delta, Sardinia,Italy. Seismic reflection imaging. Geophysics 71(4):121–128
Doherty J (2002) PEST model independent parameter estimation.Watermark Numerical Computing
FAO (1976) A framework for land evaluation. Soils bulletin 32. Foodand Agriculture Organization of the United Nations, Rome
Fanfani L, Biddau R, Lecca G, Murgia F (2008) AQUAGRID: Aproblem solving platform for mine water (Sardinia first casestudy). Proceedings of the 10th International Mine WaterAssociation Congress, in press
Goldfarb CF, Prescod P (2000) The XML handbook. Prentice HallPTR, Upper Saddle River
Grace Team (2008) Grace user’s guide (for Grace-5.1.22). Available atthe site: http://plasma-gate.weizmann.ac.il/Grace/doc/UsersGuide.html#toc4.2. Accessed September 01, 2008
Grell GA, Dudhia J, Stauffer DR (1994) A description of the fifth-generation Penn State/NCAR Mesoscale Model (MM5). NCAR
Tech. Note NCAR/TN-3981STR, 121 pp. [Available from MMMDivision, NCAR, P.O. Box 3000, Boulder, CO 80307]
Halonen T, Romero J, Melero J (2003) GSM, GPRS, and EDGEperformance: Evolution towards 3G/UMTS. Wiley, West Sussex
Heilmann Z (2007) CRS-stack-based seismic reflection imaging forland data in time and depth domains. Available at KarlsruheUniversity site. http://digbib.ubka.uni-karlsruhe.de/volltexte/1000005850—Accessed September 03, 2008
Henderson A (2004) “The paraview guide: a parallel visualizationapplication” Kitware, Incorporated
Hewlett Packard (2008) IPMI: Intelligent platform managementinterface white paper
Jäger R, Mann J, Höcht G, Hubral P (2001) Common-reflection-surface stack: Image and attributes. Geophysics 66(1):97–109
Kesselman C, Foster I (2001) The anatomy of the grid, Proceedings ofthe 7th International Euro-Par Conference Manchester on ParallelProcessing, Pages: 1–4
Koglin I, Mann J, Heilmann Z (2006) CRS-stack-based residual staticcorrection. Geophys Prospect 54:697–707
Kosmas C, Ferrara A, Briassouli H, Imeson I (1999) Methodology formapping ESAs to desertification. In: Kosmas C, KirkbyM, Geeson N(eds) The MEDALUS (Mediterranean Desertification and Land Use)project, manual on key indicators of desertification and mappingenvironmentally sensitive areas to desertification. EUR 18882:31–47
Kropla B (2005) Beginning mapServer: Open source GIS develop-ment. 418 p, Apress L. P
Lecca G (2000) Implementation and testing of the CODESA-3Dmodel for density-dependent flow and transport problems inporous media, CRS4-TECH-REP-00/40, Cagliari, Italy
Lecca G, Murgia F, Maggi P, Piras A (2007) AQUAGRID: The subsurfacehydrology grid service of the Sardinian regional grid infrastructure.Proceedings of the Third EELA Conference. In: Gavela R,Marechal B, Barbera R, Ciuffo LN, Mayo R (eds), pp 357–365
Manca S, Cau P, Bonomi E, Mazzella A (2006) The DatacrossingDSS: a data-GRID based decision support system for groundwa-ter management. Proceedings the 2nd IEEE International Con-ference on e-Science and Grid Computing, Dec. 4–6, 2006,Amsterdam, Netherlands
Marrocu M, Chessa P (2008) A multi-model/multi-analysis limitedarea ensemble: Calibration issues. Meteor Appl 15:171–179
Neteler M, Mitasova H (2002) Open source GIS: a GRASS GISapproach, 464 p. Kluwer Academic, Dordrecht, Boston. ISBN 1-4020-7088-8
Palmer T (1993) Ensemble prediction. Proc. 1992 ECMWF Seminar,Reading, UK, ECMWF
Parkhurst DL (1995) User’s guide to PHREEQC—a computerprogram for speciation, reaction-path, advective-transport, andinverse geochemical calculations. U.S. Geological Survey Water-Resources Investigations Report 95-4227, 143 p
Pielke RA, CottonWR,WalkoRL, Tremback CJ, LyonsWA,Grasso LD,Nicholls ME, MoranMD,Wesley DA, Lee TJ, Copeland JH (1992)A comprehensive meteorological modelling system—RAMS. Me-teor Atmos Phys 49:69–91
PostgreSQL Global Development Group (2007) PostgreSQL referencemanual. Vol. 1–3. Network Theory Ltd
Rajasekar A, Wan M, Moore R, Schroeder W, Kremenek G,Jagatheesan A, Cowart C, Zhu B, Chen S, Olschanowsky R(2003) Storage resource broker—Managing distributed data in agrid. Computer Society of India Journal, Special Issue on SAN,33(4):42–54
Rysavy Research (2008) EDGE, HSPA and LTE Broadband Inovation.Available online at: http://www.rysavy.com/Articles/2008_09_Broadband_Innovation.pdf. Accessed September 01, 2008
20 Earth Sci Inform (2009) 2:5–21
Salminen R, Batista MJ, Bidoc M, Demetriades, A, De Vivo B, DeVos W, Gilucis A, Gregorauskiene V, Halamic J, Heitzmann P,Lima A, Jordan G, Klaver G, Klein P, Lis J, Locutura J, Marsina K,Mazreku A, Mrnkova J, O’connor PJ, Olsson S, Ottesen RT,Petersell V, Plant JA, Reeder S, Salpeteur I, Sandström H,Siewers U, Steenfelt A, Tarvainent T (2005) Geochemical atlasof Europe. Part 1: Background information, methodology andmaps. In: R. Salminen (ed.) Geological Survey of Finland.Espoo, 525 pp
Smith B (2007) A quick guide to GPLv3. 6 pages, Free SoftwareFoundation, Inc. Available at GNU Operating System site:http://www.gnu.org/licenses/quick-guide-gplv3.html—AccessedSeptember 01, 2008
Spinner M (2007) CRS-based minimum-aperture Kirchhoff migrationin the time domain. Available at Karlsruhe University site. http://
digbib.ubka.uni-karlsruhe.de/volltexte/1000007099—AccessedSeptember 03, 2008
Vacca A, Loddo S, Serra G, Aru, A (2002) Soil degradation inSardinia (Italy): main factors and processes. In: Zdruli P, Steduto P,Kapur S (eds) 7th International Meeting on soils with mediterra-nean type of climate (Selected Papers), Options Méditerranéennes,Series: Mediterranean Seminars, Volume A50, Valenzano (BA),Italy, ISBN 2-85352-248-2, ISSN 1016-121X, 413–423
Wouters P (2004) What is the matter with e-Science?—Thinking aloudabout informatisation in knowledge creation. Proceedings of Societyfor Social Studies of Science, & EASST CONFERENCE Paris.August 2004 Available at pantaneto site http://www.pantaneto.co.uk/issue2023/wouters.htm.—Accessed September 01, 2008
Yacoub MD (2001) Wireless technology. Protocols, standards, andtechniques. CRC Press LLC, Boca Raton
Earth Sci Inform (2009) 2:5–21 21