Grid West Project HVDC Technology · PDF fileGrid West Project HVDC Technology Review Page 9...
123
Grid West Project HVDC Technology Review Prepared by Les Brand / Ranil de Silva / Errol Bebbington / Kalyan Chilukuri For EirGrid Reference JA4846 Date 17 th December 2014
Transcript of Grid West Project HVDC Technology · PDF fileGrid West Project HVDC Technology Review Page 9...

Grid West Project
HVDC Technology Review
Prepared by Les Brand / Ranil de Silva / Errol Bebbington / Kalyan Chilukuri
For EirGrid
Reference JA4846
Date 17th December 2014

EirGrid Grid West Project
HVDC Technology Review
Page 2 of 123
Revision Table
Revision Issue Date Description
0 12/12/2014 Final for Approval
1 17/12/2014 Client Comments Addressed
2 28/1/2015 Client Comments Addressed
Reviewers
Name Interest Signature Date
Ranil de Silva Director of Engineering 28/1/2015
Approval
Name Position Signature Date
Les Brand HVDC Global Lead 28/1/2015

EirGrid Grid West Project
HVDC Technology Review
Page 3 of 123
TABLE OF CONTENTS
EXECUTIVE SUMMARY ....................................................................... 7
1. INTRODUCTION ............................................................................. 9
1.1 Consultant’s Scope ........................................................................... 9
1.2 Grid West Project ............................................................................. 9
2. HVDC TECHNOLOGY ..................................................................... 11
2.1 Available HVDC Technologies ........................................................ 11
2.1.1 LCC Technology ...................................................................... 12
2.1.2 VSC Technology ...................................................................... 13
2.1.3 CCC Technology ...................................................................... 14
2.2 HVDC Scheme Configurations ........................................................ 15
2.2.1 Point-to-Point Transmission and Back-to-Back Schemes .............. 15
2.2.2 Monopole and Bipole Configurations .......................................... 15
2.2.3 Ground and Metallic Return Options .......................................... 18
2.2.4 Symmetric Monopole ............................................................... 22
2.3 Multi-Terminal HVDC Schemes ...................................................... 22
2.3.1 Multi-Terminal HVDC Schemes Overview.................................... 22
2.3.2 LCC and VSC Based HVDC Schemes .......................................... 23
2.3.3 Parallel and Series Taps ........................................................... 24
2.3.4 Examples of Multi-Terminal HVDC Schemes ............................... 25
2.4 Meshed HVDC Systems .................................................................. 26
2.5 Embedded HVDC Schemes ............................................................. 27
2.5.1 Embedded HVDC Schemes Overview ......................................... 27
2.5.2 Examples of Embedded HVDC Schemes ..................................... 28
2.6 HVDC Expandability and Modularity .............................................. 30
2.7 HVDC Future Developments ........................................................... 34
2.7.1 LCC Future Developments ........................................................ 34
2.7.2 VSC Future Developments ........................................................ 35
2.7.3 Cable Future Developments ...................................................... 36
3. HVDC CONVERTER STATIONS ...................................................... 36
3.1 Major Components ......................................................................... 36
3.1.1 Valve Groups .......................................................................... 37
3.1.2 Transformers .......................................................................... 38
3.1.3 Converter Reactor ................................................................... 39
3.1.4 AC Filter ................................................................................. 39
3.1.5 DC Smoothing Reactor and DC Filter ......................................... 39
3.1.6 DC Capacitor ........................................................................... 40

EirGrid Grid West Project
HVDC Technology Review
Page 4 of 123
3.2 Converter Station Layout and Dimensions .................................... 40
3.3 Reactive Power Capabilities .......................................................... 43
3.3.1 LCC Converters ....................................................................... 43
3.3.2 VSC Converters ....................................................................... 44
3.3.3 Transient Overvoltages ............................................................ 44
3.4 Black Start Capabilities .................................................................. 45
3.5 Filters and Harmonics .................................................................... 45
3.5.1 Harmonics Overview ................................................................ 45
3.5.2 LCC Converters ....................................................................... 46
3.5.3 VSC Converters ....................................................................... 46
3.5.4 Filter Design ........................................................................... 47
3.6 Sub-Synchronous Interactions ...................................................... 47
3.7 Control and Protection System ...................................................... 48
3.8 Audible Noise ................................................................................. 48
3.9 Overload ......................................................................................... 49
4. HVDC CABLES ............................................................................... 50
4.1 HVDC Cable Types and Composition .............................................. 50
4.2 Cable Configurations ...................................................................... 53
4.3 Land and Submarine Cable Design ................................................ 53
4.3.1 Conductor Material and Size ..................................................... 53
4.3.2 Cable Insulation ...................................................................... 54
4.3.3 Cable Weights and Transportation ............................................. 56
4.4 Land Cable Installation .................................................................. 58
4.4.1 Trench Profile ......................................................................... 58
4.4.2 Open Trench Cable Installation Methods .................................... 59
4.4.3 Automated Installation Methods ................................................ 60
4.4.4 Horizontal Directional Drilling .................................................... 62
4.4.5 Selection of Installation Method ................................................ 63
4.5 Submarine Cable Installation ........................................................ 64
4.5.1 Required Submarine Cable Protection ........................................ 64
4.5.2 Submarine Cable Installation Methods ....................................... 65
4.5.3 Submarine Cable Burial Methods ............................................... 67
4.5.4 Cable Crossings of Existing Services .......................................... 69
4.5.5 Cable Protection Methods ......................................................... 69
4.5.6 Submarine Cable Landing ......................................................... 70
4.6 Fibre Optic Cables .......................................................................... 70
4.7 Cable Reliability ............................................................................. 71
4.7.1 Land Cables ............................................................................ 71
4.7.2 Submarine Cables .................................................................... 72

EirGrid Grid West Project
HVDC Technology Review
Page 5 of 123
4.8 Cable Repair Times......................................................................... 73
4.8.1 Fault Detection and Location .................................................... 73
4.8.2 Cable Repair ........................................................................... 73
4.8.3 Strategies for Minimising Downtime during Cable Repairs ............ 74
4.9 Cable Overload ............................................................................... 75
5. HVDC OPERATION AND PERFORMANCE ....................................... 75
5.1 HVDC Losses ................................................................................... 75
5.2 HVDC Reliability and Availability ................................................... 76
5.2.1 LCC Technology ...................................................................... 77
5.2.2 VSC Technology ...................................................................... 77
5.3 Operation and Maintenance Requirements ................................... 78
6. HVDC INTERACTIONS WITH AC SYSTEM ..................................... 79
6.1 HVDC Interaction Overview ........................................................... 79
6.2 Potential Interaction Issues .......................................................... 79
6.2.1 Short Circuit Ratio ................................................................... 79
6.2.2 Reduction in Fault Levels Compared with AC Connections ............ 80
6.2.3 AC Circuit Overload .................................................................. 80
6.2.4 AC System Voltage .................................................................. 80
6.2.5 DC Faults Affecting Operation of AC System ............................... 81
6.2.6 AC Faults Interrupting DC Power Transfer .................................. 81
6.2.7 Distortion in AC Voltages .......................................................... 82
6.2.8 Fluctuations in AC Voltages and Frequency when Ramping DC
Power .................................................................................... 83
6.2.9 Sub-synchronous Interactions with Generators ........................... 83
6.2.10 Interactions Between Multiple HVDC Schemes, Power Electronic
Devices and Special Protection Schemes .................................... 83
6.2.11 Long Term Changes to the AC System ..................................... 84
6.3 Assessment Criteria ....................................................................... 84
6.4 Mitigations ..................................................................................... 85
7. HVDC CONVERTER AND CABLE COSTS ......................................... 86
7.1 Costing Assumptions ...................................................................... 87
7.2 CAPEX Costs ................................................................................... 87
7.2.1 “Non EPC” Costs ...................................................................... 88
7.2.2 Converter Station Costs ............................................................ 89
7.2.3 Land Cable Costs ..................................................................... 90
7.2.4 Submarine Cable Costs ............................................................ 92
7.2.5 Reactive Support Costs ............................................................ 93
7.3 OPEX Costs ..................................................................................... 93

EirGrid Grid West Project
HVDC Technology Review
Page 6 of 123
7.4 Cost of Losses ................................................................................. 94
7.5 Mid-Life Refurbishment ................................................................. 95
7.6 End of Life Replacement ................................................................ 96
7.7 Lifetime Costs ................................................................................. 97
8. GRID WEST HVDC OPTIONS ......................................................... 97
8.1 Available HVDC Undergrounding Options ...................................... 98
8.1.1 Interaction with AC Network and Other HVDC Schemes ............... 98
8.1.2 Future Augmentation Considerations ........................................ 100
8.1.3 HVDC Technology ................................................................... 101
8.1.4 Scheme Configuration ............................................................. 101
8.1.5 HVDC Cables .......................................................................... 102
8.2 Appropriate Options ..................................................................... 103
8.2.1 Options Considered ................................................................ 103
8.2.2 Scoping and Cost Assumptions................................................. 103
8.2.3 Lifetime Cost Assumptions ....................................................... 104
8.3 Evaluation of Options ................................................................... 110
8.4 High Level Preferred Option ........................................................ 111
8.4.1 Maximum Network Flexibility Solution (Option 1) ....................... 111
8.4.2 North Mayo Generation Evacuation Solution (Option 2) .............. 113
8.4.3 Land Requirements ................................................................. 115
8.4.4 High Level Project Timeline ..................................................... 116
9. GLOSSARY AND ACRONYMS ....................................................... 117
10. REFERENCES ............................................................................ 119

EirGrid Grid West Project
HVDC Technology Review
Page 7 of 123
EXECUTIVE SUMMARY
EirGrid plc (“EirGrid”) is currently developing the Grid West Project, a major transmission
project in Ireland.
EirGrid is investigating the viability of utilizing underground cable technology in lieu of
overhead transmission lines for this project. With anticipated cable routes of the order of 112.5km for Grid West, any proposal to underground the Grid West project will need to consider utilizing High Voltage Direct Current (HVDC) technology.
Power System Consultants (“PSC”), as a globally recognised specialist in HVDC technology, was engaged to assist EirGrid in this investigation by delivering a report on HVDC technology that addresses key issues and characteristics associated with HVDC technology, and
compares and contrasts the various HVDC options that could be viable for these projects. PSC did not carry out any system studies or modelling during this investigation, and our report is based on PSC’s experience and information supplied by EirGrid.
In this report, Chapters 2 through to 7 detail and explain HVDC technology and any associated benefits and technical constraints of the technology. These sections are intended to be informational and generic in nature. The scope of these sections is limited to the
general parameters and requirements of the Grid West project.
Chapter 8 provides a high level review of options that could be considered when applying HVDC technology to the Grid West project. A preferred HVDC option is identified for the
project based on high level analysis and consideration of future augmentation. Construction costs have been benchmarked internationally based on publicly available information,
information supplied by EirGrid and/or budgetary pricing from cable manufacturers. The EPC contract cost estimates are combined with the “non EPC” costs (including development costs). Lifecycle costs, which include opex, cost of losses, and refurbishment costs, have also
been estimated and have been represented as annual costs discounted at a discount rate of 5.2% pa over 50 years.
Chapter 8 of this report identifies two potential solutions for Grid West, depending on
whether there is only a need to simply ensure export of additional generation in the North Mayo area (“North Mayo Generation Evacuation Solution”), or whether the inherent additional security of supply benefits that come with additional infrastructure are to be considered
(“Maximum Network Flexibility Solution”). The solutions are based on 500 MW ‘building blocks’ for converters and cables which are not directly comparable to AC solutions using EirGrid’s standard 400 kV AC 1500 MW building blocks.
North Mayo Generation Evacuation Solution – PSC has identified a preferred option of a 500MW symmetric monopole between North Mayo and Flagford using VSC
technology for the Grid West project. This solution has the capability for future augmentation (assumed to occur 10 years later) with a 1,000MW bipole HVDC scheme between North Mayo and Cashla using VSC technology. The estimated total
capex of this HVDC option for the Grid West project only is €357m with an estimated lifetime cost (without future augmentations) of €396m over 50 years. After completion of the future augmentations, the estimated lifetime cost is €817m over 50
years.
Maximum Network Flexibility Solution – PSC has identified a preferred option of two
separate bipole HVDC schemes, with an initial 500MW monopole between North Mayo and Flagford using VSC technology for the Grid West project. This solution has the capability for future augmentation (assumed to occur 10 years later) with a
second 500MW pole between North Mayo and Flagford and a new 1,000MW bipole between North Mayo and Cashla using VSC technology. The estimated total capex of
this HVDC option for the Grid West project only is €507m with an estimated lifetime cost (without future augmentations) of €527m over 50 years. After completion of the future augmentations, the estimated lifetime cost is circa €1.05bn over 50 years.

EirGrid Grid West Project
HVDC Technology Review
Page 8 of 123
Technical issues associated with the preferred HVDC option for the Grid West project have been outlined along with studies required to determine which of the two solutions should be
selected, and to ensure the selected option is viable.

EirGrid Grid West Project
HVDC Technology Review
Page 9 of 123
1. INTRODUCTION
EirGrid plc (“EirGrid”) is currently developing the Grid West Project, a major transmission
project in Ireland. EirGrid is investigating the viability of utilizing underground cable technology in lieu of overhead transmission lines for this project. With anticipated cable
routes of the order of 112.5km, any proposal to underground the Grid West project will need to consider utilizing High Voltage Direct Current (HVDC) technology.
The UK branch of Power System Consultants New Zealand Ltd (“PSC”) was engaged to assist
EirGrid in this investigation by delivering a report on HVDC technology that addresses key issues and characteristics associated with HVDC technology, compares and contrasts the various HVDC options that could be viable for this project.
1.1 Consultant’s Scope
PSC has been engaged to prepare a report on the application of HVDC technology, both in general and with reference to the Grid West project that will have two main parts:
1. Background and commentary on HVDC technology; and
2. Reference to how HVDC technology could be applied to the Grid West project.
In this report, the first part is presented in Chapters 2 through to 7. These sections are intended to be informational and generic in nature. The scope of these sections is however limited to the general parameters and requirements of the Grid West project. Some key
parameters of interest include required power transfer, cable routes and route length, connection AC voltage, AC network strength at the connection points and availability and reliability requirements. PSC’s commentary on HVDC technology will be limited to within and
in the vicinity of these key parameters.
For the second part, presented in Chapters 8, PSC’s scope is limited to a high level review of options that could be considered when applying HVDC technology to the Grid West project
and identification of a preferred option. The recommendations are based on the high level information provided by EirGrid and a desktop analysis using only indicative costing values located within the public domain. PSC did not carry out any system studies or modelling
during this investigation, and our report is based on PSC’s experience and information supplied by EirGrid.
This report only considers HVDC systems with underground DC cables. No analysis or
commentary on overhead DC transmission lines is included in this report.
1.2 Grid West Project
The Grid West project was originally proposed as a point to point 400kV AC connection between the proposed North Mayo substation to the existing Flagford substation in County Roscommon and ultimately could be further developed with a connection between the
proposed North Mayo substation and the existing Cashla substation in County Galway. It is driven by the need to facilitate the connection of a significant amount of wind generation in the North Mayo area.
Figure 1 shows the proposed route for the overhead 400 kV option.

EirGrid Grid West Project
HVDC Technology Review
Page 10 of 123
Figure 1 - Overview Map of Overhead Line Option
EirGrid is now considering a HVDC option for this project. The preferred route for an underground HVDC circuit from North Mayo to Flagford has been identified as shown in Figure 2.
Figure 2 - Overview Map of Underground Cable Option
When considering HVDC alternatives to this project within this report, PSC has considered the
following key parameters of the proposed solution.
The Grid West project HVDC solution will comprise a link with 500 MW capacity from
the proposed North Mayo substation in County Mayo to the existing Flagford substation in County Roscommon. This will require an N-1 security criteria where up

EirGrid Grid West Project
HVDC Technology Review
Page 11 of 123
to 500MW of DC transfer can be lost for a single contingency. The 500 MW loss will be picked up by generation reserves.
An ability to accommodate future requirements for North Mayo, including:
o An additional capacity of 1,000MW from the proposed North Mayo substation
in County Mayo to the existing Flagford substation in County Roscommon and/or from the proposed North Mayo substation to the existing Cashla substation in County Galway, driven by additional generation in the North
Mayo area and security of supply requirements.
o Security criteria options will be considered in light of network reinforcement and security of supply benefits. The reinforcement options to meet the
security of supply criteria will be considered when the need for network reinforcement arises.
Cable routes as follows:
o Approximately 112.5km route length between North Mayo and the Flagford substation as shown in Figure 2; and
o Approximately 132km route length between North Mayo and the Cashla substation.
To reduce environmental impact and for access to the cable for installation and
maintenance purpose, a route predominately in the public road has been selected, which will only leave the public road where necessary to cross infrastructure such as
rivers and railway lines.
HVDC solutions based on 500 MW ‘building blocks’ were used for converters and
cables to ensure that capital investment in line with the network needs. 500 MW is not directly comparable to EirGrid’s standard 400 kV AC solution which uses 1,500 MW building blocks.
2. HVDC TECHNOLOGY
2.1 Available HVDC Technologies
High Voltage Direct Current (HVDC) technology, in its most basic form, is the point to point transmission of power by first converting it from AC to DC at the rectifier converter station,
transmitting in DC to the inverter and then converting back to AC at the inverter. This is shown in Figure 3.
Figure 3 - Basic Diagram for HVDC Transmission
RECTIFIER INVERTER
DC TRANSMISSIONLINE OR CABLE
ACNETWORK
ACNETWORK
ACTIVE POWER FLOW

EirGrid Grid West Project
HVDC Technology Review
Page 12 of 123
HVDC transmission can be classified according to the three basic HVDC converter technologies in use:
1. Line Commutated Converters (LCC) – Sometimes referred to as “conventional” HVDC or “classic” HVDC, this technology utilises thyristor valves at the converter stations. LCC has been installed and operational since the mid-1950s, with thyristors
in use in LCC converter stations since 1972 [24] (prior to that mercury arc valves were used).
2. Voltage Source Converters (VSC) – Voltage source converters utilise Insulated
Gate Bipolar Transistors (IGBTs) instead of thyristors in the conversion process. Rather than relying on the network voltage for commutation, the IGBTs are switched
on and off under the direction of a control system to develop an AC and DC voltage waveform. VSC technology was first introduced by ABB in 1997 [2].
3. Capacitive Commutated Converters (CCC) – Capacitive commutated converters
are a variation of LCC and use the same thyristor technology. CCC technology was introduced in 1990 to deal with issues associated with weak AC networks. The first CCC scheme was commissioned in 1999 [25].
2.1.1 LCC Technology
LCC technology utilises thyristors to commutate the current. This technology requires a
synchronous voltage source in order to operate and the network needs to be relatively strong compared to the DC power transfer (high short circuit ratio).
An LCC converter is modular in design, with each “module” consisting of a six pulse bridge.
Two six pulse bridges are connected in series to create a twelve pulse bridge. In a twelve pulse bridge, a 30˚ phase shift between each six pulse bridge is achieved by using a star/star
connected converter transformer for one six pulse bridge and a star/delta connected converter transformer for the other six pulse bridge. The connection of six pulse bridges with a 30˚ phase shift has the advantage of reducing AC harmonic currents [24].
Figure 4 shows two common LCC HVDC configurations. Part (a) shows the monopolar configuration and part (b) shows the bipolar configuration (these configurations are explained in Section 2.2.2). Figure 4 represents each six pulse group using a thyristor symbol enclosed
in a box. The modular nature of the design is evident from Figure 4, with the monopolar configuration consisting of 4 six pulse bridges and the bipolar configuration consisting of 8 six pulse bridges. The converter stations can be interconnected by DC cables, an overhead DC
transmission line, or a combination of the two.
Figure 4 - Typical LCC Configurations [25]
(a) Monopolar configuration
(b) Bipolar configuration

EirGrid Grid West Project
HVDC Technology Review
Page 13 of 123
At present LCC technology is commercially available at DC voltages up to ±800 kV and for power transfer capacities up to 7,500 MW [24]. Very high power and long distance
applications are currently best achieved using LCC technology. There is a high cost associated with this technology, which diminishes in terms of cost per MW or cost per km as these variables are increased.
2.1.1.1 Advantages and Disadvantages of LCC Technology
The advantages of LCC technology include:
LCC is a well-established technology and there is a considerable amount operating
experience globally. The present design, utilising thyristor valves, has been in service since the early 1970s.
Converter station power losses are low at approximately 1.7% for both stations at full power [24].
At present, very high power transfer (>3,000 MW) is best achieved using LCC technology.
DC voltage levels of up to 800 kV are achievable with overhead lines, and up to 500 kV with mass impregnated cables. Voltage levels of 600 kV are under construction
using polypropylene laminate paper insulated cables.
The disadvantages of LCC technology include:
LCC cable systems cannot utilise extruded cables (which are generally less expensive
than mass impregnated cables for a given voltage and current rating) as power reversal of LCC schemes is achieved by reversing the voltage polarity. Extruded
cables will not tolerate this voltage polarity reversal.
LCC converters have a high reactive power demand, with converters at both ends
drawing reactive power from the AC network (typically 50% – 60% of the converter’s real power rating [24]). This requires a strong AC system with high short circuit ratio (SCR). Because of this, LCC schemes have no black start capability.
LCC produces harmonic currents that require a high level of filtering to meet the power quality requirements for connection to most AC networks. These filters add
additional expense and require a significant amount of space at each converter station.
LCC converters have an inherent minimum power transfer and cannot operate below
about 10% of their rated capacity [24].
Power reversal is achieved by reversing the voltage polarity. This polarity reversal
limits the application of cable to insulations that can handle the polarity reversal.
2.1.2 VSC Technology
VSC technology converts the AC voltage to a DC voltage through the use of Insulated Gate Bipolar Transistors (IGBTs), either using Pulse Width Modulation (PWM) or through the switching in and out of smaller DC capacitors (Modular Multi-level Converters (MMC)).
The fundamental difference between VSC and LCC is that the IGBTs used in VSC converters have the capability to control the switch on and switch off of the current, whereas the thyristors used for LCC can only control the switching on of the current. The switch off
capability means that VSC converters do not require a synchronous voltage for commutation.
VSC technology has similar key components as LCC technology, exceptions include:
The valves utilise IGBTs instead of thyristors.
There is minimal, or sometimes zero, AC filtering requirement.
The converter transformers for a symmetric monopole VSC system are very similar to normal AC transformers (often referred to as “interface transformers”).

EirGrid Grid West Project
HVDC Technology Review
Page 14 of 123
All other components remain the same, although they often differ in specification,
including valve cooling, control and protection systems, DC filters, smoothing reactor etc.
2.1.2.1 Advantages and Disadvantages of VSC Technology
The advantages of VSC technology include:
VSC schemes can supply power to a passive network or to a network with low SCR.
This makes them suitable for connecting areas with little or no synchronous generation, such as remote renewable generation. It also means that VSC schemes
are black start capable, requiring only an auxiliary power source for controls and cooling (e.g. a diesel generator) and at least one VSC converter connected to an energized AC transmission network.
In symmetric monopolar VSC schemes, the converter transformers are very similar to normal AC transformers. This makes them less expensive, easier to repair and more
reliable than LCC converter transformers. LCC converter transformers must be designed to handle AC and DC voltage stress which requires more complex insulation. Section 2.2.4 discusses the symmetric monopole configuration in more detail.
Controllability of reactive power is independent of active power transfer. VSC schemes can provide or consume reactive power, at a level directed by the operator,
to support the AC system.
VSC schemes do not require a large amount of reactive compensation and AC
filtering. The converters do not need to absorb reactive power and do not produce high magnitude harmonic currents as is the case for LCC converters.
Similarly rated VSC schemes have a smaller converter station footprint than an
equivalent LCC scheme. This is primarily due to the low or no requirement for harmonic filters.
VSC schemes do not need to reverse the voltage polarity to change power direction and can therefore make use of extruded polymer cables, which depending on the
required voltage levels, may lead to a more economical solution than the use of mas impregnated cables.
The disadvantages of VSC technology include:
There is less global operational experience with VSC systems. The technology is still evolving, with the latest converter topology – modular multilevel converters, being
introduced in 2006 [24].
Currently there is very little operational experience with the use of VSC using DC
overhead lines. The VSC main AC circuit breakers must be tripped to clear overhead DC line faults. LCC converters have the ability to rapidly reduce the DC voltage to extinguish the fault and then restart at partial of full DC voltage.
Although converter station losses are reducing, they are still higher than LCC station losses, at approximately 2% of total power transfer for both converter stations [2].
VSC converter station overload capabilities are limited when compared to that of a LCC converter stations [27].
2.1.3 CCC Technology
CCC technology was developed to overcome issues with connecting LCC HVDC schemes to
weak AC networks. An AC capacitor is connected in series between the converter transformer and the valve. The series capacitor supplies reactive power that is consumed by the valves and improves the dynamic performance of the HVDC system. The limiting factor for the

EirGrid Grid West Project
HVDC Technology Review
Page 15 of 123
uptake of this technology has been the additional DC voltage stress placed on the valves. Due to the additional voltage stress placed on the valves, CCC technology has to date only been
used for back to back HVDC schemes, where the DC voltages are much lower, than for HVDC transmission [28].
2.2 HVDC Scheme Configurations
2.2.1 Point-to-Point Transmission and Back-to-Back Schemes
HVDC schemes can be placed into two basic categories, point-to-point transmission schemes and back-to-back schemes.
In point-to-point transmission schemes the converters are placed at different geographical
locations and interconnected using DC overhead lines and/or cables. In back-to-back schemes, the converters are located within the same converter building.
HVDC point-to-point transmission schemes are used for long distance power transmission
using overhead lines, submarine and/or underground cable transmission and as an asynchronous link between AC systems [24]. Back-to-back schemes are primarily used to interconnect asynchronous networks that are geographically adjacent but not connected by
AC lines.
For the purpose of this report EirGrid’s Grid West project is considered to involve power
transmission through an underground cable, therefore the discussion in this report will be in the context of point-to-point transmission schemes.
2.2.2 Monopole and Bipole Configurations
The terms “monopole” and “bipole” refer to the use of one or two high voltage DC polarities to interconnect the converters of an HVDC bulk power transmission scheme. A configuration
with a single high voltage DC polarity (either positive or negative polarity relative to ground) is referred to as being monopolar or a monopole. A configuration with two high voltage DC polarities (one positive and one negative relative to ground) is referred to as being bipolar or
a bipole [10].
2.2.2.1 Monopole Configuration
The DC current flowing in the high voltage conductor must return to complete the current loop. In monopolar configuration, the return path for the DC current may be either through
the ground (ground return) or through a metal conductor held at ground potential (metallic return).
The monopole configuration with ground return shown in Figure 5 requires an electrode line
and a ground or sea electrode capable of continuously carrying the rated DC current of the converter. There are a number of drawbacks to the ground return configuration such as electrode erosion, corrosion of third-party buried metal pipelines and magnetic saturation of
transformers [10]. These drawbacks are discussed in detail in Section 2.2.3.
The monopole configuration with metallic return shown in Figure 6 uses a low voltage DC conductor to carry the returning DC current. The conductor is grounded at one end to
maintain a low DC potential along the metallic return. All of the return current flows in the metallic return conductor, and there is no DC current in the ground, thus avoiding the disadvantages of ground return. However there are drawbacks to metallic return such as the
cost of installing a metallic return which is generally higher than ground return and the increased power losses associated with metallic return.

EirGrid Grid West Project
HVDC Technology Review
Page 16 of 123
Figure 5 - Monopolar Configuration with Ground Return
Converter Transformer
12-Pulse Valve Group
HVDC Circuit
Figure 6 - Monopolar Configuration with Metallic Conductor Return
Converter Transformer
12-Pulse Valve Group
HVDC Circuit
Metallic Return Conductor
2.2.2.2 Bipole Configuration
The bipole configuration can be regarded as being made up of two monopoles as shown in
Figure 7. A bipole configuration costs significantly more than a monopole configuration but offers many advantages [10]:
a) During normal operation the DC current is essentially balanced between the poles,
resulting in ground current that is less than 1 – 2 % of rated current [24].
b) The two poles can be designed for independent operation so that a forced or planned outage on one of the DC transmission lines/cables or converters does not affect the
operation of the remaining healthy pole. For an outage of one converter, the bipole configuration can be designed to operate in:
Monopolar mode with ground return if sufficient electrode material is
included in the design.
Monopolar mode with metallic return using the failed pole’s line. This mode is
used if long-term ground current flow is undesirable and requires the installation of appropriate DC switchgear. An example of appropriate DC
arrangements is shown in Figure 8. To transfer current to the metallic return path (failed pole’s line or cable) and back to ground return without interruption requires a Metallic Return Transfer Breaker (MRTB) and
additional switchgear. If a short interruption of power flow is permitted, a MRTB is not necessary.
Monopolar mode with dedicated metallic return if even short-term ground
currents are unacceptable. A third conductor is added end-to-end which

EirGrid Grid West Project
HVDC Technology Review
Page 17 of 123
carries the small unbalanced currents during bipolar operation and serves as the return path during the outage of a pole [10].
The remaining healthy pole is then capable of delivering 50% of the nominal bipolar power rating. Bipole configurations can also be rated for short-term overload operation which is used to minimize the initial loss of power caused by a pole outage
by temporarily delivering greater than 50% of the nominal bipolar power rating [24].
c) If each of the two poles in a bipole configuration has a different full load current rating, they could be operated with different currents, as long as a return path is
provided through the ground or by a metallic return conductor.
d) For a given rated pole voltage and DC line/cable current, twice the amount of power
can be transmitted by a bipolar configuration in comparison to the monopolar configuration described in Section 2.2.2.1. For example;
a bipolar HVDC scheme with a pole voltage of ± 500 kV interconnected by a
DC conductor rated at 1 kA, the power transmission capability would equate to 1,000 MW (2 x 500 kV x 1 kA);
a monopolar scheme with a ground or metallic return with a pole voltage of +500 kV interconnected by the same 1 kA rated DC conductor would have a power transmission capability of 500 MW (500 kV X 1 kA).
Figure 7 - Bipolar Configuration with Ground Return
HVDC Circuit (- kV)
12-Pulse Valve Group
HVDC Circuit (+ kV)
Converter Transformer

EirGrid Grid West Project
HVDC Technology Review
Page 18 of 123
Figure 8 - Bipolar Configuration with Metallic Conductor Return
HVDC Circuit (- kV)
12-Pulse Valve Group
Converter Transformer
MRTB
HVDC Circuit (+ kV)Switchgear
2.2.3 Ground and Metallic Return Options
The term ground return is used to describe monopolar and bipolar schemes that utilise the earth and/or the sea as the conduction medium for ground currents. Metallic return uses a
low voltage DC conductor to carry the returning DC current. The conductor is grounded at one end to maintain a low DC potential along the metallic return. All of the return current flows in the metallic return conductor, and there is no DC current in the ground.
When compared with ground return there are two key drawbacks to metallic return; higher initial capital costs and increased operational power losses. The ground return option can often provide a lower capital cost solution as the cost of installing a metallic return is
generally higher than ground return particularly for long distance power transmission or when underground/submarine cables are used for power transmission.
The operational power losses associated with metallic return approaches twice the power loss
associated with ground return. This is because the resistance of the metallic return path is similar to the resistance of the high voltage conductor and doubling the resistance of the current loop will double the power loss. In the ground return option, the DC return current
will spread rapidly over a large cross-sectional area within the earth and/or sea from the point of injection at the electrode. As the resistance of the conduction medium is inversely
proportional to the cross-sectional area, the resistance of the ground return path and as a consequence the power losses in the ground return path are both very low [10].
Although ground return typically offers a lower capital cost option and reduced operational
power losses when compared to metallic return, there are numerous issues associated with high DC ground currents in the earth/sea which significantly reduce the feasibility of the ground return option. Key issues associated with DC ground currents in the earth/sea are
summarized in Table 1.

EirGrid Grid West Project
HVDC Technology Review
Page 19 of 123
Table 1 - Key technical and environmental issues with high DC ground currents associated with the ground return configuration [48]
Electrode Location
Issues Impact Potential Mitigations
Applicable to all
ground return configurations
Electrode corrosion The electrode operating as the anode will be
subject to a loss of material through electrolytic corrosion.
The impact of electrolytic corrosion can be minimised by
surrounding the electrode with cheaper conductive material.
For example, if an iron electrode was surrounded by coke and good surface contact between the two materials was
achieved, then the majority of the current flow between the iron electrode and coke will be through the exchange of electrons and not ionic. Thus, the electrolytic erosion of the
iron electrode can be drastically reduced. The coke will still erode but as it is a cheaper material, the erosion can be tolerated.
A section of the electrode may need to be replaced but this usually required only once every few years.
Effects on metallic underground or
grounded infrastructure in the vicinity of the
electrode
The flow of DC currents can cause touch potential and corrosion of buried metallic structures;
pipelines, cables, telephone lines and railway tracks. It can also cause disturbances in telecommunications circuits.
The simplest mitigation is to locate electrodes at a sufficient distance from structures. If it is not possible to do so then the
following mitigations can be applied :
For onshore pipelines, the joints can be insulated or
cathodic protection systems can be implemented.
For submarine pipelines, additional sacrificial material
can be added near/to the anodes.
The flow of current in the railway tracks can be
disrupted by adding electrical isolation gaps.
Replacing metallic conductors used in
telecommunication circuits with either fibre optic cables encased in plastic or by using radio links.

EirGrid Grid West Project
HVDC Technology Review
Page 20 of 123
Electrode Location
Issues Impact Potential Mitigations
DC current in transformer neutrals
Transformers with solidly grounded neutrals provide a return path for DC currents. Dependant
on the transformer’s ferromagnetic core design and the magnitude of DC current flowing through the neutral, a solidly grounded transformer may
experience saturation of the ferromagnetic core which in turn can introduce harmonics in to the power system.
A resistor or a capacitor can be added to the transformer neutral to lower the magnitude of DC current flowing in the
neutral thereby preventing core saturation.
Specific to land
electrodes
Electric fields Potential for dangerous step and touch voltages for
humans and animals (particularly four legged animals such as horses and cattle) close to the electrode sites.
The electrode sites can be designed to ensure low current
densities by increasing the electrode surface areas. Other mitigations include fencing off the site to prevent animal access and by increasing the depth at which the electrodes
are buried.
Soil around electrode site
The movement of charged water particles away from the anode electrode can reduce the moisture levels in the vicinity of the electrode and cause
possible heating and drying out of the soil.
Irrigation methods can be used to prevent drying out of the soil.
Specific to sea
electrodes
Electric fields Impact on fish and marine life behaviour. The electrode can be buried in the sea bed or the electrode
area can be fenced out preventing access to fish and marine life.
Electrolysis products Impact on flora and fauna due to hypochlorite, chloride, hypobromite, bromide, chloroform and
bromoform produced near the anode electrode during electrolysis.
Selection of appropriate electrode material, increasing electrode size thereby reducing current density and managing
the pH value near the electrode by ensuring satisfactory seawater exchange.

EirGrid Grid West Project
HVDC Technology Review
Page 21 of 123
Electrode Location
Issues Impact Potential Mitigations
Magnetic fields Magnetic compass deviations and impact on fish and marine life due to the magnetic fields
produced by the DC current carried by a single HVDC cable.
If multiple DC cables with currents flowing in opposite directions in each cable pairs are being implemented, the
magnetic fields can be mitigated by laying the HVDC cables near each other.
A partial mitigation for the potential impact on navigation on
marine vessel due to compass deviations is to mark the presence of the magnetic disturbances on nautical charts.

EirGrid Grid West Project
HVDC Technology Review
Page 22 of 123
2.2.4 Symmetric Monopole
Symmetric monopolar configuration can be used for VSC based HVDC schemes. An example of a simplified symmetric monopole configuration is shown in Figure 9. In a symmetric
monopolar configuration the converter stations are interconnected by two high voltage DC line/cables at opposite voltage polarity. Advantages of a symmetric monopolar configuration include [2, 60]:
As with the bipolar scheme described in Section 2.2.2.2, symmetric monopolar configuration for a given rated pole voltage and DC line/cable current, can transmit
twice the amount of power when compared to a monopolar configuration with ground or metallic return paths.
The drawbacks associated with DC ground current are avoided as the current flows
through the second HV conductor (similar to the metallic return described in section 2.2.3).
There are no DC stresses on the transformers. This is a significant advantage as special converter transformers capable of handling DC offset voltages are not
required which is likely to increase reliability. This is described in more detail in Section 5.2.
Disadvantages of a symmetric monopolar configuration include [63]:
Unlike a bipolar configuration, the symmetric monopolar configuration does not offer inherent redundancy i.e. a fault at the converter station or on one of the high
voltage DC transmission lines/cables would result in the loss of the whole HVDC scheme.
When compared with monopolar ground or even metallic return configurations,
symmetric monopolar configurations have an increased capital cost as two HV DC cables are required for operation.
When compared with monopolar ground return configuration, symmetric monopolar configurations have greater power losses (due to the same reasons as explained for
the metallic return described in section 2.2.3).
Figure 9 - Symmetric monopole configuration [2]
2.3 Multi-Terminal HVDC Schemes
2.3.1 Multi-Terminal HVDC Schemes Overview
The term ‘Multi-Terminal (MT)’ is used to describe HVDC schemes with the ability to flexibly
interchange power between three or more converter stations [49]. The three main configuration options for MT HVDC schemes are [35]:
Radial - Each converter station is connected to a single DC line, and is in parallel with
other converters. In radial configurations, any DC system disconnections will result in significant changes to the flow of energy in the AC system.
Series - All the convertor stations are connected in series in a ring shaped DC line. A section of the ring DC line cannot be disconnected without interrupting energy
exchange between the AC systems.

EirGrid Grid West Project
HVDC Technology Review
Page 23 of 123
Meshed - Where each converter station is connected to more than one DC line. Any part of the DC system can be disconnected without a change in the flow of energy
between the AC systems.
All existing MT HVDC schemes such as the Hydro-Quebec to New England and Sardinia-Corsica-Italy LCC HVDC schemes are radially configured.
2.3.2 LCC and VSC Based HVDC Schemes
Radial LCC based MT HVDC schemes usually operate with the rectifier controlling the DC
voltage and each of the inverters controlling the DC current. Draw backs for radial LCC based MT HVDC schemes include [50]:
Mechanical switching operation required to reverse the power flow direction in any
one converter.
In the MT HVDC scheme, if the converter stations are composed of series connected
converter bridges (12-pulse convertor configuration), and one of the series connect converter bridges is blocked, the entire MT HVDC scheme must operate at a
reduced voltage or the entire converter station containing the blocked converter bridge must be disconnected.
Commutation failure in an inverter can draw current from the other interconnected
converter stations. It can be difficult to recover from commutation failure if the inverter rating is small in relation to the other interconnected converter stations.
In series LCC based MT HVDC schemes, one of the converter stations is usually given the task of controlling the DC current whilst the remaining converter stations operate based on a firing angle limit. Unlike the radial configuration, series LCC based MT HVDC schemes can
reverse the power flow at any of the converter stations without mechanical switching operations. Converter valve groups or whole converter stations can also be taken out of service without affecting the remaining HVDC scheme.
There is growing interest in VSC based MT HVDC schemes due to the advantages they offer over LCC based MT HVDC schemes, such as:
The ability to control the power flow through each of the interconnected converter
stations and the capability to reverse power flow through a converter station without the need for mechanical switches.
The smaller footprint required for the converter station when compared with an LCC converter station. This is of particular benefit in offshore applications where there is
often limited area of available land.
The advantages inherently offered by VSC over LCC converters such as the ability to
connect to passive networks and lower harmonic generation.
At this point in time, the major drawback for VSC based MT HVDC schemes is the very limited operational experience with its implementation and operation. Due to this, credible and
reliable data with regards to expected challenges during implementation and operation of the HVDC scheme is sparsely available. However, due to the advantages of VSC technology described above and in Section 2.1.2, we anticipate VSC based MT HVDC scheme will be less
complex to operate than LCC based MT HVDC schemes.
The first VSC based MT HVDC (three terminal) scheme was successfully commissioned in China on December 25th 2013 [71]. The project has been developed to transmit wind power
generated on Nan-Ao Island to mainland of China. The project has a voltage rating of ± 160 kV and the three converter stations are rated at 200 MW, 100 MW and 50 MW. More
information on this scheme is available in reference [71].
A VSC based three terminal HVDC scheme named the South-West Link has also been proposed. This scheme will interconnect the southern part of the Swedish power grid with the

EirGrid Grid West Project
HVDC Technology Review
Page 24 of 123
western part of the power grid in Norway. More detail regarding the South-West Link is presented in Section 2.3.4.3.
2.3.3 Parallel and Series Taps
An existing point-to-point HVDC scheme could be tapped into using a parallel or series configuration. The selection of the tap configuration is dependent on various factors such as
the converter technology used in the existing scheme and the required power rating of the tapping converter station in relation to the power ratings of the existing converter stations. In general, parallel taps are used when the required power rating of the tapping converter
station is greater than 20%. Issues related to parallel tapping particularly for small taps (less than 20%) include [50]:
For LCC based inverter technology, small tapping converter stations will face
difficulties recovering from disturbances such as commutation failures.
High insulation coordination costs - the tapping converter station must be rated for
full line voltage and protected from surges corresponding to the line rating.
As the converter station must be rated for full line voltage, the converter must
incorporate the same number of thyristors as for the existing converter stations.
In general, parallel taps are used when the required power rating of the tapping converter
station is greater than 20 %. For small taps, where the power rating of the tapping converter station is 20 % or less, series taps are generally used [K7]. Figure 10 and Figure 11 respectively show an example of a simplified parallel tap and a series tap configuration.
If a low power series tap needs to be upgraded to a high power parallel tap then a significant replacement project will be required.
When evaluating the feasibility of tapping in to an existing point-to-point HVDC scheme, the
modifications required to the existing control system must also be considered. The complexity involved in modifying the existing control system depends on the particular application. For example, if a central controller is not required such as in the Sardinia-Corsica-Italy HVDC
scheme then the modifications required to the existing control systems can be simplified as the need for high speed high security telecommunication links between the converter stations
and the central controller can be avoided. More detail regarding the Sardinia-Corsica-Italy HVDC scheme is presented in section 2.3.4.1.
Figure 10 - Simplified configuration of a parallel tap MT HVDC scheme
HVDC Circuit
Converter TransformersParallel Tap
12-Pulse Valve Group

EirGrid Grid West Project
HVDC Technology Review
Page 25 of 123
Figure 11 - Simplified configuration of a series tap MT HVDC scheme
12-Pulse Valve Group
HVDC Circuit
Converter Transformers
Series Tap
HVDC Circuit
2.3.4 Examples of Multi-Terminal HVDC Schemes
2.3.4.1 Sardinia-Corsica-Italy HVDC Scheme
The Sardinia-Corsica-Italy Monopolar 200 MW 200 kV HVDC scheme (SACOI) interconnects
Sardinia and Italy, with a 50 MW parallel tap at Corsica. The link is composed of three 12-pulse LCC converters located at San Dolmazio (Italy), Lucciana (Corsica) and Cordrongianus (Sardinia). The converter stations are interconnected by two submarine cables and an
overhead line. The submarine cables connect the mainland of Italy with northern Corsica and southern Corsica with Sardinia. The overhead line runs along the eastern coastline of Corsica. Figure 12 shows the simplified configuration of the Sardinia-Corsica-Italy scheme.
The parallel tap at Corsica was seen as a way of compensating for the environmental drawback of the overhead line by providing a supply point to the Corsica network. Two major project specific reasons resulted in the selection of parallel tapping for the Corsica converter
station [49]:
The mercury arc valve technology used in the two main converter stations located in
Italy and Sardinia could not operate with the large extinction angles imposed by series tapping; and
The main link was to be used to control the frequency of the Sardinian Network. As a
result of this capability, the DC current flowing through the main link had the potential to rapidly change between 100A to 1,000A. For a series tapping alternative,
in order to ensure the required 20 MW availability in Corsica, the Lucciana station would have had to be rated at 200 MW (200 kV X 1,000A) which is excessive given that the guaranteed capability was only 20 MW.
The Sardinia-Italy section of the Sardinia-Corsica-Italy HVDC scheme was commissioned and operated for more than 20 years as a standard point-to-point 2-terminal HVDC scheme prior
to the addition of the parallel Corsica tap. In order to function as a 3-terminal HVDC scheme post inclusion of the Corsica parallel tap, the existing control system had to be modified. The modifications were relatively simple as the converter stations at Corsica and Sardinia were set
to control their own current to meet the local power and frequency requirements. The converter station in Italy, subject only to the limitations of its ratings, is set to meet the demands of the converter stations at Corsica and Sardinia. In this particular application, there
was no need for a central controller which avoided the necessity of high speed high security telecommunication links as the operating conditions and equipment ratings can be safely managed without the need for healthy telecommunication links [61].
More information can be found in reference [49].

EirGrid Grid West Project
HVDC Technology Review
Page 26 of 123
Figure 12 - Simplified configuration of the Sardinia-Corsica-Italy MT HVDC scheme
220 kV AC
Italy 200 MW1000 A
90 kV AC
Corsica 50 MW250 A
220 kV AC
Sardinia 200 MW1000 A
200 kV DC
2.3.4.2 NEA800 Scheme
A new LCC based MT HVDC scheme has commenced development in India. The HVDC scheme has a voltage rating of ± 800 kV and a power rating of 6,000 MW. It is due to be commissioned in 2014 – 2015. The link is composed of four terminals located at three
converter stations. This HVDC scheme has a continuous overload rating of 33 %, therefore has the capability to transfer 8,000 MW which would make the scheme the largest HVDC transmission ever built [52].
The key driver for this project has been the large amount of hydro power resources located in the North Eastern region of India. These resources are scattered over a large area and are located hundreds and at times thousands of kilometres away from the major load centres.
The intention is to create power pooling points to collect power from the hydro generators in the North Eastern region and transmit it to the distant load centres via the MT HVDC scheme [52].
2.3.4.3 South-West HVDC Scheme
The South West HVDC Scheme will interconnect Southern Sweden and Norway. The VSC based converter stations are located at Hurva and Barkeryd in Sweden and Tveiten in Norway. The scheme will reinforce the AC network and increase operational reliability in
southern Sweden and mitigate the existing transmission limitations between Sweden and Norway.
The scheme will consist of two parallel DC links with a 720 MW power transmission capacity,
operating at a DC voltage of ±300kV. Each of the converter stations will be configured as a symmetrical monopole without a neutral or ground conductor. The converter stations will be linked by sections of overhead lines and underground cables totalling in approximately 700 –
800kms in length [52].
The execution of this scheme has been split into two phases. Phase one will involve the HVDC connections at Hurva and Barkeryd in Sweden and phase two will extend the HVDC scheme
from Barkeryd to Tveiten in Norway. Phase one is due to be commissioned in late 2014 and phase two is expected to be ready after 2018. Note that as part of phase one, the DC side
connections in the Barkeryd station are being installed for the future connection to the third terminal. This will allow construction work for Phase two to be implemented, without disruption to the operation of phase one [51].
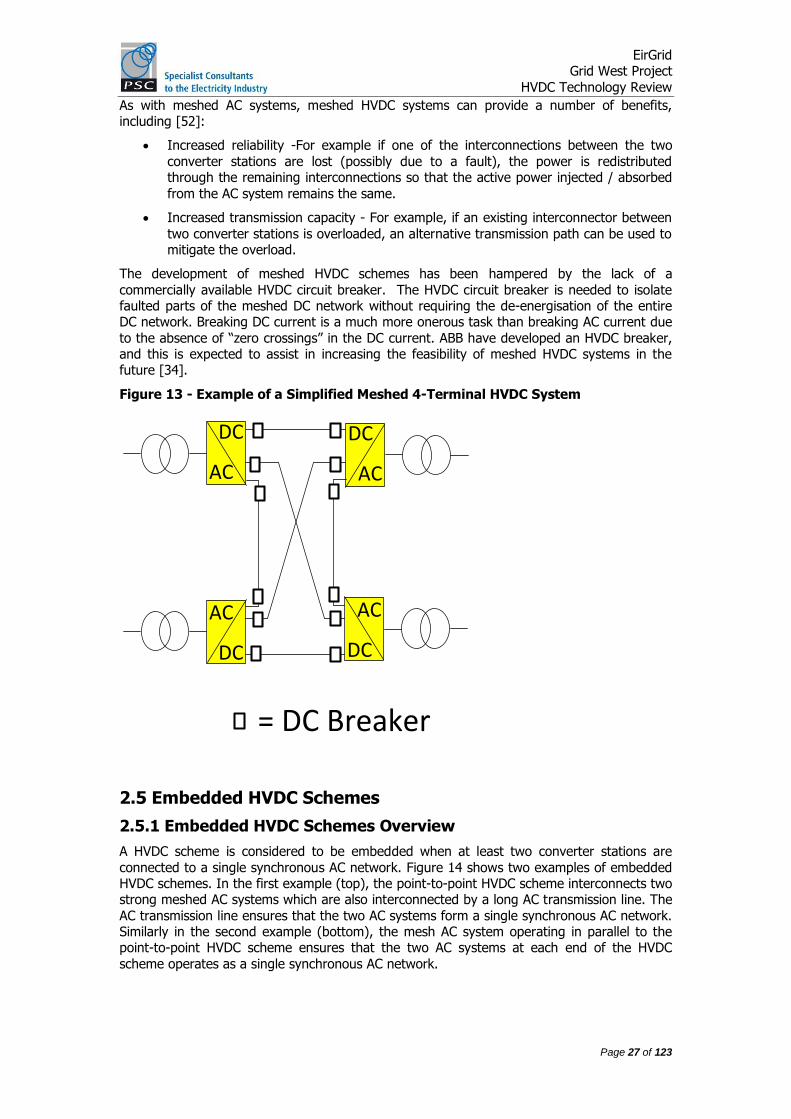
2.4 Meshed HVDC Systems
A meshed HVDC system is where multiple HVDC converter stations (three or more) are
interconnected by DC lines / cables. Figure 13 shows an example of a meshed HVDC system.
EirGrid Grid West Project
HVDC Technology Review
Page 27 of 123
As with meshed AC systems, meshed HVDC systems can provide a number of benefits, including [52]:
Increased reliability -For example if one of the interconnections between the two
converter stations are lost (possibly due to a fault), the power is redistributed through the remaining interconnections so that the active power injected / absorbed
from the AC system remains the same.
Increased transmission capacity - For example, if an existing interconnector between
two converter stations is overloaded, an alternative transmission path can be used to mitigate the overload.
The development of meshed HVDC schemes has been hampered by the lack of a
commercially available HVDC circuit breaker. The HVDC circuit breaker is needed to isolate faulted parts of the meshed DC network without requiring the de-energisation of the entire DC network. Breaking DC current is a much more onerous task than breaking AC current due
to the absence of “zero crossings” in the DC current. ABB have developed an HVDC breaker, and this is expected to assist in increasing the feasibility of meshed HVDC systems in the future [34].
Figure 13 - Example of a Simplified Meshed 4-Terminal HVDC System
AC
DC
AC
DC
AC
DC
AC
DC
= DC Breaker
2.5 Embedded HVDC Schemes
2.5.1 Embedded HVDC Schemes Overview
A HVDC scheme is considered to be embedded when at least two converter stations are
connected to a single synchronous AC network. Figure 14 shows two examples of embedded HVDC schemes. In the first example (top), the point-to-point HVDC scheme interconnects two strong meshed AC systems which are also interconnected by a long AC transmission line. The
AC transmission line ensures that the two AC systems form a single synchronous AC network. Similarly in the second example (bottom), the mesh AC system operating in parallel to the point-to-point HVDC scheme ensures that the two AC systems at each end of the HVDC
scheme operates as a single synchronous AC network.

EirGrid Grid West Project
HVDC Technology Review
Page 28 of 123
Figure 14 - Examples of embedded HVDC schemes
Long AC transmission line
Strong meshed AC
system
Strong meshed AC
system
Meshed AC system
Meshed AC system
Meshed AC system
By utilizing appropriate control algorithms, embedded HVDC schemes can offer the ability to
[28]:
Control power flows on the DC line and consequently the power flows across the
parallel AC transmission path.
Control AC system voltages (the level of control is dependent on the type of
converter technology selected).
Improve system transient stability and mitigate system cascading failure by rapidly
controlling the power injected in the AC system suffering from major outages.
Control frequency and dampen power oscillations.
Two examples of embedded HVDC schemes are provided in Section 2.5.2.
2.5.2 Examples of Embedded HVDC Schemes
2.5.2.1 Caprivi Link
The Caprivi monopole scheme is based on VSC converter technology and rated at 300MW. The scheme utilizes a 950 km overhead line operated at 350 kV DC to interconnect the
electricity networks of Namibia and Zambia. Prior to the commissioning of the Caprivi Link the power network of Namibia and Zambia were interconnected by only a meshed AC network. Both the Namibia and Zambia AC networks are weak, with potential for fault levels as low as
80 % of the rated power of the converters. There also exists a potential for either of these networks to become islanded. In light of these issues, VSC converter technology was selected
for the HVDC link [28].
Key control systems applied for the HVDC link include [28]:

EirGrid Grid West Project
HVDC Technology Review
Page 29 of 123
Power flow control – Export 0 to 300 MW from Zambia to Namibia or 0 to 280 MW from Namibia to Zambia without power interruption.
AC voltage control – Approximately ±200 MVAr is available at the converter terminals throughout the 0 – 300 MW range.
The reactive power can be maintained at a constant value if required.
If the AC network connected to either of the converter stations becomes passive or
islanded, the station can be set to frequency control.
An emergency power control system can reduce the active power transmitted for
certain network events (i.e. a “run-back scheme”), such as tripping of AC lines or generators.
The Caprivi Link enhances stability and assists with the prevention of blackouts by providing
voltage support when inherent voltage collapse situations arise. The link also provides stable frequency support to island or passive network conditions [28].
2.5.2.2 INELFE: France-Spain HVDC link
Currently, France and Spain are interconnected by four HV AC transmission lines which provide 1,200 to 1,400 MW of capacity from France to Spain and 900 to 1,100 MW capacity
from Spain to France. In order to expand the cross border interconnection capacity, the INELFE HVDC scheme was proposed [53]. The INELFE HVDC scheme, currently under construction, will connect France at the Baixas node to Spain at the Santa Llogaia node. The
INELFE scheme is based on VSC converter technology and will operate as two identical but independent symmetric monopolar systems. Each of the monopolar systems will have a
nominal active power rating of 1,000 MW and will be operated at a voltage of ± 320 kV [28]. As the INELFE HVDC scheme is VSC based, it will be capable of reversing power transfer direction without blocking a converter or performing any high voltage switching.
The control system of the HVDC scheme has been designed to improve dynamic behaviour during disturbances in the system as a severe incident in the Spanish network can impact the interconnection with France in the form of power flows and voltage oscillations. Control
algorithms to be implemented include [28]:
Active power control - the control system will increase/decrease the power
transmitted by the HVDC scheme based on the differences between AC phase measurements at both converter stations.
Reactive power/voltage control - the HVDC scheme will assist in the maintenance of
steady state network voltages by providing reactive power support.
The HVDC scheme will have the ability to reverse the active power flow in order to
maintain the network security. The HVDC scheme will be designed to change the flow of power from 2,000 MW in one direction to 400 MW in the opposite direction in less
than 150 milliseconds.
2.5.2.3 Trans Bay Cable
Trans Bay Cable is a HVDC link between Pittsburg, CA and San Francisco, CA which has been in service since early 2010. The facility provides a dedicated connection to downtown San Francisco from the East Bay. The HVDC link comprises two VSC converter stations and 86km
of submarine cable installed in San Francisco Bay. Prior to the commissioning of Trans Bay Cable, the major power supply to the City of San Francisco was from the south side of the San Francisco Peninsular [72] which is fed from an AC network which runs along the East
Bay. Both “ends” of the HVDC link at Pittsburg and Potrero connect to the PG&E AC network.
The Trans Bay Cable provides power flow from the existing AC network in the East Bay directly into San Francisco. This provides increased network security and reliability through

EirGrid Grid West Project
HVDC Technology Review
Page 30 of 123
the provision of an alternate transmission path into San Francisco as well as improved voltage support and a lower loss transmission path into the city [72]. The facility also reduced AC network congestion in the East Bay and avoided the need for additional power generation
facilities in the City of San Francisco [14].
2.6 HVDC Expandability and Modularity
Inherent modularity in the design of HVDC converter stations means that HVDC technology is
well suited to staged development The staged development of transmission capacity allows for the deferment of a portion of the capital cost until the additional transmission capacity is required. This might be a desirable approach, particularly when integrating renewable energy,
where planned generation assets may be commissioned over a period of many years.
The staged methodology would involve the initial construction of a transmission connection
with a lower capacity but designed and consented to be upgraded once the additional capacity is required. It is important to pre-plan future upgrades in Stage 1 to avoid considerable expense at later stages due to difficulties with integrating old and new
equipment.
The most common approach to the staged development of HVDC is to first construct monopole converter stations, with a later upgrade to bipole converter stations [24]. Figure 15
depicts this most common approach, with the first stage monopole configuration on the left and the second stage bipole configuration on the right. Although Figure 15 depicts an LCC HVDC scheme, this approach is equally valid for VSC schemes.
Figure 15 - Staged Development Monopole Configuration to Bipole Configuration [26]
(a) Monopolar configuration
(b) Bipolar configuration
Capacity is added at a later stage by either increasing the voltage rating by installing
converters in series (monopole to bipole is one example of this) or increasing the current rating by installing converters in parallel.
One key consideration when planning a staged development is the rating of the connection
between the two converter stations. Two options are available to the developer:
1. Over specify the initial cable (i.e. install all cables required for stage two at stage one); or
2. Install additional cable or overhead line capacity at stage two,
Figure 15 depicts option 2, with a second cable being installed as part of stage two. The decision whether to over specify the connection at stage one or add additional cable capacity
at stage two would depend on the results of a technical, economic and environmental assessment.
Another example of staged development of a HVDC scheme might be the addition of a third
terminal to provide another connection with the AC system (see Section 2.3).

EirGrid Grid West Project
HVDC Technology Review
Page 31 of 123
Table 2 gives three examples to illustrate how a staged approach to HVDC development might be implemented. Although the examples given are focused on VSC HVDC, the same methodology can be applied to LCC HVDC schemes. For LCC staged development the
technical challenges and the relative advantages and disadvantages may differ but the general approach is the same.
Examples 1 and 3 given in Table 2 would be good options if the stage two transfer capacity is
unknown at stage one. In both cases the stage one cable is fully utilised, reducing the risk of a stranded asset (higher rated cable than required) if stage two does not proceed. The major disadvantage is that additional cable will need to be installed at stage two.
Example 2 given in Table 2 shows how a staged development might be limited to converter station upgrades at stage two. Installing the full rated cable at stage one will mean less disruption to the local community at stage two and may result in a lower total cost of cable
installation.
An example of a VSC HVDC scheme that has been designed and constructed with a future upgrade in mind is the Caprivi Link in Namibia. Commissioned in 2010, the Caprivi Link
connects two weak AC systems with an asymmetric monopole rated at 300 MW and having a DC voltage of -350 kV. The addition of a second +350 kV pole in the future will increase the
link’s capacity to 600 MW. The transmission line for the Caprivi Link has been constructed with both pole conductors, ready for the future upgrade to a bipole. With the second conductor already installed the link can operate in three monopole configurations:
Metallic return using the second pole conductor as a metallic return conductor.
Ground return using just one of the two pole conductors (useful for maintenance).
Ground return with the two pole conductors in parallel (reduces losses).
Addition of the second pole will also add redundancy, as the system is designed to operate in
ground return mode, if one pole conductor is down the healthy pole can be operated as a 300 MW monopole [29].
The INELFE project consists of two parallel 1,000 MW ±320 kV VSC HVDC links between
Spain and France. Although this project is not being undertaken in stages, the design is similar to that of stage two in example 1 given in Table 2. The two parallel VSC links, although constructed on the same site, are completely separate and could equally have been
constructed in two stages if required [30].

EirGrid Grid West Project
HVDC Technology Review
Page 32 of 123
Table 2 - VSC staged development example [2]
Example
No. Description Stage one Stage two
1 Construction of a symmetric monopole scheme, with the option to build a parallel symmetric monopole.
Advantages:
Complete separation of the two stages allowing for more flexibility
at stage two.
No DC stress on transformers with
symmetric configuration.
Metallic return – No DC ground current.
Disadvantages:
Requires laying of two extra cables
at stage two.
Symmetric monopole:
750 MW ±320 kV.
2×1,200 mm2 Copper cables.
Parallel symmetric monopoles:
2×750 MW ±320 kV.
4×1,200 mm2 Copper cables.
2 Construction of an asymmetric
monopole scheme, with the option to build a second pole. Install ground return cable rated to 320 kV ready for
stage two.
Advantages:
Cable for final stage is installed
upfront. No need to lay more cable at stage two.
Metallic return – No DC ground
current.
Disadvantages:
Cables will not be fully utilized until stage two.
Converter transformers are
Asymmetric monopole with metallic ground return cable:
550 MW 320 kV.
2×2,400 mm2 CU cables.
Bipole:
1,100 MW ±320 kV.
2×2,400 mm2 CU cables.

EirGrid Grid West Project
HVDC Technology Review
Page 33 of 123
subjected to DC stresses with asymmetric configuration.
May need to use ±500 kV if greater than 1100 MW is required
at stage two. This would preclude the use of XLPE cables.
3 Construction of an asymmetric
monopole scheme, with the option to build a second pole. Install just one cable at stage one.
Advantages:
Lower initial cost of cabling.
No redundancy in the cable at
stage one.
Disadvantages:
Environmental effects of ground return currents may inhibit approval process.
Converter transformers are subjected to DC stresses with
asymmetric configuration.
May need to increase voltage to ±500 kV if greater than 1,100 MW
is required at stage two.
Asymmetric monopole without metallic ground return
cable:
550 MW 320 kV.
1×2,400 mm2 CU cables.
Bipole:
1,100 MW ±320 kV.
2×2,400 mm2 CU cables.

EirGrid Grid West Project
HVDC Technology Review
Page 34 of 123
Long distance HVDC schemes frequently transverse regions where future generation may be developed, or future supply points may be added. Tapping the HVDC link is a possible option
for connecting the generation or supply point to the network, particularly when the alternative is to build a long AC line to connect to the AC network.
However tapping an HVDC link is a considerably more complex exercise than tapping into an
AC line. An AC tap can be implemented by building a substation, including transformers if necessary, and modifying the AC protections to handle the new configuration. On the other
hand, implementing a DC tap requires building a converter station and completely re-designing the control system of the HVDC scheme, turning a point to point HVDC connection into a multi-terminal HVDC connection. This re-design will require all of the AC/DC interaction
studies to be repeated, new controls to be built, and re-commissioning of the entire HVDC scheme. The cost of this exercise can be somewhat mitigated by incorporating the possibility of future taps into the original design. Implementing the tap would then only require building
the converter station and re-commissioning the scheme.
2.7 HVDC Future Developments
2.7.1 LCC Future Developments
LCC utilising thyristor valves is a well-established technology. While developments in thyristor technology will continue, the basic topology of LCC converter stations is likely to remain the
same. With VSC technology gaining favour in areas such as offshore wind, multi-terminal schemes and HVDC grids, the development in LCC technology appears to be concentrated in the area of point to point bulk transmission.
In recent years the surge in energy requirements in geographically expansive countries such as China, India and Brazil has driven the development of large scale long distance HVDC. LCC HVDC schemes are best suited to these applications, with schemes rated at around 6,400 MW
and having transmission distances greater than 2,000 km being implemented in China. The primary means of achieving these very high power transfers has been to increase the transmission voltage. Presently the highest DC voltage in operation is ±800 kV, however,
±1,000 kV and greater has been proposed and developed [31].
The modular nature of HVDC converters is utilised to achieve voltages up to ±800 kV. By combining 12 pulse groups in series, converter valves can be rated for voltages up to ±800
kV. The main technical issue facing future HVDC at voltages above ±800 kV is the voltage stress placed on equipment such as converter transformers and with the very large air clearances required. The bushings on the converter transformer shown in Figure 16 give an
indication of the clearances in air required for ±800 kV HVDC.
Figure 16 - HVDC Converter Transformer for ±800 kV [32]

EirGrid Grid West Project
HVDC Technology Review
Page 35 of 123
2.7.2 VSC Future Developments
VSC technology is comparatively new and has evolved significantly since its introduction in
1997. Initially only ABB offered a VSC solution for HVDC transmission, starting with “Generation 1 HVDC Light®”, this technology has evolved to “Generation 4 HVDC Light®”,
which was introduced in 2010 [2]. Although the introduction of multi-level converters appears to represent a stable platform for VSC topology, VSC technology is likely to continue to evolve further in the coming years.
The key areas of development are likely to be:
Increased capacity – As with LCC converters, additional capacity of a single VSC
link may be gained by increasing the DC voltage. At present ABB offers base modules up to ±640 kV with a capacity of greater than 2,000 MW [2]. Limiting the uptake of
VSC schemes at these voltage levels is the voltage rating of the cable connections. VSC technology can use polymer cables, which are presently limited ±320 kV. It is likely that as cable technology improves the voltage and power rating of VSC
schemes being commissioned will also increase.
Reduction of losses – Continual improvement in power semiconductor technology
is likely to result in the losses associated with switching IGBTs to continue the downward trend as seen in Figure 17.
Figure 17 - HVDC Light® Converter Losses as a Percentage of Rated Power [2]
DC fault clearing – At present DC faults are cleared by the AC breakers as the IGBTs have only forward blocking capability. During a fault on the DC system, the
free-wheeling diodes of the IGBTs will continue to feed the fault even when the converter is blocked [12]. This characteristic of VSC HVDC has limited uptake of the technology for overhead line schemes and will require a solution before HVDC grids
can be realised.
Full bridge MMC – At present MMC VSC converters utilise a half bridge arrangement
of IGBTs in each module. Siemens offers a full bridge option, with the capability for voltage polarity reversal, in the Siemens HVDC Plus range for traction systems. This technology might be extended to VSC overhead line schemes, where the voltage
polarity reversal could be used to clear a non-permanent DC line fault (e.g. an air insulation fault caused by lightning strike)[33]. Limiting the development of this
technology at present is the losses associated with switching IGBTs. The full bridge design uses twice the number of IGBTs, therefore the switching losses are doubled with this design.

EirGrid Grid West Project
HVDC Technology Review
Page 36 of 123
Hybrid DC circuit breaker – HVDC grids will require the development of a fast DC
circuit breaker. Existing mechanical breakers are too slow and attempts to develop a fast mechanical breaker have failed. Semiconductor HVDC breakers can easily overcome the speed issues but introduce losses up 30% of the converter station
losses. As a solution ABB has developed a hybrid (mechanical and semiconductor) HVDC circuit breaker. At present the ABB HVDC breaker remains in the development phase [34].
2.7.3 Cable Future Developments
The two key developments in high voltage DC cables lay in increasing the DC voltage and in the introduction of polypropylene laminated cables (PPL).
The current maximum voltage is 500kV for mass impregnated DC cables [58] and 320kV for
polymer DC cables [1]. This is based on actual projects either installed and/or committed to date. There is only a small amount of operational experience with the 320kV polymer cables. It is understood that various DC cable manufacturers are undertaking the necessary research,
development and pre-qualification for higher voltages for both mass impregnated and polymer cables, although at this stage there is no operational experience with DC voltages higher than these values [59].
New cables designs, particularly those at higher DC voltage, require prequalification tests to be performed. These are tests performed on samples of the new designed cables which must be passed before the cable can be offered on a commercial basis. These tests are required to
satisfy owners and operators that the cable can provide satisfactory long term performance [23].
Solid Polypropylene Laminated Paper (PPLP) comprises a layer of polypropylene film
“sandwiched” between two layers of kraft paper. This paper has higher AC, impulse and DC breakdown strength and lower dielectric loss than “conventional” kraft paper used in mass
impregnated cables [19]. Oil filled cables with PPLP insulation have been used on a number of AC and DC projects up to 500kV [19]. New designs have been developed for “solid” DC cables. PPLP cables will be used on the Western Link project which connects the Scottish and
the English power grids. The DC voltage for these cables is 600kV [60]. This project is scheduled for completion in 2016. There is currently no operational experience with solid DC PPLP cables.
3. HVDC CONVERTER STATIONS
3.1 Major Components
Figure 18 and Figure 19 show simplified representations of LCC and VSC converter station components respectively. The following sections will describe each of the major components and the key differences in the major components between the two converter station
technologies.

EirGrid Grid West Project
HVDC Technology Review
Page 37 of 123
Figure 18 - Major Components of a LCC HVDC Converter Station
AC Filters
Transformers
Valve
AC
DC
DC Filters
DC Smoothing Reactor
Figure 19 - Major Components of a VSC HVDC Converter Station
AC
DCTransformer
AC Filters
Converter Reactors
DC Capacitor
Valve Groups
3.1.1 Valve Groups
The fundamental building block for LCC converters is the six pulse bridge, shown in red in Figure 20, which consists of two thyristor valves per phase. Due to the high voltage and
current rating required for HVDC, each thyristor valve consists of many series/parallel thyristors. Often the thyristor valve is simply referred to as a valve, which is a throwback to the early days of HVDC when mercury arc valves were used [10]. The turn on time of each
valve is controlled to produce a DC voltage at the DC terminals of the converter. The turn off of thyristors cannot be controlled.
LCC converters are usually implemented as a twelve pulse circuit, consisting of two six pulse
bridges in series, as shown in Figure 20.
Figure 20 - LCC valve arrangement – twelve pulse bridge

EirGrid Grid West Project
HVDC Technology Review
Page 38 of 123
The fundamental building block for the MMC VSC valve is the half bridge IGBT circuit with a capacitor, shown in red in Figure 21, commonly referred to as a module or cell. MMC VSC
converters consist of many modules in series (38 modules per arm for a ±320 kV converter [24]). The turn of and turn on controllability of the IGBT allows the control system to insert or bypass individual modules. The control system uses this functionality to control the voltage
across the converter reactor and thus control the power flow (active and reactive) [2].
Figure 21 - MMC VSC valve arrangement [2]
Figure 21 shows the latest MMC VSC topology. Earlier designs using two level converters and pulse width modulation (PWM) are also still available. Two level converter topology is
essentially the same as a single module shown in Figure 21. One IGBT (comprising many series connected IGBTs) forms the upper leg and the other forms the lower leg. The IGBTs are switched using PWM to produce the AC waveform. This technology produces higher
magnitude harmonics and places additional voltage stress on the converter reactor [24].
3.1.2 Transformers
Converter transformers provide the connection between the converter station and the AC
system. Although the basic operating principles are the same as a normal AC transformer, converter transformers are subjected to additional stresses. This is particularly true of
converter transformers for LCC HVDC schemes. These stresses included [24]:
The valve windings are subjected to, as well as the usual AC voltage stress, DC voltage stress. Additionally, DC pre-magnetisation of the transformer core means that
additional core steel is required to prevent magnetic saturation.
High magnitude harmonic currents produce additional losses, consequently heating of
the transformer.
LCC converter transformers consist of a bank of transformers for each 6-pulse group with star/star and star/delta connections. The bank may comprise:
A single 3-phase, 3-winding transformer.
Two 3-phase, 2-winding transformers.
Three 1-phase, 3-winding transformers.
Six 1-phase, 2-winding transformers.
Factors that govern the converter transformer arrangement include required power rating,
voltage rating and transport constraints.
To differentiate the VSC transformers from “true” converter transformers, the term “interface transformer” is often used. For VSC interface transformers, two winding configurations are

EirGrid Grid West Project
HVDC Technology Review
Page 39 of 123
utilised. Although VSC interface transformers are subjected to a higher level of harmonic currents than normal AC transformers, the level is significantly lower than for LCC converter
transformers. For symmetrical VSC designs the interface transformers are not subjected to any DC voltage stress, resulting in a transformer design that is very similar to a normal AC transformer. For asymmetrical design the transformer will be subjected to a DC offset on the
valve side AC winding, which will result in a more complicated transformer design [2].
3.1.3 Converter Reactor
Converter reactors are required for VSC converters and not for LCC converters. The converter reactors main purpose is to:
1. Provide a means to control active and reactive power – The voltage across the
reactor is controlled and this determines the power flow (active and reactive) between the AC and DC systems.
2. Limit the fault contribution from the AC system in the event of a converter or DC
line/cable fault.
The converter reactors for early VSC schemes (PWM VSC) were subjected to large switching voltage stresses. The latest MMC VSC schemes result in much lower voltage stress on the
converter reactors, but require the reactor carry both AC and DC currents [2].
3.1.4 AC Filter
LCC converter stations produce high magnitude harmonic currents that would be detrimental to the AC system if filtering was not performed. VSC schemes on the other hand have very
low or sometimes no harmonic filtering requirements.
VSC harmonic filter requirements depend on:
1. The converter topology – PWM VSC schemes produce greater magnitude harmonics
than MMC VSC schemes.
2. The requirements of the AC network – Permissible voltage distortion and the harmonic impedance of the connected AC system may determine if filtering is
required.
High frequency and radio interference filters are usually required for VSC schemes due to the relatively high switching frequencies. If power line carrier (PLC) systems such as ripple
control for hot water systems are used on the AC network, additional PLC filters may be required [2].
The AC filters for LCC converter stations require a significant amount of space due to the
number and magnitude of the current harmonics produced by a LCC converter. Another characteristic of LCC converters is that they draw a large amount of reactive power from the AC system (as discussed in Section 3.3.1). The filters perform two functions:
1. To filter unwanted current harmonics such that the converter station will meet the power quality requirements of the connected AC system.
2. Provide reactive support by supplying, at least in part, the reactive power required by the converter.
3.1.5 DC Smoothing Reactor and DC Filter
Harmonic voltages occur on the DC side of the converter which lead to high frequency AC currents being superimposed on the DC current in the transmission line. These high
frequency currents can cause interference issues with nearby telecommunication systems [36]. DC smoothing reactors and harmonic filters are required for LCC HVDC schemes, particularly those that utilise overhead lines. VSC schemes generally have a lower

EirGrid Grid West Project
HVDC Technology Review
Page 40 of 123
requirement for DC smoothing reactors and harmonic filters [2], however, the requirement would be determined following a detailed investigation of each specific VSC HVDC project.
The DC smoothing reactor is most often an air core design, however, iron core oil filled designs have been utilised. The DC smoothing reactor is placed in series with the transmission line and forms part of the DC filter. The main functions of the reactor are:
1. Reduction of harmonic currents and preventing intermittent current at minimum load.
2. Limiting DC fault current
3. Prevention of resonance in the DC circuit
The DC filters usually consist of passive shunt components which are tuned to filter the high frequency AC currents. The design of the DC filter is specific to each HVDC scheme and will
account for the different operating modes (monopolar or bipolar operation).
3.1.6 DC Capacitor
The DC capacitor is required for VSC schemes using both earlier PWM and the more recent MMC topologies. A separate DC capacitor is not normally required for LCC schemes.
The DC capacitor is placed at each pole. The main capacitance for MMC VSC is provided by
the capacitor in each module, however, a pole capacitor is still required. The pole capacitor for MMC VSC schemes is therefore considerable smaller than that of PWM VSC schemes [2].
3.2 Converter Station Layout and Dimensions
Figure 22 shows a converter station layout in “plan view” for the East West Interconnector. This is a relatively new VSC converter station using ABB Generation 3 HVDC Light®
technology. It is expected that a Generation 4 multilevel VSC station would be much the
same size, however, the filter hall is likely to be smaller and the valve hall is likely to be larger. Figure 23 shows a photograph of a converter station for the East West Interconnector.
Figure 22 - VSC Converter Station Layout – East West Interconnector [37]
Filter hall
Valve hallDC hall
Control building
Spare parts building
Valve cooling
AC yardTransformers
Emergency generator

EirGrid Grid West Project
HVDC Technology Review
Page 41 of 123
Figure 23 - VSC Converter Station – East West Interconnector [38]
Figure 24 shows a converter station layout in “plan view” for a 1,500 MW LCC HVDC converter station [39]. Although this example is for a station with three times the capacity of the East West Interconnector, it is interesting to note the relative space requirements of the
various items of equipment. In particular, the AC filters and AC yard for the LCC HVDC converter station take up greater than 50% of the total land area. This is common as the high requirement for AC filtering with the LCC technology requires large AC filter yards.

EirGrid Grid West Project
HVDC Technology Review
Page 42 of 123
Figure 24 - LCC Converter Station Layout [39]
AC filters
Valve cooling
AC filters
AC yard Control room
Transformers
Transformers
AC reactors
AC reactors
Valve Hall 2
Valve Hall 1
Pole 2 DC switchgear
Pole 1 DC switchgear
240 m
18
0 m
Figure 25 shows a 2,000 MW ABB Generation 4 HVDC Light® converter station, comprised of two parallel 1,000 MW ±320 kV symmetric monopoles. As the ABB Generation 4 HVDC Light®
technology is modular in nature, it is reasonable to assume that the footprint of the converter station is linearly related to the converter rating. Therefore, a reasonable estimate for the footprint of a 1,500 MW ABB Generation 4 HVDC Light® converter station would be 24,750 m2
(220 m × 150 m × 0.75). The footprint of the 1,500 MW LCC converter station shown in
Figure 24 is 43,200 m2, or approximately 70% larger than that of the estimated footprint for the 1,500 MW ABB Generation 4 HVDC Light® converter station. An electricity transmission
costing study conducted by Parsons Brinkerhoff, for the Department of Energy and Climate Change in the United Kingdom, also estimated that a LCC converter station will have a footprint approximately 70% greater than an equivalent VSC converter station [40].
A separate Parsons Brinkerhoff study suggested that the use of Gas Insulated Switchgear (GIS) might reduce the footprint by as much as 30% [39]. This estimate was based on LCC technology and it is expected that the space saving would be less for VSC technology, as the
AC yard accounts for a smaller proportion of the total land area of a VSC converter station.

EirGrid Grid West Project
HVDC Technology Review
Page 43 of 123
Figure 25 - ABB HVDC Light® Generation 4 VSC Converter Station Layout -
2×1,000 MW ±320 kV [41]
3.3 Reactive Power Capabilities
3.3.1 LCC Converters
HVDC schemes that utilize LCC technology have very limited reactive power control capabilities. LCC converters can only consume reactive power due to the large reactance of the converter transformers which results in the current phase angle inherently lagging the
voltage phase angle. The delay angle associated with the LCC converter commutation process further exacerbates the situation. Due to the large reactance of the converter transformers and the commutation delay angles, LCC converters consume about 50% to 60% of the
transmitted active power [12].
The reactive power consumed by the LCC converters varies according to the level of active power being transmitted at the time, therefore switchable filters and shunt capacitor banks
are typically installed for LCC based HVDC schemes. Although the primary purpose of the switchable filters is to absorb the harmonic currents generated by the LCC converters as a result of the commutation process (further described in section 3.5), they are also designed
to appear capacitive (act as a source of reactive power) at fundamental frequency to support the LCC converters. The shunt capacitor banks are usually switched via circuit breakers so that their generated reactive power matches the reactive power consumed by the LCC
converters [12].
The presence of switchable shunt capacitor banks offers a crude reactive power control capability by switching in and out individual shunt capacitor banks as required. For example,
the Basslink HVDC scheme in Australia connects the Victorian network at Loy Yang power station with the Tasmanian network at the George Town substation. This particular
connection provides greater reactive support capabilities compared to other LCC links. In order to support the reactive power requirements of Basslink, 313 MVAr of shunt capacitance (composed of AC filters and a capacitor bank) was installed on the Tasmanian side. In
addition, surplus shunt capacitance is also installed on the Loy Yang side and the HVDC scheme is able to provide 195MVAr to the AC grid when required [28].

EirGrid Grid West Project
HVDC Technology Review
Page 44 of 123
3.3.2 VSC Converters
VSC converters can control the active and reactive power simultaneously and independently as required and are only limited by their apparent power ratings. This characteristic is shown
by the simplified PQ diagram in Figure 26. Note that in Figure 26, the circular locus labelled as Umax is larger than Umin. This is used to demonstrate the potential for an increase in capability for VSC converters at maximum AC system voltage relative to the capability at
minimum AC system voltage. VSC converters control the reactive power absorption and injection by changing the amplitude of the VSC output voltage. When the VSC output voltage is greater than the system AC voltage, reactive power is injected into the AC system. In order
to absorb reactive power from the AC system, the VSC output voltage is reduced to a value lower than the AC system voltage [12].
For example, in the Caprivi Link (detailed in section 2.5.2.1) the AC voltage control improves
voltage stability in the connected AC networks by effectively utilizing the reactive power capability. Approximately ±200 MVAr of reactive support is available at the converter terminals to assist the AC networks during light (potential for over voltage) and peak
(potential for under voltage) loading conditions [28].
Unlike LCC converters which are limited to minimum active power transmission, VSC converters can operate at zero active power and still provide full reactive support [24].
Figure 26 - Simplified PQ Capability Diagram of a VSC Converter
Pconverter
(Cap
acitive R
egio
n)
Umin
(In
du
ctiv
e R
egi
on
)
Rectifier Operation
Umax
3.3.3 Transient Overvoltages
LCC HVDC schemes require substantial reactive power compensation in the form of switched shunt capacitor and filter banks and as a consequence a significant potential for over voltages
exists in the AC system. When the LCC HVDC converters are tripped/faulted, the reactive power absorption drops to zero. A large overvoltage is then observed on the AC system due to the excess reactive support generated by the still connected filter and capacitor banks
[12,24].
The shunt capacitors and/or filter banks used in VSC HVDC schemes have small MVA ratings
relative to the VSC HVDC converter rating. These small reactive support components typically do not cause any significant over voltage during a VSC HVDC trip/fault. However, a potential source of significant AC over voltage does exist in a VSC based HVDC scheme if, for example,
the VSC converters are absorbing a significant amount of reactive power prior to a fault then post fault, there will be an excess amount of reactive power in the vicinity of the faulted VSC converter. The excess reactive power can cause large AC over voltages [12,24].

EirGrid Grid West Project
HVDC Technology Review
Page 45 of 123
The AC over voltages described above need to be limited to a level that does not damage equipment supplied from the AC system. A suitable mitigation for the AC over voltages is the
installation of dynamic reactive support such as a synchronous condenser, SVC or a STATCOM. The choice of type and size of dynamic reactive support required will need to be determined on a case by case basis.
3.4 Black Start Capabilities
In order to quickly and effectively recover from major outages, a certain number of black
start capable power stations should be distributed throughout the AC network.
LCC based HVDC schemes do not inherently have black start capability and require additional equipment, such as diesel generators and synchronous condensers to assist in a black start
situation. The additional equipment is needed to support converter commutation and to control the AC voltage. This results in a relatively complicated start-up sequence for system restoration.
In contrast to LCC based HVDC schemes, VSC based HVDC schemes inherently offer black start capability. The black start capability does however depend on the specific application of a VSC based HVDC scheme. For example, if both converter stations in a point-to-point
interconnection scheme are in the black out area then black-start cannot be provided [12,24]. However, if a HVDC scheme connects two asynchronous systems and a total outage of one system occurs, the remaining healthy system and the VSC HVDC scheme can be used to
energise the black network. Generally the following steps are performed during such a black-start [28]:
1. The local network near the HVDC converter station in the blacked out system is isolated and the load connected to the local network is limited to ensure it does not exceed the capability of the HVDC scheme.
2. A diesel generator is started to supply the auxiliary loads such as the valve cooling systems and control equipment at the converter station in the blacked out system.
3. The converter station in the blacked out network can now be used to energize the
local network in the blacked out system. The diesel generator can be switched off at this stage as the auxiliary source supplying the station loads should be functional.
4. Additional power plants can then be brought online gradually and ultimately restore
the blacked out power system.
3.5 Filters and Harmonics
3.5.1 Harmonics Overview
The term “harmonics” refers to sinusoidal voltages or currents of frequencies that are integer multiples of the fundamental system frequency, for example the 5th harmonic current in a 50
Hz power system refers to a sinusoidal current wave form with a frequency of 250 Hz. Voltage and current harmonics are generated by non-linear components present in the power system such as a saturated power transformer, non-linear loads and power electronics based
equipment. The presence of excessive levels of harmonics in a power system can cause:
Increased heating and higher dielectric stresses in the power systems equipment.
Increased power losses in capacitors and rotating machines.
Induced voltages may cause telephone interference, malfunction of ripple control
systems and/or other mains signalling systems and protective relays.
In order to prevent these issues, Independent System Operators (ISOs) enforce limits on the
levels of harmonic currents and voltages acceptable throughout the system. Using knowledge of the existing background harmonic levels, the ISO can determine the acceptable magnitude

EirGrid Grid West Project
HVDC Technology Review
Page 46 of 123
of harmonic injections for any new additions to the power system such as a large non-linear load connection.
The non-linear behaviour of LCC and VSC converters used in HVDC schemes results in the generation of harmonics on both AC and DC sides of the converters. In order to ensure that the level of generated harmonics are acceptable and if required, to facilitate filter design, the
vendor of the HVDC scheme must be provided with:
The frequency-dependent system impedance characteristics at the point of common
connection for various possible system configurations and relevant outages.
Permissible harmonic injection levels.
The characteristics of any other harmonic emitting equipment in the vicinity of the proposed HVDC converter stations.
3.5.2 LCC Converters
LCC converters generate harmonics on both the AC and DC sides of the converter valve
groups due to the non-linear commutation process. The harmonics generated by the LCC converters can be classified as characteristic and non-characteristic harmonics.
Characteristic harmonics are harmonics that are present under ideal conditions such as
balanced and harmonic free AC system voltages, equidistant firing pulses, symmetric converter transformer impedances between phases and between valve groups (for 12-pulse
converters) and smooth DC current (infinite sized smoothing reactor). Under these ideal conditions harmonic orders of 6n ± 1 and 6n for a 6-pulse converter; and 12n ± 1 and 12n for a 12-pulse converter are generated on the AC and DC side respectively.
Non-characteristic harmonics are generated due to the non-ideal nature of the system, i.e. unbalanced AC system voltages. Non-characteristic harmonics such as the 5th harmonic on the AC side of a 12-pulse converter can be problematic as typically specific filters tuned to the
non-characteristic harmonic orders are not implemented. The non-characteristic harmonics can be mitigated by ensuring equidistant firing of the converter valves using a phase locked loop based firing system [54].
3.5.3 VSC Converters
VSC converters generate harmonics on both the AC and DC sides. Unlike LCC converters, VSC
converters have the ability to reduce the level of harmonics to acceptable levels by using alternative methods to standard filtering components. These methods include
Multi-level techniques; or
Pulse width modulation (PWM) techniques.
The specific VSC design and configuration has a significant impact on the magnitude and order of harmonics generated. For example, the total harmonic distortion; used to measure the total harmonic content with respect to the fundamental voltage amplitude, of a 2-level
converter is typically 50 % where as a multilevel converter topology can reduce the total harmonic distortion to approximately 15 % [24]. Appropriate PWM techniques such as the carrier modulated method and increasing the frequency of the carrier signal, can increase the
order of harmonics generated. This is advantageous as higher frequency tuned filters are significantly smaller and can be sourced at a lower cost than lower frequency tuned filters.
There is however a limit to both of these methods as the greater the number of levels, the higher the complexity of the control system required for the converter. Higher frequency carrier signal for the PWM technique will result in a higher number of switching operations
which in turn increases the operational power losses.

EirGrid Grid West Project
HVDC Technology Review
Page 47 of 123
If it is not possible to limit the level of harmonics generated using either of the methods described above then AC filters may be required.
On the DC side, if communication cables are close to the DC cables over a long distance, electric and magnetic field interactions may cause potential interference in the communications cables [24]. The DC capacitor in a VSC converter based HVDC scheme
usually diminishes harmonics on the DC side; nevertheless, mitigations such as DC filters may be required.
3.5.4 Filter Design
The selection of an appropriate filter bank design is dependent on the specific application. Factors that impact on the filter bank design include [24, 62]:
The operating steady-state voltage range of the network. This is particularly important for LCC converters as the filter banks are required to provide reactive
power support at fundamental frequency. The reactive power output of the filter banks at fundamental frequency varies with the bus voltage. For example, a 50 MVAr filter bank will supply between 45.125 and 55.125 MVAr if the bus voltage varies
between 0.95 pu and 1.05 pu of the nominal value.
HVDC converter operating conditions, i.e. for LCC converters knowledge of the firing
angle and valve voltage must be considered.
Harmonic currents which can flow in to filter banks due to other nearby harmonic
sources.
Ambient temperature and system harmonic impedance characteristics.
3.6 Sub-Synchronous Interactions
HVDC converters, particularly LCC converters operating in rectifier mode, can introduce a negative dampening component and reduce the damping of sub-synchronous torsional modes
of nearby generator units. This effect is called sub-synchronous torsional interaction (SSTI) [28].
This issue is usually associated with large turbo-generators. It occurs when the sub-
synchronous rotor motion developed damping torque is negative and greater in magnitude than the mechanical-damping torque of the rotor.
SSTI need to be carefully studied if one or more of the following is applicable [35]:
Turbo-generators and the HVDC rectifier station are located close together.
Weak interconnection of the turbo-generator to the AC system.
Rated power of the HVDC and the turbo-generator are of the same order of
magnitude.
If studies suggest a potential for SSTI then sub-synchronous damping controllers can be applied to cancel the negative dampening effects of the HVDC scheme. There are two basic
types of sub-synchronous damping controllers, the narrow band and wide band controller. The narrow band controller is used when sub-synchronous interactions only occur over a narrow range of frequencies. If these interactions are present over a wide range of
frequencies then multiple sub-synchronous narrow band controllers or a wide band controller must be used. Although wide band controllers increase the dampening over the entire sub-synchronous range, narrow band controllers offer greater dampening at specific frequencies.
The sub-synchronous damping control was successfully used for the Fenno-Skan HVDC scheme in Finland as it was commissioned in the vicinity of two 950 MVA turbo generators [28].

EirGrid Grid West Project
HVDC Technology Review
Page 48 of 123
3.7 Control and Protection System
The HVDC converter stations are controlled by a sophisticated control and protection system. This requirement is driven by the complexity of the AC/DC conversion process, the protection of often highly sensitive equipment and the fact that HVDC schemes have a high degree of
controllability.
The control and protection system of an HVDC converter station will comprise any or all of the following control functions [2]:
Operator Workstation (OWS) / Human-Machine Interface (HMI) – The interface between the converter and the operator, this is where active and reactive power
orders are entered, startup and shutdown sequences are initiated and remote controlled switchgear are operated. The operator receives real-time technical information and alarms through the OWS/HMI.
AC Control and Protection – Including active and reactive power control, AC voltage control and protections associated with the AC interface and the AC equipment within
the converter station (filters, transformers etc.).
DC Control and Protection / Pole Control – Including the implementation of active and
reactive power orders in the valves, DC voltage control and DC protections.
Project specific requirements can also be incorporated into the control and protection system. This could include elements such as run-back schemes, sub-synchronous damping control,
frequency control, black start control and reduced DC voltage control.
The control and protection system will also include important troubleshooting and analysis tools, such as a sequence of events recorder and a transient fault recorder.
Auxiliary controls are interfaced into the control and protection system, including the valve cooling control (controlling the operation of fans and valves and monitoring of water temperatures and flow), fire protection and air handling systems.
The control and protection system needs to have a high reliability and as such the key control and protection elements will be duplicated and operated in a “hot standby” mode of operation where at any one time one system is operating as the “active system” and the other as the
“standby system”. The switchover from active to standby can be done automatically or manually. A failure in the active system is detected through internal supervision and will generate an immediate handover to the standby system without affecting power transfers
and the operation of the HVDC link. This duplication also allows for one system to be switched out and maintained with the HVDC system still running [10].
The complexity of the control and protection systems for HVDC schemes does lend itself to a
degree of risk of maloperation. The impacts of such maloperation can be high, particularly where the HVDC scheme is of high capacity or is otherwise critical to maintaining the security
of the AC network. The risks are managed by a combination of duplication and redundancy as described above as well as a more stringent and robust commissioning process for the control and protection systems. This includes factory testing of the controls in the factory, detailed
analysis of the dynamic performance of the scheme and on site commissioning at a level beyond that normally performed for AC network elements.
3.8 Audible Noise
HVDC converter stations can generate audible noise. The level of audible noise generated is dependent on the converter layout and design including any sound proofing designed into the converter and valve hall buildings and around external elements such as transformers and
fans. External factors that also affect the level of audible noise measured at distances away from the site include the level of background noise, topography around the converter station
and meteorological conditions [11].

EirGrid Grid West Project
HVDC Technology Review
Page 49 of 123
For LCC converters, the majority of audible noise generated comes from the converter transformers, cooling fans (both transformer fans and valve cooling fans), filter capacitors
and reactors [11]. Converter transformers have a higher sound power level than AC transformers at the same power level [11]. The DC smoothing reactor and the AC filter reactors are major contributing sources [11]. Whilst the converter valves can be a source of
noise, they are located within the converter building which can be designed with the appropriate level of sound insulation to achieve the local noise requirements. Converter
transformers have recorded component sound power levels of 90-125dBA, whilst smoothing reactors (80–100dBA), filter reactors (70–90 dBA), capacitors (60–105dBA) and cooling systems (55–105dBA) are the other major contributions to the overall sound power level of a
HVDC converter station (sound power levels from [11]).
The noise characteristics of the VSC interface transformer is similar to those of an AC substation transformer [12]. Reference [12] provides some typical noise emission levels
(without noise attenuation), which show the interface transformers to have the highest sound power level of 90-110dBA, whilst the harmonic filters (80–100dBA), capacitors (60–90 dBA), valves (60–100 dBA) and cooling systems (75-100dBA) are the other major contributors to
the overall sound power level of a VSC converter.
As part of the design process, a noise prediction model will normally be developed by the supplier as a three dimensional model of the surroundings of the converter station including
nearby vegetation [2]. With this model, various station layouts and configurations can be investigated to achieve levels below the required maximum noise levels.
Noise mitigation measures can be applied to reduce the component power levels. For LCC
converters, sound walls can be installed around the transformers and a sound shield over the smoothing reactor. For the filter reactors and capacitors however, this may require careful design of the station layout [11]. Sound attenuation options are available for outdoor cooling
fans.
For VSC stations, of the main noise generating elements, the valves, filters and capacitors
reside inside the building which can be designed with the appropriate level of sound insulation to achieve the local noise requirements. Where an indoor design is chosen, the sound power levels can be damped by 30dBA at 30 metres from the building [12]. The
interface transformer and cooling fans are located outside and are therefore a source of noise to be mitigated during the design of the station. The use of transformer sound walls and attenuation on the valve cooling fans should be considered [12]. Typical mitigations applied
to these elements have shown sound power levels reduced for the interface transformer down to 60-90dBA and for the cooling fans, 70-90dBA [12].
3.9 Overload
The overload capability of a HVDC converter station is the capability of the station to operate above its rated power. A converter station might be specified with a continuous overload
capability, or more commonly with a short duration overload capability. The short duration overload is usually given as a percentage of the rated power and is defined for a given time. For example, the overload capability might be 25% overload for 10 minutes.
Short duration overload may be required for a number of reasons:
1. It is common to specify an overload for a bipolar scheme so that in the event of a single pole outage, the healthy pole can operate above rated power to lessen the
impact on the system caused by the sudden loss of transmission capacity.
2. The demand on the transmission systems can have very sharp peaks (i.e high demand for a short duration). The controllability of HVDC along with overload
capability could be utilised to alleviate transmission constraints during times of high demand.

EirGrid Grid West Project
HVDC Technology Review
Page 50 of 123
3. When trading electricity on the spot market over an HVDC link, an overload capability might be used during times of high electricity prices to maximise profit.
In general, the thermal overload capability of HVDC systems is limited compared to an AC line [24]. This is due primarily to the valve equipment, which has a small thermal time constant [42]. As such, redundancy in the valves and valve cooling is required to achieve even very
short term overloads. Other items of equipment that might limit overload capability include:
Converter transformers – Oil filled equipment such as converter transformers
have much larger thermal time constants than the valves. In the case of very short term overloads, this equipment is not usually the limiting factor. For longer overloads however, thermal modelling and heat run tests will be required to confirm the
specified overload capability.
DC smoothing reactor – Often DC smoothing reactors are air cooled, therefore
they will have a shorter thermal time constant than converter transformers. This makes the smoothing reactor one of the critical elements to consider when designing for overload conditions.
DC Cables – as discussed in Section 4.9.
In the case of longer duration thermal overload the transfer of power may be restricted to
less than the rated power of the HVDC scheme for a period following overload period. This allows equipment such as converter transformers and DC smoothing reactors to cool before normal full power operation is resumed.
4. HVDC CABLES
4.1 HVDC Cable Types and Composition
A high voltage cable is a high voltage conductor with the appropriate layers of insulation, water blocking and protection layers to allow the cable to be either buried underground or laid on the sea bed. These various layers are arranged concentrically, primarily so that the
electric fields within the cable’s insulation are radial.
A typical high voltage cable would comprise the following key components/layers:
Conductor – to carry the current at the specified DC voltage.
Insulation and semi-conductor screen layers - to insulate the high voltage conductor
from the outer mechanical protection layers and to manage the electrical stresses surrounding the conductor.
Mechanical protection layers – to provide the necessary mechanical protection to the
inner insulation layers (during transportation, installation and while in operation) and to protect the inner cable “core” from water ingress where required.
The DC cables for a specific project are designed to meet the specific requirements of the project. These requirements will determine key parameters in the cable design, such as selection of the conductor metal, thickness of the insulation, the need for water blocking
layers and type of reinforcement and armouring required.
Figure 27 and Figure 28 below show typical DC cable compositions for land (underground) cables and submarine cables respectively.

EirGrid Grid West Project
HVDC Technology Review
Page 51 of 123
Figure 27 - Typical High Voltage DC Cable for Underground Applications
Figure 28 - Typical High Voltage DC Cable for Submarine Applications
The land and submarine cable applications share a number of similarities, mostly within the
cable “core” (comprising the conductor, conductor screen, insulation and insulation screen). The main difference between the two is in the mechanical protection, where submarine
cables have a lead alloy water protection sheath, steel wire armour layers as well as an outer string serving.
Referring to Figure 27 and Figure 28, a brief description of the various layers is provided
below.
Conductor – Energized at high voltage, the conductor carries the DC current and is
comprised a material of good conductivity, typically copper or aluminium. The selection of the conductor material depends on the project’s requirements with regards to required power transfer, DC voltage, losses, installation method and
mechanical properties.
Conductor Screen – The conductor screen’s role is to provide a smooth interface
between the conductor and the insulation (avoiding electrical stress concentrations)

EirGrid Grid West Project
HVDC Technology Review
Page 52 of 123
and to provide even grading of the electric field generated by the conductor. The conductor screen is comprised of a semi-conductive material (i.e. neither a good
conductor nor a good insulator).
Insulation – The insulation layer insulates the high voltage conductor from the
outer layers of the cable and therefore to “earth”. A failure of the insulation layer will result in the cable failing and being unable to operate until the failure is repaired. In HVDC applications, the two main choices of insulation material are lapped mass
impregnated paper tapes or a polymer material similar to cross linked polyethylene (XLPE) in AC cables. More explanation and a comparison of the two insulation materials is provided in Section 4.3.2.
Insulation Screen – Performs a similar role to the conductor screen, providing a smooth surface between the insulation and the outer layers of the cable. It is also
made up of a semi-conductive material. Any damage or imperfections in either the insulation or conductor screen can lead to localised electric stresses and eventual failure of the cable.
Lead Alloy Sheath – Required primarily for submarine cables, the lead alloy sheath protects the inner cable “core” or insulation system (comprising of the conductor,
conductor screen, insulation and insulation screen) from water ingress. If water were allowed to get into the cable core, this can lead to degradation of the semi-conductive screens and the insulation itself, leading to cable failure. This layer is
metallic and a lead alloy is most commonly used. Swelling tape is typically installed between the lead sheath and the underlying insulation screen.
Metallic Screen – All high voltage DC cables will have a metallic screen, whose purpose is to contain the electric field generated within the cable core and to provide a current path in the event of a cable fault. This screen is typically copper tape or
wound copper conductors in the case of land cables sized for the anticipated fault currents. Swelling tape is typically installed between the metallic screen and the
underlying insulation screen.
Metallic Sheath – Required for where high axial tensions are anticipated during installation. The metallic sheath provides longitudinal strength to the cable and
protects the cable core from the high axial tensions during installation. A metal-polyethylene laminate (typically aluminium) is used for this purpose for land cable.
For submarine cable applications, the lead alloy sheath and the steel wire armour assist with this function.
Polyethylene Sheath – The polyethylene sheath provides a tough outer layer to
protect the layers within. In land cable installations, this is the final layer and protects the cable from abrasion during handling, transportation and installation. In submarine
cables, it provides a tough layer between the inner layers and the outer mechanical protection layers and provides corrosion protection to the lead alloy sheath.
Steel Wire Armouring – Is comprised of galvanized steel wires twisted around the
cable and provides mechanical strength to protect the cable during handling, transportation and laying of the cable in the sea as well as providing longitudinal
strength to the cable during laying. The steel wire armouring also provides protection of the installed cable from abrasions and impact while on the sea bed. For submarine applications in deeper water, two layers are often installed, wound in opposite
directions (counter helix), to prevent damage to the damage due to torsional forces while the cable is suspended from the ship during installation.
Outer String Serving – Comprised of polypropylene “yarn” wound around the cable
steel wire armouring and filled with an asphaltic compound, the outer string serving is designed to protect the cable from abrasion during handling, transportation and
installation. The asphaltic compound protects the underlying steel wire armours from corrosion in submarine cables.

EirGrid Grid West Project
HVDC Technology Review
Page 53 of 123
Where required, some layers can be separated by bedding layers or water swelling tape to provide cushioning and to prevent the transversal movement of water if it enters the cable. In
some applications, termite protection or protection against marine life (such as teredo worms) may be required.
4.2 Cable Configurations
The configuration of the DC cable is dependent on the selected technology and configuration as described in Chapter 2 of this report.
For a monopole configuration there will be one HVDC cable rated at the full HVDC voltage and designed to carry 100% of the rated power transfer. If the HVDC system requires a metallic return, there will also be a metallic return cable. The metallic return cable is typically
polymer insulated but does not need to be rated at the HVDC voltage – instead, the rating is driven by the amount of current and the resistance (i.e. length) of the cable. The rated voltage of metallic return cables are typically in the thousands or tens of thousands of volts.
There is no redundancy in the event of a HVDC cable fault.
For a bipole configuration there will be two HVDC cables with each cable rated at the full HVDC voltage and designed to carry 50% of the rated power transfer of the bipole link. In
the event of an outage of one of the HVDC cables, the HVDC system can operate at 50% rated power transfer. In the latter case, if a metallic return is required for monopolar operation, then a metallic return cable as described above for the monopole configuration
case, will also be required.
For a symmetrical monopole configuration, there are two HVDC cables, with each cable rated
at the full HVDC voltage (positive and negative poles) and designed to carry 100% of the rated power transfer. However as the HVDC voltage seen at the converter is actually two times the voltage rating of the cable, the current flowing in the cable is half that for
monopolar operation.
In all cases, it is possible to install a fibre optic cable with the HVDC and metallic return cables. This is particularly useful where reliable high speed communications are required
between the converter stations at each end as discussed in Section 4.6.
4.3 Land and Submarine Cable Design
For both land and submarine cables, the design of the DC cable requires the selection and
determination of rating/thickness for the various layers as described in Section 4.1.
The design of some of these layers/parts are dependent on the DC voltage rating and
required power transfer capacity, whereas others are determined based on other project specific elements, such as transportation to site, installation method and the final “as installed” arrangement of the in-service cable.
Two particular parts of the cable that not only drive the final design of the cable, but also influence the transportation and installation requirements of the cable itself are:
1. Selection of the conductor material and size; and
2. Selection of the cable insulation.
4.3.1 Conductor Material and Size
The conductor requires a material of good conductivity and DC cables can utilise either aluminium or copper for this purpose. The conductor is comprised of a number of layers or strands of this material and is often made up as either a number of circular wires compacted
together or for larger cross-sections, keystone-shaped wires installed in concentric layers.

EirGrid Grid West Project
HVDC Technology Review
Page 54 of 123
Aluminium is lighter than copper, but has poorer mechanical properties and lower conductivity. Conversely copper is heavier but has better mechanical properties (i.e. is
stronger and can tolerate higher tensile forces) and has better conductivity (meaning that more current can be transmitted for the same cross sectional area). Aluminium is a cheaper material than copper and the lower weight makes aluminium cables easier and cheaper to
install. For this reason, it is common for land cable applications to utilise aluminium conductors and for submarine applications, which require higher tensile strength during
installation, copper is preferred. However, for larger land cables requiring higher power transfers, copper conductors may be selected to keep the overall size of the cable down.
The required power transfer and the selected DC voltage will determine the amount of DC
current required to be transmitted in the cable, which is the primary determinant in establishing the required size of the conductor. The conductor material’s thermal characteristics and the cable’s ability to dissipate heat away from the cable (for example, the
thermal resistivity of the surrounding soil in underground applications) will determine the size of the conductor required to transmit that amount of current. Therefore the method of burial and/or installation of the cable needs to be known before determining the cable size and
specific characteristics, such as thermal resistivity of the surrounding soil, seabed temperatures, ground temperatures, climate, size of conduits etc., will need to be determined.
4.3.2 Cable Insulation
In HVDC applications, the two main choices of insulation material are lapped mass impregnated paper tapes (referred to as mass impregnated cables) and polymer insulation (referred to as polymer cables).
4.3.2.1 Mass Impregnated Cables
For mass impregnated cables, the insulation layer is cable up of many layers of lapped paper tape which has been “impregnated” with a high viscosity compound based on mineral oil.
The first mass impregnated cables were installed in the 1950s. Therefore, the mass impregnated cable technology has over 60 years of operational experience and is considered a proven technology. At present, mass impregnated cables have been manufactured, installed
and commissioned for DC voltages up to 500kV.
One particular characteristic of the mass impregnated cable is that the insulation can handle a “polarity reversal” (i.e. can withstand a sudden change from a positive high voltage to a
negative one), which is required for LCC HVDC transmission. Because of this, mass impregnated cables are suited to both LCC and VSC HVDC systems.
On the negative side, these cables tend to be larger, heavier and more expensive than the
polymer alternative. Installation can be more difficult and cumbersome leading to higher installation costs when used for land cable applications. Mass impregnated cables are also not
“coilable”, which means that in the submarine cable installations for example, the cable laying vessel will need a turntable to load and later install the cable without damaging the cable insulation. This increases the installation complexity and therefore the cost.
4.3.2.2 Polymer Cables
The insulation of polymer cables is a cross linked polyethylene material (similar to that use with AC XLPE cables) which is extruded over the conductor and conductor screen rather than
wrapped as is the case for the mass impregnated cables. Polyethylene (PE) has low dielectric loss characteristics which makes it attractive for extra high voltage applications. The “cross linking” results in a more thermally stable material, allowing the cable to operate at higher
sustained operating temperatures which in turn allows higher current ratings than PE insulation for the same conductor size and installation conditions.

EirGrid Grid West Project
HVDC Technology Review
Page 55 of 123
DC polymer cables at high voltage have only been in service since the late 1990s and therefore there exists significantly less operational experience than for mass impregnated
cables. These cables are however much lighter than the equivalent mass impregnated cables and less expensive. At present, polymer cables have been manufactured, installed and commissioned for DC voltages up to 320kV, although the majority of operational experience
to date has been at voltages between 80kV and 200kV.
“Polarity reversal”, as explained in Section 4.3.2.1, can cause high localised stresses in
polymer cables and can adversely affect the life of the cable insulation (and therefore the life of the cable itself). For this reason, polymer cables are not presently suited to LCC applications but are suitable for VSC HVDC applications. In addition, polymer cables are
“coilable” and can therefore be more easily installed off a cable laying vessel or barge without a turntable, reducing the complexity and cost of installation. For this reason, and the lower weight and cost, polymer cables are preferred for VSC applications. Polymer cables also have
a smaller bending radius than the mass impregnated cables.
4.3.2.3 Other Cable Insulation Types
Whilst the use of mass impregnated cables and polymer cables represent the current state of
the art for HVDC cable transmission, there are other insulation types which have been used on previous HVDC projects including:
Fluid-filled paper insulated HVDC cables - Suitable for up to 500-600 kV [55], these
cables have typically been confined to land-based HVDC cable systems which are traditionally associated with a submarine cable installation. An early fluid-filled HVDC
cable example is a 120 km section of paper insulated 400 kV cable in Denmark, installed in conjunction with a submarine crossing to Germany [56] in the mid 1990s. Relative to mass-impregnated cables, fluid-filled cables are able to operate at higher
temperatures and under higher electrical stress. As for high voltage AC cables, the construction includes an aluminium or reinforced lead sheath able to withstand internal pressure associated with a low viscosity hydrocarbon fluid which impregnates
the insulation. Additional infrastructure, including storage tanks and straight and stop joints, is required to maintain pressurisation of the impregnating fluid.
Gas-filled cables were employed in the original HVDC link between the New Zealand North and South Islands, in the early 1960s [57]. No more recent examples are understood to exist. Similarly, additional infrastructure is required, in order to
maintain the internal gas pressure within the cable sheath.
4.3.2.4 Comparison of Mass Impregnated Cables and Polymer Cables
Table 3 provides a comparison of mass impregnated cables and polymer cables for HVDC applications.
Table 3 - Comparison of Mass Impregnated Cables and Polymer Cables for HVDC Applications
Characteristic Mass
Impregnated
Cables
Polymer Cables
Operational
Experience 40+ Years 15+ Years
Present Voltage Level ≤500kV ≤320kV
Cable Cost Higher Lower
Installation Cost Higher Lower

EirGrid Grid West Project
HVDC Technology Review
Page 56 of 123
Weight Heavier Lighter
Coilability Not Coilable Coilable
Polarity Reversal OK Not OK
Bending Radius Larger Smaller
HVDC Applications LCC and VSC VSC Only
4.3.3 Cable Weights and Transportation
4.3.3.1 Land Cables
Land cables are delivered to the site wound on cable drums. These cable drums are required
to be transported to the site and handled on site to allow the ease of installation of the cable without damaging the cable or exceeding its minimum bending radius.
The amount of cable that can be wound onto a single drum is important as it defines how often the cable will need to be jointed on site and therefore drives the total number of joints in the field as well as the cost and time for the installation of the cable (as cable jointing is a
careful and time consuming process). Ideally, an underground cable installation should target as long a length as possible on a cable drum, thereby minimising the number of cable joints in the installed system and reducing the cost and duration of cable installation.
DC cables are manufactured in very long lengths and it is unlikely that manufacturing lengths will drive the length of cable that can be installed on a cable drum.
Some key factors that will drive the amount of DC cable that can be wound onto a single
cable drum include:
Cable weight;
Cable size / outer diameter;
Minimum bending radius of the cable;
How much weight can be handled during transportation and installation (dependent on the installation method); and
Maximum size of cable drum during transportation, including minimum clearances when crossing under bridges and power lines and size of tunnels en route to the
installation site.
As polymer cables are lighter and have a smaller bending radius, it is expected that for a given cable drum size, a longer length of polymer cable could be installed on a single drum –
making polymer cables more attractive for land cable installations.
Currently, steel drum sizes of up to 4.5m outer diameter are available with some wooden drums up to 2.5m outer diameter [2]. Depending on the local transportation conditions and
means of transport, some limitations may apply. Reference [1] refers to a normal maximum of 4 metres diameter and a maximum weight of 24 tons for transportation.
Table 4 is based on a graph provided in Figure 6 in reference [1]. This table shows the relationship between required power transfer capacity, conductor size, the number of joint bays required and the amount of cable that can be installed on a cable drum for aluminium
HVDC polymer cables. The selection of conductor is based on a symmetrical monopole arrangement installed with cables touching. The table shows that the larger the cable, the less can be wound onto a single cable drum and therefore the more joint bays will be
required for a given length.

EirGrid Grid West Project
HVDC Technology Review
Page 57 of 123
Table 4 also includes an estimate of the weight of the cable (in kg/m) and an estimate of the weight of the cable on the cable drum. These have been taken from [2].
Table 4 - Estimated Lengths of Aluminium Polymer Land Cables per Drum
Required Power
Transfer
(MW)
Estimated
Conductor Cross- Section
(mm2)
Estimated Weight Of
Cable
(kg/m)
Number of Joint Bays Per 10km
Estimated Length Per
Cable
Drum (km)
Estimated Weight
Per Cable Drum1
(kg)
400MW 630mm2 8 kg/m 5 1.7km 13,600 kg
500MW 800mm2 8 kg/m 6 1.4km 8,400 kg
700MW 1400mm2 11 kg/m 8 1.1km 12,100 kg
800MW 1800mm2 13 kg/m 8 1.1km 14,300 kg
1,000MW 2400mm2 16 kg/m 11 0.8km 12,800 kg
Whilst jointing technology has vastly improved over recent decades, it remains prudent to
minimise as much as possible the number of joints in the installed DC cable. Each joint must be manually performed and any manual intervention creates the possibility of a weakness that could eventuate into a fault at a later date. Improved techniques and quality control can
help manage this risk.
The first challenge associated with the installed of underground DC cables is transporting
them to site. The physical size of the cable drums must be taken into account to ensure the drums can be transported to the location of installation, including the capability for the drums to be transported under low clearances (e.g. bridges and overhead power lines), through and
over tunnels and bridges and on poorly surfaced roads or off-track. The transportation requirements and limitations will drive the acceptable size of cable drum and conversely, the cable drum size will determine the preferred transportation route and method.
4.3.3.2 Submarine Cables
Submarine cables of significant length are loaded onto the cable laying ship at the factory
(referred to as the cable “loadout”), and then transported to the site to be installed direct from the ship. In some circumstances, particularly where there are schedule or vessel availability issues, it may be possible to load the cable onto a separate transport vessel
(particularly if the cable is “coilable”) and then transferred at site to the cable laying vessel by trans-shipment.
Some key factors that will drive the amount of DC submarine cable that can be transported
by a cable laying vessel include:
Cable weight;
Cable size / outer diameter;
Minimum bending radius of the cable;
Capacity of the vessel; and
The number of turntables or carousels available (for “non-coilable” cable).
1 This weight does not include the weight of the cable drum.

EirGrid Grid West Project
HVDC Technology Review
Page 58 of 123
Submarine DC cables are significantly heavier and have a larger outer diameter than the land cable equivalent. This is due to the addition of the lead water blocking and galvanized steel
wire armouring layers as well as the use of copper over aluminium in most cases. For comparison purposes, a 320kV 2,400mm2 copper polymer submarine DC cable weights approximately 61kg per metre, compared to the same cross sectional area for an aluminium
land cable of 16kg per metre [2]. For the same cables, the outer diameter of the marine cable is approximately 148mm compared to 123mm for the land cable [2].
There are only a small number of cable laying vessels capable of transporting and installing long lengths of DC cables. Some of these vessels have one or two carousels or turntables. On these vessels, the capacity of the turntable varies within the range of 3,000 t – 7,000 t. A
7,000t turntable can carry approximately 80km of 1,600mm2 320kV polymer submarine cable and about 200km of 500mm2 320 kV polymer submarine cable [1].
Some vessels will also have desk space available which allows a length of coilable cable (i.e.
polymer cables) to be stored and/or fibre optic cables. For example, the Giulio Verne reports approximately 2,500 t of deck space cable storage is available [8].
The length of cable that can be loaded onto the vessel will determine the number of times
that the vessel will need to return to the factory to load more cable after the installation of the first load has been completed. This is often called a laying “campaign”. For example, to install 300km on a vessel that is only capable of loading 100km will require three laying
campaigns.
DC submarine cable joints require specialised personnel to perform and can take a number of days, making them expensive and critical items in the schedule. As with land cables, it is
prudent to minimise the number of submarine cable joints in the installed length. The submarine joint can be a potential weak point in the future, as well as being very difficult and costly to repair.
4.4 Land Cable Installation
The DC land cables can be installed using open trench methods or more automated
techniques such as direct ploughing. Before the method can be determined however, the trench profile design needs to be determined.
4.4.1 Trench Profile
A typical trench profile for an underground DC cable installation will include:
The placement of the DC cables - The profile depends on the HVDC configuration
used, and how many DC cables are required. For example, a symmetrical monopole arrangement as shown in Figure 29 will require two HVDC cables. These may be installed touching or spaced apart, and may be installed in conduits or direct buried.
The selection of the final arrangement is based on the mechanical protection requirements and the required power transfer or current capacity. Cables in conduits have lower capacity than those that are direct buried (unless they are filled with a
compound of suitable thermal characteristic) and cables that are touching have lower capacity than those spaced apart.
The placement of fibre optic cables – Where land fibre optic cables are required to be installed, the cable and the conduit in which it is to be installed may be located within the trench.
Cable protection – A cable protection layer is design to provide mechanical protection to the cables below it, whether from impact from above (for example, a shovel or
pick) or constant traffic above the cables. This layer is usually made of a polymeric material for low traffic areas and concrete slabs when cables are installed under areas subject to heavy traffic, such as roads.

EirGrid Grid West Project
HVDC Technology Review
Page 59 of 123
Warning tape – A warning tape layer is usually installed just below the surface (for
example, 300mm below the surface). The tape layer is coloured in bright colours and is designed to indicate the presence of cables following the first “scoop” of a backhoe or excavator.
In some cases an imported material with a known thermal resistivity needs to be installed under and around the DC cables. This is to improve the ability of the cable to dissipate heat away from the cable itself and into the surrounding soil. Any limitations on the ability of the
cable to do this, such as poor thermal resistivity material surrounding the cable, will reduce the rating of the cable and limit power transfer. When this occurs, the possibility of importing better thermal resistivity materials needs to be considered and weighed against the cost of
larger conductor.
The DC cables for the EWIC project, as shown in Figure 29, have been installed with the two
HVDC cables spaced apart and in conduits.
Figure 29 - Cable Trench – East-West Interconnector
4.4.2 Open Trench Cable Installation Methods
This method involves the digging of an open trench to the required burial depth and the manual installation of the various bedding layers, cables, protection and warning tape.
The process can be described as follows:
1. The trench is dug first, using a backhoe or excavator, at the required depth. For installation in the road, asphalt cutting machines will be required prior to excavating
the trench.

EirGrid Grid West Project
HVDC Technology Review
Page 60 of 123
2. A screened bedding layer is applied. This material is free from large rocks to prevent damage to the conduit.
3. Cable conduits are installed with a “pull wire” installed to allow the cable to be pulled into the conduit. Where conduits are installed, the cable can be pulled later.
4. The conduits will be covered with a lean mix concrete.
5. Public warning tiles are installed over the ducts to alert future construction workers when digging up the road.
6. The remainder of the trench is backfilled, appropriately compacted and the road is reinstated to the local authority requirements.
The installation of cables require that the cable drums be transported to site, placed at the
start of the cable “run” – i.e. from one jointing pit to the next jointing pit and set up on a spindle, which is often motorized for the large cable drums. Where conduits are installed, the cables are pulled through the conduits by the “pull wire” connected to a winch or similar
device. See Figure 30.
Figure 30 - Cables Being Pulled Into Conduit
The winch is also equipped with a load cell to ensure that the maximum tensile strength of
the cable is not exceeded. The layout of the conduits have been designed to ensure that the maximum sidewall pressures of the cable are also not exceeded during the pull.
The conduits are typically filled with a material of suitable thermal characteristics [14], a clay
grout, after the cable has been pulled through. This helps maintain the required current capacity of the cables.
4.4.3 Automated Installation Methods
Where the soil allows and where there are relatively few existing underground services to be
crossed, more automated methods may be suitable. Such methods can be significantly faster in terms of length of cable buried per day and may also allow operation within a narrow corridor, reducing the impact on the environment.

EirGrid Grid West Project
HVDC Technology Review
Page 61 of 123
While these methods need to be determined specifically for the project, two such methods that have been used on prior projects are:
Direct ploughing; and
Process Methods.
These automated installation methods are not particularly suited in built up areas where there are significant crossings of existing underground services. They rely on having long lengths in
the cable route where the cable is not required to go under another surface. At such crossings, the process will need to be stopped, the cables cut (and later jointed) and the process continued on the other side. This can be time consuming and doing this too many
times can counteract the benefits of using these methods.
These methods also do not involve the actual “pulling” of the cable, so issues associated with the tensile strength and the sidewall pressures being exceeded are not so prominent.
4.4.3.1 Direct Ploughing
Direct ploughing involves the use of a plough machine to rip up the ground and feed the cables directly into the ground. It comprises an installation blade through which the cable is
pass and fed out of the blade at the required burial depth with the earth naturally closing in above it. The technique can be modified to include the simultaneous installation of warning
tape (see Figure 31).
Figure 31 - Example of a Cable Ploughing Machine2
Direct ploughing has been used in the installation of telecommunications and lower voltage cables for some time. It requires reasonably soft soil and a route free from both surface and subsurface obstructions, and its suitability will be heavily dependent on the size and weight of
the cables to be installed and the weight and size of the cable drum. These techniques are dependent on the size of plough equipment available and may only be possible for small
HVDC applications. The Directlink HVDC Project, which used 630mm2 aluminium polymer cables, used direct ploughing for a part of the cable installation [3]. These cables were only rated at 80kV and for a power transfer of 60MW.
2 Reproduced from http://www.pjhironstrenching.co.uk/gallery.htm

EirGrid Grid West Project
HVDC Technology Review
Page 62 of 123
Direct ploughing has a minimal impact on the surface and only requires a relatively small level of reinstatement when compared to the open trench and process methods. It does not
however allow the installation of imported backfill if required.
4.4.3.2 Process Methods
This involves the application of cable installation processes specifically developed to suit the
soil conditions, cable route terrain and environmental or permitting conditions applied to the project. The developed process will typically have a means to excavate the trench, screen the
excavated soil, install the screened material (including imported backfill if required), lay the cables, install more screened material, install cable protection, backfill, warning tapes and then reinstate the surface – all in one movement or cable “front”.
This method was applied in the Murraylink HVDC project [4]. The process involved a trench digger to excavate the soil, with a number of cable screen jigs towed behind it to screen the soil to the required grade for bedding and backfill material. A truck held both cable drums
and fed the cable over the trench digger directly into the trench. Manual methods were used to backfill the trenches and install the cable protection and warning tapes. Laying speeds of 1,000m per day with peaks up to 3,000m per day have been reported in relatively soft soils
using this method [l4] and 300m per day in bedrock [1].
These process methods are particularly suited when the cable route involves long runs with few surface or subsurface obstructions and where there are onerous restrictions on the cable
right of way. The hardness of the surface and soil plays a part as well, although rock cutters may be used as part of the process if required. Compared to direct ploughing, these methods are more versatile in terms of being applied in harder soils, allowing the installation of
bedding materials and imported backfill if required and the easy installation of cable protections. The speed of installation will be slower than direct ploughing but faster than the
open trench methods and will still require significant surface reinstatement.
4.4.4 Horizontal Directional Drilling
Most obstacles such as underground services (e.g. communication cables, gas pipes, electricity cables etc.) can be crossed by pulling the cable or conduit under it, allowing for the required spacing between the DC cable and the service as agreed with the owner of the
service.
There are however some obstacles that are much larger and require the cable to be installed by different means. In particular railways, highways, rivers, creeks, waterways and other
environmentally sensitive areas are experienced on many long underground cable routes. The crossing of these obstacles are often impacted by significant environmental and permitting constraints, eliminating the use of trenching or other installation methods. The most common
means of crossing these obstacles is the use of Horizontal Directional Drilling (HDD).

EirGrid Grid West Project
HVDC Technology Review
Page 63 of 123
Figure 32 - HDD Rig - East West Interconnector
HDD is a steerable technology that allows the precise drilling of a suitably sized bore along a
specified path, ensuring the bore remains clear for the obstacle. The steerable boring head positions are monitored and the drill heads are “steered” to stay on path. Once the pilot bore has reached the required location on the other side of the obstacle, the bore is widened on
the return path and a conduit or pipe pulled with it. Once the conduit or pipe is installed, the cables can be pulled through the conduits and the installation completed. An example of a
HDD drill rig is provided in Figure 32.
HDD methods can be expensive and can interrupt the flow of the cable installation works. There is also cost uncertainty associated with this method, as the subsurface ground
conditions are not often known and problems can be experienced during the drilling resulting in either slower progress than usual or the loss of expensive equipment [5].
4.4.5 Selection of Installation Method
The selection of the appropriate installation method for a particular project depends on some key project specific factors, including:
The size and weight of the cables;
The terrain over the DC cable route;
The type and condition of soil/ground;
Tensile strength of the cable;
Environmental and permitting requirements;
The need to commence civil works in parallel with cable manufacture and transportation;
Required flexibility to manage traffic issues during installation; and
Number and type of existing underground services to be crossed.
The size and weight of the cables will affect the size and weight of the cable drums (see Section 4.3.3.1) and therefore the level of difficulty involved in transporting them to site and

EirGrid Grid West Project
HVDC Technology Review
Page 64 of 123
handling them during the installation process. Larger and heavier cables may be more suited to more automated methods provided the soil conditions and access for larger vehicles allow
it. Table 5 provides a simplified comparison of the installation methods discussed in this report.
Table 5 – Comparison of Land Cable Installation Methods
Open Trench
Method
Direct
Ploughing
Process
Methods
Cable Laying Speed3
3 1 2
Hard Surface / Sub-
surface Yes No Yes
Install Imported
Bedding Material Yes No Yes
Requires Pulling of Cable During Installation
Yes No No
Suitability For4:
Large Cables and Drum
Sizes/Weights
2 3 1
Narrow Right of
Way / Corridors 3 1 1
Built-Up Areas With High Number of
Crossings 1 3 3
4.5 Submarine Cable Installation
The installation of submarine DC cables requires consideration of two key parameters – the level of protection required and the method of installation/protections to be applied.
4.5.1 Required Submarine Cable Protection
Prior to completion of the submarine cable design and the commencement of installation it
must be determined whether the cables are to be buried in the seabed or laid on the seabed without burial, and if the cables are to be buried, the required depth.
The first step is to conduct a route study and risk assessment to determine the extent of any risk of damage to the cables. This will require consideration of the following along the cable route:
The level of shipping activity, frequency of traffic and the size of vessels;
Determination of anchor types and weight for the anticipated size of vessels;
Extent of fishing activity including trawling and dredging operations;
3 Where “1” is the fastest and “3” is the slowest. 4 Where “1” is most suitable and “3” is least suitable

EirGrid Grid West Project
HVDC Technology Review
Page 65 of 123
Natural hazards present such as sediment mobility or ice scour;
Water depth; and
Soil composition, geology and geotechnical properties of the seabed.
Vessel anchors are usually the most significant concern. High holding capacity anchors, usually required as part of an offshore installation, can penetrate 20m into the seabed in very
soft clays however the risk can be managed as part of a planned operation [6]. Anchors on other ships tend to be used for temporary mooring or in times when the vessel is out of control. These anchors are more of a concern to the cable as they are unpredictable and their
use cannot be planned. The anchor weight and the subsea soil properties would determine how deep the anchor would penetrate in the seabed, identify the level of risk to the cable and therefore the required burial depth. However the water depth also needs to be considered, as
there is a limit to the length of chain carried by ships and this normally prevents anchoring in deep water with typical maximum water depths for anchoring between 100m and 150m [6]. However [7] reports that the number of vessels with anchor chains greater than 300m is “on
the increase” and that only unburied cables at water depths beyond 400m could be considered relatively safe. Cables installed beyond these depths are likely to have double steel wire armouring to manage torsional forces during the lay which provides additional
mechanical protection of the cable core.
Large deep water trawlers can weigh over 4 tonnes and can operate at depths over 1,000m, whereas shellfish dredgers tend not to penetrate the seabed too much and typically operate
at depths up to 200m [6].
Known sediment mobility, such as “sandwaves” on the seabed will determine the required
depth of burial as the seabed movement may reduce the depth in which the cables are buried over time, exposing them to higher risks to anchors and fishing activity [6]. Also, ice can break up and migrate to the shore area where large slabs of ice can overlay each other and
force the ice to scour the bottom. The cables need to be installed in HDD conduits at suitable depths to avoid damage by ice scour.
A submarine cable route which has a very high water depth (using the example above, over
400 metres) with no known trawling or dredging activity may be a candidate to have the cables laid directly on the seabed without burial. Conversely, a submarine cable route at a shallower water depth (for example, less than 150 metres) in an area of high shipping traffic,
high trawling or dredging activity and relatively soft soils would require the cables to be buried and at relatively deep burial depths.
Typical burial depths range from 0.5 metres in low risk areas to greater burial depths in
higher risk areas. The marine cables for the East-West Interconnector project were buried at 1.5 metres. The Trans Bay Cable project in San Francisco was installed with a target burial depth of 3 to 6 feet [9].
4.5.2 Submarine Cable Installation Methods
Submarine cables are buried either from a specialist marine cable laying ship or from a cable
laying barge. The difference is related to the water depth – the larger ships are more suited to deep waters whereas the barges are suitable in very shallow waters. An example of a cable laying ship is provided in Figure 33 and of a cable laying barge in Figure 34.

EirGrid Grid West Project
HVDC Technology Review
Page 66 of 123
Figure 33 - The AMC Connector Cable Laying Ship
Cable laying ships are equipped with Dynamic Positioning (DP) systems which allow the vessel to hold a position and maintain an accurate course to ensure the cable is accurately buried within the required right of way.
Cable laying barges can be put together close to the installation site by installing and commissioning a cable laying “spread” on a local barge. Cable laying barges utilise “spud anchors” driven into the seabed to maintain position while installing the cable. These barges
are not suited to ocean going travel and therefore cannot transport the cable, which would be done by another vessel (either a cable laying ship or a freight ship) and then transferred to the barge at the site.
Figure 34 - Example of Cable Laying Barge
The Trans Bay Cable project in the USA used a cable laying barge as well as a cable laying
vessel. The cables were transhipped from the Guilio Verne cable laying ship to the barge and then both vessels laid the cable in opposite directions. The cable laying barge laid approximately 23km in shallow water whilst the Guilio Verne laid approximately 62km in
relatively deeper waters [14].
Both types of vessels are equipped with the necessary tools and equipment to safely install the cables, including cable storage, cable rollers and ladders, “caterpillars” (devices that can
push the cable along with damaging it), cranes and sheaves over the rear of the vessel.

EirGrid Grid West Project
HVDC Technology Review
Page 67 of 123
When more than one cable is to be installed, the cables can be bound together forming a cable bundle. Figure 35 shows a cable bundle configuration used on the Trans Bay Cable
project, a 400MW HVDC link in symmetrical monopole configuration utilising 2 x 200kV polymer cables. This diagram also shows the fibre optic cable installed as a part of the bundle. The cables are bundled using strapping of twine installed around the 2-3 cables at
regular spacing on the deck of the cable laying vessel before it is installed over the sheave. Where cable bundles are used, ease of installation and lower installation costs are traded off
against reduced cable capacity due to the cables touching.
Figure 35 - Typical Symmetrical Monopole Submarine Cable Bundle Configuration5
4.5.3 Submarine Cable Burial Methods
The burial of the submarine cable in the seabed is the most common method of protecting a marine cable from external damage.
Where the submarine cable is required to be buried, there are two strategies that can be employed:
Simultaneous lay and burial; or
Post lay burial.
Selection of the method of burial requires careful consideration of factors such as the geology/geotechnical composition of the seabed, project schedule and cost.
4.5.3.1 Simultaneous Lay and Burial
As the name suggests, this involves the burial of the cable at the same time that it is laid on the seabed.
The cable can be simultaneously laid and buried using a device such as a marine plough. A
typical marine plough is a vehicle on wheels or skids that can be towed behind the cable laying vessel. The plough has an adjustable keel that can be lowered into the seabed to the required burial depth and most are equipped with high pressure nozzles on the blade of the
keel that fluidise the seabed and allow the keel to sink into the seabed. The cable or cable bundle enters the “bell mouth” of the adjustable keel and is released at the base of the keel at the required burial depth. The seabed will close above the cable after the keel has moved
through. The plough is equipped with the necessary technology to allow its position to be
5 http://www.ci.pittsburg.ca.us/pittsburg/pdf/tbc_addendum/Figures/Fig2.4-1.jpg

EirGrid Grid West Project
HVDC Technology Review
Page 68 of 123
monitored and to provide visual information on ploughing activities on the seabed. Modern ploughs can bury the cables up to a burial depth of 3 metres [7].
Simultaneous lay and burial will be typically faster and cheaper than applying post lay burial techniques, however some factors may make this solution not ideal – such as the hardness of the seabed and a significant number of crossings of other seabed or subsea services. The
plough method involves a lot of mechanical forces on the cable and could pose a risk to the integrity of the cable if not handled with care [7]. The water depths at which this method can
be applied may be restricted by the ploughs that are available and the ability of the cable laying vessel to control the horizontal payout of the cable between the vessel and plough.
The Trans Bay Cable project in the USA, a symmetrical monopole VSC HVDC system, used a
“Hydroplow” system – which is a plough system supported by high pressure water jets as described above, at a target depth of 6 feet [14].
4.5.3.2 Post Lay Burial
Post lay burial is where the cable is first laid on the seabed and then another pass is made to bury the cable or cable bundle. Common methods applied to the burial of a cable or cable
bundle which has already been laid on the seabed include:
Water jetting; or
Rock trencher.
Water jetting involves a similar technique to the plough where a Remote Operate Vehicle
(ROV), equipped with “swords” with high pressure water nozzles on its blade, straddles the as-laid cable or cable bundle and fluidises the seabed underneath, allowing the cables to sink into the seabed under their own weight. The device is controlled remotely from a control
room on the vessel and is equipped with the necessary technology to allow its position to be monitored and to provide visual information on ploughing activities on the seabed. The water jetting machine can be equipped with equipment to determine the depth of burial (i.e. how
deep the cable bundle has sunk into the seabed). Water jetting machines can typically bury the cable to a maximum depth of 1-2 metres [7].
Water jetting is typically employed in soft or loose soils. Where the seabed is too hard for
water jetting, then other cutting methods can be used, such as a rock trencher which allows the cable to be loaded into it and held to a position out of the way while a wheel cutter or rock saw digs the trench to the required depth. The cables are then lowered into the trench.
When using this method, the trench should remain as narrow as possible and the trench is allowed to be filled in by the natural movement of the seabed materials [7]. In hard soils
where rock trenching is necessary, it is often the case that a reduced burial depth is acceptable as anchors and trawlers will penetrate the seabed less [7].

EirGrid Grid West Project
HVDC Technology Review
Page 69 of 123
Figure 36 - Assotrencher IV Rock Trencher6
4.5.4 Cable Crossings of Existing Services
When the cable needs to cross other services, whether they are laid directly on the seabed or buried, it is prudent to cease burying the cable a specified distance before the location of the service and recommence a distance after. This distance is usually agreed with the owner of
the service. In this case, the cable or cable bundle will remain on the surface exposed for tens or hundreds of metres, although other cable protection methods can be applied to the cable as described in Section 4.5.5.
In some cases, other precautions are agreed with the service owner, including applying cable protection on top of the service before it is crossed.
4.5.5 Cable Protection Methods
Whilst the burial of the cables is the most common method for protecting the cables where hazards or risks exist, there are times where other protection methods may be required,
including:
When crossing other seabed or buried services;
In areas where burial to the required depth is not achievable; or
In areas close to the shore, where burial is not possible due to water depth or
environmental constraints.
In these instances, other forms of cable protection are applied post lay. Typical methods include:
Mattressing – the placement of pre-fabricated articulated concrete mattresses which are made up of individual concrete blocks connected together by ropes or straps,
directly on top of the cables or cable bundle. An example is shown in Figure 37.
Rock dumping – the placement of large rocks over the cable or cable bundle.
6 http://www.assodivers.gr

EirGrid Grid West Project
HVDC Technology Review
Page 70 of 123
Grout bags – the placement of bags of grout on top of the cable or cable bundle by
divers or ROV which shape over the cables.
Cast iron shells – Articulate iron pipes installed around the cables.
Figure 37 - Concrete Mattresses
In a recent survey of submarine cable asset owners and projects performed by the CIGRE B1-21 working group, 25% of respondents used rock dumping where cable burial was not possible and 17% used mattresses. 33% of respondents used pipes (such as cast iron shells)
on the shore sections.
4.5.6 Submarine Cable Landing
Once the cable or cable bundle has been installed, the cables need to be “landed” onto the
shore at either end. This operation can be tricky and represents a time when the cable is most at risk of being kinked or twisted and therefore must be planned and managed carefully.
In modern times the environmental sensitivities associated with coastal areas means that HDD is often employed (as described in Section 4.4.4). In this case, the pilot bore is drilled by a drill rig set up on the shore and out to the location of an awaiting barge, which holds the
HDPE conduits and crew assembles them and pulls them back through the backreamed bore. Once the conduits are in place, the cables are landed from the cable laying vessel. The cables
are cut to length and floated out on air-bags or floats and the end sunk down into the opening of the conduit (below the water line) from where the cable is pulled to the shore. During this period, the cables are floated out into a large “omega” to reduce the risk of cable
kinks or twists during the operation.
Where the project allows it, the cables can be trenched (using the same methods as for the land cable installation) along the beach and into the shallow water. The cables would then be
“floated” to the shore in a similar way as when HDD is used, however the cables would then be guided to the open trench and conduits within the trench (if applicable).
4.6 Fibre Optic Cables
Telecommunications between the HVDC converter stations, often referred to as “station-to-station communication”, is often provided to enhance the performance of the link [10]. These
enhancements include high speed interaction between the control and protection systems to coordinate operations, including interlocking and sequencing and to improve the converter response during faults. HVDC converter stations are designed to operate without this link, in
terms of both control and protection (albeit with reduced functionality), in the event that the telecommunication fails.
Providing fibre optic communications between converter stations is becoming increasingly
popular. At an incrementally low cost, fibre optic cables containing a number of fibres can be

EirGrid Grid West Project
HVDC Technology Review
Page 71 of 123
installed at the same time as the DC cable system or overhead line. It is prudent in such cases to provide enough fibres for spares (in the event that a used fibre fails) or for potential
future uses.
Fibre optic cables have the benefit that the telecommunications will not be affected by the close presence of high voltage cables, unlike copper telecommunication circuits.
The fibre optic link can be provided as:
Underground fibre optic cables, installed with the DC cables.
Submarine fibre optic cables, installed with the DC cable bundle (see Figure 35); or
Optical Fibre Ground Wire (OPGW), installed in place of the ground wire on overhead
DC transmission lines.
For HVDC systems that have a combination of land cables, submarine cables and/or overhead
lines, the communication path will use a combination of the above.
Submarine fibre optic cables will have armouring to protect the fibres from mechanical damage.
The provision of such communication also provides the operator with the capability to provide additional features for operation and maintenance purpose, including high speed Close Circuit Television (CCTV) of the converter station and operational telephone voice communication.
The Basslink HVDC project, an LCC HVDC link in Australia, installed fibre optic cables with 12 fibres. The submarine fibre optic cables were bundled with the HVDC and metallic return cables [13]. The Transbay Cable project, a VSC HVDC link in the USA, installed a fibre optic
cable in bundle configuration with the DC cables [14]. The East West Interconnector installed a 48 fibre cable.
4.7 Cable Reliability
4.7.1 Land Cables
Failures of underground cables can be broadly categorized into the following three categories [7]:
Internal cable failures;
Third party mechanical damage; or
Other physical external parameters.
Internal cable failures refer to a failure during operation due to a cable imperfection, often
occurring in the factory, during handling and transportation or during installation. Third party mechanical damage is the result of the cable being hit or moved during excavation or drilling. Other physical external parameters include overheating due to the burial depth, soil dry-out
caused by vegetation and subsidence [7].
Analysis of underground AC extruded (XLPE) cables performed by Cigre has concluded that the risk of external-mechanical damage is three to five times higher than the risk of an
internal cable failure [7]. For AC XLPE cables between 220kV to 500kV, based on a survey based on failure rates between 2001 and 2005, the average annual failure rate per 100 km of installed circuit was 0.05 for internal cable faults and 0.238 for external damage [7]. Put
another way, a cable of this type that is 100km long is expected to incur a fault once even 3.5 years, with a high likelihood that this would be caused by external damage. Depending on how the risk of external damage is managed by the asset owner or operator, the reliability of
100km of this type of cable could be between one failure in every 3.5 years and one failure in every 20 years. This is however only based on a sample size of 1,600km of installed cable.

EirGrid Grid West Project
HVDC Technology Review
Page 72 of 123
For the lower voltage AC XLPE cables (60kV to 219kV), for which there was 16,836km in the sample over the period, the average annual failure rate per 100 km of installed circuit was
0.037 for internal cable faults and 0.116 for external damage, or for a 100km length of cable, one fault every 6.5 years [l7].
PSC could not locate reliable data on the reliability of cable joints of DC cable in the public
domain. However whilst jointing technology has vastly improved over recent decades, it remains prudent to minimise as much as possible the number of joints in the installed DC
cable. Each joint must be manually performed and any manual intervention creates the possibility of a weakness that could eventuate into a fault at a later date. Improved techniques and quality control can help manage this risk.
4.7.2 Submarine Cables
Submarine HVDC cables have been operational since 1954 so there is significant operational
experience with submarine cables and their reliability.
Failures of submarine cables fall into four broad categories [7]:
Internal faults;
Anchor damage;
Trawling damage; and
Excavation.
The survey data presented in [7] covers the period from 1990 to 2005, and has no data for submarine DC XLPE cables. Interestingly this data shows the failure rate due to external damage significantly higher for DC mass impregnated cables than for AC XLPE cables, and
this is most likely due to the DC cables having longer lengths and therefore spanning areas where such damage is possible.
Based on the data in [7], the reported average annual failure rate per 100 km of installed circuit for DC mass impregnated cables (60 to 219kV) was 0.133 with zero reports of internal cable failure. This means that for a 100km length of this cable, a failure should be anticipated
on average once every 7.5 years, and it is highly likely to be caused by external damage. Similarly, for DC mass impregnated cables (220 to 500kV), the failure rate per 100km was 0.1 with zero reports of internal cable failure. This means that for a 100km length of this cable, a
failure should be anticipated on average once every 10 years is expected.
Reference [7] states that these figures cannot be conclusive due to the relatively small sample size and is dependent on the number of survey respondents, although it does
conclude that submarine cables have a higher reliability than land cables and that the primary cause of failure is external damage. The actual reliability of specific HVDC cables however is heavily dependent on whether they are buried or not, the other means of mechanical
protection applied, the water depth, the cable design and other mitigation measures applied such as accurate maps and education for the operators of vessels in the area.
For submarine cables, the long lengths (compared to land cables) that can be transported on
cable laying ships often results in fewer joints being required. The data above showed external damage being the major contributing factor to submarine cable failures. Similar to
the discussion on land cable joints above, it remains prudent to minimise as much as possible the number of joints in the installed DC submarine cable as each joint must be manually performed and any manual intervention creates the possibility of a weakness that could
eventuate into a fault at a later date.

EirGrid Grid West Project
HVDC Technology Review
Page 73 of 123
4.8 Cable Repair Times
4.8.1 Fault Detection and Location
In general, the fault location methodology applied to the identification and location of DC cable faults is the same for both land and submarine cables.
The current state of the art in DC cable fault finding technology is the use of the Time Domain Reflectometer (TDR). This device will apply a voltage pulse to the cable and monitor the reflected voltage waves generated from discontinuities on the cable. Where unexpected
discontinuities are identified, the time duration between the incident and reflected wave can be used to measure the distance to the fault. Small discontinuities are inherent with the final as installed cable in the forms of cable joints, terminations, open disconnectors etc. For this
reason, it is good practice to obtain a TDR “fingerprint” of the healthy cable shortly after it has been commissioned to compare against during future fault investigations.
In some cases, the impedance of the fault may be too high to be clearly seen as a
discontinuity using the TDR. In this case, a high voltage surge generator (colloquially called a “thumper”) can be used. The device will provide a low resistance arc at the fault which can be clearly located by the TDR.
4.8.2 Cable Repair
The method of repair to be employed differs between land and submarine cables.
4.8.2.1 Land Cables
Once the cable fault is located, the cable repair process is typically:
1. Mobilise excavation equipment to the site and expose the DC cables at or around the
area where the cable fault has been confirmed.
2. Visually identify the precise location of the fault. The fault can be identified as a hole, burning or other deformity on the outer jacket of the cable.
3. Cut out the faulted section, allowing a certain distance on either side of the fault. This distance should allow adequate room for two cable joints and a reasonable length of cable between them.
4. Retrieve the required length of spare cable and two cable joints and insert the new piece into the installed cable length, completing the two joints.
5. Test the repaired cable.
6. Backfill and remediate the area.
The time typically taken to locate and repair a DC cable fault is dependent on strategies put
in place to minimise downtime as described in Section 4.8.3 as well as factors such as time taken to locate difficult to find faults, access requirements and notification periods for access to the fault area, whether the fault is located in cable ducts or HDD areas, availability of
experienced fault locating personnel and cable jointers. Based on the experience of the authors, land cable repairs can take from close to a week for a well prepared operator through to a couple of weeks for the unprepared operator and/or access to troublesome
areas.
4.8.2.2 Submarine Cables
Once the submarine cable fault location has been identified, the cable repair process can
begin. For a submarine cable, the cable repair vessel needs to be mobilised immediately, the required cable retrieval, recovery and burial equipment sourced and mobilised and the required specialists skills, including cable jointers, located and dispatched. The cable repair
vessel may be a large ship in deep, rough waters or a smaller barge in shallow and calm waters.

EirGrid Grid West Project
HVDC Technology Review
Page 74 of 123
Once the required equipment has been located and mobilised onto the cable laying vessel and the specialist skills arrived, the cable repair vessel will mobilise to the location of the
cable fault and the retrieval and repair process can commence.
For cables buried in the seabed, the cable will need to be exposed by removing the covering soil and overburden, using Remote Operated Vehicles (ROVs) and/or divers. The cable is then
cut while on the seabed and the “good” end of the cable retrieved onto the vessel. The spare length of cable is jointed onto the retrieved cable. Another cut is made some distance along
the cable to ensure the faulted section is removed, and the good end retrieved on board while “paying out” the inserted spare cable onto the seabed. The other end of spare cable is then jointed to the “good” end of that cable. The retrieved ends of the cable, with the new
“spare” cable jointed between them, form a “hair-pin” loop. The centre of this loop is then placed around a semi-circular former (to ensure that the cable is not kinked and that the minimum bending radius is not breached) and the former and cable lowered carefully to the
sea bed [21]. Reburial activities and/or additional protection methods (as described in Section 4.5.5) will then be completed as required.
Looking at the cable repair in plan view, the length of cable that was faulted will now have an
“omega” shape installed within it.
As with the land cable installation, the time typically taken to locate and repair a submarine DC cable fault is dependent on strategies put in place to minimise downtime as described in
Section 4.8.3. However the arrangements in place for quick short-notice access to the cable repair vessel, associated equipment and specialist jointing skills is a significant factor. Weather windows also play an important part in determining the time to repair [21].
Good examples of submarine cable repair times are difficult to obtain. However a repair of a submarine cable fault that occurred on 6th March 2003 on the IFA 2000 Cross-Channel link is well documented [22]. This paper reports that all necessary staff and equipment was brought
together in less than 15 days, and that the location and equipping of a suitable cable repair vessel and loading of the spare cable was completed before 11th April 2003, 36 days after the
fault. Restoration of the service is reported as 28th May 2003 [22], resulting in a total location and repair time of 83 days, or just under 3 months. This paper also notes that almost 40% of the time was spent in the shelter of the port of Dover, due to unfavourable weather
conditions, emphasising the effect of weather on cable repair times.
4.8.3 Strategies for Minimising Downtime during Cable Repairs
A prudent operator of a HVDC system should adopt a strategy to cover the process of repairing of the DC cable from the first trip of the converter station, through to cable fault identification, cable repair and final remediation [20]. Implementing such a strategy can be
expensive so the required availability of the HVDC system should be considered in the preparation of such a strategy.
Some strategies to be considered include [20]:
Holding required levels of spare cable and cable joints;
Procurement of fault locating equipment or securing short-notice access to same;
Training personnel on the use of fault locating equipment or securing short-notice
access to same;
Sourcing submarine cable fault repair vessels including consideration of engaging
vessels on standby or straight procurement of the required vessels;
Holding of the required cable recovery, repair and laying equipment for rigging onto a
repair the vessel;
Arranging standby access to or identifying multiple sources of excavation equipment in the vicinity of the cables; and/or

EirGrid Grid West Project
HVDC Technology Review
Page 75 of 123
Develop and maintain a well thought out and documented cable repair procedure.
4.9 Cable Overload
DC cables are a thermal element in the HVDC system, which means that their ratings are driven to a large extent by its thermal capabilities. Each cable will have a defined maximum
permissible operating temperature (55°C for mass impregnated cables and 70°C for polymer DC cables [28]). Operating the cable beyond this temperature risks damage to the cable
insulation that can result in degradation in the insulation and potential cable failure.
DC cable thermal models can be developed based on the specifications provided by the manufacturer and applying techniques such as that presented in IEC 60853-2 [15]. These
models allow the potential for any overload to be determined.
When operating at constant power transfer levels, the DC cable will heat up and reach a thermal equilibrium level. Based on the cable design and the proposed installation, if this level
is determined to be below the maximum permissible operating temperature at the required power transfer (continuous rated current), there may be some room for overload. In such cases, these overload conditions are well defined and will necessarily require a “cooling”
period after the period of overload to allow the cable to cool down and to again achieve thermal equilibrium at the continuous rating.
An example of an overload on a major DC submarine cable is Basslink which allows an
overload of an extra 130MW for up to six hours subject to an adequate pre-cooling period [13].
The overloading of cables can also be managed using cable thermal monitoring and/or
dynamic cable rating techniques [16]. Cable thermal monitoring is being used on existing HVDC land cables, although there is little experience to date on dynamic cable rating techniques for DC cables.
5. HVDC OPERATION AND PERFORMANCE
5.1 HVDC Losses
The operational losses in a HVDC scheme is dependent on a number of factors such as:
The converter technology implemented, i.e. LCC vs VSC (PWM or MMC).
The configuration of the HVDC scheme, i.e. monopole, bipole, symmetrical monopole and more specifically the type of DC current return path (ground return or metallic
conductor return).
The design of other power systems equipment such as DC cables/overhead lines and
filters banks.
The losses associated with HVDC converter stations constitute a significant portion of the total operational power loss of a HVDC scheme. Of the two technologies available, the LCC
converters are still considered to have the least amount of power losses. The recent advances in VSC design, particularly the introduction of MMC-VSC have significantly reduced the difference in power losses. Table 6 shows typical converter station losses for each converter
station at power transfers of 500MW and 1,000MW. The higher power losses associated with the PWM based VSC design is due to the higher frequency of switching of the IGBTs thereby increasing the switching losses.

EirGrid Grid West Project
HVDC Technology Review
Page 76 of 123
Table 6 - Typical Percentage Power Losses of LCC and VSC Based Converter Stations [24]
Converter
Station Rating (MW)
LCC converters (%
power losses)
VSC converters (% power losses)
PWM based MMC based
500 0.85 2 1
1,000 0.75 1.75 0.9
As described in Section 2.2.3, the operational power losses associated with metallic return approaches twice the power loss associated with ground return. This is because the
resistance of the metallic return path is similar to the resistance of the high voltage conductor and doubling the resistance of the current loop will double the power loss. In the ground return option, the DC return current will spread rapidly over a large cross-sectional area
within the earth and/or sea from the point of injection at the electrode. As the resistance of the conduction medium is inversely proportional to the cross-sectional area, the resistance of the ground return path and as a consequence the power losses in the ground return path are
both very low [10].
The power losses associated with the DC cable and overhead line will be dependent on various factors such as the type, the length and the voltage rating of the DC cable and
overhead line. Reference [24] specifies a rule of thumb power loss value of 25 W/m for a DC cable. The losses associated with other power systems equipment such as the converter transformer and filter banks, particularly for LCC based HVDC schemes, must also be
considered. The losses in these components will be dependent on inherent characteristics, such as the winding resistance in the case of the converter transformer and the quality of the AC system voltage; harmonics/unbalanced AC system voltage will introduce additional losses
in the converter transformer and filter bank.
5.2 HVDC Reliability and Availability
The reliability and availability characteristics of HVDC schemes are affected by the frequency and duration of both forced and scheduled outages. A forced outage is an unplanned outage due to a fault or the failure of an item of equipment. A scheduled outage is a planned outage
due to an annual maintenance shutdown or the need for repairs outside normal maintenance plans.
Scheduled outages have a lower impact on the power system as they can be timed to occur
when the demand is low or reduced transmission requirements are expected. Forced outages can occur at any time and may have a significant impact on the power system and/or revenue of the HVDC scheme owner.
The primary source for data on the reliability and availability of HVDC schemes is CIGRE Advisory Group (AG) B4.04. AG B4.04 collects reliability data on an annual basis for HVDC
systems around the world and provides a biannual report based on the data collected for the previous two years [43].
The reliability and availability of HVDC schemes is determined by the energy availability or
non-availability. Energy availability is a measure of the amount of energy that can be transmitted relative to the rated energy capability over a given time period. For example, if an HVDC scheme was available to transfer 100% of its rated power for twelve hours and then
50% of its rated power for the next twelve hours, the energy availability for the twenty four hour period would be 75%. The difference between energy availability and energy utilisation should also be noted. In the example above the energy availability is 75%; this does not
mean that the availability is fully utilised, just that it is available.

EirGrid Grid West Project
HVDC Technology Review
Page 77 of 123
The reliability and availability of HVDC schemes is impacted by many factors from scoping and design decisions through to the competency of the operators. The statistics associated
with forced outages highlight the importance of carrying spares. Additionally, timely install of the spare equipment is important. This is highlighted by the 2007 converter reactor failure at Murraylink, where one factor sited for the lengthy outage was that the building design did not
accommodate easy replacement of the reactor [46].
5.2.1 LCC Technology
CIGRE AG B4.04 uses energy unavailability and gives data for:
1. Forced Energy Unavailability (FEU) – The amount of energy that could not be transmitted due to forced outages.
2. Scheduled Energy Unavailability (SEU) - The amount of energy that could not be transmitted due to scheduled outages [43].
Over the period from 1997 to 2008, the FEU of the respondents to the AG B4.04 surveys had
an average value of 2% and a median value of 0.45% [44]. The difference between the average and the mean FEU is due to the skewing of the data caused by transformer failures. The high impact of transformer failures on FEU is due to the lengthy repair times, often more
than a year if a spare is not available. Between 1997 and 2008, the average number of forced outages was 7.1 outages per year (this figure includes converter, pole and bipole outages_. The AC equipment category (which includes converter transformers) accounts for 37% of the
forced outages, however, these outages accounted for 83% of the energy unavailability.
CIGRE joint working group A2/B4-28 provides performance and reliability information of in
service HVDC converter transformers. CIGRE Brochure 406 [45] showed that the converter transformer failure rate by year of commissioning peaked in the late 1980s and again in the late 1990s. This was primarily due to increased capacity and voltage (the first ±600 kV HVDC
schemes were commissioned in the late 1980s). Since the year 2000 the failure rate by year commissioned has been trending downward, with the decrease being attributed to better design and monitoring of HVDC converter transformers. This result suggests that the average
FEU is skewed by extra high voltage systems (±600 kV and greater) commissioned between 1985 and 2000. The expected range for FEU of a new HVDC scheme is 0.5% to 1.0% [44].
For the period between 1997 and 2008, the average SEU was 2.85%, which corresponds to
1.5 equivalent weeks of outage [44]. This is due to regular maintenance and scheduled outages for repair. A good estimate for the time required to complete the annual maintenance would be one week per annum.
5.2.2 VSC Technology
Reliability statistics for VSC HVDC schemes are not as readily available as reliability statistics for LCC schemes. This is primarily because VSC is a comparatively new technology with much
less operating experience exists for these emerging technologies. CIGRE Advisory Group B4.04 has not yet reported on VSC statistics.
Reliability statistics for two ABB VSC schemes, Cross Sound Cable and Murraylink, were reported for the period from 2003 to 2009 in reference [46]. Table 7 gives the average forced outage and scheduled outage rates for Cross Sound Cable and Murraylink from 2003 to 2009.
Table 7 - Average outage rates for two VSC HVDC schemes [46]
Outage rates Cross Sound Cable Murraylink
Forced 1.16 % 2.3%
Scheduled 1.92 % 1.73%
The manufacturers target forced outage rate for Cross Sound Cable was given as 1.18% and
the scheduled outage rate as 0.82 %. The forced outage rate for Cross Sound Cable was

EirGrid Grid West Project
HVDC Technology Review
Page 78 of 123
lower than the target, however, the scheduled outage rate was over twice the target rate. The Murraylink forced outage rate is higher due to a lengthy outage in 2007 following a
converter reactor fault.
5.3 Operation and Maintenance Requirements
Some items of equipment associated with HVDC systems are the same or similar to those located on the AC network, including high voltage transformers, cables, capacitors, reactors etc. However HVDC systems have some key differences which affect the level of operation
and maintenance required. HVDC systems have more complex control and protection systems and more critical auxiliary systems than AC substations (such as cooling systems and critical air handling systems). HVDC converter stations have solid state power electronic equipment
such as thyristors and IGBTs which are not normally a part of the AC network (except where newer SVCs are installed) [20].
HVDC systems can be designed to be operated either directly from the HMI provided with the
system (dedicated control screens) or to the new operator’s existing Energy Management System (EMS) [20]. They can be designed to be dispatched manually or set up to receive an external “dispatch” signal and operate automatically. Either way, it is good practice to have
monitoring of the information and alarms from the HVDC converter stations on a 24/7 basis and a means to respond to failures or trips reported. These decisions are often driven by the dispatch mechanisms of the jurisdiction in which the HVDC system is connected and whether
the new operator is already running a 24/7 control system. Setting up a dedicated 24/7 control centre to operate the link will be more expensive than incorporating the monitoring
and dispatch into an existing control centre but in some cases this may be the only option.
All equipment will need to be inspected and maintained in accordance with the manufacturer’s requirements. Some equipment can be accessed safely while the converter
stations are “alive” whereas others require a shutdown to access the equipment. Shutdowns (scheduled outages) should be kept to a minimum and managed to allow multiple activities to be undertaken during the shutdown.
The operator will also need to maintain a set of required spare parts to minimise the outage during equipment failure. These spare parts will need to be stored according to their requirements and maintained in good order.
The “manning strategy” is dependent on the HVDC system and the operator. Some converter stations are manned on a 24/7 basis, others are partially manned (for example, Monday to Friday as is the case for Basslink [20]) and others completely unmanned (for example,
Directlink, Gotland, Cross Sound Cable and Murraylink [20]).
Typical operation and maintenance requirements for HVDC systems include:
Ongoing monitoring and dispatch of the HVDC converter stations;
First response to faults and alarms from the converter station;
Routine inspection and repair of equipment which can be accessed while the station is “alive”, including control and protection systems and auxiliary systems, such as
cooling fans, pumps, air conditioning, air handling systems and fire protection/suppression systems;
Inspection and repair of equipment during shutdowns (for example an annual
shutdown or every six months), covering the high voltage equipment and thyristor/IGBT valves and equipment located in areas that cannot be safely accessed
while the converter station is “alive”;
Quick response for faults and alarms reported at the converter station and/or trips;
Major activities associated with the repair and replacement of failed equipment, which can involve everything from a control board replacement through to the complete replacement of a failed converter transformer or reactor;

EirGrid Grid West Project
HVDC Technology Review
Page 79 of 123
Monitoring and controlling the inventory of spare parts and maintaining spare parts
in good order;
Cable and overhead line route inspections, including checking for vegetation
encroachment, suspicious activity in the vicinity of the cables and that all cable markers and signs are in place and in good order; and
Site security.
6. HVDC INTERACTIONS WITH AC SYSTEM
6.1 HVDC Interaction Overview
When an HVDC scheme transmits a large amount of power relative to the capacity of the AC system, there will be strong interactions between the AC system and DC system which can
adversely affect the performance of the combined systems.
The AC/DC interactions can be categorized into distinct issues which helps understanding and analysis. Over time, the power industry has developed technical solutions to these issues,
some of which are inexpensive, and others of such a significant cost that they undermine the economic viability of the HVDC scheme.
The following AC/DC interaction issues need to be addressed when implementing an HVDC
scheme [54]:
a) Short Circuit Ratio
b) AC circuit overload
c) AC system voltage
d) DC faults affecting operation of AC system
e) AC faults interrupting DC power transfer
f) Distortion in AC voltages
g) Fluctuations in AC voltages and frequency when ramping DC power
h) Sub-synchronous interactions with generators
i) Interactions between multiple HVDC schemes, power electronic devices, and special
protection schemes
j) Long term changes to the AC system
6.2 Potential Interaction Issues
6.2.1 Short Circuit Ratio
To help quantify the amount of AC/DC interaction, the power industry has historically used
the Short Circuit Ratio (SCR) as a key indicator. The SCR is a measure of the strength of the AC system at the converter station relative to the DC transfer. The strength of the AC system is represented by the three phase fault capacity at the converter station in MVA. The DC
transfer is measured in MW. The SCR is then:
SCR = Three phase fault capacity (MVA) / DC Transfer (MW) [24]
LCC schemes with an SCR greater than 2.5, where the AC system strength is much greater
than the DC power transfer, have characteristically fewer AC/DC interaction problems than schemes with a lower SCR. On the other hand VSC schemes have less reliance on a high SCR and can operate in a completely passive system with no generation, zero fault level, and zero
SCR.

EirGrid Grid West Project
HVDC Technology Review
Page 80 of 123
6.2.2 Reduction in Fault Levels Compared with AC Connections
Low system strength and low fault levels can become an issue in some parts of the system
where synchronous generators and induction motors are being displaced by converter connected generators (such as some wind generators) and converter connected motors (such
as variable speed drives). The converter connected plant do not contribute the high fault current that is provided by directly connected rotating plant. On one hand this is helpful in limiting fault currents below the rating of existing circuit breakers. On the other hand very
low fault levels can lead to more problems with over-voltages, harmonics, and maloperation of protection.
Like other converter connected plant, both LCC and VSC based HVDC schemes will contribute
little fault current compared with an AC scheme. In areas of very low system strength the AC scheme may be more beneficial than an HVDC scheme with respect to avoiding excessively low fault levels.
6.2.3 AC Circuit Overload
AC circuits are not able to control their own power transfer. This is determined by external
factors such as the output of individual generating stations, amount and location of demand, and the topology and impedance of AC circuits in the network. Conversely, the power transfer
on an HVDC scheme is set by the DC control system, independently of the AC system.
The power transmitted by an HVDC scheme will affect the loading on AC circuits. As the DC power transfer increases, AC circuits in series with the HVDC scheme will tend to increase in
loading in the direction of the DC power transfer, whilst AC circuits in parallel with the HVDC scheme will tend to decrease in loading in the direction of the DC power transfer. The loading on those parts of the AC system that are radially connected to the transmission grid (such as
the distribution networks) are not affected by power flows on the transmission network.
The generation and HVDC power transfer to be controlled (or ‘dispatched’) in a way that transmission AC circuits are not overloaded. This needs to be achieved during normal
operation as the demand changes through the day, and also during outages when the power flows through the network may abruptly change.
6.2.4 AC System Voltage
The voltage on the AC system is controlled within a regulated band primarily by the fine voltage control of generators, synchronous compensators, and static var compensators
(SVCs), with assistance from more coarsely controlled switched capacitors and transformer tap changers. For the voltage to be maintained in the regulated band, the system needs to be in reactive power balance where the available reactive power from the controlling
elements can match the reactive demand of the network. If there is a local deficit in the reactive balance then the local voltage will fall, conversely if there is a local excess in the reactive balance then the local voltage will rise.
As discussed in Section 3.3.1, LCC converters consume a significant amount of reactive power. Some of this reactive power is supplied from the harmonic filters, and the local AC system must be able to supply the rest to maintain the reactive balance. There needs to be
sufficient reactive support dispatched during normal operating conditions as well as during outages, otherwise it may not be possible to maintain the reactive balance and the voltage will fall.
On the other hand VSC converters are able to supply and consume reactive power as directed by the operator and consequently contribute to maintaining the voltage, improving the reactive balance in the local area.

EirGrid Grid West Project
HVDC Technology Review
Page 81 of 123
6.2.5 DC Faults Affecting Operation of AC System
DC faults can result in temporary or permanent interruptions to the DC power transfer.
If there is a fault on an overhead DC line then the power transfer is interrupted for a few hundred milliseconds to de-energize the line and allow the fault arc to de-ionize [28]. The
line is then re-energized and if the arc has been successfully de-ionized then power transfer is restored. If the fault persists then further de-energisation attempts may be made to remove the fault. If all are unsuccessful then the link is tripped and there is a permanent interruption
to the DC transfer.
Unlike overhead DC lines, if there is a fault in a DC cable or in a converter then there is no opportunity to de-ionize the fault arc. The protection systems will trip the link and there is a
permanent interruption to DC transfer until the fault is repaired and the link restarted. This applies to both LCC and VSC schemes.
As discussed in Section 2.2.2.2, an interruption to the DC transfer can be partially or
completely compensated by an increase in power on the healthy pole of an LCC bipole scheme, or on the parallel healthy poles of a VSC scheme.
In the case of an LCC scheme the sudden interruption in DC power transfer will also be
associated with a sudden interruption to the reactive power absorption of the converters. This also applies to a VSC converter that is absorbing reactive power at the time of interruption. This will immediately result in an excess of reactive power in the local AC
system, accompanied by a sudden increase in the local AC voltage which will fall back to normal as the exciters on synchronous machines reduce their reactive output, and filters and
capacitors are switched out. This Temporary Over-Voltage (TOV) needs to be limited to a level that does not damage equipment supplied from the AC system. The magnitude of the TOV is closely related to the SCR of the system at the converter. A scheme with a low SCR
will result in a high TOV when the DC power is interrupted.
If the DC scheme is embedded in the AC system then any interrupted DC power that is not transferred to the healthy DC poles will flow through AC circuits and possibly overload them.
The abrupt change in power flow paths through the AC network will also result in changes to the AC voltages which may be outside their regulated band.
If the DC scheme interconnects two asynchronous AC systems then any interrupted DC
power that is not transferred to the healthy DC poles will result in a power excess in the sending (rectifier) system and a power deficit in the receiving (inverter) system.
The power excess in the sending system will result in the AC frequency rising. This rise will be
limited by the action of generator governors and, if governor action is insufficient, generator over-frequency tripping may be required.
The power deficit in the receiving system will result in the AC frequency falling. The fall will
be arrested by the action of generator governors and, if governor action is insufficient, load shedding may be required.
6.2.6 AC Faults Interrupting DC Power Transfer
Faults in the AC network will affect LCC schemes in a different way to VSC schemes.
6.2.6.1 Effect of AC Faults on LCC Schemes
A drop in AC voltage at an LCC rectifier will result in a reduction in DC power transfer, roughly
in proportion to the reduction in voltage.
A drop in AC voltage at an LCC inverter results in a more complex chain of events. If the fault location is electrically remote from the inverter (for example far away on the EHV
transmission network, or even close by on an LV distribution network), then the drop in AC

EirGrid Grid West Project
HVDC Technology Review
Page 82 of 123
voltage at the inverter will be slight. If the drop is 10% or less then this results in a small reduction in DC transfer roughly in proportion to the reduction in voltage [24].
On the other hand if the fault location is electrically close to the inverter, resulting in a drop in AC voltage exceeding 10%, then the inverter can suffer a commutation failure [24]. A commutation failure disrupts the normal periodic transfer (or commutation) of current from
valve to valve in the converter , resulting in a collapse and reversal of the DC voltage together with a sharp increase in DC current, and zero DC transfer. When the fault is cleared
then the normal commutation process is restored and the DC power transfer recovers.
After the AC fault is cleared, at either the rectifier or inverter, the allowable rate of DC transfer recovery is mostly dependent on the SCR and whether the DC connection is an
overhead line or a cable.
A strong AC system with a high SCR is able to support the AC voltage as the DC transfer recovers. However a weak AC system with a low SCR will suffer from a voltage collapse if the
DC transfer attempts to recover too fast. A voltage collapse would result in a second commutation failure and require the recovery sequence to be restarted. If the recovery speed is still not limited then further voltage collapses and commutation failures will follow until the
HVDC link protection eventually trips the link due to prevent further disturbance to the AC system.
The DC recovery is also slowed down by the need to recharge the capacitance of the DC
connection. If the DC connection is by overhead line then the capacitance is relatively small and can be recharged relatively quickly back to normal DC voltage. On the other hand if the DC connection is by a long cable then the capacitance is relatively high and will require longer
to recharge back to normal DC voltage.
Strong AC systems with a high SCR and overhead DC lines can result in fast recovery times. On the other hand weak AC systems with a low SCR combined with long DC cables can slow
the recovery time to as much as 327ms as has been observed on the Basslink LCC scheme [64].
6.2.6.2 Effect of AC Faults on VSC Schemes
In the case of a VSC scheme, the SCR is not such a significant influence on performance as
for an LCC scheme. Even in the extreme case of a completely passive AC system with no generation and zero fault capacity (zero SCR), the VSC converter could use the DC voltage and energy to synthesise an AC voltage to supply the AC system. The VSC converter can
supply the AC system and recover from AC faults provided the converter is rated to supply the steady state active and reactive power demand as well as any additional short duration active and reactive power demand following fault clearance.
Also long DC cables with high capacitance do not hinder recovery from AC faults as with LCC schemes. Conversely the energy stored in the cable capacitance assists the VSC converter to help fault recovery.
A fault on the AC network will also result in a drop in the AC voltage at the converter station until the fault is cleared. For either rectifier or inverter operation, the reduction in DC transfer is roughly proportional to the drop in AC voltage.
After the fault is cleared the DC power transfer in the VSC scheme tends to recover faster than for comparable LCC schemes.
6.2.7 Distortion in AC Voltages
As discussed in Section 3.5, HVDC converters inject harmonic currents into the AC network, with LCC converters injecting significantly more harmonic currents than VSC converters. The
harmonic currents result in harmonic voltage distortion in the AC network and this can be reduced by using harmonic filters. Filtering is more difficult on schemes with a low SCR.

EirGrid Grid West Project
HVDC Technology Review
Page 83 of 123
There are also harmonic sources within the AC system, particularly from loads that have a significant amount of power electronics, including adjustable speed drives and commercial
buildings with large numbers of computers. This creates a background harmonic voltage distortion which results in additional harmonic currents flowing into the HVDC harmonic filters. The HVDC filters need to be rated to handle the HVDC harmonic currents as well as
background harmonics from the AC system.
6.2.8 Fluctuations in AC Voltages and Frequency when Ramping DC Power
When the DC power transfer of an LCC scheme is being ramped there will be a corresponding
ramp in the reactive power absorption of each converter. This must be balanced by the local reactive support to maintain the AC voltage within the regulated band. The need for balancing by local reactive support becomes more onerous as the AC system becomes weaker
and the SCR decreases.
Dynamic reactive support from generators and static VAR compensators can smoothly balance the reactive ramp but harmonic filters, capacitors, and reactors also need to be
switched so that the dynamic reactive support does not run out of range. The harmonic filters also need to be switched to limit the voltage distortion as the power ramps. Each time a filter,
capacitor, or reactor is switched, there will be a step change in the AC voltage. The magnitude of this step needs to be within regulated limits to prevent the lighting flicker becoming a visual nuisance to consumers.
The need to allow time to balance the changes in reactive absorption, and the need to avoid excessive switching may result in a limitation on the speed of ramping the DC power transfer.
On the other hand, ramping the DC power of a VSC scheme can be more rapid. The VSC
converter can be operated with zero reactive absorption to minimize voltage changes. Also the harmonic filters for a VSC scheme are small and infrequently switched compared to an LCC scheme, leading to fewer flicker issues.
If the HVDC scheme (LCC or VSC) is interconnecting two separate asynchronous AC systems then ramping up the DC power transfer will reduce the frequency in the sending system, and increase the frequency in the receiving system. Generator governors need to be able to
increase power output in the sending system and reduce power output in the receiving system to match the DC ramp and maintain the frequencies within regulated limits. In this case the maximum DC ramp rate can be limited by the speed of response from the generator
governors.
6.2.9 Sub-synchronous Interactions with Generators
As discussed in Section 3.6, the power electronics of LCC and VSC schemes can potentially result in a sub-synchronous resonance with local generator turbines with long shafts. Sub-
synchronous interactions are also possible with wind generators that use power electronics to connect to the AC system.
6.2.10 Interactions Between Multiple HVDC Schemes, Power
Electronic Devices and Special Protection Schemes
When multiple HVDC schemes, power electronic devices and Special Protection Schemes
(SPS) are being operated in close proximity to each other there is a possibility that the controls will interact in an adverse way.
The control interactions can be grouped into three broad categories:
a) Interactions between DC power runbacks and special protection schemes;
b) Interactions between DC power modulation controls; and

EirGrid Grid West Project
HVDC Technology Review
Page 84 of 123
c) Interactions between valve firing controls.
DC power runbacks and SPS schemes share a common characteristic in that they both detect
a problem in the network and then take an automated one-way action to resolve the problem. For example the network problem might be that a line is overloaded, and the automated action could be to trip a generator or runback the DC power to relieve the
overload. The action cannot be automatically undone and operator action is needed to reconnect the generator or restore DC power transfer. The action of DC runbacks and SPS
schemes need to be carefully co-ordinated to avoid inadvertent operations with unexpected consequences. Co-ordination failures can be due to designs that do not envisage unusual network operating configurations, designs that become outdated as the network changes
over time (for example the addition of AC or DC lines), or maintenance errors in the fault detection system.
DC power modulations are intended to improve the stability of the AC network by adjusting
the DC power transfer to counteract power or frequency oscillations in the AC system. The design of the power modulations in an HVDC scheme need to take into account the modulations in other nearby HVDC schemes so that overall network stability is maintained.
Without co-ordination, modulations in other HVDC schemes may fight against each other to reduce their effect, or combine together to produce an excessive action that leads to instability.
The valve firing controls in HVDC converters are sensitive to distortions in the AC voltage, and also contribute to these distortions. HVDC converters that are in close proximity in a weak AC network (low SCR) can interfere with each other’s valve firing via the distorted AC voltage.
The firing control system of these HVDC converters needs to be accurately modelled during the design phase to identify adverse interactions and check the effectiveness of mitigations.
In cases where HVDC schemes are built many years apart and by different manufacturers, it
can be difficult for the designers of the newer scheme to accurately model the controls of the older scheme. Modelling simplifications for the older schemes are often made in the design
phase of the newer schemes, and there is always some attendant risk that modelling inaccuracies will lead to unexpected problems during commissioning or service.
6.2.11 Long Term Changes to the AC System
The power system is constantly evolving to allow the connection of new generation and to cater for new and increasing demand. Changes in the AC system can adversely affect the
performance of HVDC schemes, particularly if the SCR is reduced. For example the retirement of local generation can reduce the SCR at an existing converter and result in previously unseen AC/DC interaction issues.
System planners need to be aware of potential issues as the AC system changes, and possibly allow for a review or re-design of HVDC control systems.
6.3 Assessment Criteria
The following AC/DC system interaction studies are normally carried out when planning for an HVDC scheme:
a) Load flow studies identify AC circuits that may become overloaded under normal operating conditions as well as for one or more outages. These studies also determine whether there is sufficient reactive support in the network to maintain
voltages within the regulated band.
b) Short circuit studies determine the fault level at the converters so that the SCR can be calculated under normal operating conditions as well as for one or more outages.
A low SCR is an indicator of AC/DC interaction problems.

EirGrid Grid West Project
HVDC Technology Review
Page 85 of 123
c) Transient stability studies determine the effect of AC faults and DC faults on the combined AC/DC system. These studies identify the magnitude of the TOV in the
local and wider area following an interruption in DC transfer, the low voltage ride through profile that may be impressed on generators and the HVDC scheme, and also the ability of the system to return to a stable operating state following a disturbance.
The effect of a low SCR becomes apparent in these studies.
d) Harmonic studies determine the harmonic impedance characteristic of the AC system,
and the level of pre-existing background harmonics. This information is needed to allow the design of the harmonic filters.
e) Sub-synchronous interaction studies identify the likelihood of adverse sub-
synchronous interactions between the HVDC scheme and generators or other power electronic converters.
f) Studies to identify potential interactions with other HVDC schemes and to identify and
design required control actions to avoid adverse interactions.
g) Additionally, fast transient EMTP type studies may be carried out to identify potential issues with switching or faults within or close to the HVDC scheme. During the
planning phase EMTP type studies may be necessary to further investigate high TOV issues that are first identified in the transient stability studies. EMTP studies are also used to gain a better understanding of equipment design issues for the HVDC plant
itself.
6.4 Mitigations
There are a number of mitigations that can be applied to an HVDC scheme to mitigate against any AC/DC interaction issues that are discovered either during the design phase or during operations.
Overloading of AC circuits – In some cases, studies performed can identify situations where under certain HVDC power flow and AC network outage conditions,
other parts of the AC network can become overloaded. In these cases, the HVDC link may be constrained to operate below a certain level to avoid any post-contingency overloads and other issues. Where these are identified, the HVDC system could be
equipped with an external control scheme or special protection scheme (SPS) which allows the HVDC system to respond quick enough so as to not create an issue on the AC network. Some examples of these SPS schemes include:
o Run-Back Schemes – In situations where the loading of the HVDC causes an overload of AC network elements following a trip or disturbance on the network, this scheme is designed to send a signal to the HVDC control and
protection system to ramp the active power flow down to a specified level within a specified timeframe.
o Inter-Trip Schemes – In situations where a loss of a major load or generation
unit creates a frequency issue and the HVDC scheme is exasperating the problem, a trip signal can be sent to the HVDC scheme to trip the link to balance the load-generation of the network and resolve the frequency issue.
Low SCR – Sections 6.2.1 and 6.2.6.1 discussed the effect that low SCR (representing connection to a relatively weak AC network) can have on the
performance of LCC HVDC schemes. Where there is a requirement for LCC HVDC schemes to connect to AC networks with relatively low SCR, the common mitigation is to allow for the construction and commissioning of synchronous condensers, Static
Var Compensators (SVCs) and/or STATCOMs. A synchronous condenser is a device that can support the AC network voltage by providing both reactive power and
additional short circuit power capacity. The HVDC connection between Haenam and Jeju Island in South Korea are an example of the application of synchronous

EirGrid Grid West Project
HVDC Technology Review
Page 86 of 123
condensers. These synchronous condensers were used to both improve short circuit level and provide reactive power support. The synchronous condensers used were
originally gas-turbine generators converted for synchronous condenser operation [18].
However where a large amount of synchronous condensers are required, it may
result in the short circuit level being increased beyond the capacity of installed or otherwise commercially available AC equipment [17].
Another mitigation to low SCR that could be considered is the use of VSC instead of LCC technology. The Bipole III project in Manitoba, Canada (Nelson River) has concluded that the application of VSC technology will resolve the issue of having so
many synchronous condensers as to exceed the short circuit rating of the 230kV AC equipment [17].
AC Network Response to DC Faults – Where there are concerns regarding the
potential for major swings in frequency due to a trip of the HVDC scheme (for example, where the power transfer of the HVDC scheme represents a significant
portion of the total load or generation in one of the connected networks), a Special Protection Scheme could be implemented. Such a scheme would be design to monitor and trip loads if the HVDC scheme tripped while importing power (i.e. acting
as a generator to the AC network) and to trip the required amount of generation if the HVDC scheme tripped while exporting (i.e. acting as a load). The Frequency Control Special Protection Scheme (FCSPS) utilised by the Basslink HVDC scheme
does exactly that – constantly monitoring major loads and the outputs of generators to identify what should be disconnected the moment Basslink trips [13].
Low Frequency Oscillations – Power oscillations can occur in large AC systems
following a disturbance. These inter-area power oscillations are typically in the frequency range of 0.2Hz - 0.6 Hz [28]. An HVDC link can have a Power Oscillation
Damping (POD) function implemented in its control and protection system that can become active during a disturbance on the AC network. This function modulates the active power (and reactive power for VSC applications [2]) based on the frequency
difference between the two AC systems.
Sub-synchronous interaction - The HVDC control and protection system can be
fitted with a Sub-Synchronous Damping Control (SSDC) which is designed to provide a positive damping to oscillations in the sub-synchronous frequency bandwidth (15-40Hz) [10]. This control modulates the active power to damp any sub-synchronous
oscillations detected.
7. HVDC CONVERTER AND CABLE COSTS
The determination of accurate cost estimates for HVDC projects, particularly those on the leading edge of technology (as is the case for VSC projects), can be difficult as reliable information associated with the cost of HVDC projects are rare in the public domain.
The availability of reliable publicly available information is an issue when developing high level cost estimates. For converter stations, some pricing is available although differences in the scope of each project (including technology, use of ground return vs metallic return,
requirement for reactive compensation, DC voltage and other project specific differentiators) makes it difficult to accurately apply these figures. Similarly for HVDC cables, there is very little publicly available information, particularly information that differentiates between copper
and aluminium conductors, cables of different conductor size, mass impregnated and polymer cables and different terrains and installation techniques. For both converter stations and cables it can also be difficult to understand how much “non-EPC” cost (refer to Section 7.2.1)
is included within the public cost figure.
The cost estimates presented in this chapter are to be considered “ballpark” only and subject
to the costing assumptions listed in Section 7.1. More accurate cost estimates would require

EirGrid Grid West Project
HVDC Technology Review
Page 87 of 123
the detailed scoping of the project, development of a “bottom up” cost and the engagement of the HVDC vendors to provide more accurate estimates based on their specific technology
and application.
7.1 Costing Assumptions
The high level estimates provided in this report are based on the following costing assumptions:
All costs (with the exception of the cable costs as described below) are based on
publically available literature, including documents, papers and brochures from organisations such as CIGRE and publicly available feasibility studies and analysis of
other HVDC projects.
Due to the lack of public information on the cost of land-based mass impregnated
HVDC cables, PSC approached three cable manufacturers for budgetary pricing (cable costs only). Two of the three cable manufacturers responded and these figures were used to derive better land cable estimates as described in Section 7.2.3.
Where costing information is available in a currency other than Euro, the foreign exchange rates in Table 8 have been used.
Table 8 - Exchange Rates
Currencies Exchange rates
AUD/EUR 0.80
USD/EUR 0.74
CAD/EUR 0.68
SEK/EUR 0.11
NZD/EUR 0.62
Cost estimates derived from a source older than two years have been escalated at a rate of 2.5% per annum from the date of publication to 2014.
Capex cost estimates are intended to cover the design, engineering, manufacturing, transportation, construction, erection, installation and commissioning of the converter
stations and DC cables under an EPC contract as well as the “non EPC” costs as detailed in Section 7.2.1.
Opex cost estimates are assumed to remain stable regardless of which HVDC solution
is progressed, except where differentiating between monopolar/symmetrical monopole configurations and bipole configurations as described in Section 7.3.
7.2 CAPEX Costs
PSC has sought to provide cost estimates for the design, construction and commissioning of
both LCC and VSC HVDC schemes. Rates for the various components of HVDC schemes were developed from publicly available cost information except where specified in this Section.
The high level cost estimates presented in Sections 7.2.1 through to 7.2.5 represent the “EPC
contract” price. The majority, if not all, HVDC projects are undertaken as one or more Engineer, Procure and Construct (EPC) contracts typically with the Original Equipment Manufacturer (OEM) of the HVDC converter stations and/or cables. These costs cover the
costs of design, engineering, manufacturing, transportation, construction, erection, installation and commissioning of the project. The costs will also include spare parts provided by the EPC contractor when they deliver the project. Each project will also incur “non EPC”

EirGrid Grid West Project
HVDC Technology Review
Page 88 of 123
costs as well which are treated separately to the EPC contract. These “non EPC” costs are discussed in Section 7.2.1.
7.2.1 “Non EPC” Costs
The “non EPC” costs are those costs not included as part of the EPC contract. They can include the cost of front-end project development, licenses, permits, external advisors and consultants, land and easement procurement, environmental studies, marine studies, grid
connection studies, public consultation, finance, insurance, test energy and O&M facilities. There may also be some engineering, design and construction costs that are excluded from the EPC contract for the project. These costs can occur where the risk profile makes it
difficult or impossible for the EPC contractor to accurately price the work or where the work needs to be performed on the assets of the project owner or another party.
The following explains some of the key “non EPC” costs to be expected for an HVDC system
project:
Front-end project development – This involves the necessary technical studies
and investigations to develop and obtain approval for the project to proceed. This can include preliminary network and connection studies, alternatives analysis, conceptual design, technical specification, cable route assessment and marine studies.
Licenses and permits – Procurement of the necessary permits and licenses for the construction and operation of the HVDC system. This can include development
approvals, government approvals, environmental permits, operating permits and transmission licenses.
Land and easement procurement – This will involve the cost of obtaining the
land for the converter station sites and the necessary easements for cables.
External advisors and consultants – Post approval, an HVDC project will often
require the use of specialist consultants for activities such as the review of technical studies and design, witnessing of factory activities, monitoring of construction and
installation and the management and monitoring of commissioning activities.
Development studies – Projects often require detailed environmental impact
studies, route assessment studies, marine studies (for submarine cable projects) and other studies required. These are more developed and thorough than those performed during front-end project development.
Public consultation – This includes the cost of undertaking public consultation and responding to submissions from the public. This can include the engagement of
consultants and specialists to respond to specific requests and submissions.
Finance and insurance – This includes Interest During Construction (IDC) and the cost of insurance to cover the project developer/owner’s risks during the project
implementation.
Test energy – Where an HVDC system is required to be commissioned in an
electricity market environment, the power transferred during commissioning often needs to be procured and paid for.
Network integration costs – Grid connection studies will need to be performed to
verify the suitability of the HVDC system to connect to both ends of the HVDC link and to identify any constraints during operation and identify the requirements of any
run-back or SPS schemes that may be required. In addition, the engineering, design, construction and installation of the grid connection assets (e.g. AC cable to the nearest connection point on the AC network and associated AC substation
equipment) may be excluded from the EPC contract.

EirGrid Grid West Project
HVDC Technology Review
Page 89 of 123
O&M facilities – In preparation to operate and maintain the HVDC system, these
costs would cover the recruitment and training of O&M staff, procurement of tools and equipment and the required site facilities, including offices, workshops and spare part storage facilities not covered in the EPC contract.
Developer/owner costs – The management of the EPC contract and of the above activities require the developer and/or owner’s own staff in addition to the external
advisors and consultants to undertake works throughout the development and implementation of the project.
The “non EPC” costs associated with a project depend on a number of factors, including
whether or not submarine assets are involved, the particular country/jurisdiction in which the project is being installed, the level of opposition to the project and the degree to which parts of the project are carved out of the EPC contract (e.g. grid connection assets, land and civil
works). Detailed public sources of these costs are rare and difficult to understand what is included within them.
For the purpose of comparison of the costs of alternatives in Chapter 8 of this report, PSC has
used allowance based on the “non EPC” costs for the East West Interconnector (EWIC) project. This is considered prudent given that the EWIC project is a HVDC system, installed in
Ireland and the land cable route is similar in terms of terrain and installation “in road” as will be required for the Grid West project. A breakdown on “non EPC” cost allowances for the Grid West Project, which are based on those incurred for EWIC, excluding elements which can be
associated with the marine cabling part of the EWIC project which do not apply to Grid West, is provided in Table 9.
Table 9 - "Non EPC" Cost Allowances - Based on EWIC Costs Associated with
Terrestrial Assets Only
Cost Category Allowance
(€m)
Third Party Payments 17.90
Advisors Fees 7.12
EirGrid Costs 8.72
Public Consultation 1.60
Network Integration 6.50
Employer's Representative 15.44
Interest During Construction 14.10
Total 71.38
For the purpose of comparing the lifetime costs of all options, a portion of these costs (development costs) are assumed to be incurred in the two years prior to commencement of
construction with the remainder assumed to be incurred during the three year construction period.
7.2.2 Converter Station Costs
The converter station costs presented are for the design, construction and commissioning of converter stations under an EPC contract. Individual equipment costs were not used to build up a cost. Instead data contained in publically available references for the entire converter
station cost was used. The costs are for air insulated converter stations not gas insulated stations.
Table 10 gives the estimated cost per MW per converter station for the two technologies
considered.
Table 10 - Converter Station Cost per MW
HVDC technology Cost per MW (€)

EirGrid Grid West Project
HVDC Technology Review
Page 90 of 123
VSC 114,300
LCC 89,300
The VSC technology costs are based on general information provided by CIGRE in Technical Bulletin 492 [24] and costs provided by EirGrid for the East West Interconnector (EWIC).
The average converter station cost for the EWIC project is reported as 65.3 M€. The project
has a rating of 500 MW, however, if the continuous overload rating is taken into account, the converter stations are rated for 550 MW. This gives a cost of € 118,600 per MW per converter station. Table 4.1 in Section 4.2.1 of CIGRE 492 gives a cost estimate for VSC converter
stations of € 110,000 per MW per converter station, although this is stated as being a ±30% estimate based on converter stations of rating between 650MW and 1,100MW. The difference between the two numbers can be attributed to the comparison of a ±30% estimate [24] to
an actual cost and to some degree the expectation that the cost per MW will reduce as the size of the project increases (economies of scale).
The VSC converter station cost figure presented in Table 10 is the average of the EWIC and
CIGRE cost per MW per converter station.
The LCC converter station cost estimate is based data provided in CIGRE technical bulletins
and a small number of independent studies. Table 11 gives a breakdown of the public cost information available for LCC converter stations between 500MW and 1,800MW and the relevant source. The average cost per converter station from these public sources is € 89,300
per MW per converter station.
Table 11 - Sources of LCC Converter Station Cost Estimates
Source Year published
Base project Cost per MW (€) per station (2014)
CIGRE 186 [35] 2001 ±500 kV 1,000 MW 86,800
CIGRE 492 [24] 2012 400 kV 500 MW 80,000
L. P. Lazaridis [68] 2005 400 kV 500 MW 99,900
DC Interconnect [66] 2007 500kV 1,800MW 90,367
7.2.3 Land Cable Costs
Polymer land cable costs derived from three sources are given in Table 12. The information
given in Table 9 is based on information provided by:
1. CIGRE, – in particular cable cost information for VSC projects provided in reference [24]. This reference gives per km costing information for 500, 1000 and 1500 MW
HVDC polymer land cable.
2. Parsons Brinkerhoff (PB) – for the Tyrone – Cavan interconnector [39]. This reference gives cost information for a 1500 MW link using HVDC polymer land cable. This cost
information was extrapolated assuming a linear relationship between cost and MW rating for comparison with the CIGRE information.
3. EirGrid – actual polymer land cable cost for the EWIC project.
A comparison of the land cable cost information shows that the cost derived from the PB estimate and the EWIC price are about 1.6 times greater than the CIGRE cost estimates. The statistics provided by CIGRE are likely to include costs from cable installation using less costly
techniques than open trenching in the roadway. All costs in Table 12 are for the installation of two (symmetric monopole) HVDC polymer cables.

EirGrid Grid West Project
HVDC Technology Review
Page 91 of 123
Table 12 - Land Cable Cost per km – Polymer Cables, Symmetric Monopole
Rating (MW) CIGRE Cost [24]
(M€/km)
Cost derived from PB estimate
[39] (M€/km)
EWIC Actual Costs
(M€/km)
500 0.8 1.28 1.26
1,000 1.6 2.56
1,500 2.4 3.84
The cost for the EWIC land cable provided in Table 12 includes an estimated 0.137 M€/km for
trenching, ducting and partial reinstatement of the road in relatively good ground conditions [73]. The Grid West project, which will require trenching in significantly poorer ground conditions, will require trenching, ducting and full width reinstatement of the roadway at an
estimated cost of 0.4 M€/km [74].
Table 13 gives the cost estimates for the VSC options which utilise polymer cables that will be used in the comparison of all HVDC Grid West options. Both cost estimates are based on the
EWIC costs provided. The 500 MW estimate accounts for the poorer ground conditions expected for the Grid West project and full width road reinstatement. To develop an estimate
for 1000 MW land polymer the EWIC land cable cost was broken down and engineering judgement was used to apply scaling factors to the various components and build up the estimate given in Table 13.
Table 13 - Land Cable Cost per km – Polymer Cables – Grid West Project VSC options
Rating (MW) Configuration Cost (M€/km)
500 Symmetric monopole
1.524
1000
2 x 500 MW monopole cables in
bipole configuration
2.649
Cable costs for land non-polymer cables, such as mass impregnated cables are more difficult to obtain in the public domain. For mass impregnated cables, there a few (if any) examples of
where these cables have been used for DC cables in projects that do not also have a submarine component, and therefore the length of the land component tends to be small. A
part of the reason for this is likely to be the lower maximum operating temperature (55°C for MI cables compared to 70°C for polymer cables). This means that the use of imported backfill is more likely when comparing MI cables and polymer cables of the same conductor size
and/or larger cables are required. Therefore, it is expected to see significant cost differences between land mass impregnated cables and land polymer cables.
Due to the difficulty in obtaining costs for land non-polymer cables, PSC has sought the input
from three cable manufacturers. One manufacturer declined to respond, another provided lump sum indicative prices and the third included a breakdown of the costs (450 kV mass impregnated cable, metallic return cable and joints). The third manufacturer’s price estimates
were utilised to develop an estimate for procurement and installation of mass impregnated land cables.
Installation costs for mass impregnated land cables were estimated using the EWIC land
cable price, which was broken down and the cost components scaled to account for the additional weight of mass impregnated cable and additional cost of cable jointing.

EirGrid Grid West Project
HVDC Technology Review
Page 92 of 123
Table 14 gives the cost estimates for the LCC options which utilise non-polymer land cable that will be used in the comparison of all HVDC Grid West options.
Table 14 - Land Cable Cost per km – Non-Polymer Cables – Grid West Project LCC options
Rating (MW) Configuration Cost (M€/km)
500 Monopole – with metallic return 2.06
1000 Bipole – no metallic return 2.87
7.2.4 Submarine Cable Costs
The installed costs for submarine cables depends greatly on the type of cables (mass
impregnated versus polymer cables), the cable size, the water depth and the cable installation and cable protection methods utilised. In addition, the length of the cable can be a factor – the capacity of the cable laying ship to carry the required amount of cable can
increase the number of laying “campaigns” required and therefore increase cost due to the additional distances to be travelled by the ship. This will also increase the number of submarine cable joints required, which can be very expensive compared to the land
equivalent. The general cost of transportation to and from the factory will increase the further the cable laying site is away from the cable factory.
Reliable public sources for submarine cable costs are rare. In a similar way to land cable
costs, where these are available, it is difficult to use this information to differentiate between copper and aluminium conductors, cables of different conductor size, mass impregnated and
polymer cables, the number of service crossings and different terrains and installation techniques.
Actual prices can also be a result of the competitive bidding process and the supply and
demand at the time of the order which is difficult to predict with any certainty.
The following table summarises some “EPC” submarine cable costs as identified through public notices issued from three major submarine cable suppliers – Prysmian, ABB and
Nexans. Where applicable, these have been escalated and adjusted for foreign exchange according to Section 7.1.
Table 15 - Submarine Cable Cost per km
Project Rating
(MW)
Cable
Type DC Config.
Cond. Size
(mm2)
DC Voltage
(kV)
Length
(km)
Cost Estimate
(€M/km)
Transbay cable
400 Polymer Symm.
Monopole 1,100 ±200 85 1.29
SylWin1 864 Polymer Symm.
Monopole 1,250 ±320 205 1.28
EWIC 550 Polymer Symm.
Monopole 1,650 ±200 186 1.23
SAPEI 1,000 MI Bipolar
(2 x 500MW) 1,000-1,150
±500 425 1.15
Fennoskan 2 800 MI One Pole of
Existing Monopole
2,000 500 200 0.87
Skagerrak 4 700 MI One Pole of
Existing Monopole
-
500 140 0.67
Maritime Link 500 MI Symm.
Monopole
(2 x 250MW)
- ±200 170 1.03

EirGrid Grid West Project
HVDC Technology Review
Page 93 of 123
The costs in Table 15 vary considerably from project to project, although from this table PSC makes the following observations:
The cost per kilometre for the three polymer cable, symmetrical monopole projects are reasonably close to each other. This is likely because of trade offs between the
various project differentiators. For example, Transbay cable is a relatively short length and a longer distance from the European manufacturer when compared to SylWin1, whereas Sylwin 1 has a larger cable at higher voltage.
The mass impregnated cable, LCC (bipole and monopole) installations are cheaper than the polymer cable equivalents.
From PSC’s experience, the cost of the cables for a bipole or symmetrical monopole can be 35-45% of the total installed cost. Therefore, PSC has scaled the polymer cables (maximum 864MW) by 16% (39% uplift of 40% cable cost) and the mass impregnated cables
(maximum 1,000MW) by 8% (20% uplift of 40% cable costs).
High level submarine cable estimates are provided in Table 16.
Table 16 – Submarine Cable Estimates
Cable Configuration
High Level Cost
Estimate (M€/km)
Polymer Symmetric Monopole
1.48
Mass Impregnated Bipole 1.24
7.2.5 Reactive Support Costs
The LCC options for Grid West will require the addition of reactive power support in the form of synchronous condensers and/or SVCs in order to be viable. In order to provide fair comparison of the various options, these costs must be represented.
Reference [66] provides ballpark costs for SVCs/STATCOMs and for synchronous condensers. Using the escalation and foreign exchange assumptions described in Section 7.1, these figures are shown in Table 17.
Table 17 – Reactive Support Costs [66]
Reactive Support Cost (€/kvar)
SVC/STATCOM 40€ - 97€
Synchronous
Compensation 65€ - 81€
7.3 OPEX Costs
Section 5.3 details the types of activities expected to be undertaken for the operation and maintenance of a HVDC scheme. The costs of these activities are the operational expenditure
(opex) costs.
Opex costs for a typical HVDC scheme will include:
1. Salary/wages for incremental control room personnel, engineering, operational
personnel and contractors for:
a. Dispatch operations and monitoring of alarms;
b. Regular scheduled maintenance in line with the manufacturer’s requirements;

EirGrid Grid West Project
HVDC Technology Review
Page 94 of 123
c. Cable route inspections and maintenance, including vegetation management, maintenance of signage etc;
d. Undertaking repairs and replacements due to failure; and
e. Day to day asset management and maintenance documentation activities.
2. Cost of consumables required for the regular operation of the asset.
3. Cost to procure, maintain and calibrate tools and equipment used by site staff, including safety equipment and cable fault locating equipment.
4. Replacement of spare parts and procurement of items for replacement.
5. Auxiliary power demand and energy charges.
6. Cost to implement strategies for minimising downtime as detailed in Section 4.8.3.
7. Retainers/stand-by costs for on-call and short notice skills and equipment, including cable jointers, cable repair vessels, excavation equipment and specialist staff.
During the evaluation and comparison of HVDC systems performed by CIGRE and Parsons
Brinkerhoff [24, 39], high level estimation of opex costs have been represented as a percentage of capital cost. The O&M cost associated with operating a HVDC system has been estimated at 0.4%-0.5% of the capital cost of converter stations [24, 39] and 0.025% of the
capital cost of underground cable [39] per annum.
The downside to the use of a percentage of capital cost estimate is that it does not take into account the expectation that a significant step in O&M costs are anticipated for operating and
maintaining a new converter station and HVDC cables of any size and that O&M costs are often driven by the project complexity (e.g. type of technology, cable route, marine vs land cable, manned sites versus unmanned sites and operating philosophy) rather than the capital
cost of the project.
PSC was provided with an annual O&M costs for the EWIC project, excluding any marine cable components, of €5M per annum. These costs include payroll and staff related costs,
administration (including insurances), the cost of facilities and other costs.
It was noted in Section 4.8.3 that there are a number of strategies that should be applied to
minimise downtime during the repair of both land and cable costs. The cost of these strategies can be very high and selection of those to be implemented are project specific and often driven by availability requirements and/or penalties for that particular project. The
EWIC cost includes the costs of operating a “dial before you dig” system, attending to sites where excavations are close to the cables, performing regular land cable route inspections, maintaining the cable repair response procedure and delivering cable awareness sessions. For
those other strategies presented in Section 4.8.3, it should be noted that these costs can however vary significantly from project to project and should be looked at more detail particularly if the submarine cable is considered viable.
PSC will use the €5M p.a figure to cover the annual cost of O&M for the HVDC alternatives symmetrical monopole and monopolar converter configuration. To reflect some increase in O&M costs anticipated when additional converters are added (for example where an extra
pole is added to create a bipole configuration or where a bipolar configuration is constructed on the outset), PSC has applied an additional 50%, or €2.5M to the O&M costs per converter pair. This is assumed to be satisfactory for the level of estimation required for the high level
comparison of options.
7.4 Cost of Losses
The cost of losses represent the demand and energy components of supplying the losses within the converter stations and the DC cables.

EirGrid Grid West Project
HVDC Technology Review
Page 95 of 123
Demand losses are the capital costs associated with installing the extra generation,
transmission and distribution infrastructure required to supply the losses.
Energy losses are the costs associated with the cost of the fuel and maintenance of
the generation and the operating costs of transmission and distribution needed to supply the losses.
The cost of losses are calculated for each year following commissioning, for the lifetime of the
HVDC scheme [40].
Section 5.1 of this report discusses the expected losses in the converter stations and DC cables for the different HVDC technologies available. Estimating the cost of losses however
depends greatly on a number of factors including the forecast power flows across the HVDC scheme over the year and the cost of power at the connection point.
The cost of losses depends on the power transfers across the HVDC link. The values
determined in Section 5.1 are based on maximum power transfers, however in reality the power flows across an HVDC scheme is likely to vary from day to day and even from hour to hour. The accurate determination of the cost of losses requires knowledge of these daily load
transfer curves which, for HVDC schemes dispatch in electricity markets, is impossible to determine in advance. Therefore, PSC has applied the “equivalent hours loss factor”
technique presented in reference [70] in the comparison of the annualised cost of losses for the Grid West project. This technique determines the cost of losses over a year based on the following formula:
LosskWh = (8760 x LsF) x Losspeak
Where LosskWh is an estimate of the total losses over a year in kWh, LsF is the Equivalent Hours Loss Factor and Losspeak is the estimate of losses, in kW, at the maximum capacity of
the HVDC scheme.
As the load factor of an HVDC scheme can vary greatly from project to project, PSC has assumed a load factor of 30% which aligns with typical wind generation load factors in
Ireland. This results in an equivalent hours loss factor of 10% (using the equations of [70]). Considerable studies are required to refine these figures.
For a cost per kWh, PSC has used the short-run marginal cost (SRMC) value of €60.66 per
MWh presented in [75], which has been derived from the average system marginal price for Ireland.
7.5 Mid-Life Refurbishment
HVDC systems are expected to have an asset life of 30-40 years, although some parts of the
facility can have a useful life beyond that. MI HVDC cables have been proven in service to have a lifetime beyond 40 years. PE HVDC cables have only been in service since 1999, however design studies indicate a useful asset life over 40 years [1].
For HVDC schemes, mid-life refurbishment typically consists of a control and protection systems refurbishment at the mid-life of the HVDC transmission scheme (15 – 20 years). This is often driven by issues such as technical obsolescence and the availability of spare parts, in
which case the actual timing of the refurbishment will be dependent on the life cycle of the control and protection system used.
Information provided by EirGrid highlights a control system refurbishment plan for the East-
West Interconnector project in three stage, namely:
Level 1 - 7-15 years – Estimated at 4M€ (2M€ OEM cost, 2M€ EirGrid cost);
Level 2 - 15-25 years – Estimated at 5M€ (3M€ OEM cost, 2M€ EirGrid cost); and
Level 3- 20-40 years – Estimated at 7M€ (5M€ OEM cost, 2M€ EirGrid cost).

EirGrid Grid West Project
HVDC Technology Review
Page 96 of 123
All control system refurbishments require re-commissioning activities, coordination and control and project management activities by the owner and/or operator.
These costs are expected to be as applicable for other VSC projects.
Public pricing of LCC projects can vary due to other scope items included in the upgrade, such as upgrading of the valve cooling system or enhancements to the transfer capacity.
Some recent control and protection upgrade announcements include:
The multi-terminal HVDC link between Québec and New England (three converters) is
being upgraded after 22-24 years of service, at a contract price of approximately 55M€7 (2013). The project also includes a cable transition stations and a control and protection system simulator in Canada.
The Highgate back-to-back converter station in the USA had its control and protection and valve cooling systems upgraded in 2012, 27 years after the project was first
commissioned. The reported cost for this upgrade (converted to Euros according to the assumptions stated in Section 7.1) was approximately 15M€8.
Based on the above, PSC has assumed a 20M€ cost for the upgrade of the control and
protection system, with a contingency for other upgrades as may be required, at the 25 years mark for LCC technology options.
7.6 End of Life Replacement
The lifetime costs of a HVDC scheme need to account for the cost of replacement at the end
of the specified design life as the power system will likely still require the transmission capacity that the HVDC transmission scheme is providing. If the project is no longer considered to be useful after the design life, the converter stations and cables may have to
be retired, physically removed and the sites restored.
These costs vary considerably from project to project and depend on whether refurbishment, replacement or retirement is the preferred end of life solution. The discount period of 50
years used for the comparison of options for the Grid West project is well beyond the typical asset life described in Section 7.5. For this reason, PSC has included an estimate of end of life replacement costs in the assessment of lifetime costs when comparing HVDC alternatives for
the Grid West project, based on the following key assumptions:
The system will be de-commissioned and retired, not refurbished or have extension
of life strategies applied to it. These two strategies are possible although at this stage of evaluation it is not possible to identify which strategy would be implemented.
The DC cables need to be removed however the duct banks may remain
underground. This greatly simplifies the removal of cable by cutting at the joint bays, flushing out the bentonite and pulling the recovered cables through.
The net cost of removing the DC cable is zero. Based on the above assumption, the costs associated with removing the cable are likely to be of the order of, or less than,
the monies through the sale of the scrap metals.
The converter stations will be de-commissioned and all equipment, structures and
foundations above ground removed and disposed of. Any foundations or structures below ground will remain.
A scrap value of recovered and removed converter station equipment of zero.
7 http://www.elp.com/articles/2013/12/abb-wins-75-million-hvdc-order-in-north-america.html 8 http://www.electricityforum.com/news/may11/ABBwins20millionHVDCrefurbishmentorder.html

EirGrid Grid West Project
HVDC Technology Review
Page 97 of 123
A new converter of identical specification will be built in parallel with the aging asset
in the final three years of its operation and commissioned the year before the older asset is retired.
An allowance of €1.5m per converter station has been assumed. This figure is derived from
the experience of PSC staff in undertaking asset retirement assessments and after consideration of the above assumptions.
7.7 Lifetime Costs
The lifetime cost for a HVDC transmission scheme is the total cost of construction and operation through the entire life of the asset.
The lifetime costs of an HVDC system include:
1. Capex costs;
2. Opex costs;
3. Cost of losses;
4. Mid-life refurbishment; and
5. End of life replacement.
The lifetime cost does not include any savings due to wind generation displacing more expensive thermal generation.
Each of these costs can represented as an outgoing cash flow in the year that they are
incurred. Once the costs have been estimated over the life of the HVDC transmission scheme, a discounted cash flow analysis is performed to determine the present value (PV) of the lifetime costs of the HVDC asset.
Capex, opex, costs of losses, mid life refurbishment and end of life replacement costs have been described in Sections 7.2 - 7.6 above.
8. GRID WEST HVDC OPTIONS
In this chapter, PSC provides a high level review of options that could be considered for an
underground HVDC solution for the Grid West project. This review is based on the high level information provided by EirGrid and a desktop analysis only. No site visits, detailed engineering, studies or “bottom up” cost estimate has been developed. Cost analysis are
based on values located in the public domain. It should be noted that the determination of accurate cost estimates for HVDC projects can be difficult as reliable information associated with the cost of HVDC projects are rare in the public domain. PSC has considered available
information to short-list potential options and to identify an preferred solution.
The Grid West project is described in Section 1.2. The key considerations and characteristics of this project are repeated below:
The Grid West project HVDC solution will comprise a link with 500 MW capacity from the proposed North Mayo substation in County Mayo to the existing Flagford
substation in County Roscommon. This will require an N-1 security criteria where up to 500MW of DC transfer can be lost for a single contingency. The 500 MW loss will be picked up by generation reserves.
An ability to accommodate future requirements for North Mayo, including:
o An additional capacity of 1,000MW from the proposed North Mayo substation
in County Mayo to the existing Flagford substation in County Roscommon and/or from the proposed North Mayo substation to the existing Cashla

EirGrid Grid West Project
HVDC Technology Review
Page 98 of 123
substation in County Galway, driven by additional generation in the North Mayo area and security of supply requirements.
o Security criteria options will be considered in light of network reinforcement and security of supply benefits. The reinforcement options to meet the security of supply criteria will be considered when the need for network
reinforcement arises.
Cable routes as follows:
o Approximately 112.5km route length between North Mayo and the Flagford substation as shown in Figure 38; and
o Approximately 132km route length between North Mayo and the Cashla
substation.
To reduce environmental impact and for access to the cable for installation and
maintenance purpose, a route predominately in the public road has been selected, which will only leave the public road where necessary to cross infrastructure such as rivers and railway lines.
HVDC solutions based on 500 MW ‘building blocks’ were used for converters and cables to ensure that capital investment in line with the network needs. 500 MW is
not directly comparable to EirGrid’s standard 400 kV AC solution which uses 1,500 MW building blocks.
Figure 38 - Overview Map of Underground Cable Option
8.1 Available HVDC Undergrounding Options
8.1.1 Interaction with AC Network and Other HVDC Schemes
When evaluating the feasibility of the various options available in terms of HVDC technologies and configurations, the impact of each option on the AC system and the impact of the AC system on each option must be considered, as well as the possible interactions with other
HVDC schemes in the network.
EirGrid Grid West Project
HVDC Technology Review
Page 99 of 123
At this stage, the Grid West HVDC Link is expected to be a 500 MW HVDC scheme with an ability to accommodate future requirements for North Mayo to increase capacity of up to
1,500 MW.
With regards to short circuit ratio (SCR), it was noted in Section 6.2.1 that LCC HVDC schemes with low SCR (typically less than 2.5) can have AC/DC interaction problems whereas
VSC schemes have less reliance on the SCR level and can operate in a completely passive system with no generation, zero fault level, and zero SCR.
Considering the effect of SCR on any potential LCC options, a high level SCR review was carried out. For the review PSC assumed that:
The three-phase short-circuit current data sourced from EirGrid’s “10 Year
Transmission Plan” [65] does not include fault contributions by the Grid West project if implemented as an AC project.
The new 110 kV substation located at North Mayo will be normally connected just to wind generation (providing negligible fault current level). A 110 kV link from the North Mayo 110 kV substation to the existing local 110 kV network may be
developed. This link may be operated either open or closed. Note that as a result of this configuration:
o the North Mayo 110 kV substation can be asynchronously connected to Flagford 220 kV via the Grid West HVDC scheme (and to Cashla 220 kV through future augmentations).
o the wind generators can be synchronously operated with the rest of EirGrid’s network only if the North Mayo – local 110 kV network link is closed.
The weak AC system is represented by the summer valley demand of 2016 and 2019.
All AC circuits are connected i.e. if an AC line trips then the SCR will reduce and may require a runback for LCC converters.
Wind generators with power electronic converters will not significantly contribute to fault currents.
Shunt reactive support in the form of filters and switched capacitor banks and of the order of 50% of power transfer capacity are installed at the converter stations.
The synchronous condensers recommended in cases where additional reactive support is deemed necessary have a sub-transient reactance of 15% and a
transformer reactance of 10%.
Adding synchronous condensers at any one converter station does not significantly
increase the fault level at remote converter stations.
In order to use LCC technology in a Grid West HVDC scheme, an SCR of at least 2.5 is assumed to be required at each converter station. The results show that:
The North Mayo 110 kV bus has an SCR of zero, which is well below the SCR required for LCC operation with long cables. To allow LCC operation, synchronous condensers
could be added in the vicinity of North Mayo to improve the SCR. We estimate that approximately four 100 MVA synchronous condensers will be required to allow LCC operation at 500 MW for the Grid West project, and a further eight 100 MVA
synchronous condensers will be required to allow LCC operation at 1,500 MW for future augmentations.
The Flagford 220 kV bus has an SCR above 4.9 for a 500 MW converter for the Grid
West project, which will be adequate for LCC operation. However the SCR will fall to 2.2 for a 1,000 MW LCC converter, and we estimate that one 100 MVA synchronous
condenser will need to be added in the vicinity of Flagford to allow LCC operation at 1,000 MW for future augmentations.

EirGrid Grid West Project
HVDC Technology Review
Page 100 of 123
For a 1,000 MW converter station (future augmentations), the Cashla 220 kV bus has
an SCR above 3.0 which will be adequate for LCC operation.
In addition to the cost of the condensers, the impact on the fault levels must also be considered when evaluating the LCC option and studies will need to be performed to ensure
that the increased fault levels (particularly at Bellacorick 110 kV substation when the Bellacorick-North Mayo 110 kV connection is closed), do not result in fault currents in excess of the existing protection equipment ratings or do not introduce transient stability issues.
The design of the Grid West HVDC solution will need to take into account the interactions with other HVDC interconnectors in the EirGrid and Northern Ireland networks. At present these include the 500 MW Moyle Interconnector between Northern Ireland and Scotland, and
the 500 MW East-West Interconnector between Ireland and Wales. In addition, a 700 MW Celtic Interconnector has been proposed between Ireland and France.
Multiple HVDC interconnectors can co-exist in close proximity as demonstrated by the ten HVDC interconnectors presently operating in Scandinavia. However the control actions must be coordinated to avoid adverse interactions. The required modelling is often simplified and
there is always a risk that unexpected behaviour might occur due to over-simplified modelling, unforeseen network configurations, or maintenance errors. This coordination is studied in the planning and design stages of new interconnectors. Other factors to consider
include:
If the wind generation does not offer a frequency control function then asynchronous
operation of the North Mayo network will require frequency control via power modulation on the Grid West HVDC Link.
Potential for AC circuit overloads - AC circuit paths in series with Grid West HVDC link
may overload if one circuit in the path trips. When the Bellacorick-North Mayo 110 kV connection is closed, AC circuit paths in parallel with Grid West HVDC link may
overload if the HVDC link trips. This may require the use of generator run-back or special protection schemes to reduce power output of the wind generators following an HVDC link trip. The mal-operation of such schemes may create security of supply
issues, the risk of which needs to be mitigated through design of the scheme.
Sub-synchronous Interactions with Generators - Local long shaft thermal generators
may cause SSTI issues (in particular the thermal generation located at Tawnaghmore and Tynagh). There is also a possibility of SSTI issues between wind generators with power electronic converters and the HVDC converters. These can be mitigated during
the design phase by control action, provided accurate models are available for the thermal and wind generators.
From an SCR point of view, this suggests a VSC based scheme would be preferred for a Grid
West HVDC scheme and for any future augmentations.
To determine the actual level of reactive compensation required, the requirements and degree of need for run-back and special protection schemes and any sub-synchronous
interactions with generators, detailed studies as listed in Section 6.3 would be required.
8.1.2 Future Augmentation Considerations
The selection and comparison of HVDC undergrounding options for any future augmentations beyond the Grid West project will be driven by two key factors:
The potential for generation in the North Mayo area to increase beyond the initial 500MW capacity of the Grid West project (“North Mayo Generation Evacuation
Solution”).

EirGrid Grid West Project
HVDC Technology Review
Page 101 of 123
A consideration of options that reinforce the network in the North West to provide
increased operational flexibility and improve security of supply to Flagford (“Maximum Network Flexibility Solution”).
For the Grid West project PSC has considered an preferred solution for both the North Mayo
Generation Evacuation Solution and the Maximum Network Flexibility Solution. The selection of which is the best for the Grid West project will require additional studies and analysis.
8.1.3 HVDC Technology
PSC has considered the various HVDC technology options discussed in Section 2.1 and their
applicability to the Grid West project.
The application of LCC technology to the Grid West project was partly discussed in Section 8.1.1. The key concerns relate to the anticipated SCRs at the North Mayo end and to a lesser
degree at the Flagford end for higher transfers. This does not necessarily eliminate LCC technology as the SCR can be improved by the provision of synchronous condensers, however it is expected that the cost of such additional equipment, the potential to exceed
fault levels of existing AC equipment and the potential to introduce transient stability issues (the latter two issues requiring further detailed investigation) will eliminate any cost benefits of applying the LCC technology.
LCC technology has been in operation longer than VSC technology and therefore has more operational experience. In addition, LCC technology will have lower losses overall compared to current VSC designs. On the downside, LCC technology cannot utilise polymer cables
(which could be cheaper to install), has no passive network or black start capability in the event that the system is “islanded” on the 110kV network and operates at a “deadband” where power transfers below approximately 10% of the maximum rating are not possible.
LCC technology converter stations (and their associated synchronous condensers) take up significantly more area than VSC stations. Ease of construction and unfavourable geotechnical
conditions may favour a smaller converter station footprint.
VSC technology on the other hand can easily connect to the weak network (low SCR) at North Mayo. It can also be provided with black start capability which will help start up the wind
generators from a dead network. VSC technology can provide dynamic reactive support for the AC system at both ends of the link and could utilise polymer cables (potentially cheaper to install). VSC technology does not have the “deadband” associated with LCC technology and
has a smaller “footprint” (requires less land than the LCC equivalent). On the downside, VSC will have higher converter station losses than an equivalent LCC scheme and has less operational experience than LCC technology.
It should be noted that both LCC technology and VSC technology offer a very limited short term overload capacity compared with an AC line, primarily due to the small thermal time constant of the valves.
8.1.4 Scheme Configuration
The various scheme configurations described in Section 2.2 are considered here in terms of
their applicability to the Grid West project.
The monopole configuration may be suited to the Grid West project, where only 500MW
capacity is required, however it will not satisfy the requirement for future augmentations as there is no redundancy, so a trip of the HVDC converter or cable will necessarily cause an outage of the entire link. This configuration may also require an earth return path and for
continuous permanent operation may require a metallic return, significantly increasing the cable costs for very little benefit in terms of power flow.

EirGrid Grid West Project
HVDC Technology Review
Page 102 of 123
The bipole configuration allows for the easy staging of the proposed HVDC link into 500MW stages. In this case, both HVDC cables could be installed during the Grid West project,
temporarily using the second cable as a metallic return while it is initially operated as a monopole for 500MW. When operating as a bipole after future augmentations (1,000MW), this configuration allows for 50% redundancy as one pole can continue to operate in the
event of a single pole outage, provided ground return operation is allowed temporarily or the cable of the failed pole can be used as a metallic return. Temporary overloads designed into
the scheme could reduce the frequency and voltage effects of a single pole outage for a period of time to allow the AC network to react.
Symmetric monopoles have in the past only been considered when using VSC technology,
mostly due to the application of this configuration with LCC technology having a high cost with little incremental benefit. When using VSC technology, this configuration offers reduced voltage stress on the interface transformers and the associated lower costs and improved
reliability. The required cables would be smaller in size (and cheaper on a per cable basis) than the cable required for a monopolar system of the same power level.
8.1.5 HVDC Cables
The selection of HVDC cables depends on both the selection of HVDC technology and scheme configuration. The use of LCC technology only allows for the use of mass impregnated cables,
whereas selection of VSC technology opens up the possibility of the use of polymer cables which are lighter and less expensive than the mass impregnated cables. The scheme
configuration will determine the current carrying capacity required of the HVDC cables and higher power transfers may limit the ability to do this with a single cable using the DC voltages and conductor sizes currently in use.
For the Grid West project, the proposed converter station locations (North Mayo and Flagford) are located a considerable distance from the shore. Submarine cable route options considered were deemed to be least preferred during a separate study on underground cable
routes.
As discussed in Section 4.3.1, the determination of the conductor type and size to be used depends on a number of project specific factors, including the DC voltage, required power
transfer, method of burial and/or installation, ground temperature, thermal resistivity of the surrounding soil and climate. The conductor size is also dependent on the selection of conductor material – aluminium has a lower conductivity than copper and therefore
aluminium conductors will require a larger cross sectional area than copper conductors for the same current rating. At higher current/power requirements, copper may be selected due to the practicality of handling and installing smaller cable. Copper may also be selected over
aluminium where high tensile strength is required – for example, land cables to be pulled in a long run.
As detailed in Section 7.2.3, mass impregnated land cables can be considerably more
expensive than polymer land cables. This can be for a number of reasons, including the lower maximum operating temperature (requiring a larger cable and/or more imported backfill) and
difficulties in handling and installing these larger cables. The cost difference places the use of LCC technology at a disadvantage in this instance.
PSC has been advised that the land cable routes between North Mayo and Flagford (and
between North Mayo and Cashla for future augmentations) require the cables to be installed within the road. This will require a significant amount of reinstatement of the roads after the cables have been installed. This has been addressed in the determination of cable cost
estimates provided in Section 7.2.3.

EirGrid Grid West Project
HVDC Technology Review
Page 103 of 123
8.2 Appropriate Options
8.2.1 Options Considered
Based on the considerations provided in Section 8.1, the options considered for the Grid West project are listed below. The shortlist comprises one VSC and one LCC technology solution for
each of the North Mayo Generation Evacuation Solution and Maximum Network Flexibility Solution described in Section 8.1.2.
1. Option 1 (VSC – Maximum Network Flexibility Solution)
a. Grid West project – 500 MW VSC Monopole North Mayo – Flagford (112.5 km), using a 2nd 500 MW cable as metallic return
b. Future augmentations – Turn the Grid West project into a VSC bipole 2 x 500
MW, using the 2nd cable. Also build a new 2 x 500 MW VSC bipole North Mayo – Cashla (125 km)
2. Option 2 (VSC – North Mayo Generation Evacuation Solution)
a. Grid West project- 500 MW VSC Symmetric Monopole North Mayo – Flagford (112.5 km)
b. Future augmentations – Build a new 2 x 500 MW VSC bipole North Mayo –
Cashla (125 km)
3. Option 3 (LCC - Maximum Network Flexibility Solution)
a. Grid West project – 500 MW LCC Monopole North Mayo – Flagford (112.5 km), using a 2nd 500 MW cable as metallic return
b. Future augmentations – Turn the Grid West project into a LCC bipole 2 x 500
MW, using the 2nd cable. Also build a new 2 x 500 MW LCC bipole North Mayo – Cashla (125 km)
4. Option 4 (LCC – North Mayo Generation Evacuation Solution)
a. Grid West project – 500 MW LCC Monopole North Mayo – Flagford (112.5 km), with a low voltage metallic return cable
b. Future augmentations – Build a new 2 x 500 MW LCC bipole North Mayo –
Cashla (125 km)
All LCC options are based on 450kV underground cables whereas all VSC options are based on 320kV cables.
A comparison of the high level cost estimates for each stage for all four options, along with a qualitative assessment of the pros and cons of each option and a high level lifetime cost, is provided in Table 18.
The estimated capex values in Table 18 represent the EPC construction costs and development costs discussed and presented in Chapter 7 of this report. These costs are not
discounted. The lifetime costs include the capital cost (allocated over a number of years according to the assumptions in Section 8.2.3) as well as opex, cost of losses and refurbishment costs (described in Sections 7.3, 7.4 and 7.5 of this report), and are discounted
over a 25 year period using a discount rate as stated in in Section 8.2.3.
8.2.2 Scoping and Cost Assumptions
PSC has considered the following high level assumptions when determining options for the Grid West project:
Based on HVDC technology and configurations commercially available and with either
operational experience or currently under construction.

EirGrid Grid West Project
HVDC Technology Review
Page 104 of 123
No network studies were performed for this desktop study. No costs for any required
AC network augmentations, run-back schemes or special protection schemes have been included.
The cost estimates are based on the high level “ballpark” figures presented in
Chapter 7 of this report.
The cost estimates include the cost of synchronous condensers where required.
The cost of the connection assets at Flagford and North Mayo, including the 110kV collection network, new 110kV North Mayo GIS substation and AC cables connecting
the converter stations near Flagford to the 220kV Flagford substation are not included. These costs are assumed to be the same for all options.
The cost per MW for a bipole VSC system compared to a symmetric monopole system is assumed to be 20% higher due to the requirement to have separate buildings, have transformers rated for DC voltage stresses, control and protection systems and
additional switching.
For bipole options, it is assumed that in the event of an outage of one pole, either:
o the converters can operate in monopole mode with ground return for a suitable period of time so that the AC network can achieve a secure state; or
o Switching arrangements are in place to use the cable of the failed pole as a
metallic return, even if the pole cable has a cable fault.
Therefore no dedicated metallic return cables have been included in either stage.
The costs for mitigations required to allow safe ground return operation for some bipole options during single pole outages have not been included. Such mitigations can include insulated joints, cathodic protection systems, additional sacrificial
material near/to the anodes, electrical isolation gaps for railway lines and/or the replacement of metallic conductors used in telecommunication circuits with either
fibre optic cables encased in plastic or by using radio links.
For the option that has an XLPE metallic return cable, an allowance of € 300k/km has been used to represent the incremental cost of installing the second cable.
The 110kV connection between the Bellacorick substation and the North Mayo substation is a normally open point.
Adding synchronous compensators only increases the fault level at the local converter, and does not affect the fault level at the remote converter.
The antipcated need for future augmentations is included with the pricing for the Grid West project, assumed to be required 10 years after the completion of the Grid West
project.
8.2.3 Lifetime Cost Assumptions
In the determination of lifetime costs, PSC has made the following assumptions:
The estimated lifetime cost includes the estimated project capex (timing assumptions described below), plus estimated annual amounts for opex, cost of losses,
refurbishment and end of life replacement as covered in Chapter 7 of this report.
The estimated lifetime cost excludes any savings due to wind generation displacing
more expensive thermal generation.
To determine the annualised cost of losses, all options are based on an Equivalent
Hours Loss Factor (LsF) of 10% and a cost of energy losses of €60.66 per MWh as described in Section 5.1.
Capital costs are allocated evenly over a three year EPC contract period.

EirGrid Grid West Project
HVDC Technology Review
Page 105 of 123
A period for the determination of lifetime costs of 50 years from commencement of
operation of the Grid West project. This means that lifetime costs are evaluated for a total of 55 years which includes two years of project development and three year EPC contract period.
The discount period of 50 years is greater than the typical asset life described in Section 7.6, therefore end of life replacement and retirement costs have been
included in the lifetime costs when comparing HVDC alternatives.
The anticipated future augmentations have been included in the lifetime analysis and
are assumed to be completed 10 years after the Grid West project is completed. Lifetime analysis has been performed both with and without future augmentations.
All VSC solutions are assumed to use the latest Multilevel Modular Converter (MMC)
technology.
A figure of €5M p.a. has been used to cover the annual O&M costs for symmetric
monopole and monopolar converter configurations. To reflect some increase in O&M costs anticipated for additional converters (e.g. bipolar configuration or addition of a
second monopole), an uplift of 50% of this figure has been applied to the O&M costs for each additional converter pair.
O&M costs are assumed the same for VSC and LCC technology.
O&M costs have been increased by 25% after the completion of the anticipated future augmentations.
A discount rate of 5.2% pa as used as advised by EirGrid.

EirGrid Grid West Project
HVDC Technology Review
Page 106 of 123
Table 18 - Grid West - Comparison of Options
Option Option Description
Estimated
Capex Grid West
project
(M€)
Estimated
Capex Future
Augmentations
(M€)
Estimated Lifetime
Cost Grid West
Project
Only - PV (M€)
Estimated LifetimeCost
Grid West + Future
Augmentations -
PV (M€)
Advantages Disadvantages
1
VSC – Maximum Network Flexibility Solution Grid West project – 500 MW VSC
monopole North Mayo -Flagford, using a second 500 MW cable as metallic return
Future augmentations – Turn the
Grid West project into a VSC bipole 2 x 500 MW, using the second cable.
Also build a new 2 x 500 MW VSC bipole North Mayo -Cashla
Security of Supply:
o Grid West project – 500 MW capacity with 500 MW N-1 risk
o Future augmentations – 1,500
MW capacity with 0 MW N-1 risk (2,000 MW installed)
Land polymer cables:
o Grid West project - cables 2 x 320 kV, 1,000 MW, North Mayo -Flagford
o Future augmentations - cables 2 x 320 kV, 1,000 MW, North Mayo -Cashla
507 833 527 1,046
Provides network
reinforcement and higher security of supply for the AC network
No requirement for additional reactive support (e.g. synchronous condensers).
Can provide black start capability if required.
Can provide reactive power
support independent of power flows across HVDC link.
Less land required (smaller “footprint”).
Future technology options
remain open for the North Mayo-Cashla component for
future augmentations.
Higher converter station losses.
Less operational experience than LCC technology and VSC
symmetric monopole configuration.
Additional DC switching required
to switch cables for monopole operation following completion of future augmentations
The transformers are subjected to DC stresses with the asymmetric VSC configuration.
2
VSC – North Mayo Generation Evacuation Solution
Grid West project – 500 MW VSC symmetric monopole North Mayo -Flagford
Future augmentations – 2 x 500 MW
VSC bipole North Mayo -Cashla
Security of Supply o Grid West project – 500 MW
357 695 396 817
No requirement for additional
reactive support (e.g. synchronous condensers).
Can provide black start
capability if required. Can provide reactive power
support independent of
power flows across HVDC link.
Higher converter station losses.
Less operational experience than LCC technology.
Additional DC switching required
for future augmentations to switch cables for monopole operation (North Mayo-Cashla
bipole) The transformers for the stage

EirGrid Grid West Project
HVDC Technology Review
Page 107 of 123
Option Option Description
Estimated Capex
Grid West project (M€)
Estimated Capex
Future Augmentations
(M€)
Estimated Lifetime
Cost
Grid West Project
Only - PV (M€)
Estimated LifetimeCost Grid West +
Future Augmentations -
PV (M€)
Advantages Disadvantages
capacity with 500 MW N-1 risk o Future augmentations – 1,500
MW capacity remaining at 500 MW N-1 risk
Land polymer cables: o Grid West project - cables 2 x
320 kV, 500 MW, North Mayo –
Flagford o Future augmentations - cables
2 x 320 kV, 1,000 MW, North Mayo -Cashla
Less land required (smaller
“footprint”). Future technology options
remain open for the North
Mayo-Cashla component fior future augmentations.
two asymmetric VSC are
subjected to DC stresses.
3
LCC – Maximum Network Flexibility
Solution Grid West project – 500 MW LCC
monopole North Mayo -Flagford,
using a second 500 MW cable as metallic return
Future augmentations – Turn the
Grid West project into a LCC bipole 2 x 500 MW, using the second cable. Also build a new 2 x 500 MW LCC
bipole North Mayo -Cashla Network Reinforcement (included in
capex):
o Grid West project – Four 100MVA synchronous condensers at North Mayo.
o Future augmentations – An
additional eight 100MVA synchronous condensers at
North Mayo, and one 100 MVA synchronous condenser at Flagford.
Security of Supply:
o Grid West project – 500 MW
513 784 530 1,018
Lower converter station losses.
More operational experience than VSC technology.
Provides network
reinforcement and higher security of supply for the AC network
Requires significant reactive
support at the North Mayo end (Grid West project) and all three converter stations (future
augmentations). No black start capability. No reactive support capability.
Additional reactive plant may increase fault levels beyond the
rating of existing AC equipment. Active power deadband - power
transfers below approximately
10% of the maximum rating are not possible.
Larger area of land required
(larger “footprint”).

EirGrid Grid West Project
HVDC Technology Review
Page 108 of 123
Option Option Description
Estimated Capex
Grid West project (M€)
Estimated Capex
Future Augmentations
(M€)
Estimated Lifetime
Cost
Grid West Project
Only - PV (M€)
Estimated LifetimeCost Grid West +
Future Augmentations -
PV (M€)
Advantages Disadvantages
capacity with 500 MW N-1 risk o Future augmentations – 1,500
MW capacity with 0 MW N-1 risk (2000 MW installed)
Land mass impregnated cables: o Grid West project - cables 2 x
450 kV, 1,000 MW, North Mayo
-Flagford o Future augmentations - cables
2 x 450 kV, 1,000 MW, North Mayo -Cashla
4
LCC – North Mayo Generation
Evacuation Solution Grid West project – 500 MW LCC
monopole North Mayo -Flagford with
low voltage metallic return. Future augmentations - Build a new 2
x 500 MW LCC bipole North Mayo-Cashla.
Network Reinforcement (included in
capex): o Grid West project – Four
100MVA synchronous condensers at North Mayo.
o Future augmentations – An
additional eight 100MVA synchronous condensers at
North Mayo. Security of Supply
o Grid West project – 500 MW
capacity with 500 MW N-1 risk o Future augmentations – 1,500
MW capacity with 500 MW N-1 risk
Land mass impregnated cables:
422 687 450 864
Lower converter station losses.
More operational experience
than VSC technology.
Requires significant reactive support at the North Mayo end (Grid West project) and all three
converter stations (future augmentations).
No black start capability.
No reactive support capability. Additional reactive plant may
increase fault levels beyond the rating of existing AC equipment.
Active power deadband - power
transfers below approximately 10% of the maximum rating are not possible.
Larger area of land required
(larger “footprint”).

EirGrid Grid West Project
HVDC Technology Review
Page 109 of 123
Option Option Description
Estimated Capex
Grid West project (M€)
Estimated Capex
Future Augmentations
(M€)
Estimated Lifetime
Cost
Grid West Project
Only - PV (M€)
Estimated LifetimeCost Grid West +
Future Augmentations -
PV (M€)
Advantages Disadvantages
o Grid West project - cables 1 x
450 kV 500 MW, North Mayo-Flagford with 1 x low voltage metallic return
o Future augmentations - cables 2
x 450 kV, 1,000 MW, North Mayo –Cashla

EirGrid Grid West Project
HVDC Technology Review
Page 110 of 123
8.3 Evaluation of Options
The analysis summarised in Table 18 shows that option 2 has the lowest estimated capex for the Grid West project, the lowest estimated total capex (the Grid West project and future augmentations combined) and the lowest estimated lifetime cost (both for the Grid West
project and after the implementation of future augmentations).
As discussed in Section 8.1.2, PSC has considered two possible solutions – a Maximum Network Flexibility Solution and a North Mayo Generation Evacuation Solution. When
comparing the VSC and LCC options for each of these solutions, the VSC technology is option is the lowest cost in terms of capex and lifetime cost for both the North Mayo Generation Evacuation Solution and Maximum Network Flexibility Solutions when only the Grid West
project is considered. This is primarily due to the requirement for more expensive and larger mass impregnated cables and for significant reactive support for LCC technology options as explained in Section 8.1.1. Also as described in Section 8.1.1, studies will need to be
performed to ensure that the increased fault levels due to the additional synchronous condensers do not exceed the existing protection equipment ratings or do not introduce transient stability issues. These issues favour a VSC technology solution for the Grid West
project.
In the case of the Maximum Network Flexibility Solution however, the LCC has a lower estimated lifetime cost when the future network augmentations are factored in. This is due to
the future augmentations having less capital cost for the LCC option than for the VSC option as well as the increased effect of losses on the lifetime cost as the power rating of the whole
scheme is increased. In general, LCC becomes more cost effective as the power rating increases.
The VSC options have more inherent advantages within them for the Grid West project than
the LCC options. In particular, implementing a VSC solution will provide the flexibility to incorporate black start capability into the HVDC scheme which will help start wind generators from a dead network or blackstart the 110 kV network in Mayo from Flagford (or Cashla
following completion of future augmentations) and to provide additional reactive support independent of power flows across the HVDC scheme. There is no requirement to install a high number of synchronous condensers and therefore limits the risk of issues due to an
increased fault level or transient stability issues and additional ongoing costs of these new items of plant. The VSC option will also not require significant AC filtering, significantly reducing the amount of land required for the converter stations.
When comparing VSC options 1 and 2, option 1 (Maximum Network Flexibility Solution) has a significantly higher capital cost (for both the grid West project and for future augmentations) and a higher lifetime cost, but with the benefit of reinforcing the AC network and providing a
greater degree of security of supply. On completion of the anticipated future augmentations, the Maximum Network Flexibility Solution ensures that zero power transfer is at risk under an
N-1 condition of the loss of one HVDC pole either between North Mayo and Flagford or between North Mayo and Cashla. The North Mayo Generation Evacuation Solution focuses on making sure there is enough capacity to evacuate power out of the North Mayo area as the
generation increases but, after future augmentations have been completed, in the event of the loss of one HVDC pole (North Mayo to Cashla) or the HVDC link (North Mayo to Flagford), up to 500MW of transfer capacity will be lost and will need to be picked up by generation
reserves.
Subject to the limitations of this desktop analysis and based on the information provided to PSC, it is PSC’s view that:
o Option 1 is the preferred option for the Maximum Network Flexibility Solution; and
o Option 2 is the preferred option for the North Mayo Generation Evacuation Solution.
These solutions are described in more detail in Section 8.4.

EirGrid Grid West Project
HVDC Technology Review
Page 111 of 123
8.4 High Level Preferred Option
8.4.1 Maximum Network Flexibility Solution (Option 1)
The preferred option for the Maximum Network Flexibility Solution is a VSC technology solution configured, following completion of future augmentations, as two separate bipole
HVDC schemes between North Mayo and Flagford and between North Mayo and Cashla. The scope of this option is described below:
Grid West project
o A new converter station at North Mayo with a 500MW VSC monopole converter station installed.
o A new converter station at Flagford with a 500MW VSC monopole converter station installed.
o 2 x 320kV, 1,000MW land polymer cables installed between North Mayo and
Flagford, installed in the roads requiring road reinstatement.
o The second 320kV cable will initially be used as a metallic return cable.
Future augmentations
o A new 500MW VSC bipole installed at the North Mayo converter station.
o A new 500MW VSC bipole installed at the Flagford converter station.
o A new 1,000MW VSC bipole installed at the North Mayo converter station.
o A new converter station at Cashla with a 1,000MW VSC bipole installed.
o 2 x 320kV, 500MW (per pole) land polymer cables installed between North
Mayo and Cashla, installed in the roads requiring road reinstatement.
A simplified single line diagram for this option is presented in Figure 39 for the Grid West Project and Figure 40 for future augmentations.
Figure 39 - Preferred Option – Grid West Project – Maximum Network Flexibility Solution
North Mayo 110 kV AC
Flagford 220 kV AC
Flagford 500 MW
Converter
+ 320 kV DC 110 km Land Cable
North Mayo 500 MW
Converter
Grid West Project
Srananagh 220 kV AC Circuit
Louth 220 kV AC Circuit
Cashla 220 kV AC Circuit

EirGrid Grid West Project
HVDC Technology Review
Page 112 of 123
Figure 40 - Preferred Option – Future Augmentations – Maximum Network Flexibility Solution
North Mayo 110 kV AC
Flagford 220 kV AC
Future Augmentation: VSC Bipole
Cashla 220 kV AC
North Mayo 2 X 500 MW
Converter
Cashla 2 X 500 MW
Converter
+/- 320 kV DC 125 km Land
Cable
Flagford – Cashla 220 kV AC Circuit
Tynagh 220 kV AC Circuit
Prospect 220 kV AC Circuit
Srananagh 220 kV AC Circuit
Louth 220 kV AC Circuit
North Mayo 2 X 500 MW
Converter
+/- 320 kV DC 110 km Land
Cable
Flagford 2 X 500 MW Converter
Future Augmentation: Conversion to VSC Bipole
For the Grid West project, a VSC monopole from North Mayo to Flagford will provide a 500
MW non-firm capacity. The two 320kV cables installed will provide for the future bipole in future augmentations whilst providing a metallic return path during this stage and avoiding the need for a ground return path/electrodes. This configuration allows for a second 500MW
pole to be built between North Mayo and Flagford in future augmentations.
For future augmentations, the addition of a second 500MW pole between North Mayo and Flagford and the new 2 x 500 MW VSC bipole from North Mayo to Cashla will increase the
overall Grid West capacity to 2,000 MW, with an N-1 firm capacity of 1,500 MW. This assumes that in the event of a single pole outage North Mayo to Cashla, ground return can
be temporarily used or the cable of the failed pole can be used as a metallic return. Temporary overloads designed into the scheme could reduce the voltage effects of a single pole outage for a period of time to allow the AC network to react.
A high level cost estimate for the Grid West Project component of option 1 is provided in Table 19.

EirGrid Grid West Project
HVDC Technology Review
Page 113 of 123
Table 19 - Maximum Network Flexibility Solution – Preferred Option 1 – Grid West Project - High Level Cost Estimate
Cost Category Estimate
(€m)
Development Costs
Development Costs 17.2
EPC Costs9
Converter Stations 137.16
HVDC Land Cable 298.01
Non-EPC Costs
Third Party Payments, Advisors Fees, other EirGrid Costs, Public Consultation, Network Integration etc.
40.08
Interest During Construction
IDC 14.10
Total 506.55
8.4.2 North Mayo Generation Evacuation Solution (Option 2)
Based on this high level review, the preferred option for the North Mayo Generation
Evacuation Solution is a VSC technology solution configured as a 500MW symmetric monopole between North Mayo and Flagford for the Grid West project and a bipole HVDC
scheme between North Mayo and Cashla for future augmentations. The scope of this option is described below:
Grid West project
o A new converter station at North Mayo with a 500MW VSC symmetric monopole converter station installed.
o A new converter station at Flagford with a 500MW VSC symmetric monopole converter station installed.
o 2 x 320kV, 500MW land polymer cables installed between North Mayo and
Flagford, installed in the roads requiring road reinstatement.
Future Augmentations
o A new 1,000MW VSC bipole installed at the North Mayo converter station.
o A new converter station at Cashla with a 1,000MW VSC bipole installed.
o 2 x 320kV, 500MW (per pole) land polymer cables installed between North
Mayo and Cashla, installed in the roads requiring road reinstatement.
A simplified single line diagram for this option is presented in Figure 41for the Grid West Project and Figure 42 for future augmentations.
9 Note these costs exclude the 110 kV AC switchgear required to collect the wind generation and the 220 kV AC switchgear required to connect back into the meshed network at Flagford, but do include costs for the HVDC transformers (HVDC/110 kV at North Mayo and HVDC/220 kV at Flagford).

EirGrid Grid West Project
HVDC Technology Review
Page 114 of 123
Figure 41 - Preferred Option – Grid West Project – North Mayo Generation Evacuation Solution
North Mayo 110 kV AC
Flagford 220 kV AC
Flagford 500 MW
Converter
+/- 320 kV DC 110 km Land Cable
North Mayo 500 MW
Converter
Grid West Project
Srananagh 220 kV AC Circuit
Louth 220 kV AC Circuit
Figure 42 - Preferred Option – Future Augmentations – North Mayo Generation Evacuation Solution
North Mayo 110 kV AC
Future Augmentation
Cashla 220 kV AC
North Mayo 2 X 500 MW
Converter
Cashla 2 X 500 MW Converter
+/- 320 kV DC 125 km Land
Cable
Flagford – Cashla 220 kV AC Circuit
Tynagh 220 kV AC Circuit
Prospect 220 kV AC Circuit
For the Grid West project, a VSC symmetric monopole from North Mayo to Flagford will
provide a 500 MW non-firm capacity. This configuration offers reduced voltage stress on the interface transformers and the associated lower costs and improved reliability. The required
cables would be smaller in size (and cheaper on a per cable basis) than the cable required for a monopolar system of the same power level.
For future augmentations, the addition of a 2 x 500 MW VSC bipole from North Mayo to
Cashla will increase the overall Grid West capacity to 1,500 MW, with an N-1 firm capacity of 1,000 MW. This assumes that in the event of a single pole outage North Mayo to Cashla, ground return can be temporarily used or the cable of the failed pole can be used as a
metallic return. Temporary overloads designed into the scheme could reduce the voltage effects of a single pole outage for a period of time to allow the AC network to react.
A high level cost estimate for the Grid West Project component of option 2 is provided in
Table 20.

EirGrid Grid West Project
HVDC Technology Review
Page 115 of 123
Table 20 - North Mayo Generation Evacuation Solution – Preferred Option 2 – Grid West Project - High Level Cost Estimate
Cost Category Estimate
(€m)
Development Costs
Development Costs 17.2
EPC Costs10
Converter Stations 114.30
HVDC Land Cable 171.45
Non-EPC Costs
Third Party Payments, Advisors Fees, other EirGrid Costs, Public Consultation, Network Integration etc.
40.08
Interest During Construction
IDC 14.10
Total 357.13
8.4.3 Land Requirements
At the converter stations, the estimated land size required for the converter stations is as follows:
Grid West project – approximately 5.0-5.5 acres at each of the North Mayo site and the Flagford site.
Future augmentations – An additional 8.0-8.2 acres at North Mayo and a new site of 8.0-8.2 acres at the Cashla site.
The cable trench requirements for both the link between North Mayo and Flagford and between North Mayo and Cashla will be similar to that shown in Figure 43. The difference may be in terms of distance between the pole cables. For an option utilising symmetric
monopole configuration, the symmetric monopole cables are installed close together as there is no redundancy between the cables anyway. For the bipole some consideration should be given for a separation distance between the cables (shown as “X” in Figure 43) depending on
the outcome of a risk review. The likelihood of cables being dug up in the middle of the road without anyone knowing about it is less than if the cables were installed in the shoulder or on
other private or public land.
10 Note these costs exclude the 110 kV AC switchgear required to collect the wind generation and the 220 kV AC switchgear required to connect back into the meshed network at Flagford, but do include costs for the HVDC transformers (HVDC/110 kV at North Mayo and HVDC/220 kV at Flagford).

EirGrid Grid West Project
HVDC Technology Review
Page 116 of 123
Figure 43 - Typical Trench Profile for Symmetric Monopole or Bipole Configuration
8.4.4 High Level Project Timeline
The time for the design, manufacture, construction and commissioning of the HVDC scheme
will depend on a number of factors, including the specific supplier/OEM, any factory “bottlenecks” at the time, the workload of the design and engineering team, availability of equipment etc. However, Figure 44 provides a high level estimate of the expected project
duration for the Grid West project for either preferred option. The assumptions applied here are:
Specification, tendering and contract award – 18 months – comprised of 10-12
months to develop a technical specification and undertake required studies (route planning, environmental, electrical studies etc.), 4 months for vendors to submit bids
and 2-4 months for bid analysis and negotiation.
Design and manufacture – 18 months - Similar projects have reported periods from
12 months through to 18 months for design and manufacture of VSC projects.
Construction – 36 months – Based on the 26 months reported for EWIC for the
installation of land cables (70km) and 30 months for INELFE (60km). PSC has assumed that a significant amount of this time is attributed to preparatory works and that a degree of efficiency is gained over time and has added an allowance of 6
months for the additional 50-60km of land cable. The converter station construction is assumed to be 24 months and to fall within this period.
Commissioning – 3 months – Based on prior experience of PSC staff with the
commissioning of VSC systems.
Some degree of overlap is anticipated between design, manufacture and construction
is assumed possible.

EirGrid Grid West Project
HVDC Technology Review
Page 117 of 123
Figure 44 - High Level Project Duration Estimate - Preferred Solution – Grid West Project Only
9. GLOSSARY AND ACRONYMS
AC Alternating current
Black start capability The ability to operate the HVDC converter station without relying on the connected AC transmission network.
CAPEX Capital expenditure
CCC Capacitive Commutated Converters – A variation of LCC
EMTP Electro Magnetic Transient Program – Specialist software used for performing fast transient studies e.g to identify potential issues
with switching or faults within or close to the HVDC scheme.
EWIC East West Interconnector
Harmonic currents Sinusoidal currents defined by their frequency relative to the
fundamental frequency (50 Hz). i.e third harmonic currents are sinusoidal with a frequency of 150 Hz.
HVDC High voltage direct current
IGBT Insulated Gate Bipolar Transistors
kA Kilo Ampere
kV Kilo Volt
LCC Line commutated converter – Sometimes referred to as “conventional” HVDC or “classic” HVDC.
MMC Modular multi-level converters
MRTB Metallic Return Transfer Breaker
MT Multi-terminal
OHL Overhead line
OPEX Operational expenditure
PWM Pulse width modulation
Reactive power Reactive power is required in AC systems to support the transfer of real power. It is associated with stored energy in the magnetic or electric field of AC power system components. Some HVDC
converter stations have a high requirement for reactive power which must be supplied from the AC system.
Real power Real or active power is the component of the apparent power that
performs work.
SCR Short circuit ratio
Specification, Tendering &
Contract Award
Design and Manufacture
Construction & Installation
Commissioning
Year 1 Year 2 Year 3 Year 4 Year 5 Year 6

EirGrid Grid West Project
HVDC Technology Review
Page 118 of 123
VSC Voltage Source Converter – Sometime referred to as HVDC “Light” or HVDC “Plus”
XLPE Cross Linked Polyethelyene cable insulation material.

EirGrid Grid West Project
HVDC Technology Review
Page 119 of 123
10. REFERENCES
[1] M. Jeroense, A. Gustafsson, M. Bergvist, “HVDC Light® Cable System Extended to
320kV”, CIGRE 2008
[2]
ABB, “HVDC Light® – It’s time to connect”, December 2012, Available:
http://www05.abb.com/global/scot/scot221.nsf/veritydisplay/2742b98db321b5bfc1257b26003e7835/$file/Pow0038%20R7%20LR.pdf
[3] B. D. Railing, G. Moreau, J. Wasborg, D. Stanley, J. J. Miller, Y. Jiang-Häfner, “The Directlink VSC-Based HVDC Project And Its Commissioning”, CIGRE 2002
[4] I. Mattsson, B.D. Railing, B.Williams, G. Moreau, C. D. Clarke, A. Ericsson, J.J. Miller, “Murraylink, The Longest Underground HVDC Cable In The World”, CIGRE 2004
[5]
Parsons Brinckerhoff report – “Cavan-Tyrone And Meath-Cavan 400kV Transmission Circuits - Comparison Of High Voltage Transmission Options: Alternating Current Overhead And Underground, And Direct Current Underground - Final Report” -
February 2009
[6]
Allan, PG, “Selecting Appropriate Cable Burial Depths – A Methodology”, IBC
Conference on Submarine Communications. The Future of Network Infrastructure, Cannes, November 1998
[7] CIGRE Technical Brochure 398 “Third-Party Damage to Underground and Submarine Cables - Working Group B1.21”, December 2009
[8] Prysmian document, “Giulio Verne Cable Laying Ship Specification”, February 2004
[9] Trans Bay Cable – Addendum - http://www.ci.pittsburg.ca.us/pittsburg/pdf/tbc_addendum/0-TOC.htm
[10] Alstom Grid, “HVDC Connecting to the future”, First Edition, 2010
[11] Cigre Technical Brochure 202, “WG 14.26 - HVDC Stations Audible Noise”, CIGRE 2002
[12] Cigre Technical Brochure 269, “VSC Transmission”, WG B4.37, April 2005
[13] Bex, M Carter, L Falla, T Field, M Green, A Koelz,P Nesbitt, M Piekutowski, T Westerweller – “Basslink HVDC Design Provisions Supporting AC System Performance”, CIGRE 2006
[14] M. BACCHINI T. WESTERWELLER N. KELLEY, R. GRAMPA, M. MARELLI – “200 kV DC extruded cables crossing the San Francisco Bay”, CIGRE 2010
[15]
IEC 60853-2 “Calculation of the Cyclic and Emergency Current Ratings of Cables,
Part 2: Cyclic rating of cables greater than 18/30 (36)kV and emergency ratings for cables of all voltages”
[16] CIGRE Technical Brochure 247 “Optimization Of Power Transmission Capability Of
Underground Cable Systems Using Thermal Monitoring”, April 2004
[17]
D.A.N. Jacobson, P. Wang, C. Karawita, R. Ostash, M. Mohaddes, B. Jacobson,
“Planning the Next Nelson River HVDC Development Phase Considering LCC vs. VSC Technology”, CIGRE 2012.
[18] P. E. Marken, , J. P. Skliutas, Member, IEEE, P.Y. Sung, K.S. Kim, H.M. Kim, L.H.
Sailer, and R.R. Young, “New Synchronous Condensers for Jeju Island”, IEEE 2012
[19] Ryosuke HATA, “Solid DC Submarine Cable Insulated with Polypropylene Laminated Paper (PPLP)”, SEI Technical Review · Number 62 · June 2006
[20] L.N. BRAND M. ECCLES, “Transition from Project Delivery to Operation of HVDC

EirGrid Grid West Project
HVDC Technology Review
Page 120 of 123
Facilities”, CIGRE SCB4 Colloquium 2011.
[21] L. Aanerud, G. Balog, K. Bjorlow-Larsen, “A Survey Of Installation And Repair
Techniques Presently In Use For Submarine Cables”, CIGRE 1990.
[22] Xavier Bourgeat, “Offshore Repair Of The IFA 2000 Cross-Channel Link”, Electra No 213, April 2004
[23] Cigre Technical Brochure 496, “Recommendations for Testing DC Extruded Cable Systems for Power Transmission at a Rated Voltage up to 500 kV”, April 2012.
[24] CIGRE Technical Brochure 492, “VSC HVDC for Power Transmission – Economic Aspects and Comparison with other AC and DC Technologies”, April 2012
[25] G. Persson, V. Lescale and A. Persson, “HVDC Capacitor Commutated Converters in
Weak Networks”, ABB Sweden, December 2010
[26] D. A. Woodford, “HVDC Transmission”, Manitoba HVDC Research Centre, March 1998
[27] TransGrid Solutions Inc. “Investigating the Impact of HVDC Schemes in the Irish Transmission Network”, Oct 2009
[28]
CIGRE Joint Working Group C4/B4/C1.604, “ Influence of Embedded HVDC
Transmission on System Security and AC Network Performance”, Technical Brochure 536, April 2013
[29]
T. Magg, M. Manchen, E. Krige, J. Wasborg and J. Sundin, “Connecting Networks
with VSC HVDC in Africa: Caprivi Link Interconnector”, IEEE PES Power Africa 2012 Conference and Exposition, July 2012
[30]
P. Labra Francos, S. Sanz Verdugo, H. Fernandez Alvarez, S. Guyomarch and J.
Loncle, “ INELFE – Europe’s first integrated onshore HVDC interconnection”, IEEE PES General Meeting, July 2012
[31]
N. Nayak, R. P. Sasmal, Y. K. Sehgal, M. Rashwan; G. Flisberg, “Technical
Feasibility and Research & Development Needs for ± 1,000 kV and above HVDC System”, CIGRE 2010
[32] Siemens AG Energy Sector, “The Bulk Way”, Available: http://www.energy.siemens.com/hq/en/power-transmission/hvdc/hvdc-ultra/
[33]
J. Dorn, E. OGEE, D. Retzmann and F. Schettler, “Combined AC/DC Transmission
Systems – Benefits and Prospects of Innovative Multilevel VSC Technologies”, CIGRE B4-115-2014
[34] M. Callavik, A. Blomberg, J. Hafner and B. Jacobson, “The Hybrid HVDC Breaker”,
ABB Grid Systems Technical Paper, Nov 2012
[35] CIGRE Technical Brochure No. 186, “Economic Assessment of HVDC Links”, June 2001
[36] Siemens AG Power Transmission and Distribution, “HVDC – Proven Technology for Power Exchange”
[37]
J. Egan, et al., “Overview of the 500 MW EirGrid East-West Interconnector,
considering System Design and Execution-Phase Issues”, International Universities’ Power Engineering Conference, August 2013
[38] J. Egan, “East West Interconnector”, Presentation to the ABB Technical Seminar,
May 2014
[39] Parsons Brinkerhoff, “Tyrone-Cavan Interconnector Second ES Addendum –
Appendix 3.1”, February 2009, Available: http://www.nie.co.uk/documents/NS/TCInt_2ndES_Addendum/Appendix-3-1-PB-

EirGrid Grid West Project
HVDC Technology Review
Page 121 of 123
Power-Report.aspx
[40] Parsons Brinkerhoff, “Electricity Transmission Costing Study”, January 2012,
Available: http://www.theiet.org/factfiles/transmission-report.cfm
[41]
G. Persson, “HVDC Converter Operations and Performance, Classic and VSC”, ABB Presentation, September 2011, Available: http://www.sari-
energy.org/PageFiles/What_We_Do/activities/HVDC_Workshop_Sep_2011/presentations/HVDC%20Converter%20Operations%20and%20Performance,%20Classic%20
and%20VSC_ABB.pdf
[42] IEC 60919-1, “Performance of high-voltage d.c. (HVDC) systems. Part 1: Steady-state conditions”, December 1988
[43] M. Bennett, N. Dhaliwal and A. Leirbukt, “A Survey of the Reliability of HVDC Systems Throughout the World During 2009 – 2010”, CIGRE Advisory Group B4.04, 2012
[44] N. Dhaliwal , M. Bennett and A. Leirbukt, “The Reliability of HVDC Systems Throughout the World From 1997 – 2008”, CIGRE Advisory Group B4.04, 2011
[45] CIGRE Technical Brochure 406, “HVDC Converter Transformers – Design Review,
Test Procedures, Ageing Evaluation and Reliability in Service”, February 2010
[46] S. Dodds, B. Railing, K. Akman, B. Jacobson, T. Worzyk and B. Nilsson, “HVDC VSC (HVDC Light®) transmission – operating experiences”, CIGRE 2010
[47] IEEE Std 1240-2000, “Guide for the Evaluation of the Reliability of HVDC Converter Stations”, August 2000
[48] CIGRE Technical Brochure 508, “HVDC Environmental Planning Guidelines”, October 2012.
[49]
Long, W.F.; Reeve, J.; McNichol, J.R.; Holland, M. S.; Taisne, J.-P.; Lemay, J.;
Lorden, D.J., "Application aspects of multiterminal DC power transmission," Power Delivery, IEEE Transactions on , vol.5, no.4, pp.2084,2098, Oct 1990.
[50]
Long, W. F.; Reeve, J.; McNichol, J.R.; Harrison, R. E.; Fletcher, D. E.; Bowles, J.P.,
"Consideration for Implementing Multiterminal DC Systems," Power Apparatus and Systems, IEEE Transactions on , vol.PAS-104, no.9, pp.2521,2530, Sept. 1985.
[51]
Ingemansson, D.; Wheeler, J.D.; MacLeod, N.M.; Gallon, F.; Ruiton, O., "The South — West scheme: A new HVAC and HVDC transmission system in Sweden," AC and DC Power Transmission (ACDC 2012), 10th IET International Conference on , vol.,
no., pp.1,5, 4-5 Dec. 2012.
[52] CIGRE Technical Brochure 533, “HVDC Grid Feasibility Study”, April 2013.
[53]
Francos, P.L.; Verdugo, S.S.; Alvarez, H.F.; Guyomarch, S.; Loncle, J., "INELFE —
Europe's first integrated onshore HVDC interconnection," Power and Energy Society General Meeting, 2012 IEEE , vol., no., pp.1,8, 22-26 July 2012.
[54] CIGRE Technical Brochure 484, “Impact of HVDC Stations on Protection of AC
Systems”, December 2011.
[55]
E. Zaccone, “HVDC transmission cable systems: state of the art and future trends”, ICC Meeting Subcommittee C – Cable Systems, 17-20 May 2009, Orlando.
http://www.pesicc.org/iccwebsite/subcommittees/subcom_c/Presentations/2009Spring/C-4-HVDCTransmissionCableSystems-Zaccone.pdf.
[56] “Electric cables handbook”, 3rd edition, ed. G. F. Moore, BICC Cables. Oxford:
Blackwell Science, 1997.
[57] Giovanni Mazzanti, Massimo Marzinotto, “Extruded cables for high-voltage direct-current transmission: advances in research and development”. Hoboken, New

EirGrid Grid West Project
HVDC Technology Review
Page 122 of 123
Jersey: Wiley, 2013.
[58]
Prysmian Cables and Systems, “Submarine Energy Systems”, Brochure available:
http://australia.prysmiangroup.com/en/business_markets/markets/hv-and-submarine/downloads/Brochures/
[59] CIGRE Technical Brochure 496, “Recommendations for Testing DC Extruded Cable
Systems for Power Transmission at a Rated Voltage up to 500 kV”, April 2012
[60] Prysmian Group, “Western HVDC Link”, Article available:
http://prysmiangroup.com/en/corporate/about/special_projects/western-HVDC-link/
[61] Mazzoldi, F.; Taisne, J.P.; Martin, C.J.B.; Rowe, B.A., "Adaption of the Control Equipment to Permit 3-Terminal Operation of the HVDC Link between Sardinia,
Corsica and Mainland Italy," Power Engineering Review, IEEE, vol.9, no.4, pp.87, 1989.
[62] Cigre Technical Brochure 484, “Impact of HVDC Stations on Protection of AC
Systems”, WG B5/B4.25, December 2011.
[63] De Boeck, S.; Tielens, P.; Leterme, W.; Van Hertem, D., "Configurations and earthing of HVDC grids," Power and Energy Society General Meeting (PES), 2013
IEEE , vol., no., pp.1,5, 21-25, July 2013.
[64] Basslink, “2009 Reliability Review Draft Report Response Letter”, November 2012, Available:
http://www.energyregulator.tas.gov.au/domino/otter.nsf/LookupFiles/095595_Basslink_Pty_Ltd_Submission_to_the_2009_Reliability_Review_Draft_Report.pdf/$file/095595_Basslink_Pty_Ltd_Submission_to_the_2009_Reliability_Review_Draft_Report.
[65] EIRGRID; SONI, “Ten Year Transmission Forecast Statement 2013”, 2013, Available:
http://www.eirgrid.com/media/TenYearTransmissionForecastStatement2013.pdf
[66] DC Interconnect, Inc Report, “Feasibility of Using HVDC Technology For Reinforcing
the Interior to Lower Mainland Transmission Grid”, BCTC Reference No.: 300209, June 2007
[67] de Toldeo, P.F. “Feasibility of HVDC for City Infeed”, Licentiate Thesis, Royal
Institute of Technology, Department of Electrical Engineering, Electric Power Systems, Stockholm 2003
[68] L. P. Lazridis, “Economic Comparison of HVAC and HVDC Solutions for Large
Offshore Wind Farms under Special Consideration of Reliability”, Master’s Thesis – Royal Institute of Technology, Stockholm, 2005
[69] Transpower, HVDC Inter-Island Link Upgrade Project - Investment Proposal - Part V
– Project Costs, 2005 available at: https://www.ea.govt.nz/dmsdocument/180
[70] Gustafson, M.W, Baylor, J.S. “The Equivalent Hours Loss Factor Revisited”, IEEE, November 1988
[71] CIGRE, “Development of ± 160 kV XLPE Cable and its Application to the World’s First Three-terminal VSC HVDC System in China”, 2014, available at: http://www.cigre-thailand.org/tncf/events/aorc2014/full_paper/1110R.pdf
[72] T. WESTERWELLER, K. FRIEDRICH, U. ARMONIES, A. ORINI, D. PARQUET, S. WHEN – “Trans bay cable – world's first HVDC system using multilevel voltage-
sourced converter”, CIGRE 2010
[73] Tobin, “6424 - EWIC Trench & Full Road Surface Dressing Cost Estimate.pdf”, Provided by email: S Meagher, “FW: Road restoration costs”, 30-10-2014
http://australia.prysmiangroup.com/en/business_markets/markets/hv-and-submarine/downloads/Brochures/

EirGrid Grid West Project
HVDC Technology Review
Page 123 of 123
[74] Tobin, “6424 Local Roads 4m wide cway - Trench & Full Road Reinstatement Costing-Poor ground.pdf”, Provided by email: S Meagher, “FW: Road restoration
costs”, 30-10-2014.
[75] Parsons Brinckerhoff Report – “Cavan-Tyrone And Meath-Cavan 400kV Transmission Circuits - Technology and Costs Update - Addendum to the 2009
Report and Supplementary Note” – July 2013. Available: http://www.eirgridprojects.com/media/PB%20Power%20Report.pdf