Gresham’s Energy Independence Challenges and Successes
46
1 Gresham’s Energy Independence Challenges and Successes Alan Johnston, Senior Engineer, Wastewater Services Division
Transcript of Gresham’s Energy Independence Challenges and Successes

1
Gresham’s Energy Independence Challenges and Successes
Alan Johnston, Senior Engineer, Wastewater Services Division

Gresham’s Wastewater Treatment Plant
114,000 service population (Gresham, Fairview, Wood Village) 20 mgd annual average capacity; 13 mgd current flowrate Secondary, Activated Sludge, Anaerobic Digestion, BFP, Chlorination/
Dechlorination. Discharges to Columbia River WWTP and PS O&M provided under contract with Veolia Water 16 FTE in Operations & Maintenance (Veolia Water) 3 FTE in WWTP and PS Engineering (Gresham)

3
Energy Discussion Items
Gresham’s Sustainability Policy (carbon footprint reduction)
400 kw Cogeneration
420 kw Peak DC Solar plant
MicroHydro in our Outfall Pipeline
FOG Receiving Station (under construction)
Energy Conservation (Linear Motion Mixers, Neuros Blowers)
WWTP Energy Consumption and Production Data
Energy Management Plan (Keep it simple)
Power Monitoring
Lofty Goal: Energy Independence by FY 2015/16?

4
Gresham’s Sustainability Policy
Adopted by Gresham City Council in 2009.
“The City of Gresham will strive to design and deliver services that:
Support a stable, diverse and equitable economy.
Promote community health and well-being, outdoor recreation, cultural awareness, and encourage learning.
Protect and improve the quality of the air, water, land and other natural resources by reducing human impacts and increasing public awareness of the valuable services the environment provides.”

5
Gresham’s Sustainability Policy Key Goals
1) 80% Reduction in City Greenhouse Gas Emissions by 2050
2) 100% Renewable Energy by 2030
3) Zero Waste in City Operations by 2020
4) Ongoing Protection of Natural Resources (including water quality and availability, and habitat)
5) Toxin Reduction and Eventual Elimination
This discussion involves Goals 1 and 2 at the WWTP.

6
Gresham Cogeneration History
250 kw Waukesha cogenerator installed 1987 with digesters
No biogas treatment over its lifetime
Turned off 2003/04 due to sudden continued internal corrosion
400 kw Lean Burn Caterpillar cogenerator started 2005
Installed in same footprint as Waukesha
H2S/Siloxane/moisture removal system incorporated

7
400 kw CAT Cogenerator

8
Cogeneration by the Numbers
93% Runtime since 2005 (off about 48 hours per month)
Produces power and heats buildings with jacket water heat
Haven’t put a number to the financial benefits of the heat
50,000+ Operating Hours (no engine overhaul yet)
17,000,000+ kwh of power production
2.6 cents per kwh operation/maintenance expenses
An oil change and spark plugs is $3,200 bimonthly, or so
Sample your oil starting at 1000 hrs runtime.
50% of WWTP Power needs
$1.5 million in avoided electrical costs.
3.5 year payback

9
Cogeneration Financing
City’s first Design-Build contract
Engine ordered during schematic design phase.
Allowed start-up 6-8 months earlier than possible with conventional design-bid-build (resulting in >$100k in energy production and savings)
ODOE BETC Grant, Energy Trust Grant
Certified Capital Cost $1,128,633 less BETC Partner $287,801 less Energy Trust Grant $82,379 Total Capital Cost $758,453 Annual Power Savings $275,000 Annual O&M $40,000 Payback 3.5 years

10
Biogas Scrubbing
9000 scfh Design Flow (7000 scfh at 400 kw engine output)
H2S Scrubbing Tank (Change media as needed)
Booster Blower (Design in redundancy)
Heat exchanger (Chill gas to 40 F)
Moisture Removal
Heat Exchanger (Heat gas to 70 F)
Siloxane Tank (Change media once per year)
Treated Biogas to Engine or boiler

11

12

13
Biogas Scrubbing

14
Biogas Scrubber Media
Largest Cost of the treatment system
H2S Media replaced every 60-120 days, varies widely.
H2S media changed when treated biogas > 100 ppm H2S
Siloxane media Changed every year (switch tanks 6 months)
1 per year siloxanes testing, unreliable and expensive
Storage required for media so it is ready to go
Change oil (if needed) when media is replaced for ½ day outage.
$10,000 per H2S Media Changeout (3 per year)
$6,000 per Siloxane Media Changeout (1 per year)

15
Biogas Scrubber Media

16
Cogen/Gas Scrubber Maintenance Cost Summary
Summary of Costs: Total City Labor Cumul. Maintenance Media Uptime Total Cumul. Cost Cost
Period (calendar year) Costs Costs Incentive Costs Costs ¢/kwh ¢/kwh 2005 (Start 11/05) $ 131.25 $ - $ - $ 131.25 $131.25 0.03 2006 $ 24,138.83 $ - $0.00 $ 24,138.83 $24,270.08 0.77 0.68 2007 $ 59,271.45 $ 5,644.00 $8,061.55 $ 72,977.00 $97,247.08 2.30 1.44 2008 $ 98,542.27 $ 7,953.00 $10,822.81 $ 117,318.08 $214,565.16 4.09 2.23 2009 $ 117,073.31 $ 10,262.00 $8,036.77 $ 135,372.08 $349,937.24 4.35 2.75 2010 $ 52,481.72 $ 10,262.00 $4,566.55 $ 67,310.27 $417,247.51 2.13 2.62 Total: $ 351,638.83 $ 34,121.00 $ 31,487.68 $ 417,247.51 Average: $ 58,606.47 $ 5,686.83 $ 5,247.95 $ 69,541.25 2.62

Audience Poll Question
17
If you have a cogen system, do you have a biogas scrubber?

18
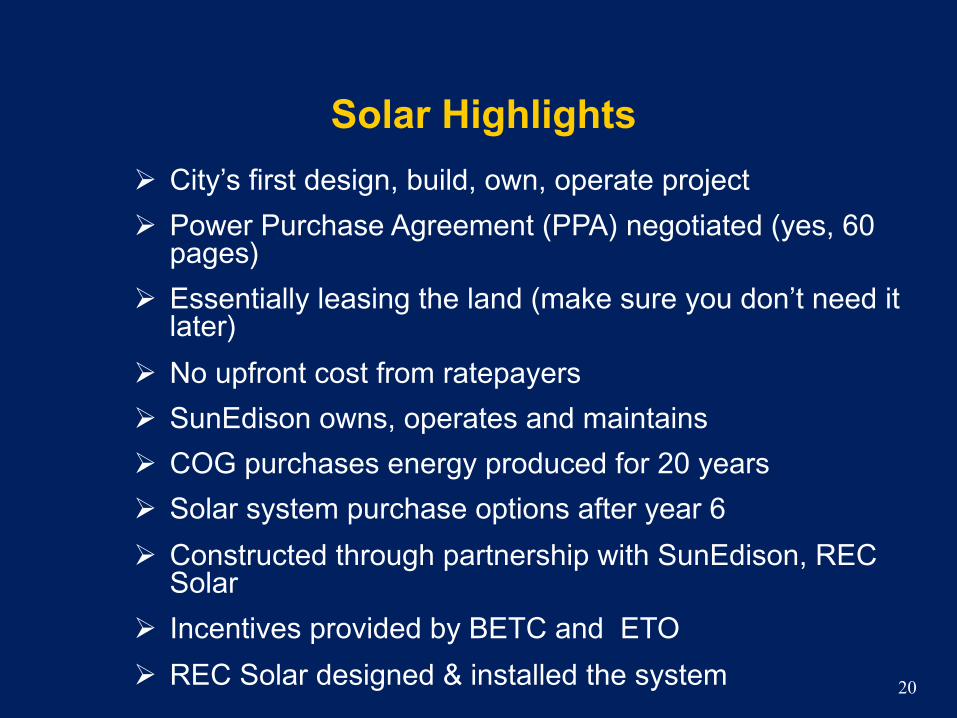
Solar Update
420 kW peak capacity
1 acre ground-mounted system
RFP issued in April 2008
Power Purchase Agreement signed with Tioga in Oct. 2008
Transferred to SunEdison in July 2009
Installation completed in Dec. 2009
PGE net metering agreement
No capital cost to City
First year kwh charge 2/3 PGE
Fixed annual escalation

19
Solar Layout
20
Solar Highlights
City’s first design, build, own, operate project
Power Purchase Agreement (PPA) negotiated (yes, 60 pages)
Essentially leasing the land (make sure you don’t need it later)
No upfront cost from ratepayers
SunEdison owns, operates and maintains
COG purchases energy produced for 20 years
Solar system purchase options after year 6
Constructed through partnership with SunEdison, REC Solar
Incentives provided by BETC and ETO
REC Solar designed & installed the system

21
Solar Website
System monitoring website required of PPA
Realtime kw, Kwh, insolation, temperature
Monthly Invoice generation
Calculates CO2, NOX, SO2 avoided
www.my.sunedison.com
Public login, UN: gresham.kiosk, PW: Gresham@wwtp1
Show website!

22
Solar By The Numbers
420 kw Peak DC Capacity
Payback in years = 0
Capital Cost to City = $0
O&M Costs to City = $0
COG purchases energy produced for 20 years
2010 Power Production 450,181 kwh
2011 Power Production 437,116 kwh
Average Monthly Solar Invoice $2,200
Average Monthly avoided utility cost $1,100
Produced 8% of WWTP demand in 2011

Audience Poll Question
23
Is your organization interested in solar power?

24
MicroHydroPower
Produce power from a 36 foot (annual average) gravity fall
60 kw Frances Turbine, 600 rpm, 480 v
Install Powerhouse near shore of Columbia River
Permitting has been and still is lengthy
Water Rights permit from State (Done)
FERC Permit (conduit exemption) for powerhouse (Done, took about 2 years)
Flood Plain Development Permit for flood plain construction (pending)
Levee encroachment permit with Drainage District (pending)
Still evaluating grant options and feasibility of project
Looking at public/private ownership options

25
MicroHydroPower

26
MicroHydroPower

27
MicroHydroPower Funding
Estimated Capital Cost $905,477 less BETC Partner $153,000 less Energy Trust Grant $360,000 Net Capital Cost $392,477 Annual Power Income $41,000 Annual O&M $7,500 Payback 12 years
Annual power production 450,000 kwh
Revenues from PGE Schedule 201
Kwh purchase varies linearly from $.04 in 2012 to $.11 in 2032, 20 year contract.
Annual O&M estimated at $7,500
Frances Turbine Cost $385,000
Expected Turbine Life 25 years

Audience Poll Question
28
Would you go forward with the MicroHydro project?

29
Small Wind Power
Quite windy in Gresham (near Columbia River gorge)
Prefeasibility Study Completed (100% ETO)
Feasibility Study Underway $18,000 (50% ETO)
Early Paybacks aren’t promising
Technology always changing
Public/private partnership?
More to Come!

30
2 Energy Efficiency Projects Energy Efficiency Study financed by ETO
Replace gas mixing system (3 - 40 hp compressors)
Install Linear Motion Mixers (LMM) for both digesters
Each LMM has 20 hp motor and VFD
Currently operating at 75% speed or 15 hp.
Essentially trading 80 hp 24 hrs/day for 30 hp 24 hrs/day
Replace 2 Hoffman mutistage blowers (100 hp each)
Install 2 Neuros Turbo blowers (100 hp each)
Operating curves are much more efficient
50% variable speed turndown
Air bearings

31
2 Energy Efficiency Projects

32
100 hp Neuros Blowers

33
Linear Motion Mixer Floating Cover Digester
Show Video!

34
Linear Motion Mixer Floating Cover Digester

35
Linear Motion Mixer (Inside Digester)
HydroDisk Diameter 8 feet
Travel (up and down) 20 inches
30 cycles/minute

36
Energy Efficiency By the Numbers
Project Cost $1,000,000 (estimated at $600k)
Energy Trust Incentive $272,115
BETC $220,000
Capital Cost $507,885
Energy Savings
Linear Motion Mixing 412,375
Neuros Blowers/Diffusers 437,983
850,358 kwh per year
$58,270 per year
Approximate payback 8 years

37
FOG Receiving Station
12,000 gallon receiving tank
Tank Mixing Pump and FOG injection pump
Projected 30 - 50% increase in gas production

38
FOG Receiving Station Financing
FOG Feasibility Study Completed with OECDD grant
$1,000,000 Phase 1 Construction under way
$40,000 Energy Trust Grant
FOG Hauler RFP advertising this week
Anticipated $20,000 per month tipping fee revenue
$3,000,000 Phase 2 Cogeneration under design
Anticipated 2-3 mil kwh per year additional production
$20,000 per month avoided utility costs
Anticipated 7 year payback

39
Energy Management Plan
Keep it simple
Select Energy Team Members (Ops, engineering, maintenance, etc)
Meet Monthly for 1 hour and talk only energy
Update Monthly energy production and consumption numbers every month
Look and discuss trends
Select and evaluate projects
Stay on track!
Assign projects to team members
Keep Running agenda in EMP
Update plan monthly (keep it alive!)

40
Energy Management Plan
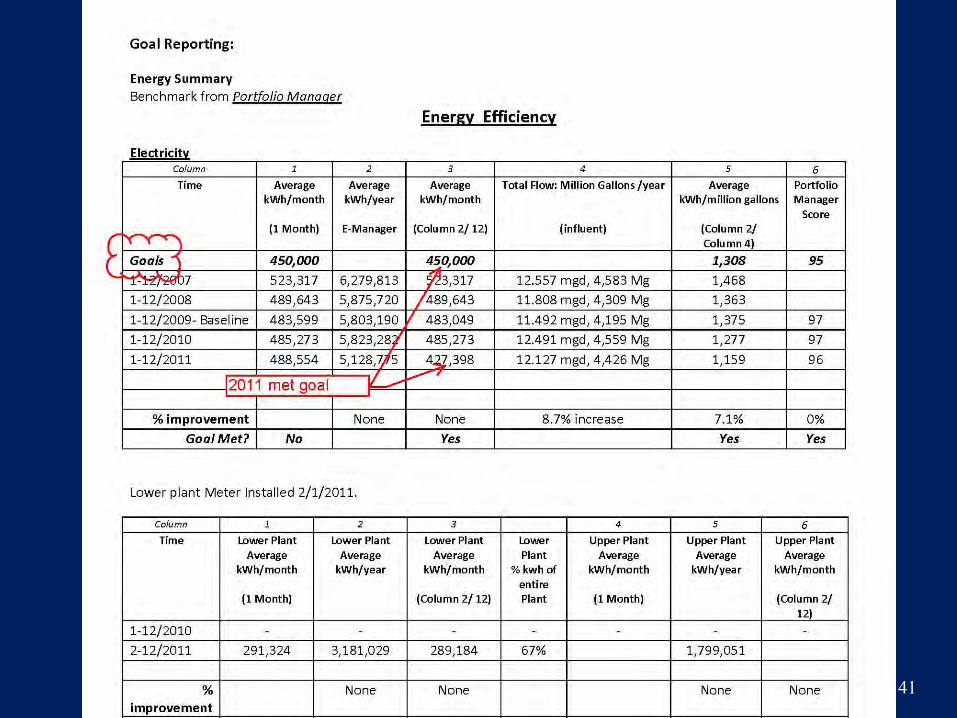
41
Energy Management Plan

42
Power Monitoring Monitor, store and evaluate power consumption
PGE meter, lower plant, cogen, solar
Data sent by cell to PGE E-manager website
http://www.portlandgeneral.com, search “E-manager”
About $60/month per unit

43
Energy Accomplishments Since 2005 18,000,000 Kwh produced by cogeneration
1,000,000 kwh produced by Solar
55% of WWTP power needs generated on site
Over 26 billion gallons treated without a permit violation
Approximately $10,000,000 in Capital Projects built
6.2 mil kwh 2006, 5.4 mil kwh 2011
13% reduction in energy consumption
50% increase in energy production
76% of energy from sustainable sources
Cogeneration 50%
Solar 8% since 2010
Clean Wind program through PGE 18% since 2008
Completed ACWA Sustainable Energy Training in 2011

44
Energy Accomplishments Since 2005
0
1,000,000
2,000,000
3,000,000
4,000,000
5,000,000
6,000,000
7,000,000
2006 2007 2008 2009 2010 2011
An
nu
al k
Wh
Year
2006-2011 Consumption Summary
PGE kWh Cogen kWh Clean Wind kWh Solar kWh

45
Next Steps
1. Energy Management Team Meetings Monthly
2. FOG Receiving Facilities, Complete June, 2012
3. FOG Hauler Contract May, 2012
4. Cogeneration expansion, Complete May 2014
5. Evaluate Future Energy Projects Ongoing
6. Energy Independent 2015 ?

46
Questions & Answers
Alan Johnston, Senior Engineer, Wastewater Services Division