Gregory J. Fleming - Morgan Stanley · Gregory J. Fleming President of Morgan ... future results of...
26
Credit Suisse 2015 Financials Conference Gregory J. Fleming President of Morgan Stanley Wealth Management and Morgan Stanley Investment Management February 10, 2015
Transcript of Gregory J. Fleming - Morgan Stanley · Gregory J. Fleming President of Morgan ... future results of...

Credit Suisse 2015 Financials ConferenceGregory J. FlemingPresident of Morgan Stanley Wealth Management and Morgan Stanley Investment ManagementFebruary 10, 2015

2
The information provided herein may include certain non-GAAP financial measures. The reconciliation of such measures to the comparable GAAP figures are included in this presentation and in the Company’s most recent Annual Report on Form 10-K, Quarterly Reports on Form 10-Q and Current Reports on Form 8-K, as applicable, which are available on www.morganstanley.com.
This presentation may contain forward-looking statements. You are cautioned not to place undue reliance on forward-looking statements, which speak only as of the date on which they are made, which reflect management’s current estimates, projections, expectations or beliefs and which are subject to risks and uncertainties that may cause actual results to differ materially. The Company does not undertake to update the forward-looking statements to reflect the impact of circumstances or events that may arise after the date of forward-looking statements. For a discussion of risks and uncertainties that may affect the future results of the Company, please see the Company’s most recent Annual Report on Form 10-K, Quarterly Reports on Form 10-Q and Current Reports on Form 8-K, as applicable, which are available on www.morganstanley.com. This presentation is not an offer to buy or sell any security.
Please note this presentation is available at www.morganstanley.com.
Notice

• Wealth Management: Performance and Growth
• Fast Changing Industry and World
• Technology as a Competitive Advantage
• Broadening the Banking & Lending Platform
3
1
2
3
4
Agenda

4
Wealth Management: Performance and Growth1

22-25%
5
Wealth Management Pre-Tax Margin (%) Wealth Management Pre-Tax Earnings ($MM)
Optimizing Margin Discipline While Making Investments to Drive Growth
6%9% 10%
14%
18%20%
2009 2010 2011 2012 2013 2014 4Q15
$536
$1,063 $1,252
$1,765
$2,604
$2,985
2009 2010 2011 2012 2013 2014
(3)
(1),(2)
(4)
(3)
(1),(2)
(1) Pre-tax margin is a non-GAAP financial measure that the Company considers useful for investors to assess operating performance. Pre-tax margin represents income (loss) from continuing operations before taxes (“pre-tax earnings”) divided by net revenues.
(2) All periods have been recast to exclude the Managed Futures business, which is now reported in the Investment Management business segment. Additionally, the periods 2009-2013 have been recast to exclude the International Wealth Management business, currently reported in the Institutional Securities businesssegment.
(3) Pre-tax margin and pre-tax earnings for 2012 exclude $193 million of non-recurring costs associated with the Morgan Stanley Wealth Management integration and the purchase of an additional 14% stake in the joint venture.
(4) The attainment of these margins in 2015 may be impacted by external factors that cannot be predicted at this time, including macroeconomic and market conditions and future regulations.
1 Wealth Management Focus on Margin AND Growth

6
Fast Changing Industry and World2

7
0
100
200
300
400
500
600
700
Sep-94 Sep-96 Sep-98 Sep-00 Oct-02 Oct-04 Nov-06 Nov-08 Nov-10 Dec-12 Dec-14
Nasdaq Composite S&P 500
Trajectory of U.S. Equity Markets(Sep 1994 – Dec 2014)
Index 100 = September 1, 1994 Dotcom Bubble
• Time Period: March 11, 2000 – October 9, 2002
• Market Decline: Nasdaq down 78%, S&P down 45%
Credit Crisis
• Time Period: July 1, 2007 – March 9, 2009
• Market Decline: Nasdaq down 51%, S&P down 55%
Nasdaq Index Level: 1,114 S&P Index
Level: 677
Nasdaq Index Level: 5,048
S&P IndexLevel: 777
S&P IndexLevel: 1,527
Nasdaq Index Level: 1,269
Nasdaq Index Level: 2,859
S&P IndexLevel: 1,565
(1)
(1) Data sourced from Yahoo Finance and Capital IQ.
2 Volatility Drives Need for Financial Advice

8
(1) In 2004, Wirehouses included Citigroup, Merrill Lynch, Morgan Stanley, UBS and Wachovia. In 2010 and 2013, Wirehouses included Bank of America Merrill Lynch, Morgan Stanley, UBS and Wells Fargo. Cerulli Associates, Advisor Metrics 2013: Understanding and Addressing a More Sophisticated Population and Advisor Metrics 2006.
(2) 2004 and 2010 industry fee-based asset data sourced from Cerulli Associates, Managed Accounts 2013: Moving Toward a Single Platform Environment data and sourced from The Cerulli Edge – Managed Accounts Edition, 1Q 2014 issue.
(3) Wirehouse deposits sourced from company and FDIC filings for 2010 and 2013. Merrill Lynch deposits for 2010 and 2013 are based on Morgan Stanley internal estimates. Wirehouse deposits for 2004 are based on Morgan Stanley internal estimates from limited available data and pro forma for the mergers that occurred between Wachovia and Wells Fargo and Merrill Lynch and Bank of America.
$1,187
$2,154
$3,459
2004 2010 2013
2004–2013 Wirehouse Fee-Based Assets ($Bn)
$280
$450
$524
2004 2010 2013
2004-2013 Wirehouse Deposits ($Bn)(1),(2) (1),(3)
Wealth Management Industry – Growth in Fee-Based Assets and Deposits

9
Other
2004
Transactional
Asset Management
Net Interest Income
Wirehouse Revenue Mix (%) (1),(2),(3)
2013
(1) Illustrative; not to scale.(2) In 2004, Wirehouses included Citigroup, Merrill Lynch, Morgan Stanley, UBS and Wachovia. In 2013, Wirehouses included Bank of America Merrill Lynch, Morgan
Stanley, UBS and Wells Fargo.(3) Wirehouse revenue mix sourced from company filings.
Other
Net Interest Income
Transactional
Asset Management
Change in Revenue Mix Reflects Move to Advice-Driven Model
10(1) Data sourced from Singularity Technologies.
Time Required for Mainstream Adoption
Accelerating Mainstream Adoption of Technology Creates Powerful Growth Opportunity
11
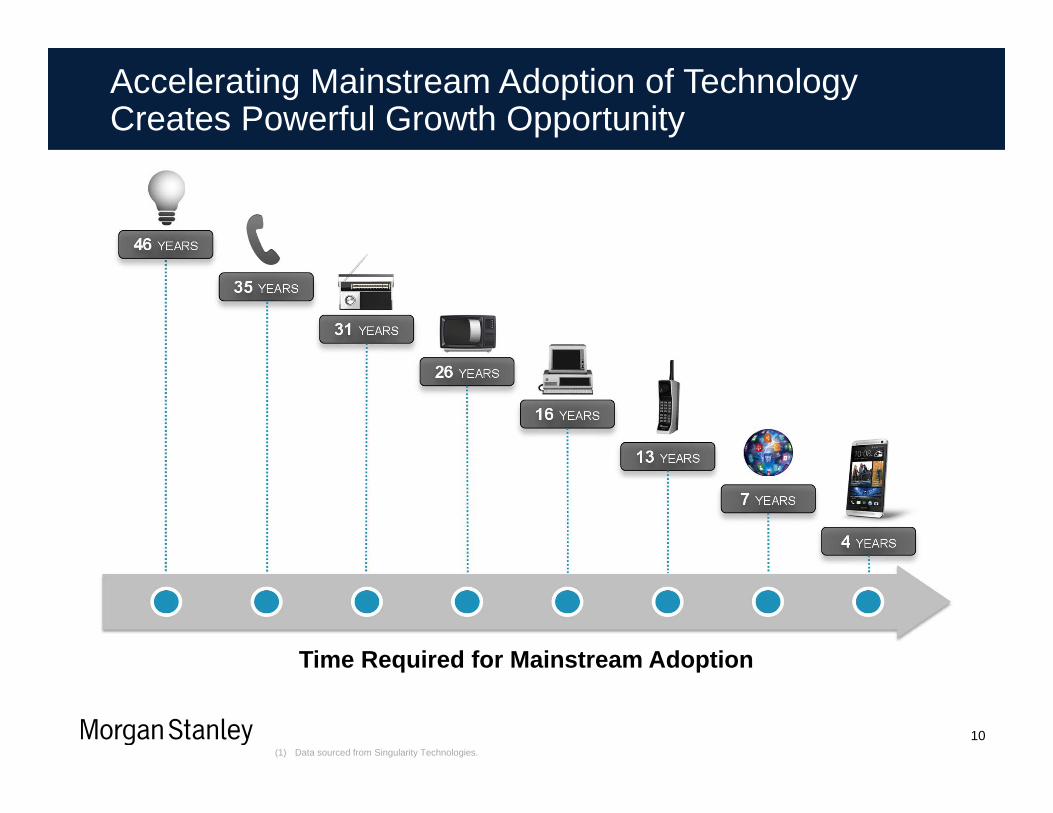
20052005 20132013St. Peter’s Square
Impact of Technology Everywhere: Clients, Advisors and Business Models

12
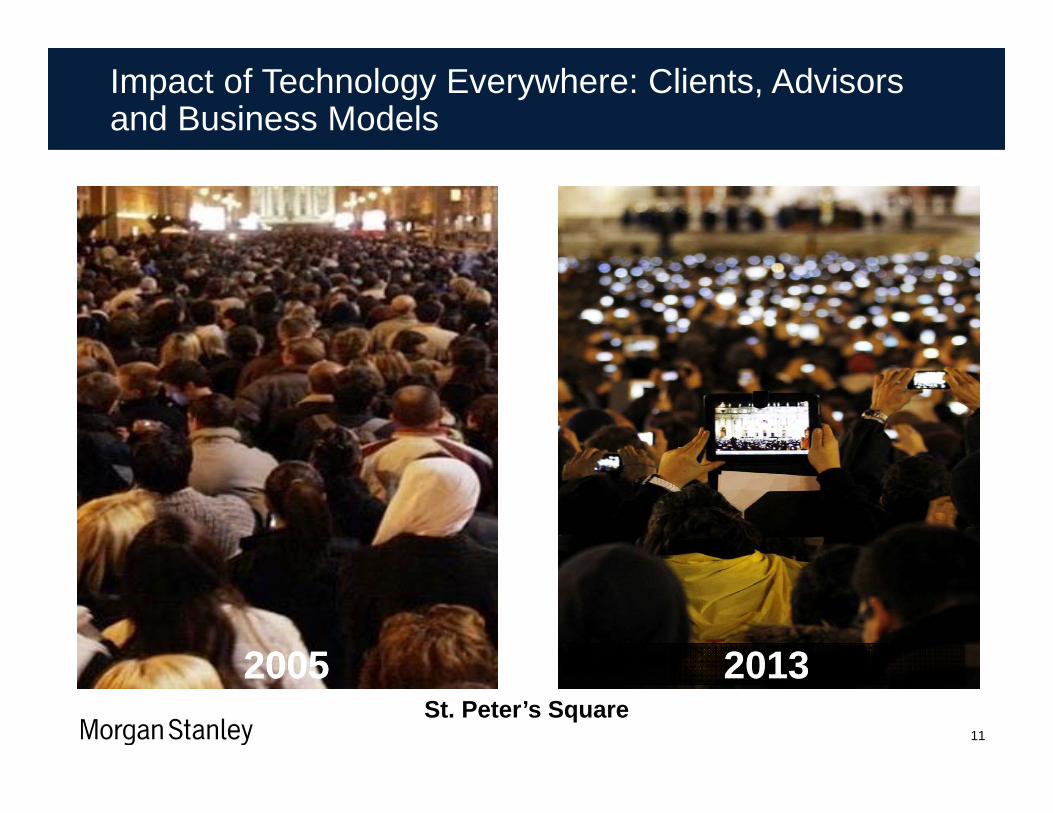
Technology as a Competitive Advantage3
13
New platforms: Significant investment post integration
Best-in-class advisors
Intellectual capital
Industry leading and broad-based technology expertise and talent
Scale to invest
Morgan Stanley Strengths Singular and highly integrated
Innovative tools to drive productivity
Advisor Platform
MS Online
Mobile channels
Client Platforms
3 Technology as a Competitive Advantage

14
Business ViewClient View
• Increases advisor productivity through a fully integrated system
• Leverages technology in a new way, allowing the advisor to efficiently service client needs
3D Advisor Platform – Singular and Highly Integrated

2,800+covered securities
250daily reports
15
Pre-Insights Engine Post-Insights Engine
~100minutes
~5minutes
• Insights Engine is a desktop-based technology platform that targets client-specific investment ideas to advisors and clients based on historical behavior, current holdings and market conditions
Illustrative Time to Generate Tactical Investment IdeaShifts in Wealth Management Industry Have Increased Complexity
Research Complexity
Product Complexity
Book Complexity
Client Complexity
4,000+funds
200+fund
managers
90+investment
styles
250clientsper FA
23 unique positions per client
~5,800 positions to
monitor
Most clients’ assets spread across multiple financial institutions
Insights Engine – Innovative Tool for Advisors
16
Mobile ChannelsMS Online
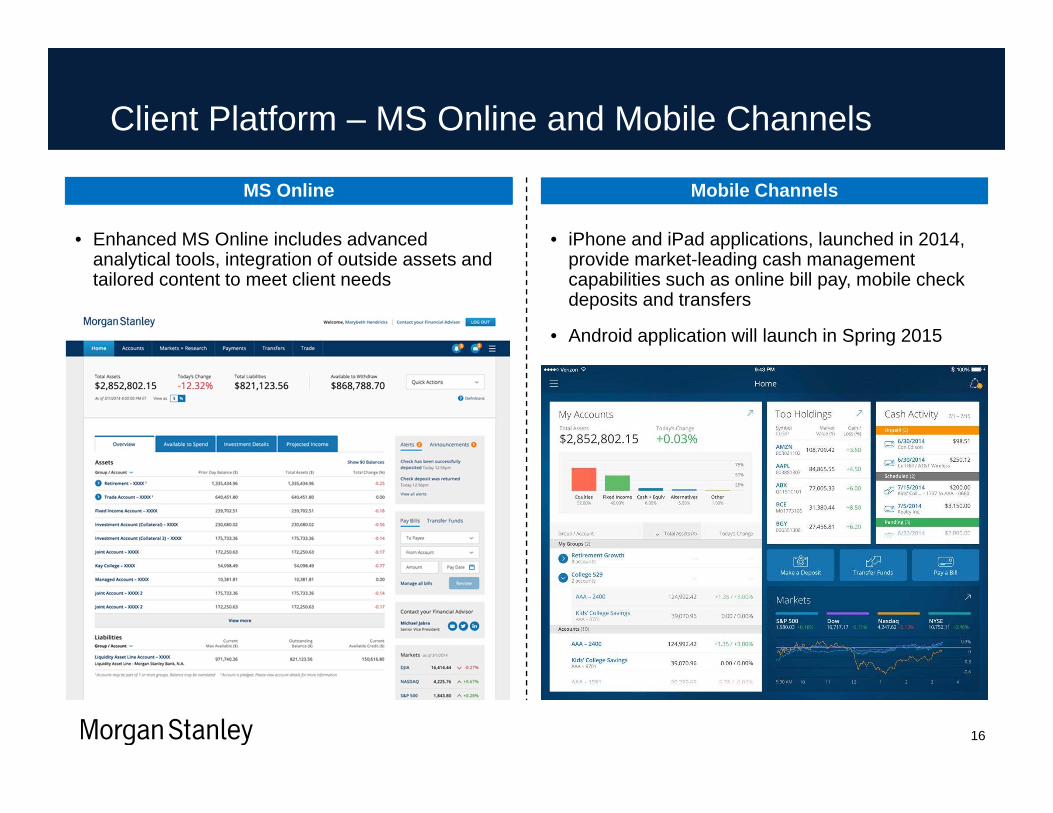
• iPhone and iPad applications, launched in 2014, provide market-leading cash management capabilities such as online bill pay, mobile check deposits and transfers
• Android application will launch in Spring 2015
• Enhanced MS Online includes advanced analytical tools, integration of outside assets and tailored content to meet client needs
Client Platform – MS Online and Mobile Channels

17
Broadening the Banking & Lending Platform4

18
4Q12 1Q13 2Q13 3Q13 4Q13 1Q14 2Q14 3Q14 4Q14
Securities-Based Lending Residential Real Estate Lending Tailored Lending
$31$34
$39$41
$45
$51
$36
$48
Lending Balances ($Bn)(1) Disciplined Risk Management
$31
Securities-Based Lending• Includes lending in both the U.S. bank
and broker-dealer• Low loan-to value (LTV) ratios, with a
portfolio average of ~15%(2)
• Daily portfolio mark-to-market and dynamic portfolio oversight
Residential Real Estate Lending• Average debt to income ratio of ~35%,
FICO score >750(3)
• LTV of ~65%(3)
• Low historical losses and current delinquencies
Tailored Lending• Serve ultra-high net worth (UHNW)
clients with substantial assets and cash flow
• Primarily lend on a secured basis, with personal recourse to the client
• Highly customized offerings and competitive solutions
(1) Figures represent Wealth Management lending balances out of both the Morgan Stanley Smith Barney LLC broker-dealer and the U.S. Subsidiary Banks; Residential mortgages include HELOCs. U.S. Subsidiary Banks refer to the Firm’s U.S. bank operating subsidiaries Morgan Stanley Bank, N.A. (MSBNA) and Morgan Stanley Private Bank, National Association (MSPBNA). Residential mortgages are made by MSPBNA, an Equal Housing Lender.
(2) Loan-to-value based on Market Value. Securities Based Lending products include: Portfolio Loan Account (PLA), Express Credit Line (ECL) and Margin.(3) Average debt-to-income, FICO and loan-to-value ratios are as of December 31, 2014.
Delivered Strong and Prudent Lending Growth in Wealth Management4

11%
17%
27%
2012 2013 2014
19
A Significant Percentage of our FAs Have Engaged With at Least One
New Lending Solution…
…And an Increasing Number Have Initiated Four or More New Lending
Products
50%57%
69%
2012 2013 2014
Growth Drivers
• Product expansion• Increasing FA engagement
• Greater client awareness • Continued investments in platform & services
Significant Organic Growth Opportunities Remain Within Our Existing Client and Advisor Base
20
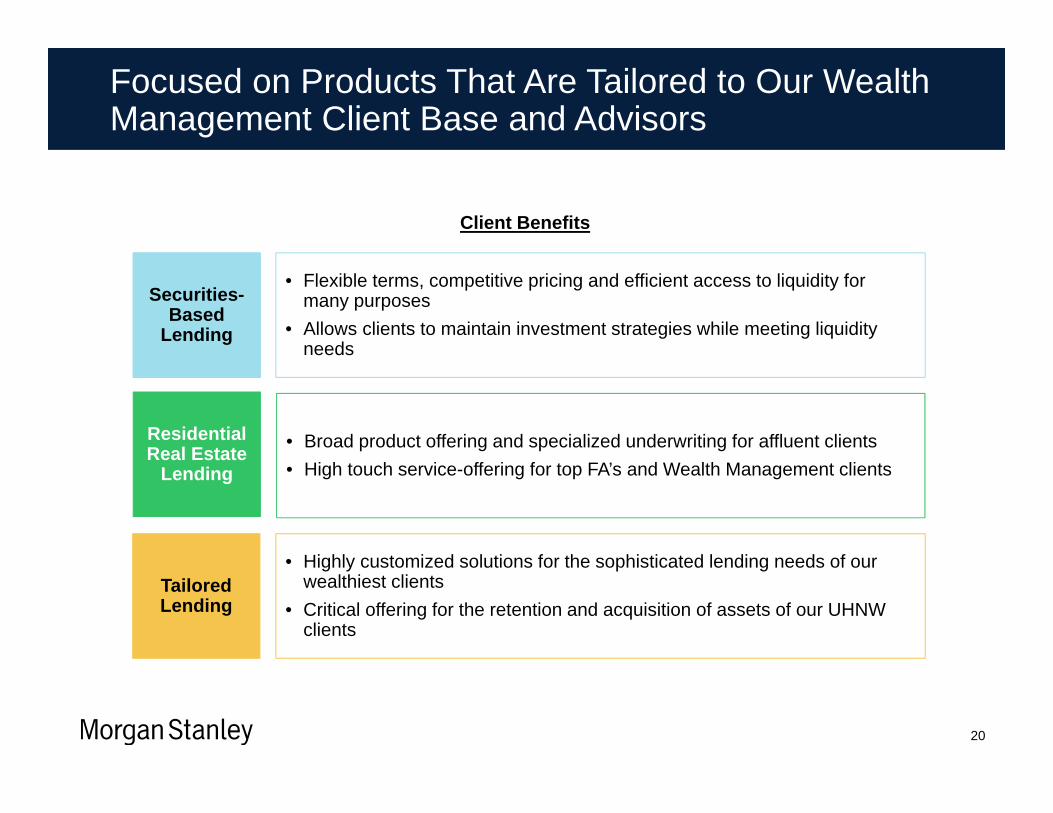
Securities-Based
Lending
Residential Real Estate
Lending
Tailored Lending
Client Benefits
• Flexible terms, competitive pricing and efficient access to liquidity for many purposes
• Allows clients to maintain investment strategies while meeting liquidity needs
• Broad product offering and specialized underwriting for affluent clients• High touch service-offering for top FA’s and Wealth Management clients
• Highly customized solutions for the sophisticated lending needs of our wealthiest clients
• Critical offering for the retention and acquisition of assets of our UHNW clients
Focused on Products That Are Tailored to Our Wealth Management Client Base and Advisors

(1) Illustrative: not to scale.(2) Core organic growth is estimated based on historic deposit growth, projected inflation rates and gross domestic product growth.(3) The attainment of this potential growth opportunity may be impacted by external factors that cannot be predicted at this time, including macroeconomic and
market conditions and future regulations.
$137Bn
$200Bn+
YE2014 Core OrganicGrowth
IncrementalOrganic Growth
Future State
Upside to U.S. Bank Strategy
Client Deposits (1)
Morgan Stanley
Other Institutions
U.S. Bank Deposit Potential
Greater Deposit Penetration with Existing Clients
(2)
21
(3)
• Meaningful opportunities remain across both the Wealth Management and Institutional Securities client base to generate loan growth while maintaining current credit risk profile
• Significant opportunity to attract greater share of deposits from our existing client base to fund expected loan growth
Deposit Strategy Aligned With Continued, Prudent Loan Growth

22
Advisor Centric• Trusted client relationship• Personal service• Supported by access to experts• Backed by 24/7 service
Integrated with Wealth Management• Consolidated cash and investments• Financial plan advice and monitoring• Opportunity to deploy idle cash• Liability consulting
Suite of Cash Management Solutions• Full service Active Assets Account• Expanding deposit product line• Full suite of payments services• Distinct debit and credit card offer
Customized Digital Offering• Digital tools built for affluent clients• Leading cash management features• Convenient mobile check deposits• Exceptional user experience
ClientSolutions
(1) Morgan Stanley Smith Barney LLC (MSSB), member of SIPC, is a registered broker-dealer, not a bank. Where appropriate MSSB has entered into arrangements with banks, including MSPBNA and MSBNA, and other third parties in offering certain banking and lending related products and services.
Growing Deposits Through Expanded Client Access to Banking Services

Integrated, Advisor Centric Value Proposition
Leading Mobile Cash Management
Corporate Insights rates MS Mobile “A”
Enhanced Morgan Stanley Online
Consolidated view of Assets and Liabilities
Integrated bill pay and cash management
Integrated Payment Features
Morgan Stanley EMV Debit Card
Distinct American Express cards
ApplePay
Access to New Deposit Products
Savings and Term Deposits
23
Building Competitive Suite of Cash Management Solutions
(1) Morgan Stanley Smith Barney LLC (MSSB), member of SIPC, is a registered broker-dealer, not a bank. Where appropriate MSSB has entered into arrangements with banks, including MSPBNA and MSBNA, and other third parties in offering certain banking and lending related products and services.

24
Putting It All Together

• Wealth Management: Performance and Growth
• Fast Changing Industry and World
• Technology as a Competitive Advantage
• Broadening the Banking & Lending Platform
25
1
2
3
4
Unique combination of demonstrated ability to execute, with outsized
opportunity for organic growth
Putting It All Together

Credit Suisse 2015 Financials ConferenceGregory J. FlemingPresident of Morgan Stanley Wealth Management and Morgan Stanley Investment ManagementFebruary 10, 2015