Greenwich Market Report
23
4th Quarter 2014 Greenwich Market
-
Upload
joanne-mancuso -
Category
Documents
-
view
215 -
download
0
description
Â
Transcript of Greenwich Market Report
4th Quarter 2014Greenwich Market
Presented By
CHRIS MEYERSManaging Principal
Houlihan Lawrence
HoulihanLawrence.com

6 ContinentsWE SERVE CLIENTS ON
667,540 THE NUMBER OF MILES TRAVELED BY THE HOULIHAN LAWRENCE GLOBAL TEAM
98%OF THE WORLD’S COUNTRIESHAVE VISITED OUR WEBSITE
38THE NUMBER OF
LANGUAGES SPOKEN ATHOULIHAN LAWRENCE
4 GlobalNetworksGIVING OUR CLIENTS THE AREA’S LARGEST AND MOST EXTENSIVE GLOBAL REACH
WITH PARTNERS IN 56 COUNTRIES
FROM GREENWICH TO GENEVABuilding an esteemed network does not happen overnight. We have been developingour powerful connections for 125 years. We understand world-wide markets. Wehave the area’s largest global network with international connections across 6continents, and partners in over 21,500 international offices spanning 56 countries.Our local network of 26 offices is the most comprehensive in the area. And byintegrating smarter data and the newest digital platforms, our private brokerageteam can pair the right client with the perfect home—whether they're around thecorner, or across the globe.
We are happy to be ringing in the New Year with positive momentum to report in Greenwich real estate. The stock market is near record highs, consumer confidence is at levels not seen since 2008, and the economy is growing at its fastest pace in more than a decade, helping drive a solid 2014 in Greenwich, and positioning the real estate market for an even better 2015.
In 2014, the luxury market ($10M+) was buoyed by continued gains on Wall Street, and the Federal Reserve’s low interest rate policy, giving buyers the means and the confidence to purchase the most expensive properties. For example, in Greater Greenwich, sales of $10M+ homes jumped 87%. Median prices are up 11%. Inventory is on the rise in the $10M+ range, and buyers in this price range have a wide selection of important properties to choose from.
North of the Parkway, sales more than doubled in the $10M price range in 2014. Sales of all homes in this area were down for the year by 11%, but median sale price increased by 20%. With ample inventory, North of the Parkway offers value and opportunity for buyers.
South of the Parkway was firing on all cylinders. Median sale price increased by 14% compared to last year and the number of homes sold grew by 5%. With pending sales (those expected to close within 60 to 90 days) up by 8%, and inventory down by 6%, all indicators point to a competitive spring market South of the Parkway.
Sales doubled in the $5-6M range in the South of the Post Road area. There was also heavy activity in the $1-2M range, where sales were up 50%. Cos Cob also got attention for its strong value proposition. Sales in the $2-3M range jumped 250% in 2014 vs. 2013. Properties are starting to sell faster there - the average days on the market fell by more than 21% in 2014, and the average price per square foot jumped 19% in Q4.
Riverside saw strength in the $4-5M range, where sales were up 300%. That said, the overall market saw a drop of 34%. Median sales prices were up by 11% in 2014, which we believe will encourage sellers who have been waiting for the right time to list their homes.
Old Greenwich showed strong performance in 2014: median and average sale price increased by 47% and 34% respectively, while homes sold was relatively flat for the year. The $4-5M range jumped 400%, a clear sign of renewed interest in the area, as buyers adjust to revised flood zone rules following Hurricane Sandy.
As we enter our second year in the Greenwich market, Houlihan Lawrence is grateful to the community for its support. We look forward to continuing to serve all of you in 2015.
FOURTH QUARTER 2014
EXECUTIVE SUMMARY
Stephen MeyersPresident and CEO
Chris MeyersManaging Principal
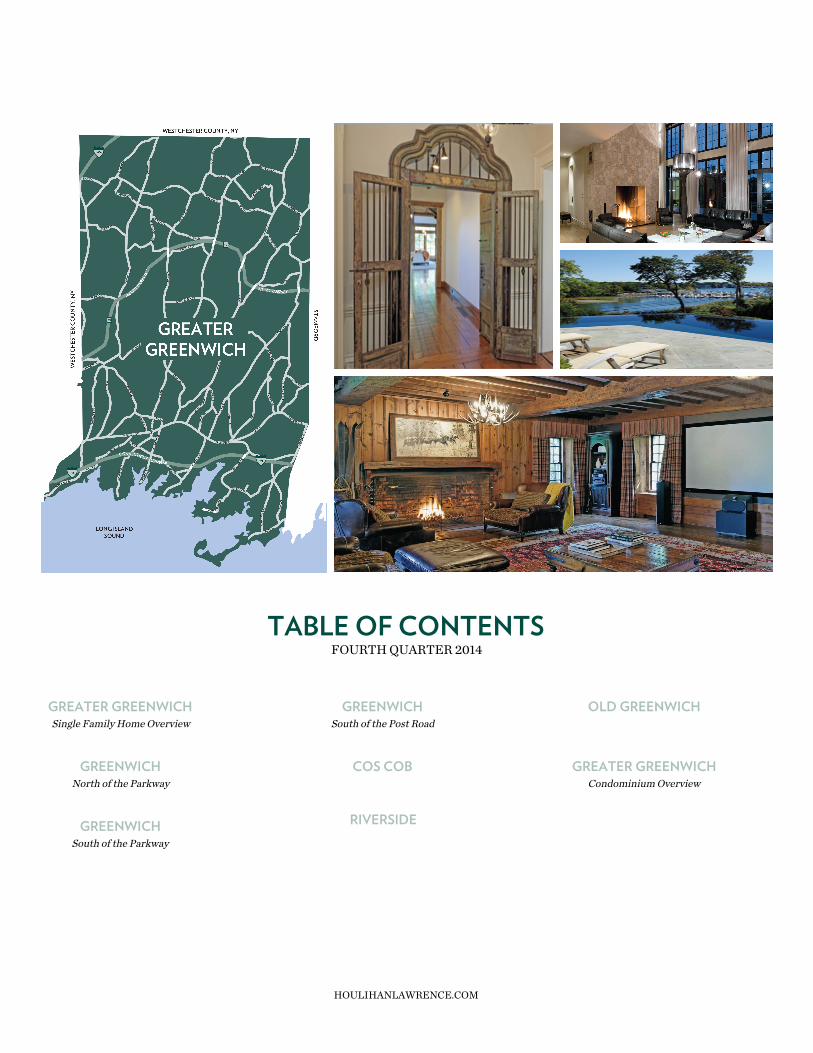
TABLE OF CONTENTSFOURTH QUARTER 2014
GREATER GREENWICHSingle Family Home Overview
GREENWICHNorth of the Parkway
GREENWICHSouth of the Parkway
GREENWICHSouth of the Post Road
COS COB
RIVERSIDE
OLD GREENWICH
GREATER GREENWICHCondominium Overview
HOULIHANLAWRENCE.COM
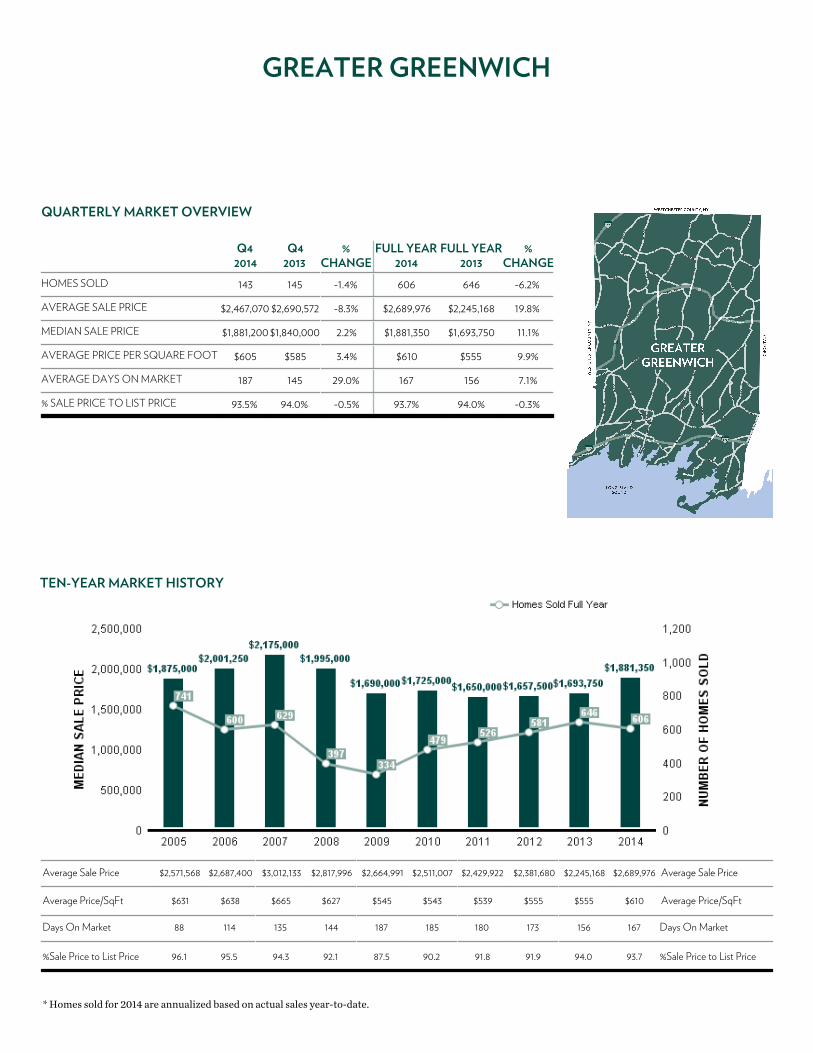
GREATER GREENWICH
QUARTERLY MARKET OVERVIEW
Q42014
Q42013
%CHANGE
FULL YEAR2014
FULL YEAR2013
%CHANGE
HOMES SOLD 143 145 -1.4% 606 646 -6.2%
AVERAGE SALE PRICE $2,467,070 $2,690,572 -8.3% $2,689,976 $2,245,168 19.8%
MEDIAN SALE PRICE $1,881,200 $1,840,000 2.2% $1,881,350 $1,693,750 11.1%
AVERAGE PRICE PER SQUARE FOOT $605 $585 3.4% $610 $555 9.9%
AVERAGE DAYS ON MARKET 187 145 29.0% 167 156 7.1%
% SALE PRICE TO LIST PRICE 93.5% 94.0% -0.5% 93.7% 94.0% -0.3%
TEN-YEAR MARKET HISTORY
Average Sale Price $2,571,568 $2,687,400 $3,012,133 $2,817,996 $2,664,991 $2,511,007 $2,429,922 $2,381,680 $2,245,168 $2,689,976 Average Sale Price
Average Price/SqFt $631 $638 $665 $627 $545 $543 $539 $555 $555 $610 Average Price/SqFt
Days On Market 88 114 135 144 187 185 180 173 156 167 Days On Market
%Sale Price to List Price 96.1 95.5 94.3 92.1 87.5 90.2 91.8 91.9 94.0 93.7 %Sale Price to List Price
* Homes sold for 2014 are annualized based on actual sales year-to-date.
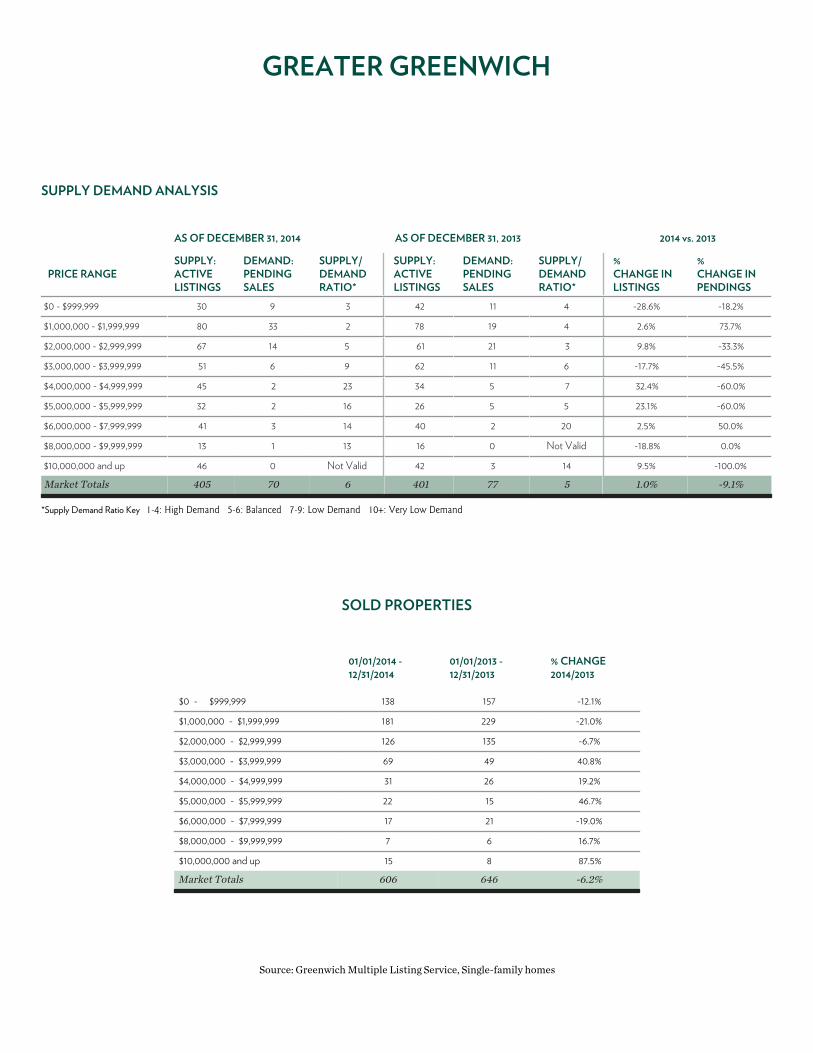
GREATER GREENWICH
SUPPLY DEMAND ANALYSIS
AS OF DECEMBER 31, 2014 AS OF DECEMBER 31, 2013 2014 vs. 2013
PRICE RANGESUPPLY:ACTIVELISTINGS
DEMAND:PENDINGSALES
SUPPLY/DEMANDRATIO*
SUPPLY:ACTIVELISTINGS
DEMAND:PENDINGSALES
SUPPLY/DEMANDRATIO*
%CHANGE INLISTINGS
%CHANGE INPENDINGS
$0 - $999,999 30 9 3 42 11 4 -28.6% -18.2%
$1,000,000 - $1,999,999 80 33 2 78 19 4 2.6% 73.7%
$2,000,000 - $2,999,999 67 14 5 61 21 3 9.8% -33.3%
$3,000,000 - $3,999,999 51 6 9 62 11 6 -17.7% -45.5%
$4,000,000 - $4,999,999 45 2 23 34 5 7 32.4% -60.0%
$5,000,000 - $5,999,999 32 2 16 26 5 5 23.1% -60.0%
$6,000,000 - $7,999,999 41 3 14 40 2 20 2.5% 50.0%
$8,000,000 - $9,999,999 13 1 13 16 0 Not Valid -18.8% 0.0%
$10,000,000 and up 46 0 Not Valid 42 3 14 9.5% -100.0%
Market Totals 405 70 6 401 77 5 1.0% -9.1%
*Supply Demand Ratio Key 1-4: High Demand 5-6: Balanced 7-9: Low Demand 10+: Very Low Demand
SOLD PROPERTIES
01/01/2014 -12/31/2014
01/01/2013 -12/31/2013
% CHANGE2014/2013
$0 - $999,999 138 157 -12.1%
$1,000,000 - $1,999,999 181 229 -21.0%
$2,000,000 - $2,999,999 126 135 -6.7%
$3,000,000 - $3,999,999 69 49 40.8%
$4,000,000 - $4,999,999 31 26 19.2%
$5,000,000 - $5,999,999 22 15 46.7%
$6,000,000 - $7,999,999 17 21 -19.0%
$8,000,000 - $9,999,999 7 6 16.7%
$10,000,000 and up 15 8 87.5%
Market Totals 606 646 -6.2%
Source: Greenwich Multiple Listing Service, Single-family homes
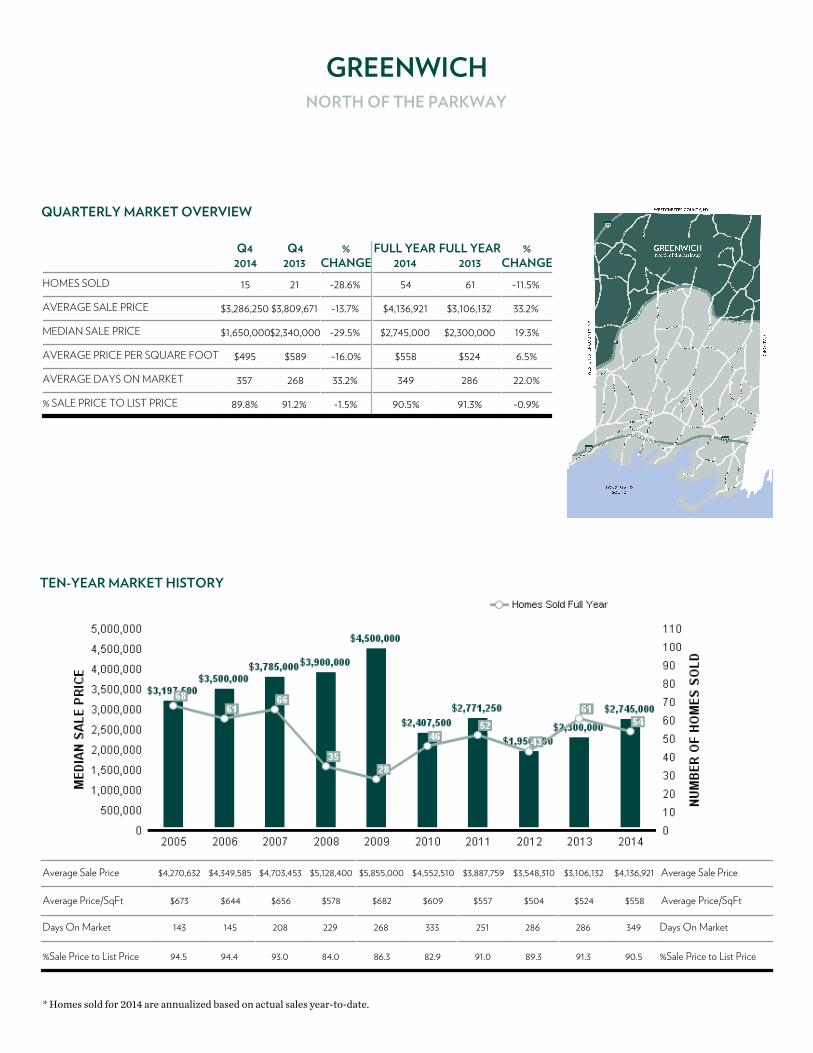
GREENWICHNORTH OF THE PARKWAY
QUARTERLY MARKET OVERVIEW
Q42014
Q42013
%CHANGE
FULL YEAR2014
FULL YEAR2013
%CHANGE
HOMES SOLD 15 21 -28.6% 54 61 -11.5%
AVERAGE SALE PRICE $3,286,250 $3,809,671 -13.7% $4,136,921 $3,106,132 33.2%
MEDIAN SALE PRICE $1,650,000$2,340,000 -29.5% $2,745,000 $2,300,000 19.3%
AVERAGE PRICE PER SQUARE FOOT $495 $589 -16.0% $558 $524 6.5%
AVERAGE DAYS ON MARKET 357 268 33.2% 349 286 22.0%
% SALE PRICE TO LIST PRICE 89.8% 91.2% -1.5% 90.5% 91.3% -0.9%
TEN-YEAR MARKET HISTORY
Average Sale Price $4,270,632 $4,349,585 $4,703,453 $5,128,400 $5,855,000 $4,552,510 $3,887,759 $3,548,310 $3,106,132 $4,136,921 Average Sale Price
Average Price/SqFt $673 $644 $656 $578 $682 $609 $557 $504 $524 $558 Average Price/SqFt
Days On Market 143 145 208 229 268 333 251 286 286 349 Days On Market
%Sale Price to List Price 94.5 94.4 93.0 84.0 86.3 82.9 91.0 89.3 91.3 90.5 %Sale Price to List Price
* Homes sold for 2014 are annualized based on actual sales year-to-date.
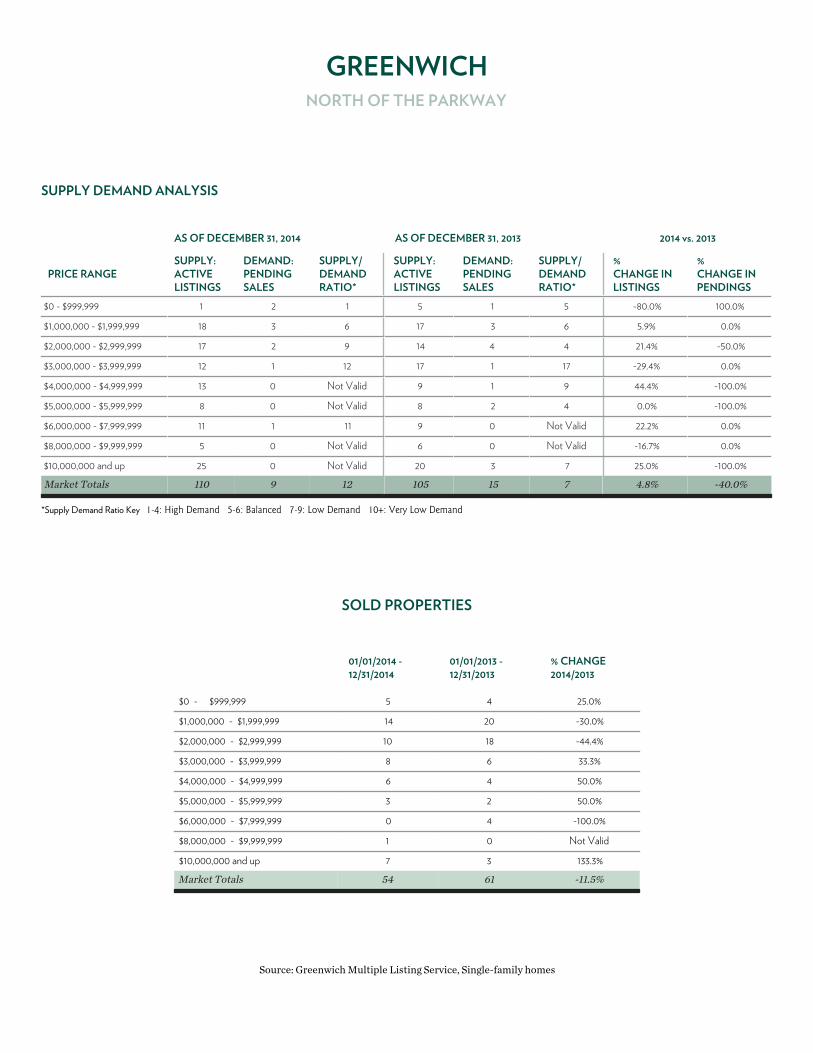
GREENWICHNORTH OF THE PARKWAY
SUPPLY DEMAND ANALYSIS
AS OF DECEMBER 31, 2014 AS OF DECEMBER 31, 2013 2014 vs. 2013
PRICE RANGESUPPLY:ACTIVELISTINGS
DEMAND:PENDINGSALES
SUPPLY/DEMANDRATIO*
SUPPLY:ACTIVELISTINGS
DEMAND:PENDINGSALES
SUPPLY/DEMANDRATIO*
%CHANGE INLISTINGS
%CHANGE INPENDINGS
$0 - $999,999 1 2 1 5 1 5 -80.0% 100.0%
$1,000,000 - $1,999,999 18 3 6 17 3 6 5.9% 0.0%
$2,000,000 - $2,999,999 17 2 9 14 4 4 21.4% -50.0%
$3,000,000 - $3,999,999 12 1 12 17 1 17 -29.4% 0.0%
$4,000,000 - $4,999,999 13 0 Not Valid 9 1 9 44.4% -100.0%
$5,000,000 - $5,999,999 8 0 Not Valid 8 2 4 0.0% -100.0%
$6,000,000 - $7,999,999 11 1 11 9 0 Not Valid 22.2% 0.0%
$8,000,000 - $9,999,999 5 0 Not Valid 6 0 Not Valid -16.7% 0.0%
$10,000,000 and up 25 0 Not Valid 20 3 7 25.0% -100.0%
Market Totals 110 9 12 105 15 7 4.8% -40.0%
*Supply Demand Ratio Key 1-4: High Demand 5-6: Balanced 7-9: Low Demand 10+: Very Low Demand
SOLD PROPERTIES
01/01/2014 -12/31/2014
01/01/2013 -12/31/2013
% CHANGE2014/2013
$0 - $999,999 5 4 25.0%
$1,000,000 - $1,999,999 14 20 -30.0%
$2,000,000 - $2,999,999 10 18 -44.4%
$3,000,000 - $3,999,999 8 6 33.3%
$4,000,000 - $4,999,999 6 4 50.0%
$5,000,000 - $5,999,999 3 2 50.0%
$6,000,000 - $7,999,999 0 4 -100.0%
$8,000,000 - $9,999,999 1 0 Not Valid
$10,000,000 and up 7 3 133.3%
Market Totals 54 61 -11.5%
Source: Greenwich Multiple Listing Service, Single-family homes
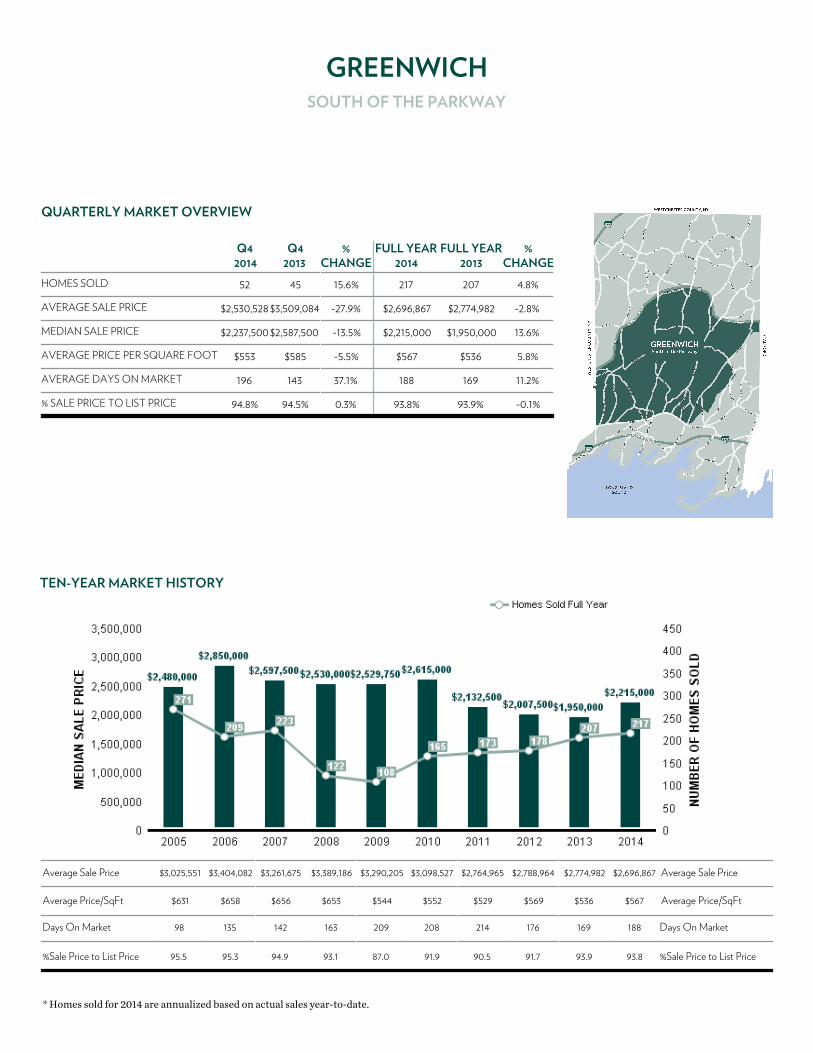
GREENWICHSOUTH OF THE PARKWAY
QUARTERLY MARKET OVERVIEW
Q42014
Q42013
%CHANGE
FULL YEAR2014
FULL YEAR2013
%CHANGE
HOMES SOLD 52 45 15.6% 217 207 4.8%
AVERAGE SALE PRICE $2,530,528 $3,509,084 -27.9% $2,696,867 $2,774,982 -2.8%
MEDIAN SALE PRICE $2,237,500 $2,587,500 -13.5% $2,215,000 $1,950,000 13.6%
AVERAGE PRICE PER SQUARE FOOT $553 $585 -5.5% $567 $536 5.8%
AVERAGE DAYS ON MARKET 196 143 37.1% 188 169 11.2%
% SALE PRICE TO LIST PRICE 94.8% 94.5% 0.3% 93.8% 93.9% -0.1%
TEN-YEAR MARKET HISTORY
Average Sale Price $3,025,551 $3,404,082 $3,261,675 $3,389,186 $3,290,205 $3,098,527 $2,764,965 $2,788,964 $2,774,982 $2,696,867 Average Sale Price
Average Price/SqFt $631 $658 $656 $653 $544 $552 $529 $569 $536 $567 Average Price/SqFt
Days On Market 98 135 142 163 209 208 214 176 169 188 Days On Market
%Sale Price to List Price 95.5 95.3 94.9 93.1 87.0 91.9 90.5 91.7 93.9 93.8 %Sale Price to List Price
* Homes sold for 2014 are annualized based on actual sales year-to-date.
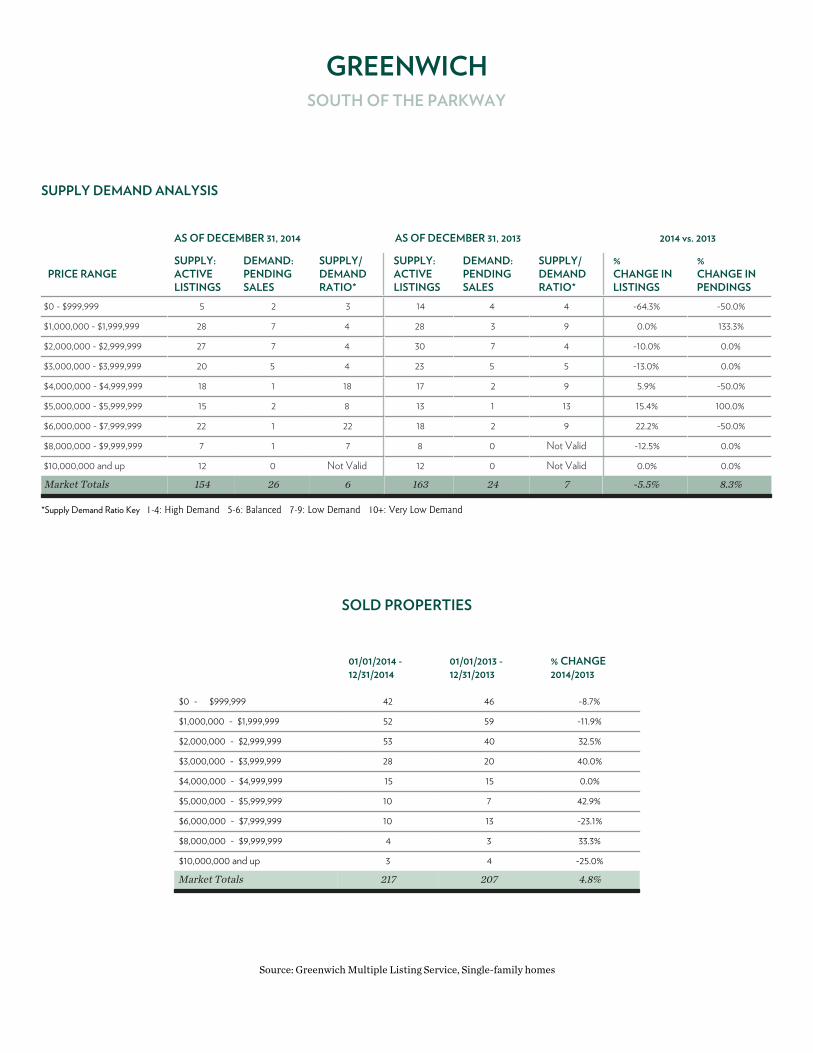
GREENWICHSOUTH OF THE PARKWAY
SUPPLY DEMAND ANALYSIS
AS OF DECEMBER 31, 2014 AS OF DECEMBER 31, 2013 2014 vs. 2013
PRICE RANGESUPPLY:ACTIVELISTINGS
DEMAND:PENDINGSALES
SUPPLY/DEMANDRATIO*
SUPPLY:ACTIVELISTINGS
DEMAND:PENDINGSALES
SUPPLY/DEMANDRATIO*
%CHANGE INLISTINGS
%CHANGE INPENDINGS
$0 - $999,999 5 2 3 14 4 4 -64.3% -50.0%
$1,000,000 - $1,999,999 28 7 4 28 3 9 0.0% 133.3%
$2,000,000 - $2,999,999 27 7 4 30 7 4 -10.0% 0.0%
$3,000,000 - $3,999,999 20 5 4 23 5 5 -13.0% 0.0%
$4,000,000 - $4,999,999 18 1 18 17 2 9 5.9% -50.0%
$5,000,000 - $5,999,999 15 2 8 13 1 13 15.4% 100.0%
$6,000,000 - $7,999,999 22 1 22 18 2 9 22.2% -50.0%
$8,000,000 - $9,999,999 7 1 7 8 0 Not Valid -12.5% 0.0%
$10,000,000 and up 12 0 Not Valid 12 0 Not Valid 0.0% 0.0%
Market Totals 154 26 6 163 24 7 -5.5% 8.3%
*Supply Demand Ratio Key 1-4: High Demand 5-6: Balanced 7-9: Low Demand 10+: Very Low Demand
SOLD PROPERTIES
01/01/2014 -12/31/2014
01/01/2013 -12/31/2013
% CHANGE2014/2013
$0 - $999,999 42 46 -8.7%
$1,000,000 - $1,999,999 52 59 -11.9%
$2,000,000 - $2,999,999 53 40 32.5%
$3,000,000 - $3,999,999 28 20 40.0%
$4,000,000 - $4,999,999 15 15 0.0%
$5,000,000 - $5,999,999 10 7 42.9%
$6,000,000 - $7,999,999 10 13 -23.1%
$8,000,000 - $9,999,999 4 3 33.3%
$10,000,000 and up 3 4 -25.0%
Market Totals 217 207 4.8%
Source: Greenwich Multiple Listing Service, Single-family homes
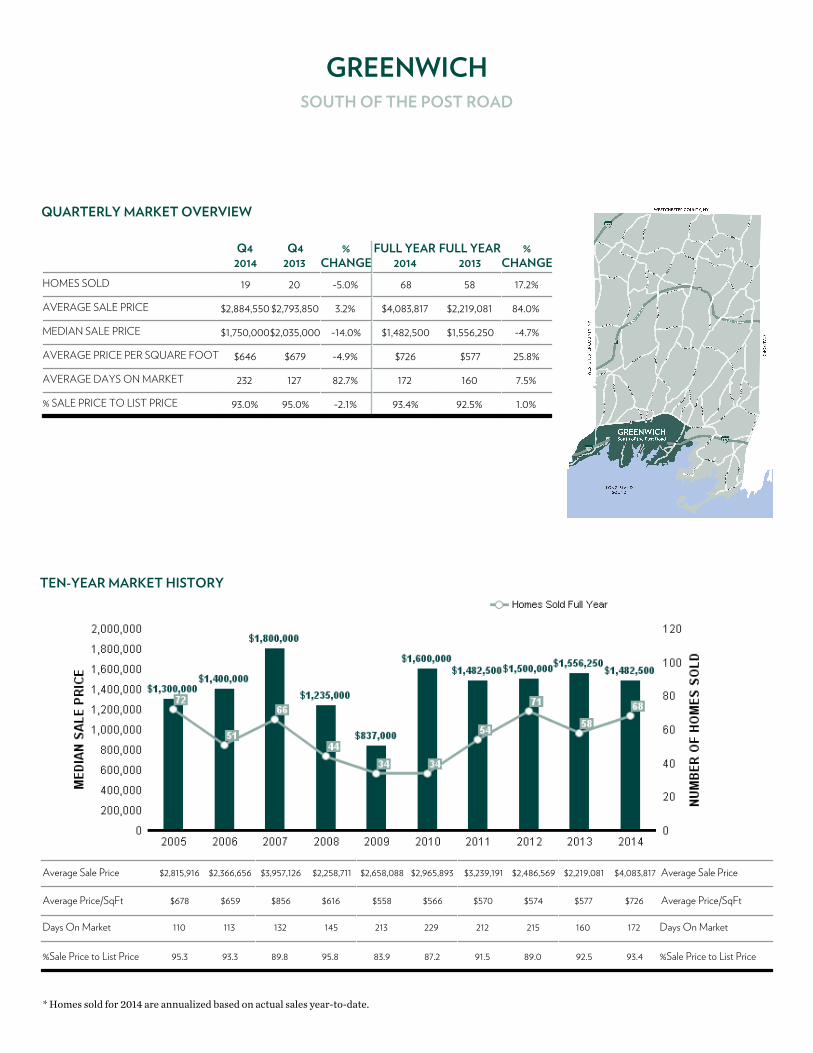
GREENWICHSOUTH OF THE POST ROAD
QUARTERLY MARKET OVERVIEW
Q42014
Q42013
%CHANGE
FULL YEAR2014
FULL YEAR2013
%CHANGE
HOMES SOLD 19 20 -5.0% 68 58 17.2%
AVERAGE SALE PRICE $2,884,550 $2,793,850 3.2% $4,083,817 $2,219,081 84.0%
MEDIAN SALE PRICE $1,750,000$2,035,000 -14.0% $1,482,500 $1,556,250 -4.7%
AVERAGE PRICE PER SQUARE FOOT $646 $679 -4.9% $726 $577 25.8%
AVERAGE DAYS ON MARKET 232 127 82.7% 172 160 7.5%
% SALE PRICE TO LIST PRICE 93.0% 95.0% -2.1% 93.4% 92.5% 1.0%
TEN-YEAR MARKET HISTORY
Average Sale Price $2,815,916 $2,366,656 $3,957,126 $2,258,711 $2,658,088 $2,965,893 $3,239,191 $2,486,569 $2,219,081 $4,083,817 Average Sale Price
Average Price/SqFt $678 $659 $856 $616 $558 $566 $570 $574 $577 $726 Average Price/SqFt
Days On Market 110 113 132 145 213 229 212 215 160 172 Days On Market
%Sale Price to List Price 95.3 93.3 89.8 95.8 83.9 87.2 91.5 89.0 92.5 93.4 %Sale Price to List Price
* Homes sold for 2014 are annualized based on actual sales year-to-date.
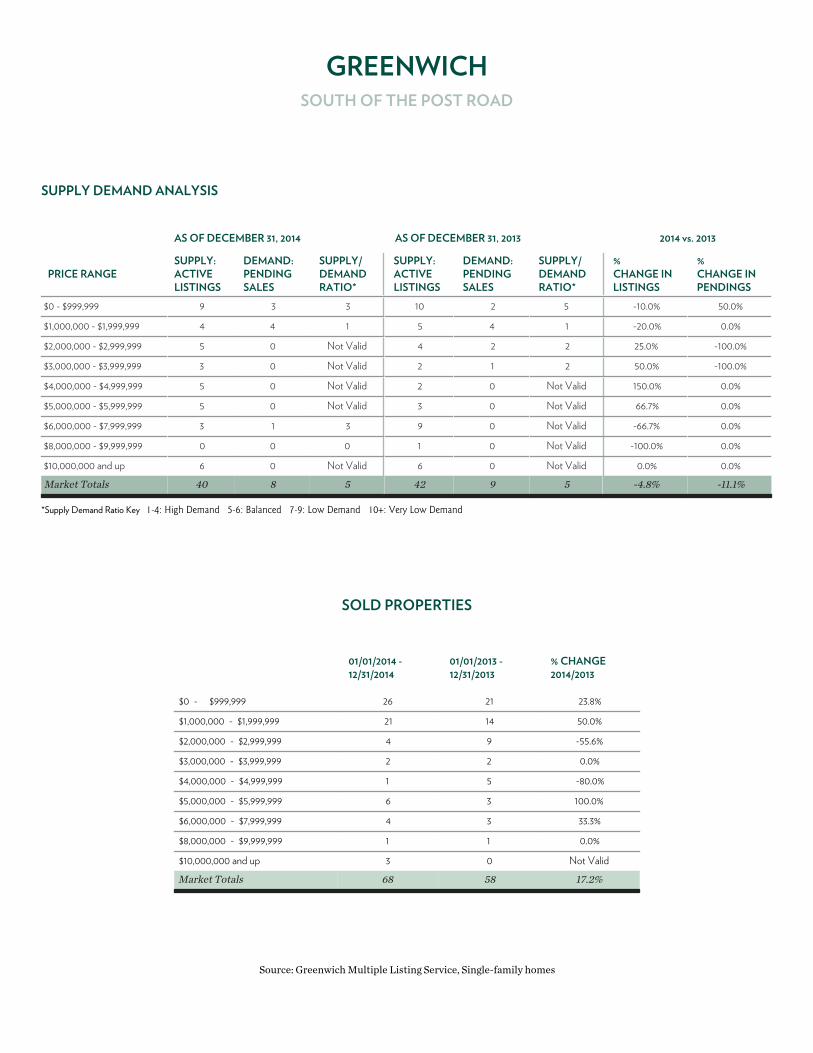
GREENWICHSOUTH OF THE POST ROAD
SUPPLY DEMAND ANALYSIS
AS OF DECEMBER 31, 2014 AS OF DECEMBER 31, 2013 2014 vs. 2013
PRICE RANGESUPPLY:ACTIVELISTINGS
DEMAND:PENDINGSALES
SUPPLY/DEMANDRATIO*
SUPPLY:ACTIVELISTINGS
DEMAND:PENDINGSALES
SUPPLY/DEMANDRATIO*
%CHANGE INLISTINGS
%CHANGE INPENDINGS
$0 - $999,999 9 3 3 10 2 5 -10.0% 50.0%
$1,000,000 - $1,999,999 4 4 1 5 4 1 -20.0% 0.0%
$2,000,000 - $2,999,999 5 0 Not Valid 4 2 2 25.0% -100.0%
$3,000,000 - $3,999,999 3 0 Not Valid 2 1 2 50.0% -100.0%
$4,000,000 - $4,999,999 5 0 Not Valid 2 0 Not Valid 150.0% 0.0%
$5,000,000 - $5,999,999 5 0 Not Valid 3 0 Not Valid 66.7% 0.0%
$6,000,000 - $7,999,999 3 1 3 9 0 Not Valid -66.7% 0.0%
$8,000,000 - $9,999,999 0 0 0 1 0 Not Valid -100.0% 0.0%
$10,000,000 and up 6 0 Not Valid 6 0 Not Valid 0.0% 0.0%
Market Totals 40 8 5 42 9 5 -4.8% -11.1%
*Supply Demand Ratio Key 1-4: High Demand 5-6: Balanced 7-9: Low Demand 10+: Very Low Demand
SOLD PROPERTIES
01/01/2014 -12/31/2014
01/01/2013 -12/31/2013
% CHANGE2014/2013
$0 - $999,999 26 21 23.8%
$1,000,000 - $1,999,999 21 14 50.0%
$2,000,000 - $2,999,999 4 9 -55.6%
$3,000,000 - $3,999,999 2 2 0.0%
$4,000,000 - $4,999,999 1 5 -80.0%
$5,000,000 - $5,999,999 6 3 100.0%
$6,000,000 - $7,999,999 4 3 33.3%
$8,000,000 - $9,999,999 1 1 0.0%
$10,000,000 and up 3 0 Not Valid
Market Totals 68 58 17.2%
Source: Greenwich Multiple Listing Service, Single-family homes
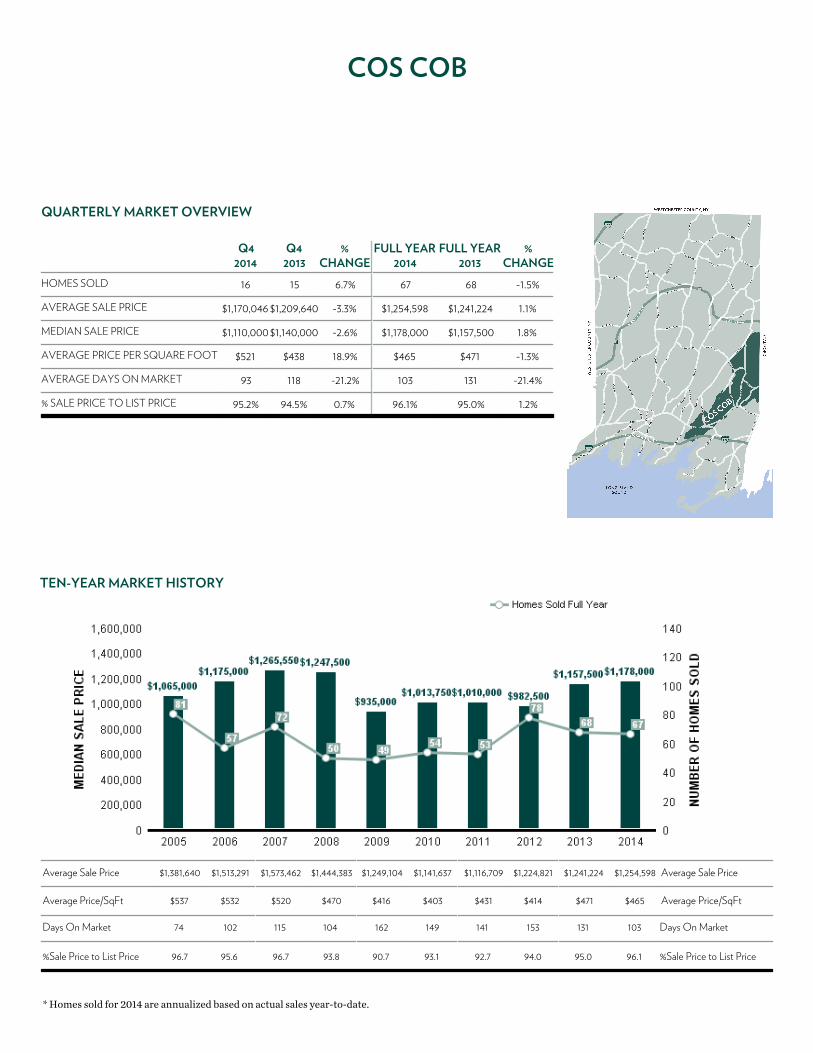
COS COB
QUARTERLY MARKET OVERVIEW
Q42014
Q42013
%CHANGE
FULL YEAR2014
FULL YEAR2013
%CHANGE
HOMES SOLD 16 15 6.7% 67 68 -1.5%
AVERAGE SALE PRICE $1,170,046 $1,209,640 -3.3% $1,254,598 $1,241,224 1.1%
MEDIAN SALE PRICE $1,110,000 $1,140,000 -2.6% $1,178,000 $1,157,500 1.8%
AVERAGE PRICE PER SQUARE FOOT $521 $438 18.9% $465 $471 -1.3%
AVERAGE DAYS ON MARKET 93 118 -21.2% 103 131 -21.4%
% SALE PRICE TO LIST PRICE 95.2% 94.5% 0.7% 96.1% 95.0% 1.2%
TEN-YEAR MARKET HISTORY
Average Sale Price $1,381,640 $1,513,291 $1,573,462 $1,444,383 $1,249,104 $1,141,637 $1,116,709 $1,224,821 $1,241,224 $1,254,598 Average Sale Price
Average Price/SqFt $537 $532 $520 $470 $416 $403 $431 $414 $471 $465 Average Price/SqFt
Days On Market 74 102 115 104 162 149 141 153 131 103 Days On Market
%Sale Price to List Price 96.7 95.6 96.7 93.8 90.7 93.1 92.7 94.0 95.0 96.1 %Sale Price to List Price
* Homes sold for 2014 are annualized based on actual sales year-to-date.
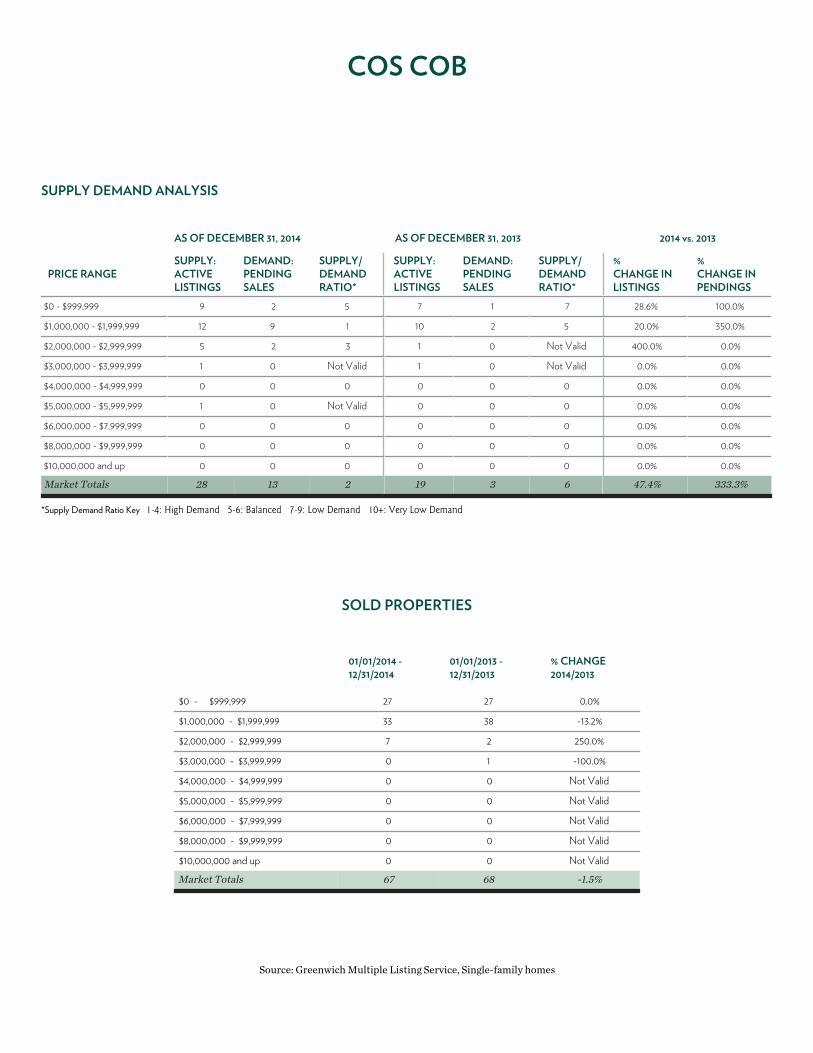
COS COB
SUPPLY DEMAND ANALYSIS
AS OF DECEMBER 31, 2014 AS OF DECEMBER 31, 2013 2014 vs. 2013
PRICE RANGESUPPLY:ACTIVELISTINGS
DEMAND:PENDINGSALES
SUPPLY/DEMANDRATIO*
SUPPLY:ACTIVELISTINGS
DEMAND:PENDINGSALES
SUPPLY/DEMANDRATIO*
%CHANGE INLISTINGS
%CHANGE INPENDINGS
$0 - $999,999 9 2 5 7 1 7 28.6% 100.0%
$1,000,000 - $1,999,999 12 9 1 10 2 5 20.0% 350.0%
$2,000,000 - $2,999,999 5 2 3 1 0 Not Valid 400.0% 0.0%
$3,000,000 - $3,999,999 1 0 Not Valid 1 0 Not Valid 0.0% 0.0%
$4,000,000 - $4,999,999 0 0 0 0 0 0 0.0% 0.0%
$5,000,000 - $5,999,999 1 0 Not Valid 0 0 0 0.0% 0.0%
$6,000,000 - $7,999,999 0 0 0 0 0 0 0.0% 0.0%
$8,000,000 - $9,999,999 0 0 0 0 0 0 0.0% 0.0%
$10,000,000 and up 0 0 0 0 0 0 0.0% 0.0%
Market Totals 28 13 2 19 3 6 47.4% 333.3%
*Supply Demand Ratio Key 1-4: High Demand 5-6: Balanced 7-9: Low Demand 10+: Very Low Demand
SOLD PROPERTIES
01/01/2014 -12/31/2014
01/01/2013 -12/31/2013
% CHANGE2014/2013
$0 - $999,999 27 27 0.0%
$1,000,000 - $1,999,999 33 38 -13.2%
$2,000,000 - $2,999,999 7 2 250.0%
$3,000,000 - $3,999,999 0 1 -100.0%
$4,000,000 - $4,999,999 0 0 Not Valid
$5,000,000 - $5,999,999 0 0 Not Valid
$6,000,000 - $7,999,999 0 0 Not Valid
$8,000,000 - $9,999,999 0 0 Not Valid
$10,000,000 and up 0 0 Not Valid
Market Totals 67 68 -1.5%
Source: Greenwich Multiple Listing Service, Single-family homes
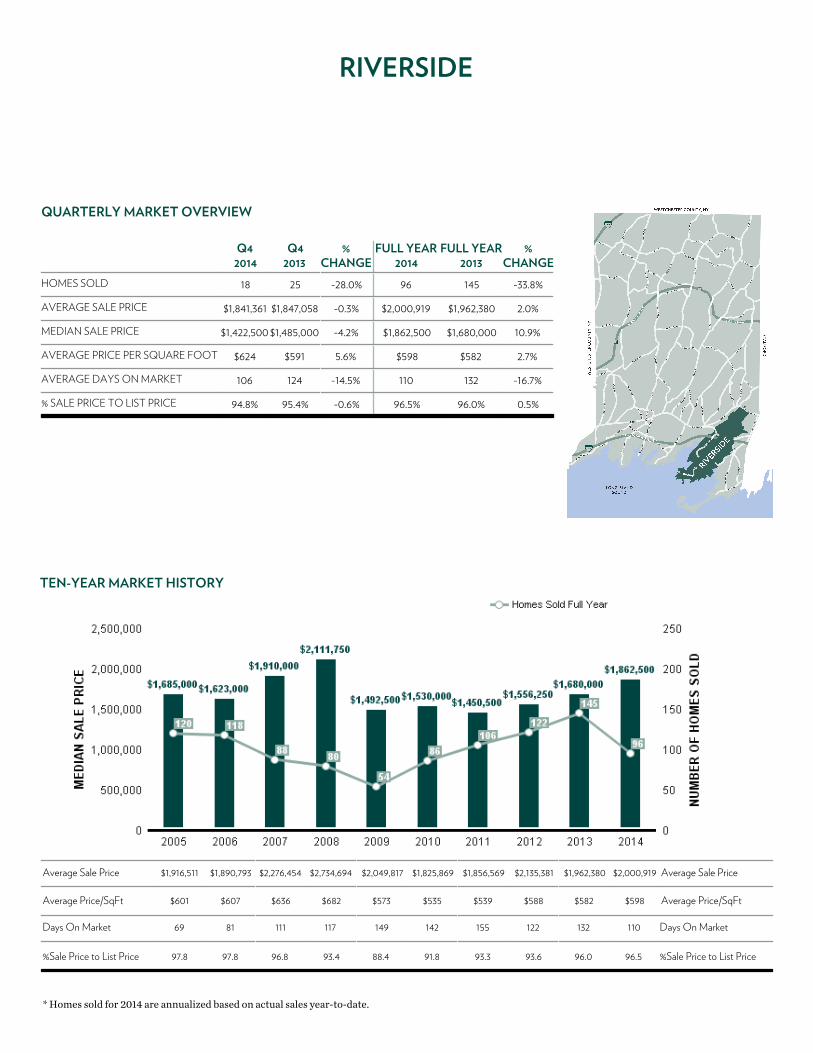
RIVERSIDE
QUARTERLY MARKET OVERVIEW
Q42014
Q42013
%CHANGE
FULL YEAR2014
FULL YEAR2013
%CHANGE
HOMES SOLD 18 25 -28.0% 96 145 -33.8%
AVERAGE SALE PRICE $1,841,361 $1,847,058 -0.3% $2,000,919 $1,962,380 2.0%
MEDIAN SALE PRICE $1,422,500 $1,485,000 -4.2% $1,862,500 $1,680,000 10.9%
AVERAGE PRICE PER SQUARE FOOT $624 $591 5.6% $598 $582 2.7%
AVERAGE DAYS ON MARKET 106 124 -14.5% 110 132 -16.7%
% SALE PRICE TO LIST PRICE 94.8% 95.4% -0.6% 96.5% 96.0% 0.5%
TEN-YEAR MARKET HISTORY
Average Sale Price $1,916,511 $1,890,793 $2,276,454 $2,734,694 $2,049,817 $1,825,869 $1,856,569 $2,135,381 $1,962,380 $2,000,919 Average Sale Price
Average Price/SqFt $601 $607 $636 $682 $573 $535 $539 $588 $582 $598 Average Price/SqFt
Days On Market 69 81 111 117 149 142 155 122 132 110 Days On Market
%Sale Price to List Price 97.8 97.8 96.8 93.4 88.4 91.8 93.3 93.6 96.0 96.5 %Sale Price to List Price
* Homes sold for 2014 are annualized based on actual sales year-to-date.
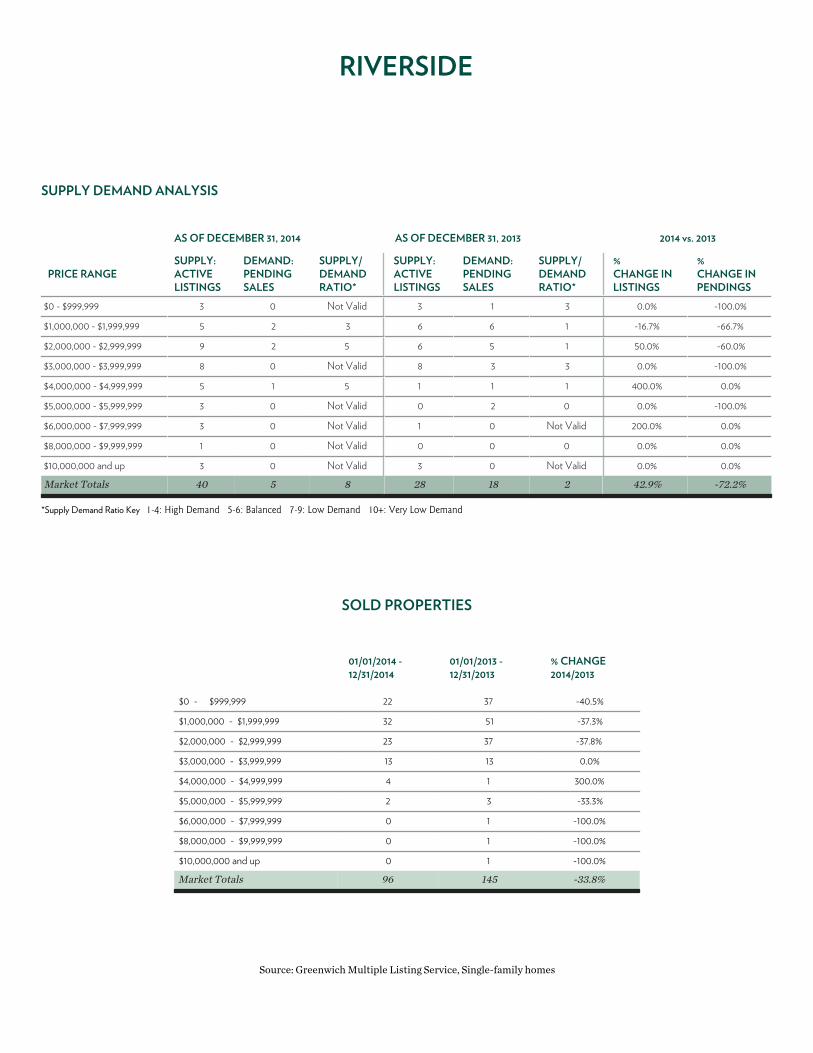
RIVERSIDE
SUPPLY DEMAND ANALYSIS
AS OF DECEMBER 31, 2014 AS OF DECEMBER 31, 2013 2014 vs. 2013
PRICE RANGESUPPLY:ACTIVELISTINGS
DEMAND:PENDINGSALES
SUPPLY/DEMANDRATIO*
SUPPLY:ACTIVELISTINGS
DEMAND:PENDINGSALES
SUPPLY/DEMANDRATIO*
%CHANGE INLISTINGS
%CHANGE INPENDINGS
$0 - $999,999 3 0 Not Valid 3 1 3 0.0% -100.0%
$1,000,000 - $1,999,999 5 2 3 6 6 1 -16.7% -66.7%
$2,000,000 - $2,999,999 9 2 5 6 5 1 50.0% -60.0%
$3,000,000 - $3,999,999 8 0 Not Valid 8 3 3 0.0% -100.0%
$4,000,000 - $4,999,999 5 1 5 1 1 1 400.0% 0.0%
$5,000,000 - $5,999,999 3 0 Not Valid 0 2 0 0.0% -100.0%
$6,000,000 - $7,999,999 3 0 Not Valid 1 0 Not Valid 200.0% 0.0%
$8,000,000 - $9,999,999 1 0 Not Valid 0 0 0 0.0% 0.0%
$10,000,000 and up 3 0 Not Valid 3 0 Not Valid 0.0% 0.0%
Market Totals 40 5 8 28 18 2 42.9% -72.2%
*Supply Demand Ratio Key 1-4: High Demand 5-6: Balanced 7-9: Low Demand 10+: Very Low Demand
SOLD PROPERTIES
01/01/2014 -12/31/2014
01/01/2013 -12/31/2013
% CHANGE2014/2013
$0 - $999,999 22 37 -40.5%
$1,000,000 - $1,999,999 32 51 -37.3%
$2,000,000 - $2,999,999 23 37 -37.8%
$3,000,000 - $3,999,999 13 13 0.0%
$4,000,000 - $4,999,999 4 1 300.0%
$5,000,000 - $5,999,999 2 3 -33.3%
$6,000,000 - $7,999,999 0 1 -100.0%
$8,000,000 - $9,999,999 0 1 -100.0%
$10,000,000 and up 0 1 -100.0%
Market Totals 96 145 -33.8%
Source: Greenwich Multiple Listing Service, Single-family homes
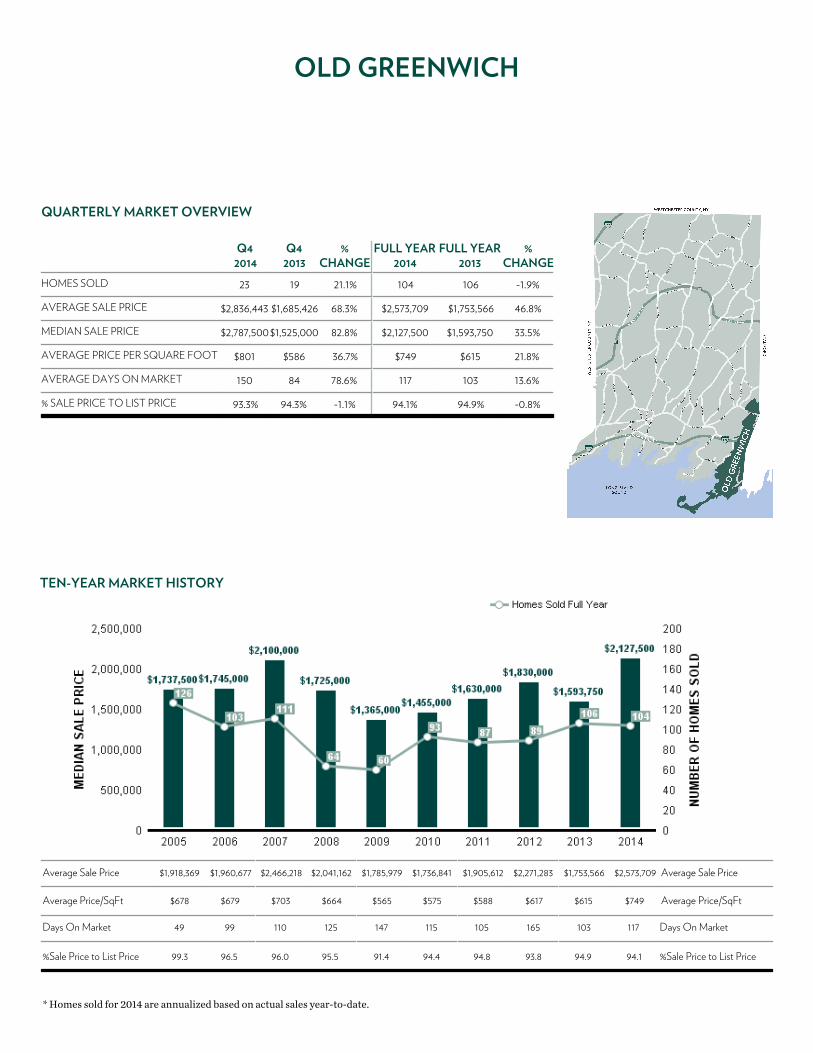
OLD GREENWICH
QUARTERLY MARKET OVERVIEW
Q42014
Q42013
%CHANGE
FULL YEAR2014
FULL YEAR2013
%CHANGE
HOMES SOLD 23 19 21.1% 104 106 -1.9%
AVERAGE SALE PRICE $2,836,443 $1,685,426 68.3% $2,573,709 $1,753,566 46.8%
MEDIAN SALE PRICE $2,787,500$1,525,000 82.8% $2,127,500 $1,593,750 33.5%
AVERAGE PRICE PER SQUARE FOOT $801 $586 36.7% $749 $615 21.8%
AVERAGE DAYS ON MARKET 150 84 78.6% 117 103 13.6%
% SALE PRICE TO LIST PRICE 93.3% 94.3% -1.1% 94.1% 94.9% -0.8%
TEN-YEAR MARKET HISTORY
Average Sale Price $1,918,369 $1,960,677 $2,466,218 $2,041,162 $1,785,979 $1,736,841 $1,905,612 $2,271,283 $1,753,566 $2,573,709 Average Sale Price
Average Price/SqFt $678 $679 $703 $664 $565 $575 $588 $617 $615 $749 Average Price/SqFt
Days On Market 49 99 110 125 147 115 105 165 103 117 Days On Market
%Sale Price to List Price 99.3 96.5 96.0 95.5 91.4 94.4 94.8 93.8 94.9 94.1 %Sale Price to List Price
* Homes sold for 2014 are annualized based on actual sales year-to-date.

OLD GREENWICH
SUPPLY DEMAND ANALYSIS
AS OF DECEMBER 31, 2014 AS OF DECEMBER 31, 2013 2014 vs. 2013
PRICE RANGESUPPLY:ACTIVELISTINGS
DEMAND:PENDINGSALES
SUPPLY/DEMANDRATIO*
SUPPLY:ACTIVELISTINGS
DEMAND:PENDINGSALES
SUPPLY/DEMANDRATIO*
%CHANGE INLISTINGS
%CHANGE INPENDINGS
$0 - $999,999 3 0 Not Valid 3 2 2 0.0% -100.0%
$1,000,000 - $1,999,999 13 8 2 12 1 12 8.3% 700.0%
$2,000,000 - $2,999,999 4 1 4 6 3 2 -33.3% -66.7%
$3,000,000 - $3,999,999 7 0 Not Valid 11 1 11 -36.4% -100.0%
$4,000,000 - $4,999,999 4 0 Not Valid 5 1 5 -20.0% -100.0%
$5,000,000 - $5,999,999 0 0 0 2 0 Not Valid -100.0% 0.0%
$6,000,000 - $7,999,999 2 0 Not Valid 3 0 Not Valid -33.3% 0.0%
$8,000,000 - $9,999,999 0 0 0 1 0 Not Valid -100.0% 0.0%
$10,000,000 and up 0 0 0 1 0 Not Valid -100.0% 0.0%
Market Totals 33 9 4 44 8 6 -25.0% 12.5%
*Supply Demand Ratio Key 1-4: High Demand 5-6: Balanced 7-9: Low Demand 10+: Very Low Demand
SOLD PROPERTIES
01/01/2014 -12/31/2014
01/01/2013 -12/31/2013
% CHANGE2014/2013
$0 - $999,999 16 22 -27.3%
$1,000,000 - $1,999,999 29 47 -38.3%
$2,000,000 - $2,999,999 29 28 3.6%
$3,000,000 - $3,999,999 18 7 157.1%
$4,000,000 - $4,999,999 5 1 400.0%
$5,000,000 - $5,999,999 1 0 Not Valid
$6,000,000 - $7,999,999 3 0 Not Valid
$8,000,000 - $9,999,999 1 1 0.0%
$10,000,000 and up 2 0 Not Valid
Market Totals 104 106 -1.9%
Source: Greenwich Multiple Listing Service, Single-family homes
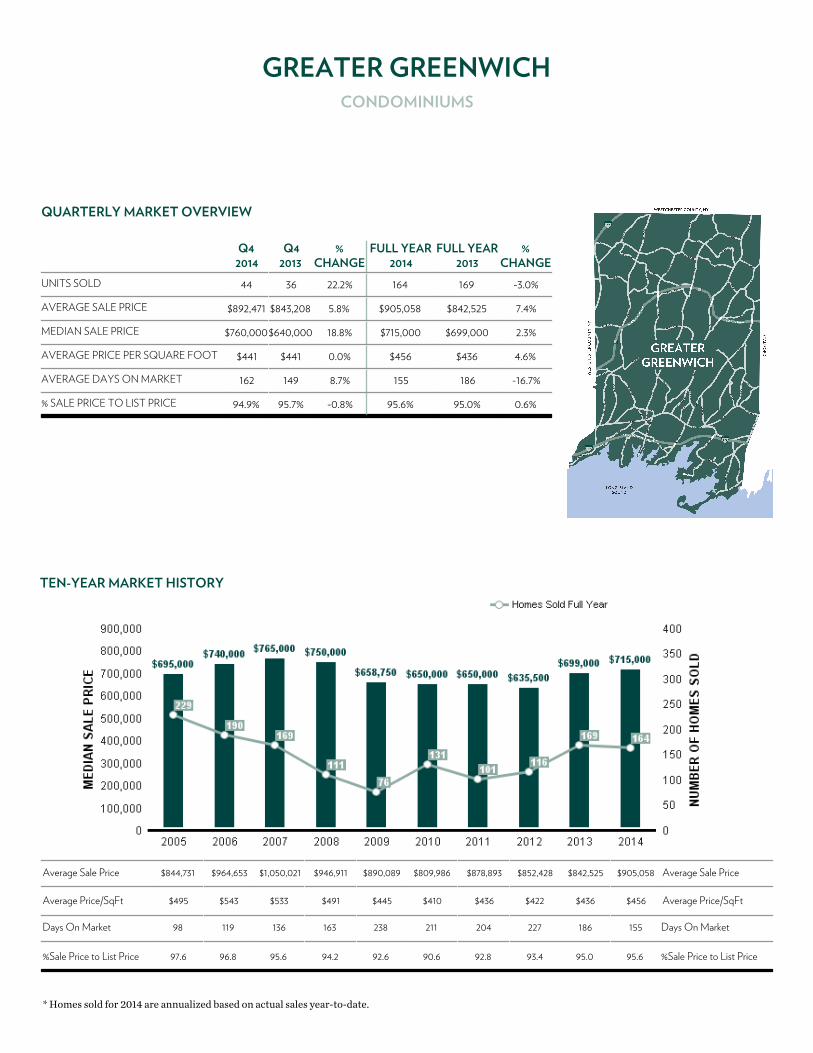
GREATER GREENWICHCONDOMINIUMS
QUARTERLY MARKET OVERVIEW
Q42014
Q42013
%CHANGE
FULL YEAR2014
FULL YEAR2013
%CHANGE
UNITS SOLD 44 36 22.2% 164 169 -3.0%
AVERAGE SALE PRICE $892,471 $843,208 5.8% $905,058 $842,525 7.4%
MEDIAN SALE PRICE $760,000$640,000 18.8% $715,000 $699,000 2.3%
AVERAGE PRICE PER SQUARE FOOT $441 $441 0.0% $456 $436 4.6%
AVERAGE DAYS ON MARKET 162 149 8.7% 155 186 -16.7%
% SALE PRICE TO LIST PRICE 94.9% 95.7% -0.8% 95.6% 95.0% 0.6%
TEN-YEAR MARKET HISTORY
Average Sale Price $844,731 $964,653 $1,050,021 $946,911 $890,089 $809,986 $878,893 $852,428 $842,525 $905,058 Average Sale Price
Average Price/SqFt $495 $543 $533 $491 $445 $410 $436 $422 $436 $456 Average Price/SqFt
Days On Market 98 119 136 163 238 211 204 227 186 155 Days On Market
%Sale Price to List Price 97.6 96.8 95.6 94.2 92.6 90.6 92.8 93.4 95.0 95.6 %Sale Price to List Price
* Homes sold for 2014 are annualized based on actual sales year-to-date.
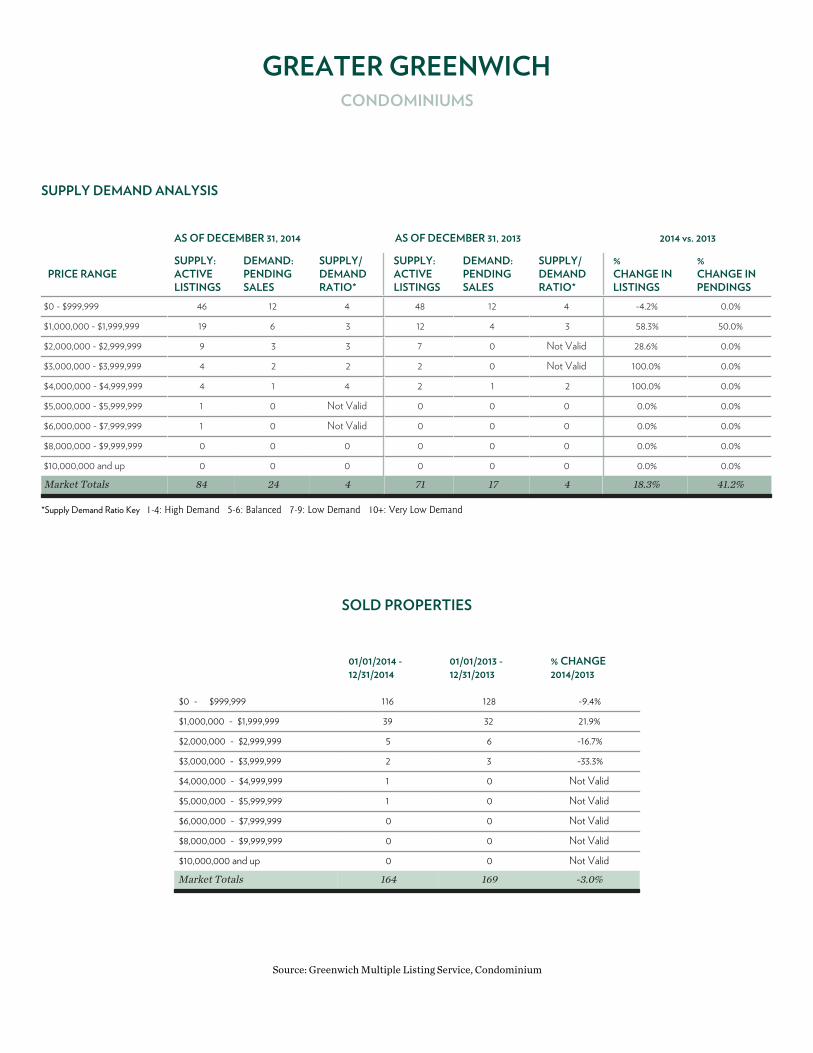
GREATER GREENWICHCONDOMINIUMS
SUPPLY DEMAND ANALYSIS
AS OF DECEMBER 31, 2014 AS OF DECEMBER 31, 2013 2014 vs. 2013
PRICE RANGESUPPLY:ACTIVELISTINGS
DEMAND:PENDINGSALES
SUPPLY/DEMANDRATIO*
SUPPLY:ACTIVELISTINGS
DEMAND:PENDINGSALES
SUPPLY/DEMANDRATIO*
%CHANGE INLISTINGS
%CHANGE INPENDINGS
$0 - $999,999 46 12 4 48 12 4 -4.2% 0.0%
$1,000,000 - $1,999,999 19 6 3 12 4 3 58.3% 50.0%
$2,000,000 - $2,999,999 9 3 3 7 0 Not Valid 28.6% 0.0%
$3,000,000 - $3,999,999 4 2 2 2 0 Not Valid 100.0% 0.0%
$4,000,000 - $4,999,999 4 1 4 2 1 2 100.0% 0.0%
$5,000,000 - $5,999,999 1 0 Not Valid 0 0 0 0.0% 0.0%
$6,000,000 - $7,999,999 1 0 Not Valid 0 0 0 0.0% 0.0%
$8,000,000 - $9,999,999 0 0 0 0 0 0 0.0% 0.0%
$10,000,000 and up 0 0 0 0 0 0 0.0% 0.0%
Market Totals 84 24 4 71 17 4 18.3% 41.2%
*Supply Demand Ratio Key 1-4: High Demand 5-6: Balanced 7-9: Low Demand 10+: Very Low Demand
SOLD PROPERTIES
01/01/2014 -12/31/2014
01/01/2013 -12/31/2013
% CHANGE2014/2013
$0 - $999,999 116 128 -9.4%
$1,000,000 - $1,999,999 39 32 21.9%
$2,000,000 - $2,999,999 5 6 -16.7%
$3,000,000 - $3,999,999 2 3 -33.3%
$4,000,000 - $4,999,999 1 0 Not Valid
$5,000,000 - $5,999,999 1 0 Not Valid
$6,000,000 - $7,999,999 0 0 Not Valid
$8,000,000 - $9,999,999 0 0 Not Valid
$10,000,000 and up 0 0 Not Valid
Market Totals 164 169 -3.0%
Source: Greenwich Multiple Listing Service, Condominium
5 GLOBAL NETWORKS – REACHING 56 COUNTRIES & 6 CONTINENTS
Leading Real Estate Companies of the World | Luxury Portfolio InternationalMayfair International Realty | Board of Regents Luxury Real Estate