Greenville: An Upward Bound Economy in Transition The transforming economy Incomepatterns...
33
Greenville: An Upward Bound Economy in Transition • The transforming economy •Incomepatterns •natConverging but distinctive South Carolina’s Economy: Forecast & Indicators. Will South Carolina’s Flowers Bloom in the Newly Sprouted Knowledge Economy? Bruce Yandle Professor of Economics Emeritus, Clemson University [email protected]
-
Upload
mervyn-henry -
Category
Documents
-
view
215 -
download
1
Transcript of Greenville: An Upward Bound Economy in Transition The transforming economy Incomepatterns...
Greenville: An Upward Bound Economy in Transition
• The transforming economy
•Incomepatterns
•natConverging but distinctive
South Carolina’s Economy:Forecast & Indicators.
Will South Carolina’s Flowers Bloom in the Newly Sprouted Knowledge Economy?
Bruce Yandle
Professor of Economics Emeritus, Clemson University

Greenville: An Upward Bound Economy in Transition
• The transforming economy
•Incomepatterns
•natConverging but distinctive


What matters now are BRAINS.
How to get the brains…, and get them connected?
•

Average Annual Per Capita Real GDP Growth: 2000-2006
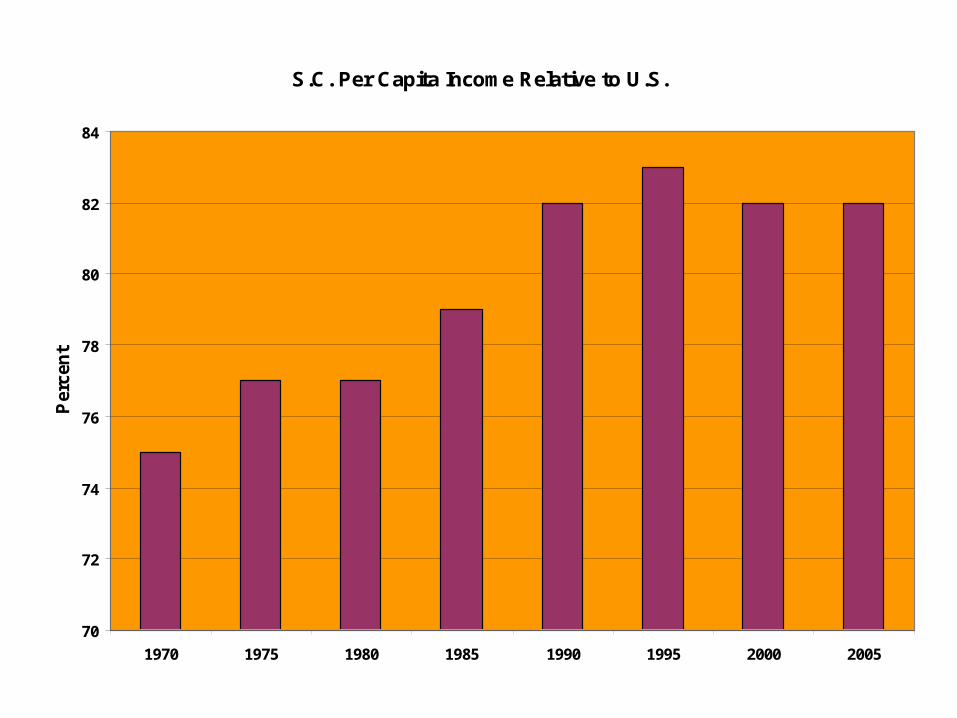
S.C. Per Capita Income Relative to U.S.
70
72
74
76
78
80
82
84
1970 1975 1980 1985 1990 1995 2000 2005
Per
cen
t

2005 Over 25 Population with High School Education

Percent of Population 25 or older with Bachelor’s Degree or Higher, 2005

Bachelor's Degrees & Per Capita GDP, 2006
0.0
5.0
10.0
15.0
20.0
25.0
30.0
35.0
40.0
45.0
0 10000 20000 30000 40000 50000 60000 70000
Per Capita GDP
Sh
are
of
abo
ve 2
5 w
ith
deg
rees
Delaware
W. Virginia
Massachusetts
S.C.
N.C.
Texas
Mich.Calif.
Conn.
New York
Miss.Nevada
Vermont
Maryland
Hawaii
Kansas
Alaska
La.
Ark
Colo.
N.J.
Wyoming.
Mont.
Tenn.
Va.

Let’s talk about where people work!And how that has changed.

U.S. EMPLOYMENT: 1940Non-Agricultural
MFG34%
CONST5%
TPU9%
TRADE22%
MIN3%
GVT13%
FIN & SVC14%

U.S. EMPLOYMENT: 2006
MFG11%
CONST5%
TPU4%
TRADE17%
0%
GVT17%
SVC &FIN45%
MIN1%

Source: Bureau of Labor Statistics
Percent Distribution of Percent Distribution of US Nonfarm Employment US Nonfarm Employment
by Industryby Industry20062006
Government16.2%
Leisure and Hospitality
9.6%
Education and Health Services
13.1%
Professional and Business Services
12.8%
Financial Activities6.2%
Information2.3%
Trade, Transportation and Utilities
19.2%
Manufacturing10.5%
Construction5.6%

Percent Distribution of Percent Distribution of SC Nonfarm Employment SC Nonfarm Employment
by Industryby IndustryJuly 2007July 2007
Government17.0%
Leisure and Hospitality
11.0%
Education and Health Services
11.0%
Professional and Business Services
11.0% Financial Activities5.0%
Information1.0%
Trade, Transportation and
Utilities19.0%
Manufacturing13.0%
Construction6.0%
Source: SCESC/LMI

Number of Employees: Professional, Scientific & Technical Services, 2005

Median Family Income, 2005

The Changing Industrial Scene
America is disintegrating!

Total Employed, 16 and Over, Seasonally AdjustedHousehold Survey, with Trend
1/1991 - 12//2007
105000
110000
115000
120000
125000
130000
135000
140000
145000
150000
Date
Apr-91
Aug-91
Dec-9
1
Apr-92
Aug-92
Dec-9
2
Apr-93
Aug-93
Dec-9
3
Apr-94
Aug-94
Dec-9
4
Apr-95
Aug-95
Dec-9
5
Apr-96
Aug-96
Dec-9
6
Apr-97
Aug-97
Dec-9
7
Apr-98
Aug-98
Dec-9
8
Apr-99
Aug-99
Dec-9
9
Apr-00
Aug-00
Dec-0
001
M401
M8
01M12
2-Apr
2-Aug
2-Dec
3-Apr
3-Aug
3-Dec
4-Apr
4-Aug
4-Dec
5-Apr
5-Aug
5-Dec
6-Apr
6-Aug
6-Dec
7-Apr
7-Aug
7-Dec
Th
ou
san
d

U.S. Manufacturing Output
1919-2006Federal Reserve Index 2000=100
y = 4.5606e0.0032x
R2 = 0.9694
0
20
40
60
80
100
120
140
Month/Year
Ind
ex

Percentage Change in Manufacturing Employment1992-2003
-30
-25
-20
-15
-10
-5
0
5C
anad
a
Norw
ay
Tai
wan
Ital
y
Sw
eden
Fra
nce
Kore
a
Net
her
lands
Bel
giu
m
U.S
.
U.K
.
Chin
a
Ger
man
y
Aust
ralia
Japan
Rat
e
Data for The Netherlands and China are for 1990-2002.Source: W.A. Ward, Manufacturing Productivity and the Shifting U.S., China, and Global Job Scenes, 1990-2005. Center for International Trade, Clemson University, Clemson, SC.


Unemployment Rates: S.C. & U.S.2005-2007
3.03.54.04.55.05.56.06.57.07.5
South Carolina U.S.

What lies ahead? When will the sub-prime problem end? Recession????


Money Supply Annual Growth1960 - 2006
-6
-4
-2
0
2
4
6
8
10
12
14
16


Annual G rowth in Indus trial P roduc tion and S .C . R eal T otal P ers onal Inc ome: 1971-2007
-10
-5
0
5
10
15
1971
1972
1973
1974
1975
1976
1977
1978
1979
1980
1981
1982
1983
1984
1985
1986
1987
1988
1989
1990
1991
1992
1993
1994
1995
1996
1997
1998
1999
2000
2001
2002
2003
2004
2005
2006
2007
Indus trial P roduc tion R eal TP I

-2
-1
0
1
2
3
4
5
6
Growth
2005Q1 2005Q3 2006Q1 2006Q3 2007Q1 2007Q3 2008Q1 2008Q3
GDP Growth & Forecast
Actual GDP Growth Forecast

Forecast Time
Actual 12/31/06 Forecast 12/31/07 12/31/07 Forecast 12/08
• Real GDP Growth 3.2% 2.5% 2.6%* 2.2%
• CPI Inflation 2.6% 2.5% 4.3%** 3.0%
• 30-yr. Mortgage 5.82% 6.0% 5.84% 6.10%
• Unemploy Rate 4.5% 4.0% 5.0% 5.0%
• Prime 8.25% 7.75% 7.25% 6.00%
• Dow 12,460 13,200 13,264 14,200
• Employ Growth 150M 175M 120M 110M
• Oil $58 $45 $93 $80
• Gold $510 $600 $838 $700________________* Estimate. ** Through November 2007.