GreenTree Hospitality Group Ltd.
24
GreenTree Hospitality Group Ltd. 2018 Q4 and Full Year Results Presentation March 14, 2019 | Comfort Quality Value Convenience * Notes: * currently being registered as trademark in PRC V3
Transcript of GreenTree Hospitality Group Ltd.

GreenTree Hospitality Group Ltd.
2018 Q4 and Full Year Results Presentation March 14, 2019|
Comfort
Quality
Value
Convenience
*
Notes: * currently being registered as trademark in PRC
V3

2
This presentation does not constitute or form part of any offer for sale or subscription of or solicitation or invitation of any offer to buy or subscribe for any securities. Neither this
presentation nor any part of it shall form the basis of or be relied upon in connection with any contract or commitment whatsoever. Specifically, this presentation does not constitute a
“prospectus” within the meaning of the Securities Act of 1933, as amended.
Our historical results are not necessarily indicative of results to be expected for any future period. The financial data contained in this presentation for the periods and as of the dates
indicated are qualified by reference to and should be read in conjunction with our financial statements and related notes and “Management’s Discussion and Analysis of Financial Condition
and Results of Operations” included in our public filings with the U.S. Securities and Exchange Commission (the “SEC”).
This presentation includes certain non-GAAP financial measures, which are different from financial measures calculated in accordance with U.S. GAAP. Such non-GAAP financial
measures should be considered in addition to and not as a substitute for or superior to financial measures calculated in accordance with U.S. GAAP. In addition, the definitions of Adjusted
EBITDA and Margin and Core Net Income and Margin in this presentation may be different from the definition of such term used by other companies, and therefore comparability may be
limited. A quantitative reconciliation of non-GAAP financial measures to the most directly comparable U.S. GAAP financial measures has been included in this presentation.
Except for historical information, all of the statements, expectations, and assumptions contained in this presentation constitute forward-looking statements made under the “safe harbor”
provisions of Section 21E of the Securities Exchange Act of 1934, as amended, and the U.S. Private Securities Litigation Reform Act of 1995. These statements include descriptions
regarding the intent, belief or current expectations of GreenTree Hospitality Group Ltd. (the “Company”), its officers or its management with respect to the consolidated results of operations
and financial condition of the Company. The Company may also make written or oral forward-looking statements in its reports filed with or furnished to the SEC, in its annual report to
shareholders, in press releases and other written materials and in oral statements made by its officers, directors or employees to third parties. These statements can be recognized by the
use of words or phrases such as “may,” “will,” “expect,” “anticipate,” “aim,” “estimate,” “intend,” “plan,” “believe,” “potential,” “continue,” “is/are likely to,” “confident,” “future,” words or
expressions of similar meaning. Such forward-looking statements are not guarantees of future performance and involve known and unknown factors, risks and uncertainties that may cause
our actual results, performance or achievements to be materially different from those expressed or implied by the forward-looking statements. Such factors and risks include, but not limited
to the following: the Company’s goals and growth strategies; its future business development, financial condition and results of operations; trends in the hospitality industry in China and
globally; competition in our industry; fluctuations in general economic and business conditions in China and other regions where we operate; the regulatory environment in which we and
our franchisees operate; and assumptions underlying or related to any of the foregoing. You should not place undue reliance on these forward-looking statements. Further information
regarding these and other risks, uncertainties or factors are included in the Company’s filings with the SEC, copies of which are available for free in the Investor Relations section of the
Company’s website at http://ir.998.com or upon request from the Company’s Investor Relations Department. All information provided, including the forward-looking statements made, in this
presentation are current as of the date hereof. Neither the delivery of this presentation nor any further discussions of the Company after the date hereof shall, under any circumstances,
imply that there has been no change in the affairs of the Company since such date. Except as required by law, the Company undertakes no obligation to update any such information or
forward-looking statements to reflect events or circumstances after the date on which the information is provided or statements are made, or to reflect the occurrence of unanticipated
events.
Disclaimer

3
Agenda
Business and Strategy Review 4
Operational and Financial Highlights 12
1
2
Appendix: Hotel Performance 213

4
1. Business and Strategy Review

5
Q4 and Full Year 2018 Performance Overview
2,757 Hotels
221,529 Rooms
~29 million Loyal Members
98.9% F&M Hotels(1)
77.3% Revenue Contribution from F&M Hotels for Q4
As of December 31, 2018
430 Hotels Contracted for or under Development
Notes: 1. Franchised-and-managed hotels2. Adjusted EBITDA (non-GAAP) is calculated as net income plus other operating expenses, income tax expense, share of loss in equity investees (net of tax), interest expense, share-based compensation, depreciation and amortization,
losses on investments in equity securities and other expense net, but excludes other operating income, gains on investments in equity securities, share of gain in equity investees (net of tax) and other income net.3. Core net income is calculated as net income plus share-based compensation, losses on investments in equity securities (net of 25% tax), other expense (net of 25% tax), income tax expenses related to dividend distribution outside
PRC and Losses from joint venture closure but excludes government subsidies (net of 25% tax), gains on investments in equity securities (net of 25% tax) and other income (net of 25% tax).
1,270,000+ Corporate MembersRMB 1.14 (US$0.17) for Q4RMB 4.49 (US$0.65) for Full Year
+3.8% YoY to RMB164 for Q4
+4.5% YoY to RMB 164 for Full year ADR:
-1.0% YoY to 80.4% for Q4
-0.5% YoY to 82.1% for Full YearOccupancy:
+2.3% YoY to RMB132 for Q4
+3.8% YoY to RMB135 for Full YearRevPAR:
+20.8% YoY to RMB250MM for Q4
+21.4% YoY to RMB945MM for Full YearRevenue
+19.0% YoY to RMB176MM for Q4
+22.0% YoY to RMB664MM for Full Year
Gross
Profit
+35.2% YoY to RMB160MM(2) for Q4
+30.5% YoY to RMB610MM(2) for Full Year
Adjusted
EBITDA
(non-GAAP)
Basic and diluted core net income per ADS
+33.4% YoY to RMB116MM(3) for Q4
+31.8% YoY to RMB445MM(3) for Full Year
Core Net
Income
224 New Hotel Openings for Q4
554 New Hotel Openings for Full Year

6
1 2
Added Wumian Hotel
to our portfolio.
2018 Q3
Started to explore
ways to grow service
apartment business
2018 Q3
Acquired 4.95% of
shares in New century
2019 Q1
4
Acquired majority
stake in Argyle
2019 Q1
5
Invested in Gingko
2019 Q1
6
2018 and 2019Q1 Important Events
3
The Company’s App was ranked 2nd in terms of user
activity on the “Intelligent Mobile Observatory” in
hotel sector, a famous mobile big data query platform
launched by TalkingData., as of December 31,2018
2018

7
Continued Strategic Focus on the F&M Model
97.6
98.4
98.9 98.9 98.9 98.8 98.9
95
96
97
98
99
100
2015 2016 2017 18Q1 18Q2 18Q3 18Q4 andFull Year
71 75 77 78 78 77 77
29 25 23 22 22 23 23
0
20
40
60
80
100
2016 2017 2018 18Q1 18Q2 18Q3 18Q4
F&M Hotels L&O Hotels
98.9% of Our Hotel Portfolio are F&M Hotels
% of F&M hotels Revenue, %
F&M Hotels Contribute ~77.3% of Total Revenue for 2018 Q4
~77.4% of Total Revenue for 2018

8
21
29
15
20
25
30
Dec 31, 2017 Dec 31, 2018
Fast-Growing Loyal Membership Base
820
1,270
500
750
1,000
1,250
Dec 31, 2017 Dec 31, 2018
MM
Robust Membership Growth Increase in Corporate Members
‘000
94.5% of rooms nights sold through direct sales in 2018 Q4
95.0% of rooms nights sold through direct sales in 2018

9
Consistently Healthy RevPAR Growth
115124
131123
119129
139
129
124135
145
132
92
111117
108 100
131
145
135
117
142
152137
50
100
150
16Q1 16Q2 16Q3 16Q4 17Q1 17Q2 17Q3 17Q4 18Q1 18Q2 18Q3 18Q4
F&M L&O
Quarterly RevPAR
RMB
135 137 131
139
50
100
150
200
17Q4 18Q4 2017 Full Year 2018 Full Year
129 132 129
134
50
100
150
200
17Q4 18Q4 2017 Full Year 2018 Full Year
RevPAR YoY Growth for F&M HotelsRevPAR YoY Growth for L&O Hotels
RMB RMB

10
306
430
0
125
250
375
500
Dec. 31, 2017 Dec. 31, 2018
Continued to Build up Hotel Pipeline to Fuel Accelerated Growth
Strengthening Hotel Pipeline Business to Mid-to-up-scale and Economy Segments Fuel Stronger Growth and a More Diversified Portfolio
GreenTree Eastern, Gme, Gya
& VX
Vatica and Shell
2016 2017 2018
Business to Mid-
to-up-scale1.5% 2.2% 3.9%
Mid-scale 90.4% 86.6% 79.2%
Economy 8.1% 11.2% 16.9%
% of Total Hotels
Number of hotels contracted for or under development
Shell VaticaGreenTree
EasternVX
153
348104
117
257
465
0
100
200
300
400
500
2017 2018
GME GYA
50
87
11
0
9
0
1
50
108
0
15
30
45
60
75
90
105
2017 2018

11
Further Development of Business to Mid-to-up-scale Brands
● Mid-to-up-scale business hotels designed
to be a calm and unique haven for
business travelers
● Mid-to-up-scale smart, fashionable and
trendy hotels highlighting individuality● Mid-to-up-scale leisure hotels that combine
youthful trends with artistic interiors to
create a “Very Relaxing” space for travelers
● Price: RMB 280–350
● Grand opening of 7 in Q4 2018 and 9 in
2018 Full Year
● Pipeline:29 ● Pipeline:27
● Price: RMB 280–350
● Grand opening of 1 in Jiangsu Province in
2018 Full Year
● Pipeline:24
● Price: RMB 280–350
● Grand opening of 7 in Q4 2018 and 11 in
2018 Full Year

12
2. Operational and Financial Highlights

13
1,932
2,263
2,728
32
26
29
1,964
2,289
2,757
0
500
1,000
1,500
2,000
2,500
2016 2017 2018
Hotel Openings / ClosuresIncreasing Number of Hotels in Operation
Rapid Growth with Low Hotel Closure Rate
% F&M
Hotels98.4% 98.9% 98.9%
F&M Hotels L&O Hotels
196 171 224
80 104 146
224
205 254
330
(88) (100) (86) (15) (24) (22) (25)
(100)
0
100
200
300
400
500
2016 2017 2018 18Q1 18Q2 18Q3 18Q4
Opened in
Q4 2017
Net
Increase in
Total Hotels313
Hotels Opened Hotels Closed
Number of hotels
Breakdown of New Hotel Openings in Q4 2018
Mid-scale, 86
38.4%
Economy, 110
49.1%
Mid-to-up-scale, 28
12.5%
Tier 1 Cities, 20
8.9%
Tier 2 Cities, 49
21.9%
Other Cities, 155
69.2%
By Brand Segments By City Tier(1)
Note1. Tier 1 cities refer to Beijing, Shanghai, Shenzhen and Guangzhou; Tier 2 cities refer to the 32 major cities, other than Tier 1 cities, including provincial capitals, administrative capitals of autonomous regions, direct-controlled
municipalities and other major cities designated as municipalities with independent planning by the State Council
Opened in
Q4 2016
325 468 65 80 124 199
Opened in
Q4 2018

14
Improving ADR and Stable Occupancy Lead to Sustained RevPAR
Growth
ADR
RMB
Occupancy
%
RevPAR
RMB
153 158
163 166
193
212
0
50
100
150
200
250
16Q4 17Q4 18Q4
F&M Hotels L&O Hotels
% ADR YoY Growth3.3% 3.2%
16.3% 9.8%
80 82 81
65
70
65
0
20
40
60
80
100
16Q4 17Q4 18Q4
F&M Hotels L&O Hotels
% Occupancy YoY Growth
123
129 132
108
135 137
0
30
60
90
120
150
16Q4 17Q4 18Q4
F&M Hotels L&O Hotels
% RevPAR YoY Growth1.3 % (0.9%)
5.3% (5.7%)
4.9% 2.3%
25.0% 1.5%
The Company has achieved a steady 2.3% RevPAR increase from the same quarter of 2017

15
Improving ADR and Stable Occupancy Lead to Sustained RevPAR
Growth
ADR
RMB
Occupancy
%
RevPAR
RMB
152 156
163 164
186
205
0
50
100
150
200
250
2016 2017 2018
F&M Hotels L&O Hotels
% ADR YoY Growth2.6% 4.5%
13.4% 10.2%
8183 82
66
7068
0
20
40
60
80
100
2016 2017 2018
F&M Hotels L&O Hotels
% Occupancy YoY Growth
123
129 134
109
131
139
0
30
60
90
120
150
2016 2017 2018
F&M Hotels L&O Hotels
% RevPAR YoY Growth2.0 % (0.6%)
4.0% (2.3%)
4.9% 3.9%
20.2% 6.1%
The Company has achieved a steady 3.8% RevPAR YoY growth for full year.

16
Robust Revenue Growth
Total Revenue
RMB MM
207
778
250
945
0
200
400
600
800
1,000
2017 Full Year 2018 Full Year2017Q4 2018Q4
Revenue from F&M Hotels
RMB MM
153
584
193
732
0
200
400
600
800
2017 Full Year 2018 Full Year2017Q4 2018Q4
Revenue from L&O Hotels
RMB MM
54
194
57
213
0
100
200
300
2017 Full Year 2018 Full Year2017Q4 2018Q4

17
Effective Cost Structure
Total Operating Costs and Expenses(1)
RMB MM % of Revenue
105
368
131
433
0
100
200
300
400
500
600
700
2017 Full Year 2018 Full Year2017Q4 2018Q4
Hotel Operating Costs
RMB MM % of Revenue
59
234
74
281
0
200
400
2017 Full Year 2018 Full Year2017Q4 2018Q450.7% 52.3%
47.3%
45.8%
10%
0%
20%
30%
40%
50%
Note1. Total operating costs and expenses consist of hotel operating costs, selling and marketing expenses, general and administrative expenses and other operating expenses. And exclude one-time expenses.2. General and Administrative Expense exclude One-time share-based compensation expenses of RMB38.0 million in 2017 for GreenTree Inns Hotel Management Group Inc.’s shares granted to certain of our directors for their past
services as directors.
28.6%29.7%
30%
0%
30.0% 29.7%
Selling and Marketing Expense
RMB MM % of Revenue
16
45
16
50
0
40
80
2017 Full Year 2018 Full Year2017Q4 2018Q4
7.6% 6.5%
8%
0%
5.8%5.3%
General and Administrative Expense(2)
RMB MM % of Revenue
26
84
35
95
0
100
200
300
2017 Full Year 2018 Full Year2017Q4 2018Q4
12.4% 13.9%
15%
0%
10.7% 10.1%
60%
70%
5%
10%

18
RMB MM
Adjusted EBITDA and Margin(1)
%
Strong and Improving Profitability
Notes: 1. Adjusted EBITDA (non-GAAP) is calculated as net income plus other operating expenses, income tax expense, share of loss in equity investees (net of tax), interest expense, share-based compensation, depreciation and amortization,
losses on investments in equity securities and other expense net, but excludes other operating income, gains on investments in equity securities, share of gain in equity investees (net of tax) and other income net.2. Core net income is calculated as net income plus share-based compensation, losses on investments in equity securities (net of 25% tax), other expense (net of 25% tax), income tax expenses related to dividend distribution outside
PRC and Losses from joint venture closure but excludes government subsidies (net of 25% tax), gains on investments in equity securities (net of 25% tax) and other income(net of 25% tax).3. General and Administrative Expense exclude One-time share-based compensation expenses of RMB38.0 million in 2017 for GreenTree Inns Hotel Management Group Inc.’s shares granted to certain of our directors for their past
services as directors.
Core Net Income(2)/Net Income and Margin(3)
RMB MM
87 116
338
445
28 54
323
394
0
300
600
900
17Q4 18Q4 2017 FullYear
2018 FullYear
Core Net Income Net Income
%
0%
Core Net Income Margin
40%
Net Income Margin
20%
148
544
176
664
0
200
400
600
800
1000
2017 Full
Year2018 Full
Year
2017Q4 2018Q4
100%
20%
0%
70.3%71.4%
70.3%70.0%
118
467
160
610
0
200
400
600
800
1000
2017 Full
Year
2018 Full
Year2017Q4 2018Q4
64.1%
57.3%
64.5%
60.0%
%
Gross Profit and Margin
42.0%46.4%
13.6%
21.5%
41.5%
47.1%
43.4%
41.7%
RMB MM
Gross Margin of
2017Q4 & 2018Q4
Gross Margin of
2017 & 2018
60%
40%
80%
20%
0%
40%
60%
80%
100%
60%
Adjusted EBITDA Margin
of 2017Q4 & 2018Q4
Adjusted EBITDA Margin
of 2017 & 2018
19
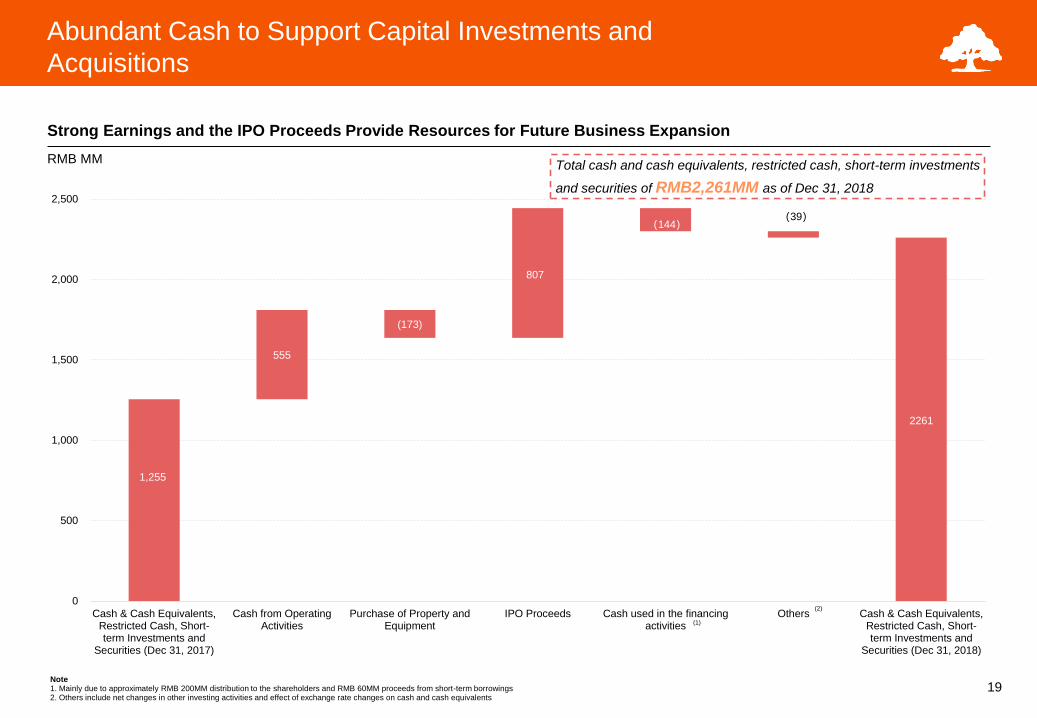
Strong Earnings and the IPO Proceeds Provide Resources for Future Business Expansion
Abundant Cash to Support Capital Investments and
Acquisitions
RMB MM
Note1. Mainly due to approximately RMB 200MM distribution to the shareholders and RMB 60MM proceeds from short-term borrowings 2. Others include net changes in other investing activities and effect of exchange rate changes on cash and cash equivalents
1,255
555
(173)
807
(144)(39)
2261
0
500
1,000
1,500
2,000
2,500
Cash & Cash Equivalents,Restricted Cash, Short-term Investments and
Securities (Dec 31, 2017)
Cash from OperatingActivities
Purchase of Property andEquipment
IPO Proceeds Cash used in the financingactivities
Others Cash & Cash Equivalents,Restricted Cash, Short-term Investments and
Securities (Dec 31, 2018)
Total cash and cash equivalents, restricted cash, short-term investments
and securities of RMB2,261MM as of Dec 31, 2018
(1)
(2)
20
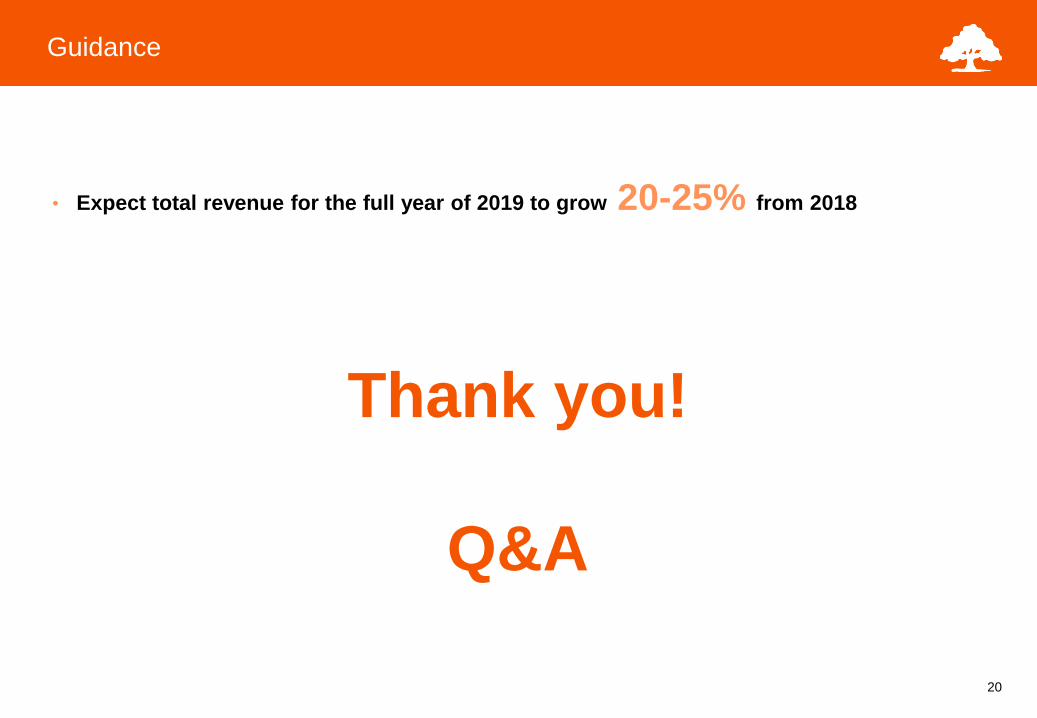
Guidance
• Expect total revenue for the full year of 2019 to grow 20-25% from 2018
Thank you!
Q&A

21
Appendix: Hotel Performance
22
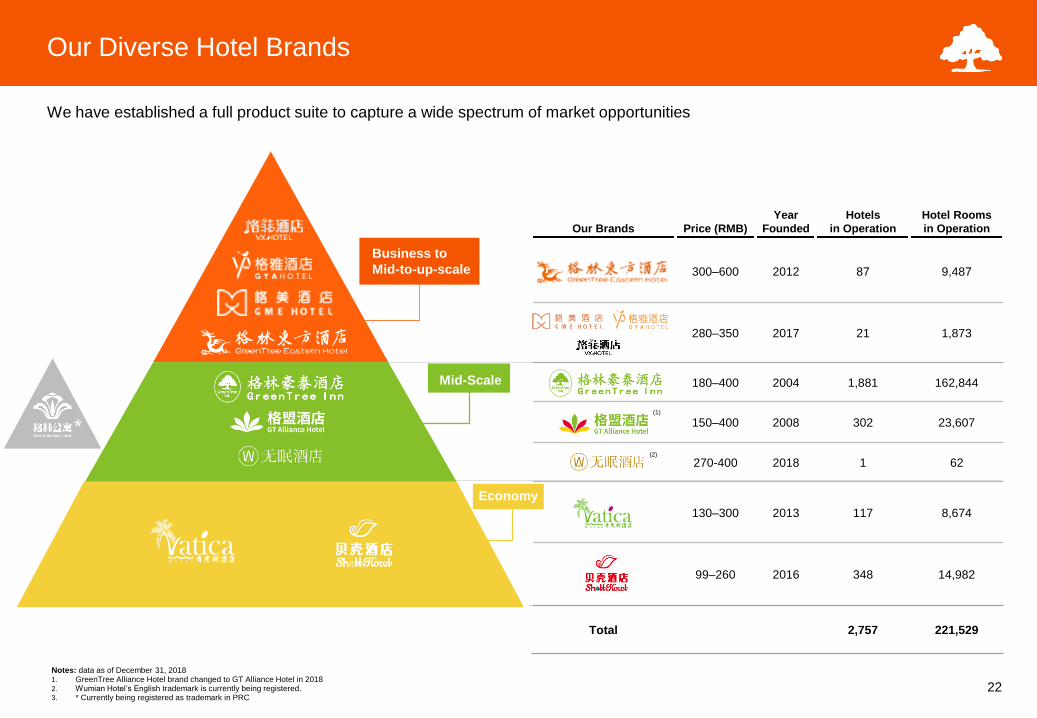
Our Brands Price (RMB)
Year
Founded
Hotels
in Operation
Hotel Rooms
in Operation
300–600 2012 87 9,487
280–350 2017 21 1,873
180–400 2004 1,881 162,844
150–400 2008 302 23,607
270-400 2018 1 62
130–300 2013 117 8,674
99–260 2016 348 14,982
Total 2,757 221,529
Our Diverse Hotel Brands
Notes: data as of December 31, 20181. GreenTree Alliance Hotel brand changed to GT Alliance Hotel in 20182. Wumian Hotel’s English trademark is currently being registered.3. * Currently being registered as trademark in PRC
We have established a full product suite to capture a wide spectrum of market opportunities
(1)
Business to
Mid-to-up-scale
Mid-Scale
(1)
(Shell Hotel)
(2)
Economy
(2)
*

23
Hotel Breakdown by Segment
Number of Hotels in Operation Number of Hotel Rooms in Operation
2017 2018 2017 2018
Economy hotels 257 465 14,060 23,656
Vatica 104 117 7,704 8,674
Shell 153 348 6,356 14,982
Mid-scale 1,982 2,184 171,041 186,513
GreenTree Inn 1,733 1,881 151,154 162,844
GT Alliance 249 302 19,887 23,607
无眠酒店 (Wumian Hotel) - 1 - 62
Business to Mid-to-up-scale 50 108 5,706 11,360
GreenTree Eastern 50 87 5,706 9,487
VX - 11 - 969
Gme - 9 - 841
Gya - 1 - 63
Total 2,289 2,757 190,807 221,529
(1)
Notes:1. Wumian Hotel’s English trademark is currently being registered.
24
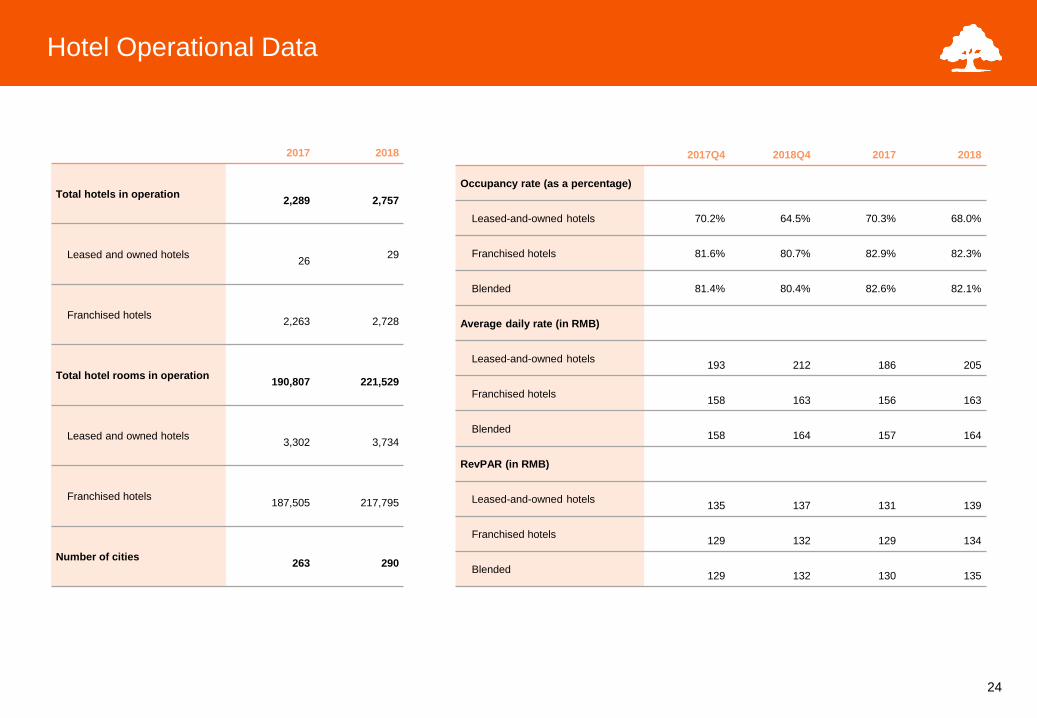
Hotel Operational Data
2017 2018
Total hotels in operation2,289 2,757
Leased and owned hotels 26
29
Franchised hotels 2,263 2,728
Total hotel rooms in operation 190,807 221,529
Leased and owned hotels 3,302 3,734
Franchised hotels 187,505 217,795
Number of cities 263 290
2017Q4 2018Q4 2017 2018
Occupancy rate (as a percentage)
Leased-and-owned hotels 70.2% 64.5% 70.3% 68.0%
Franchised hotels 81.6% 80.7% 82.9% 82.3%
Blended 81.4% 80.4% 82.6% 82.1%
Average daily rate (in RMB)
Leased-and-owned hotels 193 212 186 205
Franchised hotels 158 163 156 163
Blended 158 164 157 164
RevPAR (in RMB)
Leased-and-owned hotels 135 137 131 139
Franchised hotels 129 132 129 134
Blended 129 132 130 135