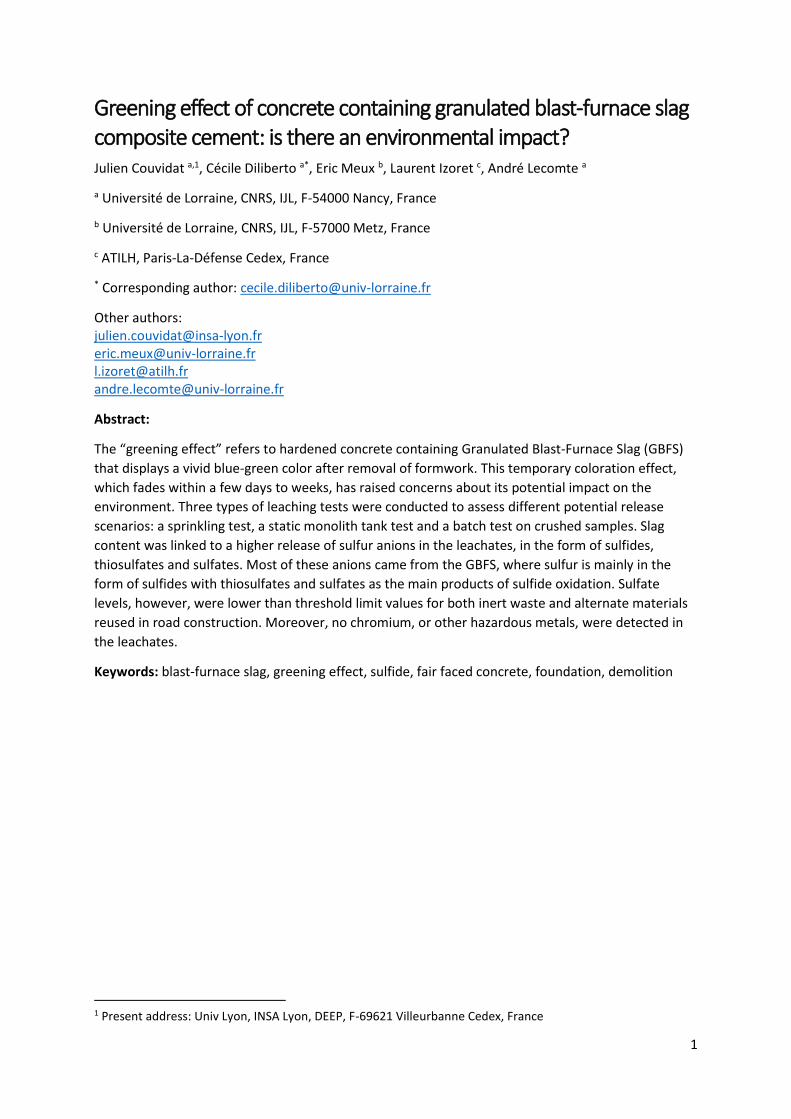
Greening effect of concrete containing granulated blast ...
22
HAL Id: hal-02894613 https://hal.archives-ouvertes.fr/hal-02894613 Submitted on 9 Jul 2020 HAL is a multi-disciplinary open access archive for the deposit and dissemination of sci- entific research documents, whether they are pub- lished or not. The documents may come from teaching and research institutions in France or abroad, or from public or private research centers. L’archive ouverte pluridisciplinaire HAL, est destinée au dépôt et à la diffusion de documents scientifiques de niveau recherche, publiés ou non, émanant des établissements d’enseignement et de recherche français ou étrangers, des laboratoires publics ou privés. Greening effect of concrete containing granulated blast-furnace slag composite cement: Is there an environmental impact? Julien Couvidat, Cécile Diliberto, Eric Meux, Laurent Izoret, André Lecomte To cite this version: Julien Couvidat, Cécile Diliberto, Eric Meux, Laurent Izoret, André Lecomte. Greening ef- fect of concrete containing granulated blast-furnace slag composite cement: Is there an en- vironmental impact?. Cement and Concrete Composites, Elsevier, 2020, 113, pp.103711. 10.1016/j.cemconcomp.2020.103711. hal-02894613
Transcript of Greening effect of concrete containing granulated blast ...

HAL Id: hal-02894613https://hal.archives-ouvertes.fr/hal-02894613
Submitted on 9 Jul 2020
HAL is a multi-disciplinary open accessarchive for the deposit and dissemination of sci-entific research documents, whether they are pub-lished or not. The documents may come fromteaching and research institutions in France orabroad, or from public or private research centers.
L’archive ouverte pluridisciplinaire HAL, estdestinée au dépôt et à la diffusion de documentsscientifiques de niveau recherche, publiés ou non,émanant des établissements d’enseignement et derecherche français ou étrangers, des laboratoirespublics ou privés.
Greening effect of concrete containing granulatedblast-furnace slag composite cement: Is there an
environmental impact?Julien Couvidat, Cécile Diliberto, Eric Meux, Laurent Izoret, André Lecomte
To cite this version:Julien Couvidat, Cécile Diliberto, Eric Meux, Laurent Izoret, André Lecomte. Greening ef-fect of concrete containing granulated blast-furnace slag composite cement: Is there an en-vironmental impact?. Cement and Concrete Composites, Elsevier, 2020, 113, pp.103711.�10.1016/j.cemconcomp.2020.103711�. �hal-02894613�
1
Greening effect of concrete containing granulated blast-furnace slag composite cement: is there an environmental impact? Julien Couvidat a,1, Cécile Diliberto a*, Eric Meux b, Laurent Izoret c, André Lecomte a
a Université de Lorraine, CNRS, IJL, F-54000 Nancy, France
b Université de Lorraine, CNRS, IJL, F-57000 Metz, France
c ATILH, Paris-La-Défense Cedex, France
* Corresponding author: [email protected]
Other authors: [email protected] [email protected] [email protected] [email protected]
Abstract:
The “greening effect” refers to hardened concrete containing Granulated Blast-Furnace Slag (GBFS)
that displays a vivid blue-green color after removal of formwork. This temporary coloration effect,
which fades within a few days to weeks, has raised concerns about its potential impact on the
environment. Three types of leaching tests were conducted to assess different potential release
scenarios: a sprinkling test, a static monolith tank test and a batch test on crushed samples. Slag
content was linked to a higher release of sulfur anions in the leachates, in the form of sulfides,
thiosulfates and sulfates. Most of these anions came from the GBFS, where sulfur is mainly in the
form of sulfides with thiosulfates and sulfates as the main products of sulfide oxidation. Sulfate
levels, however, were lower than threshold limit values for both inert waste and alternate materials
reused in road construction. Moreover, no chromium, or other hazardous metals, were detected in
the leachates.
Keywords: blast-furnace slag, greening effect, sulfide, fair faced concrete, foundation, demolition
1 Present address: Univ Lyon, INSA Lyon, DEEP, F-69621 Villeurbanne Cedex, France

2
1 Introduction Granulated Blast-Furnace Slag (GBFS) is a common by-product of iron and steel production. While
ground GBFS has a long history of varied uses, in the late 19th century, it began being used as a
supplementary cementitious material (SCM) to partially replace clinker in composite cements and
strengthen durability. The blue-green coloration or “greening” effect occurs when GBFS or GGBFS
are hydrated and will fade within days or weeks when exposed to air.
This greening effect is a well-documented phenomenon seen across a range of construction
applications that rely on CEM III based or slag based concretes, i.e. (a) civil engineering, (b) precast
concrete use in small- and large-scale construction (c) flooring and (d) masonry (Fig. 1). The issue has
been addressed by several professional journals and white papers [1,2].
Fig. 1. Examples of the “greening effect” in various sectors of construction - Photographs
illustrating the “greening effect” in different sectors of construction: a) civil engineering, b) pre-cast
industry, c) Flooring works, d) masonry works.
In France, while CEM III cement types (cement containing from 36 to 95% GGBFS) represent roughly
10% of overall production (16.5 M metric tons in 2018), the full range of overhead applications and
those using fair-faced concrete (excluding foundation work) that rely on CEM III and slag based
binders (CEM I type with Slag as addition) are potentially at stake.
The origin of this coloration effect was for a long time poorly understood, but more recent
investigations have pointed to the potential causal role of sulfur compounds in concrete aggregates.
One of the first studies to show how sulfides potentially contribute to coloration analyzed the
cement hydrates containing the sulfide ion into hydrated mortar, and found that hexagonal
aluminates hydrates contained a solid solution of sulfides and sulfates that displayed a characteristic
green color [3]. More recent studies have explored the origin of this coloration in GGBFS-containing
materials by using UV-Visible [4] or XANES spectroscopy [5] and concluded that radical polysulfides
(a) (b)
(c) (d)
3
anions are primarily responsible for the greening effect. In cement materials containing slag, low
porosity acts to prevent important oxygen penetration, and soluble sulfides are most likely
consumed by precipitation with cement hydrates rather than by an oxidative reaction [3]. Cement
hydration will then likely form a protective surrounding to the chromophore species, allowing the
metastable blue-green color to occur for hours, days or weeks.
To date, few studies have examined this phenomenon, despite a wide and historical use in civil
engineering and the cement industry. To the best of our knowledge, no studies have focused on the
potential environmental impacts whereas CEM III cement customers regularly question producers
and resellers about the safety of ‘blue-green concrete’. The concern is that this effect is consistently
present through several key construction phases including form removal, but also during
deconstruction, given that the blue-green color remains visible when a GBFS-containing concrete is
demolished.
The objective of this study was to assess the environmental impact of the greening effect occurring in
GBFS-rich material and CEM III based concretes. For this purpose, leaching tests were conducted on
materials made with commercially available GBFS-composite cements. These tests were performed
on cement Portland paste, for example, to study transport mechanisms of leached components, or
long-term leaching of hazardous trace metals [6,7]. Other authors have studied the leaching
characteristics of standard cement mortars during their whole life cycle, from first use to reuse or
recycling purposes [8]. Van der Sloot advised situating leaching tests as closely as possible to the field
conditions to be assessed. Studies that have focused on slag-based materials have emphasized the
intrinsic properties of the structure and its geochemical behavior [9].
Our understanding of the potential environmental impact of this phenomenon is surprisingly limited.
The fact that GBFS is widely used as a construction material merits a closer look at its geo-
environmental characteristics. The leaching tests were conducted on a standardized basis (monolithic
and crushed samples) in order to simulate the behavior of foundation concrete (monolithic) and
during a recycling process (crushed). The impact of rainfall on fair- faced (green) concrete was
assessed by means of a configuration (sprinkling test) developed by the authors for this specific
purpose. In addition, H2S emissions during demolding were determined using a second specific
configuration designed the authors.
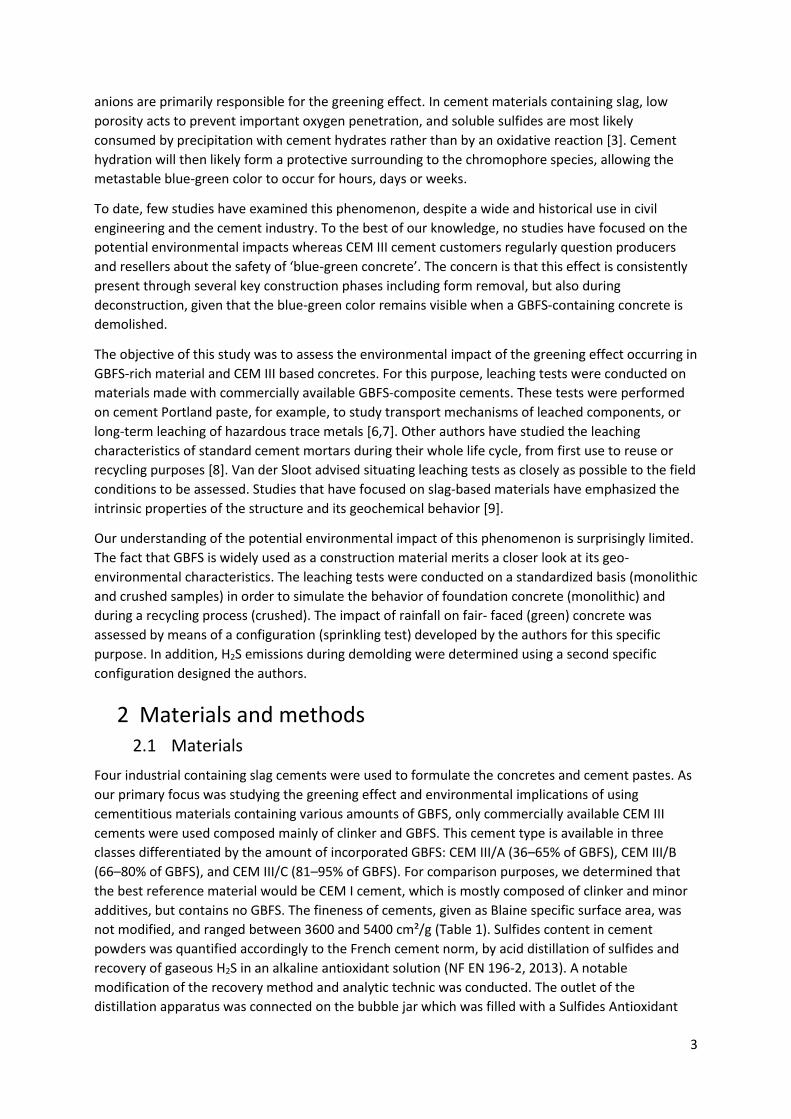
2 Materials and methods 2.1 Materials
Four industrial containing slag cements were used to formulate the concretes and cement pastes. As
our primary focus was studying the greening effect and environmental implications of using
cementitious materials containing various amounts of GBFS, only commercially available CEM III
cements were used composed mainly of clinker and GBFS. This cement type is available in three
classes differentiated by the amount of incorporated GBFS: CEM III/A (36–65% of GBFS), CEM III/B
(66–80% of GBFS), and CEM III/C (81–95% of GBFS). For comparison purposes, we determined that
the best reference material would be CEM I cement, which is mostly composed of clinker and minor
additives, but contains no GBFS. The fineness of cements, given as Blaine specific surface area, was
not modified, and ranged between 3600 and 5400 cm²/g (Table 1). Sulfides content in cement
powders was quantified accordingly to the French cement norm, by acid distillation of sulfides and
recovery of gaseous H2S in an alkaline antioxidant solution (NF EN 196-2, 2013). A notable
modification of the recovery method and analytic technic was conducted. The outlet of the
distillation apparatus was connected on the bubble jar which was filled with a Sulfides Antioxidant

4
Buffer (SAOB) solution. The SAOB solution was prepared with 80 g of NaOH, 35 g of ascorbic acid and
67 g of EDTA for one liter. This solution was then analyzed using a Silver/Sulfide ion-selective
electrode. All leachates were analyzed using the same method (see section II.4.d). Major composition
of cements was determined by X-Ray Fluorescence (XRF) on a Bruker S4 Explorer spectrometer using
SpectraPlus software (Table 1). Samples were prepared as melted beads by mixing 1 g of cement or
GBFS with 8 g of Lithium Tetraborate (LiB4O7) in a Pt-Au crucible (95-5 % w/w). Melting was
performed on an Autofluxer Breitlander fusion bead machine. Concretes were made with siliceous
alluvial (Moselle river) aggregates used for producing concrete in northeastern France. The cement
paste was made solely with CEM III/C, to assess the most concentrated sample in GBFS. Throughout
the rest of this article, concrete samples will be referred to by the cements used (i.e. CEM I, CEM
III/A, B or C) and the cement paste sample will be referred to as “P CEM III/C”.
Table 1. Composition of cements used for concretes and cement pastes preparation
Blaine surface
area GBFS S2- Al2O3 CaO Fe2O3 K2O MgO MnO Na2O SiO2 SO3
cm2/g wt.% g(S)/100g wt.%
CEM I 4370 0 - 5.44 62.91 3.03 0.81 1.89 0.08 0.20 20.69 3.33
CEM III/A 5400 62 0.61 9.91 48.91 1.84 0.55 4.64 0.39 0.35 29.74 2.72
CEM III/B 3643 71 0.55 9.56 47.62 1.15 0.55 4.99 0.24 0.22 31.32 3.52
CEM III/C 4662 85 0.74 10.54 44.87 0.79 0.34 5.80 0.28 0.31 33.74 3.00
Description: Composition of CEM I, CEM III/A, CEM III/B and CEM III/C cements is given in this table.
Blaine surface area is given as cm²/g, GBFS content of cement is given as wt.%, sulfides content is
given as g of sulfur for 100 g of cement, and major elements are given as oxides in wt.%.
2.2 Concrete and cement paste preparation and conditioning
Concrete and cement paste samples were prepared by mixing the required amounts of components
in a concrete mixer (Controlab Perrier). Concrete was made with a water/cement (w/c) ratio of 0.5,
with 420 kg/m3 of cement, 210 kg/m3 of water, 885 kg/m3 of 0–5 mm sand, and 750 kg/m3 of 4–8
mm gravel. Cement paste was made solely with water and cement with a w/c = 0.5. The mixing
procedure was performed according to the NF EN 196-1 (09/2016) standard for concrete samples,
and the NF EN 196-3 (09/2017) for cement pastes. Immediately after mixing, the paste was poured
into cylindrical hermetically sealed HDPE bottles (12.5 cm height and 7.2 cm diameter) at 3 time
intervals, each vibrated for 30 s on a vibrating table to remove air pockets within the sample.
Samples were cured in the dark for 3 days in a tank at 25°C and with a relative humidity greater than
90%.
2.3 Color analysis
Coloration of the samples was examined using a portable spectrophotometer Konica Minolta CM-
700d. This device allows a precise characterization of the color in each color space. We used a
common color space defined in 1976 by the International Commission on Illumination known as CIE
1976 (L*a*b*) or CIELAB, according to the NF EN ISO/CIE 11664-4 (07/2019) standard. The L*
parameter quantifies the brightness of the color (from darkest to lightest on a scale of 0 to 100),
whereas a* and b* quantify the chromaticity. On a diagram, the color on the a* axis ranges between
-60 (green) and +60 (red), and on the b* axis between -60 (blue) and +60 (yellow). All concrete and
cement paste samples subjected to the different leaching tests were assessed for their color just

5
before the test. The bottom face, being smaller, was analyzed for at least 3 different points, whereas
the larger side curved face was analyzed for at least 5 different points. Values were averaged for
each sample and each face, and then averaged for different samples.
2.4 Leaching tests
In the present study, we constructed three separate scenarios to determine where the greening
effect might have an impact on the surrounding environment. The rainfall leaching of a freshly
unmolded facing wall made with GBFS-rich cement is the scenario that is most visible by workers and
outside observers. To assess potential leaching of hazardous substances, we used a custom designed
test that involved sprinkling the block surface. The second scenario considered involved leaching by
immersion of freshly unmolded building foundations, largely because GBFS-rich cements are
frequently used in more aggressive wet environments. In this context, we used a standard monolith
leaching test. The last scenario considered rainfall leaching in deconstruction of materials containing
GBFS-rich cement, which constitutes the final step of building construction. In this case, a standard
batch leaching test on crushed samples was used.
2.4.1 Sprinkling leaching test
On working sites, after removal of formwork, “green” surfaces of slag cement-based concretes may
be subjected to rainy weather, especially heavy rainfall. To assess the effect of rainfall events on
concrete surfaces, an innovative leaching test was designed (Fig. 2). Its process consists of sprinkling
deionized water on a concrete or cement paste block and collecting it in a tank connected in a close
circuit to the sprinkler using a peristaltic pump.
Fig. 2. Experimental device of the sprinkling leaching test - A block of sample is fixed above a
container filled with water. Water is pumped with a peristaltic pump, and sprinkled on the sample by
a perforated tubing.
After a curing time of 3 days, a block of about 21.5 x 15.2 x 3.5 cm was fixed to the device above a
container filled with about 5 L of water, with a tilt angle of 40°. A peristaltic pump (Watson-Marlow
323E) at the speed of 100 RPM sprinkled the water over the surface of the block on a mean surface
of 370 cm2 through a regularly perforated PVC tubing (one hole of a rate of roughly 1 mm every 4
mm). The mean liquid/area ratio (L/A) obtained was close to 13.5 cm3/cm2. The water flowed on the
surface of the block at a rate of about 125 mL/min, and dropped into the container, to circulate again
for a total of 4 hours. Marprene tubing was used between the container and the top PVC tubing.
Blue-green concrete
Water container
Water circulation
Peristaltic pump
6
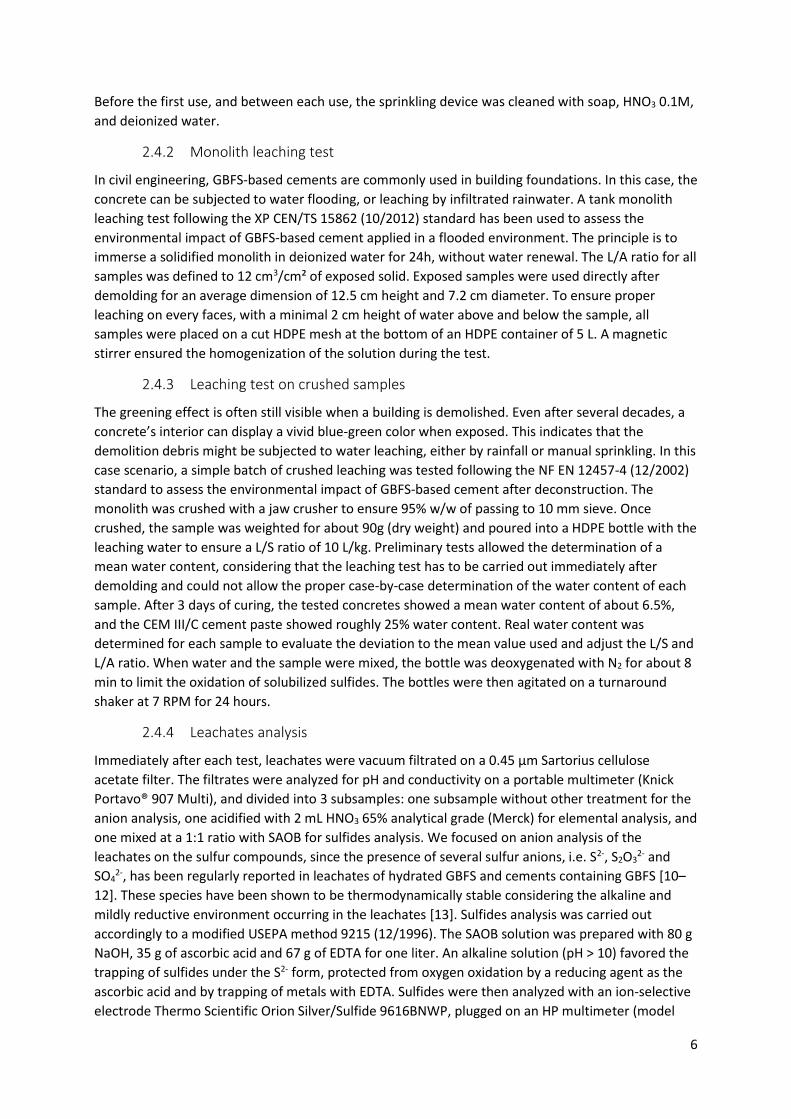
Before the first use, and between each use, the sprinkling device was cleaned with soap, HNO3 0.1M,
and deionized water.
2.4.2 Monolith leaching test
In civil engineering, GBFS-based cements are commonly used in building foundations. In this case, the
concrete can be subjected to water flooding, or leaching by infiltrated rainwater. A tank monolith
leaching test following the XP CEN/TS 15862 (10/2012) standard has been used to assess the
environmental impact of GBFS-based cement applied in a flooded environment. The principle is to
immerse a solidified monolith in deionized water for 24h, without water renewal. The L/A ratio for all
samples was defined to 12 cm3/cm² of exposed solid. Exposed samples were used directly after
demolding for an average dimension of 12.5 cm height and 7.2 cm diameter. To ensure proper
leaching on every faces, with a minimal 2 cm height of water above and below the sample, all
samples were placed on a cut HDPE mesh at the bottom of an HDPE container of 5 L. A magnetic
stirrer ensured the homogenization of the solution during the test.
2.4.3 Leaching test on crushed samples
The greening effect is often still visible when a building is demolished. Even after several decades, a
concrete’s interior can display a vivid blue-green color when exposed. This indicates that the
demolition debris might be subjected to water leaching, either by rainfall or manual sprinkling. In this
case scenario, a simple batch of crushed leaching was tested following the NF EN 12457-4 (12/2002)
standard to assess the environmental impact of GBFS-based cement after deconstruction. The
monolith was crushed with a jaw crusher to ensure 95% w/w of passing to 10 mm sieve. Once
crushed, the sample was weighted for about 90g (dry weight) and poured into a HDPE bottle with the
leaching water to ensure a L/S ratio of 10 L/kg. Preliminary tests allowed the determination of a
mean water content, considering that the leaching test has to be carried out immediately after
demolding and could not allow the proper case-by-case determination of the water content of each
sample. After 3 days of curing, the tested concretes showed a mean water content of about 6.5%,
and the CEM III/C cement paste showed roughly 25% water content. Real water content was
determined for each sample to evaluate the deviation to the mean value used and adjust the L/S and
L/A ratio. When water and the sample were mixed, the bottle was deoxygenated with N2 for about 8
min to limit the oxidation of solubilized sulfides. The bottles were then agitated on a turnaround
shaker at 7 RPM for 24 hours.
2.4.4 Leachates analysis
Immediately after each test, leachates were vacuum filtrated on a 0.45 µm Sartorius cellulose
acetate filter. The filtrates were analyzed for pH and conductivity on a portable multimeter (Knick
Portavo® 907 Multi), and divided into 3 subsamples: one subsample without other treatment for the
anion analysis, one acidified with 2 mL HNO3 65% analytical grade (Merck) for elemental analysis, and
one mixed at a 1:1 ratio with SAOB for sulfides analysis. We focused on anion analysis of the
leachates on the sulfur compounds, since the presence of several sulfur anions, i.e. S2-, S2O32- and
SO42-, has been regularly reported in leachates of hydrated GBFS and cements containing GBFS [10–
12]. These species have been shown to be thermodynamically stable considering the alkaline and
mildly reductive environment occurring in the leachates [13]. Sulfides analysis was carried out
accordingly to a modified USEPA method 9215 (12/1996). The SAOB solution was prepared with 80 g
NaOH, 35 g of ascorbic acid and 67 g of EDTA for one liter. An alkaline solution (pH > 10) favored the
trapping of sulfides under the S2- form, protected from oxygen oxidation by a reducing agent as the
ascorbic acid and by trapping of metals with EDTA. Sulfides were then analyzed with an ion-selective
electrode Thermo Scientific Orion Silver/Sulfide 9616BNWP, plugged on an HP multimeter (model

7
3478A). An electrode was calibrated with a serial dilution of a stock solution of Na2S. The stock
solution was sulfide ISE standard of 1000 mg/L bought at Mettler-Toledo and prepared daily with
Roth analytical grade Na2S in 0.4M NaOH. The stock solution was standardized with an AgNO3
solution, calibrated beforehand with a KCl solution, using a Tacussel TT-Processeur 2 automated
titrator equipped with the ion-selective silver/sulfide electrode. The subsamples for anion analysis
(SO42-, S2O3
2-, Cl-) were filtrated on 0.22 µm Sartorius filter and stored in the dark at 4°C. The analysis
was conducted on an ion chromatography instrument (Metrohm 882 Compact IC) with a chemical
suppressor and conductimetric detection, equipped with a Metrosep A Supp 4 column (250 x 4.0
mm) and a Metrosep A Supp 5 Guard/4.0 precolumn (5 x 4.0 mm). A mix Na2CO3 1.8 mM / NaHCO3
1.7 mM / 2% acetone was used as a mobile phase with a 1 mL/min flow rate and an injection volume
of 20 µL. Standard solutions for calibration were prepared in the laboratory from a certified Alfa
Aesar multi-anions commercial solution (ref. 041693) at 1000 µg/mL. Concentrations were
determined from peak areas. Major element analyses (Si, Al, Fe, Mn, Mg, Ca, Na, K, Cr) were carried
out by ICP-OES (Thermo Scientific iCAP 6500) on acidified subsamples.
2.5 H2S assessment
A custom designed device was used to assess the potential release of H2S during the demolding of
concretes containing GBFS (Fig. 3). This instrument is composed of a cell with a cylindrical section
with transparent PMMA (approx. 10.1 cm diameter and 25.4 cm height), and top and bottom
sections made of PTFE with an O-ring to ensure water and air tightness. Openings are situated on the
lower section and underneath to allow for inlet and outlet of fluids. The bottom cap is pierced and a
cable gland is inserted to allow for vertical movements of a metal rod equipped with a PTFE bucket.
Concrete is poured into the bucket, with a metal hook fixed at the top cap that dips into the
concrete. After 3 days, once the concrete has hardened, the hook becomes firmly secure and pulling
the metal rod allows the concrete cylindrical faces to be exposed. During the demolding process, a
constant argon flow is injected by the inlet valve at the bottom of the cell, and a pipe is connected to
a washing bottle filled with 200 mL of SAOB solution to trap H2S gas. The sulfide analysis of the SAOB
solution was performed with the silver/sulfide ion-selective electrode following the protocol
described previously (section II.4.d.).
Blue-green concrete
Screw
PTFE mold
Ar flow
SAOB solution

8
Fig. 3. Experimental device for H2S emission assessment - A closed chamber contained a concrete
sample in a mold, maintained by a screw to the cap of the device. A metal rod can move vertically in
the bottom of the device to remove the mold and expose the sample to an Ar flux bubbling in an
alkaline protective solution to trap H2S.
3 Results The greening effect of GBFS-containing concrete has gained increasing attention as a public health
concern, in part due to its visibility. From the demolding stage through to building deconstruction, a
number of known environmental events can cause deleterious interactions with green materials and
release potentially harmful compounds into the environment that could pose a risk to human health.
3.1 Analysis of the greening effect
The color of GBFS-containing materials was evaluated just prior to setting-up the leaching tests. The
effect of the GBFS concentration in the different samples was highlighted by the shifting of the color
to the green-blue side of the color space. Ranging from -0.24 for CEM I to -4.43 for the cement paste
of CEM III/C, a* decreased while the GBFS content increased in the mixture (Fig. 4a). This indicates
that the color turning more green corresponded with increased levels of GBFS (see Fig. 4b for
example). For the blue-yellow axis b*, the overall trend showed a decrease from 3.29 for CEM I to -
1.88 for the cement paste of CEM III/C. The color then shifted toward blue with increased GBFS
content. However, in this case, standard deviation between samples was considerably higher than
for a*, and ranged between 0.32 for CEM I sample and 0.9 for the cement paste of CEM III/C (for a* it
was contained in a 0.12–0.32 range). On an a*–b* plot, the samples are more scattered along the b*
axis than the a* axis (Fig. 4c). Samples with the same mixture appear gathered in clusters, and those
clusters are fairly widely spaced vertically.
-0.24 -0.40
-2.09
-3.61
-4.43
3.292.71 2.44
0.15
-1.88
-6
-4
-2
0
2
4
6
CEM ICEMIII/A
CEMIII/B
CEMIII/C
P CEMIII/C
a*/b
* ch
rom
atic
ity
axis
a* (average)
b* (average)
a

9
Fig. 4. Color analysis of concrete and cement paste samples - Average values for a* and b*
parameters of concrete and cement paste samples (a), pictures of concretes and cement paste (b),
and dispersion of samples on a* and b* axis depicted on the chromatic circle representing the L*a*b*
CIE 1976 color space, modified from www.colorimax.com (c).
Results for L* are not shown, as variation of the brightness for the different samples is close in range
(between 47.5 and 58.3 with SD from 2.65 to 7.77), without any identifiable trend.
3.2 Rainfall leaching of building faces: sprinkling test
The first leaching event on a freshly unmolded wall normally comes from rainfall. Given that classical
leaching tests for assessing environmental impact are less practical for gauging rainfall leaching on
horizontal concrete surfaces, we relied on our own test designed specifically for this purpose, as
described previously (cf. section II.4.a and Fig.2).
Concrete and cement pastes are alkaline mineral materials, as shown in our pH analysis following
leaching (Fig. 5). Concretes made with CEM III/A and CEM III/B are the most alkaline when subjected
to a surface dynamic leaching, with a pH value of about 11.3. For concrete with CEM III/C and cement
paste of CEM III/C, the pH is lower, around 10.9. Conductivity of the samples decreased from 0.36
mS/cm for CEM III/A concrete to about 0.18 mS/cm for CEM III/C concrete and cement paste.
Conductivity in this case appeared to increase with the Portland clinker content.
11.26
11.27
10.92
10.88
0.36
0.29
0.17
0.19
0.000.501.00
10 11 12 13 14
CEM III/A
CEM III/B
CEM III/C
P CEM III/C
Conductivity (mS/cm)
pH
pH
Conductivity
10
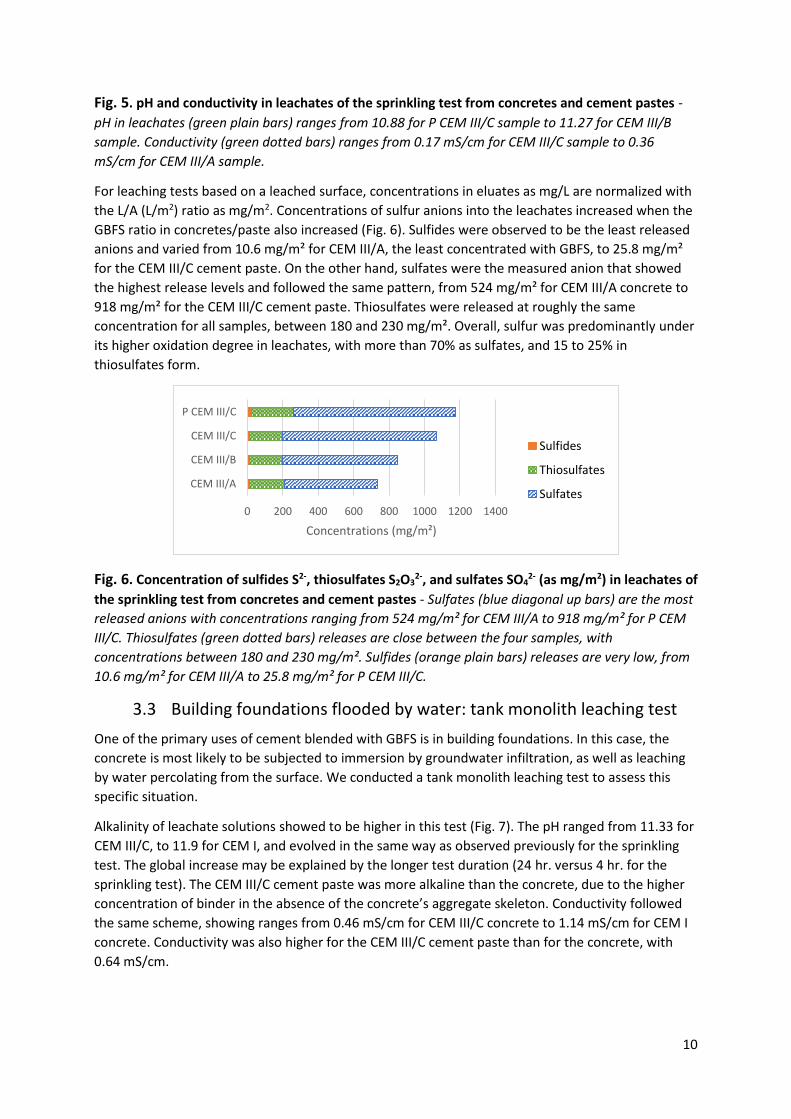
Fig. 5. pH and conductivity in leachates of the sprinkling test from concretes and cement pastes -
pH in leachates (green plain bars) ranges from 10.88 for P CEM III/C sample to 11.27 for CEM III/B
sample. Conductivity (green dotted bars) ranges from 0.17 mS/cm for CEM III/C sample to 0.36
mS/cm for CEM III/A sample.
For leaching tests based on a leached surface, concentrations in eluates as mg/L are normalized with
the L/A (L/m2) ratio as mg/m2. Concentrations of sulfur anions into the leachates increased when the
GBFS ratio in concretes/paste also increased (Fig. 6). Sulfides were observed to be the least released
anions and varied from 10.6 mg/m² for CEM III/A, the least concentrated with GBFS, to 25.8 mg/m²
for the CEM III/C cement paste. On the other hand, sulfates were the measured anion that showed
the highest release levels and followed the same pattern, from 524 mg/m² for CEM III/A concrete to
918 mg/m² for the CEM III/C cement paste. Thiosulfates were released at roughly the same
concentration for all samples, between 180 and 230 mg/m². Overall, sulfur was predominantly under
its higher oxidation degree in leachates, with more than 70% as sulfates, and 15 to 25% in
thiosulfates form.
Fig. 6. Concentration of sulfides S2-, thiosulfates S2O32-, and sulfates SO4
2- (as mg/m2) in leachates of
the sprinkling test from concretes and cement pastes - Sulfates (blue diagonal up bars) are the most
released anions with concentrations ranging from 524 mg/m² for CEM III/A to 918 mg/m² for P CEM
III/C. Thiosulfates (green dotted bars) releases are close between the four samples, with
concentrations between 180 and 230 mg/m². Sulfides (orange plain bars) releases are very low, from
10.6 mg/m² for CEM III/A to 25.8 mg/m² for P CEM III/C.
3.3 Building foundations flooded by water: tank monolith leaching test
One of the primary uses of cement blended with GBFS is in building foundations. In this case, the
concrete is most likely to be subjected to immersion by groundwater infiltration, as well as leaching
by water percolating from the surface. We conducted a tank monolith leaching test to assess this
specific situation.
Alkalinity of leachate solutions showed to be higher in this test (Fig. 7). The pH ranged from 11.33 for
CEM III/C, to 11.9 for CEM I, and evolved in the same way as observed previously for the sprinkling
test. The global increase may be explained by the longer test duration (24 hr. versus 4 hr. for the
sprinkling test). The CEM III/C cement paste was more alkaline than the concrete, due to the higher
concentration of binder in the absence of the concrete’s aggregate skeleton. Conductivity followed
the same scheme, showing ranges from 0.46 mS/cm for CEM III/C concrete to 1.14 mS/cm for CEM I
concrete. Conductivity was also higher for the CEM III/C cement paste than for the concrete, with
0.64 mS/cm.
0 200 400 600 800 1000 1200 1400
CEM III/A
CEM III/B
CEM III/C
P CEM III/C
Concentrations (mg/m²)
Sulfides
Thiosulfates
Sulfates
11
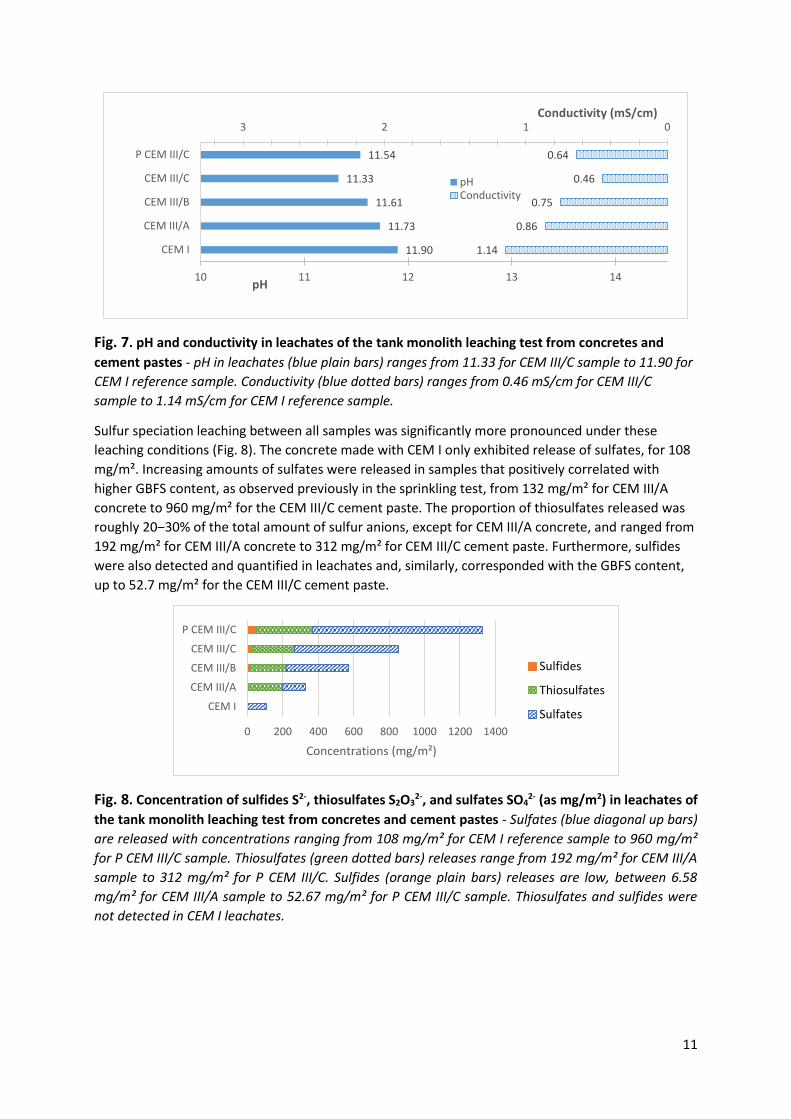
Fig. 7. pH and conductivity in leachates of the tank monolith leaching test from concretes and
cement pastes - pH in leachates (blue plain bars) ranges from 11.33 for CEM III/C sample to 11.90 for
CEM I reference sample. Conductivity (blue dotted bars) ranges from 0.46 mS/cm for CEM III/C
sample to 1.14 mS/cm for CEM I reference sample.
Sulfur speciation leaching between all samples was significantly more pronounced under these
leaching conditions (Fig. 8). The concrete made with CEM I only exhibited release of sulfates, for 108
mg/m². Increasing amounts of sulfates were released in samples that positively correlated with
higher GBFS content, as observed previously in the sprinkling test, from 132 mg/m² for CEM III/A
concrete to 960 mg/m² for the CEM III/C cement paste. The proportion of thiosulfates released was
roughly 20‒30% of the total amount of sulfur anions, except for CEM III/A concrete, and ranged from
192 mg/m² for CEM III/A concrete to 312 mg/m² for CEM III/C cement paste. Furthermore, sulfides
were also detected and quantified in leachates and, similarly, corresponded with the GBFS content,
up to 52.7 mg/m² for the CEM III/C cement paste.
Fig. 8. Concentration of sulfides S2-, thiosulfates S2O32-, and sulfates SO4
2- (as mg/m2) in leachates of
the tank monolith leaching test from concretes and cement pastes - Sulfates (blue diagonal up bars)
are released with concentrations ranging from 108 mg/m² for CEM I reference sample to 960 mg/m²
for P CEM III/C sample. Thiosulfates (green dotted bars) releases range from 192 mg/m² for CEM III/A
sample to 312 mg/m² for P CEM III/C. Sulfides (orange plain bars) releases are low, between 6.58
mg/m² for CEM III/A sample to 52.67 mg/m² for P CEM III/C sample. Thiosulfates and sulfides were
not detected in CEM I leachates.
11.90
11.73
11.61
11.33
11.54
1.14
0.86
0.75
0.46
0.64
0123
10 11 12 13 14
CEM I
CEM III/A
CEM III/B
CEM III/C
P CEM III/C
Conductivity (mS/cm)
pH
pHConductivity
0 200 400 600 800 1000 1200 1400
CEM I
CEM III/A
CEM III/B
CEM III/C
P CEM III/C
Concentrations (mg/m²)
Sulfides
Thiosulfates
Sulfates

12
3.4 Deconstruction products leaching by rainfalls: leaching test on
crushed samples
Deconstruction is the other aspect to take into account when it comes to common uses of slag-
containing cements. A leaching test on crushed samples was used to assess the potential release
from deconstruction debris subjected to both natural rainfalls and artificial sprinkling.
Leachates from the crushed leaching tests showed to be the most alkaline of the three tests (Fig. 9).
Regardless of the type of cement used, all leachates exceeded 12 pH units, and ranged from 12.10
for CEM III/C concrete to 12.49 for CEM I concrete. Conductivity was also higher, with 1.92 mS/cm for
the CEM III/C concrete to 7.36 mS/cm for the CEM I concrete.
Fig. 9. pH and conductivity in leachates of the crushed leaching test from concretes and cement
pastes - pH in leachates (orange plain bars) ranges from 12.10 for CEM III/C sample to 11.49 for CEM
I reference sample. Conductivity (orange dotted bars) ranges from 1.92 mS/cm for CEM III/C to 7.36
mS/cm for CEM I reference sample.
For leaching tests dependent on the mass of the assessed materials, units in mg/L were normalized
with the L/S (L/kg of dry weight material) ratio as mg/kg dry weight (DW). High releases of sulfur
anions were observed in the crushed leaching test (Fig. 10). The CEM I concrete released a negligible
amount of thiosulfates, about 11 mg/kg DW, but no sulfates were found in the leachates. As such,
thiosulfates represented from one to two thirds of the total sulfur anions found in other concretes
and cement paste, ranging from 58 to 154 mg/kg DW. The other form of sulfur was sulfates, with 31
and 25 mg/kg DW respectively for CEM III/A and B concretes leachates, and increased to 204 mg/kg
DW for CEM III/C concrete, and 112 mg/kg DW for CEM III/C cement paste. Sulfur content was
noticeably well divided between the 3 forms analyzed for the CEM III/C cement paste, given that
close to 165 mg/kg DW of sulfides was recovered in the leachates.
12.49
12.33
12.36
12.10
12.38
7.36
3.47
3.36
1.92
3.63
05101520
11 12 13 14
CEM I
CEM III/A
CEM III/B
CEM III/C
P CEM III/C
Conductivity (mS/cm)
pH
pHConductivity
0 100 200 300 400 500
CEM I
CEM III/A
CEM III/B
CEM III/C
P CEM III/C
Concentrations (mg/kg)
Sulfides
Thiosulfates
Sulfates

13
Fig. 10. Concentration of anions sulfides S2-, thiosulfates S2O32-, and sulfates SO4
2- (in mg/kg dry
weight) in leachates of the crushed leaching test from concretes and cement pastes - Sulfates (blue
diagonal up bars) are released with concentrations ranging from 25 mg/kg DW for CEM III/B sample
to 204 mg/kg DW for CEM III/C sample. Thiosulfates (green dotted bars) releases range from 11
mg/kg DW for CEM I reference sample to 154 mg/kg DW for P CEM III/C. Sulfides (orange plain bars)
releases range between 6.58 mg/m² for CEM III/A sample to 52.67 mg/m² for P CEM III/C sample.
Thiosulfates and sulfides were not detected in CEM I leachates.
3.5 H2S assessment
A typical phenomenon during formwork removal blue-green concrete is the presence of a
characteristic odor resembling the distinct smell commonly associated with hydrogen sulfide. The
main issue with use of this particular compound is one of safety; its high toxicity may increase health
and environmental risks. According to WHO guidelines, the recommended safe exposure limit is 0.15
mg/m3 over a 24 hour period [14].
The purpose of our customized instrument was to detect and quantify the potential emission of H2S
during the unmolding process. Argon was set to flow for 30 minutes after demolding, and bubbled in
200mL SAOB solution to trap emitted H2S. No sulfides were recovered with this method. The limit of
detection of the ISE silver/sulfide electrode is about 3.10-3 mg/L. Under the experimental conditions,
this equated a minimum of 6.10-4 mg emitted by the concrete that could be quantified in the final
solution.
4 Discussion 4.1 Trace and major elements releases in the different scenarios
In this study, three scenarios involving the potential impact of the greening effect of GBFS-rich
cement were considered. Trace and major elements were analyzed and quantified in the leachates.
Despite relatively recent investigations pointing to the potentially important role of sulfur
compounds in the greening effect process, notably under the sulfide form, it was previously thought
that other compounds might also be involved. This was the case for iron and manganese compounds
[15–17], and even chromium salts such as CrCl3.6H2O. Accordingly, we included these elements for
analysis in the leachates, and paid particularly close attention to chromium content for the known
health hazards associated with its exposure. In the three cases, no Cr element was found in the
leachates (detection limit was 0.06 mg/L), and Fe and Mn elements were under the detection limit,
or showed statistical uncertainty near the detection limit (respectively 0.01 mg/L and 0.001 mg/L).
This is consistent with the literature on the use of cement (either with or without GBFS) in
cementitious solidification/stabilization (S/S) treatment processes of hazardous wastes, including
those contaminated with chromium [18]. Moreover, Fe and Mn were not expected to be leached
considering their significantly low solubility in the alkaline conditions of cementitious materials [19].
We observed Na, K, Ca, Al, and Si among the major elements released by cement and GBFS leaching,
although their release through rainfall leaching or solubilization and diffusion into groundwater does
not typically represent an environmental hazard. While cement and blast furnace slag have similar
raw composition, mainly composed of CaO, SiO2 and Al2O3, proportions of oxides varied. Compared
with Portland cement, GBFS is richer in SiO2 and Al2O3, and depleted in CaO [19]. In fact, CEM I is
composed of nearly 62.9% of CaO, 5.4% of Al2O3, and 20.7% of SiO2 (Table 1). In CEM III/C, where
85% of clinker was replaced by GBFS, CaO was reduced to 44.9%, with almost twice of Al2O3 (10.5%)
and 33.7% of SiO2. The global trend of both CEM I to CEM III/C was decreased levels of CaO, and
14
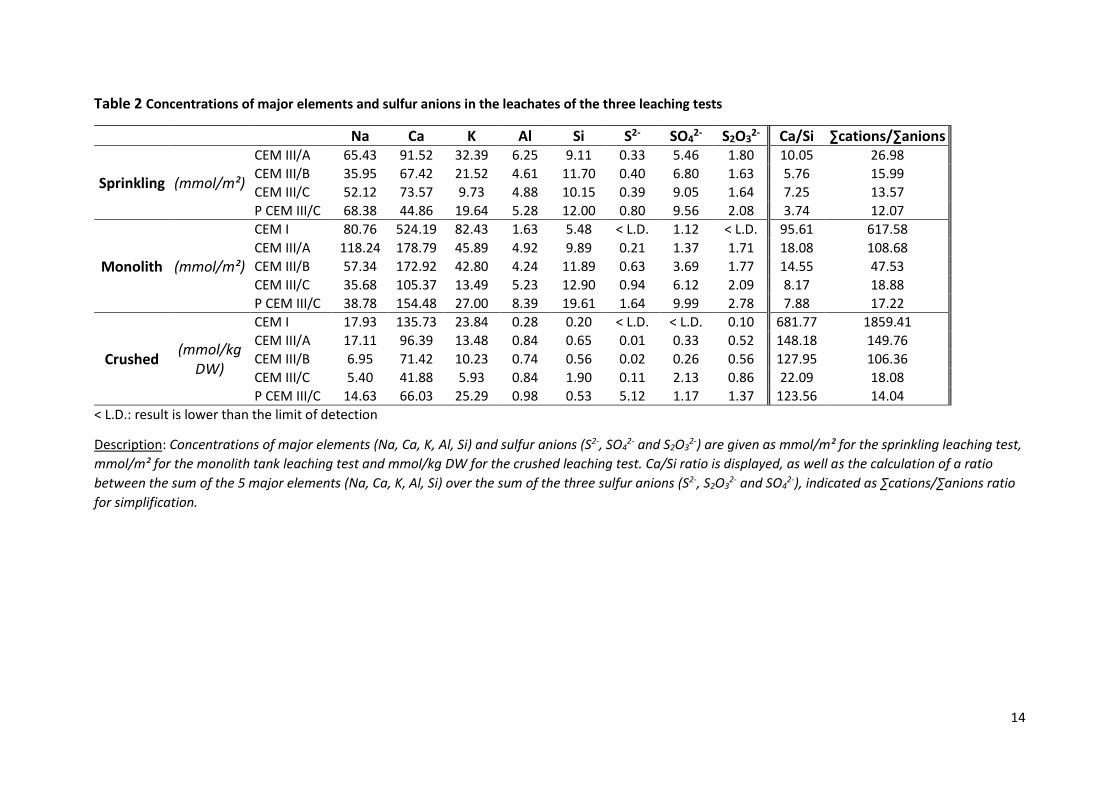
Table 2 Concentrations of major elements and sulfur anions in the leachates of the three leaching tests
Na Ca K Al Si S2- SO42- S2O3
2- Ca/Si ∑cations/∑anions
Sprinkling (mmol/m²)
CEM III/A 65.43 91.52 32.39 6.25 9.11 0.33 5.46 1.80 10.05 26.98
CEM III/B 35.95 67.42 21.52 4.61 11.70 0.40 6.80 1.63 5.76 15.99
CEM III/C 52.12 73.57 9.73 4.88 10.15 0.39 9.05 1.64 7.25 13.57
P CEM III/C 68.38 44.86 19.64 5.28 12.00 0.80 9.56 2.08 3.74 12.07
Monolith (mmol/m²)
CEM I 80.76 524.19 82.43 1.63 5.48 < L.D. 1.12 < L.D. 95.61 617.58
CEM III/A 118.24 178.79 45.89 4.92 9.89 0.21 1.37 1.71 18.08 108.68
CEM III/B 57.34 172.92 42.80 4.24 11.89 0.63 3.69 1.77 14.55 47.53
CEM III/C 35.68 105.37 13.49 5.23 12.90 0.94 6.12 2.09 8.17 18.88
P CEM III/C 38.78 154.48 27.00 8.39 19.61 1.64 9.99 2.78 7.88 17.22
Crushed (mmol/kg
DW)
CEM I 17.93 135.73 23.84 0.28 0.20 < L.D. < L.D. 0.10 681.77 1859.41
CEM III/A 17.11 96.39 13.48 0.84 0.65 0.01 0.33 0.52 148.18 149.76
CEM III/B 6.95 71.42 10.23 0.74 0.56 0.02 0.26 0.56 127.95 106.36
CEM III/C 5.40 41.88 5.93 0.84 1.90 0.11 2.13 0.86 22.09 18.08
P CEM III/C 14.63 66.03 25.29 0.98 0.53 5.12 1.17 1.37 123.56 14.04
< L.D.: result is lower than the limit of detection
Description: Concentrations of major elements (Na, Ca, K, Al, Si) and sulfur anions (S2-, SO42- and S2O3
2-) are given as mmol/m² for the sprinkling leaching test,
mmol/m² for the monolith tank leaching test and mmol/kg DW for the crushed leaching test. Ca/Si ratio is displayed, as well as the calculation of a ratio
between the sum of the 5 major elements (Na, Ca, K, Al, Si) over the sum of the three sulfur anions (S2-, S2O32- and SO4
2-), indicated as ∑cations/∑anions ratio
for simplification.
15
increased levels of Al2O3 and SiO2. The lack of available Ca in GBFS high substituted systems leads to
the consumption of Portlandite hydrates to allow precipitation of C‒S‒H, and the enrichment in Al2O3
of C‒S‒H to form C‒A‒S‒H [20,21]. This behavior can be observed in the leachates chemistry and
matches our own results of the Ca/Si ratio of leachates (Table 2). We observed an overarching trend
in Ca and Si releases of a decreased Ca/Si ratio that appeared to correlate with increased GBFS
content, presumably due to the fact that the Calcium is consumed by C‒S‒H incorporated into GBFS
containing pastes. This was particularly the case for the crushed test and the monolith tank test,
where CEM I concrete showed a Ca/Si ratio 5 to 30 times higher than the other concretes and
cement paste. Consequently, Ca/Si decreased in the following order: CEM III/A > CEM III/B > CEM
III/C. Calcium leaching mostly comes from the dissolution of Portlandite and interstitial solutions,
whereas Si comes from the incongruent dissolution of C‒S‒H [9]. In the crushed test, the cement
paste had a higher ratio than CEM III/C, given that the overall concentration was not diluted by
aggregates. This was not observed for the other tests specific to surface leaching, unlike the crushed
test.
The second effect of portlandite dissolution is that the alkalinity of the leachates increases. Cement
containing more GBFS contains less clinker and consequently lowers CaO levels. If less portlandite
forms when the concrete or cement paste is leached, less portlandite is dissolved which induces a
lower pH. The pH ranges obtained for each test differed: the sprinkling test showed a pH range of
10.88‒11.26, the monolith tank test showed a pH range of 11.33‒11.90, and the crushed test pH
range was observed a 12.10‒12.49 (Fig. 5, 7 and 9). These differences depend, to a certain degree,
on the testing method itself. The sprinkling test is carried out over a relatively short time duration
and only leaches the surface of the block, often a very thin superficial layer. In the monolith tank test,
the block was immersed for 24 hours, wherein water could penetrate the first millimeters of the
surface, allowing a deeper leaching by diffusion. Finally, the crushed leaching test involved a highly
specific surface due to block crushing, which allowed a high dissolution of hydrates and access to
inner portions of the block.
Examining electrical conductivity of leachates is a particularly reliable way to assess the behavior of
concrete and cement blocks subjected to various leaching test conditions. Conductivity ranges for the
sprinkling test were between 0.17 and 0.36 mS/cm, for the monolith test between 0.46 and 1.14
mS/cm, and for the crushed test between 1.92 and 7.36 mS/cm (Fig. 5, 7 and 9). The crushed test
proved by far to be the most “extractive” method, followed by the monolith tank test, and then the
sprinkling test. Moreover, the same observations were made for a similar leaching test which showed
a decrease of conductivity in leachates when GBFS content increased. In addition to the availability of
the more soluble species (i.e. Ca(OH)2 in particular), the porosity might also affect the dissolution,
diffusion, and subsequent leaching of the more soluble species. In a solidified cement paste, and by
extension in concrete, the mass transport is controled by the diffusion mechanism, and depends on
the matrix’ porosity [7]. Importantly, GBFS impacts porosity, and effectively will lower the overall
porosity of concretes and cement paste [22]. Thus, blocks with a high level of GBFS not only have less
Portlandite, but are also less likely to diffuse and release elements and ions due to lower
permeability. The amounts of the major elements (Na, Ca, and K) released in leachates decrease
when GBFS increases (Table 2). Compared to those elements, the trend of Al is different. Between
CEM III/A, B, and C concretes, Al slightly varies in a close range, 4.31‒6.25 mmol/m² for sprinkling
test, 4.24‒5.23 mmol/m² for monolith tank test, and 0.74‒0.84 for crushed test, with CEM III/B being
lower than for CEM III/A and CEM III/C. This is consistent with the cement composition, as CEM III/B
has a lower Al2O3 content than the two others with 9.56% versus 9.91 and 10.54% respectively for
CEM III/A and CEM III/C (Table 1). Furthermore, despite the higher content of Al2O3 in GBFS-rich

16
concretes, Al leaching is most likely limited by the solubility of the incorporated hydrates, or Al
dissolution may be controlled by precipitation of secondary Al-oxyhydroxides phases [23].
The leaching tests used in this study were designed to represent selected scenarios where a blue-
green material is subjected to bad weather or environmental situations leading to surface or mass
leaching. The choice of the monolith tank test and the crushed leaching test was made to follow as
close as possible the related standard (i.e. NF EN 14957-4 12/2002 and XP CEN/TS 15862, 10/2012).
For future environmental assessment of construction materials, these initial conditions could be
improved. One European standard currently in development aims specifically to normalize the
ecotoxicological assessment of construction materials and suggests reducing the L/S or L/A to
concentrate the released compounds (draft standard “Construction Products - Assessment of release
of dangerous substances – Determination of ecotoxicity of construction product eluates” FprCEN/TS,
2019). This could be specifically pertinent when applied to the monolith test, which by design
concentrates on gauging minimal quantities of leaching solution required to surround the sample.
Regarding the released concentrations in the crushed test, a L/S of 10 might be sufficient. This
particular test, however, is possibly the most distant approximation of a real-life scenario, more so
than the other two, in that it simulates a more aggressive environment than what would typically be
associated with construction debris. It is highly unlikely than such debris would remain immersed in a
large amount of water. It is more likely to be sporadically sprinkled with water by workers or rainfall.
In this case, an innovative test could be developped, such as test that might account for column
leaching but with a transient water regime, including dry phases, similar to those used in other fields
as for marine sediments [24]. In the same way, the sprinkling leaching test was designed to fill a gap,
since no surface dynamic test was found in literature. Even if the water regime is continuous, this
test is probably the most realistic in terms of releases, although the L/A is the highest with about
13.5 cm3/cm2. This L/A is calculated as the ratio of the total volume of leaching solution (5000 cm3)
by the leached area of the block (about 370 cm2, representing the top surface and one of the small
sides). In this case, the L/S might be reduced, by decreasing the volume of leaching solution.
Moreover, this test accounts for a virtual L/A, by taking into account the total volume of 30 liters
sprinkled, because the pump is set to a speed of 125 mL/min, and the test duration is 4 hrs. On a
mean surface of 370 cm² during the duration of the test, a mean L/A of 79 cm3/cm2 is obtained. This
is effectively close to an annual rainfall of about 800 mm, which is equal to 80 cm3/cm2.
4.2 Sulfur speciation in leachates
Unlike major elements, sulfur anions tend to increase in leachates when GBFS concentrations are
higher in concretes and cement paste (Table 2). However, major elements and sulfur anions are not
released in the same proportions. The sum of the 3 sulfur anions (S2-, S2O32- and SO4
2-) is always at
least 10 times lower than the sum of the 5 major elements released (Na, K, Ca, Si, Al). For the
sprinkling test, the ∑cations/∑anions ratio increased from 12 for the CEM III/C cement paste to 27 for
CEM III/A concrete. For the monolith tank test, this ratio expanded from 17.2 for P CEM III/C to 108.7
for CEM III/A concrete, and even 617.6 for CEM I concrete. Finally, for the crushed leaching test, the
ratio went from 14.0 for P CEM III/C to 149.8 for CEM III/A, and 1859.4 for CEM I.
The increase of sulfur anions in the leachates of GBFS-rich materials is not surprising, given that GBFS
includes noticeable quantities of reduced sulfur compounds which promptly react when GBFS is
hydrated. This mechanism is probably at the origin of the blue-green color. Unlike clinker, essentially
all sulfur in GBFS is present in sulfide form due to the reducing conditions in the blast furnace [12,25].
Cement containing up to 90% GBFS can reach a redox potential of -250 to 350 mV (versus calomel
electrode) [26,27]. Thus, sulfur speciation might take different forms in interstitial water, from
sulfides (oxidation degree of –II) to sulfates (+VI) [10,11]. When GBFS-rich material is subjected to

17
leaching, those sulfur species can be easily leached, and most oxidizable species, i.e. sulfides, might
be readily oxidized when leached, depending on the oxygen diffusion during the leaching test. The
three tests performed in this study showed not only the presence of sulfates in leachates, but also
thiosulfates and sulfides. Up to 0.80 mmol/m² (0.19 mg/L measured in the solution) of sulfides were
quantified in the sprinkling test for the CEM III/C cement paste. Sulfides concentration reached 1.64
mmol/m² (0.44 mg/L in the solution) for the same material in the monolith tank test, and 5.12 mmol
/kg DW (16.55 mg/L) in the crushed leaching test. In the same way, thiosulfates in the CEM III/C
cement paste was quantified to 2.08 mmol/m², 2.78 mmol/m² and 1.37 mmol/kg DW respectively in
the sprinkling test, monolith test, and the crushed leaching test. Thermodynamically, sulfides are
oxidized in sulfates. However, it has been shown than the main products of sulfides’ oxidation by
molecular oxygen at pH > 8.5 are thiosulfates, and oxidation to the most stable product can take
weeks [28–30]. From the three leaching tests used in this study, the sprinkling test was estimated to
favor oxygen diffusion by creating a thin moving water slide upon a large area, unlike the monolith
tank test for example. Yet, despite the bottles in the crushed test being purged with N2, it is likely
that oxygen concentrations were lowered, but not removed, as a function of the short duration time
of the bubbling. Thus, even with reduced oxygen content, the crushed leaching test is more likely
highly oxidative for released sulfides because of the 24 hours of turnaround shaking. Our results
show a relatively low recovery of sulfides, for example for CEM III/B concrete, in the crushed samples
test compared to the monolith test (0.02 mmol/kg DW versus 0.63 mmol/m², or 0.06 mg/L versus
0.17 mg/L in the leachates solutions) (Table 2). Moreover, CEM I only released about 1.12 mmol/m²
of sulfates in the monolith test, or 0.10 mmol/kg DW of thiosulfates for the crushed test, meaning
that for other samples, the majority of sulfur anions leached comes from the sulfides leaching and
oxidation originated from GBFS. Finally, it is not surprising not to find gaseous H2S during the
unmolding process. With a pKa1 = 7.04 and a pKa2 = 11.96, and considering the strong alkaline pH, it
seems unlikely that sulfides turn into H2S.
The most striking aspect of the sulfur chemistry occurring in GBFS-rich materials is the origin of the
blue-green color. In fact, the intensity of the color effect is basically a slag conditional mechanism
and is related to sulfides content. In particular, the association of the three chromophorous radical
ions S4·-, S3
·-, S2·- is responsible for the blue-green color of the hydrated slag [2]. In Lapis Lazulis, the
mix of chromophores S2·- (yellow) and S3
·- (blue) in zeolithe-type structures explains the ultramarine
colors ranging from deep blue to green [31]. For cement, the appearance of the greening color
depends more highly on the replacement ratio of clinker by GBFS (Fig. 4). From almost 100% of
clinker (for CEM I) to 85% replacement by GBFS (CEM III/C), the color shifts to green, toward –a*, and
blue, toward –b*. Vernet proposed that the color is concentrated in a fraction containing a solid
solution of sulfides and sulfates in an aluminate hydrate [3]. The precise chemistry governing the
appearance and disappearance of the blue-green color has not yet been determined. However, the
disappearance of the color probably involves an oxidation of the sulfides by molecular oxygen
penetrating in the superficial surface. Preliminary experiments showed that the color took some
weeks to disappear. Below 20 cm of water, the color does not visually change for months.
Finally, concerning the human health impact of such leachates, we detected no hazardous
substances, except dissolved sulfides. Regarding these dissolved sulfides, there is no threshold value
in any recommendation from Word Health Organization.
Gas emission from use of hydrogen sulfides is unlikely to occur, but depending on the GBFS content,
sulfides might be released during leaching by rainfall or groundwater. As chemical oxidation of
sulfides to sulfates by molecular oxygen is a slow process, sulfides might be spilled into groundwater
[32]. However, two processes will quickly prevent any accumulation or damages to the environment.

18
Firstly, even if the chemical oxidation is slow, some ionic species act as catalysts for this reaction,
such as Mn2+, Fe2+ or Cu2+, and reduce the meta-stability of sulfides from one or two orders of
magnitude [33,34]. Biotic oxidation with sulfo-oxidant bacteria is also highly effective for sulfides
oxidation [32]. Additionally, precipitation with trace metals is another means of removing sulfides
from the leaching solution, since metals such as Zn (pKs = 23 for Sphalerite), Cu (pKs = 47.6 for Cu2S)
or Pb (pKs = 27 for PbS) form insoluble sulfides [35]. Incidentally, no threshold was determined for
soluble sulfides by WHO [14]. Concerning the environmental impact, sulfate is the only compound
which can be potentially problematic. For comparison purposes, the values obtained in this study can
be compared to French legislation, concerning the admission of inert wastes into classified
installation [36]. Concrete is included in the category of recognized inert wastes. For this purpose,
the waste is submitted for leach testing and needs to comply with threshold values for 18
parameters. Sulfates are one of the parameters, with a threshold value of 6000 mg/kg DW for L/S =
10 ml/g DW. Also, a more severe threshold is observed for the reuse of slags in road construction,
with a threshold value for sulfates of 1300 mg/kg DW for type 3 use [37]. The highest value obtained
in this study was 204 mg/kg DW for CEM III/C concrete, almost 20 times lower than the legislation
threshold (Fig. 10).
For a more thorough environmental study of construction materials, additional aspects might well be
considered. In particular, beyond the chemical leaching behavior, it could be useful to assess the
ecotoxicological aspects [38].
5 Conclusions Greening effect occurs either during removal of formwork of blast furnace cement (CEM III) based
concrete, or demolishing CEM III based old concrete, and has raised question about its
environmental and health safety. Three scenarios were studied, with a specific leaching test for each:
– Freshly demolded fair faced blue-green concrete subjected to leaching by rainfall was
assessed with an innovative leaching test designed to sprinkle water on the surface of a
concrete block;
– CEM III based concrete of building foundations immersed in groundwater was assessed with
a standard monolith leaching test;
– Demolition debris of old concrete blocks containing GBFS, sprinkled with water by workers or
by rainfall was assessed with a standard batch leaching test on crushed samples.
Three cements with GBFS were selected (CEM III/A, CEM III/B and CEM III/C) to form concrete blocks
and one cement paste (with CEM III/C cement), and one reference (CEM I, clinker only) as concrete.
The greening effect was observed to correlate with concentrations of GBFS, wherein the color shifted
to green and blue with the increase of GBFS content. Slag content in concretes and cement paste was
also linked to a higher release of sulfur anions in the leachates, in the form of sulfides, thiosulfates
and sulfates. Compared to the very low releases of sulfur anions in CEM I leachates, 108 mg/m2 of
sulfates in tank monolith test and 11 mg/kg of Dry Weight (DW) of thiosulfates in a crushed leaching
test, it appears that most of these anions came from GBFS, where sulfur is mainly under sulfides
form. As such, thiosulfates and sulfates are the main oxidation products of sulfides included in GBFS.
For example, sulfates release in the monolith tank test for CEM III/C concrete is 588 mg/m2, with 30.1
mg/m2 of sulfides and 234 mg/m2 of thiosulfates. Nevertheless, sulfates levels reported here are
lower than thresholds for inert wastes or for reuse of alternate materials in road construction.
Moreover, no chromium, or other hazardous metals, were detected in leachates. The major
elements released were Na, K and Ca.

19
6 Acknowledgments The authors wish to thank the LCPME Laboratory (Villers-lès-Nancy, France) for its contribution to the
leachates analysis of sulfur anions, and the SARM Laboratory (CRPG, Vandoeuvre-lès-Nancy, France)
for its contribution to the element analysis. The authors also want to acknowledge Vincent Chatain
from the DEEP laboratory (INSA Lyon, Villeurbanne, France) for the material support that allowed us
to develop the H2S analysis device, and José Manuel-Lopez (ICPM, University of Lorraine, Metz,
France) for building the sprinkling device. The authors also wish to thank Dimitri Loschi for his help
designing our artwork. Finally, the authors are particularly grateful for invaluable financial backing
from the ATILH Professional Association (Paris-La-Defense, France), and especially Horacio Colina for
offering constant support throughout the project.
7 References [1] Euroslag, Technical leaflet n°1 “Granulated Blastfurnace Slag,” (2003).
https://www.euroslag.com/wp-content/uploads/2018/12/LeafletGBS.pdf (accessed May 14, 2020).
[2] Slag Cement Association, Slag Cement in Concrete N°10 - “Greening,” (2013). https://www.slagcement.org/portals/11/Files/PDF/IS-10.pdf (accessed May 14, 2020).
[3] C. Vernet, Comportement de l’ion S-- au cours de l’hydratation des ciments riche en laitier (CLK), Silic. Ind. 47 (1982) 85–89.
[4] D. Le Cornec, Q. Wang, L. Galoisy, G. Renaudin, L. Izoret, G. Calas, Greening effect in slag cement materials, Cem. Concr. Compos. 84 (2017) 93–98. https://doi.org/10.1016/j.cemconcomp.2017.08.017.
[5] M. Chaouche, X.X. Gao, M. Cyr, M. Cotte, L. Frouin, On the origin of the blue/green color of blast-furnace slag-based materials: Sulfur K-edge XANES investigation, J. Am. Ceram. Soc. 100 (2017) 1707–1716. https://doi.org/10.1111/jace.14670.
[6] S.R. Hillier, C.M. Sangha, B.A. Plunkett, P.J. Walden, Long-term leaching of toxic trace metals from Portland cement concrete, Cem. Concr. Res. 29 (1999) 515–521. https://doi.org/10.1016/S0008-8846(98)00200-2.
[7] K. Haga, S. Sutou, M. Hironaga, S. Tanaka, S. Nagasaki, Effects of porosity on leaching of Ca from hardened ordinary Portland cement paste, Cem. Concr. Res. 35 (2005) 1764–1775. https://doi.org/10.1016/j.cemconres.2004.06.034.
[8] H.A. van der Sloot, Comparison of the characteristic leaching behavior of cements using standard (EN 196-1) cement mortar and an assessment of their long-term environmental behavior in construction products during service life and recycling, Cem. Concr. Res. 30 (2000) 1079–1096. https://doi.org/10.1016/S0008-8846(00)00287-8.
[9] P. Faucon, P. Le Bescop, F. Adenot, P. Bonville, J.F. Jacquinot, F. Pineau, B. Felix, Leaching of cement: Study of the surface layer, Cem. Concr. Res. 26 (1996) 1707–1715. https://doi.org/10.1016/S0008-8846(96)00157-3.
[10] B. Lothenbach, G. Le Saout, M. Ben Haha, R. Figi, E. Wieland, Hydration of a low-alkali CEM III/B–SiO2 cement (LAC), Cem. Concr. Res. 42 (2012) 410–423. https://doi.org/10.1016/j.cemconres.2011.11.008.
[11] A. Gruskovnjak, B. Lothenbach, L. Holzer, R. Figi, F. Winnefeld, Hydration of alkali-activated slag: comparison with ordinary Portland cement, Adv. Cem. Res. 18 (2006) 119–128.
[12] F.P. Glasser, K. Luke, M.J. Angus, Modification of cement pore fluid compositions by pozzolanic additives, Cem. Concr. Res. 18 (1988) 165–178. https://doi.org/10.1016/0008-8846(88)90001-4.
[13] M. Pourbaix, A. Pourbaix, Potential-pH equilibrium diagrams for the system S-H2O from 25 to 150° C: Influence of access of oxygen in sulphide solutions, Geochim. Cosmochim. Acta. 56 (1992) 3157–3178.

20
[14] Hydrogen Sulfide, in: Air Qual. Guidel. Eur., 2nd ed, World Health Organization, Copenhagen, 2000: pp. 146–148.
[15] B. Sioulas, J.G. Sanjayan, The coloration phenomenon associated with slag blended cements, Cem. Concr. Res. 31 (2001) 313–320. https://doi.org/10.1016/S0008-8846(00)00371-9.
[16] A.P. Schwab, J. Hickey, J. Hunter, M.K. Banks, Characteristics of Blast Furnace Slag Leachate Produced Under Reduced and Oxidized Conditions, J. Environ. Sci. Health Part A. 41 (2006) 381–395. https://doi.org/10.1080/10934520500423527.
[17] T. Mansfeldt, R. Dohrmann, Identification of a Crystalline Cyanide-Containing Compound in Blast Furnace Sludge Deposits R. Dohrmann, present address: Bundesanstalt für Geowissenschaften und Rohstoffe (BGR), D-30655 Hannover, Germany., J. Environ. Qual. 30 (2001) 1927–1932. https://doi.org/10.2134/jeq2001.1927.
[18] C.Y. Rha, S.K. Kang, C.E. Kim, Investigation of the stability of hardened slag paste for the stabilization/solidification of wastes containing heavy metal ions, J. Hazard. Mater. 73 (2000) 255–267. https://doi.org/10.1016/S0304-3894(99)00185-5.
[19] K.L. Scrivener, A. Nonat, Hydration of cementitious materials, present and future, Spec. Issue 13th Int. Congr. Chem. Cem. 41 (2011) 651–665. https://doi.org/10.1016/j.cemconres.2011.03.026.
[20] J.I. Escalante, L.Y. Gómez, K.K. Johal, G. Mendoza, H. Mancha, J. Méndez, Reactivity of blast-furnace slag in Portland cement blends hydrated under different conditions, Cem. Concr. Res. 31 (2001) 1403–1409. https://doi.org/10.1016/S0008-8846(01)00587-7.
[21] B. Kolani, L. Buffo-Lacarrière, A. Sellier, G. Escadeillas, L. Boutillon, L. Linger, Hydration of slag-blended cements, Cem. Concr. Compos. 34 (2012) 1009–1018. https://doi.org/10.1016/j.cemconcomp.2012.05.007.
[22] A.A. Ramezanianpour, V.M. Malhotra, Effect of curing on the compressive strength, resistance to chloride-ion penetration and porosity of concretes incorporating slag, fly ash or silica fume, Cem. Concr. Compos. 17 (1995) 125–133. https://doi.org/10.1016/0958-9465(95)00005-W.
[23] N.M. Piatak, M.B. Parsons, R.R. Seal, Characteristics and environmental aspects of slag: A review, Environ. Geochem. Mod. Min. 57 (2015) 236–266. https://doi.org/10.1016/j.apgeochem.2014.04.009.
[24] J. Couvidat, M. Benzaazoua, V. Chatain, F. Zhang, H. Bouzahzah, An innovative coupling between column leaching and oxygen consumption tests to assess behavior of contaminated marine dredged sediments, Environ. Sci. Pollut. Res. 22 (2015) 10943–10955. https://doi.org/10.1007/s11356-015-4323-z.
[25] A. Roy, Sulfur speciation in granulated blast furnace slag: An X-ray absorption spectroscopic investigation, Cem. Concr. Res. 39 (2009) 659–663. https://doi.org/10.1016/j.cemconres.2009.05.007.
[26] D.E. Macphee, M. Atkins, P.P. Glassar, Phase Development and Pore Solution Chemistry in Ageing Blast Furnace Slag-Portland Cement Blends, MRS Proc. 127 (1988) 475. https://doi.org/10.1557/PROC-127-475.
[27] M.J. Angus, F.P. Glasser, The chemical environment in cement matrices, MRS Online Proc. Libr. Arch. 50 (1985).
[28] K.Y. Chen, J.C. Morris, Kinetics of oxidation of aqueous sulfide by oxygen, Environ. Sci. Technol. 6 (1972) 529–537. https://doi.org/10.1021/es60065a008.
[29] W.E. Kleinjan, A. de Keizer, A.J.H. Janssen, Kinetics of the chemical oxidation of polysulfide anions in aqueous solution, Water Res. 39 (2005) 4093–4100. https://doi.org/10.1016/j.watres.2005.08.006.
[30] D.J. O’Brien, F.B. Birkner, Kinetics of oxygenation of reduced sulfur species in aqueous solution, Environ. Sci. Technol. 11 (1977) 1114–1120. https://doi.org/10.1021/es60135a009.
[31] R. Steudel, Inorganic Polysulfides S n 2− and Radical Anions S n·−, in: Elem. Sulfur Sulfur-Rich Compd. II, Springer, 2003: pp. 127–152.
[32] G.W. Luther, A.J. Findlay, D.J. MacDonald, S.M. Owings, T.E. Hanson, R.A. Beinart, P.R. Girguis, Thermodynamics and Kinetics of Sulfide Oxidation by Oxygen: A Look at Inorganically
21
Controlled Reactions and Biologically Mediated Processes in the Environment, Front. Microbiol. 2 (2011). https://doi.org/10.3389/fmicb.2011.00062.
[33] D.A. Dohnalek, J.A. FitzPatrick, The chemistry of reduced sulfur species and their removal from groundwater supplies, J. - Am. Water Works Assoc. 75 (1983) 298–308. https://doi.org/10.1002/j.1551-8833.1983.tb05142.x.
[34] J.-Z. Zhang, F.J. Millero, The products from the oxidation of H2S in seawater, Geochim. Cosmochim. Acta. 57 (1993) 1705–1718.
[35] A.E. Lewis, Review of metal sulphide precipitation, Hydrometallurgy. 104 (2010) 222–234. [36] Arrêté du 12 décembre 2014 relatif aux conditions d’admission des déchets inertes dans les
installations relevant des rubriques 2515, 2516, 2517 et dans les installations de stockage de déchets inertes relevant de la rubrique 2760 de la nomenclature des installations classes, 2014. https://www.legifrance.gouv.fr/affichTexte.do?cidTexte=JORFTEXT000029893828 (accessed September 28, 2019).
[37] L. Chateau, P. Vaillant, F. Leray, A. Orsini, S. Cavellec, J. Crosnier, D. Guyonnet, G. Bellenfant, P. Piantone, B. Hazebrouck, J. Domas, J. Méhu, A. Jullien, Guide méthodologique - Acceptabilité de matériaux alternatifs en technique routière - Evaluation environnementale, Setra, Bagneux, 2011.
[38] N. Bandow, S. Gartiser, O. Ilvonen, U. Schoknecht, Evaluation of the impact of construction products on the environment by leaching of possibly hazardous substances, Environ. Sci. Eur. 30 (2018) 14. https://doi.org/10.1186/s12302-018-0144-2.