
Greenhouse Gas Technology Verification Center · Greenhouse Gas Technology Verification Center ......
54
-
Upload
nguyenminh -
Category
Documents
-
view
215 -
download
0
Transcript of Greenhouse Gas Technology Verification Center · Greenhouse Gas Technology Verification Center ......


Greenhouse Gas Technology Verification Center A USEPA Sponsored Environmental Technology Verification Organization
Testing and Quality Assurance Plan for the C. Lee Cook Division, Dover Corporation
Static Pac® System
Prepared By: Southern Research Institute
Greenhouse Gas Technology Verification Center Research Triangle Park, NC USA
Telephone: 919/403-0282
For Review By: C. Lee Cook Division, Dover Corporation
ANR Gas Pipeline Company The Oil and Gas Industry Stakeholder Group
USEPA Quality Assurance Team
July 20, 1999

TABLE OF CONTENTS Page
1.0 BACKGROUND AND INTRODUCTION ........................................................................................................ 1
2.0 TECHNOLOGY DESCRIPTION AND VERIFICATION APPROACH .............................................. 32.1. STATIC PAC SYSTEM DESCRIPTION .................................................................. 32.2. VERIFICATION PARAMETERS AND THEIR DETERMINATION ....................... 6
2.2.1. Approach ...................................................................................................... 62.2.2. Phase I Static Pac Evaluation....................................................................... 102.2.3. Phase II Static Pac Evaluation ..................................................................... 15
2.3. SITE SELECTION, DESCRIPTION, AND STATIC PACINSTALLATION .................................................................................................... 182.3.1. Site Selection and Description ..................................................................... 182.3.2. Static Pac Installation and Operation ........................................................... 19
2.4. FIELD TEST OVERVIEW...................................................................................... 202.4.1. Continous Leak Rate Measurements ............................................................ 202.4.2. Manual Leak Rate Measurements ................................................................ 21
2.5. SCHEDULE OF ACTIVITIES ................................................................................ 23
3.0 DATA QUALITY OBJECTIVES ....................................................................................................................... 243.1. CONTINUOUS MEASUREMENTS....................................................................... 243.2. MANUAL MEASUREMENTS............................................................................... 253.3. PROJECTIONS....................................................................................................... 27
4.0 DATA QUALITY INDICATORS ....................................................................................................................... 27
5.0 SAMPLING/ANALYTICAL AND QA/QC PROCEDURES .................................................................... 295.1. CONTINUOUS FLOW MEASUREMENTS ........................................................... 295.2. MANUAL LEAK RATE MEASUREMENTS......................................................... 30
5.2.1. Blow-down Valve, and Pressure Relief Valve.............................................. 305.2.2. Miscellaneous Components ......................................................................... 325.2.3. Unit Valves ................................................................................................. 32
5.3. DATA ACQUISITION............................................................................................ 33
6.0 DATA REDUCTION, VALIDATION, AND REPORTING ..................................................................... 346.1. DATA REDUCTION .............................................................................................. 34
6.1.1. Continuous Measurements........................................................................... 346.1.2. Manual Measurements ................................................................................ 356.1.3. Gas Savings and Payback period ................................................................. 356.1.4. Unit Conversions......................................................................................... 35
6.2. DATA REVIEW AND VALIDATION ................................................................... 366.3. DATA ANALYSIS AND REPORTING.................................................................. 37
7.0 AUDITS........................................................................................................................................................................ 39
8.0 CORRECTIVE ACTION ...................................................................................................................................... 39
9.0 PROJECT ORGANIZATION ............................................................................................................................. 39
10.0 TEST PROGRAM HEALTH AND SAFETY................................................................................................. 40
11.0 REFERENCES .......................................................................................................................................................... 42
i

APPENDIX
ii
Appendix A Static Pac Operator’s Manual – Automatic Control System
Appendix B Static Pac Operator’s Manual – Manual Control System

1.0 BACKGROUND AND INTRODUCTION
The Environmental Technology Verification (ETV) program was established by the United States
Environmental Protection Agency (EPA) in response to the belief that there are many viable
environmental technologies which are not being used for the lack of credible third-party
performance testing. With the performance data developed under the program, technology buyers
and permitters in the United States and abroad will be better equipped to make informed
environmental technology purchase decisions. In late 1997, EPA selected Southern Research
Institute to manage 1 of 12 ETV verification entities: The Greenhouse Gas Technology
Verification Center (the Center). Eleven other ETV entities are currently operating throughout the
United States conducting third-party verifications in a wide range of environmental media and
industries.
In March of 1997, the Center met with members of the Executive Stakeholder Group. In that
meeting it was decided that the oil and gas industries were good candidates for third-party
verification of methane mitigation and monitoring technologies. As a consequence, in June 1998,
the Center hosted a meeting in Houston, Texas with operators and vendors in the oil and natural
gas industries. The objectives of the meeting were to: (1) gauge the need for verification testing in
these industries, (2) identify specific technology testing priorities, (3) identify broadly acceptable
verification and testing strategies, and (4) recruit industry stakeholders. Industry participants
voiced support for the Center’s mission, identified a need for independent third-party verification,
and prioritized specific technologies and verification strategies. Since the Houston meeting, a 19
member Oil and Gas Industry Stakeholder Group was formed, vendors of GHG mitigation devices
were solicited in several top-rated technology areas, and verification testing of one compressor leak
mitigation device has started.
C. Lee Cook Division of the Dover Corporation has committed to participate in a long-term
independent verification of their rod leak prevention technology. C. Lee Cook’s Static Pac1 is
designed to reduce methane leaking from compressor rod seals during periods of compressor
shutdown without full depressurization. There are over 13,000 natural gas compressors operating
in the United States alone, a significant number of them experiencing frequent shutdowns. When
the compressor remains pressurized during these periods, rod leaks continue at rates similar to
1 Static Pac is a registered trademark of the C. Lee Cook Division of Dover Corporation.
- 1

those during normal operation. According to the Gas Research Institute/Environmental Protection
Agency study “Methane Emissions From the Natural Gas Industry (“GRI Study”), compressor rod
seal leaks during periods of shutdown represent a major source of methane emissions, and a
significant loss of economic and natural resources.
A test of the Static Pac device will be carried out at a compressor station operated by ANR Pipeline
Company (ANR) of Detroit, Michigan. This Test Plan describes the technology to be tested, and
outlines the Center's plans to conduct the verification in a field setting.
Field testing of the Static Pac is scheduled to begin at the ANR site in June 1999, and will continue
for a 4 to 6 month period. After initial installation and testing is complete, the Center will issue a
Phase I Report, containing installation and initial verification measurements data (September
1999). After all testing is complete, a Phase II Report will be issued which contains longer-term
technical and economic performance verification data (2 months after completion of the field
evaluation). The specific verification parameters associated with the Phase 1 and Phase II efforts
are listed below. Determination of each parameter is discussed in Section 2.2.
Phase I Static Pac Evaluation:
• Document initial gas savings for primary baseline operating conditions (Case 1 and Case 2, see Section 2.2)
• Document capital, installation, and shakedown requirements and costs
Phase II Static Pac Evaluation:
• Document annualized gas savings for primary baseline conditions • Document methane emission reduction • Calculate and document Static Pac payback period
Phase I goals will be achieved through observation, collection and analysis of direct gas
measurements, and use of site operator logs and vendor supplied cost information.
A primary goal of Phase II is determination of the Static Pac payback period. As a practical matter,
the Center cannot conduct direct testing for the several years that would be required to determine
payback entirely through direct gas and other measurements or for the myriad of variations in the
frequency and duration of compressor operating/shutdown cycles. Thus, several Phase II goals will
be accomplished through a combination of medium-term measurements (3 to 6 months), data
- 2

extrapolation techniques, and collecting and presenting data adequate to calculate payback for
various operating/shutdown cycles. Extrapolation and other assumptions will be transparent in the
final report, allowing readers to make alternate assumptions and assessments if they wish.
2.0 TECHNOLOGY DESCRIPTION AND VERIFICATION APPROACH
2.1. STATIC PAC SYSTEM DESCRIPTION
The Static Pac is a gas leak containment device designed to prevent rod packing leaks from
escaping into the atmosphere during compressor shutdown periods. The Static Pac system is
installed in a conventional packing case by replacing several cups (typically 2) in the low-pressure
side of the packing case (see Figure 1).
Upon shutdown of the compressor, the compressor control system activates the Static Pac control
system and a pressurized gas is used to move a piston along the outer shell of the Static Pac seal,
wedging a lip seal into contact with the rod (see Figures 1 and 2). When the actuating pressure is
lowered, the piston retracts, releasing the Static Pac seal. Leaks that normally occur during periods
of shutdown are reported by Cook to be completely or nearly eliminated.
Because the Static Pac requires modification of the conventional packing case, resulting in a
“missing seal”, it is speculated that increase in rod emissions can occur while the compressor is in
operating mode. However, industry experience suggests that the Static Pac should not affect
normal sealing during compressor operation. The Center has been unable to locate reliable data
that verified this. Therefore, the verification test will include assessment of the effect (if any) of
the Static Pac on normal sealing performance during compressor operation. This will be
accomplished by fitting one rod on the test engine with a Static Pac and the second rod with a new
conventional packing. A second engine will be fitted in the same manner to provide duplicate
measurements.
- 3

Figure 1-a. The Static Pac Activation and Deactivation Process
- 4

Figure 1-b. Rod Packing Cutaway With Static Pac
- 5

2.2. VERIFICATION PARAMETERS AND THEIR DETERMINATION
2.2.1. Approach
Because the Static Pac operates only when the compressor is shut down, the gas savings depend on
the number and duration of shutdown periods. In addition, changes in operating procedures
associated with installation of the static seal must be considered in determining net gas savings.
Normal compressor shutdown procedures vary from station to station. In general, the following
procedures are used:
• Depressurize/blow-down all pressure (except a small residual pressure to prevent air inleakage) and vent the gas, either partially or completely, to the atmosphere,
• Maintain pressure, either with or without the unit isolation valves open,
• Depressurize to a lower pressure, either venting the gas to the atmosphere or to the station fuel system, or
• A combination of these procedures.
Adding a Static Pac to a compressor will result in varying levels of net gas savings and emission
reductions depending on the current shutdown procedure. Evaluation of net emission reductions
for Static Pac operation requires quantifying any significant leak rate changes resulting from
normal Static Pac operation and related changes in operating procedures.
A station that currently leaves compressors pressurized during shutdown will realize net savings
simply from the decrease in the rod packing leak rate due to the action of the static seal. If a station
that currently blows down its compressors during shutdown were to add static seals, it is presumed
that the station would also go to a pressurized shutdown condition. In this case, the savings result
from the eliminated blow-down and the unit valve leak (the unit valves are prevented from leaking
because the unit now remains pressurized). There is also the potential for increases in emissions at
components now exposed to pressure during shutdown. This includes the rod packing (if the static
seal is not 100 percent effective, valves, fittings, and other components.
- 6
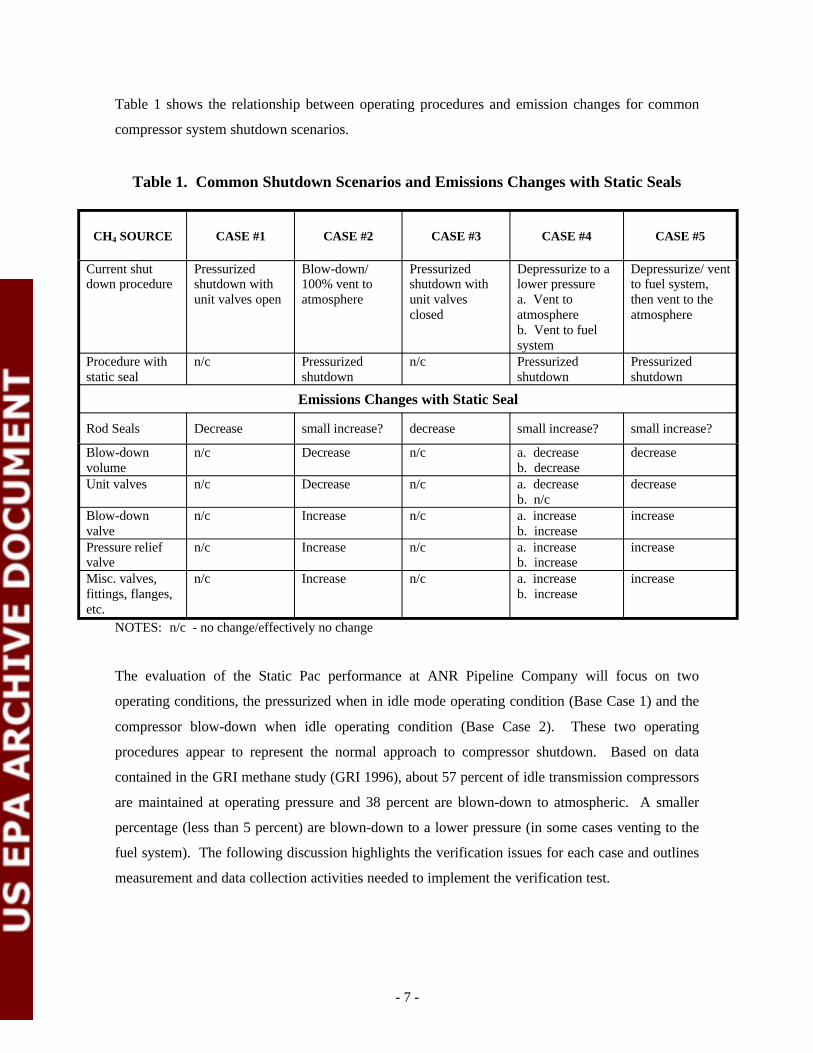
Table 1 shows the relationship between operating procedures and emission changes for common
compressor system shutdown scenarios.
Table 1. Common Shutdown Scenarios and Emissions Changes with Static Seals
CH4 SOURCE CASE #1 CASE #2 CASE #3 CASE #4 CASE #5
Current shut down procedure
Pressurized shutdown with unit valves open
Blow-down/ 100% vent to atmosphere
Pressurized shutdown with unit valves closed
Depressurize to a lower pressure a. Vent to atmosphere b. Vent to fuel
Depressurize/ vent to fuel system, then vent to the atmosphere
system Procedure with n/c Pressurized n/c Pressurized Pressurized static seal shutdown shutdown shutdown
Emissions Changes with Static Seal
Rod Seals Decrease small increase? decrease small increase? small increase?
Blow-down volume
n/c Decrease n/c a. decrease b. decrease
decrease
Unit valves n/c Decrease n/c a. decrease b. n/c
decrease
Blow-down valve
n/c Increase n/c a. increase b. increase
increase
Pressure relief valve
n/c Increase n/c a. increase b. increase
increase
Misc. valves, n/c Increase n/c a. increase increase fittings, flanges, b. increase etc.
NOTES: n/c - no change/effectively no change
The evaluation of the Static Pac performance at ANR Pipeline Company will focus on two
operating conditions, the pressurized when in idle mode operating condition (Base Case 1) and the
compressor blow-down when idle operating condition (Base Case 2). These two operating
procedures appear to represent the normal approach to compressor shutdown. Based on data
contained in the GRI methane study (GRI 1996), about 57 percent of idle transmission compressors
are maintained at operating pressure and 38 percent are blown-down to atmospheric. A smaller
percentage (less than 5 percent) are blown-down to a lower pressure (in some cases venting to the
fuel system). The following discussion highlights the verification issues for each case and outlines
measurement and data collection activities needed to implement the verification test.
- 7

Case 1. The baseline for this case is a compressor that normally maintains full operating pressure
during idle periods. The addition of the Static Pac should eliminate leaks that occur during idle
periods and cause no increase in the leak rate while the compressor is operating.
Continuous measurements of the rod packing leak rate will be made during the entire test period.
Emissions reductions will be determined by comparing uncontrolled emissions (with the Static Pac
disabled) with emissions controlled by the Static Pac. A second measure of uncontrolled emissions
will be obtained based on measurements of emissions during idle periods from a second rod on the
same engine using conventional packing. This arrangement will be repeated on two separate
engines in order to provide a more reliable and robust data set.
Continuous leak rate measurements on the control rods during operation will be used as a baseline
for verifying that the Static Pac does not cause any increase in the operating leak rate of the rod
packing.
Disabling the Static Pac is a manual operation that will require Center test personnel or a site
operator to manually disable the Static Pac during a shutdown period for a sufficient period to
allow the packing to cool and representative measurements to be obtained (several hours). This
will require a scheduled shutdown and will be conducted during each of three intensive
measurement periods to be conducted at the start of the test, at the end of Phase I, and at the end of
the test. If additional quantifications are needed (due to variability in the leak rate or changes in
operating conditions), site personnel can be called upon to perform additional shutdowns.
In addition, it is possible that there is a relationship between operating emissions and idle emissions
with the Static Pac disabled. Data collected during the intensive measurement periods will allow
assessment of whether there is a correlation. If a correlation is found, then operating emissions
immediately before and after each shutdown period could be used to refine the analysis by
providing greater capture of emissions changes over time.
To verify that the Static Pac does not cause any increase in the operating leak rate of the rod
packing, continuous leak rate measurements will also be made on a second unit fitted with new
seals at the time of Static Pac installation.
- 8
Because the unit pressure is essentially unchanged during both operating and idle periods, all other
component leak rates (pressure relief valve, blown-down valve, unit valves, and miscellaneous
flanges, valves, and fittings) can be anticipated to remain constant after installation of the Static
Pac. This will be verified by manual measurements before and after installation.
Case 2. The baseline for this condition is a compressor that normally blows down from operating
pressure to a minimum pressure level during idle periods. At such times, the pressure on
compressor components is reduced to near zero and any rod packing, pressure relief valve and
blown-down valve leaks cease. However, any leaking gas from the unit valves isolating the
compressor is lost. The gas leaks into the compressor system and passes to the atmosphere through
the open blown-down valve to the open-ended blow-down line. Based on available data, this loss
from the unit valves can be substantial (see Table 2). To address this, unit valve leak rates will be
measured (manually) periodically during the study.
In addition, the compressed gas contained in the compressor lines is lost during the blow-down.
This will be calculated based on known volumes of compressor components and operating
pressure.
For Case 2, emissions reductions are gained by changing the shutdown procedure to leaving the
compressor pressurized during idle periods. This eliminates losses due to the blow-down volume
and unit valve leaks. The Static Pac serves to eliminate the increase in rod packing emissions
during idle periods that results from leaving the unit pressurized.
In order to determine net gas savings, any increase in leaks from the pressure relief valve, blow
down valve, and various flanges, connectors, and valves due to leaving the unit pressurized must be
measured. The sum of any increase in leaks from these components offsets the gas savings
described above.
Components that require quantification of gas leak rate during the evaluation are identified in Table
2. The table also presents estimates of the leak rate for each component (GRI 1996) and indicates
gas savings or loss associated with each component for each test scenario.
- 9

Table 2. Leak Sources, Emissions, and Gas Savings
Blow-down Volume
Emissions Sources
Compressor Seal
Compressor Seal
Loss eliminated due to change in operating procedure associated with static seal
Notes
Unit Idle, Pressurized
Unit Operating
2,750 220
Gas Savings/Loss Associated with Emissions Packing (Mcf/yr)
high low avg
2,212 84 670
(0) (0) (0)
2,212 84 670
825 Case 2 Savings
Gas Savings/Loss
Case 1 Savings
Case 1 Loss
Case 1 Net Gas Savings
Unit Valves
Blow-down Valve
Pressure Relief Valve
Misc. Components
Compressor Seal
Compressor Seal
Loss eliminated due to change in operating procedure associated with static seal
Unit Idle, Pressurized
Unit Idle, Pressurized
Unit Idle, Pressurized
Unit Idle, Pressurized
Unit Operating
2,916
(587)
(256)
(75)
(0)
(0)
4,748
67
(235)
(0)
(52)
(0)
(0)
0
1,491
(436)
(149)
(64)
(0)
(0)
1,668
Case 2 Savings
Case 2 Loss
Case 2 Loss
Case 2 Loss
Case 2 Loss
Case 2 Loss
Case 2 Net Gas Savings
2.2.2. Phase I Static Pac Evaluation
Document Initial Gas Savings for Baseline Operating Conditions (Case 1, Case 2)
Initial gas leak prevention effectiveness will be determined and reported in the Phase I Report after
at least 4 weeks of continuous monitoring data and two sets of manual leak tests have been
collected and analyzed. Net gas savings will be determined separately for Case 1 and Case 2 as
discussed above.
For Case 1, the savings consist solely of the gas prevented from leaking from the rod packing
during idle periods. This is the difference between the leak rate without the Static Pac and the leak
rate (if any) with the Static Pac. The leak rate without the Static Pac (uncontrolled emissions) will
- 10
be measured directly by disabling the Static Pac during scheduled shutdowns. It may also be
possible to use the running leak rate (when the Static Pac is inactive) as a surrogate for
uncontrolled emissions - provided that a sound correlation can be established between the running
leak rate and true uncontrolled emissions. Finally, if it is determined that the Static Pac causes any
increase in emissions during operation, these emissions must be subtracted from the gas savings.
This is represented mathematically in Equation 1.
G_1i = [Qd – Qs] * t (Eqn. 1)
Where, G_1 = gas savings for Case 1, scf Qd - uncontrolled leak rate (Static Pac disabled), scfm Qs - average hourly leak rate (cfm) during shutdown, scfm t - shutdown period (minutes) = [te – ts]
ts – time at start of shutdown period te – time at end of shutdown period
I = shutdown interval
Alternatively, if correlation analysis supports using running emissions before and after each
shutdown period as a surrogate for uncontrolled emissions, then the refined formula for gas
recovery is given by Equation 1a.
G_1i = [Qr(te) – Qr(ts)]/2 – Qs] * t (Eqn. 1a)
where, Qr(t) – running leak rate (cfm) at time “t” - corrected for correlation with the uncontrolled rate Qd
Qs - average hourly leak rate (cfm) during shutdown t - shutdown period (minutes) = [te – ts]
ts – time at start of shutdown periodte – time at end of shutdown period
In both cases (Equations 1 and 1a), the Total gas savings for the test period is
G_1 = SS G_1i - Vm (Eqn. 1b)
- 11

where Vm is the increase in operating emissions (if any) over the test period due to the Static Pac.
Vm will be determined based on comparison with rod leak rate measurements on a duplicate unit
fitted with new seals at the same time the Static Pac is installed.
An important consideration in this approach is that it may take some time after start up for the
running leak rate to stabilize. Thus, Qr(te) should be obtained once the leak rate has stabilized. For
the Phase 1 evaluation, cumulative gas savings and hourly average gas savings during idle periods
will be calculated and reported as Case 1 gas savings. Details of the measurement methods, tests to
be conducted, QA/QC and schedule are given in Section 5.
For Case 2, gas savings consists of the blown-down volume (times the number of idle periods) and
the unit valve leak rate (times the duration of idle periods). In addition, there are gas losses due to
leakage from the blown-down valve, pressure relief valve and miscellaneous components (see
Table 2). An additional loss is any gas that escapes past the Static Pac (since the baseline for this
case is a blown-down compressor, rod packing leakage would be zero). For Case 2, the gas
savings for each idle period will be calculated as follows.
G_2i = BDV + Quv * [te – ts] – [Qprv + Qbdv + Qmisc + Qs(t)] * [te – ts] (Eqn. 2)
Where, Gi is the gas savings cf BDV is the blow-down volume, cf Quv is the unit valve leak rate, cfm Qprv is the pressure relief valve leak rate, cfm Qbdv is the blow-down valve leak rate, cfm Qmisc is the aggregate leak rate for miscellaneous components Qs(t) is the leak rate (cfm) during shutdown at time “t”
The total gas savings for the test period is
G_2 = SS G_2i - Vm (Eqn. 1b)
where Vm is (once again) the total increase in operating emissions (if any) over the test period due
to the Static Pac.
- 12

The blow-down volume for the test unit has been calculated by ANR personnel to be 200 cf at 800
psi or roughly 55,000 scf. For the other components, manual leak rate measurements will be
needed. These measurements will be made during intensive measurement periods at the start and
end of the Phase 1 evaluation. Details of the measurement methods, tests to be conducted, QA/QC
and schedule are given in Section 5.
Document Capital, Installation, and Shakedown Requirements and Costs
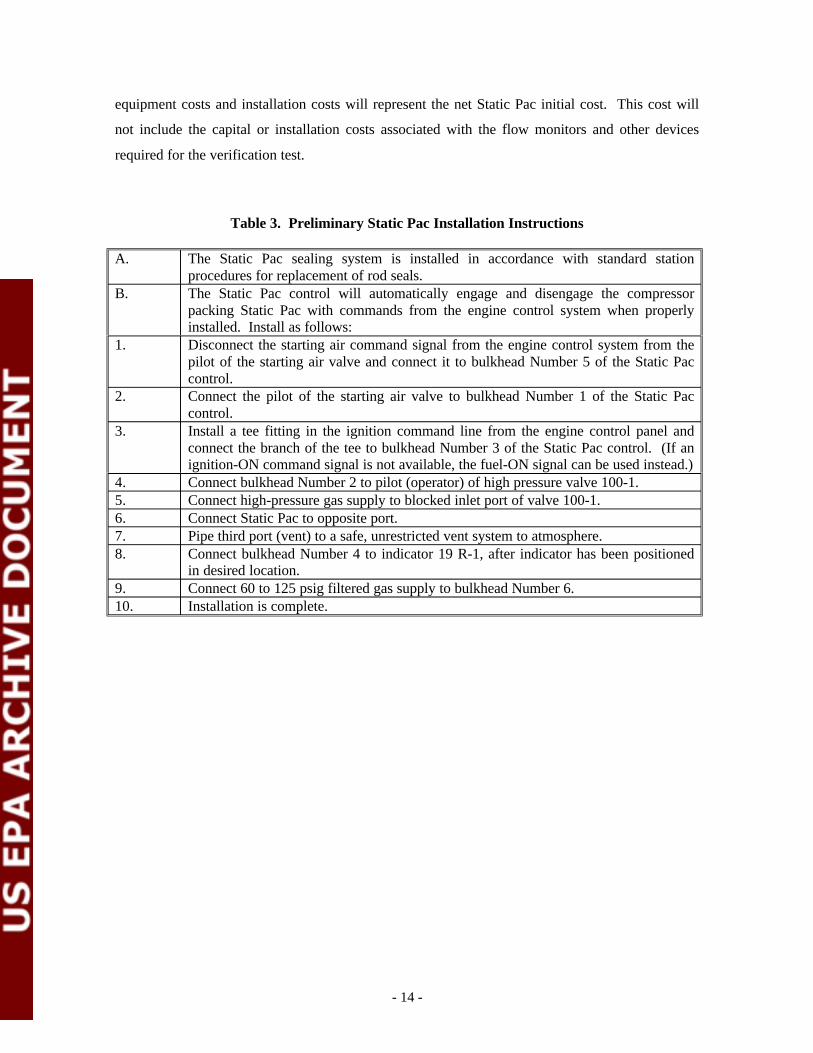
C. Lee Cook has prepared installation instructions for the Static Pac system. These instructions are
outlined in Table 3. The Static Pac will be installed by ANR site personnel, with supervision and
guidance provided by a C. Lee Cook engineer. The ANR staff will also conduct leak checks on the
complete system, and correct loose fittings or valves. Center personnel will be on-site throughout
the installation and shakedown process, and will document any modifications made or difficulties
encountered. The Center will also document key decisions made regarding placement of
equipment or adjustments made for site-specific conditions.
C. Lee Cook will provide an Operator’s Manual that provides instructions on start-up activities and
routine monitoring and maintenance requirements (see Appendix A and Appendix B). For the
start-up instructions, the manual lists step-by-step procedures for: initiating Static Pac start-up,
obtaining optimum gland activation pressure, checking for its design activation pressure, and
verifying functionality of integral monitoring sensors. The Center will document any problems
encountered or changes made to the start-up and shakedown activities, and report the final
procedures in the Verification Report.
To determine the payback period, it will be necessary to document accurately Static Pac capital and
installation costs. Table 4 is a listing of the capital equipment required to assemble and install the
Static Pac. This table includes preliminary cost data, and identifies where final data will be
obtained. The list is specific to the conditions encountered at the host site (e.g., shaft diameter.)
The staff performing the installation will provide the piping, valves, and fittings. Although the list
is believed to be complete, C. Lee Cook may add or delete items necessary to accommodate site
specific conditions. The Center will obtain the "as-built" equipment list from C. Lee Cook after
installation is complete, and will document total equipment and installation costs based on invoices
and labor logs. The Center will multiply the logged hours by the hourly rates charged by all
participating contractors and ANR staff to calculate total installation cost. The sum of the capital
- 13
equipment costs and installation costs will represent the net Static Pac initial cost. This cost will
not include the capital or installation costs associated with the flow monitors and other devices
required for the verification test.
Table 3. Preliminary Static Pac Installation Instructions
A. The Static Pac sealing system is installed in accordance with standard station procedures for replacement of rod seals.
B. The Static Pac control will automatically engage and disengage the compressor packing Static Pac with commands from the engine control system when properly installed. Install as follows:
1. Disconnect the starting air command signal from the engine control system from the pilot of the starting air valve and connect it to bulkhead Number 5 of the Static Pac control.
2. Connect the pilot of the starting air valve to bulkhead Number 1 of the Static Pac control.
3. Install a tee fitting in the ignition command line from the engine control panel and connect the branch of the tee to bulkhead Number 3 of the Static Pac control. (If an ignition-ON command signal is not available, the fuel-ON signal can be used instead.)
4. Connect bulkhead Number 2 to pilot (operator) of high pressure valve 100-1. 5. Connect high-pressure gas supply to blocked inlet port of valve 100-1. 6. Connect Static Pac to opposite port. 7. Pipe third port (vent) to a safe, unrestricted vent system to atmosphere. 8. Connect bulkhead Number 4 to indicator 19 R-1, after indicator has been positioned
in desired location. 9. Connect 60 to 125 psig filtered gas supply to bulkhead Number 6. 10. Installation is complete.
- 14

---
Table 4. Documentation of Initial Capital and Installation Costs
Description Units Required
Price/Unit Source of
Data
Capital Equipment Costs:
Static Pac Case for 4: Rod GMW 2 $2,650.29 C. Lee Cook
Renewal Rings 2 $797.79 C. Lee Cook
Automatic Control P/W 502957 1 $1,638.00 C. Lee Cook
Miscellaneous Tubings, Fittings $200.00 Station Purchase Records
Installation Costs:
Static Pac Assembly Installation 16 hours $45 - $65 / hour Station (includes time required to remove cylinder, Maintenance install Static Pac, make Control System Logs adjustments, and check the system
2.2.3. Phase II Static Pac Evaluation
The Phase II evaluation represents an extended period of performance testing and includes trends
analyses to project emissions beyond the period of the field test. Calculation of the payback period
based on these measurements and analyses is another key element of Phase II. Phase II will
represent up to 4 months of continuous rod packing leak rate measurements and at least 3 intensive
periods of manual measurements. A discussion of verification issues and actions for each Phase II
verification parameter are given in the following sections.
Document Annualized Gas Savings for Primary Baseline Operating Conditions
Case 1 and Case 2 gas savings for each idle period during the entire field test will be computed in
the same manner as for the Phase 1 testing (see Equations 1 and 2). Since the test will not span an
entire year, it will be necessary to project gas savings over this longer period. The most direct
method would be to simply compute average gas savings over the study period (for Case 1 and
Case 2) and multiply by the number of expected idle hours during a year. However, this approach
could yield an overly conservative estimate of annual gas savings - especially for Case 1 (see the
"Average Gas Savings" in Figure 2).
- 15
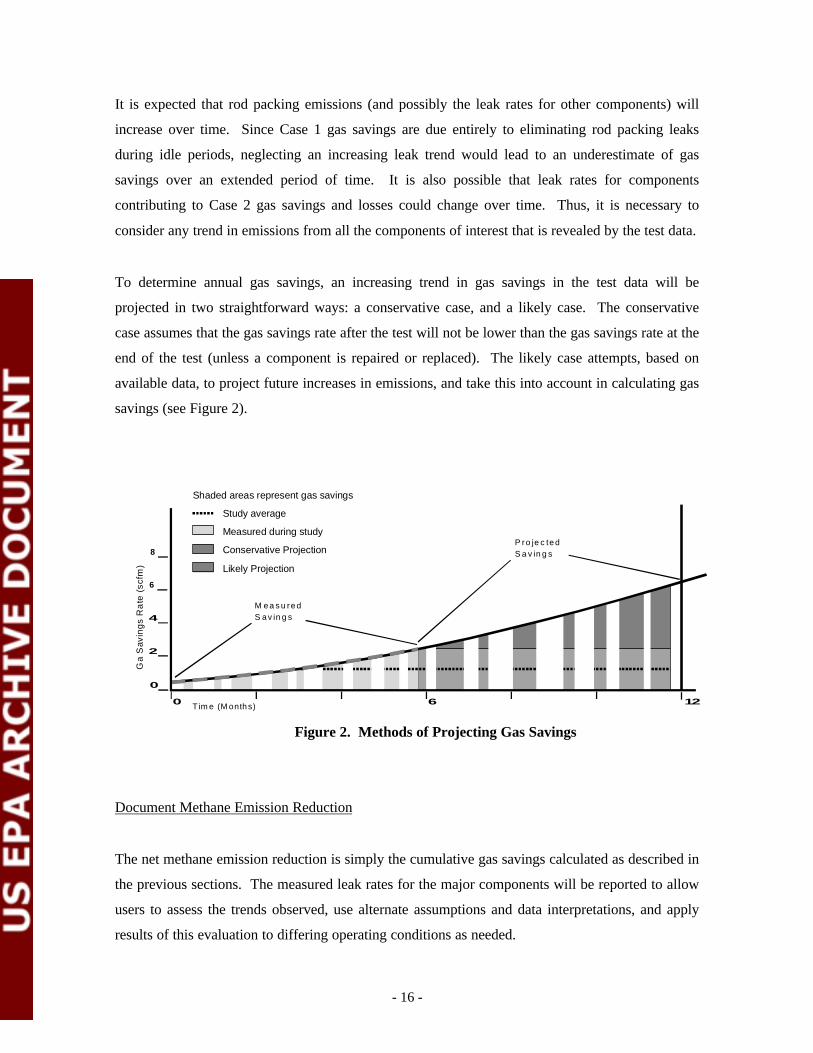
It is expected that rod packing emissions (and possibly the leak rates for other components) will
increase over time. Since Case 1 gas savings are due entirely to eliminating rod packing leaks
during idle periods, neglecting an increasing leak trend would lead to an underestimate of gas
savings over an extended period of time. It is also possible that leak rates for components
contributing to Case 2 gas savings and losses could change over time. Thus, it is necessary to
consider any trend in emissions from all the components of interest that is revealed by the test data.
To determine annual gas savings, an increasing trend in gas savings in the test data will be
projected in two straightforward ways: a conservative case, and a likely case. The conservative
case assumes that the gas savings rate after the test will not be lower than the gas savings rate at the
end of the test (unless a component is repaired or replaced). The likely case attempts, based on
available data, to project future increases in emissions, and take this into account in calculating gas
savings (see Figure 2).
Shaded areas represent gas savings
G a
Sa
vin
gs
Ra
te (
scf
m)
8
6
4
2
0
T im e (M o n th s) 0 6
ji
i j i
Li l j i
12
M e a s u r e d
S a v in g s
P r o e c t e d
S a v in g s
Study average
Measured dur ng study
Conservat ve Pro ect on
ke y Pro ect on
Figure 2. Methods of Projecting Gas Savings
Document Methane Emission Reduction
The net methane emission reduction is simply the cumulative gas savings calculated as described in
the previous sections. The measured leak rates for the major components will be reported to allow
users to assess the trends observed, use alternate assumptions and data interpretations, and apply
results of this evaluation to differing operating conditions as needed.
- 16
Calculate and Document Static Pac Payback Period
Payback occurs when the capital and operating costs (including cost of money) of the Static Pac are
balanced by the value of the gas saved. The operating and maintenance costs for the Static Pac
system is expected to be minimal, but will be documented and included in payback calculations.
Complete O&M logs on both the Static Pac and the compressor will be maintained. This will
include selected monitored parameters for the engine/compressor system, and manual logs of key
O&M activities. Table 5 lists the operational and maintenance parameters that will be collected.
Table 5. Operational and Maintenance Data to be Collected During Testing
Description Source of Data
Static Pac, Compressor, and Engine Operating Parameters Logged:
Engine rpm
Rod temperature (both rods) Operating
Station Data
Unit discharge pressure
Unit discharge temperature
Unit suction pressure
Static Pac actuation status
Maintenance Requirements Logged:
Labor required to start/stop the system, conduct routine leak checking on the entire Static Pac assembly, repair leaks, respond to malfunctions, and perform Static Pac adjustments
Operator logs Equipment replacement or repair costs for failed units
Labor required to replace or repair failed units
Compressor/Engine downtime costs caused by failures in the Static Pac apparatus
Periodic checks on Static Pac actuator pressure and adjustment as necessary will be performed.
After initial measurements are complete, the site operators will perform routine Static Pac control
system operational checks in accordance with the O&M instructions for the Static Pac, and if
- 17

significant deviations from specifications are present, the Operator's Manual will be followed to
determine appropriate action. The time required to conduct these activities will be logged. In the
event that any of the Static Pac components fail and need repair or replacement, ANR site
personnel will log the purchase cost of each component, and the time and materials expended in
installing and checking the new components. Although unlikely, if failure in the Static Pac system
causes malfunctioning of the compressor or the engine, ANR site operators will be consulted to help
quantify the costs associated with the failure.
The procedure for calculating payback is outlined below.
1. Total cost will be determined by adding the Static Pac capital costs, installation costs, and O&M costs determined as outlined above. Capital costs will be amortized over the payback period assuming a discount rate of return of 10 percent. Payback is achieved when the total cost = the value of the gas saved.
Total Cost = (Gas Savings) * (GP) (Eqn. 3)
Where: Total Costs = sum of capital, installation, O&M costs and cost of moneyTotal Gas Saved = net volume of methane (SCF) required to achieve paybackGP = gas price ($2/MCF)
2. Total gas savings over the payback period will necessarily include measured and projected values. Savings will be projected in the same manner as described for determining annual gas savings. For each case,
Total Gas Saved = Gas Saved Test + Gas Saved Est (Eqn 4)
Where: Gas SavedTest = total measured net volume of gas saved during the test period. Gas SavedEst = total estimated net volume of gas to be saved after the test period.
The payback projections will, likewise include a conservative and a likely case. These will be calculated just as described for projecting annual emissions reductions - except over the payback period.
2.3. SITE SELECTION, DESCRIPTION, AND STATIC PAC INSTALLATION
2.3.1. Site Selection and Description
The natural gas transmission engine/compressor selected to host this evaluation is operated by
ANR Pipeline Company. This station operates six Cooper-Bessemer engines (8-cylinder, 2000
Hp), each equipped with two-stage reciprocating compressors operating in series (4,275 cubic inch
- 18

displacement, 4” rods). Geographic location was not seen as a significant factor in the evaluation,
but extremes of environment, very hot or very cold, were avoided.
The low speed engines at the test site are not typical of newer high speed engines in use, but the
rods and packings have the same basic design and functionality as most reciprocating compressors
used now and planned for use in the future within the transmission sector. Reciprocating
compressors are the dominant types in use, although newer compressor designs, such as screw
type, are beginning to be placed into service. The rod packing system used at this station is typical
of those being built or retrofitted within the industry. The rod packing is essentially a dry seal
system, using a few ounces of lubricant per day. Traditionally, wet seals, which use high-pressure
oil to form a barrier against escaping gas, have been employed. According to the natural Gas
STAR partners, dry seal systems have come into favor recently because of lower power
requirements, improved compressor and pipeline operating efficiency and performance, enhanced
compressor reliability, and reduced maintenance. The STAR industry partners report that about 50
percent of new seal replacements consist of dry seals.
In order to provide necessary experimental controls (see Section 2.2), the Emissions Packing will
be installed on one compressor on each of two engines (engine Id’s 801 and 802). The packing on
the second rod on each engine will be replaced with a new packing at the same time that the
Emissions Packing is installed. The two engines are the same age and have similar operating hours
(this is part of ANR’s operating practice). They were both overhauled at the same time in 1996,
including replacement of the rod packings. Actual operating hours on each engine will be logged
at installation. ANR’s operation and maintenance practices are the same for each of the units.
2.3.2. Static Pac Installation and Operation
The host site presents a typical installation for the Static Pac system and no application specific
engineering is required. The Static Pac system is designed to accommodate the conditions
(pressure, existing sealing system) at the test site. The Static Pac will be installed in a modified
packing case with new seals. A representative of C. Lee Cook has visited the test site and
confirmed all necessary requirements. The Static Pac will be installed by a Cook representative on
one rod on each of two engines. This will require two separate actuation systems. Costs used for
determining payback will be based on equipment needed for installation on a single engine with a
- 19

single actuator. As normal operations dictate, operators will perform and document normal system
maintenance and adjustments to maintain Static Pac performance, maximizing gas containment.
2.4. FIELD TEST OVERVIEW
The field testing will include both continuous and manual measurements. The continuous
measurements will quantify the gas savings from the rod packing leaks due to the action of the
Static Pac during idle periods. These measurements allow quantification of the Case 1 gas savings
(for a compressor that remains pressurized while shut down). The manual measurements are
necessary to quantify leak rates for the unit valves, blown-down valve, pressure relief valve and
miscellaneous components that make up additional data needed to quantify Case 2 gas savings (for
a compressor that would normally blow-down prior to installing the Static Pac).
2.4.1. Continous Leak Rate Measurements
At the test compressors, emissions from the packing case vent and fugitive emissions from around
the rod are both vented into the distance piece or doghouse and then vented to atmosphere through
the doghouse vent. The doghouse vent and oil drain are the only paths by which the leaking gas
can leave the doghouse. For the test, the doghouse drain will be sealed using a liquid trap so that
all emissions will be forced out the doghouse vent. To measure these emissions, flow meters will
be installed on the doghouse vent lines for each of the compressors to be tested.
The station operates automatically and compressors are shut down or brought on line on demand.
Continuous measurements and automated data logging are needed to be certain of measuring
emissions during each shutdown period. The meters must present a minimal restriction to flow in
order not to influence the leak rate, have a wide range, and be resistant to oil vapor present in the
emissions.
The meters selected for the test are a type of rate meter (similar to a rotameter) designed for
measuring methane emissions from sludge digesters, landfills, and other low-pressure applications.
They have wide range (25:1 turndown), a very low pressure drop (2-inches water) and should not
be affected by oil mist present in the emissions. The meters produce a 4-20 mA full-scale linear
- 20

output that will be recorded locally on a datalogger equipped with modem communications. Hourly
averaged leak rate data will be stored continuously on site and retrieved remotely once each day for
review. The data will be archived at the Center's Research Triangle Park, NC facility.
During installation and during periodic intensive measurement periods, the methane concentration
of the gas leaking from the doghouse will be measured with a portable hydrocarbon analyzer. At
these times, flow meter performance will be checked against direct measurements using GRI's Hi-
FlowTM device.
2.4.2. Manual Leak Rate Measurements
Manual measurements will be made of leak rates for the unit valves, blow-down valve, pressure
relief valve and miscellaneous components.
The leak rate for the unit valves will be measured at an existing port located immediately
downstream of the unit valve in the suction line to the compressor (see Figure 3). With the
compressor shut down and blown-down, any unit valve leak will exit through the opened port. The
leak rate will be measured with GRI's Hi-FlowTM device.
Figure 3. Unit Valve Sampling Port
- 21

The leak rates for the blow-down valve and pressure relief valve will be made with the unit shut
down and pressurized. The leak rate for the blow-down valve will be measured at the flange
located at the exit of the valve (see Figure 4). To make this measurement it will be necessary to
unbolt the flange. The flange will then be separated about 1-inch and a disk will be inserted and
clamped into place. The disk will capture the leak and direct it outward. The disk will be made of
high-density polyethylene about 1-inch thick and machined to fit the flange. A borehole will be
provided radially into the disk that will allow any leaking gas to escape for measurement using the
Hi-Flow.
Figure 4. Blown-down Valve Sampling Location
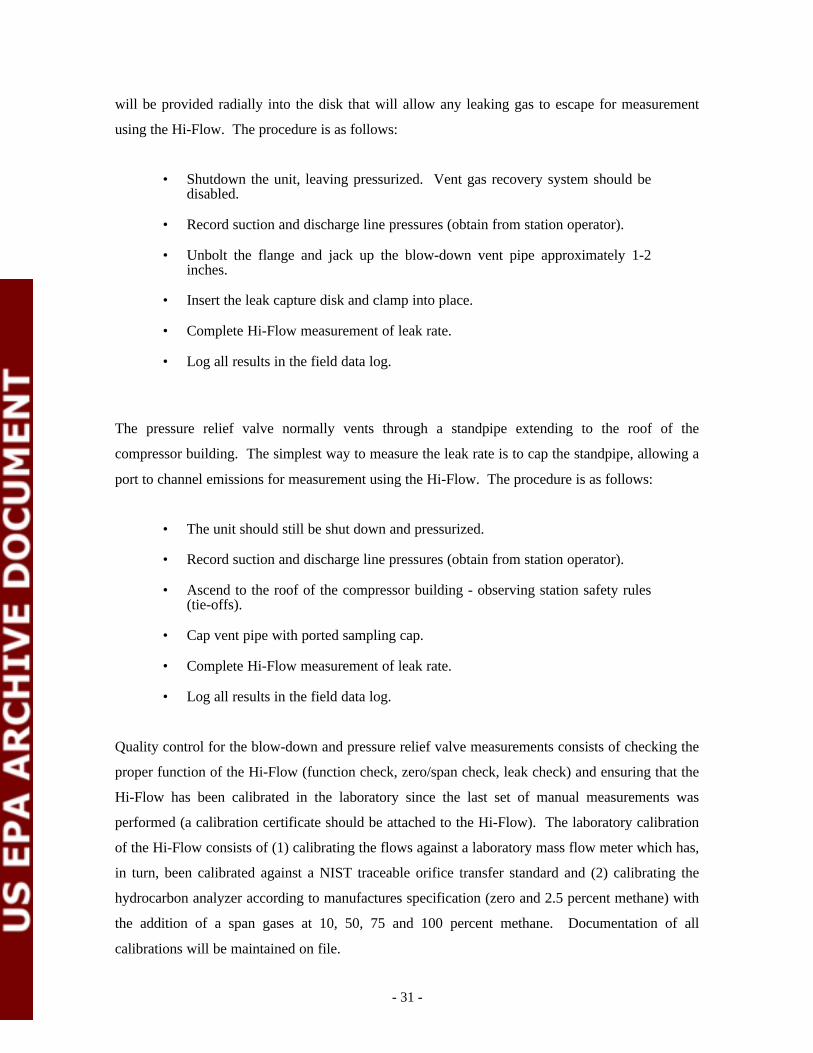
The pressure relief valve normally vents through a 4-inch standpipe extending to the roof of the
compressor building. The simplest way to measure the leak rate is to cap the standpipe, allowing a
port to channel emissions for measurement using the Hi-Flow.
The miscellaneous components at the test site consist of metering ports and valving used to recover
gas to the fuel system during shutdowns (the host station normally vents to the fuel system during
shutdowns). Significant leaks are not expected at these locations; however, all components will be
soap screened and any leaks identified will be quantified using the Hi-Flow or the EPA protocol
tent/bag method, where needed.
- 22

The manual leak rate measurements will require scheduled shutdowns that proceed as follows:
• Unit shutdown - remains pressurized, leak rates for the pressure relief valve, blow-down valve and miscellaneous components will be measured (several hours)
• Static Pac disabled, Hi-flow determination of leak rate and continuous flow monitoring (at least one hour)
• Unit blown-down, unit valve leak rate measured (about one hour)
• Unit brought back on line
Nearly one full day will be needed to conduct this suite of measurements.
The station has agreed to a limited number of scheduled shutdowns. These will be used to
characterize the quantities as discussed above, but will not contribute to the gas savings during idle
periods. It is proposed to conduct 3 such scheduled shutdowns during the first week of the test,
after installation of the static seal and after the rod packing (with the static seal) has had time to
stabilize (approximately 24 hours). In order to address possible changes over time, this series of
measurements will be repeated on two other occasions at approximately 2 months and 4 months
after installing the SS. Thus, the manual measurements will be repeated a total of 9 times in order
to capture the magnitude and variability of the various quantities involved.
2.5. SCHEDULE OF ACTIVITIES
A site survey visit has already been completed. Field testing is scheduled to begin in June of 1999,
but the exact date of start-up will depend on the availability of equipment and the extent to which
difficulties are encountered during start-up and shakedown. Uncertainty in the start-up date impacts
the dates for the subsequent activities in the schedule.
Allowing time for data analysis to be completed, a draft Phase I Report should be available for
review in September, 1999. All field activity should be completed by October 30, 1999. A draft
Phase II Report should be available no later than December 31, 1999. A final Phase I Report
should be available for distribution in November, 1999 and a final Phase II Report should be
available for distribution in February, 2000.
- 23

3.0 DATA QUALITY OBJECTIVES
Data quality objectives state the values of key data quality indicators for each measured quantity.
These objectives must be achieved in order to draw conclusions from the measurements with the
desired level of confidence. The process of establishing data quality objectives for measurements
starts with determining the desired level of confidence in the primary verification parameters (e.g.,
confidence level in the verified payback period).
The next step is to identify all measured values impacting the primary verification parameters, and
determine the error allowed. Formal error propagation techniques can help to systematize these
determinations. With error propagation, the cumulative effect of all measured variables on the primary
data quality objective can be determined. This allows individual measurement methods to be chosen
which perform well enough to satisfy the data quality objective for the primary verification parameter.
The primary quantitative objective for this study is to establish the payback period associated with
installation and use of the Static Pac. Inherent in this objective is documentation of the Static Pac's
gas loss reduction performance. Based on meetings with the Stakeholders, a payback period of
three years would represent acceptable performance. An error in this value of about +/- 3 to 4
months, or about 10 percent, is used as a basis in determining the data quality requirements.
Payback occurs when the total cost of the Static Pac (amortized capital and installation costs, and
operation and maintenance costs) equals the savings that the system provides (net gas loss
prevented). For the field test, the costs will be based on actual costs and the errors are zero. Gas
loss reduction will be measured directly during the study, then projected for the periods
immediately before and after the test is done. Specific data quality objectives address the error in
the direct measurements only; however, a discussion of the errors in the projections is also
provided below.
3.1. CONTINUOUS MEASUREMENTS
For a three year payback to occur for Case 1, the gas savings rate would have to average about 9.5
cfm - or 4.75 cfm per rod (assuming $10,000 total cost for two rods, gas value of $2/MCF, and 33
percent downtime). This implies a minimum gas savings rate of interest of about 0.5 cfm per rod
(~10 percent of 4.75 cfm) based on a 10 percent error in the payback period.
- 24

As discussed above (see Equation 1), the gas savings for each idle period will be taken as the
difference between the leak rate with the static seals disabled (or a surrogate using the running leak
rate) and the leak rate with the static seals engaged. By error propagation, the total error in the
difference is the sum of the absolute error in each measurement (in measured units). The accuracy
of the meters is +/- 2 percent full scale and the full-scale range of the meters is about 3-scfm
methane, so the absolute error is +/- 0.06 scfm. The total error in the difference (the gas savings) is
then +/- 0.12 scfm. This is well below the minimum leak rate of interest, and meets the 10 percent
data quality objective for a three year payback**. For payback periods longer than about 9 years
(gas savings rates less than 1.6 scfm/rod), the +/- 10 percent objective might not be met. The
minimum response of the meters chosen for the test is to a flow of about 0.125-scfm methane.
**For completeness, it should be noted that this assumes that the percentage errors during each idle
period are roughly consistent. This is because the total gas savings is computed as the sum of the
gas savings for each idle period over the duration of the test. By propagation, the error in the total
gas savings is the sum of the errors in the gas savings for each idle period. If the fractional, or
percentage error for each idle period is the same, then the percentage error in the total gas savings
is the same as the error for each idle period.
3.2. MANUAL MEASUREMENTS
Manual measurements will be based on use of GRI's Hi-Flow device and/or EPA's protocol
tent/bag method. The GRI Hi-Flow device draws a metered volume of ambient air past the leak
interface to capture the leaking gas. Flow metering is accomplished using a thermal anemometer
calibrated to flow. The concentration of methane in the sample stream is measured using a
Bascom-Turner CGI-201 hydrocarbon analyzer which has an effective range from about 500 ppm
to greater than 50 percent methane. The leak rate is determined simply as the product of flow and
concentration.
The device can meter sample flows in the range from about 4 to 8 scfm. This gives the device an
effective leak rate quantification range from about 0.02 to 4 scfm. The device has been shown in
laboratory testing to be able to quantify leak rates to within 10 percent of the actual value (Lott,
1995).
- 25

Since the Hi-Flow draws a high volume of air past the sample point, it will be important to take
measures to ensure that the sampler does not act to increase the leak rate by pulling excess gas
from the leak source. This issue is important for this test since some of the leak points to be tested
are expected to be passive, very low-pressure seeps to the atmosphere. These locations include the
doghouse vent and the unit valve sampling port.
This issue can be effectively addressed with proper sampling technique. The Hi-Flow is capable of
leak quantification over a range of sample flows. The sample flow used must be no higher than
necessary to capture the leak. Repeated measurements at different sample flows can be used to
verify that this occurs. Initially, the leak should be quantified using the lowest possible sample
flow. The measurement is then repeated at a higher flow. If the measured leak rate remains
constant at both flows, this indicates that the leak has been completely captured and that no excess
gas has been sampled. If the leak rate increases at the higher flow, this could indicate better leak
capture or sampling of excess gas. To control for this ambiguity, leak capture should be ensured by
constructing a partial enclosure around the Hi-Flow sampling hose and the leak interface that
allows ambient dilution air to enter, but effectively channels all leaking gas to the Hi-Flow.
It is possible that some leaks may not be readily quantifiable using the Hi-Flow device. This would
be the case if the leak interface were such that the Hi-Flow alone could not capture the leak. In
such cases, EPA's tent/bag method may be used. EPA's tent/bag method is nominally accurate to
within +/- 20 percent (EPA 1993), but has been shown to be capable of accuracies better than +/
10 percent when carefully applied (SRI 1996). Thus, the methods should be capable of producing
data at or near the desired level of confidence.
As a practical matter, the real limitation on the accuracy and the representativeness of the manual
measurements is their relative infrequency. Although the frequency of a measurement does not
affect the accuracy of an individual measurement, a larger number of measurements does improve
the “accuracy” (i.e., decrease the confidence interval for the mean). For this reason, the manual
measurements will be repeated in triplicate during each of the three intensive measurement periods
planned for the overall test (Phase I and Phase II). If significant variability is encountered in the
three samples, three additional samples will be collected.
The other quantity to be considered for Case 2 is the blow-down volume. This will be quantified
based pressure readings at the station controls, and the volume of piping and manifolds in the
- 26

compressor system. These valves are critical for station operation and the accuracy of station
metering is carefully checked and documented. Station calibration records will be obtained and
corded. Unit pressure (measured at the station) will be used to convert the volume to scfm.
3.3. PROJECTIONS
As discussed above (Section 2.2), projections beyond the test period will include a conservative
case and a likely case. In both cases, idle periods will be based on the previous year's operation for
the test unit. In the conservative case, emissions projections are straight lined from the end of the
test period and the uncertainties are small - no more than uncertainty in the final set of
measurements used for the projected value. In the likely case, projections will be based on the
trends in the measured data. In this case, the uncertainty may be estimated based on the fit of the
projected curve to the measured data.
4.0 DATA QUALITY INDICATORS
This section specifies data quality indicators that will be used as measures of data quality for the
test data and states how values for each indicator will be determined through calibrations, QC
checks, and other appropriate measures. This is presented in Table 6.
- 27

Table 6. Data Quality Indicators
Measurement Method Range Completeness/
Frequency Accuracy Precision How Verified/ Determined
Doghouse Vent Emissions
Continuous flow meter
0.2 to 4 scfm methane
90 % of hourly data over test period
2 % full scale, or +/- 0.2 scfm methane
2 % of reading
Comparison against manual flow tube measurements
Laboratory
Unit Valve Leak Rate Hi-Flow 0.1 to 4 scfm methane
9 total measurements (3 sets of 3)
10 % 10 % calibration against NIST certified mass flow meter
Laboratory Blow down valve leak rate
Hi-Flow 0.1 to 4 scfm methane
9 total measurements (3 sets of 3)
10 % 10 % calibration against NIST certified mass flow meter
Laboratory Pressure relief valve leak rate
Hi-Flow 0.1 to 4 scfm methane
9 total measurements (3 sets of 3)
10 % 10 % calibration against NIST certified mass flow meter
Misc. components leak rate
Hi-Flow or EPA Tent/Bag
0.1 to 4 scfm methane
9 total measurements (3 sets of 3)
10 % 10 % Repeat measurements
- 28

5.0 SAMPLING/ANALYTICAL AND QA/QC PROCEDURES
5.1. CONTINUOUS FLOW MEASUREMENTS
Static Pac leak prevention is determined using a flow meter on each doghouse vent to measure any
leaks. The meters selected for the test are a type of rate meter (similar to a rotameter) designed for
measuring methane emissions from sludge digesters, landfills, and other low-pressure applications.
Since they are rate meters, they will require external temperature and pressure correction to obtain
flow readings at standard conditions. Since the meters will be vented to atmosphere, local
barometric pressure data will be used to correct for pressure. Gas temperature is not expected to
vary significantly (within data quality objectives), therefore, temperature corrections will be based
on spot checks conducted during the manual measurement intensives.
The flow meters and barometric pressure transducer will be installed and tied in to the data
acquisition system approximately one week before the Static Pac installation. This will provide a
record of normal operations prior to installing the Static Pac and allow time for testing and
shakedown.
The flow meters are designed to operate unattended continuously after installation. Configuration
testing will be completed during the initial shakedown period. This will include manufacturer's
startup checks and reasonableness and manual flow checks. In addition, manual checks of meter
performance will be conducted using the Hi-Flow. A sampling port will be provided upstream of
the meters that allows the meters to be isolated and emissions to vent directly into the Hi-Flow.
The manufacturer is providing a calibration certificate for each of the flow meters. The meters
should not require re-calibration over the duration of the test.
Once the system is operational, average hourly flow data will be reviewed daily. The daily review
will include reasonableness screening as well as emissions trends and changes that could indicate
system problems.
- 29

5.2. MANUAL LEAK RATE MEASUREMENTS
A general description of the manual measurements of the leak rates for the unit valves, blow-down
valve, pressure relief valve and miscellaneous components is given in Section 2.4. The manual leak
rate measurements will require scheduled shutdowns that proceed as follows:
• Unit shutdown - remains pressurized. Leak rates for the pressure relief valve, blow-down valve and miscellaneous components will be measured (several hours). The gas recovery system will be disabled for the testing.
• SS disabled. Leak rate recorded by continuous flow monitor and Hi-Flow measurement (at least one hour)
• Unit blown-down, unit valve leak rate measured (about one hour)
• Unit brought back on line
Nearly one full day will be needed to complete this suite of measurements. The station has agreed
to a limited number of scheduled shutdowns. It is proposed to conduct three such scheduled
shutdowns during the first week of the test, after installation of the SS and after the rod packing
(with the SS) has had time to stabilize (approximately 24 hours). In order to address possible
changes over time, this series of measurements will be repeated on two other occasions at
approximately 2 months and 4 months after installing the Static Pac. Thus, the manual
measurements will be repeated a total of 9 times in order to capture the magnitude and variability
of the various quantities involved.
Detailed procedures for each type of measurement follow.
5.2.1. Blow-down Valve, and Pressure Relief Valve
The leak rates for the blow-down valve and pressure relief valve will be measured with the unit
shut down and pressurized. The leak rate for the blow-down valve will be measured at the flange
located at the exit of the valve (see Figure 3). To make this measurement it will be necessary to
unbolt the flange. The flange will then be separated about 1 inch and a disk will be inserted and
clamped into place. The disk will capture the leak and direct it outward radially. The disk will be
made of high-density polyethylene about 1 inch thick and machined to fit the flange. A borehole
- 30
will be provided radially into the disk that will allow any leaking gas to escape for measurement
using the Hi-Flow. The procedure is as follows:
• Shutdown the unit, leaving pressurized. Vent gas recovery system should be disabled.
• Record suction and discharge line pressures (obtain from station operator).
• Unbolt the flange and jack up the blow-down vent pipe approximately 1-2 inches.
• Insert the leak capture disk and clamp into place.
• Complete Hi-Flow measurement of leak rate.
• Log all results in the field data log.
The pressure relief valve normally vents through a standpipe extending to the roof of the
compressor building. The simplest way to measure the leak rate is to cap the standpipe, allowing a
port to channel emissions for measurement using the Hi-Flow. The procedure is as follows:
• The unit should still be shut down and pressurized.
• Record suction and discharge line pressures (obtain from station operator).
• Ascend to the roof of the compressor building - observing station safety rules (tie-offs).
• Cap vent pipe with ported sampling cap.
• Complete Hi-Flow measurement of leak rate.
• Log all results in the field data log.
Quality control for the blow-down and pressure relief valve measurements consists of checking the
proper function of the Hi-Flow (function check, zero/span check, leak check) and ensuring that the
Hi-Flow has been calibrated in the laboratory since the last set of manual measurements was
performed (a calibration certificate should be attached to the Hi-Flow). The laboratory calibration
of the Hi-Flow consists of (1) calibrating the flows against a laboratory mass flow meter which has,
in turn, been calibrated against a NIST traceable orifice transfer standard and (2) calibrating the
hydrocarbon analyzer according to manufactures specification (zero and 2.5 percent methane) with
the addition of a span gases at 10, 50, 75 and 100 percent methane. Documentation of all
calibrations will be maintained on file.
- 31

5.2.2. Miscellaneous Components
The miscellaneous components at the test site consist of metering ports, the bypass valve and the
vent gas recovery system used to recover gas to the fuel system during shutdowns (the host station
normally vents to the fuel system during shutdowns). These tests will be conducted with the unit
shut down and fully pressurized. Significant leaks are not expected at these locations; however, all
components will be soap screened and any leaks identified will be quantified using the GRI High
Flow (Lott, 1995) or the EPA protocol tent/bag method (EPA 1993). Sampling/analytical and
QA/QC procedures for these methods are published elsewhere (EPA 1993, Lott 1995). With either
method, the basic principle is to measure the methane concentration in a known volume of clean air
and compute the leak rate as the product of the methane concentration and the sampling rate.
In both cases, a Bascom-Turner CGI-201 methane analyzer will be used to determine methane
concentration. The CGI-201 is very stable and need only be calibrated prior to each set of
intensive measurements. Calibration will be done in the Center's Research Triangle Park, NC
laboratory facility using a certified gas mixture. Field checks consist of an automated zero cycle
conducted prior to each set of measurements.
5.2.3. Unit Valves
After the leak rates for the blown-down valve, pressure relief valve, and miscellaneous components
have been measured, the unit will be blown-down to measure the combined leak rate from both unit
valves. Whenever the unit is shut down, the suction and discharge lines are connected via a bypass
valve and line. The combined leak rate for the unit valves will be measured at an existing port
located immediately downstream of the suction side unit valve. With the compressor blown-down,
the combined leak from both unit valves will exit through the sampling port. The leak rate will be
measured with the Hi-Flow. The procedure is as follows.
• Blow-down the unit (station operator). • Open the sampling port. • Complete high flow measurements of the leak rate. • Log all results in the field data log.
Quality control for the unit valve measurements is the same as for the other manual measurements
using the Hi-Flow for quantification.
- 32

5.3. DATA ACQUISITION
Each continuous flow meter produces a 4 to 20 mA linearized output over the full-scale range of
the sensor. The barometric pressure transducer provides a linear 0 to 5 VDC output. All signals
will be logged using a Campbell 21X data logger with a serial connection to a laptop computer.
The laptop computer will provide remote access to the logger via modem communications. A
telephone connection will be made available at the station for daily data downloads and status
checks. Power for all components will be provided from the station 24V DC power supply which
is equipped with a battery back-up system. The logger will read data continuously and provide
aggregation of sampled data into hourly values.
In addition to the direct measurements, data on engine and compressor operation that relate to the
test are stored in the station computer and will be retrieved and transmitted to the Center
periodically. Table 7 lists all parameters that will be collected and stored by both the Station
computer and the project data system and their purpose.
Data will be checked daily and summary statistics and trend plots will be generated to check for
unusual or changing conditions. Details of the daily review are given in Section 6. Data will be
automatically downloaded from the DAS each midnight. Summary statistics and time series plots
will be produced from the data and reviewed at the start of each day.
- 33

Table 7. Data Record Contents and Significance
PARAMETER SIGNIFICANCE
Date Time Rod Seal #1 Leak Rate Leak rate Rod Seal #1 Gas Temperature Temp. Correction for #1 leak rate Rod Seal #2 Leak Rate Leak rate Rod Seal #1 Gas Temperature Temp. Correction for #2 leak rate Baromtric pressure Pressure correction for #1/#2 leak rates Engine RPM Unit on/off status Unit Suction Pressure Unit operating status Unit Discharge Pressure Unit operating status
6.0 DATA REDUCTION, VALIDATION, AND REPORTING
6.1. DATA REDUCTION
This section documents calculations that will be used to obtain final results from raw
measurements.
6.1.1. Continuous Measurements
The continuous flow meters provide a linearized 4 to 20 mA output over the full scale range of the
sensor. The reading in cfm (at calibrated conditions) is given by:
acfm = (mA - 4)/16 * FS
where, mA is the mA output from the meter electronics and FS is the full-scale reading in cfm.
The meters will be calibrated specific to methane at 70 degrees F. and 1 atmosphere pressure. To
adjust for variations in gas temperature and pressure and correct to standard conditions.
scfm = acfm * (P/760 * 294.26/T)^0.5
- 34

where P is the absolute barometric pressure (torr) at the site and T is the gas temperature (in
Kelvins). The exponent of 0.5 (square root) is necessary due to the physics of rate meters.
6.1.2. Manual Measurements
Leak rates for the blow-down valve, pressure relief valve, and unit valves are determined using the
Hi-Flow which measures sample flow and concentration. The flow will be calibrated specific to
methane in the laboratory and the calibration parameters (slope and intercept) will be used to
convert directly from the thermal anemometer output (arbitrary units) to flow rate (in scfm) as
follows.
scfm = v * m + b
where v is the anemometer output, m is the slope of the calibration curve, and b is the intercept.
If miscellaneous components are found to be leaking (using soap solution), then the leak rates will
be quantified using the GRI high flow or the EPA protocol (Method 21) tent/bag method. For each
of these methods, the leak rate is found as the product of the methane concentration and the
sampled flow rate. The methane concentration will be read directly from a Bascom-Turner CGI
201 analyzer calibrated specific to methane.
6.1.3. Gas Savings and Payback period
Formulae for calculating gas savings (Case 1 and Case 2) and for determining the payback period
are given in Section 2.2 of this plan.
6.1.4. Unit Conversions
Engineering units in common use at the test site and within the host industry will be used for
reporting and summarizing results. For pressure, the units are psi or inches water column. For
flow, the units are cfm and scfm (1 atmosphere, 70 degrees F or 294.26 K). For gas velocity, the
units are fpm. For concentration, percentage by volume or ppm are used.
- 35

6.2. DATA REVIEW AND VALIDATION
Calibrations and quality control checks for each measurement are described in Section 5 -
Sampling and Analytical Procedures. Table 8 summarizes the calibrations and quality control
checks to be performed. Upon review, all data collected will be classified as either valid, suspect
or invalid. In general, valid results are based on measurements meeting data quality objectives.
All data are considered valid unless a specific performance limit is exceeded or operational check
is failed.
It is often the case that anomalous data are identified in the process of data review. All outlying or
unusual values will be investigated as fully as possible using test records and logs. Anomalous
data may be considered suspect if no specific operational cause to invalidate the data are found.
All data - valid, invalid, and suspect will be included in the final report. Report conclusions will be
based on valid data only. The reasons for excluding any data will be justified in the report. Suspect
data may be included in the analyses, but may be given special treatment as specifically indicated.
All continuous sensor data will be reviewed on a daily basis. All anomalous or outlying values will
be identified and investigated to find a cause for the unusual condition. Manual measurements data
will be reviewed in the field as they are collected and any anomolous conditions will be
documented in field log book and, if possible, corrected.
- 36

Table 8. Summary of Calibrations and QC Checks
Measurement Cal/QC Check When Performed/
frequency
Expected or Allowable
Result
Response to Check Failure or Out of Control
Condition
Continuous flow measurements (including flow rate, temperature and pressure)
Hi-Flow verification
Startup and during bimonthly intensive measurement periods
+/- 10 % Agreement
Identify cause of discrepancy and correct
Sensor diagnostics Startup and daily No error condition Identify cause of any problem and correct
Data review Daily Reasonable values/trends
Identify cause of any problem and correct, flag suspect data
Manual Hi-Flow measurements
Hi-Flow zero, span and response checks Each measurement
+/- 5 percent of calibrated values
Identify cause of any problem and correct
Laboratory calibration
Prior to startup and intesive measurement periods
obtain calibration slope and intercept n/a
Manual EPA Method 21
Methane analyzer calibration
Prior to startup and intesive measurement periods set to standard n/a
Flow system calibration
Prior to startup and intesive measurement periods
obtain calibration slope and intercept n/a
Flow system leak check Each measurement no leak
Identify cause of any problem and correct
6.3. DATA ANALYSIS AND REPORTING
After data reduction, review and validation, the primary Phase 1 data analyses will include the
following:
• Document initial gas savings (methane emission reduction) for primary baseline operating conditions
The gas savings and methane emission reduction is the amount of gas that is prevented from leaking to the atmosphere either by the static seals themselves (Case I) or by changes in shut down procedure associated with installation of the static seals (Case II).
• Document capital, installation, and shakedown requirements and costs
This is a broad assessment of effort and costs required to install the Static Pac and ensure that it is operating properly. Any problems encountered during installation and shakedown - and their resolutions will be described. Capital and installation costs will be based on the actual installed cost for the system. For the test, flow sensors are being installed that might not be installed in a normal situation. Once the system is operational, host site personnel will be interviewed to determine whether flow sensors to document gas savings would be considered necessary in a permanent installation.
- 37

The following is a preliminary outline of the content of the Phase 1 verification report.
Preliminary Outline C. Lee Cook Static Pac Seal System
Phase I Verification Report
Verification Statement
Section 1 Executive Summary
ETV OverviewVerification ObjectivesTechnology DescriptionVerification ApproachVerification Results and Performance Evaluation
Initial gas savings (methane emission reduction) for primary baseline operating conditions Installation and Shakedown Requirements Initial Capital and Installation Costs
Data Quality Assessment Section 2 Verification Test Design and Description
Static Pac Description Site Selection, Description, and Static Pac Installation Verification Parameters and Their Determination
Initial gas savings (methane emission reduction) for primary baseline operating conditions Installation and Shakedown Requirements Initial Capital and Installation Costs
Sampling and Analytical ProceduresContinuous MeasurementsManual MeasurementsData Acquisition System
Quality Assurance and Quality Control Measures Calibration Procedures Quality Control Checks, Audits, and Corrective Actions Data Reduction Data Validation Data Analysis and Reporting
Section 3 Phase I Verification Results and Evaluation
Initial gas savings (methane emission reduction) for primary baseline operating conditions Installation and Shakedown Requirements Initial Capital and Installation Costs Data Quality Assessment
Section 4 Additional Technical and Performance Data from C. Lee Cook Division
References
- 38

The Phase II report will include key data from the Phase I report. The Phase II report will
incorporate the results from the entire evaluation process, and will focus on longer-term
performance of the system and the payback period. Phase II verification parameters include:
• Annualized gas savings for primary baseline conditions • Methane emission reduction • Calculate Static Pac payback period
7.0 AUDITS
An internal systems audit is planned for this test. The audit will be conducted by Southern’s
independently managed QA staff. This will include field verification, procedural, and
documentation components using this plan as the basis for the audit. An external audit may be
performed at EPA's discretion by EPA QA staff or a qualified contractor. A performance audit on
sensors used in the study is not considered necessary since the Hi-Flow will be laboratory certified
before each intensive measurement period and the continuous flow meters are rugged devices
designed for industrial applications. An internal audit of data quality will be conducted once data
collection and analyses are complete. The final report will contain a summary of results from all
audits.
8.0 CORRECTIVE ACTION
Table 8 in Section 6.2 lists allowable values for each of the calibrations and quality control checks
and also indicates actions to be taken in response to an out of control condition. Other issues may
arise that require corrective actions or plan changes to ensure that data quality objectives are met.
Southern's quality management plan provides general procedures for corrective action that will be
followed in such instances.
9.0 PROJECT ORGANIZATION
Southern Research Institute's Greenhouse Gas Technology Verification Center has overall
responsibility for planning and ensuring successful implementation of the verification test. C. Lee
Cook is providing the Static Pac technology, equipment, and engineering for the test installation.
ANR Pipeline is providing access to the host site, and logistical and manpower assistance in the
installation and operation of the Static Pac, and in conducting the test. Good working relationships
- 39

have been established between the Center, C. Lee Cook, and ANR which have proved valuable in
the planning up to this stage. All parties have signed a formal agreement (documented in the Letter
of Commitment and associated documents) specifying details of financial, technical, and
managerial responsibilities.
EPA's APPCD is the sponsor of the ETV Greenhouse Gas Pilot and is providing broad oversight
and QA support for the project. The project organization is presented in Figure 5.
Southern Research Institute ETV GHG Center Director
ETV GHG Center Deputy Director Sushma Masemore
EPA ETV GHG Pilot Manager
EPA - APPCD
Southern Research Institute QA Manager
Southern Research Institute QA Staff Scott Bell
Southern Research Institute ETV GHG QA Coordinator
Brian Phillips Southern Research Institute
ETV GHG Technical Staff
EPA ETV GHG QA Manager
EPA - APPCD Kaye Whitfield
ANR PipelineC. Lee Cook Bob Borders
Stephen Piccot David Kirchgessner
Leslie Schnoll
Eric Ringler Tony Eggleston
Ron Sanders Marylyn Wenzel
Figure 5. Project Organization
10.0 TEST PROGRAM HEALTH AND SAFETY
This section applies to Center personnel only. Other organizations involved in the project have
their own health and safety plans - specific to their roles in the project.
Since the site is part of a pipeline facility, ANR’s safety policies are regulated in part by the US
Department of Transportation. The Center previously provided a scope of work equivalent to the
- 40

scope of this plan to the National Compliance Management Service Company, which is a
compliance and safety program management company specializing in DOT regulated industries.
Their assessment is that the Center's on-site job function is not covered by the Research and
Special Programs Administration, DOT pipeline safety regulations covered by 49 CFR Parts 192,
193, and 195. If the scope of work changes significantly, this determination would be re-evaluated.
Southern staff will comply with all known ANR, state/local and Federal regulations relating to
safety at ANR’s Celestine compressor station. This includes use of personal protective gear (flame
resistant clothing, safety glasses, hearing protection, safety toe shoes) as required and completion
of site safety orientation (site hazard awareness, alarms and signals, etc.).
Other than normal industrial hazards, the most significant hazard at the Station is the potential for
explosive concentrations of natural gas. Southern plans to use only intrinsically safe apparatus in
the compressor building. Should use of any equipment not so rated be required, Southern will not
use this equipment until advised by site personnel that it is safe to do so.
Some test procedures will require that special safety precautions be observed. In particular, when
conducting manual sampling of the blow-down valve leak rate, the automated blow-down valve
control should be disabled to prevent a blown-down during sampling.
- 41
11.0 REFERENCES
US Environmental Protection Agency. Appendix A, NSPS Test Methods. 40 CFR Part 60. 1999.
US Environmental Protection Agency. Natural Gas STAR Program. World Wide Web (www.epa.gov.gasstar).
US Environmental Protection Agency. Protocol for Equipment Leak Emissions Estimates, EPA-453/R-93-026, June 1993.
Gas Research Institute/US Environmental Protection Agency. Methane Emissions from the Natural Gas Industry. GRI-94/0257-EPA-600/R-96-080. June, 1996.
Howard, Touche. Methane Emissions from Natural Gas Customer Meters: Screening and Enclosure studies. Indaco Air Quality Services, July 1992.
Hummel, Kirk E., Lisa M. Campbell, and Matthew R. Harrison. Methane Emissions from the Natural Gas Industry, Volume 8: Equipment Leaks. GRI-94/0257.25. Gas Research Institute. Chicago, IL. June 1996.
Lott, R.A., Howard, T., and Webb M. New Technology for Measuring Leak Rates. American Gas Association Operating Proceedings. 1995.
Lott, Robert A., Indaco Air Quality Services, Inc. GRI Hi-FlowTM Sampler for Leak Detection and Measurement, June 1998.
Southern Research Institute. Evaluation of the High Volume Collection System (HVCS) for Quantifying Fugitive Organic Vapor Leaks, EPA/600/SR-95/167, February 1996.
Southern Research Institute. Environmental Technology Verification Greenhouse Gas Technology Verification Quality Management Plan. Research Triangle Park, NC. October, 1998.
- 42

APPENDIX A
Static Pac Operator’s Manual Automatic Control System
- 43

- 44

- 45

- 46
APPENDIX B
Static Pac Operator’s Manual Manual Control System
- 47
- 48
- 49

- 50