
Greenhouse Gas Reporting Program Petroleum and Natural Gas … · 2018-10-26 · Greenhouse Gas...
34
Greenhouse Gas Reporting Program Petroleum and Natural Gas Systems U.S. Environmental Protection Agency October 17, 2018
Transcript of Greenhouse Gas Reporting Program Petroleum and Natural Gas … · 2018-10-26 · Greenhouse Gas...

Greenhouse Gas Reporting Program Petroleum and Natural Gas Systems
U.S. Environmental Protection AgencyOctober 17, 2018

Agenda
• Background on Greenhouse Gas Reporting Program (GHGRP)
• GHGRP Petroleum and Natural Gas Systems (Subpart W): Reporting Year 2017 Data Summary
2

Background on Greenhouse Gas Reporting Program
3

Overview of GHG Reporting Program
• Launched in response to FY 2008 Consolidated Appropriations Act• Annual reporting of GHGs by 41 source categories
– 33 types of direct emitters– 6 types of suppliers of fuel and industrial GHGs– Facilities that inject CO2 underground for geologic sequestration, enhanced oil
recovery, or any other purpose• Most source categories began collecting data in 2010
– An additional 12 source categories began collecting data in 2011– We now have 8 years of data for 29 source categories and 7 years of data for 12
source categories• Facilities use uniform methods prescribed by the EPA to calculate GHG
emissions, such as direct measurement, engineering calculations, or emission factors derived from direct measurement
– In some cases, facilities have a choice of calculation methods for an emission source• Direct reporting to EPA electronically• EPA verification of GHG data
4

Source Categories Covered by GHG Reporting Program
Power Refining & Petrochem
Other Chemicals
Combustion Waste Metals Minerals Pulp & Paper
High GWP Gases
- Electricity Generation
- ElectricalEquipment Mfg.
- ElectricalEquipment Use
- Petroleum Refineries
- Petrochem. Production
- Adipic Acid
- Ammonia
- Hydrogen Production
- Nitric Acid
- Phosphoric Acid
- Titanium Dioxide
- Stationary Combustion
- IndustrialWaste Landfills
- IndustrialWastewater Treatment
- MSW Landfills
- Aluminum
- Ferroalloy
- Iron & Steel
- Lead
- Magnesium
- Silicon Carbide
- Zinc
- Cement
- Glass
- Lime
- Misc.Carbonate Use
- Soda Ash
- Pulp & Paper
- Electronics Mfg.
- Fluorinated GHG Production
- HCFC-22 Prod./HFC-23 Destruction
- Pre-ChargedEquipment Import/Export
- Industrial Gas Suppliers
Petroleum & Natural Gas Systems Fuel Suppliers Carbon Capture & Sequestration
Mining
- Onshore Production
- Offshore Production
- Gathering and Boosting (as of 2016)
- Natural Gas Processing
- Natural Gas Transmission Compression
- Natural Gas Transmission Pipeline (as of 2016)
- Natural Gas Distribution
- Underground Natural Gas Storage
- Liquefied Natural Gas Storage
- Liquefied Natural Gas Import/Export
- Coal-Based Liquid Fuels Suppliers
- Natural Gas and Natural Gas Liquids Suppliers
- Petroleum Product Suppliers
- Geologic Sequestration of CO2
- Injection of CO2
- CO2 Suppliers
- Underground Coal Mines
Direct EmittersSuppliers
CO2 Injection
5

GHG Reporting Program vs. US GHG Inventory
Task Inventory Greenhouse Gas Reporting Program
Find total U.S. emissions
Review trend data for the past 20 years
Browse a map to find largest emitters in your
area Compare facility emissions across an industrial sectorFind reported emissions by
state
• Inventory of U.S. Greenhouse Gas Emissions and Sinks (Inventory) tracks total annual U.S. emissions across all sectors of the economy using national-level data
• GHGRP collects detailed emissions data from large greenhouse gas emitting facilities in the United States
– GHGRP covers most, but not all, U.S. GHG emissions– GHGRP does not include agriculture, land use, and small sources
6

Electronic Reporting Workflow
e-GGRT, interactive web-based, data reporting tool
EPA
iVP
e-GGRT Datamart
State-Specific ServiceOriented data flow using EnviroFactsAPI
EPA EnviroFacts: Serviceable, searchable and separately hosted copy of non-CBI dataset.
EPA GHG Data System
Data Collection Data Publication
Reporters Facilities andSuppliers
Data Verification(EPA)
GHGRP Data Publication Website (FLIGHT) (ghgdata.epa.gov)
Downloadable XLS, XML & HTML Data Files & highlights
Improve data quality before it is submitted to EPA- Intuitive Interface- Comprehensive Help- Real-Time Data Quality
Feedback
7

Validation and Verification
Validation generally refers to electronic checks and messaging performed by e-GGRT and presented to the reporter before the annual GHG report is certified and submitted
Verification refers to electronic checks, manual review, and messaging performed by EPA after the annual report is certified and submitted.
EPA’s verification process includes thousands of electronic checks.
These checks comprise two groups. Validation checks and Verification checks.
8

What is a Facility?
• In general, a “facility” for purposes of the GHGRP means all co-located emission sources that are commonly owned or operated
• However, certain industry segments within the Petroleum and Natural Gas Systems source category have unique “facility” definitions
– Onshore production: the “facility” includes all emissions associated with wells owned or operated by a single company (the permit holder) in a specific hydrocarbon producing basin (as defined by the geologic provinces published by the American Association of Petroleum Geologists)
– Natural gas distribution: the “facility” is a local distribution company as regulated by a single state public utility commission
– Gathering and boosting: a “facility” means all gathering pipelines and other equipment located along those pipelines that are under common ownership or common control by a gathering and boosting system owner or operator and that are located in a single hydrocarbon basin
– Natural gas transmission pipeline, a “facility” means the total U.S. mileage of natural gas transmission pipelines, owned and operated by an onshore natural gas transmission pipeline owner or operator
• The other industry segments in the Petroleum and Natural Gas Systems source category follow the general GHGRP definition of “facility”
9
GHGRP Petroleum and Natural Gas Systems: Reporting Year 2017 Data
Summary
10

Reporting Year 2017 Data Release
• Today, EPA is releasing 2017 data collected by the GHG Reporting Program.
• In 2017, reported emissions were down 2.7% from 2016.– Reported emissions from large power plants declined 4.5%
since 2016, and 19.7% since 2011. – Reported emissions from petroleum and natural gas systems
increased 1.5% since 2016. – Reported emissions from other large sources in the industrial
and wastes sectors were mostly unchanged from 2016.
11
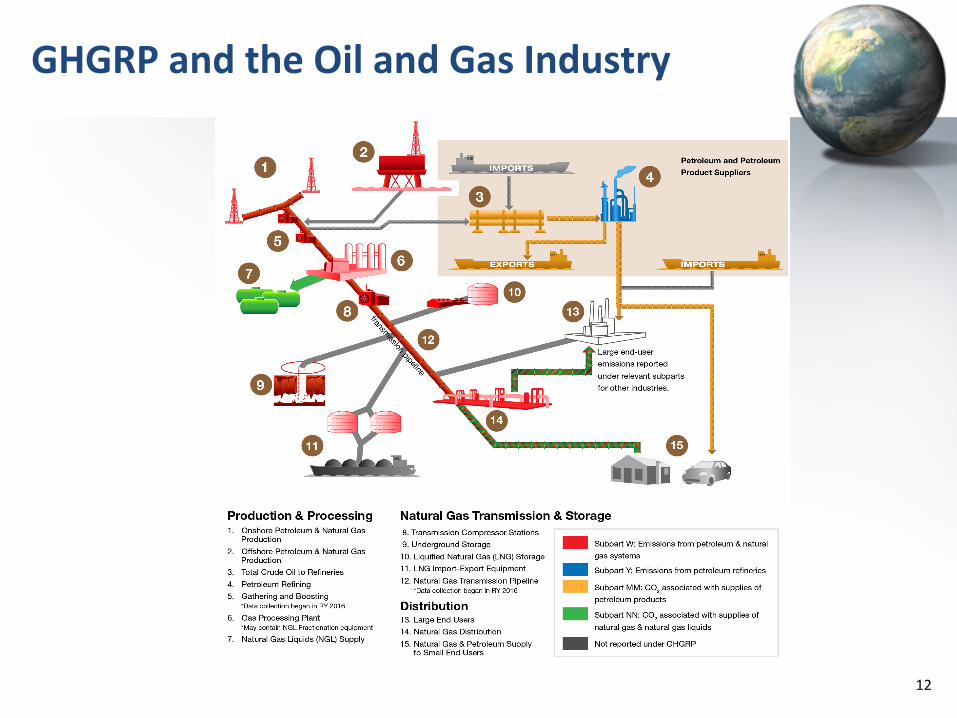
GHGRP and the Oil and Gas Industry
12

Reported GHG Emissions by Industry Segment• EPA received annual reports from 2,253 facilities• Reported emissions totaled 284 Million Metric Tons (MMT) CO2e• Largest segments in terms of reported GHG emissions were onshore
production, gathering and boosting, and natural gas processing
13
Segment Number of Facilities
2017 Reported Emissions(Million Metric Tons CO2e)
Onshore Production 497 94Offshore Production 141 7Gathering and Boosting 321 75Natural Gas Processing 449 56Natural Gas Transmission Compression 529 24Natural Gas Transmission Pipeline 33 3Underground Natural Gas Storage 48 1LNG Import/Export 6 4LNG Storage 6 <1Natural Gas Distribution 169 13Other Oil and Gas Combustion 79 7Total 2,253 284
GHGRP data as of 8/19/18

Changes in Reported Emissions by Industry Segment: 2011-2017
Industry Segment
2011 Reported Emissions
(MMT CO2e)
2012 Reported Emissions
(MMT CO2e)
2013 Reported Emissions
(MMT CO2e)
2014 Reported Emissions
(MMT CO2e)
2015 Reported Emissions
(MMT CO2e)
2016 Reported Emissions
(MMT CO2e)
2017Reported Emissions
(MMT CO2e)Onshore Production 92 93 98 102 101 85 94Offshore Production 6 7 6 7 7 7 7Gathering and Boosting
N/A N/A N/A N/A N/A 82 75
Natural Gas Processing 59 60 59 60 59 55 56Natural Gas Transmission Compression
24 24 23 22 23 22 24
Natural Gas Transmission Pipeline
N/A N/A N/A N/A N/A 3 3
Underground Natural Gas Storage
2 2 2 2 2 1 1
LNG Import/Export 1 1 <1 1 1 2 4LNG Storage <1 <1 <1 <1 <1 <1 <1
Natural Gas Distribution
16 15 15 15 14 14 13
Other Oil and Gas Combustion
23 25 24 28 29 7 7
Total 222 226 228 235 235 280 28414
GHGRP data as of 8/19/18

Reported Emissions by Greenhouse Gas• Carbon dioxide (CO2) emissions accounted for 197 MMT CO2e and
methane (CH4) emissions accounted for 88 MMT CO2e • Emissions from natural gas distribution were primarily methane while
emissions from natural gas transmission compression, natural gas processing, gathering and boosting, and onshore production were primarily carbon dioxide
15GHGRP data as of 8/19/18
7
4
20
53
56
5
50
13
3
4
3
19
2
44
0 20 40 60 80 100
Other Oil and Gas Combustion
Natural Gas Distribution
LNG Storage
LNG Import/Export
Underground Natural Gas Storage
Natural Gas Transmission Pipeline
Natural Gas Transmission Compression
Natural Gas Processing
Gathering and Boosting
Offshore Production
Onshore Production
Emissions, MMT CO2e
2017 Reported Emissions by Greenhouse Gas
CO2 EmissionsCH4 EmissionsN2O Emissions
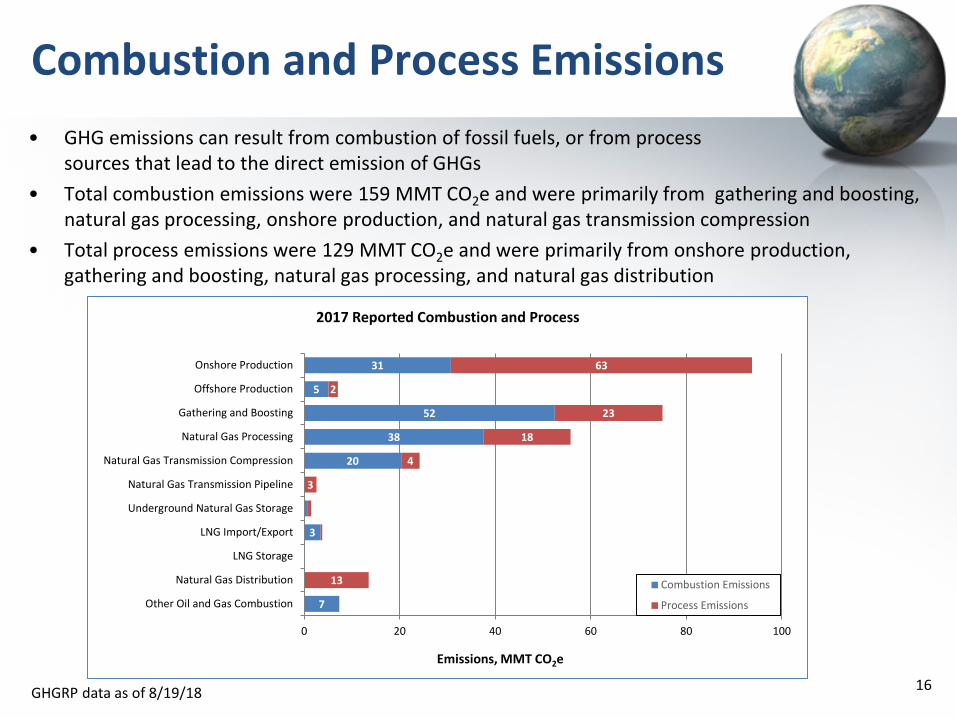
Combustion and Process Emissions • GHG emissions can result from combustion of fossil fuels, or from process
sources that lead to the direct emission of GHGs• Total combustion emissions were 159 MMT CO2e and were primarily from gathering and boosting,
natural gas processing, onshore production, and natural gas transmission compression• Total process emissions were 129 MMT CO2e and were primarily from onshore production,
gathering and boosting, natural gas processing, and natural gas distribution
16GHGRP data as of 8/19/18
7
3
20
38
52
5
31
13
3
4
18
23
2
63
0 20 40 60 80 100
Other Oil and Gas Combustion
Natural Gas Distribution
LNG Storage
LNG Import/Export
Underground Natural Gas Storage
Natural Gas Transmission Pipeline
Natural Gas Transmission Compression
Natural Gas Processing
Gathering and Boosting
Offshore Production
Onshore Production
Emissions, MMT CO2e
2017 Reported Combustion and Process
Combustion Emissions
Process Emissions

• The figure to the left shows total reported process emissions across all Petroleum and Natural Gas Systems facilities
• The largest reported process emission sources were pneumatic devices, miscellaneous equipment leaks, and acid gas removal units
Process Emission Sources
17GHGRP data as of 8/19/18
2
6
9
9
12
2
2
2
3
2
1
3
4
7
9
4
1
1
14
31
0 5 10 15 20 25 30 35
Enhanced Oil Recovery Pumps
Enhanced Oil Recovery Liquids
Well Testing
Gas Well Compl. and Work.…
Transmission Tanks
Distribution M-R Stations
Offshore Sources
Liquids Unloading
Centrifugal Compressors
Pneumatic Pumps
Dehydrators
Well Compl. and Work. with HF
Reciprocating Compressors
Distribution Services
Blowdown Vent Stacks
Distribution Mains
Atmospheric Storage Tanks
Other Flare Stacks
Associated Gas Venting and…
Acid Gas Removal Units
Misc Equipment Leaks
Pneumatic Devices
Emissions, MMT CO2e
2017 Reported Process Emission Sources
CO2 EmissionsCH4 EmissionsN2O Emissions

Onshore Production
• Reported emissions in onshore production totaled 93.8 MMT CO2e• Methane emissions totaled 44.2 MMT CO2e and carbon dioxide emissions totaled 50.5
MMT CO2e• Combustion equipment (30.9 MMT CO2e) and pneumatic devices (25.7 MMT CO2e) were
the top reported emission sources in onshore production
18GHGRP data as of 8/19/18
2
3
5
9
30
2
2
1
2
8
1
25
0 5 10 15 20 25 30 35
Liquids Unloading
Pneumatic Pumps
Well Compl. and Work. with HF
Other Flare Stacks
Atmospheric Storage Tanks
Misc Equipment Leaks
Associated Gas Venting and Flaring
Pneumatic Devices
Combustion Equipment
Emissions, MMT CO2e
2017 Onshore Production: Top Reported Emission Sources
CO2 Emissions
CH4 Emissions
N2O Emissions

Onshore Production Basins
19GHGRP data as of 8/19/18

Onshore Production Well Count by County
20GHGRP data as of 8/19/18

Offshore Production
• Reported emissions from offshore production totaled 7.0 MMT CO2e• Methane emissions totaled 1.6 MMT CO2e and carbon dioxide emissions totaled 5.5
MMT CO2e• The top reported emission source was combustion equipment (5 MMT CO2e)• GHGRP calculation methods for process emissions are based on requirements that were
established by the Bureau of Ocean Energy Management (BOEM)
21GHGRP data as of 8/19/18
5
1
0 1 2 3 4 5 6
Flaring
Equipment Leaks
Venting
Combustion
Emissions, MMT CO2e
2017 Offshore Production: Top Reported Emission Sources
CO2 Emissions
CH4 Emissions
N2O Emissions

Gathering and Boosting• The gathering and boosting segment was first reported in 2016• Reported emissions from gathering and boosting totaled 75 MMT CO2e• Methane emissions totaled 19.3 MMT CO2e and carbon dioxide emissions totaled 55.7
MMT CO2e• The top reported emission sources were combustion equipment (52.5 MMT CO2e),
miscellaneous equipment leaks (6.2 MMT CO2e), and pneumatic devices (4.9 MMT CO2e)
22GHGRP data as of 8/19/18
2
52
0
2
2
5
6
1
0 10 20 30 40 50 60
Reciprocating Compressors
Acid Gas Removal Units
Pneumatic Pumps
Centrifugal Compressors
Dehydrators
Blowdown Vent Stacks
Other Flare Stacks
Atmospheric Storage Tanks
Pneumatic Devices
Misc Equipment Leaks
Combustion Equipment
Emissions, MMT CO2e
2017 Gathering and Boosting: Top Reported Emission Sources
CO2 EmissionsCH4 EmissionsN2O Emissions

Natural Gas Processing
• Reported emissions from natural gas processing totaled 55.8 MMT CO2e• Methane emissions totaled 3.1 MMT CO2e and carbon dioxide emissions totaled
52.8 MMT CO2e• The top reported emission sources were combustion equipment (37.7 MMT CO2e), acid
gas removal units (11.3 MMT CO2e), and other flare stacks (4.1 MMT CO2e)
23GHGRP data as of 8/19/18
4
11
38
1
1
1
0 5 10 15 20 25 30 35 40
Misc Equipment Leaks
Dehydrators
Centrifugal Compressors
Blowdown Vent Stacks
Reciprocating Compressors
Other Flare Stacks
Acid Gas Removal Units
Combustion Equipment
Emissions, MMT CO2e
2017 Natural Gas Processing: Top Reported Emission Sources
CO2 EmissionsCH4 EmissionsN2O Emissions

Natural Gas Transmission Compression
• Reported emissions from natural gas transmission compression totaled 24.2 MMT CO2e• Methane emissions totaled 3.9 MMT CO2e and carbon dioxide emissions totaled 20.8
MMT CO2e• Top reported emission source was combustion equipment (20.8 MMT CO2e)
24GHGRP data as of 8/19/18
20
1
1
0 5 10 15 20 25
Other Flare Stacks
Transmission Tanks
Pneumatic Devices
Misc Equipment Leaks
Centrifugal Compressors
Blowdown Vent Stacks
Reciprocating Compressors
Combustion Equipment
Emissions, MMT CO2e
2017 Natural Gas Transmission Compression: Top Reported Emission Sources
CO2 Emissions
CH4 Emissions
N2O Emissions

Natural Gas Transmission Pipeline
• GHG emissions from the natural gas transmission pipeline segment were first reported in 2016 and contains one reported emission source, blowdown vent stacks
• Reported emissions from natural gas transmission pipeline totaled 2.6 MMT CO2e
• Methane emissions totaled 2.6 MMT CO2e and carbon dioxide emissions totaled less than 0.01 MMT CO2e
25GHGRP data as of 8/19/18

Natural Gas Transmission Pipeline
26GHGRP data as of 8/19/17

Underground Natural Gas Storage
• Reported emissions from underground natural gas storage totaled 1.5 MMT CO2e
• Methane emissions totaled 0.7 MMT CO2e and carbon dioxide emissions totaled 0.8 MMT CO2e
• The top reported emission source was combustion equipment (0.8 MMT CO2e)
27GHGRP data as of 8/19/18
0.0 0.2 0.4 0.6 0.8 1.0
Other Flare Stacks
Centrifugal Compressors
Misc Equipment Leaks
Pneumatic Devices
Reciprocating Compressors
Combustion Equipment
Emissions, MMT CO2e
2017 Underground Natural Gas Storage: Top Reported Emission Sources
CO2 EmissionsCH4 EmissionsN2O Emissions

LNG Import/Export and LNG Storage
• LNG Import/Export– EPA received emission reports from 6 LNG import/export
terminals – Reported emissions totaled 3.8 MMT CO2e
• Methane emissions totaled 0.04 MMT CO2e and carbon dioxide emissions totaled 3.7 MMT CO2e
• Top reported source of emissions was combustion equipment (3.4 MMT CO2e)
• LNG Storage– EPA received emission reports from 6 LNG storage facilities– Reported emissions from LNG storage were less than 0.01
MMT CO2e28GHGRP data as of 8/19/18
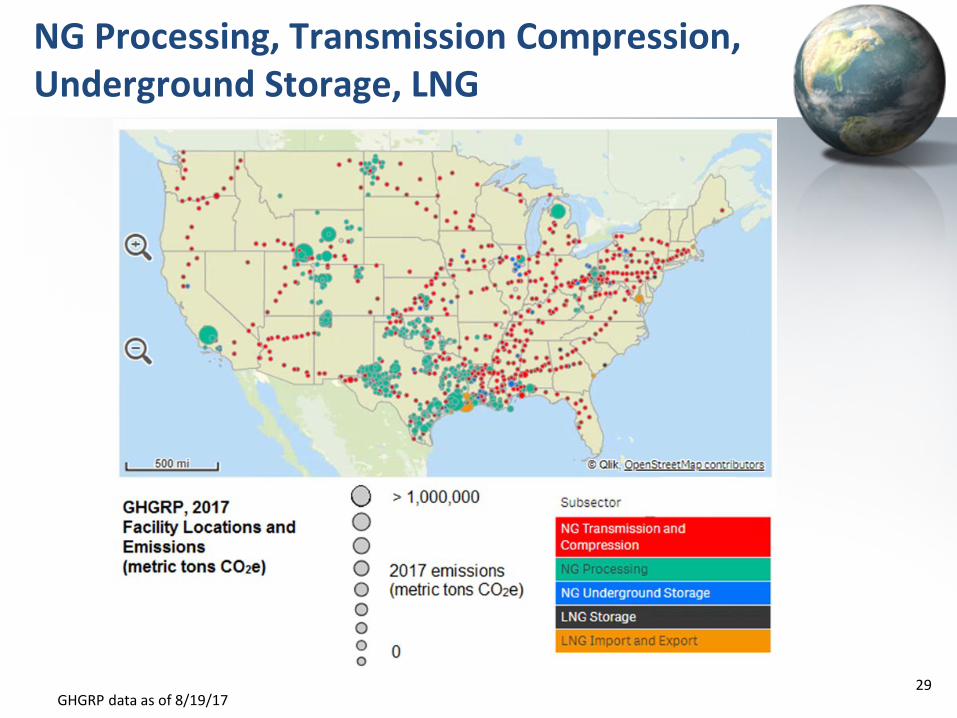
NG Processing, Transmission Compression, Underground Storage, LNG
29GHGRP data as of 8/19/17

Natural Gas Distribution
• Reported emissions from natural gas distribution totaled 13.5 MMT CO2e• Methane emissions totaled 13.4 MMT CO2e and carbon dioxide emissions
totaled 0.2 MMT CO2e • Distribution mains (9.1 MMT CO2e) and distribution services (4.1 MMT CO2e)
accounted for the majority of reported emissions
30GHGRP data as of 8/19/18
4
9
0 2 4 6 8 10
Misc Equipment Leaks
Combustion Equipment
Distribution M-R Stations
Distribution Services
Distribution Mains
Emissions, MMT CO2e
2017 Natural Gas Distribution: Top Reported Emission Sources
CO2 EmissionsCH4 EmissionsN2O Emissions

For More Information
31

How to Access GHGRP Data on Petroleum and Natural Gas Systems
• EPA has several data portals to access data collected by the GHGRP on Petroleum and Natural Gas Systems
• EPA’s easy-to-use Facility Level Information on GreenHouse gas Tool (FLIGHT) allows users to view GHG data from Petroleum and Natural Gas Systems in a variety of ways
– View GHG data reported by individual facilities– Aggregate reported emissions based on industry segment or geographic level– Search for facilities by name, location, corporate parent, or NAICS code– Visit FLIGHT: http://ghgdata.epa.gov/ghgp
• Detailed non-CBI data is available on Envirofacts– Access GHG data on Envirofacts: http://www.epa.gov/enviro/facts/ghg/search.html
32
Informational Webinar
• EPA will be holding an informational webinar to demonstrate its greenhouse gas data publication tool known as “FLIGHT”, as well as Envirofacts– The tentative date is Wednesday, October 24– For more information, and to register for the webinar see:
www.epa.gov/ghgreporting/
33

Other GHGRP Resources
• GHGRP Subpart W website: http://www.epa.gov/ghgreporting/subpart-w-petroleum-and-natural-gas-systems
• GHGRP Help Desk: [email protected]
34