Zeppelin Universität | Leadership Excellence Institute Zeppelin | LEIZ, Annual Report April 2014

Annual report 2007
Greenhouse gas monitoring at the Zeppelin station, Svalbard, Norway
1044
2009


Statlig program for forurensningsovervåking:
Greenhouse gas monitoring at the Zeppelin station,
Svalbard, Norway
SPFO-rapport: 1044/2009
TA-2480/2009
ISBN 978-82-425-2058-6 (printed)
ISBN 978-82-425-2059-3 (electronic)
Oppdragsgiver: Statens forurensningstilsyn (SFT)
Utførende institusjon: Norsk institutt for luftforskning (NILU)
Greenhouse gas monitoring at the Zeppelin station, Svalbard, Norway
Rapport
1044/2009
Annual report 2007
Authors: C. Lund Myhre, O. Hermansen, A.M. Fjæraa, C. Lunder,
N. Schmidbauer, K. Stebel (all NILU), J. Ström (Norwegian Polar
Institute), V.E. Cachorro Revilla (University of Valladolid)
NILU project no.: O-99093
NILU report no.: OR 02/2009
ISSN 0807-7207

Greenhouse gas monitoring at the Zeppelin station, Svalbard, Norway - Annual report 2007 (TA-2480/2009)
2

Greenhouse gas monitoring at the Zeppelin station, Svalbard, Norway - Annual report 2007 (TA-2480/2009)
3
Preface
In 1999 the Norwegian Pollution Control Authority (SFT) and Norwegian Institute for Air
research (NILU) signed a contract commissioning NILU to run a programme for monitoring
greenhouse gases at the Zeppelin station, close to Ny-Ålesund at Svalbard. At the same time
NILU started to coordinate a project funded by the European Commission called SOGE
(System for Observation of halogenated Greenhouse gases in Europe). The funding from SFT
enabled NILU to broadly extend the monitoring programme and associated activities, making
the Zeppelin observatory a considerable contributor of data on a global as well as a regional
scale.
The unique location of the Zeppelin observatory at Svalbard together with the infrastructure
of the scientific research community at Ny-Ålesund makes it ideal for monitoring the global
changes of the atmosphere. There are few local sources of emissions, and the Arctic location
is also important as the Arctic is a particularly vulnerable region.
In 1987 the Montreal Protocol was signed and entered into force in 1989 in order to reduce
the production and use of the ozone-depleting substances (ODS). The amount of most ODS in
the troposphere is now declining slowly and one expects to be back to pre-1980 levels around
year 2050. It is crucial to follow the development of the concentration of these ozone
depleting gases in order to verify that the Montreal Protocol and its amendments work as
expected. Further these gases and their replacement gases are strong greenhouse gases making
it even more important to follow the development of their concentrations.
In December 1997 the Kyoto protocol was adopted. The target set by the Kyoto protocol is to
reduce the total emissions of greenhouse gases from the industrialized countries during the
period 2008 to 2012. The six most important groups of greenhouse gases included are: CO2,
CH4, N2O, fluorinated hydrocarbons (HFKs and PFKs) and sulphur hexsafluoride (SF6).
The satellite picture to the
left shows the location of
the Zeppelin Mountain at
Svalbard, and the picture
above is the observatory
close to Ny-Ålesund.

Greenhouse gas monitoring at the Zeppelin station, Svalbard, Norway - Annual report 2007 (TA-2480/2009)
4
This collaborative SFT/NILU programme includes monitoring of 23 greenhouse gases at the
Zeppelin observatory in the Arctic. The following are regulated through the Montreal
protocol: chlorofluorocarbons (CFC), hydrochlorofluorocarbons (HCFC), and halones as well
as other halogenated organic gases. Further the following gases included in the Kyoto
protocol are monitored; methane (CH4), hydrofluorocarbons (HFC), sulphurhexafluoride
(SF6). Additionally carbon monoxide (CO) and tropospheric ozone (O3) are a part of the
programme. The amount of particles in the air above the stations is also measured. The station
is hosting measurements of carbon dioxide (CO2) performed by ITM, University of
Stockholm as well. This activity is funded by the Swedish Environmental Protection Agency
and the results are included briefly in the report.
The Norwegian Institute for Air Research (NILU) is responsible for the operation and
maintenance of the monitoring programme. The purpose of the programme is to:
Provide continuous measurements of greenhouse gases in the Arctic region resulting in
high quality data that can be used in trend analysis
Provide trend analysis and interpretations
Provide information on the status and the development of the greenhouse gases with a
particular focus on the gases included in the international conventions the Montreal and
Kyoto protocol.
Observations and results from the monitoring programme are processed and used to assess the
progress towards compliance with international agreements like the Kyoto and the Montreal
Protocols. This report summarises the activities and results of the greenhouse gas monitoring
programme for the year 2007, and analysis for the period 2001-2007.
Kjeller, January 2009
Cathrine Lund Myhre
Senior scientist and Project manager

Greenhouse gas monitoring at the Zeppelin station, Svalbard, Norway - Annual report 2007 (TA-2480/2009)
5
Table of Contents
Preface ....................................................................................................................................... 3
1 Summary .......................................................................................................................... 7
2 Introduction ................................................................................................................... 11
3 Observations and trends of greenhouse gases observed at the Zeppelin station
in the Norwegian Arctic ............................................................................................... 14 3.1 Greenhouse gases with natural and anthropogenic sources .................................. 15
3.1.1 Observations of methane in the period 2001-2007 .................................... 15 3.1.2 Observations of Carbon Dioxide (CO2) in the period 1988-2007 ............. 18
3.1.3 Observations of Methyl Chloride in the period 2001-2007 ....................... 20 3.1.4 Observations of Methyl Bromide in the period 2001-2007 ....................... 21 3.1.5 Observations of tropospheric ozone in the period 1990 to summer
2008 ........................................................................................................... 22
3.1.6 Observations of CO in the period 2001-2007 ............................................ 23 3.2 Greenhouse gases with solely anthropogenic sources ........................................... 25
3.2.1 Observations of Chlorofluorocarbons (CFCs) in the period 2001-
2007 ........................................................................................................... 25
3.2.2 Observations of Hydrochlorofluorocarbons (HCFCs) in the period
2001-2007 .................................................................................................. 27 3.2.3 Observations of Hydrofluorocarbons (HFCs) in the period 2001-
2007 ........................................................................................................... 29
3.2.4 Observations of Halons in the period 2001-2007 ...................................... 30 3.2.5 Observations of other chlorinated hydrocarbons in the period 2001-
2007 ........................................................................................................... 31
3.2.6 Perfluorinated compounds ......................................................................... 33 3.3 The Zeppelin observatory ...................................................................................... 34
3.3.1 NILU‟s activities at the Zeppelin observatory .......................................... 35 3.3.2 Measurements of CO2 at Zeppelin observatory ......................................... 35
4 Observations of total aerosol load at Ny-Ålesund, Svalbard .................................... 37 4.1 AOD measurements in 2007 at Ny-Ålesund ......................................................... 37 4.2 AOD measurements 2002-2007 ............................................................................ 38
5 Regional emissions and the influence on the observations ........................................ 40 5.1 Regional emissions and the elevated methane levels ............................................ 41
6 Greenhouse Gas Monitoring Networks ...................................................................... 43 6.1 SOGE ..................................................................................................................... 43 6.2 AGAGE ................................................................................................................. 44
7 References ...................................................................................................................... 45
Appendix I Description of instruments, methods and trend analysis .............................. 47
Appendix II The Montreal and Kyoto Protocol ................................................................. 53

Greenhouse gas monitoring at the Zeppelin station, Svalbard, Norway - Annual report 2007 (TA-2480/2009)
6

Greenhouse gas monitoring at the Zeppelin station, Svalbard, Norway - Annual report 2007 (TA-2480/2009)
7
1 Summary
This annual report describes the activities and main results of the programme “Greenhouse
gas monitoring at the Zeppelin station in the Norwegian Arctic” for 2007, which is a part of
the governmental programme for monitoring pollution in Norway. The report comprises all
natural well mixed greenhouse gases (with the exception of N2O), the most important
anthropogenic greenhouse gases as well as the amount of particles in the air. Many of the
greenhouse gases have also a strong ozone-depleting effect. Table 1 summarises the main
results of the observations for the period 2001-2007. The table includes a list with all
measured gases, their annual mean values the first and the last year with observations and the
trends for the period 2001-2007. Further details and interpretations are presented in section 3.
Table 1: Greenhouse gases measured at Ny-Ålesund together with their trends, lifetimes, and
global warming potential (GWP) and their relevance to the Montreal and Kyoto Protocols.
The lifetimes and GWPs are updated in accordance with the last IPCC report. All
concentrations1 are in pptv, except for methane and carbon monoxide (ppbv) and carbon dioxide
(ppmv). Trends are calculated for the period 2001-2007 and are given in mixing ratio per year.
Compound Formula
Life-time
(years) GWP
2 2001 2007
Trend/ Year
Montreal or Kyoto
Protocol
Comments on use for the halocarbons
Methane CH4 12.03
23 1857 1877 +2.7 K
Carbon monoxide CO 122.5 116.0 -1.1
Carbondioxide4 CO2 1 370.9 384.1 +2.3 K
Chlorofluorocarbons
CFC-11 CCl3F 45 4600 263 249 -2.29 M phased out foam blowing, aerosol propellant
CFC-12 CCl2F2 100 10600 551 547 -0.71 M phased out temperature control
CFC-113 CCl2FCClF2 640 6000 82 78 -0.64 M phased out solvent, electronics industry
CFC-115 C2 F5Cl 1700 7200 8.3 8.5 +0.03 M phased out temperature control, aerosol propellant
Hydrochlorofluorocarbons
HCFC-22 CHClF2 11.9 1700 163 199 +6.1 M freeze temperature control, foam blowing
HCFC-141b C2H3FCl2 9.3 700 16.8 20.2 +0.6 M freeze foam blowing, solvent
HCFC-142b CH3CF2Cl 19 2400 15.0 19.6 +0.8 M freeze foam blowing
Hydrofluorocarbons
HFC-125 C2HF5 29 3400 2.03 5.9 +0.7 K temperature control
HFC-134a CH2FCF3 13.8 1300 20.7 48.3 +4.6 K temperature control, foam blowing, solvent, aerosol propellent
HFC-152a C2H4F2 1.4 120 2.8 7.6 +0.8 K foam blowing
Halons
H-1211 CBrClF2 11 1300 4.4 4.5 +0.02 M phased out fire extinguishing
H-1301 CBrF3 65 6900 3.0 3.3 +0.05 M phased out fire extinguishing
Halogenated compounds
Methylchloride CH3Cl 1.3 16 513 519 +0.96 natural emissions (algae)
Methylbromide CH3Br 0.7 5 9.1 8.83 -0.05 M freeze agriculture, natural emissions (algae)
Dichloromethane CH2Cl2 0.5 9 31.1 34.6 +0.6 solvent
Chloroform CHCl3 0.5 30 10.8 10.5 -0.04 solvent
Methylchloroform C2H3Cl3 4.8 140 37.8 13.3 -4.1 M phased out solvent
Trichloromethane C2HCl3 0.5 0.2 -0.05 solvent
Perchloroethylene C2Cl4 4.4 2.5 -0.31 solvent
Sulphurhexafluoride SF6 3200 22200 4.9 6.2 +0.2 K Mg-production, electronics industry
1The term mixing ratio is commonly used instead of concentrations in atmospheric science. The mixing ratio is the ratio of
the number of moles of a constituent in a given volume to the total number of moles of all constituents in that volume. Both
annual mean and trends are given in mixing ratio per year. 2GWP (Global warming potential) 100 years time period, CO2 = 1 3 The lifetimes for CH4 are adjustment times including feedbacks of emission on lifetimes 4 Measurements of Carbon dioxide is performed by Stockholm University, Department of Applied Environmental Science
(ITM)

Greenhouse gas monitoring at the Zeppelin station, Svalbard, Norway - Annual report 2007 (TA-2480/2009)
8
Greenhouse gases regulated through the Kyoto protocol – Key findings
The target set by the Kyoto protocol is to reduce the total emissions of greenhouse gases from
the industrialized countries during the period 2008 to 2012. This report includes 6 greenhouse
gases or groups of gases regulated through the Kyoto protocol. The key findings are:
Methane – CH4: The results for the year 2007 show that the mixing ratios of methane
have reached new heights with an annual mean value of at 1877 ppb at the Zeppelin
observatory. This is an increase of 0.62% since 2006. There is also observed an increase
in the methane levels globally from 2006-2007, in average this increase is 0.34 % (WMO,
2008). This is somewhat lower than we have observed at Svalbard which might point
towards a possible source at the northern hemisphere, maybe at northern latitudes. The
increase at the Zeppelin observatory since 2004 is more than 1% and we consider this as a
relatively large change compared to the development of the methane levels in the period
from 1999-2005; globally the change was close to zero for this period according to IPCC
(Forster et al, 2007), and also at our observatory. Currently there is no explanation for the
increase in methane, observed both at Zeppelin and globally. The development and
understanding of the levels of this compound have to be followed very carefully the
coming years, particularly in the Arctic region, as both permafrost and methane clathrates
(so called methane hydrates) in the ocean might be new significant methane emission
sources initiated by the observed temperature increase the last years particularly in the
Arctic region.
Carbon dioxide – CO2: The results for the year 2007 show that the mixing ratios of CO2
have reached new heights at 384.1 ppm. The global mean value for 2007 was 383.1 ppb
(WMO, 2008). The annual trend for the period 2001-2007 was +2.3 ppm per year at
Zeppelin. The change in CO2 for the period 2001-2007 has slowed down compared to the
period 2001-2006. The observations of CO2 are performed by the University of Stockholm
and are thus only briefly included in the report.
Hydrofluorocarbons: These gases have replaced ozone depleting substances, and are
relatively new gases of solely anthropogenic origin. The mixing ratios of HFC-125,
HFC-134a, HFC-152a have increased by as much as 190%, 133% and 169% respectively
since 2001 at the Zeppelin observatory. We find however that the total radiative forcing for
the change in these gases for the period 2001-2007 is only 0.006 W m-2
. Thus the
contribution from these man made gases to the global warming is currently considered
small since the concentrations still are very low. It is crucial to follow the development of
these gases in the future given the observed rapid increase in concentrations.
The perfluorinated compound – SF6: The only perfluorinated compound measured at
Zeppelin is Sulphurhexacloride, SF6. This is an extremely potent greenhouse gas, but the
concentration is still very low. However, the concentration has increased by approximately
25% since 2001.
Greenhouse gases regulated through the Montreal protocol – Key findings
All gases regulated trough the Montreal protocol are substances depleting the ozone layer. In
addition they are greenhouse gases. The amount of most of the ozone-depleting substances
(ODS) in the troposphere is now declining slowly and one expects to be back to pre-1980
levels around year 2050. In the stratosphere the peak is expected to be reached somewhat
later.

Greenhouse gas monitoring at the Zeppelin station, Svalbard, Norway - Annual report 2007 (TA-2480/2009)
9
The gases included in the monitoring programme are the man-made greenhouse gases called
chlorofluorocarbons (CFCs), the hydrogen chlorofluorocarbons (HCFCs), which are CFC
substitutes, and halons:
CFCs: In total the development of the CFC gases measured at the global background site
Zeppelin should give reason for optimism. The concentrations of the observed CFCs:
CFC-11, CFC-12, CFC-113 and CFC-115 are declining. The mixing ratios of three of the
four gases have decreased since a maximum level in 2003-2004 and are now at a lower
level than in 2001. This is the first year CFC-12 has a negative trend for the investigated
period (2001-2007) at Zeppelin. For the compound CFC-115 the growth rate is still
positive, but the increase has slowed down and we expect the trend for 2001-2008 to be
negative. We find a larger reduction for CFC-11, approximately 2.3 ppt/year, than the
global average but for European observations the growth rate for CFC-11 was -2.7 ppt/year
for 2003-2004, more in accordance with our results. For CFC-113 the difference with
global and European levels is larger. The difference might be explained by the distribution
of the sources, and the very remote location of the Zeppelin observatory resulting in a
delay of the changes compared to other locations. Further analysis is necessary. The global
averaged atmospheric mixing ratio of CFC-12 fits well with our observations.
HCFCs: The CFC substitutes HCFC-22, HCFC-141b and HCFC-142b have all a relatively
strong increase in the levels measured at Zeppelin. HCFC-22 used for temperature control
and foam blowing has the largest growth rate. This is the most abundant substance of the
HCFCs and is currently increasing at a rate of 6.1 ppt/year which is more than 3% per year.
HCFC-142b has the strongest relative increase with more than 4% per year.
Halons: The levels of the two gases monitored have been quite stable over the observation
period at Zeppelin. However, based on the recent results it seems like there was a
maximum in 2004 for halon-1211 at Zeppelin, and a decrease since 2005. According to the
last Ozone Assessment (WMO, 2007) it is currently unclear whether the atmospheric
mixing ratios of halon-1301 is increasing, but our last observations now indicate that the
decline has started in 2006. However this is uncertain, and longer time series are necessary.
Greenhouse gases and aerosols not regulated trough the protocols – Key findings
The monitoring programme includes greenhouse gases not regulated through any of the two
protocols, and observations of the total amount of aerosols above Ny-Ålesund.
Chlorinated greenhouse gases: These are the following chlorinated gases: Methylchloride
(CH3Cl), Dichloromethane (CH2Cl2), Chloroform (CHCl3), Trichloromethane (C2HCl3),
Perchloroethylene (C2Cl4). The levels of all these gases have decreased the last years
except for Dichloromethane. Dichloromethane has had an increase of 11% since 2001.
Aerosols: Observations of the total amount of aerosols above Ny-Ålesund and Zeppelin
show increased aerosol levels during the spring. This is as expected and is the so-called
Arctic haze which is due to pollution. In 2007 this aerosol pollution was at the same levels
as previous years. There are also short episodes later in the year with elevated levels of
aerosols, particularly in July and September.
Long range transport of pollutions and reactive gases – Key findings
Reactive gases: Tropospheric ozone and CO are compounds with relatively short lifetime
in the atmosphere. They are suitable indicators for long range transport of pollution from
the continents and biomass burning events. There are several episodes with elevated levels

Greenhouse gas monitoring at the Zeppelin station, Svalbard, Norway - Annual report 2007 (TA-2480/2009)
10
of ozone and CO in 2007, but none as extreme as in 2006. Based on the CO observations
there seems to have been a considerable transport of smoke from biomass burning in
March. In general there has been a reduction in CO the last years at Zeppelin, and the
annual mean value for 2007 of 116 ppb is the lowest for the period 2001-2007.
Long range transport of pollutions: In 2007 there were relatively few episodes with
polluted air transported to Zeppelin, although there was a strong episode in December
resulting in record levels of methane. Rather it is important to emphasise the high
frequency of days with air categorised as clean air. This means that the observations at
Zeppelin were less influenced by long range transport in 2007 than previous years.

Greenhouse gas monitoring at the Zeppelin station, Svalbard, Norway - Annual report 2007 (TA-2480/2009)
11
2 Introduction
The greenhouse effect is a naturally occurring process in the atmosphere caused by trace
gases, especially water vapour (H2O), carbon dioxide (CO2), methane (CH4) and nitrous oxide
(N2O) that naturally occur in the atmosphere. Without these gases the global mean
temperature would have been much lower. These gases absorb infrared radiation and thereby
trap energy emitted by the Earth. Due to this energy trapping the global mean temperature has
increased by more than 30 degrees to approximately 13.7oC (IPCC, 2007). This is the natural
greenhouse effect. The enhanced greenhouse effect refers to the additional effect of the
greenhouse gases from human activities. In the industrial era, after 1750, the concentration of
greenhouse gases in the atmosphere has increased significantly. The global atmospheric mean
mixing ratios of CO2 has increased by 37% (from 280 ppm as a pre-industrial concentration to
383.1 ppm in 2007) and methane has increased by as much as 156% from 700 ppb to 1789
ppb in 2007) according to WMO (WMO, 2008). These changes in concentrations are the main
cause of the global mean temperature rise of 0.74oC over the last century. According to the
various IPCC scenarios the temperature will continue to increase with 1.1-6.4oC approaching
the year 2100.
Radiative forcing1 is a useful tool to estimate the relative climate impacts of various
components inducing atmospheric radiative changes. The influence of external factors on the
climate can be broadly compared using this concept. Revised global-average radiative forcing
estimates from the 4th
IPCC are shown in Figure 1 (IPCC, 2007). The estimates represent
radiative forcing caused by changes in anthropogenic factors since pre-industrial time and up
to the year 2005.
Figure 1: Global-average radiative forcing (RF) estimates for important anthropogenic
agents and mechanisms together with the typical spatial scale of the forcing and the assessed
level of scientific understanding (LOSU).
1 Radiative forcing is a measure of the influence a factor has in altering the balance of incoming and outgoing energy in the
Earth-atmosphere. It is an index of the importance of the factor as a potential climate change mechanism. It is expressed in
Wm-2 and positive radiative forcing tends to warm the surface. A negative forcing tends to cool the surface.

Greenhouse gas monitoring at the Zeppelin station, Svalbard, Norway - Annual report 2007 (TA-2480/2009)
12
The most important greenhouse gas emitted from anthropogenic activities is CO2 with a
radiative forcing of 1.66 W m-2
. This is an increase of 0.2 W m-2
since the IPCC report from
2001. CH4 and N2O are other components with strong forcings of 0.48 W m-2
and 0.16 W m-2
,
respectively. It is worth noting that even the change in CO2 radiative forcing since 2001 is
stronger than the forcing of e.g. N2O emphasising the importance of CO2.
The joint group of halocarbons is also a significant contributor to the radiative forcing.
Halocarbons include a wide range of components. The most important ones are the ozone
depleting gases regulated through the Montreal protocol. This includes the CFCs, the HCFCs,
chlorocarbons, bromocarbons and halons. Other gases are the HFC (fluorinated halocarbons),
PFCs (per fluorinated halocarbons), and SF6. These fluorinated gases are regulated through
the Kyoto protocol. The total forcing of the halocarbons is 0.337 Wm-2
, and the single
component CFC-12 is presently stronger than N2O, but the concentration of CFC-12 seems to
have reached its peak value. The trend for CFC-12, seemingly to lower concentrations, gives
reason for optimism for this substance. Observations of the halocarbons and methane are
central activities at the Zeppelin observatory. Most of the halocarbons have now a negative
trend in the development of the atmospheric mixing ratios.
The diagram below shows the relative contribution (in percent) of the long-lived greenhouse
gases and ozone to the anthropogenic greenhouse warming sine pre-industrial times (1750).
The numbers are based on the radiative forcing estimates in the last IPCC report. The diagram
shows that CO2 has contributed to 55% of the changes in the radiative balance while methane
has contributed 16% since pre-industrial times. The halocarbons have contributed 11% to the
direct radiative forcing of all long-lived greenhouse gases.
Figure 2: The relative contribution in percent of the long-lived greenhouse gases and ozone
to the anthropogenic warming since pre-industrial times (1750). The numbers are based on
the radiative forcing estimates in the last IPCC report.
The main objective of NILU‟s monitoring programme on Svalbard is to observe, analyse and
interpret the changes in the gases included on the Montreal protocol and the Kyoto protocol.
An overview of all gases observed together with their trends, lifetime and GWP is given in
Table 1 in the Summary.
The Montreal and the Kyoto protocols
The international collaboration regarding the protection of the ozone layer leading to the
Montreal protocol started with the Vienna convention in 1985. Two years later the Montreal

Greenhouse gas monitoring at the Zeppelin station, Svalbard, Norway - Annual report 2007 (TA-2480/2009)
13
protocol was signed and for the first time there was and international agreement forcing the
participating countries to reduce and phase out anthropogenic substances. Halocarbons and
their relation to the Montreal protocol are indicated in Table 1.
Today more than 190 countries have ratified the protocol and many countries have also
ratified the later additions to the protocol. The Montreal protocol has goals and strategies for
all of the ozone reducing substances and the protocol is a part of the UN environmental
program UNEP. According to the last ozone assessment report from WMO (WMO, 2007) the
total combined abundance of anthropogenic ozone-depleting gases in the troposphere had
decreased by 8-9% from the peak value observed in the 1992-1994 time period. This was
related to 2005 mixing ratios, and the gases have continued to decrease since.
The target set by the Kyoto protocol is to reduce the total emissions of greenhouse gases from
the industrialized countries during the period 2008 to 2012. The four most important
greenhouse gases and two groups of gases are included: CO2, CH4, N2O, fluorinated
hydrocarbons (CFCs and PFCs) and sulphur hexafluoride (SF6). The emissions are calculated
as annual mean values during the period 2008-2012. The gases are considered jointly and
weighted in accordance with their global warming potentials as given by IPCC (2007) and
shown in Table 1.
A Norwegian introduction to the Montreal and Kyoto protocol can be found at “Miljøstatus
Norge” (http://www.miljostatus.no). The English link to the Montreal protocol is
http://ozone.unep.org/Ratification_status/montreal_protocol.shtml whereas the Kyoto
protocol can be found at
http://unfccc.int/essential_background/kyoto_protocol/items/1678.php.
A brief introduction is also included in Appendix II in this report.

Greenhouse gas monitoring at the Zeppelin station, Svalbard, Norway - Annual report 2007 (TA-2480/2009)
14
3 Observations and trends of greenhouse gases observed at the
Zeppelin station in the Norwegian Arctic
NILU measures 23 greenhouse gases at the Zeppelin observatory at Svalbard. The results
from the measurements, analysis and interpretations are presented in this chapter. Also
observations and results of CO2, which are performed by the Stockholm University –
Department of Applied Environmental Science (ITM), are included in the report.
Table 2 presents the main results with annual mean values since the beginning of the
observation period in 2001. Also trend per year and change (acceleration) in trend for each
component is given. The acceleration in the trend indicates how the growth rate is expected to
change in the coming years2. Note that all peak concentrations of the measured gases are
significantly lower at Ny-Ålesund than at other sites, due to the stations remote location.
Table 2: Yearly average concentration levels of greenhouse gases measured at the Zeppelin
station for the years 2001-2007. All concentrations are in pptv, except for methane and
carbon monoxide (ppbv) and CO2 (ppmv). Trends are calculated from observations for the
period 2001-2007.
* Measurements of Carbondioxide performed by Stockholm University, Department of Applied Environmental
Science (ITM)
2 As the time series still are short and the seasonal and annual variations are large for many of the components,
there are considerable uncertainties connected with the results.
Compound Formula 2001 2002 2003 2004 2005 2006 2007 Trend/ year
Change in trend
Methane CH4 1857 1852 1870 1858 1863 1865 1877 +2.7 +1.2
Carbon monoxide CO 123 130 134 135 132 126 116 -1.1 -3.54
Carbondioxide* CO2 371 373 376 378 381 382 384 + 2.3 -0.29
Chlorofluorocarbons
CFC-11 CFCl3 263 264 263 262 259 255 249 -2.29 -1.28
CFC-12 CF2Cl2 551 559 563 564 561 551 547 -0.71 -3.3
CFC-113 CF2ClCFCl2 82 82 82 82 81 80 78 -0.64 -0.45
CFC-115 CF3CF2Cl 8.3 8.5 8.5 8.6 8.6 8.6 8.5 +0.03 -0.04
Hydrochlorofluorocarbons
HCFC-22 CHF2Cl 163 170 177 184 190 195 199 + 6.1 -0.67
HCFC-141b CH3CFCl2 16.8 17.9 18.8 19.4 19.9 20.1 20.2 + 0.6 -0.21
HCFC-142b CH3CF2Cl 15.0 15.6 16.3 17.0 17.8 18.7 19.6 + 0.8 +0.05
Hydrofluorocarbons
HFC-125 CHF2CF3 2.0 2.6 3.1 3.8 4.4 5.2 5.9 +0.7 +4.49
HFC-134a CH2FCF3 20.7 26.0 30.9 35.7 40.1 44.3 48.3 +4.6 -0.25
HFC-152a CH3CHF2 2.8 3.4 4.1 4.9 5.7 6.6 7.6 +0.8 +0.09
Halons
H-1301 CF3Br 3.0 3.1 3.2 3.3 3.3 3.3 3.3 + 0.05 -0.03
H-1211 CF2ClBr 4.4 4.5 4.6 4.7 4.7 4.6 4.5 + 0.02 -0.05
Halogenated compounds
Methyl Chloride CH3Cl 513 520 524 526 526 523 519 +0.96 -2.32
Methyl Bromide CH3Br 9.1 9.0 8.9 8.8 8.8 8.8 8.8 -0.05 + 0.03
Dichloromethane CH2Cl2 31.1 31.3 32.6 32.1 32.8 33.6 34.6 +0.6 + 0.16
Chloroform CHCl3 10.8 10.7 10.6 10.5 10.5 10.5 10.5 -0.04 +0.02
Trichloromethane CH3CCl3 37.8 32.3 27.4 23.1 19.2 16.0 13.3 -4.1 +0.55
TriChloroethylene CHClCCl2 0.5 0.4 0.4 0.3 0.3 0.3 0.2 -0.05 -0.01
Perchloroethylene CCl2CCl2 4.4 4.0 3.6 3.2 2.9 2.7 2.5 -0.31 +0.06
Sulphurhexafluoride SF6 4.9 5.1 5.3 5.5 5.8 6.0 6.2 + 0.2 +0.02

Greenhouse gas monitoring at the Zeppelin station, Svalbard, Norway - Annual report 2007 (TA-2480/2009)
15
Greenhouse gases have numerous sources both anthropogenic and natural. Trends and future
changes in concentrations are determined by their sources and the sinks, and in section 3.1 are
observations and trends of the monitored greenhouse gases with both natural and
anthropogenic sources presented in more detail. In section 3.2 are the detailed results of the
gases with purely anthropogenic sources presented. These gases are not only greenhouse
gases but also a considerable source of chlorine and bromine in the stratosphere, and are thus
responsible for the ozone depletion and the ozone hole discovered in 1984. These gases are
controlled and regulated through the successful Montreal protocol. Section 3.3 describes the
Zeppelin observatory at Svalbard where the measurements take place and the importance of
the unique location. A description of the instrumental and theoretical methods applied is
included in Appendix I.
3.1 Greenhouse gases with natural and anthropogenic sources
All gases presented in this section (Methane, Carbon Dioxide, Methyl Chloride, Methyl
Bromide, CO and O3) have both natural and anthropogenic sources. This makes it complex to
interpret the observed changes as the sources and sinks are numerous. Moreover, several of
these gases are produced in the atmosphere from chemical precursor gases and often also
dependant on the solar intensity.
3.1.1 Observations of methane in the period 2001-2007
Methane (CH4) is the second largest greenhouse gas after CO2 with a radiative forcing of
0.48 W m-2
since 1750. In addition to be a crucial greenhouse gas, methane also plays a
significant role in the atmospheric chemistry. Methane is destroyed by the reaction with the
hydroxyl radical (OH) giving water vapour. The OH radical has a crucial role in the
tropospheric chemistry by reactions with many emitted components and thus are responsible
of the cleaning of the atmosphere. Increased levels of methane might lower the concentration
of OH. Furthermore methane is important for the ozone layer chemistry by being an important
source of bringing water vapour to the stratosphere (Forster et al., 2007).
The atmospheric methane concentration has been relatively stable the last 10 years, both
globally and at Zeppelin observatory since 2001 when the measurements started. 2003 was an
exception; a maximum annual mean of 1870 ppb at Zeppelin was obtained, considerable
higher that the other years. This was also the previous record year globally. Recently an
increase in the methane levels is evident from our observations, and also observations at other
sites. Figure 3 presents the observations of methane at Zeppelin since the start in 2001.

Greenhouse gas monitoring at the Zeppelin station, Svalbard, Norway - Annual report 2007 (TA-2480/2009)
16
2001 2002 2003 2004 2005 2006 2007 2008
1800
1850
1900
1950
ppb
v
Year
Figure 3: Observations of methane for the period 2001-2007 at the Zeppelin observatory.
Blue dots: observations, orange solid line: modelled background methane concentrations.
As can be seen there is an increase in the concentrations of methane observed at Zeppelin the
last years and particularly in 2007. The pronounced increase started in November/December
2006 and continues throughout the year 2007, and is particularly evident in the late summer-
winter 2007. The maximum methane mixing ratio was detected 10th
December and was as
high as 1956 ppb. This seems to be the highest value ever recorded at Zeppelin. Analysis of
source regions is included in section 5 on page 40.
To retrieve the annual trends in the methane levels for the entire period the observations have
been fitted by an empirical equation as described in Appendix I. The modelled methane
values are included as the orange solid line in the Figure. Only the observations resulting from
clean air arriving at Zeppelin are used in the model, thus the model represents the background
level of methane at the site.
The average annual growth rate is +2.7 ppbv per year for the period 2001-2007 this
corresponds to an increase of 0.14% per year. Comparably the annual trend for the period
2001-2006 was +1.9 ppbv thus the last year‟s increase has changed this by more than 40%.
The acceleration in the trend is positive, 1.2, (see Table 2) indicating that the growth rate year
is expected to increase in the coming years. Although, this is connected with large uncertainty
as the reason for the observed increase is not clear. (Additionally, the seasonal and annual
variations are large and the time series are still short.)
The increase in the methane levels the last years is better visualized in Figure 4 showing the
CH4 annual mean mixing ratio for the period 2001-2007. The annual means are based on a
combination of the observed methane values and the modelled background values; during
periods with lacking observations we have used the modelled background mixing ratios in the
calculation of the annual mean.

Greenhouse gas monitoring at the Zeppelin station, Svalbard, Norway - Annual report 2007 (TA-2480/2009)
17
Figure 4: Development of the annual mean mixing ratio of methane measured at the Zeppelin
Observatory for the period 2001-2007.
This diagram clearly illustrates the large increase in the concentrations of methane in 2007
starting already in 2006 as shown in Figure 3. All annual means are included in Table 2 on
page 14. The annual mean mixing ratio for 2007 was 1877 ppbv while the level was 1865 ppbv
in 2006. This is an increase of 0.62%. The increase since 2004 is more than 1% which is
considered as relatively large compared to the development of the methane mixing ratio in the
period from 1999-2005. The global average change was close to zero for this period
according to IPCC (Forster et al, 2007), and also at our site until 2005.
Also stations at other locations show a significant increase in methane for the year 2007, at
both hemispheres. The global annual mean concentration reported by IPCC for the year 2005
was 1774 ppbv (IPCC, 2007). According to WMO (WMO, 2008) there has been a global
increase in the methane concentration from 1782 ppb in 2006 to 1789 ppb in 2007 (0.34%).
Rigby and his co-workers report a global increase of methane in a recent article in the
Geophysical Research Letters (Rigby et al, 2008). They have analyzed methane data from
12 sites worldwide, and found an increase of around 10 ppbv at all sites. The largest increase
was observed at Mace Head in Ireland and Alert. Alert is a site north in Canada (82 oN), and
the site closest to the Zeppelin observatory at Svalbard.
The reason for the large increase observed is unclear, although several hypotheses are raised.
It is now crucial to try to understand and explain the observed increase. To do this we need to
analyse the possible recent changes in the sources and sinks in methane.
The average CH4 concentration in the atmosphere is determined by a balance between
emission from the various sources at the surface and destruction by free hydroxyl radicals
(OH) in the troposphere. In the stratosphere CH4 is destroyed by short wave radiation. The
atmospheric lifetime of methane is 12 years (Forster et al, 2007).
The main sources of methane today include boreal and tropical wetlands (including rice
paddies), emission from ruminant animals, biomass burning and fossil fuels combustion.
Further, methane is the principal component of natural gas. Of natural sources there is a large

Greenhouse gas monitoring at the Zeppelin station, Svalbard, Norway - Annual report 2007 (TA-2480/2009)
18
unknown amount of methane in methane clathrates (so called methane hydrates) in the ocean
floors. Other sources include mud volcanoes which are connected with deep geological faults,
and also emissions from plants are suggested (Keppler et al., 2006). Further a large unknown
amount of methane is bounded in the permafrost layer in Siberia and North America and this
might be released if the permafrost layer melts as a feed back to climate change. According to
the last IPCC report (Alley et al., 2007) the temperature of the top of the permafrost layer has
generally increased by up to 3oC since 1980s.
Currently the observed increase is not explained or understood. According to Rigby et al.
(2008) there might be signs of a reduction in the hydroxyl radical OH, which is essential in
the destruction of methane, but this is not in agreement with other observations. Furthermore,
the OH concentration is low in the Arctic particularly during autumn and winter. There might
also be new sources. High effort should be put on the issue to explain the increase in the CH4
concentrations as the consequence might be severe. The high levels observed in 2003 are also
a global feature, and i still not understood. It is essential to find out if the increase is due to
large one-time point emission, or of it is new initiated process releasing methane to the
atmosphere as the melting of the permafrost layer. But still it is too early to conclude if the
trend will continue in 2008 and 2009.
We have performed an analysis and understanding of the source regions of the air arriving at
Zeppelin in the period 2001-2007 as described in section 5 at page 40. The most striking of
this analysis is that in 2007 are the air arriving at Zeppelin categorized as clean marine and
Arctic air as much as 67% of the time compared to around 53 (±5) % the previous years. This
can point in the direction of an Arctic source or accumulation of methane in the Arctic,
particularly during late summer and autumn. Also the year 2003 with the second highest
methane concentration had a large fraction of clean air arriving at Zeppelin.
We will continue to work on the analysis of the methane levels. As a part of this we will try to
assess the contribution from the emissions from regional sources like Melkøya and the flaring
at the new LNG (Liquefied Natural Gas) plant in Hammerfest. The emissions of CO2 from
Melkøya in 2007 was more than 1.6 million tons (Statistics Norway, www.ssb.no), and there
were also high methane emissions.
3.1.2 Observations of Carbon Dioxide (CO2) in the period 1988-2007
CO2 is the most important greenhouse gases with a radiative forcing of 1.66 W m-2
since 1750
and an increase in the forcing of as much as 0.2 W m-2
since the IPCC report from 2001
(Forster et al., 2007). CO2 is the end product of the destruction of all main organic compounds
in the atmosphere and has shown an increase of as much as 37 % since the pre industrial time.
The atmospheric CO2 concentration measured at Zeppelin Observatory for the period 2001-
2007 is presented in Figure 5. This data are provided by ITM University of Stockholm and we
acknowledge the effort they are doing in monitoring CO2 at the site.

Greenhouse gas monitoring at the Zeppelin station, Svalbard, Norway - Annual report 2007 (TA-2480/2009)
19
1988 1993 1998 2003 2008
330
340
350
360
370
380
390
400
ppm
v
Year
Figure 5: The CO2 concentration measured at Zeppelin Observatory for the period 2001-
2007.
The results show a continues increase since the start of the observations and in Figure 6 is the
development of the annual mean concentrations measured at Zeppelin observatory for the
period 1988-2007 shown.
Figure 6: Development of the annual mean mixing ratio of CO2 measured at Zeppelin
observatory for the period 1988-2007.
The results show that 2007 is a new record year for the annual mixing ratio of CO2 at
Zeppelin. The mean value for 2007 was 384.1 ppm. The global mean value for 2007 was
383.1 ppb. The main reason why it is higher at Zeppelin than globally is that in general the
CO2 emissions is lower at the Southern hemisphere and the global mixing takes a certain time.

Greenhouse gas monitoring at the Zeppelin station, Svalbard, Norway - Annual report 2007 (TA-2480/2009)
20
The annual trend for the period 2001-2007 was +2.3 ppm per year, and the change in trend
was slightly negative. This means that the growth rate for the period 2001-2007 has slowed
down compared to the period 2001-2006.
A more detailed analysis of this result with comparison to other sites is considered as central
and valuable. However, as this component is not included in the national monitoring
programme, we are not in a position where we can analyse the data further.
3.1.3 Observations of Methyl Chloride in the period 2001-2007
The main source of Methyl Chloride in the atmosphere is algae in the oceans thus this
compound are not regulated trough any of the Montreal or Kyoto protocols. The results of the
observation of this substance are shown in Figure 7.
2001 2002 2003 2004 2005 2006 2007 2008
400
450
500
550
600
650
Dayli concentrations of CH3Cl
Model
ppt v
Year
Figure 7: Observations of Methyl Chloride, CH3Cl, for the period 2001-2007 at the Zeppelin
observatory. Dots: daily averaged concentrations from the observations, solid line: modelled
background concentrations.
The lifetime of the compound is only 1.3 year resulting in large seasonal fluctuations as
shown in the Figure. The degradation of the compound is dependent on solar intensity. To
reach the stratosphere, the lifetime in general needs to be in the order of 2-4 years to have
significant chorine contribution. However, Methyl Chlorine has relatively high mixing ratios,
and will contribute to the stratospheric Chlorine burden. With respect to the warming
potential this substance is 16 times stronger than CO2 per kg gas.
By use of the model described in Appendix I we have calculated the annual trend, and change
in trend also given in Table 2. The trend for the period 2001-2007 is 0.96 ppt per year, and the
change in the trend is -2.32. This indicates that the reduction in the mixing ratio of this
substance is expected to be relatively large for the coming years and we expect trend to be
close to zero for the period 2001-2008 if there are no large abrupt changes in the emissions.

Greenhouse gas monitoring at the Zeppelin station, Svalbard, Norway - Annual report 2007 (TA-2480/2009)
21
The development of the annual means
of Methyl Chloride for the period
2001-2007 is presented in Figure 8.
The last years there has been a
decrease in the annual means. As the
main source of this compound is
algae from the ocean, it is interesting
to note that the decrease is large from
2006-2007 at Zeppelin despite the
fact that this was a year with record
low sea ice cover in the Arctic region,
and high temperatures.
3.1.4 Observations of Methyl Bromide in the period 2001-2007
The sources of Methyl Bromide (CH3Br) are both from natural and anthropogenic activities.
The natural sources such as the ocean, plants, and soil, can also be a sink for this substance.
Additionally there are also significant anthropogenic sources; it is used in a broad spectrum of
pesticides in the control of pest insects, nematodes, weeds, pathogens, and rodents. It is also
used in agriculture primarily for soil fumigation, as well as for commodity and quarantine
treatment, and structural fumigation.
The results of the daily averaged observations of this compound for the period 2001-2007 are
shown in the Figure below.
2001 2002 2003 2004 2005 2006 2007 2008
7
8
9
10
11 Dayli concentrations of CH3Br
Model
ppt v
Year
Figure 9: Observations of Methyl Bromide, CH3Br, for the period 2001-2007 at the Zeppelin
observatory. Dots: daily averages mixing ratios from observations, solid lines: modelled
background concentrations.
Figure 8: Development of the annual means Methyl
Chloride measured at the Zeppelin Observatory for
the period 2001-2007

Greenhouse gas monitoring at the Zeppelin station, Svalbard, Norway - Annual report 2007 (TA-2480/2009)
22
While methyl bromide is a natural substance, the additional methyl bromide added to the
atmosphere by humans contributes to the thinning of the ozone layer. Total organic bromine
from halons and methyl bromide
peaked in 1998 and has declined since
(WMO, 2007). This observed decrease
was solely a result of declines observed
for methyl bromide. Bromine (Br) from
halons continues to increase, but at
slower rates in recent years, see section
3.2.4 on page 30. Additionally, Methyl
bromide is a greenhouse gas with a
lifetime of 0.7 years and it is 5 times
stronger than CO2, if the emissions of
both gases were equal.
We have calculated the annual trend by
use of the model described in Appendix
I. The trend and change in the trend is
given in Table 2. For the period 2001-
2007 there is a reduction in the mixing
ratio of -0.05 ppt per year, with a very small acceleration in the trend of 0.03 indicating that
the trend is expected to be similar, or slightly larger, for the next year (if there are no abrupt
changes in sources and sinks). However, the observed changes are small, and this is uncertain.
The development of the annual means for the period 2001-2007 is presented in Figure 10,
clearly illustrating the decrease the last years, with a small not significant increase from
2006-2007. In general atmospheric amounts of methyl bromide have declined, beginning in
1999 when industrial production was reduced. By mid-2004, mixing ratios had declined
1.3 ppt (14%) from the peak of 9.2 ppt measured before 1999 (WMO, 2007). Our
observations are higher than the global mean values, and the trend is somewhat smaller.
3.1.5 Observations of tropospheric ozone in the period 1990 to summer 2008
Tropospheric ozone (which is the ozone in the lower part of the atmosphere) is a natural
constituent of the atmosphere and plays a vital role in many atmospheric processes. It also a
greenhouse gas with a radiative forcing of +0.35 W m-2
(IPCC, 2007) due to changes in the
concentrations since 1750. Ozone is not emitted directly to the atmosphere, it is rather
produced from precursor gases; the formation of ozone is due to a large number of photo-
chemical reactions taking place in the atmosphere and depends on the temperature, humidity
and solar radiation as well as the primary emissions of nitrogen oxides and volatile organic
compounds. Anthropogenic emissions of VOC and nitrogen oxides have increased the photo-
chemical formation of ozone in the troposphere. Until the end of the 1960s the problem was
basically believed to be one of the big cities and their immediate surroundings. In the 1970s,
however, it was found that the problem of photochemical oxidant formation is much more
widespread. The ongoing monitoring of ozone at rural sites throughout Europe shows that
episodes of high concentrations of ground-level ozone occur over most parts of the continent
every summer.
The 1999 Gothenburg Protocol is designed for a joint abatement of acidification,
eutrophication and ground-level ozone. The critical levels defined by ECE for protection of
vegetation are 150 μg/m3 for hourly mean, 60 μg/m3 for eight-hour mean and 50 μg/m
3 for
seven-hour mean (9 a.m.–4 p.m.) averaged over the growing season (April-September).
Figure 10: Development of the annual means of
Methyl Bromide measured at the Zeppelin
Observatory for the period 2001-2007.

Greenhouse gas monitoring at the Zeppelin station, Svalbard, Norway - Annual report 2007 (TA-2480/2009)
23
The observed ozone mixing ratios for the period 2001-2007 are shown in the next Figure.
1990 1995 2000 2005
0
25
50
75
100
125
150
175
g m
-3
Year
Figure 11: Observations of ozone in the troposphere for the period 2001 to 31.07.2008 at the
Zeppelin observatory. Red dots: daily average concentrations observations.
Monthly mean concentrations show a large seasonal variation. In 2006 there was an extreme
episode with transport of pollution into the Arctic region and ozone levels as high as
~160 g m-3
. This was above all critical levels. In 2007 there have been remarkably few
episodes, and the maximum ozone level observed was 91 g m-3
in December 2007.
3.1.6 Observations of CO in the period 2001-2007
Carbon monoxide (CO) is not considered as a direct greenhouse gas, mostly because it does
not absorb terrestrial thermal IR energy strongly enough. However, CO is able to modulate
the production of methane and tropospheric ozone which are both very important
components. The CO sources and emissions have influence on the increasing tropospheric
ozone and methane concentrations. CO is closely linked to the cycles of methane and ozone
and like methane plays a key role in the control of the OH radical.
The observed CO mixing ratio for the period 2001-2007 are shown in the next Figure.

Greenhouse gas monitoring at the Zeppelin station, Svalbard, Norway - Annual report 2007 (TA-2480/2009)
24
2001 2002 2003 2004 2005 2006 2007 2008
50
75
100
125
150
175
200
225
250
275
ppb
v
Year
Figure 12: Observations of carbon monoxide (CO) for the period 2001-2007 at the Zeppelin
observatory. Red dots: daily averaged observed mixing ratios.
Monthly mean concentrations of CO show a seasonal variation with large amplitudes in the
Northern Hemisphere and small ones in the Southern Hemisphere. This seasonal cycle is
driven by variations in OH concentration as a sink, emission by industries and biomass
burning, and transportation on a large scale.
The CO concentrations measured at Zeppelin show a decrease during the period, and 2007
was the minimum for the period investigated. This is important to note, as the sources are
many and complex, and the level of this compound is important for ozone and methane.
Atmospheric CO sources are oxidation of various organic gases (volatile organic compounds,
VOC) from sources as fossil fuel, biomass burning, and also oxidation of methane is
important. Additionally emissions from plants and ocean are important sources.
The global levels of CO were
increasing before mid-1980s, and the
averaged global growth rate was -0.8
ppb/year for the period from 1992 to
2001. The variability of the growth
rates is large. High positive growth
rates and subsequent high negative
growth rates were observed in northern
latitudes and southern low latitudes
from 1997 to 1999. We calculated a
trend of -1.1 ppb per year for the
period 2001-2007, and the change in
the trend is as high as -3.5 indicating
that there is now a considerable
acceleration in the decrease of CO for
this short time period. The
Figure 13: Development of the annual means of
CO measured at the Zeppelin Observatory for the
period 2001-2007.

Greenhouse gas monitoring at the Zeppelin station, Svalbard, Norway - Annual report 2007 (TA-2480/2009)
25
development of the annual means for the period 2001-2007 is presented in Figure 13, clearly
illustrating a maximum in the year of 2004, and a decrease the last years particularly from
2006-2007.
3.2 Greenhouse gases with solely anthropogenic sources
All the gases presented in this chapter have solely anthropogenic sources. These are the man-
made greenhouse gases and are called CFCs, HCFCs, HFCs PFCs, SF6 and halons and the
gases did not exist in the atmosphere before the 20th
century. Although the gases have much
lower concentration levels than most of the natural gases mentioned in the previous section,
they are strong infrared absorbers, many of them with extremely long atmospheric lifetimes
resulting in high global warming potentials; see Table 1 on page 7.
Some of these gases are ozone depleting, and they are regulated through the Montreal
protocol. Additional chlorine from CFCs and HCFCs added to the atmosphere contributes to
the thinning of the ozone layer, allowing increased UV radiation to reach the earth's surface,
with potential impact not only to human health and the environment, but to agricultural crops
as well. In 1987 the Montreal Protocol was signed in order to reduce the production and use
of these ozone-depleting substances (ODS) and the amount of ODS in the troposphere
reached a maximum around 1995. The amount of most of the ODS in the troposphere is now
declining slowly and one expects to be back to pre-1980 levels around year 2050. In the
stratosphere the peak is reached somewhat later.
The CFCs, consisting primarily of CFC-11, -12, and -113, accounted for ~62% of total
tropospheric Chlorine in 2004 and accounted for a decline of 9 ppt Chlorine from 2003-2004
(or nearly half of the total Chlorine decline in the troposphere over this period) (WMO, 2007).
It is two generations of substitutes for the CFCs, the main group of the ozone depleting
substances. The first generation substitutes is now included in the Montreal protocol as they
also influence the ozone layer. This is the so-called HCFCs in Table 1 and Table 2. The
second-generation substitutes, the HFCs, are included in the Kyoto protocol. The situation
now is that the CFCs have started to decline, while their substitutes are increasing, and many
of them have a steep increase.
3.2.1 Observations of Chlorofluorocarbons (CFCs) in the period 2001-2007
This section includes the results of the observations of the CFCs: CFC-11, CFC-12, CFC-113,
CFC-115. These are the main ozone depleting gases, and the anthropogenic emissions started
around 1930s and were restricted in the first Montreal protocol. Figure 14 shows the daily
averaged observed mixing ratios of these four CFCs.

Greenhouse gas monitoring at the Zeppelin station, Svalbard, Norway - Annual report 2007 (TA-2480/2009)
26
2001 2002 2003 2004 2005 2006 2007 2008
7.5
8.0
8.5
9.0
70
75
80
85
90520
540
560
580
600
240
260
280
300
CFC-115
ppt v
Year
CFC-13
ppt v
CFC-12
ppt v
CFC-11
ppt v
Figure 14: Daily averaged mixing ratios of the monitored CFCs: CFC-11 (dark blue), CFC-
12 (red), CFC-13 (green) and CFC-115 (light blue) for the period 2001-2007 at the Zeppelin
observatory. The solid lines are modelled background concentrations.
The main sources of these compounds were foam blowing, aerosol propellant, temperature
control (refrigerators), solvent, and electronics industry. The highest production of the
observed CFCs was around 1985.The life times of the compounds is long as given in Table 1,
and also the GWP due to the life time and strong infrared absorption properties is high.
We have used the model described in Appendix I in the calculation of the annual trends, and
changes in the trends. The trends per year for the substances CFC-11, CFC12 and CFC-13 are
now all negative, given in Table 2. This is the first year CFC-12 has a negative trend for the
investigated period (2001-2007) at Zeppelin. For the compound CFC-115 the trend is still
positive, +0.04, but the change in trend is negative and thus we expect the trend for
2001-2008 to be negative. In total the development of the CFC levels at the global back-
ground site Zeppelin is now very optimistic.
According to WMO (WMO, 2007) the CFC-11 mixing ratios are decreasing at approximately
1.9 ppt/year and CFC-113 are decreasing by approximately 0.8 ppt/yr up to 2005 as a global
mean. This is relatively close to our results for the period 2001-2007, but we find a larger
reduction for CFC-11, approximately 2.3 ppt/year. In Europe the growth rates for CFC-11
was -2.7 for 2003-2004, in agreement with our results. For CFC-113 the difference is larger,
we had only and 0.6 ppt/year now and -0.4 ppt/year for 2001-2006. The difference might be
explained by the distribution of the sources, and the very remote location of the Zeppelin
observatory.
Greenhouse gas monitoring at the Zeppelin station, Svalbard, Norway - Annual report 2007 (TA-2480/2009)
27
Figure 15: Development of the annual means all the observed CFCs at the Zeppelin
Observatory for the period 2001-2007. Upper left panel: CFC-11, upper right panel:
CFC-12, lower left panel: CFC-13, lower right panel: CFC-115
The development of the annual means for all the observed CFCs is shown in Figure 15, and
this shows a similar tendency for all the compounds; a weak increase in the beginning of the
period and a decrease the recent years. CFC-12 is the gas with the highest GWP of the CFCs,
10600, and the second highest of all gases observed at Zeppelin. This means that the warming
potential of 1 kg emitted CFC-12 has 10600 times stronger warming effect than 1 kg emitted
CO2 gas. The global averaged atmospheric mixing ratios of CFC-12 have been constant
within 1% (5 ppt) since 2000 and some in situ column measurements at Northern Hemisphere
show that peak values were attained in 2003 (WMO, 2007). This fits well with our
observations as illustrated in Figure 15 as CFC-12 (the red diagram) has the maximum in
2003-2004, but the variations since 2001 is a larger than the global average variation.
3.2.2 Observations of Hydrochlorofluorocarbons (HCFCs) in the period 2001-2007
This chapter includes the observations of the following components: HCFC-22, HCFC-141b
and HCFC-142b. These are all first generation replacement gases for the CFCs and their
lifetimes are rather long. This means that they have potentially strong warming effects, also
depending on their concentrations and absorption properties; their GWPs are high (see Table
1). The compound HCFC-142b is the strongest of these gases, and the warming potential is
2400 times stronger than CO2, per kg gas. These gases do also contain chlorine, and thus are
contributing to the depletion of the ozone layer. The HCFCs accounted for 6% of the total
tropospheric chlorine in 2004 versus 5% of the total in 2000 (WMO, 2007).
The daily averaged observations of these gases are shown in Figure 16 for the period
2001-2007.

Greenhouse gas monitoring at the Zeppelin station, Svalbard, Norway - Annual report 2007 (TA-2480/2009)
28
2001 2002 2003 2004 2005 2006 2007 2008
15
20
25
15
20
25150
175
200
225
HCFC-142b
ppt v
Year
HCFC-141b
ppt v
HCFC-22
ppt v
Figure 16: Daily average mixing ratios of the monitored HCFCs: HCFC-22 (red), HCFC-
141b (dark blue) HCFC-142b (green) for the period 2001-2007 at the Zeppelin observatory.
The solid lines are modelled background concentrations.
The trends per year for the compounds HCFC-22, CFC-141b and HCFC-142b are all positive,
particularly for HCFC-22 as given in Table 2. HCFC-22 is the most abundant of the HCFCs
and is currently increasing at a rate of 6.1 ppt/year. In comparison, the global mean increase
for 2000-2004 was +4.9 ppt/year according to WMO, (WMO, 2007). HCFC-141b and HCFC-
142b mixing ratios increased by 0.6 ppt/yr and 0.8 ppt/year, respectively.
It is worth mentioning that the changes in trends are negative for HCFC-22 and HCFC-141b,
meaning that the increase in the concentrations is slowing down. This is not the case for
HCFC-142b, which still has a slight acceleration in the trend. The rates of increase for all
three of these HCFC substances are significantly slower than projected in the previous Ozone
Assessment (WMO, 2007).
The next Figure shows the annual means for the full period for all these compounds, clearly
illustrating the development; and increase which now shows signs of slowing down.
Figure 17: Development of the annual means the observed HCFCs at the Zeppelin
Observatory for the period 2001-2007. Red: HCFC-22, Blue:H CFC-141b, and green:
HCFC-142b.

Greenhouse gas monitoring at the Zeppelin station, Svalbard, Norway - Annual report 2007 (TA-2480/2009)
29
The main sources of these gases are temperature control (refrigerants), foam blowing and
solvents, as for the CFCs, which they suppose to replace. All these gases are regulated
through the Montreal protocol as they all contain Chlorine. The emissions of the gases are
now frozen, but not completely phased out. With lifetimes in the order of 10-20 years it is
central to monitor the levels in the future as they have an influence both on the ozone layer,
and are strong climate gases.
3.2.3 Observations of Hydrofluorocarbons (HFCs) in the period 2001-2007
The substances called HFCs are the so called second generation replacements of CFCs, which
means that they are considered as better alternatives than HCFCs described in the previous
section with respect to the ozone layer. This category includes the following components:
HFC-125, HFC-134a, HFC-152a with lifetimes in the order of 1.4-30 years. These substances
do not contain Chorine thus they do not have a direct influence on the ozone layer. HFC-152a
has short life time and is mainly destroyed in the lowest part of the atmosphere by photolysis
and reactions with OH. The seasonal cycle in the observed mixing ratio of these substances is
caused by the variation in the incoming solar radiation and is clearly visible in the time series
shown in Figure 18 for HFC-152a.
2001 2002 2003 2004 2005 2006 2007 2008
0
5
10
10
20
30
40
50
60
2
4
6
8
10
HFC-152a
ppt v
Year
HFC-134a
ppt v
HFC-125
ppt v
Figure 18: Daily average concentrations of the monitored CFCs: HFC-125 (red), HFC-134a
(dark blue), HFC-152a (green) for the period 2001-2007 at the Zeppelin observatory. The
solid lines are modelled background concentrations.
Even if these compounds are better alternatives for the protection of the ozone layer as they
do not contain Chlorine or Bromine, they are still highly potent greenhouse gases. 1 kg of the
gas HFC-125 is as much as 3400 times more powerful greenhouse gas than CO2. But still
their concentrations are rather low, but strongly increasing as our results show. This is also
clearly illustrated in the Figure showing the development of the annual means. The gases are
continuously increasing with the same change per year as earlier.

Greenhouse gas monitoring at the Zeppelin station, Svalbard, Norway - Annual report 2007 (TA-2480/2009)
30
The three main HFCs are HFC-23 (not measured at Zeppelin), HFC-134a and HFC152a, with
HFC-134a being the most widely used refrigerant (temperature control) and in air
conditioners in cars. Since 1990, when it was almost undetectable, concentrations of
HFC-134a have risen massively. For the period 2001-2007 we find an annual increase per
year of 4.6 ppt, which leaves this compound as the one with the second highest change per
year for the all the gases observed at Zeppelin. The mixing ratios of HFC-125, HFC-134a,
HFC-152a have increased by as much as 190%, 133% and 169% respectively since 2001. Due
to the large increase it is relevant to calculate the radiative forcing of these observed changes.
Based on the assumption that these changes are the same at all locations (constant
geographical distribution) we find that the total radiative forcing for the change in the period
2001-2007 is 0.006 W m-2
for the three gases. Thus the contribution from the recent man
made changes in these gases is considered as small. This is explained by the (still) low mixing
ratios of the compounds.
3.2.4 Observations of Halons in the period 2001-2007
Halons include the following components: H-1301, H-1211. These substances contain
Bromine, also contribution to the depletion of the ozone layer. The compounds are regulated
trough the Montreal protocol, and are now phased out. The main source of these substances
was fire extinguishers. Figure 20 presents the daily average concentrations of the monitored
halons.
Figure 19: Development of the annual means the observed HFCs at the Zeppelin Observatory
for the period 2001-2007. Red: HFC-125, Blue: HFC-134a, and green: HFC-152a.

Greenhouse gas monitoring at the Zeppelin station, Svalbard, Norway - Annual report 2007 (TA-2480/2009)
31
2001 2002 2003 2004 2005 2006 2007 2008
3.8
4.0
4.2
4.4
4.6
4.8
5.0
5.22.0
2.5
3.0
3.5
4.0
4.5
H-1211
ppt v
Year
H-1301
ppt v
Figure 20: Daily average concentrations of the monitored halons: H-1301 (blue in the upper
panel) and H-1211 (Red in the lower panel) for the period 2001-2007 at the Zeppelin
observatory. The solid lines are modelled background concentrations.
By use of the model described in Appendix I
we have calculated the annual trends, and
changes in trends, given in Table 2. The trends
for the period 2001-2007 is increasing for both
substances, with a very small reduction in the
rates indicating that the trend is expected to be
smaller the next years (if there are no abrupt
changes in sources and sinks).
The development of the annual means are
shown in the Figure to the left, and as can be
seen the mixing ratios are quite stable over the
period explained by low emissions and
relatively long lifetimes (11 years for H-1211
and 65 years for H-1301.). According to the
last Ozone Assessment (WMO, 2007) it is
currently unclear whether atmospheric mixing ratios of halon-1301 continue to increase. The
global average atmospheric increase in halon-1211 was 0.06 ppt/year in 2000-2004 were
about half those in 1996-2000. This agrees well with our observations in the Arctic region.
3.2.5 Observations of other chlorinated hydrocarbons in the period 2001-2007
This section includes observations of the components: Trichloromethane (also called Methyl
chloroform) (CH3CCl3), Dichloromethane (CH2Cl2), Chloroform (CHCl3), Trichloroethylen
(CHClCCl2), Perchloroethylene (CCl2CCl2). The main source of all these substances is
solvents. The daily averaged concentrations are shown in Figure 22.
Figure 21: Development of the annual
means the observed Halons at the Zeppelin
Observatory for the period 2001-2007. Red:
Halon-1211, Blue: H-1301.

Greenhouse gas monitoring at the Zeppelin station, Svalbard, Norway - Annual report 2007 (TA-2480/2009)
32
2001 2002 2003 2004 2005 2006 2007 2008
20
40
60
10
15
02468
10
20
400
5
10
15
Dichloromethane (CH2Cl
2)
ppt v
Year
Chloroform (CHCl3)
ppt v
Trichloroethylen (CHClCCl2),
ppt v
Trichloromethane (CH3CCl
3)
ppt v
Perchloroethylene (CCl2CCl
2)
ppt v
Figure 22: Daily average concentrations chlorinated hydrocarbons: From the upper panel:
Perchloroethylene (dark blue) Trichloromethane (red), Trichloroethylen (green), Chloroform
(light blue) and Dichloromethane (pink) for the period 2001-2007 at the Zeppelin
observatory. The solid lines are the modelled background concentrations.
The large seasonal variations shown in the daily averaged concentrations of the compounds
reflect the short lifetimes. The compounds do have relatively low GWP, with Methyl
chloroform as the highest (30). Figure 23 shows the annual means for the period 2001-2007.
For the substances Perchloroethylene, Trichloromethane and Trichloroethylen the develop-
ment are similar with homogenous decrease. This is also reflected in the calculated trends, all
are negative and Trichloromethane has the highest reductions with a change of 4.1 ppt per
year for the period 2001-2007. For Dichloromethane there is an increase of 11% since 2001.
Trichloromethane (CH3CCl3) has continued to decrease and contributed 13.5 ppt, or more
than half, of the overall decline observed for total tropospheric Cl in 2003-2004. It is currently
still the largest contributor to the decline in tropospheric chlorine. Globally averaged surface
mixing ratios were 22.6 ppt in 2004 versus 46.4 ppt in 2000 (WMO, 2007). This is close to
our observations.

Greenhouse gas monitoring at the Zeppelin station, Svalbard, Norway - Annual report 2007 (TA-2480/2009)
33
Figure 23: Development of the annual means all the Chlorinated hydrocarbons. From the
upper panel: Trichloromethane (red), Perchloroethylene (blue), Trichloroethylen (green),
and Dichloromethane (violet) for the period 2001-2007.
3.2.6 Perfluorinated compounds
The only perfluorinated compound measured at Zeppelin is Sulphurhexacloride, SF6. This is
an extremely potent greenhouse gas emitted to the atmosphere mainly from the production of
magnesium and electronics industry. The atmospheric lifetime of this compound is as much as
3200 years, and the global warming potential is 22200, which means that the emission of 1 kg
of this gas has a warming potential which is 22200 times stronger than 1 kg emitted CO2. The
other perfluorinated compounds are also very powerful greenhouse gases thus we plan to
extend the monitoring programme with Carbon Tetrafluoride (CF4) and possibly also Hexa-
fluoroethane (C2F6) from 2009, when we have new and improved instrumentation installed at
Zeppelin. The current instrumentation is not well suited for measurements of SF6 thus there
are larger uncertainties in this compound than in most of the other compounds reported. The
daily averaged concentration of SF6 is presented in Figure 24. Note that the variations through
the year is not due to seasonal variations, rather it is instrumental adjustments.
2001 2002 2003 2004 2005 2006 2007 2008
4.0
4.5
5.0
5.5
6.0
6.5
7.0
ppt v
Year
Figure 24: Daily average concentrations of SF6 for the period 2001-2007 to the left, and
the development of the annual mean concentrations in the right panel.

Greenhouse gas monitoring at the Zeppelin station, Svalbard, Norway - Annual report 2007 (TA-2480/2009)
34
3.3 The Zeppelin observatory
The monitoring observatory is located in the Arctic on the Zeppelin Mountain, close to Ny-
Ålesund at Svalbard. At 79° north the station is placed in an undisturbed arctic environment,
away from major pollution sources. Situated 474 meters a.s.l and most of the time above the
inversion layer, there is minimal influence from local pollution sources in the nearby small
community of Ny-Ålesund.
Figure 25: The monitoring station is located at
the Zeppelin Mountain at Spitsbergen close to the
village Ny-Ålesund.
The unique location of the station makes it an ideal platform for the monitoring of global
atmospheric change and long-range transport of pollution. The main goals of NILU‟s research
activities at the Zeppelin station are:
Studies of climate related matters and stratospheric ozone
Exploration of atmospheric long-range transport of pollutants. This includes greenhouse
gases, ozone, persistent organic pollutants, aerosols and others.
Characterization of the arctic atmosphere and studies of atmospheric processes and
changes
The measurement activities at the Zeppelin station contribute to a number of global, regional
and national monitoring networks:
SOGE (System for Observation of halogenated Greenhouse Gases in Europe)
AGAGE (Advanced Global Atmospheric Gases Experiment)
EMEP (European Monitoring and Evaluation Programme under "UN Economic
Commission for Europe")
Network for detection of atmospheric change (NDAC under UNEP and WMO)
Global Atmospheric Watch (GAW under WMO)
Arctic Monitoring and Assessment Programme (AMAP)

Greenhouse gas monitoring at the Zeppelin station, Svalbard, Norway - Annual report 2007 (TA-2480/2009)
35
The Zeppelin station is owned and maintained by the Norwegian Polar Institute. NILU is
responsible for the scientific activities at the station. The station was built in 1989-1990. After
10 years of use, the old building was removed to give place to a new modern station that was
opened in May 2000. The building contains several separate laboratories, some for permanent
use by NILU and Stockholm University, others intended for short-term use like measurement
campaigns and visiting scientists. A permanent data communication line permits on-line
contact with the station for data reading and instrument control.
3.3.1 NILU’s activities at the Zeppelin observatory
NILU performs measurements of more than 20 greenhouse gases including halogenated
greenhouse gases, methane and carbon monoxide. In Appendix I are details about sampling
techniques and frequency of observations described. Methane and CO are sampled 3 times per
hour. This high sampling frequency gives valuable data for the examination of episodes
caused by long-range transport of pollutants as well as a good basis for the study of trends and
global atmospheric change. Close cooperation with SOGE-partners on the halocarbon
instrument and audits on the methane and CO-instruments (performed by EMPA on the
behalf of GAW/WMO) show that the instruments deliver data of high quality.
The amount of particles in the air is monitored by a Precision-Filter-Radiometer (PFR) sun
photometer. This instrument gives the aerosol optical depth (AOD). AOD is a measure of the
aerosols attenuation of solar radiation in the total atmospheric column.
The station at Zeppelin Mountain is also used for a wide range of other measurements, which
are not directly related to climate gas monitoring, including daily measurements of sulphur
and nitrogen compounds (SO2, SO42-
, (NO3- + HNO3) and (NH4
+ + NH3), main compounds in
precipitation, mercury, persistent organic pollutants (HCB, HCH, PCB, DDT, PAH etc.), as
well as tropospheric ozone. Zeppelin observatory is also widely used in campaigns as during
the International Polar Year.
3.3.2 Measurements of CO2 at Zeppelin observatory
At the Zeppelin station carbon dioxide (CO2) is measured by Stockholm University (SU)
(Institute of Applied Environmental Research, ITM).
SU maintain an infrared CO2 instrument measuring CO2 continuously. The instrument has
been in operations since 1989. The continuous data are enhanced by the weekly flask
sampling programme in co-operation with NOAA CMDL. Analysis of the flask samples
provide CH4, CO, H2, N2O and SF6 data for the Zeppelin station in addition to CO2.
The CO2 monitoring project at the Zeppelin station has three goals:
Provide a baseline measurement of European Arctic CO2 concentrations.
Allow detailed analysis of the processes behind CO2 variations in the Arctic on time-
scales from minutes to decades.
Understand how human activities and climate change perturb the global carbon cycle and
thus give variations of atmospheric CO2 and CH4.
SU has several instruments at Zeppelin station, which measure particles in the atmosphere.
Aerosol particles tend to reflect light and can therefore alter the Earth‟s radiation balance. The
Optical Particle Counter (OPC) gives the concentration of aerosol particles and, combined

Greenhouse gas monitoring at the Zeppelin station, Svalbard, Norway - Annual report 2007 (TA-2480/2009)
36
with data from the instrument Nephelometer, clues to the particles‟ age and origin. Size
distribution is acquired from a Differential Mobility Analyser (DMA).
Understanding atmospheric chemical processes requires more than just CO2 and aerosols and
scattering data. A total filter allows creating a bi-daily record of the chemical composition of
aerosol particles.

Greenhouse gas monitoring at the Zeppelin station, Svalbard, Norway - Annual report 2007 (TA-2480/2009)
37
4 Observations of total aerosol load at Ny-Ålesund, Svalbard
Major sources of anthropogenic aerosols are fossil fuel and biomass burning. Aerosols like
sulphate, biomass burning aerosols and fossil fuel organic carbon produce negative radiative
forcing, while fossil fuel black carbon has a positive radiative effect. Aerosols vary
considerably by regions and respond quickly to changes in emissions as their lifetime is short,
in the order of days-weeks.
Natural aerosols like sea salt, dust and sulphate and carbon aerosols from natural emissions
are expected to increase as a result of climate change. In addition to their direct radiative
forcing, aerosols have an indirect radiative forcing through their effect on cloud formation.
4.1 AOD measurements in 2007 at Ny-Ålesund
Hourly AOD values measured in Ny-Ålesund with the PFR-instrument are presented in
Figure 12 for three different wavelengths. The observations show increased aerosol levels
during the Arctic haze period in the spring. However, there are also short episodes later in the
year with elevated levels of AOD in July and September. These are caused by long-range
transport of aerosols into the Arctic.
15 Feb 15 Mar 15 Apr 15 May 15 Jun 15 Jul 15 Aug 15 Sep 15 Oct
0.00
0.05
0.10
0.15
0.20
0.25
0.30
0.35
0.40
AO
D=
50
1 n
m
Date 2006
Figure 26: Hourly AOD values measured in Ny-Ålesund during 2007.
Table 3 gives an overview of the annual and seasonal mean for AOD at 501 nm and the
Ångstrøm exponent. Maximum value for the AOD and the number of hours with observations
is also included. Despite the low numbers of observations, the elevated levels in spring are
visible in Figure 12 and in the Table below in the mean AOD and max AOD for the spring
months.
Table 3: Annual and seasonal mean values of AOD at 501 nm together with the Ångstrøm
exponent in Ny-Ålesund in 2007. The numbers in parenthesis indicates the uncertainty (1 ).
Mean AOD =501 nm
Max
AOD =501 nm Ångstrom exponent
Number of hours with observations
Annual 0.069 (0.03) 0.325 1.547 330 March-May 0.087 (0.03) 0.325 1.508 187 June-Aug 0.050 (0.01) 0.098 1.634 97 Sept-Oct 0.038 (0.02) 0.13 1.519 46

Greenhouse gas monitoring at the Zeppelin station, Svalbard, Norway - Annual report 2007 (TA-2480/2009)
38
The Ångstrøm exponent, , provides information about the size of the aerosols. Larger values
of imply a relatively high ratio of small particles. In general aerosols transported over a
wider area are small compared to primary local source aerosols as sea salt. These are called
secondary aerosols. According to Smirnov et al. (2003) the representative threshold value for
maritime aerosol types are Ångstrøm exponents below 1.0. Aerosols from combustion
processes and aerosols produced in the atmosphere by secondary processes tend to be small
and might be transported over large regions and thus have higher Ångstrøm exponent. In 2007
the smallest aerosols are found during summer
indicating that there might be aerosol production
in the region or transport from source region and
less maritime aerosol produced e.g. by sea spray.
In Figure 27 hourly relative frequencies of the
Ångstrøm exponents, , during 2007 are
displayed. The values show a distinct peak
centered at = 1.60. More than 90% of the is
in the range from 1.05-2, and around 10% of the
Ångstrøm exponents are below 1.0 in
Ny-Ålesund, the typical value for larger marine
aerosols. This is much less than in 2006 where
30% of the values were in this range. The high
values imply large loading of fine aerosols
typical for long-range transport.
4.2 AOD measurements 2002-2007
Figure 28 presents the AOD measurements at 501 nm in Ny-Ålesund for the years 2002-2007.
The AOD values are, as expected, considerable higher during the Arctic haze period for all
years. Yet, Figure 14 illustrates that there are
several episodes during the years with short-term
elevated AOD values in the summer and autumn
as well. Analyses of such episodes are important
to understand the effect of pollution transported
into the region. Stohl and co-workers (Stohl et al.
2006) analysed the observed episode in the end
of July 2004. They showed that huge emissions
from boreal forest fires in North America, with
light absorbing aerosol containing BC, were
transported into the region and very likely
explain the elevated AOD levels. Furthermore
Stohl et al. (2007) showed that agricultural fires
in Eastern Europe resulted in elevated pollution
levels in Arctic in spring 2006 and Lund Myhre
et al. (2007) found that these aerosol had a strong
cooling effect on the Arctic during this period, with a moderate warming effect when the
aerosol layer were above snow covered surface areas.
0.0 0.2 0.4 0.6 0.8 1.0 1.2 1.4 1.6 1.8 2.0 2.20
20
40
60
Figure 27: The relative frequency of
hourly averaged Ångstrøm exponents,
during 2007.
15 Feb 15 Mar 15 Apr 15 May 15 Jun 15 Jul 15 Aug 15 Sep 15 Oct
0.00
0.05
0.10
0.15
0.20
0.25
0.30
0.35
0.40
0.45
AO
D=
50
1 n
m
AOD 2002
AOD 2003
AOD 2004
AOD 2005
AOD 2006
AOD 2007
Figure 28: Daily average aerosol optical
depth (AOD) measured in Ny-Ålesund
during 2002-2007.
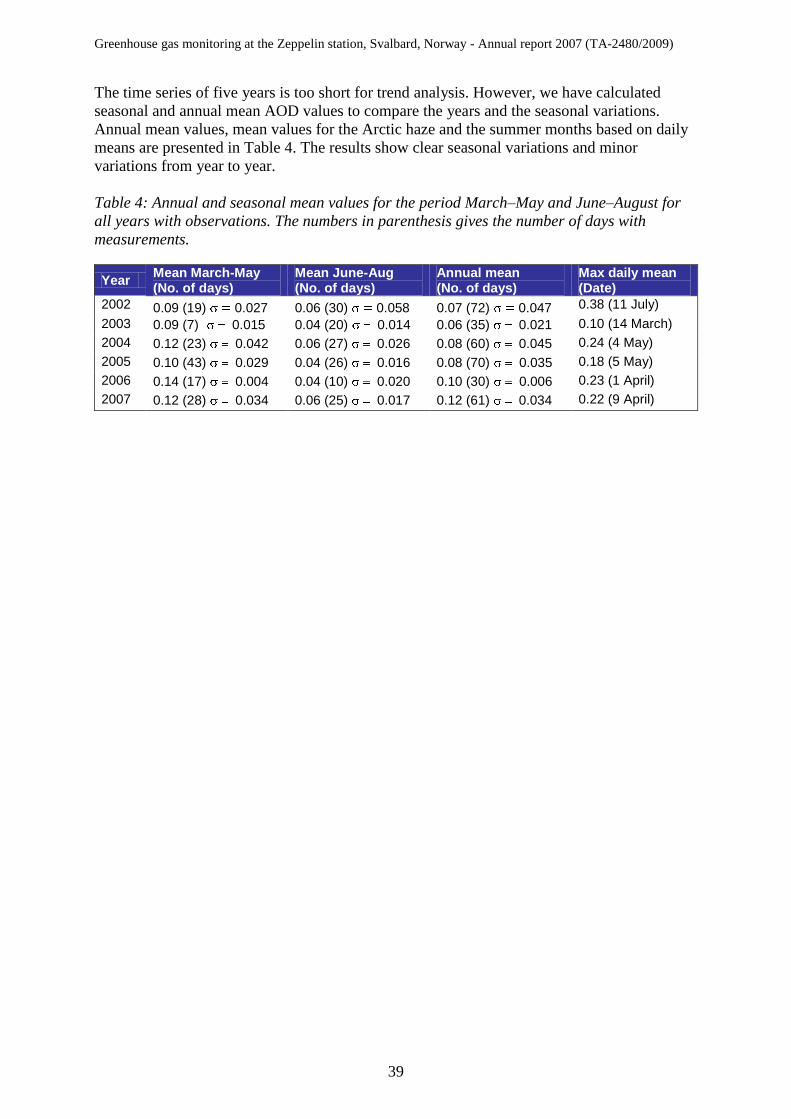
Greenhouse gas monitoring at the Zeppelin station, Svalbard, Norway - Annual report 2007 (TA-2480/2009)
39
The time series of five years is too short for trend analysis. However, we have calculated
seasonal and annual mean AOD values to compare the years and the seasonal variations.
Annual mean values, mean values for the Arctic haze and the summer months based on daily
means are presented in Table 4. The results show clear seasonal variations and minor
variations from year to year.
Table 4: Annual and seasonal mean values for the period March–May and June–August for
all years with observations. The numbers in parenthesis gives the number of days with
measurements.
Year Mean March-May (No. of days)
Mean June-Aug (No. of days)
Annual mean (No. of days)
Max daily mean (Date)
2002 0.09 (19) 0.027 0.06 (30) 0.058 0.07 (72) 0.047 0.38 (11 July)
2003 0.09 (7) 0.015 0.04 (20) 0.014 0.06 (35) 0.021 0.10 (14 March)
2004 0.12 (23) 0.042 0.06 (27) 0.026 0.08 (60) 0.045 0.24 (4 May)
2005 0.10 (43) 0.029 0.04 (26) 0.016 0.08 (70) 0.035 0.18 (5 May)
2006 0.14 (17) 0.004 0.04 (10) 0.020 0.10 (30) 0.006 0.23 (1 April)
2007 0.12 (28) 0.034 0.06 (25) 0.017 0.12 (61) 0.034 0.22 (9 April)

Greenhouse gas monitoring at the Zeppelin station, Svalbard, Norway - Annual report 2007 (TA-2480/2009)
40
5 Regional emissions and the influence on the observations
Analyses of the air mass origin are important for the understanding of the observed levels of
the gases. We have analysed the origin of the air arriving at Zeppelin in 2007. 7 days
backward trajectories from the European Center for Medium-Range Weather Forecasts
(ECMWF) have been used to investigate the major transport pathways into the region.3 The
origin of the air arriving at Zeppelin is categorised in following 6 sectors:
Arctic region: Clean Arctic air: Air mass trajectories with all trajectory points north of
65°N were classified as Arctic
Atlantic sector: Clean marine air: Air mass trajectories with all trajectory points
between 10°W and 70°W and from south of 60°N.
North American sector: Polluted air: If at least 50% of the trajectory points are between
70°W and 180°W, and from south of 60°N.
European sector: Polluted air: If at least 50% of the trajectory points were between
10°W and 30°E, and from south of 60°N.
Russian sector: Polluted air: If air mass trajectories with all points between 30°E and
180°E and from south of 60°N the sector were classified as „Russian‟ sector.
Undefined sector: 20% the trajectories do not come from a distinct sector. This is
classified as „undefined‟.
The Arctic and Atlantic sector are assumed to have minimal influence of pollution. There are
no industrial sources in these areas, and one can say that the air is „clean‟. Background values
are defined from those „clean air‟ areas with 6 out of 8 trajectories (sampling day ±12 hours)
within the sector, as described above.
The Table below shows the portion of the polluted and clean air arriving at Zeppelin
observatory for the years 2001-2007.
Table 5: The distribution of polluted and clean air arriving at Zeppelin in the period 2001-
2007.
2001 2002 2003 2004 2005 2006 2007
Total days 365 365 365 366 365 365 365
Clean air 206 203 213 174 186 195 246
% days with clean air 56.4 55.6 58.4 47.5 51.0 53.4 67.4
3 The spatial resolution is T106, which correspond to a latitude/longitude resolution of 1.125x1.125 degrees, the
temporal resolution is 6 hours, and 60 levels (91 levels after February 2006) are available in the vertical
direction. The data sets used are so-called analysis, which is a combination of observations and numerical
calculations. This includes measurements from satellites, radio sondes, buoys, weather stations, etc. which are
assimilated into a meteorological model that produce an estimate of the state of the atmosphere at a given time.

Greenhouse gas monitoring at the Zeppelin station, Svalbard, Norway - Annual report 2007 (TA-2480/2009)
41
In 2007 there were relatively few episodes with polluted air transported to Zeppelin and no
extreme episode as the record one observed in 2006 (Stohl et al, 2007, Lund Myhre et al
2007). Rather it is important to emphasise the high frequency of days with air categorised as
clean arctic marine air (67%) for 2007. This is air from the Atlantic region and north of
65 degrees from northern part of Scandinavia, Russia, Greenland, USA and Alaska. This
means that the observations at Zeppelin were less influenced by long range transport in 2007
than previous years.
5.1 Regional emissions and the elevated methane levels
We have performed a more detailed analysis of the air masses for the days and periods with
elevated methane levels in 2007. In Figure 29 are the methane observations for the period
2001-2007 shown together with an indication if the air masses are considered as clean Arctic
and Atlantic air or polluted air.
Figure 29: Observations of methane for the period 2001-2007 at the Zeppelin observatory.
Blue dots: air mass origin is from a clean sector, red dots: the air mass origin is from a
polluted sector.
The blue dots represent the background methane levels which mean that the air masses have
originated from the Arctic or Atlantic region. The red dots represent the methane observations
when the air masses arriving at Zeppelin originate from a polluted region: North America,
Europe or Russia. As can be seen in 2007 a large portion of the air masses arriving at
Zeppelin originate for the Arctic and Atlantic sector, particularly during the summer and the
autumn. Further, the peak episodes are due to pollution transported from lower latitudes.
The next Figure shows 5 different plots for selected days. In the upper panel are trajectories
for the days with maximum methane mixing ratio showed, and the lower panel are typical
trajectories for the elevated period in August and September.

Greenhouse gas monitoring at the Zeppelin station, Svalbard, Norway - Annual report 2007 (TA-2480/2009)
42
Figure 30: Trajectory plots for selected periods with elevated methane levels at Zeppelin in
2007.
The maximum methane mixing ratio ever detected at Zeppelin was on 10th
December 2007
and was as high as 1956 ppb. At this day, and the days before, air from North and central
Russia, and east Europe (8th
December) arrived at Zeppelin. This is a typical situation for long
range transport of pollution from the continents industrialised regions.
The lower panel shows the typical situation for the period in August with elevated levels. The
air was quite stable north of 65 degrees and circulates the Arctic region following a path
relatively close to the surface. The air masses were in contacted with the surface particularly
in the northern part of Russia and Greenland during this period. The analysis of the source
regions and influence on the methane levels at Zeppelin will continue, and no conclusions can
be drawn at this point.

Greenhouse gas monitoring at the Zeppelin station, Svalbard, Norway - Annual report 2007 (TA-2480/2009)
43
6 Greenhouse Gas Monitoring Networks
6.1 SOGE
SOGE is an integrated system for observation of halogenated greenhouse gases in Europe and
was funded in 2001-2003. SOGE builds on a combination of observations and modelling.
High resolution in situ observation at four background stations forms the backbone of SOGE.
A network is being developed between the four stations. This includes full inter-calibration
and common quality control, which is adopted from the global monitoring network of
Advanced Global Atmospheric Gases Experiment (AGAGE).
The in situ measurements will be combined with vertical column measurements, which have
been made at two of the network sites for up to about 15 years, as a part of Network for
Detection of Stratospheric Change (NDSC). One purpose of this combination is determination
of trends in the concentrations of the gases under consideration. Integration of the
observations with a variety of model tools will allow extensive and original exploitation of the
data. The integrated system will be used to verify emissions of the measured substances in
Europe down to a regional scale. This will be obtained by the use of a model labelling air-
parcels with their location and time of origin, so it is possible to identify the various sources
that contribute to the concentrations measured at the network sites. The results will contribute
to the assessment of compliance with the Kyoto and Montreal protocols, and they will be
utilised also to define criteria for future monitoring of halocarbons in Europe.
Global models are used to estimate impacts of the observed compounds on climate change
and the ozone layer. The impacts will be evaluated in terms of radiative forcing and Global
Warming Potential (GWP), and ozone destruction and Ozone Depletion Potential (ODP),
respectively.
SOGE is funded by European Commission Directorate General Research 5th Framework
Programme Energy, Environment and Sustainable Development.
Figure 31: The SOGE climate gas monitoring stations.
Mt Zeppelin
Mace Head
Jungfraujoch
Mt Cimone
SOGE stations
Mt. Zeppelin Svalbard, Norway 78º54’ N, 11º53’ E 475 m asl
Mace Head Ireland 53º20’ N, 9º54’ W 14 m asl
Jungfraujoch Switzerland 46º32’ N, 7º59’ E 3500 m asl
Mt. Cimone Italy 44º12’ N, 10º42’ E 2165 m asl

Greenhouse gas monitoring at the Zeppelin station, Svalbard, Norway - Annual report 2007 (TA-2480/2009)
44
6.2 AGAGE
The Advanced Global Atmospheric Gases Experiment and its predecessors the Atmospheric
Lifetime Experiment (ALE) and the Global Atmospheric Gases Experiment (GAGE) have
been measuring the composition of the global atmosphere since 1978. The observations and
their interpretation are widely recognised for their importance to ozone depletion and climate
change studies. The AGAGE is distinguished by its capability to measure over the globe at
high frequency almost all of the important species in the Montreal Protocol to protect the
ozone layer and almost all of the significant non-CO2 gases in the Kyoto Protocol to mitigate
climate change.
The scientific objectives of AGAGE are considerable importance in furthering our
understanding of important global chemical and climatic phenomena:
To optimally determine from observations, the rate of emission and/or chemical
destruction (i.e. lifetime) of the anthropogenic chemicals which contribute most of the
reactive chlorine and bromine released into the stratosphere.
To accurately document the global distributions and temporal behavior of the
biogenic/anthropogenic gases N2O, CH4, CO, H2, CH3Cl, CH3Br, CHBr3, CH3I, CH2Cl2,
CCl2CCl2 and CHCl3 over the globe.
To optimally determine the average concentrations and trends of OH radicals in the
troposphere by determining the rate of destruction of atmospheric CH3CCl3 and other
hydrohalocarbons from continuous measurements of their concentrations together with
industrial estimates of their emissions.
To optimally determine, using CH4 and N2O data (and theoretical estimates of their rates
of destruction), the global magnitude and distribution by semi-hemisphere or region of the
surface sources of CH4 and N2O.
To provide an accurate data base on the rates of accumulation of trace gases over the
globe which cab be used to test the synoptic-, regional- and global-scale circulation
predicted by three dimensional models and/or to determine characteristics of the sources
of these gases near the stations.
The AGAGE measurement stations coastal sites around the world chosen to provide accurate
measurements of trace gases whose lifetimes are long compared to global atmospheric
circulations. The SOGE stations are included in the network through collaborations between
SOGE and AGAGE sharing technology and placing AGAGE and SOGE data on common
calibration scales with similar precision, accuracy and measurement frequency.
Figure 32: The AGAGE network of monitoring stations.

Greenhouse gas monitoring at the Zeppelin station, Svalbard, Norway - Annual report 2007 (TA-2480/2009)
45
7 References
Forster, P., Ramaswamy, V., Artaxo, P., Berntsen, T., Betts, R., Fahey, D.W., Haywood, J.,
Lean, J., Lowe, D.C., Myhre, G., Nganga, J., Prinn, R., Raga, G., Schulz, M. and Van
Dorland, R. (2007) Changes in atmospheric constituents and in radiative forcing. In:
Climate Change 2007: The physical science basis. Contribution of Working Group I to the
fourth assessment report of the Intergovernmental Panel on Climate Change. Solomon, S.,
D. Qin, M. Manning, Z. Chen, M. Marquis, K.B. Averyt, M.Tignor and H.L. Miller (eds.).
Cambridge, Cambridge University Press.
IPCC (2007) Summary for Policymakers. In: Climate Change 2007: The physical science
basis. Contribution of Working Group I to the fourth assessment report of the
Intergovernmental Panel on Climate Change. Solomon, S., D. Qin, M. Manning, Z. Chen,
M. Marquis, K.B. Averyt, M.Tignor and H.L. Miller (eds.). Cambridge, Cambridge
University Press.
Keppler, F., Hamilton, J.G., Bra, M. and Röckmann, T. (2006) Methane emissions from
terrestrial plants under aerobic conditions. Nature, 439, 187-191.
Myhre, C.L., Toledano, C., Myhre, G., Stebel, K., Yttri, K. E., Aaltonen, V., Johnsrud, M.,
Frioud, M., Cachorro, V., de Frutos, A., Lihavainen, H., Campbell, J. R., Chaikovsky, A.
P., Shiobara, M., Welton, E. J., and Tørseth, K. (2007) Regional aerosol optical properties
and radiative impact of the extreme smoke event in the European Arctic in spring 2006.
Atmos. Chem. Phys., 7, 5899-5915.
Rigby, M., Prinn, R.G., Fraser, P.J., Simmonds, P.G., Langenfelds, R.L., Huang, J., Cunnold,
D.M., Steele, L.P., Krummel, P.B., Weiss, R.F., O'Doherty, S., Salameh, P.K., Wang, H.J.,
Harth, C.M., Mühle, J. and Porter, L.W. (2008) Renewed growth of atmospheric methane.
Geophys. Res. Lett., 35, L22805, doi:10.1029/2008GL036037.
Simmonds, P.G., Manning, A.J., Derwent, R.G., Ciais, P., Ramonet, M., Kazan, V. and Ryall,
D. (2005) A burning question. Can recent growth rate anomalies in the greenhouse gases
be attributed to large-scale biomass burning events? Atmos. Environ., 39, 2513-2517.
Stohl, A., Berg, T., Burkhart, J.F., Fjǽraa, A.M., Forster, C., Herber, A., Hov, Ø., Lunder, C.,
McMillan, W.W., Oltmans, S., Shiobara, M., Simpson, D., Solberg, S., Stebel, K., Ström,
J., Tørseth, K., Treffeisen, R., Virkkunen, K., and Yttri, K.E. (2007) Arctic smoke – record
high air pollution levels in the European Arctic due to agricultural fires in Eastern Europe
in spring 2006. Atmos. Chem. Phys., 7, 511–534.
WMO (2007) Scientific assessment of ozone depletion: 2006. Geneva, World Meteorological
Organization (Global Ozone Research and Monitoring Project – Report No. 50).
WMO (2007) Greenhouse Gas Bulletin, The State of Greenhouse Gases in the Atmosphere
Using Global Observations through 2007. WMO. URL:
http://www.wmo.int/pages/prog/arep/gaw/ghg/documents/ghg-bulletin-4-final-english.pdf

Greenhouse gas monitoring at the Zeppelin station, Svalbard, Norway - Annual report 2007 (TA-2480/2009)
46

Greenhouse gas monitoring at the Zeppelin station, Svalbard, Norway - Annual report 2007 (TA-2480/2009)
47
Appendix I
Description of instruments, methods and trend analysis

Greenhouse gas monitoring at the Zeppelin station, Svalbard, Norway - Annual report 2007 (TA-2480/2009)
48

Greenhouse gas monitoring at the Zeppelin station, Svalbard, Norway - Annual report 2007 (TA-2480/2009)
49
Description of instruments and methods
In this appendix are the instrumental methods used for the measurements of the various
greenhouse gases presented. Additionally we explained the theoretical methods used in the
calculation of the trends and how the annual mean values presented in Table 2 are calculated
in the end of the section.
Instrumental description
NILU performs measurements of halogenated greenhouse gases as well as methane and
carbon monoxide using automated gas chromatographs with high sampling frequencies. A
mass spectrometric detector is used to determine more than 30 halogenated compounds,
automatically sampled 6 times per day. Methane and CO are sampled 3 times per hour. This
high sampling frequency gives valuable data for the examination of episodes caused by long-
range transport of pollutants as well as a good basis for the study of trends and global
atmospheric change. Close cooperation with SOGE-partners on the halocarbon instrument
and audits on the methane and CO-instruments (performed by EMPA on the behalf of
GAW/WMO) show that the instruments deliver data of high quality.
Component Instrument and method
Time res.
Calibration procedures
Comment
Methane CH4 GC-FID 1 h
Hourly, working std. calibrated vs. GAW std.
Data coverage 2007: 86% Instrument down for a longer period May-June due to instrument breakdown, requiring major repairs and wait for new spare parts.
Carbon monoxide CO GC-MgO/UV 1 h
Every 2 hours, working std. calibrated vs. GAW std.
Data coverage 2007: 95%
Carbondioxide CO2 1 h CO2 measurements performed by ITM Stockholm University (SU)
CFC-11 CFC-12 CFC-113 CFC-115 HFC-125 HFC-134a HFC-152a HCFC-22 HCFC-141b HCFC-142b H-1301 H-1211 Methyl Chloride Methyl Bromide Methylendichloride Chloroform Methylchloroform TriChloroethylene Perchloroethylene Sulphurhexafluoride
CFCl3 CF2Cl2 CF2ClCFCl2 CF3CF2Cl CHF2CF3 CH2FCF3 CH3CHF2 CHF2Cl CH3CFCl2 CH3CF2Cl CF3Br CF2ClBr CH3Cl CH3Br CH2Cl2 CHCl3 CH3CCl3 CHClCCl2 CCl2CCl2 SF6
ADS-GC-MS 4 h
Every 2 hours, working std. calibrated vs. AGAGE std.
Data coverage 2007: 67% Instrument down for longer periods in January due to Gas Chromatograph breakdown, and in August-September due to Mass Spectrometer breakdown, requiring major repairs and wait for new spare parts.
Ozone O3 5 min

Greenhouse gas monitoring at the Zeppelin station, Svalbard, Norway - Annual report 2007 (TA-2480/2009)
50
The amount of particles in the air is monitored by a continuous aethalometer (SU) and by the
use of a Precision-Filter-Radiometer (PFR) sun photometer (NILU). The aethalometer
measures the total amount of particles at ground level, while the sun photometer measures the
amount in a total column.
The station at Zeppelin Mountain is also used for a long range of measurements, which are
not directly related to climate gas monitoring, including daily measurements of sulphur and
nitrogen compounds (SO2, SO42-
, (NO3- + HNO3) and (NH4
+ + NH3), main compounds in
precipitation, mercury, persistent organic pollutants (HCB, HCH, PCB, DDT, PAH etc.), as
well as tropospheric and stratospheric ozone.
Observations of Aerosol Optical Depth: Experimental details regarding the Precision Filter Radiometer (PFR) in 2007
The PFR measurements in Ny-Ålesund are part of the global network of aerosol optical depth
(AOD) observations, which started in 1999 on behalf of the WMO GAW program. The
instrument is located on the roof of the Sverdrup station, Ny-Ålesund, close to the EMEP
station on the Zeppelin Mountain (78.9°N, 11.9°E, 474 m asl). The PFR has been in operation
since May 2002. In Ny-Ålesund the polar night lasts from 26th
October to 16th
February,
leading to short observational seasons. However during the summer it is possible to measure
day and night if the weather conditions are satisfactory. The instrument measures direct solar
radiation in four narrow spectral bands centered at 862, 501, 411, and 368 nm. Data quality
control includes instrumental control like detector temperature and solar pointing control as
well as objective cloud screening. The signals are recorded every 1.25 seconds and are given
as one minute averages. In the calculations of the AOD values it is necessary to correct for the
absorption of UV by ozone. For this, we have used daily ozone values from TOMS in the
calculations. The low number of days with measurements is caused by bad weather
conditions. The number of days where measurements can be performed is reduced due to
cloudy or foggy weather conditions as the measurements are dependent on direct solar
radiation.
CO2 measurements performed by ITM Stockholm University (SU)
At the Zeppelin station carbon dioxide (CO2) and atmospheric particles are measured by
Stockholm University (Institute of Applied Environmental Research, ITM).
SU maintains a continuous infrared CO2 instrument, which has been monitoring since 1989.
The continuous data are enhanced by the weekly flask sampling programme in co-operation
with NOAA CMDL. Analysis of the flask samples provide CH4, CO, H2, N2O and SF6 data
for the Zeppelin station.
The CO2 monitoring project at the Zeppelin station has three goals:
Provide a baseline measurement of European Arctic CO2 concentrations.
Allow detailed analysis of the processes behind CO2 variations in the Arctic on time-
scales from minutes to decades.
Understand how human activities and climate change perturb the global carbon cycle and
thus give variations of atmospheric CO2 and CH4.
SU has several instruments at Zeppelin station, which measure particles in the atmosphere.
Aerosol particles tend to reflect light and can therefore alter the Earth‟s radiation balance. The

Greenhouse gas monitoring at the Zeppelin station, Svalbard, Norway - Annual report 2007 (TA-2480/2009)
51
Optical Particle Counter (OPC) gives the concentration of aerosol particles and, combined
with data from the Nephelometer, clues to the particles‟ age and origin. Size distribution is
acquired from a Differential Mobility Analyser (DMA).
Understanding atmospheric chemical processes requires more than just CO2 and aerosols and
scattering data. A total filter allows creating a bi-daily record of the chemical composition of
aerosol particles.
Model studies: Calculation of trends
Calculation of trends
To calculate the annual trends the observations have been fitted as described in Simmons et
al. (2006) by an empirical equation of Legendre polynomials and harmonic functions with
linear, quadratic, and annual and semi-annual harmonic terms:
tstctstcN
tP
Nd
N
tP
Nbatf 4sin4cos2sin2cos1
123
11
1222112
2
1
The observed f can be expressed as functions of time measures from the 2N-months interval
of interest. The coefficient a defines the average mole fraction, b defines the trend in the mole
fraction and d defines the acceleration in the trend. The c and s define the annual and inter-
annual cycles in mole fraction. N is the mid-point of the period of investigation. Pi are the
Legendre polynomials of order i.
Determination of background data
Based on the daily mean concentrations an algorithm is selected to find the values assumed as
clean background air. If at least 75% of the trajectories within +/- 12 hours of the sampling
day are arriving from a so-called clean sector, defined below, one can assume the air for that
specific day to be non-polluted. The remaining 25% of the trajectories from European,
Russian or North-American sector are removed before calculating the background.

Greenhouse gas monitoring at the Zeppelin station, Svalbard, Norway - Annual report 2007 (TA-2480/2009)
52

Greenhouse gas monitoring at the Zeppelin station, Svalbard, Norway - Annual report 2007 (TA-2480/2009)
53
Appendix II
The Montreal and Kyoto Protocol

Greenhouse gas monitoring at the Zeppelin station, Svalbard, Norway - Annual report 2007 (TA-2480/2009)
54

Greenhouse gas monitoring at the Zeppelin station, Svalbard, Norway - Annual report 2007 (TA-2480/2009)
55
Background on the Montreal protocol for the protection of the ozone layer
This chapter is a shortened and somewhat changed version of Chapter 8 International
Regulations on Halocarbons by P.M. Midgley and A. McCulloch in The Handbook of
Environmental Chemistry 4E , Reactive Halogen Compounds in the Atmosphere editor
P. Fabian.
CFC-11 and CFC-12 were introduced in the 1930s as replacements for toxic and flammable
refrigerants. Production and emissions first remained low but increased rapidly in the 1960s
with the spread of refrigeration in the developed world and as new uses, such as aerosol spray
cans, were developed. By the early 1970s – CFC-11 and CFC-12, had become ubiquitous
trace constituents of the troposphere. Actually the Association of Chemical Manufacturers
itself started a research programme to investigate possible effects of CFCs on the environ-
ment. The original aim was to assess the smog-forming potential but was soon altered when
the later Nobel Price winners Molina and Rowland propounded their hypothesis of ozone
depletion by CFCs in 1974.
The essence of the hypothesis was that, because of their exceptionally high chemical stability,
CFCs would be totally stable in the troposphere and would diffuse unchanged to the
stratosphere, where they would photolyse under the reaction of the sun‟s UV radiation to
produce Cl atoms. In effect, chlorine atoms resulting from the photolysis of CFCs would
increase the destruction of ozone that already was taking place by Cl atoms arising from
naturally occurring chlorocarbons in the stratosphere. Owing to the cyclic nature of the
reaction, each Cl atom could destroy many ozone molecules before it reacted with other
species to form a stable and inactive molecule like HCl.
That was the basic hypothesis but, at that time, no ozone depletion had been observed and
mathematical models of the atmosphere were incapable of describing all the processes
consistently. Throughout the 1970s and early 1980s, the scientific community strove both to
detect trends in stratospheric ozone, and improve the models.
In the meantime the releases of CFC-11 and CFC-12 continued to grow, as did releases of
other compounds that could be transported to the stratosphere and decompose there to release
chlorine or bromine: CFC-113, CFC-114, CFC-115, Halon-1211, Halon-1301, carbon
tetrachloride and methyl chloroform all showed growth, although for many compounds this
was not documented sufficient.
The growth in emissions was reflected in growth in atmospheric concentrations and was
sufficiently alarming to set regulations in process, notwithstanding the inability of
atmospheric models to agree or real ozone depletion to be detected.
In the mid 1970s, the widespread use of CFCs in aerosols was banned in USA. This resulted
in an immediate reduction in emissions, but the long-term trend of releases remained positive.
Production was capped at the then current capacity in Europe, with a requirement to reduce
the quantities used in aerosol propulsion by 30%. This form of regulation – controlling total
production and consumption, rather than each end use – was subsequently adopted in the
Montreal Protocol and its revisions.
In 1981 there was still no evidence that the ozone layer was being affected, but – with the
expectation that it could be depleted – the United Nations Environment Programme started a
working group with legal and technical experts with the aim of securing a general treaty to

Greenhouse gas monitoring at the Zeppelin station, Svalbard, Norway - Annual report 2007 (TA-2480/2009)
56
tackle ozone depletion. This was finally agreed upon in Vienna 1985 as the Convention for
the Protection of the Ozone layer, signed by 28 nations and subsequently ratified by 168.
The nations agreed to take “appropriate measures ... to protect human health and environment
against activities which are likely to modify the Ozone Layer, but the measures where
unspecified. The main goal of the Convention was to encourage research, cooperation among
countries and exchange of information.
The Vienna Convention set an important precedent: for the first time nations agreed in
principle to tackle a global environmental problem before its effects were felt – or even
scientifically proven. One fact that helped here was the fact that there are relatively few
producers of ozone-depleting substances. This meant that those drafting the treaty could
envisage controls on particular substances, rather than control on society‟s activities. In this
respect, ozone-depleting substances are very different from greenhouse gases like carbon
dioxide or methane, which are released as byproducts of societal activities, such as energy
conversion and agriculture, rather than production and consumption.
The Montreal Protocol on substances that deplete the ozone layer
At the same time as the legal and technical experts were developing treaties, the scientific
experts in the Coordinating Committee on the Ozone Layer (CCOL 1977) were reviewing
results of atmospheric measurements and the models using them, and developing projects to
extend understanding of ozone layer behavior.
The first real evidence of ozone depletion came from Farman et al. who, in 1985, linked
severe seasonal ozone depletion in the Antarctic to the growth in chlorine from CFCs in the
Antarctic stratosphere. This paper was instrumental in promoting the Montreal Protocol,
signed by 24 countries in 1987 and subsequently ratified by 165. Today about 190 countries
have ratified the protocol.
The Protocol, which came into force on 1st January 1989, is a flexible instrument; the
provisions must be modified in the light of a virtually continuous scientific review process
that reported to the Parties (Scientific Assessment of Ozone Depletion 1989, 1991, 1994,
1998, 2002). Reviews of the technologies available for providing substitutes for ODS (ozone
depleting substances) occur with similar frequency together with reviews of the possible
effects of ozone depletion.
The protocol also contains clauses to cover the special circumstances of several groups of
countries, especially developing countries with low consumption rates that do not want the
Protocol to hinder their development. As a result, regulations have evolved since 1989 as the
scientifically driven requirements have changed and as the political and societal needs of
countries have changed.
For the developed world the Protocol set out to control national production and consumption
of CFCs (11, 12, 113, 114 and 115) and halons (1211, 1301,and 2402) as two distinct groups:
the CFCs were to be reduced by the year 1998 to 50% of their level in 1986, and production
and consumption of halons were to be frozen at their 1986 levels in 1993. In both cases the
different potency for ozone depletion of substances within each group was taken into account,
using ODP (Ozone Depletion Potential) of each substance as a multiplier of the masses
produced or consumed.

Greenhouse gas monitoring at the Zeppelin station, Svalbard, Norway - Annual report 2007 (TA-2480/2009)
57
Amendments and Adjustments to the Protocol
London 1990
The CFCs controlled in the original version of the Protocol have lifetimes in the order of
decades to several centuries. Consequently their atmospheric concentrations will be
maintained by comparatively modest emissions. New calculations showed that a 77%
reduction in emissions for CFC-11 and a 85% reduction in the emissions of CFC-12 would be
required, simply to stabilise atmospheric concentrations on 1989 levels. Furthermore, the
increases in concentration arising from production that were still allowed were not trivial –
the CFC-12 levels could have been doubled by 2050 had the Protocol not been changed.
At the same time it became apparent that other compounds were capable of being transported
into the ozone layer and augmenting ozone depletion by releasing chlorine there. Carbon
tetrachloride (CCl4), used principally as raw material for CFC-11 and CFC-12 production. The
long atmospheric lifetime of 42 years made it an important ODS, even though the quantities
released were smaller than CFC releases.
Methyl chloroform (CCl3CH3) has a much shorter lifetime (5 years) but because of larger
releases its tropospheric concentration was higher than that of CCl4. A significant part (over
10%) could be expected to reach the stratosphere.
There were also releases of hydrochlorofluorocarbons (HCFCs) to consider. One of them
HCFC-22 (CHClF2), had been used as refrigerant in many years and in 1987 had a
concentration of 100 ppt. There was concern that removing the option to use CFCs would
result in a rapid and sustained increase in the use of HCFCs. Substitution in other than modest
proportion could both increase the peak chlorine loading and sustain unprecedented levels of
stratospheric chlorine.
Based on that, the Parties to the Montreal Protocol, meeting in London in 1990, agreed to
phase out CFCs and halons by the year 2000; to extend the controls to any fully halogenated
CFC (previously only named compounds were covered); to phase out Carbon tetrachloride by
2000 and Methyl chloroform by 2005. These controls extended to the developed world only.
Copenhagen 1992
HCFCs were included in a formula that set a “cap” on consumption and progressively reduced
it to virtually zero by 2020, with complete phase-out in 2030. For each nation, the cap was set
at the sum of its 1989 consumption of HCFCs plus 3.1% of its total consumption of CFCs in
that year. The calculations for the cap are based on ODP tonnes (that is the mass of each
substance consumed multiplied by its ozone depletion potential).
In addition the Copenhagen amendments brought forward the dates for phase out of CFCs,
CCl4 and CCl3CH3 all to 1996 and halons to 1994. In part, this was in recognition of the far
greater potency of bromine for ozone depletion than chlorine. For the same reason, CH3Br
(Methyl Bromide) was formally included in the protocol with a freeze on consumption in the
developed world in 1995.
Vienna 1995
The first signs of the response of the environment to the Montreal Protocol could be
discerned:

Greenhouse gas monitoring at the Zeppelin station, Svalbard, Norway - Annual report 2007 (TA-2480/2009)
58
The increase in concentrations of CFC-11, 12, 113 and of Methyl chloroform had begun to
slow down. However, the major review of ozone depletion in 1994 gave little ground for
complacency, particularly because the extent and severity of Antarctic ozone holes continued
to increase in 1992 and 1993. In 1995 CFCs, CCl4 and CCl3CH3 and halons were all about to
be phased out in the developed world, so that there was scope for change only as regards
HCFCs and Methyl Bromide. The cap percentage was reduced from 3.1 to 2.8% and a phase
out schedule for Methyl Bromide was implemented. Both affected only the developed world.
Montreal 1997
There was a clearly discernible response of the halogen loading of the atmosphere to the
reductions in production and consumption of halocarbons that actually had gone significantly
faster than was required by the Protocol. Tropospheric chlorine loading peaked in 1993, from
which it could be inferred that maximum stratospheric chlorine concentrations would occur a
few years later. The peak in bromine loading could be expected to occur between 2000 and
2010. The Montreal amendments concentrated on consolidating the environmental
improvements that had been made by the developed countries and extending the controls on
HCFCs and Methyl Bromide to the developing world. Summarised the controls for
developing countries are: CFCs, CCl4 and CCl3CH3,: freeze 1999 – phase out 2010 – Halons :
freeze 2002 – phase out 2010 -HCFCs: freeze 2016 – phase out 2040 -Methyl Bromide :
freeze 2002 – phase out 2015. Between now and the phase out dates developing countries
may continue to produce ODS at up to 15% of the rate in 1986. The quantity produced and
the amount consumed is reported to UNEP. According to that the total production of CFCs in
1996 was less than 8% of the 1986 level.
Beijing 1999
The Beijing amendments include limits on the production of HCFCs in both developed
(freeze in 2004) and developing countries (freeze in 2016). It also include stricter limits on the
production of ODSs by developed countries for use in developing countries, as well as a
global phase-out of a new species Bromochloromethane (CH2BrCl) in 2002
What might have happened without the Montreal Protocol?
In the free market that existed before 1974, CFCs showed remarkable growth. At that date,
the combined production of CFCs was more than 800 000 t year-1
and had been growing at
10% every year for over two decades. Had the ozone depletion theory not been evinced by
Molina and Rowland in 1974 and had there not been a history of Antarctic ozone
measurements dating back to 1956, that enabled the ozone hole to be identified as a recurrent
phenomenon only a few years after the first spring in which significant depletion was
observed, the first signs might have been severe, sudden changes to the ozone distribution in
populated regions of the southern hemisphere.
Had the Antarctic ozone hole come as a surprise in the early 1990s with a global CFC ban in
2002 the ozone losses would have been more severe and have persisted well in the 22nd
century. But as it looks now, stratospheric halogen will return by the early 2050 to the levels,
which existed in the late 1970s, when the annual Antarctic ozone hole first became
discernible.

Greenhouse gas monitoring at the Zeppelin station, Svalbard, Norway - Annual report 2007 (TA-2480/2009)
59
Climate change and the Kyoto Protocol
This is arguably the next great environmental challenge to governments. The way that the
threat of climate change from the accumulation of greenhouse gases has been addressed by
international regulations bears some similarity to the negotiations of the Montreal Protocol
and the scientific assessment of the two processes share a common heritage. The concept that
atmospheric gases which absorb infrared radiation would affect the climate was already
suggested in 1909 by S. Arrhenius.
However, many years elapsed before the proposition was subjected to detailed examination.
Two WMO reports, one in 1981 “The stratosphere: Theory and measurements” and the
second in 1985 “Atmospheric ozone: assessment of our understanding of the processes
controlling its present distribution and changes” included the climatic implications of
increasing concentrations of greenhouse gases into assessments made by the Coordinating
Committee on the Ozone Layer for the Vienna Convention. These examined the physics of
the atmospheric effects of increasing greenhouse gases and ozone depletion. But the first
scientific reports that addressed all the implications, from the dynamics and possible detection
of climate change through to its potential impacts on society were those of the
Intergovernmental Panel on Climate Change in 1990. These reports provided the scientific
bases for the negotiations that resulted in the Rio Convention in 1991. This has the ultimate
objective of stabilisation of greenhouse gas concentrations in the atmosphere at a level that
would prevent dangerous anthropogenic interference with the climate system. The Rio
Convention bears the same relationship to climate change as the Vienna Convention to
ozone depletion; similarly, the more rigorous controls are contained in Protocols to the
Convention, the first of which is the Kyoto Protocol.
In order for a gas to be implicated in climate change, it must both absorb infrared radiation
and accumulate in the atmosphere. The first can be calculated relatively simply from its
infrared absorption spectrum and a model of the natural transmittance of infrared radiation
through the atmosphere. The second is a consequence of imbalance between the rate of
addition of a compound to the atmosphere – the source flux – and its rate of removal – its
atmospheric lifetime. Gases with long lifetimes like C2F6 (10 000 years) can accumulate in the
atmosphere even if their fluxes are relatively small. At the other extreme, a gas that has a
short lifetime can accumulate to relatively important concentrations, provided that its flux is
large enough. This is the case for tropospheric ozone that has a lifetime of a few weeks at the
earth‟s surface, but accounts for 15% of the calculated climate forcing, due to the very large
“secondary” flux arising from atmospheric reactions of hydrocarbons and oxides of nitrogen.
The most important primary atmospheric greenhouse gas is carbon dioxide (CO2), which
accounts for 55% of the increase in radiative forcing since pre-industrial times. Methane
(CH4) and nitrous oxide (N2O), together, are calculated to contribute 21% and halocarbons the
remaining 11%. The halocarbon contribution is expected to fall to 1.5% by the year 2050.
Carbon dioxide is, intrinsically, not a particularly powerful greenhouse gas but it has a very
long environmental lifetime, so that the influence of an emission persists for many hundreds
of years. Because of its position as the pre-eminent greenhouse gas, CO2 is the reference
compound against which the intrinsic effects of other greenhouse gases are judged, expressed
as the ratio of the radiative forcing effect of a release of one kilogram of the target compound
to the effect of a kilogram of CO2. The problem that the effect of CO2 changes with time has
been addressed by integrating its radiative forcing effect, as well as that of other greenhouse
gases, only up to a particular time horizon. The effect of this is to include progressively more
of the effect of CO2 as the time horizon lengthens, so that – as a general rule – GWPs

Greenhouse gas monitoring at the Zeppelin station, Svalbard, Norway - Annual report 2007 (TA-2480/2009)
60
decrease with longer time horizons. For most purposes, a time horizon of 100 years is used.
Halocarbons are effective absorbers of infrared radiation, so their GWPs are in the range of
several thousands. Consequently halocarbons in the form of hydrofluorocarbons and
perfluorocarbons have been included in the Kyoto protocol as a part of the “basket” of
greenhouse gases, emissions of which must be reduced. The other gases included are CO2,
CH4, N2O and sulphur hexafluoride (SF6).
A significant commitment under the Rio Convention was the provision of inventories of
national emissions of greenhouse gases. Secondary greenhouse gases, such as non-methane
hydrocarbons and oxides of nitrogen, that can generate tropospheric ozone, are also included
in the methodology of the emissions inventory. Using 1990 emissions as the baseline, the
“aggregate anthropogenic carbon dioxide equivalent emissions” of the greenhouse gases
described above must be reduced overall by at least 5% in the period 2008 to 2012. Carbon
dioxide equivalence is actually the mass of the emissions multiplied by the 100 year Global
Warming Potential of the gas concerned. The targets are, in fact, variable. The EU have
targets within the Kyoto Protocol of 8%, while the target for the USA is 7% and some nations
are allowed to increase releases of greenhouse gases - notably Australia, which is allowed an
8% increase. In recognition of the fact that, in 1990, emissions of the halocarbon greenhouse
gases not controlled by the Montreal Protocol were very small, 1995 is used as the base year
for HFCs, PFCs and SF6.
In conclusion The Montreal Protocol is beginning to have the desired effect – although unambiguous
detection of the beginning of the recovery of the ozone layer is expected to be well after the
maximum loading of ozone depleting gases – still talking about time frames of decades.
Although there is superficial similarity between the topics of ozone depletion and those of
climate change, and indeed much scientific interaction between the two, climate change has
much wider implications. The range of materials and activities to be considered in regulations
and the range of consequences are far larger for climate change and, because of the very long
lifetime of carbon dioxide, the timescale for recovery from any effect on climate is far longer.
Nevertheless, the Kyoto Protocol is an important first step.

Statlig program for forurensningsovervåking
Statens forurensningstilsyn (SFT)
Postboks 8100 Dep, 0032 Oslo - Besøksadresse: Strømsveien 96
Telefon: 22 57 34 00 - Telefaks: 22 67 67 06
E-post: [email protected] - Internett: www.sft.no
Utførende institusjon Norsk institutt for luftforskning (NILU)
ISBN-nummer 978-82-425-2058-6 (p)
978-82-425-2059-3 (e)
Oppdragstakers prosjektansvarlig Cathrine Lund Myhre
Kontaktperson SFT Harold Leffertstra
TA-nummer 2480/2009
År
2008
Sidetall 60
SFTs kontraktnummer 4008016
Utgiver Norsk institutt for luftforskning
NILU OR 02/2009
ISSN 0807-7207
Prosjektet er finansiert av Statens forurensningstilsyn (SFT) og Norsk institutt for
luftforskning (NILU).
Forfatter(e) C. Lund Myhre, O. Hermansen, A.M. Fjæraa, C. Lunder, N. Schmidbauer, K. Stebel (all NILU), J. Ström
(Norwegian Polar Institute), V.E. Cachorro Revilla (University of Valladolid)
Tittel - norsk og engelsk
Klimagassovervåking ved Zeppelinsobservatoriet – Årsrapport 2007
Greenhouse monitoring at the Zeppelin station Annual report 2007
Sammendrag – summary
Rapporten presenterer aktiviteter og måleresultater fra klimagassovervåkingen ved Zeppelinobservatoriet på
Svalbard for årene 2001-2007.
Overvåkingsprogrammet utføres av Norsk institutt for luftforskning (NILU) og er finansiert av Statens
forurensningstilsyn (SFT) og Norsk institutt for luftforskning (NILU).
The report summaries the activities and results of the greenhouse gas monitoring at the Zeppelin observatory
situated on Svalbard in Arctic Norway during the period 2001-2007.
The monitoring programme is performed by the Norwegian Institute for Air Research (NILU) and funded by the
Norwegian Pollution Control Authority (SFT) and Norwegian Institute for Air Research (NILU).
4 emneord Drivhusgasser, partikler, Arktis, halokarboner
4 subject words Greenhouse gases, aerosols, Arctic, halocarbons

Statens forurensningstilsyn
Postboks 8100 Dep,
0032 Oslo
Besøksadresse: Strømsveien 96
Telefon: 22 57 34 00
Telefaks: 22 67 67 06
E-post: [email protected]
www.sft.no
Statlig program for forurensningsovervåking omfatter
overvåking av forurensningsforholdene i luft og nedbør,
skog, vassdrag, fjorder og havområder.
Overvåkingsprogrammet dekker langsiktige undersøkelser
av:
overgjødsling
forsuring (sur nedbør)
ozon (ved bakken og i stratosfæren)
klimagasser
miljøgifter
Overvåkingsprogrammmet skal gi informasjon om
tilstanden og utviklingen av forurensningssituasjonen, og
påvise eventuell uheldig utvikling på et tidlig tidspunkt.
Programmet skal dekke myndighetenes
informasjonsbehov om forurensningsforholdene, registrere
virkningen av iverksatte tiltak for å redusere
forurensningen, og danne grunnlag for vurdering av nye
tiltak. SFT er ansvarlig for gjennomføringen av
overvåkningsprogrammet.
TA-2480/2009
ISBN 978-82-425-2058-6 (p)
978-82-425-2059-3 (e)