GREENHOUSE GAS INVENTORY AND FORECAST · PDF fileGREENHOUSE GAS INVENTORY AND FORECAST REPORT...
141
CITY OF WINNIPEG 2011 COMMUNITY GREENHOUSE GAS INVENTORY AND FORECAST WINNIPEG’S 2011 COMMUNITY GREENHOUSE GAS INVENTORY AND FORECAST REPORT DATE: MARCH 2015
Transcript of GREENHOUSE GAS INVENTORY AND FORECAST · PDF fileGREENHOUSE GAS INVENTORY AND FORECAST REPORT...

CITY OF WINNIPEG 2011 COMMUNITY GREENHOUSE GAS INVENTORY AND FORECAST
WINNIPEG’S 2011 COMMUNITY GREENHOUSE GAS INVENTORY AND FORECASTREPORT DATE: MARCH 2015

CITY OF WINNIPEG COMMUNITY 2011 GHG INVENTORY AND FORECAST
March 30, 2015 Report No. 13-1443-0010 i
Table of Contents
ACKNOWLEDGEMENTS .......................................................................................................................................................... 1
EXECUTIVE SUMMARY ........................................................................................................................................................... 3
1.0 INTRODUCTION ............................................................................................................................................................... 6
1.1 Terms of Reference ............................................................................................................................................. 6
1.2 Scope of Study .................................................................................................................................................... 6
1.3 Report Structure .................................................................................................................................................. 7
2.0 BACKGROUND ................................................................................................................................................................ 9
2.1 Community Profile ............................................................................................................................................... 9
2.2 Buildings ............................................................................................................................................................ 10
2.3 Transportation ................................................................................................................................................... 12
2.4 Waste ................................................................................................................................................................ 13
2.5 Water and Waste Water .................................................................................................................................... 14
3.0 METHODOLOGY ............................................................................................................................................................ 15
4.0 ENERGY AND GHG INVENTORY ................................................................................................................................. 17
4.1 General Approach.............................................................................................................................................. 17
4.2 Scope of Study .................................................................................................................................................. 17
4.3 Data Sources ..................................................................................................................................................... 18
4.4 Building Electricity and Natural Gas ................................................................................................................... 19
4.5 Transit ................................................................................................................................................................ 20
4.6 Vehicles ............................................................................................................................................................. 20
4.7 Waste Disposal .................................................................................................................................................. 21
4.8 Water and Waste Water .................................................................................................................................... 21
4.9 GHG Emissions Summary ................................................................................................................................. 22
4.10 Comparison with Other Municipalities ................................................................................................................ 23
4.11 Comparison with Previous Inventories ............................................................................................................... 25
5.0 ENERGY AND GHG FORECASTS ................................................................................................................................ 29
5.1 General Approach.............................................................................................................................................. 29
5.2 Community Trends ............................................................................................................................................ 29

CITY OF WINNIPEG COMMUNITY 2011 GHG INVENTORY AND FORECAST
March 30, 2015 Report No. 13-1443-0010 ii
5.3 Climate Impacts ................................................................................................................................................. 30
5.4 Land Use Implications ....................................................................................................................................... 31
5.5 Business as Usual Scenario .............................................................................................................................. 34
5.5.1 Description ................................................................................................................................................... 34
5.5.2 Assumptions ................................................................................................................................................ 34
5.5.2.1 Land Use .................................................................................................................................................. 34
5.5.2.2 Building Electricity and Natural Gas .......................................................................................................... 35
5.5.2.3 Transit ....................................................................................................................................................... 37
5.5.2.4 Vehicles .................................................................................................................................................... 37
5.5.2.5 Waste Disposal ......................................................................................................................................... 38
5.5.2.6 Water and Waste Water ........................................................................................................................... 39
5.5.3 Results ......................................................................................................................................................... 40
5.6 OurWinnipeg Scenario ....................................................................................................................................... 42
5.6.1 Description ................................................................................................................................................... 42
5.6.2 Assumptions ................................................................................................................................................ 43
5.6.2.1 Land Use .................................................................................................................................................. 43
5.6.2.2 Building Electricity and Natural Gas .......................................................................................................... 46
5.6.2.3 Transit ....................................................................................................................................................... 48
5.6.2.4 Vehicles .................................................................................................................................................... 48
5.6.2.5 Waste Disposal ......................................................................................................................................... 49
5.6.2.6 Water and Waste Water ........................................................................................................................... 50
5.6.3 Results ......................................................................................................................................................... 51
5.7 Low Carbon Path Scenario ................................................................................................................................ 53
5.7.1 Description ................................................................................................................................................... 53
5.7.2 Assumptions ................................................................................................................................................ 53
5.7.2.1 Land Use .................................................................................................................................................. 53
5.7.2.2 Building Electricity and Natural Gas .......................................................................................................... 54
5.7.2.3 Transit ....................................................................................................................................................... 57
5.7.2.4 Vehicles .................................................................................................................................................... 57
5.7.2.5 Waste Disposal ......................................................................................................................................... 58
5.7.2.6 Water and Waste Water ........................................................................................................................... 59

CITY OF WINNIPEG COMMUNITY 2011 GHG INVENTORY AND FORECAST
March 30, 2015 Report No. 13-1443-0010 iii
5.7.3 Results ......................................................................................................................................................... 60
5.8 Summary of Forecast GHG Emissions .............................................................................................................. 62
6.0 ANALYSIS OF EMISSION REDUCTION OPPORTUNITIES ......................................................................................... 66
6.1 Land Use and Buildings ..................................................................................................................................... 67
6.2 Transportation ................................................................................................................................................... 69
6.3 Waste, Water and Wastewater .......................................................................................................................... 72
6.4 Summary of Emission Reduction Opportunities ................................................................................................ 74
7.0 RECOMMENDED FURTHER ACTIONS ........................................................................................................................ 76
8.0 REPORT LIMITATIONS ................................................................................................................................................. 83
9.0 WORKS CITED ............................................................................................................................................................... 84
10.0 CLOSURE ....................................................................................................................................................................... 86
TABLES
Table 1: City of Winnipeg Housing Mix (2011) [2] .................................................................................................................... 11
Table 2: Community Sectors and ICLEI Activities .................................................................................................................... 17
Table 3: Energy and GHG Inventory Data Sources ................................................................................................................. 18
Table 4: Summary of GHG Emissions ..................................................................................................................................... 22
Table 5: Data Sources for Other Municipalities ........................................................................................................................ 23
Table 6: Previous Inventories Results ...................................................................................................................................... 26
Table 7: Comparison of Previous Inventories to 2011 Inventory, By Source ........................................................................... 26
Table 8: Comparison of Natural Gas and Electricity Emissions from Previous Inventories to 2011 Inventory, By Sector (Total Consumption) ................................................................................................................................................ 28
Table 9: Comparison of Natural Gas and Electricity Emissions from Previous Inventories to 2011 Inventory, By Sector (Percentage) ........................................................................................................................................................... 28
Table 10: Community Trend Input Values ................................................................................................................................ 30
Table 11: Historical Natural Gas Consumption in the City of Winnipeg .................................................................................... 30
Table 12: Contrasting Traditional and Low Carbon Land Use Strategies ................................................................................. 33
Table 13: Business as Usual Scenario – Building and Land Use Key Indicators ..................................................................... 35
Table 14: Business as Usual Scenario – Building Electricity and Natural Gas Key Indicators ................................................. 36
Table 15: Business as Usual Scenario – Transit Key Indicators .............................................................................................. 37
Table 16: Business as Usual Scenario – Vehicle Key Indicators ............................................................................................. 38
Table 17: Business as Usual Scenario – Waste Disposal Key Indicators ................................................................................ 39
Table 18: Business as Usual Scenario – Water and Waste Water Key Indicators ................................................................... 39

CITY OF WINNIPEG COMMUNITY 2011 GHG INVENTORY AND FORECAST
March 30, 2015 Report No. 13-1443-0010 iv
Table 19: Business as Usual Scenario Results ........................................................................................................................ 40
Table 20: Business as Usual Scenario Emission Changes ...................................................................................................... 41
Table 21: OurWinnipeg Scenario –Land Use Key Indicators ................................................................................................... 45
Table 22: OurWinnipeg Scenario – Building Electricity and Natural Gas Key Indicators .......................................................... 47
Table 23: OurWinnipeg Scenario – Transit Key Indicators ....................................................................................................... 48
Table 24: OurWinnipeg Scenario – Vehicle Key Indicators ...................................................................................................... 49
Table 25: OurWinnipeg Scenario – Waste Disposal Key Indicators ......................................................................................... 50
Table 26: OurWinnipeg Scenario – Water and Waste Water Key Indicators ........................................................................... 50
Table 27: OurWinnipeg Scenario Results ................................................................................................................................ 51
Table 28: OurWinnipeg Scenario Emission Changes .............................................................................................................. 52
Table 29: Low Carbon Path Scenario – Building and Land Use Key Indicators ....................................................................... 54
Table 30: Low Carbon Path Scenario – Building Electricity and Natural Gas Key Indicators ................................................... 56
Table 31: Low Carbon Path Scenario – Transit Key Indicators ................................................................................................ 57
Table 32: Low Carbon Path Scenario – Vehicle Key Indicators ............................................................................................... 58
Table 33: Low Carbon Path Scenario – Waste Disposal Key Indicators .................................................................................. 59
Table 34: OurWinnipeg Scenario – Water and Waste Water Key Indicators ........................................................................... 59
Table 35: Low Carbon Path Scenario Results .......................................................................................................................... 60
Table 36: Low Carbon Path Scenario Emission Changes ........................................................................................................ 61
Table 37: Comparison of Scenario Results .............................................................................................................................. 62
Table 38: Land Use and Buildings Emission Reduction Opportunity Assessment ................................................................... 67
Table 39: Transportation Emission Reduction Opportunity Assessment .................................................................................. 69
Table 40: Waste, Water and Wastewater Emission Reduction Opportunity Assessment ........................................................ 72
FIGURES
Figure 1: Summary of Emission Reduction Opportunities .......................................................................................................... 5
Figure 2: Forecasted Population Growth [1] ............................................................................................................................... 9
Figure 3: Summary of GHG Emissions .................................................................................................................................... 22
Figure 4: Comparison of GHG Emissions per Capita by City ................................................................................................... 24
Figure 5: Comparison of GHG Emissions per Capita by Key Sectors ...................................................................................... 24
Figure 6: City of Winnipeg HDD vs. Natural Gas Consumption (2007/2008 to 2012/2013 Fiscal Years) ................................. 31
Figure 7: Typical Municipal Density Progression, Complete Communities [6] .......................................................................... 32
Figure 8: Business as Usual Scenario Results ......................................................................................................................... 40
Figure 9: OurWinnipeg Land Use Plan [6] ................................................................................................................................ 44

CITY OF WINNIPEG COMMUNITY 2011 GHG INVENTORY AND FORECAST
March 30, 2015 Report No. 13-1443-0010 v
Figure 10: OurWinnipeg Transit System Plan [8] ..................................................................................................................... 45
Figure 11: OurWinnipeg Scenario Results ............................................................................................................................... 51
Figure 12: Low Carbon Path Scenario Results ........................................................................................................................ 60
Figure 13: Comparison of 2031 Scenario Results .................................................................................................................... 63
Figure 14: Comparison of All Scenarios Results ...................................................................................................................... 64
Figure 15: Comparison of 2050 Scenario Results .................................................................................................................... 65
Figure 16: Summary of OurWinnipeg Emission Reduction Opportunities ................................................................................ 74
Figure 17: Summary of Low Carbon Path Emission Reduction Opportunities ......................................................................... 75
APPENDICES
APPENDIX A GHG Inventory Calculation Methodology
APPENDIX B Forecast Methodology
APPENDIX C Key Indicators to Track
APPENDIX D Low Carbon Path Workshop Outcomes, May 30, 2014
APPENDIX E Forecast Scenario Indicators

CITY OF WINNIPEG COMMUNITY 2011 GHG INVENTORY AND FORECAST
March 30, 2015 Report No. 13-1443-0010 1
ACKNOWLEDGEMENTS This Plan was financed by the City of Winnipeg. Golder Associates was responsible for
overall project management, analysis, strategic planning, and policy development with
considerable contributions from the City’s Project Steering Committee. The Plan
benefitted from significant guidance and input from community stakeholders and City
staff.
City Contributing Divisions
Core Project Team – Urban Planning Division
Planning, Property, and Development
Transportation Division
Public Works
Winnipeg Transit
Solid Waste, Water, & Wastewater Division
Water & Waste Division
Infrastructure Planning Division
Corporate Finance
Low Carbon Path Workshop Attendees
50 by 30
Manitoba Chapter, Canada Green Building Council
Manitoba Geothermal Alliance
Manitoba Home Builders Association
Manitoba Hydro
Manitoba Trucking Association
Province of Manitoba
Province of Manitoba
Richardson College for the Environment
Social Planning Council of Winnipeg

CITY OF WINNIPEG COMMUNITY 2011 GHG INVENTORY AND FORECAST
March 30, 2015 Report No. 13-1443-0010 2
University of Manitoba
Urban Development Institute
Winnipeg Realtor’s Association
Workplace Commuter Options, Green Action Centre
Golder Associates Team
James Allen Project Manager
Rachel Wyles Senior Inventory Specialist
Michael Lindgren Inventory Specialist
Curt Hull Local Engagement and Technical Support Specialist, Curt Hull
Consulting
Micah Lang Policy Analyst, Blue Cedar Ventures Inc.
Jeff Ramkellawan Inventory Specialist
Joel Pipher Planner
Derek De Biasio Senior Engagement Specialist
Daniella Fergusson Engagement Specialist
Aaron Licker GIS and Transportation Specialist
Alex Boston Senior Policy Analyst
Sean Tynan Policy Analyst
Margo Shaw Project Coordinator
Mark Greenhill Senior Energy Engineer

CITY OF WINNIPEG COMMUNITY 2011 GHG INVENTORY AND FORECAST
March 30, 2015 Report No. 13-1443-0010 3
EXECUTIVE SUMMARY The City of Winnipeg recognizes that climate change is a serious global environmental
problem and thus endorsed A Sustainable Winnipeg, emphasizing a commitment to a
6% reduction in community emissions below 1998 levels. This commitment did not
include a target year. Council has correspondingly committed to the development of a
community Climate Action Plan including recommendations on how to achieve the 6%
target. Although Council has established a target, OurWinnipeg does not provide
specific guidance on how this target would be achieved.
In support of the carbon reduction strategy, the City of Winnipeg worked with Golder to
provide an updated community energy and greenhouse gas inventory, and to forecast
the energy and emission reductions that are likely to occur in Winnipeg as a while
under three illustrative scenarios:
Business as Usual Scenario: Depicts the likely emissions future should
Winnipeg continue to grow as it has in the recent past, but in accordance with
current market forecasts. Recent policy goals and targets associated with
OurWinnipeg and related strategies are not considered.
OurWinnipeg Scenario: Depicts the concerted implementation of measurable
policies and actions adopted with OurWinnipeg that are likely to impact
Winnipeg’s energy use and greenhouse gas emissions. This scenario is guided
by numerous recent strategies including A Sustainable Winnipeg, Completed
Communities, the Transportation Master Plan, and the Garbage and Recycling
Master Plan.
Low Carbon Path Scenario: Depicts a series of outcomes leading to more
significant reductions in community-wide energy consumption and greenhouse
gases that are ambitious, yet achievable. This scenario presumes a desire to
implement and lead world class reduction commitments that are ambitious, yet
achievable.
All three scenarios incorporate the impact of adopted senior government regulations
such as new vehicle efficiency standards and the Manitoba Energy Code for Buildings.
Golder undertook a review of the previously compiled 1994 and 1998 community wide
energy and emissions inventory and produced a comprehensive inventory for 2011
using best practice accounting standards. Previous inventories were created with data
and methods that are not compatible with modern reporting methods. Thus,
comparisons between these inventories and the new comprehensive inventory for
2011 are difficult and may not necessarily reflect an accurate depiction of the changes
in Winnipeg GHG emissions.

CITY OF WINNIPEG COMMUNITY 2011 GHG INVENTORY AND FORECAST
March 30, 2015 Report No. 13-1443-0010 4
Under the Business as Usual Scenario, it was estimated that Winnipeg’s GHG
emissions would increase 2% by 2031 and 0.2% by 2050. This is primarily associated
with increases in population competing with effects such as federal tailpipe emission
standards, Manitoba Hydro demand-side management conservation programs, and
increases in building energy efficiency due to newer technology.
Under the OurWinnipeg Scenario, more substantial reductions would occur, with GHG
emissions declining 6% by 2031 and 11% by 2050. Although overall GHG emission
reductions are not as prominent after 2031, projected increases in population translate
to significant reductions in per capita emissions up to 2050. Above and beyond the
reductions seen in the Business as Usual Scenario, GHG reductions are most
significantly associated with increased diversion of organic waste, mitigation of landfill
gas, expanded public transit and cycling lanes, and a shift toward multi-unit residential
buildings.
Under the Low Carbon Path Scenario, emissions would decline 21% by 2031 and 35%
by 2050. This is primarily due to aggressive City policies such as promotion of infill,
multi-unit residential buildings, building-scale renewables, district energy systems, and
electric vehicles. As population is forecasted to increase, overall decreases in GHG
emissions represent sharp reductions in per capita emissions in this scenario.
Emission reduction opportunities beyond those currently pursued in the OurWinnipeg
planning initiative were developed and analyzed as a part of the Low Carbon Path
Scenario. Key opportunities include:
Emphasis on development of highly walkable, transit-friendly, mixed-use
complete communities;
Pursuit of infill development as a primary growth strategy;
Promotion of modest growth in building-scale renewable energy and district
energy systems;
Completion of the rapid transit network and improvement of transit service;
Completion of active transportation network and promotion of alternative
transportation options;
Increased uptake of electric and low-emission vehicles, including partial
electrification of the transit fleet;
Enhancement of Garbage and Recycling Master Plan through increased
composting and diversion;
Expansion of landfill gas collection system for non-City landfills; and,
Elimination of biosolid landfilling.

CITY OF WINNIPEG COMMUNITY 2011 GHG INVENTORY AND FORECAST
March 30, 2015 Report No. 13-1443-0010 5
A summary of the impact of the emission reduction opportunities is shown below in
Figure 1, with each emission reduction opportunity shown as having an incremental
reduction in City emissions.
Figure 1: Summary of Emission Reduction Opportunities

CITY OF WINNIPEG COMMUNITY 2011 GHG INVENTORY AND FORECAST
March 30, 2015 Report No. 13-1443-0010 6
1.0 INTRODUCTION
1.1 Terms of Reference Golder Associates Ltd. (Golder) was contracted by the City of Winnipeg (the City) to
develop a community greenhouse gas inventory and forecast for the City of Winnipeg.
The City of Winnipeg Community Greenhouse Gas Inventory, Forecast and Emission
Reduction Opportunity Assessment has been conducted in accordance to the scope of
work outlined in RFP No 631-2012, subsequent addenda and detailed in the Golder
Proposal dated October 17, 2012.
1.2 Scope of Study The City of Winnipeg recognizes that climate change is a serious global environmental
problem resulting from the accumulation of greenhouse gases (GHG) in the
atmosphere. Recognizing the importance of dealing with climate change, on November
25, 1998, the City of Winnipeg committed to the Federation of Canadian Municipalities
(FCM) Partners for Climate Protection (PCP) program. The (PCP) program is a
network of Canadian municipal governments, representing more than 80 per cent of
the Canadian population, that have committed to reducing greenhouse gases (GHG)
and to acting on climate change.
Winnipeg’s commitment to reduce GHG emissions is emphasized in the City’s
sustainability strategy – A Sustainable Winnipeg. This sustainability strategy is part of
the City’s OurWinnipeg planning initiative. To achieve significant energy conservation
and GHG reductions in the community, the development of a climate action plan with a
vision, overarching and sector-specific goals, policies, and actions are proposed. The
City’s overarching goals include:
a) The intensification of energy and emissions policies and actions undertaken by
the City within its sphere of influence as a local government;
b) Engagement with senior governments on realistic policies and measures within
their sphere of influence; and,
c) Pursuit of Council’s 6% reduction target in community-wide emissions from
1998 levels.
In support of the carbon reduction strategy, the City of Winnipeg worked with Golder to
develop a community GHG inventory, emission forecasts and an emission reduction
opportunity assessment. The objectives of the strategy are to:
a) Develop a robust measurement of Winnipeg’s community greenhouse gas
emissions inventory and key performance indicators.
b) Perform careful and scientifically defensible analyses and forecasts of the
energy and emissions impact that consider:
1) Relevant proposed or adopted local and senior government policy and
actions;
In support of the carbon reduction strategy, the City of Winnipeg worked with Golder to develop a community GHG inventory, emission forecasts and an emission reduction opportunity assessment.

CITY OF WINNIPEG COMMUNITY 2011 GHG INVENTORY AND FORECAST
March 30, 2015 Report No. 13-1443-0010 7
2) Future changes in community land use, transportation, waste and
wastewater management corresponding to the direction established by the
City’s development plan, OurWinnipeg, and supporting strategies;
3) Additional opportunities pertaining to the carbon reduction experience in
other cities; and,
4) Additional opportunities developed through consultation with Council, City
staff, stakeholders, and the broader community.
c) Model a low carbon path and fine-tune strategies to achieve a balance of
emission reductions with efficient efforts across each sector.
d) Create a public-facing technical report summarizing all findings.
The geographic scope of the study is limited to energy consumed and greenhouse
gases generated within the City of Winnipeg city limits, with the exception of City of
Winnipeg waste landfilled outside of the city limits.
The following report summarizes the findings of the study.
1.3 Report Structure The Plan is organized into seven sections:
Section 1: Introduction describes the scope of the study and outlines the report
structure.
Section 2: Background provides a profile of the City energy and emissions and
examines local regional climate and energy context for the Plan.
Section 3: Methodology presents the overall study methodology and data sources
used in the preparation of this study.
Section 4: Energy and GHG Inventory describes the community GHG forecast for
the City of Winnipeg for the 2011 calendar year by source.
Section 5: Energy and GHG Forecasts provides community GHG forecasts for the
2020, 2031 and 2050 calendar years corresponding with three development scenarios.
Section 6: Analysis of GHG Emission Reduction Opportunities evaluates a
selection of GHG reduction policy actions for their overall impact on community GHG
emissions.
Section 7: Recommended Further Actions details suggested steps that the City of
Winnipeg could consider toward developing their current carbon reduction strategy.
Section 8: Report Limitations details the stated limitations of the use of this report,
inventory and forecast.

CITY OF WINNIPEG COMMUNITY 2011 GHG INVENTORY AND FORECAST
March 30, 2015 Report No. 13-1443-0010 8
Section 9: Works Cited provides a list of documents where information and data is
referenced from in this report.
Section 10: Closure provides a sign-off of the report by the Golder project team.

CITY OF WINNIPEG COMMUNITY 2011 GHG INVENTORY AND FORECAST
March 30, 2015 Report No. 13-1443-0010 9
2.0 BACKGROUND
2.1 Community Profile Winnipeg, the largest city in Manitoba, serves as the capital of the province. Winnipeg
experiences a continental climate with hot summers and cold winters. A multiethnic
modern municipality and regional centre, the community has diverse economy based
on manufacturing, service, government, and trade.
With a 2011 city population of over 690,000, Winnipeg is currently experiencing rapid
population growth. After a flat growth period in the 80s and 90s, the City experienced a
rapid population growth driven by immigration and migration from the rest of Canada.
This growth is forecasted to continue at 9,000 to 10,000 new residents per year over
the next 20 years, shown in Figure 2.
Figure 2: Forecasted Population Growth [1]
Winnipeg obtains both electricity and natural gas from Manitoba Hydro – the provincial
energy utility. Electricity rates in Manitoba, Winnipeg included, are some of the lowest
in the country and natural gas prices are on par with the rest of the country. Manitoba
generates electricity almost exclusively from hydroelectric, with small amounts of
thermal power used for peaking and backup loads. As a result, Winnipeg has very low
greenhouse gas emissions associated with electricity consumption.
Winnipeg serves a regional transportation hub with a broad transportation system that
includes a large network of surface streets, rail service and an international airport.
The road transportation system consists of a large ring road – the Perimeter Highway –
The City of Winnipeg at a Glance
Population
(2011): 691,800
Projected
Population
(2031): 876,700
Jobs in Winnipeg
(2011): 392,640
Projected Jobs
(2031): 489,600
Per Capita GHG
Emissions in
Winnipeg (2011):
7.59 tonnes
CO2e/person/year

CITY OF WINNIPEG COMMUNITY 2011 GHG INVENTORY AND FORECAST
March 30, 2015 Report No. 13-1443-0010 10
that connects to the Trans-Canada highway as well as other provincial highways.
Within the city, several major arterial roads provide high-volume vehicle roadways that
service the city. Adjacent to the airport and within city limits, the City operates
CentrePort Canada, an inland port for trucking routes, rail carriers and air cargo.
Public Transit in Winnipeg is operated by Winnipeg Transit. Winnipeg Transit is a bus-
based system, and in recent years has begun to implement measures to optimize
operation, including transit priority signals, diamond lanes for transit, and BRT (bus
rapid transit). Winnipeg Transit has a fleet of approximately 580 buses on 95 routes
within the city. Winnipeg Transit's first segment of BRT, Phase 1 of the Southwest
Transitway, opened in 2012. 13 routes make use of the corridor. A second phase of
this line is in the process of being planned to extend service to the University of
Manitoba, and 5 additional legs of rapid transit are ultimately anticipated.
The City of Winnipeg operates one active landfill for disposal of solid waste: the Brady
Road Resource Management Facility, also known as the Brady Road Landfill. The
landfill accepts waste from residential, industrial/commercial, construction/demolition,
and city operation sources. Recycling and composting can also be done at the landfill
for items such as yard waste, scrap metal, bicycles, batteries, and used tires. The
Brady Road Resource Management Facility operates a landfill gas collection system.
Additional private landfills are operated in proximity to the City of Winnipeg and receive
commercial, industrial, construction and demolition waste from Winnipeg.
Potable water for Winnipeg comes from Shoal Lake and is stored at the Deacon
Reservoir. Before being delivered to the end users, potable water goes through a
treatment process. Wastewater is collected in sewer systems and septic tanks and the
majority of it is treated in the North End Water Pollution Control Centre, with the
remainder treated by the West End Water Pollution Control Centre and the South End
Water Pollution Control Centre.
The following sub-sections provide additional detail with respect to community factors
influencing greenhouse gas emissions in key areas.
2.2 Buildings With a significant percentage of overall residential building stock dedicated to single
family housing, the City of Winnipeg is one of the lowest density cities in Canada,
outside of Alberta. Greenfield development continues to represent a majority of overall
community growth; while the downtown core of Winnipeg is the major centre of
employment in the City, but has limited residential buildings within the core itself.
However, the core of Winnipeg is experiencing a re-vitalization with increased focus on
infill development and promotion of residential growth closer to the city core.
The use of electricity and natural gas by residential buildings constitutes the largest
share of energy and greenhouse gas (GHG) emissions in the buildings sector. In

CITY OF WINNIPEG COMMUNITY 2011 GHG INVENTORY AND FORECAST
March 30, 2015 Report No. 13-1443-0010 11
commercial and residential buildings, electricity is used for heating/hot water, lighting
and appliances, and natural gas for space heating and heating hot water. The key
factors affecting energy use in residential and commercial buildings are:
Building type and size;
Building energy efficiency, influencing energy consumption; and,
Energy sources – e.g., hydro-electricity, natural gas, solar thermal.
Climate plays a major factor in building energy use. Winnipeg experiences hot
summers and cold winters, leading to a high air conditioning load in the summer and
high heating load in the winter. Buildings in Winnipeg also experience significant solar
exposure as the weather is often sunny. Thus, the addition of solar water heaters may
be an increasingly viable method of reducing energy consumption.
Housing type can influence residential building energy use. Typically, attached and
multi-unit residential buildings tend to consume less energy per unit floor area than
detached buildings due to shared walls and fewer exposed surfaces. Although this is
not always the case because of factors such as differences in construction standards,
empirical data suggests that, on average, energy use per person is significantly lower
(up to 48%) for apartment towers compared to single-family residences. On a
municipal basis, this means that higher density development reduces building energy
consumption and GHG emissions when compared to single family homes.
Table 1 below presents the overall breakdown of single family and multi-unit residential
buildings in 2011.
Table 1: City of Winnipeg Housing Mix (2011) [2]
Residential Building Type
Household Count Percentage
Single Family 184,740 63%
Multi-Unit Residential Buildings
106,575 37%
Another important factor in energy use in buildings is the age of the building. Based on
Canadian EnerGuide assessments, on average the older the home, the higher the
energy consumption (based on a per-area basis). Given limited growth in City
population since 1990, the average building age in Winnipeg is older than in similar
prairie cities that have had more consistent growth patterns. Recently, the province of
Manitoba has adopted the 2010 National Model Construction Codes which have
provisions for increased energy efficiency for new construction. Over time, the
implementation of the new building code will gradually reduce building per capita
energy and GHG intensities.

CITY OF WINNIPEG COMMUNITY 2011 GHG INVENTORY AND FORECAST
March 30, 2015 Report No. 13-1443-0010 12
While the energy efficiency of individual devices and appliances continues to improve,
the adoption of new and emerging technologies such as smart phones, tablets, PVRs
and personal computers lead to increased electricity consumption per capita. As
personal consumer electronics continue to grow in availability and popularity, these
trends will likely continue.
Winnipeg obtains both electricity and natural gas from Manitoba Hydro – the provincial
utility. Manitoba generates electricity almost exclusively from hydroelectric, with small
amounts of thermal and wind power. Future expansion of Manitoba Hydro hydroelectric
assets would suggest that low-carbon hydroelectricity will continue to represent that
vast majority of electricity provided to the City of Winnipeg. Winnipeg does import
some fossil energy from the regional network, which has a significant impact on
electricity emissions in years of drought.
Within the City of Winnipeg, a limited number of buildings use geothermal building-
scale renewables to displace natural gas use. Building-scale renewables have fewer
GHG emissions than natural gas use for heating. Building-scale renewables for
electricity generation would not have the same benefit due to the low electricity cost
and GHG emissions in Winnipeg.
District energy systems are one of the most efficient forms for heating commercial and
multi-unit residential buildings. Conversion from fuel to heat is done at one centralized
site instead as opposed to in each building or home. In addition, district energy system
often can capture waste heat, increasing the overall efficiency. Because one large
system is used to serve the needs of many customers, fuel type is very flexible in
district energy systems, with systems having the ability to use conventional fuels such
as natural gas, or renewables. Currently, the City has very few district energy systems
in operation, limited to several residential complexes and a few other applications,
including the Manitoba Hydro building downtown and the University of Manitoba district
waste heat recovery system.
2.3 Transportation Personal vehicle travel is the predominant mode of transportation in the City of
Winnipeg, representing 81% of total weekday trips. Primary factors influencing the
relatively high mode share associated with personal vehicle travel include the relatively
low-density across much of the City, and the distances between people’s homes and
their daily destinations (i.e., work, school, shopping, and areas of recreation). Within
this context, cold winter temperatures only further discourage active and alternative
modes of transportation.
Compact, mixed-use development that is focused around direct transit routes creates
urban form that increases liveability of neighbourhoods and accessibility to daily
destinations and amenities, while decreasing resource use and greenhouse gas

CITY OF WINNIPEG COMMUNITY 2011 GHG INVENTORY AND FORECAST
March 30, 2015 Report No. 13-1443-0010 13
emissions associated with transportation. To help the City move towards this type of
urban form, Winnipeg has created neighbourhood and community plans; however,
Winnipeg’s current densities, land use mix, and transportation network limit low carbon
transportation alternatives.
A mixed land use provides nearby options for working, shopping, school, and
recreation that, as a result, decrease auto dependency. Winnipeg’s City Centre and
key redevelopment areas are becoming increasingly walkable with a diversity of key
destinations. However, these destinations are not necessarily easily accessible by
transit, walking, and cycle by a significant portion of residents, especially those living at
the City peripheries.
2.4 Waste Community waste generation rates in Winnipeg are similar to other Canadian
municipalities with a mix or inorganic and organic waste. The City operates city-wide
collection service with traditional waste collection and a blue-box recycling program for
non-organics. Organics recycling is planned as a part of the City of Winnipeg Garbage
and Recycling Master Plan, but is currently limited to a yard waste collection program
and voluntary composting facilities operating throughout the community. Residential
and some commercial/institutional waste is currently sent to and disposed at the Brady
Resource Recovery Centre. Additional commercial, industrial and construction waste is
collected by private landfills operated within or near the City of Winnipeg boundaries.
While waste generation is similar to other Canadian cities, diversion rates have been
comparatively poor in Winnipeg. This has been improving with the adoption of the
Garbage and Recycling Master Plan.
For accounting purposes under the ICLEI protocol, all landfill emissions related to the
decomposition of waste generated in the City of Winnipeg are assumed to be
attributable to the community, regardless of whether the landfill is located within the
community boundaries. Greenhouse gas emissions from the solid waste sector are
calculated using a “methane commitment” approach, where Scope 3, indirect
emissions, that occur outside the geographic boundaries of the City are included in the
City’s inventory. The methane commitment method attributes all future emissions to
the year in which the waste was produced. The main advantage of using the methane
commitment method is that it provides results that are comparable to the estimated
emissions avoided by reduce, reuse, and recycle programs. For example, reducing the
amount of waste produced avoids all emissions that would have been released over
the lifetime of the waste's decomposition.
Since landfill GHG emissions are due primarily to organic waste, the amount of organic
waste sent to the landfill is the primary factor in landfill emissions. Traditional landfill
gas is formed from the decomposition of organic wastes which is then released
uncontrolled to the atmosphere. In 2013, the City of Winnipeg constructed and began

CITY OF WINNIPEG COMMUNITY 2011 GHG INVENTORY AND FORECAST
March 30, 2015 Report No. 13-1443-0010 14
operation of a landfill gas system at the Brady Resource Recovery Centre that
captures a large percentage of the landfill’s methane emissions and converts them
through combustion to the less impactful carbon dioxide, reducing the life-cycle GHG
intensity of the landfill by up to 80%.
2.5 Water and Waste Water GHG emissions from waste treatment primarily result from the production of biogas
from sludge digestion and waste water decomposition. The City currently operates
three waste water treatment plants: the North End Water Pollution Control Centre; the
South End Water Pollution Control Centre, and West End Sewage Pollution Control
Centre.
Currently, the waste water plants produce biosolids which are either composted or
landfilled. The City is currently working to increase the percentage of biosolids either
composted or sold for beneficial usage as fertilizer or soil conditioner. Biosolids were
100% landfilled in 2011; however, a composting trial is scheduled to begin in 2015.
The biogas produced is collected and stored for use as heating or alternatively,
combusted to carbon dioxide when no heating load is present.

CITY OF WINNIPEG COMMUNITY 2011 GHG INVENTORY AND FORECAST
March 30, 2015 Report No. 13-1443-0010 15
3.0 METHODOLOGY For this study, the inventory and forecasts were developed through active engagement
between the City and key stakeholders, rigorous analysis, and innovative policy and
planning. Briefly, the approach involved the following steps:
Data Collection
A first step of the process was data collection and analysis. Data was requested from a
variety of sources, including the City of Winnipeg, Manitoba Hydro, Manitoba Public
Insurance and the James Armstrong Richardson Airport. Data sources used in the
inventory are discussed in more detail in Section 4.3. Note that the James Armstrong
Richardson Airport was not able to provide any GHG data.
GHG Inventory Development
The next step was the development of a GHG Inventory representing the current
activities in the City, using 2011 data. This inventory was created following the ICLEI
protocol for accounting and reporting greenhouse gas emissions for communities [3].
The GHG Inventory provided a baseline understanding of current emissions
performance within the City.
Business as Usual and OurWinnipeg Scenario Development
A Business as Usual forecast was created to show the likely emissions future in the
absence of municipal intervention through the policy commitments and action
statements associated with OurWinnipeg and its supporting strategies. An
OurWinnipeg forecast was developed based on the expected maximum potential of the
City’s OurWinnipeg planning blueprint. The OurWinnipeg forecast represents the likely
emissions future based on the City’s current plans for growth and management.
Forecasts were created for 2020, 2031, and 2050. Both scenarios used identical
population forecasts, based on the Conference Board of Canada report on the
Winnipeg CMA [1]. As the Conference Board of Canada only had values up to 2035,
forecasts were extrapolated to 2050.
Low Carbon Path Scenario Development
To identify key areas of opportunity for new emission reductions and their expected
impact, a Low Carbon Path was considered. The Low Carbon Path will likely require
community, local and senior government leadership, including the adoption of new
commitments extending beyond the present scope of OurWinnipeg and its supporting
strategies.
On May 30th, 2014, the City met with key stakeholders to identify high level strategies
and priorities to inform a potential Low Carbon Path for the City. Participants
suggested and ranked a number of community-based actions and initiatives which
could be enacted to realize emission reductions in Winnipeg. Low carbon emission
reduction opportunities were then analyzed for economic, technical, and political

CITY OF WINNIPEG COMMUNITY 2011 GHG INVENTORY AND FORECAST
March 30, 2015 Report No. 13-1443-0010 16
feasibility. Using the refined list of ideas for a low carbon strategy, a Low Carbon Path
forecast was developed for the City to determine the potential reductions in GHGs.
Forecast were created for 2020, 2031, and 2050. Population forecasts used were
identical to the Business as Usual and OurWinnipeg Scenarios. Appendix D contains
a summary of the ideas generated in the Low Carbon Path Workshop breakout
sessions.
Looking Forward
Recommendations for the creation of a Climate Action Plan were put together to assist
the City in their task of guiding Winnipeg toward a green and sustainable future.

CITY OF WINNIPEG COMMUNITY 2011 GHG INVENTORY AND FORECAST
March 30, 2015 Report No. 13-1443-0010 17
4.0 ENERGY AND GHG INVENTORY
4.1 General Approach The inventory was created following the 2012 “U.S. Community Protocol for
Accounting and Reporting of Greenhouse Gas Emissions”, developed by ICLEI – Local
Governments for Sustainability USA [3]. The standard was designed to guide local
governments in the accounting and reporting of greenhouse gas (GHG) emissions
associated with communities.
The protocol includes guidance on scoping, and lists the five ICLEI basic emission-
generating activities that must be included in all GHG emission reports:
Use of Electricity by the Community
Use of Fuel in Residential and Commercial Stationary Combustion Equipment
On-Road Passenger and Freight Motor Vehicle Travel
Use of Energy in Potable Water and Wastewater Treatment and Distribution
Generation of Solid Waste by the Community
For more details on the methodology used, please refer to Appendix A.
4.2 Scope of Study A summary of the community sectors included within the City of Winnipeg Energy and
GHG Inventory is presented in Table 2, along with corresponding ICLEI activities.
Table 2: Community Sectors and ICLEI Activities
Community Sector ICLEI Activities Included
Building Electricity and Natural Gas Use of Electricity by the Community, Use of Fuel in Residential and Commercial Stationary Combustion Equipment
Vehicles On-Road Passenger and Freight Motor Vehicle Travel
Transit On-Road Passenger and Freight Motor Vehicle Travel
Waste Disposal Generation of Solid Waste by the Community
Water and Waste Water Use of Energy in Potable Water and Wastewater Treatment and Distribution
The following items were not included within the scope of the Energy and GHG
Inventory:
The protocol includes guidance on scoping, and lists the five ICLEI basic emission-generating activities that must be included in all GHG emission reports.

CITY OF WINNIPEG COMMUNITY 2011 GHG INVENTORY AND FORECAST
March 30, 2015 Report No. 13-1443-0010 18
Fugitive emissions from refrigerant / coolant use
Indirect emissions from transboundary on-road inter-city or international
transportation trips that originate and/or complete their journey within the City
Railway emissions
Water-borne navigation emissions
Aviation emissions
Off-road transportation emissions
Industrial process emissions
Agriculture, forestry, and land use emissions
Transboundary emissions due to exchange / consumption of goods and services
These items were not included because they are either insignificant (and thus
considered de minimis), their activities are not occurring with the City of Winnipeg, or
accurate data was not readily available at the time of study. For more details on the
scope, please refer to Appendix A.
4.3 Data Sources Key data sources for the Energy and GHG Inventory are shown below in Table 3.
Table 3: Energy and GHG Inventory Data Sources
Item Data Provided Data Source
Building Electricity Consumption
kWh of electricity consumption by building type over 2011 fiscal year (April 1, 2011 to March 31, 2012)
Manitoba Hydro
Building Natural Gas Consumption
m3 of natural gas consumption by building type over 2011 fiscal year (April 1, 2011 to March 31, 2012)
Manitoba Hydro
Transit Vehicle Fuel Consumption
L of B2 diesel fuel for all transit vehicles
Winnipeg Transit
Vehicle Kilometers Travelled
vkmt by vehicle and fuel type for residential and commercial vehicles
Calculated using Golder transportation model
City of Winnipeg Registered Vehicle Count
number of vehicles by vehicle and fuel type for residential and commercial vehicles
Manitoba Public Insurance

CITY OF WINNIPEG COMMUNITY 2011 GHG INVENTORY AND FORECAST
March 30, 2015 Report No. 13-1443-0010 19
Item Data Provided Data Source
Waste Generated and Disposed in Landfills
tonnes of waste generated and disposed in landfills for residential, industrial/commercial, construction/demolition, and City operations
City of Winnipeg Garbage and Recycling Master Plan
Landfill Gas System Information
% coverage, % efficiency City of Winnipeg Garbage and Recycling Master Plan
Breakdown of Landfilled Waste
% breakdown of landfilled waste by type for residential, industrial/commercial, construction/demolition, and City operations
City of Winnipeg Garbage and Recycling Master Plan
Wastewater Characteristics
m3 of biogas produced, tonnes of biosolids produced, wastewater quality, wastewater volume
City of Winnipeg
For more details on the data sources used, please refer to Appendix A.
4.4 Building Electricity and Natural Gas Building electricity consists of the GHG emissions incurred through the use of
electricity in residential, commercial, and industrial buildings within the City of
Winnipeg. Emissions from the consumption of electricity appear at the source – where
the electricity is generated – as opposed to where the electricity is being used. As
Winnipeg obtains the majority of electricity from hydroelectric generating stations, GHG
from the consumption of electricity are much lower on a per kilowatt-hour basis than
other Canadian cities. However, Winnipeg’s clean low-emission electricity is vulnerable
to factors such as unpredictable drought, which may dramatically increase electricity
emissions in future years.
Building natural gas is comprised of the GHG emissions due to the combustion of
natural gas in residential, commercial, and industrial buildings, as well as stationary
combustion within the City of Winnipeg. Natural gas is used within the city for space
heating and hot water heaters and, thus, is very dependent on annual variations in
weather. Due to Winnipeg’s continental climate which experiences cold winters, natural
gas use is quite high compared to other, more temperate Canadian cities. Therefore,
natural gas usage for space heating represents a significant contributor to GHG
emissions in Winnipeg.

CITY OF WINNIPEG COMMUNITY 2011 GHG INVENTORY AND FORECAST
March 30, 2015 Report No. 13-1443-0010 20
The winter of 2011 was an unseasonably warm as thus experienced a notably lower
than average natural gas consumption. A discussion of how the 2011 natural gas
consumption was adjusted in future forecast scenarios is discussed in Section 5.3
4.5 Transit Currently, public transportation in Winnipeg is facilitated by a network of buses which
serve the transit needs of residents. Buses in the City are fueled by B2 diesel; a
common blend of biodiesel comprised of 98% petrodiesel and 2% biodiesel. For the
2011 inventory, electric buses were not yet in use within the City, but as of 2015,
Winnipeg Transit is testing four new battery-powered electric buses in a four-year trial
program.
4.6 Vehicles GHG emissions from residential and commercial vehicles depend on the vehicle and
the distance travelled. A list of registered vehicles was provided by Manitoba Public
Insurance. Based on the vehicles age, make, model, fuel consumed, and/or
description, the registered vehicles were matched with a fuel consumption rate and
associated greenhouse gas emission factors, taken from the 2012 Climate Registry [4]
and the US Department of Energy; Energy and Efficiency and Renewable Energy [5].
Vehicles were categorized as being Passenger Vehicles, Light Truck, or Heavy Truck,
depending on the make and model. Additionally, vehicles were separated into gas,
diesel, and CNG fueled vehicles. Average distance travelled per vehicle was calculated
with a Golder model. The Golder model set up 465 traffic zones in Winnipeg, and
calculated the number of trips by mode between, within, and from each traffic zone to
surrounding areas. Standard weekly and daily patterns were applied to the model,
calibrated with data from other prairie cities and indicators from the Transportation
Association of Canada.
Calculated emissions may not be based on factors such as driver behaviour and road
conditions. While these factors do have an impact on vehicle emissions, the model
only deals with average fuel consumption rates.

CITY OF WINNIPEG COMMUNITY 2011 GHG INVENTORY AND FORECAST
March 30, 2015 Report No. 13-1443-0010 21
4.7 Waste Disposal All non-recycled, non-composted solid waste in the City of Winnipeg was considered to
be landfilled at either the City-operated Brady Resource Recovery Centre or at nearby
private landfills. While private landfills may not necessarily be within the City
boundaries, emissions associated with Winnipeg-generated community waste is
attributable to the City in the community GHG inventory. Landfill emissions are unique
among sources of emissions in that the emissions are generated over long periods of
time from the activity that caused them. For the purposes of the inventory, life cycle
emissions were taken as occurring within the year of disposal, as per the methane
commitment method of accounting landfill GHG emissions [3]. This calculation method
is quicker and simpler than using the first order of decay model, which requires
knowledge of historic waste disposal information, while still providing accurate results.
Emissions from waste generation were separated into the following sub-categories:
Residential;
Industrial and commercial;
Construction and demolition; and
City operations.
Note that wastewater biosolids were not included within this section as they are
covered under the following section, Water and Waste Water. Also note that
composting was not considered as contributing to City of Winnipeg GHG emissions
because composting was assumed to be carbon neutral.
A landfill gas cap and collection system was first commissioned in 2013 to capture
methane emissions, which are presently flared, and convert methane emissions into
carbon dioxide, which is far less GHG-intensive. It is anticipated that the landfill gas
collection system will continue to be expanded in tandem with new areas of the landfill.
The amount of methane conversion is based upon the landfill gas coverage, date of
installation, and efficiency the system.
4.8 Water and Waste Water Waste water includes both the treatment and disposal of waste water in the City of
Winnipeg. GHG emissions from waste water depend on the type of process used and
amount of waste water generated. Emissions from biogas combustion, waste water
processing, biosolids landfilling, and biosolids composting were included within this
section. Waste water processing electricity consumption was not included within this
section because it was covered under Building Electricity.

CITY OF WINNIPEG COMMUNITY 2011 GHG INVENTORY AND FORECAST
March 30, 2015 Report No. 13-1443-0010 22
4.9 GHG Emissions Summary Overall GHG Emissions are shown below in Table 4 and Figure 3.
Table 4: Summary of GHG Emissions
Activity
Annual Emission Rate (tonne CO2e/year) GHG Intensity (tonne CO2e per capita)
Percent of Total CO2 CH4 N2O
Total GHGs
Building Electricity 18,284 0 0 18,284 0.03 0.3% Building Natural Gas 1,790,048 1,073 9,906 1,801,027 2.60 33.5% Transit 43,044 57 395 43,495 0.06 0.8% Vehicles-Residential 1,689,442 2,434 33,241 1,725,116 2.49 32.1% Vehicles-Commercial 938,779 338 6,525 945,642 1.37 17.6% Waste Disposal — 798,801 — 798,801 1.15 14.9% Water and Waste Water
4,922 33,620 8,117 46,659 0.07 0.9%
Total 4,484,518 836,322 58,184 5,379,024 7.78 100%
Figure 3: Summary of GHG Emissions

CITY OF WINNIPEG COMMUNITY 2011 GHG INVENTORY AND FORECAST
March 30, 2015 Report No. 13-1443-0010 23
Building Natural Gas and Vehicles show the highest emissions, accounting for 83.1%
of total emissions when combined. Waste disposal follows closely behind with14.9% of
total GHG emissions. The remaining categories comprise of less than a percentage
each. Note that airport emissions are not included due to data availability from the
Winnipeg Airport Authority. The inventory tool has a place to enter in airport emissions
if they are obtained at a later date.
4.10 Comparison with Other Municipalities Winnipeg GHG emissions per capita were compared to several other large Canadian
municipalities. Data sources used in obtaining data are shown in Table 5.
Table 5: Data Sources for Other Municipalities
City Data Source
Calgary “Calgary Climate Change Action Plan Target 50: The City of Calgary Corporate and Community Outlook on Climate and Air Quality Protection”, City of Calgary Environmental Management. 2006
Edmonton “Edmonton’s Energy Transition: Discussion Paper”, Pembina Institute & HB Lanarc. 2012
Toronto “Greenhouse Gases and Air Pollutants in the City of Toronto: Toward a Harmonized Strategy for Reducing Emissions”, ICF International. 2007
Ottawa “Framing Our Future: An Energy & Emissions Plan for Canada’s Capital Region”, HB Lanarc. 2012
North Vancouver
“Community Energy and Emissions Plan: City of North Vancouver”, HB Lanarc. 2010
Vancouver “City of Vancouver: Greenest City – 2020 Action Plan”, City of Vancouver. 2012
The comparison of GHG emissions per capita is shown in Figure 4 and Figure 5.

CITY OF WINNIPEG COMMUNITY 2011 GHG INVENTORY AND FORECAST
March 30, 2015 Report No. 13-1443-0010 24
Figure 4: Comparison of GHG Emissions per Capita by City
Figure 5: Comparison of GHG Emissions per Capita by Key Sectors

CITY OF WINNIPEG COMMUNITY 2011 GHG INVENTORY AND FORECAST
March 30, 2015 Report No. 13-1443-0010 25
Major Canadian municipalities showed a range of 4.8 to 13.5 tonnes of CO2 equivalent
per person per year, with Winnipeg coming in at the lower end at 7.8 tonnes of CO2
equivalent per person per year. Cities such as Winnipeg, Vancouver and North
Vancouver show low levels of greenhouse gas emissions primarily due to the use of
hydroelectricity as a major source of electricity. Note that direct emissions from
industry were not included in many municipalities due to lack of data. However, most
cities, including Winnipeg, do not have a large amount of industrial emissions occurring
within the city limits. Most emissions for industry are covered under natural gas and
electricity use. Also note that Edmonton shows large industrial emissions due to the
refineries in the city.
4.11 Comparison with Previous Inventories Previously, the City of Winnipeg had GHG inventories created for 1994 and 1998. The
inventories were prepared using software developed by Torrie Smith Associates for the
Cities for Climate Protection Campaign of The International Council for Local
Environmental Initiatives.
The documentation in regards to the inventory scope and calculation methodologies
used was not included in the report documentation and other data provided, thus, a
comprehensive comparison between these inventories and the 2011 inventory
presented in this report is challenging.

CITY OF WINNIPEG COMMUNITY 2011 GHG INVENTORY AND FORECAST
March 30, 2015 Report No. 13-1443-0010 26
A summary of the previous inventories is shown below in Table 6.
Table 6: Previous Inventories Results
Activity Annual Emission Rate (tonne CO2e/year) 1994 1998
Residential 1,491,602 1,176,928 Commercial 209,171 188,323 Industrial 2,121,086 2,102,396 Transportation 1,575,472 1,650,494 Waste 217,088 139,183 Total 5,614,419 5,257,324
As the breakdown of emission categories does not match the 2011 inventory
categories, re-organization of the emissions into broader categories was necessary to
allow for comparison. However, because the inventory methodology, data sources, and
geographical boundaries potentially differ between inventories, this comparison does
not necessarily reflect an accurate depiction of the changes in Winnipeg GHG
emissions.
Table 7: Comparison of Previous Inventories to 2011 Inventory, By Source
Activity Annual Emission Rate (tonne CO2e/year) 1994 1998 2011
Building Electricity 83,565 89,872 18,284
Building Natural Gas 3,738,295 3,377,776 1,801,027
Vehicles and Transit 1,575,472 1,650,494 2,714,253
Waste, Water, & Wastewater 217,088 139,183 845,460
Total 5,614,419 5,257,324 5,379,024
The comparison of inventories shows a 2.3% increase in GHG emissions between
1998 and 2011. However, as there are a number of differences between the
inventories, this does not necessarily mean that the City did not meet their 6%
reduction target. Previous inventories are not clear on what was included, meaning that
a number of items which have been included in the 2011 inventory may be absent from
the previous inventories.
Differences and other findings noted when comparing the 1994/1998 inventories and
the 2011 inventory are summarized below:
The GHG emission factor for Scope 2 electricity consumed in the City was
significantly higher in the 1994/1998 inventories. It appears the factor represents
a blend of hydroelectricity and fossil fuel emission factors reflective of electricity
import from the United States. For the 2011 calendar year, the emission factor
assigned by Environmental Canada’s Nation Inventory Report (NIR) and used in
the City of Winnipeg 2011 community inventory is approximately 3.4 g/kWh. As

CITY OF WINNIPEG COMMUNITY 2011 GHG INVENTORY AND FORECAST
March 30, 2015 Report No. 13-1443-0010 27
comparison, the emission factors provided by Environmental Canada’s National
Inventory Report for 1990 and 2000 were 26 g/kWh and 31 g/kWh, respectively.
The emission factor used in the City of Winnipeg 1998 community inventory was
13.6 g/kWh.
The 1994/1998 inventory omitted emissions from wastewater and sewer sludge.
The 2011 inventory included emissions from wastewater and sewer sludge.
It is unclear whether commercial transportation was included in the 1994/1998
inventories based on the documentation provided. Commercial transportation was
developed separately from residential transportation in the 2011 inventory.
The per capita GHG emissions prepared in the 1994/1998 inventories was
roughly on par with the per capita GHG emissions developed in the 2011
inventory, however, the 1994/1998 inventories estimated significantly higher
natural gas usage, while estimating significantly lower transportation emissions.
As presented in 4.10, the per capita GHG emissions profile of the 2011 inventory
is fairly consistent with other Canadian municipalities. Comparing the City’s
emissions profile developed in 1994/1998 inventories with other similar Canada
cities highlights the discrepancies in community transportation and natural gas
emissions.
A significant difference exists in the breakdown of natural gas and electricity
emissions between industrial, residential and commercial from the 1994/1998
inventories to the 2011 inventory. In the 1994/1998 inventories, industrial natural
gas use is significantly greater than commercial natural gas usage. The 2011
inventory suggests that commercial natural gas use is significantly greater than
industrial natural gas usage. It is possible that the designation of commercial
customers versus industrial customers may have changed, as their additive
consumption total is similar.

CITY OF WINNIPEG COMMUNITY 2011 GHG INVENTORY AND FORECAST
March 30, 2015 Report No. 13-1443-0010 28
In discussion with Manitoba Hydro, it is also understood that Centra Gas’ natural
gas and Winnipeg Hydro’s electricity consumption data recordkeeping prior to
their acquisition by Manitoba Hydro was less developed at the community-level,
thus the quality of building energy data used prior 2002 may potentially be
suspect.
Table 8: Comparison of Natural Gas and Electricity Emissions from Previous Inventories to 2011 Inventory, By Sector (Total Consumption)
Activity Natural Gas and Electricity Annual Emission Rate (tonne CO2e/year) 1994 1998 2011
Residential 1,491,602 1,176,928 682,215
Commercial 209,171 188,323 928,001
Industrial 2,121,086 2,102,396 196,584Total 3,821,859 3,467,647 1,806,799 Table 9: Comparison of Natural Gas and Electricity Emissions from Previous Inventories to 2011 Inventory, By Sector (Percentage)
Activity Percentage of Overall Natural Gas and Electricity Emissions, 1994 1998 2011
Residential 39% 34% 38%Commercial 5% 5% 51%Industrial 56% 61% 11%

CITY OF WINNIPEG COMMUNITY 2011 GHG INVENTORY AND FORECAST
March 30, 2015 Report No. 13-1443-0010 29
5.0 ENERGY AND GHG FORECASTS
5.1 General Approach As a part of examining possible emission futures for the City of Winnipeg, energy and
GHG forecasts were prepared for 2020, 2031, and 2050. Estimates were made in
conjunction with the City for key parameters and policies which were then translated to
Inventory inputs. After inputs had been updated, results from the forecasted years
were compared to the original inventory to observe changes in emissions over time.
Three scenarios were considered: Business as Usual, OurWinnipeg, and Low Carbon
Path. Differences between the scenarios were limited to what was possible for the City
to reasonably influence. For example, factors such as population growth, provincial
policies, and changes in technology were kept the same in all scenarios. However,
areas which may be influenced by City policies, such as transit infrastructure, housing
densities, and waste diversion rates, did vary between scenarios. The forecasting and
scenarios are described in more detail in the following sections.
As weather can potentially have a large unpredictable impact on GHG emissions, all
forecasts have been normalized for climate extremes. This includes weather events
such as drought, which would reduce the amount of hydro-electricity generated within
Manitoba and thus raise electricity emissions due to reliance on imported electricity.
Any anticipated effects from climate change have not been factored into the analysis.
A number of indicators are outlined for each scenario and sector, which can be viewed
by sector for each scenario. To view all indicators for all scenarios side-by-side, see
Appendix E.
5.2 Community Trends Between all scenarios, overall community trends in population and jobs were taken as
being the same. Forecasted population for 2020 and 2031 were taken from a report on
the long term forecasts for Winnipeg CMA by the Conference Board of Canada. To
estimate population in 2050, an extrapolation of the population trend from 2011 to 2035
was used. Job forecasts were also taken from the Conference Board of Canada report
on Winnipeg CMA, using a factor of 0.96 – the historical ratio of jobs in the City to jobs
in the CMA [1].
A summary of the input values is shown below in Table 10.

CITY OF WINNIPEG COMMUNITY 2011 GHG INVENTORY AND FORECAST
March 30, 2015 Report No. 13-1443-0010 30
Table 10: Community Trend Input Values
Inputs 2011 2020 2031 2050 Reference
Population 691,800 776,100 876,700 1,050,000 Conference Board of Canada [1]
Jobs 392,640 441,600 489,600 508,800 Conference Board of Canada [1]
5.3 Climate Impacts An unseasonably warm or cold winter can have a significant impact on natural gas
consumption reflecting a lesser or greater need for space heating. In 2011, Winnipeg
experienced a warmer than usual winter. Accordingly, Manitoba Hydro reported that
natural gas consumption for their 2011/2012 fiscal year was approximately 9% lower
than their 2010/2011 fiscal year (11% lower than the six-year average).
Heating degree days (HDDs) is a measurement designed to reflect the energy
consumption needed to heat a building. In the 2011/2012 fiscal year, the number of
heating degree days for Winnipeg was 4,066 whereas the average number of HDDs in
experience in the past six fiscal years was 4,851. The lower amount of HDDs
experienced in 2011/2012 compared to the average confirms that the 2011 Winnipeg
winter was unseasonably warm.
Table 11: Historical Natural Gas Consumption in the City of Winnipeg
Fiscal Year1
Annual Natural Gas Consumption
(m3)
Natural Gas Deviation from
Six-Year Average
Heating Degree Days
Heating Degree Days Deviation from Six-Year
Average
2012/13 1,051,260,142 -2% 5,075 5%
2011/12 953,878,222 -11% 4,066 -16%
2010/11 1,046,672,257 -2% 4,862 0%
2009/10 1,068,026,780 0% 4,694 -3%
2008/09 1,155,335,524 8% 5,302 9%
2007/08 1,144,300,344 7% 5,109 5%
Average 1,069,912,211 - 4,851 -1The Manitoba Hydro fiscal year begins April 1st and Ends March 31st.
Accordingly a heating degree day (HDD) analysis was conducted on the data to
evaluate the relationship between the outdoor temperature and the natural gas
consumption, shown in Figure 6.

CITY OF WINNIPEG COMMUNITY 2011 GHG INVENTORY AND FORECAST
March 30, 2015 Report No. 13-1443-0010 31
Figure 6: City of Winnipeg HDD vs. Natural Gas Consumption (2007/2008 to 2012/2013 Fiscal Years)
The relationship shown in Figure 6 was used to develop a baseline for natural gas
consumption for the City of Winnipeg in 2011, normalized for weather. Accordingly, we
would expect that baseline natural gas consumption to increase 12%, to approximately
1,069,912,211 m3 per year. This climate-adjusted baseline natural gas estimate is
used in all scenarios in lieu of the actual 2011 natural gas assumption for forecasting
purposes.
5.4 Land Use Implications Land use policies and plans not only strongly impact emissions related to building use
and transportation, but also impact transit, waste and wastewater. Thus, land use and
development policies within the City have an indirect, rather than direct, impact on
overall community GHG emissions.
Throughout Winnipeg’s growth, development has often resulted in continuously
outward development of low-density communities supporting predominantly single-
family housing development. While new development of low-density communities on
the fringe of large municipalities is relatively common, older communities at the

CITY OF WINNIPEG COMMUNITY 2011 GHG INVENTORY AND FORECAST
March 30, 2015 Report No. 13-1443-0010 32
municipal core become opportunities for transformative and infill development (Figure
7).
Figure 7: Typical Municipal Density Progression, Complete Communities [6]
Sustainable land use is a label which reflects a City planning philosophy that envisions
livability, environmental protection, accessibility, mobility and affordable housing
production as key tenets to community growth. Table 12 contrasts traditional land-use
strategies with sustainable strategies that promote a lower-carbon footprint for the
urban growth.

CITY OF WINNIPEG COMMUNITY 2011 GHG INVENTORY AND FORECAST
March 30, 2015 Report No. 13-1443-0010 33
Table 12: Contrasting Traditional and Low Carbon Land Use Strategies Land Use & Development Policy
Traditional Low Carbon Impacts to GHG Drivers
Growth strategy
Outward growth focusing on developing new low-density neighborhoods at community periphery. Growth of community transportation infrastructure focussing on supporting personal vehicle travel over public and alternative transportation options.
Mixed development, balancing the growth of new neighborhoods with revitalizing existing neighborhoods through infilling, densification and development of transit corridors / centres
Decrease in building energy consumption intensity Reduction in number of vehicle trips Reduction in length of vehicle trips
Residential building
Development focused on single family buildings
Development mix of single family and multi-unit residential buildings
Decrease in building energy consumption intensity
Commercial buildings
Development of commercial buildings separate from residential areas which may include big box development, large shopping centres and strip malls
Integrate commercial buildings within or in close proximity to residential neighborhoods with a focus on providing necessary retail within an easily commutable transit, biking or walking distance from residents
Reduction in number of vehicle trips Reduction in length of vehicle trips
Energy supply
Electricity supply supplied by public power grid Individual space heating for each unit / building
Electricity supplied by public smart grid and building-scale generation Promotion of shared or district energy heating systems for space heating
Decrease in building energy consumption intensity Increase in renewable energy supply
Transportation
Network and facility design focused on providing convenient and efficient access and travel by personal vehicle
Network and facility design that provides convenient and effective Transit and active transportation-travel options.
Reduction in number of vehicle trips Reduction in length of vehicle trips
For the Business as Usual and OurWinnipeg scenarios, the impacts from current and
planned land use policies have been directly translated into GHG key performance
indicators (e.g., growth by building type, infill, number of trips) primarily through
transportation and land-use planning data that was already developed by the City of
Winnipeg. Additional transportation modeling was conducted through Golder’s
Community Energy and Emissions Modeling (CEEMAP) tool.

CITY OF WINNIPEG COMMUNITY 2011 GHG INVENTORY AND FORECAST
March 30, 2015 Report No. 13-1443-0010 34
5.5 Business as Usual Scenario 5.5.1 Description
The Business as Usual Scenario was created to show the likely emissions future in the
absence of municipal intervention through the policy commitments and action
statements associated with OurWinnipeg and its supporting strategies. In general, the
City continues along current trends, with many key indicators remaining the same at
2011 baseline levels.
Inputs for the Business as Usual Scenario were primarily taken from the 2011 Energy
and GHG Inventory, allowing for scaling up with the forecasted increases in population.
An overview of the assumptions used in the development of the Business as Usual
Scenario can be found in the following sections.
5.5.2 Assumptions
The following sub-sections present an overview of the assumptions and key indicators
used in the development of the Business as Usual Scenario. For a more detailed
explanation on the calculation methodology used, please refer to Appendix B.
5.5.2.1 Land Use
For the Business as Usual scenario, it is assumed that land use policies will be
consistent with a continuation of recent development patterns, policies, and priorities
currently undertaken by the City of Winnipeg.
The key characteristics of the Business as Usual Scenario are as follows:
Development of new neighbourhoods at the City periphery dominating residential
unit growth;
Largest share of new units being suburban low-density single family;
Limited mix of land uses with low densities;
Limited residential development in the downtown and mixed use areas;
Infilling continuing to represent a very small contribution to overall neighborhood
development;
No additional development of transit infrastructure will occur with the exception of
the completion of the Southwest transit way; and,
No significant increase in biking or active transportation infrastructure beyond
what is currently in place.
A summary of the key indicator values is shown below in Table 13.
The Business as Usual Scenario was created to show the likely emissions future if no further City actions were implemented.

CITY OF WINNIPEG COMMUNITY 2011 GHG INVENTORY AND FORECAST
March 30, 2015 Report No. 13-1443-0010 35
Table 13: Business as Usual Scenario – Building and Land Use Key Indicators Inputs 2011 2020 2031 2050 Reference
Single-Family Homes
63% 63% 63% 63% Conference Board of Canada
Multi-Unit Residential Building Homes
37% 37% 37% 37% Conference Board of Canada
Infill Percentage of New Residential Construction
N/A 2% 5% 8% Developed with CEEMAP
5.5.2.2 Building Electricity and Natural Gas
Building electricity and natural gas use are influenced by a number of factors that are
independent of the scenarios considered. In the absence of other influences,
consumption scales with population and, therefore, increases in the City’s population
have a large effect on electricity and natural gas use. Provincial demand-side
management programs under Manitoba Hydro have targets for reductions in both
electricity and natural gas use throughout the province. Additionally, changes in
building technology would have an impact on reducing the energy consumption of all
new homes. The demand for electricity is expected to increase in residential buildings
due to an increase in the number of consumer electronics. All of these factors are
outside of the control of the City, and are independent of the scenarios considered.
For the Business as Usual Scenario, building stock makeup (i.e., single family homes
vs. multi-unit residential buildings) was assumed to remain at 2011 levels. Thus, there
would be no efficiency gains from a shift from single family homes to multi-unit
residential buildings. Growth in building-scale renewables, mostly geothermal heating
systems, would also stay at the same proportions as 2011 in this scenario. Finally,
there would no new buildings connected to district energy systems to offset heating
loads.
A summary of the key indicator values is shown below in Table 14.

CITY OF WINNIPEG COMMUNITY 2011 GHG INVENTORY AND FORECAST
March 30, 2015 Report No. 13-1443-0010 36
Table 14: Business as Usual Scenario – Building Electricity and Natural Gas Key Indicators Inputs 2011 2020 2031 2050 Reference Building Electricity Intensity Reduction due to Demand Side Management
0% 4% 5% 10% Manitoba Hydro
Building Natural Gas Intensity Reduction due to Demand Side Management
0% 2% 3% 6% Manitoba Hydro
New Building Energy Intensity Reduction due to Building Stock Changes
0% 0% 0% 0% Assumed
New Building Energy Intensity Reduction due to Technology Changes
0% 9% 20% 39% Assumed
Additional Electricity Use 0% 5% 10% 21% Manitoba Hydro
Residential Building Scale Renewables
1.5% 1.5% 1.5% 1.5%
Manitoba Geothermal Energy Alliance
Commercial/Industrial Building Scale Renewables
1.5% 1.5% 1.5% 1.5%
Manitoba Geothermal Energy Alliance
Residential Buildings Connected to District Energy Systems
0% 0% 0% 0% Assumed
Commercial Buildings Connected to District Energy Systems
< 1% < 1% < 1% < 1% Assumed
Residential Electricity Use (kWh/year)
1,690,588,866 1,897,087,432 2,175,793,596 2,498,264,543 Calculated
Commercial Electricity Use (kWh/year)
3,046,484,478 3,276,408,397 3,499,055,017 3,293,713,564 Calculated
Industrial Electricity Use (kWh/year)
837,309,539 900,502,866 961,696,068 905,259,096 Calculated
Residential Natural Gas Use (m3/year)
488,426,808 595,966,809 648,519,154 687,570,870 Calculated
Commercial Natural Gas (m3/year)
361,222,578 441,801,677 473,031,695 453,652,964 Calculated
Industrial Natural Gas (m3/year)
104,025,761 127,231,127 136,224,824 130,644,089 Calculated
Single-Family Homes 63% 63% 63% 63% Conference Board of Canada
Multi-Unit Residential Building Homes
37% 37% 37% 37% Conference Board of Canada

CITY OF WINNIPEG COMMUNITY 2011 GHG INVENTORY AND FORECAST
March 30, 2015 Report No. 13-1443-0010 37
5.5.2.3 Transit
The Business as Usual Scenario includes no major changes to the City of Winnipeg
public transportation fleet. Transit vehicles continue to use B2 biodiesel fuel, although
due to changes in technology, fuel consumption per kilometer does improve. The
number of transit vehicles and transit routes operated by the City does not change in
this scenario. Additional travel is assumed to be undertaken by personal vehicles.
A summary of key indicator values is shown below in Table 15.
Table 15: Business as Usual Scenario – Transit Key Indicators Inputs 2011 2020 2031 2050 ReferenceKilometers of Transit Travel (km/year)
24,300,000 24,300,000 24,300,000 24,300,000 Assumed
Transit Fuel Type (% of kilometers travelled)
100% B2 Biodiesel
100% B2 Biodiesel
100% B2 Biodiesel
100% B2 Biodiesel
Assumed
Diesel Fuel Use (L/year)
16,163,620 15,173,364 13,184,596 10,025,073 Calculated
Electricity Use (MWh/year)
0 0 0 0 Calculated
5.5.2.4 Vehicles
Between all scenarios, GHG emissions per kilometer travelled are also expected to
decrease as the result of new technology and new government policies, such as
federal government tailpipe emission standards. As vehicular usage represents a large
percentage of overall community emissions, the extent of fuel economy improvements
represents one of the most significant areas of uncertainty in the overall community
GHG emissions forecast. Fuel economy improvements assumed in the forecast are
based on the continued adoption of government regulations mandating vehicular fuel
efficiency standards, technology roll-out for low-emission vehicles and economic
considerations, such as sustained increase in oil prices.
A projection of emissions per kilometer travelled for new vehicles was obtained from a
UNEP study on Canadian Automotive Fuel Economy Policy [7]. To determine the GHG
emissions from the combined fleet on the road, the average vehicle on the road in
Winnipeg was assumed to be 10 years old. This assumption was based on the current
vehicle makeup from the registration data provided by the Manitoba Public Insurance.
In the Business as Usual Scenario, public transit did not increase service to match the
increased population. Additionally, no expansion to the cycling network was assumed.
With continued greenfield development and limited public transit and active transit
availability, the weekday travel shifts slightly toward vehicles. As a result of these
factors and the increased population, the total kilometers travelled increases for all

CITY OF WINNIPEG COMMUNITY 2011 GHG INVENTORY AND FORECAST
March 30, 2015 Report No. 13-1443-0010 38
vehicles. There is no shift toward electric vehicles here as this scenario does not
include any significant outlaying of charging stations within the City.
A summary of key indicator values is shown below in Table 16.
Table 16: Business as Usual Scenario – Vehicle Key Indicators Inputs 2011 2020 2031 2050 Reference Cycle Network (km) 274 274 274 274 Assumed Total Residential Vehicle Kilometers Travelled (vkmt/year)
5,175,656,607 5,526,529,233 6,256,030,891 8,241,968,092 Calculated
Total Commercial Vehicle Kilometers Travelled (vkmt/year)
932,055,814 1,105,305,847 1,251,209,851 1,648,393,618 Calculated
Electric Vehicle Use 0% 0% 0% 0% Assumed Weekday Trips by Mode Auto Driver Auto Passenger Public Transit Walk/Cycle
64% 18% 10% 8%
64% 18% 10% 8%
65% 19% 9% 7%
66% 20% 8% 6%
Assumed
Average Residential Fleet Emissions (gCO2e/km)
370 278 196 133 Calculated
Average Commercial Fleet Emissions (gCO2e/km)
1015 761 538 365 Calculated
5.5.2.5 Waste Disposal
In all scenarios, the average waste generated remains the same. This means that
across the scenarios, the waste increases proportionally as the City grows.
In the Business as Usual Scenario, there are no changes to the diversion rates for
waste. Additionally, no supplementary policies are introduced which could affect
the amount or makeup of waste. Finally, as the landfill gas collection system is not
expanded any further, the landfill gas collection efficiency remains constant.
A summary of key indicator values is shown below in Table 17.

CITY OF WINNIPEG COMMUNITY 2011 GHG INVENTORY AND FORECAST
March 30, 2015 Report No. 13-1443-0010 39
Table 17: Business as Usual Scenario – Waste Disposal Key Indicators Inputs 2011 2020 2031 2050 Reference Residential Waste (tonne/year) 278,896 312,881 353,438 423,303 Calculated Commercial/Industrial Waste (tonne/year)
348,000 391,394 433,936 450,954 Calculated
Construction/Demolition Waste (tonne/year)
124,000 139,462 154,621 160,685 Calculated
Residential Diversion Rate 15% 15% 15% 15% Assumed Commercial/Industrial Diversion Rate
20% 20% 20% 20% Assumed
Construction/Demolition Diversion Rate
20% 20% 20% 20% Assumed
Landfill Gas Collection Coverage (City Landfills)
100% 100% 100% 100% Assumed
Landfill Gas Collection Efficiency (City Landfills)
55% 55% 55% 55% Assumed
Landfilled Waste Per Capita (tonne/person/year)
1.09 1.09 1.07 0.99 Calculated
5.5.2.6 Water and Waste Water
For all scenarios, total mass of biosolids associated with waste water increases with
population. In the Business as Usual Scenario, the treatment methods do not change
at all. Additionally, no biosolids are sold for beneficial use or composted, suggesting
that 100% of biosolids generated are landfilled.
A summary of key indicator values is shown below in Table 18.
Table 18: Business as Usual Scenario – Water and Waste Water Key Indicators Inputs 2011 2020 2031 2050 ReferenceMass of Biosolids Disposed (tonne/year)
13,982 15,700 17,700 21,200 Calculated
Biosolids Sold for Beneficial Use 0% 0% 0% 0% Assumed Biosolids Composted 0% 0% 0% 0% Assumed

CITY OF WINNIPEG COMMUNITY 2011 GHG INVENTORY AND FORECAST
March 30, 2015 Report No. 13-1443-0010 40
5.5.3 Results
The results from the Business as Usual Scenario can be seen below in Table 19 and
Figure 8.
Table 19: Business as Usual Scenario Results
Activity
Annual Emission Rate (tonne CO2e/year)
2011 2020 2031 2050
Airport N/A N/A N/A N/A
Buildings Electricity 18,284 19,923 21,768 21,967
Building Natural Gas 1,801,027 2,200,116 2,375,323 2,401,926
Transit 43,495 40,831 35,479 26,977
Vehicles-Residential 1,725,116 1,534,331 1,227,376 1,098,322
Vehicles-Commercial 945,642 841,061 672,696 601,892
Waste Disposal 798,801 982,933 1,093,004 1,173,095
Water and Waste Water 46,659 51,876 56,945 65,807
Total 5,379,024 5,671,070 5,482,591 5,389,987
Per Capita Emissions 7.78 7.31 6.25 5.13
Figure 8: Business as Usual Scenario Results

CITY OF WINNIPEG COMMUNITY 2011 GHG INVENTORY AND FORECAST
March 30, 2015 Report No. 13-1443-0010 41
In this scenario, there are no large changes to the overall GHG emissions for the City.
This is due to the competing effects of increased population and better technology.
Looking at individual sectors, the largest increases in GHG emissions are in Waste
Disposal and Water and Waste Water. Because no additional policies have been
implemented in this scenario to make these processes more efficient, emissions scale
up with population. Building Electricity and Natural Gas show similar trends, although
the increase in consumption due to the increase in population is tempered by efficiency
gains due to technology improvements and provincial demand-side management
programs. Residential, Commercial, and Transit vehicles all show decreases in
emissions due to natural fleet replacement with better, more fuel-efficient vehicles.
Overall, the Business as Usual Scenario shows a 2% increase in emissions by 2031.
As population is forecasted to increase by 27% in this time, this indicates a reduction in
per capita emissions. In 2011, per capita emissions were 7.78 tonnes of CO2e per
person, which reduces 20% to 6.25 tonnes of CO2e per person in 2031. Looking
farther ahead to 2050, we can see overall emissions increasing by 0.2% while the
population increases by 52%. Per capita emissions are forecasted at 5.13 tonnes of
CO2e per person in 2050, representing a decrease of 34% from 2011. See Table 20 for
a summary of the changes to emission by year and sector.
Table 20: Business as Usual Scenario Emission Changes
Activity
Change in Annual Emission Rate
2011 2020 2031 2050
Airport N/A N/A N/A N/A
Buildings Electricity 0% 9% 19% 20%
Building Natural Gas 0% 22% 32% 33%
Transit 0% -6% -18% -38%
Vehicles-Residential 0% -11% -29% -36%
Vehicles-Commercial 0% -11% -29% -36%
Waste Disposal 0% 23% 37% 47%
Water and Waste Water 0% 11% 22% 41%
Total 0% 5% 2% 0%
Per Capita Emissions 0% -6% -20% -34%

CITY OF WINNIPEG COMMUNITY 2011 GHG INVENTORY AND FORECAST
March 30, 2015 Report No. 13-1443-0010 42
5.6 OurWinnipeg Scenario 5.6.1 Description
The OurWinnipeg Scenario represents the current plans of the City of Winnipeg,
outlined in the 2011 report, “OurWinnipeg: It’s Our City, It’s Our Plan, It’s Our Time”
and the OurWinnipeg companion documentation:
Complete Communities Direction Strategy (July 20, 2011)
Sustainable Transportation (July 20, 2011)
Sustainable Water & Waste (July 20, 2011)
A Sustainable Winnipeg (July 20, 2011)
In July 2011, City Council approved OurWinnipeg, a development plan that will guide
the physical, social, environmental, and economic development of the City of Winnipeg
for the next few decades. In addition, other key approved plans paved the way for the
OurWinnipeg scenario, including the Transportation Master Plan and Garbage and
Recycling Master Plan. Golder developed individual forecast parameters for the 2020
and 2031 forecast years based on the assumptions of those studies and data directly
provided by City of Winnipeg staff.
The OurWinnipeg GHG forecast scenario is not strictly considered a business as usual
case because it does assume changes to management practices. However, the
scenario represents a reasonable forecast of future emissions based on the currently
known assumptions in regards to building growth, waste and wastewater management,
and transportation developments. Population growth in OurWinnipeg follows the same
forecasts as all other scenarios.
The OurWinnipeg development plans set GHG targets until the 2031 calendar year.
Because the scope of this study is to project greenhouse gas emissions to 2050, the
study window exceeds the planning windows ending in 2031. Thus, for the 2050
forecast, Golder extrapolated the emissions forecast based on the available data from
the 2011, 2020 and 2031 forecast years. No additional insight was assumed in regards
to growth or management strategies for the 2050 forecast year.
The inputs for the OurWinnipeg scenario were largely based on Council adopted
strategies, targets, and previous studies supporting these planning efforts. For
example, the transportation model outputs developed for the Transportation Master
Plan were used as inputs to this scenario, as were the solid waste estimates
developed for the Garbage and Recycling Master Plan. After populating the inputs and
before modelling the results, the consulting team sought confirmation from the City that
the scenario was being appropriately modelled.
The OurWinnipeg Scenario represents the current plans of the City of Winnipeg, outlined in the 2011 report, “OurWinnipeg: It’s Our City, It’s Our Plan, It’s Our Time” and the OurWinnipeg companion documentation.

CITY OF WINNIPEG COMMUNITY 2011 GHG INVENTORY AND FORECAST
March 30, 2015 Report No. 13-1443-0010 43
5.6.2 Assumptions
The following sub-sections present an overview of the assumptions and key indicators
used in the development of the OurWinnipeg Scenario. For a more detailed
explanation on the calculation methodology used, please refer to Appendix B.
5.6.2.1 Land Use
The planning document, OurWinnipeg: It’s Our City, It’s Our Plan, It’s Our Time, was
adopted in 2011 as a 25-year planning vision for City development. The OurWinnipeg
forecast assumes an optimistic and full implementation of the policies and
development strategies outlined in the OurWinnipeg planning document. The land-use
strategy was outlined in the companion document Complete Communities: Winnipeg’s
Guide to Land Use and Development. The report outlines areas of stability within the
City and areas slated for new development or redevelopment.
To support the development of this scenario, the City provided TransCAD and land use
forecasting (PLUM) data which supported development of transportation, building and
land-use key performance indicators for the 2031 forecast scenario. The current plans
include a modest shift of new building stock makeup from single family homes to multi-
unit residential buildings. As multi-unit residential buildings are more energy efficient
than single family homes, this shift would represent a decrease in energy use per
person, both electricity and natural gas.
The key characteristics of the OurWinnipeg land use plan are as follows:
Move towards are more balanced growth between greenfield and infill
development with future dwelling demand reflecting historical forecast trends;
Increase share of duplexes, secondary suites, row houses, and multi-unit
residential buildings to overall new building stock;
Direct most infill to transformative areas, including transit-oriented regional and
neighbourhood centres and corridors, major redevelopment sites, and the
downtown to provide compact, mixed-use, high-quality development;
Repurpose obsolete and underutilized industrial lands for mixed use, complete
communities;
Develop higher density regional mixed used centres over time, primarily co-
located with existing neighborhood centres / major shopping developments (e.g.,
Polo Park, St. Vital Centre, Kenaston & McGillivary);
Promote high density residential developments and pedestrian-oriented
transportation in the downtown;

CITY OF WINNIPEG COMMUNITY 2011 GHG INVENTORY AND FORECAST
March 30, 2015 Report No. 13-1443-0010 44
Develop three additional rapid transportation corridors, beyond the Southwest
transit way before 2031:
Southwest: Downtown to University of Manitoba;
West: Downtown to Polo Park, Red River College and the Airport; and,
East: Downtown to Kildonan Place.
Additional rapid transportation corridors to be developed after 2031 based on
community growth.
Develop additional transit quality corridors throughout the City; and,
Increase active transportation infrastructure throughout the City, particularly in
new communities.
The proposed land-use and transit corridor plans a presented in Figure 9 and Figure
10, respectively
Figure 9: OurWinnipeg Land Use Plan [6]

CITY OF WINNIPEG COMMUNITY 2011 GHG INVENTORY AND FORECAST
March 30, 2015 Report No. 13-1443-0010 45
Figure 10: OurWinnipeg Transit System Plan [8]
A summary of the key indicator values is shown below in Table 21. Table 21: OurWinnipeg Scenario –Land Use Key Indicators Inputs 2011 2020 2031 2050 Reference
Single-Family Homes
63% 62% 61% 59% Conference Board of Canada
Multi-Unit Residential Building Homes
37% 38% 39% 41% Conference Board of Canada
Infill Percentage of New Residential Construction
N/A 7% 16% 25% Developed with CEEMAP

CITY OF WINNIPEG COMMUNITY 2011 GHG INVENTORY AND FORECAST
March 30, 2015 Report No. 13-1443-0010 46
5.6.2.2 Building Electricity and Natural Gas
Building electricity and natural gas use are influenced by a number of factors that are
independent of the scenarios considered. Increases to City population has a large
effect on electricity and natural gas use due to consumption scaling with population in
the absence of other influences. Provincial demand-side management programs under
Manitoba Hydro have targets for reductions in both electricity and natural gas use
throughout the province. Additionally, changes in building technology would have an
impact on reducing the energy consumption of all new homes. It is also expected that
the demand for electricity would increase in residential buildings due to an increase in
consumer electronics. All of these factors are outside of the control of the City, and are
independent of the scenarios considered.
Building-scale renewables, mostly geothermal heating systems, would continue to
grow at historic rates in this scenario as this scenario includes no City plans for
policies, targets, or goals concerning these technologies. Finally, there would be a
limited promotion of district energy systems, leading to a small number of buildings
connected to district energy systems to offset heating loads.
A summary of the key indicator values is shown below in Table 22.

CITY OF WINNIPEG COMMUNITY 2011 GHG INVENTORY AND FORECAST
March 30, 2015 Report No. 13-1443-0010 47
Table 22: OurWinnipeg Scenario – Building Electricity and Natural Gas Key Indicators Inputs 2011 2020 2031 2050 Reference Building Electricity Intensity Reduction due to Demand Side Management
0% 4% 5% 10% Manitoba Hydro
Building Natural Gas Intensity Reduction due to Demand Side Management
0% 2% 3% 6% Manitoba Hydro
New Building Energy Intensity Reduction due to Building Stock Changes
0% 4% 8% 16% Calculated
New Building Energy Intensity Reduction due to Technology Changes
0% 9% 20% 39% Assumed
Additional Electricity Use
0% 5% 10% 21% Manitoba Hydro
Residential Building Scale Renewables
1.5% 2% 4% 8% Manitoba Geothermal Energy Alliance
Commercial/Industrial Building Scale Renewables
1.5% 3% 6% 15% Manitoba Geothermal Energy Alliance
Residential Buildings Connected to District Energy Systems
0% 1% 2% 4% Assumed
Commercial Buildings Connected to District Energy Systems
< 1% 1% 3% 6% Assumed
Residential Electricity Use (kWh/year)
1,690,588,866 1,890,028,752 2,143,841,778 2,397,080,071 Calculated
Commercial Electricity Use (kWh/year)
3,046,484,478 3,276,408,397 3,499,055,017 3,293,713,564 Calculated
Industrial Electricity Use (kWh/year)
837,309,539 900,502,866 961,696,068 905,259,096 Calculated
Residential Natural Gas Use (m3/year)
488,426,808 592,503,952 633,883,431 647,309,955 Calculated
Commercial Natural Gas (m3/year)
361,222,578 439,550,725 466,306,958 435,777,875 Calculated
Industrial Natural Gas (m3/year)
104,025,761 126,754,010 134,692,295 126,234,851 Calculated
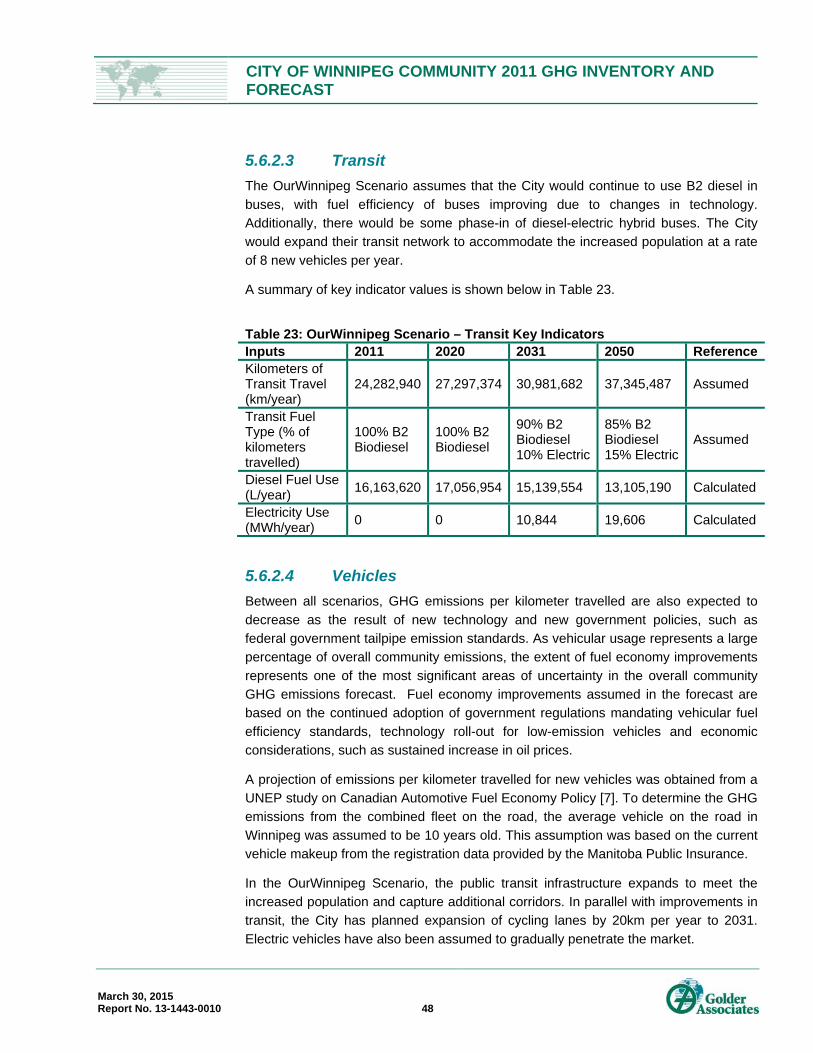
CITY OF WINNIPEG COMMUNITY 2011 GHG INVENTORY AND FORECAST
March 30, 2015 Report No. 13-1443-0010 48
5.6.2.3 Transit
The OurWinnipeg Scenario assumes that the City would continue to use B2 diesel in
buses, with fuel efficiency of buses improving due to changes in technology.
Additionally, there would be some phase-in of diesel-electric hybrid buses. The City
would expand their transit network to accommodate the increased population at a rate
of 8 new vehicles per year.
A summary of key indicator values is shown below in Table 23.
Table 23: OurWinnipeg Scenario – Transit Key Indicators Inputs 2011 2020 2031 2050 ReferenceKilometers of Transit Travel (km/year)
24,282,940 27,297,374 30,981,682 37,345,487 Assumed
Transit Fuel Type (% of kilometers travelled)
100% B2 Biodiesel
100% B2 Biodiesel
90% B2 Biodiesel 10% Electric
85% B2 Biodiesel 15% Electric
Assumed
Diesel Fuel Use (L/year)
16,163,620 17,056,954 15,139,554 13,105,190 Calculated
Electricity Use (MWh/year)
0 0 10,844 19,606 Calculated
5.6.2.4 Vehicles
Between all scenarios, GHG emissions per kilometer travelled are also expected to
decrease as the result of new technology and new government policies, such as
federal government tailpipe emission standards. As vehicular usage represents a large
percentage of overall community emissions, the extent of fuel economy improvements
represents one of the most significant areas of uncertainty in the overall community
GHG emissions forecast. Fuel economy improvements assumed in the forecast are
based on the continued adoption of government regulations mandating vehicular fuel
efficiency standards, technology roll-out for low-emission vehicles and economic
considerations, such as sustained increase in oil prices.
A projection of emissions per kilometer travelled for new vehicles was obtained from a
UNEP study on Canadian Automotive Fuel Economy Policy [7]. To determine the GHG
emissions from the combined fleet on the road, the average vehicle on the road in
Winnipeg was assumed to be 10 years old. This assumption was based on the current
vehicle makeup from the registration data provided by the Manitoba Public Insurance.
In the OurWinnipeg Scenario, the public transit infrastructure expands to meet the
increased population and capture additional corridors. In parallel with improvements in
transit, the City has planned expansion of cycling lanes by 20km per year to 2031.
Electric vehicles have also been assumed to gradually penetrate the market.

CITY OF WINNIPEG COMMUNITY 2011 GHG INVENTORY AND FORECAST
March 30, 2015 Report No. 13-1443-0010 49
A summary of key indicator values is shown below in Table 24.
Table 24: OurWinnipeg Scenario – Vehicle Key Indicators Inputs 2011 2020 2031 2050 Reference Cycle Network (km) 274 454 674 674 Assumed Total Residential Vehicle Kilometers Travelled (vkmt/year)
5,175,656,607 5,483,855,690 6,161,200,794 8,057,049,404 Calculated
Total Commercial Vehicle Kilometers Travelled (vkmt/year)
932,055,814 1,096,771,138 1,232,240,159 1,611,409,881 Calculated
Electric Vehicle Use 0% 1% 2% 5% Assumed Weekday Trips by Mode Auto Driver Auto Passenger Public Transit Walk/Cycle
64% 18% 10% 8%
64% 18% 10% 8%
63% 18% 10% 9%
62% 17% 11% 10%
Assumed
Average Residential Fleet Emissions (gCO2e/km)
370 276 193 129 Calculated
Average Commercial Fleet Emissions (gCO2e/km)
1015 759 538 360 Calculated
5.6.2.5 Waste Disposal
In all scenarios, the average waste generated remains the same. This means that
across the scenarios, the waste increases proportionally as the City grows.
In the OurWinnipeg Scenario, the City implements the 2011 Garbage and Recycling
Master Plan [9] and Comprehensive Integrated Waste Management Plan [10], which
includes increases in residential waste sent for beneficial use (i.e., recycling or
composting). Aside from the Garbage and Recycling Master Plan, this scenario also
has improvements to landfill gas collection efficiency through continuous expansion of
the landfill gas collection system to incorporate all new waste and higher methane
capture efficiency. Additionally, this scenario includes a reduction in yard waste sent to
landfills due to initiatives by the City, leading to an overall decrease in residential waste
and a slight change in the residential waste makeup. The scenario assumes the rollout
of a residential source separated organics program to meet the 50% residential
diversion rate target.
A summary of key indicator values is shown below in Table 25.

CITY OF WINNIPEG COMMUNITY 2011 GHG INVENTORY AND FORECAST
March 30, 2015 Report No. 13-1443-0010 50
Table 25: OurWinnipeg Scenario – Waste Disposal Key Indicators Inputs 2011 2020 2031 2050 Reference
Residential Waste (tonne/year) 278,896 234,477 199,588 239,042 Calculated Commercial/Industrial Waste (tonne/year)
348,000 337,577 108,484 112,738 Calculated
Construction/Demolition Waste (tonne/year)
124,000 130,746 38,655 40,171 Calculated
Residential Diversion Rate 15% 35% 50% 50% Assumed Commercial/Industrial Diversion Rate 20% 20% 20% 20% Assumed Construction/Demolition Diversion Rate 20% 20% 20% 20% Assumed Landfill Gas Collection Coverage (City Landfills)
100% 100% 100% 100% Assumed
Landfill Gas Collection Efficiency (City Landfills)
55% 75% 75% 75% Assumed
Landfilled Waste Per Capita (tonne/person/year)
1.09 0.99 0.90 0.81 Calculated
5.6.2.6 Water and Waste Water
For all scenarios, total mass of biosolids associated with waste water increases with
population. In the OurWinnipeg Scenario, the treatment methods do not change at all.
However, this scenario does show promotion of biosolids sent for beneficial use and
composting due to City initiatives.
A summary of key indicator values is shown below in Table 26.
Table 26: OurWinnipeg Scenario – Water and Waste Water Key Indicators Inputs 2011 2020 2031 2050 Reference
Mass of Biosolids Disposed (tonne/year)
13,982 15,700 17,700 21,200 Calculated
Biosolids Sold for Beneficial Use 0% 20% 40% 60% Assumed Biosolids Composted 0% 20% 30% 40% Assumed

CITY OF WINNIPEG COMMUNITY 2011 GHG INVENTORY AND FORECAST
March 30, 2015 Report No. 13-1443-0010 51
5.6.3 Results
The results from the OurWinnipeg Scenario can be seen below in Table 27 and
Figure 11.
Table 27: OurWinnipeg Scenario Results
Activity
Annual Emission Rate (tonne CO2e/year)
2011 2020 2031 2050
Airport N/A N/A N/A N/A
Buildings Electricity 18,284 19,900 21,663 21,635
Building Natural Gas 1,801,027 2,188,425 2,332,091 2,283,812
Transit 43,495 45,899 40,776 35,330
Vehicles-Residential 1,725,116 1,511,810 1,191,832 1,036,053
Vehicles-Commercial 945,642 832,395 659,158 580,901
Waste Disposal 798,801 738,425 796,266 839,371
Water and Waste Water 46,659 36,785 27,171 14,863
Total 5,379,024 5,373,639 5,068,956 4,811,966
Per Capita Emissions 7.78 6.92 5.78 4.58
Figure 11: OurWinnipeg Scenario Results

CITY OF WINNIPEG COMMUNITY 2011 GHG INVENTORY AND FORECAST
March 30, 2015 Report No. 13-1443-0010 52
In this scenario, overall emissions decrease significantly for the City. This is due to the
effects of new technology and City policies reducing emission rates while population
increases. Increases in emissions are seen in Building Natural Gas and Building
Electricity, which are purely due to increases in population. Increases in energy
efficiency and the use of building-scale renewables dampen this effect; population
increases by 52% by 2050 whereas emissions from natural gas and electricity only
increase by 18% and 27% each, respectively. Waste Disposal also shows a slight
increase in emissions due to population increases.
Other sectors all show decreases due to higher efficiency, more stringent standards,
new technology, and the use of recycling and compost as an alternative to landfill.
Vehicles both for residential and commercial use illustrate this clearly as even though
total kilometers travelled increases by over 70%, the gains in efficiency and use of
electric cars cause the net emissions to decrease by 40%.
Overall, the OurWinnipeg Scenario shows a 6% reduction in GHG emissions by 2031.
Because population is forecasted to increase by 27% in this time, this indicates a
reduction in per capita emissions. In 2011, per capita emissions were 7.78 tonnes of
CO2e per person, which reduces 26% to 5.78 tonnes of CO2e per person in 2031.
Looking farther ahead to 2050, we can see overall emissions reducing by 24% while
the population increases by 52%. Per capita emissions are forecasted at 4.58 tonnes
of CO2e per person in 2050, representing a decrease of 41% from 2011. See Table 28
for a summary of the changes to emission by year and sector.
Table 28: OurWinnipeg Scenario Emission Changes
Activity
Change in Annual Emission Rate
2011 2020 2031 2050
Airport N/A N/A N/A N/A
Buildings Electricity 0% 9% 18% 18%
Building Natural Gas 0% 22% 29% 27%
Transit 0% 6% -6% -19%
Vehicles-Residential 0% -12% -31% -40%
Vehicles-Commercial 0% -12% -30% -39%
Waste Disposal 0% -8% 0% 5%
Water and Waste Water 0% -21% -42% -68%
Total 0% 0% -6% -11%
Per Capita Emissions 0% -11% -26% -41%

CITY OF WINNIPEG COMMUNITY 2011 GHG INVENTORY AND FORECAST
March 30, 2015 Report No. 13-1443-0010 53
5.7 Low Carbon Path Scenario 5.7.1 Description
The Low Carbon Path is made up of an overall vision in addition to sector-specific
goals, policies, and actions. The Low Carbon Path outlines a series of policies and
actions that will result in significant GHG emission reductions over the current
OurWinnipeg planning scenario. To ensure that policies and actions result in an
emissions path that is both achievable and ambitious, Golder facilitated a workshop
with the City and key stakeholders to develop the parameters of the Low Carbon Path.
5.7.2 Assumptions
The following sub-sections present an overview of the assumptions and key indicators
used in the development of the Low Carbon Path Scenario. For a more detailed
explanation on the calculation methodology used, please refer to Appendix B.
5.7.2.1 Land Use
The land use strategy for the Low Carbon Path Scenario assumes an evolutionary shift
over the OurWinnipeg scenario with a focus infill growth, transit-oriented communities
and densification.
The key characteristics of the Low Carbon Path land use plan are as follows:
Significant and measurable emphasis is placed on achieving development
patterns and urban form in new neighbourhoods that are highly walkable, transit-
friendly, mixed-use, and complete communities;
Infilling and redevelopment ramping up modestly over time to become the primary
mechanism for building growth beyond 2031;
Substantial increase in proportion of new duplexes, secondary suites, row
houses, and multi-unit residential buildings;
Prioritization of centre and corridor intensification as focal points, characterized by
a mix of uses, higher densities, pedestrian and transit-oriented development, and
a high level of accessibility through multiple modes of transportation;
Prioritization of high density residential developments and pedestrian-oriented
transportation in the downtown;
Transit-oriented, pedestrian-oriented and active transportation development being
commonplace in all new communities;
Implementation of district energy systems for new development, where practical;
The Low Carbon Path outlines a series of policies and actions that will result in significant GHG emission reductions.

CITY OF WINNIPEG COMMUNITY 2011 GHG INVENTORY AND FORECAST
March 30, 2015 Report No. 13-1443-0010 54
Development of five additional rapid transportation corridors, beyond the
Southwest Transit Way, before 2031:
Southwest: Downtown to University of Manitoba;
West: Downtown to Polo Park, Red River College and the Airport;
East: Downtown to Kildonan Place;
Southeast: St. Boniface to St. Vital; and
Northeast: St. Boniface to River East.
Development of additional rapid transportation corridors after 2031 based on
community growth.
Development of additional transit quality corridors throughout the City; and,
Significant increase in active transportation infrastructure throughout the City with
a focus on developing dedicated corridors for commuting.
As the Low Carbon Forecast scenario is not based on any current city plans, the
building and transportation impacts from land-use policies were modeled based on the
Golder Community Energy and Emissions Mapping and Planning (CEEMAP) tool. The
CEEMAP tool uses a combination of geographic information system (GIS) spatial
analysis and information contained in databases to model the effect of various land
use, urban form and transportation changes.
A summary of the key indicator values is shown below in Table 29. Table 29: Low Carbon Path Scenario – Building and Land Use Key Indicators Inputs 2011 2020 2031 2050 Reference
Single-Family Homes
63% 61% 58% 53% Developed with CEEMAP
Multi-Unit Residential Building Homes
37% 39% 42% 47% Developed with CEEMAP
Infill Percentage of New Residential Construction
N/A 23% 50% 70% Developed with CEEMAP
5.7.2.2 Building Electricity and Natural Gas
Building electricity and natural gas use are influenced by a number of factors that are
independent of the scenarios considered. Increases to City population has a large
effect on electricity and natural gas use as the consumption scales with population in
the absence of other influences. Provincial demand-side management programs under
Manitoba Hydro have targets for reductions in both electricity and natural gas use

CITY OF WINNIPEG COMMUNITY 2011 GHG INVENTORY AND FORECAST
March 30, 2015 Report No. 13-1443-0010 55
throughout the province. Additionally, changes in building technology have an impact
on reducing the energy consumption of all new homes. Also the demand for electricity
is expected to increase in residential buildings due to an increase in consumer
electronics. All of these factors are outside of the control of the City, and are
independent of the scenarios considered.
In the scenario, the City is assumed to heavily promote a shift of building stock makeup
from single family homes to multi-unit residential buildings. Because multi-unit
residential buildings are more energy efficient than single family homes, this would
represent a decrease in energy use per person, both electricity and natural gas. The
City would also promote building-scale renewables and energy efficient technologies
through new policy tools and incentives, which might include promotion of
Passivehaus, LEED, or EnergyStar building design. Building-scale renewables would
continue to be primarily limited to geothermal heating systems with some solar water
heating. Additionally, within the Low Carbon Path Scenario, the City would aim to
increase district energy systems by promoting limited adoption in targeted areas such
as downtown, and requiring district energy system readiness in new developments.
A summary of the key indicator values is shown below in Table 30.

CITY OF WINNIPEG COMMUNITY 2011 GHG INVENTORY AND FORECAST
March 30, 2015 Report No. 13-1443-0010 56
Table 30: Low Carbon Path Scenario – Building Electricity and Natural Gas Key Indicators Inputs 2011 2020 2031 2050 Reference Building Electricity Intensity Reduction due to Demand Side Management
0% 4% 5% 10% Manitoba Hydro
Building Natural Gas Intensity Reduction due to Demand Side Management
0% 2% 3% 6% Manitoba Hydro
New Building Energy Intensity Reduction due to Building Stock Changes
0% 8% 17% 33% Calculated
New Building Energy Intensity Reduction due to Technology Changes
0% 14% 30% 59% Assumed
Additional Electricity Use 0% 5% 10% 21% Manitoba Hydro
Residential Building Scale Renewables
1.5% 4% 8% 14%
Manitoba Geothermal Energy Alliance
Commercial/Industrial Building Scale Renewables
1.5% 6% 12% 22%
Manitoba Geothermal Energy Alliance
Residential Buildings Connected to District Energy Systems
0% 2% 4% 8% Assumed
Commercial Buildings Connected to District Energy Systems
< 1% 3% 6% 12% Assumed
Residential Electricity Use (kWh/year)
1,690,588,866 1,873,133,493 2,066,458,470 2,144,637,253 Calculated
Commercial Electricity Use (kWh/year)
3,046,484,478 3,259,313,820 3,423,823,982 3,117,963,439 Calculated
Industrial Electricity Use (kWh/year)
837,309,539 895,804,516 941,019,231 856,955,139 Calculated
Residential Natural Gas Use (m3/year)
488,426,808 583,814,306 604,010,541 570,215,446 Calculated
Commercial Natural Gas (m3/year)
361,222,578 433,410,227 448,167,147 403,452,094 Calculated
Industrial Natural Gas (m3/year)
104,025,761 125,152,448 129,843,331 117,562,603 Calculated

CITY OF WINNIPEG COMMUNITY 2011 GHG INVENTORY AND FORECAST
March 30, 2015 Report No. 13-1443-0010 57
5.7.2.3 Transit
The Low Carbon Path Scenario assumes that the City would continue to use B2 diesel
in buses, with fuel efficiency of buses improving due to changes in technology.
Additionally, there would be a larger phase-in of diesel-electric hybrid or fully electric
buses. The City would rapidly expand their transit network and increase land use
intensification around transit corridors to accommodate the increased population and to
promote a more transit-friendly city. This transit network expansion would result in a
significant increase in transit usage in the city. The City is also expected to introduce
electric light rail transit in this scenario, the first being completed before 2031.
A summary of key indicator values is shown below in Table 31.
Table 31: Low Carbon Path Scenario – Transit Key Indicators Inputs 2011 2020 2031 2050 ReferenceKilometers of Transit Travel (km/year)
24,282,940 31,351,034 41,205,637 61,377,308 Assumed
Transit Fuel Type (% of kilometers travelled)
100% B2 Biodiesel
85% B2 Biodiesel 15% Electric
60% B2 Biodiesel 40% Electric
25% B2 Biodiesel 75% Electric
Assumed
Diesel Fuel Use (L/year)
16,163,620 16,651,425 13,423,738 6,334,817 Calculated
Electricity Use (MWh/year)
0 16,459 57,688 161,115 Calculated
5.7.2.4 Vehicles
Between all scenarios, GHG emissions per kilometer travelled are also expected to
decrease as the result of new technology and new government policies, such as
federal government tailpipe emission standards. As vehicular usage represents a large
percentage of overall community emissions, the extent of fuel economy improvements
represents one of the most significant areas of uncertainty in the overall community
GHG emissions forecast. Fuel economy improvements assumed in the forecast are
based on the continued adoption of government regulations mandating vehicular fuel
efficiency standards, technology roll-out for low-emission vehicles and economic
considerations, such as sustained increase in oil prices.
A projection of emissions per kilometer travelled for new vehicles was obtained from a
UNEP study on Canadian Automotive Fuel Economy Policy [7]. To determine the GHG
emissions from the combined fleet on the road, the average vehicle on the road in
Winnipeg was assumed to be 10 years old. This assumption was based on the current
vehicle makeup from the registration data provided by the Manitoba Public Insurance.
In the Low Carbon Path Scenario, the public transit infrastructure expands rapidly,
reducing the number of passenger vehicles on the road. In parallel with improvements

CITY OF WINNIPEG COMMUNITY 2011 GHG INVENTORY AND FORECAST
March 30, 2015 Report No. 13-1443-0010 58
in transit, this scenario includes an aggressive expansion of year-round connected
networks of bike trails and active transportation infrastructure. Additionally, the City will
promote segregated bike lanes and off-road bike paths. Electric vehicles will have
increased adoption due to substantial growth of private and public electric vehicle
infrastructure. The City fleet would also be partially retrofitted to electric vehicles.
A summary of key indicator values is shown below in Table 32.
Table 32: Low Carbon Path Scenario – Vehicle Key Indicators Inputs 2011 2020 2031 2050 Reference Cycle Network (km) 274 600 800 800 Assumed Total Residential Vehicle Kilometers Travelled (vkmt/year)
5,175,656,607 4,943,881,915 5,976,259,971 5,889,224,738 Calculated
Total Commercial Vehicle Kilometers Travelled (vkmt/year)
932,055,814 988,776,383 1,195,251,994 1,177,844,948 Calculated
Electric Vehicle Use 0% 4% 8% 16% Assumed Weekday Trips by Mode Auto Driver Auto Passenger Public Transit Walk/Cycle
64% 18% 10% 8%
61% 18% 11% 9%
58% 18% 13% 10%
54% 18% 15% 11%
Assumed
Average Residential Fleet Emissions (gCO2e/km)
370 269 185 121 Calculated
Average Commercial Fleet Emissions (gCO2e/km)
1015 752 532 359 Calculated
5.7.2.5 Waste Disposal
In all scenarios, the average waste generated remains the same. This means that
across the scenarios, the waste increases proportionally as the City grows.
In the OurWinnipeg Scenario, the City goes beyond the 2011 Garbage and Recycling
Master Plan to further increases the amount of residential, commercial/industrial and
construction/demolition waste sent for beneficial use (i.e., recycling or composting).
This scenario also has improvements to landfill gas collection efficiency above and
beyond the OurWinnipeg Scenario through greater expansion of the landfill gas
collection system to incorporate all new waste and higher methane capture efficiency.
Additionally, the Low Carbon Path includes a reduction in yard waste sent to landfills
due to initiatives by the City, leading to an overall decrease in residential waste and a
slight change in the residential waste makeup. The scenario assumes the rollout of a
residential source separated organics program to meet the residential diversion rate
targets.
A summary of key indicator values is shown below in Table 33.

CITY OF WINNIPEG COMMUNITY 2011 GHG INVENTORY AND FORECAST
March 30, 2015 Report No. 13-1443-0010 59
Table 33: Low Carbon Path Scenario – Waste Disposal Key Indicators Inputs 2011 2020 2031 2050 Reference Residential Waste (tonne/year) 278,896 209,225 99,794 119,521 Calculated Commercial/Industrial Waste (tonne/year)
348,000 337,577 108,484 112,738 Calculated
Construction/Demolition Waste (tonne/year)
124,000 130,746 38,655 40,171 Calculated
Residential Diversion Rate 15% 42% 75% 75% Assumed Commercial/Industrial Diversion Rate 20% 31% 80% 80% Assumed Construction/Demolition Diversion Rate 20% 25% 80% 80% Assumed Landfill Gas Collection Coverage (City Landfills)
100% 100% 100% 100% Assumed
Landfill Gas Collection Efficiency (City Landfills)
55% 75% 75% 75% Assumed
Landfilled Waste Per Capita (tonne/person/year)
1.09 0.87 0.28 0.26 Calculated
5.7.2.6 Water and Waste Water
For all scenarios, total mass of biosolids associated with waste water increases with
population. In the Low Carbon Path Scenario, the treatment methods do not change at
all. However, this scenario does show a near-elimination of biosolids sent to landfill
through beneficial use and composting due to City initiatives.
A summary of key indicator values is shown below in Table 34.
Table 34: OurWinnipeg Scenario – Water and Waste Water Key Indicators Inputs 2011 2020 2031 2050 Reference
Mass of Biosolids Disposed (tonne/year)
13,982 15,700 17,700 21,200 Calculated
Biosolids Sold for Beneficial Use 0% 35% 70% 80% Assumed Biosolids Composted 0% 20% 30% 20% Assumed

CITY OF WINNIPEG COMMUNITY 2011 GHG INVENTORY AND FORECAST
March 30, 2015 Report No. 13-1443-0010 60
5.7.3 Results
The results from the OurWinnipeg Scenario can be seen below in Table 35 and
Figure 12.
Table 35: Low Carbon Path Scenario Results
Activity
Annual Emission Rate (tonne CO2e/year)
2011 2020 2031 2050
Airport N/A N/A N/A N/A
Buildings Electricity 18,284 19,773 21,095 20,269
Building Natural Gas 1,801,027 2,157,394 2,232,262 2,060,799
Transit 43,495 44,863 36,314 17,581
Vehicles-Residential 1,725,116 1,328,977 1,106,737 711,609
Vehicles-Commercial 945,642 743,520 636,026 423,165
Waste Disposal 798,801 650,971 219,989 234,502
Water and Waste Water 46,659 31,126 14,411 14,863
Total 5,379,024 4,976,624 4,266,834 3,482,788
Per Capita Emissions 7.78 6.41 4.87 3.32
Figure 12: Low Carbon Path Scenario Results

CITY OF WINNIPEG COMMUNITY 2011 GHG INVENTORY AND FORECAST
March 30, 2015 Report No. 13-1443-0010 61
In this scenario, overall emissions decrease very significantly for the City. This is due
to the effects of new technology and aggressive City policies reducing emission rates
while population increases. Increases in emissions are only seen marginally in Building
Natural Gas and Building Electricity, which are purely due to increases in population.
Promotion of multi-unit residential buildings, increases in energy efficiency, and the use
of building-scale renewables considerably dampen this effect; population increases
52% by 2050 whereas emissions from natural gas and electricity only increase by 11%
and 14% each, respectively.
Other sectors all show significant decreases due to City policies, higher efficiency,
more stringent standards, new technology, and the use of recycling and composting as
an alternative to landfill.
Overall, the Low Carbon Path Scenario shows a 21% reduction in GHG emissions by
2031. As population is forecasted to increase by 27% in this time, this indicates a
drastic reduction in per capita emissions. In 2011, per capita emissions were 7.78
tonnes of CO2e per person, which reduces 37% to 4.87 tonnes of CO2e per person in
2031. Looking farther ahead to 2050, we can see overall emissions reducing by 35%
while the population increases by 52%. Per capita emissions are forecasted at 3.32
tonnes of CO2e per person in 2050, representing a decrease of 57% from 2011. See
Table 36 for a summary of the changes to emission by year and sector.
Table 36: Low Carbon Path Scenario Emission Changes
Activity
Change in Annual Emission Rate
2011 2020 2031 2050
Airport N/A N/A N/A N/A
Buildings Electricity 0% 8% 15% 11%
Building Natural Gas 0% 20% 24% 14%
Transit 0% 3% -17% -60%
Vehicles-Residential 0% -23% -36% -59%
Vehicles-Commercial 0% -21% -33% -55%
Waste Disposal 0% -19% -72% -71%
Water and Waste Water 0% -33% -69% -68%
Total 0% -7% -21% -35%
Per Capita Emissions 0% -18% -37% -57%

CITY OF WINNIPEG COMMUNITY 2011 GHG INVENTORY AND FORECAST
March 30, 2015 Report No. 13-1443-0010 62
5.8 Summary of Forecast GHG Emissions A comparison of the scenarios for 2031 can be seen below in Table 37 and Figure 13.
Table 37: Comparison of Scenario Results
Activity
Annual Emission Rate (tonne CO2e/year)
Baseline (2011)
Business as Usual (2031)
OurWinnipeg (2031)
Low Carbon Path (2031)
Airport N/A N/A N/A N/A
Buildings Electricity 18,284 21,768 21,663 21,095
Building Natural Gas 1,801,027 2,375,323 2,332,091 2,232,262
Transit 43,495 35,479 40,776 36,314
Vehicles-Residential 1,725,116 1,227,376 1,191,832 1,106,737
Vehicles-Commercial
945,642 672,696 659,158 636,026
Waste Disposal 798,801 1,093,004 796,266 219,989
Water and Waste Water
46,659 56,945 27,171 14,411
Total 5,379,024 5,482,591 5,068,956 4,266,834
Per Capita Emissions
7.78 6.25 5.78 4.87

CITY OF WINNIPEG COMMUNITY 2011 GHG INVENTORY AND FORECAST
March 30, 2015 Report No. 13-1443-0010 63
Figure 13: Comparison of 2031 Scenario Results
The Business as Usual Scenario shows a slight increase in emissions by 2031 where
the OurWinnipeg Scenario has a moderate reduction and the Low Carbon Path
Scenario shows a significant reduction in GHG emissions. Recall that the primary
difference between the scenarios was actions taken by the City.
By examining the sectors individually, we observe the importance of City policies on
Waste Disposal and Water and Waste Water. The Business as Usual Scenario shows
a significant increase in these categories whereas the OurWinnipeg Scenario shows a
slight decrease and the Low Carbon Path Scenario shows a significant decrease in
emissions. This emphasizes the influence of the City’s policies such as diversion rates,
yard recycling, land fill gas collection efficiency, and biosolid composting and sales for
beneficial use.
Conversely, we find that emissions from building electricity and natural gas, transit, and
vehicles do not seem to be impacted significantly by City policies. However, noting that
these sectors show much slower response to GHG reduction policies because they
involve replacement on time-scales of 10 or more years is important. This means that
even though drastic results are not yet shown in the forecasts for 2031, emission-
focused policies will set the City on the path toward long-term sustainability.

CITY OF WINNIPEG COMMUNITY 2011 GHG INVENTORY AND FORECAST
March 30, 2015 Report No. 13-1443-0010 64
This this path towards long-term sustainability can be seen in Figure 14, below, which
illustrates the changes in GHG emissions over time for all Scenarios.
Figure 14: Comparison of All Scenarios Results
From these trends, we can clearly see that even though the aggressive emission-
focused policies of the Low Carbon Path Scenario did not make a very large impact in
2031, they do offer a trend in the right direction. By 2050, the Low Carbon Path
Scenario shows a reduction in emissions of 35% for the City whereas the OurWinnipeg
Scenario only shows 11%. For comparison, the Business as Usual Scenario has
almost no change, with an increase of only 0.2% overall.
Examining the categories individually again, we look to Figure 15 for a breakdown of
the 2050 emissions for all scenarios.

CITY OF WINNIPEG COMMUNITY 2011 GHG INVENTORY AND FORECAST
March 30, 2015 Report No. 13-1443-0010 65
Figure 15: Comparison of 2050 Scenario Results
As in the 2031 comparison, the drastic differences in emissions associated with Waste
Disposal and Water and Waste Water are apparent. However, here we can see that
emissions from Building Natural Gas and Electricity are clearly different between
scenarios. This is primarily due to the differences in building stock. The OurWinnipeg
Scenario has a moderate shift from single family homes to multi-unit residential
buildings, which leads to the slight improvement in emissions over the Business as
Usual Scenario. The Low Carbon Path shows even further improvements in building
emissions because it involves a much greater promotion of multi-unit residential
buildings.
Looking at all transportation emissions, we can see the effects of the City policies of an
expanded public transportation network and promotion of electric vehicles for the
general public, City vehicles, and transit vehicles. Because of these factors, the total
kilometers driven for residential and commercial vehicles decrease in the OurWinnipeg
and Low Carbon Path Scenarios, leading to the reduced emissions. Furthermore,
although the OurWinnipeg and Low Carbon Path Scenarios would have more
kilometers traveled for transit vehicles, overall emissions go down due to the shift
toward electric hybrid and full electric buses.

CITY OF WINNIPEG COMMUNITY 2011 GHG INVENTORY AND FORECAST
March 30, 2015 Report No. 13-1443-0010 66
6.0 ANALYSIS OF EMISSION REDUCTION OPPORTUNITIES
Emission reduction opportunities are currently being pursued by the City of Winnipeg
as a part of their OurWinnipeg planning initiative. While the forecast shows a reduction
in carbon emissions, many of the emissions reductions are associated with
technological and senior government level policies that are not directly within the
purview of the City of Winnipeg.
The Low Carbon Path forecast scenario was developed to demonstrate what additional
potential carbon reduction strategies could be pursued beyond the policies set out as a
part of the OurWinnipeg planning initiative. The policy assumptions of the Low Carbon
Path are considered to be a moderate, evolutionary and practical improvement over
the current plans.
The emission reduction opportunities have been divided into the following areas for
analysis:
Land Use and Buildings;
Transportation; and
Waste, Wastewater and Water Management.
To reduce GHG emissions to this level and noticeably change the energy mix in
Winnipeg, the City would likely need to undertake the activities outlined below.
Note that the cost, timing, or sequencing of these recommendations has not been
evaluated or proposed as part of this discussion paper. Further analysis by the City on
the resource requirements for these recommendations, opportunities for
implementation, readiness of the marketplace, and timing considerations is
recommended. This analysis will allow the City to prioritize these recommendations
and create a more detailed implementation plan as part of the City of Winnipeg carbon
reduction strategy.
While the forecast shows a reduction in carbon emissions, many of the emissions reductions are associated with technological and senior government level policies that are not directly within the purview of the City of Winnipeg.
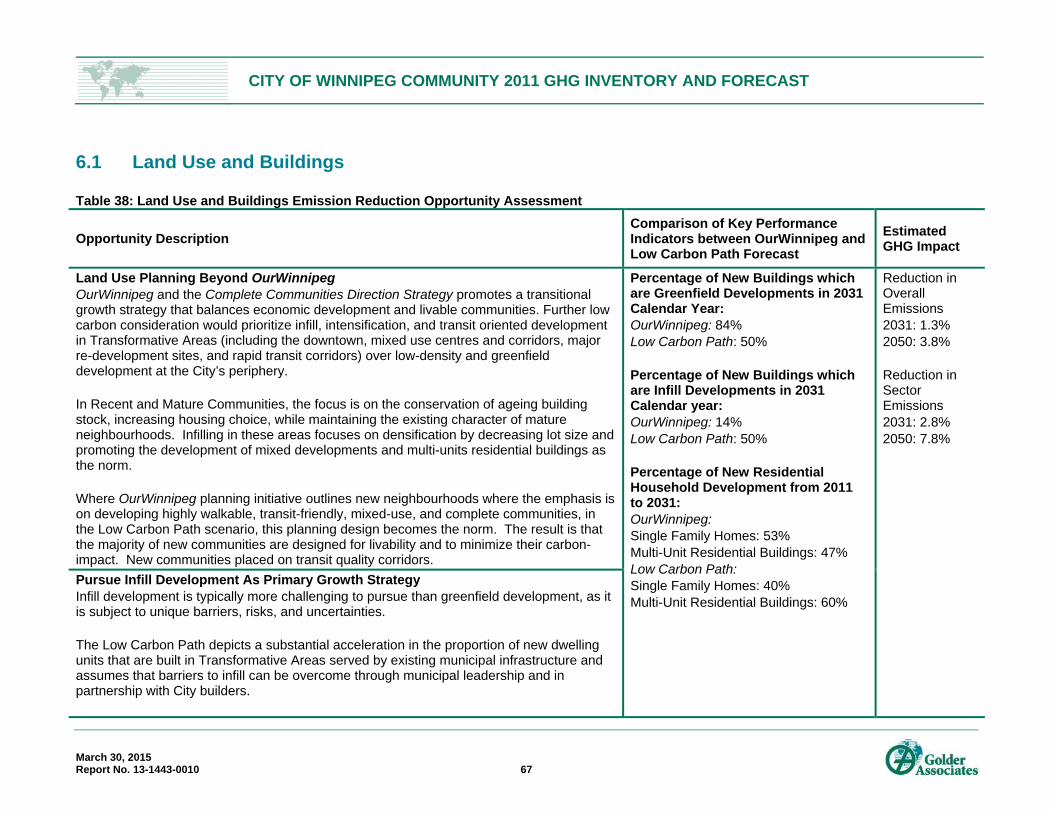
CITY OF WINNIPEG COMMUNITY 2011 GHG INVENTORY AND FORECAST
March 30, 2015 Report No. 13-1443-0010 67
6.1 Land Use and Buildings Table 38: Land Use and Buildings Emission Reduction Opportunity Assessment
Opportunity Description Comparison of Key Performance Indicators between OurWinnipeg and Low Carbon Path Forecast
Estimated GHG Impact
Land Use Planning Beyond OurWinnipeg OurWinnipeg and the Complete Communities Direction Strategy promotes a transitional growth strategy that balances economic development and livable communities. Further low carbon consideration would prioritize infill, intensification, and transit oriented development in Transformative Areas (including the downtown, mixed use centres and corridors, major re-development sites, and rapid transit corridors) over low-density and greenfield development at the City’s periphery. In Recent and Mature Communities, the focus is on the conservation of ageing building stock, increasing housing choice, while maintaining the existing character of mature neighbourhoods. Infilling in these areas focuses on densification by decreasing lot size and promoting the development of mixed developments and multi-units residential buildings as the norm. Where OurWinnipeg planning initiative outlines new neighbourhoods where the emphasis is on developing highly walkable, transit-friendly, mixed-use, and complete communities, in the Low Carbon Path scenario, this planning design becomes the norm. The result is that the majority of new communities are designed for livability and to minimize their carbon-impact. New communities placed on transit quality corridors.
Percentage of New Buildings which are Greenfield Developments in 2031 Calendar Year: OurWinnipeg: 84% Low Carbon Path: 50% Percentage of New Buildings which are Infill Developments in 2031 Calendar year: OurWinnipeg: 14% Low Carbon Path: 50% Percentage of New Residential Household Development from 2011 to 2031: OurWinnipeg: Single Family Homes: 53% Multi-Unit Residential Buildings: 47% Low Carbon Path: Single Family Homes: 40% Multi-Unit Residential Buildings: 60%
Reduction in Overall Emissions 2031: 1.3% 2050: 3.8% Reduction in Sector Emissions 2031: 2.8% 2050: 7.8%
Pursue Infill Development As Primary Growth Strategy Infill development is typically more challenging to pursue than greenfield development, as it is subject to unique barriers, risks, and uncertainties. The Low Carbon Path depicts a substantial acceleration in the proportion of new dwelling units that are built in Transformative Areas served by existing municipal infrastructure and assumes that barriers to infill can be overcome through municipal leadership and in partnership with City builders.

CITY OF WINNIPEG COMMUNITY 2011 GHG INVENTORY AND FORECAST
March 30, 2015 Report No. 13-1443-0010 68
Opportunity Description Comparison of Key Performance Indicators between OurWinnipeg and Low Carbon Path Forecast
Estimated GHG Impact
Promote Modest Growth of Building-Scale Renewable Energy Building scale renewables have had limited implementation primarily due to the current low cost of electricity (5 to 7¢ per kWh) and natural gas (17¢ per m3). While the low price of electricity makes investment in building-scale renewable electricity generation impracticable from an economic perspective, alternative space and hot water heating technologies have become an attractive way to reduce natural gas usage over time. The Low Carbon Path assumes that non-electricity generating building-scale renewables, such as geoexchange or solar hot water system, will be promoted by means of a tax incentive or subsidy, but will not be required on new development opportunities. Development of building scale renewables will be promoted with a small subsidy or tax incentive. Other strategies such as promotion of ‘solar-ready’ new developments will also be implemented in the Low Carbon Path.
Percentage of All Buildings that Operate Building-Scale Renewables in 2031: OurWinnipeg: 4% Residential 6% Commercial and Industrial Low Carbon Path: 8% Residential 12% Commercial and Industrial
Reduction in Overall Emissions 2031: 0.6% 2050: 0.7% Reduction in Sector Emissions 2031: 1.2% 2050: 1.5%
Increase Uptake of District Energy Systems in New in New Residential, Commercial and Industrial Development District energy system are an effective means to provide economic heating and even electrical power to large developments. Currently, there is limited implementation of geoexchange district energy such as the Forks Market, IKEA and McPhillips Common geoexchange systems. In the OurWinnipeg planning initiative it is assumed that geoexchange district energy systems will continue to grow for some of the new developments. In the Low Carbon Path it is assumed that municipal tax incentives have been implemented to promote the further implementation of district energy systems.
Percentage of Buildings Connected to District Energy Systems in 2031 OurWinnipeg: 2% Residential 3% Commercial and Industrial Low Carbon Path: 4% Residential 126 Commercial and Industrial
Reduction in Overall Emissions 2031: 0.1% 2050: 0.2% Reduction in Sector Emissions 2031: 0.2% 2050: 0.4%

CITY OF WINNIPEG COMMUNITY 2011 GHG INVENTORY AND FORECAST
March 30, 2015 Report No. 13-1443-0010 69
6.2 Transportation Table 39: Transportation Emission Reduction Opportunity Assessment
Opportunity Description Comparison of Key Performance Indicators between OurWinnipeg and Low Carbon Path Forecast
Estimated GHG Impact
Complete the Rapid Transit Network and Improvement of Transit Service The OurWinnipeg forecast assumes a build-out of rapid transit in accordance with Winnipeg’s Transportation Master Plan, including the completion of the Southwest, East, North, and West corridors by 2031, and continued implementation of improvements to designated Transit Quality Corridors. The Low Carbon Forecast assumes a full build-out of the rapid transit system proposed in the Transportation Master Plan by 2031, including the Southeast and Northeast corridors. Additionally, all transit routes are assumed to have achieved at least 30-minute service headways at all times. The Low Carbon Forecast further assigns a majority of new infill development along rapid transit corridors, transit quality corridors, and mixed use centres and corridors identified in the Transportation Master Plan and the Complete Communities Direction Strategy. This accelerated infill is assumed to be achieved through supportive policy, planning tools, and incentives complementary to increasing the efficiency of the transit network. New suburban communities as identified in the Complete Communities direction strategy are targeted for enhanced service and access to this network of corridors.
Commuter Mode Share in 2031: OurWinnipeg: 63% Auto-Driver 18% Auto-Passenger 10% Public Transit 8% Walking/Cycling Low Carbon Path: 58% Auto-Driver 18% Auto-Passenger 13% Public Transit 10% Walking/Cycling Total Annual Vehicle Kilometers Traveled in 2031: OurWinnipeg: Residential: 6,161,200,000 km / year Commercial: 1,232,200,000 km / year Low Carbon Path: Residential: 5,976,300,000 km / year Commercial: 1,195,300,000 km / year Active Transportation Network OurWinnipeg: 674 km Low Carbon Path: 800 km
Reduction in Overall Emissions 2031: 1.2% 2050: 9.1% Reduction in Sector Emissions 2031: 3.1% 2050: 26.4%
Complete the Active Transportation Network and Promotion of Alternative Transportation Options Winnipeg’s Transportation Master Plan includes a proposed long term active transportation network expansion to 674km from 274km in 2011. The OurWinnipeg forecast assumes this proposed network will be complete by 2031.

CITY OF WINNIPEG COMMUNITY 2011 GHG INVENTORY AND FORECAST
March 30, 2015 Report No. 13-1443-0010 70
Opportunity Description Comparison of Key Performance Indicators between OurWinnipeg and Low Carbon Path Forecast
Estimated GHG Impact
The Low Carbon Path assumes that the active transportation network completion is accelerated and grows as the City expands to facilitate convenient and direct trips to daily destinations and amenities by foot or by bike. The Low Carbon Path also assumes additional incentives and policies are implemented to manage transportation demand within the community. This may include high-occupancy vehicle lanes along major corridors and car pool programs which are estimated to allow the share of vehicle passenger travel to keep up with the growth in City population.
Increase Uptake of Electric and Low-Emission Vehicles In 2014, the first public electric vehicle charging station was installed in Winnipeg. As electric vehicle technology improves, the infrastructure needed to support the technology will also need to be developed. While Winnipeg has abundant block heater outlets, most outlets are cycled, which make the impractical for electric vehicle usage. The Manitoba provincial government has begun the implementation of its Electric Vehicle road map; however, the planned roll is limited and will not support anything beyond a minor adoption of electrical vehicle in the near future. Whereas the OurWinnipeg forecast assumes modest in electric vehicles, the Low Carbon Path forecast presumes more aggressive growth in electric vehicles by 2031. Local regulatory and policy tools and incentives are assumed to support this growth through the provision of ‘electric-vehicle ready’ homes and the strategic installation of public rapid charging infrastructure in new development. Additionally, the forecast assumes that new provincial incentives for charging infrastructure and electric vehicle deployment may be required. Up to 50% of the City’s own municipal non-transit passenger vehicles are assigned to be electric in accordance with an expansion of the City’s Green Fleet Plan.
Electric Vehicle Share as Percentage of Overall Vehicle Kilometers Traveled in 2031: OurWinnipeg: 2% Low Carbon Path: 8%
Reduction in Overall Emissions 2031: 0.6% 2050: 0.7% Reduction in Sector Emissions 2031: 1.5% 2050: 2.0%

CITY OF WINNIPEG COMMUNITY 2011 GHG INVENTORY AND FORECAST
March 30, 2015 Report No. 13-1443-0010 71
Opportunity Description Comparison of Key Performance Indicators between OurWinnipeg and Low Carbon Path Forecast
Estimated GHG Impact
Electrification of Transit Fleet As a part of Winnipeg Transit long-term planning, 10% of their transit fleet is estimated to be replaced by battery-electric vehicles by 2031. In the Low Carbon Path, replacement is assumed to have been expanded through both the one-for-one replacement of diesel and biodiesel buses with battery-electric vehicles, but also the limited implementation of electric trolley buses.
Percentage of Winnipeg Transit Diesel and Electric Buses Fleet in 2031 OurWinnipeg: Diesel and Biodiesel: 90% Electric: 10% Low Carbon Path: Diesel and Biodiesel: 60% Electric: 40%
Reduction in Overall Emissions 2031: 0.5% 2050: 0.6% Reduction in Sector Emissions 2031: 1.4% 2050: 2.0%

CITY OF WINNIPEG COMMUNITY 2011 GHG INVENTORY AND FORECAST
March 30, 2015 Report No. 13-1443-0010 72
6.3 Waste, Water and Wastewater Table 40: Waste, Water and Wastewater Emission Reduction Opportunity Assessment
Opportunity Description Comparison of Key Performance Indicators between OurWinnipeg and Low Carbon Path Forecast
Estimated GHG Impact
Enhance the Garbage and Recycling Master Plan The Sustainable Water and Waste component of the OurWinnipeg planning initiative outlines various new policies and programs that will be implemented by 2031 to reduce the amount of waste entering the landfill including yard waste composting and development of an organics strategy. The Low Carbon Path forecast assumes that additional educational programs and waste policies are implemented to further increase the diversion rate of existing recycling programs. A City-wide organics diversion program is assumed to have been implemented.
Waste Diversion Percentages in 2031: OurWinnipeg: Residential: 50% Commercial/Industrial: 20% Construction/Demolition: 20% Low Carbon Path: Residential: 75% Commercial/Industrial: 80% Construction/Demolition: 80% Landfill Gas Collection Coverage for Non-City Landfills in 2031 OurWinnipeg: 0% Low Carbon Path: 25% Landfill Gas Collection Efficiency for City Landfills in 2031 OurWinnipeg: 75% Low Carbon Path: 75%
Reduction in Overall Emissions 2031: 11.4% 2050: 12.6% Reduction in Sector Emissions 2031: 72.4% 2050: 72.1%
Expand Landfill Gas Collection System for Non-City of Winnipeg Landfills The OurWinnipeg forecast presumes that the Brady Resource Recovery Centre’s landfill gas collection system will be expanded over time and its methane collection efficiency will improve to 75%. A large proportion of commercial, industrial, institutional, and construction and demolition waste is landfilled outside of the City. The Low Carbon Path assumes that measures will be in place to capture at least 25% of the methane generating potential of this waste by 2031.
Eliminate the Landfilling of Biosolids The City of Winnipeg is currently looking at ways to commercialize the biosolids generated as a part of their wastewater treatment system. In 2031, the City plans to market some of its biosolids for resale and compost the remaining amount. In the Low Carbon Forecast scenario, the City is
Percent of City Wastewater Biosolids Diverted for Commercial Usage in 2031 OurWinnipeg: 40% Low Carbon Path: 70%
Reduction in Overall Emissions 2031: 0.3% 2050: 0.0%

CITY OF WINNIPEG COMMUNITY 2011 GHG INVENTORY AND FORECAST
March 30, 2015 Report No. 13-1443-0010 73
Opportunity Description Comparison of Key Performance Indicators between OurWinnipeg and Low Carbon Path Forecast
Estimated GHG Impact
assumed to be able to market the majority of its biosolids for use in the agriculture or landscaping industries, offsetting the amount of fertilizer that is required.
Reduction in Sector Emissions 2031: 47.0% 2050: 0.0%

CITY OF WINNIPEG COMMUNITY 2011 GHG INVENTORY AND FORECAST
March 30, 2015 Report No. 13-1443-0010 74
6.4 Summary of Emission Reduction Opportunities A summary of the impact of the OurWinnipeg emission reduction opportunities is
shown in Figure 16. Each emission reduction opportunity is shown as having an
incremental reduction in City emissions from the Business as Usual Scenario.
Figure 16: Summary of OurWinnipeg Emission Reduction Opportunities
A summary of the impact of the Low Carbon Path emission reduction opportunities is
shown below in Figure 17. The emissions reduction beyond the OurWinnipeg Scenario
is shown for each reduction opportunity. The Low Carbon Path forecast assumes all of
the emission reduction opportunities have been implemented.

CITY OF WINNIPEG COMMUNITY 2011 GHG INVENTORY AND FORECAST
March 30, 2015 Report No. 13-1443-0010 75
Figure 17: Summary of Low Carbon Path Emission Reduction Opportunities
The largest impact to overall emissions is seen through rapid transit and active
transportation improvements. Additionally, land use planning also represents the
potential for significant emission reductions within the City. These opportunities do not
yet show a drastic improvement by 2031; however, they set the City on the right path
for a low emissions future. Looking forward to the 2050 forecast, we can see that these
emission reduction opportunities show the largest GHG reductions for the City.

CITY OF WINNIPEG COMMUNITY 2011 GHG INVENTORY AND FORECAST
March 30, 2015 Report No. 13-1443-0010 76
7.0 RECOMMENDED FURTHER ACTIONS Update Inventory to Include James Armstrong Richardson International Airport
The 2011 City of Winnipeg community GHG inventory excluded emissions assigned to
the Winnipeg James Armstrong Richardson International Airport. Originally, the airport
emissions were to be included within the scope of the study, however, the Winnipeg
Airport Authority (WAA) GHG consumption data was under the process of being
prepared, but not publically available at the time of the study.
Future City of Winnipeg community GHG inventories should include emissions
associated non-building energy consumption at the airport (mobile equipment and
aircraft) within the scope of the community inventory in accordance with the ICLEI
protocol. As the airport is currently preparing their own GHG inventory report, the
inclusion of airport emissions should be a relatively simple exercise. The key would be
to ensure that the emissions from building electricity and natural gas consumption
included in the WAA GHG report be excluded, as it is already included from the MB
Hydro energy consumption dataset.
Track Key Performance Indicators
As a part of the preparation of the community inventory, several key performance
indicators (KPIs) were identified as driving community GHG performance. Some of the
KPIs were readily available based information supplied by data providers. Other
indicators may need to be developed and tracked based on a broader City
engagement with external organization.
Particularly, additional data monitoring and collection is recommended with respect to
the building energy consumption and the data set provided by Manitoba Hydro and
collected by the City of Winnipeg. The indicators include, but are not limited to:
Residential, commercial and institutional electricity and natural gas intensity as a
function of energy consumption per unit building area;
Inventory of existing building stock including building type and age; and
Energy consumption disaggregated by postal code.
Future City of Winnipeg community GHG inventories should include emissions associated non-building energy consumption at the airport (mobile equipment and aircraft) within the scope of the community inventory in accordance with the ICLEI protocol.

CITY OF WINNIPEG COMMUNITY 2011 GHG INVENTORY AND FORECAST
March 30, 2015 Report No. 13-1443-0010 77
Other major planning indicators include:
Transit headway;
Density on transit corridors;
Transportation mode share;
Waste generation per capita; and
Infill (i.e., comparison of new building starts in greenfield vs. existing development
areas).
A complete summary of all GHG KPIs recommended to be tracked a part of an overall
community action plan is included in Appendix C. The goal of collecting these
additional KPIs will be to provide to set the data collection methodologies and collect
the data necessary to set targets and goals as a part of a broader Community Energy
Plan.
Develop Advisory Group
To move ahead with climate action planning in the City of Winnipeg, it is recommended
that the City develop an Advisory Group that will set GHG planning goals and targets in
consultation and with approval of the City of Winnipeg Council. A core group of 10-14
individuals is recommended to form the executive of the group with a broader
consultation group including many of the same members who participated in the Low
Carbon Path stakeholder engagement component of the inventory project. The core
executive is recommended to consist of:
City of Winnipeg Council Sponsor
City of Winnipeg Climate Change Coordinator
City of Winnipeg Transportation Planner
City of Winnipeg Waste Planner
City of Winnipeg Land Use Planner
Manitoba Hydro Power Smart
Winnipeg Airport Authority
4-6 leaders from non-governmental community organizations, which may include,
but is not limited to:
Community environmental and social advocacy groups;
Winnipeg Chamber of Commerce;

CITY OF WINNIPEG COMMUNITY 2011 GHG INVENTORY AND FORECAST
March 30, 2015 Report No. 13-1443-0010 78
First Nations groups
Local academia experts focussing on climate change, alternative energy
and/or energy efficiency.
The core executive of the Advisory Group would meet regularly and would lead the
design, implementation and monitoring of the Climate Action Plan. Input and feedback
should be solicited from the broader action group for targeting setting, policy
development and to review and comment on key deliverables.
Engage the Public
To solicit feedback outside the Advisory Group during the preparation and
implementation of the Climate Action Plan, the development of a public engagement
strategy is recommended. Feedback could be solicited through a series of public
workshops, mail outs, social media and online resources. The City’s communication
department is recommended to play an active role is communicating the role of the
Climate Action Plan to ensure representative feedback is received by the community.
Develop a Climate Action Plan
The key tool that outlines how the City of Winnipeg will set their climate goals and
implement their reduction strategy should be the implementation of a detailed Climate
Action Plan. The goal of the plan is to serve as a blueprint for how to community will
achieve its energy and GHG reduction targets. Several protocols and guides have
been developed that outlines the scope and methodology that should be used in the
preparation of the plan, including, but not limited to:
Federation of Canadian Municipalities Partners, Climate Change Milestone 3
protocol [11];
Quality Urban Energy Systems of Tomorrow (QUEST), Advancing Integrated
Community Energy Planning in Ontario: A Primer [12];
The Community Energy Association’s (CEA’s) and the Province of British
Columbia, Community Energy & Emissions Planning: A Guide for B.C. Local
Governments [13]; and
Natural Resources Canada, Community Energy Planning Guide [14].

CITY OF WINNIPEG COMMUNITY 2011 GHG INVENTORY AND FORECAST
March 30, 2015 Report No. 13-1443-0010 79
Each protocol approaches community energy planning from a slightly different
perspective. However, irrespective of the protocol, many of the tenets are similar and
generally consist of:
Outlining measurable, quantifiable and actionable goals for community energy
and GHG reductions broken down by sector (waste, transportation, buildings,
etc.) based on the KPIs developed and tracked;
Setting milestones for key actions;
Identifying available funding sources and needs to implement the plan;
Outlining how the community will be consulted on the implementation of the plan;
Assigning roles and responsibilities for the implementation of the plan; and,
Discussing how the targets, goals and KPIs will be tracked throughout the
implementation of the plan.
Various funding sources are available for the development of Climate Action Plans.

CITY OF WINNIPEG COMMUNITY 2011 GHG INVENTORY AND FORECAST
March 30, 2015 Report No. 13-1443-0010 80
Implement Climate Action Plan
Once the Climate Action Plan has been prepared, the approval and support of council,
municipal staff and the community are essential to the plan's success. The roles and
proposed commitment under the Climate Action Plan for key groups are as follows:
City Council
Provide leadership in advocating for the Climate Action
Plan
Secure budget for the implementation of the Climate Action
Plan
Legislate polices, projects and regulations in support of
the Climate Action Plan
Review annual report on progress and be accountable for
achieving results
Advisory Group
Provide technical support for the practical implementation
of Climate Action Plan project, plans and policies
Outline the vision for the implementation of the Climate
Action Plan
Act as the Liaison between council, City staff and
community stakeholders
Manage and oversee the implementation of the Climate
Action Plan
City Staff
Provide technical support for the practical implementation
of Climate Action Plan project, plans and policies
Align department procedures with the Climate Action Plan
actions and new policies and regulation
Execute projects, policies and plans for individual Climate
Action Plan initiatives
Develop policies and regulations based on the goals of
the Climate Action Plan for council approval
Community Stakeholders
Provide input and feedback on Climate Action Plan policies
and regulations
Champion initiatives to reduce energy and carbon within
their organization and partners

CITY OF WINNIPEG COMMUNITY 2011 GHG INVENTORY AND FORECAST
March 30, 2015 Report No. 13-1443-0010 81
Implementing the Climate Action Plan in the plan timeline is essential. The Advisory
Group should meet frequently to review the implementation of the plan and to amend
the plan, targets and schedule as necessary. Communication of progress to Council
and the public is essential.
Numerous resources are available, which discuss strategies from taking community
planning from ideas to actions. Once such resource is From Great Ideas to Great
Communities: A Guide for Implementing Integrated Community Sustainability Plans in
Nova Scotia [15], which provides excellent guidance on how to move beyond
community planning to implementing to programs, policies and actions necessary to
meet energy and GHG targets.
Monitor Progress and Report Results
Once the implementation of the Climate Action Plan is underway, monitoring the
implementation progress is important to analyze progress and learn from successes
and failures. Specifically, monitoring should assess whether:
Projects, plans and policies are producing the anticipated results;
Amendments to the plan are required; and
Community energy and GHG emissions targets will be met.
Monitoring the implementation of the action plans should be led by the Advisory Group,
but may require additional external technical support, should internal resources not be
available. Monitoring consists of various control measures, but generally should
include:
Updating the community GHG inventory annually;
Updating the key performance indicators annually;
Updating the Climate Action Plan annually; and,
Preparing a public facing annual summary report which outlines:
Projects, plans and policies implemented during the year;
An updated community GHG inventory;
A list of implementation challenges and opportunities encountered;
A description of stakeholder engagement activities;
A list of amendments to the Climate Action Plan; and,
A revised Climate Action Plan schedule.
Once the implementation of the Climate Action Plan is underway, monitoring the implementation progress is important to analyze progress and learn from successes and failures.

CITY OF WINNIPEG COMMUNITY 2011 GHG INVENTORY AND FORECAST
March 30, 2015 Report No. 13-1443-0010 82
Climate action planning should be considered an evolving process in order to adapt to
changing environmental, economic and political realities.

CITY OF WINNIPEG COMMUNITY 2011 GHG INVENTORY AND FORECAST
March 30, 2015 Report No. 13-1443-0010 83
8.0 REPORT LIMITATIONS This report was prepared for the exclusive use of the City of Winnipeg. Golder or its
employees will not be responsible for any use of the information contained in this
report or any reliance on or decisions made based on it by an unauthorized third party.
The report is based solely on the information available provided by the City of
Winnipeg, Manitoba Hydro and Manitoba Public Insurance during the pre-inventory
documentation request. No site visits or field data collection was conducted as a part
of this inventory. If additional information is discovered in the future, Golder should be
requested to re-evaluate the conclusions presented in this report and to provide
amendments as required.
In evaluating the project, Golder has relied in good faith on information provided by
individuals as noted in this report. We assume that the information provided is factual
and accurate. We accept no responsibility for any deficiency, misstatements, or
inaccuracies contained in this report as a result of omissions, misinterpretation, or
fraudulent acts of the persons interviewed or contacted. No other warranties are
expressed or implied.

CITY OF WINNIPEG COMMUNITY 2011 GHG INVENTORY AND FORECAST
March 30, 2015 Report No. 13-1443-0010 84
9.0 WORKS CITED
[1] Conference Board of Canada, "Long Term Demographic and Economic Forecast
for Winnipeg Census Metropolitan Area," 2012.
[2] Statistics Canada, "Census Metropolitan Area of Winnipeg, Manitoba - 2011
Census," 2011.
[3] ICLEI-USA, "U.S. Community Protocol for Accounting and Reporting of
Greenhouse Gas Emissions, Version 1.0," ICLEI – Local Governments for
Sustainability USA, 2012.
[4] The Climate Registry, "2012 Climate Registry Default Emission Factors," 2012.
[5] US Department of Energy, "Fuel Economy," 2013. [Online]. Available:
http://www.fueleconomy.gov/feg/ws/index.shtml. [Accessed 18 October 2013].
[6] City of Winnipeg, "Complete Communities," 2011.
[7] United Nations Environment Programme, "Canadian Automotive Fuel Economy
Policy," 2011.
[8] City of Winnipeg, "Sustainable Transportation," 2011.
[9] City of Winnipeg, "Garbage and Recyling Master Plan," 2011.
[10] Stantec, "Comprehensive Integrated Waste Management Plan," Winnipeg, 2011.
[11] Federation of Canadian Municipalities, "Climnate Change Milestone 3 Protocol,"
2014.
[12] Quality Urban Energy Systems of Tomorrow (QUEST), "Advancing Integrated
Community Energy Planning in Ontario: A Primer," 2013.
[13] The Community Energy Association (CEA), "Community Energy & Emissions
Planning: A Guide for B.C. Local Governments," 2014.
[14] Natural Resources Canada, "Community Energy Planning Guide," 2014.
[15] Golder Associates and Natural Step Canada, "From Great Ideas to Great
Communities: A Guide for Implementing Integrated Community Sustainability
Plans in Nova Scotia," 2013.
[16] Environment Canada, "National Inventory Report 1990 - 2011 Part 3," 2013.

CITY OF WINNIPEG COMMUNITY 2011 GHG INVENTORY AND FORECAST
March 30, 2015 Report No. 13-1443-0010 85
[17] Calgary Transit, "About Calgary Transit," 2014. [Online]. Available:
http://www.calgarytransit.com/html/technical_information.html. [Accessed 8 April
2014].
[18] SYLVIS, "The Biosolids Emissions Assessment Model (BEAM): A Method for
Determining Greenhouse Gas Emissions from Canadian Biosolids Management
Practices," New Westminster, 2009.
[19] Clean Development Mechanism, "Approved Baseline and Monitoring
Methodologies for Large Scale CDM Project Activities," 2008. [Online]. Available:
http://cdm.unfccc.int/methodologies/PAmethodologies/approved.
[20] Manitoba Geothermal Energy Alliance, "Manitoba Continues to see Geothermal
Market Growth," [Online]. Available: https://www.mgea.ca/.
[21] City of Winnipeg, "Winnipeg Transportation Master Plan," 2011.
[22] Stantec, "City of Winnipeg - Comprehensive Integrated Waste Management Plan,"
2011.
[23] Manitoba Hydro, "2013 Electric Load Forecast," 2013.
[24] Manitoba Hydro, "2013 Natural Gas Volume Forecast," 2013.
[25] Manitoba Hydro, "2013-16 Power Smart Plan: 15 Year Supplementary Analysis
Report," 2013.
[26] City of Winnipeg, "Winnipeg 202 Vision," 2003.

CITY OF WINNIPEG COMMUNITY 2011 GHG INVENTORY AND FORECAST
March 30, 2015 Report No. 13-1443-0010
10.0 CLOSURE We trust the information contained in this report is sufficient for your present needs. Should you have any
additional questions regarding the project, please do not hesitate to contact the undersigned.
GOLDER ASSOCIATES LTD.
James Allen, P.Eng. Mark Greenhill, P.Eng.
Environmental Engineer and Energy Consultant Senior Energy Engineer
Golder, Golder Associates and the GA globe design are trademarks of Golder Associates Corporation.
y:\vancouver\active\2013\1443\13-1443-0010 city of winnipeg ghg inventory\10 report\13-1443-0010 final report.docx

CITY OF WINNIPEG COMMUNITY 2011 GHG INVENTORY AND FORECAST
March 30, 2015 Report No. 13-1443-0010
APPENDIX A GHG Inventory Calculation Methodology

APPENDIX A GHG Inventory Calculation Methodology
March 30, 2015 Project No. 13-1443-0010 1/11
1.0 GENERAL APPROACH The inventory was created following the 2012 “U.S. Community Protocol for Accounting and Reporting of
Greenhouse Gas Emissions”, developed by ICLEI – Local Governments for Sustainability USA. The standard
was designed to guide local governments in the accounting and reporting of greenhouse gas (GHG) emissions
associated with communities.
The protocol includes guidance on scoping, and lists the five basic emission-generating activities that must be
included in all GHG emission reports:
Use of Electricity by the Community
Use of Fuel in Residential and Commercial Stationary Combustion Equipment
On-Road Passenger and Freight Motor Vehicle Travel
Use of Energy in Potable Water and Wastewater Treatment and Distribution
Generation of Solid Waste by the Community
Emission calculations are described within the protocol by community sector. For each GHG source, the protocol
presents accounting methodologies, some with multiple methodologies of varying accuracy to be selected based
on the level of data quality. Most calculations are based on activity data, emission factors, and conversion of
resultant emissions to CO2 equivalent through the use of global warming potentials.
The protocol also provides recommendations for the reporting of a community GHG report. These include an
emissions report summary table, quantified estimates of emissions associated with the five basic emission-
generating activities, and data for each emission source or activity such as activity data, emission factors,
accounting methodology, and emissions. Community context data should also be included within any GHG
report; total population and households at a minimum. The protocol also recommends inclusion of additional
information such as notes on data sources, confidence in data accuracy, and any additional context data [1].
2.0 SCOPE OF STUDY The scope of the GHG Inventory is shown below in Table 1.
Table 1: Scope of Study
GHG Emissions Source Accounting Approach Included*
Stationary Units
Residential Buildings
Direct Emissions (Scope 1) In-Boundary Fuel Combustion (Natural Gas) Yes
Energy Indirect Emissions (Scope 2) In-Boundary Energy Consumption (Electricity) Yes
Commercial / Institutional Facilities

APPENDIX A GHG Inventory Calculation Methodology
March 30, 2015 Project No. 13-1443-0010 2/11
GHG Emissions Source Accounting Approach Included*
Direct Emissions (Scope 1) In-Boundary Fuel Combustion (Natural Gas) Yes
Energy Indirect Emissions (Scope 2) In-Boundary Energy Consumption (Electricity) Yes
Industrial Energy Use
Direct Emissions (Scope 1) In-Boundary Fuel Combustion (Natural Gas) Yes
Energy Indirect Emissions (Scope 2) In-Boundary Energy Consumption (Electricity) Yes
Energy Generation
Direct Emissions (Scope 1) In-Boundary Fuel Combustion No, IE
Energy Indirect Emissions (Scope 2) In-Boundary Energy Consumption No, IE
Fugitive Emissions
Direct Emissions (Scope 1) In-Boundary Refrigerant / Coolant Emissions No, NE
Mobile Units
On-Road Transportation
Direct Emissions (Scope 1) In-Boundary Fuel Combustion Yes
Energy Indirect Emissions (Scope2) In-Boundary Energy Consumption Yes
Indirect Emissions from Transboundary On-Road
Inter-City or International Transportation Trips that
Originate and/or Complete their Journey Within
the Community (Scope3)
No, NE
Railways
Direct Emissions (Scope 1) Proportional Fuel Combustion No, NE
Energy Indirect Emissions (Scope2) Proportional Energy Consumption No, NE
Indirect Emissions from Transboundary Inter-City
or International Railway Trips that Originate and/or
Complete their Journey Within the Community
(Scope3)
No, NE
Fugitive Emissions
Direct Emissions (Scope 1) Direct Emissions (Scope 1) No, NE
Water-Borne Navigation

APPENDIX A GHG Inventory Calculation Methodology
March 30, 2015 Project No. 13-1443-0010 3/11
GHG Emissions Source Accounting Approach Included*
Direct Emissions (Scope 1) Proportional Fuel Combustion No, NE
Energy Indirect Emissions (Scope2) Proportional Energy Consumption No, NE
Indirect Emissions from Inter-City or International
Water-Borne Navigation Trips that Originate their
Journey Within the Community (Scope3)
No, NE
Aviation
Direct Emissions (Scope 1) Proportional Fuel Combustion No, NE
Energy Indirect Emissions (Scope 2) Proportional Energy Consumption No, NE
Indirect Emissions from Inter-City or International
Aviation that Originate and/or Complete their
Journey Within the Community (Scope 3)
No, NE
Off-Road
Direct Emissions (Scope 1) In-boundary Fuel Combustion No, NE
Waste
Solid Waste Disposal
Option-1: First Order Decay (FOD) Method -
Direct (Scope1-Current Year) and Indirect
(Scope3-Previous Years) Emissions from Landfills
Located Within the Community Boundary
(excluding emissions due to incoming waste from
other communities)
In-boundary Waste Generated and
Proportional Waste Treated No, IE
Option-2: Methane Commitment (MC) Method -
Direct (Current Year) and Indirect (Scope3-Future
Year) Emissions from Landfills Located Within the
Community Boundary (excluding emissions due to
incoming waste from other communities)
In-boundary Waste Generated and
Proportional Waste Treated Yes
Indirect Emissions (Scope3) from Community
Wastes Deposited in Landfills Located Outside the
Community Boundary
Proportional Waste Treated Yes
Biological Treatment of Waste

APPENDIX A GHG Inventory Calculation Methodology
March 30, 2015 Project No. 13-1443-0010 4/11
GHG Emissions Source Accounting Approach Included*
Direct (Scope1) Emissions from Biological
Treatment of Waste in the Community Boundary
(excluding emissions due to incoming waste from
other communities)
In-boundary Waste Generated and
Proportional Waste Treated Yes
Indirect Emissions (Scope3) from Biological
Treatment of Wastes Outside the Community
Boundary
Proportional Waste Treated No, NO
Incineration and Open Burning
Direct (Scope 1) Emissions from Incineration and
Open Burning of Waste in the Community
Boundary (excluding emissions due to incoming
waste from other communities)
In-boundary Waste Generated and
Proportional Waste Treated No, NO
Indirect Emissions (Scope 3) from Incineration and
Open burning of Wastes Outside the Community
Boundary
Proportional Waste Treated No, NO
Wastewater Treatment and Discharge
Direct (Scope 1) Emissions from WWT and
discharge in the Community Boundary (excluding
emissions due to incoming waste from other
communities)
In-boundary Waste Generated and
Proportional Waste Treated Yes
Indirect Emissions (Scope 3) from WWT and
discharge Outside the Community Boundary Proportional Waste Treated No, NO
Industrial Processes and Product Use (IPPU)
Direct Emissions from Industrial Processes In-boundary Production No, NE
Agriculture, Forestry, and Land Use (AFOLU)
Direct Emissions from AFOLU In-boundary Areas No, NE
Other Indirect Emissions
All other Scope 3 Emissions from all sources No, NE
All transboundary Scope 3 emissions due to
exchange/consumption of goods and services No, NE
*IE=Included Elsewhere, NE=Not Estimated, NO=Not Occurring

APPENDIX A GHG Inventory Calculation Methodology
March 30, 2015 Project No. 13-1443-0010 5/11
3.0 COMMUNITY SECTORS The GHG Inventory is made up of the following sectors.
3.1 Building Electricity This section is comprised of the GHG emissions from electricity consumption of buildings within the City of
Winnipeg. Electricity use has been split up into a number of categories for residential, commercial, and industrial
buildings.
Building categories, number of buildings, and total electricity consumed were provided by Manitoba Hydro. Using
the total electricity consumed and the electricity generation GHG intensities for Manitoba, provided in the
National Inventory Report 1990-2011 Part 3 [2], the GHG emission rate was calculated as follows:
Where: ERCO2e is the annual City of Winnipeg building electricity GHG emission rate (tonne CO2e),
Ei is the building category total electricity consumed (kWh),
EFCH4 is the methane electricity generation intensity (g CO2e/kWh),
EFN2O is the nitrous oxide electricity generation intensity (g CO2e/kWh), and
EFCO2 is the carbon dioxide electricity generation intensity (g CO2e/kWh).
3.2 Building Natural Gas This section is comprised of the GHG emissions due to natural gas combustion from buildings within the City of
Winnipeg. Natural gas use has been split up into a number of categories for residential, commercial, and
industrial buildings.
Building categories, number of buildings and total natural gas consumed were provided by Manitoba Hydro. The
GHG emission rates were calculated based on the methodology outlined in ICLEI (2012) Appendix C [1]. A
sample calculation is provided below.
Where: ERCO2e is the annual City of Winnipeg building natural gas consumption emissions (tonne CO2e),
Gi is the building category natural gas consumption (m3/year),
GWPCH4 is the global warming potential for methane,
110
110
10.351
34121
110

APPENDIX A GHG Inventory Calculation Methodology
March 30, 2015 Project No. 13-1443-0010 6/11
EFc,CH4 is the methane emission factor for building category industrial, commercial or residential (kg
CH4/MMBtu),
GWPN2O is the global warming potential for nitrous oxide,
EFc,N2O is the nitrous oxide emission factor for building category industrial, commercial or residential (kg
N2O/MMBtu), and
EFCO2 is the carbon dioxide emission factor (kg CO2/MMBtu).
3.3 Transit Public transit vehicles were calculated separately from residential and commercial vehicles using total fuel
consumed provided by the City of Winnipeg. Vehicles in this category are all fueled with B2 diesel. Emission
factors were obtained from the National Inventory Report 1990-2011 Part 2 [2].
It was assumed that all vehicles would be bus-like (heavy duty vehicle) and would also have moderate air
emission controls. Emissions were calculated as detailed below:
Where: ERCO2e is the annual City of Winnipeg public transit vehicle emissions (tonne CO2e),
Fuel Consumed is the annual volume of fuel consumed by transit vehicles (L),
EFCH4 is the emission factor for methane (g/L fuel),
GWP CH4 is the global warming potential for CH4 (tonne CO2e/tonne CH4),
EFN2O is the emission factor for N2O (g/L fuel),
GWPN2O is the global warming potential for N2O (tonne CO2e/tonne N2O), and
EFCO2 is the emission factor for CO2 (g/L fuel).
3.4 Vehicles This section consists of GHG emissions for residential and commercial vehicles. Vehicular emissions were
calculated based on data supplied by The Climate Registry, the US Department of Energy, and the City of
Winnipeg.
Vehicle fuel efficiency was obtained from the 2012 Climate Registry Default Emission Factors, Table 13.2 [3].
Greenhouse gas emission factors for the vehicles, based on manufactured year, were obtained in the Climate
Registry, Tables 13.4 and 13.5. Vehicle descriptions (manufacturer, year, vehicle class) were obtained from the
US Department of Energy; Energy and Efficiency and Renewable Energy [4].
110

APPENDIX A GHG Inventory Calculation Methodology
March 30, 2015 Project No. 13-1443-0010 7/11
A list of registered vehicles was provided Manitoba Public Insurance. Based on the vehicles age, make, model,
fuel consumed, and/or description the registered vehicles were matched with a fuel consumption rate
(mile/gallon, km/L) and associated greenhouse gas emission factors (GHG emission/mile travelled, g/km).
Vehicles that were assigned commercial or industrial within the list of registered vehicles were excluded from the
analysis. With regards to the fuel consumption it was assumed, based on recommendations in The Climate
Registry [3], all vehicles travel 45% on highway (freeway) ad 55% on city roads.
Vehicles were defined in 10 different categories based on the fuel type and engine type. The emission factors of
these 10 vehicle categories were derived from calculating the average value of the emission factors assigned
based on the method described above for the 2011 datasets.
Next, annual vehicle kilometers were estimated using TransCAD, a GIS transportation software tool. Average
annual vehicle kilometers were then multiplied by the individual vehicle emission factors to determine the annual
GHG emissions, as shown in the following equation.
Where: ERCO2e is the annual City of Winnipeg vehicular GHG emission rate (tonne CO2e),
VKTi is the individual annual vehicle km travelled (km/year),
GWPCH4 is the global warming potential for methane,
EFi,CH4 is the methane emission factor vehicle category i (g/km),
GWPN2O is the global warming potential for nitrous oxide,
EFi,N2O is the nitrous oxide emission factor for vehicle category i (g/km), and
EFi,CO2 is the carbon dioxide emission factor for vehicle category i (g/km).
3.5 Waste Disposal Solid waste disposal for Winnipeg were considered to be entirely landfill. Landfill emissions are unique among
sources of emissions in that the emissions are generated over long periods of time from the activity that caused
them. Within the City of Winnipeg, waste generation falls into the following categories:
Residential;
Industrial and commercial;
Construction and demolition; and
City operations, excluding wastewater biosolids.
Some landfill gas is collected through a collection system (LFG).
110 , , ,

APPENDIX A GHG Inventory Calculation Methodology
March 30, 2015 Project No. 13-1443-0010 8/11
The landfilling or composting of city biosolids was covered in the waste water GHG calculations. Process based
GHG emissions (electricity consumption, etc.) associated with waste disposal were included in different emission
activity groups.
Emissions from waste disposal were calculated using the total tonnage of all landfilled waste, taken from the City
of Winnipeg Comprehensive Integrated Waste Management Plan [5]. Waste was divided into categories and
emission factors were applied based on the type of waste. In this way, lifetime emissions from landfilled waste
were taken all during the inventory year, with no calculation of emissions from already existing waste. Landfill
gas collection systems were also considered in these calculations.
Note that no emissions were assigned for composting. While conventions for greenhouse gas accounting, such
as those presented by the US EPA, indicate negative GHG emissions or a “carbon sink” for composting of
organic materials, on the extent to which composting materials break down and potentially sequester carbon is
not fully defined. Thus, for the purposes of this inventory, no composting emissions have been considered.
Emission rates were calculated using the following formula:
Where: ERCH4 is the community generated waste emissions from waste disposal (tonne CO2e/year),
GWPCH4 is the CH4 global warming potential,
Mi is the mass of each fraction of waste component i (wet short ton),
Efi is the emission factor for material i (tonne CH4/wet short ton),
CE is the LFG collection efficiency, and
OX is the oxidation rate.
3.6 Water and Waste Water Waste water includes both the treatment and disposal of waste water in the City of Winnipeg. Emissions from
biogas combustion, waste water processing, landfilling, and composting were all included within this section.
Waste water electricity consumption was not included, as it was covered under the electricity section.
The emission calculation for water and waste water was divided into bio-gas combustion, process-based N2O
emissions, and outflow GHG emissions.
3.6.1 Bio-gas Combustion
Bio-gas combustion emissions were based on method WW.1.a within Appendix F for calculating GHG emission
from bio-gas combustion from anaerobic digesters [1]. Emission rates were calculated using the following
formula:
1 1

APPENDIX A GHG Inventory Calculation Methodology
March 30, 2015 Project No. 13-1443-0010 9/11
Where: ERCH4 is the annual methane emitted by devices designed to combust digester gas (tonne CO2e/year),
Digester gas is the standard cubic feet of digester gas produced per day (std ft3/day),
GWPCH4 is the CH4 global warming potential,
0.61 is the fraction of CH4 in the gas (provided by the City of Winnipeg),
BTUCH4 is the Default BTU content of methane (BTU/ft3), and
EFCH4 if the methane emission factor (kg CH4/MMBTU).
The emission calculations due to nitrous oxide combustions were similar to methane except EFCH4 was replaced
by the emission factor for nitrous oxide (EFN2O) and the GWPCH4 was replaced by the global warming potential
for nitrous oxide (GWPN2O).
3.6.2 Process Based Nitrous Oxide Emissions
Waste water treatment plants also emit nitrous oxide during process operation. As over the next five years the
city of Winnipeg will have systems with and without denitrification, two methods were used to determine nitrous
oxide emission rates; methods WW.7 and WW.8, Appendix F [1].
Emission rates were calculated using the following formula:
Where: ERN2O is the total annual nitrous oxide emissions by WWTP processes (tonne CO2e),
P is the population serviced by the waste water treatment facility,
Find-com is the factor for nitrogen loading due to industrial and commercial processes, and
EF is the emission factor for WWP (g N2O/person/year).
3.6.3 Process Based Carbon Dioxide Emissions
Carbon dioxide is emitted during processing as methanol is used in the nitrification/denitrificaiton process,
detailed in calculation method WW.9, Appendix F [1].
Emission rates were calculated using the following formula:
0.61110
365.251
11000
110

APPENDIX A GHG Inventory Calculation Methodology
March 30, 2015 Project No. 13-1443-0010 10/11
Where: ERCO2 is the total annual carbon dioxide emitted (tonne CO2e),
Methanol Load is the amount of neat chemical used per day (tonne CH3OH/day), and
F is the sludge disposal factor.
3.6.4 Outflow GHG Emissions
Nitrous oxide is also emitted from WWTP effluent outflow. As the nitrogen content of the WWTP outflow is
routinely monitored, the sample calculation detailed in method WW.12 was used [1].
Emission rates were calculated using the following formula:
Where: ERN2O is the annual nitrous oxide emitted from the effluent outfall (tonne CO2e/year),
Nload is the average total nitrogen content per day (kg N/day), and
EFeffluent is the emission factor (kg N2O-N/kg sewage-N discharged).
3.6.5 Landfill Emissions
Methane is emitted from decomposition of biosolids in the landfill. The following sample calculation was used to
estimate the methane emissions [6].
Where: ERCH4 is the annual methane emitted by decomposition of biosolids in the landfill (tonne CO2e/year),
SL is the mass of biosolids landfill disposed (tonne/year),
VS is the percent volatile solids (%),
Co is the organic carbon content in the VS (%),
CH4LFG is the methane content in landfill gas (%),
44.01
32.04365.25
44.01
28.01365.25
11000
16.04
12.01 4 0.9

APPENDIX A GHG Inventory Calculation Methodology
March 30, 2015 Project No. 13-1443-0010 11/11
DOCr is the decomposable organic fraction of raw wastewater solids,
D is the percent decomposition rate (%),
MCFlandfill is the methane correction for anaerobic managed landfills, and
0.9 is the model uncertainty factor [7].
3.6.6 Composting Emissions
Carbon dioxide is emitted from decomposition of biosolids in compost. The following sample calculation was
used to estimate the carbon dioxide emissions [6].
Where: ERCO2 is the annual CO2 emitted from the compost biosolid decomposition (tonne CO2e/year), and
Sc is the mass of biosolids composted (tonne/year),
Co is the organic carbon content in the VS (%),
DOCr is the decomposable organic fraction of raw wastewater solids, and
D is the percent decomposition rate (%).
44.01
12.01
CITY OF WINNIPEG COMMUNITY 2011 GHG INVENTORY AND FORECAST
March 30, 2015 Report No. 13-1443-0010
APPENDIX B Forecast Methodology

APPENDIX B Forecast Methodology
March 30, 2015 Project No. 13-1443-0010 1/10
Golder based forecasts primarily on key indicators supplied by the City of Winnipeg and Manitoba Hydro relating
to building electricity, building natural gas, transit, waste disposal, and water and waste water. For sectors where
the availability of key indicators was limited, Golder utilized the Community Energy and Emissions Modeling and
Planning tool, CEEMAP (see Figure 1). Golder used the CEEMAP tool to drive key indicators for the
OurWinnipeg and Low Carbon Path forecasts, particularly in relation to land use and transportation.
CEEMAP is based on several dynamic, interactive modules that use key policy inputs to estimate greenhouse
gas emissions for each sector over which local governments have significant influence. CEEMAP uses the
following categories of indicators:
Socio Economic Data, e.g., residential and employment population.
Land Use & Community Design, e.g., location and density of commercial and residential buildings.
Transportation Technology & Patterns, e.g., number and type of automobiles, transit routes and frequency.
Building Type & Performance, e.g., single detached or multi family home type, building energy rating,
retrofit rate.
Heat & Electricity Supply, e.g., electricity from grid or other, specific district energy technology, building-
scale.
Solid Waste Management, e.g., waste composition and mass, management practice.
To start the process, a baseline model is populated using values for the year for which the best data is available.
In this case, key indicators from 2011 were used.
Figure 1: CEEMAP Diagram

APPENDIX B Forecast Methodology
March 30, 2015 Project No. 13-1443-0010 2/10
Values for indicators were projected into the future based on the type and intensity of strategies that the City
could implement. CEEMAP then used empirically-derived knowledge of the relationships between indicators to
calculate sector emission changes at future milestone years. As well as changes to greenhouse gas emissions,
CEEMAP generated other outputs such as vehicle kilometers travelled by neighbourhood and across the
community.
The following sections detail the approach taken in constructing the Business as Usual, OurWinnipeg, and Low
Carbon Path Scenarios, by sector.
1.0 BUILDING ELECTRICITY AND NATURAL GAS Building electricity and natural gas was assumed to grow differently for residential, commercial, and industrial
sectors. Residential electricity and natural gas was assumed to grow in proportion to population growth.
Commercial and industrial electricity and natural gas was assumed to grow in proportion to job growth. All
growth-related factors are independent of scenario.
Provincial demand-side management programs undertaken by Manitoba Hydro have outlined forecasts for the
reductions in electricity and natural gas up until 2031. These programs are primarily targeted at existing
buildings, as there exists a far greater potential to reduce energy use. For the 2050 forecasts, values were
extrapolated from the Manitoba Hydro targets. As the demand-side management programs are provincial, the
savings were applied to all scenarios.
Multi-unit residential buildings (MURBs) are generally more energy efficient in nature than single family homes.
By promoting a shift toward MURBs, gains in both electricity and natural gas efficiency are possible for new
buildings. The Business as Usual Scenario assumes that residential building stock does not change from 2011,
thus there are no efficiency benefits. The OurWinnipeg Scenario follows the Conference Board of Canada
forecasts for the City of Winnipeg which see a gradual movement toward MURBs due to City policies. The Low
Carbon Path Scenario assumes a much greater effort on the part of the City to promote MURBs, and thus has a
higher gain in new residential building energy efficiency.
Newer buildings are more energy efficient than older buildings due to changes in technology. Thus it has been
assumed that new buildings of all types (residential, commercial, and industrial) see gains in both electricity and
natural gas efficiency. This is also influenced by policies such as the Manitoba (National) Building Code and
2007 Green Building Policy. The Business as Usual and OurWinnipeg Scenarios assume no City intervention
and see modest increases in new building energy efficiency. The Low Carbon Path has the City promoting new
technology and more stringent energy standards, thus gaining a bit more in efficiency.
As demand for consumer electronics has steadily increased, it is expected that residential households will use
more electricity on a per capita basis to support these products. Manitoba Hydro has made some forecasts
assuming a modest growth rate in electricity use. Based on these, the forecasting model uses a 0.5% increase in
residential electricity use per person per year. This factor is independent of all scenarios.
Building-scale renewables, primarily geothermal heat with some limited solar water heating, represent an
opportunity to reduce natural gas consumption in buildings. The forecasting model used assumed that buildings
with building-scale renewables installed would be able to save 25% of their natural gas. For the Business as
Usual Scenario, no growth in building-scale renewables was used. For the OurWinnipeg Scenario, it was

APPENDIX B Forecast Methodology
March 30, 2015 Project No. 13-1443-0010 3/10
assumed that trends in the uptake of building-scale renewables would continue at the same rates. For the Low
Carbon Path Scenario, a more aggressive targeting of building-scale renewables was assumed, leading to a
higher growth rate.
District energy systems also represent an opportunity to reduce the heating load in residential and commercial
buildings. Due to the complexity of industrial processes, industrial buildings were excluded from district energy
systems. Buildings connected to district energy systems were assumed to be able to save 10% of their natural
gas due to efficiencies in having a larger centralized system. The Business as Usual Scenario assumed no
district energy systems. The OurWinnipeg Scenario assumed a very modest growth in buildings connected to
district energy systems where the Low Carbon Path Scenario had a slightly higher growth rate.
Calculation for building electricity use and natural gas is shown below:
, ,2011 12011
20111 1 1
Where: , = residential electricity use in year X, calculated
,2011 = residential electricity use in 2011, from Manitoba Hydro
= population in year X, from the Conference Board of Canada (2012)
2011 = population in 2011, from the Conference Board of Canada (2012)
= reduction in electricity intensity due to demand-side management for existing buildings, from the
Manitoba Hydro Power Smart Plan (2013)
= reduction in electricity intensity due to changes in building stock for new buildings, calculated based
on trends in building stock from Conference Board of Canada (2012)
= reduction in electricity intensity due to newer technology for new buildings, assumed, based on the
Manitoba Building Code (2011)
= increase in electricity intensity due to increased electricity use per person, from the Manitoba
Hydro Electric Load Forecast (2013)
, ,2011 12011
2011
1
Where: , = commercial electricity use in year X, calculated
,2011 = commercial electricity use in 2011, from Manitoba Hydro
= jobs in year X, from the Conference Board of Canada (2012)
2011 = jobs in 2011, from the Conference Board of Canada (2012)

APPENDIX B Forecast Methodology
March 30, 2015 Project No. 13-1443-0010 4/10
= reduction in electricity intensity due to demand-side management for existing buildings, from the
Manitoba Hydro Power Smart Plan (2013)
= reduction in electricity intensity due to newer technology for new buildings, assumed, based on the
Manitoba Building Code (2011)
, ,2011 12011
2011
1
Where: , = industrial electricity use in year X, calculated
,2011 = industrial electricity use in 2011, from Manitoba Hydro
= jobs in year X, from the Conference Board of Canada (2012)
2011 = jobs in 2011, from the Conference Board of Canada (2012)
= reduction in electricity intensity due to demand-side management for existing buildings, from the
Manitoba Hydro Power Smart Plan (2013)
= reduction in electricity intensity due to newer technology for new buildings, assumed, based on the
Manitoba Building Code (2011)
, ,2011 12011
20111 1 1 , ,2011 0.25
1 0.1
Where: , = natural gas use in year X, calculated
,2011 = natural gas use in 2011, from Manitoba Hydro
= population in year X, from the Conference Board of Canada (2012)
2011 = population in 2011, from the Conference Board of Canada (2012)
= reduction in natural gas intensity due to demand-side management for existing buildings, from the
Manitoba Hydro Power Smart Plan (2013)
= reduction in natural gas intensity due to changes in building stock for new buildings, calculated
based on trends in building stock from Conference Board of Canada (2012)
= reduction in natural gas intensity due to newer technology for new buildings, assumed, based on the
Manitoba Building Code (2011)
, = fraction of residential buildings with building-scale renewables in year X, based on trends
from Manitoba Geothermal Energy Alliance

APPENDIX B Forecast Methodology
March 30, 2015 Project No. 13-1443-0010 5/10
,2011 = fraction of residential buildings with building-scale renewables in 2011, from Manitoba
Geothermal Energy Alliance
= fraction of residential buildings connected to district energy systems in year X, assumed
, ,2011 12011
2011
1 1 , ,2011 0.25
1 0.1
Where: , = commercial natural gas use in year X, calculated
,2011 = commercial natural gas use in 2011, from Manitoba Hydro
= jobs in year X, from the Conference Board of Canada (2012)
2011 = jobs in 2011, from the Conference Board of Canada (2012)
= reduction in natural gas intensity due to demand-side management for existing buildings, from the
Manitoba Hydro Power Smart Plan (2013)
= reduction in natural gas intensity due to newer technology for new buildings, assumed, based on the
Manitoba Building Code (2011)
, = fraction of commercial buildings with building-scale renewables in year X, based on trends
from Manitoba Geothermal Energy Alliance
,2011 = fraction of commercial buildings with building-scale renewables in 2011, from Manitoba
Geothermal Energy Alliance
= fraction of commercial buildings connected to district energy systems in year X, assumed
, ,2011 12011
2011
1 1 , ,2011 0.25
Where: , = industrial natural gas use in year X, calculated
,2011 = industrial natural gas use in 2011, from Manitoba Hydro
= jobs in year X, from the Conference Board of Canada (2012)
2011 = jobs in 2011, from the Conference Board of Canada (2012)
= reduction in natural gas intensity due to demand-side management for existing buildings, from the
Manitoba Hydro Power Smart Plan (2013)
= reduction in natural gas intensity due to newer technology for new buildings, assumed, based on the
Manitoba Building Code (2011)

APPENDIX B Forecast Methodology
March 30, 2015 Project No. 13-1443-0010 6/10
, = fraction of industrial buildings with building-scale renewables in year X, based on trends from
Manitoba Geothermal Energy Alliance
,2011 = fraction of industrial buildings with building-scale renewables in 2011, from Manitoba
Geothermal Energy Alliance
2.0 TRANSIT The first parameter affecting the GHG emissions from transit is the total distance travelled by all transit vehicles.
The Business as Usual Scenario assumes no increase in the transit fleet or service, which means that the total
distance travelled is unchanged from 2011. Note that this does have implications for the residential vehicle GHG
emissions, as discussed in the following section. The OurWinnipeg Scenario assumes gradual increase in the
size of the transit fleet of 8 vehicles per year, with the average annual distance travelled by vehicle remaining
constant. The Low Carbon Path Scenario also assumes an increase in the transit fleet of 8 vehicles per year, but
also assumes the average annual distance travelled is increasing, representing a large push by the City to make
Winnipeg a more transit-friendly city.
The other factor affecting the GHG emissions from transit is the type of vehicle used. For all scenarios,
improvements in technology and more stringent tailpipe standards would lead to an increase in fuel efficiency of
newer vehicles, taken as being 0.7% per year. In the Business as Usual Scenario, the entire transit fleet
continues to be made up of buses using B2 diesel fuel. In the OurWinnipeg Scenario, transit vehicles shift
toward some diesel-electric hybrid buses. In addition, the City would gradually introduce electric light rail transit,
the first being completed in 2031. Electric light rail transit has been assumed to consume 3.5 kWh per kilometer
travelled based on a technical study done in Calgary. The Low Carbon Path Scenario follows a similar trend to
the OurWinnipeg Scenario, with the exception of having a greater shift to diesel-electric buses and electric light
rail.
Calculations are shown below:
1 0.007
Where: = fuel efficiency of B2 diesel buses in L/km in year X, calculated
= fuel efficiency of B2 diesel buses in L/km in 2011, calculated at
0.6656L/km
= year of forecast
2011
Where: = number of transit vehicles on the road in year X, calculated
= number of transit vehicles on the road in 2011, from the City of Winnipeg
= year of forecast

APPENDIX B Forecast Methodology
March 30, 2015 Project No. 13-1443-0010 7/10
= increase in transit vehicles per year, 0 for Business as Usual Scenario, 8 for OurWinnipeg and
Low Carbon Path Scenarios, from the City of Winnipeg
Where: = total kilometers travelled by transit vehicles in year X, calculated
= total kilometers travelled by transit vehicles in 2011, from the City of
Winnipeg
= number of transit vehicles on the road in 2011, from the City of Winnipeg
= number of transit vehicles on the road in year X, calculated
= increase in kilometers travelled per vehicle, 0 for Business as Usual Scenario and OurWinnipeg
Scenarios, assumed for Low Carbon Path Scenario
Where: = the amount of diesel consumed in year X for transit, calculated
= total kilometers travelled by transit vehicles in year X, calculated
= the proportion of diesel in the transit fleet, from the City of Winnipeg
= fuel efficiency of B2 diesel buses in L/km in year X, calculated
3.5
Where: = the amount of electricity consumed in year X for transit, calculated
= total kilometers travelled by transit vehicles in year X, calculated
= the proportion of the electric light rail in the transit fleet, from the City
of Winnipeg
3.0 VEHICLES Vehicle kilometers travelled were modelled using Golder’s transportation model. As part of this, items such as
transit, cycling lanes, and policies were taken into consideration in order to form the input to the model. The
Winnipeg Transportation Master Plan (2011) was the major guiding document for the transportation inputs.
GHG emissions per kilometer travelled are also expected to decrease as the result of new technology and new
government policies, such as federal government tailpipe emission standards. A projection of emissions per

APPENDIX B Forecast Methodology
March 30, 2015 Project No. 13-1443-0010 8/10
kilometer travelled for new vehicles was obtained from a UNEP study on Canadian Automotive Fuel Economy
Policy. To determine the GHG emissions from the combined fleet on the road, it was assumed that the average
vehicle on the road in Winnipeg would be 10 years old. This was based on the current vehicle makeup from the
registration data provided by the City.
For the Business as Usual Scenario, no electric vehicles were assumed. For the OurWinnipeg Scenario, limited
adoption of electric vehicles was assumed to gradually penetrate the market. The Low Carbon Path Scenario
has electric vehicles with increased adoption due to substantial growth of private and public electric vehicle
infrastructure. The City fleet would also be partially retrofitted to electric vehicles in this scenario.
4.0 WASTE DISPOSAL It was assumed that residential waste generated would increase with population such that waste generated per
person per year would remain the same. Similarly, the commercial / industrial and construction / demolition
waste was assumed to increase with the number of jobs such that waste generated per job per year would
remain constant. This was taken as being the same for all scenarios.
Diversion rates for all waste play a major factor in the GHG emissions of landfilled waste. As diversion rates
increase, the amount of landfilled waste goes down. For the Business as Usual Scenario, it was assumed that
no new initiatives would be introduced, leading the diversion rates to not change from 2011. The OurWinnipeg
Scenario has the implementation of the 2011 Comprehensive Integrate Waste Management Plan, which
includes expansion of services to all sectors to increase diversion rates. The Low Carbon Path assumed more
aggressive City policies targeting residential diversion rates, with other diversion rates the same as the
OurWinnipeg Scenario. Also note that both the OurWinnipeg and Low Carbon Scenarios included a yard waste
composting facility, reducing the amount of yard waste ending up in landfills.
Landfill gas capture rate determines that amount of methane gas emitted to the atmosphere. The Business as
Usual Scenario has no change to landfill gas capture efficiency. The OurWinnipeg and Low Carbon Path
Scenarios show a moderate increase in landfill gas capture efficiency, due to the implementation of the 2011
Comprehensive Integrate Waste Management Plan.
Calculations for waste generated and waste sent to landfills are shown below:
Where: = residential waste generated in year X, calculated
= residential waste generated in 2011, from City of Winnipeg
= population in 2011, from the Conference Board of Canada (2012)
= population in year X, from the Conference Board of Canada (2012)

APPENDIX B Forecast Methodology
March 30, 2015 Project No. 13-1443-0010 9/10
1
Where: = residential waste sent to landfills in year X, calculated
= residential waste generated in year X, calculated
= residential diversion rate in year X, from City of Winnipeg
/ /
Where: / = commercial/industrial waste generated in year X, calculated
/ = commercial/industrial waste generated in 2011, from City of Winnipeg
= jobs in 2011, from the Conference Board of Canada (2012)
= jobs in year X, from the Conference Board of Canada (2012)
/ / 1 /
Where: / = commercial/industrial waste sent to landfills in year X, calculated
/ = commercial/industrial waste generated in year X, calculated
/ = commercial/industrial diversion rate in year X, from City of Winnipeg
/ /
Where: / = construction/demolition waste generated in year X, calculated
/ = construction/demolition waste generated in 2011, from City of
Winnipeg
= jobs in 2011, from the Conference Board of Canada (2012)
= jobs in year X, from the Conference Board of Canada (2012)
/ / 1 /
Where: / = construction/demolition waste sent to landfills in year X, calculated
/ = construction/demolition waste generated in year X, calculated
/ = construction/demolition diversion rate in year X, from City of Winnipeg

APPENDIX B Forecast Methodology
March 30, 2015 Project No. 13-1443-0010 10/10
5.0 WATER AND WASTE WATER No changes to water and waste water treatment were assumed in any of the scenarios. The only changes to
water and waste water were the handling of biosolids. In the Business as Usual Scenario, all biosolids continue
to be sent to landfills. In the OurWinnipeg Scenario, the City promotes biosolids sold for beneficial use and sent
to compost. The Low Carbon Path Scenario has a similar approach as the OurWinnipeg Scenario, with the
difference being additional biosolids being sold for beneficial use. All scenarios showed biosolid production
increasing with population.
CITY OF WINNIPEG COMMUNITY 2011 GHG INVENTORY AND FORECAST
March 30, 2015 Report No. 13-1443-0010
APPENDIX C Key Indicators to Track

APPENDIX C Key Indicators to Track
March 30, 2015 Project No. 13-1443-0010 1/4
The following sections detail the key indicators to track by sector as well as the base year values in 2011.
1.0 COMMUNITY TRENDS The following table lists key indicators in community trends to track.
Table 1: Community Trend Key Indicators
Indicator Indicator Description Base Year (2011)
Population Population living within the City of Winnipeg limits 691,800 Jobs Number of jobs within the City of Winnipeg limits 392,640
Single Family Homes Percentage of residential households that live single family homes
63%
Multi-Unit Residential Building Homes
Percentage of residential households that live in multi-unit residential buildings
37%
2.0 BUILDING ELECTRICITY AND NATURAL GAS The following table lists key indicators in building electricity and natural gas to track.
Table 2: Building Electricity and Natural Gas Key Indicators
Indicator Indicator Description Base Year (2011)
Building Electricity Intensity Reduction due to Demand Side Management
Reduction in electricity use per building due to Manitoba Hydro sponsored demand-side management programs
0%
Building Natural Gas Intensity Reduction due to Demand Side Management
Reduction in natural gas use per building due to Manitoba Hydro sponsored demand-side management programs
0%
New Building Energy Intensity Reduction due to Building Stock Changes
Reduction in electricity and natural gas use per residential household due to changes in building stock (i.e., from single family homes to multi-unit residential buildings)
0%
New Building Energy Intensity Reduction due to Technology Changes
Reduction in electricity and natural gas use per building due to changes in building technology.
0%
Additional Electricity Use Increase in residential electricity use per person due to more consumer electronics
0%
Residential Building Scale Renewables
Percentage of residential buildings connected to building-scale renewable systems
1.5%
Commercial/Industrial Building Scale Renewables
Percentage of commercial and industrial buildings connected to building-scale renewable systems
1.5%
Residential Buildings Connected to District Energy Systems
Percentage of residential buildings connected to district energy systems
0%
Commercial Buildings Connected to District Energy Systems
Percentage of commercial buildings connected to district energy systems
0%
Residential Electricity Use Total annual consumption of electricity from residential 1,690,588,866

APPENDIX C Key Indicators to Track
March 30, 2015 Project No. 13-1443-0010 2/4
Indicator Indicator Description Base Year (2011)
(kWh/year) buildings Commercial Electricity Use (kWh/year)
Total annual consumption of electricity from commercial buildings
3,046,484,478
Industrial Electricity Use (kWh/year) Total annual consumption of electricity from industrial buildings
837,309,539
Residential Natural Gas Use (m3/year)
Total annual consumption of natural gas from residential buildings
488,426,808
Commercial Natural Gas (m3/year) Total annual consumption of natural gas from commercial buildings
361,222,578
Industrial Natural Gas (m3/year) Total annual consumption of natural gas from industrial buildings
104,025,761
Other potential indicators to track include residential, commercial, and industrial building electricity and natural
gas intensity on a kWh/m2 and GJ/m2 basis, respectively.
3.0 TRANSIT The following table lists key indicators in transit to track.
Table 3: Transit Key Indicators
Indicator Indicator Description Base Year (2011)
Kilometers of Transit Travel (km/year)
Total annual kilometers of transit travel for all transit vehicles
24,300,000
Bus Fuel Type Breakdown of fuel use for buses 100% Diesel Diesel Fuel Use (L/year) Total annual diesel fuel use for transit vehicles 16,163,620 Electricity Use (MWh/year) Total annual electricity use for transit vehicles 0
Residents Close to Transit Percentage of residents within a 5 minute walk of a transit service route
95%
Maximum Route Headway (minutes)
Maximum route headway for City transit vehicles 60
Other potential indicators to track include transit ridership per capita.
4.0 VEHICLES The following table lists key indicators in vehicles to track.
Table 4: Vehicle Key Indicators
Indicator Indicator Description Base Year (2011)

APPENDIX C Key Indicators to Track
March 30, 2015 Project No. 13-1443-0010 3/4
Indicator Indicator Description Base Year (2011)
Cycle Network (km) Total length of all City cycle paths 274 Total Residential Vehicle Kilometers Travelled (vkmt/year)
Total annual distance travelled by all residential vehicles
5,175,656,607
Total Commercial Vehicle Kilometers Travelled (vkmt/year)
Total annual distance travelled by all commercial vehicles
932,055,814
Electric Vehicle Use Percentage of vehicles that are full electric vehicles
0%
Modal Share Breakdown of residential vehicle trips by mode
Auto-Driver: 64% Auto-Passenger: 19% Public Transit: 9% Walk/Cycle: 7%
Vehicle Emissions Reduction in vehicle emissions per kilometer travelled relative to base year
0%
Average Residential Fleet Emissions (gCO2e/km)
Average greenhouse gas emissions from the residential fleet
370
Average Commercial Fleet Emissions (gCO2e/km)
Average greenhouse gas emissions from the commerical fleet
1015
5.0 WASTE DISPOSAL The following table lists key indicators in waste disposal to track.
Table 5: Vehicle Key Indicators
Indicator Indicator Description Base Year (2011)
Residential Waste (tonne/year) Total annual residential waste sent to landfills
278,896
Commercial/Industrial Waste (tonne/year) Total annual commercial and industrial waste sent to landfills
348,000
Construction/Demolition Waste (tonne/year) Total annual construction and demolition waste sent to landfills
124,000
Residential Diversion Rate Amount of residential waste diverted from landfills
15%
Commercial/Industrial Diversion Rate Amount of commercial and industrial waste diverted from landfills
20%
Construction/Demolition Diversion Rate Amount of construction and demolition waste diverted from landfills
20%
Landfill Gas Collection Coverage (City Landfills)
Percentage of City Landfill Area with Landfill Gas Collection
100%
Landfill Gas Collection Efficiency (City Landfills)
Efficiency of Landfill Gas Collection for City Landfills
55%
Other potential indicators to track include waste generated per capita.

APPENDIX C Key Indicators to Track
March 30, 2015 Project No. 13-1443-0010 4/4
6.0 WATER AND WASTE WATER The following table lists key indicators in water and waste water to track.
Table 6: Vehicle Key Indicators
Indicator Indicator Description Base Year (2011)
Mass of Biosolids Disposed (tonne/year) Total annual biosolids disposed from water and waste water
13,982
Biosolids Sold for Beneficial Use Percentage of biosolids sold for beneficial use
0%
Biosolids Composted Percentage of biosolids composted 0%

CITY OF WINNIPEG COMMUNITY 2011 GHG INVENTORY AND FORECAST
March 30, 2015 Report No. 13-1443-0010
APPENDIX D Low Carbon Path Workshop Outcomes, May 30, 2014

Winnipeg Low Carbon Path Workshop
This document captures the suggestions that were made by the participants in a workshop hosted by the City of Winnipeg and Golder Associates at the Winnipeg Millennium Library on May 30, 2014.Golder began by giving a presentation on the process, assumptions, methods, and results of the project so far. The participants were then arranged into groups of four or five people at four tables. Each table had a facilitator who recorded the participants’ ideas on sheets of flipchart paper. During that table discussion session, 32 sheets of ideas were captured.At the end of the table discussion session, each participant was asked to mark one vote with an “*” for one idea from each of the four topic areas. There was then a “regroup” session where the ideas that had received a “*” were read out and comments invited.Before participants left the workshop, they were given sticker “dots” and asked to place them next to whichever ideas they felt should be given priority. Land Use received 31 dots, Transportation 23, Solid waste 18, and Buildings received 5 These are the topic areas that were considered during this workshop:
LAND USE! 2
Land use priorities 2Table selections for Land Use 2Other ideas for Land Use 3
TRANSPORTATION! 6
Transportation priorities 6Transportation table selections 6Other ideas for transportation 7
BUILDINGS! 11
Buildings priorities 11Buildings table selections 11Other ideas for buildings 12
SOLID WASTE! 14
Solid Waste priorities 14Solid Waste table selections 14Other ideas for solid waste 14
City Of Winnipeg GHG Inventory & Reduction Plan 13-1443-0010-3000
Low Carbon Path Workshop - Participant Ideas Page 1 Of 15 Tuesday, May 20, 2014

LAND USE
Land use priorities
These are all of the ideas that received table votes (*) or voting dots in the area of Land Use:• (5 dots) Permeable for AT - Neighbourhood plans include cut-throughs• * (plus 4 dots) Corporate Energy Management Plan - pools, adm, comm. centre - lead by
example• ** (plus 3 dots) Require District System readiness • ** (plus 3 dots) Increasing uptake of District Energy in new / existing communities• * (plus 3 dots) Energy modeling programs - monitoring• * (plus 3 dots) Multifamily / Apartment - more greenspace within and near multifamily
developments (Verve Tache) - intergenerational• **** (plus 2 dots) Increasing fine grained mix of uses including population, jobs
(challenged by existing policy / practice)• * (plus 2 dots) Mixed Use • (2 dots) Transit oriented development• **** (plus 1 dot) Force ourselves to implement our plan / improve plan; More specifics,
Targets, Results driven, Mechanism for regular review• * (plus 1 dot) Increased density• (1 dot) Repurpose / Redevelop old industrial• (1 dot) Develop in targeted areas (incentives)• * Decentralize community services (e.g. Library, Community Centre, Schools) -
neighbourhood based• * Maximize solar capture, green roof• * Everything within 400 m• * Decrease land consumption for surface parking• * Require trip generation / energy use / carbon emissions analysis - lead to evaluation
with new vs redevelopment
Table selections for Land Use
The following are the Land Use ideas that were shared during the “regroup” session. These ideas were identified to be a priority by at least one participant during the table session. Ideas that were identified by multiple groups were amalgamated:
• Decentralize common services• More multifamily / Mixed use
City Of Winnipeg GHG Inventory & Reduction Plan 13-1443-0010-3000
Low Carbon Path Workshop - Participant Ideas Page 2 Of 15 Tuesday, May 20, 2014

• Locate all services within 400 meters • Improve plan• Less surface parking• New and infill have District energy
Other ideas for Land Use
These are all of the ideas exactly as recorded on the flip chart sheets during the table discussions of Land Use:
• Financial incentives / mechanisms (e.g. Local improvement charges)• LED street lights• Brownfield incentives to increase infill• Balance of single vs. Multi-family• TDM1 built into new developments• More focus on density / dev along corridors - create a network and link with Transit• Green job development to create efficiencies (i.e. Quality jobs)• **** (plus 2 dots) Increasing fine grained mix of uses including population, jobs
(challenged by existing policy / practice)• Commitment to efficiency in new building developments• Promotion of telecommuting (affected by zoning)• Increase in infill development• ** (plus 3 dots) Increasing uptake of District Energy in new / existing communities• * (plus 3 dots) Energy modeling programs - monitoring• Building operator training• Building labeling of energy rating• * Maximize solar capture, green roof• Incentive programs? - There is risk associated with the end of incentives, Use to fill a
market gap• Require solar / electric vehicle / other energy efficiency readiness• ** (plus 3 dots) Require District System readiness • LEED / Advanced energy requirements (partial?)• (1 dot) Green building policy updated; more clarity before implementation
City Of Winnipeg GHG Inventory & Reduction Plan 13-1443-0010-3000
Low Carbon Path Workshop - Participant Ideas Page 3 Of 15 Tuesday, May 20, 2014
1 Transportation Demand Management

• * (plus 4 dots) Corporate Energy Management Plan - pools, adm, comm. centre - lead by example
• Building code - enhance provisions• Incentive to exceed code• High energy efficiency standard• Property tax inc• Utilities tax inc• Biomass District energy• Examine renewable energy during building design• Geothermal and Biomass District energy in 50% of new developments• * Decentralize community services (e.g. Library, Community Centre, Schools) -
neighbourhood based• Make public buildings multipurpose - schools in evening, community centres, churches• Regional strategy - transportation authority• Plan to accommodate multi-modal transportation• Annex communities / RM2 lands to enable efficient land use planning• Allow tiny houses - smaller lots• (2 dots) Transit oriented development• Allow Car share to reduce parking requirements• Walkable placement of everything (shopping...)• * (plus 3 dots) Multifamily / Apartment - more greenspace within and near multifamily
developments (Verve Tache) - intergenerational• (1 dot) Repurpose / Redevelop old industrial• * (plus 2 dots) Mixed Use • Educate public about value of mixed use• * (plus 1 dot) Increased density• (5 dots) Permeable for AT - Neighbourhood plans include cut-throughs• (1 dot) Develop in targeted areas (incentives)• Dis-incent development in areas that are not part of plan• Cost recovery of development• Conserve existing natural greenspace and create new• Greater inner city development, less sprawl
City Of Winnipeg GHG Inventory & Reduction Plan 13-1443-0010-3000
Low Carbon Path Workshop - Participant Ideas Page 4 Of 15 Tuesday, May 20, 2014
2 Rural Municipality

• Greenspace vs. Infill - Use un-used or industrial land before greenspace • Use rail land for infill• Tax incentives for infill• Tax dis-incentive for sprawl• By 2031 75% PERC(?) density• Convert policy to practice• Rooftop agriculture• Reduce single family homes• “Fence” limit - No new growth beyond current footprint - determine where fence should
be• * Everything within 400 m• Policy that survives admin change• New area development
• Higher density
• Mixed use
• Transit orientation
• Closer proximity to destination
• Better land use planning / integration with transportation planning• **** (plus 1 dot) Force ourselves to implement our plan / improve plan
• More specifics
• Targets
• Results driven
• Mechanism for regular review• * Decrease land consumption for surface parking
• More efficient use of space
• Build up more• Reduction of heat islands (map them)• Land development(?) needs to go hand-in-hand with provision of services• * Require trip generation / energy use / carbon emissions analysis - lead to evaluation
with new vs redevelopment• Consider more District energy (Vancouver requires it) - Require District Energy business
case
City Of Winnipeg GHG Inventory & Reduction Plan 13-1443-0010-3000
Low Carbon Path Workshop - Participant Ideas Page 5 Of 15 Tuesday, May 20, 2014
TRANSPORTATION
Transportation priorities
These are all of the ideas that received table votes (*) or voting dots in the area of Transportation:• ** (plus 5 dots) Integration of Land Use and Transportation planning• ** (plus 3 dots) Transit - improve service; frequency, wi-fi, multi-modal• ** (plus 3 dots) Addressing multi-modal needs more comprehensively• * (plus 3 dots) No additional road capacity (VKT is not going up)• *** (plus 2 dots) Regional Transit development (demand responsive)• * (plus 2 dots) Downtown bike share 2020, City-wide bike share 2031• *** (plus 1 dot) Making Transit / walking / cycling more convenient for most trips
(caution against making car use too convenient)• ** (plus 1 dot) Aggressive deployment of rapid charge electric buses• (1 dot) Pay as you drive insurance by 2020; all, personal only• (1 dot) Revenue neutral carbon tax (relevant to all topics)• (1 dot) Mode share targets• * Regional AT development• * Full / Aggressive implementation of AT strategies / Transit strategies• * Retrofit City vehicles with alternative energy / low emissions / electric• * Rapid Transit• * More Quality Corridors (than are currently on Transportation Master Plan)• * Recharging station network• * Distance based insurance• * Plan cycle facilities such that they are excellent in summer and therefore adequate in
winter (snow storage and clearing)• * More river transportation
Transportation table selections
The following are the Transportation ideas that were shared during the “regroup” session. These ideas were identified to be a priority by at least one participant during the table session. Ideas that were identified by multiple groups were amalgamated:
• Retrofit or replace City fleet vehicles• Regional Transit development• Regional Active Transportation strategy
City Of Winnipeg GHG Inventory & Reduction Plan 13-1443-0010-3000
Low Carbon Path Workshop - Participant Ideas Page 6 Of 15 Tuesday, May 20, 2014

• Aggressive deployment of rapid charge electric buses• Address multi-modal transportation comprehensively• Make Transit / walking more convenient for most trips• Integrate land use and transportation planning• Create a city-wide bike share system • Recharging station network• Distance-based insurance• Plan cycling facilities that are so good in summer that they are adequate in winter (e.g.
leave space for cleared snow)• More river transportation• Improve quality of Transit (e.g. Wi-Fi, frequency, multi-modal)• More Transit Quality Corridors - Go beyond the routes defined in the Transportation
Master Plan
Other ideas for transportation
These are all of the ideas exactly as recorded on the flip chart sheets during the table discussions of Transportation:
• * Plan cycle facilities such that they are excellent in summer and therefore adequate in winter (snow storage and clearing)
• Separated cycling facilities• * More river transportation• More walking / cycling bridges• Reduce parking minimum requirements (for building permits)• ** (plus 3 dots) Transit - improve service; frequency, wi-fi, multi-modal• * Rapid Transit• * More Quality Corridors (than are currently on Transportation Master Plan)• Become a Transit City (instead of a Car City)• School travel planning (encourage kids)• Car sharing on post secondary campuses• Bike share within offices (instead of fleets)• Regional subscription service for car pooling• Preferences (e.g. Parking) for “green” cars• * Recharging station network• Sidewalk clearing in winter
City Of Winnipeg GHG Inventory & Reduction Plan 13-1443-0010-3000
Low Carbon Path Workshop - Participant Ideas Page 7 Of 15 Tuesday, May 20, 2014

• * Distance based insurance• Connectivity improvement within AT3 network - especially major intersections (e.g.
Osborne underpass)• TDM requirements for large facilities and employers (e.g. California, Washington)• Buy local• Better Transit / cycling int.• More park and ride• Set car-share mode target• Improve Transit network for more convenient travel• Commercial vehicle diamond lanes (trucks, taxi, Canada Post, etc)• Goods delivery scheduling• Physically separated bike facilities• * (plus 3 dots) No additional road capacity (VKT is not going up)• ** (plus 5 dots) Integration of Land Use and Transportation planning• When developing - What’s required to get there• Modeling shortcoming - congestion• (1 dot) Pay as you drive insurance by 2020; all, personal only• * Downtown bike share 2020, (2 dots) City-wide bike share 2031• Targeted street standard for more efficient goods movement• Unbundling of parking requirement (incentive to not own a car)• Charging stations• More plugs for long-term parking• Increased use of waterways (winter and summer)• *** (plus 1 dot) Making Transit / walking / cycling more convenient for most trips
(caution against making car use too convenient)• Education - bike / Transit, not just Driver’s Ed• Accommodate LSEV4 - licensing and infrastructure• (1 dot) Revenue neutral carbon tax (relevant to all topics)• Prioritizing snow and road cleaning• ** (plus 3 dots) Addressing multi-modal needs more comprehensively• (1 dot) Mode share targets
City Of Winnipeg GHG Inventory & Reduction Plan 13-1443-0010-3000
Low Carbon Path Workshop - Participant Ideas Page 8 Of 15 Tuesday, May 20, 2014
3 Active Transportation
4 Low Speed Electric Vehicle

• Lawnmower exchange programs (to push / electric)• Speed limit / Intelligent transportation systems• Reduce ROW5 width - Alternate time of day lanes• Signal synchronization• Minimum standards on car share for certain developments (origin and destination)• Institutional shuttle services / pool vehicles• ** (plus 1 dot) Aggressive deployment of rapid charge electric buses• Electrification of RT6 system• End of life transport improvements• Community / Campus bike share• Increase biofuel standards• Reduce overall VKT• *** (plus 2 dots) Regional Transit development (demand responsive)• * Regional AT development• Vehicle use restrictions?• Vehicle Corydons’s / Tolls?• Distance-based insurance• Gas tax increases?• * Full / Aggressive implementation of AT strategies / Transit strategies• Target growth in electric charging stations• Target growth in priority parking• Target growth in car-share deployment• Bike lane expansion• Not enough Transit buses during high gas prices• Compare Active Transportation to cities such as Amsterdam for limit• Set up transportation authority - charge vehicles in city to fund• Suburban Transit access - build new routes• Build Transit interchange to allow better access to Rapid Transit - Shuttles, expand inter-
city, free bus• Target cars in downtown; tax, limit
City Of Winnipeg GHG Inventory & Reduction Plan 13-1443-0010-3000
Low Carbon Path Workshop - Participant Ideas Page 9 Of 15 Tuesday, May 20, 2014
5 Right of Way
6 Rapid Transit

• Target Active Transportation - 50% target for AT• Compare other cities with good transit to set goal• Limit parking downtown; reduce spaces, cost / tax• Electric vehicle; all City vehicles, with City Centre to start• Rapid Transit to airport• * Retrofit City vehicles with alternative energy / low emissions / electric
City Of Winnipeg GHG Inventory & Reduction Plan 13-1443-0010-3000
Low Carbon Path Workshop - Participant Ideas Page 10 Of 15 Tuesday, May 20, 2014

BUILDINGS
Buildings priorities
These are all of the ideas that received table votes (*) or voting dots in the area of Buildings:• *** (plus 3 dots) Energy labelling on new buildings and transfer of ownership• ** (plus 2 dots) Mandated energy audits when selling buildings (consumer disclosure)• *** Renewable ready (solar, geothermal); District energy in right of way• * Renovation code• * Adaptable / durable / resilient buildings• * Geothermal as a utility• * Energy audits and incentives for middle market• * Incentives for retrofits (more PAYS)• * CHP7 / District energy in re-development sites• * Focus on identifying the barriers to building energy efficiency (factors that impact the
market) and develop a strategy to eliminate
Buildings table selections
The following are the Buildings ideas that were shared during the “regroup” session. These ideas were identified to be a priority by at least one participant during the table session. Ideas that were identified by multiple groups were amalgamated:
• Create an Energy Management plan for corporate City buildings• Perform energy modelling on more buildings• Maximize solar capture• District energy system readiness / redevelopment• Identify market barriers for high-performance buildings• Mandate energy audit when selling a building (e.g. as is done in UK)• Incentives for middle market • Geothermal as a utility• Incentives for retrofit• Energy labelling for new buildings • Adaptable, durable building design
City Of Winnipeg GHG Inventory & Reduction Plan 13-1443-0010-3000
Low Carbon Path Workshop - Participant Ideas Page 11 Of 15 Tuesday, May 20, 2014
7 Combined Heat and Power

Other ideas for buildings
These are all of the ideas exactly as recorded on the flip chart sheets during the table discussions of Buildings:
• * Geothermal as a utility• * Energy audits and incentives for middle market• Building performance monitoring and management services• Performance metrics; more visible / standardized, for sale, during use -• Winter city design (not California)• Building performance feedback (meters, Apps)• Co-location of heat-producers with heat users• Passive solar design; solar walls, seasonal water use• Green roofs; food, “grass”• Public green spaces• * Incentives for retrofits (more PAYS)• Bike facilities within buildings; storage, access (stairs), multiple commercial tenants with
access to shared facility• Passivhaus• Building energy improvement costs shared - include geothermal• Increase education / efficiency promotion• Large institutional / Building fuel switching (e.g. Biomass)• * CHP8 / District energy in re-development sites• Tax credits incentives for efficiency• What communities all stack (?)• Retrofit existing buildings; begin with City buildings, aggressive targeting• Technical feasibility of geothermal in Winnipeg• Add heat utility• Available capital funds for energy efficiency• Internal carbon tax• Municipal gas / carbon tax• U of M, U of W, HSC big carbon• Winnipeg as leader in “green” building
City Of Winnipeg GHG Inventory & Reduction Plan 13-1443-0010-3000
Low Carbon Path Workshop - Participant Ideas Page 12 Of 15 Tuesday, May 20, 2014
8 Combined Heat and Power

• Decouple Manitoba Hydro Power Smart; allow consultant assessments• Electric vehicle-ready housing• *** (plus 3 dots) Energy labelling on new buildings and transfer of ownership• Commercial energy disclosure; challenge sub-metering• *** Renewable ready (solar, geothermal); District energy in right of way• * Renovation code• * Adaptable / durable / resilient buildings• Green building incentives / standard• MLS listing - energy rating• Remove barriers to building energy efficiency - lack of availability of smaller, more
energy efficient homes, lots - • * Focus on identifying the barriers to building energy efficiency (factors that impact the
market) and develop a strategy to eliminate• ** (plus 2 dots) Mandated energy audits when selling buildings (consumer disclosure)
City Of Winnipeg GHG Inventory & Reduction Plan 13-1443-0010-3000
Low Carbon Path Workshop - Participant Ideas Page 13 Of 15 Tuesday, May 20, 2014

SOLID WASTE
Solid Waste priorities
These are all of the ideas that received table votes (*) or voting dots in the area of Solid Waste:• **** (plus 7 dots) Provincial regulations enforcing material bans (organics, drywall,
lumber, etc)• **** (plus 6 dots) Biomass / Waste streams as heat / power source (waste-to-energy)• * (plus 4 dots) Life Cycle Analysis carbon analysis for diversion• ** (plus 1 dot) Water sensitive urban design (regulations)• *** Curbside organics (commercial, industrial, residential)• ** Industrial composting (grocery, hospitals, restaurants)• ** Biomass energy strategy 2020• ** Greywater use• * Increase household composting (e.g. Workshops)• * Construction waste recovery and reuse• * Expand methane capture
Solid Waste table selections
The following are the Solid Waste ideas that were shared during the “regroup” session. These ideas were identified to be a priority by at least one participant during the table session. Ideas that were identified by multiple groups were amalgamated:
• Material ban from landfill• Life Cycle Analysis for diversion - • Water sensitive urban design - • Biomass strategy• Curbside organics• Methane capture for industrial / commercial • Industrial composting -• Household composting• Construction waste recovery / reuse -
Other ideas for Solid Waste
These are all of the ideas exactly as recorded on the flip chart sheets during the table discussions of Solid Waste:
City Of Winnipeg GHG Inventory & Reduction Plan 13-1443-0010-3000
Low Carbon Path Workshop - Participant Ideas Page 14 Of 15 Tuesday, May 20, 2014

• * Increase household composting (e.g. Workshops)• ** Industrial composting (grocery, hospitals, restaurants)• Consistent diversion system (i.e. Clear identification of what is acceptable on each bin)• * Construction waste recovery and reuse• Tipping fees are too low• *** Curbside organics (commercial, industrial, residential)• * Expand methane capture• Methane beneficial reuse• **** (plus 6 dots) Biomass / Waste streams as heat / power source (waste-to-energy)• Naturalization of green spaces• ** (plus 1 dot) Water sensitive urban design (regulations)• Xerscaping• Wetland treatment• Usage of urban waste wood for energy• ** Biomass energy strategy 2020• * (plus 4 dots) LCA carbon analysis for diversion• More efficient diversion• Improve load efficiency in collection• Compost organics at home - not City collection• Recycle half / Incinerate half• Water pricing• **** (plus 7 dots) Provincial regulations enforcing material bans (organics, drywall,
lumber, etc)• Curbside composting• Commercial composting• Expand use of landfill gas (plan for elimination)• Ban plastic bags (scope?)• Target reductions in packaging• Expansion of product stewardship for end-of-life of specific products• ** Greywater use
City Of Winnipeg GHG Inventory & Reduction Plan 13-1443-0010-3000
Low Carbon Path Workshop - Participant Ideas Page 15 Of 15 Tuesday, May 20, 2014

CITY OF WINNIPEG COMMUNITY 2011 GHG INVENTORY AND FORECAST
March 30, 2015 Report No. 13-1443-0010
APPENDIX E Forecast Scenario Indicators

APPENDIX E Forecast Scenario Indicators
March 30, 2015 Project No. 13-1443-0010 1/3
The following sections detail the key indicators for the base year (2011) and each scenario (2031).
1.0 COMMUNITY TRENDS The following table lists key indicators in community trends.
Table 1: Community Trend Key Indicators
Indicator Base Year (2011) Business as Usual (2031)
OurWinnipeg (2031)
Low Carbon Path (2031)
Population 691,800 876,700 876,700 876,700 Jobs 392,640 489,600 489,600 489,600 Single Family Homes 63% 63% 61% 58% Multi-Unit Residential Building Homes
37% 37% 39% 42%
2.0 BUILDING ELECTRICITY AND NATURAL GAS The following table lists key indicators in building electricity and natural gas.
Table 2: Building Electricity and Natural Gas Key Indicators
Indicator Base Year
(2011) Business as Usual (2031)
OurWinnipeg (2031)
Low Carbon Path (2031)
Building Electricity Intensity Reduction due to Demand Side Management
0% 5% 5% 5%
Building Natural Gas Intensity Reduction due to Demand Side Management
0% 3% 3% 3%
New Building Energy Intensity Reduction due to Building Stock Changes
0% 0% 8% 17%
New Building Energy Intensity Reduction due to Technology Changes
0% 20% 20% 30%
Additional Electricity Use 0% 10% 10% 10% Residential Building Scale Renewables
1.5% 1.5% 4% 8%
Commercial/Industrial Building Scale Renewables
1.5% 1.5% 6% 12%
Residential Buildings Connected to District Energy Systems
0% 0% 2% 4%
Commercial Buildings Connected to District Energy Systems
< 1% < 1% 3% 6%
Residential Electricity Use (kWh/year)
1,690,588,866 2,175,793,596 2,143,841,778 2,066,458,470
Commercial Electricity Use (kWh/year)
3,046,484,478 3,499,055,017 3,499,055,017 3,423,823,982
Industrial Electricity Use (kWh/year) 837,309,539 961,696,068 961,696,068 941,019,231

APPENDIX E Forecast Scenario Indicators
March 30, 2015 Project No. 13-1443-0010 2/3
Indicator Base Year
(2011) Business as Usual (2031)
OurWinnipeg (2031)
Low Carbon Path (2031)
Residential Natural Gas Use (m3/year)
488,426,808 648,519,154 633,883,431 604,010,541
Commercial Natural Gas (m3/year) 361,222,578 473,031,695 466,306,958 448,167,147 Industrial Natural Gas (m3/year) 104,025,761 136,224,824 134,692,295 129,843,331
3.0 TRANSIT The following table lists key indicators in transit.
Table 3: Transit Key Indicators
Indicator Base Year (2011) Business as Usual (2031)
OurWinnipeg (2031)
Low Carbon Path (2031)
Kilometers of Transit Travel (km/year)
24,300,000 24,300,000 30,981,682 41,205,637
Bus Fuel Type 100% B2 Biodiesel
100% B2 Biodiesel
90% B2 Biodiesel 10% Electric
60% B2 Biodiesel 40% Electric
Diesel Fuel Use (L/year) 16,163,620 13,184,596 15,139,554 13,423,738 Electricity Use (MWh/year) 0 0 10,844 57,688
4.0 VEHICLES The following table lists key indicators in vehicles.
Table 4: Vehicle Key Indicators
Indicator Base Year
(2011) Business as Usual (2031)
OurWinnipeg (2031)
Low Carbon Path (2031)
Cycle Network (km) 274 274 674 800 Total Residential Vehicle Kilometers Travelled (vkmt/year)
5,175,656,607 6,256,030,891 6,161,200,794 5,976,259,971
Total Commercial Vehicle Kilometers Travelled (vkmt/year)
932,055,814 1,251,209,851 1,232,240,159 1,195,251,994
Electric Vehicle Use 0% 0% 2% 8% Weekday Trips by Mode Auto Driver Auto Passenger Public Transit Walk/Cycle
64% 19% 9% 7%
65% 19% 9% 7%
63% 18% 10% 9%
58% 18% 13% 10%
Average Residential Fleet Emissions (gCO2e/km)
370 196 193 185
Average Commercial Fleet Emissions (gCO2e/km)
1015 538 538 532

APPENDIX E Forecast Scenario Indicators
March 30, 2015 Project No. 13-1443-0010 3/3
5.0 WASTE DISPOSAL The following table lists key indicators in waste disposal.
Table 5: Vehicle Key Indicators
Indicator Base Year
(2011) Business as Usual (2031)
OurWinnipeg (2031)
Low Carbon Path (2031)
Residential Waste (tonne/year) 278,896 353,438 199,588 99,794 Commercial/Industrial Waste (tonne/year)
348,000 433,936 433,936 108,484
Construction/Demolition Waste (tonne/year)
124,000 154,621 154,621 38,655
Residential Diversion Rate 15% 15% 50% 75% Commercial/Industrial Diversion Rate
20% 20% 20% 80%
Construction/Demolition Diversion Rate
20% 20% 20% 80%
Landfill Gas Collection Coverage (City Landfills)
100% 100% 100% 100%
Landfill Gas Collection Efficiency (City Landfills)
55% 55% 75% 75%
Landfilled Waste Per Capita (tonne/person/year)
1.09 1.07 0.90 0.28
6.0 WATER AND WASTE WATER The following table lists key indicators in water and waste water.
Table 6: Vehicle Key Indicators
Indicator Base Year (2011)Business as Usual (2031)
OurWinnipeg (2031)
Low Carbon Path (2031)
Mass of Biosolids Disposed (tonne/year)
13,982 17,700 17,700 17,700
Biosolids Sold for Beneficial Use
0% 0% 40% 70%
Biosolids Composted 0% 0% 30% 30%

Golder Associates Ltd.
200 - 2920 Virtual Way
Vancouver, British Columbia, V5M 0C4
Canada
T: +1 (604) 296 4200