Greenhouse gas fluxes between drained forested - GUPEA
31
1 Greenhouse gas fluxes between drained forested peatlands and the atmosphere – influence of nutrient status and wood ash fertilization Maria Ernfors Department of Plant and Environmental Sciences Gothenburgh University 2009 Akademisk avhandling för filosofie doktorsexamen i Naturvetenskap, med inriktning mot Miljövetenskap, som enligt Naturvetenskapliga fakultetens beslut kommer att offentligen försvaras fredagen den 15 maj 2009, kl 9.00 i föreläsningssalen, Institutionen för växt- och miljövetenskaper, Carl Skottsbergs gata 22b, Göteborg. Examinator: Professor Ulf Molau Fakultetsopponent: Dr. Peter Dörsch, Dept. of Plant and Environm. Sci. Norwegian University of Life Sciences Box 5003, N-1432 Aas, Norway Göteborg, februari 2009
Transcript of Greenhouse gas fluxes between drained forested - GUPEA
1
Greenhouse gas fluxes between drained forested peatlands and the atmosphere
– influence of nutrient status and wood ash fertilization
Maria Ernfors
Department of Plant and Environmental Sciences
Gothenburgh University 2009
Akademisk avhandling för filosofie doktorsexamen i Naturvetenskap, med inriktning mot Miljövetenskap, som enligt Naturvetenskapliga fakultetens beslut
kommer att offentligen försvaras fredagen den 15 maj 2009, kl 9.00 i föreläsningssalen, Institutionen för växt- och miljövetenskaper, Carl Skottsbergs
gata 22b, Göteborg.
Examinator: Professor Ulf Molau
Fakultetsopponent: Dr. Peter Dörsch, Dept. of Plant and Environm. Sci. Norwegian University of Life Sciences Box 5003, N-1432 Aas, Norway
Göteborg, februari 2009

2
ISBN 978-91-85529-25-4
3
Greenhouse gas fluxes between drained forested peatlands and the atmosphere
- influence of nutrient status and wood ash fertilization
Maria Ernfors
Department of Plant and Environmental Sciences Gothenburgh University, 2009
Abstract The management of peatlands for wood production involves drainage and, sometimes, fertilization with, for example, wood ash. The effects of these measures on greenhouse gas fluxes, in relation to the nutrient status of the peat, were studied at three sites in southern Sweden. The carbon dioxide (CO2) fluxes from a well drained nutrient rich peatland, with an agricultural history, were found to be high (71 000 kg ha-1 a-1), in comparison to earlier studies of similar sites. There was also a net uptake of CH4
(-4.4 kg ha-1 a-1) and a net emission of N2O (2.7 kg ha-1 a-1). At two nutrient poor sites, one of which was well drained and one poorly drained, there were net CH4 emissions (5.1 and 8.5 kg ha-1 a-1, respectively; averaged over three years) and no fluxes of N2O. The CO2 flux values measured at the nutrient poor sites (9 500 and 13 000 kg ha-1 a-1, respectively; averaged over three years) were considered to be underestimates, due to the measurement technique used. The N2O fluxes from all three sites where gas fluxes were measured agreed well with predictions made on the basis of the C:N ratio of the peat. At a nutrient poor site, ash fertilization did not result in any changes in greenhouse gas emissions over a period of five years after the treatment. However, signs of increased tree growth, and thereby increased CO2 uptake, were detectable in the fifth year. At a nutrient rich site, which was studied over a period of two years after ash fertilization, CO2 and N2O emissions from the treated plots decreased, but no changes in tree stand growth were detected. The decrease in N2O emissions was attributed to an increase in pH in the ash fertilized plots, which affected the N2O winter fluxes. The preliminary conclusion was that wood ash fertilization has a positive influence on the greenhouse gas balance of drained peatlands. Analyses of soil samples from three drained peatlands – two treated recently with wood ash and one that was treated 25 years earlier – supported this conclusion by showing no major changes in microbial processes, community structure or biomass, apart from decreases in net nitrogen mineralization and microbial biomass (as indicated by PLFA) at the nutrient poor sites. The studies upon which this thesis is based were mainly short-term; for definitive conclusions to be drawn, gas fluxes must be studied over the long-term.

4
5
Sammanfattning För att kunna bedriva skogsbruk på torvmark krävs att grundvattennivån sänks, så att marken blir tillräckligt syresatt. Detta uppnås genom dikning. Ofta är det också nödvändigt att tillföra näringsämnen, speciellt fosfor (P) och kalium (K). Dessa näringsämnen finns i aska från förbränning av biobränslen. De studier som presenteras här utfördes för att undersöka vilka effekter dikning och gödsling med biobränsleaska har på torvmarkers emissioner och upptag av växthusgaser. Studierna utfördes på tre torvmarker i södra Sverige. Två av de utvalda försöksytorna var dikade mossar och hade låg näringsstatus, medan den tredje var ett dikat kärr som tidigare använts som jordbruksmark och som hade hög näringsstatus. Emissionerna av koldioxid (CO2) på den näringsrika torvmarken var höga (71 000 kg ha-1 a-1) jämfört med tidigare studier på liknande marker. Den näringsrika ytan hade också ett nettoupptag av metan (CH4)
(-4.4 kg ha-1 a-1) och en nettoemission av lustgas (N2O) (2.7 kg ha-1 a-1). På de två näringsfattiga torvmarkerna, varav en var väldikad och en sämre dikad, uppmättes nettoemissioner av CH4 (5.1 resektive 8.5 kg ha-1 a-1, medel över tre år), men varken emissioner eller upptag av N2O. CO2-emissionerna som uppmättes på de näringsfattiga ytorna (9 500 respektive 13 000 kg ha-1 a-1, medel över tre år) underskattades troligen, på grund av den mätteknik som användes. Resultaten av N2O-mätningarna på de tre torvytorna överensstämde väl med de förutsägelser som gjorts med hjälp av en modell, utifrån markens C:N-kvot. Gödsling med biobränsleaska på en av de näringsfattiga ytorna hade inga effekter på växthusgasflödena, under de fem år efter askspridningen som studien pågick. Det fanns dock tecken på att träden svarat på gödslingen med en ökad tillväxt. På den näringsrika ytan var emissionerna av CO2 and N2O lägre på de askade parcellerna, under de två första åren efter asktillförseln, medan inga effekter på trädtillväxten kunde urskiljas. Den minskade årliga N2O-emissionen, som berodde på minskade vinteremissioner, kunde förklaras med ett ökat pH-värde i det översta marklagret. Den preliminära slutsatsen av askförsöken var att asktillförsel har en positiv effekt på växthusgasbalansen för dikade torvmarker. En studie gjordes också på torvprover, som samlades in från två av ytorna där växthusgasflöden mätts och från en yta som askgödslats 25 år tidigare. Analyser av proverna visade inga stora effekter av askan på de mikrobiella processerna, den mikrobiell biomassan eller den mikrobiella samhällsstrukturen, förutom minskningar av nettokvävemineralisering och mikrobiell biomassa (mätt genom analys av PLFA) på de näringsfattiga ytorna. Dessa resultat stärker slutsatsen att aska snarare minskar än ökar växthusgasemissionerna från dikade skogliga torvmarker. Det bör noteras att de mätningar som presenteras här pågick som längst fem år efter askbehandling. För att kunna dra definitiva slutsatser om effekterna av askgödsling på växthusgasflöden behövs långtidsstudier.

6
7
List of papers The present thesis is based on the following papers, which are referred to in the text by their Roman numerals.
I. Ernfors M, von Arnold K, Stendahl J, Olsson M, Klemedtsson L. Nitrous
oxide emissions from drained organic forest soils––an up-scaling based on C:N ratios. Biogeochemistry (2007) 84: 219-231.*
II. Ernfors M, Nousratpour A, Weslien P, Klemedtsson L. Greenhouse gas
dynamics of a well drained afforested agricultural peatland. Manuscript.
III. Ernfors M, Sikström U, Nilsson M, Klemedtsson L. Fertilization of nutrient poor drained peatland forests with wood ash did not alter greenhouse gas emissions in the short term. Submitted to Science of the Total Environment.
IV. Klemedtsson L, Ernfors M, Björk RG, Weslien P, Rütting T, Crill P,
Sikström U. Reduction of greenhouse gas emissions by wood ash application to a Picea abies forest on a drained organic soil. Manuscript.
V. Björk RG, Ernfors M, Sikström U, Nilsson M, Andersson MX, Rutting T,
Klemedtsson L. Microbial community structure, biomass and processes, in drained forested organic soils with different nutrient status: short and long-terms effects of wood ash application. Manuscript.
* This paper is reprinted by kind permission of the publisher.

8
9
Table of contents Introduction …………………………………………………………………11
Material and methods……………………………………………….………13
Sites 13
Field methods 15
Soil sampling and laboratory methods 15
Results and discussion………………………………………………..……...18
Up-scaling of N2O fluxes 18
Magnitudes of measured fluxes, in relation to
nutrient status and other site factors 18
N2O 19
CH4 19
CO2 20
Effects of wood ash fertilization on measured fluxes 22
Drained bogs 22
Drained fen 23
Microbial processes, community structure and biomass 24
Main results…………………….…………………………………………….25
Acknowledgements………………………………………..…………………26
References……………………………………………………….…………....27

10
11
Introduction The global climate is changing and it is very likely that the change is due to anthropogenic emissions of radiatively active gases, the so-called greenhouse gases, to the atmosphere (IPCC, 2007). Three of the most important greenhouse gases – carbon dioxide (CO2), methane (CH4) and nitrous oxide (N2O) – are constantly exchanged between the biosphere and the atmosphere, and any mitigation of further climate change requires an understanding of these fluxes. This thesis focuses on well drained forested peatlands and their uptake and release of CO2, CH4 and N2O. Peatlands contain approximately one third of all the carbon stored in soils (Gorham, 1991) and their carbon balance, including CO2 and CH4 fluxes, is therefore of great importance. Draining peatlands for forestry changes their carbon balance by allowing air to enter the previously waterlogged soil. Aeration increases the production of CO2 as a result of an increased decomposition rate, but also promotes forest growth and thus increases the uptake of CO2 from the atmosphere. Emissions of CH4, which can be large in undrained peatlands (Nilsson et al., 2001; Saarnio et al., 2007), decrease after drainage, since the water-level drawdown limits CH4 production and favours CH4 oxidation (Sundh et al., 1994, 1995). In peatlands that are rich in nitrogen (N), large emissions of N2O can also occur after drainage, when the increased aeration allows nitrification to take place (Regina et al., 1996; von Arnold et al., 2005b). N2O can be produced by nitrification or denitrification, but denitrification relies on the nitrate produced during nitrification (Firestone and Davidson, 1989). In Sweden, Russia and Finland, the countries in which the drainage of peatlands for forestry has been most common, drained and forested peatlands currently cover 1.5, 4.0 and 4.9 Mha, respectively (Minkkinen et al., 2008). At present, the greenhouse gas dynamics of these ecosystems are only partly understood. To create a basis for political decisions, the greenhouse gas budgets of both unmanaged and managed ecosystems need to be calculated at a national level. In addition, the national greenhouse gas budgets for different types of land use are reported to the United Nations and the European Union, to allow international monitoring and control of emissions, within e.g. the Climate Convention and the Kyoto Protocol. National estimates of greenhouse gas fluxes are produced by relating estimated fluxes for sites to other properties that can be more easily determined over large areas. Using these other site factors, the greenhouse gas fluxes can be scaled up to larger regions or a whole country (IPCC, 2006). For the N2O fluxes from drained organic forest soils, a possible method for up-scaling was already apparent when the work underlying this thesis was initiated. Annual N2O fluxes from drained organic forest soils had been linked to the C:N ratio in the upper part of the soil profile in a study by Klemedtsson et al. (2005),
12
and data on C:N ratios were available in the Swedish National Forest Soil Inventory (RIS, 2009). Thus, a national up-scaling was carried out, based on these data, including an attempt to construct a confidence interval around the N2O flux estimates (I). It was concluded that, although this procedure probably produced a more reliable result than earlier attempts, more measurements needed to be included in order to narrow the confidence interval. For the CH4 and CO2 fluxes from drained organic forest soils, relationships to different site factors needed further investigation, in order to find possible ways to scale up these fluxes in the future. In earlier studies in Sweden (von Arnold et al. 2005b,c), greenhouse gas fluxes had been measured at poorly drained sites and the major remaining gaps in knowledge, therefore, involved the well drained sites. Thus, the studies presented herein were focused mainly on well drained organic forest soils. Two nutrient poor sites (former bogs) (III) and one nutrient rich site (former fen) (II, IV) were chosen for the measurements. It appears that considerable areas of the Swedish drained organic soils that are now afforested were used for agriculture during the late 1800s and early 1900s, so a soil of this type was chosen to represent the nutrient rich category. The greenhouse gas fluxes from intensively farmed and subsequently afforested organic soils had not previously been studied in Sweden. In production forestry, the management can be adapted so that it minimizes emissions and maximizes uptake of greenhouse gases. One management measure that has attracted increasing interest in recent years is the addition of wood ash from the combustion of biofuels. The effects on greenhouse gas fluxes of wood ash fertilization of drained organic forest soils are largely unknown; therefore these were investigated in one study on a nutrient poor site (III) and one study on a nutrient rich site (IV). The general aims of the work presented in this thesis were to improve the understanding and quantification of greenhouse gas fluxes associated with Swedish drained organic forest soils and to identify possible mitigation options for these fluxes.
13
Material and methods Below is a short description of the sites studied and the methods employed in the research underlying this thesis. For further details, see the respective articles. Sites
Anderstorp (57°15’N, 13°35’E, 150 m a.s.l.) (III, V) The Anderstorp site is a former bog; it was drained in the late 1980s and has a naturally regenerated cover of Scots pine (Pinus sylvestris L.). In September 2003, the mean height and biomass of the tree stand were 12 m and 82 tonnes dry weight (d.w.) ha-1, respectively. The field layer was dominated by Vaccinium vitis-idea L., Vaccinium myrtillus L. and Eriophorum vaginatum L. and the bottom layer was mostly forest mosses (Pleurozium schreberi Willd., Dicranum polysetum Sw. and
Aulacomnium palustre (Hedw.) Schwaegr., but also some Sphagnum spp.). The peat layer was > 1 m deep and the degree of humification varied between H3 and H8 (von Post and Granlund, 1926) in the 0-0.05 and 0.05-0.20 m layers and between H4 and H8 in the 0.20-0.30 m layer. The site was well drained, with an average groundwater level of 0.36-0.56 m. The effects of wood ash fertilization on the greenhouse gas fluxes of the site were investigated using a randomized block design, with four blocks. There were two wood ash treatments, 3.3 tonnes d.w. ha-1 and 6.6 tonnes d.w. ha-1, and one untreated control. Bredaryd (57°11’N, 13°44’E and 155 m a.s.l.) (III) The Bredaryd site consists of two mires, about 400 m apart, each in a different watershed. These mires, referred to as “Bredaryd North” and “Bredaryd South”, were both bogs that were drained in the late 1980s. Before the start of the measurements, Bredaryd North and Bredaryd South were similar with regard to: 1) peat type (Sphagnum-dominated peat formed in an ombrotrophic environment) and 2) tree cover (Scots pine dominated forest, mean tree height 15 m, stand biomass 94 (SE 4.2) tonnes d.w. ha-1 at Bredaryd North and 99 (SE 11.5) tonnes d.w. ha-1 at Bredaryd South). The field layer was dominated by Eriophorum vaginatum L. and different proportions of Vaccinium vitis-idea L., Vaccinium myrtillus L. and Vaccinium uliginosum L. The bottom layer consisted mostly of Pleurozium
schreberi Willd. and Dicranum spp. The peat layer was > 1 m deep. The Bredaryd site had an average groundwater level of 0.15-0.31 m. In order to study the effects of ash on greenhouse gas fluxes, reference measurements were first made over a period of one year, on both mires. Subsequently, Bredaryd North was treated with 3.1 tonnes d.w. ha-1 of wood ash, while the southern mire was left untreated and served as a control.
14
Skogaryd (58°23’N, 12°09’E; 60 m.a.s.l.) North-East Peat site (SkNE-P) (II) This sub-site of the Skogaryd site is part of a well drained former fen that was formed in a valley. The site was drained in the 1870s and used for agriculture until 1951, when it was planted with Norway spruce (Picea abies (L.) H. Karst.). The tree stand has now reached a height of 22 m (measured in 2006) and has a stem volume of approximately 400 m3 ha-1. The ground vegetation is sparse or absent in the denser parts of the tree stand and dominated by bryophytes in the more open parts. Viola riviniana Rchb., Luzula pilosa (L.) Willd. and Juncus conglomeratus
L. are common in the field layer, while the bottom layer consists mainly of Mnium
affine Bland. ex Funck., Mnium hornum Hedw., Polytricum formosum Hedw., Pleurozium schreberi Willd. and Hylocomium splendens (Hedw.) Shimp. The peat is between one and several metres deep. The SkNE-P had an average groundwater level of 0.43 m (Table 2). Gas flux measurements were carried out in six plots arranged in a circle (Ø ≈ 25 m), around a micrometeorological tower. South-West Peat site (SkSW-P) (IV, V) This second sub-site of the Skogaryd site is part of the same drained mire as SkNE-P, although located at the other side of the main ditch, and has the same management history. The tree stand, which is dominated by spruce, had a mean height of 20.4 ± 0.7 m and a stem volume of 400 ± 14 (m3 ha-1), when measured in 2006. The field layer is dominated by Vaccinium myrtillus L., Luzula pilosa (L.) Willd. and Oxalis acetosella L. with small amounts of Deschampsia flexuosa (L.) Trin., Dryopteris carthusiana (Vill.) H. P. Fuchs and Mycelis muralis (L.) Dumort.. The bottom layer consists mainly of Pleurozium schreberi Willd., Dicranum majus Sw., Hylocomium splendens (Hedw) Br.Eur., Plagiomnium affine (Funck) T.Kop., Polytrichum formosum Hedw. and Sciuro-hypnum oedipodium (Mitt.) Ignatov & Huttunen. The peat was between one and several metres deep. The site had an average groundwater level of 0.71-0.73 m. The experimental design was the same as for the Anderstorp site, except that there were only three blocks. Perstorp (56°12'N, 13°17'E) (V) The Perstorp site is a former bog; it was drained in 1981. When the experiment was established in 1982, the tree layer was dominated by 1.3 m tall Scots Pine (Pinus
sylvestris L.) trees, mixed with some Downy Birch (Betula pubescens Ehrh.) of similar height. During the experimental period, 1982-2007, the growth increment was almost negligible in the control plots (approx. 0.04 m3 of stemwood ha-1 yr-1). During the same period, the increment was 1.6 m3 ha-1 yr-1 in the plots treated with wood ash (see below), which resulted in a six-fold higher standing stem volume in the ash plots (48 m3 ha-1) than in the control plots (7.4 m3 ha-1) in 2007 (Sikström et al. submitted). The field layer was dominated by Calluna vulgaris (L.) Hull, Erica tetralix L. and Eriophorum vaginatum L., the bottom layer was dominated by Sphagnum capillifolium (Ehrh.) Hedw. and S. magellanicum Brid. but Hypnum
cupressiforme Hedw., Pleurozium schreberi Willd., and Mylia anomala (Hook.) S.
15
Grey. were also important elements. No groundwater level measurements were taken at the site, but, based on the water levels in the ditches, it could be classified as poorly drained. Greenhouse gases were not measured at Perstorp, but soil samples were collected for the study of microbial reactions to ash addition. Field methods
Manual chamber measurements (II, III, IV) Manual chambers were used for all gas measurements except those of CO2 at SkNE-P. The chambers were constructed from stainless steel and consisted of a collar and a lid. The collar, which was inserted into the soil, had a 0.07 m flange around the bottom to minimize the risk of leaks and increase the diffusion path between the chamber and the ambient air. The flange was, as far as possible, installed just below the litter layer, to avoid cutting the roots and mycorrhizae. During measurements, when the lid was placed onto the collar, the chamber measured 0.44 × 0.44 on the inside and the height was approximately 0.15 m, depending on the soil microtopography. An airtight interface between the collar and the lid was ensured by using a rubber gasket or a water-filled groove. Gas samples were collected from the chamber through a butyl rubber membrane 4, 8, 16 and 32 minutes after closure. The samples, which were collected in 22 ml glass vials, were taken to the laboratory for analysis on a Varian 3800 gas chromatograph, as described by Klemedtsson et al. (1997). Automatic chamber measurements (II) The CO2 soil fluxes at SkNE-P were measured automatically in six chambers. The chamber height was 1.25 m and the chamber volume during measurement was approximately 0.24 m3. The same collars were used as for the manual measurements. A measurement cycle was run every 20 minutes for two chambers at a time. Samples of the chamber air were taken every 30 seconds for the first 15 minutes after chamber closure, and CO2 concentrations were determined by an infrared gas analyser (PP Systems SBA-4 OEM CO2 Analyzer). The CO2 concentration values, the time points for the measurements and the air temperature inside the chamber were stored in a data logger (Campbell Scientific Ltd, model CR10, Leicestershire) and used to calculate the CO2 flux from the soil.
Soil sampling and laboratory methods (V) Soil samples were collected from the Skogaryd, Anderstorp and Perstorp sites and analysed in the laboratory. The aim was to investigate whether the microbial community structure, microbial biomass, microbial processes and abiotic properties had changed after ash fertilization, in ways that could affect the fluxes of greenhouse gases from the soil. The soil properties examined were: pH, total C and N content, content of PLFAs (PhosphoLipid Fatty Acids), NEA (Nitrification Enzyme Activity), DEA (Denitrification Enzyme Activity), SIR (Substrate Induced
16
Respiration), basal respiration, lag time (in the soil respiration measurements), exponential growth (in the soil respiration measurements), microbially available N, microbially available P, net N-mineralization, net nitrification, potential CH4 production, potential CH4 oxidation, elemental content, plant-available P (P-AL), plant-available K (K-AL), bulk density and organic matter content. The control and low ash dose (2.5-3.3 tonnes d.w. of wood ash ha-1) plots at each site were sampled, at depths of 0-0.05 m and 0.20-0.30 m. The samples were collected 1, 4 and 25 years after the ash was applied, at Skogaryd, Anderstorp and Perstorp, respectively. Some of the methods for the soil analyses are explained briefly below. For the remaining methods and further detail, see the original papers.
Microbial respiration Substrate Induced Respiration (SIR) is determined by measuring how the CO2 production from aerobically incubated soil samples changes over time after substrate additions; this allows soil microbial biomass to be determined physiologically (Stenström et al. 1998). SIR represents the sum of the respiration rates of growing and non-growing microorganisms. The incubations carried out in (V), according to Nordgren (1988; 1992), allowed SIR, lag time (before exponential growth starts), exponential growth rate and basal respiration to be determined. PLFA analysis
PLFAs (PhosphoLipid Fatty Acids) are components of the cell membranes of microorganisms and the amount of PLFA extracted from a soil sample can be used to estimate the amount of microbial biomass present. Many PLFAs are specific to certain microbial groups and subgroups, e.g. bacteria, fungi, gram positive bacteria, gram negative bacteria and actinobacteria, and can be used as indicators of the relative abundance of these groups. The method described by Frostegård et al. (1993) was followed, with minor modifications.
Net N-mineralization
Net N mineralization, partitioned into net ammonification and net nitrification, was measured by analysing the KCl-extractable ammonium and nitrate contents for one set of unincubated samples and for one set of samples incubated at room temperature for 28 days. The water content was adjusted to 60 % of the water holding capacity before incubation. The method described by Robertson et al. (1999) was followed, with minor modifications. NEA
NEA (Nitrification Enzyme Activity) is used to determine the nitrification potential of the soil. Soil samples were mixed with a nutrient solution and incubated for 24 hours in darkness, at room temperature, whilst being constantly shaken. The slurry was sampled six times during the incubation, to monitor the increase in nitrate concentration. The nitrate in the samples was converted to N2O, through a bacterial process and measured by gas chromatography. The method described by Lensi et
17
al. (1985,1986) was used, with modifications according to Bäckman and Kasimir Klemedtsson (2003). DEA
DEA (Denitrification Enzyme Activity) is used to determine the denitrification potential of the soil. Soil samples were mixed with a nutrient solution and incubated anaerobically for 70 minutes in bottles filled with N2 + acetylene (10%). The incubation was carried out at + 20 oC, while being shaken. Acetylene inhibits the reduction of N2O to N2, which means that N2O will be the only end-product of denitrification. The headspace air was sampled four times during the incubation and the samples were analysed for N2O on a gas chromatograph, to monitor changes in the N2O concentration. (Klemedtsson et al., 1977; Smith and Tiedje, 1979). CH4 oxidation
The potential of the soil to oxidize CH4 was assessed by incubating slurries made from soil samples, in bottles filled with air and an initial concentration of ~500 ppm CH4. The samples were incubated at room temperature, in darkness, for 15 hours, while being shaken. The bottles were sampled every third hour and the CH4 oxidation was calculated from the decrease in CH4 concentration in the bottle. The method was described by Sundh et al. (1994) and Moore and Dalva (1997). CH4 production
To assess the CH4 production of the soil, slurries made from soil samples were incubated anaerobically in bottles filled with N2. The samples were incubated at room temperature, in darkness, for five days. The bottles were sampled once a day and the CH4 production was calculated based on the increase in CH4 concentration in the bottle. The assay was performed according to Bergman et al. (1998).
18
Results and discussion Up-scaling of N2O fluxes (I) A national up-scaling of N2O emissions from drained organic forest soils was performed, based on the findings of Klemedtsson et al (2005) and the Swedish National Forest Soil Inventory (which is part of the Swedish National Inventory of Forests) (RIS, 2009) (I). Klemedtsson et al. (2005) presented an exponential function describing the relationship between mean annual N2O emissions and soil C:N ratios for drained organic forest soils. Most of the annual N2O emission values included were averages of measurements collected over 2-3 years. The function used for scaling up was based on the same data, but was slightly modified in order to be able to calculate a confidence band around it and thus an uncertainty range for the national N2O emission estimate. The resulting function was:
45.3/3.30) - (lnX 0.081.58 lnX 3.26-8.69 Yln 2+±=
Where Y = N2O emission, and X = C:N ratio in the upper part of the soil profile. The N2O emission calculated for the Swedish drained organic forest soils was 4 700 tonnes N2O a-1 (uncertainty range 2 610-8 600 tonnes N2O a-1); of this, it was estimated that 88 % is emitted from soils with a C:N ratio lower than 25. The value is higher than previous estimates for the same type of soil (von Arnold et al., 2005a), and presumably more accurate, since the high N2O emissions from very nutrient rich soils were taken into account. For example, a substantial part of the emissions seemed to originate from former agricultural soils. The estimated emissions of 4700 tonnes N2O a-1 correspond to 1.50 Mtonnes CO2-equivalents a-1, which equals 3 % of the total anthropogenic greenhouse gas emissions in Sweden, including land use, land use change and forestry (Swedish Environmental Protection Agency, 2009). Magnitudes of measured fluxes, in relation to nutrient status and other site
factors (II, III, IV)
Of the three sites studied, Nennesmo and Bredaryd were nutrient poor (former bogs) (III), while Skogaryd was nutrient rich (a former fen) (II, IV). Factors such as degree of decomposition, ground vegetation and tree stand properties differed between the two nutrient status categories and differences in gas fluxes should not be interpreted as being solely dependent on the nutrient content of the peat, but rather on the site characteristics as a whole.
19
N2O
At the nutrient poor sites the N2O fluxes were practically zero, while there were relatively large emissions at the nutrient rich site (Table 1). The production of N2O is dependent on the availability of mineralized N (Firestone and Davidson, 1989), which could explain a large part of this difference. The magnitudes of the fluxes were in accordance with the model used for up-scaling by Ernfors et al. (2007) (I). The data presented here, therefore, support the validity of this model. N2O emissions at the nutrient rich Skogaryd site seemed to be restricted by drought in the summer months. The moisture measurements at the SkNE-P subsite showed that the soil in one of the plots retained more moisture than the other plots during dry periods and this plot also had an exceptionally high and long-lasting N2O emission peak from June to September. Previous studies on well drained sites (Mäkiranta et al. 2007; Weslien et al. 2009) have recorded higher N2O fluxes than those at Skogaryd, despite having lower or similar mean groundwater tables (0.53 m and ~ 0.40-0.50 m), but they also had low C:N ratios (13 and 13-28.2, respectively). This suggests that the soil C:N ratio is the main factor determining the N2O emissions from drained organic forest soils, but that groundwater level is a secondary regulating factor. Thus, as more data on the N2O fluxes of drained organic forest soils become available, incorporating groundwater levels into the model presented by Ernfors et al. (2007) would probably improve its predictive ability. CH4
The CH4 emissions at Anderstorp and Bredaryd (III), and the SkSW-P (IV) and SkNE-P (II) subsites of Skogaryd, were 1.9–8.9, 8.2–8.8, -4.3–(-4.6) and -4.4 kg ha-1 a-1, respectively (Table 1). In summary, there was uptake of CH4 at the nutrient rich sites and emission at the nutrient poor sites, a pattern that has also been recorded in previous studies (Nykänen et al., 1998). CH4 emissions from ditches at drained peatland sites can be significant (Minkkinen and Laine, 2006) and to produce a comprehensive estimate of the CH4 fluxes from a drained peatland, these fluxes should be taken into account. In the studies included in the present thesis, gas fluxes were not measured in the ditches and the inclusion of ditch CH4 fluxes may have shifted the estimates towards higher emissions. Minkkinen et al. (2007) showed that the stand volume of drained and forested peatlands in Finland could be used to predict CH4 fluxes from the soil. The existence of this relationship was attributed to the influence that a growing tree stand has on the depth of the groundwater table and the species composition of the ground vegetation, which in turn affect the microbial production and consumption of CH4 (Minkkinen et al., 2007). The function presented by Minkkinen et al. (2007) covers stand volumes up to about 300 m3 ha-1, but extrapolating it to the stand volume recorded at the SkSW-P and SkNE-P sites (both ~ 400 m3 ha-1) resulted in a good agreement (model -5.9 kg CH4 ha-1 a-1; measurements -4.4 kg CH4 ha-1 a-1 and -4.5, respectively). The prediction for Anderstorp was also reasonable (prediction: 2.42 kg CH4 ha-1 a-1; measurements: 1.9-8.9 kg CH4 ha-1 a-1), while the prediction for Bredaryd was poorer (prediction: 0.35 kg CH4 ha-1 a-1; measurements: 8.2-8.8 kg
20
CH4 ha-1 a-1). Generally, the agreement between modelled and measured values was good and the model thus seems also to be valid for Swedish conditions. Although up-scaling functions of this type are coarse, they can be very useful for obtaining reasonable estimates of gas fluxes for nations or regions. Most of the procedures currently available for use in national up-scalings are relatively simple (IPCC, 2006). CO2
The CO2 emissions at the Anderstorp and Bredaryd sites (III) and the SkSW-P (IV) and SkNE-P (II) subsites were 7–12 000, 11–15 000, 17–18 000 and 71 000 kg ha-1 a-1, respectively (Table 1). Since SkSW-P and SkNE-P are two parts of the same mire, the difference between them is remarkable. It seems likely that this discrepancy was due to the use of different types of chambers for recording emissions. Closed chambers have shown to underestimate gas fluxes from the soil in simulations (Healy et al., 1996; Conen and Smith, 2000) as well as in experiments (Nay et al., 1994; Rayment, 2000; Pumpanen et al., 2004). Underestimates occur because of a disturbance of the diffusion gradient between the soil and the chamber headspace (Hutchinson and Mosier, 1981; Healy et al., 1996). The main suggestion is that the gradient between the soil and the chamber continuously decreases after chamber closure, as the headspace gas concentration increases. With a decreased gradient, the flux entering the chamber decreases and the headspace gas concentration converges towards a saturation value. Underestimation would then arise when a linear regression is fitted to a non-linear process (Kutzbach et al., 2007). The solution to this problem has been to try to achieve a linear increase, e.g. by taking measurements only over a short time, or to develop non-linear models, where the slope at the intercept with the y-axis can be used to calculate the gas flux before chamber closure (Livingston et al., 2005,2006; Kutzbach et al., 2007). However, Conen and Smith (2000) showed, through mathematical simulations and laboratory measurements, that the diffusion gradient can be disturbed and the soil fluxes can be severely underestimated despite a virtually linear increase in headspace gas concentration. Their simulations showed that the concentration of the measured gas increased in the whole soil profile, although the changes below the source decreased with increasing depth. The increase started immediately after chamber closure. The linear increase in the chamber gas concentration was interpreted as an effect of the gas concentration in the air-filled pore space of the soil increasing simultaneously with the concentration in the head space (Conen and Smith, 2000). The increase in the soil gas concentration was confirmed in a laboratory experiment. This model of the disturbance of the diffusion gradient implies that underestimation of the gas flux increases as the air-filled porosity of the soil increases, as demonstrated by Rayment (2000). However, underestimation also decreases with the height of the chamber, since with a high chamber the air-filled porosity of the soil will account for relatively less of the total volume in which the gas concentration increases (Rayment, 2000; Conen and Smith, 2000).
21
Peat soils are highly porous and the air-filled porosity depends greatly on the water content of the soil. Closed chamber gas flux measurements on well drained peat soils are, therefore, likely to be susceptible to error due to “storage” of gas in the soil pore space. Such underestimates would be especially large when groundwater levels were low, i.e. in summer. Thus, for the study at SkNE-P, where the aim was to determine the soil flux, 1.25 m high chambers were used (II). The height of these chambers ought to have substantially improved the measurements and the measured flux values from these chambers were assumed to be close to the true fluxes. Manual measurements using chambers with a more conventional height of 0.15 m (II, III, IV), probably underestimated the fluxes of CO2 and the results should not be used for up-scaling. The errors associated with the use of closed chambers appear to be proportional to the flux (Widén and Lindroth, 2003) and the N2O and CH4 flux values, which were several orders of magnitude smaller than the CO2 fluxes, were therefore likely to be much more reliable than the CO2 flux values. In addition, when comparing different treatments in the ash fertilization experiments (III, IV), the effects of underestimates on the results would have been minor, since the same chambers were used in all plots. Chamber measurements will always be subject to errors to some extent, since they interfere with the diffusion flux that they measure, and micrometeorological techniques are therefore more reliable for the measurements of net fluxes. However, for treatment experiments such as the ones conducted in the studies presented here, or in studies which involve partitioning of the sources of soil respiration, chamber techniques are more suitable. At SkNE-P, the chamber technique was chosen since the measurements were part of a partitioning experiment, with trenching performed in August 2007 and measurements still ongoing (II). The chambers were also placed in the footprint area of a micrometeorological tower and the chamber measurements will subsequently be compared with the micrometeorological measurements. The CO2 fluxes measured at SkNE-P (II) were large in relation to most other studies in the literature, in which similar soils were examined. The difference could be due to the use of low closed chambers in most of the other studies, as well as to the fact that the tree stand volume was larger at Skogaryd than at any of the other study sites; this could mean that the autotrophic respiration was higher. Silvola et al. (1996b) showed that the root contribution to soil respiration correlated well with tree stand volume in an experiment including ten Finnish peatland sites. The trenching experiment, which is presently underway at the SkNE-P site, will eventually reveal the relative proportions of autotrophic and heterotrophic respiration at this site. Considering the three sites, SkSW-P, Anderstorp and Bredaryd, where CO2 emissions were measured manually using low chambers, the CO2 emissions were higher at the nutrient rich site (SkSW-P). This is consistent with results from Finland, where increases in heterotrophic respiration with nutrient status have been found for drained forested peatlands (Silvola et al. 1996b; Minkkinen et al., 2007). The SkSW-P site also had a larger stand volume than
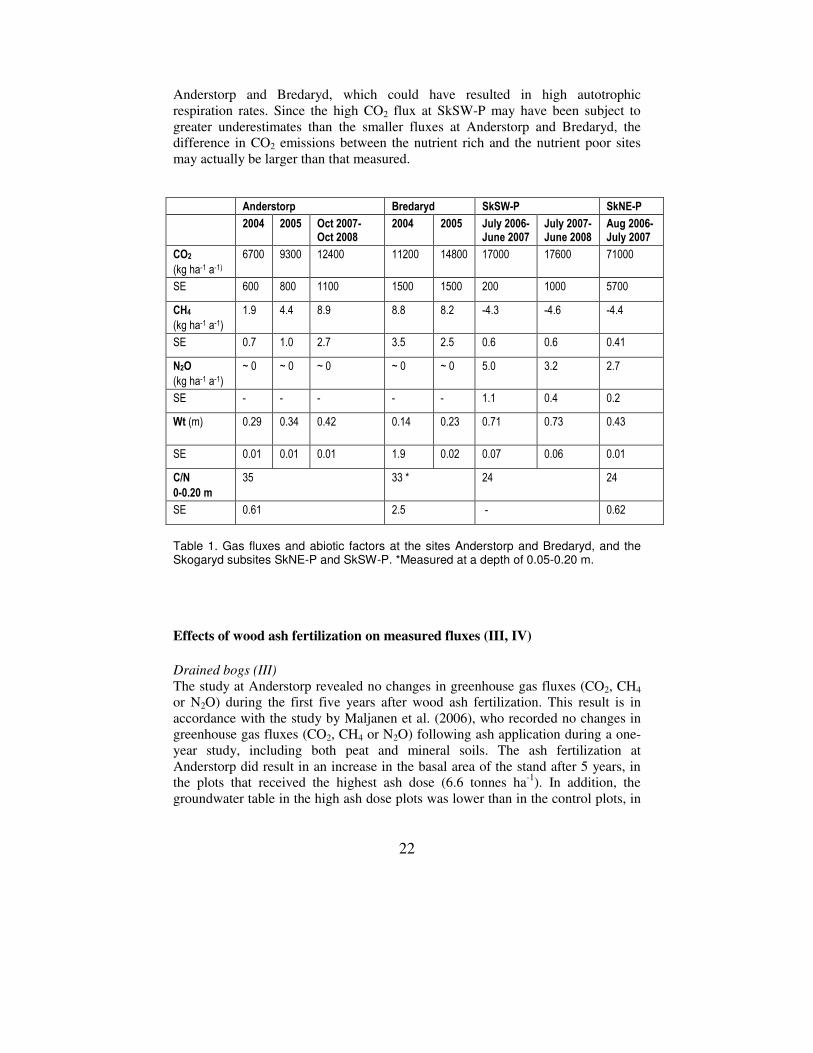
22
Anderstorp and Bredaryd, which could have resulted in high autotrophic respiration rates. Since the high CO2 flux at SkSW-P may have been subject to greater underestimates than the smaller fluxes at Anderstorp and Bredaryd, the difference in CO2 emissions between the nutrient rich and the nutrient poor sites may actually be larger than that measured. Anderstorp Bredaryd SkSW-P SkNE-P
2004 2005 Oct 2007- Oct 2008
2004 2005 July 2006-June 2007
July 2007-June 2008
Aug 2006-July 2007
CO2
(kg ha-1 a-1)
6700 9300 12400 11200 14800 17000 17600 71000
SE 600 800 1100 1500 1500 200 1000 5700
CH4
(kg ha-1 a-1)
1.9 4.4 8.9 8.8 8.2 -4.3 -4.6 -4.4
SE 0.7 1.0 2.7 3.5 2.5 0.6 0.6 0.41
N2O
(kg ha-1 a-1)
~ 0 ~ 0 ~ 0 ~ 0 ~ 0 5.0 3.2 2.7
SE - - - - - 1.1 0.4 0.2
Wt (m)
0.29 0.34 0.42 0.14 0.23 0.71 0.73 0.43
SE 0.01 0.01 0.01 1.9 0.02 0.07 0.06 0.01
C/N
0-0.20 m
35 33 * 24 24
SE 0.61 2.5 - 0.62
Table 1. Gas fluxes and abiotic factors at the sites Anderstorp and Bredaryd, and the Skogaryd subsites SkNE-P and SkSW-P. *Measured at a depth of 0.05-0.20 m.
Effects of wood ash fertilization on measured fluxes (III, IV)
Drained bogs (III)
The study at Anderstorp revealed no changes in greenhouse gas fluxes (CO2, CH4 or N2O) during the first five years after wood ash fertilization. This result is in accordance with the study by Maljanen et al. (2006), who recorded no changes in greenhouse gas fluxes (CO2, CH4 or N2O) following ash application during a one-year study, including both peat and mineral soils. The ash fertilization at Anderstorp did result in an increase in the basal area of the stand after 5 years, in the plots that received the highest ash dose (6.6 tonnes ha-1). In addition, the groundwater table in the high ash dose plots was lower than in the control plots, in
23
the last year that measurements were taken. The lower groundwater table after ash fertilization indicates that the ash promoted tree growth, resulting in increased water uptake by the trees. Since CH4 emissions generally decrease with a lower groundwater table (Sundh et al., 1994, 1995), increased tree growth due to wood ash fertilization is likely to decrease CH4 emissions, in accordance with the hypothesis presented by Minkkinen et al. (2007). Increased tree growth at Anderstorp, combined with an absence of changes in greenhouse gas fluxes suggest that ash fertilization has a net positive effect on the greenhouse gas balance of nutrient poor drained forested peatlands. However, measurements over a whole stand rotation are necessary to determine whether this is the case in the long-term. Drained fen (IV)
At the SkSW-P site (IV), decreases in CO2 and N2O emissions were found in the fertilized plots during the first two years following ash addition. The mechanism behind the decrease in CO2 emissions could not be conclusively determined, but the most likely possibility was that this was the result of a decrease in moisture in the upper soil layer, due to an increased water uptake by the tree stand. The increase in the depth of the groundwater table seen in (III) showed that a tree stand can respond to wood ash fertilization at an early stage and rapidly increase water uptake. Since the groundwater table at the SkSW-P site was close to the optimum level for total soil respiration (Mäkiranta et al., 2009), further drying could decrease the respiration rates. The annual N2O emissions were reduced by ash fertilization, but no decreases were found during the summer periods, presumably because the soil surface was drier and the N2O production took place deeper down in the soil profile, in layers that had not been affected by the ash. In winter, when the water tables were generally higher, the N2O production was likely to take place closer to the soil surface, where it could be affected by the ash addition and the increased pH. During cold periods, denitrification is the dominant process with respect to N2O production (Öqvist et al. 2007). Total denitrification increases with increased pH, but so does the N2/N2O production ratio (Simek and Cooper, 2002). An increase in pH can, therefore, lead to a decrease in the N2O fluxes from the soil. This has been demonstrated by Weslien et al. (2009), for a well drained and nutrient rich forested peatland. If the decrease in N2O emissions after wood ash fertilization lasts beyond the first few years after application, ash fertilization could be used as a means to mitigate these emissions from nutrient rich organic forest soils. However, long-term studies are needed to determine whether this is a possibility. There were no changes in the annual fluxes of CH4 in the low ash dose plots, although an increase was seen during the second winter. In the high ash dose plots, the CH4 uptake was lower than in the control and low ash dose plots, but this was unlikely to be an effect of the treatment, since the difference was already apparent when measurements were carried out before ash application. In summary, no effect of the ash on CH4 fluxes could be established.
24
Microbial processes, community structure and biomass (V)
The main effects of the ash on the soil were seen at a depth of 0-0.05 m at Anderstorp and 0.20-0.30 m at Perstorp. The vertical distribution of the effects thus mirrors the time elapsed since ash application. In the 0-0.05 m layer at the Anderstorp site, the fungal biomass (estimated by PLFA analysis) was significantly lower and the biomasses of gram-negative bacteria (p = 0.08) and actinobacteria (p = 0.10) tended to be lower in the ash treated plots. The net N-mineralization (mainly net ammonification) was also significantly lower in the ash treated plots. There were no effects on the PLFA or net N-mineralization in the 0.20-0.30 m layer at Anderstorp. At the Perstorp site, in contrast, there were no effects on the PLFA or net N-mineralization in the 0-0.05 m layer, but in the 0.20-0.30 m layer the total microbial biomass, biomass of gram-positive bacteria and biomass of actinobacteria (all estimated by PLFA analysis) and the net N-mineralization (mainly net ammonification) were significantly lower in the ash treated plots. There were no effects of ash application on microbial biomass or net N-mineralization at any depth at Skogaryd. Despite changes in the biomass of some microbial groups, there was no significant effect of ash on the microbial population structure measured with PFLA, as indicated by Principal Component Analysis (PCA); in addition, the microbial respiration experiment indicated no ash application effects, except a tendency towards an increase in SIR in the 0-0.05 m layer of the ash treatment at Perstorp. In the PCA of the elemental content, there were significant differences along Principal Component 1 (PC1), at all depths at Perstorp, but only in the 0-0.05 m layer at Anderstorp. There were no significant differences along PC1 at Skogaryd or along PC2 at any of the sites. Changes in pH were only detected in the 0-0.05 m layer at Skogaryd. At the Perstorp site, fertilization with wood ash resulted in a marked increase in tree growth. The tree stand was small before the start of the experiment (height 1.3 m); by the summer of 2007 the stem volume was 7.4 m3 ha-1 in the control plots and 48 m3 ha-1 in the ash treated plots. The differences in PLFA and net mineralization in the 0.20-0.30 soil layer may, therefore, be an effect of the change in vegetation rather than a direct effect of the ash. Although no changes in microbial processes, community structure or biomass were detected at Skogaryd, the higher pH indicates that the ash did affect the soil in the 0-0.05 m layer. This is in accordance with the significantly lower N2O emissions measured from the ash treated plots at Skogaryd in winter. Potential CH4 production and oxidation did not differ between treatments at any of the sites, which corroborates the results of the gas flux measurements, demonstrating that CH4 fluxes from the soil were not affected by ash fertilization. There were no differences between controls and ash fertilized plots with respect to C:N ratio, NEA, DEA, net nitrification, bulk density or organic matter content. In conclusion, there were no major effects on soil microbial processes, community structure or biomass as a result of the addition of wood ash.
25
Main results
• The regression model presented by Klemedtsson et al. (2005), which related the C:N ratio of the soil to annual N2O emissions, was modified for the purpose of constructing a confidence band around it. Using the modified model, and a national forest soil database (the Swedish National Forest Soil Inventory), the N2O emissions for Swedish drained organic forest soil were estimated to amount to 4 700 tonnes a-1 (uncertainty range 2 610 to 8 600 tonnes a-1) (I).
• The measured N2O emissions (II, III, IV) agreed with the relationship
between N2O emissions and soil C:N ratio presented by Ernfors et al. (2007), which was based on the findings of Klemedtsson et al. (2005) (I).
• The N2O emissions at the nutrient rich site, Skogaryd (II), seemed to be
restricted by drought in the summer months. This suggests that although the N2O fluxes of drained forested peatlands are mainly determined by the soil C:N ratio, the groundwater level is an additional regulating factor.
• The measured CH4 fluxes (II, III, IV) agreed with a relationship between CH4 fluxes and stand volume presented by Minkkinen et al. (2007). The CH4 flux measurements presented herein could, therefore, probably be used to improve the model and to extend it to larger stand volumes. According to this model, increased forest production leads to a decrease in the emissions of CH4, implying that ash fertilization could decrease the emissions of CH4 if it results in increased forest growth.
• Wood ash fertilization decreased CO2 emissions at the nutrient rich SkSW-P site (IV). The mechanism behind the decreased CO2 emissions was not clear; further studies are needed.
• Wood ash fertilization decreased the N2O emissions at the SkSW-P site; this decrease could be attributed to the change in pH caused by the ash (IV). The longevity of the effect needs to be investigated.
26
Acknowledgements I will now take the opportunity to express my thanks to and my huge appreciation for the following people, of which some have contributed to this thesis directly and some indirectly - by keeping me happy and sane during the past 5 years as well as earlier on. In random order: The staff at IVM in general, for always being friendly and helpful. The PhD students at IVM in particular, for good party and lunch company and for being interesting and sometimes slightly odd people. Krister, Jonas and David for their reliable and hard work in the field and good company in the forest. Ulf Sikström and my second supervisor Mats N. for thorough reading of articles. Per for all help and inspiration on the technical side. Robert for good cooperation (alltså, inte på något sätt svindåligt!). Azad for company and help in the field and for taking good care of the chamber system. Mats R. for helping out and always having an opinion. Lasse for good roommateship and the Finnish karaoke. Josefine for impersonating the expression “bjuda på sig själv”. Marianne for lovely breakfasts and fun. Tina fordi at du er en dejlig pige. Catrin for always being ready for a fika. Hanna, for sharing my enthusiasm for soils. Gabbie and My för friska fläktar i gammalt gäng. Gabor for tough TP/MIG challenges. Karin H. for inside information. Bella, Annelie and Jojje - for being undescribable, for being my second family and for not taking me seriously. Sanna, for philosophy and party nights. Sara Hi, Sara Li and Lotta for much valued friendship on and off stage. Kristina, för att ingen är kärvare. Niall, for teaching me a lot of long and difficult words in English. Björn, for taking care of me during my “exjobb” crisis. Linis for being exceptional. My mother for introducing me to the joys of reading and writing (and for being such a “filur”). Martin, my brother, for enduring me practicing teaching on him throughout his childhood. My father, for introducing me to the joys of building and problem-solving. Farmor, för arvet av småländsk envetenhet. My supervisor, Leif, first and foremost for all help, but also for having a sense of humour and an enthusiasm beyond all imagination. And finally Mattias, for making me happy, always.
27
References Bergman I, Svensson BH and Nilsson M. Regulation of methane production in a Swedish acid mire by pH, temperature and substrate. Soil Biology and Biochemistry 1998; 30: 729-741. Bäckman JSK and Kasimir Klemedtsson Å. Increased nitrification in acid coniferous forest soil due to high nitrogen deposition and liming. Scandinavian.Journal of Forest Research 2003; 18: 514 – 524. Conen F and Smith KA. An explanation of linear increases in gas concentration under closed chambers used to measure gas exchange between soil and the atmosphere. European Journal of Soil Science 2000; 51, 111-117. Ernfors M, von Arnold K, Stendahl J, Olsson M, Klemedtsson L. C:N ratio based estimates of nitrous oxide emissions from Swedish drained organic forest soils. Biogeochemistry 2007; 84:219-231. Firestone MK and Davidson EA. Microbiological basis of NO and N2O production and consumption in soil. In: Exchange of Trace Gases between Terrestrial Ecosystems and the Atmosphere (eds M.O. Andreae & D.S. Schimel), pp. 7-21. John Wiley & Sons, Chichester, 1989. Frostegård Å, Bååth E, Tunlid A. Shifts in the structure of soil microbial communities in limed forests as revealed by phospholipid fatty acid analysis. Soil Biology and Biochemistry 1993; 25, 723–730. Gorham E. Northern peatlands: role in the carbon cycle and probable responses to climatic warming. Ecol Appl 1991; 1: 182-195. Healy RW, Striegl RG, Russell TF, Hutchinson GL, Livingston GP. Numerical evaluation of static-chamber measurements of soil-atmosphere gas exchange: Identification of physical processes. Soil Science Society of America Journal 1996; 60, 740-847. Hutchinson GL, Mosier AR. Improved soil cover method for field measurement of nitrous oxide fluxes. Soil Science Society of America Journal 1981; 45, 311-316. IPCC. IPCC Guidelines for National Greenhouse Gas Inventories, Prepared by the National Greenhouse Gas Inventories Programme, Eggleston H.S., Buendia L., Miwa K., Ngara T. and Tanabe K. (eds). Published: IGES, Japa, 2006. IPCC. IPCC, 2007: Summary for Policymakers. In: Climate Change 2007: The Physical Science Basis. Contribution of Working
28
Group I to the Fourth Assessment Report of the Intergovernmental Panel on Climate Change [Solomon, S., D. Qin, M. Manning, Z. Chen, M. Marquis, K.B. Averyt, M.Tignor and H.L. Miller (eds.)]. Cambridge University Press, Cambridge, United Kingdom and New York, NY, USA, 2007. Klemedtsson L, Kasimir Klemedtsson Å, Moldan F, Weslien P. Nitrous oxide emission from Swedish forest soils in relation to liming and simulated increased N-deposition. Biol Fertil Soils 1997; 25: 290-295. Klemedtsson L, Svensson BH, Lindberg T, Rosswall T. The use of acetylene inhibition of nitrous oxide reductase in quantifying denitrification. Swedish Journal of Agricultural Research 1977; 7, 179-185. Klemedtsson L, von Arnold K, Weslien P, Gundersen P. Soil CN ratio as a scalar parameter to predict nitrous oxide emissions. Glob Change Biol 2005; 11: 1142-1147. Kutzbach L, Schneider J, Sachs T, Giebels M, Nykänen H, Shurpali NJ, Martikainen PJ, Alm J, Wilmking M. CO2 flux determination by closed-chamber methods can be seriously biased by inappropriate application of linear regression. Biogeosciences 2007; 4, 1005-1025. Lensi R, Gourbière F and Josserand A. Measurement of small amounts of nitrate in an acid soil by N2O production. Soil Biology and Biochemistry 1985; 17, 733–734. Lensi R, Mazurier F, Gourbière F and Josserand A. Rapid determination of the nitrification potential of an acid forest soil and assessment of its variability. Soil Biology and Biochemistry 1986; 18, 239–240. Livingston GP, Hutchinson GL, Spartalian K. Diffusion theory improves chamber-based measurements of trace gas emissions. Geophysical Research Letters 2005; 32, L24817. Livingston GP, Hutchinson GL, Spartalian K. Trace gas emission in chambers: A non-steady-state diffusion model. Soil Science Society of America Journal 2006; 70, 1459-1469. Minkkinen K, Laine J. Vegetation heterogeneity and ditches create spatial variability in methane fluxes from peatlands drained for forestry. Plant and Soil 2006; 285, 289-304.
29
Minkkinen K, Byrne KA, Trettin C. Climate impacts of peatland forestry. In Peatlands and Climate Change, ed. M. Strack, International Peat Society, Saarijärvi, Finland, 2008, pp 98-122. Minkkinen K, Laine J, Shurpali NJ, Mäkiranta P, Alm J. Penttilä P. Heterotrophic soil respiration in forestry-drained peatlands. Boreal Environment Research 2007; 12, 115-126. Maljanen M, Nykänen H, Moilanen M, Martikainen PJ. Greenhouse gas fluxes of coniferous forest floors as affected by wood ash addition. Forest Ecology and Management 2006; 237, 143-149. Moore and Dalva. Methane and carbon dioxide exchange potentials of peat soils in aerobic and anaerobic laboratory incubations. Soil Biology and Biochemistry 1997; 29, 1157-1164. Mäkiranta P, Hytönen J, Aro L, Maljanen M, Pihlatie M, Potila H, Shurpail NJ, Laine J, Lohila A, Martikainen PJ, Minkkinen K. Soil greenhouse gas emissions from afforested organic soil croplands and cutaway peatlands. Boreal Environment Research 2007; 12, 159-175. Mäkiranta P, Laiho R, Fritze H, Hytönen J, Laine J, Minkkinen K. Indirect regulation of heterotrophic peat soil respiration by water level via microbial community structure and temperature sensitivity, Soil Biology & Biochemistry 2009; 41, 695-703. Nay SM, Mattson KG, Bormann BT. Biases of chamber methods for measuring soil CO2 efflux demonstrated with a laboratory apparatus. Ecology 1994; 75, 2460-2463. Nilsson M, Mikkelä C, Sundh I, Granberg G, Svensson BH, Ranneby B. Methane emission from Swedish mires: national and regional budgets and dependence on mire vegetation. J Geophys Res 2001; 106: 20 847-20 860. Nordgren A. Apparatus for the continuous long-term monitoring of soil respiration rate in large numbers of samples. Soil Biology and Biochemistry 1988; 20, 955–958. Nordgren A. A method for determining microbially available nitrogen and phosphorus in an organic soil. Biology and Fertility of Soils 1992; 13, 195–199. Nykänen H, Alm J, Silvola J, Tolonen K, Martikainen PJ. Methane fluxes on boreal peatlands of different fertility and the effect of long-term experimental lowering of the water table on flux rates. Glob Biogeochem Cycle 1998; 12: 53-69.
30
Pumpanen J, Kolari P, Ilvesniemi H, Minkkinen K, Vesala T, Niinistö S, Lohila A, Larmola T, Morero M, Pihlatie M, Janssens I, Yuste JC, Grünzweig JM, Reth S, Subke J-A, Savage K, Kutsch W, Østreng G, Ziegler W, Anthoni P, Lindroth A, Hari P. Comparison of different chamber techniques for measuring soil CO2 efflux. Agricultural and Forest Meteorology 2004; 123, 159-176. Rayment MB. Closed chamber systems underestimate soil CO2 efflux. European Journal of Soil Science 2000; 51, 107-110. Regina K, Nykänen H, Silvola J, Martikainen PJ. Fluxes of nitrous oxide from boreal peatlands as affected by peatland type, water table level and nitrification capacity. Biogeochemistry 1996; 35, 401-418. Regina K, Nykänen H, Silvola J, & Martikainen PJ. Fluxes of nitrous oxide from boreal peatlands as affected by peatland type, water table level and nitrification capacity. Biogeochemistry 1996; 35, 401-418. RIS. Swedish National Inventory of Forests. http://www-ris.slu.se. Cited 15 April 2009a, University site. Robertsson GP, Wedin D, Groffman PM, Blair JM, Holland EA, Nadelhoffer KJ and Harris D. Soil carbon and nitrogen availability: nitrogen mineralization, nitrification and soil respiration potentials. In: Standard soil methods for long-term
ecological research. Eds. Robertson GP, Coleman DC, Bledsoe CS, Sollins P. pp.106-114. Oxford University Press, New York, 1999. Saarnio S, Morero M, Shurpali NJ, Tuittila E-S, Mäkilä M, Alm J. Annual CO2 and CH4 fluxes of pristine boreal mires as a background for the lifecycle analyses of peat energy. Boreal Environment Research 2007; 12, 101-113. Sikström U, Almqvist C and Jansson G. Growth of Pinus sylvestris after addition of ash or PK on a peatland in southern Sweden. (submitted) Silvola J, Alm J, Ahlholm U, Nykänen H, Martikainen P J. CO2 fluxes from peat in boreal mires under varying temperature and moisture conditions. Journal of Ecology 1996a; 84, 219-228. Silvola J, Alm J, Ahlholm U, Nykänen H, Martikainen PJ. The contribution of plant roots to CO2 fluxes from organic soils. Biology and Fertility of Soils 1996b; 23, 126-131. Šimek, M. & Cooper, J.E. 2002. The influence of soil pH on denitrification: progress towards the understanding of this interaction over the last 50 years. European Journal of Soil Science, 53, 345-354.
31
Smith M S and Tiedje J M. Phases of denitrification following oxygen depletion in soil. Soil Biology and Biochemistry 1979; 11, 261–267. Stenström J, Stenberg Bo, Johansson M. Kinetics of Substrate-Induced Respiration (SIR): Theory. Ambio1998; 27, 35-40. Sundh I, Nilsson M, Granberg G, Svensson BH. Depth distribution of microbial production and oxidation of methane in northern boreal peatlands. Microbial Ecology 1994; 27, 253-265. Sundh I, Mikkelä C, Nilsson M, Svensson BH. Potential aerobic methane oxidation in a Sphagnum-dominated peatland – controlling factors and relation to methane emission. Soil Biology and Biochemistry 1995; 27, 829-837. Swedish Environmental Protection Agency. National Inventory report 2009 Sweden. Swedish Environmental Protection Agency, Stockholm, Sweden, 2009. Weslien P, Kasimir Klemedtsson Å, Börjesson G, Klemedtsson, L. 2009, Strong pH influence on N2O and CH4 fluxes from forested organic soils, European Journal of Soil Science 2009; in press. Widén B, Lindroth A. A calibration system for soil carbon dioxide-efflux measurement chambers: Description and application. Soil Science Society of America Journal 2003; 67, 327-334.
von Arnold K, Hånell B, Stendahl J, Klemedtsson L. Greenhouse gas fluxes from drained organic forestland in Sweden. Scandinavian Journal of Forest Research 2005a; 20:400-411.
von Arnold K, Nilsson M, Hånell B, Weslien P, Klemedtsson L. Fluxes of CO2, CH4 and N2O from drained organic soils in deciduous forests. Soil Biology & Biochemistry 2005b; 37:1059-1071.
von Arnold K, Weslien P, Nilsson M, Svensson BH, Klemedtsson L. Fluxes of CO2, CH4 and N2O from drained coniferous forests on organic soils. Forest Ecology and Management 2005c; 210, 239-254. von Post and Granlund. Södra Sveriges torvtillgångar. In: Sver.Geol.Unders., årsbok 19, Ser C, No 335, Stockholm, 1926, pp. 127. In Swedish. Öquist, M.G., Petrone, K., Nilsson,M. & Klemedtsson, L. Nitrification controls N2O production rates in a frozen boreal forest soil Soil Biology and Biochemistry 2007; 39, 1809-1811.