
Greenhouse Gas Emissions from Commuting in New York City
38
Rolling Carbon: Greenhouse Gas Emissions from Commuting in New York City Your advocate for bicycling, walking and public transit www.transalt.org 127 west 26th street suite #1002 New York, NY 10001 212 629 8080 telephone 212 629 8334 fax October 2008
Transcript of Greenhouse Gas Emissions from Commuting in New York City
Rolling Carbon:Greenhouse Gas Emissions from Commuting in New York City
Your advocate for bicycling, walking and public transit
www.transalt.org 127 west 26th street suite #1002New York, NY 10001
212 629 8080 telephone 212 629 8334 fax
October 2008
2 October 2008Transportation AlternativesNew York, NY
Rolling Carbon:Greenhouse Gas Emissions from Commuting in New York City
4
6
8
13
18
23
24
Methodology Overview
Scenario 1: What if every New York City resident commuted by a single mode?Scenario 2: What if 10% of all New Yorkers who now commute by motorized transport modes (motor vehicle or public transit) switched to bicycling or other non-motorized transport one day a week?Scenario 3: What if 5% of New Yorkers who now commute by private car or taxi switched proportionally to all other modes?General Modal Shift Scenario Analysis and Context
Appendix A: Context – Greenhouse Gas Emissions from New York City’s Transportation SectorAppendix B: MethodologyAppendix C: Commuter Survey DataAppendix D: Fuel Specs
Table of Contents
Executive summary
Introduction
Part I: CO2 Emissions from Individual Transportation Modes in New York City
Part II: CO2 Emissions from Commuting by New York CityResidents
Part III: Scenarios for CO2 Emissions Reductions from Commuting Modal Shifts
Conclusions
Appendices
7
1819
20
21
24
263437
3 October 2008Transportation AlternativesNew York, NY
Rolling Carbon:Greenhouse Gas Emissions from Commuting in New York City
811
1415172021242829
30313132
35363738
Table 1: Individual transportation modes compared in this reportTable 2: CO2 emissions per mile for individual commute modes and per passenger-mile for public tran-sit and individual modes with assumed occupancy ratesTable 3: Current commute mode choices and volumes in New York CityTable 4: Estimated CO2 emissions from different commute modes New York CityTable 5: Summary of CO2 emissions data and commuting modal share for major commuting modes Table 6: Scenario 2 impacts on modal share and CO2 emissionsTable 7: Scenario 3 impacts on modal share and CO2 emissionsTable A1: New York City’s 2005 ground transportation sector greenhouse gas emissions by sourceTable B1: US fleet average fuel economy values, 2000-2006Table B2: Summary of fuel economy data and calculations for vehicles and vehicle classes discussed in this reportTable B3: CO2 emissions from MTA buses in New York City, 2005Table B4: CO2 emission data per passenger-mile for NYC busesTable B5: Estimated sources and shares of electricity powering the New York City subwaysTable B6: Calculation of CO2 emission per kWh electricity sold to the MTA for use in the NYC subway systemTable C1: Commuting data parsed from the US Census by transportation modeTable C2: Commuting census data aggregated by main modesTable D1: Selected transportation fuel specificationsTable D2: Selected power generation fuel specifications
List of Tables
49
12131416182224
Figure 1: Pounds CO2 emission per mile in New York CityFigure 2: CO2 emissions for selected transportation modes in New York CityFigure 3: CO2 emissions for various transportation modes in New York CityFigure 4: Annual CO2 emissions from various commute modes in New York CityFigures 5 and 6: NYC commuting share by trips and total passenger-miles traveledFigures 6 and 7: Comparison of commuting share by passenger-miles and CO2 emissionsFigure 8: Total Annual CO2 emissions if every New Yorker commuted by single modeFigure 9: CO2 Emissions reductions potentials from NYC commuting modal shiftsFigure A1: New York City’s 2005 ground transportation sector greenhouse gas emission shares
List of Figures
4 October 2008Transportation AlternativesNew York, NY
Rolling Carbon:Greenhouse Gas Emissions from Commuting in New York City
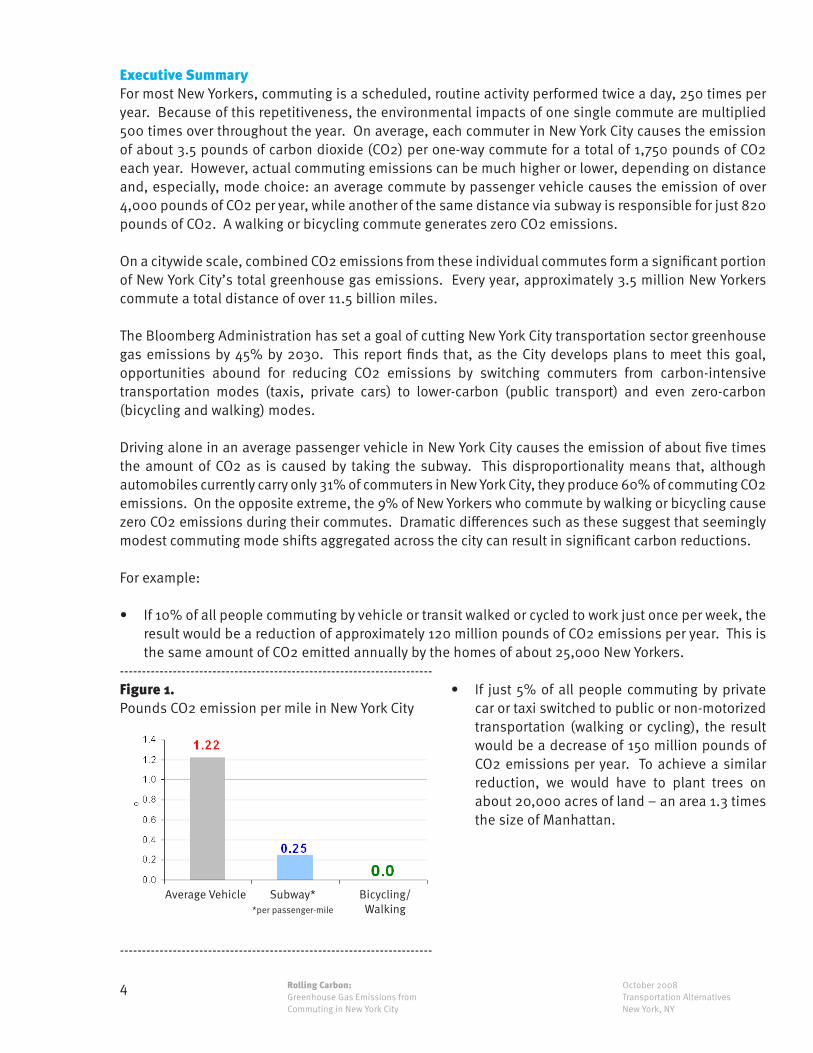
For most New Yorkers, commuting is a scheduled, routine activity performed twice a day, 250 times per year. Because of this repetitiveness, the environmental impacts of one single commute are multiplied 500 times over throughout the year. On average, each commuter in New York City causes the emission of about 3.5 pounds of carbon dioxide (CO2) per one-way commute for a total of 1,750 pounds of CO2 each year. However, actual commuting emissions can be much higher or lower, depending on distance and, especially, mode choice: an average commute by passenger vehicle causes the emission of over 4,000 pounds of CO2 per year, while another of the same distance via subway is responsible for just 820 pounds of CO2. A walking or bicycling commute generates zero CO2 emissions.
On a citywide scale, combined CO2 emissions from these individual commutes form a significant portion of New York City’s total greenhouse gas emissions. Every year, approximately 3.5 million New Yorkers commute a total distance of over 11.5 billion miles.
The Bloomberg Administration has set a goal of cutting New York City transportation sector greenhouse gas emissions by 45% by 2030. This report finds that, as the City develops plans to meet this goal, opportunities abound for reducing CO2 emissions by switching commuters from carbon-intensive transportation modes (taxis, private cars) to lower-carbon (public transport) and even zero-carbon (bicycling and walking) modes.
Driving alone in an average passenger vehicle in New York City causes the emission of about five times the amount of CO2 as is caused by taking the subway. This disproportionality means that, although automobiles currently carry only 31% of commuters in New York City, they produce 60% of commuting CO2 emissions. On the opposite extreme, the 9% of New Yorkers who commute by walking or bicycling cause zero CO2 emissions during their commutes. Dramatic differences such as these suggest that seemingly modest commuting mode shifts aggregated across the city can result in significant carbon reductions.
For example:
If 10% of all people commuting by vehicle or transit walked or cycled to work just once per week, the •result would be a reduction of approximately 120 million pounds of CO2 emissions per year. This is the same amount of CO2 emitted annually by the homes of about 25,000 New Yorkers.
Executive Summary
Average Vehicle Subway**per passenger-mile
Bicycling/Walking
-----------------------------------------------------------------------
-----------------------------------------------------------------------Figure 1. Pounds CO2 emission per mile in New York City
If• just 5% of all people commuting by private car or taxi switched to public or non-motorized transportation (walking or cycling), the result would be a decrease of 150 million pounds of CO2 emissions per year. To achieve a similar reduction, we would have to plant trees on about 20,000 acres of land – an area 1.3 times the size of Manhattan.
5 October 2008Transportation AlternativesNew York, NY
Rolling Carbon:Greenhouse Gas Emissions from Commuting in New York City
In• sobering contrast, if everyone were to commute alone by large SUV, the increase in CO2 emissions would be 12 billion pounds per year, tripling commuting CO2 emissions and increasing the city’s CO2 “footprint” from all sources — transport, buildings, power generation, and industry – by 10%.
Reducing CO2 emissions by upgrading commuting to “greener” transportation modes will require an array of coordinated, progressive transportation policies, supplemented by public-outreach campaigns educating New Yorkers on the carbon impacts of commuting as well as the availability of less-polluting commuting options. Because commuting trips are consistent and predictable, are generally manageable distances, and are usually performed alone, there may be more opportunities to affect commuting trips than other, less predictable trips. Moreover, the repetitive nature of commuting means that large impacts can be aggregated from seemingly small changes.
While this report addresses CO2 emissions specifically, modal shifts away from cars and onto public and non-motorized transportation will confer myriad additional benefits: improved air quality, reduced congestion, safer streets, and a more active, healthier population. As the City considers policies and programs promoting modal shifts (congestion pricing, transit, bicycling and walking improvements, etc.), the CO2 emissions reductions quantified here should be considered as just one element of the overall public benefit.
6 October 2008Transportation AlternativesNew York, NY
Rolling Carbon:Greenhouse Gas Emissions from Commuting in New York City
Introduction The scientific community has never been more unified in its message that greenhouse gas emissions from human activities are the primary cause of global warming, and that significant and immediate reductions of these emissions are required to avoid disastrous future consequences.1 Achieving these reductions is not trivial and will require multiple strategies and the active participation of every nation, state, city, and person.
Recognizing that New York City is both a significant contributor to greenhouse gas emissions as well as a potential victim of climate change, New York’s Mayor has called for a 30% cut in citywide greenhouse gas emissions from current levels by 2030.2 Mayor Bloomberg’s plan calls for emissions reductions across all sectors: buildings, power generation, and transportation.
Within the transportation sector, the Mayor proposes cutting annual greenhouse gas emissions by 6.1 million metric tons (MMT) — a 45% reduction from current levels.3 Achieving this goal will require a multi-faceted approach; therefore, the City has specified three general strategies:
Reduce vehicle use by improving public transportation•
Improve• the efficiency of private vehicles, taxis, and black cars
Decrease• CO2 intensity of fuels
This report focuses on the first strategy, reducing vehicle use. Focusing on CO2, the predominant greenhouse gas, we first present an analysis of CO2 emissions from various transportation modes in New York City; then use this analysis to estimate commuting CO2 emissions within the City; and finally explore the CO2 reductions possible from certain commuting modal shifts. These include replacing taxis and private vehicles not only with public transportation but also with non-motorized modes such as bicycling and walking.
–––––––––––––––––––––––––
1 This report does not attempt to detail the causes or potential future impacts of global warming. Definitive, current information on climate change may be found through the Intergovernmental Panel on Climate Change, www.ipcc.ch.
2New York-specific impacts may be found through PlaNYC documents as well as the July, 2007 report from the Union of Concerned Scientists, Confronting Climate Change in the US Northeast, available at: ucsusa.org/news/press_release/global-warming-to-hit-0044.html.
3PlaNYC: A Greener, Greater New York, April, 2007, page 13. Report published by the New York City Mayor’s Office of Operations, Office of Long Term Planning and Sustainability. Available at: nyc.gov/html/planyc2030/downloads/pdf/full_report.pdf, page 134.
7 October 2008Transportation AlternativesNew York, NY
Rolling Carbon:Greenhouse Gas Emissions from Commuting in New York City
Methodology Overview
This report compares CO2 emissions from various transportation modes in New York City and discusses the overall carbon impact of commuting here. A brief overview of the technical methodology used to estimate the CO2 emissions from each mode is presented in this section; a complete, detailed methodology is presented in Appendix B. The data in this report were derived for New York City conditions and may not apply elsewhere.
For individual vehicles and vehicle classes (including specific models, taxis, and “average” vehicles), CO2 emissions per mile were calculated directly from the fuel economy of the vehicle or vehicle class. The US Environmental Protection Agency (EPA) publishes annual fuel economy ratings by individual vehicle model as well as vehicle class. However, these published, “sticker” fuel economy ratings are notorious for overstating actual fuel economy, and must be adjusted to reflect real-world driving conditions, particularly in New York City. Here, we calculated a “New York City mpg penalty” by comparing published EPA fuel economy ratings with measured fuel economies achieved by vehicles driving in New York.
For buses, we combined system-wide fuel consumption data from the Metropolitan Transportation Authority (MTA) with bus passenger ridership data from the New York Metropolitan Transportation Council (NYMTC) to determine CO2 emissions per passenger-mile for each of the three types of buses operated by the MTA: diesel, diesel-electric hybrid, and compressed natural gas (CNG). An overall average weighted by ridership was then computed to arrive at a single emissions rate for buses.
For the subway, which is powered entirely by electricity, we used data on the statewide mix of fuel sources for electricity generation to estimate CO2 emissions per kWh supplied to the MTA; data on total electricity purchased by the MTA were then used to calculate annual CO2 emissions from the entire subway system. Annual passenger ridership data from NYMTC then allowed for the calculation of CO2 per passenger-mile traveled.
The data for ferries and commuter rail in this report are approximate, due to lack of available data, limited scope of this report, and limited overall contribution of these modes to transportation sector greenhouse emissions (1% in both cases). For ferries, an emission estimate for the Staten Island Ferry (calculated from fuel consumption and passenger ridership data) was used as a proxy for all ferries. For commuter rail, subway emissions data were used as proxy for.
Greenhouse Gas Terminology
The term “greenhouse gases” refers to all compounds in the earth’s atmosphere that contribute to the greenhouse effect and global warming. These include carbon dioxide (CO2), nitrous oxide, (N2O), methane (CH4), hydrofluorocarbons (HFCs), and others.
This report compares and sums CO2 emissions only, since CO2 is the most common greenhouse gas emitted by the transportation sector.4 However, the remaining gases are certainly an important subject for future analysis.
The term “carbon impact” is generally used as shorthand for total greenhouse gas or CO2 emissions.
–––––––––––––––––––––––––
4 CO2 emissions comprise greater than 95% of the greenhouse gas emissions from light duty vehicles, according to US EPA: Emission Facts: Greenhouse Gas Emissions from a Typical Passenger Vehicle, February 2005. Available at: epa.gov/otaq/climate/420f05004.htm.
8 October 2008Transportation AlternativesNew York, NY
Rolling Carbon:Greenhouse Gas Emissions from Commuting in New York City
Part I: CO2 Emissions from Individual Transportation Modes in New York City
The first step towards understanding transportation sector carbon emissions is to quantify CO2 emissions per mile from each major transportation mode. In this section of the report, CO2 emissions from seven typical and/or iconic New York City transportation modes are compared. The seven were chosen for their ability to resonate personally with New Yorkers; the analyses and comparisons here will serve as precursors to a public outreach campaign encouraging consumers to choose less carbon-intensive modes of transportation. The seven modes, with explanations on their inclusion in this report, are presented in Table 1:
––––––––––––––––––––––––––––––––––––––––––––––––––––––––––––––––––––––––––Table 1. Individual transportation modes compared in this report.––––––––––––––––––––––––––––––––––––––––––––––––––––––––––––––––––––––––––Transportation Mode Notes––––––––––––––––––––––––––––––––––––––––––––––––––––––––––––––––––––––––––
Yellow cabs have been icons of New York City for decades. In 2005, the Ford Crown Victoria accounted for 92% of all taxis in New York City;5 therefore, this vehicle was chosen as a proxy for all taxis in New York City.
Ford Crown Victoria Taxicab
––––––––––––––––––––––––––––––––––––––––––––––––––––––––––––––––––––––––––Cadillac Escalade SUV SUVs make up over 25% of the national auto market.6 We chose the Cadil-
lac Escalade to represent SUVs because of its iconic status among athletes and pop stars and in American culture generally.
––––––––––––––––––––––––––––––––––––––––––––––––––––––––––––––––––––––––––Average Vehicle Data calculated for an “average” vehicle enable analysis of the entire pas-
senger vehicle fleet in New York City. Here, average vehicle is as defined by the EPA (but with fuel economy adjusted as described in Appendix B).
––––––––––––––––––––––––––––––––––––––––––––––––––––––––––––––––––––––––––Toyota Prius The Toyota Prius, the best-selling gasoline-electric hybrid vehicle in the
U.S., has become renowned for its top-ranked EPA fuel economy rating among commercially available vehicles.
––––––––––––––––––––––––––––––––––––––––––––––––––––––––––––––––––––––––––Bus The MTA operates three types of buses: diesel, diesel/electric hybrid, and
compressed natural gas (CNG). The data presented in this report represent weighted averages of these three different types.
––––––––––––––––––––––––––––––––––––––––––––––––––––––––––––––––––––––––––Subway New York City’s subway system, run by the Metropolitan Transportation
Authority, is one of the oldest and most extensive systems in the world; the system carries more passengers daily than the total carried by the next five largest transit systems in the U.S.7
––––––––––––––––––––––––––––––––––––––––––––––––––––––––––––––––––––––––––NMT NMT stands for non-motorized transportation: generally bicycling,
skating, and walking.––––––––––––––––––––––––––––––––––––––––––––––––––––––––––––––––––––––––––––––––––––––––––––––––––––––––––––––––––––––––––––––––––––––––––––––––––––– –––––––––––5Schaller Consulting: New York City Taxicab Fact Book, March, 2006, page 43. Available at: schallerconsult.com/taxi/taxifb.pdf.6Environmental Defense: Automakers’ Corporate Carbon Burdens, 2003, page 6. Available at: environmentaldefense.org/documents/4715_CarbonBurdensUpdateFinal.pdf.7New York City Mobility Needs Assessment, April, 2007, page 6. Published by the New York City Mayor’s Office of Operations, Office of Long Term Planning and Sustainability. Available at: nyc.gov/html/planyc2030/downloads/pdf/tech_report_transportation.pdf.
9 October 2008Transportation AlternativesNew York, NY
Rolling Carbon:Greenhouse Gas Emissions from Commuting in New York City
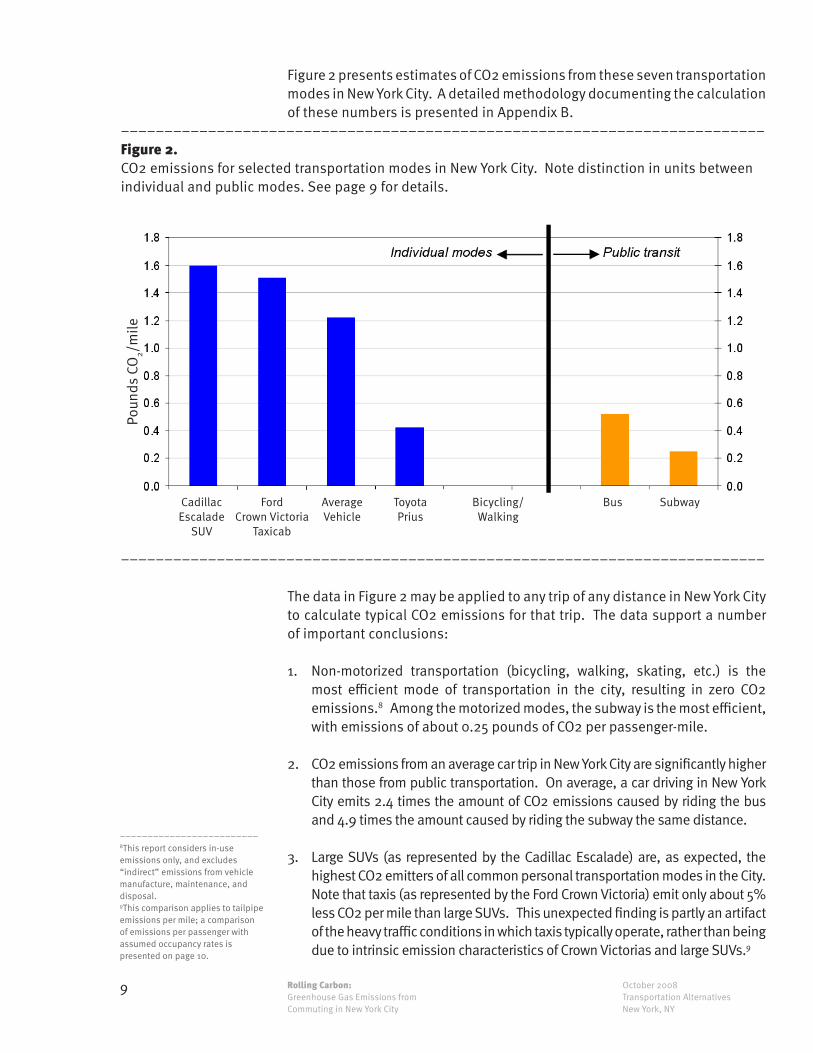
Figure 2 presents estimates of CO2 emissions from these seven transportation modes in New York City. A detailed methodology documenting the calculation of these numbers is presented in Appendix B.
––––––––––––––––––––––––––––––––––––––––––––––––––––––––––––––––––––––––––Figure 2. CO2 emissions for selected transportation modes in New York City. Note distinction in units between individual and public modes. See page 9 for details.
Ford Crown Victoria
Taxicab
Cadillac Escalade
SUV
AverageVehicle
ToyotaPrius
Bus SubwayBicycling/Walking
––––––––––––––––––––––––––––––––––––––––––––––––––––––––––––––––––––––––––
Poun
ds C
O2/m
ile
The data in Figure 2 may be applied to any trip of any distance in New York City to calculate typical CO2 emissions for that trip. The data support a number of important conclusions:
Non1. -motorized transportation (bicycling, walking, skating, etc.) is the most efficient mode of transportation in the city, resulting in zero CO2 emissions.8 Among the motorized modes, the subway is the most efficient, with emissions of about 0.25 pounds of CO2 per passenger-mile.
CO22. emissions from an average car trip in New York City are significantly higher than those from public transportation. On average, a car driving in New York City emits 2.4 times the amount of CO2 emissions caused by riding the bus and 4.9 times the amount caused by riding the subway the same distance.
Large3. SUVs (as represented by the Cadillac Escalade) are, as expected, the highest CO2 emitters of all common personal transportation modes in the City. Note that taxis (as represented by the Ford Crown Victoria) emit only about 5% less CO2 per mile than large SUVs. This unexpected finding is partly an artifact of the heavy traffic conditions in which taxis typically operate, rather than being due to intrinsic emission characteristics of Crown Victorias and large SUVs.9
–––––––––––––––––––––––––8This report considers in-use emissions only, and excludes “indirect” emissions from vehicle manufacture, maintenance, and disposal.9This comparison applies to tailpipe emissions per mile; a comparison of emissions per passenger with assumed occupancy rates is presented on page 10.
10 October 2008Transportation AlternativesNew York, NY
Rolling Carbon:Greenhouse Gas Emissions from Commuting in New York City
CO24. emissions from a Toyota Prius hybrid gasoline-electric vehicle in New York City are just one-third of those from an average vehicle.
A noteworthy and, perhaps, disappointing finding in Figure 2 is that CO2 emissions from an average trip by bus, though considerably lower than the citywide average for private car trips, are about 25% higher than those from a Prius and more than double those from the subway. There are two reasons: first, average bus occupancy in New York City is just 16.3 passengers.10 This is far below capacity and points to the possibility of decreasing per-trip CO2 emissions by adding riders on many routes without having to expand bus operations. Second, chronic and widespread traffic congestion, along with inefficient boarding and fare collection systems, limits New York City buses’ average speed to just 7.9 mph, well below that of cities like Los Angeles and Washington, D.C.11 Because buses operate more efficiently at higher speeds, reduced congestion and other measures to increase bus speeds would translate directly to reduced CO2 emissions per passenger-mile.
Moreover, this result should not be taken to mean that driving an efficient gasoline-electric hybrid vehicle in New York City is a lower-impact choice than taking the bus. Though hybrid vehicles do achieve significantly better fuel economy than conventional cars, any use of private vehicles, even hybrids, in dense urban environments imposes additional costs, including increased road congestion, decreased street safety, and reduced public space. When and if private cars are used in the city, policies encouraging carpooling should be implemented to help minimize these costs.
Within Figure 2, CO2 emissions from different sources are presented in different units. CO2 emissions from individual transportation modes (private vehicles, taxis, and non-motorized transportation) are presented in pounds of CO2 per mile, whereas CO2 emissions from public transportation (buses and subways) are presented as pounds of CO2 per passenger-mile.
There are several reasons for this distinction. First, when describing the impacts from individual transportation modes such as private vehicles and taxis, using units of pounds CO2 per mile results in a real and intuitive sense of environmental impact; if one drives a car one mile, the CO2 emissions will be x pounds; drive two miles, and the CO2 emissions will be 2x pounds. The CO2 emission impact of driving is an absolute impact; presenting data in terms of this absolute impact is a key component of targeting and affecting individual drivers’ behavior.
However, the same unit, CO2 per mile, is inadequate for describing impacts –––––––––––––––––––––––––10Calculated from data from NYMTC: Regional Transportation at a Glance, 2005, indicating MTA buses in 2005 traveled 119.6 million miles and carried 1.97 billion passenger-miles. Available at: nymtc.org/files/2005_Transportation_Statistics_at_a_Glance.pdf.11PlaNYC, page 82.
Notes on Units
11 October 2008Transportation AlternativesNew York, NY
Rolling Carbon:Greenhouse Gas Emissions from Commuting in New York City
from public transportation, because emissions from public transportation are most meaningful in the context of how many passengers it carries. Whereas driving a car results in an absolute increase in CO2, riding public transportation causes an increase in CO2 only if an additional bus or train must be pressed into service to accommodate the additional rider. Accordingly, the decision to ride the bus or subway cannot be directly tied to a discrete, measurable increase in emissions.12
CO2 emissions from public transportation are calculated system-wide by dividing total energy consumed (computed from electricity used by the subway system, and diesel or CNG fuel used by buses) by total passengers carried and miles traveled. The resulting units are CO2 per passenger-mile.13
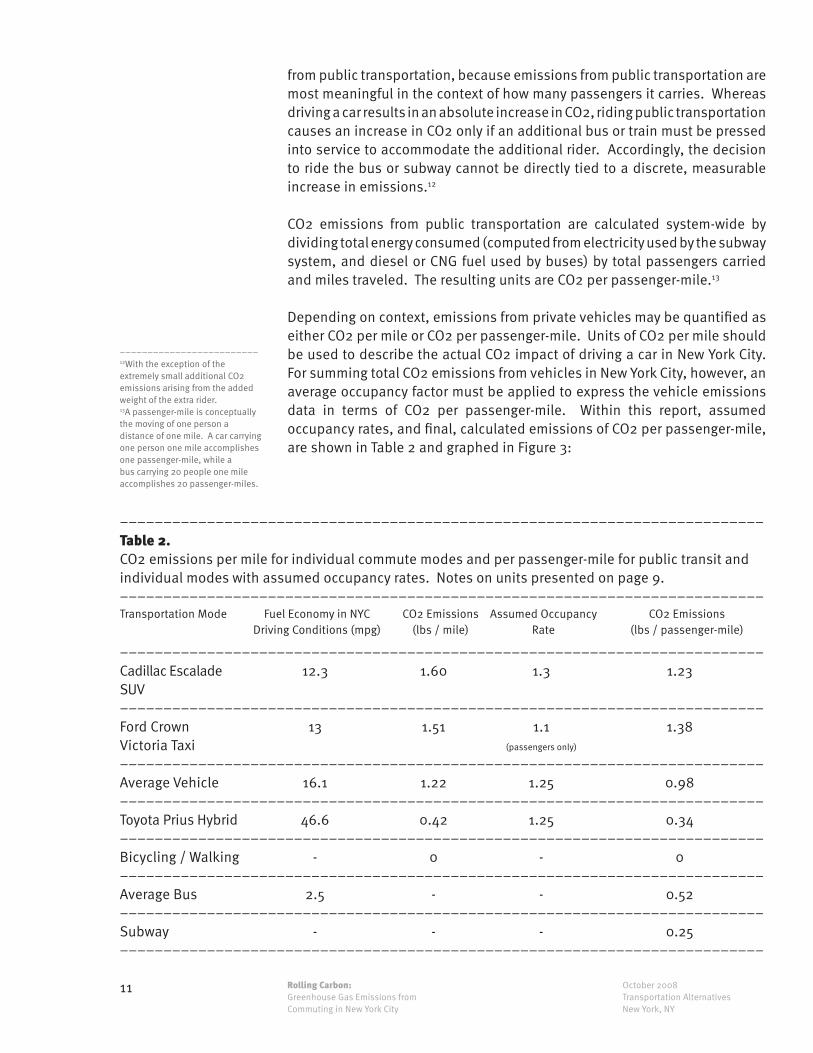
Depending on context, emissions from private vehicles may be quantified as either CO2 per mile or CO2 per passenger-mile. Units of CO2 per mile should be used to describe the actual CO2 impact of driving a car in New York City. For summing total CO2 emissions from vehicles in New York City, however, an average occupancy factor must be applied to express the vehicle emissions data in terms of CO2 per passenger-mile. Within this report, assumed occupancy rates, and final, calculated emissions of CO2 per passenger-mile, are shown in Table 2 and graphed in Figure 3:
–––––––––––––––––––––––––12With the exception of the extremely small additional CO2 emissions arising from the added weight of the extra rider.13A passenger-mile is conceptually the moving of one person a distance of one mile. A car carrying one person one mile accomplishes one passenger-mile, while a bus carrying 20 people one mile accomplishes 20 passenger-miles.
––––––––––––––––––––––––––––––––––––––––––––––––––––––––––––––––––––––––––Table 2.CO2 emissions per mile for individual commute modes and per passenger-mile for public transit and individual modes with assumed occupancy rates. Notes on units presented on page 9.––––––––––––––––––––––––––––––––––––––––––––––––––––––––––––––––––––––––––Transportation Mode Assumed Occupancy
RateFuel Economy in NYC
Driving Conditions (mpg)CO2 Emissions
(lbs / mile)CO2 Emissions
(lbs / passenger-mile)
––––––––––––––––––––––––––––––––––––––––––––––––––––––––––––––––––––––––––Cadillac Escalade SUV
Ford Crown Victoria Taxi
Average Vehicle
Toyota Prius Hybrid
Bicycling / Walking
Average Bus
Subway––––––––––––––––––––––––––––––––––––––––––––––––––––––––––––––––––––––––––
––––––––––––––––––––––––––––––––––––––––––––––––––––––––––––––––––––––––––
––––––––––––––––––––––––––––––––––––––––––––––––––––––––––––––––––––––––––
––––––––––––––––––––––––––––––––––––––––––––––––––––––––––––––––––––––––––
––––––––––––––––––––––––––––––––––––––––––––––––––––––––––––––––––––––––––
––––––––––––––––––––––––––––––––––––––––––––––––––––––––––––––––––––––––––
––––––––––––––––––––––––––––––––––––––––––––––––––––––––––––––––––––––––––
12.3
13
16.1
46.6
-
2.5
-
1.60
1.51
1.22
0.42
0
-
-
1.3
1.1(passengers only)
1.25
1.25
-
-
-
1.23
1.38
0.98
0.34
0
0.52
0.25
12 October 2008Transportation AlternativesNew York, NY
Rolling Carbon:Greenhouse Gas Emissions from Commuting in New York City
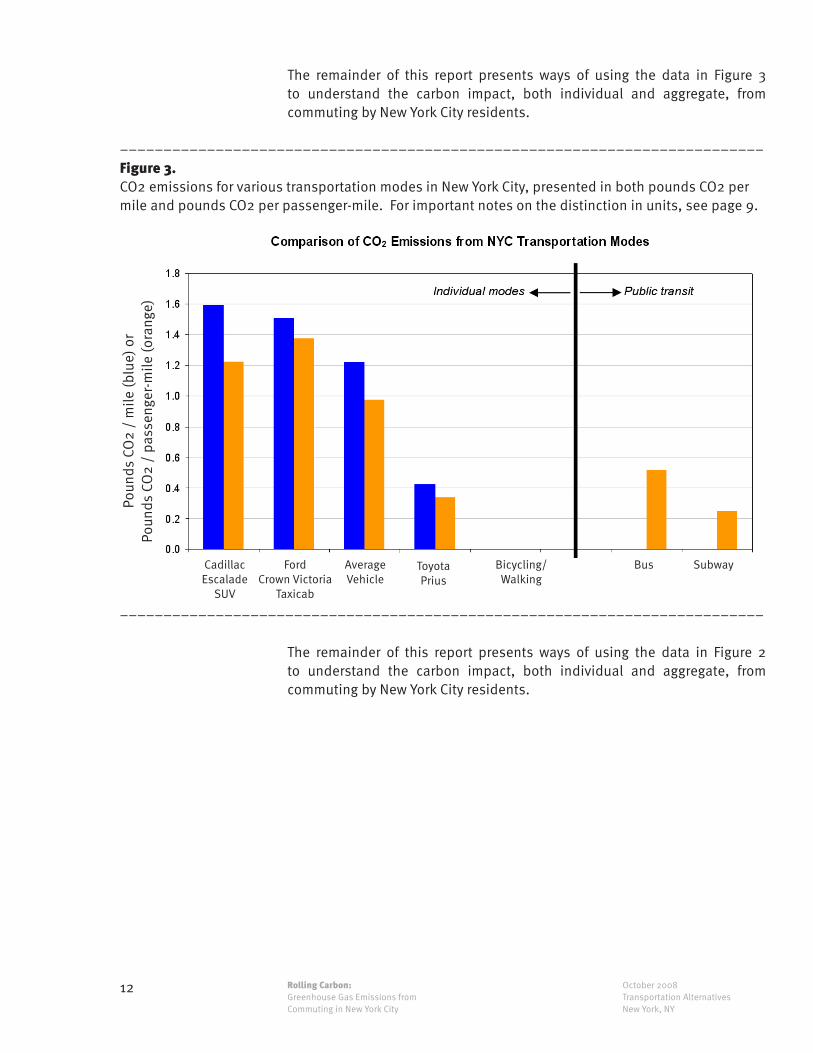
The remainder of this report presents ways of using the data in Figure 3 to understand the carbon impact, both individual and aggregate, from commuting by New York City residents.
––––––––––––––––––––––––––––––––––––––––––––––––––––––––––––––––––––––––––Figure 3. CO2 emissions for various transportation modes in New York City, presented in both pounds CO2 per mile and pounds CO2 per passenger-mile. For important notes on the distinction in units, see page 9.
Poun
ds C
O2
/ m
ile (b
lue)
or
Poun
ds C
O2
/ pa
ssen
ger-
mile
(ora
nge)
Ford Crown Victoria
Taxicab
Cadillac Escalade
SUV
AverageVehicle
ToyotaPrius
Bus SubwayBicycling/Walking
––––––––––––––––––––––––––––––––––––––––––––––––––––––––––––––––––––––––––
The remainder of this report presents ways of using the data in Figure 2 to understand the carbon impact, both individual and aggregate, from commuting by New York City residents.
13 October 2008Transportation AlternativesNew York, NY
Rolling Carbon:Greenhouse Gas Emissions from Commuting in New York City
Part II: CO2 Emissions from Commuting by New York City Residents
Three of every seven New Yorkers, or about 3.5 million people (43% of the City’s 8.2 million population), are active participants in the workforce.14 In this section of the report we explore both individual and aggregate CO2 emissions from their commutes.
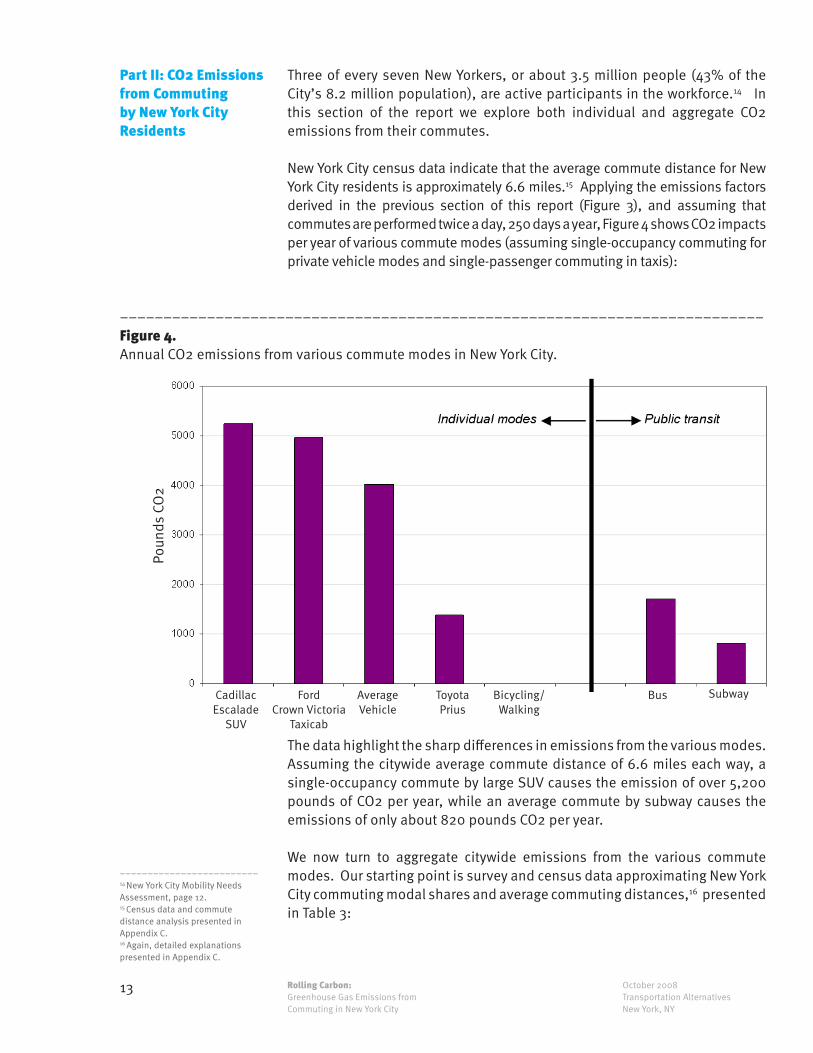
New York City census data indicate that the average commute distance for New York City residents is approximately 6.6 miles.15 Applying the emissions factors derived in the previous section of this report (Figure 3), and assuming that commutes are performed twice a day, 250 days a year, Figure 4 shows CO2 impacts per year of various commute modes (assuming single-occupancy commuting for private vehicle modes and single-passenger commuting in taxis):
––––––––––––––––––––––––––––––––––––––––––––––––––––––––––––––––––––––––––Figure 4. Annual CO2 emissions from various commute modes in New York City.
Ford Crown Victoria
Taxicab
Cadillac Escalade
SUV
AverageVehicle
ToyotaPrius
Bus SubwayBicycling/Walking
Poun
ds C
O2
The data highlight the sharp differences in emissions from the various modes. Assuming the citywide average commute distance of 6.6 miles each way, a single-occupancy commute by large SUV causes the emission of over 5,200 pounds of CO2 per year, while an average commute by subway causes the emissions of only about 820 pounds CO2 per year.
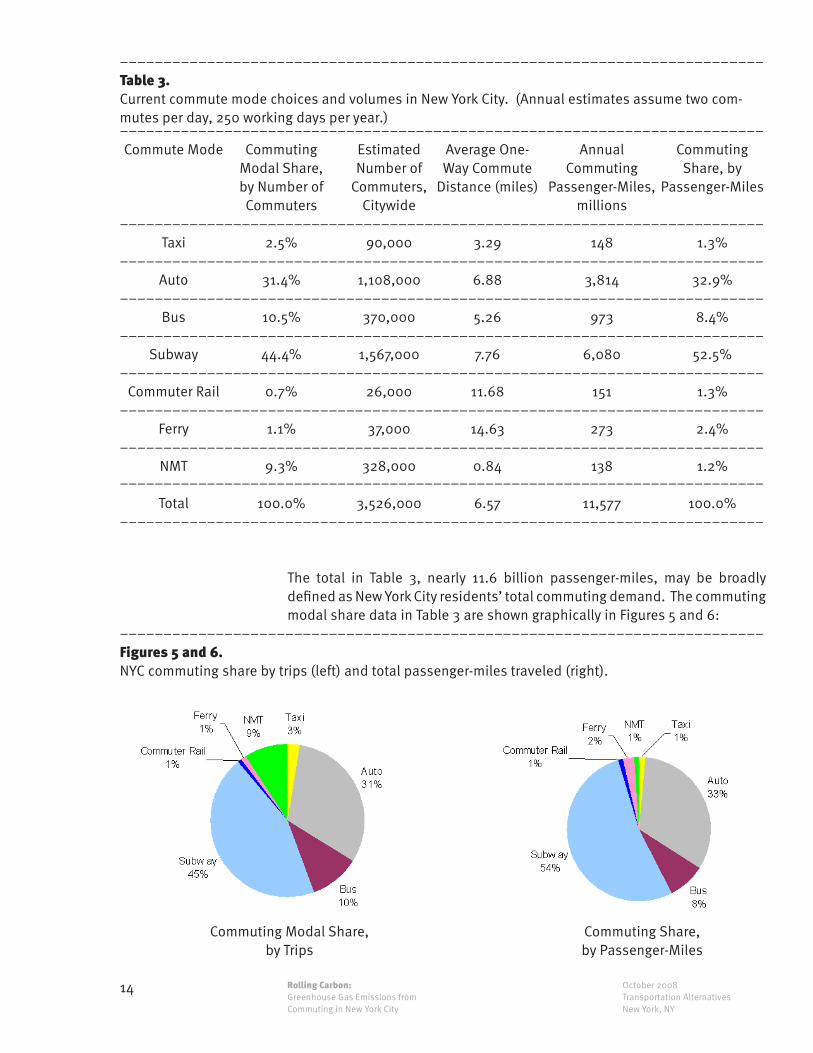
We now turn to aggregate citywide emissions from the various commute modes. Our starting point is survey and census data approximating New York City commuting modal shares and average commuting distances,16 presented in Table 3:
–––––––––––––––––––––––––14 New York City Mobility Needs Assessment, page 12.15 Census data and commute distance analysis presented in Appendix C.16 Again, detailed explanations presented in Appendix C.
14 October 2008Transportation AlternativesNew York, NY
Rolling Carbon:Greenhouse Gas Emissions from Commuting in New York City
The total in Table 3, nearly 11.6 billion passenger-miles, may be broadly defined as New York City residents’ total commuting demand. The commuting modal share data in Table 3 are shown graphically in Figures 5 and 6:
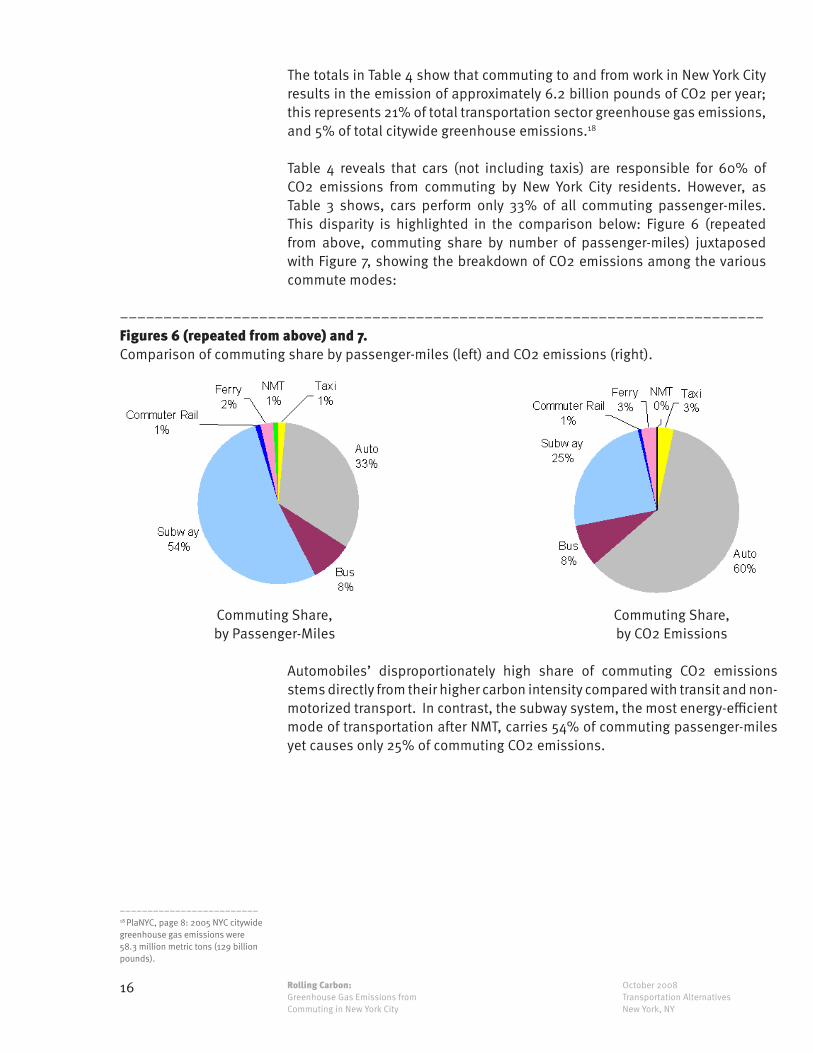
––––––––––––––––––––––––––––––––––––––––––––––––––––––––––––––––––––––––––Figures 5 and 6. NYC commuting share by trips (left) and total passenger-miles traveled (right).
Commuting Modal Share,by Trips
Commuting Share,by Passenger-Miles
––––––––––––––––––––––––––––––––––––––––––––––––––––––––––––––––––––––––––Table 3.Current commute mode choices and volumes in New York City. (Annual estimates assume two com-mutes per day, 250 working days per year.)
Commute Mode
Taxi
Auto
Bus
Subway
Commuter Rail
Ferry
NMT
Total
Commuting Modal Share, by Number of Commuters
2.5%
31.4%
10.5%
44.4%
0.7%
1.1%
9.3%
100.0%
Estimated Number of
Commuters, Citywide
90,000
1,108,000
370,000
1,567,000
26,000
37,000
328,000
3,526,000
Average One-Way Commute
Distance (miles)
3.29
6.88
5.26
7.76
11.68
14.63
0.84
6.57
Annual Commuting
Passenger-Miles, millions
148
3,814
973
6,080
151
273
138
11,577
––––––––––––––––––––––––––––––––––––––––––––––––––––––––––––––––––––––––––
––––––––––––––––––––––––––––––––––––––––––––––––––––––––––––––––––––––––––
––––––––––––––––––––––––––––––––––––––––––––––––––––––––––––––––––––––––––
––––––––––––––––––––––––––––––––––––––––––––––––––––––––––––––––––––––––––
––––––––––––––––––––––––––––––––––––––––––––––––––––––––––––––––––––––––––
––––––––––––––––––––––––––––––––––––––––––––––––––––––––––––––––––––––––––Commuting Share, by
Passenger-Miles
1.3%
32.9%
8.4%
52.5%
1.3%
2.4%
1.2%
100.0%
––––––––––––––––––––––––––––––––––––––––––––––––––––––––––––––––––––––––––
––––––––––––––––––––––––––––––––––––––––––––––––––––––––––––––––––––––––––
––––––––––––––––––––––––––––––––––––––––––––––––––––––––––––––––––––––––––
––––––––––––––––––––––––––––––––––––––––––––––––––––––––––––––––––––––––––
15 October 2008Transportation AlternativesNew York, NY
Rolling Carbon:Greenhouse Gas Emissions from Commuting in New York City
The most striking difference between Figures 5 and 6 is the disparity between non-motorized transport (NMT)’s share of commuters (9%) and share of passenger-miles (1%). This is due to the fact that non-motorized commuting generally covers very short distances — the average NMT commute distance is just 0.84 miles. Subways, on the other hand, generally carry commuters farther than average (the average subway commute is 7.8 miles), hence the greater percentage share of commuting passenger-miles carried by subways as compared with commuting trips (54% vs. 45%).
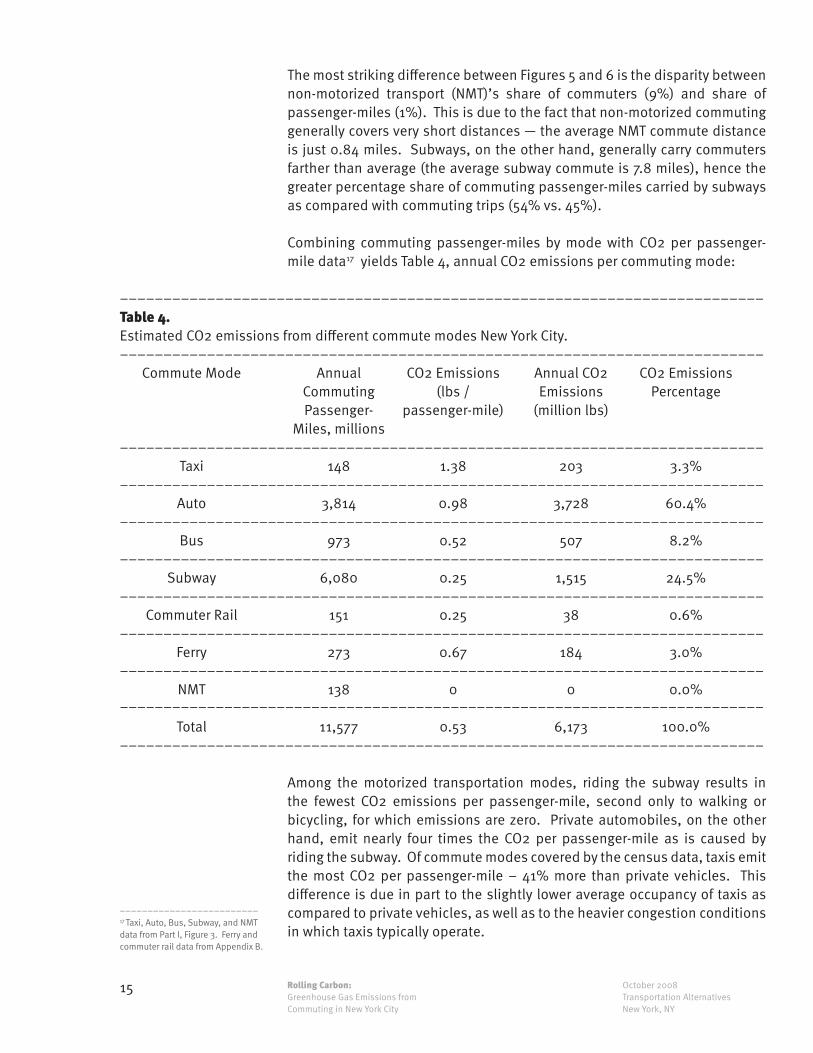
Combining commuting passenger-miles by mode with CO2 per passenger-mile data17 yields Table 4, annual CO2 emissions per commuting mode:
––––––––––––––––––––––––––––––––––––––––––––––––––––––––––––––––––––––––––Table 4.Estimated CO2 emissions from different commute modes New York City.
Commute Mode
Taxi
Auto
Bus
Subway
Commuter Rail
Ferry
NMT
Total
Annual Commuting Passenger-
Miles, millions
148
3,814
973
6,080
151
273
138
11,577
CO2 Emissions (lbs /
passenger-mile)
1.38
0.98
0.52
0.25
0.25
0.67
0
0.53
Annual CO2 Emissions
(million lbs)
203
3,728
507
1,515
38
184
0
6,173
CO2 Emissions Percentage
3.3%
60.4%
8.2%
24.5%
0.6%
3.0%
0.0%
100.0%
––––––––––––––––––––––––––––––––––––––––––––––––––––––––––––––––––––––––––
––––––––––––––––––––––––––––––––––––––––––––––––––––––––––––––––––––––––––
––––––––––––––––––––––––––––––––––––––––––––––––––––––––––––––––––––––––––
––––––––––––––––––––––––––––––––––––––––––––––––––––––––––––––––––––––––––
––––––––––––––––––––––––––––––––––––––––––––––––––––––––––––––––––––––––––
––––––––––––––––––––––––––––––––––––––––––––––––––––––––––––––––––––––––––
––––––––––––––––––––––––––––––––––––––––––––––––––––––––––––––––––––––––––
––––––––––––––––––––––––––––––––––––––––––––––––––––––––––––––––––––––––––
––––––––––––––––––––––––––––––––––––––––––––––––––––––––––––––––––––––––––
––––––––––––––––––––––––––––––––––––––––––––––––––––––––––––––––––––––––––
–––––––––––––––––––––––––17 Taxi, Auto, Bus, Subway, and NMT data from Part I, Figure 3. Ferry and commuter rail data from Appendix B.
Among the motorized transportation modes, riding the subway results in the fewest CO2 emissions per passenger-mile, second only to walking or bicycling, for which emissions are zero. Private automobiles, on the other hand, emit nearly four times the CO2 per passenger-mile as is caused by riding the subway. Of commute modes covered by the census data, taxis emit the most CO2 per passenger-mile – 41% more than private vehicles. This difference is due in part to the slightly lower average occupancy of taxis as compared to private vehicles, as well as to the heavier congestion conditions in which taxis typically operate.
16 October 2008Transportation AlternativesNew York, NY
Rolling Carbon:Greenhouse Gas Emissions from Commuting in New York City
The totals in Table 4 show that commuting to and from work in New York City results in the emission of approximately 6.2 billion pounds of CO2 per year; this represents 21% of total transportation sector greenhouse gas emissions, and 5% of total citywide greenhouse emissions.18
Table 4 reveals that cars (not including taxis) are responsible for 60% of CO2 emissions from commuting by New York City residents. However, as Table 3 shows, cars perform only 33% of all commuting passenger-miles. This disparity is highlighted in the comparison below: Figure 6 (repeated from above, commuting share by number of passenger-miles) juxtaposed with Figure 7, showing the breakdown of CO2 emissions among the various commute modes:
–––––––––––––––––––––––––18 PlaNYC, page 8: 2005 NYC citywide greenhouse gas emissions were 58.3 million metric tons (129 billion pounds).
––––––––––––––––––––––––––––––––––––––––––––––––––––––––––––––––––––––––––Figures 6 (repeated from above) and 7. Comparison of commuting share by passenger-miles (left) and CO2 emissions (right).
Commuting Share,by Passenger-Miles
Commuting Share,by CO2 Emissions
Automobiles’ disproportionately high share of commuting CO2 emissions stems directly from their higher carbon intensity compared with transit and non-motorized transport. In contrast, the subway system, the most energy-efficient mode of transportation after NMT, carries 54% of commuting passenger-miles yet causes only 25% of commuting CO2 emissions.
17 October 2008Transportation AlternativesNew York, NY
Rolling Carbon:Greenhouse Gas Emissions from Commuting in New York City
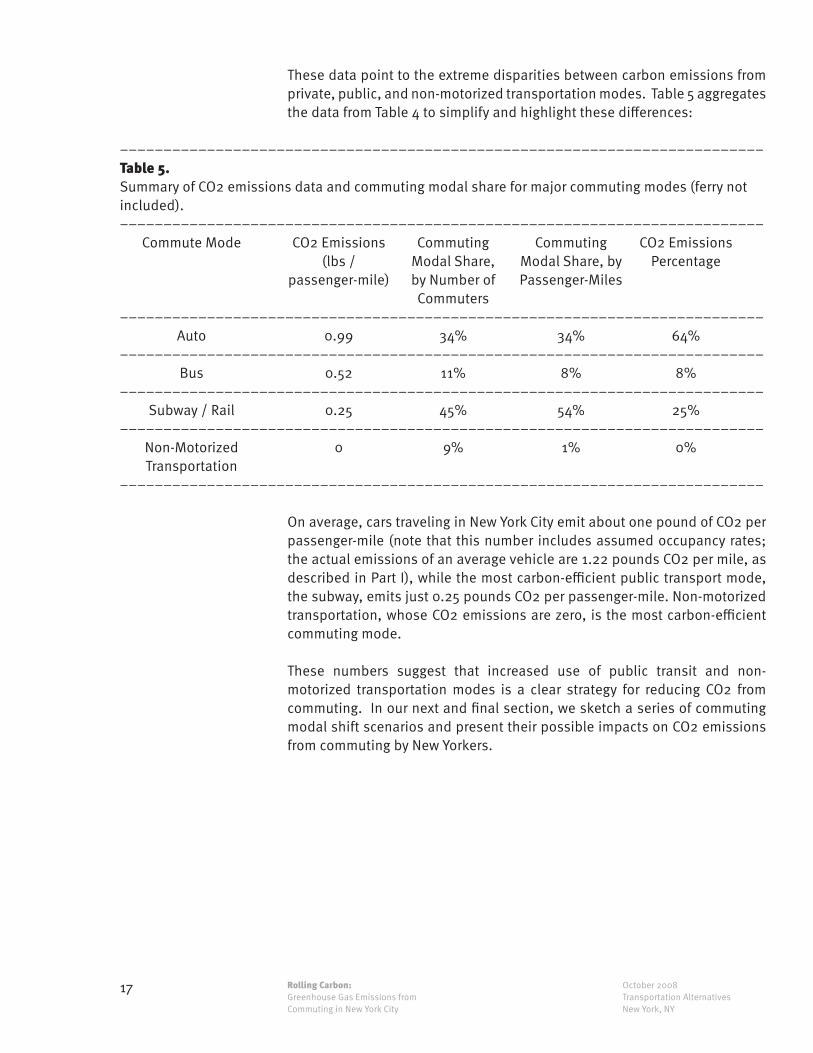
These data point to the extreme disparities between carbon emissions from private, public, and non-motorized transportation modes. Table 5 aggregates the data from Table 4 to simplify and highlight these differences:
––––––––––––––––––––––––––––––––––––––––––––––––––––––––––––––––––––––––––Table 5.Summary of CO2 emissions data and commuting modal share for major commuting modes (ferry not included).
Commute Mode
Auto
Bus
Subway / Rail
Non-Motorized Transportation
CO2 Emissions (lbs /
passenger-mile)
0.99
0.52
0.25
0
Commuting Modal Share, by Number of Commuters
34%
11%
45%
9%
Commuting Modal Share, by Passenger-Miles
34%
8%
54%
1%
CO2 Emissions Percentage
64%
8%
25%
0%
––––––––––––––––––––––––––––––––––––––––––––––––––––––––––––––––––––––––––
––––––––––––––––––––––––––––––––––––––––––––––––––––––––––––––––––––––––––
––––––––––––––––––––––––––––––––––––––––––––––––––––––––––––––––––––––––––
––––––––––––––––––––––––––––––––––––––––––––––––––––––––––––––––––––––––––
––––––––––––––––––––––––––––––––––––––––––––––––––––––––––––––––––––––––––
––––––––––––––––––––––––––––––––––––––––––––––––––––––––––––––––––––––––––
On average, cars traveling in New York City emit about one pound of CO2 per passenger-mile (note that this number includes assumed occupancy rates; the actual emissions of an average vehicle are 1.22 pounds CO2 per mile, as described in Part I), while the most carbon-efficient public transport mode, the subway, emits just 0.25 pounds CO2 per passenger-mile. Non-motorized transportation, whose CO2 emissions are zero, is the most carbon-efficient commuting mode.
These numbers suggest that increased use of public transit and non-motorized transportation modes is a clear strategy for reducing CO2 from commuting. In our next and final section, we sketch a series of commuting modal shift scenarios and present their possible impacts on CO2 emissions from commuting by New Yorkers.
18 October 2008Transportation AlternativesNew York, NY
Rolling Carbon:Greenhouse Gas Emissions from Commuting in New York City
Part III: Scenarios for CO2 Emissions Reductions from Commuting Modal Shifts
The core analyses presented in the previous sections of this report allow us to calculate CO2 emissions from a variety of commuting modal shift scenarios, both individual and citywide. We explore three sets of scenarios. In one set, all commuters shift to a single, uniform mode; while this is obviously unrealistic, the results can illuminate our understanding of the relative impacts of the various modes. The other two scenarios concern modest, hence plausible, mode shifts that, in our view, warrant serious and immediate consideration by New York City residents and policymakers.
Scenario 1: What if every New York City resident commuted by a single mode?
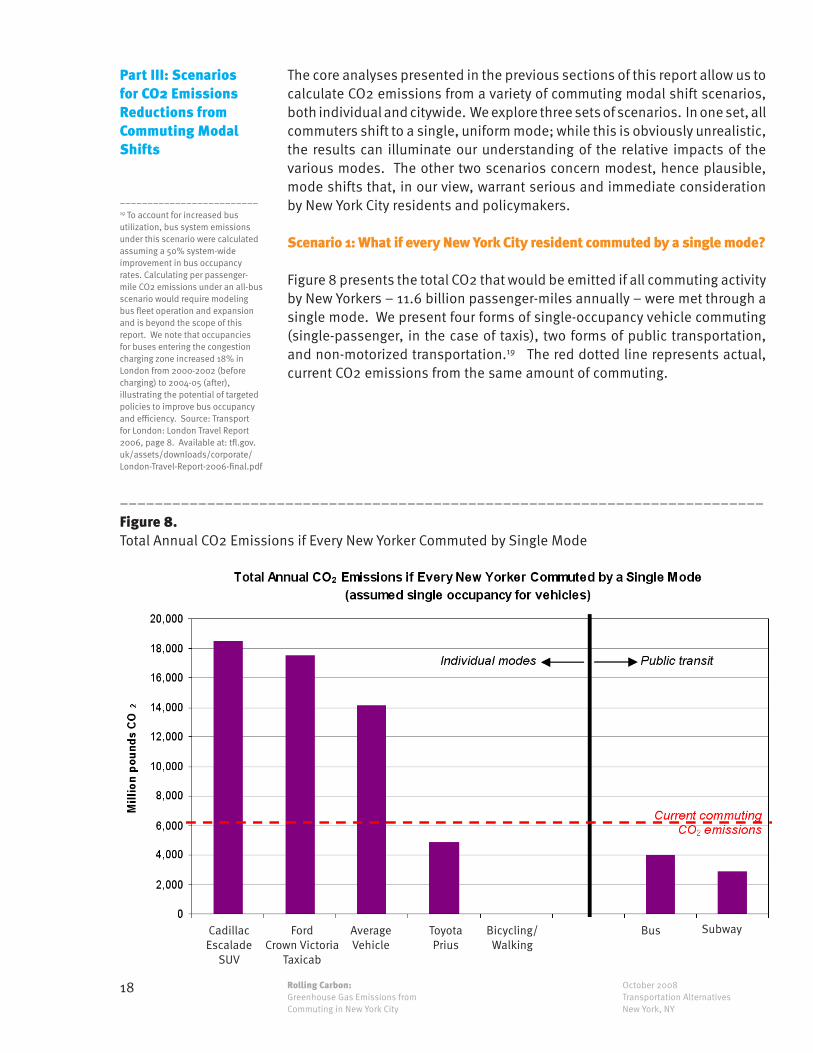
Figure 8 presents the total CO2 that would be emitted if all commuting activity by New Yorkers – 11.6 billion passenger-miles annually – were met through a single mode. We present four forms of single-occupancy vehicle commuting (single-passenger, in the case of taxis), two forms of public transportation, and non-motorized transportation.19 The red dotted line represents actual, current CO2 emissions from the same amount of commuting.
––––––––––––––––––––––––––––––––––––––––––––––––––––––––––––––––––––––––––Figure 8. Total Annual CO2 Emissions if Every New Yorker Commuted by Single Mode
–––––––––––––––––––––––––19 To account for increased bus utilization, bus system emissions under this scenario were calculated assuming a 50% system-wide improvement in bus occupancy rates. Calculating per passenger-mile CO2 emissions under an all-bus scenario would require modeling bus fleet operation and expansion and is beyond the scope of this report. We note that occupancies for buses entering the congestion charging zone increased 18% in London from 2000-2002 (before charging) to 2004-05 (after), illustrating the potential of targeted policies to improve bus occupancy and efficiency. Source: Transport for London: London Travel Report 2006, page 8. Available at: tfl.gov.uk/assets/downloads/corporate/London-Travel-Report-2006-final.pdf
Ford Crown Victoria
Taxicab
Cadillac Escalade
SUV
AverageVehicle
ToyotaPrius
Bus SubwayBicycling/Walking
19 October 2008Transportation AlternativesNew York, NY
Rolling Carbon:Greenhouse Gas Emissions from Commuting in New York City
Figure 8 shows that the implications of every New Yorker commuting by private vehicle are sobering: CO2 emissions from commuting would more than double from current levels. In an even more extreme scenario, if every New Yorker commuted in a single-occupant large SUV such as a Cadillac Escalade, current CO2 emissions from commuting would triple. As staggering as these increases are, they are probably even underestimates, since the increased congestion and resulting degradation in fuel economy would increase emissions still further.
Conversely, switching all commute journeys to subways would reduce current commuting CO2 emissions by an estimated 53%; this reduction would decrease citywide total greenhouse gas emissions by over 2.5%.
Scenario 2: What if 10% of all New Yorkers who now commute by motorized transport modes (motor vehicle or public transit) switched to bicycling or other non-motorized transport one day a week?
This scenario explores the CO2 emissions reductions from a modal shift away from motorized transportation – taxis, private cars, buses, commuter rail, and subways – to bicycling, walking, skating, or other non-motorized transportation. (A shift from ferries is not considered here, insofar as NMT is not a viable alternative to most commuting by ferry). Note that the wording of the scenario – 10% of motorized commuting switching once per week – is the same as suggesting that 2% of all those commuting by motorized transport switch to non-motorized transport. The former wording is chosen since it will resonate better with individual commuters; the idea of switching just once per week is less daunting than switching entirely from motorized transportation.
20 October 2008Transportation AlternativesNew York, NY
Rolling Carbon:Greenhouse Gas Emissions from Commuting in New York City
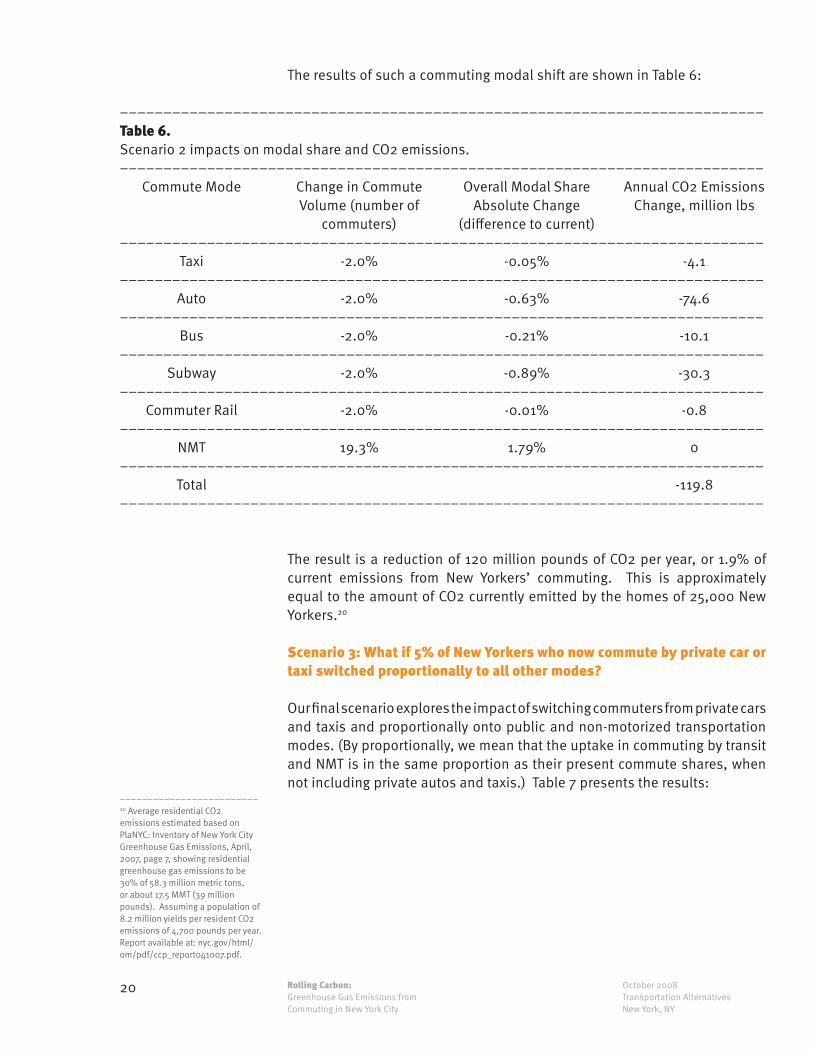
––––––––––––––––––––––––––––––––––––––––––––––––––––––––––––––––––––––––––Table 6.Scenario 2 impacts on modal share and CO2 emissions.
Commute Mode
Taxi
Auto
Bus
Subway
Commuter Rail
NMT
Total
Change in CommuteVolume (number of
commuters)
-2.0%
-2.0%
-2.0%
-2.0%
-2.0%
19.3%
Overall Modal Share Absolute Change
(difference to current)
-0.05%
-0.63%
-0.21%
-0.89%
-0.01%
1.79%
Annual CO2 Emissions Change, million lbs
-4.1
-74.6
-10.1
-30.3
-0.8
0
-119.8
––––––––––––––––––––––––––––––––––––––––––––––––––––––––––––––––––––––––––
––––––––––––––––––––––––––––––––––––––––––––––––––––––––––––––––––––––––––
––––––––––––––––––––––––––––––––––––––––––––––––––––––––––––––––––––––––––
––––––––––––––––––––––––––––––––––––––––––––––––––––––––––––––––––––––––––
––––––––––––––––––––––––––––––––––––––––––––––––––––––––––––––––––––––––––
––––––––––––––––––––––––––––––––––––––––––––––––––––––––––––––––––––––––––
––––––––––––––––––––––––––––––––––––––––––––––––––––––––––––––––––––––––––
––––––––––––––––––––––––––––––––––––––––––––––––––––––––––––––––––––––––––
––––––––––––––––––––––––––––––––––––––––––––––––––––––––––––––––––––––––––
The result is a reduction of 120 million pounds of CO2 per year, or 1.9% of current emissions from New Yorkers’ commuting. This is approximately equal to the amount of CO2 currently emitted by the homes of 25,000 New Yorkers.20 Scenario 3: What if 5% of New Yorkers who now commute by private car or taxi switched proportionally to all other modes?
Our final scenario explores the impact of switching commuters from private cars and taxis and proportionally onto public and non-motorized transportation modes. (By proportionally, we mean that the uptake in commuting by transit and NMT is in the same proportion as their present commute shares, when not including private autos and taxis.) Table 7 presents the results:
–––––––––––––––––––––––––20 Average residential CO2 emissions estimated based on PlaNYC: Inventory of New York City Greenhouse Gas Emissions, April, 2007, page 7, showing residential greenhouse gas emissions to be 30% of 58.3 million metric tons, or about 17.5 MMT (39 million pounds). Assuming a population of 8.2 million yields per resident CO2 emissions of 4,700 pounds per year. Report available at: nyc.gov/html/om/pdf/ccp_report041007.pdf.
The results of such a commuting modal shift are shown in Table 6:
21 October 2008Transportation AlternativesNew York, NY
Rolling Carbon:Greenhouse Gas Emissions from Commuting in New York City
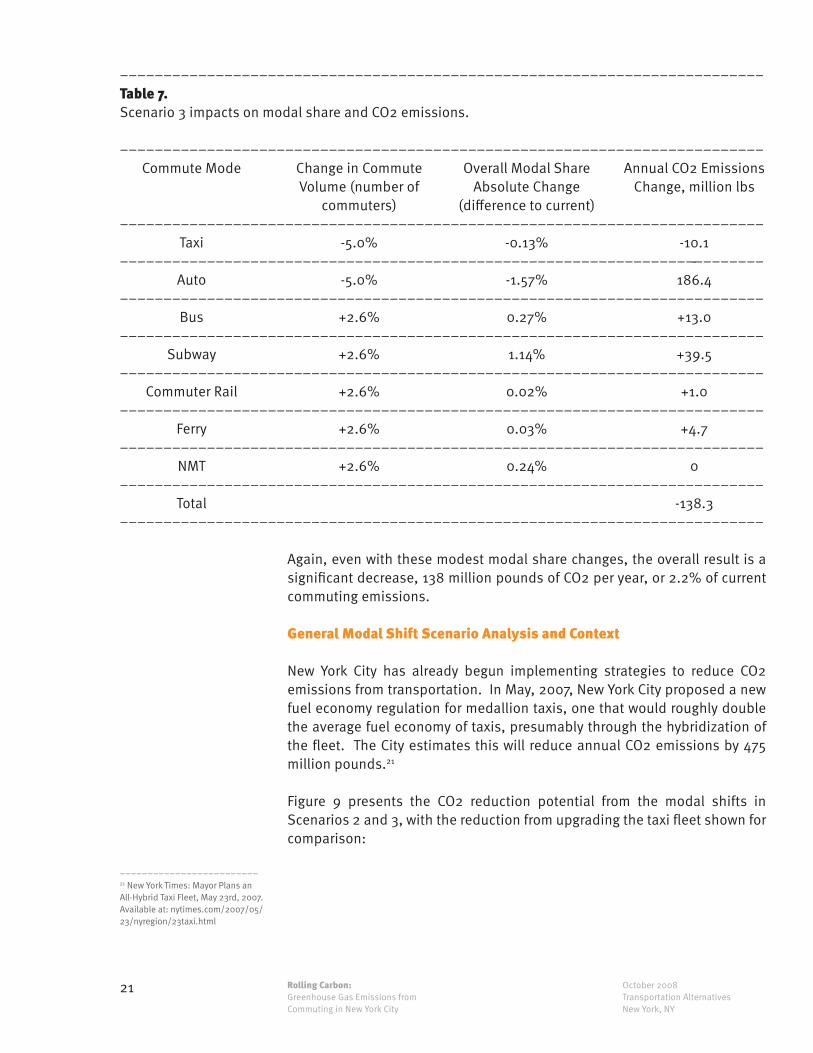
––––––––––––––––––––––––––––––––––––––––––––––––––––––––––––––––––––––––––Table 7.Scenario 3 impacts on modal share and CO2 emissions.
Commute Mode
Taxi
Auto
Bus
Subway
Commuter Rail
Ferry
NMT
Total
Change in CommuteVolume (number of
commuters)
-5.0%
-5.0%
+2.6%
+2.6%
+2.6%
+2.6%
+2.6%
Overall Modal Share Absolute Change
(difference to current)
-0.13%
-1.57%
0.27%
1.14%
0.02%
0.03%
0.24%
Annual CO2 Emissions Change, million lbs
-10.1-
186.4
+13.0
+39.5
+1.0
+4.7
0
-138.3
––––––––––––––––––––––––––––––––––––––––––––––––––––––––––––––––––––––––––
––––––––––––––––––––––––––––––––––––––––––––––––––––––––––––––––––––––––––
––––––––––––––––––––––––––––––––––––––––––––––––––––––––––––––––––––––––––
––––––––––––––––––––––––––––––––––––––––––––––––––––––––––––––––––––––––––
––––––––––––––––––––––––––––––––––––––––––––––––––––––––––––––––––––––––––
––––––––––––––––––––––––––––––––––––––––––––––––––––––––––––––––––––––––––
––––––––––––––––––––––––––––––––––––––––––––––––––––––––––––––––––––––––––
––––––––––––––––––––––––––––––––––––––––––––––––––––––––––––––––––––––––––
––––––––––––––––––––––––––––––––––––––––––––––––––––––––––––––––––––––––––
––––––––––––––––––––––––––––––––––––––––––––––––––––––––––––––––––––––––––
Again, even with these modest modal share changes, the overall result is a significant decrease, 138 million pounds of CO2 per year, or 2.2% of current commuting emissions.
General Modal Shift Scenario Analysis and Context
New York City has already begun implementing strategies to reduce CO2 emissions from transportation. In May, 2007, New York City proposed a new fuel economy regulation for medallion taxis, one that would roughly double the average fuel economy of taxis, presumably through the hybridization of the fleet. The City estimates this will reduce annual CO2 emissions by 475 million pounds.21
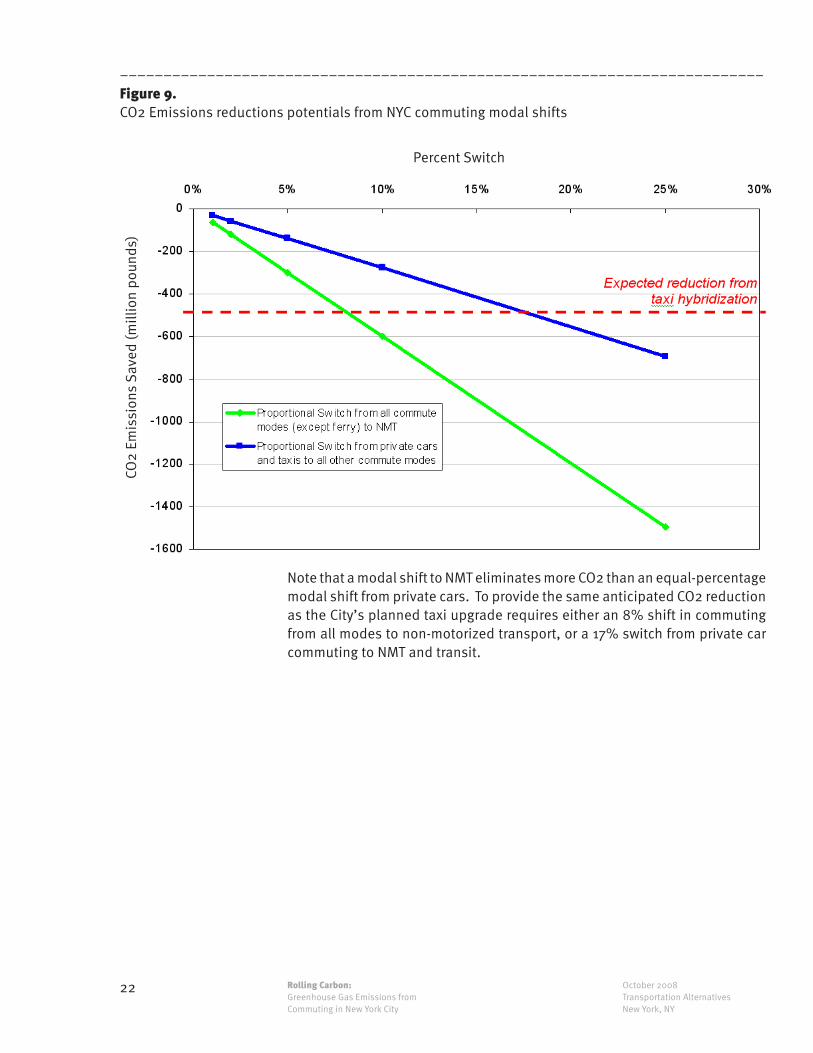
Figure 9 presents the CO2 reduction potential from the modal shifts in Scenarios 2 and 3, with the reduction from upgrading the taxi fleet shown for comparison:
–––––––––––––––––––––––––21 New York Times: Mayor Plans an All-Hybrid Taxi Fleet, May 23rd, 2007. Available at: nytimes.com/2007/05/23/nyregion/23taxi.html
22 October 2008Transportation AlternativesNew York, NY
Rolling Carbon:Greenhouse Gas Emissions from Commuting in New York City
––––––––––––––––––––––––––––––––––––––––––––––––––––––––––––––––––––––––––Figure 9. CO2 Emissions reductions potentials from NYC commuting modal shifts
Percent Switch
CO2
Emis
sion
s Sa
ved
(mill
ion
poun
ds)
Note that a modal shift to NMT eliminates more CO2 than an equal-percentage modal shift from private cars. To provide the same anticipated CO2 reduction as the City’s planned taxi upgrade requires either an 8% shift in commuting from all modes to non-motorized transport, or a 17% switch from private car commuting to NMT and transit.
23 October 2008Transportation AlternativesNew York, NY
Rolling Carbon:Greenhouse Gas Emissions from Commuting in New York City
Conclusions This report began with a detailed analysis of CO2 emissions from ground transportation in New York City, and then addressed impacts, both individual and aggregate, of commuting by New Yorkers. The data not only document that commuting is responsible for a significant portion of the city’s greenhouse gas emissions, but also that opportunities abound to reduce these emissions via modal shifts.
We intend for the report to provide a foundation for progress in two directions. The first direction concerns individual residents’ behavior; understanding the aggregate effect of everyone behaving “like you” can provide a powerful impetus for behavioral shift.
The second direction concerns City policy. As New York City moves to adopt programs to achieve its stated goal of reducing transportation sector greenhouse gas emissions by 45%, citizens and policymakers need to acknowledge and act on the potential to reduce emissions via modal shifts. Other cities are already doing so. Chicago, for example, has set a 2015 goal of having residents use bicycles for at least 5% of all trips less than five miles. Clearly, the findings in this report support establishment of comparable goals for New York City.
Equally clearly, New York City will need to deploy numerous strategies to achieve significant greenhouse gas emissions reductions in the transportation sector. Along with the commuting modal shifts outlined here, such strategies include raising vehicle fuel economy, developing low-carbon fuel sources, and decreasing travel demand through progressive urban planning and development.
24 October 2008Transportation AlternativesNew York, NY
Rolling Carbon:Greenhouse Gas Emissions from Commuting in New York City
Appendix A: Context – Greenhouse Gas Emissions from New York City’s Transportation Sector
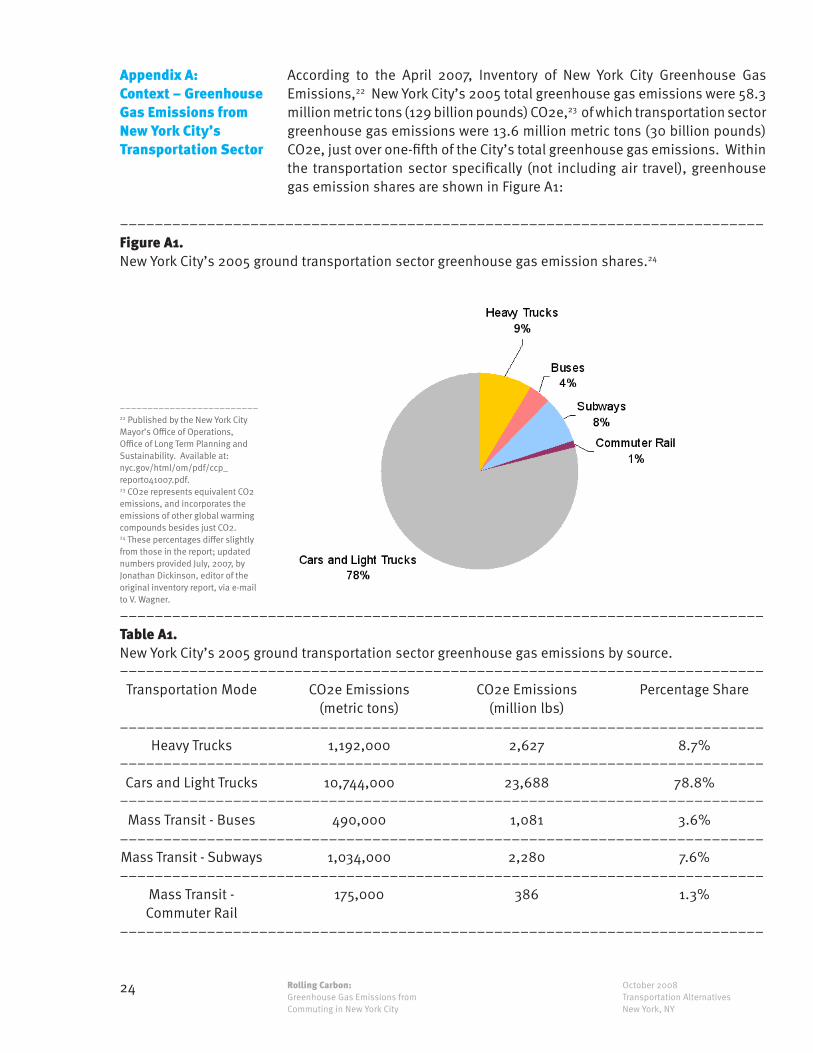
According to the April 2007, Inventory of New York City Greenhouse Gas Emissions,22 New York City’s 2005 total greenhouse gas emissions were 58.3 million metric tons (129 billion pounds) CO2e,23 of which transportation sector greenhouse gas emissions were 13.6 million metric tons (30 billion pounds) CO2e, just over one-fifth of the City’s total greenhouse gas emissions. Within the transportation sector specifically (not including air travel), greenhouse gas emission shares are shown in Figure A1:
––––––––––––––––––––––––––––––––––––––––––––––––––––––––––––––––––––––––––Figure A1. New York City’s 2005 ground transportation sector greenhouse gas emission shares.24
––––––––––––––––––––––––––––––––––––––––––––––––––––––––––––––––––––––––––Table A1.New York City’s 2005 ground transportation sector greenhouse gas emissions by source.
Transportation Mode
Heavy Trucks
Cars and Light Trucks
Mass Transit - Buses
Mass Transit - Subways
Mass Transit - Commuter Rail
CO2e Emissions (metric tons)
1,192,000
10,744,000
490,000
1,034,000
175,000
CO2e Emissions (million lbs)
2,627
23,688
1,081
2,280
386
Percentage Share
8.7%
78.8%
3.6%
7.6%
1.3%
––––––––––––––––––––––––––––––––––––––––––––––––––––––––––––––––––––––––––
––––––––––––––––––––––––––––––––––––––––––––––––––––––––––––––––––––––––––
––––––––––––––––––––––––––––––––––––––––––––––––––––––––––––––––––––––––––
––––––––––––––––––––––––––––––––––––––––––––––––––––––––––––––––––––––––––
––––––––––––––––––––––––––––––––––––––––––––––––––––––––––––––––––––––––––
––––––––––––––––––––––––––––––––––––––––––––––––––––––––––––––––––––––––––
––––––––––––––––––––––––––––––––––––––––––––––––––––––––––––––––––––––––––
–––––––––––––––––––––––––22 Published by the New York City Mayor’s Office of Operations, Office of Long Term Planning and Sustainability. Available at:nyc.gov/html/om/pdf/ccp_report041007.pdf. 23 CO2e represents equivalent CO2 emissions, and incorporates the emissions of other global warming compounds besides just CO2. 24 These percentages differ slightly from those in the report; updated numbers provided July, 2007, by Jonathan Dickinson, editor of the original inventory report, via e-mail to V. Wagner.
25 October 2008Transportation AlternativesNew York, NY
Rolling Carbon:Greenhouse Gas Emissions from Commuting in New York City
Not shown in the above figure and table are greenhouse emissions from bicycling, walking, and other forms of non-motorized transportation (NMT), for the simple reason that they are responsible for zero greenhouse gas emissions.25
As noted in the Introduction, New York City proposes to reduce its overall citywide emissions of greenhouse gases by 30% by 2030. Though transportation is responsible for only about a fifth of the city’s greenhouse gas emissions, reducing emissions from this sector is likely to be a high priority for the city, for several reasons. First, to meet the citywide target of 30%, significant reductions will clearly be required from all sectors. Second, most strategies to reduce transportation emissions have additional societal benefits, such as improved air quality, decreased congestion, and safer streets. Third, the transportation sector presents a number of attractive and even obvious reduction strategies, mostly involving shifts away from the use of private cars.
–––––––––––––––––––––––––25 As mentioned in Part I, this considers in-use emissions only, and excludes “indirect” emissions from vehicle manufacture, maintenance, and disposal.
26 October 2008Transportation AlternativesNew York, NY
Rolling Carbon:Greenhouse Gas Emissions from Commuting in New York City
Appendix B: Methodology
Methodology for Vehicles
OverviewThis section of the appendix presents the analysis performed to estimate tailpipe CO2 emissions from passenger vehicles driving in New York City. The basic equation follows:
Tailpipe CO2 emissions (lbs / mile) = Fuel CO2 coefficient (lbs / gallon) / Vehicle average fuel economy (mpg) (1)
Each fuel’s CO2 coefficient is constant, and is calculated from density and carbon ratio as detailed in Appendix D. The more imposing task is estimating vehicles’ fuel economy in New York City driving conditions.
We performed this estimation via a two-step process. In the first step, we combined federal EPA-published city and highway fuel economy ratings to create a single, composite fuel economy rating for each vehicle or vehicle class. In the second step, we applied a penalty to these ratings to reflect actual performance in New York City’s challenging and unique driving conditions. Accordingly, the fuel economy and CO2 per mile values in this report should be considered specific to New York City and should not be applied to other cities. Detailed notes on each step follow:
Notes on US EPA Fuel Economy RatingsThe EPA publishes fuel economy ratings for all vehicle models for sale in the United States,26 as well as yearly fuel economy trends for the entire US light-duty vehicle fleet.27
The EPA determines its fuel economy values from a laboratory driving test.28 Through Model Year 2007, the driving test used for reporting fuel economy used only moderate speeds and excluded factors such as driving in cold climates, rapid acceleration, and the use of air conditioning that degrade fuel economy of vehicles operating in typical, real-world conditions. To account for this overestimation, since 1984, the EPA’s practice has been to revise the test numbers down by 10% for the city estimate and 22% for the highway estimate.29 These revised numbers are the rounded numbers that are presented as the “sticker” fuel economy values at dealerships. 30
However, even with the standard, downward adjustments, the sticker fuel economy values are still generally higher than what drivers typically achieve. Therefore, beginning with Model Year 2008 vehicles, EPA will incorporate new test conditions into the fuel economy testing that are expected to lower the mpg estimates even further. The expected change is not trivial, according to the agency: “Compared to today’s estimates, the city mpg estimates for the manufacturers of most vehicles will drop by about 12 percent on average, and by as much as 30 percent for some vehicles. The highway mpg estimates will drop on average by about 8 percent, and by as much as 25 percent for some vehicles.”31
–––––––––––––––––––––––––26 Available at: fueleconomy.gov/feg/download.shtml.27 Available at: epa.gov/otaq/fetrends.htm.28 Lab test driving cycle reference info available at: fueleconomy.gov/feg/fe_test_schedules.shtml.29 epa.gov/fueleconomy/420f06069.htm#background_existing.30 Within the EPA’s downloadable data sets, these adjusted, “sticker” fuel economy values are only presented as integers. For the analysis in this report, EPA-adjusted city and highway fuel economy estimates were calculated directly from the unadjusted lab data points within the data sets.31 epa.gov/fueleconomy/420f06069.htm#how.
27 October 2008Transportation AlternativesNew York, NY
Rolling Carbon:Greenhouse Gas Emissions from Commuting in New York City
The new test results were not used in this report, for two reasons. First, while the EPA has provided revised estimates of past model year vehicle fuel economy ratings for individual models, it has not done so for historical fleet and class average data. Second, as described below, an additional fuel economy penalty was applied to the data here to capture the additional degradation on fuel economy caused by New York City’s chronic traffic congestion.
Notes on Overall Fuel Economy CombinationThe EPA also publishes a combined fuel economy rating assuming 55% city driving share and 45% highway driving share.32 This combined fuel economy value is not used here, since the share of driving in New York City done under city conditions exceeds 55%. For this study, we assume that non-taxi private vehicles drive 67% in city conditions and 33% in highway conditions. For taxis, we use an 80/20 split.
Notes on NYC mpg PenaltyAs mentioned above, for data published through Model Year 2007, even the EPA’s standard downward adjustments to the lab test data are not enough to overcome the disparity between its reported fuel economy ratings and actual mpg values. The overestimation is even more severe in New York City, given the frequent start-stop traffic.
For this study, the discrepancy between EPA-reported and NYC real-world driving fuel economies is quantified using driver-reported fuel economy figures.
Taxi drivers surveyed by New York City report achieving an average fuel economy of 13 mpg.33 In contrast, the composite EPA estimate for the Ford Crown Victoria (previously noted as representing 92% of all taxicabs) is 18.3 mpg.34 These data give rise to the following equation:
NYC mpg penalty for taxis = 1 – (13 mpg / 18.3 mpg) = 29% (2)
The result, 29%, is taken to be the NYC mpg penalty for taxis. Because private vehicles typically operate in less-congested conditions, their mpg penalty is presumably less. We posit that the mpg penalty for private autos is 60% as great as that for taxicabs, or 17% of the composite value calculated from the adjusted EPA values.
–––––––––––––––––––––––––32 This combination was preformed using harmonic averaging, as per EPA methodology: fueleconomy.gov/feg/FEG2007intro.pdf, page i. 33 PlaNYC: Inventory of New York City Greenhouse Gas Emissions, page 39. Available at: nyc.gov/html/om/pdf/ccp_report041007.pdf. 34 As noted, this composite for taxis assumes 80% city driving and 20% highway driving.
28 October 2008Transportation AlternativesNew York, NY
Rolling Carbon:Greenhouse Gas Emissions from Commuting in New York City
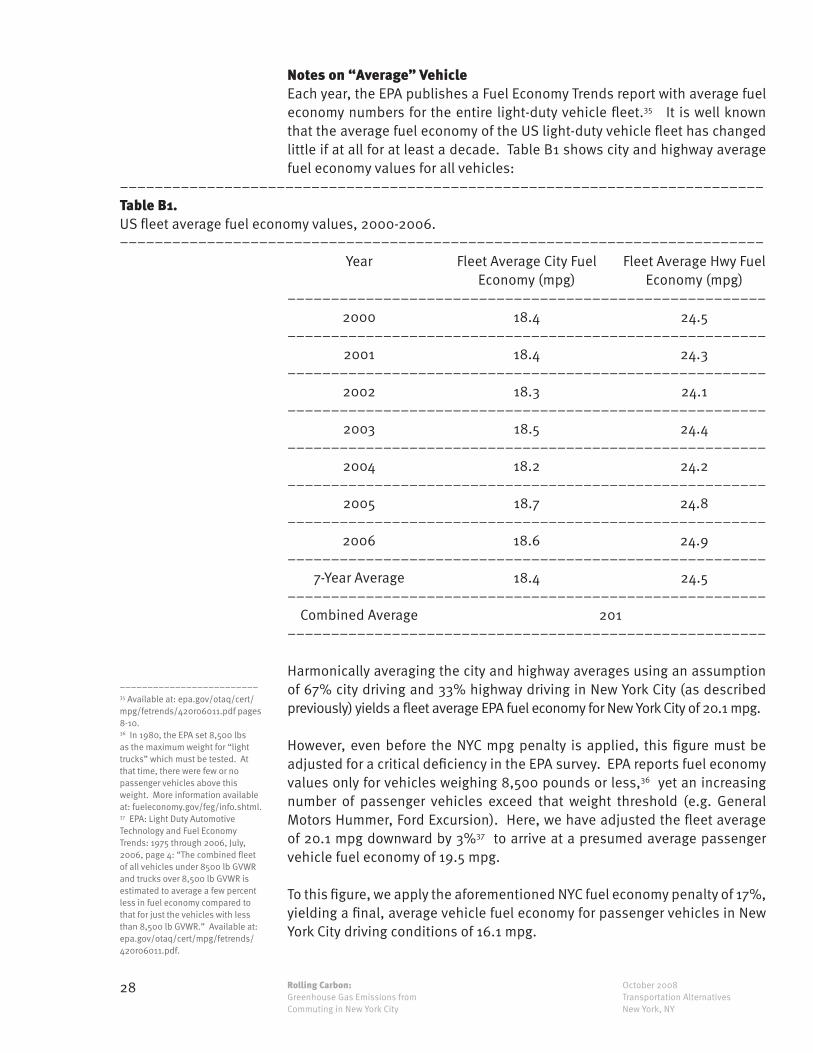
Notes on “Average” VehicleEach year, the EPA publishes a Fuel Economy Trends report with average fuel economy numbers for the entire light-duty vehicle fleet.35 It is well known that the average fuel economy of the US light-duty vehicle fleet has changed little if at all for at least a decade. Table B1 shows city and highway average fuel economy values for all vehicles:
––––––––––––––––––––––––––––––––––––––––––––––––––––––––––––––––––––––––––Table B1.US fleet average fuel economy values, 2000-2006.
Year
2000
2001
2002
2003
2004
2005
2006
7-Year Average
Combined Average
Fleet Average City Fuel Economy (mpg)
18.4
18.4
18.3
18.5
18.2
18.7
18.6
18.4
Fleet Average Hwy Fuel Economy (mpg)
24.5
24.3
24.1
24.4
24.2
24.8
24.9
24.5
––––––––––––––––––––––––––––––––––––––––––––––––––––––––––––––––––––––––––
–––––––––––––––––––––––––––––––––––––––––––––––––––––––
–––––––––––––––––––––––––––––––––––––––––––––––––––––––
–––––––––––––––––––––––––––––––––––––––––––––––––––––––
–––––––––––––––––––––––––––––––––––––––––––––––––––––––
–––––––––––––––––––––––––––––––––––––––––––––––––––––––
–––––––––––––––––––––––––––––––––––––––––––––––––––––––
–––––––––––––––––––––––––––––––––––––––––––––––––––––––
–––––––––––––––––––––––––––––––––––––––––––––––––––––––
–––––––––––––––––––––––––––––––––––––––––––––––––––––––201
Harmonically averaging the city and highway averages using an assumption of 67% city driving and 33% highway driving in New York City (as described previously) yields a fleet average EPA fuel economy for New York City of 20.1 mpg.
However, even before the NYC mpg penalty is applied, this figure must be adjusted for a critical deficiency in the EPA survey. EPA reports fuel economy values only for vehicles weighing 8,500 pounds or less,36 yet an increasing number of passenger vehicles exceed that weight threshold (e.g. General Motors Hummer, Ford Excursion). Here, we have adjusted the fleet average of 20.1 mpg downward by 3%37 to arrive at a presumed average passenger vehicle fuel economy of 19.5 mpg.
To this figure, we apply the aforementioned NYC fuel economy penalty of 17%, yielding a final, average vehicle fuel economy for passenger vehicles in New York City driving conditions of 16.1 mpg.
–––––––––––––––––––––––––35 Available at: epa.gov/otaq/cert/mpg/fetrends/420r06011.pdf pages 8-10.36 In 1980, the EPA set 8,500 lbs as the maximum weight for “light trucks” which must be tested. At that time, there were few or no passenger vehicles above this weight. More information available at: fueleconomy.gov/feg/info.shtml. 37 EPA: Light Duty Automotive Technology and Fuel Economy Trends: 1975 through 2006, July, 2006, page 4: “The combined fleet of all vehicles under 8500 lb GVWR and trucks over 8,500 lb GVWR is estimated to average a few percent less in fuel economy compared to that for just the vehicles with less than 8,500 lb GVWR.” Available at: epa.gov/otaq/cert/mpg/fetrends/420r06011.pdf.
–––––––––––––––––––––––––––––––––––––––––––––––––––––––
29 October 2008Transportation AlternativesNew York, NY
Rolling Carbon:Greenhouse Gas Emissions from Commuting in New York City
EPA City Estimate
(mpg)
18.4
-
17.2
59.9
13.7
EPA Hwy Estimate
(mpg)
24.5
-
25.0
50.5
17.9
Assumed City / Hwy
Driving Mix
67% / 33%
-
80% / 20%
67% / 33%
67% / 33%
Combined, Unadjusted
NYC Fuel Economy
20.09
19.49
18.31
56.44
14.91
NYC mpg Penalty Applied
17%
17%
29%
17%
17%
Final, Estimated NYC Fuel Economy
-
16.1
13
46.6
12.3
Vehicle
EPA-rated light-duty vehicles, all, 2000-2006
Average vehicle, including -3% FE adjustment to account for vehicles >8500 lbs
Ford Crown Victoria,2004-2007
Toyota Prius,2004-2007
Cadillac Escalade,2004-2007
––––––––––––––––––––––––––––––––––––––––––––––––––––––––––––––––––––––––––
––––––––––––––––––––––––––––––––––––––––––––––––––––––––––––––––––––––––––
––––––––––––––––––––––––––––––––––––––––––––––––––––––––––––––––––––––––––
––––––––––––––––––––––––––––––––––––––––––––––––––––––––––––––––––––––––––
––––––––––––––––––––––––––––––––––––––––––––––––––––––––––––––––––––––––––
––––––––––––––––––––––––––––––––––––––––––––––––––––––––––––––––––––––––––
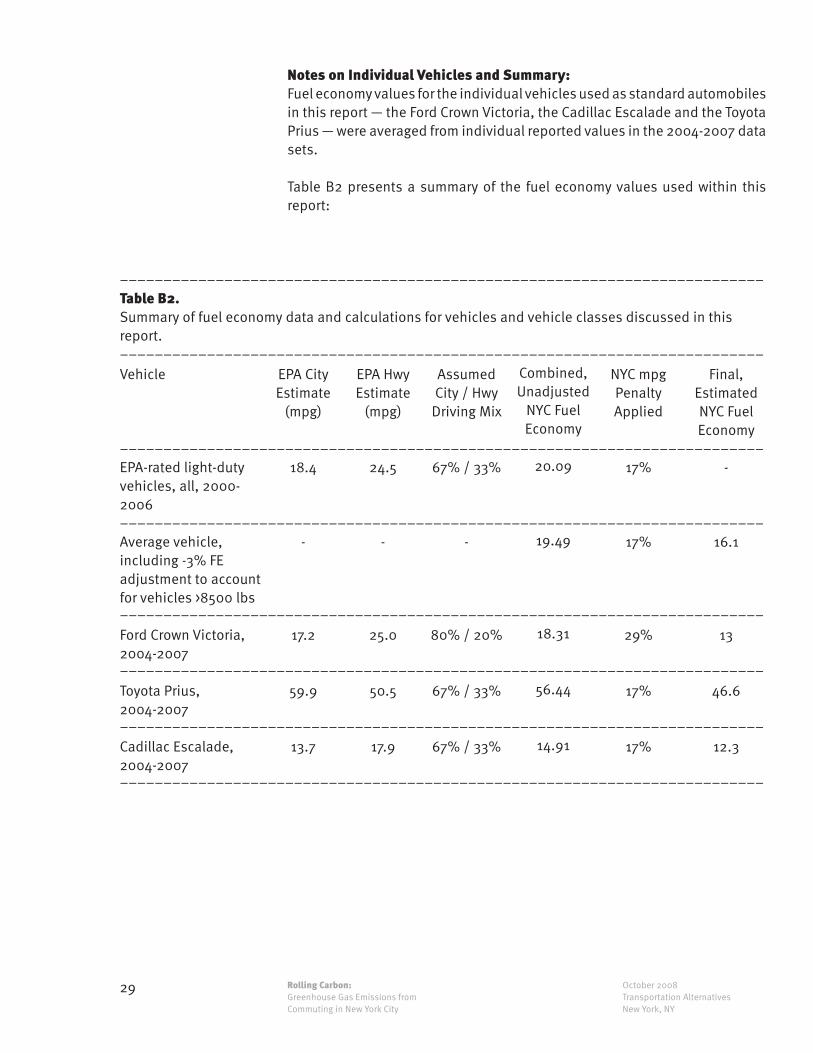
––––––––––––––––––––––––––––––––––––––––––––––––––––––––––––––––––––––––––Table B2.Summary of fuel economy data and calculations for vehicles and vehicle classes discussed in this report.––––––––––––––––––––––––––––––––––––––––––––––––––––––––––––––––––––––––––
Notes on Individual Vehicles and Summary:Fuel economy values for the individual vehicles used as standard automobiles in this report — the Ford Crown Victoria, the Cadillac Escalade and the Toyota Prius — were averaged from individual reported values in the 2004-2007 data sets.
Table B2 presents a summary of the fuel economy values used within this report:

30 October 2008Transportation AlternativesNew York, NY
Rolling Carbon:Greenhouse Gas Emissions from Commuting in New York City
Methodology for BusesAs mentioned in the body of this report, CO2 emissions for public transportation are most appropriately calculated in a system-wide context. We did this by determining the total CO2 emitted by each system based on published energy consumption data, and dividing by passenger ridership data. The result is estimated CO2 per passenger-mile.
The Metropolitan Transportation Authority provided diesel fuel consumption data for diesel and diesel-electric buses in New York City, as well as vehicle miles traveled (VMT) for diesel, diesel-electric, and CNG buses.38 (The MTA did not provide CNG fuel consumption data, so we estimated CNG consumption based on a published figure for the fuel economy of CNG buses in NYC.39 )
As shown in Table B3, bus CO2 emissions were calculated directly from fuel use (for diesel and diesel-electric hybrid) or indirectly from fuel economy and VMT data (for CNG):
––––––––––––––––––––––––––––––––––––––––––––––––––––––––––––––––––––––––––Table B3.CO2 emissions from MTA buses in New York City, 2005
Bus Type
Diesel
Diesel-ElectricHybrid
CNG
All MTA Buses
VMT / year
97,200,000
9,200,000
13,200,000
119,600,000
Fuel Used (diesel gallons or diesel gallon equivalent
(dge))
37,900,000
2,900,000
7,700,000
CO2 Fuel Coefficient (lbs /
gallon)40
22.14
22.14
16.24
Fuel Economy (mpg or mpdge)
2.57 (calculated)
3.20 (calculated)
1.70 (assumed)
CO2 Emissions (lbs / year)
838,200,000
63,800,000
125,900,000
1,028,000,000
–––––––––––––––––––––––––––––––––––––––––––––––––––––––––––––––––––––––––
––––––––––––––––––––––––––––––––––––––––––––––––––––––––––––––––––––––––––
––––––––––––––––––––––––––––––––––––––––––––––––––––––––––––––––––––––––––
––––––––––––––––––––––––––––––––––––––––––––––––––––––––––––––––––––––––––
––––––––––––––––––––––––––––––––––––––––––––––––––––––––––––––––––––––––––
––––––––––––––––––––––––––––––––––––––––––––––––––––––––––––––––––––––––––
The New York Metropolitan Transportation Council (NYMTC) reports that New York City buses carried 1,973 million passenger-miles in 2005.41 Assuming that ridership on each of the three bus types was proportional to VMT, total CO2 emissions data in the previous table can be divided by the respective passenger-miles to yield CO2 per passenger-mile, as follows:
–––––––––––––––––––––––––38 Data from MTA NYC Transit 2006 Forecast: Diesel Fuel and Compressed Natural Gas, provided May, 2007, by Jesse Samberg of the MTA via mail to C. Komanoff.39 National Renewable Energy Laboratory: New York City Transit Hybrid and CNG Transit Buses, November, 2006, page vii. Available at: nrel.gov/vehiclesandfuels/fleettest/pdfs/40125.pdf.40 Calculated in Appendix D.41 NYMTC: Regional Transportation at a Glance, 2005. Available at: nymtc.org/files/2005_Transportation_Statistics_at_a_Glance.pdf.
31 October 2008Transportation AlternativesNew York, NY
Rolling Carbon:Greenhouse Gas Emissions from Commuting in New York City
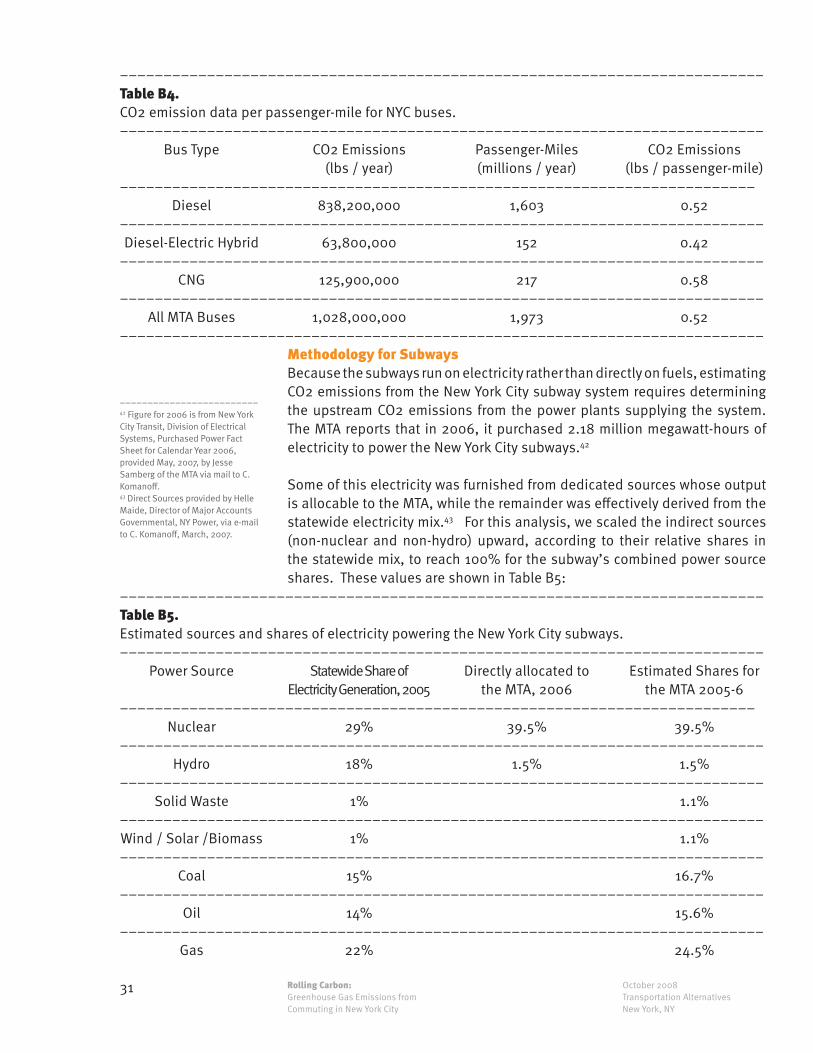
––––––––––––––––––––––––––––––––––––––––––––––––––––––––––––––––––––––––––Table B4.CO2 emission data per passenger-mile for NYC buses.
Bus Type
Diesel
Diesel-Electric Hybrid
CNG
All MTA Buses
CO2 Emissions (lbs / year)
838,200,000
63,800,000
125,900,000
1,028,000,000
Passenger-Miles (millions / year)
1,603
152
217
1,973
CO2 Emissions (lbs / passenger-mile)
0.52
0.42
0.58
0.52
–––––––––––––––––––––––––––––––––––––––––––––––––––––––––––––––––––––––––
––––––––––––––––––––––––––––––––––––––––––––––––––––––––––––––––––––––––––
––––––––––––––––––––––––––––––––––––––––––––––––––––––––––––––––––––––––––
––––––––––––––––––––––––––––––––––––––––––––––––––––––––––––––––––––––––––
––––––––––––––––––––––––––––––––––––––––––––––––––––––––––––––––––––––––––
––––––––––––––––––––––––––––––––––––––––––––––––––––––––––––––––––––––––––
Methodology for SubwaysBecause the subways run on electricity rather than directly on fuels, estimating CO2 emissions from the New York City subway system requires determining the upstream CO2 emissions from the power plants supplying the system. The MTA reports that in 2006, it purchased 2.18 million megawatt-hours of electricity to power the New York City subways.42
Some of this electricity was furnished from dedicated sources whose output is allocable to the MTA, while the remainder was effectively derived from the statewide electricity mix.43 For this analysis, we scaled the indirect sources (non-nuclear and non-hydro) upward, according to their relative shares in the statewide mix, to reach 100% for the subway’s combined power source shares. These values are shown in Table B5:
––––––––––––––––––––––––––––––––––––––––––––––––––––––––––––––––––––––––––Table B5.Estimated sources and shares of electricity powering the New York City subways.
Power Source
Nuclear
Hydro
Solid Waste
Wind / Solar /Biomass
Coal
Oil
Gas
Statewide Share of Electricity Generation, 2005
29%
18%
1%
1%
15%
14%
22%
Directly allocated to the MTA, 2006
39.5%
1.5%
Estimated Shares for the MTA 2005-6
39.5%
1.5%
1.1%
1.1%
16.7%
15.6%
24.5%
–––––––––––––––––––––––––––––––––––––––––––––––––––––––––––––––––––––––––
––––––––––––––––––––––––––––––––––––––––––––––––––––––––––––––––––––––––––
––––––––––––––––––––––––––––––––––––––––––––––––––––––––––––––––––––––––––
––––––––––––––––––––––––––––––––––––––––––––––––––––––––––––––––––––––––––
––––––––––––––––––––––––––––––––––––––––––––––––––––––––––––––––––––––––––
––––––––––––––––––––––––––––––––––––––––––––––––––––––––––––––––––––––––––
––––––––––––––––––––––––––––––––––––––––––––––––––––––––––––––––––––––––––
––––––––––––––––––––––––––––––––––––––––––––––––––––––––––––––––––––––––––
–––––––––––––––––––––––––42 Figure for 2006 is from New York City Transit, Division of Electrical Systems, Purchased Power Fact Sheet for Calendar Year 2006, provided May, 2007, by Jesse Samberg of the MTA via mail to C. Komanoff.43 Direct Sources provided by Helle Maide, Director of Major Accounts Governmental, NY Power, via e-mail to C. Komanoff, March, 2007.
32 October 2008Transportation AlternativesNew York, NY
Rolling Carbon:Greenhouse Gas Emissions from Commuting in New York City
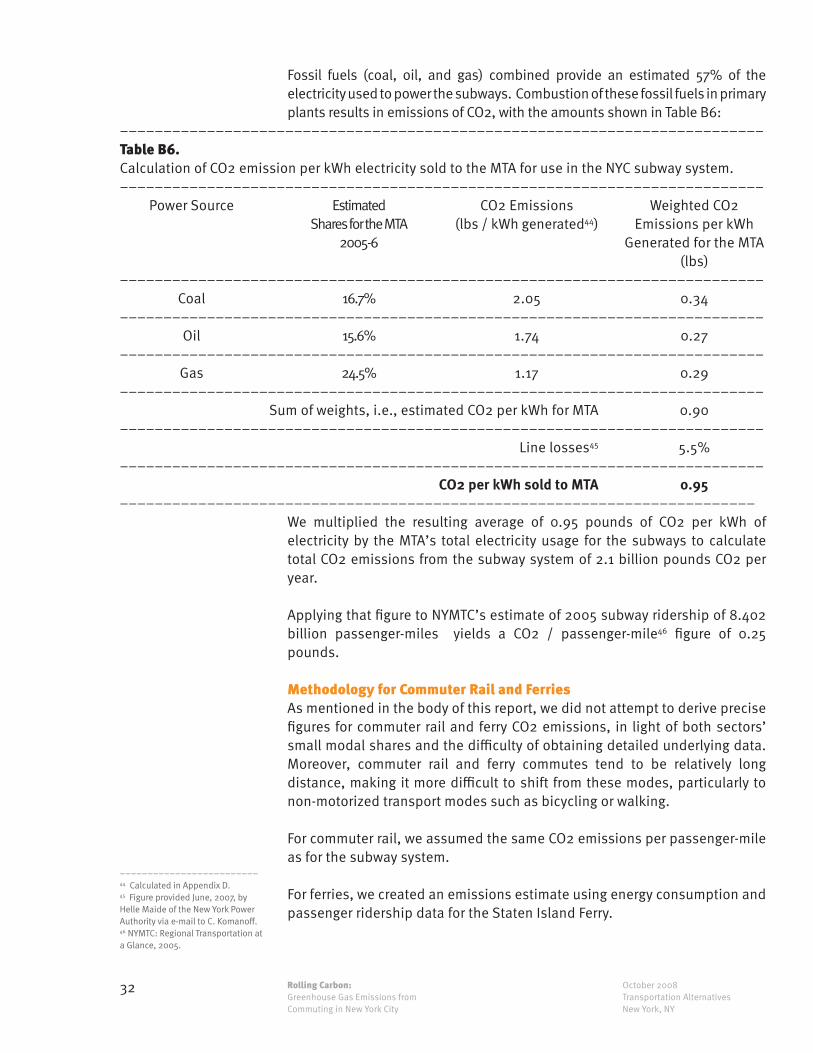
Fossil fuels (coal, oil, and gas) combined provide an estimated 57% of the electricity used to power the subways. Combustion of these fossil fuels in primary plants results in emissions of CO2, with the amounts shown in Table B6:
––––––––––––––––––––––––––––––––––––––––––––––––––––––––––––––––––––––––––Table B6.Calculation of CO2 emission per kWh electricity sold to the MTA for use in the NYC subway system.
Power Source
Coal
Oil
Gas
EstimatedShares for the MTA
2005-6
16.7%
15.6%
24.5%
CO2 Emissions (lbs / kWh generated44)
2.05
1.74
1.17
Weighted CO2 Emissions per kWh
Generated for the MTA (lbs)
0.34
0.27
0.29
0.90
5.5%
0.95–––––––––––––––––––––––––––––––––––––––––––––––––––––––––––––––––––––––––
––––––––––––––––––––––––––––––––––––––––––––––––––––––––––––––––––––––––––
––––––––––––––––––––––––––––––––––––––––––––––––––––––––––––––––––––––––––
––––––––––––––––––––––––––––––––––––––––––––––––––––––––––––––––––––––––––
––––––––––––––––––––––––––––––––––––––––––––––––––––––––––––––––––––––––––
––––––––––––––––––––––––––––––––––––––––––––––––––––––––––––––––––––––––––
––––––––––––––––––––––––––––––––––––––––––––––––––––––––––––––––––––––––––
––––––––––––––––––––––––––––––––––––––––––––––––––––––––––––––––––––––––––
Sum of weights, i.e., estimated CO2 per kWh for MTA
Line losses45
CO2 per kWh sold to MTA
We multiplied the resulting average of 0.95 pounds of CO2 per kWh of electricity by the MTA’s total electricity usage for the subways to calculate total CO2 emissions from the subway system of 2.1 billion pounds CO2 per year.
Applying that figure to NYMTC’s estimate of 2005 subway ridership of 8.402 billion passenger-miles yields a CO2 / passenger-mile46 figure of 0.25 pounds.
Methodology for Commuter Rail and FerriesAs mentioned in the body of this report, we did not attempt to derive precise figures for commuter rail and ferry CO2 emissions, in light of both sectors’ small modal shares and the difficulty of obtaining detailed underlying data. Moreover, commuter rail and ferry commutes tend to be relatively long distance, making it more difficult to shift from these modes, particularly to non-motorized transport modes such as bicycling or walking.
For commuter rail, we assumed the same CO2 emissions per passenger-mile as for the subway system.
For ferries, we created an emissions estimate using energy consumption and passenger ridership data for the Staten Island Ferry.
–––––––––––––––––––––––––44 Calculated in Appendix D. 45 Figure provided June, 2007, by Helle Maide of the New York Power Authority via e-mail to C. Komanoff. 46 NYMTC: Regional Transportation at a Glance, 2005.
33 October 2008Transportation AlternativesNew York, NY
Rolling Carbon:Greenhouse Gas Emissions from Commuting in New York City
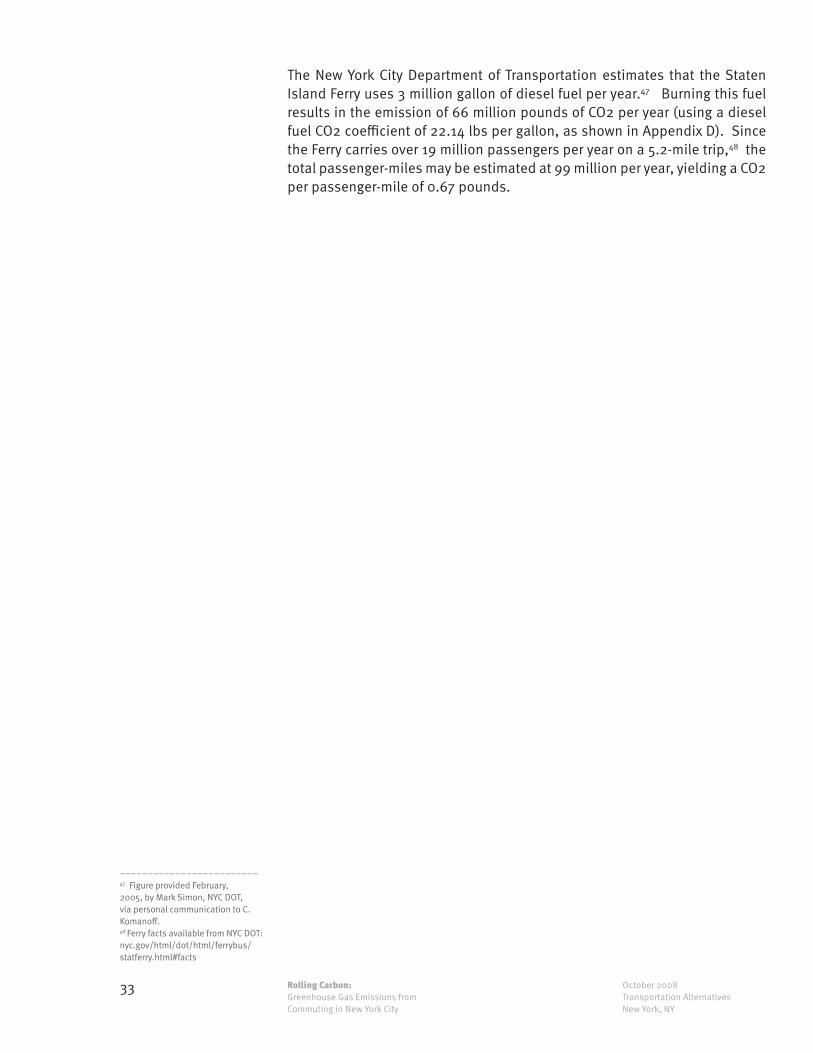
The New York City Department of Transportation estimates that the Staten Island Ferry uses 3 million gallon of diesel fuel per year.47 Burning this fuel results in the emission of 66 million pounds of CO2 per year (using a diesel fuel CO2 coefficient of 22.14 lbs per gallon, as shown in Appendix D). Since the Ferry carries over 19 million passengers per year on a 5.2-mile trip,48 the total passenger-miles may be estimated at 99 million per year, yielding a CO2 per passenger-mile of 0.67 pounds.
–––––––––––––––––––––––––47 Figure provided February, 2005, by Mark Simon, NYC DOT, via personal communication to C. Komanoff.48 Ferry facts available from NYC DOT: nyc.gov/html/dot/html/ferrybus/statferry.html#facts
34 October 2008Transportation AlternativesNew York, NY
Rolling Carbon:Greenhouse Gas Emissions from Commuting in New York City
Appendix C: Commuter Survey Data
Our starting point for commuting data is the 2000 US Census Journey-to-Work and Census Transportation Planning Package.49 We parsed out all trips whose purpose was either “Home to Work” or “Work to Home,” then aggregated by mode. This data is shown in Table C1:
–––––––––––––––––––––––––49 Select data provided by Bruce Schaller to C. Komanoff April, 2007. Original data available at: www.fhwa.dot.gov/ctpp/.
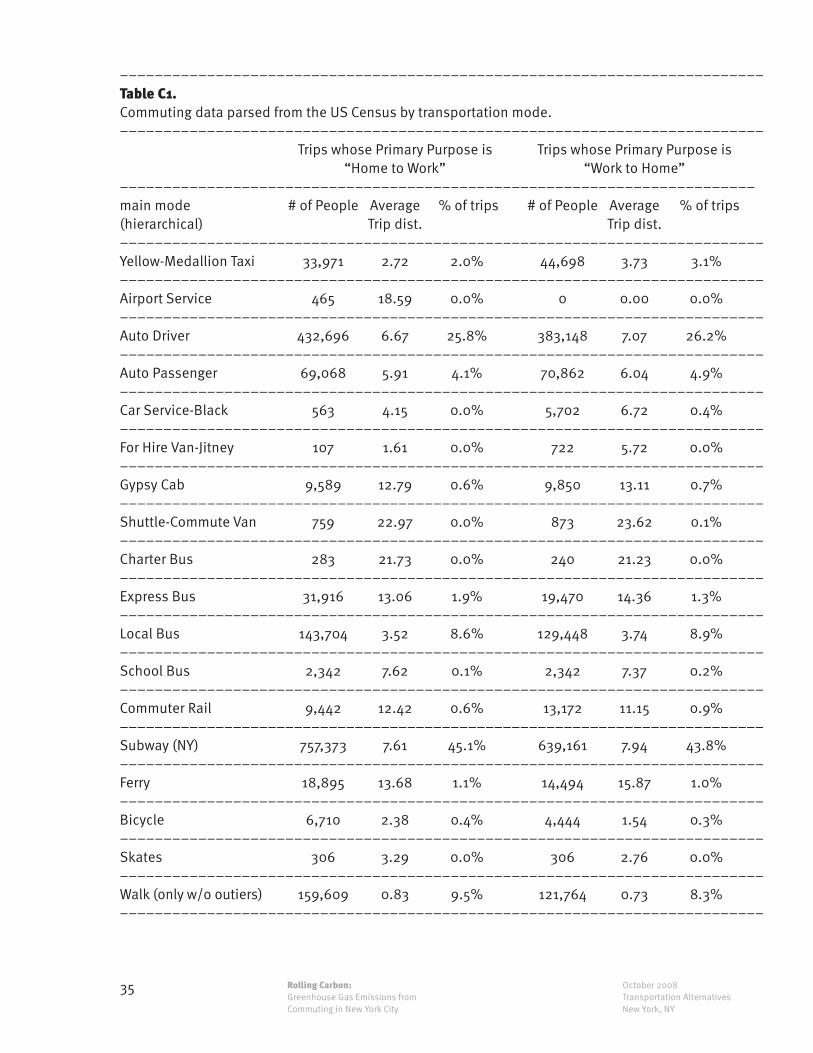
35 October 2008Transportation AlternativesNew York, NY
Rolling Carbon:Greenhouse Gas Emissions from Commuting in New York City
––––––––––––––––––––––––––––––––––––––––––––––––––––––––––––––––––––––––––Table C1.Commuting data parsed from the US Census by transportation mode.
main mode (hierarchical)
Yellow-Medallion Taxi
Airport Service
Auto Driver
Auto Passenger
Car Service-Black
For Hire Van-Jitney
Gypsy Cab
Shuttle-Commute Van
Charter Bus
Express Bus
Local Bus
School Bus
Commuter Rail
Subway (NY)
Ferry
Bicycle
Skates
Walk (only w/o outiers)
–––––––––––––––––––––––––––––––––––––––––––––––––––––––––––––––––––––––––
––––––––––––––––––––––––––––––––––––––––––––––––––––––––––––––––––––––––––
––––––––––––––––––––––––––––––––––––––––––––––––––––––––––––––––––––––––––
––––––––––––––––––––––––––––––––––––––––––––––––––––––––––––––––––––––––––
––––––––––––––––––––––––––––––––––––––––––––––––––––––––––––––––––––––––––
––––––––––––––––––––––––––––––––––––––––––––––––––––––––––––––––––––––––––Trips whose Primary Purpose is
“Home to Work”Trips whose Primary Purpose is
“Work to Home”
# of People
33,971
465
432,696
69,068
563
107
9,589
759
283
31,916
143,704
2,342
9,442
757,373
18,895
6,710
306
159,609
% of trips
2.0%
0.0%
25.8%
4.1%
0.0%
0.0%
0.6%
0.0%
0.0%
1.9%
8.6%
0.1%
0.6%
45.1%
1.1%
0.4%
0.0%
9.5%
Average Trip dist.
2.72
18.59
6.67
5.91
4.15
1.61
12.79
22.97
21.73
13.06
3.52
7.62
12.42
7.61
13.68
2.38
3.29
0.83
# of People
44,698
0
383,148
70,862
5,702
722
9,850
873
240
19,470
129,448
2,342
13,172
639,161
14,494
4,444
306
121,764
% of trips
3.1%
0.0%
26.2%
4.9%
0.4%
0.0%
0.7%
0.1%
0.0%
1.3%
8.9%
0.2%
0.9%
43.8%
1.0%
0.3%
0.0%
8.3%
Average Trip dist.
3.73
0.00
7.07
6.04
6.72
5.72
13.11
23.62
21.23
14.36
3.74
7.37
11.15
7.94
15.87
1.54
2.76
0.73
––––––––––––––––––––––––––––––––––––––––––––––––––––––––––––––––––––––––––
––––––––––––––––––––––––––––––––––––––––––––––––––––––––––––––––––––––––––
––––––––––––––––––––––––––––––––––––––––––––––––––––––––––––––––––––––––––
––––––––––––––––––––––––––––––––––––––––––––––––––––––––––––––––––––––––––
––––––––––––––––––––––––––––––––––––––––––––––––––––––––––––––––––––––––––
––––––––––––––––––––––––––––––––––––––––––––––––––––––––––––––––––––––––––
––––––––––––––––––––––––––––––––––––––––––––––––––––––––––––––––––––––––––
––––––––––––––––––––––––––––––––––––––––––––––––––––––––––––––––––––––––––
––––––––––––––––––––––––––––––––––––––––––––––––––––––––––––––––––––––––––
––––––––––––––––––––––––––––––––––––––––––––––––––––––––––––––––––––––––––
––––––––––––––––––––––––––––––––––––––––––––––––––––––––––––––––––––––––––
––––––––––––––––––––––––––––––––––––––––––––––––––––––––––––––––––––––––––
––––––––––––––––––––––––––––––––––––––––––––––––––––––––––––––––––––––––––
––––––––––––––––––––––––––––––––––––––––––––––––––––––––––––––––––––––––––
––––––––––––––––––––––––––––––––––––––––––––––––––––––––––––––––––––––––––
––––––––––––––––––––––––––––––––––––––––––––––––––––––––––––––––––––––––––
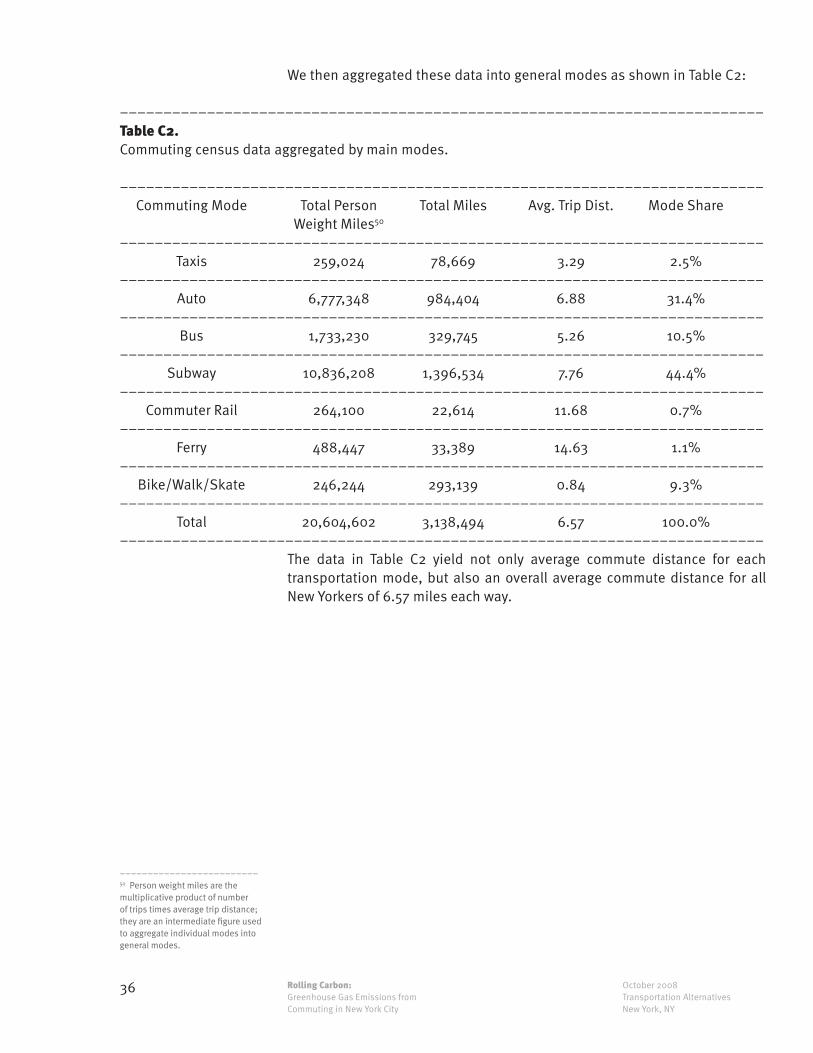
36 October 2008Transportation AlternativesNew York, NY
Rolling Carbon:Greenhouse Gas Emissions from Commuting in New York City
We then aggregated these data into general modes as shown in Table C2:
––––––––––––––––––––––––––––––––––––––––––––––––––––––––––––––––––––––––––Table C2.Commuting census data aggregated by main modes.
Commuting Mode
Taxis
Auto
Bus
Subway
Commuter Rail
Ferry
Bike/Walk/Skate
Total
Total Person Weight Miles50
259,024
6,777,348
1,733,230
10,836,208
264,100
488,447
246,244
20,604,602
Total Miles
78,669
984,404
329,745
1,396,534
22,614
33,389
293,139
3,138,494
Avg. Trip Dist.
3.29
6.88
5.26
7.76
11.68
14.63
0.84
6.57
Mode Share
2.5%
31.4%
10.5%
44.4%
0.7%
1.1%
9.3%
100.0%
––––––––––––––––––––––––––––––––––––––––––––––––––––––––––––––––––––––––––
––––––––––––––––––––––––––––––––––––––––––––––––––––––––––––––––––––––––––
––––––––––––––––––––––––––––––––––––––––––––––––––––––––––––––––––––––––––
––––––––––––––––––––––––––––––––––––––––––––––––––––––––––––––––––––––––––
––––––––––––––––––––––––––––––––––––––––––––––––––––––––––––––––––––––––––
––––––––––––––––––––––––––––––––––––––––––––––––––––––––––––––––––––––––––
––––––––––––––––––––––––––––––––––––––––––––––––––––––––––––––––––––––––––
––––––––––––––––––––––––––––––––––––––––––––––––––––––––––––––––––––––––––
––––––––––––––––––––––––––––––––––––––––––––––––––––––––––––––––––––––––––
––––––––––––––––––––––––––––––––––––––––––––––––––––––––––––––––––––––––––The data in Table C2 yield not only average commute distance for each transportation mode, but also an overall average commute distance for all New Yorkers of 6.57 miles each way.
–––––––––––––––––––––––––50 Person weight miles are the multiplicative product of number of trips times average trip distance; they are an intermediate figure used to aggregate individual modes into general modes.
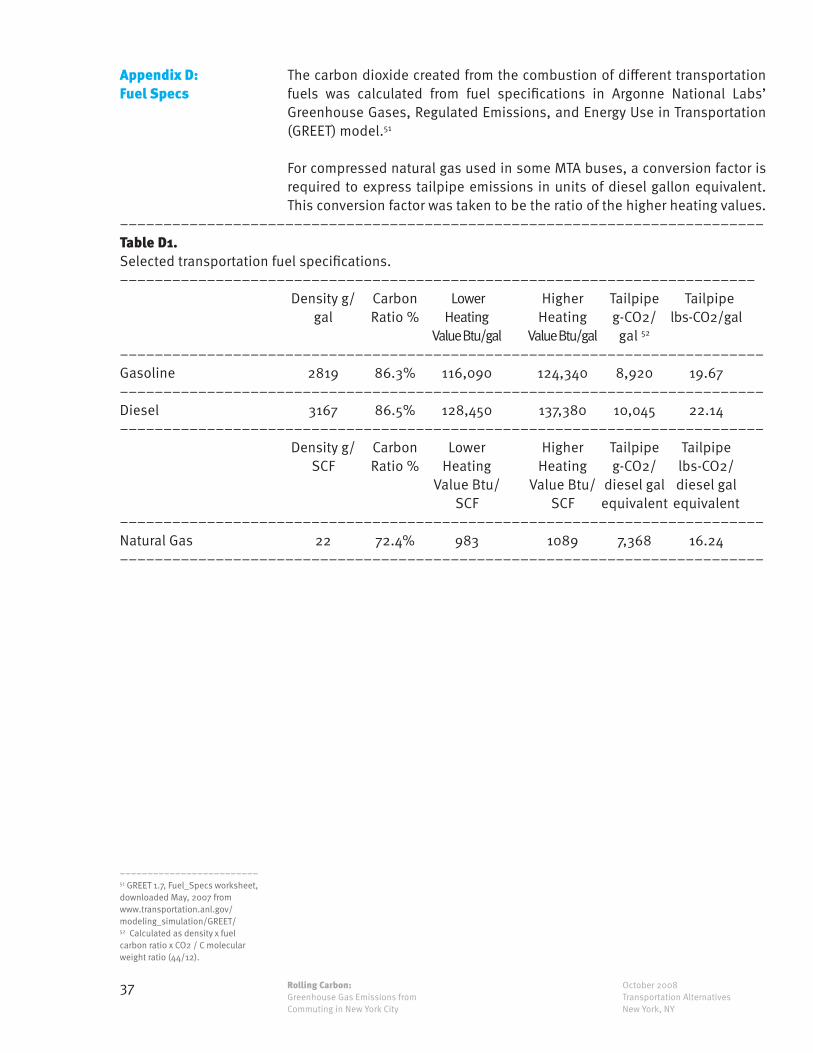
37 October 2008Transportation AlternativesNew York, NY
Rolling Carbon:Greenhouse Gas Emissions from Commuting in New York City
Appendix D: Fuel Specs
The carbon dioxide created from the combustion of different transportation fuels was calculated from fuel specifications in Argonne National Labs’ Greenhouse Gases, Regulated Emissions, and Energy Use in Transportation (GREET) model.51
For compressed natural gas used in some MTA buses, a conversion factor is required to express tailpipe emissions in units of diesel gallon equivalent. This conversion factor was taken to be the ratio of the higher heating values.
––––––––––––––––––––––––––––––––––––––––––––––––––––––––––––––––––––––––––Table D1.Selected transportation fuel specifications.
Gasoline
Diesel
Natural Gas
–––––––––––––––––––––––––––––––––––––––––––––––––––––––––––––––––––––––––
––––––––––––––––––––––––––––––––––––––––––––––––––––––––––––––––––––––––––
––––––––––––––––––––––––––––––––––––––––––––––––––––––––––––––––––––––––––
Density g/gal
2819
3167
Density g/SCF
22
Lower Heating
Value Btu/gal
116,090
128,450
Lower Heating
Value Btu/SCF
983
Carbon Ratio %
86.3%
86.5%
Carbon Ratio %
72.4%
Higher Heating
Value Btu/gal
124,340
137,380
Higher Heating
Value Btu/SCF
1089
Tailpipe lbs-CO2/gal
19.67
22.14
Tailpipe lbs-CO2/diesel gal equivalent
16.24
Tailpipe g-CO2/gal 52
8,920
10,045
Tailpipe g-CO2/
diesel gal equivalent
7,368
––––––––––––––––––––––––––––––––––––––––––––––––––––––––––––––––––––––––––
––––––––––––––––––––––––––––––––––––––––––––––––––––––––––––––––––––––––––
––––––––––––––––––––––––––––––––––––––––––––––––––––––––––––––––––––––––––
–––––––––––––––––––––––––51 GREET 1.7, Fuel_Specs worksheet, downloaded May, 2007 from www.transportation.anl.gov/modeling_simulation/GREET/ 52 Calculated as density x fuel carbon ratio x CO2 / C molecular weight ratio (44/12).
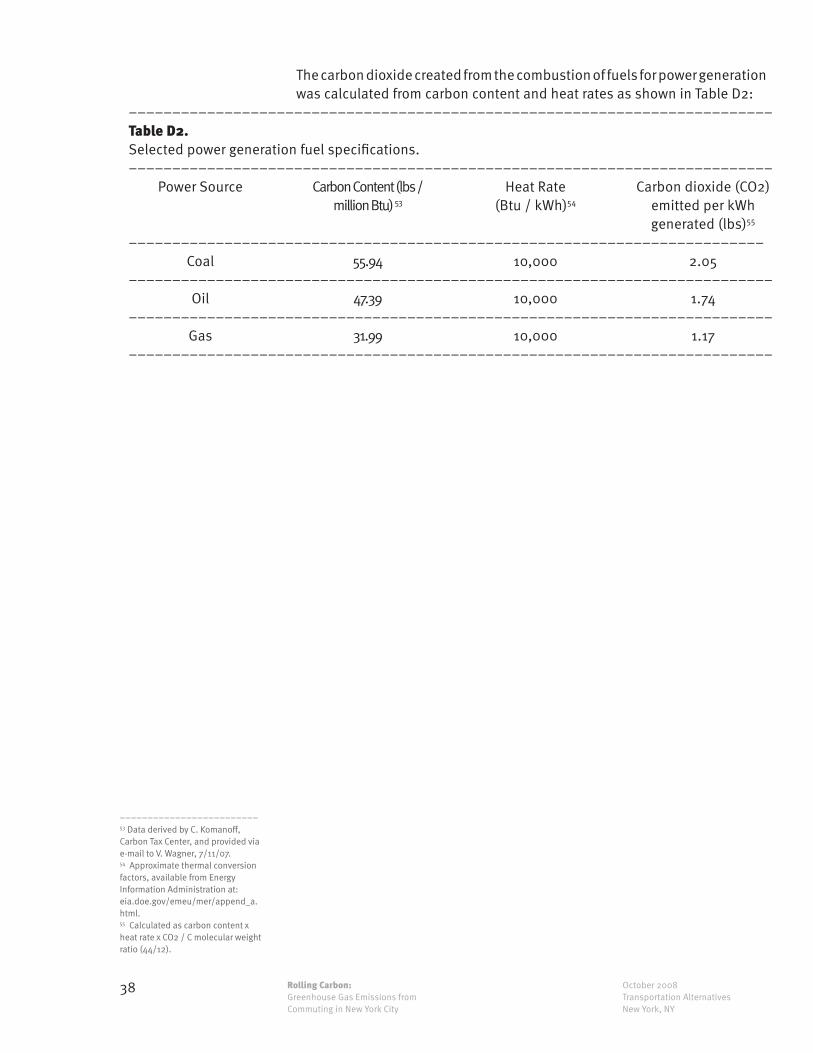
38 October 2008Transportation AlternativesNew York, NY
Rolling Carbon:Greenhouse Gas Emissions from Commuting in New York City
The carbon dioxide created from the combustion of fuels for power generation was calculated from carbon content and heat rates as shown in Table D2:
––––––––––––––––––––––––––––––––––––––––––––––––––––––––––––––––––––––––––Table D2.Selected power generation fuel specifications.
Power Source
Coal
Oil
Gas
Carbon Content (lbs / million Btu) 53
55.94
47.39
31.99
Heat Rate (Btu / kWh)54
10,000
10,000
10,000
Carbon dioxide (CO2) emitted per kWh generated (lbs)55
2.05
1.74
1.17
–––––––––––––––––––––––––––––––––––––––––––––––––––––––––––––––––––––––––
––––––––––––––––––––––––––––––––––––––––––––––––––––––––––––––––––––––––––
––––––––––––––––––––––––––––––––––––––––––––––––––––––––––––––––––––––––––
––––––––––––––––––––––––––––––––––––––––––––––––––––––––––––––––––––––––––
––––––––––––––––––––––––––––––––––––––––––––––––––––––––––––––––––––––––––
–––––––––––––––––––––––––53 Data derived by C. Komanoff, Carbon Tax Center, and provided via e-mail to V. Wagner, 7/11/07.54 Approximate thermal conversion factors, available from Energy Information Administration at: eia.doe.gov/emeu/mer/append_a.html.55 Calculated as carbon content x heat rate x CO2 / C molecular weight ratio (44/12).


![Greenhouse Gas Emissions and Emissions Trading in North … · 2020. 2. 23. · 2002] Stephenson-Greenhouse Gas Emissions, Kyoto and U.S. Response 45 greenhouse gas molecules. This](https://static.fdocuments.in/doc/165x107/60facf56e286b02f9b10de99/greenhouse-gas-emissions-and-emissions-trading-in-north-2020-2-23-2002-stephenson-greenhouse.jpg)


