# Greenhouse gas reductions Michael Kvetny COWI 11 May 2010 1 11.05.2010 Economics.
Greenhouse Gas Emission Reductions from Blended Cement Production
Issues Paper
Prepared by
The Loreti Group
56 Adams Street Arlington, MA 02474
Contact: Christopher Loreti [email protected]
781-641-0338
December 19, 2008
Prepared for
California Climate Action Registry
523 W. 6th Street Los Angeles, CA 90014

Table of Contents 1. Introduction .................................................................................................................... 1
1.1 Cement and Concrete Production in the U.S. ............................................................ 1 1.1 Emissions from Cement Production in the U.S. ........................................................ 2
2. GHG Emission Quantification Methodologies .............................................................. 4 2.1. Existing GHG Emission Quantification Methodologies for Cement Production.... 4 2.2 CDM Emission Reduction Methodology for Blended Cement ................................ 5
2.2.1 Applicability ..................................................................................................... 6 2.2.2 Project Boundary (GHG Sources Accounted For) ............................................ 6 2.2.3 Baseline Emissions ........................................................................................... 7 2.2.4 Emission Reductions ......................................................................................... 8 2.2.5 Proposed Changes to the CDM Methodology .................................................. 9
2.3 Cool Climate Concrete Emission Reduction Methodologies ................................. 10 2.3.1 Cool Climate Concrete Project Method .......................................................... 11 2.3.2 Cool Climate Concrete Company Method ...................................................... 12
3. Issues Concerning the Establishment of Baselines and Performance Standards ......... 12 3.1 Performance Standards for Blended Cement and SCM Concrete .......................... 14 3.2 GHG Emissions Intensity of Portland Cement Production .................................... 14 3.3 Baseline Consumption of Supplementary Cementitious Materials ........................ 16
4. Drivers and Barriers to the Use of SCMs in Concrete ................................................. 19 4.1 Drivers for the Use of SCMs in Concrete............................................................... 19
4.1.1 Regulation ....................................................................................................... 19 4.1.2 EPA Procurement Guidelines ......................................................................... 20 4.1.3 LEED Certification ......................................................................................... 21 4.1.4 Cost Savings.................................................................................................... 22
4.2 Barriers to the Use of SCMs in Concrete .............................................................. 22 4.2.1 Regulatory and Contractual Barriers .............................................................. 22 4.2.2 Technical Barriers ........................................................................................... 23 4.2.3 Economic Barriers .......................................................................................... 24 4.2.4 Perceived Safety and Health Risk Barriers ..................................................... 25
5. Related Environmental Impacts from the Use of SCMs .............................................. 25 6. Issues Related to Boundaries, Leakage, Ownership, and Market Interest ................... 26
6.1 Boundaries .............................................................................................................. 26 6.2 Leakage ................................................................................................................... 27 6.3 Ownership ............................................................................................................... 27 6.4 Market Interest ........................................................................................................ 28
7. Permanence and Scientific Uncertainty ....................................................................... 30 8. Conclusions .................................................................................................................. 30 9. References .................................................................................................................... 31
1
1. Introduction
1.1 Cement and Concrete Production in the U.S.
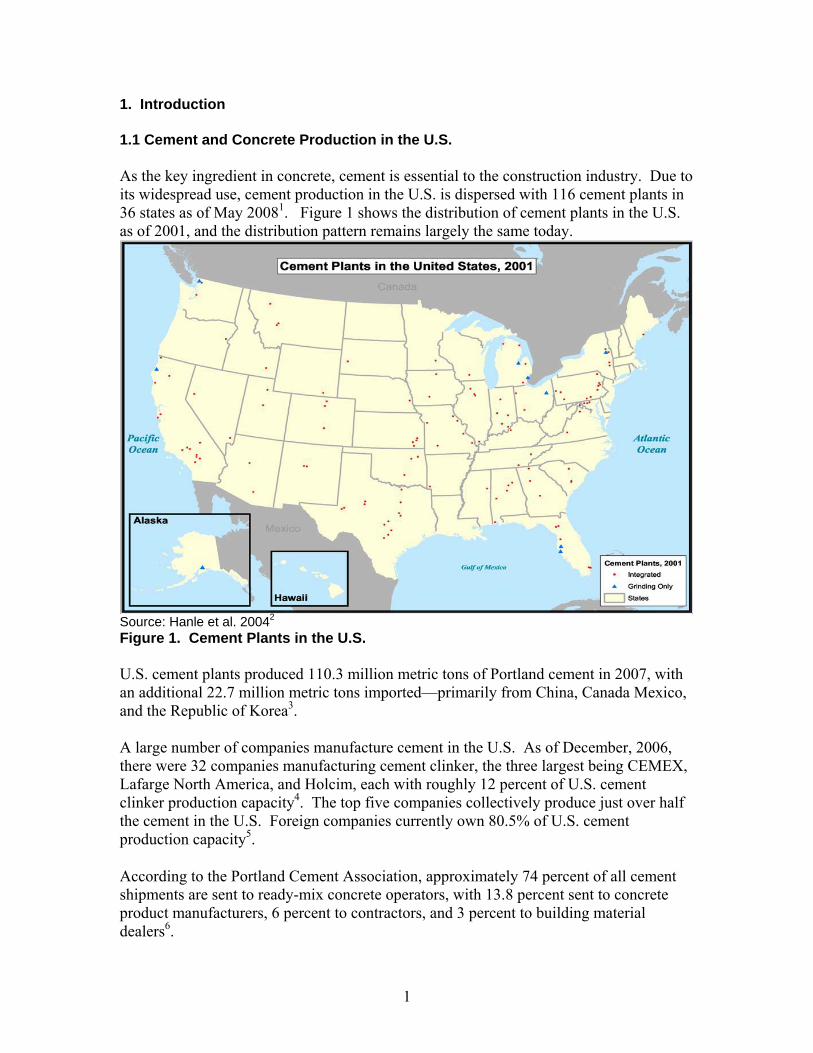
As the key ingredient in concrete, cement is essential to the construction industry. Due to its widespread use, cement production in the U.S. is dispersed with 116 cement plants in 36 states as of May 20081. Figure 1 shows the distribution of cement plants in the U.S. as of 2001, and the distribution pattern remains largely the same today.
Source: Hanle et al. 20042 Figure 1. Cement Plants in the U.S. U.S. cement plants produced 110.3 million metric tons of Portland cement in 2007, with an additional 22.7 million metric tons imported—primarily from China, Canada Mexico, and the Republic of Korea3. A large number of companies manufacture cement in the U.S. As of December, 2006, there were 32 companies manufacturing cement clinker, the three largest being CEMEX, Lafarge North America, and Holcim, each with roughly 12 percent of U.S. cement clinker production capacity4. The top five companies collectively produce just over half the cement in the U.S. Foreign companies currently own 80.5% of U.S. cement production capacity5.
According to the Portland Cement Association, approximately 74 percent of all cement shipments are sent to ready-mix concrete operators, with 13.8 percent sent to concrete product manufacturers, 6 percent to contractors, and 3 percent to building material dealers6.
2
Once concrete is made by blending cement, water, coarse and fine aggregates, it must be used relatively quickly. For this reason ready-mix concrete plants are widely distributed in the U.S. The most recent U.S. Census Bureau statistics indicate that there were more than 5500 ready mix plants in the U.S. in 20027. Plants are located in every state, with numbers ranging from just 9 in Rhode Island to 395 and 476 in California and Texas, respectively. Although ready-mix plants have traditionally operated as independent companies, they are increasingly being acquired by vertically integrated cement companies. At present, it is estimated that cement companies control half of the ready-mix plants in the U.S.8
1.1 Emissions from Cement Production in the U.S.
Cement plants in the U.S. accounted for about 1.1 percent of U.S. greenhouse gas GHG emissions in 2007—82 million tonnes out of a total of 7.28 billion tonnes9. The manufacture of cement is an energy-intensive process requiring the high temperature heating of the cement ingredients in a rotary kiln, which results in emissions from combustion of kiln fuel—primarily coal. In addition, during the pyro-processing of limestone—the main ingredient in cement—in the kiln, carbon dioxide is emitted as calcium and magnesium carbonates are converted to calcium and magnesium oxides. The increasing interest in strategies to reduce (GHG) emissions has led to the examination options for reducing emissions from the production of Portland cement. One way of reducing GHG emissions from cement manufacture is to produce blended cements, in which some of the Portland cement is replaced with supplementary cementitious material (SCM). The two most common SCMs are fly ash from coal-fired power plants and ground, granulated blast furnace slag (GGBFS) from the production of pig iron. By using these SCMs, either separately or together, emissions associated with the production of Portland cement are reduced to the extent that less is required to produce cement with the same properties. The blending of SCMs with Portland cement may occur at the cement plant or it may occur at a concrete batch plant where concrete is made. To avoid confusion, it is important to distinguish between cement and concrete. Concrete is a mixture of cement, fine and coarse aggregates, and water. Cement, when mixed with water, forms the paste that holds the concrete together. The cement in concrete may consist of ordinary Portland cement or a mixture of Portland cement and SCM. For the purpose of this paper, “blended cement” is used to refer to a mixture of Portland cement and SCM manufactured at a cement plant and sold as a blended cement. Concrete manufactured from a mixture of ordinary Portland cement and SCM added at a concrete batch plant is referred to as “SCM concrete.” Regardless of where the addition of SCMs occurs, their use can significantly reduce the emissions of GHGs associated with the production of Portland cement and its use in concrete. The extent of the emission reductions is proportional to the extent to which
Ground limestone may also be used a blending component, but because its use is limited to 5 percent of the cement, and has not achieved widespread use, it is not considered in this paper.
3
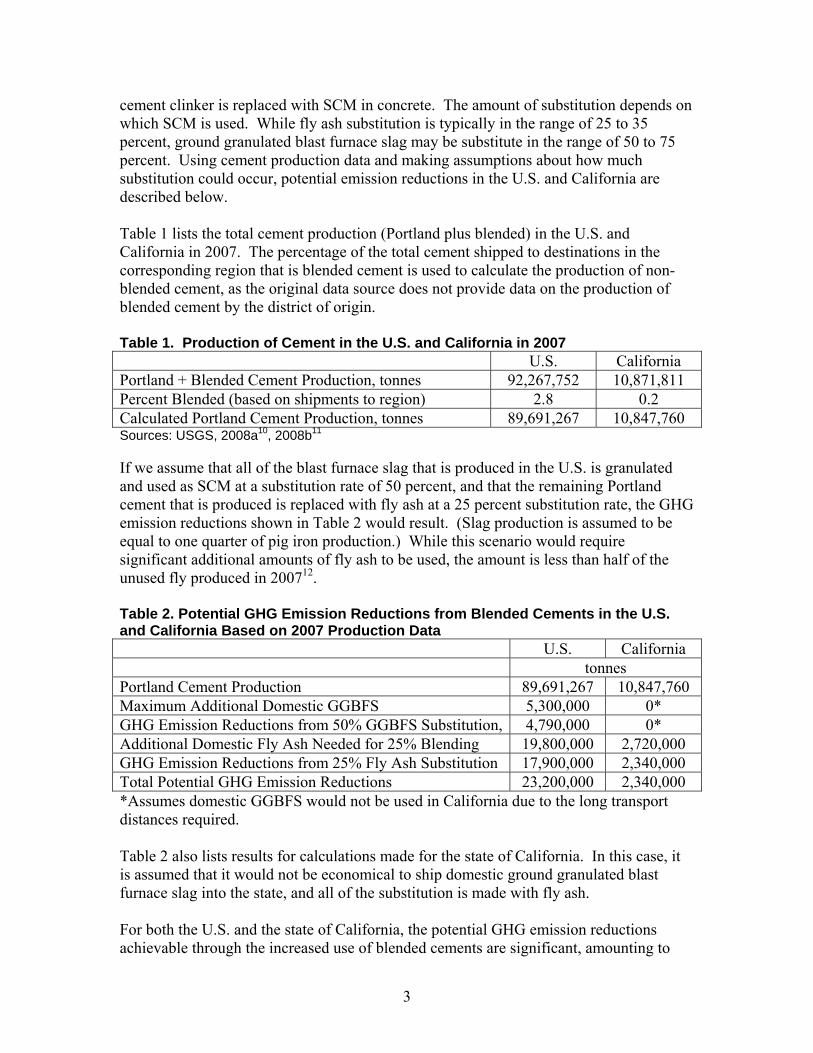
cement clinker is replaced with SCM in concrete. The amount of substitution depends on which SCM is used. While fly ash substitution is typically in the range of 25 to 35 percent, ground granulated blast furnace slag may be substitute in the range of 50 to 75 percent. Using cement production data and making assumptions about how much substitution could occur, potential emission reductions in the U.S. and California are described below. Table 1 lists the total cement production (Portland plus blended) in the U.S. and California in 2007. The percentage of the total cement shipped to destinations in the corresponding region that is blended cement is used to calculate the production of non-blended cement, as the original data source does not provide data on the production of blended cement by the district of origin. Table 1. Production of Cement in the U.S. and California in 2007
U.S. California Portland + Blended Cement Production, tonnes 92,267,752 10,871,811 Percent Blended (based on shipments to region) 2.8 0.2 Calculated Portland Cement Production, tonnes 89,691,267 10,847,760 Sources: USGS, 2008a10, 2008b11 If we assume that all of the blast furnace slag that is produced in the U.S. is granulated and used as SCM at a substitution rate of 50 percent, and that the remaining Portland cement that is produced is replaced with fly ash at a 25 percent substitution rate, the GHG emission reductions shown in Table 2 would result. (Slag production is assumed to be equal to one quarter of pig iron production.) While this scenario would require significant additional amounts of fly ash to be used, the amount is less than half of the unused fly produced in 200712. Table 2. Potential GHG Emission Reductions from Blended Cements in the U.S. and California Based on 2007 Production Data
U.S. California tonnes Portland Cement Production 89,691,267 10,847,760 Maximum Additional Domestic GGBFS 5,300,000 0* GHG Emission Reductions from 50% GGBFS Substitution, 4,790,000 0* Additional Domestic Fly Ash Needed for 25% Blending 19,800,000 2,720,000 GHG Emission Reductions from 25% Fly Ash Substitution 17,900,000 2,340,000 Total Potential GHG Emission Reductions 23,200,000 2,340,000 *Assumes domestic GGBFS would not be used in California due to the long transport distances required. Table 2 also lists results for calculations made for the state of California. In this case, it is assumed that it would not be economical to ship domestic ground granulated blast furnace slag into the state, and all of the substitution is made with fly ash. For both the U.S. and the state of California, the potential GHG emission reductions achievable through the increased use of blended cements are significant, amounting to

4
millions of tonnes per year and reductions in GHG emissions from cement production of at least 25 percent. Due to the great potential for the increased use of SCMs to reduce GHG emissions, the California Climate Action Registry retained the services of The Loreti Group to develop this issues paper on creating GHG emission offsets through projects that increase the use of blended cement. This paper discusses five key areas related to GHG emissions offsets from blended cement and SCM concrete and concludes with a description of the main issues the California Climate Action Registry will have to address should it decide to develop a protocol for these emission offsets. These areas are:
GHG Emission Quantification Methodologies Baselines and Performance Standards Drivers and Barriers to the Use of SCMs in Concrete Related Environmental Impacts from the Use of SCMs Boundaries, Leakage, Ownership, and Market Interest Permanence and Scientific Uncertainty Conclusions
2. GHG Emission Quantification Methodologies
A variety of quantification methodologies exist for quantifying GHG emissions from the manufacture of cement. The focus of most of these methodologies is the quantification of total emissions at a cement plant or for an entire cement company, rather than the quantification of emission reductions that may be achieved through the use of blended cement. Two approaches to quantifying emission reductions through the increased use of blended cement were indentified. Those approaches are described below following an overview of the plant-level approach to estimating GHG emissions from cement production.
2.1. Existing GHG Emission Quantification Methodologies for Cement Production
Until this year, the reporting of GHG emissions from cement plants in the U.S. has not been required by law or regulation. The three most widely used GHG quantification methodologies for voluntary reporting in the U.S. are:
California Climate Action Registry: Cement Reporting Protocol13 WBCSD: The Cement CO2 Protocol: CO2 Emissions Monitoring and Reporting
Protocol for the Cement Industry14 U.S. EPA: Direct Emissions from the Cement Sector15
As its title indicates, the first of these protocols was produced by the California Climate Action Registry. The second was published by the World Business Council for Sustainable Development, and the third, which remains in draft form, was published by the U.S. EPA’s Climate Leaders Program.
5
Although these three protocols differ somewhat in their details, their approach to quantifying GHG emissions is very similar. In all cases process emissions of CO2 from the manufacture of cement are based on the quantity of cement clinker (or finished cement) produced. None of the methods require the direct measurement of emissions. Process emissions of CO2 from cement manufacture result from the calcination of calcium and magnesium carbonate in the limestone fed to the kiln to calcium and magnesium oxide. Since the quantity of oxides in the cement clinker are routinely monitored in the manufacturing process, the amount of CO2 produced can be readily calculated. Emissions from the calcination of limestone that ends up in cement kiln dust that does not become part of the cement product also need to be accounted for, and these three protocols describe methods for doing so. The other main source of GHG emissions in cement manufacture is the combustion of fossil fuel in the kiln. Smaller emission sources include indirect emissions from electricity consumption and the combustion of carbon contained in the kiln feed materials other than limestone. These emission sources are also included in the protocols. Regulations issued under California Assembly Bill 23 (AB32) require that cement plants in the state begin reporting their GHG emissions using the best available data for 2008. In subsequent years, they will have to report emissions based on all of the requirements in the regulations. These requirements allow, but do not require, direct measurement of emissions. As an alternative, they allow emissions to be calculated in the same way as described in the California Climate Action Registry Cement Reporting Protocol. Cement plants in Europe are also required to report emissions because they are included in the European Union Emissions Trading Scheme (ETS), The ETS includes only direct emissions of CO2 from cement manufacture and therefore is not directly comparable to the ARB, CCAR, and EPA emissions reporting which require the inclusion of indirect emissions from electricity consumption and also include emissions of methane and nitrous oxide. The monitoring of direct emissions of CO2 under the EU ETS should provide results comparable to the ARB, CCAR, and EPA emissions reporting for direct emissions from the cement kiln. Since the EU ETS does not include on-site power generation within the system boundary for a cement plant, however, direct emissions from cement plants with on-site power generation or other direct emission sources would not be comparable to the emissions calculated with the other methods listed above.
2.2 CDM Emission Reduction Methodology for Blended Cement
Under the Clean Development Mechanism (CDM) of the United Nations Framework Convention on Climate Change, a methodology for quantifying emission reductions from the increased use of blended cement has been developed16. This methodology is designed for quantifying emission reductions for blended cement produced at cement plants. As of the end of November 2008, 13 different blended cement CDM projects were registered17.

6
2.2.1 Applicability
The CDM methodology lists three conditions for applicability of this method:
There is no shortage of additives related to the lack of blending materials. This methodology is applicable to domestically sold output of the cement plant
and excludes export of blended cement. Adequate data are available on cement types in the market.
Although the rationale for these condition is not explained in the methodology, they appear to be based on the ability to accurately quantify the emission reductions that occur within the country where the project is located. If there is a shortage of blending materials, then the increase in use at a particular cement plant would result in the decrease in use at anther plant, or a decrease in use for some other purpose than the manufacture of blended cement. In the former case, the emission reductions would merely be shifted from one location to another, while in the latter, the change in emissions that result from the loss of the blending material in the other use would need to be considered. The requirement that the blended cement be sold domestically relates to the requirement of the CDM program, and is not particularly relevant to cement production in the U.S., as less than 2 percent of the cement produced in the U.S. is exported, almost all of which goes to Canada18. The final requirement that adequate market data be available is relevant in the U.S. as these data are used in the calculation of the baseline for assessing the emission reductions.
2.2.2 Project Boundary (GHG Sources Accounted For)
The project boundary for this methodology includes all direct emissions from the cement plant, including any on-site power generation, and indirect emissions from purchased power. The methodology lists the following emission sources to be included:
Direct emissions at the cement plant due to fuel combustion for: o Firing the kiln (including supplemental fuels used in the precalciner); o Processing (including drying) of solid fuels, raw materials, and additives; o On-site generation of electricity (if applicable).
Direct emissions due to calcination of limestone (i.e. calcium carbonate and magnesium carbonate, if present in the raw meal).
Indirect emissions from fossil fuel combustion in power plants in the grid due to electricity use at the cement plant, including electricity consumption for:
o Crushing and grinding the raw materials used for clinker production; o Driving the kiln and kiln fans; o Finish grinding of cement; o Processing of additives.

7
The power plant and grid losses for purchased electricity are considered in the calculation of indirect emissions. Any emissions associated with the transport of additional additives to the cement plant are counted as leakage, while any reduction in emissions associated with the reduction in raw material consumption at the cement plant are ignored as a conservative assumption, as emissions of these gases will also be reduced. Since GHG emission from cement production are almost entirely CO2, changes in methane and nitrous oxide emissions are considered to be negligible. This is also taken to be a conservative assumption.
2.2.3 Baseline Emissions
The CDM methodology uses a performance standard or benchmark for assessing emission reductions from the project. The methodology specifies that the benchmark for the emissions baseline be the lowest value of the following:
1. The average (weighted by production) mass percentage of clinker for the five highest blend cement brands for the relevant cement type in the region. (For example, if the project was meant to increase the proportion of fly ash in blended cement, the relevant baseline would be set using fly ash blended cement, whereas a project to increase the proportion of ground granulated blast furnace slag would use slag blended cement for the baseline.) If the region comprises less than five blended cement brands, the national market would be used as the default region;
2. The production weighted average mass percentage of clinker in the top 20 percent
(in terms of share of additives) of the total production of the blended cement type in the region. If 20 percent falls within the partial capacity of a plant, that plant is included in the calculations;
3. The mass percentage of clinker in the relevant cement type produced in the
proposed project activity plant before the implementation of the CDM project activity, if applicable (For greenfield projects, this option may be excluded).
The “region” used for the determination of the benchmark has to be justified by the project proponent. While the national market is the default, smaller regions may be used based on the amount of the cement plant’s output sold within the region, the number of other plants in the region and the total production of these plants relative to the project plant. For the first two options listed above, project proponents must either retrospectively update the benchmark annually and incorporate any increasing trend in the proportion of blending components (keeping the benchmark constant if there is a decreasing trend) or incorporate a trend of an increasing proportion of blending components based on general market trends or a minimum of two percent annual increase in the proportion of blending components. (For example, if the baseline proportion of blending component was 20
8
percent in the first year of the project, it would be 20.4 percent in the second year and 20.8 percent in the third, etc.) For the third option listed above, a trend minimum of two percent per year is used to adjust the baseline benchmark up to the limit of the proportion of blending components that is established either by regulation for the product for the selected region or by product specifications set by a non-governmental standards body such as ASTM International or the local equivalent.
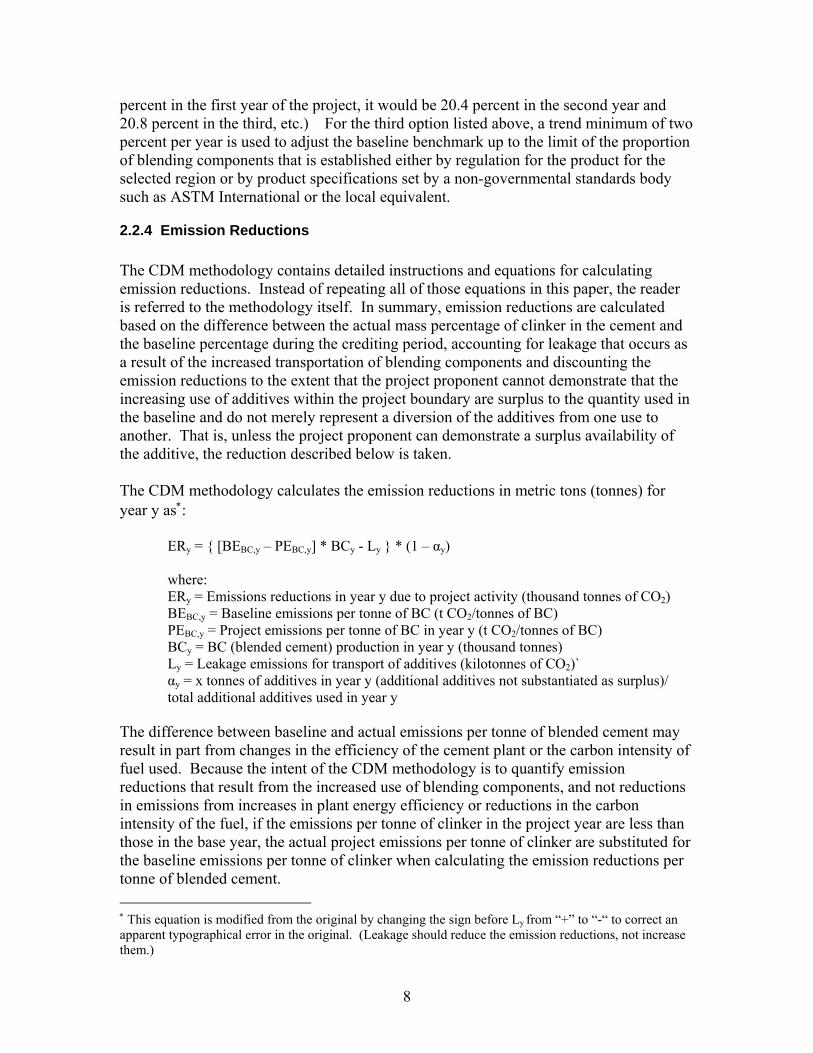
2.2.4 Emission Reductions
The CDM methodology contains detailed instructions and equations for calculating emission reductions. Instead of repeating all of those equations in this paper, the reader is referred to the methodology itself. In summary, emission reductions are calculated based on the difference between the actual mass percentage of clinker in the cement and the baseline percentage during the crediting period, accounting for leakage that occurs as a result of the increased transportation of blending components and discounting the emission reductions to the extent that the project proponent cannot demonstrate that the increasing use of additives within the project boundary are surplus to the quantity used in the baseline and do not merely represent a diversion of the additives from one use to another. That is, unless the project proponent can demonstrate a surplus availability of the additive, the reduction described below is taken. The CDM methodology calculates the emission reductions in metric tons (tonnes) for year y as:
ERy = { [BEBC,y – PEBC,y] * BCy - Ly } * (1 – αy) where: ERy = Emissions reductions in year y due to project activity (thousand tonnes of CO2) BEBC,y = Baseline emissions per tonne of BC (t CO2/tonnes of BC) PEBC,y = Project emissions per tonne of BC in year y (t CO2/tonnes of BC) BCy = BC (blended cement) production in year y (thousand tonnes) Ly = Leakage emissions for transport of additives (kilotonnes of CO2)` αy = x tonnes of additives in year y (additional additives not substantiated as surplus)/ total additional additives used in year y
The difference between baseline and actual emissions per tonne of blended cement may result in part from changes in the efficiency of the cement plant or the carbon intensity of fuel used. Because the intent of the CDM methodology is to quantify emission reductions that result from the increased use of blending components, and not reductions in emissions from increases in plant energy efficiency or reductions in the carbon intensity of the fuel, if the emissions per tonne of clinker in the project year are less than those in the base year, the actual project emissions per tonne of clinker are substituted for the baseline emissions per tonne of clinker when calculating the emission reductions per tonne of blended cement.
This equation is modified from the original by changing the sign before Ly from “+” to “-“ to correct an apparent typographical error in the original. (Leakage should reduce the emission reductions, not increase them.)
9
This is not to say that emission reductions from energy efficiency improvements or fuel switching are not desirable or cannot obtain credits under the CDM program. If a project proponent wishes to obtain such credits, however, they would employ a different methodology. This approach of segregating the emission reductions makes sense in that if the CDM methodology for blended cement also awarded credits for energy efficiency improvements or fuel switching, it is possible that blended cement projects might actually experience a decrease the proportion additives in the blended cement but still reduce emissions and receive credits, which is inconsistent with the purpose of the blended cement methodology. If emissions per tonne of clinker are greater in the project year than in the base year, the base year emission rate is used. In this case, the emissions in the project year could be greater than in the base year even if the use of blending components increased. If the project year emissions are greater than the base year emissions, no credits are awarded for that year. Before credits are issued for any future years, the increase in emissions for that year must be offset by emission reductions.
2.2.5 Proposed Changes to the CDM Methodology
To date, CDM projects for cement plants have yielded slightly more than 1.5 million tonnes of certified emission reductions19. As this amounts to less than 0.1 percent of the annual cement industry emissions in countries where CDM projects can be implemented, the current CDM methodology for blended cement is not considered to be successful by the international cement industry. The Cement Sustainability Initiative (CSI) of the World Business Council for Sustainable Development has recently proposed an alternative CDM approach for cement plants that simultaneously accounts for emission reductions from blended cement and other project types such as waste heat recovery and fuel switching at cement plants20. The new methodology proposed by the CSI takes a benchmarking approach to both the project baseline the assessment of additionality (assessing whether the reductions would have occurred in the absence of the project activity). Both the baseline and threshold for additionality are expressed in terms of the distribution of emissions intensity of cement plants in the region. In order to be considered additional, the project (or projects) would have to bring a cement plant’s GHG emissions intensity to within the top 20 percent in the region. This emissions intensity level would be set at the outset of the project for the first five years of the project’s implementation. The baseline would be established as the GHG emissions intensity at the 45th percentile level, and would be adjusted each year. For projects that qualify as additional, the difference in the actual emissions intensity and the baseline intensity multiplied by the production volume would yield the GHG emission reductions. The emissions intensity used in the CSI proposal is tonnes of CO2/tonne clinker21. Because the intensity is based on clinker production, it would appear to be inapplicable to blended cement projects as the amount of blending does not directly affect the emissions
10
intensity of clinker production. Presumably, the methodology could also be based on the tonnes of cementitious material (clinker plus SCM) produced, which would make it applicable to cement blending at cement plants. At present, the CSI is in the early stages of seeking approval of their proposed methodology. While their approach does seem to simplify the current process for obtaining credits through the CDM process, it is doubtful that it would be a useful approach for achieving emission reductions for the use of SCM in the U.S. simply because such a small fraction of SCM use in the U.S. occurs at cement plants. If similar data were available for cementitious material used in concrete batch plants in the U.S., such a benchmarking approach might be applicable in the U.S., as that is where approximately 95 percent of SCM use occurs22. As described below, the one U.S. program for achieving offset credits for the use of SCM involves concrete batch plants.
2.3 Cool Climate Concrete Emission Reduction Methodologies
The CDM process for creating emission reductions from blended cement is centered on the cement plant where the cement clinker is produced, ground, and blended with the supplementary cementitious material to make the blended cement. In the U.S., most blending of supplementary cementitious material takes place at the concrete batch plant, rather than at the cement plant. Instead of using blended cement to make a concrete containing less Portland cement, the supplementary cementitious material is used as part of the concrete mix, thus reducing the amount of conventional Portland cement in the concrete. A review of the literature found only one U.S. program for obtaining GHG emission offsets through the increased use of supplementary cementitious material. The Cool Climate Concrete program was set up by The Climate Trust with the participation of Seattle City Light to purchase offsets from a project that promotes the increased use of blended cement. The initial phase of the project was established to create (and retire) 250,000 tonnes of CO2 emission reductions. The Climate Trust contracted with Horst Inc., a firm specializing in sustainable design services and materials, to recruit participants and provide incentives for using blended cement concrete in construction and civil works projects. The Cool Climate Concrete program does not make its protocol for quantifying emission reductions publicly available. Therefore information on the program was obtained from the Cool Climate Concrete website23, and through telephone conversations with its program manager24, and the Climate Trust project manager for the program25.
Unlike the CDM protocol for quantifying emission reductions, which applies to cement plants, the Cool Climate Concrete program awards offsets at the point of blending the supplementary cementitious material into the concrete—namely at the concrete batch plant. While conceptually, offsets could be created either at a cement plant or a concrete batch plant, with the overwhelming majority of SCM consumption occurring at batch plants in the U.S., it makes sense for the Cool Climate Concrete program to work only with batch plants. Additional assumptions for this program include:
11
On a national level, for each tonne of Portland cement (ASTM C150) clinker produced, one tonne of CO2 is produced.
Offsets are based on the weight of Portland cement used to produce concrete compared to a baseline concrete mix, which is established on a quarterly basis using the past three years of data for the participating company.
Accepted Supplementary Cementitious Materials (SCMs) include ground granulated blast furnace slag, fly ash, silica fume and rice hull ash. Other SCMs may be allowable if they can be shown to have no associated emissions.
There are two methods by which participants in the Cool Climate Concrete program can earn emission offsets. These are referred to as the “project method” and the “company method.”
2.3.1 Cool Climate Concrete Project Method
In the project method, the baseline is determined on a project level with regionally specific data that includes weather data, over-design criteria, and regional practice. For each project, one or more concrete design mixes may be used and the ratio of Portland cement to concrete will vary with the factors listed above. The project participant specifies what this ratio would be for each design mix in the absence of the Cool Climate Concrete program. Offsets are determined by the reduction in the amount of cement used compared to the baseline. Examples of the types of projects that might earn offsets include road projects, building projects, and large infrastructure projects, or other types of projects in which baseline concrete mixes can be established, but alternative mixes using supplementary cementitious materials are employed instead as a result of the program. A baseline is established for each mix design based on the weight of Portland cement per cubic yard of concrete that would have been used if the project was not part of the Cool Climate Concrete program. Thus, multiple baselines may exist for a single project because multiple concrete mixes may be used on a single project. The baseline cement to concrete ratio is multiplied by the quantity of concrete placed for the project to arrive at the total baseline weight of Portland cement for each mix employed. For projects participating in the program, the actual total weight of Portland cement used in each mix is compared to the corresponding baseline to determine the reduction in Portland cement for each mix. The difference (reduction) in cement used for each mix is summed to give the total reduction in cement use for the project in tonnes. Because conventional Portland cement is not entirely ground cement clinker—gypsum and lesser amounts of other components are added—it is assumed that the cement that is displaced consists of 95 percent ground cement clinker. For each tonne of cement clinker use reduced, one tonne of CO2 emission reductions results. Thus, the reduction in Portland cement consumption in tonnes (the difference between the tonnes of Portland cement in the baseline and the project cases) is multiplied by 0.95 to obtain the CO2 emission reductions in tonnes.
12
In order for the project mix to be considered to be additional, the use of SCM in the concrete cannot be mandated by law or regulation. If concrete containing SCM is purchased from the concrete batch plant to help qualify a project for a voluntary initiative, such as Leadership in Energy and Environmental Design (LEED) certification program described in Section 3, however, it can still qualify for offsets under the Cool Climate Concrete project method as there is no legal requirement to use of the SCM26. If implemented as designed, the Cool Climate Concrete project method result in offset credits for emission reductions that would not have occurred otherwise. Since the determination of what the baseline (the type of concrete that would be used in the absence of the project activity) is left up to the concrete batch plant receiving the credits, it is unclear how easily the baseline can be verified. This is especially true at the time voluntary programs like LEED are encouraging the use of SCM concrete. One other shortcoming of this approach is the amount of recordkeeping required. According to the program manager, some concrete batch plants have found that the administrative costs of this approach, particularly for smaller projects, exceed the 50 cents per tonne offset credit paid to them by The Climate Trust27.
2.3.2 Cool Climate Concrete Company Method
The calculation of emission reductions using the Cool Climate Concrete company method is similar to the project method except in the way the emissions baseline is established. Instead of focusing on specific projects, the company method looks at all of the concrete produced by a company. The company typically is the ready mix concrete producer. In taking this approach, the Cool Climate Concrete program reportedly takes care to ensure that the use of supplementary cementitious materials are not simply being shifted to one company (or single concrete batch plant) to another that is not a part of the program28, though it is not entirely clear how they do this. Baselines for the company method are established on a seasonal basis to account for changes in concrete blends with the weather. For each quarter of the year, a baseline ratio of cement used to concrete produced is calculated using the average cement to concrete ratio for the corresponding quarter of the three prior years. Reductions in cement consumption are calculated on a quarterly basis by taking the difference between the actual ratio of cement to concrete for the quarter and the baseline ratio for the corresponding quarter. This difference is multiplied by the amount of concrete produced in the quarter to establish the amount of cement displaced by the use of the SCM. Once the reduction in cement usage is calculated, the reduction in CO2 emissions is calculated in the same way as for the project method. It is assumed that cement contains 95 percent ground clinker and that production of one ton of clinker results in one ton of CO2 emissions.
3. Issues Concerning the Establishment of Baselines and Performance Standards
In order to quantify the GHG emission reductions associated with projects to increase the use of blended cement or SCM concrete, the baseline emissions in the absence of the

13
project must be quantified. The emission reductions are then calculated as the difference between the actual emissions with the project in place and the baseline emissions that would have occurred in the absence of the project. The Greenhouse Gas Protocol for Project Accounting29 identifies two principal means for establishing baselines for GHG emission reduction projects:
Project-specific baseline procedure Performance standard baseline procedure
In the project-specific approach, a separate baseline is established for each emission reduction project. Because this approach is based on representative technology types or practices in a given geographical region, it requires verifiable information on those technologies over the period of interest. The baseline is identified by conducting an “assessment of barriers” to determine which of the baseline alternatives has the fewest (or no) barriers to its implementation compared to the others, or if more than one baseline falls into this situation, picking the one that yields the lowest emissions or provides the greatest net benefits to those deciding on the approach. Although sufficient information is generally available to assess GHG emissions from cement production and the emission reductions that may occur using the project-specific baseline approach, the baseline approaches used by the CDM blended cement methodology and the Cool Climate Concrete program incorporate, in part, performance-based standards in their approaches. The CDM methodology uses a regional or national performance standard for the determination of the baseline clinker fraction in the blended cement, while the Cool Climate Concrete program uses a single performance standard for the CO2 intensity of Portland cement: 0.95 tonne CO2/tonne Portland cement (although as noted below, this approach is under review). The Cool Climate Concrete program does not, however, use a performance standard for the concrete produced at the batch plant. The performance standard approach is the preferred approach of the California Climate Action Registry because of its ease of use once the up-front work has been done to develop the standard. Associated benefits include30:
Assessment of industry practice as a whole, rather than individual projects Less subjective determination of baseline emissions and project eligibility More certainty in the amount of credits Lower risk for developers Faster project processing
For these reasons, the discussion that follows focuses on the potential use of a standardized, performance based approach to establishing a baseline for blended cement and SCM concrete projects.

14
3.1 Performance Standards for Blended Cement and SCM Concrete
The GHG emissions associated with the use of SCMs in concrete depend on two key parameters: the amount of Portland cement displaced in the concrete mix, and the GHG emissions intensity of that displaced cement. Each of these parameters must be considered separately, as each can vary significantly both geographically and temporally, depending on the source of the Portland cement and the location where the SCM concrete is produced.
3.2 GHG Emissions Intensity of Portland Cement Production
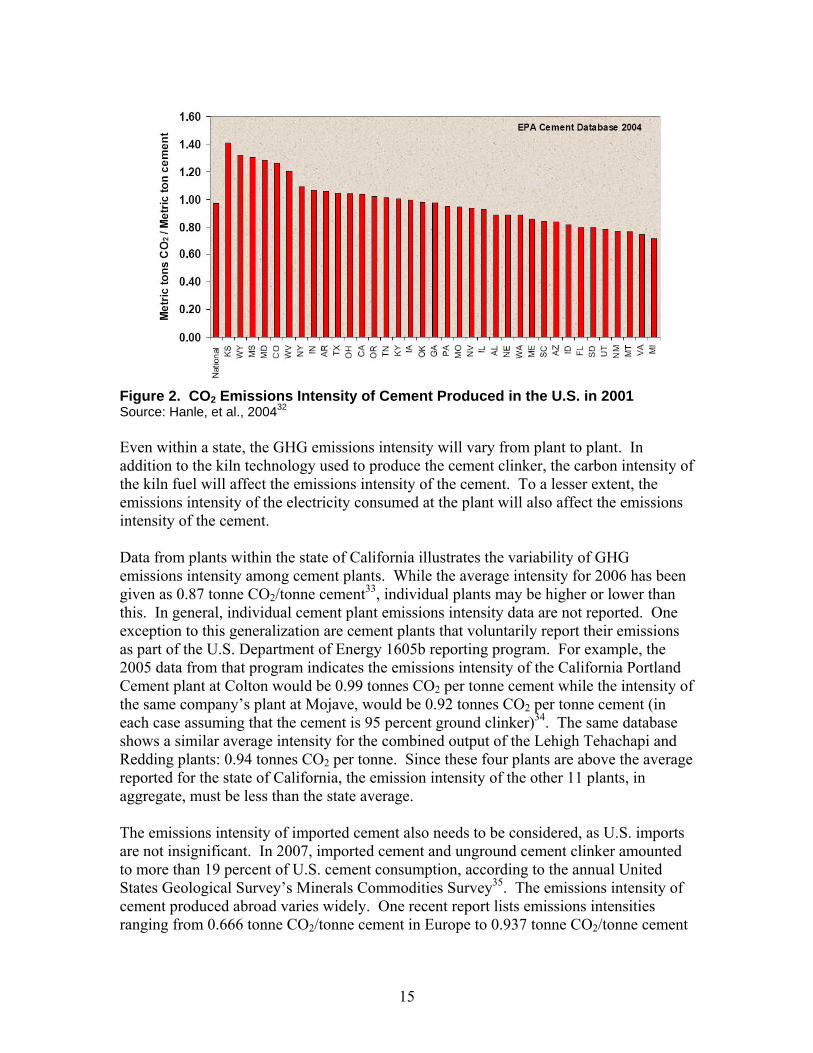
The two approaches to assessing GHG emission reductions from the use of SCMs described in Section 2 of this paper take different approaches to quantifying the emissions intensity of the Portland cement being displaced. In the case of the CDM methodology, the project activity takes place at the cement plant, and thus the emissions intensity of the cement production is based on the operating data from that plant. Because these data must be monitored and verified as part of the CDM process, there is a high degree of assurance in the quantity of emission reductions for a given amount of Portland cement displaced. In the case of the Cool Climate Concrete program, the emission reductions are quantified based on the activities at the concrete batch plant, without regard to the specific source of the cement. As described in Section 2, it is assumed that ordinarily Portland cement consumed contains 95 percent ground cement clinker and that one tonne of CO2 emissions results from the production of one tonne of ground clinker. According to the Cool Climate Concrete Portfolio Manager at the Climate Trust31, this assumption will be reviewed if the program is continued in the future. Indeed, it is important to consider how the emissions intensity of Portland cement varies within the U.S. and abroad. Figure 2 provides an estimate of the GHG emissions intensity of cement plants within the U.S. as determined by the U.S. EPA. Similar, current data are compiled on a plant by plant basis by the Portland Cement Association and the Cement Sustainability Initiative. Because of confidentiality concerns, these groups will not release the data for individual cement plants, nor will they do so for individual states that contain a small number of cement plants. Both groups have stated that they might be able to provide regional data for the U.S., however. While the authors of the report from which these figures come qualify the data used to create it, the important point the figure illustrates is the differences in the emissions intensity of the cement produced from state to state. These differences are explained by the greater use of wet cement kilns, which are more energy intensive, in some states and the greater presence of clinker grinding-only facilities in some states, which would tend to lower the average emissions intensity for those states. Nevertheless, the emissions intensity varies by more than 60 percent from state to state, suggesting that the emissions displaced by blended cement would also vary by the same amount.
15
Figure 2. CO2 Emissions Intensity of Cement Produced in the U.S. in 2001 Source: Hanle, et al., 200432 Even within a state, the GHG emissions intensity will vary from plant to plant. In addition to the kiln technology used to produce the cement clinker, the carbon intensity of the kiln fuel will affect the emissions intensity of the cement. To a lesser extent, the emissions intensity of the electricity consumed at the plant will also affect the emissions intensity of the cement. Data from plants within the state of California illustrates the variability of GHG emissions intensity among cement plants. While the average intensity for 2006 has been given as 0.87 tonne CO2/tonne cement33, individual plants may be higher or lower than this. In general, individual cement plant emissions intensity data are not reported. One exception to this generalization are cement plants that voluntarily report their emissions as part of the U.S. Department of Energy 1605b reporting program. For example, the 2005 data from that program indicates the emissions intensity of the California Portland Cement plant at Colton would be 0.99 tonnes CO2 per tonne cement while the intensity of the same company’s plant at Mojave, would be 0.92 tonnes CO2 per tonne cement (in each case assuming that the cement is 95 percent ground clinker)34. The same database shows a similar average intensity for the combined output of the Lehigh Tehachapi and Redding plants: 0.94 tonnes CO2 per tonne. Since these four plants are above the average reported for the state of California, the emission intensity of the other 11 plants, in aggregate, must be less than the state average. The emissions intensity of imported cement also needs to be considered, as U.S. imports are not insignificant. In 2007, imported cement and unground cement clinker amounted to more than 19 percent of U.S. cement consumption, according to the annual United States Geological Survey’s Minerals Commodities Survey35. The emissions intensity of cement produced abroad varies widely. One recent report lists emissions intensities ranging from 0.666 tonne CO2/tonne cement in Europe to 0.937 tonne CO2/tonne cement

16
in China36. The U.S. was reported to have an average emissions intensity somewhat higher than the world average: 0.904 versus 0.862 tonne CO2/tonne cement.
3.3 Baseline Consumption of Supplementary Cementitious Materials
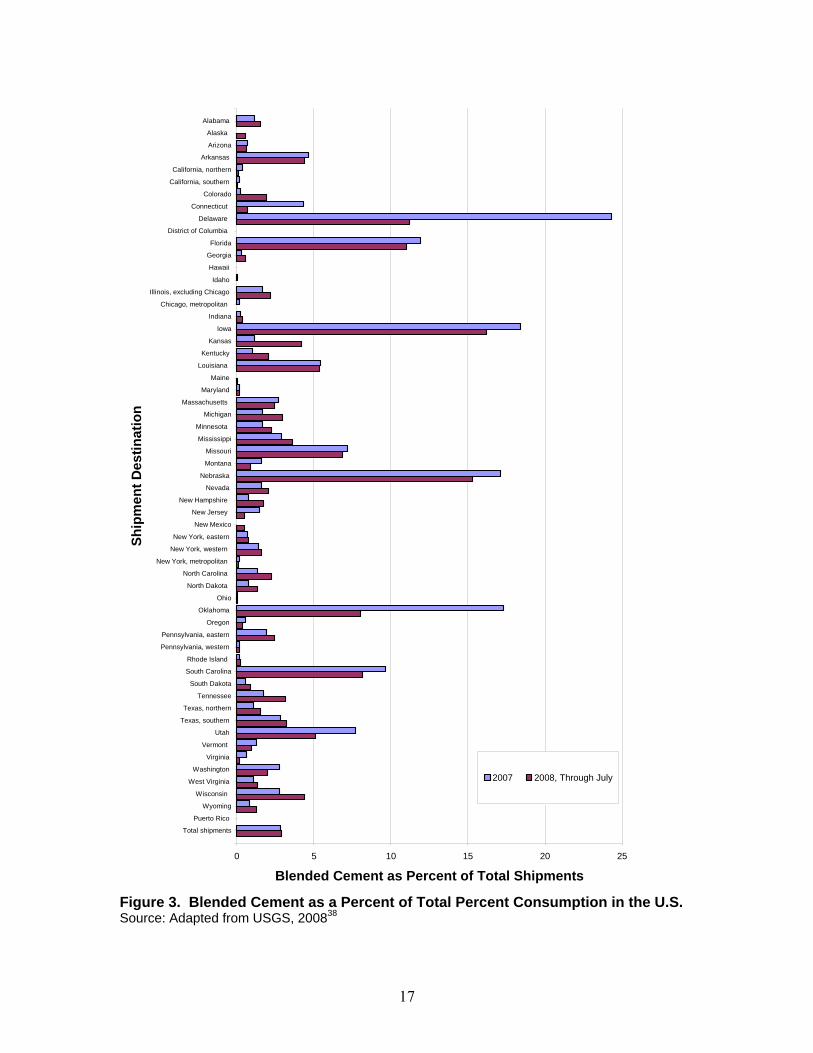
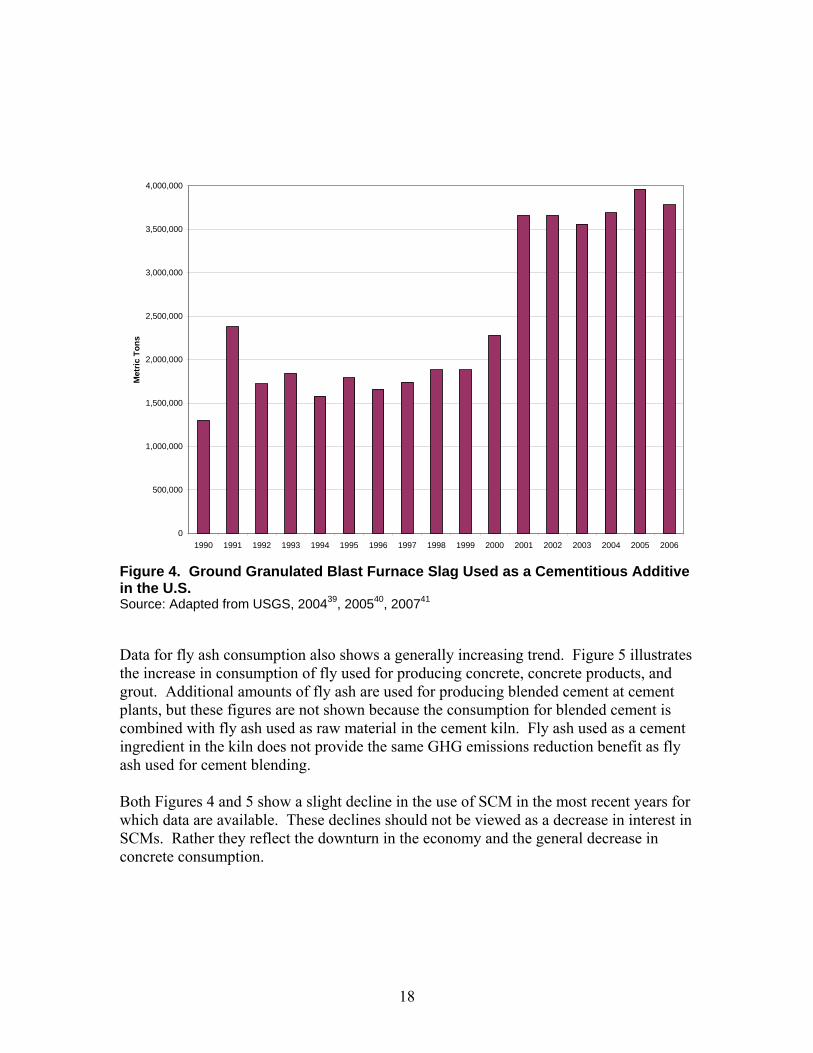
If the emissions intensity of cement production varies from country to country, state to state, and plant to plant, the same is true for the extent to which blended cements are currently used. The U.S. Geological Service (USGS) compiles statistics on Portland cement shipments by destination. These data are published on a monthly basis as part of the USGS’s Mineral Industry Surveys. Typically, destinations are entire states, although for larger or more populous states, they may be for parts of states. The USGS compiles the same information on blended cements, and published them in the same survey, which allows the proportion of blended cement to be calculated for each of the destinations the USGS tracks. Figure 3 shows the percent of total (conventional Portland cement plus blended cement) shipped to each of the USGS destinations in 2007 and the first seven months of 2008. As this figure shows, the proportion of the total cement that is made up of blended cement varies greatly from state to state, and even in those states that are subdivided, the amount of blended cement that is consumed varies. In addition to showing spatial variations in blended cement consumption, Figure 3 also shows that the proportion of blended cement is not constant over time. In those states where the consumption of blended cement is significant, such as Delaware and Oklahoma, the proportion of cement consumption that is accounted for by blended cement differs greatly between the first seven months of 2007 and the whole of 2008. It is important to emphasize that the USGS data pertains to shipments of cement, not concrete. The data used to create Figure 2 are for cement prepared in accordance with ASTM Standard C595 and shipped as blended cement. The data do not include the SCM used as a substitute for Portland cement at concrete batch plants, and therefore represents a small fraction of the total SCM used in making concrete. Nevertheless, it is believed the spatial and temporal variability shown in the Figure are representative of what occurs in total with SCM concrete. There has been increasing interest in the use of SCMs to produce blended cement and concrete in recent years. Figure 4 shows the pattern of use of ground granulated blast furnace slag as a cementitious material. The Slag Cement Association also reports an increasing trend in the use of slag cement, with an average annual increase in consumption of 11.8 percent between 1998 and 2007, compared to a 1.0 percent increase for Portland cement consumption over the same period37.
17
0 5 10 15 20 25
Alabama
Alaska
Arizona
Arkansas
California, northern
California, southern
Colorado
Connecticut
Delaware
District of Columbia
Florida
Georgia
Hawaii
Idaho
Illinois, excluding Chicago
Chicago, metropolitan
Indiana
Iowa
Kansas
Kentucky
Louisiana
Maine
Maryland
Massachusetts
Michigan
Minnesota
Mississippi
Missouri
Montana
Nebraska
Nevada
New Hampshire
New Jersey
New Mexico
New York, eastern
New York, western
New York, metropolitan
North Carolina
North Dakota
Ohio
Oklahoma
Oregon
Pennsylvania, eastern
Pennsylvania, western
Rhode Island
South Carolina
South Dakota
Tennessee
Texas, northern
Texas, southern
Utah
Vermont
Virginia
Washington
West Virginia
Wisconsin
Wyoming
Puerto Rico
Total shipments
Sh
ipm
en
t D
es
tin
ati
on
Blended Cement as Percent of Total Shipments
2007 2008, Through July
Figure 3. Blended Cement as a Percent of Total Percent Consumption in the U.S. Source: Adapted from USGS, 200838
18
0
500,000
1,000,000
1,500,000
2,000,000
2,500,000
3,000,000
3,500,000
4,000,000
1990 1991 1992 1993 1994 1995 1996 1997 1998 1999 2000 2001 2002 2003 2004 2005 2006
Met
ric
To
ns
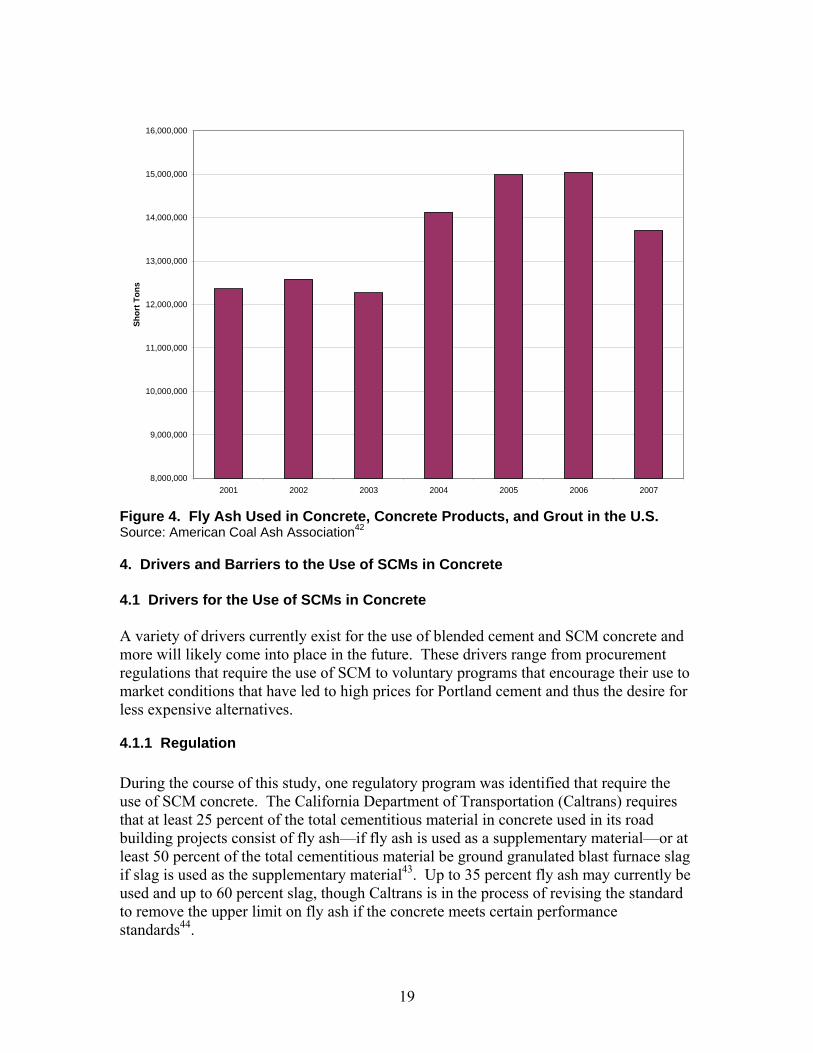
Figure 4. Ground Granulated Blast Furnace Slag Used as a Cementitious Additive in the U.S. Source: Adapted from USGS, 200439, 200540, 200741 Data for fly ash consumption also shows a generally increasing trend. Figure 5 illustrates the increase in consumption of fly used for producing concrete, concrete products, and grout. Additional amounts of fly ash are used for producing blended cement at cement plants, but these figures are not shown because the consumption for blended cement is combined with fly ash used as raw material in the cement kiln. Fly ash used as a cement ingredient in the kiln does not provide the same GHG emissions reduction benefit as fly ash used for cement blending. Both Figures 4 and 5 show a slight decline in the use of SCM in the most recent years for which data are available. These declines should not be viewed as a decrease in interest in SCMs. Rather they reflect the downturn in the economy and the general decrease in concrete consumption.
19
8,000,000
9,000,000
10,000,000
11,000,000
12,000,000
13,000,000
14,000,000
15,000,000
16,000,000
2001 2002 2003 2004 2005 2006 2007
Sh
ort
To
ns
Figure 4. Fly Ash Used in Concrete, Concrete Products, and Grout in the U.S. Source: American Coal Ash Association42
4. Drivers and Barriers to the Use of SCMs in Concrete
4.1 Drivers for the Use of SCMs in Concrete
A variety of drivers currently exist for the use of blended cement and SCM concrete and more will likely come into place in the future. These drivers range from procurement regulations that require the use of SCM to voluntary programs that encourage their use to market conditions that have led to high prices for Portland cement and thus the desire for less expensive alternatives.
4.1.1 Regulation
During the course of this study, one regulatory program was identified that require the use of SCM concrete. The California Department of Transportation (Caltrans) requires that at least 25 percent of the total cementitious material in concrete used in its road building projects consist of fly ash—if fly ash is used as a supplementary material—or at least 50 percent of the total cementitious material be ground granulated blast furnace slag if slag is used as the supplementary material43. Up to 35 percent fly ash may currently be used and up to 60 percent slag, though Caltrans is in the process of revising the standard to remove the upper limit on fly ash if the concrete meets certain performance standards44.
20
The Caltrans procurement requirement does not regulate the production of cement or concrete but rather its consumption by one government agency. Since anyone selling concrete to Caltrans has to meet this standard, however, emission reductions from the blended cement or SCM concrete provided to the agency would not be eligible for offset credits as their use would reflect baseline emissions. Thus, if the Cool Climate Concrete project approach were being applied, offset credits could not be claimed for concrete supplied for Caltrans projects unless it could be shown that the amount of SCM used exceeded what would normally be used to meet the Caltrans requirements. At present, there are no regulations in the U.S. that require cement plants to produce blended cement or concrete batch plants to produce SCM concrete. Given the magnitude of GHG emissions that result from the production of cement, however, cement plants are included in proposed, federal cap-and-trade legislation to control GHG emissions from cement production. Therefore, the baseline emissions will likely change in the future as legislation is passed and emission reductions regulations promulgated. Within the state of California, emissions from cement production will be regulated under Assembly Bill 32 (AB32). At this time, it is unclear exactly what form these regulations will take. If an allowance trading program is implemented that covers cement plants, production of blended cement at the plants would likely be one option that manufacturers could use to meet their emissions limitation. In that case, a voluntary offset program for blended cement would duplicate the regulatory program and therefore would not be feasible. Similarly, if a trading program based on the GHG emissions performance of concrete were established, a voluntary offset program would not be possible. Although it seems unlikely to do so, if the state were to set a GHG performance standard for all cement or concrete sold within California, and did not use a market-based approach, a voluntary emissions offset program could be established to reward emission reductions beyond the mandated levels. If regulations are enacted that directly or indirectly require certain types of emission reductions from cement, the reductions from these regulations would be treated in the same manner as those resulting from Caltrans procurement regulations. They could not be counted as offset credits, as they would have occurred as business as usual in compliance with the regulations. Other procurement guidance in California varies with respect to its treatment of SCM concrete. The “Greenbook” is a widely used set of standards adopted by agencies in southern California for public works projects45. The Greenbook includes standards for the use of SCM concrete, but does not specifically require or encourage their use.
4.1.2 EPA Procurement Guidelines
While not having the force of a regulation, procurement guidelines may also serve as a driver to increased use of blended cement and SCM concrete. At the Federal level, the U.S. Environmental Protection Agency (EPA) has developed Comprehensive Procurement Guidelines, which include the use of recovered materials such as fly ash and

21
ground granulate blast furnace slag in cement and concrete. According to the guidelines46: EPA recommends that procuring agencies consider the use of all of these recovered materials and choose the one (or the mixture of them) that meets their performance requirements, consistent with availability and price considerations. The guidelines do not specify any particular substitution rates for the SCM, but do note that fly ash typically replaces between 20 and 30 percent of the cement and that ground granulated blast furnace slag may replace up to 70 percent. EPA recommends that procuring agencies allow the use of SCM in all construction projects where they are appropriate. Thus while federal agencies are required to follow these procurement guidelines, the guidelines themselves to not require the use of SCMs as the Caltrans procurement regulations do. (Some suppliers of these materials believe there are too many exceptions in the guidelines to make them effective in promoting demand for SCMs.) If, however, the procuring agencies specify that SCMs must be used, then vendors responding to their requests would effectively be in the same position as vendors who respond to Caltrans solicitations—namely supplying blended cement or SCM concrete because the customer requires it. Their actions to provide supplementary cementitious materials would be considered to be business as usual, as they would merely be meeting the demands of their customers.
4.1.3 LEED Certification
Voluntary building standards can also serve as a driver for the increased use of blended cement and SCM concrete. The U.S. Green Building Council has developed the Leadership in Energy and Environmental Design (LEED) rating system to serve as a benchmark for the design, construction, and operation of high performance green buildings47. The LEED rating system allows participants to earn various ratings based on the number of points the subject building receives in various categories. While the use of blended cements or SCM concrete is not required to achieve any particular LEED rating, their use can earn the project proponents points in several LEED categories. Trade groups for both slag cement and fly ash have recognized that the use of their products can benefit those seeking LEED certification and have provided guidance to help them do so. The Slag Cement Association, for example, has published LEED-NC™ Guide: Using Slag Cement in Sustainable Construction48, which describes how slag cement can be used to earn up to 10 of the 26 LEED points needed for the basic certification of a LEED (new construction) building. A guide like that produced by the Slag Cement Association was not found for fly ash blended cement. Two of the largest fly ash marketers, Headwaters Resources and Boral Materials Technologies, Inc., however, provide information on their websites on the use of fly ash to help achieve LEED certification49,50. Similarly, the Portland Cement Association provides information on its website on the use of slag and fly ash blended cement to earn LEED certification points51.
22
The architect or project specifier for a building that is being designed to achieve LEED certification will determine whether blended cement or SCM concrete will be used in its construction. If this is the case, those supplying the concrete would be required to meet the selected product specification and again, as in the case of Caltrans procurement regulations, they would be unable to claim their actions went beyond business as usual. Instead, it would be more appropriate to credit the party that is seeking the LEED certification, rather than the SCM concrete supplier, since it is the actions of that party that directly lead to the increased use of the SCM.
4.1.4 Cost Savings
The high cost of Portland cement in recent years—$90 to $100 per tonne—has provided an economic incentive for the use of SCM. Both fly ash and ground granulated blast furnace slag are priced at a discount to Portland cement to promote their use. Therefore, ready-mix plants, if not the end user, benefit financially from using them to displace Portland cement in concrete. Nevertheless, the increased use of blended cement and SCM concrete faces a number of barriers, which a small cost advantage (or low offset credit price) are not sufficient to overcome. These barriers are discussed in the next section.
4.2 Barriers to the Use of SCMs in Concrete
The drivers described in the previous section and the data presented in the charts above demonstrate that fly ash and ground granulated blast furnace slag can be and are being used in blended cement and SCM concrete in the U.S. Therefore, the question of barriers to their use is not one of why they are not being used, but rather why their use is not more widespread. Several different types of barriers currently exist to the use of blended cement and SCM concrete in the U.S. A recent report to Congress addresses the question of the use of “recovered mineral components,” including fly ash and ground granulated blast furnace slag, in federal procurements involving cement and concrete52. That report describes several barriers to the increasing use of fly ash and ground granulated blast furnace slag. Based on the information in that report, and the information developed for this paper, the barriers may be grouped into the following categories in decreasing order of importance:
Regulatory and Contractual, Technical, Economic, and Perceived Safety and Health Risks.
4.2.1 Regulatory and Contractual Barriers
At the same time that regulations or procurement guidelines in some jurisdictions require or promote the use of blended cement and SCM concrete, in others, their use is

23
prohibited. In Los Angeles County, for example, the “Brown Book” defines specifications for public works projects53. Unlike the Caltrans specifications, which require the use of blended cement, or the Greenbook specifications, which allow it, the Brown Book specifications do not allow the use of fly ash as an SCM in concrete54. Bidding procedures for blended cements and SCM concrete are reported to have improved, although barriers still exist. In general, most state departments of transportation do allow the use of blended cement for roadway construction55, but do not explicitly recommend that it be used. Standards for ternary mixtures—those that contain both fly ash and ground granulated blast furnace slag—are still evolving, however. A greater barrier to the specification of SCM concrete in the contracts for building projects is educational. Those responsible for construction projects are often reluctant to specify new materials with which they are unfamiliar, unless they can be sure of their performance. Even is cases where there are no regulatory or technical barriers to the use of SCM concrete, specifiers may be reluctant to switch from conventional concrete. (To overcome this barrier, both CDM projects to increase the use of blended cement and the Cool Climate Concrete project methodology contain educational components to increase the use of SCM.)
4.2.2 Technical Barriers
Technical barriers to the use of SCM concrete relate primarily to the longer time it takes to reach full strength as measured by standard industry tests. As the report to Congress notes, this characteristic has led to concerns that project schedules may be delayed, and thus that SCM concrete should not be used after certain dates in the fall of the year. Research to address the lower early-age strength has been conducted by the National Ready Mix Concrete Association with the goal of increasing the acceptability of high volume fly ash in concrete56. A more significant technical barriers that is cited may be that some state department of transportations do not accept American Society for Testing and Materials (ASTM) performance standards for blended cement and there is a lack of harmonization between ASTM and American Association of State Highway and Transportation Officials (AASHTO) specifications for blended cement. A lack of high quality fly ash and storage limitations at concrete batch plants is sometimes cited as a barrier to SCM use, including in the report to Congress, though this appears to be less true today. Neither of these technical barriers were cited as significant issues (at the current rates of fly ash consumption) by a fly ash marketer contacted for this study, however57. Air pollution regulations on nitrogen oxide and mercury emissions from coal-fired power plants lead to fly ash with a greater carbon content, making it less desirable, or in some cases, not useable in blended cement or SCM concrete. While this may be a constraint on
24
the ability of some power plants to produce acceptable fly ash, overall in the U.S., there is a large excess of suitable fly ash available.
4.2.3 Economic Barriers
The extent to which economic barriers to the use of SCM exist depend on the geographic relationship between the supplies of the SCMs and their point of use. Fly ash is generally available throughout the country either locally or by rail. Although the report to Congress cites an estimate that coal combustion products (fly ash) can be shipped economically only within a hundred miles of a power plant, rail shipments of hundreds of miles are routinely made to California. At high cement prices, fly ash suppliers can undercut the price of Portland cement even with relatively large transportation costs. Producers of granulated blast furnace slag are much more limited than those of fly ash, and thus the economics of domestic granulated blast furnace slag are more dependent on the location where it is used in relation to where it is produced. All of the blast furnaces in the U.S. are located east of the Mississippi River. Rail shipment to the western states would be much greater than for fly ash, and are not generally considered to be economic. Granulated slag can be economically transported by ship, however, and is regularly imported from other countries. On the west Coast, Lafarge grinds granulated slag imported from Japan at its facility in Seattle, Washington. Because SCMs serve as cement substitutes, their price is tied to the market price for Portland cement. When the price of cement is high, as it has been in recent years, the economic barriers to their use are reduced. For ground granulated blast furnace slag, the cost of infrastructure to produce it must also be considered. Unlike fly ash, which is a byproduct that can be used without further processing (assuming carbon levels are low enough), blast furnace slag must first be granulated as it is produced at the blast furnace, and then it must be ground before use. Only about one fourth of the blast furnace slag produced in the U.S. is reported to be granulated58. While this may be seen as a constraint on domestic supplies, it may also reflect the fact that demand has not matured the point that slag producers are confident enough to make investments in additional granulation capacity. At present, all grinding of granulated slag in the U.S., occurs at cement plants59, since the mills that are used to grind cement clinker can also be used for grinding slag. Since grinding capacity is controlled by cement producers, there is some question of how much interest they have in selling a ground granulated slag to third party concrete batch plants when it will compete with the Portland cement they produce. There has been some discussion of a stand-alone slag grinding facility in California, but any decisions on whether it will be built apparently depend on the what form GHG emissions regulations in the state take.
25
4.2.4 Perceived Safety and Health Risk Barriers
Perceived safety and health risk barriers to the use of SCMs pertain primarily to the use of fly ash. The most common means of controlling mercury emissions from power plants involves the injection of carbon into the flue gas to absorb the mercury and the subsequent removal of that carbon with the fly ash. The report to Congress describes the potential health risks of this mercury in SCM concrete as negligible, and a recent review of the literature by The Loreti Group for a report to the California Energy Commission suggested the same60. Nevertheless, the Collaborative for High-Performance Schools (CHPS) in California and elsewhere have set mercury limits in fly ash ranging from 11 and 5.5 parts per billion, respectively (the different limits resulting from different analytical methodologies)61. The U.S. Green Building Council is reportedly considering a standard of 2 ppb for its LEED Healthcare certification program. At present perceived health risks concerns cannot be considered to be significant barriers to the use SCM concrete because the current limitations affect such a small part of the market. If widely adopted, these concerns may be more significant. The American Coal Ash Association believes most ash will meet the California standard62 although the limitation will require more testing. The lower standard being considered for the LEED Healthcare program may have a larger effect if it is implemented.
5. Related Environmental Impacts from the Use of SCMs
In addition to the GHG emission reductions that result from the use of blended cement and SCM concrete, a number of associated environmental benefits result. Reduced clinker production means less kiln fuel (principally coal) will be burned to produce the cement thus reducing emissions of conventional air pollutants, such as oxides of nitrogen and particulate matter, as well as emissions of trace substances from the kiln. The reduction in clinker production will also result in less resource consumption for the kiln fuel, as well as the raw materials going into the kiln, primarily limestone. At the same time, use of SCMs eliminates the potential environmental impacts associated with fly ash disposal and the stockpiling of blast furnace slag. Potential increased environmental impacts may result from the additional transportation of the SCMs to make the blended cement or SCM concrete. Aside from additional GHG emissions, which would represent leakage, the additional transport would lead to greater emissions of conventional air pollutants. The magnitude of this impact will depend, however, on how far the fly ash or ground granulated blast furnace slag are transported compared to the cement that they displace. There are also differences between the processing of fly ash and slag and cement clinker that should be considered. Fly ash does not need to be ground before it is blended with the cement, thereby reducing the energy (electricity) consumption associated with grinding the displaced clinker. Some fly ashes require processing to reduce their carbon content, however, possibly leading to additional air pollutant emissions. Again, the

26
additional GHG emissions associated with the grinding would need to be considered as possible leakage, while increased emissions of conventional pollutants associated with the additional electricity consumption would represent an additional environmental impact. For ground granulated blast furnace slag, the situation with respect to cement clinker is the reverse of that for fly ash. Because the slag is harder than cement clinker, it requires additional grinding energy and thus electricity consumption. Nevertheless, the effect of the additional energy consumption for slag (or possibly fly ash) processing and any additional transportation they may require are believed to be small in comparison to the benefits of reducing cement clinker demand.
6. Issues Related to Boundaries, Leakage, Ownership, and Market Interest
The project boundaries for assessing GHG emission reductions from the use of blended cement and SCM concrete are closely related to the question of emissions leakage and offset ownership. The question of offset ownership is also related to the potential interest of parties in participating in the market, as parties that may have an ownership interest will be more interested in participating in the market. For this reason, these three areas are considered together in this section.
6.1 Boundaries
The boundaries of blended cement and SCM concrete emission reduction processes may be best understood by considering the processes by which fly ash and ground granulated blast furnace slag become part of concrete. Since these processes differ slightly depending on which SCM is being considered, they are shown separately below. Processes in parentheses may or may not occur in the production of SCM concrete. Blast Furnace Slag Production>>>Slag Granulation at Blast Furnace >>>Slag Grinding>>>(Cement Blending)>>>Concrete Production at Batch Plant Fly Ash Production at Power Plant>>>(Fly Ash Processing)>>>Fly Ash Supplier>>>(Cement Blending) >>>Concrete Production at Batch Plant Figure 6. Steps in the Use of SCM to Produce Concrete The boundaries for assessing emission reductions may be drawn in several different ways. Since the production of blast furnace slag and fly ash are a byproduct of other industrial processes, they will be produced regardless of whether they are used as SCMs. For ground granulated blast furnace slag, however, granulation is but one option for handling the slag that is produced, although GHG emissions associated with the granulation are expected to be small. Slag grinding should be included in the boundary because of the additional energy required, and emissions associated with the transport of SCMs over large distance may need to be also. Figure 6 does not show the cement plant (or plants) that are used to make the cement that goes into the concrete mix. In the CDM methodology described in Section 2, the project
27
proponent is the cement plant, and the reduction in emissions at the plant are key to assessing the boundary. In the Cool Climate Concrete program, the cement that is displaced is not associated with any particular cement plant. Instead, the emissions intensity of the cement that would have been consumed at the company level (concrete batch plant) or project level is key to calculating the emission reductions. While either approach may be used to establish offset credits, the Cool Climate Concrete methodology reflects the reality that the vast majority of the consumption of SCM occurs in the production of SCM concrete at batch plants rather than the production of blended cement at cement plants.
6.2 Leakage
If GHG emission reduction credits are to be awarded to projects that reduce emissions from cement manufacture through the use of blended cement or SCM concrete, it will be important to ensure that the emission reductions do not result in increased emissions elsewhere. For example, even if all the significant emission sources in the SCM production and use chain illustrated in the previous section are accounted for, net emissions might not be reduced if the blended cement production at one cement plant is increased, while the production at another plant that is not part of the crediting program decreased by an equal amount. The key to achieving the emission reductions is to be sure that within a particular concrete market, cement clinker is being replaced by SCMs. One source of data that could be used as a check for leakage in the production of blended cement are monthly USGS data by geographic area, as listed in Figure 3. If the proportion of total cement shipments within a state (or smaller geographic area) did not increase even after projects to increase blending were implemented, this would be an indication that the increased blending at the plants involved in the project led to reductions in blending (leakage) at other plants. Unfortunately, similar data are not available for the use of SCMs at the ready-mix concrete plants, except at the national level on an annual basis. The CDM methodology addresses this kind of leakage by requiring the project proponent to demonstrate that additional SCM is being used, and that there is not a shortage of the SCM. If there is a shortage, it is presumed that the increase in use a one cement plant merely displaces the use at another. In the U.S., such a scenario is more likely for ground granulated blast furnace slag, for which production is limited, than it is for fly ash which is produced in a large excess.
6.3 Ownership
Reduction in GHG emissions from the use of blended cement and SCM concrete represents are indirect emission reductions. As such, the location or facility where the reduction in emissions takes place may not be owned by the party that is taking action to reduce emissions. Therefore, the possibility of conflicting claims to ownership of the emission reductions needs to be considered and addressed in any program to generate emission offsets.

28
The owner or operator of any of facilities shown in Figure 6, as well as at the cement plant itself, could conceivably claim the rights to emission reductions from blended cement or SCM concrete. Voluntary reporting of GHG emissions and reductions to the U.S. Department of Energy’s 1605b reporting program provides a possible prelude to competing claims for emissions offsets. While no financial benefit is known to be involved, the 1605b reports provide examples of both power plants claiming emission reductions from the use of their fly ash to produced SCM concrete, and cement producers claiming credit for producing blended cement. According to the American Coal Ash Association, coal-fired power plants are interested in using emission reductions from fly ash use to reduce their own GHG emissions63. At present, it is unclear whether contractual claims of ownership are following the ash, however. According to a fly ash supplier in California, the ash is sold without any mention of who may be entitled to the emission reductions64. In the U.S., blast furnace operators typically contract out the handling of slag, usually to divisions of cement companies. According to a representative of the largest iron producer in North America, his company does not currently claim the emission reductions associated with the use of their slag, but may consider addressing ownership in the future when the contract is renewed, particularly if the offsets are expected to increase in value65. In addition to blended cement producers and concrete batch plant operators who may lay claim to the emission reductions, and in practice receive them under the CDM and Cool Climate Concrete programs, consumers of SCM concrete may also try to claim the reductions. In the same way that companies or individuals wish to receive credit for the indirect emission reductions they achieve by improving their efficiency of electricity consumption, building designers and purchasers may wish to obtain the credits for the indirect emission reductions associated with using a less carbon intensive building material in the form of SCM concrete. How competing ownership claims may be resolved is not entirely clear at present. To avoid potential conflicts any program to generate emission offsets should aim to have a clear contractual chain of ownership in the path of SCM generation, processing, and use.
6.4 Market Interest
During the preparation of this paper, a number of individuals at a number of organizations expressed interest in the possibility of the California Climate Action Registry developing a project protocol for blended cement. These individuals and their organizations are listed below, along with other organizations that may have an interest in a protocol but did not directly express it. For each organization, their interest and activity is briefly described.
American Coal Ash Association (ACAA), David Goss, Executive Director. As the trade organization representing fly ash producers and marketers, ACAA is

29
interested in seeing increased use of fly ash in such applications as SCM concrete. ACAA has recently formed a Greenhouse Gas Emissions Trading Task Team to explore GHG emission reduction accounting associated with the use of fly ash as and SCM as well as ways of addressing ownership of the offset credits that are created.
California Department of Transportation, Tom Pyle, Leader, AB32 Cement Sub-Group. As the sole state transportation department in the U.S. that requires the use of SCM concrete, Caltrans is interested in both technical performance of concrete made with SCM as well as its availability and cost for state transportation projects.
California Air Resources Board. The California Air Resources Board is the agency charged with implementing AB32, the California bill regulating GHG emissions from stationary sources. For this reason, the agency is interested in means of reducing emissions from the cement industry, particularly in California.
The Climate Trust, Drew Bryenton, Offset Portfolio Coordinator (Cool Climate Concrete). As the principal sponsor of the only offset program for SCM concrete in the U.S., The Climate Trust is interested in acquiring emission offsets needed by power companies in Oregon. With its experience in operating a program, the Trust is interested in ensuring that the design of other programs results in high quality offsets.
Portland Cement Association (PCA), Andrew O’Hare, Vice President, Regulatory Affairs. The Portland Cement Association is the trade group representing cement producers in the U.S. and Canada. The association complies data on cement plant operations including GHG emissions and the production of blended cement. While the cement industry in the U.S. has not actively promoted the use of SCM concrete, the PCA is interested in the accounting of emission reductions through the use of SCM and other measures.
National Ready Mix Concrete Association. The National Ready Mix Concrete Association represents concrete suppliers. It promotes the use of concrete and provides education on concrete materials, including SCM concrete.
Slag Cement Association: David Weber, Executive Director. The Slag Cement Association is the trade group that represents almost all the ground, granulated blast furnace slag in the U.S. It conducts research and education on the use of slag cement, including its environmental benefits and promotes the use of slag cement.
Cement Companies. As noted above, cement plants in the U.S. have not taken a leading role in promoting SCM concrete. This position is at odds with the corporate goals established by the owners of these plants, many of which have established corporate goals for reducing the clinker fraction in their cement. This discrepancy might be due to the lower degree of integration of concrete producers in the U.S., as compared to other countries, and may change as more concrete batch plants are acquired by cement companies.
Integrated Steel Producers. Integrated steel producers produce pig iron in blast furnaces. The slag byproduct of this process is used to make ground, granulated blast furnace slag. Thus, these producers are interested in the market for granulated blast furnace slag used in SCM concrete both to benefit economically
30
from the slag byproduct and to determine whether to invest in increasing the slag granulation capacity at their blast furnaces.
Power Companies. Power companies are interested in the use of SCM concrete as both suppliers of fly ash and as large emitters of GHGs that they may have to offset. At a minimum, increasing demand for their fly ash relieves coal-fired power plants of a disposal problem. If the same plants can maintain ownership of the emission reduction credits resulting from the use of the fly ash in SCM concrete, then they can also use the credits to offset their own emissions, a particularly attractive option as CO2 emissions from these plants come under regulation in several states.
Fly Ash Suppliers. Most fly ash used in the U.S. is sold through suppliers (brokers). These suppliers have a direct economic interest in promoting the increased use of SCM concrete, even if they do not claim the offset credits themselves.
7. Permanence and Scientific Uncertainty
Unlike some types of GHG emission reduction projects, such as biological or geological sequestration, where questions arise about the magnitude of the emission reductions and their permanence, the reductions associated with blended cement and SCM concrete are considered sound. As long as the emission reduction accounting is done properly, the inherent uncertainty of the reductions and their permanence has not been questioned. One area that may deserve greater scientific understanding is the behavior trace compounds such as mercury in fly ash once the fly ash is used in a concrete mix. As discussed above, the existing literature does not seem to indicate a potential health threat. Additional studies may alleviate concerns that continue to exist, and which may limit the acceptance of fly ash as an SCM.
8. Conclusions
The increased use of blended cement and SCM concrete has a large potential to reduce GHG emissions both in California and the U.S. as a whole. Offset programs for achieving emission reductions through their increased use have been implemented in the U.S. and abroad. In order for the California Climate Action Registry to establish such a program, it will be necessary for it to address two key issues:
Baselines and additionality—a single national performance standard is not recommended due to the relatively wide variation in the current use of blended cement in the U.S. and the variability of the emissions intensity of the cement that would be displaced. Performance standards would most likely have to be developed by concrete market at the state or regional level, depending on data availability.
Ownership—the two existing programs for generating emission reduction credits
take different approaches to where the credits are earned and who owns them.

31
While crediting cement plants for the production of blended cements simplifies the project accounting for the reductions, the reality of the SCMs markets in the U.S. is that most is used at concrete batch plants. A program limited to cement plants would not be able to fully realize the potential of SCMs in the U.S.
While other parties in the SCM supply chain, such as producers, will likely have interests in the emission reduction credits. It is expected that their ownership interests can be handled contractually with the parties to whom they supply their materials. If agreement on these issues can be reached among the parties interested in a blended cement protocol, an offset program could be effective as an additional economic incentive to expand the use of SCMs in the U.S.
9. References
1 Portland Cement Association web site: http://www.cement.org/econ/industry.asp accessed December 16, 2008. 2 Hanle, L.J., K. R Jayaraman, and J. S. Smith, 2004. CO2 Emissions Profile of the U.S. Cement Industry, U.S. Environmental Protection Agency, Washington, D.C. 3 Ibid. 4 PCA, December 2006. U.S. and Canadian Portland Cement Industry: Plant Information Summary. Portland Cement Association, Skokie, Ill. 5 Portland Cement Association web site: http://www.cement.org/econ/industry.asp accessed December 16, 2008. 6 Ibid. 7 U.S. Census Bureau web site accessed December 16, 2008: http://www.census.gov/econ/census02/data/industry/E327320.HTM 8 O’Hare, Andrew. Portland Cement Association, Washington, D.C. Personal communication, December 15, 2008. 9 Calculated from Portland Cement Association Summary of Portland Cement Plant Carbon Dioxide Emissions with Support Data, September 25, 2008 and U.S. Department of Energy, Emissions of Greenhouse Gases report: http://www.eia.doe.gov/oiaf/1605/ggrpt/. 10 USGS, April 2008. Mineral Industry Surveys: Cement in December 2007, U.S. Geological Survey, Reston, Virginia 11 USGS, November 2008. Mineral Industry Surveys: Cement in August 2008, U.S. Geological Survey, Reston, Virginia 12 American Coal Ash Association, 2007 CCP Survey Results: http://acaa.affiniscape.com/displaycommon.cfm?an=1&subarticlenbr=3 accessed November 13, 2008. 13 California Climate Action Registry: Cement Reporting Protocol (December 2005), California Climate Action Registry, Los Angeles, California. 14The Cement CO2 Protocol: CO2 Accounting and Reporting Standard for the Cement Industry, Version 2.0, June 2005, The Cement Sustainability Initiative, World Business Council for Sustainable Development, Geneva. 15 Direct Emissions from the Cement Sector (Draft for Comment through August 2003), Climate Leaders Greenhouse Gas Inventory Protocol Core Module Guidance, U.S. Environmental Protection Agency, Washington, D.C. 16 CDM Executive Board (undated), Revision to the approved consolidated baseline methodology ACM0005: Consolidated Baseline Methodology for Increasing the Blend in Cement Production, ACM0005/Version 4, Valid from 2 November 2007 onwards. 17 CSI, 2008. Benchmark CDM Methodology for the Cement Sector. Cement Sustainability Initiative, World Business Council for Sustainable Development. Poznan, Poland, December 2008. 18 Portland Cement Association, Cement Industry Overview, www.cement.org/econ/industry.asp, accessed November 7, 2008.

32
19 CSI, 2008. 20 Ibid. 21 Ibid. 22 O’Hare, 2008. 23 http://www.coolclimateconcrete.com/index.html 24 Schmoyer, Lura, Cool Climate Concrete Program Manager, Horst, Inc., Kutztown, Penn., personal communication October 24, 2008. 25 Bryenton, Drew, Offset Portfolio Coordinator, The Climate Trust, Portland, Oregon, personal communications October 30-31, 2008. 26 Ibid. 27 Ibid. 28 Schmoyer, 2008. 29 The Greenhouse Gas Protocol for Project Accounting (2005) World Business Council for Sustainable Development, Geneva, World Resources Institute, Washington, D.C. 30Overview of the Climate Action Reserve, Presentation by Joel Levin, Vice President, Business Development California Climate Action Registry, November 5, 2008. 31 Bryenton, 2008. 32 Hanle et al., 2004. 33 Pyle, Tom, CAT Cement Sub-Group Leader, Industry Background and Overview, Presentation, at the ARB Cement Working Group meeting, April 10, 2008, Sacramento, California. 34 U.S. Department of Energy 1605b Voluntary Reporting Program, 2005 data. 35 U.S. Geological Survey, Mineral Commodity Summaries, January 2008 36 Hohne, N., 2008. Sectoral Approach and Development: Input Paper for the Workshop: Where development meets climate—development related mitigation options for a global climate change agreement. Ecofys, Inc. Koln, Germany. September 16, 2008. 37 Slag Cement Association, U.S. Slag Cement Shipments: http://www.slagcement.org/shared/custompage/custompage.jsp?_event=view&_id=445505_c_sU128801_s_i148636 accessed November 13, 2008. 38 U.S. Geological Survey, October, 2008. Mineral Industry Surveys: Cement in July 2008. USGS, Reston, Virginia. 39 U.S. Geological Survey, (undated) 2004 Minerals Yearbook: Slag—Iron and Steel. 40 U.S. Geological Survey, September 15, 2005. Iron and Steel Slag End-Use Statistics. 41 U.S. Geological Survey, December, 2007, 2006 Minerals Yearbook: Slag—Iron and Steel. 42 American Coal Ash Association, 2001-2007 CCP Survey Results: http://acaa.affiniscape.com/displaycommon.cfm?an=1&subarticlenbr=3 accessed November 13, 2008. 43 California Department of Transpiration (Caltrans, 2007) Amendments to May 2006 Standard Specifications, Updated January 5, 2007. 44 Pyle, Tom, California Department of Transportation, Leader, AB32 Cement Sub Group, personal communication October 30, 2008. 45Greenbook: Standard Specifications for Public Works Construction, 2009 Fifteenth triennial edition. BNi Building News, Vista, California. 46 U.S. Environmental Protection Agency, Comprehensive Procurement Guidelines: Cement and Concrete, http://www.epa.gov/epawaste/conserve/tools/cpg/products/cement.htm#recommended accessed November 13, 2008. 47 U.S. Green Building Council website: http://www.usgbc.org/DisplayPage.aspx?CategoryID=19 accessed November 13, 2008. 48 Slag Cement Association (SCA), 2006, LEED-NC™ Guide: Using Slag Cement in Sustainable Construction, SCA, Sugar Land, Texas. 49 Headwaters Resources (undated), How to combat global warming, reduce the production of greenhouse gases, and build a stronger infrastructure. Headwaters Resources, South Jordan, Utah. 50 Boral Materials Technologies Inc., website: http://www.boralmti.com/pages/greenmaterials.html accessed November 13, 2008. 51 Portland Cement Association website: http://www.cement.org/buildings/green_leed.asp accessed November 13, 2008.

33
52 EPA, 2008. Study on Increasing the Usage of Recovered Mineral Components in Federally Funded Projects Involving Procurement of Cement or Concrete to Address the Safe, Accountable, Flexible, Efficient Transportation Equity Act: A Legacy for Users. U.S. Environmental Protection Agency, Washington, D.C., June, 2008. EPA530-R-08-007. 53 “Brown Book” City of Los Angeles, Department of Public Works. Additions and Amendments to the 2006 Edition of the Standard Specifications for Public Works Construction (Formerly Standard Plan S-610) http://eng.lacity.org/techdocs/stdplans/s-600/BB2006.pdf 54 Pyle, 2008. 55 Weber, David, Slag Cement Association, personal communication, October 29, 2008. 56 Obla, Karthikeyan et al. 2008. New Technology-Based Approach to Advance Higher Volume Fly Ash Concrete With Acceptable Performance. National Ready Mix Concrete Association. Silver Springs, MD. 57 Smith, Mitchell, Boral Materials Technologies Inc., personal communication, October 30, 2008. 58 EPA, 2008. 59 Weber, 2008. 60 Loreti, C.P., May 2008. CEC Contract #600-04-024, Work Authorization Number 5, Task 4. Report to the California Energy Commission, Sacramento, California by The Loreti Group, Arlington, Mass. 61 Atles, T.K., 2008. Groups Set Mercury Limits for Fly Ash in Concrete, Green Source, September 22, 2008. 62 Goss, David, American Coal Ash Association, personal communication October 28, 2008. 63 Goss, 2008. 64 Smith, 2008. 65 Osborn, Jonathan, Arcelor Mittal Steel, personal communication, November 6, 2008.