Greenhouse Gas Assessment - Environmental Resources Management
37
Annex R Greenhouse Gas Assessment
Transcript of Greenhouse Gas Assessment - Environmental Resources Management

Annex R
Greenhouse Gas Assessment

The business of sustainability
Zambezi River Authority (ZRA)
Greenhouse Gas (GHG) Assessment
Proposed Batoka Gorge Hydro-Electric Scheme (Zambia and Zimbabwe) on the Zambezi River
18 September 2019
Project No.: 0239269

www.erm.com Version: 2.0 Project No.: 0239269 Client: Zambezi River Authority (ZRA) 18 September 2019
Document details
Document title Greenhouse Gas (GHG) Assessment
Document subtitle Proposed Batoka Gorge Hydro-Electric Scheme (Zambia and Zimbabwe) on the Zambezi River
Project No. 0239269
Date 18 September 2019
Version 2.0
Author Holly Jeans
Client Name Zambezi River Authority (ZRA)
Document history
ERM approval to issue
Version Revision Author Reviewed by Name Date Comments
Draft 1.0 Holly Jeans M. Eddis, D.
Rodewald, and
M. Everett
M. Everett 21.08.2019 Draft for Client
Review /
Comment
Final 2.0 Holly Jeans M. Eddis, D.
Rodewald, and
M. Everett
M. Everett 18.09.2019 Final

www.erm.com Version: 2.0 Project No.: 0239269 Client: Zambezi River Authority (ZRA) 18 September 2019
Signature Page
18 September 2019
Greenhouse Gas (GHG) Assessment
Proposed Batoka Gorge Hydro-Electric Scheme (Zambia and Zimbabwe) on the Zambezi River
Mike Everett
Partner in Charge
Environmental Resources Management (ERM) Southern Africa (Pty) Ltd.
1st Floor | Great Westerford | 240 Main Road | Rondebosch | 7700 | Cape Town | South Africa
© Copyright 2019 by ERM Worldwide Group Ltd and / or its affiliates (“ERM”). All rights reserved. No part of this work may be reproduced or transmitted in any form, or by any means, without the prior written permission of ERM.

www.erm.com Version: 2.0 Project No.: 0239269 Client: Zambezi River Authority (ZRA) 18 September 2019 Page i
GREENHOUSE GAS (GHG) ASSESSMENT Proposed Batoka Gorge Hydro-Electric Scheme (Zambia and Zimbabwe) on the Zambezi River
CONTENTS
CONTENTS
OVERVIEW ............................................................................................................................................. 1
1. INTRODUCTION .......................................................................................................................... 2
1.1 Assessment Objectives.................................................................................................................. 2 1.2 Scope of the Assessment .............................................................................................................. 2 1.3 Relevant Documents, Standards and Guidelines .......................................................................... 2
1.3.1 Zambia GHG Documents, Standards and Guidelines ................................................... 2 1.3.2 Zimbabwe GHG Documents, Standards and Guidelines .............................................. 3 1.3.3 IFC Performance Standards ......................................................................................... 3 1.3.4 African Development Bank (AfDB) Standards .............................................................. 3 1.3.5 European Investment Bank (EIB) Standards ................................................................ 4 1.3.6 European Bank for Reconstruction and Development Bank (EBRD) Standards .......... 4 1.3.7 Hydro-Electric Electricity Generation in Context ........................................................... 4
2. BASELINE .................................................................................................................................... 7
2.1 National GHG Inventories for Zimbabwe and Zambia ................................................................... 7
3. METHODOLOGY ......................................................................................................................... 9
3.1 GHG Emissions Calculations ......................................................................................................... 9 3.1.1 Introduction ................................................................................................................... 9 3.1.2 Impact Assessment Methodology ............................................................................... 10
4. IMPACT ASSESSMENT ............................................................................................................ 14
4.1 Construction Impacts ................................................................................................................... 16 4.1.1 Transport of Materials Emissions ................................................................................ 16 4.1.2 On-Site Fuel Use Emissions ....................................................................................... 17 4.1.3 Land Use Change Emissions ...................................................................................... 17 4.1.4 Impact Assessment Summary .................................................................................... 18
4.2 Operational Impacts ..................................................................................................................... 19 4.2.1 Decay of Reservoir Biomass Material ......................................................................... 19 4.2.2 BGHES Site Operation Emissions .............................................................................. 21 4.2.3 Impact Assessment Summary .................................................................................... 22
5. MITIGATION MEASURES AND RESIDUAL IMPACTS ............................................................ 23
5.1 Construction ................................................................................................................................. 23 5.2 Operation ..................................................................................................................................... 25 5.3 Residual Impacts ......................................................................................................................... 26
List of Tables Table 2.1 World, Zimbabwe and Zambia GHG Emissions () ............................................................ 8 Table 3.1 Global Warming Potential Values .................................................................................. 11 Table 4.1 Emission Sources during Construction and Operation .................................................. 14 Table 5.1 Mitigation Measures ....................................................................................................... 24 Table 5.2 Operational Mitigation Measures ................................................................................... 25
List of Figures Figure 1.1 Lifecycle Emissions from Operation of Power Generation Technologies () ..................... 5 Figure 1.2 Lifecycle GHG Emissions from Different Hydropower ..................................................... 6 Figure 4.1 Carbon dioxide and Methane Pathways in a Freshwater .............................................. 20 Figure 4.2 GHG Emissions from Decay of Biomass Material in the BGHES Reservoir ................. 20

www.erm.com Version: 2.0 Project No.: 0239269 Client: Zambezi River Authority (ZRA) 18 September 2019 Page ii
GREENHOUSE GAS (GHG) ASSESSMENT Proposed Batoka Gorge Hydro-Electric Scheme (Zambia and Zimbabwe) on the Zambezi River
CONTENTS
APPENDIX A OVERVIEW OF EMISSION CALCULATION SHEETS
Acronyms and Abbreviations
Name Description
AfDB African Development Bank
BGHES Batoka Gorge Hydro-Electric Scheme
CO2e Carbon Dioxide equivalent emissions
EBRD European Bank for Reconstruction and Development Bank
EIB European Investment Bank
GHG Greenhouse Gas Emissions
GWP Global Warming Potential
IFC International Finance Corporation
IHA International Hydropower Association
IPCC Intergovernmental Panel on Climate Change
O&M Operations and maintenance
SP Studio Pietrangeli Consulting Engineers
UNFCCC United Nation Framework Convention on Climate Change

www.erm.com Version: 2.0 Project No.: 0239269 Client: Zambezi River Authority (ZRA) 18 September 2019 Page 1
GREENHOUSE GAS (GHG) ASSESSMENT Proposed Batoka Gorge Hydro-Electric Scheme (Zambia and Zimbabwe) on the Zambezi River
OVERVIEW
OVERVIEW
This greenhouse gas (GHG) assessment estimates the emissions contributing to climate change from the proposed Batoka Gorge Hydro-Electric Scheme (hereafter known as the proposed Project or BGHES) during its construction and operation.
The construction of the proposed BGHES includes estimations for emissions associated with the combustion of fuel from the transportation of materials to site, transportation of excavated materials and use of construction plant; and emissions released from biogenic carbon contained within the vegetation that is cleared for the construction sites. The most significant source of GHG emissions during construction is associated with land use change from the clearance of vegetation for the construction sites.
The operation of the proposed BGHES includes estimations for emissions associated with the combustion of fuel from maintenance vehicles as well as from the decay of the remaining biomass submerged within the BGHES reservoir. The most significant source of GHG emissions during operation is associated with the decay of remaining biomass submerged within the BGHES reservoir, which contributes approximately 99.9% of the total emissions (1).
Mitigation proposed to reduce the most significant sources of GHG emissions includes utilising cleared vegetation (wood) for commercial timber and community fuelwood rather than clearance by fire during the construction period, and minimising the amount of biomass available to decay before the BGHES reservoir is inundated. It is suggested that a timber survey be carried out to estimate the amount of commercially viable timber, which could be recovered from the areas that will be cleared of vegetation during construction. It would then be possible to estimate the amount of biomass that would not release GHGs and reduce the impact from land use change emissions.
When the proposed BGHES is compared against fossil fuel electricity generation technologies over the 50 to 100 year Project lifetime, the GHG emissions associated are significantly lower per GWh of electricity generated. Although there is a high initial GHG impact primarily associated with the clearance of vegetation during construction and decay of vegetation from inundation, the emissions over the Project lifetime are significantly lower due to the minimal emissions associated with generating electricity once in operation. This means the BGHES will have a much lower contribution to climate change over its lifetime compared to any fossil fuel electricity generation technologies.
(1) Total emissions, during years 1-25 of BGHES operation have been calculated as 304,614 tCO2e. Of this total, emissions
associated with the decay of remaining biomass amounts to 304,594 tCO2e (equating to 99.99% of the total).

www.erm.com Version: 2.0 Project No.: 0239269 Client: Zambezi River Authority (ZRA) 18 September 2019 Page 2
GREENHOUSE GAS (GHG) ASSESSMENT Proposed Batoka Gorge Hydro-Electric Scheme (Zambia and Zimbabwe) on the Zambezi River
INTRODUCTION
1. INTRODUCTION
This greenhouse gas (GHG) assessment estimates the emissions contributing to climate change from the Batoka Gorge Hydro-Electric Scheme (BGHES), (hereafter known as the proposed Project or BGHES), during its construction and operation phases.
1.1 Assessment Objectives
The objectives for this assessment are:
To undertake GHG modelling and calculation of the construction and operational carbon footprint of the BGHES through an impact assessment.
To contextualise annual emissions against international and national thresholds.
To determine whether expected GHG emissions are deemed to be ‘significant’.
To develop viable mitigation measures and management actions that are designed to reduce any significant GHG emissions.
Assuming the implementation of the suggested mitigation measures and management actions, a residual impact assessment rating has being assigned.
1.2 Scope of the Assessment
The GHG assessment looks at the emissions associated with the BGHES during its construction and operation phases. These can be described as follows:
During construction, GHG emissions are linked with the clearance of vegetation in the construction sites, as well as typical activities associated with construction such as the transportation of raw materials, use of heavy vehicles and on-site power generation (1).
Emissions associated with the BGHES during its operation are related to the decay of biomass in the reservoir and additionally very limited vehicle transport and power generating requirements expected at and around the site.
1.3 Relevant Documents, Standards and Guidelines
1.3.1 Zambia GHG Documents, Standards and Guidelines
Zambia has various climate change-related policies, strategies, projects and programs in response to climate change impacts. These documents are aligned with the National Development Plans (2) and the Vision 2030, both of which support development of a low carbon and climate-resilient development pathway. In 2016, Zambia launched its National Climate Change Policy (3) aimed at stemming the impact of climate change, and introduces a well-structured and coordinated national strategy to effectively tackle the adverse effects of climate change. The policy is driven by the Ministry of National Development.
(1) Scope 3 emissions associated with the mining/manufacture of the raw materials used for construction of the BGHES (e.g.
cement and steel) are considered to be outside the scope of this Assessment. Emissions associated with transportation of
these raw materials to the project site have however been included within the scope of work. (2) Zambia’s latest National Development Plan for 2017-2021 is available at: http://extwprlegs1.fao.org/docs/pdf/zam170109.pdf (3) http://www.lse.ac.uk/GranthamInstitute/wp-content/uploads/laws/8142.pdf

www.erm.com Version: 2.0 Project No.: 0239269 Client: Zambezi River Authority (ZRA) 18 September 2019 Page 3
GREENHOUSE GAS (GHG) ASSESSMENT Proposed Batoka Gorge Hydro-Electric Scheme (Zambia and Zimbabwe) on the Zambezi River
INTRODUCTION
1.3.2 Zimbabwe GHG Documents, Standards and Guidelines
The Zimbabwean National Climate Change Response Strategy ( 1 ) provides a framework for the comprehensive and strategic approach to managing climate change. The response strategy includes climate change policies designed to make Zimbabwe more resistant to climate pressures and help it meet its international carbon-cutting pledges. Of particular note, the National Climate Policy (2) aims to help Zimbabwe put in place the legal structures needed to guide businesses on becoming greener.
1.3.3 IFC Performance Standards
Regarding resource efficiency, including the use of energy and other GHG-relevant activities, the IFC’s Performance Standard 3: Resource Efficiency and Pollution Prevention (3) states that:
The client will implement technically and financially feasible and cost effective measures for improving efficiency in its consumption of energy, water, as well as other resources and material inputs, with a focus on areas that are considered core business activities. Such measures will integrate the principles of cleaner production into product design and production processes with the objective of conserving raw materials, energy, and water. Where benchmarking data are available, the client will make a comparison to establish the relative level of efficiency.
With specific reference to GHGs, the Standard states that:
The client will consider alternatives and implement technically and financially feasible and cost-effective options to reduce project-related GHG emissions during the design and operation of the project. These options may include, but are not limited to, alternative project locations, adoption of renewable or low carbon energy sources, sustainable agricultural, forestry and livestock management practices, the reduction of fugitive emissions and the reduction of gas flaring.
For projects that are expected to or currently produce more than 25,000 tonnes of CO2-equivalent annually, the client will quantify direct emissions from the facilities owned or controlled within the physical project boundary, as well as indirect emissions associated with the off-site production of energy used by the project. Quantification of GHG emissions will be conducted by the client annually in accordance with internationally recognized methodologies and good practice.
As the BGHES is expected to produce more than 25,000 tonnes of CO2-equivalent annually, the project is required to undertake consideration of the emissions associated with the BGHES during its initial design and later operational stages. “Project-related” should be considered to include any emissions related to the construction and operation of the BGHES.
1.3.4 African Development Bank (AfDB) Standards
The AfDB clearly sets out that the impact of climate change on the sustainability of investment projects, and the contribution of projects to global GHG emissions must be systematically considered.
This is outlined as an Operational Standard (OS 4) within its Integrated Safeguards System: “Pollution Prevention and Control, Greenhouse Gases, Hazardous Materials and Resource Efficiency – This safeguard covers the range of impacts of pollution, waste, and hazardous materials for which there are agreed international conventions and comprehensive industry-specific standards that other multilateral development banks follow. It also introduces vulnerability analysis and monitoring of greenhouse gas emissions levels and provides a detailed analysis of the possible reduction or compensatory measures framework” (4).
(1) Government of Zimbabwe, Ministry of Environment, Water and Climate. Available online at:
https://www.climatechange.org.zw/sites/default/files/National%20Climate%20Change%20Response%20Strategy.pdf (2) http://newfour.ncuwash.org/wp-content/uploads/2017/08/Zimbabwe-Climate-Policy-2016.pdf (3) International Finance Corporation, Performance Standard 3, 2012 (4) African Development Bank Group's Integrated Safeguards System, 2013

www.erm.com Version: 2.0 Project No.: 0239269 Client: Zambezi River Authority (ZRA) 18 September 2019 Page 4
GREENHOUSE GAS (GHG) ASSESSMENT Proposed Batoka Gorge Hydro-Electric Scheme (Zambia and Zimbabwe) on the Zambezi River
INTRODUCTION
1.3.5 European Investment Bank (EIB) Standards
The EIB’s Environmental and Social Handbook (1) has Climate Standards which require it’s financing to be aligned with EU climate policy. Of particular note, the EIB is committed to: assessing and reporting the carbon footprint of EIB financed investment projects, their annual aggregate GHG emissions and savings. These are published in the EIB’s Annual Report for each year of finance contract signature (2).
1.3.6 European Bank for Reconstruction and Development Bank (EBRD) Standards
The EBRD’s Protocol for Assessment of GHG Emissions (3) sets out its methodology for how consultants should assess the GHG emissions from projects. The EBRD has assessed the impact on GHG emissions of its direct investments (loan and equity) since 2003. Summaries have been published in the Bank’s annual Environmental or Sustainability Reports since that date. Although in most years all direct investment projects with emissions, or emissions savings, exceeding 20 kt CO2e per annum have been assessed, the focus has been on large projects, i.e. those emitting > 100 kt per annum, mainly in the energy and industrial sectors, which dominate the portfolio GHG footprint.
1.3.7 Hydro-Electric Electricity Generation in Context
Figure 1.1 shows the relative contribution of GHG emissions from the different lifecycle stages over the lifetime of different power generation technologies, clearly showing the GHG benefit of power generation through hydro-electricity in comparison with other more GHG intensive technologies. Figure 1.2 shows GHG emissions over the lifecycle of different hydropower technologies based on a literature review of studies since 1980 carried out by the Intergovernmental Panel on Climate Change (IPCC). Figure 1.2 shows that GHGs (carbon dioxide and methane) associated with the construction and operation of hydro-electric projects are largely due to the decay of reservoir biomass (inundated areas). Moreover, Figure 1.2 shows there is significant variation between schemes depending on the size of the inundated area and the vegetation type and extent of coverage within it.
(1) European Investment Bank, Environmental and Social Handbook, 2018 (2) European Investment Bank, Environmental and Social Handbook, 2013 (3) European Bank for Reconstruction and Development Bank, Protocol for Assessment of Greenhouse Gas Emissions, 2010
www.erm.com Version: 2.0 Project No.: 0239269 Client: Zambezi River Authority (ZRA) 18 September 2019 Page 5
GREENHOUSE GAS (GHG) ASSESSMENT Proposed Batoka Gorge Hydro-Electric Scheme (Zambia and Zimbabwe) on the Zambezi River
INTRODUCTION
Figure 1.1 Lifecycle Emissions from Operation of Power Generation Technologies (1)
(1) Source: World Energy Council, taken from http://www.worldenergy.org/wp-
content/uploads/2012/10/PUB_Comparison_of_Energy_Systens_using_lifecycle_2004_WEC.pdf
www.erm.com Version: 2.0 Project No.: 0239269 Client: Zambezi River Authority (ZRA) 18 September 2019 Page 6
GREENHOUSE GAS (GHG) ASSESSMENT Proposed Batoka Gorge Hydro-Electric Scheme (Zambia and Zimbabwe) on the Zambezi River
INTRODUCTION
Figure 1.2 Lifecycle GHG Emissions from Different Hydropower Technologies (1)
(1) Source: Kumar, A., T. Schei, A. Ahenkorah, R. Caceres Rodriguez, J.-M. Devernay, M. Freitas, D. Hall, Å. Killingtveit, Z.
Liu, 2011: Hydropower. In IPCC Special Report on Renewable Energy Sources and Climate Change Mitigation [O. Edenhofer,
R. Pichs-Madruga, Y. Sokona, K. Seyboth, P. Matschoss, S. Kadner, T. Zwickel, P. Eickemeier, G. Hansen, S. Schlömer,
C. von Stechow (eds)], Cambridge University Press, Cambridge, United Kingdom and New York, NY, USA.

www.erm.com Version: 2.0 Project No.: 0239269 Client: Zambezi River Authority (ZRA) 18 September 2019 Page 7
GREENHOUSE GAS (GHG) ASSESSMENT Proposed Batoka Gorge Hydro-Electric Scheme (Zambia and Zimbabwe) on the Zambezi River
BASELINE
2. BASELINE
The baseline for GHG emissions prior to the development of the BGHES (i.e. – prior to the construction phase) is defined as zero for the purposes of this impact assessment, as it is understood that BGHES will provide additional capacity to meet energy demand rather than displacing existing grid capacity. Construction and operational activities will lead to incremental increases in GHG emissions, primarily due to the consumption of fuel and land use changes.
For context, the annual national emissions of Zimbabwe were 59.9 million tonnes of carbon dioxide equivalent (MtCO2e) in 2010, whilst annual national emissions of Zambia were 396.4 million tonnes of carbon dioxide equivalent (MtCO2e) in 2010. These figures represented 0.12% and 0.78% of global emissions in 2010 (global emissions amounted to 50,911 million tonnes of carbon dioxide equivalent (MtCO2e) (1).
2.1 National GHG Inventories for Zimbabwe and Zambia
Zimbabwe submitted its Third National Communication Update Report (NC3) to the UN Framework Convention on Climate Change in 2017 (2). NC3 includes information on Zimbabwe’s greenhouse gas inventory for the year 2006, measures to reduce emissions (mitigation) and adaptation to climate change.
Zambia submitted its Second National Communication Update Report to the UN Framework Convention on Climate Change in 2014 (3). NC2 summarises the national GHG inventory for the year 2000.
Given that the National Communication reports for Zimbabwe and Zambia only include GHG emissions data up to 2006 and 2000 (respectively), UNFCCC (United Nation Framework Convention on Climate Change) 2010 data has been used in this assessment (4).
Table 2.1 summarises Zimbabwe and Zambia’s emissions from 1990 to 2012, compared with total global emissions. Zimbabwe and Zambia had an estimated 72.1 and 320 million tCO2e (respectively) in 2012, excluding the emissions from land use, land use change and forestry. The countries were therefore responsible for 0.13% and 0.59% (respectively) of global emissions in 2012 and are considered to be low emitters. However, between 1990 and 2012, national emissions grew by 105% in Zimbabwe and 53% in Zambia, whilst global emissions increased by 41% over the same period.
The data available are not sufficiently detailed to show the sector emissions specifically associated with energy for Zimbabwe and Zambia.
(1) Source: Country information from UNFCCC (UNFCCC, 2010), data on current emissions and their share of global emissions
including LULUCF from JRC/PBL (2012) (EDGAR 4.2 FT2010): http://edgar.jrc.ec.europa.eu/overview.php
https://edgar.jrc.ec.europa.eu/overview.php?v=GHGts1990-2012 (2) Source https://unfccc.int/process-and-meetings/transparency-and-reporting/reporting-and-review-under-the-
convention/national-communications-and-biennial-update-reports-non-annex-i-parties/national-communication-submissions-
from-non-annex-i-parties (3) Source: https://unfccc.int/process-and-meetings/transparency-and-reporting/reporting-and-review-under-the-
convention/national-communications-and-biennial-update-reports-non-annex-i-parties/national-communication-submissions-
from-non-annex-i-parties (4) Country information from UNFCCC (UNFCCC, 2010), data on current emissions and their share of global emissions
including LULUCF from JRC/PBL (2012) (EDGAR 4.2 FT2010): http://edgar.jrc.ec.europa.eu/overview.php
https://edgar.jrc.ec.europa.eu/overview.php?v=GHGts1990-2012
www.erm.com Version: 2.0 Project No.: 0239269 Client: Zambezi River Authority (ZRA) 18 September 2019 Page 8
GREENHOUSE GAS (GHG) ASSESSMENT Proposed Batoka Gorge Hydro-Electric Scheme (Zambia and Zimbabwe) on the Zambezi River
BASELINE
Table 2.1 World, Zimbabwe and Zambia GHG Emissions (1)
1990 2000 2010 2011 2012
World
Total Mt CO2e, excluding
LULUCF
38,232.0 40,563.0 50,911.0 53,197.0 53,937.0
Zimbabwe Total Mt CO2e, excluding
LULUCF
35.1 51.4 71.0 71.6 72.1
Relative to 1990 base % - 46.5 102.3 1.309 105.3
Zambia Total Mt CO2e, excluding
LULUCF
209.6 290.8 319.8 320.0 320.3
Relative to 1990 base % - 38.7 52.5 52.6 52.8
(1) Source: https://edgar.jrc.ec.europa.eu/overview.php?v=GHGts1990-2012&sort=asc1

www.erm.com Version: 2.0 Project No.: 0239269 Client: Zambezi River Authority (ZRA) 18 September 2019 Page 9
GREENHOUSE GAS (GHG) ASSESSMENT Proposed Batoka Gorge Hydro-Electric Scheme (Zambia and Zimbabwe) on the Zambezi River
METHODOLOGY
3. METHODOLOGY
3.1 GHG Emissions Calculations
3.1.1 Introduction
The calculation of GHG emissions arising from the BGHES has been calculated using the design specifications provided by the design engineers for the BGHES (Studio Pietrangeli Consulting Engineers (SP)) and for a construction period of 7 years.
The carbon footprint for both the construction and operational phases have been estimated using the documents listed below:
Greenhouse Gas (GHG) Protocol: Corporate Accounting & Reporting Standard (World Resources Institute/World Business Council for Sustainable Development (1);
Intergovernmental Panel on Climate Change (IPCC) 2006 GHG Inventory guidelines (2);
IPCC Special Report on Renewable Energy Sources and Climate Change Mitigation (3);
Green Investment Group - Green Impact Reporting Criteria (4);
ACM0002 - Large-scale Consolidated Methodology Grid-connected electricity generation from renewable sources (v.19.0) (5);
FAO Global Forest Resources Assessments (GFRA) (6);
UK Government GHG Conversion Factors for Company Reporting (7) ;
IFI (Interim) Dataset of Harmonized Grid Factors (v.1.016) (8); and
IGES List of Grid Emission Factors 2019 (v.10.4) (9)
The GHG Protocol Corporate Accounting & Reporting Standard divides emissions into three ‘Scopes’, which are defined as:
Scope 1 – direct emissions from sources owned or under the operational control of the company;
Scope 2 – indirect emissions from the consumption of purchased electricity; and
Scope 3 – indirect emissions an optional reporting category allowing for other indirect emissions associated with, but not controlled by the company.
Emission estimates for BGHES cover those which are under their direct operational control (scopes 1 & 2), with some limited coverage of indirect emissions (scope 3).
(1) Available online at : https://ghgprotocol.org/sites/default/files/standards/ghg-protocol-revised.pdf (2) Available online at: https://www.ipcc-nggip.iges.or.jp/public/2006gl/ (3) IPCC, 2011 – Ottmar Edenhofer, Ramón Pichs-Madruga, Youba Sokona, Kristin Seyboth, Patrick Matschoss, Susanne
Kadner, Timm Zwickel, Patrick Eickemeier, Gerrit Hansen, Steffen Schloemer, Christoph von Stechow (Eds.)
Cambridge University Press, Cambridge, United Kingdom and New York, NY, USA, 1075 pp.Available from Cambridge
University Press, The Edinburgh Building Shaftesbury Road, Cambridge CB2 2RU ENGLAND (4) Available online at: http://greeninvestmentgroup.com/media/157426/gig_green_reporting_1017_02.pdf
(5) Available online at:
https://cdm.unfccc.int/filestorage/5/8/I/58IAGB7SZUDEO2VN6LYM30K41HFPRQ/EB100_repan06_ACM0002.pdf?t=elJ8cHdqa
zN2fDBdFaeroak0uJq7GZc-_jUp (6) Available online at: http://www.fao.org/forest-resources-assessment/en/ (7) 2018 emission factors available online at: https://www.gov.uk/government/publications/greenhouse-gas-reporting-conversion-
factors-2018 (8) Available online at: http://greeninvestmentgroup.com/media/185865/ifi_interim_dataset_of_harmonized_grid_factors_v1-0-
with-cover.xlsx (9) Available online at: https://pub.iges.or.jp/pub/iges-list-grid-emission-factors

www.erm.com Version: 2.0 Project No.: 0239269 Client: Zambezi River Authority (ZRA) 18 September 2019 Page 10
GREENHOUSE GAS (GHG) ASSESSMENT Proposed Batoka Gorge Hydro-Electric Scheme (Zambia and Zimbabwe) on the Zambezi River
METHODOLOGY
Good practice dictates the use of actual activity data (e.g. litres of diesel consumed) for calculating a carbon footprint. Given that the BGHES involves an estimation of a future carbon footprint for activities yet to begin, a number of assumptions have been made in order to forecast the activity data required to undertake this GHG assessment. Calculation assumptions have been referenced within the relevant sections of this repot and are set out within the calculation spreadsheets (Appendix A). It should be noted that limited detail around BGHES construction and operation was available from SP at the time of this assessment. Calculations have therefore been undertaken on the basis of limited data, assumptions and experience of previous hydro-electric projects.
When assessing GHG emissions through the operational phase of BGHES, we have assumed full, normal operability.
3.1.2 Impact Assessment Methodology
A traditional impact assessment is conducted by determining how the proposed activities will affect the state of the environment described in the baseline (Section 2). In the case of GHG emissions, this process is complicated by the fact that the potential impact of GHG emissions on the environment cannot be quantified within a defined space and time.
As mentioned, the greenhouse effect occurs on a global basis and the specific source of GHG emissions cannot be linked directly to the future potential impact on the climate or on the BGHES geography. In the absence of such causal links, this Section presents a methodology that provides an appropriate and practical link between the GHG emissions of the BGHES and the impact assessment process adopted for this assessment.
The magnitude of GHG emissions from the BGHES has been compared to national and international (i.e. IFC) GHG emissions criteria (1).
Identifying Impact Magnitude
The magnitude of GHG emissions is defined as the tonnes of carbon dioxide equivalent (tCO2e), emitted. GHG emissions which should be included in a GHG assessment, as stated by the GHG protocol Corporate Accounting & Reporting Standard (refer to Section 3.1.1), are the six greenhouse gases covered by the Kyoto Protocol. These are:
Carbon dioxide (CO2),
Methane (CH4),
Nitrous oxide (N2O),
Hydrofluorocarbons (HFCs),
Perfluorocarbons (PFCs), and;
Sulphur hexafluoride (SF6)
The quantity of these gases emitted must be multiplied by the gas’ global warming potential (GWP) to convert this into tonnes CO2e. Table 3.1 shows the latest 100 year time horizon GWP’s, relative to CO2 are set out within the IPCC’s Fifth Assessment Report, 2014 (AR5) (2).
(1) International Finance Corporation Performance Standard 3 – Resource Efficiency and Pollution Prevention (2012) (2) IPCC’s Fifth Assessment report, 2014 available online at https://www.ipcc.ch/assessment-report/ar5/

www.erm.com Version: 2.0 Project No.: 0239269 Client: Zambezi River Authority (ZRA) 18 September 2019 Page 11
GREENHOUSE GAS (GHG) ASSESSMENT Proposed Batoka Gorge Hydro-Electric Scheme (Zambia and Zimbabwe) on the Zambezi River
METHODOLOGY
Table 3.1 Global Warming Potential Values
GHG Fifth Assessment Report (AR5)
Carbon dioxide (CO2) 1
Methane (CH4) 28
Nitrous oxide (N2O) 265
Hydrofluorocarbons (HFCs) 4 - 12,400
Perfluorocarbons (PFCs) 6,630 – 11,100
Sulphur hexafluoride (SF6) 23,500
In the absence of national laws relating to the magnitude of GHG emissions from project developments, international standards are used to place project emissions into perspective.
Table 3.2 shows a potential magnitude scale for project-wide GHG emissions that is derived from, and in line with, reporting thresholds adopted by a number of current international lender organisations or groupings, such as the IFC Standards, the European Bank for Reconstruction and Development (EBRD) GHG assessment methodology (1) and the Equator Principles (2).
Table 3.2 Magnitude Scale for Project-Wide GHG Emissions
Project-Wide GHG Emissions / annum Magnitude Rating
>1,000,000 tCO2e Very Large
100,000 – 1,000,000 tCO2e Large
25,000 – 100,000 tCO2e Medium
5,000 - 25,000 tCO2e Small
<5,000 tCO2e Negligible
The IFC’s Performance Standard 3 defines a reporting threshold for annual GHG emissions of 25,000 tonnes of CO2 equivalent (tCO2e) and, as mentioned in Section 1.3.3, requires clients to “…consider alternatives and implement technically and financially feasible and cost-effective options to reduce project-related GHG emissions during the design and operation of the project”.
An annual GHG emissions threshold of 25,000 tCO2e has also been adopted by the EBRD within its Environmental and Social Policy (3). This updated policy reduces the GHG reporting threshold within projects that the EBRD supports from 100,000 to 25,000 tCO2e / year and requires annual client quantification and reporting of these emissions. EBRD guidance on assessment of GHG emissions also defines a series of categories and thresholds for different project types (shown in Table 3.3). Hydroelectric power generation projects are considered likely to fall into the EBRD’s ‘Low’ category.
(1) EBRD Methodology for Assessment of Greenhouse Gas Emissions (2010)
http://www.ebrd.com/downloads/about/sustainability/ghgguide.pdf (2) Available online at: http://www.equator-principles.com/index.php/ep3 (3) EBRD Environmental and Social Policy, 2014. Available online at: https://www.ebrd.com/downloads/research/policies/esp-
final.pdf

www.erm.com Version: 2.0 Project No.: 0239269 Client: Zambezi River Authority (ZRA) 18 September 2019 Page 12
GREENHOUSE GAS (GHG) ASSESSMENT Proposed Batoka Gorge Hydro-Electric Scheme (Zambia and Zimbabwe) on the Zambezi River
METHODOLOGY
Table 3.3 EBRD GHG Emissions Reporting Categories
GHG Emissions / annum Magnitude Description
> 1,000,000 tCO2e High
100,000 – 1,000,000 tCO2e Medium-High
20,000 – 100,000 tCO2e Medium-Low
< 20,000 tCO2e Low
Not defined Negligible
The Equator Principles require all projects, in all locations, to conduct an alternatives analysis to evaluate less GHG intensive alternatives when combined Scope 1 and Scope 2 operational emissions are expected to be more than 100,000 tCO2e annually. In addition, the Equator Principles require that “the client (should) report publicly on an annual basis on GHG emission levels (combined Scope 1 and Scope 2 emissions) during the operational phase for Projects emitting over 100,000 tonnes of CO2 equivalent annually. Clients will be encouraged to report publicly on Projects emitting over 25,000 tonnes.”
Determining Significance
The receptor for GHG emissions is the global climate, and the natural and societal systems and infrastructure which the climate will influence.
In order to conclude whether the potential impact from GHG emissions is deemed significant or not, a risk classification approach is used. The approach is derived from classic risk assessment terminology, which involves the expression of risk as the consequence of the event multiplied by the probability of that event. The environmental assessment equivalent is the magnitude of the impact multiplied by the likelihood of the impact. Impact magnitude is a function of the potential intensity of the impact, moderated by the extent and duration of that impact. Expressed mathematically impact significance is:
Impact significance = (intensity + extent + duration) × likelihood
When considering GHGs, the extent and duration of the potential impact will always be the same. The extent is international as it is the total stock of world GHG emissions (leading to the greenhouse effect) that are directly increased due to the impact of a project. The greenhouse effect is transboundary and so global emissions and national emissions are both directly affected. The duration of the impact is regarded as permanent as the persistence of carbon dioxide in the atmosphere ranges between 100 and 300 years (1) and continues beyond the life of the project. Therefore, the magnitude of the potential impact is directly related to the intensity, or volume of emissions. Likelihood can be defined as ‘Unlikely’, ‘Seldom/Occasional’ or ‘Likely’ (see Table 3.4).
Table 3.4 Likelihood Definitions
Likelihood Criteria
Unlikely Reasonable to expect that the consequence will not occur at this facility during
its lifetime.
Seldom/Occasional Exceptional circumstances/conditions may allow the consequence to occur
within the facility lifetime.
Likely Consequence can reasonably be expected to occur within the life of the facility.
(1) Carbon Dioxide Information Analysis Centre (CDIAC) - http://cdiac.ornl.gov/pns/current_ghg.html Last accessed: 30/01/2015

www.erm.com Version: 2.0 Project No.: 0239269 Client: Zambezi River Authority (ZRA) 18 September 2019 Page 13
GREENHOUSE GAS (GHG) ASSESSMENT Proposed Batoka Gorge Hydro-Electric Scheme (Zambia and Zimbabwe) on the Zambezi River
METHODOLOGY
The magnitude of a potential impact and the likelihood have been assessed in combination to evaluate whether a potential GHG impact is significant and if so, its degree of significance. This is illustrated in Table 3.5.
Table 3.5 GHG Impact Significance Rating
LIKELIHOOD
Unlikely Seldom/ Occasional Likely
M
AG
NIT
UD
E
High Major Major Major
Medium-High Moderate Major Major
Medium-Low Minor Moderate Major
Low Negligible Minor Minor
Negligible Negligible Negligible Negligible

www.erm.com Version: 2.0 Project No.: 0239269 Client: Zambezi River Authority (ZRA) 18 September 2019 Page 14
GREENHOUSE GAS (GHG) ASSESSMENT Proposed Batoka Gorge Hydro-Electric Scheme (Zambia and Zimbabwe) on the Zambezi River
IMPACT ASSESSMENT
4. IMPACT ASSESSMENT
As discussed in Section 3, it is not possible to link emissions from a single source, such as the BGHES, to particular impacts in the broader study area. This study, therefore, looks at the potential impact of the BGHES on Zimbabwe and Zambia’s National GHG Inventory and the likely implications of this rather than the potential physical impacts of climate change.
A full outline of data used and assumptions made is included in data supplied within the calculation spreadsheets (Appendix A). It should be noted that limited detail around BGHES construction and operation was available from SP at the time of this assessment. Calculations have therefore been undertaken on the basis of limited data, assumptions and experience of previous hydro-electric projects.
GHG sources associated with the construction and operation of the BGHES are listed within Table 4.1. Due to a number of factors, not all of the listed emission sources have been included within the assessment. Reasons for exclusion are also provided within Table 4.1.
Table 4.1 Emission Sources during Construction and Operation
Project
Phase
Source Included Reason for Exclusion
Construction Transport of materials (for the dam,
access roads and transmission
lines)
Yes N/A
Construction Transport of generation equipment No No data on equipment type, weight,
volume, origin, mode of delivery transport,
pre-assembly was available for ERM use
at the time of the assessment.
Construction On-site fuel use Yes N/A
Construction Land use change of Project areas
(including dam site, project
townships, access roads and for
transmission lines)
Yes Land use change associated with the
potential quarry sites excluded due to lack
of available data and also uncertainty
around whether these area(s) will be
excavated.
Construction Quarry emissions (quarrying and
internal transportation)
No Excluded due to uncertainty of the extent
of the quarry areas. In addition lack of
available data (e.g. quantity of aggregate
required, machinery employed) meant that
it was not possible to develop a proxy
GHG figure for this activity.
Construction Construction of two project
townships
No Constriction of the two project townships
was excluded due to lack of available data
around these activities. Land use change
associated with the two project townships
was included (see above).
Construction Waste management activities No Given the uncertainty on exact details for
waste management of the BGHES,
emissions associated with BGHES
construction waste is classified as scope 3
(indirect).
It is understood that extracted materials
(which will make up the majority of
www.erm.com Version: 2.0 Project No.: 0239269 Client: Zambezi River Authority (ZRA) 18 September 2019 Page 15
GREENHOUSE GAS (GHG) ASSESSMENT Proposed Batoka Gorge Hydro-Electric Scheme (Zambia and Zimbabwe) on the Zambezi River
IMPACT ASSESSMENT
Project
Phase
Source Included Reason for Exclusion
construction waste), will be diverted to
form construction aggregate. As a result a
significant proportion of the construction
waste is reused onsite. Should any of the
extracted material be sent for landfill, it is
considered to be a low emitting material,
so would likely have minimal GHG
implications. No data was available on
other construction wastes (quantity,
composition, disposal route), however it is
unlikely that these waste streams will be
significant.
Operation Decay of reservoir biomass
(inundation)
Yes N/A
Operation On-site fuel use during site
operation (Operations and
Maintenance - vehicle movements)
Yes N/A
Operation Waste management activities:
No Given the uncertainty on exact details for
waste management of the BGHES,
emissions associated with BGHES
operational waste is classified as scope 3
(indirect).
No data was available on operational
wastes from BGHES or the two project
townships (quantity, composition, disposal
route), however it is unlikely that these
waste streams will be significant.
It is likely that the two project townships
will not remain in the direct control of
BGHES following construction. In this
instance, domestic waste from the two
project townships would not be part of the
BGHES waste inventory.
Operation Operation of the two project
townships
No Emissions associated with the operation
of the project townships have been
excluded from the assessment due
available data. It is likely that the two
project townships will not remain in the
direct control of BGHES following
construction, in which case all emissions
associated with the townships will be
categorised as scope 3 (indirect).
Operation Sulphur hexafluoride (SF6) and
refrigerants, within electrical circuit
No No data on the possible use of SF6 within
electrical circuit breakers or refrigerants
within air cooling units was available and

www.erm.com Version: 2.0 Project No.: 0239269 Client: Zambezi River Authority (ZRA) 18 September 2019 Page 16
GREENHOUSE GAS (GHG) ASSESSMENT Proposed Batoka Gorge Hydro-Electric Scheme (Zambia and Zimbabwe) on the Zambezi River
IMPACT ASSESSMENT
Project
Phase
Source Included Reason for Exclusion
breakers/switchgear and air cooling
units.
therefore potential fugitive emissions from
these sources have been excluded from
the assessment.
4.1 Construction Impacts
4.1.1 Transport of Materials Emissions
Emissions are associated with the transport required to deliver materials, predominantly cement, fly ash and steel to and around the BGHES construction areas. It has been assumed that the vehicles used for delivery of raw materials to and around the site will be owned and operated by BGHES and therefore sit within the scope 1 emissions category.
The base data provided by SP for undertaking the calculation estimates is shown in Table 4.2. According to SP, there will not be any aggregate transportation to the site, as it is intended that excavated material will be used as an aggregate in the concrete required for construction. If the aggregate is of insufficient quality, it is intended that alternative aggregate will be extracted from the on-site quarry. In the absence of certainty on data around the potential quarry sites, emissions associated with this activity (quarrying and transportation) have been excluded from the GHG assessment.
In the absence of data, transportation of materials associated with construction of the two project townships has been excluded from the assessment, as has emissions around transportation of generation equipment.
Table 4.2 Materials Requiring Transportation
Construction Location Item Volume Unit
Dam and associated generation
areas
Cement 65,143 tonnes
Dam and associated generation
areas
Reinforcing Steel 8,571 tonnes
Transmission lines Steel lattice towers 1,517 tonnes
Transmission lines Cement 150 tonnes
Road Construction material 67,168 tonnes
In the absence of data, a range of assumptions were made around the transportation vehicles used and distance travelled to the collection points. Based on estimated volumes (set out in Table 4.2), number of trips /total distance were calculated and the estimated tCO2e calculated (set out in Table 4.3).
Table 4.3 Emissions Associated with Transportation of Materials
Part of Journey Total Journeys
(number)
Total Distance
(km)
Conversion Total
Full Leg 6,480 259,181 0.89125 kg CO2e/km 231 tCO2e
Empty (return) leg 6,480 259,181 0.67174 kg CO2e/km 174 tCO2e
Total 405 tCO2e

www.erm.com Version: 2.0 Project No.: 0239269 Client: Zambezi River Authority (ZRA) 18 September 2019 Page 17
GREENHOUSE GAS (GHG) ASSESSMENT Proposed Batoka Gorge Hydro-Electric Scheme (Zambia and Zimbabwe) on the Zambezi River
IMPACT ASSESSMENT
Construction emissions associated with materials transport were estimated as an average 57.9 tonnes CO2e per year over the construction period (1), equating to 405 tCO2e over the whole construction period. On the basis of the estimations set out above, annual construction emissions associated with transport of materials therefore amount to less than 1% of Construction Activity Fuel Use Emissions.
Construction emissions associated with materials transport are classified as having a Low magnitude according to the EBRD GHG emission reporting categories (refer to Table 3.3 in Section 3.1.2) and emissions likelihood is considered to be Likely (see Table 3.4 likelihood definitions). As a result, the average annual emissions and are considered to be Minor, as set out within the GHG Impact Significance Rating matrix (Table 3.5 in Section 3.1.2).
4.1.2 On-Site Fuel Use Emissions
There will be demand for fuel for excavation and construction machinery and on-site power generation (including power generation for the project townships). Table 4.4 shows fuel demands associated with the BGHES. The calculation is based on an estimated daily consumption of mineral diesel over a 7 day working week, provided by SP.
Table 4.4 On-Site Fuel Use for Construction Activities
Area Item Value Conversion Annual
Emissions
Fuel use for excavation &
construction machinery and on-
site power generation
1,274,000
Mineral diesel
litres per year 2.688 kg
CO2e/litre
3,424 tCO2e
Construction emissions associated with the excavation and construction machinery and on-site power generation have been estimated as 3,424 tCO2e/year, equating to 23,970 tCO2e over the whole construction period (7 years). On the basis of the estimations set out above, annual fuel use emissions are estimated to be less than 5% of average annual construction emissions.
Construction emissions associated with on-site fuel use are classified as having a Low magnitude according to the EBRD GHG emission reporting categories (refer to Table 3.3 in Section 3.1.2) and emissions likelihood is considered to be Likely (see Table 3.4 likelihood definitions). As a result, the average annual emissions and are considered to be Minor, as set out within the GHG Impact Significance Rating matrix (Table 3.5 in Section 3.1.2).
4.1.3 Land Use Change Emissions
GHG emissions will result from land clearance in the areas required for construction of BGHES infrastructure and inundation following construction of the dam. GHGs resulting from clearance will be determined by the current use of the land, and how much carbon is estimated to be stored within it. The different land uses and their associated areas for BGHES are shown in Table 4.5. The area totals for each of the land use types has been calculated from data provided within the BGHES documentation or estimated, based on likely areas. It is understood that the reservoir area will not be cleared of vegetation extensively before inundation.
SP have indicated that in the first instance excavation materials from BGHES will be used as aggregate for the BGHES construction. Should this aggregate be of insufficient quality or quantity, it is understood that aggregate will be taken from the proposed quarry sites. According to SP, there is still uncertainty
(1) Distribution of materials transport within the construction period is unknown. In order to provide an average annual emissions
figure, the total construction emissions associated with materials transport, it has been assumed that transport is spread evenly
across the 7 year construction period.

www.erm.com Version: 2.0 Project No.: 0239269 Client: Zambezi River Authority (ZRA) 18 September 2019 Page 18
GREENHOUSE GAS (GHG) ASSESSMENT Proposed Batoka Gorge Hydro-Electric Scheme (Zambia and Zimbabwe) on the Zambezi River
IMPACT ASSESSMENT
on data around the potential quarry sites. As a result of this uncertainty, emissions associated with land use change across the potential quarry areas has been excluded from the calculations.
Table 4.5 Land Use Types and Total Areas of Land Use Change
Current land use Area Units Existing land
use
Conversion Units
Transmission lines 0.44 ha Wooded
Grassland
165 tCO2e/ha
Roads 178.00 ha Wooded
Grassland
165 tCO2e/ha
Project townships 420.00 ha Wooded
Grassland
165 tCO2e/ha
Impoundment area 2,200.00 ha Wooded
Grassland
165 tCO2e/ha
Surface power plants,
switch yards and
batching areas
0.30 ha Wooded
Grassland
165 tCO2e/ha
Total land area
changed
2,799.00 ha Wooded
Grassland
Converted totals 461,835.00 tCO2e
Construction emissions associated with the land use change have been estimated at 461,835 tCO2e. The majority of emissions associated with land use change will occur at the time of the disturbance, which is likely to occur towards the beginning of the construction phase. In the absence of detailed information around construction schedules, land use change emissions have been spread across the 7 year construction period, equating to an estimated annual emission of 65,976 tCO2e/year.
Whether land use change emissions occur within year 1 or split to provide an average annual emissions across the 7 year constriction period, these emissions account for 99% (emissions occurring within year 1) or 94.9% of average annual construction emissions.
Construction emissions associated with land use change are classified as having a Medium-High (emissions occurring within year 1) or Medium-Low magnitude (spread equally across the 7 year construction period) according to the EBRD GHG emission reporting categories (refer to Table 3.3 in Section 3.1.2) and emissions likelihood is considered to be Likely (see Table 3.4 likelihood definitions). As a result, the average annual emissions (years 1 to 7) are considered to be Major as set out within the GHG Impact Significance Rating matrix (Table 3.5 in Section 3.1.2).
4.1.4 Impact Assessment Summary
The total expected GHG emissions for the 7 year BGHES construction period and associated GHG emission impact significance is summarised in Table 4.6.
Table 4.6 Total Expected Construction GHG Emissions
Item Estimated
annual
emissions
Estimated total
construction
phase emissions
Magnitude
Rating
Likelihood GHG Impact
Significance
Rating
Transport of
materials
57.90 405.1 Low Likely Minor

www.erm.com Version: 2.0 Project No.: 0239269 Client: Zambezi River Authority (ZRA) 18 September 2019 Page 19
GREENHOUSE GAS (GHG) ASSESSMENT Proposed Batoka Gorge Hydro-Electric Scheme (Zambia and Zimbabwe) on the Zambezi River
IMPACT ASSESSMENT
Item Estimated
annual
emissions
Estimated total
construction
phase emissions
Magnitude
Rating
Likelihood GHG Impact
Significance
Rating
Excavation and
construction
activity
3,424.00 23,970 Low Likely Minor
Land use change 65,976.00 (1) 461,835 Medium-High
to Medium-
Low
Likely Major
Total
Construction
69,459 tCO2e 486,210 tCO2e Major
4.2 Operational Impacts
4.2.1 Decay of Reservoir Biomass Material
Best available research (IPCC) suggests that decay of biomass material in inundated reservoirs leads to emissions of both CO2 and CH4 with the main impact occurring during the first 10 years of relevant projects (2). The IPCC has suggested an approach to calculating these emissions, which takes the total area to be inundated, the climate in which it is situated and multiplies it by estimated daily GHG emissions produced.
It should be noted that in 2017, the International Hydropower Association (IHA) and the UNESCO launched a web based tool (the GHG Reservoir (G-res) Tool) (3), to estimate and report net GHG emissions from planned and existing reservoirs.
In this instance, the IPCC approach was used because the data constraints from a proposed development allows for a high-level ‘Tier-1’ estimation of GHG emissions. This only accounts for the diffusive flux emissions across the air-water interface as shown in Figure 4.1.
(1) The majority of emissions associated with land use change will occur at the time of the disturbance, which is likely to occur
towards the beginning of the construction phase. In the absence of detailed information around construction schedules, land
use change emissions have been spread across the 7 year construction period. (2) IPCC research indicates that emissions are associated with decay of organic matter in the first 10 years following inundation
of a previously vegetated area. The best available research indicates that these emissions do not remain beyond this initial
period. Source:http://www.ipccnggip.iges.or.jp/public/2006gl/pdf/4_Volume4/V4_p_Ap2_WetlandsCO2.pdf (3) Available online at: https://g-res.hydropower.org/

www.erm.com Version: 2.0 Project No.: 0239269 Client: Zambezi River Authority (ZRA) 18 September 2019 Page 20
GREENHOUSE GAS (GHG) ASSESSMENT Proposed Batoka Gorge Hydro-Electric Scheme (Zambia and Zimbabwe) on the Zambezi River
IMPACT ASSESSMENT
Figure 4.1 Carbon dioxide and Methane Pathways in a Freshwater Reservoir (1)
BGHES is expected to create an inundated area with a surface area of 2,200 ha. Inundation is expected to take approximately four months, leading to 100% inundation at the end of the four month period.
Figure 4.2 shows the estimated emissions throughout the whole 25 year period. Over 25 years, it is estimated that the total GHG emissions emitted from the decay of biomass is 304,594tCO2e, of which 256,718 tCO2e (84.3%) occurs during the first 10 years. This is primarily from CO2 emissions, which account for approximately 74% of the total and 26% is from CH4.
Figure 4.2 GHG Emissions from Decay of Biomass Material in the BGHES Reservoir
(1) Source: Figure 5.16, Chapter 5; Kumar, A., T. Schei, A. Ahenkorah, R. Caceres Rodriguez, J.-M. Devernay, M. Freitas, D.
Hall, Å. Killingtveit, Z. Liu, 2011: Hydropower. In IPCC Special Report on Renewable Energy Sources and Climate Change
0
10 000
20 000
30 000
40 000
50 000
60 000
1 3 5 7 9 11 13 15 17 19 21 23 25
Total G
HG Emissions (tCO2e)
Years of Dam Inundation

www.erm.com Version: 2.0 Project No.: 0239269 Client: Zambezi River Authority (ZRA) 18 September 2019 Page 21
GREENHOUSE GAS (GHG) ASSESSMENT Proposed Batoka Gorge Hydro-Electric Scheme (Zambia and Zimbabwe) on the Zambezi River
IMPACT ASSESSMENT
Research by the IHA (1) suggests that emissions will decrease in the years following full inundation, falling to 50% of peak emissions by year 8 following inundation; and less than 25% of peak emissions by Year 10 following inundation. The average annual operational emissions are equivalent to 12,184 tCO2e over a 25 -year period. After 25 years annual operational emissions associated with decaying vegetation are approximately 2% of peak emissions and would continue to decline thereafter.
GHG emissions associated with the decay of biomass material in the BGHES reservoir over the 25 year period amounts to 304,594 tCO2e, of which 256,718 tCO2e (84.3%) occurs during the first 10 years.
Operational emissions associated with the decay of biomass material in the BGHES reservoir are classified as having a Medium-Low magnitude during the first 6 years of operation and a Low magnitude thereafter, according to the EBRD GHG emission reporting categories (refer to Table 3.3 in Section 3.1.2) and emissions likelihood is considered to be Likely (see Table 3.4 likelihood definitions). As a result, the average annual emissions and are considered to be Major during the first 6 years and Minor thereafter, as set out within the GHG Impact Significance Rating matrix (Table 3.5 in Section 3.1.2).
4.2.2 BGHES Site Operation Emissions
SP were unable to provide any data around O&M (Operations and Maintenance) vehicle movements or on-site fuel consumption during the operational phase of the BGHES at the time of this assessment. As a result, vehicles emissions have been estimated based on an assumed number and length of on-site journeys, multiplied by GHG conversion factors for vehicle emissions per km. In the absence of data, it has been assumed that the O&M vehicle type is a ‘van’ (2). Calculations are based on an average van (3). A total of 75 return journeys, each covering a one-way distance of 10 km per year, (a total of 1,500 km per year) is assumed for the O&M vehicle emissions. On-site fuel consumption has been based on our experience of previous hydro-electric projects. Estimated annual operational emissions are set out in Table 4.7.
It is not clear whether the two project townships will remain in the direct control of BGHES following construction; however, in the absence of data, operational emissions associated with the two project townships (likely to comprise fuel and electricity consumption) has been excluded from the assessment.
Sulphur hexafluoride (SF6) and many refrigerants, including Hydrofluorocarbons (HFCs) are potent GHG’s (see Table 3.1). No information on the possible use SF6 within electrical circuit breakers or refrigerants within air cooling units was available and therefore potential fugitive emissions from these sources have been excluded from the assessment.
Table 4.7 Annual Expected Emissions from Site Operations
Item Estimated Annual Emissions
(tCO2e)
O&M vehicles 0.39
Operations activity, including machinery fuel use, on-site
power generation (no imported electricity)
0.40
Total 0.79
Operational emissions associated with O&M vehicles and all other operational activity (excluding decay of biomass material) has been estimated as 0.79 tCO2e/year.
(1) International Hydropower Association, 2010. 'GHG Measurement Guidelines for Freshwater Reservoirs'. Calculation
Manual, pp121 (2) a van can be defined as a multipurpose, enclosed boxlike motor vehicle. (3) Factor taken from UK Government GHG Conversion Factors for Company Reporting 2018 (version 1.01)

www.erm.com Version: 2.0 Project No.: 0239269 Client: Zambezi River Authority (ZRA) 18 September 2019 Page 22
GREENHOUSE GAS (GHG) ASSESSMENT Proposed Batoka Gorge Hydro-Electric Scheme (Zambia and Zimbabwe) on the Zambezi River
IMPACT ASSESSMENT
Construction emissions associated with site operations (excluding decay of biomass) are classified as having a Low magnitude according to the EBRD GHG emission reporting categories (refer to Table 3.3 in Section 3.1.2) and emissions likelihood is considered to be Likely (see Table 3.4 likelihood definitions). As a result, the average annual emissions and are considered to be Minor, as set out within the GHG Impact Significance Rating matrix (Table 3.5 in Section 3.1.2).
4.2.3 Impact Assessment Summary
The GHG emission impact significance for during the operational phase of the BGHES is summarised in Table 4.7.
Table 4.7 Operational Phase Impact Rating
Operational Phase Annual
Impact
Estimated
annual
emissions
Estimated total
operational
phase emissions (1)
Magnitude
Rating
Likelihood Significance
O1 Emissions associated
with the decay of
reservoir biomass
material within the
inundated area
Variable 304,594tCO2e Medium-
Low
Likely Major
O2 Emissions associated
with onsite fuel or
energy use (O&M
transport and
Operational Activity)
0.79 tCO2e 19.75 tCO2e Low Likely Minor
(1) Note – this assumes a period of 25 years.
Based on the data in Section 2.1. Zimbabwe and Zambia emitted an estimated 72.1 and 320 million tCO2e (respectively) in 2012, excluding the emissions from land use, land use change and forestry. The countries were therefore responsible for 0.13% and 0.59% (respectively) of global emissions in 2012, and are considered to be low emitters. However, between 1990 and 2012, national emissions grew by 105% in Zimbabwe and 53% in Zambia, whilst global emissions increased by 41% over the same period.
During the first year of operation, it is estimated that the BGHES emissions, including those from decay of biomass, will increase the national inventory of Zimbabwe (excluding LULUCF) by 0.03% and Zambia by 0.008%, based on 2012 emissions levels (assuming 50/50 split of BGHES emissions by country). It will gradually decrease down to 0.0005 and 0.0001% by year 25 (based on the assumption that BGHES emissions will split equally between the two countries).
The EBRD guidance on assessment of GHG emissions sets out that hydro-electric power generation projects are considered likely to fall into the EBRD’s ‘Low’ category (i.e. <20,000 t CO2e/year). In line with this assumption, the BGHES is expected to meet this criterial from year 7 of operation (refer to Figure 4.2 in Section 4.2.1).
Based on the calculations undertaken through this assessment, it is identified that from year 5 of operation onwards, BGHES falls beneath the 25,000 tCO2e significance threshold, set out within the IFC Performance Standard 3 (mirrored by EBRD’s 2014 Environmental & Social Policy and the Equator Principle).

www.erm.com Version: 2.0 Project No.: 0239269 Client: Zambezi River Authority (ZRA) 18 September 2019 Page 23
GREENHOUSE GAS (GHG) ASSESSMENT Proposed Batoka Gorge Hydro-Electric Scheme (Zambia and Zimbabwe) on the Zambezi River
MITIGATION MEASURES AND RESIDUAL IMPACTS
5. MITIGATION MEASURES AND RESIDUAL IMPACTS
5.1 Construction
Mitigation of GHG emissions during construction can be achieved through a series of measures that can be included within a Construction and Environment and Social Management Plan. These mitigation measures are split between the impacts, as follows and identified in Table 5.1.
1. Emissions associated with transport of raw materials:
a. Type and quantity of raw material
b. Distance the raw material is transported
c. Type and efficiency of transportation vehicle
d. Optimum working conditions for transportation vehicles
2. Emissions associated with excavation transport:
a. Quantity of the subsurface material excavated
b. Density of excavated subsurface material
3. Emissions associated with construction activity:
a. Type and efficiency of construction vehicles
b. Optimum working conditions for construction vehicles
c. Source of on-site power generation
4. Emissions associated with land use changes:
a. Current use of the land (quantity of carbon stored pre construction)

www.erm.com Version: 2.0 Project No.: 0239269 Client: Zambezi River Authority (ZRA) 18 September 2019 Page 24
GREENHOUSE GAS (GHG) ASSESSMENT Proposed Batoka Gorge Hydro-Electric Scheme (Zambia and Zimbabwe) on the Zambezi River
MITIGATION MEASURES AND RESIDUAL IMPACTS
Table 5.1 Mitigation Measures
Impact Mitigation Measures
C1 Emissions associated
with transport of raw
materials
Where possible, favour the use of raw materials that are easier to
transport (lighter less volume) plus consideration for on-site assembly
of parts. Where there are limited raw material options, focus should be
on optimisation of transportation.
Reducing and / or optimising the quantities of construction material
transported (dependant of the final dam design and its implementation).
Management of transport logistics to ensure efficient carriage of raw
materials.
Management of voids and compaction of loads to ensure maximum safe
payloads are transported.
Reducing vehicle idling times through focus on scheduling of
construction operations.
Where possible, consideration for sourcing of materials from suppliers
closest to the construction site. Where local suppliers are not available
or their use feasible, focus should be on optimisation of transportation.
Prioritise the use of fuel efficient transportation vehicles and ensure
regular maintenance of vehicles.
Consider using a less carbon intensive fuel (e.g. a biofuel blend),
although this needs to be considered in the context of availability.
Provide efficient driving guidelines to transportation vehicle drivers, to
promote fuel efficiency.
C2 Emissions associated
with excavation
Prioritise the use of fuel efficient excavation machinery and ensure
regular maintenance of machinery.
Provide efficient working guidelines to excavation machinery operators,
to promote fuel efficiency.
Management of transport logistics to ensure efficient carriage of
excavated materials.
Management of voids and compaction of loads to ensure maximum safe
payloads are transported.
Reducing vehicle idling times through focus on scheduling of excavation
operations.
Consider using a less carbon intensive fuel (e.g. a biofuel blend),
although this needs to be considered in the context of availability.
C3 Emissions associated
with construction activity
Prioritise the use of fuel efficient construction vehicles and ensure
regular maintenance of vehicles.
Provide efficient working guidelines to construction vehicle drivers, to
promote fuel efficiency.
Reducing vehicle idling times through focus on scheduling of
construction operations.
Consider using less carbon intensive fuel (e.g. a biofuel blend), although
this needs to be considered in the context of availability.
Ensuring that on-site power generation is designed, sized and operated
for emissions performance as well as reliability.
Where possible, minimise the area of land clearance.

www.erm.com Version: 2.0 Project No.: 0239269 Client: Zambezi River Authority (ZRA) 18 September 2019 Page 25
GREENHOUSE GAS (GHG) ASSESSMENT Proposed Batoka Gorge Hydro-Electric Scheme (Zambia and Zimbabwe) on the Zambezi River
MITIGATION MEASURES AND RESIDUAL IMPACTS
Impact Mitigation Measures
C4 Emissions associated
with land use change
Reduction in GHG releases through a thorough salvage of commercial
timber and fuelwood. It is suggested that a timber survey be carried out
to estimate the amount of commercially viable timber that could be
recovered from the areas that will be cleared of vegetation during
construction. It would then be possible to estimate the amount of
biomass that would not release GHGs and reduce the impact from land
use change emissions. It is also suggested that once an estimate of
commercially viable timber is known, that markets for this are actively
sought to make the proposed mitigation as commercially viable as
possible. However, it is not believed that the reduction of GHG
emissions from this would significantly change the conclusions of this
impact assessment.
Productive utilisation of biomass material (wood) subsequent to land
clearance. This will also serve to reduce the use of wood harvested
away from the proposed inundation area for wood fuel for use by local
communities, which is the current practice.
Consider planting/re-planting of suitable indigenous trees around the
complex.
It should be noted that whilst each of these mitigation measures represents a small potential reduction in GHG, the reality of the BGHES and its location are likely to dictate whether the mitigation measures suggested are practical or feasible.
5.2 Operation
GHG emissions associated with the operation of BGHES are primarily linked to the decay of reservoir biomass material within the inundated area; however, some measures associated with on-site fuel or energy use have been identified, as set out in Table 5.2. An additional measure has been identified, relating to the potential use of SF6 and refrigerants during operation: Ensure management controls that minimise the potential for losses or leakage of these substances and track any emissions that occur during operation.
Table 5.2 Operational Mitigation Measures
Impact Mitigation Measures
O1 Emissions associated with onsite
fuel or energy use
Prioritise the use of fuel efficient on-site vehicles and
ensure regular maintenance of vehicles.
O2 Emissions associated with the decay
of reservoir biomass material within
the inundated area
Reduction in GHG releases through a thorough salvage of
commercial timber and fuelwood.
Consider planting/re-planting of suitably indigenous trees
around the complex.
www.erm.com Version: 2.0 Project No.: 0239269 Client: Zambezi River Authority (ZRA) 18 September 2019 Page 26
GREENHOUSE GAS (GHG) ASSESSMENT Proposed Batoka Gorge Hydro-Electric Scheme (Zambia and Zimbabwe) on the Zambezi River
MITIGATION MEASURES AND RESIDUAL IMPACTS
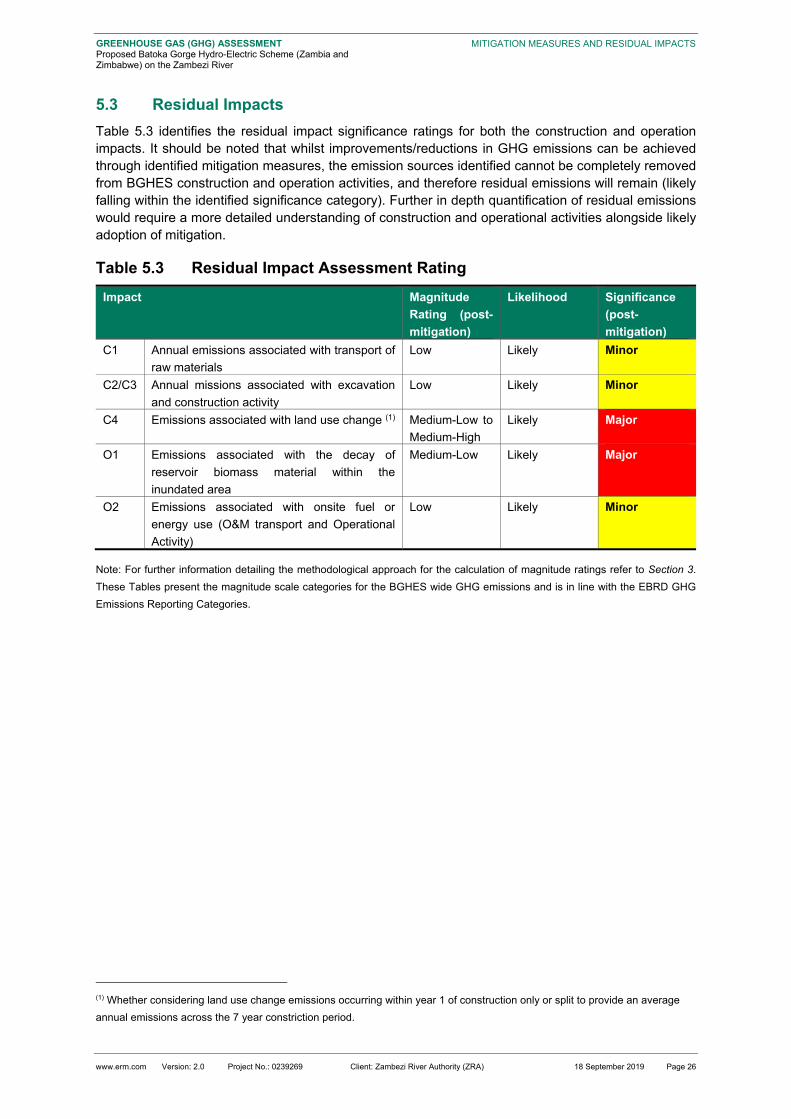
5.3 Residual Impacts
Table 5.3 identifies the residual impact significance ratings for both the construction and operation impacts. It should be noted that whilst improvements/reductions in GHG emissions can be achieved through identified mitigation measures, the emission sources identified cannot be completely removed from BGHES construction and operation activities, and therefore residual emissions will remain (likely falling within the identified significance category). Further in depth quantification of residual emissions would require a more detailed understanding of construction and operational activities alongside likely adoption of mitigation.
Table 5.3 Residual Impact Assessment Rating
Impact Magnitude
Rating (post-
mitigation)
Likelihood Significance
(post-
mitigation)
C1 Annual emissions associated with transport of
raw materials
Low Likely Minor
C2/C3 Annual missions associated with excavation
and construction activity
Low Likely Minor
C4 Emissions associated with land use change (1) Medium-Low to
Medium-High
Likely Major
O1 Emissions associated with the decay of
reservoir biomass material within the
inundated area
Medium-Low Likely Major
O2 Emissions associated with onsite fuel or
energy use (O&M transport and Operational
Activity)
Low Likely Minor
Note: For further information detailing the methodological approach for the calculation of magnitude ratings refer to Section 3.
These Tables present the magnitude scale categories for the BGHES wide GHG emissions and is in line with the EBRD GHG
Emissions Reporting Categories.
(1) Whether considering land use change emissions occurring within year 1 of construction only or split to provide an average
annual emissions across the 7 year constriction period.

www.erm.com Version: 2.0 Project No.: 0239269 Client: Zambezi River Authority (ZRA) 18 September 2019 Page 27
GREENHOUSE GAS (GHG) ASSESSMENT Proposed Batoka Gorge Hydro-Electric Scheme (Zambia and Zimbabwe) on the Zambezi River
MITIGATION MEASURES AND RESIDUAL IMPACTS
APPENDIX A OVERVIEW OF EMISSION CALCULATION SHEETS

GHG Assessment of BGHES
Scope
Assessment Results
Construction Emissions Year Materials Transport Excavation Transport Construction Activity Land Use Change Total
(t CO2e) 1 57.87 0 3424 461835 465,317
2 57.87 0 3424 3,482
3 57.87 0 3424 3,482
4 57.87 0 3424 3,482
5 57.87 0 3424 3,482
6 57.87 0 3424 3,482
7 57.87 0 3424 3,482
Total Construction (years 1-7) 405.10 0.0 23,970 461,835 486,210
Total Annual emissions (equal distribution) 57.87 0.00 3,424 65,976 69,459
Total Annual emissions (100% LUC emissions in yr. 1) 57.87 0.00 3,424 461,835 465,317
Operational Emissions Year O & M Transport Operational Activity Reservoir Emissions Total
(t CO2e) 1 0.39 0.40 48,702 48,703
2 0.39 0.40 42,713 42,714
3 0.39 0.40 35,684 35,684
4 0.39 0.40 29,806 29,807
5 0.39 0.40 24,897 24,898
6 0.39 0.40 20,796 20,796
7 0.39 0.40 17,370 17,371
8 0.39 0.40 14,509 14,509
9 0.39 0.40 12,119 12,119
10 0.39 0.40 10,122 10,123
25 0.39 0.40 680 681
Total years 1 to 25 9.75 10.00 304,594 304,614
% 0.00320077 0.003282841 99.99351639 100 %
Average annual emissions 0.39 0.4 12,183.8 12184.5664
Context: Total life cycle emissions over 50 years dam lifetime
Annual generation (GWh) 10,046
Lifetime generation (GWh) 502,300 tCO2e per GWh
(dam lifetime)
Total construction emissions (tCO2e) 24,375 0.05
Total LUC emissions (tCO2e) 461,835 0.92
Total operational emission - excluding decay (tCO2e) 71 0.00014
Total decay emissions over 25 years (tCO2e) 304,594 0.61
Total tCO2e per GWh 2
For compatibility with the IFC standards and Equator Principles, a Greenhouse Gas (GHG) GHG emissions assessment of the BGHES Project will be carried out using established methods and
principles and will:
- be carried out in conformity with the IFC Performance Standard 3 on Resource Efficiency and Pollution Prevention, and will follow internationally recognised methodologies and good
practice (as provided by the IPCC, other international organisations, and any Zimbabwe/Zambia Governmental requirements);
- include a quantification of direct emissions from the construction and operation of the proposed Project, as well as any indirect emissions associated with the off-site production of energy
used by the Project;
- use and present a robust, clear and defendable methodology;
- consider the magnitude of annual Project GHG emissions within the context of IFC Guidelines thresholds and Zimbabwe/Zambia's national GHG emissions;
- consider technically and financially feasible options for the reduction of GHG emissions in summary form.

CONSTRUCTION ACTIVITY DATA
Name Value Unit Fuel Type Source Notes
Year 1 Year 2 Year 3
Construction Phase
Materials Transport
Dam, transmission lines and road: Aggregate 0 tonnes Aggregate assumed to be taken from excavation volume
Dam and associated generation areas: Cement 65143 tonnes The main bulk of cement is in the dam which has a volume 3,800,000 with a cement content of 120kg/m^3 which
equates approximately to 456,000 tonnes. Assumed that this total volume will be split across the 7 year Dam and associated generation areas: Reinforcing Steel 8571 tonnes The current estimation for Steel is approximately 60,000 tonnes, excluding generators and other equipment.
Assumed that this total volume will be split across the 7 year construction period.Transmission lines: Steel Lattice towers 1517 tonnes Ratio of kV plus 50% Total steel lattice towers 487
Assumed mass of steel in a single tower is 21,800kgTransmission lines: cement (for concrete slab) 150 tonnes The foundation pad is constituted by a slab of reinforced concrete, located on the bottom of the trench to a depth
of between 2-3m below ground level, according to the tower type. A chimney will be positioned
in correspondence of each tower leg. This foundation presents, in plan, a square shape whose side has a length Road: Construction material 67168 tonnes TOTAL road construction material = 276,575m3 (see raw data below)
Assumed that the average density of the construction material is 1700 kg/m³Quarry: additional aggregate source 0 EXCLUDED AS QUARRY MAY NOT BE USED FOR AGGREGATE AND NO DATA AVAILABLE
Project township construction materials 0 EXCLUDED S NO DATA WAS AVAILABLE ABOUT THE PROJECT TOWNSHIPS
Project township goods deliveries 0 EXCLUDED S NO DATA WAS AVAILABLE ABOUT THE PROJECT TOWNSHIPS
Generation Equipment 0 UNKNOWN
Cons. material transport distance (one way) 40 km No data available on source of construction materials. For the purpose of the calculations, it has been assumed
that ALL materials are transported in from the nearest Township, Livingstone, located approximately 40km to the
west. Distance from Livingstone to Batoka has therefore been assumed to be 80km (round trip). It should
however be noted that the roads have not yet been constructed and therefore actual distance data is was not
available at the time of completing these calculations.
Cons material vehicle - capacity 44 tonnes https://www.gov.uk/gov
ernment/publications/gui
de-to-lorry-types-and-
weights
Assumed maximum (100%) load within HGV is 44 tonnes. However, capacity figure assumes 50% laden for all 'full
leg' journeys, plus 0% laden for return 'empty leg' journeys).
https://assets.publishing.service.gov.uk/government/uploads/system/uploads/attachment_data/file/211948/sim
plified-guide-to-lorry-types-and-weights.pdf
Cons. Material vehicle - number of journeys (full leg) 6,479.5 Number of
vehicle
journeys
Capacity figure assumes 50% laden for all 'full leg' NB *2 in calculation accounts for the assumption that each 'full
leg' journey will be at an average 50% laden.
Cons. Material vehicle - number of journeys (empty leg) 6,479.5 Number of
vehicle
journeys
Number of 'emply leg' journeys assumed to match the number of 'full leg' journeys.
Cons. Material vehicle - total distance (full leg) 259,181.0 km 6,47,,, Calculated by multiplying the estimated number of journeys by estimated length of a (one way) journey.
Cons. Material vehicle - total distance (empty leg) 259,181.0 km Toal distance of 'empty leg' journeys assumed to match the total distance of 'full leg' journeys.
HGV Articulated (>33t) - 50% laden 0.89125 kg CO2e / km UK Government GHG
Conversion Factors for
HGV Articulated (>33t) - 0% laden 0.67174 kg CO2e / km UK Government GHG
Conversion Factors for
Company Reporting 2018
(version 1.01)
CO2e of Cons. Material vehicle - total distance (full leg) 231.0 tonnes CO2e
CO2e of Cons. Material vehicle - total distance (empty leg) 174.1 tonnes CO2e
Materials Transport Emissions Does not allow for vehicle movements associated with construction of the project townships as NO DATA
available.Total construction materials transport 405.10 t CO2e Does not allow for vehicle idling time which may be substantial
Assumed Annual emissions 57.9 t CO2e Does not allow for long distance haulage of hydro generation plant or other non-bulk items
Excavation Transport
Excavated material 0 Assumed that the excavated material will be used as aggregate within the concrete (mixed up at the batching
plant). If required, additional aggregate will be sourced from the site quarry (to be confirmed). Excavated material
will also be used along the transmission line and new roads.
Excavation Transport Emissions
Excavation vehicles 0 t CO2e
t CO2e
On-Site Construction Activity
Fuel Use for construction machinery, and on-site power generation
(including for project townships).
1,274,000 1,274,000 1,274,000 litres 100% mineral diesel Information from SP "Based on information from similar project we estimate at least 3,500 litres per day".
Assuming a 364 day working year (7 day working week). Assumed that this estimated consumption rate will
continue across the 7 year construction period.
Diesel - 100% mineral diesel 2.69 kg CO2e/litre UK Government GHG Conversion Factors for Company Reporting 2018 (version 1.01)
Grid electricity use 0 kWh No connection to the grid during construction
Construction Activity Emissions
Machinery and on-site power generation 3,424 3,424 3,424 t CO2e Even if this was five times wrong, effect is not great
Grid electricity 0 0 0 t CO2e
Land Use Change
Total land area changed by transmission lines 0.44 ha Transmission lines 487 tower pads, each 9m2 (3mx3m) Total 4,393m2
Total land area changed by roads 178 ha Roads total 1,780,000m2 (as set out below)
Main roads (including new and upgrade): 1,365,000m2 (105,000m x 13m)
Staff township roads: 250,000m2 (25,000m x 10m)
Service roads: 130,000m2 (26,000m x 5m)
Site roads: 35,000m2 (7,000m x 5m)
Total land area changed by project townships 420 ha North side BGHES (Zambia) - Project township estimated area 210 ha
South side BGHES (Zimbabwe) - Project township estimated area unknown, therefore assumed to be 210 as per
the north side.
Total land area changed by impoundment area 2200 ha Impoundment area 22km2
Total land area changed by surface power plants, switch yards and
batching areas
0.3 Data not available. Assumed to be 3,000m2
Total land area changed by quarry 0 Excluded as creation of the quarry is not certain and will depend on the quality of aggregate taken from the dam
excavation area.
TOTAL land area changed by development 2799 ha From Rachel Melbourne re
Habitats Assessment - a
number of land use
categories are identified
Agriculture Land 0 ha 4383
Built environment 0 ha
Hillslope Forest 0 ha
Riparian Forest 0 ha
Secondary habitat 0 ha
Water environment 0 ha
Wooded Grassland 2799 ha
Land Use Change Emissions
All land use types 461,835 t CO2e One-off maximum change
Breakdown of emissions
over time not known
Breakdown of emissions
over time not known
In absence of actual data around construction logistics, it has been assumed that deliveries to the BGHES will be
made by Articulated HGV (>33t) and assumed that the actual vehicle capacity will be 44 tonnes at 100% load
(therefore 22 tonnes at the assumed 50% laden level).

OPERATION ACTIVITY DATA
Name Value Unit Fuel Type Source Notes
Year X Year Y Year Z
Annual Generation 10,046 GWh Annual SP data "On the base of the updated analysis carry out by SP Annual energy
production is equal to 10'046 GWh/years"
Project lifetime generation 502,300 GWh Total
Operation Phase
O & M Transport
O & M transport distance 10 km Assumed Operational distance (average one-way journey length) is assumed to include
journeys within the BGHES site boundary and not shuttling between BGHES and
Livingstone/othertownships, as was the case within the Construction phase
distance assumptions. Average Operational phase distances are liklely to be
lower and, with no data available, it has been assumed that these will be an
average of 10km.
km
O & M vehicle - journeys 75 journeys Assumed Assumed to be 75 journeys per month, based on operational data form a
previous HES ESIA. 75 journeys equates to between 1 and 2 (1.44) journeys per
week.
O & M vehicle total distance travelled 1500 km Average distance (one way) multiplied by estimated number of journeys. Total
multiplied by 2 to account for return journeys.
Vans Average (up to 3.5 tonnes) 0.2568 kg CO2e/km UK Government GHG Conversion
Factors for Company Reporting 2018
(version 1.01)
O&M vehicle assumed to be a van (up to 3.5 tonnes)
O & M Transport Emissions
O & M vehicle I 0.39 t CO2e
On-Site Operation Activity
Fuel Use for machinery 100 litres 100% mineral diesel Assumed
Fuel use for on-site power generation 50 litres 100% mineral diesel Assumed
Grid electricity use 0 Assumed It is understood that any electricity consumption will be taken from the BGHES
generated output, which is renewable and therefore has zero associated GHG
emissions.
Diesel - 100% mineral diesel 2.68779 kg CO2e/litre UK Government GHG Conversion
Factors for Company Reporting 2018
(version 1.01)
Operation Activity Emissions
Machinery 0.27 t CO2e
Power generation 0.13 t CO2e
Grid electricity 0.00 t CO2e
Decay of Reservoir Biomass Material
CO2 emissions tCO2e
CH4 emission tCO2e
Decay of reservoir biomass material 0 0 0 ALTERNATIVE CALCULATION SHEET
The assessment of biochemically generated GHGs from the reservoir is recommended to follow a stepwise process to evaluate the supply of carbon stock and the reservoir’s condition to create and release GHGs:
1. Does the reservoir have the capacity to create large carbon stock (amount of flooded organic matter, inflowing organic matter, and organic matter produced in the reservoir)? If the carbon stock is small, Global Warming Potential
(GWP) is likely negligible.
2. Does the reservoir have the capacity to convert the organic matter to GHGs and, if so, to what type? If the physical conditions disfavour decomposition of organic matter, and especially do not favour creation of CH4 and N2O,
GWP is likely negligible.
3. Does the reservoir have the capacity to release the created GHGs into the atmosphere? If the pathways of CH4 and N2O to the atmosphere are few and if the physical conditions favour transformation
of these to CO2 before emission, GWP is likely negligible.
In a reservoir, the flooded and inflowing carbon will thus be exported to the atmosphere, stored in the bed sediments, or transported further down the river system. These three processes occur in parallel in varying degrees,
depending on the topographical, geological, and climatological conditions, and the biological configuration of the water body.

The business of sustainability
ERM has over 160 offices across the following
countries and territories worldwide
Argentina
Australia
Belgium
Brazil
Canada
Chile
China
Colombia
France
Germany
Guyana
Hong Kong
India
Indonesia
Ireland
Italy
Japan
Kazakhstan
Kenya
Malaysia
Mexico
Mozambique
Myanmar
The Netherlands
New Zealand
Norway
Panama
Peru
Poland
Portugal
Puerto Rico
Romania
Russia
Singapore
South Africa
South Korea
Spain
Sweden
Switzerland
Taiwan
Tanzania
Thailand
UK
US
Vietnam
ERM’s South Africa Office
1st Floor | Great Westerford |
240 Main Road | Rondebosch |
7700 | Cape Town | South Africa
T: +27 21 681 5400
www.erm.com