Greendex-Sweden-Pres Final - National...
5
2008 2009 2010 2012 2014 2 4 5 5 63.8 63.0 64.4 64.8 FOOD Rank Score 2 63.8 64.7 62.4 62.2 9 8 11 10 2008 2009 2010 2012 2014 TRANSPORTATION Rank Score GOODS 2 47.1 47.7 47.4 46.1 12 13 10 9 2008 2009 2010 2012 2014 Rank Score Greendex Score 2014 50.9 Swedes 12 TH HOUSING 2 2008 2009 2010 2012 2014 38.5 41.8 39.0 38.2 13 9 11 11 Rank Score Swedes 12 TH 1 “Improved ranking since 2012” “Declined ranking since 2012” “Equal ranking as in 2012”
Transcript of Greendex-Sweden-Pres Final - National...

2008 2009 2010 2012 2014
2 455
63.8 63.0 64.464.8
FOODRank
Score2
63.8 64.762.462.2
98 11 10
2008 2009 2010 2012 2014
TRANSPORTATIONRank
Score
GOODS 2
47.1 47.7 47.446.1
1213109
2008 2009 2010 2012 2014
Rank
Score
Greendex Score 2014
50.9
Swedes
12TH
HOUSING 2
2008 2009 2010 2012 2014
38.541.8 39.0 38.2
139 1111
Rank
Score
Swedes12TH 1
“Improved ranking since 2012” “Declined ranking since 2012” “Equal ranking as in 2012”
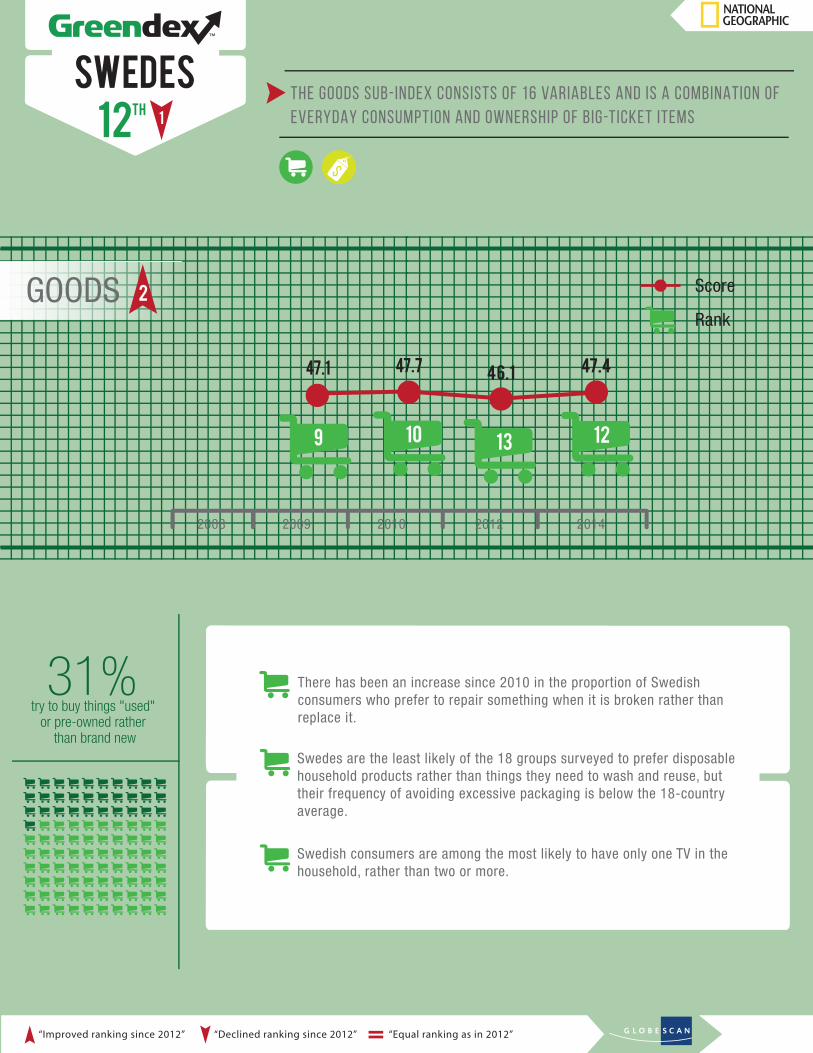
There has been an increase since 2010 in the proportion of Swedish consumers who prefer to repair something when it is broken rather than replace it.
Swedes are the least likely of the 18 groups surveyed to prefer disposable household products rather than things they need to wash and reuse, but their frequency of avoiding excessive packaging is below the 18-country average.
Swedish consumers are among the most likely to have only one TV in the household, rather than two or more.
31% try to buy things "used"
or pre-owned rather than brand new
Sweden12TH 1
GOODS 2Rank
Score
“Improved ranking since 2012” “Declined ranking since 2012” “Equal ranking as in 2012”
47.1 47.7 47.446.1
1213109
2008 2009 2010 2012 2014
THE GOODS SUB-INDEX CONSISTS OF 16 VARIABLES AND IS A COMBINATION OF EVERYDAY CONSUMPTION AND OWNERSHIP OF BIG-TICKET ITEMS
Swedes12TH 1

Swedes are among the most frequent consumers of imported foods of the 18 groups surveyed, and among the least frequent consumers of locally grown food. They are, however, the least likely to consume bottled water or convenient (prepared/processed/packaged) food.
Swedes consume less beef and chicken than the 18-country average.
Their frequency of consuming fish and seafood has increased since 2009, and their frequency of consuming fruits and vegetables has increased since 2012.
52% frequently consume
organic or natural food
Sweden12TH 1
FOODRank
Score2
“Improved ranking since 2012” “Declined ranking since 2012” “Equal ranking as in 2012”
Swedes12TH 1
2008 2009 2010 2012 2014
2 455
63.8 63.0 64.464.8

34% purchase "green" electricity
for their homes
Swedes infrequently keep their heating and cooling at a low setting, and rarely wash laundry in cold water to save energy.
However, Swedish consumers are among the most likely to have insulated walls in their residence, and among the least likely to have air conditioning.
They are less likely than the 18-country average to have an energy-saving refrigerator, freezer or laundry machine in their household.
Sweden12TH 1
“Improved ranking since 2012” “Declined ranking since 2012” “Equal ranking as in 2012”
Swedes12TH 1
HOUSING 2Rank
Score
2008 2009 2010 2012 2014
38.541.8 39.0 38.2
139 1111

Swedish consumers are more likely to own a sedan or station wagon than any other type of motor vehicle. Since 2010, there has been a notable decrease in how often Swedes drive alone in a car or truck, and they are less likely than the 18-country average to do so. Their frequency of driving with others is around average.
Swedes have become more likely to report frequently walking or bicycling to their destination, but among the consumers in the 18 countries surveyed, they are among the least likely to choose to live close to their usual destinations to minimize environmental impacts.
They are above average users of local public transport, while their use of trains is close to the 18-country average.
33% of households do not
have a car or truck
Sweden12TH 1
TRANSPORTATIONRank
Score
“Improved ranking since 2012” “Declined ranking since 2012” “Equal ranking as in 2012”
Swedes12TH 1
63.8 64.762.462.2
98 11 10
2008 2009 2010 2012 2014