![Genome-Wide Analysis of Cell Type-Specific Gene ...aoh/Saujetetal.pdf · also the case for key genes involved in the spore morphogenesis [16,17,20]. In Clostridium acetobutylicum](https://static.fdocuments.in/doc/165x107/5e87518797913649b022fe05/genome-wide-analysis-of-cell-type-specific-gene-aoh-also-the-case-for-key.jpg)
Green Synthesized Iron Oxide Nanoparticles Effect on Fermentative Hydrogen Production by Clostridium...
14
Green Synthesized Iron Oxide Nanoparticles Effect on Fermentative Hydrogen Production by Clostridium acetobutylicum Sundaresan Mohanraj & Shanmugam Kodhaiyolii & Mookan Rengasamy & Velan Pugalenthi Received: 2 December 2013 /Accepted: 28 February 2014 / Published online: 20 March 2014 # Springer Science+Business Media New York 2014 Abstract A green synthesis of iron oxide nanoparticles (FeNPs) was developed using Murraya koenigii leaf extract as reducing and stabilizing agent. UV–vis spectra show that the absorption band centred at a wavelength of 277 nm which corresponds to the surface plasmon resonances of synthesized FeNPs. Fourier transform infrared spectroscopy spectrum exhibits that the characteristic band at 580 cm −1 is assigned to Fe–O of γ-Fe 2 O 3 . Transmission electron microscopy image confirms that the spherical with irregular shaped aggregates and average size of nanoparticles was found to be ∼59 nm. The effect of synthesized FeNPs on fermentative hydrogen production was evaluated from glucose by Clostridium acetobutylicum NCIM 2337. The hydrogen yield in control experiment was obtained as 1.74±0.08 mol H 2 / mol glucose whereas the highest hydrogen yield in FeNPs supplemented experiment was achieved as 2.33±0.09 mol H 2 /mol glucose at 175 mg/L of FeNPs. In addition, the hydrogen content and hydrogen production rate were also increased from 34±0.8 to 52±0.8 % and 23 to 25.3 mL/h, respectively. The effect of FeNPs was compared with supplementation of FeSO 4 on fermentative process. The supplementation of FeNPs enhanced the hydrogen production in comparison with control and FeSO 4 . The supplementation of FeNPs led to the change of the metabolic pathway towards high hydrogen production due to the enhancement of ferredoxin activity. The fermentation type was shifted from butyrate to acetate/butyrate fermentation type at the addition of FeNPs. Keywords Green synthesis . Iron oxide nanoparticles . Murraya koenigii . Hydrogen production . Clostridium acetobutylicum NCIM 2337 Appl Biochem Biotechnol (2014) 173:318–331 DOI 10.1007/s12010-014-0843-0 S. Mohanraj : S. Kodhaiyolii : V. Pugalenthi (*) Department of Biotechnology, Bharathidasan Institute of Technology, Anna University, Tiruchirappalli 620 024 Tamil Nadu, India e-mail: [email protected] M. Rengasamy Department of Petrochemical Technology, Bharathidasan Institute of Technology, Anna University, Tiruchirappalli 620 024 Tamil Nadu, India
Transcript of Green Synthesized Iron Oxide Nanoparticles Effect on Fermentative Hydrogen Production by Clostridium...

Green Synthesized Iron Oxide NanoparticlesEffect on Fermentative Hydrogen Productionby Clostridium acetobutylicum
Sundaresan Mohanraj & Shanmugam Kodhaiyolii &Mookan Rengasamy & Velan Pugalenthi
Received: 2 December 2013 /Accepted: 28 February 2014 /Published online: 20 March 2014# Springer Science+Business Media New York 2014
Abstract A green synthesis of iron oxide nanoparticles (FeNPs) was developed usingMurraya koenigii leaf extract as reducing and stabilizing agent. UV–vis spectra show thatthe absorption band centred at a wavelength of 277 nm which corresponds to the surfaceplasmon resonances of synthesized FeNPs. Fourier transform infrared spectroscopy spectrumexhibits that the characteristic band at 580 cm−1 is assigned to Fe–O of γ-Fe2O3. Transmissionelectron microscopy image confirms that the spherical with irregular shaped aggregates andaverage size of nanoparticles was found to be ∼59 nm. The effect of synthesized FeNPs onfermentative hydrogen production was evaluated from glucose by Clostridium acetobutylicumNCIM 2337. The hydrogen yield in control experiment was obtained as 1.74±0.08 mol H2/mol glucose whereas the highest hydrogen yield in FeNPs supplemented experiment wasachieved as 2.33±0.09 mol H2/mol glucose at 175 mg/L of FeNPs. In addition, the hydrogencontent and hydrogen production rate were also increased from 34±0.8 to 52±0.8 % and 23 to25.3 mL/h, respectively. The effect of FeNPs was compared with supplementation of FeSO4
on fermentative process. The supplementation of FeNPs enhanced the hydrogen production incomparison with control and FeSO4. The supplementation of FeNPs led to the change of themetabolic pathway towards high hydrogen production due to the enhancement of ferredoxinactivity. The fermentation type was shifted from butyrate to acetate/butyrate fermentation typeat the addition of FeNPs.
Keywords Green synthesis . Iron oxide nanoparticles . Murraya koenigii . Hydrogenproduction .Clostridium acetobutylicumNCIM 2337
Appl Biochem Biotechnol (2014) 173:318–331DOI 10.1007/s12010-014-0843-0
S. Mohanraj : S. Kodhaiyolii : V. Pugalenthi (*)Department of Biotechnology, Bharathidasan Institute of Technology, Anna University, Tiruchirappalli 620024 Tamil Nadu, Indiae-mail: [email protected]
M. RengasamyDepartment of Petrochemical Technology, Bharathidasan Institute of Technology, Anna University,Tiruchirappalli 620 024 Tamil Nadu, India
Introduction
Metal andmetal oxide nanoparticles have been attracting significant interest because of their variousapplications. Metal oxide nanoparticles have unique physical and chemical properties due to theirsmall size and high surface area. Among the metal oxide nanoparticles, iron oxide nanoparticlesare having different forms such as magnetite (Fe3O4), hematite (α-Fe2O3) andmaghemite (γ-Fe2O3) [1]. Iron oxide nanoparticles have recently gained enormousinterest in various processes such as wastewater treatment [2] and biocatalysis [3]because of their large surface area, high surface reactivity and high sorption capacity.Several methodologies have been established to synthesize iron oxide nanoparticlesincluding physical and chemical methods. However, environmental contamination is amajor concern in the chemical synthesis of metal nanoparticles. To avoid the environmentalcontaminations, the rapid development of cost-effective, non-toxic and eco-friendly process isneeded for synthesizing iron oxide nanoparticles. Biosynthesis of metal nanoparticles usingmicroorganisms and plants are considered as simple, green and cost-effective methods [4].
Plant extract-mediated synthesis of nanomaterials is one of the more stable and suitablealternatives in comparison with those produced by physical, chemical and microbial methods.The synthesis of metal oxide nanoparticles using plant extracts has been found to be faster than themicrobial synthesis. The green method has been growing significance due to its simplicity and eco-friendliness. In addition, this process would impart steric stabilization against aggregation and alsohelp to overcome the environmental contaminations [5]. Recently, green synthesis of iron nanopar-ticles of various shape and size has been developed using green tea [5–7], soya bean sprouts [8] andsorghumbran extracts [9]. In continuation of the efforts, the aromatic leaves ofMurraya koenigii hasbeen used for the reduction and stabilization of silver nanoparticles [10]. Philip et al [10] andChristensen et al. [11] also reported that the high concentration of water-soluble ingredients such ascarbazole, alkaloids, flavonoids and polyphenols in M. koenigii leaf extract has been identified asresponsible for rapid reduction and stabilization of silver nanoparticles. However, the potential ofM. koenigii for the synthesis of other metal and metal oxide nanoparticles has yet to be fullyexplored. To the best of our knowledge, there is no report on the development of rapid method forgreen synthesis of iron oxide nanoparticles using aqueousM. koenigii leaf extract.
Hydrogen as a green energy source is considered as an alternative energy to substitute fossilfuels in the future due to its ideal and clean characteristics. Among the various hydrogenproduction technologies, fermentative process for hydrogen production has more potentialbecause it is a promising way to produce more energy from organic substrate [12]. Neverthe-less, the supplementation of suitable micronutrients is required to improve the fermentativeprocess for efficient hydrogen production. Iron, magnesium, zinc, sodium [13] and nickel [14]are all important trace metals for fermentative hydrogen production. Among the trace metals,iron plays important roles in electron transport, enhancing bacterial growth and high ratehydrogen production by promoting hydrogenase activity [14]. According to the previousreport, supplementation of iron could oxidize the reduced ferredoxin to produce more hydro-gen [13]. Especially, iron is a component of ferredoxin which acts as an electron carrier inhydrogenase to produce molecular hydrogen. Recently, few studies have been investigated onfermentative hydrogen production from glucose by the supplementation of Fe2+ using mixedculture [15, 16], but there is no report to evaluate the effects of Fe2+ and iron oxide nano-particles on fermentative hydrogen production from glucose by Clostridium acetobutylicum. Inaddition, the efficient conversions of substrate, high yields of hydrogen and high rate processfor fermentative hydrogen production have not been achieved. Hence, the supplementation ofsynthesized iron oxide nanoparticles was considered in the present study for enhancement offermentative hydrogen production.
Appl Biochem Biotechnol (2014) 173:318–331 319

The objective of this study was to develop a facile and rapid green synthesis of iron oxidenanoparticles using a non-toxic, renewable plant M. koenigii leaf extract as both the reducingand stabilizing agent. The effects of synthesised iron oxide nanoparticles and FeSO4 onfermentative hydrogen production from glucose using C. acetobutylicum NCIM 2337 wereinvestigated to find out the enhancement efficiency. The obtained hydrogen production datawere used to fit the Gompertz equation for kinetic analysis of fermentative process.
Materials and Methods
Materials
The leaves of M. koenigii (curry leaves) were obtained from the local market ofTiruchirappalli, Tamil Nadu, India. The fermentative medium ingredients including FeSO4,KH2PO4, Na2HPO4, NH4Cl, MgCl2, yeast extract, meat extract, peptone and glucose werepurchased from Himedia, India. C. acetobutylicum NCIM 2337 was obtained from NationalChemical Laboratory, Pune, India. All the experiments were performed in triplicates. Doubledistilled water was used for all the experiments.
Preparation of M. koenigii Leaf Extract
M. koenigii leaves were washed with deionized water and dried at room temperature for 24 h.Four grams of finely powdered leaf was mixed with 100 mL distilled water in an Erlenmeyerflask. The extract fromM. koenigii leaves was done on boiling water bath at 100 °C for 5 min.The leaf extract was filtered through Whatman no. 1 filter paper and the filtrate was stored at4 °C for further experiments.
Green Synthesis of Iron Oxide Nanoparticles
To prepare the iron oxide nanoparticles, 3 mL ofM. koenigii broth was added to 7 mL aqueoussolution of 1 mM FeSO4 and stirred for 5 min. The colour change was observed fromtransparent yellow to black after 5 min, indicating the formation of iron nanoparticles. One,2 and 3 mL ofM. koenigii leaf extract was separately added to 9, 8 and 7 mL of 1 mM FeSO4
concentration, respectively, in order to investigate the effect of M. koenigii extract on theformation of iron oxide nanoparticles. Seven millilitres of 0.25, 0.5 and 1 mM FeSO4
concentration was separately taken and mixed with 3 mL of M. koenigii leaf extract to findout the optimum concentration. All the experiments were performed on a magnetic stirrer atroom temperature. The resulting iron colloids were centrifuged (15,000 rpm, 20 °C) for20 min, washed several times with distilled water and dried at a hot air oven.
Effect of Iron Oxide Nanoparticles on Fermentative Hydrogen Production
C. acetobutylicum NCIM 2337 was cultivated in Reinforced Clostridial Broth (Himedialaboratories) under anaerobic condition for 24 h at 37 °C. Fermentative hydrogen productionwas conducted in 250 mL bottle with a working volume of 200 mL. Fermentative hydrogen-producing medium contained the following compositions (g/L): 1.5 KH2PO4, 3.2 Na2HPO4,0.5 NH4Cl, 0.8 MgCl2, 1.0 yeast extract, 0.5 meat extract, 0.5 peptone and 7.5 glucose. Theconcentrations of iron oxide nanoparticles and FeSO4 were taken in the range from 0 to250 mg/L for evaluating the enhancement effect of hydrogen production. The fermentation
320 Appl Biochem Biotechnol (2014) 173:318–331

medium was adjusted to pH 6.0 and the duration of fermentation was about 24 h. Theheadspace air was displaced by nitrogen gas to generate anaerobic condition in the reactor.The produced hydrogen was collected in a gas collector by water displacement method. Thevolume of the hydrogen and glucose utilization was measured at different time intervals.
Characterization of Iron Oxide Nanoparticles
The bioreduction of Fe2+ ions was monitored as a function of reaction time by using Varian,Cary 100 UV–vis spectrophotometer in the range of 200–800 nm. Fourier transform infraredspectroscopy (FTIR) analysis of iron oxide nanoparticles was carried out by PerkinElmer,Spectrum RX1. Morphology and size distribution of iron oxide nanoparticles were performedusing scanning electron microscopy (SEM—JEOL JSM 5610) and transmission electronmicroscopy (TEM—Tecnai 10; Philips). The size distribution of the iron oxide nanoparticlesobtained from TEM micrographs was analysed using a speciality image processing softwareImageJ 1.45. The particle size distribution of iron oxide nanoparticles size was measured usinga Zetasizer Nano ZS 90 (Malvern Instruments).
Analytical Methods
The composition of biogas including H2, CO2 and CH4 was analysed by Shimadzu gaschromatograph (GC-2014) (Shimadzu Co. Singapore) equipped with a thermal conductivitydetector and a stainless steel column packed with Porapak Q (80/100 mesh). The operationaltemperatures at the injection port, column oven and detector were 40, 40 and 80 °C, respec-tively. Nitrogen was used as carrier gas at a flow rate of 20 mL/min. The concentration of thevolatile fatty acids (VFAs) was measured by Shimadzu gas chromatograph (GC-2014)(Shimadzu Co. Singapore) equipped with a flame ionization detector (FID) and stabilwax–DA capillary column. The injector, column oven and detector were operated at 180, 200 and220 °C, respectively. Nitrogen was used as carrier gas with a flow rate of 5 mL/min. Theconcentration of glucose was determined using phenol–sulphuric acid method [17].
Kinetic Modelling Analysis
The modified Gompertz equation was used in this study to illustrate the modelling offermentative hydrogen production in batch experiments.
H ¼ P:exp −exp Rm� e=P λ−tð Þ þ 1½ �f g
where H denotes the cumulative volume of hydrogen production (mL), P is hydrogenproduction potential (mL), Rm represents the maximum hydrogen production rate (mL/h), eis 2.71828, λ represents the lag-phase time (h), and t denotes the incubation time (h). Thekinetic parameters (P, Rm and λ) were estimated by Origin 7.5 [18].
Results and Discussion
UV–Visible Spectrums of Iron Oxide Nanoparticles
The formation of iron oxide nanoparticles was observed with the colour change and UV–visible spectral analysis. The different concentrations of M. koenigii leaf extract (1, 2 and
Appl Biochem Biotechnol (2014) 173:318–331 321

3 mL) on the reduction of Fe2+ ions was monitored by using UV–vis spectroscopy. The lightblack colour of the iron colloids was formed by the addition of 1 and 2 mL of leaf extractconcentration, whereas the dark black colour was rapidly formed for completion of the reactionwithin 5 min by the addition of 3 mL leaf extract. The optimum concentration of leaf extract ondifferent FeSO4 concentration (0.25, 0.5 and 1.0 mM) was investigated (data not shown). Theexperimental results showed that there was no colour formation at 0.25 mM and the light blackcolour was observed at 0.5 mM, due to the slow reduction of ferrous ions. The colour of thereaction mixture was changed from transparent yellow to black colour within 5 min, afteraddition of 3 mL extract into 1 mM FeSO4 solution. The formation of black colour solutionindicated the rapid reduction of ferrous ions.
From the UV–visible spectra (Fig. 1a), it was observed that the two absorption peaks weredetected at 284 and 315 nm as the concentration ofM. koenigii leaf extract was increased. Theappearance of two peaks indicated the formation of anisotropic iron oxide nanoparticles.According to Mie’s theory, spherical or quasi-spherical nanocrystals exhibit a single surfaceplasmon resonance (SPR) band, whereas anisotropic particles show two or three bands,depending on their shape [19]. Furthermore, the disappearance of peak at 315 nm and slightblue shift in the peak from 284 to 277 nm was observed after 3 h. This result indicates theformation of Fe(0) nanoparticles because no absorption peak was observed in FeSO4 solutionas illustrated previously by Guo et al. [20]. As seen in traces (4–7 h) in Fig. 1a, the decrease inintensity of peak at 277 nm may be due to the oxidation of zero valent iron to iron oxidenanoparticles. Similar observation was reported earlier [20]. Therefore, the proposed possiblemechanism for synthesizing iron oxide nanoparticles is given below (Eqs. 1 and 2);
Fe2þ þ 2R‐ OHð Þn→Fe0 þ 2nR ¼ Oþ 2nHþ ð1Þ
Fe0 →O½ �Fe2O3 ð2Þ
FTIR Studies
FTIR analysis was used to identify the possible functional groups and capping agent present inM. koenigii leaf extract for the reduction of ferrous ions. Figure 1b shows the FTIR spectra ofboth synthesized iron oxide nanoparticles and M. koenigii leaf extract. The FTIR spectrum of
Fig. 1 a UV–visible absorption spectra of reaction mixtures at different time intervals. b FTIR spectra ofM. koenigii leaf extracts (broken line) and synthesized iron oxide nanoparticles (solid line)
322 Appl Biochem Biotechnol (2014) 173:318–331

the leaf extract (broken line) showed bands at 3,425, 2,073, 1,637, 1,041 and 643 cm−1. Theintense broad absorbance at 3,425 cm−1 is attributed to the O–H stretching vibration ofhydroxyl functional group in alcohols. The weak absorbance at 2,073 cm−1 may be assignedto the primary amines due to the presence of amino acids. The intense band at 1,637 cm−1 isassigned to the amide I band of the proteins released by the M. koenigii leaf extract. Similartrend was observed by Narayanan and Sakthivel [21]. The band at 1,041 cm−1 is attributed tothe C–N stretching vibration of aliphatic amines. The band at 643 cm−1 may be attributed tothe C–H bending vibrations. The FTIR spectrum of synthesized iron oxide nanoparticles (solidline) showed bands at 3,404, 2,927, 1,626, 1,370, 1,065 and 580 cm−1. The bands at 3,404 and1,626 cm−1 are assigned to the hydroxyl group and proteins, respectively. The absorption peakat 2,927 cm−1 is designated to C–H stretching vibration modes in the hydrocarbonchains. The band at 1,370 cm−1 may be assigned to C–N stretching or the O–Hbending. The band at 1,065 cm−1 is attributed to the C–N stretching vibration ofaliphatic amines. The presence of iron oxide nanoparticles was identified by thestrong absorption band at 580 cm−1, which is assigned to the Fe–O bond of γ-Fe2O3. Similar results were reported by earlier literature [22, 23]. The absorptionband at 3,404, 1,626 and 1,065 cm−1 indicated that the synthesized iron oxidenanoparticles may be surrounded by polyphenols, proteins and amines. These findingsindicate that the biomolecules present in the M. koenigii leaf extract may be account-able for the reduction of Fe2+ ions and stabilization of iron nanoparticles in anaqueous medium. Similarly, Philip et al. [10] reported that the biomolecules includingflavonoids, alkaloids and polyphenols compounds present in the M. koenigii leafextract were believed to be responsible for the reduction and efficient stabilizationof silver and gold nanoparticles.
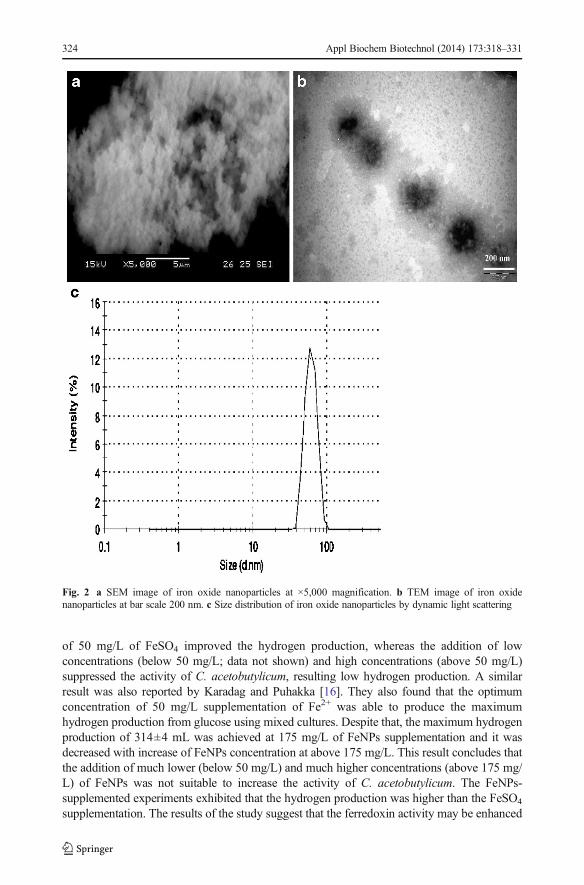
SEM, TEM and DLS Analysis
The surface morphology of the synthesized iron oxide nanoparticles was studied using SEM ata magnification of ×5,000 (Fig. 2a). SEM images reveal that the synthesized iron oxidenanoparticles were aggregated into irregular with no well-defined structure (Fig. 2a). Themorphology of the nanoparticles was mostly appeared to be a porous, spongelike form. Theformation of various particles sizes may be due to the agglomeration of nanoparticles duringthe sample preparation for SEM analysis, as reported earlier [24]. From TEM images (Fig. 2b),it is evident that the morphology of iron oxide nanoparticles was spherical along with someirregular shape, which is in agreement with the shape of SPR band in the UV–vis spectra(Fig. 1a). The result of the TEM analysis confirms the amorphous nature of the iron oxidenanoparticles. The mean size of the amorphous iron oxide nanoparticles was determined as∼59 nm by ImageJ software tool. The particle size distribution of the iron oxide nanoparticleswas analysed by dynamic light scattering analysis and the average size of iron oxide nano-particles was found to be ∼61 nm (Fig. 2c).
Effect of Iron Oxide Nanoparticles on Biohydrogen Production
The effects of FeSO4 and iron oxide nanoparticles on fermentative hydrogen production usingC. acetobutylicum NCIM 2337 are shown in Fig. 3. The hydrogen production of 254±12 mLwas observed in control experiment (without supplementation). However, the hydrogenproduction was considerably increased at 50 mg/L of FeSO4 and it was decreased withincrease of FeSO4 concentration in the range from 100 to 250 mg/L. The maximum hydrogenproduction of 273±11 mL was obtained at 50 mg/L of FeSO4 supplementation. The addition
Appl Biochem Biotechnol (2014) 173:318–331 323
of 50 mg/L of FeSO4 improved the hydrogen production, whereas the addition of lowconcentrations (below 50 mg/L; data not shown) and high concentrations (above 50 mg/L)suppressed the activity of C. acetobutylicum, resulting low hydrogen production. A similarresult was also reported by Karadag and Puhakka [16]. They also found that the optimumconcentration of 50 mg/L supplementation of Fe2+ was able to produce the maximumhydrogen production from glucose using mixed cultures. Despite that, the maximum hydrogenproduction of 314±4 mL was achieved at 175 mg/L of FeNPs supplementation and it wasdecreased with increase of FeNPs concentration at above 175 mg/L. This result concludes thatthe addition of much lower (below 50 mg/L) and much higher concentrations (above 175 mg/L) of FeNPs was not suitable to increase the activity of C. acetobutylicum. The FeNPs-supplemented experiments exhibited that the hydrogen production was higher than the FeSO4
supplementation. The results of the study suggest that the ferredoxin activity may be enhanced
Fig. 2 a SEM image of iron oxide nanoparticles at ×5,000 magnification. b TEM image of iron oxidenanoparticles at bar scale 200 nm. c Size distribution of iron oxide nanoparticles by dynamic light scattering
324 Appl Biochem Biotechnol (2014) 173:318–331
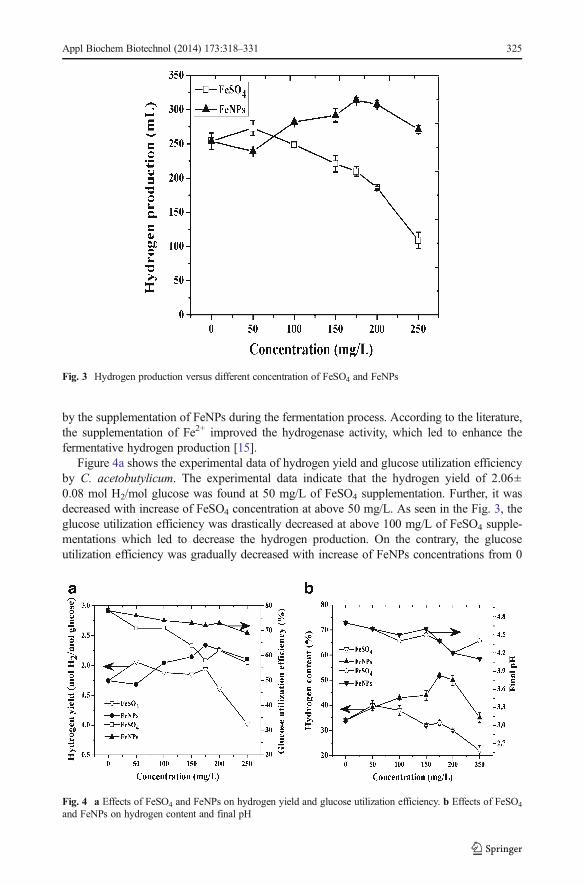
by the supplementation of FeNPs during the fermentation process. According to the literature,the supplementation of Fe2+ improved the hydrogenase activity, which led to enhance thefermentative hydrogen production [15].
Figure 4a shows the experimental data of hydrogen yield and glucose utilization efficiencyby C. acetobutylicum. The experimental data indicate that the hydrogen yield of 2.06±0.08 mol H2/mol glucose was found at 50 mg/L of FeSO4 supplementation. Further, it wasdecreased with increase of FeSO4 concentration at above 50 mg/L. As seen in the Fig. 3, theglucose utilization efficiency was drastically decreased at above 100 mg/L of FeSO4 supple-mentations which led to decrease the hydrogen production. On the contrary, the glucoseutilization efficiency was gradually decreased with increase of FeNPs concentrations from 0
Fig. 3 Hydrogen production versus different concentration of FeSO4 and FeNPs
Fig. 4 a Effects of FeSO4 and FeNPs on hydrogen yield and glucose utilization efficiency. b Effects of FeSO4
and FeNPs on hydrogen content and final pH
Appl Biochem Biotechnol (2014) 173:318–331 325

to 250 mg/L. Meanwhile, the hydrogen yield was increased from 50 to 175 mg/L. Thesefindings suggest that the bioactivity of C. acetobutylicum was enhanced up to 175 mg/L ofFeNPs supplementation, when compared to FeSO4. The FeNPs-supplemented experimentsshowed that the maximum hydrogen yield of 2.33±0.09 mol H2/mol glucose was observed at175 mg/L of FeNPs. Moreover, the much higher concentrations of FeNPs at above 175 mg/Lwere not favourable for the C. acetobutylicum to increase the hydrogen yield during fermen-tative hydrogen production. The obtained yield was comparatively higher than the controlexperiment (1.74±0.08 mol H2/mol glucose). Recent report shows that the maximum hydro-gen yield of 1.08±0.06 mol H2/mol glucose was obtained at the addition of 10−6 mol L−1
concentration of encapsulated iron oxide nanoparticles with porous silica matrix (Fe/SiO2)[25]. In comparison, the FeNPs supplementation in our experiments without any encapsulationmethod produced the maximum hydrogen yield of 2.33±0.09 mol H2/mol glucose. The similartrend was observed in hydrogen content which is presented in Fig. 4b. This figure shows thecomparative study of FeSO4 and FeNPs effects on hydrogen content and final pH duringfermentative hydrogen production process. The final pH was decreased with increase of FeNPsand FeSO4 concentrations from 0 to 200 mg/L. The results showed that the final pH values inall batch tests were lower than the initial pH 6.0 and it was gradually decreased up to 150 mg/Lof FeNPs and FeSO4. It was also noted that the final pH values were identified at below 4.5,when the supplements of FeNPs and FeSO4 were varied from 150 to 250 mg/L. This resultreveals that the low pH value at below 4.5 was not favourable for fermentative hydrogenproduction. Therefore, the hydrogen yield and glucose utilization efficiency in batch tests weredecreased with increase of FeNPs and FeSO4 at above 175 mg/L. These findings confirm thatthe favourable pH values for fermentative hydrogen production were between 6.0 and 6.5. Thelowest and highest pH values in the present study were not suitable for fermentative hydrogenproduction. The similar results have been reported by previous literature those cited in Table 3.
The hydrogen yield and hydrogen content obtained in this study and results from literatureare summarized in Table 3. The data showed that the hydrogen yield in this study was higher(2.33±0.09 mol H2/mol glucose) than those reported in other studies using glucose assubstrate. The optimum concentration of Fe2+ supplementation was found at 50 mg/L forthe production of hydrogen and similar optimum concentration has been reported by Karadagand Puhakka [16]. The Fe2+-supplemented experiments showed that the hydrogen yield wascomparatively higher than the other reported data. As shown in the Table 3, the results clearlyproved that the hydrogen yield was enhanced by the addition of iron oxide nanoparticles whencompared to supplementation of Fe2+ in both pure and mixed cultures.
Kinetic Analysis of FeNPs Supplementation on Fermentative Hydrogen Production
Shown in Fig. 5 is the effect of different iron oxide nanoparticles concentrations on hydrogenproduction using C. acetobutylicum NCIM 2337 for 24 h. The hydrogen production in controlexperiment was 254±12 mL, whereas the maximum hydrogen production at 175 mg/L ofFeNPs supplementation was 314±4 mL. The results showed that the hydrogen production wasimproved by the supplementation of FeNPs when compared to control. The obtained hydrogenproduction data was used to fit the modified Gompertz equation and the kinetic parameters aregiven in Table 1. The lag phase time was gradually decreased from 8.9 to 6.9 h when theaddition of FeNPs was varied from 50 to 175 mg/L. Furthermore, the lag phase time wasincreased with increase of FeNPs at above 175 mg/L. The lowest lag phase time of 6.9 h wasfound at 175 mg/L of FeNPs. A similar observation was described earlier [26], the lag-phasetime was decreased from 35.4 to 24.4 h when the addition of hematite nanoparticles variedfrom 25 to 1,600 mg/L for the hydrogen production from sucrose using mixed cultures. From
326 Appl Biochem Biotechnol (2014) 173:318–331

Table 1, the maximum hydrogen production rate of 25.3 mL/h was obtained at 175 mg/L ofFeNPs.
In addition, the similar hydrogen production rate was found to be at 200 mg/L and it wasdecreased at the concentration of 250 mg/L of FeNPs. The hydrogen production rate wassignificantly enhanced by the supplementation of FeNPs with increasing concentration from50 to 175 mg/L and further it was not favourable to improve the H2 production rate atconcentration over 175 mg/L. This may be due to the fact that the high concentration ofFeNPs could inhibit the activity of C. acetobutylicum. As noted previously [26], the high initialconcentration of hematite nanoparticles promoted the start-up of hydrogen production rate, butthe excess soluble hematite nanoparticles was harmful to the microorganisms, and resulted inthe decrease of hydrogen production rate. In comparison, the low hydrogen production rateand high lag phase time was observed at all the concentrations of FeSO4 addition (data notshown).
Fig. 5 Hydrogen production versus corresponding fermentation time at different concentrations of iron oxidenanoparticles
Table 1 Kinetic parameters forhydrogen production at variousconcentrations of iron oxidenanoparticles
FeNPs Concentration(mg/L)
P (mL) Rm (mL/h) λ (h) R2
0 254 23 9.2 0.9933
50 239 22.16 8.9 0.9913
100 282 24 8.6 0.9892
150 292 23.3 8.1 0.9848
175 314 25.33 6.9 0.981
200 308 25.3 7.9 0.9913
250 271 19.88 9.65 0.9943
Appl Biochem Biotechnol (2014) 173:318–331 327

Effect of FeNPs on Soluble Metabolites Distribution
The effects of FeSO4 and FeNPs on VFAwith ethanol concentration are given in Table 2. Theformation of VFA and ethanol was affected by the addition of FeSO4 and FeNPs in batchexperiments. The major soluble metabolites produced by C. acetobutylicum were acetate,butyrate, propionate and ethanol. The experimental results showed that the soluble metaboliteswere slightly improved by the addition of FeSO4 concentration at 50 mg/L, when compared tocontrol. Furthermore, the soluble metabolites were remarkably decreased with increase ofFeSO4 concentration at above 50 mg/L. However, the butyrate concentration was considerablyobtained at all concentrations of FeSO4 when compared to other metabolites. This resultindicates that the fermentation process by C. acetobutylicum was considered as butyratefermentation type in control and FeSO4-supplemented experiments. On the other hand, theconcentration of acetate and butyrate yields in batch tests was slightly increased with increaseof FeNPs concentrations from 0 to 175 mg/L. The acetate concentration was decreased withincrease of FeNPs concentrations at above 175 mg/L, whereas the butyrate concentration wassteadily increased with increase of FeNPs as the same. Meanwhile, ethanol and propionatewere also increased at above 175 mg/L of FeNPs supplementation. These results exhibit thatthe high hydrogen content was evident with acetate and butyrate. Further, the ethanol andpropionate decreased the hydrogen content. Similar findings were published by Hawkes et al.[27], who reported that the high hydrogen content associated with acetate and butyrate, whileother metabolites decreased the hydrogen production. According to theoretical yield, 4 molesof hydrogen is produced from 1 mole of glucose at the acetate fermentation type and 2 molesfor butyrate fermentation type as follows (Eqs. 3 and 4).
C6H12O6 þ 2H2O→2CH3COOHþ 2CO2 þ 4H2 ð3Þ
C6H12O6 þ 2H2O→CH3CH2COOHþ 2CO2 þ 2H2 ð4Þ
Table 2 Effects of FeSO4 and FeNPs on soluble metabolites distribution
Exp Concentration Ethanol Acetic acid Butyric acid Propionic acid
(mg/L)
Control 0 324.3±11.3 789.34±31.2 897.5±6.43 146.4±13.45
FeSO4 50 354.4±16.3 814.7±28.3 907.3±24.32 168.3±16.42
100 298.4±19.3 724.16±33.2 928.4±28.34 138.3±13.23
150 318.4±14.4 638.29±30.5 878.5±21.24 148.3±28.24
175 247.3±19.2 539.59±31.2 906.4±23.24 129.4±11.43
200 214.3±21.2 529.12±29.4 789.4±28.23 132.2±10.24
250 113.3±22.3 512.4±24.3 657.3±21.1 128.34±12.24
FeNPs 50 306.2±14.53 792.71±24.3 907.2±33.45 127.3±24.4
100 265.3±21.23 828.34±26.5 928.4±21.24 114.2±21.34
150 317.3±13.45 839.62±24.3 919.3±22.24 102.5±17.44
175 319.2±16.2 845.82±31.4 924.4±11.4 117.9±19.34
200 331.4±18.3 817.29±20.3 913.5±19.34 124.2±18.34
250 349.1±21.2 719.48±13.2 929.3±17.35 141.2±13.35
328 Appl Biochem Biotechnol (2014) 173:318–331

The present study demonstrates that the fermentation process by C. acetobutylicum wasconsidered as butyrate fermentation type in control and FeSO4-supplemented experiments, asrepresented in Eq. 4. In FeNPs-supplemented experiments, the fermentation type was shiftedfrom butyrate to acetate/butyrate fermentation type as illustrated in Eqs. 3 and 4. Thisfermentation type was favourable for hydrogen production and produced maximumhydrogen yield of 2.33±0.09 mol H2/mol glucose, but the considerable co-productionof ethanol was found to be a barrier to achieve the theoretical yield (Table 3). Thesupplementation of FeNPs played a crucial role in fermentative pathway to form anacetate/butyrate fermentation type. Moreover, this metabolic pathway shifted tosolventogenesis phase at above 175 mg/L. Nevertheless, it is important to maintainthe fermentation at acidogenesis condition to produce efficient hydrogen productionfrom C. acetobutylicum.
Conclusions
In this work, iron oxide nanoparticles were successfully synthesized using M. koenigii leafextract and their effect of enhancement on fermentative hydrogen production byC. acetobutylicum NCIM 2337 was investigated. M. koenigii is an evergreen plant and itsleaves are easily available in all four seasons. Thus, it can be used for the rapid green synthesisof iron oxide nanoparticles instead of chemical synthesis and other biosynthesis. The strongabsorption band of 580 cm−1 in FTIR spectra indicated the formation of maghemite (γ-Fe2O3).The appearance of strong vibrational bands including amide 1, –C–N and –OH groups inbiomolecules showed the presence of flavonoids, alkaloids and polyphenols in curry leaf.Hence, these biomolecules seem to be responsible for reduction and stabilization of iron oxidenanoparticles. The present study demonstrates that the maximum hydrogen production of 314±4 mL, hydrogen content of 52±0.8 % and hydrogen yield of 2.33±0.09 mol H2/mol glucosewere achieved by the addition of optimum concentration of 175 mg/L iron oxide nanoparticles.
Table 3 Comparison of literature data on hydrogen yield and hydrogen content using glucose as a substrate
Microorganism Operationmode
pH Substrateconcentration(g/L)
Ironconcentration(mg/L)
HCa
(%)H2 yield(mol H2/molglucose)
Reference
C. acetobutylicum Continuous 6.0 2.5 – 50 ~2.0 [28]
C. acetobutylicumATCC 824
Continuous 6.2 8.3 – 74 0.9 [29]
C. acetobutylicumATCC 824
Batch 6.2 7.0 – 25.4 1.79 [30]
C. butyricum Batch 7.6 5.0 10−6b – 1.08 [25]
Mixed culture Batch 6.5 9.0 40 42.1 1.59 [31]
Mixed culture Continuous 5.0 9.0 50 44.7 1.13 [16]
C. acetobutylicumNCIM 2337
Batch 6.0 7.5 – 34 1.74 Presentstudy50 40 2.06
175c 52 2.33
a Hydrogen contentb 10−6 mol L−1 of Fe/SiO2 nanoparticlesc Iron oxide nanoparticles
Appl Biochem Biotechnol (2014) 173:318–331 329

The enhancement of hydrogenase activity by the supplementation of iron oxide nanoparticleswas believed to be accountable for high yield of hydrogen production.
Acknowledgments This research was funded by the Department of Biotechnology (Ref. No. BT/PR12051/PBD/26/213/2009, dated 19 November 2010), New Delhi, India. The author Mohanraj gratefully thank theMinistry of New and Renewable Energy, New Delhi, India, for the Senior Research Fellowship (NREF–SRF).
References
1. Teja, A. S., & Koh, P. Y. (2009). Synthesis, properties, and applications of magnetic iron oxideNanoparticles. Progress in Crystal Growth and Characterization of Materials, 55, 22–45.
2. Matei, E., Predescu, A., Vasile, E., & Predescu, A. (2011). Properties of magnetic iron oxides used asmaterials for wastewater treatment. Journal of Physics: Conference Series, 304, 012022.
3. Safarikova, M., Maderova, Z., & Safarik, I. (2009). Ferrofluid modified Saccharomyces cerevisiae cells forbiocatalysis. Food Research International, 42, 521–524.
4. Narayanan, K. B., & Sakthivel, N. (2010). Biological synthesis of metal nanoparticles byMicrobes. Advancein Colloid and Interface Science, 156, 1–13.
5. Shahwan, T., Sirriah, S. A., Nairat, M., Boyaci, E., Eroglu, A. E., Scott, T. B., & Hallam, K. R. (2011). Greensynthesis of iron nanoparticles and their application as a Fenton-like catalyst for the degradation of aqueouscationic and anionic dyes. Chemical Engineering Journal, 172, 258–266.
6. Hoag, G. E., Collins, J. B., Holcomb, J. L., Hoag, J. R., Nadagouda, M. N., & Varma, R. S. J. (2009).Degradation of bromothymol blue by greener nano scale zero valent iron synthesized using tea polyphenols.Journal of Material Chemistry, 19, 8671–8677.
7. Nadagouda, M. N., Castle, A. B., Murdock, R. C., Hussain, S. M., & Varma, R. S. (2010). In vitrobiocompatibility of nanoscale zerovalent iron particles (NZVI) synthesised using tea polyphenols. GreenChemistry, 12, 114–122.
8. Cai, Y., Shen, Y., Xie, A., Li, S., & Wanga, X. (2010). Green synthesis of soya bean sprouts-mediatedsuperamegnetic Fe3O4 nanoparticles. Journal of Magnetism and Magnetic Materials, 322, 2938–2943.
9. Njagi, E. C., Huang, H., Stafford, L., Genuino, H., Galindo, H. M., Collins, J. B., Hoag, G. E., & Suib, S. L.(2011). Biosynthesis of iron and silver nanoparticles at room temperature using aqueous sorghum branextracts. Langmuir, 27, 264–271.
10. Philip, D., Unni, C., Aromal, S. A., & Vidhu, V. K. (2011). Murraya koeningii leaf assisted rapid greensynthesis of silver and gold nanoparticles. Spectrochimica Acta Part A: Molecular and BiomolecularSpectroscopy, 78, 899–904.
11. Christensen, L., Vivekanandhan, S., Misra, M., & Mohanty, A. K. (2011). Biosynthesis of silver nanopar-ticles using Murraya koenigii (curry leaf): an investigation on the effect of broth concentration in reductionmechanism and particle size. Advances Material Letters, 2, 429–434.
12. Wang, A., Ren, N., Shi, Y., & Lee, D. J. (2008). Bioaugmented hydrogen production from microcrystallinecellulose using co-culture - Clostridium acetobutylicum X9 and Ethanoigenens harbinense B49.International Journal of Hydrogen Energy, 33, 912–917.
13. Chong, M. L., Sabaratnam, V., Shirai, Y., & Hassan, M. A. (2009). Biohydrogen production frombiomass and industrial waste by dark fermentation. International Journal of Hydrogen Energy, 34, 3277–3287.
14. Liu, B. F., Ren, N. Q., Ding, J., Xie, G. J., & Guo, W. Q. (2009). The effect of Ni2+, Fe2+ and Mg2+
concentration on photo-hydrogen production by Rhodopseudomonas faecalis RLD-53. International Journalof Hydrogen Energy, 34, 721–726.
15. Wang, J., & Wan, W. (2008). Effect of Fe2+ concentration on Fermentative hydrogen production by mixedcultures. International Journal of Hydrogen Energy, 33, 1215–1220.
16. Karadag, D., & Puhakka, J. A. (2010). Enhancement of anaerobic hydrogen production by iron and nickel.International Journal of Hydrogen Energy, 35, 8554–8560.
17. Dubois, M., Gilles, K. A., Hamilton, J. K., Rebers, P. A., & Smith, F. (1956). Colorimetric method fordetermination of sugars and related substances. Analytical Chemistry, 28, 350–356.
18. Cappelletti, B. M., Reginatto, V., Amante, E. R., & Antonio, R. V. (2011). Fermentative production ofhydrogen from cassava processing wastewater by Clostridium acetobutylicum. Renewable Energy, 36, 3367–3372.
19. Mie, G. (1908). Beitrage zer Optik truber medien speziell kolloidaler metallosungen. Annals of Physics, 330,377–445.
330 Appl Biochem Biotechnol (2014) 173:318–331

20. Guo, L., Huang, Q., Li, X., & Yang, S. (2001). Iron nanoparticles: synthesis and applications in surfaceenhanced raman scattering and electrocatalysis. Physical Chemistry Chemical Physics, 3, 1661–1665.
21. Narayanan, K. B., & Sakthivel, N. (2011). Extracellular synthesis of silver nanoparticles using the leafextract of coleus amboinicus lour. Materials Research Bulletin, 46, 1708–1713.
22. Togashi, T., Naka, T., Asahina, S., Sato, K., Takami, S., & Adschiri, T. (2011). Surfactant-assisted one-potsynthesis of superamegnetic magnetite nanoparticle clusters tunable cluster size and magnetic field sensitiv-ity. Dalton Transactions, 40, 1073–1078.
23. Biswas, S., Belfield, K. D., Das, R. K., Ghosh, S., & Hebard, A. F. (2012). Superamagnetic nanocompositestemplate with pyrazole-containing diblock copolymers. Polymers, 4, 1211–1225.
24. Babu, S. A., & Prabu, H. G. (2011). Synthesis of AgNPs using the extract of Calotropis procera flower atroom temperature. Material Letters, 65, 1675–1677.
25. Beckers, L., Hiligsmann, S., Lambert, S. D., Heinrichs, B., & Thonart, P. (2013). Improving effect of metaland oxide nanoparticles encapsulated in porous silica on fermentative biohydrogen production byClostridium butyricum. Bioresource Technology, 133, 109–117.
26. Han, H., Cui, M., Wei, L., Yang, H., & Shen, J. (2011). Enhancement effect of hematite nanoparticles onfermentative hydrogen production. Bioresource Technology, 102, 7903–7909.
27. Hawkes, F. R., Dinsdale, R., Hawkes, D. L., & Hussy, I. (2002). Sustainable fermentative hydrogenproduction: challenges for process optimisation. International Journal of Hydrogen Energy, 27, 1339–1347.
28. Chin, H. L., Chen, Z. S., & Chou, C. P. (2003). Fedbatch operation using Clostridium acetobutylicumsuspension culture as biocatalyst for enhancing hydrogen production. Biotechnology Progress, 19, 383–388.
29. Zhang, H., Bruns, M. A., & Logan, B. E. (2006). Biological hydrogen production by Clostridiumacetobutylicum in an unsaturated flow reactor. Water Research, 40, 728–734.
30. Oh, S. E., Zuo, Y., Zhang, H., Guiltinan, M. J., Logan, B. E., & Regan, J. M. (2009). Hydrogen productionby Clostridium acetobutylicum ATCC 824 and megaplasmid-deficient mutant M5 evaluated using a largeheadspace volume technique. International Journal of Hydrogen Energy, 34, 9347–9353.
31. Karadag, D., Makinen, A. E., Efimova, E., & Puhakka, J. A. (2009). Thermophilic biohydrogen production by ananaerobic heat treated-hot spring culture. Bioresource Technology, 100, 5790–5795.
Appl Biochem Biotechnol (2014) 173:318–331 331