
Green Lake, WI - cswea.orgcswea.org/wp-content/uploads/2017/08/CSWEA-Ops-Seminar-GreenLa… ·...
35
Green Lake, WI
Transcript of Green Lake, WI - cswea.orgcswea.org/wp-content/uploads/2017/08/CSWEA-Ops-Seminar-GreenLa… ·...

Green Lake, WI

Green Lake Nutrient & Energy Optimization (2016-Present)
TREVOR GHYLIN , PHD, PE
DAN SHELDON, PE
OCTOBER 31, 2017

OSCAR™ Process Optimization Pilot Project Green Lake WI
Plant Information
ICEAS® Process by Sanitaire installation 2007
Design Peak/Average Flow 1.5/0.2 mgd
Project Goals
Process Optimization
- Main wastewater treatment process - Nutrient
Removal (Nitrogen and Phosphorus)
- Sludge digester process - Nutrient Removal
(Nitrogen and Phosphorus)
Prove out low-cost, process optimization methods in
operating wastewater treatment plant.

Instrumentation
Main Wastewater Treatment Process.
ICEAS® Instruments – Two Basins:
• O2 – Dissolved Oxygen
• NH4 Ammonium / NO3 Nitrate
• ORP – Oxidation Reduction Potential
• PO4 analyzer (Effluent Channel)
Sludge Digester – Two Basins:
• O2 – Dissolved Oxygen
• NH4 Ammonium / NO3 Nitrate
• K - Potassium
• ORP – Oxidation Reduction Potential
• pH
• PO4 analyzer (East Digester)
Basin 1
DO Control
Basin 2
NURO Control
Decant Return
Dewatering
Return
Sludge to
Dewatering

ICEAS® SBR

June 21 – July 22 Basin 1 – DO Control; Basin 2 – NURO Control
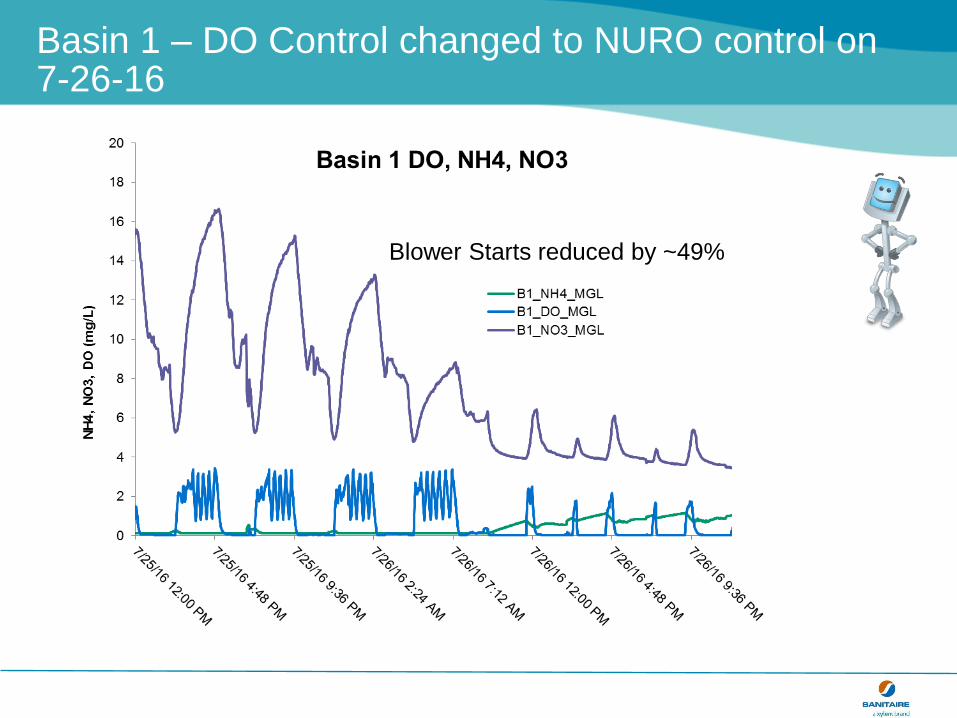
Basin 1 – DO Control changed to NURO control on 7-26-16
Blower Starts reduced by ~49%

Energy
Test Phase (Basin 1/Basin2) Dates Basin 1
Kwhr/day Basin 2
Kwhr/day % Difference
NH4/NH4 5/20-5/31 50.23 47.98 4%
DO/DO 5/31-6/7 61.57 62.20 -1%
DO/NH4 6/7-6/14 72.48 61.80 15%
DO/NURO 6/21-7/13 99.99 78.36 22%

2016 Conclusions
NURO vs DO
• 22% energy savings
• 20% lower effluent P
• 49% less blower starts

2017 Testing

3/9/17 Change from DO Control to NURO Control
NO3 decreases after changing from DO control to NURO control possibly enabling more BioP activity

3/9/17 Change from DO Control to NURO Control
ORP decreases after changing from DO control to NURO control

3/9/17 Change from DO Control to NURO Control
K fluctuations and P fluctuations increase after changing from DO control to NURO control possibly indicating
more BioP activity; Effluent P increases temporarily but recovers in about a week

Energy/Blower Starts
Test Phase
(Basin
1/Basin2) Dates
Blower
Energy
(Kwhr/d) %
Difference
Blower
Starts
(#/day) %
Difference
DO/DO 2/9/17-3/9/17 86.4 50.2
NURO/NURO 3/9/17-4/9/17 68.6 -26% 33.3 -34%

2017 Conclusions for NURO Control
NURO
• NURO saved ~26% energy compared to DO control
• NURO reduced blower starts by 34% compared to DO control
• NURO appeared to have an immediate effect on enabling BioP
(evident from lower NO3, ORP leading to P release and uptake
not seen in DO control)

Chemical Consumption

Chemical Dosing (Sorbx)
NURO/NURO NURO/NURO DO/DO
Chem feed control
started 4/26/17
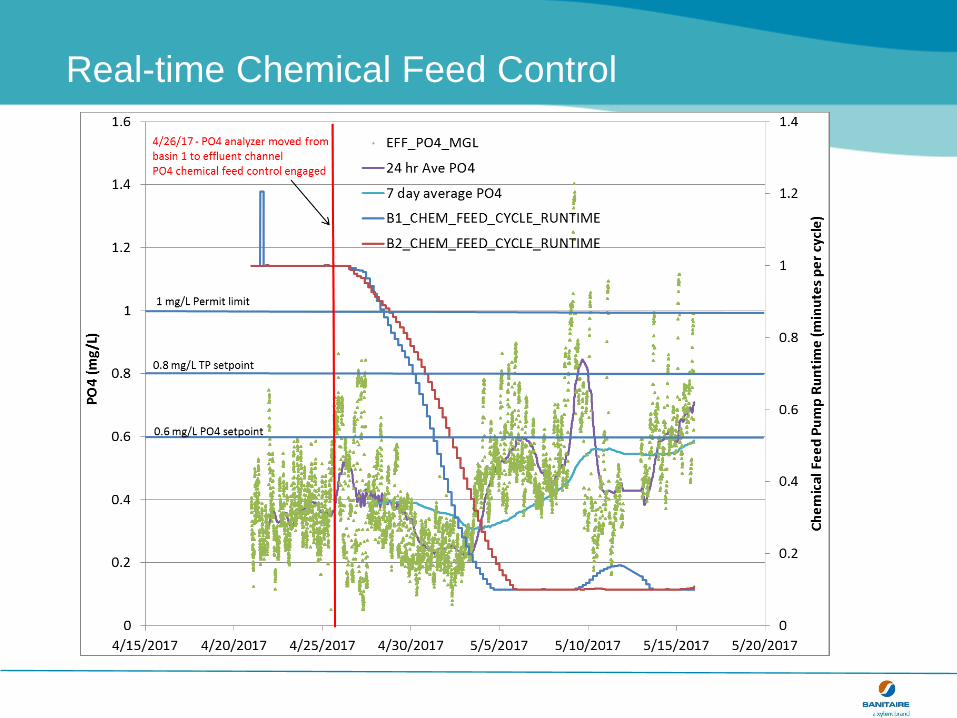
Real-time Chemical Feed Control

2015-2017 Chemical Feed Costs

2015-2017 Chemical Feed Costs

Aerobic Digester Control

Green Lake, WI Case Study
Added DO, ORP and Varion sensors (NH4, K, NO3)
Implemented new DINO control
>90% Energy Savings
>90% reduction in phosphate returned to main plant
>65% reduction in chemical consumption for phosphorus removal*
*Plant also implemented new NURO controller in mainstream ICEAS
process to enhance Biological Phosphorus removal
US
Units
Metric
Units
Flow (Average)
WAS feed TSS
Temp
Total Volume
SRT
gpd | lpd
mg/L
F | C
Gals | m3
days
5,380
8,000
41-77
185,000
34.4
20,360
8,000
5-25
700
34.4

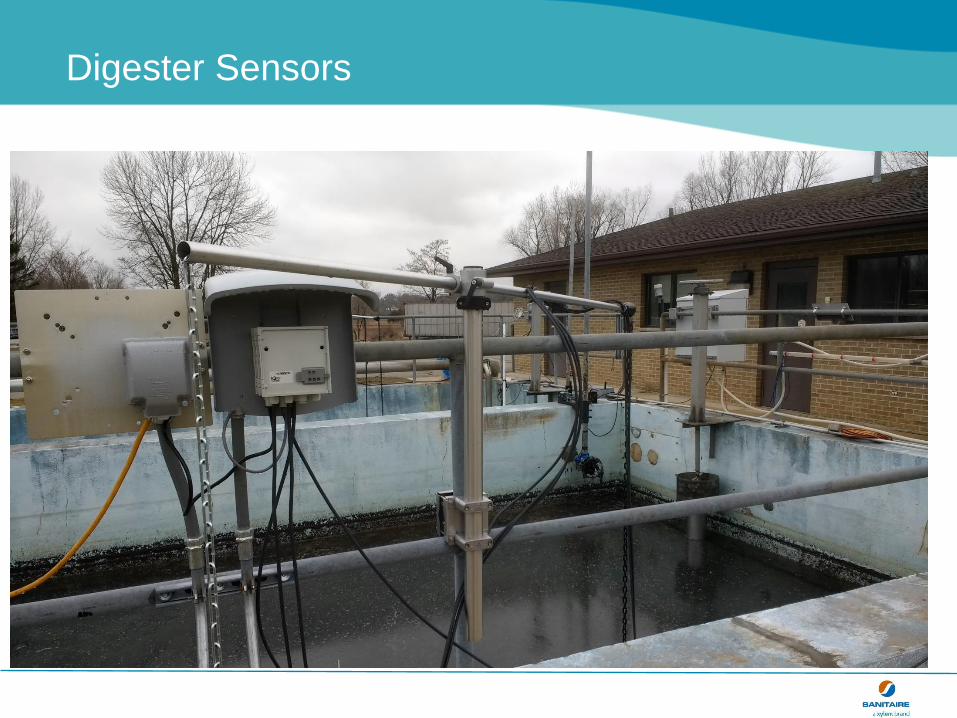
Aerobic Digester

Digester Sensors

Digester Sensors
Digester Sensors

Digester Sensors
Sludge Digester
• O2 – Dissolved Oxygen
• NH4 Ammonium / NO3 Nitrate
• K - Potassium
• ORP – Oxidation Reduction Potential
• pH
• PO4

DINO Background: K Correlation with PO4
Note: Phosphate removal phenomenon shown is due to biological P uptake rather than chemical precipitation. DNA
testing determined a high abundance of phosphate accumulating organisms; pH data indicated a neutral pH around 7.
Precipitation of struvite and other minerals generally requires higher pH;

DINO: Control Air to Optimize Biological Phosphorus Removal &
Minimize Nutrients Prior to Dewatering/Decant
36

DINO: 90% reduction in P returned to the main plant
DINO

0
0.2
0.4
0.6
0.8
1
1.2
1.4
Monday Tuesday Wednesday Thursday Friday
P L
oa
d (
mg
/L)
Effluent P with and without Digester Control
No DINO (mg/L) DINO (mg/L)
DINO: Improved Effluent P
1 mg/L Permit Limit

Digester Control Comparison (0.2 MGD plant) Full Air vs. DINO
42
DIGESTER AERATION CONTROL COMPARISON
Fully Aerated DINO
Blower Energy
Blower Energy
Kwhr/week
USD$/year
3,000
$15,000
160
$850
Blower Energy % on peak 36% 0%
Blower Starts #/week 0 3
PO4 returned to plant
PO4 returned to plant
NO3 returned to plant
NO3 returned to plant
Lbs/week
% of influent
Lbs/week
% of influent
7
15-25%
27
15-25%
0.5
1-2%
0
0%

Conclusions
Green Lake WWTP has a 0.2 MGD average flow
Improved control of:
-Activated sludge aeration (NURO; NH4-based)
-Digester aeration (DINO; K-based))
-Chemical feed (PO4-based control)
Resulted in:
-Effluent TN < 3 mg/L, Effluent TP < 1 mg/L
-Chemical Savings ~65%
-More stable effluent PO4
-SBR aeration energy savings ~20-25%
-Digester aeration energy savings >90%
-Reduced SBR blower starts 35-50%

Acknowledgements
City of Green Lake
• Glen McCarty Water/Wastewater Superintendent
• Nathan Polcyn Water/Wastewater Operator

Questions/Advice about BNR or Aerobic Digestion
Trevor Ghylin
Senior Process Engineer
Xylem-Sanitaire
414-365-2255
Contact your Local Sanitaire Sales Representative
WI– Mulcahy Shaw Water (mulcahyshaw.com)
IL– LAI (lai-ltd.com)
MN, ND, SD, IA – Great Northern Environmental (gnenv.com)