Green House Gas Report
29
Gresham, Oregon Community Greenhouse Gas Inventory
Transcript of Green House Gas Report

For Calendar Year 2019 September, 2021
Gresham, Oregon
Community Greenhouse Gas Inventory

City of Gresham, 2019 Community GHG Inventory
2
Acknowledgements
Project team
• Alex Logue
• Allison Don
• Carly Rice
• David Berniker
• Gregg Hayward
• Jay Higgins
• Meghan Borato
• Nick Isbister
• Shannon Martin
• Steve Fancher
• Tina Osterink
• Toby Hazelbaker
• Torrey Lindbo
• Tim Lynch
Project Manager and community contact: Shannon Martin, Solid Waste & Sustainability Manager City of Gresham [email protected]
Additional project staff assisting in data collection:
• Keri Handaly
• Ken Koblitz
• Tina Osterink
• Alan Johnston
• Jacob Corum Special thank you to Oregon Department of Transportation, Oregon Department of Environmental Quality, and local utilities for providing necessary data for this inventory.
Consulting team
Good Company, a sustainability consulting firm based in Eugene, OR
conducted the analysis for the City of Gresham. Aaron Toneys and Claudia
Denton of Good Company provided data gathering assistance to City staff
and facilitated the use of Good Company’s Carbon Calculator for Communities (G3C – Community), a
proprietary GHG inventory tool, to conduct analysis. They are the primary authors of this report.

City of Gresham, 2019 Community GHG Inventory
3
Table of Contents
Executive Summary ............................................................................................ 4
Introduction ........................................................................................................ 5
Inventory Boundaries & Methodology (What’s Included?) .................................. 6
High-Level Inventory Results ............................................................................... 9
Local Emissions .................................................................................................................. 9
Imported Emissions .......................................................................................................... 10
Total emissions ................................................................................................................ 10
Inventory Highlights .......................................................................................... 13
Building Energy ................................................................................................................ 13
Industrial Process & Refrigerants ...................................................................................... 14
Transportation ................................................................................................................. 15
Solid Waste & Wastewater............................................................................................... 16
Agriculture, Forestry, & Land Use ..................................................................................... 16
Imported Emissions .......................................................................................................... 17
Negative Emissions .......................................................................................................... 18
Appendix A: Glossary of Terms ......................................................................... 20
Appendix B: Methodology & Protocols ............................................................. 22
Appendix C: Summary of Data and Emissions Factors ....................................... 25
City of Gresham, 2019 Community GHG Inventory
4
Executive Summary
City of Gresham completed a Community Greenhouse Gas (GHG) Inventory to better understand sources
of GHG emissions (i.e. climate pollution) to inform development of a community Climate Action Plan
(CAP). The inventory follows internationally recognized community GHG inventory protocols and accounts
for all significant sources of GHG emissions driven by activities taking place within the City’s geographic
boundary. Beyond protocol requirements, the inventory also measures consumption-based emissions
from imported goods and food, air travel, as well as negative emissions, including forest sequestration
and the purchase of carbon offsets.
Summary of Findings
• During 2019, local emissions totaled over 1.25 million Metric Tons of carbon dioxide equivalent
(MT CO2e). The largest sectors were energy use by buildings (primarily natural gas and electricity
use, 47%), industrial processes and refrigerants (27%), and transportation (primarily gasoline
combustion, 24% local emissions). Waste disposal and land use change each accounted for 1% of
local emissions.
• Imported emissions from household consumption and production of fuel and energy sold in
Gresham totaled nearly 880,000 MT CO2e and include upstream emissions from production of
goods (35%), food (32%), fuel production (26%), and air travel (7%).
• All emissions combined total over 2.1 million MT CO2e, or 19.5 MT CO2e per resident.
Figure 1: City of Gresham’s 2019 Community Greenhouse Gas Emissions

City of Gresham, 2019 Community GHG Inventory
5
Introduction
Human activity in the form of combustion of fossil fuels is the primary cause of planetary warming and
changes in climate that have occurred over the past few decades and accelerated in recent years.1 The
best available evidence indicates that human-caused greenhouse gas emissions (GHGs) must be reduced
by about 45% from 2010 levels by 20302 to avoid “severe, pervasive and irreversible impacts for people
and ecosystems.”1 We are already observing physical changes to Oregon’s climate, including hotter
temperatures, drought, wildfire smoke and less mountain snow3. Understanding the areas of greatest risk
gives us the opportunity to act rather than react to these changing conditions and helps us be as resilient
as possible. The most common international goal to mitigate the worst climate impacts are aligned with
the Paris Climate Accord which seeks to limit global average temperature increases to well below 2°C
(3.6°F) relative to temperatures at the start of the industrial revolution and to strive for limiting
temperature to 1.5°C. As of 2018, we’ve already passed the halfway point: average temperatures have
increased by more than 1°C (1.8°F) since the Industrial Revolution and are on track to increase to 1.5°C
(2.7°F) by 20401. It’s with this understanding and urgency that the City of Gresham commissioned this
community greenhouse gas (GHG) inventory to inform development of a community Climate Action Plan.
The City of Gresham 2019 Community GHG Inventory includes the following emissions sources:
Building Energy use by residential, commercial, and industrial buildings and facilities represents a large
source of community emissions. These emissions come from combustion of natural gas for water and
building heat and from electricity generated from fossil fuels. Small quantities of combusted propane
and other fuels are also included. Additionally, a fraction of natural gas is lost during local distribution,
releasing methane, a potent greenhouse gas pollutant.
Transportation energy, particularly on-road vehicle transportation of passengers and freight, also
represents a large fraction of community emissions. Like building energy, transportation emissions are
generated at the tailpipe by combustion of gasoline, diesel, other liquid and gas fuels, or from electricity
generation for electric vehicles.
Waste disposal in landfills and other facilities and wastewater treatment from treatment plants and
septic tanks produce methane, of which a fraction leaks out to the atmosphere.
Industrial Process & Refrigerants release a variety of potent greenhouse gases into the atmosphere,
including Chlorofluorocarbons (CFCs), Hydrofluorocarbons (HFCs), Perfluorocarbons (PFCs), Sulfur
Hexafluoride (SF6) and Nitrogen Trifluoride (NF3). Some of these gases are refrigerants from building
and vehicle air conditioning and refrigeration equipment, while other gases have specific industrial
1 Intergovernmental Panel on Climate (2014). Assessment Report 5 Synthesis Report: Climate Change 2014. http://www.ipcc.ch/report/ar5/syr/ 2 Summary for Policymakers of IPCC Special Report on Global Warming of 1.5°C approved by governments, https://www.ipcc.ch/2018/10/08/summary-for-policymakers-of-ipcc-special-report-on-global-warming-of-1-5c-approved-by-governments/ 3 Mote, P.W., J. Abatzoglou, K.D. Dello, K. Hegewisch, and D.E. Rupp, 2019: Fourth Oregon Climate Assessment Report. Oregon Climate Change Research Institute. occri.net/ocar4.

City of Gresham, 2019 Community GHG Inventory
6
uses. These gases typically have very high global warming potential; therefore, relatively small losses
have a large climate impact.
Agriculture, Forestry, & Land Use generate emissions from agricultural activity (e.g. animal waste and
agricultural inputs), forestry activities, and community land use change (e.g. development of forest or
grasslands).
Consumption-based Emissions are generated outside of the community during the production of
goods, food, fuels, and service products consumed by residents. Note: Consumption-based emissions
presented in this inventory are estimated and therefore the results have a greater level of uncertainty
compared to other sources of emissions.
Inventory Boundaries & Methodology (What’s Included?)
Protocol and Inventory Boundaries
This community inventory follows Greenhouse Gas Protocol’s Global Protocol for Community-Scale
Greenhouse Gas Emissions (GPC).4 The GPC is focused on accounting for sector-based emissions, which
we refer to here as local sources of emissions. This inventory also includes an estimate of the emissions
embodied in local consumption of consumer goods (referred to here as imported emissions), construction
materials, and food, to inform community climate action strategies on a known, large emissions source
often excluded from inventories.
The first step in any GHG inventory is setting the inventory boundary. The boundary includes defining the
geographic area, time span, emissions sources and gases covered in the inventory. The greenhouse gas
inventory presented in this report is based on calendar year 2019 data for the City of Gresham geographic
boundary. This inventory considers all seven recognized greenhouse gases, and all of them are relevant
for Gresham – carbon dioxide (CO2), methane (CH4), nitrous oxide (N2O), hydrofluorocarbons (HFCs),
Perfluorocarbons (PFCs), Sulfur Hexafluoride (SF6), and Nitrogen Trifluoride (NF3). All gases are reported
in terms of carbon dioxide equivalent (CO2e), or the amount of carbon dioxide it would take to create the
same warming effect.
Scopes
As described above, GHG emissions are often organized by sector (e.g. buildings, transportation, waste,
etc.). Another way to organize them is by their location of origin, either within a community or outside –
these are referred to as scopes. Scope categories as outlined below distinguish between those emissions
that occur within the geographic boundaries (Scope 1) from those that occur outside the boundaries, but
that are driven by activity from within (Scope 2 and Scope 3). Emissions sectors and sub-sectors included
4 GPC has become the recommended or required standard for international reporting to CDP’s Cities Survey and the Global Covenant of Mayors for Climate & Energy. The GPC may be downloaded at https://ghgprotocol.org/greenhouse-gas-protocol-accounting-reporting-standard-cities.

City of Gresham, 2019 Community GHG Inventory
7
in the GPC are shown in Table 1 (next page). These are compared to emissions included in the 2019
community inventory by scope category.
Scope 1 GHG emissions from sources located within the geographic boundary.
Scope 2 GHG emissions occurring as a result of the use of grid-supplied electricity within the
geographic boundary regardless of where the electricity is generated.
Scope 3 All other GHG emissions that occur outside the boundary as a result of activities taking
places within the boundary.

City of Gresham, 2019 Community GHG Inventory
8
Table 1: Crosswalk of Emission and Scope Categories.

City of Gresham, 2019 Community GHG Inventory
9
High-Level Inventory Results
Local Emissions
The Gresham community generated over 1.25 million MT CO2e of local emissions – about 11.5 MT CO2e
per resident. This is less than the U.S. average of 15.2 and considerably greater than global average of
4.5.5 Protocols refer to local emissions as sector-based emissions. Those emissions are generated close to
home and are most often under the community’s direct control. This quantity of GHGs is equivalent to
the carbon sequestered by over 1.5 million acres of average U.S. forest6 – a land area about 100 times
the size of Gresham.
Figure 2: 2019 Local Community Emissions and Fossil Fuel Details. In Gresham, fossil fuel emissions come from
Building Energy and Transportation Energy sources only. Note: All figures present market-based7 accounting for
electricity emissions unless otherwise noted.
Gresham’s local emissions are shown on the left side of Figure 2 and come primarily from Building Energy,
such as electricity use and combustion of natural gas by buildings and other facilities (blue segments),
Industrial Process & Refrigerant, such as federally reported special industrial emissions and refrigerant
gas loss from buildings and vehicles (orange), and transportation sources, mainly gasoline and diesel
combustion in vehicles (green segment). Emissions from waste include landfill disposal of community
solid waste and wastewater treatment (yellow). In Gresham, emissions from Agriculture, Forestry, and
Land Use only come from land use development of greenspace (red). The right side of Figure 2 details
fossil fuel use. Note that all emissions from buildings and transportation are from fossil fuels (72% of
total); waste, industrial process and refrigerants, and land use are non-fossil fuel emissions.
5 Data from World Bank. For details visit https://data.worldbank.org/indicator/EN.ATM.CO2E.PC 6 US EPA GHG Equivalencies Calculator https://www.epa.gov/energy/greenhouse-gas-equivalencies-calculator 7 See Appendix B page 24 for information about market-based vs. location-based accounting.

City of Gresham, 2019 Community GHG Inventory
10
Imported Emissions
In addition to accounting for local emissions, the
inventory also estimates imported (consumption-
based) emissions, which are generated outside of
Gresham to produce and provide the imported goods,
food, services, air travel, and production and transport
of fuels consumed by local households. Imported
emissions total about 880,000 MT CO2e in addition to
sources of local emissions. This quantity of GHGs is
equivalent to the carbon sequestered by nearly 1.1
million acres of average U.S. forest8. Figure 3 compares
the scale of local, sector-based emissions to imported
emissions from household consumption.
Within goods, the largest purchasing categories include
vehicles & parts, appliances, and construction materials.
Within food, the largest emissions are from the
production of meats, particularly beef and lamb
products.
Upstream emissions from fuel production (gasoline,
diesel, electricity, and natural gas) and air travel from flights taken by residents (regardless of airport
location) are also significant sources of consumption-based emissions. For more details on these
emissions see Figure 9 and the related section on page 17.
Total emissions
Local and imported emissions combine for a total over 2.1 million MT CO2e, or 19.5 MT CO2e per resident.
This quantity of GHGs is roughly equivalent to the carbon sequestered by 2.6 million acres of average
U.S. forest. There are negative emissions sources as well, from voluntary purchase of carbon offsets from
Northwest Natural Gas customers (over 2,000 MT CO2e) as well as annual additional sequestration from
growth in local forests – over 7,000 MT CO2e. Note that the net benefit from PGE customers’ purchase of
Renewable Energy Credits are already accounted for in the building energy sector (market-based
accounting) and reduced emissions by nearly 51,000 MT CO2e.
Figure 4 and Table 2 on the following pages detail and compare local emissions, imported emissions, and
negative emissions.
8 US EPA GHG Equivalencies Calculator https://www.epa.gov/energy/greenhouse-gas-equivalencies-calculator
Figure 3: 2019 Community Local + Imported
Emissions
11
Figure 4: Gresham 2019 Community GHG Emissions by local emissions, imported emissions from consumption, and negative emissions from carbon storage and offsets.

12
Table 2: Summary Table of Gresham 2019 Community GHG Emissions*
*Sector percentages are based on the market-based accounting Local + Imported total. Per GHG Protocol, negative
emissions are not subtracted (or “netted”) from totals.

13
Inventory Highlights
Building Energy
Energy used in buildings is Gresham’s largest source of local GHG emissions accounting for 47% of local
emissions. These emissions come from a mix of electricity, natural gas use, and other stationary
combusted fuels totaling nearly 595,000 MT CO2e.9 Gresham’s commercial and industrial uses have nearly
twice the impact of residential uses. By energy type, electricity had the largest impact (69% of total
building emissions); followed by natural gas (28%); and other fuels (3%). Figure 5 shows emissions broken
down by sub-sector and energy type. Fugitive natural gas escaping from local distribution systems were
reported by the utility and accounts for 0.3% of total building emissions and are not visible in the graphic.
Figure 5: Building Energy Use breakdown
Portland General Electric (PGE) is the local utility supplying electricity to the Gresham community. Each
electric utility has its own specific emissions factor (MT CO2e emitted per kilowatt-hour [kWh] of
electricity) which is dependent on the utility’s power generation supply contracts. The market-based
electricity accounting method uses these utility-specific factors and accounts for voluntary community
participation in utility-sponsored green power programs.
In 2019, PGE’s residential and businesses customers in Gresham purchased renewable energy in the
form of Renewable Energy Credits (RECs) equal to about 11% of demand, which decreased market-
based electricity accounting emissions by 50,719 MT CO2e.
9 All emissions estimates use market-based accounting for electricity unless otherwise noted. Market-based electric accounting totals 406,984 MT CO2e from electricity, while location-based accounting totals 358,952 MT CO2e. See Appendix B page 24 for information about market-based vs. location-based accounting.

14
Industrial Process & Refrigerants
Industrial Process and Refrigerant Emissions are fugitive
gases from specialized industrial uses or refrigeration
systems. These gases – CFCs, HFCs, PFCs, SF6, and NF3 –
have a large climate impact, up to 23,500 times the Global
Warming Potential of an equivalent weight of CO2
depending on the gas.
Industrial process emissions sources were identified for
three facilities within Gresham using the U.S.
Environmental Protection Agency’s Facility-Level
Information on Greenhouse Gases Tool (FLIGHT)10 and
Oregon Department of Environmental Quality Reported
greenhouse gas emissions for facilities with air quality
permits11. These emissions total over 290,000 MT CO2e12
for 2019 and were the second largest source of local
emissions. The majority of these emissions (86%) are
process emissions from industrial manufacturing facilities
operating within Gresham. Note that building energy emissions (e.g. combusted fuels) are not included in
Industrial Process emissions and are excluded here.
A smaller source of emissions is fugitive loss of refrigerants from residential and commercial buildings and
vehicle air conditioning and refrigeration equipment. These sources are estimated for Gresham using state
per capita data, downscaling from emissions reported in the State of Oregon’s 2015 GHG Inventory, and
are estimated at about 47,000 MT CO2e. Within the State of Oregon, sources of residential, commercial,
and transportation refrigerant emissions (in DEQ’s inventory as High Global Warming Potential gases)
have grown by 21% since 200913.
10 Available at https://ghgdata.epa.gov/ghgp/main.do 11 Available at https://www.oregon.gov/deq/aq/programs/Pages/GHG-Emissions.aspx 12 These facilities are monitored by EPA’s FLIGHT and/or Oregon DEQ due to the significant climate impacts. EPA’s FLIGHT database values will vary from this analysis, as the online tool uses IPCC AR4 GWP values, and this GHG Inventory uses updated IPCC AR5 GWP values in line with the most recent science. Oregon DEQ also reports AR4 GWP values, but individual gas data was not available to convert into AR5 GWP value totals. Applicable Industrial Process emissions data for two large Industrial processors was calculated from EPA FLIGHT. Applicable Industrial Process emissions data for another large Industrial company was requested from Oregon DEQ. Building energy was excluded. 13 Oregon Greenhouse Gas Sector-Based Inventory https://www.oregon.gov/deq/aq/programs/Pages/GHG-Inventory.aspx
Figure 6: 2019 Emissions from Industrial
Process & Refrigerant sources (MT CO2e)
15
Transportation
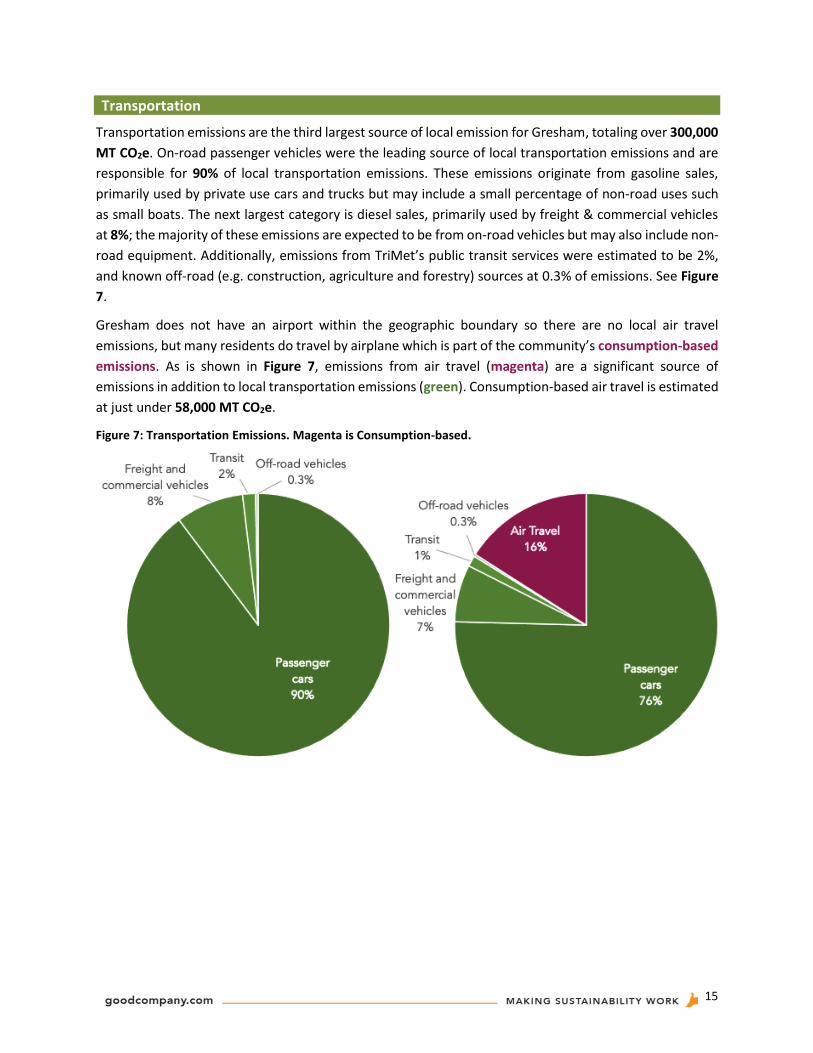
Transportation emissions are the third largest source of local emission for Gresham, totaling over 300,000
MT CO2e. On-road passenger vehicles were the leading source of local transportation emissions and are
responsible for 90% of local transportation emissions. These emissions originate from gasoline sales,
primarily used by private use cars and trucks but may include a small percentage of non-road uses such
as small boats. The next largest category is diesel sales, primarily used by freight & commercial vehicles
at 8%; the majority of these emissions are expected to be from on-road vehicles but may also include non-
road equipment. Additionally, emissions from TriMet’s public transit services were estimated to be 2%,
and known off-road (e.g. construction, agriculture and forestry) sources at 0.3% of emissions. See Figure
7.
Gresham does not have an airport within the geographic boundary so there are no local air travel
emissions, but many residents do travel by airplane which is part of the community’s consumption-based
emissions. As is shown in Figure 7, emissions from air travel (magenta) are a significant source of
emissions in addition to local transportation emissions (green). Consumption-based air travel is estimated
at just under 58,000 MT CO2e.
Figure 7: Transportation Emissions. Magenta is Consumption-based.

16
Solid Waste & Wastewater
Solid Waste and Wastewater emissions total less than 10,000 MT CO2e – about 1% of local emissions.
Gresham haulers send landfilled waste to Arlington Landfill, Wasco Landfill, Covanta Waste-to-Energy,
and a small amount to unknown destinations. These landfill emissions are estimated to total roughly 7,500
MT CO2e. In addition to landfilled waste, organics are sent to composting facilities or for fuel purposes.
Composted food scraps and yard waste are estimated to total less than 700 MT CO2e. Vance Pit is the
only waste site located inside Gresham. Data was not readily available for this site, however, emissions
are expected to minimal as the site is small, not open for new waste, and not required to be regulated by
state or federal agencies.
Wastewater is processed by City of Gresham facilities and is included in the analysis. A small number of
septic systems are also present in the city. Total wastewater process emissions, including septic, are
estimated to total about 850 MT CO2e.
Agriculture, Forestry, & Land Use
Applicable AFLU emissions include land use conversion from greenspace to development. This source of
emissions considers the carbon stored in existing vegetation that is lost to the atmosphere during site
clearing for construction and development. This data was compiled by City staff and is estimated to total
nearly 8,500 MT CO2e.

17
Imported Emissions
Emissions from Consumption of Imported Goods, Food, Fuel, and Air Travel
Gresham’s inventory goes beyond GPC protocol
requirements to highlight the known large sources of
imported emissions from consumption activities.
These emissions are considered Other Scope 3 in GPC
protocol. This means the community has less control
over management of these emissions as compared to
sources of local emissions. These consumption-based
emissions will be in another community’s local
accounting. That said – these emissions are included
in the inventory because they are large, they are
caused by local demand, it follows State of Oregon
inventory practices, and because opportunities exist
to reduce these emissions locally. These emissions
were estimated at nearly 880,000 MT CO2e and make
up 41% of total emissions (Figure 8).
Consumption of imported goods is the largest source
for Gresham’s imported emissions at 35% of
imported emissions. The largest contributors to this
category include building materials, vehicle parts,
and furnishings and supplies (Figure 9). The next largest category is food and beverage, where largest
emissions are from meats, specifically beef and lamb products. Upstream fuel production, specifically
gasoline production, is another large source, which goes hand-in-hand with passenger transportation
being a large local emissions source. Air travel is also a significant source of Gresham consumption-based
emissions. Note that these air travel emissions are from air travel trips taken by residents regardless of
airport location and are not based on Portland airport fuel use alone.
Figure 8: 2019 Community Local + Imported Emissions

18
Figure 9: Community 2019 Imported Emissions by Category
Category Descriptions:
• Goods: Emissions from extraction, manufacture, and transportation of raw materials into final
products such as building materials, automobile, furniture, clothing, and other goods.
• Food & Beverage: Emissions from agriculture (energy for irrigation, production of fertilizers,
methane emissions from livestock, etc.), transportation of raw materials, and finished products
emissions. Categories included are produce, cereals, dairy, meat, and other foods.
• Upstream Fuel Production: Process and energy emissions from the extraction and production
into usable fuel products (e.g. electricity from household outlets, gasoline pumped into cars,
natural gas combusted by furnaces, etc.). These upstream emissions are considered at the
community-scale for electricity, natural gas, gasoline, and diesel (not available for propane and
fuel oil).
• Air Travel: Emissions associated with air travel by the community regardless of the airport’s
location.
Negative Emissions
Negative emissions are from carbon sequestered by additional growth in vegetation within Gresham’s city
limits and purchased carbon offsets. When considering what to do with information about greenhouse
gases the community is emitting or causing to be emitted, there are different categories of action. The
primary and essential action is to reduce emissions from fossil fuels. The combustion of fossil fuels release
carbon into the atmosphere that has been stored for millions of years in the earth (as coal, petroleum,

19
and natural gas) and without human intervention would continue to be locked away. Greenhouse gas
inventories and climate action plans are focused on understanding and implementing actions to reduce
sources of these emissions.
But there are complementary actions that may be taken through either local carbon storage in community
land use (i.e. forests and soils) or by community purchase of carbon offset credits. These types of actions
are a complement to reducing fossil fuel and other man-made greenhouse gas emissions. But these
actions cannot act as a substitute as the current rate of fossil fuel combustion far outpaces the availability
of natural resources to sequester fossil fuel carbon.
Negative emissions accounting methodology is not currently included in community GHG inventory
protocol. Further, the protocol explicitly states that local sequestration and purchased offsets may not be
used to calculate a net reduction in community emissions. That said – this category is included as current
best practice given the recent emergence of net-zero climate goals and the potential scale of land use
opportunities within forest and agricultural resources.
Gresham’s land area is approximately 14,720 acres with only 2,500 acres of tree canopy, sequestering an
additional 7,219 MT CO2e in 2019. This value is the net gain in carbon storage for the inventory year, not
the total carbon storage for the tree canopy.
In addition to local carbon storage, a small portion of natural gas used in Gresham is compensated for by
community members who participate in Northwest Natural’s Smart Energy program (reported by the
utility as 2,188 MT CO2e). This program allows customers to purchase carbon offsets from The Climate
Trust on their bill to offset emissions from their natural gas use.
Note that the net benefit from PGE customers’ purchase of Renewable Energy Credits is already
accounted for in the building energy sector (market-based accounting) and reduced emissions by nearly
51,000 MT CO2e.

20
Appendix A: Glossary of Terms
GHG
Short for greenhouse gases. Emission of greenhouse gases are the cause of current climate change. An
inventory of GHGs measures gases in units of CO2e. A GHG inventory is also known as a carbon footprint.
GHGP/GPC/Protocol
This type of inventory follows a set protocol, the GHG Protocol (GHGP) standard for cities and
communities known as Global Protocol for Community-Scale Greenhouse Gas Emission Inventories (GPC).
This protocol determines what is included within a set boundary and categorizes emissions by sector. See
Sector-based inventory for more information.
GWP
Short for global warming potential. This refers to the potency of emissions to trap heat in the atmosphere.
Carbon dioxide has a GWP of 1, and other GHG gases are more potent and expressed as a multiple of
carbon dioxide. For example, methane has a GWP of 28, meaning one molecule has 28 times the effect of
one molecule of carbon dioxide (IPCC AR5 values).
Imported Emissions
Emissions from consumption of imported goods and services, also known as Other Scope 3 Emissions per
GPC protocol, include emissions from upstream fuel production and household consumption, such as
food, household goods, and air travel.
IPCC AR5
The United Nations Intergovernmental Panel on Climate Change (IPCC) releases Assessment Reports
providing an overview of the state of knowledge concerning climate change science. The fifth report, AR5,
is the most recent version released in 2014.
KWh
Short for kilowatt hour. Kilowatt hours are a standard unit for electricity consumption, and a measure of
electrical energy equivalent to a power consumption of 1,000 watts for 1 hour.
Local Emissions
Known as sector-based emissions per GPC protocol. This refers to preparing an inventory that is broken
down by various sectors of the community that have common GHG characteristics. This type of inventory
follows a set protocol (GPC) determining what is included in each sector. Mainly, sector-based emissions
include emissions from building energy and vehicles along with local sources of GHGs from waste,
uncontrolled loss of industrial and refrigerant gases, and land uses. Note that emissions from household
consumption of goods and services are not included in sector-based inventories. Standard sectors include:
• Building Energy: emissions from energy used or produced in a fixed location, e.g. electricity,
natural gas, propane, and fuel oil. The GPC term is stationary energy.
• Transportation: emissions from vehicles and mobile equipment.
• Waste: landfilled waste emissions and wastewater treatment emissions.

21
• Industrial Process & Refrigerants: community use of refrigerants and fugitive high-GWP gases
from industrial processes. The GPC term is Industrial Process & Product Use.
• Agriculture, Forestry & Land Use: emissions from agriculture (e.g. animal waste and agricultural
inputs) and community land use change (e.g. development of forest or grasslands), as applicable
to the community.
Location-based Electricity Emissions Accounting
Refers to GHG intensity of the regional electricity grid, representing the average impacts of electricity use
and efficiency efforts across the region. Contrast with Market-based Electricity Emissions Accounting.
Market-based Electricity Emissions Accounting
Refers to the GHG intensity of electricity contracts with local utilities. Contrast with Location-based
Electricity Emissions Accounting.
MT
Short for Metric Ton (~2,200 lbs.). This is a common unit by international standards.
MT CO2e
Metric Tons of carbon dioxide equivalent – a unit of measure. Most greenhouse gases are more potent in
warming the atmosphere than carbon dioxide. In order to calculate and compare emissions easily, all
gases are calculated and combined into a carbon dioxide equivalent, typically measured in metric tons.
Scope (as in Scope 1, Scope 2, Scope 3)
Scopes are one method to define the source of emissions. Scope categories distinguish between emissions
that occur within a geographic boundary (scope 1), from electricity generation serving the community
(scope 2), and emissions that occur outside the boundary, but that are driven by activity within the
boundary (scope 3).
Therm
Common reporting unit of natural gas that represents 100,000 British thermal units. A therm is roughly
equivalent to 100 cubic feet of natural gas.

22
Appendix B: Methodology & Protocols
Protocols and Tools
This inventory follows Global Protocol for Community-Scale Greenhouse Gas Emissions Inventories (GPC)
by Greenhouse Gas Protocol (GHGP). This inventory also follows GHGP’s Scope 2 Guidance for location-
based and market-based electricity accounting emissions and ICLEI’s US Community Protocol for guidance
on calculation of consumption-based emissions (i.e., other Scope 3 as defined by GPC protocol).
Good Company’s carbon calculator tool G3C – Community was used for emissions calculations. G3C –
Community is an Excel-based calculator that documents all activity data; emissions factors; and emissions
calculations used in the inventory. An inventory Audit Trail (included in G3C – Community) is used to
catalog all data, calculation, and resource files collected for or created to complete the inventory. These
resources are highly detailed and will allow for those conducting future inventories to fully understand
and replicate the methods used in this inventory.
GHG emissions presented in this report are represented in metric tons of carbon dioxide equivalent (MT
CO2e). The gases considered in the analysis are consistent with protocol and include carbon dioxide (CO2),
methane (CH4), nitrous oxide (N2O), Chlorofluorocarbons (CFCs), perfluorocarbons (PFCs), Sulfur
Hexafluoride (SF6), and Nitrogen Trifluoride (NF3) per the Kyoto Protocol. All GHG calculations use 100-
year global warming potentials (GWP) as defined in the International Panel on Climate Change’s 5th
Assessment Report (IPCC AR5) when available.
Data Collection
Good Company worked with City of Gresham staff to collect the data required to calculate emissions.
Gresham staff along with other local and regional government staff as well as private entities that serve
the community graciously provided time, data and expertise. Data and emissions factors are described in
Appendix C.
Inventory Exclusions
Table 3: Summary of Inventory Exclusions
NE = Emissions occur but are not reported or estimated IE = Included Elsewhere as part of another data set where a split is not available NO = Activity or process does not occur within boundary
Emissions Sector / Sub-Sector
Key Justification for Exclusion
Building energy: Potable Water Treatment and Deliver Energy
IE Gresham is served mainly from the City of Portland through the Bull Run and
groundwater systems. The City also has a partnership with the Rockwood Water
People’s Utility District to provide groundwater during times of high demand.
Electricity data was not provided by Rockwood Water but is included in
commercial/industrial electricity consumption. Known electricity use for City of
Portland Bull Run is identified in Table 2.
Building energy: Energy Generation
NO No significant activity identified within Gresham’s geographic boundary. Some local community solar is likely but expected to be de minimis.
23
Supplied to the Grid
Building energy: Agriculture, Forestry, and Fishing
NO No activity identified within Gresham’s geographic boundary.
Building energy: Fugitive emissions from Coal Production
NO No activity identified within Gresham’s geographic boundary.
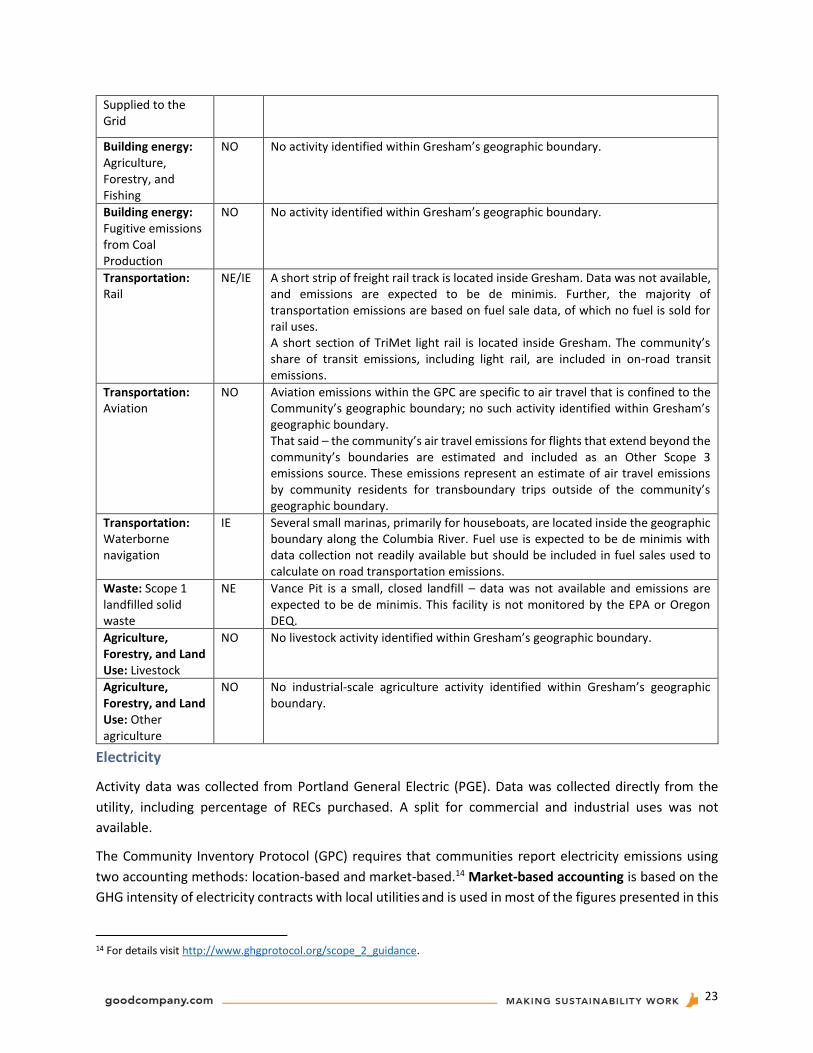
Transportation: Rail
NE/IE A short strip of freight rail track is located inside Gresham. Data was not available, and emissions are expected to be de minimis. Further, the majority of transportation emissions are based on fuel sale data, of which no fuel is sold for rail uses. A short section of TriMet light rail is located inside Gresham. The community’s share of transit emissions, including light rail, are included in on-road transit emissions.
Transportation: Aviation
NO Aviation emissions within the GPC are specific to air travel that is confined to the Community’s geographic boundary; no such activity identified within Gresham’s geographic boundary. That said – the community’s air travel emissions for flights that extend beyond the community’s boundaries are estimated and included as an Other Scope 3 emissions source. These emissions represent an estimate of air travel emissions by community residents for transboundary trips outside of the community’s geographic boundary.
Transportation: Waterborne navigation
IE Several small marinas, primarily for houseboats, are located inside the geographic boundary along the Columbia River. Fuel use is expected to be de minimis with data collection not readily available but should be included in fuel sales used to calculate on road transportation emissions.
Waste: Scope 1 landfilled solid waste
NE Vance Pit is a small, closed landfill – data was not available and emissions are expected to be de minimis. This facility is not monitored by the EPA or Oregon DEQ.
Agriculture, Forestry, and Land Use: Livestock
NO No livestock activity identified within Gresham’s geographic boundary.
Agriculture, Forestry, and Land Use: Other agriculture
NO No industrial-scale agriculture activity identified within Gresham’s geographic boundary.
Electricity
Activity data was collected from Portland General Electric (PGE). Data was collected directly from the
utility, including percentage of RECs purchased. A split for commercial and industrial uses was not
available.
The Community Inventory Protocol (GPC) requires that communities report electricity emissions using
two accounting methods: location-based and market-based.14 Market-based accounting is based on the
GHG intensity of electricity contracts with local utilities and is used in most of the figures presented in this
14 For details visit http://www.ghgprotocol.org/scope_2_guidance.

24
report as the GPC protocols recommended methodology to track progress towards goals over time.
Location-based electricity accounting emissions are calculated using the regional electricity grid’s
(Northwest Power Pool, NWPP) GHG intensity and represent the average impacts of electricity use and
efficiency efforts.
• Location-based method (or regional grid)
multiplies an organization’s electricity use by
the average emissions intensity of a specific
regional electricity grid that is published by the
Environmental Protection Agency (eGRID
2019). Note that over time there may be
differences in emissions results for inventory
years due to the use of an updated eGRID
emissions factor (typically released every 1-2
years). Location-based electricity accounting
offers a means of assessing the average
impacts of electricity use on the regional
electricity grid.
• Market-based method (or utility-specific)
represents emissions specific to the utility and
takes into account community purchase of
renewable energy certificates. Market-based
electricity accounting is commonly used for target and goal tracking and is useful to assess and
manage GHGs associated with electricity generation and supply. It also highlights benefits for
energy efficiency actions, particularly in communities served by utilities with very low GHG
electricity. That is, the less electricity used in the community, the more low-GHG electricity there
is available for export to communities with more GHG intensive electricity sources.
Figure 10: Electricity emissions using both
accounting methods
25
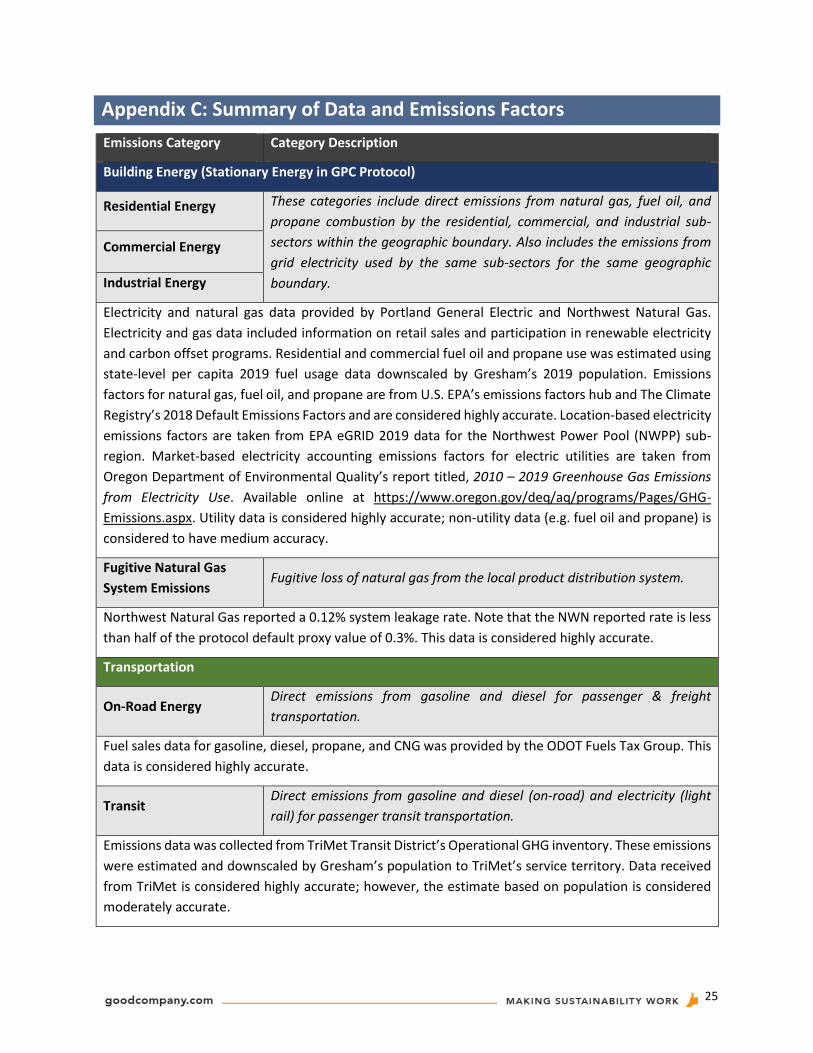
Appendix C: Summary of Data and Emissions Factors
Emissions Category Category Description
Building Energy (Stationary Energy in GPC Protocol)
Residential Energy These categories include direct emissions from natural gas, fuel oil, and
propane combustion by the residential, commercial, and industrial sub-
sectors within the geographic boundary. Also includes the emissions from
grid electricity used by the same sub-sectors for the same geographic
boundary.
Commercial Energy
Industrial Energy
Electricity and natural gas data provided by Portland General Electric and Northwest Natural Gas.
Electricity and gas data included information on retail sales and participation in renewable electricity
and carbon offset programs. Residential and commercial fuel oil and propane use was estimated using
state-level per capita 2019 fuel usage data downscaled by Gresham’s 2019 population. Emissions
factors for natural gas, fuel oil, and propane are from U.S. EPA’s emissions factors hub and The Climate
Registry’s 2018 Default Emissions Factors and are considered highly accurate. Location-based electricity
emissions factors are taken from EPA eGRID 2019 data for the Northwest Power Pool (NWPP) sub-
region. Market-based electricity accounting emissions factors for electric utilities are taken from
Oregon Department of Environmental Quality’s report titled, 2010 – 2019 Greenhouse Gas Emissions
from Electricity Use. Available online at https://www.oregon.gov/deq/aq/programs/Pages/GHG-
Emissions.aspx. Utility data is considered highly accurate; non-utility data (e.g. fuel oil and propane) is
considered to have medium accuracy.
Fugitive Natural Gas
System Emissions Fugitive loss of natural gas from the local product distribution system.
Northwest Natural Gas reported a 0.12% system leakage rate. Note that the NWN reported rate is less
than half of the protocol default proxy value of 0.3%. This data is considered highly accurate.
Transportation
On-Road Energy Direct emissions from gasoline and diesel for passenger & freight
transportation.
Fuel sales data for gasoline, diesel, propane, and CNG was provided by the ODOT Fuels Tax Group. This
data is considered highly accurate.
Transit Direct emissions from gasoline and diesel (on-road) and electricity (light
rail) for passenger transit transportation.
Emissions data was collected from TriMet Transit District’s Operational GHG inventory. These emissions
were estimated and downscaled by Gresham’s population to TriMet’s service territory. Data received
from TriMet is considered highly accurate; however, the estimate based on population is considered
moderately accurate.

26
Rail – Passenger &
Freight
Direct emissions from gasoline and diesel for passenger and freight
transportation within the geographic boundary.
Light rail emissions are included in transit emissions. No Amtrak or other passenger rail activity
occurring in the boundary.
A short strip of freight rail track is located inside Gresham. Data was not available, and emissions are
expected to be de minimis. Further, the majority of transportation emissions are based on fuel sale
data, of which no fuel is sold for rail uses.
Off-Road Direct emissions from gasoline and diesel for off-road vehicles such as
construction equipment, etc.
Fuel sales data for dyed diesel and biodiesel was provided by the ODOT Fuels Tax Group. This data is
considered highly accurate.
Waste
Landfill Solid Waste Fugitive methane emissions from mixed solid waste generated in the
community regardless of disposal location.
Gresham has multiple destination landfills. For waste landfilled at Wasco and Arlington landfills, EPA
reported 2019 emissions were downscaled based on reported short tons from Gresham customers.
This methodology follows IPCC’s first order decay model and is designated by EPA as EE-6 calculations.
This activity data is considered highly accurate.
For waste sent to Covanta Waste-to-Energy incineration plant, EPA reported 2019 emissions for an
estimated quantity of waste processed by Covanta were downscaled based on reported short tons from
Gresham customers. Covanta total emissions and short tons of waste by Gresham’s customers are
considered highly accurate, but without total short tons of processed waste for 2019 by Covanta, this
data is considered medium to high accuracy.
A small portion of waste by Gresham customers have unknown destination landfills. For this waste, the
Methane Commitment method combined with Oregon DEQ 2016 Waste Composition data for
(Portland) Metro was used to estimate emissions. This is considered medium to high accuracy.
Composting Organic
Waste
Fugitive methane and nitrous oxide emissions from composting of organic
wastes (yard debris and food). It should be noted that while composting
does produce emissions, they are significantly less than if the same material
were landfilled. Also, land-application of compost increases soil carbon
sequestration. That benefit is not currently accounted for in GPC
methodology.
Compost data was available in short tons from City staff for 2019. Compost is processed outside of
Gresham, by Dirt Hugger and Recology Aumsville. This activity data is considered highly accurate.
Wastewater Treatment
Process Emissions
Fugitive nitrous oxide emissions from discharge of treated effluent
(wastewater).

27
Wastewater treatment plant process emissions for biogas combustion and effluent discharge are
calculated using data provided by the City of Gresham Wastewater staff. For biogas combustion data
included square cubic feet per day of biogas and the percent methane in the biogas.
For Nitrogen effluent discharge, data was not available and was estimated using ICLEI U.S. Community
GHG Protocol methodology and service population. Emissions calculations for nitrification /
denitrification are based on service population.
This activity data is considered medium-to-highly accurate.
Septic Systems Direct emissions from the combustion of biosolids (wastewater).
Septic fugitive emissions are estimated using number of residents in the community not served by
centralized sewer service. Average emissions factors for residential septic systems are provided by the
U.S. Community GHG Protocol. This activity is considered highly accurate.
Industrial Process & Refrigerants (Industrial Process & Product Use in GPC protocol)
Refrigerants (Product
Use in GPC protocol)
Fugitive loss of refrigerants and other high GWP gases from building and
vehicle air conditioning systems.
Fugitive refrigerant loss and other non-industrial high GWP gas emissions are estimated using Oregon
state-level data attributed to the community on a per capita basis. Activity data for state-level fugitive
emissions from refrigerants, aerosols, and fire suppression systems is reported in the Oregon
Department of Environmental Quality’s (ODEQ’s) Oregon Greenhouse Gas Inventory (as High Global
Warming Potential [HGWP] sources) in quantities of CO2e. Data used is from Oregon’s GHG inventory
includes HGWPs for the residential & commercial and transportation sub-sector (industrial emissions
calculated separately, see Industrial Processes below). High GWP gas emissions are estimated from
State of Oregon totals and therefore are considered as having mid-level accuracy.
Industrial Processes
Fugitive loss of industrial high GWP gases from industrial processes.
Stationary building emissions (fuel combustion, etc.) are not included and
are part of Building Emissions.
Three applicable facilities inside the boundary were identified by the EPA FLIGHT tool and/or Oregon
DEQ’s air quality monitoring reports. These industrial facilities are required to report significant air
quality and/or climate emissions.
EPA reports include specific gases and quantities with clear separation of building energy emissions.
Pre-calculated values used IPCC AR4 GWP values and were re-calculated to reflect more accurate IPCC
AR5 GWP values. Building energy emission were excluded to avoid double counting.
Oregon DEQ reports total emissions in CO2e and do not list specific high GWP gases or quantities, nor a
split between Industrial Process and building energy emissions. Oregon DEQ was contacted with a
request for an Industrial Process split which was provided. Emissions were reported using AR4 GWP
values and were not possible to re-calculate using AR5 values. Other DEQ reported facilities either
emitted biogenic emissions or 100% building energy emissions and were not included.

28
This data is considered highly accurate.
Agriculture, Forestry, and Land Use
Land Use Emissions from vegetation lost during land uses development (vegetated
land to impermeable surfaces).
Acres of total vacant land developed in 2019 inside City limits were provided by City staff. The online
tool i-Tree Landscape was used to supplement this data and estimate Gresham’s average carbon
storage per acre of non-impervious land. This carbon-storage rate was multiplied by the acreage lost to
development. This data is considered medium to high accuracy.
Imported emissions
Goods Upstream energy and process emissions raw material extraction,
manufacturing, and out-of-state transportation of goods.
Food Upstream energy and process emissions from the growing, processing and
transportation of foods.
Services Upstream energy emissions from air travel by community members from
all airports regardless of location.
Accurate data on quantities and suppliers for the goods and food consumed by community households
is not readily available. Therefore, the State of Oregon’s 2015 consumption-based emissions inventory
(CBEI) was used to estimate these sources of emissions. State of Oregon CBEI results were downscaled
for Gresham using US Census Bureau data on households’ income and number of households within
various income brackets. Note that ODEQ conducts the Oregon CBEI every 5 years and therefore this
methodology may not be used to estimate emissions on an annual basis. Air travel is based on U.S.
Census Data and Oregon’s version of the UC Berkeley Household Cool Climate Calculator. Given
inventory year and that data is estimated from a large and complicated economic model, this activity
data is considered as having mid-to-low accuracy.
Upstream Fuel
Production
Upstream energy and process emission from the production and
distribution of natural gas, gasoline, diesel and electricity consumed either
directly or indirectly by the Community.
Data for gasoline, diesel, natural gas and electricity use is same as previously described. Lifecycle
emissions factors for the various fuel types are provided by Oregon Department of Environmental
Quality’s Clean Fuels program carbon intensity scores. Upstream fuel and energy emissions are
calculated as the difference between direct tailpipe emissions (reported under Transportation) and
total lifecycle emissions. Activity data for electricity and natural gas is considered highly accurate while
transportation fuel use is considered moderately accurate because the precise feedstocks for biofuels
sold within the community is not readily available. Upstream emissions can vary significantly for
biofuels depending on feedstocks and therefore calculated emissions are considered moderately

29
accurate. Upstream emissions factors are for regulatory purposes and are therefore considered highly
accurate.
Negative Emissions
Local Carbon Storage Additional carbon storage in the inventory year by local forest resources.
The online tool i-Tree Landscape was used to find the quantity of local tree canopy in Gresham and the
associated average, annual, additional CO2e sequestration. This data is considered medium to high
accuracy.
Purchased Carbon
Offsets Community purchase of verified carbon offsets.
Carbon offsets purchased by Northwest Natural Gas account holders’ participation in NWN’s Clear
Energy program were provided by the utility as therm-equivalents and MT CO2e. This activity data is
considered highly accurate.