“GREEN-FRIENDLY” BEST MANAGEMENT PRACTICES (BMPs) …
305
CIVIL ENGINEERING STUDIES Illinois Center for Transportation Series No. 13-005 UILU-ENG-2013-2021 ISSN: 0197-9191 “GREEN-FRIENDLY” BEST MANAGEMENT PRACTICES (BMPs) FOR INTERSTATE REST AREAS PHASE II Prepared By Khaled El-Rayes Liang Liu Moatassem Abdallah University of Illinois at Urbana-Champaign Research Report FHWA-ICT-13-005 A report of the findings of ICT-R27-103 “Green-Friendly” Best Management Practices (BMPs) for Interstate Rest Areas Illinois Center for Transportation June 2013
Transcript of “GREEN-FRIENDLY” BEST MANAGEMENT PRACTICES (BMPs) …
CIVIL ENGINEERING STUDIES Illinois Center for Transportation Series No. 13-005
UILU-ENG-2013-2021 ISSN: 0197-9191
“GREEN-FRIENDLY” BEST MANAGEMENT PRACTICES (BMPs)
FOR INTERSTATE REST AREAS PHASE II
Prepared By
Khaled El-Rayes Liang Liu
Moatassem Abdallah University of Illinois at Urbana-Champaign
Research Report FHWA-ICT-13-005
A report of the findings of ICT-R27-103
“Green-Friendly” Best Management Practices (BMPs) for Interstate Rest Areas
Illinois Center for Transportation
June 2013

Technical Report Documentation Page 1. Report No. FHWA-ICT-13-005
2. Government Accession No.
3. Recipient's Catalog No.
4. Title and Subtitle “Green-Friendly” Best Management Practices (BMPs) for Interstate Rest Areas—Phase II
5. Report Date June 2013
6. Performing Organization Code N/A
7. Author(s) Khaled El-Rayes, Liang Liu, and Moatassem Abdallah
8. Performing Organization Report No. ICT 13-005 UILU-ENG-2013-2021
9. Performing Organization Name and Address Illinois Center for Transportation Department of Civil and Environmental Engineering University of Illinois at Urbana-Champaign 205 N. Mathews Ave., MC 250 Urbana, IL 61801
10. Work Unit No. (TRAIS) 11. Contract or Grant No. R27-103
12. Sponsoring Agency Name and Address Illinois Department of Transportation Bureau of Materials and Physical Research 126 E. Ash St. Springfield, IL 62704
13. Type of Report and Period Covered
14. Sponsoring Agency Code
15. Supplementary Notes
16. Abstract Interstate rest area buildings in Illinois range in age from 10 to nearly 50 years old and are on display and used 365 days a year by nearly 40 million people annually. The rest area sites comprise 53 buildings that provide restroom facilities, vending machines, and 11 welcome centers. These facilities are presently being maintained within the allowable budgets; however, they are in need of upgrades to improve their environmental and economic performance in supporting recent sustainability initiatives in Illinois. The main goal of this project was to investigate, determine, and recommend a list of green-friendly best management practices (BMPs) for the six interstate rest areas that have the highest energy consumption in Illinois. These six rest areas are Willow Creek, Coalfield, Great Sauk Trail, Mackinaw Dells, Cumberland Road, and Turtle Creek, which account for 32% of IDOT’s rest area energy bills. The main results and findings of this study include (1) an online survey of state departments of transportation (DOTs) conducted to gather information on their experiences in implementing green-friendly measures in rest areas, welcome centers, office buildings, and related buildings; (2) an investigation of installing temporary or permanent sub-metering systems to measure, monitor, and analyze the actual energy consumption of devices and fixtures in the six rest areas; (3) on-site assessments and field measurements of the six rest areas; (4) an identification of energy and water-saving alternatives that can be implemented in the six rest areas, including: LED and induction lighting; motion sensors for interior lighting, vending machines, and exhaust fans; grid-connected photovoltaic systems; solar water heaters; solar tube lighting; double-pane glass, vestibule entrances; Energy Star–rated HVAC systems; geothermal heat pumps; and water-saving plumbing fixtures; (5) an energy audit analysis for the six selected rest areas, using eQuest energy simulation software to analyze the impact of implementing various energy-saving alternatives; (6) an economic analysis of the identified energy-saving alternatives for the selected rest areas in terms of their required upgrade costs, life-cycle cost, and payback periods; and (7) a practical and user-friendly decision support tool that is capable of identifying optimal upgrade measures for public buildings in Illinois to achieve a specified Leadership in Energy and Environmental Design ( LEED) certification with the minimum upgrade costs or achieve the highest LEED points within a given upgrade budget.
17. Key Words Performance of green building measures; green-friendly best management practices; decision support tool; LEED certification; sub-metering systems.
18. Distribution Statement No restrictions. This document is available to the public through the National Technical Information Service, Springfield, Virginia 22161
19. Security Classif. (of this report) Unclassified
20. Security Classif. (of this page) Unclassified
21. No. of Pages 79 plus appendices
22. Price
Form DOT F 1700.7 (8-72) Reproduction of completed page authorized

i
ACKNOWLEDGMENT, DISCLAIMER, MANUFACTURERS’ NAMES
This publication is based on the results of ICT-R27-103, “Green-Friendly” Best Management Practices (BMPs) for Interstate Rest Areas. ICT-R27-103 was conducted in cooperation with the Illinois Center for Transportation; the Illinois Department of Transportation; and the U.S. Department of Transportation, Federal Highway Administration.
Members of the Technical Review Panel are the following:
Matthew Sunderland, IDOT (Chair)
Craig Mitckes, IDOT (Former Chair)
Mark Seppelt, IDOT
Steve Massey, IDOT
Stephanie L. Dobbs, IDOT
Dean Mentjes, FHWA
Lisa Mattingly, CDB
Michael Handley, IDOT
DISCLAIMER The contents of this report reflect the view of the authors, who are responsible for the facts and the accuracy of the data presented herein. The contents do not necessarily reflect the official views or policies of the Illinois Center for Transportation, the Illinois Department of Transportation, or the Federal Highway Administration. This report does not constitute a standard, specification, or regulation.

ii
EXECUTIVE SUMMARY
This report presents the findings of a research project funded by the Illinois Center for Transportation to investigate, determine, and provide a list of “green-friendly” best management practices for the six interstate rest areas that have the highest energy consumption in Illinois. The six rest areas are Coalfield, Cumberland Road, Turtle Creek, Great Sauk Trail, Willow Creek, and Mackinaw Dells; and they account for 32% of the energy costs for IDOT rest areas.
The objectives of this project were to (1) conduct an online survey of state departments of transportation (DOTs) to gather information on their experiences in implementing green-friendly measures in their rest areas, welcome centers, office buildings, and related buildings; (2) investigate the feasibility and cost effectiveness of installing temporary or permanent sub-metering systems to measure, monitor, and analyze the actual energy consumption of devices and fixtures in the selected rest areas; (3) conduct on-site assessments and field measurements of the six selected rest areas; (4) explore and identify energy- and water-saving alternatives that can be implemented in the selected rest areas, including LED and induction lighting, motion sensors for interior lighting, vending machines, and exhaust fans; grid-connected photovoltaic systems; solar water heaters; double-pane glass; vestibule entrances; Energy Star–rated HVAC systems; geothermal heat pumps; and water-saving plumbing fixtures; (5) perform an energy audit analysis for the selected rest areas using the U.S. Department of Energy’s eQuest energy simulation software (http://www.doe2.com/equest) to analyze the impact of implementing energy-saving alternatives; (6) evaluate the economic feasibility of the identified energy-saving alternatives for the selected rest areas in terms of their required upgrade costs, life-cycle cost, and payback periods; (7) develop a decision support tool to identify optimal upgrade measures for public buildings to provide the highest number of LEED points and certification level for any given upgrade budget or to identify the least possible cost to achieve a specified level of LEED certification, such as silver, gold, or platinum; and (8) provide recommendations for green-friendly best management practices at the six rest areas, along with cost estimates for full implementation, including payback periods. To achieve these objectives, the research team carried out six major tasks.
The research work in the first task focused on investigating the feasibility of installing sub-metering systems for energy and water consumption of the major fixtures and devices in the six rest areas. The research team evaluated the major components of sub-metering systems and benefits that could potentially be achieved by installing sub-metering systems in rest area buildings. These systems could be used to measure and monitor the energy and water consumption of various building components and systems, including interior lighting, exterior lighting, vending machines, HVAC systems (heating, ventilating, and air-conditioning systems), water heaters, hand dryers, and water fixtures. Furthermore, the researchers investigated the use of automatic people-counting systems to measure the actual number of visitors in the rest areas, the peak times of use, visitation profiles, and average number of visitors. Also in this task, a survey was conducted to gather information from state departments of transportation (DOTs) about their experiences in implementing green building measures in their public buildings and the performance of those measures in terms of user satisfaction, ease of maintenance, problems encountered, repair costs, energy or water savings, and payback periods.
For the second task, the project team conducted on-site assessments for the six rest areas selected. The on-site assessments were designed to study (1) the types of services provided by each of the six rest areas, (2) the conditions and characteristics of appliances and fixtures, and (3) the potential savings and energy-efficiency practices. On-site assessments

iii
were essential in understanding the conditions of and potential improvements for these six rest areas.
In the third task, the research team explored and identified potential and promising green-friendly measures for the six rest areas. The green building measures investigated in this task were LED and induction lighting; motion sensors for interior lighting, vending machines, and exhaust fans; grid-connected photovoltaic systems; solar water heaters; solar tube lighting; double-pane glass; vestibule entrances; Energy Star–rated HVAC systems; geothermal heat pumps; and water-saving plumbing fixtures. To evaluate the performance of green building measures in these rest areas, the researchers created six simulation models to identify the major contributors of energy consumption in buildings of each of the six rest areas and to analyze the feasibility of replacing the existing devices and equipment with more energy-efficient units.
For the fourth task, the research team analyzed the economic and environmental impacts of potential green-friendly measures identified in the previous task. A life-cycle cost analysis (LCCA) and carbon footprint assessment were conducted to identify promising green-friendly measures and their upgrade costs, annual savings, payback periods, and reduced CO2 emissions.
In the fifth task, a decision support tool was developed to optimize the selection of green building measures to achieve a specified Leadership in Energy and Environmental Design (LEED) certification level with the minimum upgrade cost or to achieve the highest number of LEED points within a specified upgrade budget. The decision support tool developed was designed to analyze green-friendly measures, including interior light bulbs and fixtures, exterior light bulbs and fixtures, hand dryers, vending machines, motion sensors for interior lighting, HVAC systems, water heaters, solar photovoltaic systems, metering and sub-metering systems, and water fixtures. To ensure practicality, the tool was designed to minimize the required input data by using database systems for the building equipment and fixtures. Furthermore, user-friendly graphical interfaces were developed to facilitate the input and output of data in the decision support tool.
In the sixth task of this project, the research team developed recommendations for upgrading the six selected rest areas. These recommendations identified specific promising upgrade measures for each of the selected rest areas and the expected annual savings.

iv
CONTENTS
CHAPTER 1 INTRODUCTION ............................................................................................... 1 1.1 PROBLEM STATEMENT .................................................................................................................... 1 1.2 RESEARCH OBJECTIVES AND METHODOLOGY ........................................................................... 1
CHAPTER 2 ENERGY AND WATER SUB-METERING SYSTEMS ...................................... 3 2.1 TYPES OF ENERGY/WATER SUB-METERS .................................................................................... 4 2.2 BENEFITS OF SUB-METERING SYSTEMS ...................................................................................... 5 2.3 INITIAL AND MAINTENANCE COSTS OF SUB-METERING SYSTEMS ........................................... 6 2.4 COSTS OF SUB-METERING SYSTEMS IN THE SELECTED REST AREAS .................................. 10
CHAPTER 3 SURVEY RESULTS AND ANALYSIS .............................................................16 3.1 IMPLEMENTED GREEN TECHNOLOGIES ..................................................................................... 17 3.2 USER SATISFACTION ..................................................................................................................... 18 3.3 EASE OF MAINTENANCE ................................................................................................................ 19 3.4 OPERATION PROBLEMS AND REPAIR COSTS ............................................................................ 19 3.5 ENERGY SAVINGS AND PAYBACK PERIODS ............................................................................... 24
CHAPTER 4 ON-SITE ASSESSMENT FOR SELECTED REST AREAS .............................26 4.1 WILLOW CREEK REST AREA .......................................................................................................... 28
CHAPTER 5 POTENTIAL LISTS OF BMPS AND THEIR ENERGY AND ECONOMIC PERFORMANCE ......................................................................................................................34
5.1 COALFIELD REST AREA ................................................................................................................. 34 5.1.1 Energy Audit and Analysis ......................................................................................................... 34 5.1.2 Lighting ....................................................................................................................................... 41 5.1.3 Motion Sensors .......................................................................................................................... 46 5.1.4 More-Efficient HVAC Systems ................................................................................................... 51 5.1.5 Double-Pane Glass for Windows and Doors ............................................................................. 55 5.1.6 Vestibule Entrance ..................................................................................................................... 55 5.1.7 Energy-Efficient Hand Dryers .................................................................................................... 56 5.1.8 Solar Measures .......................................................................................................................... 57 5.1.9 Water-Saving Plumbing Fixtures ............................................................................................... 62 5.1.10 Summary of All Promising Green Building Measures .............................................................. 63
CHAPTER 6 DECISION SUPPORT TOOL DEVELOPED FOR OPTIMIZING UPGRADE DECISIONS OF ILLINOIS PUBLIC BUILDINGS ......................................................................65
6.1 DECISION SUPPORT TOOL DESIGN AND CAPABILITIES ........................................................... 65 6.2 DECISION SUPPORT TOOL UPGRADE ......................................................................................... 66 6.3 OPTIMIZING UPGRADE DECISIONS OF THE LEED RATING SYSTEM FOR EXISTING
BUILDINGS ................................................................................................................................ 66 6.3.1 Optimization Model 1: Minimize Upgrade Cost To Achieve a Specified
LEED Certification Level ........................................................................................................ 67 6.3.2 Optimization Model 2: Maximizing Accredited LEED Points Within a Certain Budget .............. 69

v
CHAPTER 7 RECOMMENDATIONS AND FUTURE RESEARCH .......................................72 7.1 RECOMMENDATIONS FOR SELECTED REST AREAS ................................................................. 72
7.1.1 Coalfield Rest Area .................................................................................................................... 72 7.2 FUTURE RESEARCH ....................................................................................................................... 75
REFERENCES .........................................................................................................................78
APPENDIX A SURVEY FORM ............................................................................................... A-1
APPENDIX B TABLES AND FIGURES ILLUSTRATING DETAILED ANALYSIS OF SURVEY RESPONSES ......................................................................................................................... B-1
APPENDIX C ON-SITE ASSESSMENT FOR THE SELECTED REST AREAS OF COALFIELD, GREAT SAUK TRAIL, MACKINAW DELLS, CUMBERLAND ROAD, AND TURTLE CREEK ................................................................................................................... C-1
APPENDIX D POTENTIAL BMPS AND THEIR ENERGY AND ECONOMIC PERFORMANCE FOR CUMBERLAND ROAD, TURTLE CREEK, GREAT SAUK TRAIL, WILLOW CREEK, AND MACKINAW DELLS REST AREAS ............................................................................... D-1
APPENDIX E DECISION SUPPORT TOOL FOR OPTIMIZING UPGRADE DECISIONS OF ILLINOIS PUBLIC BUILDINGS .............................................................................................. E-1
APPENDIX F RECOMMENDATIONS FOR SELECTED REST AREAS ................................ F-1

vi
FIGURES Figure 1. Project tasks and research deliverables. ..................................................................... 2 Figure 2. Sub-metering system. ................................................................................................. 3 Figure 3. An example of a daily comparison report for electricity consumption. .......................... 4 Figure 4. HiTESTER clamp-on power meter (Hioki). .................................................................13 Figure 5. Wattvision for monitoring energy consumption in rest areas. ......................................14 Figure 6. Ranking of green building measures, based on their user satisfaction. ......................19 Figure 7. Ranking of green-friendly measures, based on their ease of maintenance. ................20 Figure 8. Ranking of green building measures based, on percentage of respondents
reporting problems. ............................................................................................................24 Figure 9. Ranking of green-friendly measures, based on reported energy/water savings. .........25 Figure 10. Ranking of green-friendly measures, based on reported payback periods. ...............25 Figure 11. Annual energy consumption for interstate rest areas in Illinois. ................................26 Figure 12. Annual energy consumption per square footage for interstate rest areas
in Illinois . ...........................................................................................................................27 Figure 13. Selected rest areas. .................................................................................................27 Figure 14. Willow Creek rest area. ............................................................................................28 Figure 15. Lighting fixtures at the Willow Creek rest area. .........................................................30 Figure 16. Rooftop unit and water heater in southbound Willow Creek rest area. ......................31 Figure 17. Water-treatment system components in the southbound Willow Creek rest area. ....31 Figure 18. Vending machines in the Willow Creek rest area. .....................................................32 Figure 19. Hand dryers and water coolers in the Willow Creek rest area...................................32 Figure 20. Architectural layout and shape of the Coalfield rest area buildings. ..........................35 Figure 21. Building envelope in eQuest for the Coalfield rest area. ...........................................36 Figure 22. Activity areas’ allocation and occupancy for the Coalfield rest area. .........................36 Figure 23. HVAC system zones and exhaust flow. ....................................................................37 Figure 24. Interior lighting loads. ...............................................................................................38 Figure 25. Equipment and devices loads for the Coalfield rest area. .........................................38 Figure 26. Exterior lighting loads and profiles for the Coalfield rest area buildings. ...................39 Figure 27. Simulated and actual electricity consumption of the Coalfield rest area
buildings in 2009. ...............................................................................................................40 Figure 28. Energy cost breakdown of the Coalfield rest area. ...................................................41 Figure 29. Cumulative costs, savings, and CO2 emissions for the current and replacement
lighting of the Coalfield rest area buildings. ........................................................................43 Figure 30. Cumulative costs, savings, and CO2 emissions for LED and induction lighting
replacements for the Coalfield rest area buildings. .............................................................45 Figure 31. Motion-sensor simulation model for the Coalfield rest area buildings. ......................48 Figure 32. Number of visitors in the men’s restroom throughout a simulation day for the
Coalfield rest area buildings. ..............................................................................................49 Figure 33. Cumulative costs of a horizontal loop geothermal system, a vertical loop
geothermal system, the current HVAC system, and savings for the Coalfield rest area buildings. ....................................................................................................................54

vii
Figure 34. Layout for adding a second door in the Coalfield rest area to create a vestibule entrance. ............................................................................................................................56
Figure 35. Cumulative costs and savings for implementing solar daylight tubes in the restrooms of the Coalfield rest area buildings. ....................................................................58
Figure 36. Cumulative costs and savings for implementing solar daylight tubes in the lobby of the Coalfield rest area buildings. ....................................................................................59
Figure 37. Cumulative cost of incorporating a grid-connected system in the Coalfield rest area building. .....................................................................................................................61
Figure 38. Optimal upgrade decisions for rest area buildings. ...................................................65 Figure 39. Percentage of responses implementing various green measures. .......................... B-1 Figure 40. User satisfaction results for energy-efficient lighting measures. ............................. B-1 Figure 41. User satisfaction results for renewable energy. ...................................................... B-2 Figure 42 User satisfaction results for energy-efficient measures. ........................................... B-2 Figure 43. User satisfaction results for water-efficient measures. ............................................ B-2 Figure 44. Ease-of-maintenance results for energy-efficient lighting. ...................................... B-6 Figure 45. Ease-of-maintenance results for technologies of renewable energy. ...................... B-6 Figure 46. Ease-of-maintenance results for energy-efficient measures. .................................. B-6 Figure 47. Ease-of-maintenance results for water-efficient measures. .................................... B-7 Figure 48. Southbound Coalfield rest area. ............................................................................. C-1 Figure 49. Lighting fixtures in southbound Coalfield rest area. ................................................ C-2 Figure 50. Air-conditioning units and water heater in Coalfield rest area. ................................ C-3 Figure 51. Vending machines in Coalfield rest area. ............................................................... C-3 Figure 52. Hand dryers and water coolers in southbound Coalfield rest area. ......................... C-4 Figure 53. Water fixtures in Coalfield rest area........................................................................ C-4 Figure 54. Westbound Great Sauk Trail rest area. .................................................................. C-5 Figure 55. Lighting fixtures in westbound Great Sauk Trail rest area. ...................................... C-6 Figure 56. Air-conditioning units and water heater in Great Sauk Trail rest area. .................... C-6 Figure 57. Water-treatment system components in Great Sauk Trail rest area........................ C-7 Figure 58. Vending machines in Great Sauk Trail rest area. ................................................... C-7 Figure 59. Hand dryers and water coolers in westbound Great Sauk Trail rest area. .............. C-8 Figure 60. Water fixtures in Great Sauk Trail rest area. ........................................................... C-8 Figure 61. Southbound Mackinaw Dells rest area. .................................................................. C-9 Figure 62. Lighting fixtures in Mackinaw Dells rest area. ....................................................... C-11 Figure 63. Air-conditioning units and water heater in Mackinaw Dells rest area. ................... C-11 Figure 64. Water-treatment system components for Mackinaw Dells rest area. .................... C-11 Figure 65. Vending machines in Mackinaw Dells rest area.................................................... C-12 Figure 66. Hand dryers and water coolers in Mackinaw Dells rest area................................. C-12 Figure 67. Water fixtures in Mackinaw Dells rest area. .......................................................... C-13 Figure 68. Cumberland Road rest area. ................................................................................ C-13 Figure 69. Lighting fixture in Cumberland Road rest area. .................................................... C-14 Figure 70. Air-conditioning units and water heater in Cumberland Road rest area. ............... C-15 Figure 71. Vending machines in Cumberland Road rest area. .............................................. C-15 Figure 72. Hand dryers and water coolers in Cumberland Road rest area. ........................... C-16 Figure 73. Water fixtures in Cumberland Road rest area. ...................................................... C-16

viii
Figure 74. Turtle Creek rest area. ......................................................................................... C-17 Figure 75. Lighting fixtures in Turtle Creek rest area. ............................................................ C-17 Figure 76. Air-conditioning units and water heater in Turtle Creek rest area. ........................ C-19 Figure 77. Two components of water-treatment system at the Turtle Creek rest area. .......... C-19 Figure 78. Vending machines in Turtle Creek rest area. ........................................................ C-20 Figure 79. Hand dryers and water coolers in Turtle Creek rest area. ..................................... C-20 Figure 80. Water fixtures in Turtle Creek rest area. ............................................................... C-21 Figure 81. Simulated and actual electricity consumption of Cumberland Road rest area
building in 2009. ............................................................................................................... D-2 Figure 82. Energy cost breakdown of Cumberland Road rest area building. ........................... D-3 Figure 83. Cumulative costs, savings, and CO2 emissions for current and replacement
lighting in Cumberland Road rest area building. ............................................................... D-5 Figure 84. Cumulative costs, savings, and CO2 emissions for LED and induction lighting
replacements for Cumberland Road rest area building. .................................................... D-9 Figure 85. Motion-sensor simulation model for Cumberland Road rest area building. ........... D-10 Figure 86. Number of visitors in men’s restroom throughout a simulation day in
Cumberland Road rest area building. ............................................................................. D-11 Figure 87. Cumulative costs of current HVAC system, vertical loop geothermal system,
and savings for Cumberland Road rest area building. .................................................... D-15 Figure 88. Cumulative costs and savingsfor implementing solar daylight tubes in
restrooms of Cumberland Road rest area building. ........................................................ D-19 Figure 89. Cumulative costs and savings for implementing solar daylight tubes in lobby of
Cumberland Road rest area building. ............................................................................. D-20 Figure 90. Cumulative cost of incorporating grid-connected system in the Cumberland
Road rest area building. ................................................................................................. D-21 Figure 91. Simulated and actual electricity consumption of Turtle Creek rest area building
in 2009. .......................................................................................................................... D-26 Figure 92. Simulated and actual gas consumption of Turtle Creek rest area building
in 2009. .......................................................................................................................... D-26 Figure 93. Energy cost breakdown for Turtle Creek rest area building. ................................. D-27 Figure 94. Cumulative costs, savings, and CO2 emissions for current and replacement
lighting in Turtle Creek rest area building. ...................................................................... D-30 Figure 95. Cumulative costs, savings, and CO2 emissions for LED and induction lighting
replacements for Turtle Creek rest area building. ........................................................... D-32 Figure 96. Motion-sensor simulation model for Turtle Creek Road rest area building. ........... D-33 Figure 97. Number of visitors in men’s restroom throughout a simulation day in Turtle Creek
rest area Building. .......................................................................................................... D-34 Figure 98. Cumulative costs of current HVAC system, vertical loop geothermal system, and
savings for Turtle Creek rest area building. .................................................................... D-38 Figure 99. Cumulative costs and savings for implementing solar daylight tubes in restrooms of
Turtle Creek rest area building. ...................................................................................... D-42 Figure 100. Cumulative cost of incorporating grid-connected system in the Turtle Creek rest
area building. ................................................................................................................. D-43

ix
Figure 101. Simulated and actual electricity consumption of Great Sauk Trail rest area buildings in 2010. ........................................................................................................... D-48
Figure 102. Energy cost breakdown of Great Sauk Trail rest area buildings. ........................ D-49 Figure 103. Cumulative costs, savings, and CO2 emissions for current and replacement
lighting in Great Sauk Trail rest area buildings. .............................................................. D-51 Figure 104. Cumulative costs, savings, and CO2 emissions for LED and induction lighting
replacements in Great Sauk Trail rest area buildings. .................................................... D-54 Figure 105. Motion-sensor simulation model for Great Sauk Trail Road rest area building. ... D-55 Figure 106. Number of visitors in men’s restroom throughout a simulation day of Great
Sauk Trail rest area buildings. ........................................................................................ D-56 Figure 107. Cumulative costs of current HVAC system, vertical loop geothermal system, and
savings for Great Sauk Trail rest area buildings. ............................................................ D-60 Figure 108. Cumulative costs and savings for implementing solar daylight tubes in restrooms of
Great Sauk Trail rest area buildings. .............................................................................. D-64 Figure 109. Cumulative cost of incorporating grid-connected system in the Great Sauk Trail rest
area buildings. ................................................................................................................ D-65 Figure 110. Simulated and actual electricity consumption of Willow Creek rest area buildings
in 2010. .......................................................................................................................... D-70 Figure 111. Simulated and actual gas consumption of Willow Creek rest area northbound
building in 2010. ............................................................................................................. D-70 Figure 112. Simulated and actual gas consumption of Willow Creek rest area southbound
building in 2010. ............................................................................................................. D-71 Figure 113. Energy cost breakdown for northbound building of Willow Creek rest area. ...... D-72 Figure 114. Energy cost breakdown for southbound building of Willow Creek rest area. ...... D-72 Figure 115. Cumulative costs, savings, and CO2 emissions for current and replacement
lighting in northbound building of Willow Creek rest area. .............................................. D-78 Figure 116. Cumulative costs, savings, and CO2 emissions for current and replacement
lighting in southbound building of Willow Creek rest area. .............................................. D-78 Figure 117. Cumulative costs, savings, and CO2 emissions for LED and induction lighting
replacements for northbound building of Willow Creek rest area. ................................... D-81 Figure 118. Cumulative costs, savings, and CO2 emissions for LED and induction lighting
replacements for northbound building of Willow Creek rest area. ................................... D-82 Figure 119. Motion-sensor simulation model for Willow Creek rest area buildings. ............... D-83 Figure 120. Number of visitors in men’s restroom throughout a simulation day in Willow
Creek rest area buildings. .............................................................................................. D-84 Figure 121. Cumulative costs of current HVAC system, vertical loop geothermal system,
and savings for northbound building of Willow Creek rest area. .................................... D-88 Figure 122. Cumulative costs of current HVAC system, vertical loop geothermal system,
and savings for southbound building of Willow Creek rest area. .................................... D-89 Figure 123. Cumulative cost of incorporating grid-connected system in the northbound
building of Willow Creek rest area. ................................................................................. D-93 Figure 124. Cumulative cost of incorporating grid-connected system in the southbound
building of Willow Creek rest area. ................................................................................. D-93

x
Figure 125. Simulated and actual electricity consumption of Mackinaw Dells rest area buildings in 2009. ........................................................................................................... D-98
Figure 126. Energy cost breakdown of Mackinaw Dells rest area buildings. .......................... D-99 Figure 127. Energy cost, savings, and CO2 emissions for current and replacement lighting
in Mackinaw Dells rest area buildings........................................................................... D-101 Figure 128. Cumulative cost and savings and CO2 emission of LED and Induction exterior
lighting replacements for Mackinaw Dells rest area. ..................................................... D-104 Figure 129. Motion-sensor simulation model for Mackinaw Dells Road rest area building. .. D-105 Figure 130. Number of visitors in men’s restroom throughout a simulation day of
Mackinaw Dells rest area buildings. ............................................................................. D-106 Figure 131. Cumulative costs of current HVAC system, vertical loop geothermal system,
and savings for Mackinaw Dells rest area buildings. .................................................... D-110 Figure 132. Cumulative cost of incorporating grid-connected system in the Mackinaw
Dells rest area buildings. .............................................................................................. D-113 Figure 133. Database for interior light bulbs in the upgraded DST. ......................................... E-2 Figure 134. Database used for interior lighting fixtures in the upgraded DST. ......................... E-2 Figure 135. Designed GUI for interior light bulbs in the upgraded DST. .................................. E-3 Figure 136. Designed GUI for interior lighting fixtures in the upgraded DST. ........................... E-3 Figure 137. Designed GUI for exterior light bulbs in the upgraded DST. ................................. E-4 Figure 138. Designed GUI for exterior lighting fixtures in the upgraded DST. .......................... E-5 Figure 139. Designed GUI for hand dryers in the upgraded DST. ........................................... E-6 Figure 140. Designed GUI for vending machines in the upgraded DST................................... E-7 Figure 141. Designed GUI for general devices in the upgraded DST. ..................................... E-7 Figure 142. Designed GUI for water heater in the upgraded DST. .......................................... E-8 Figure 143. Designed GUI for HVAC equipment in the upgraded DST. ................................... E-9 Figure 144. Designed GUI for solar panels in the upgraded DST. ......................................... E-10 Figure 145. Designed GUI for inverters in the upgraded DST. .............................................. E-10 Figure 146. Designed GUI for water fixtures in the upgraded DST. ....................................... E-11 Figure 147. Designed GUI for electricity sub-meter in the upgraded DST. ............................ E-12 Figure 148. General building data section in the created building input data tab. .................. E-13 Figure 149. Building rooms section in the created building input data tab. ............................ E-13 Figure 150. Interior lighting section in the created building input data tab.............................. E-14 Figure 151. Exterior lighting section in the created building input data tab. ........................... E-15 Figure 152. Motions sensors, hand dryers, vending machines, and general load
assignment section in the created building input data tab. .............................................. E-17 Figure 153. Water heaters and water fixtures section in the created building
input data tab. ................................................................................................................ E-17 Figure 154. HVAC system section in the created building input data tab. .............................. E-18 Figure 155. Metering systems section in the created building input data tab. ........................ E-19 Figure 156. Action report for interior light bulbs and fixtures per room. .................................. E-20 Figure 157. Action report for exterior light bulbs and fixtures. ................................................ E-20 Figure 158. Action report for vending machines, motion sensors, and other devices............. E-21 Figure 159. Action report for water fixtures, water heater, and hand dryers. .......................... E-21 Figure 160. Action report for HVAC system. .......................................................................... E-21
xi
Figure 161. Action report for grid-connected photovoltaic system. ........................................ E-22 Figure 162. Action report for metering and sub-metering systems. ........................................ E-22 Figure 163. Turtle Creek rest area. ....................................................................................... E-23 Figure 164. Results of the DST for minimizing upgrade costs for achieving Gold level
in the LEED-EB rating system—SS, WE, EA, MR divisions. .......................................... E-33 Figure 165. Results of the DST for minimizing upgrade costs for achieving Gold level
in the LEED-EB rating system IQ, IO, and RP divisions. ................................................ E-34 Figure 166. Accredited LEED points associated with each solution and obtained LEED
certificate for maximizing LEED point within a specified budget—Turtle Creek rest area. ........................................................................................................................ E-35

xii
TABLES Table 1. Electricity Meters That Can Be Used for the Selected Rest Areas ................................ 7 Table 2. Gas Meters That Can Be Used for the Selected Rest Areas ........................................ 7 Table 3. Water Meters That Can Be Used for the Selected Rest Areas ..................................... 8 Table 4. Other Sub-Metering System Components That Can Be Used for the
Selected Rest Areas ........................................................................................................... 9 Table 5. Existing Electricity Meters in the Selected Interstate Rest Areas in Illinois ...................10 Table 6. Estimated Cost for Sub-Metering Systems for the Selected Rest Areas, Based on
Information from EKM and the ElectricSubmeter Companies .............................................11 Table 7. Estimated Cost for Sub-Metering Systems for the Selected Rest Areas, Based on
Information from the ElectricSubmeter Company ...............................................................12 Table 8. Costs of Electronic People-Counter in the Selected Rest Areas ..................................15 Table 9. Green Measures Implemented in State DOT Buildings ...............................................17 Table 10. Green Measures Not Listed in the Survey but Added by Respondents ......................18 Table 11. Types of Buildings with Green Measures ..................................................................18 Table 12. Operation Problems and Repair Costs for Energy-Efficient Lighting ..........................21 Table 13. Operation Problems and Repair Costs for Renewable Energy ..................................21 Table 14. Operation Problems and Repair Costs for Energy-Efficient Measures .......................22 Table 15. Operation Problems and Repair Costs for Water-Efficient Measures .........................23 Table 16. Interior Lighting for the Willow Creek Rest Area ........................................................29 Table 17. Exterior Lighting for the Willow Creek Rest Area .......................................................30 Table 18. Water Fixtures in the Willow Creek Rest Area ...........................................................33 Table 19. Replacing U-Shape Fluorescent T12 Bulbs with Energy-Efficient T8 Light
Bulbs in the Lobby and Restrooms of the Coalfield Rest Area Buildings ............................42 Table 20. Replacing Linear Fluorescent T12 Bulbs with Energy-Efficient T8 Light
Bulbs in the Lobby, Restrooms, Maintenance Rooms, and Storage Rooms of the Coalfield Rest Area Buildings .............................................................................................42
Table 21. Characteristics of the Current and Replacement Lighting for the Exterior of the Coalfield Rest Area Buildings .............................................................................................44
Table 22. Replacing HPS 400W Bulbs with Energy-Efficient LED and Induction Light Bulbs in the Coalfield Rest Area Buildings ...................................................................................45
Table 23. Replacing HPS 250W Bulbs with Energy-Efficient LED and Induction Light Bulbs in the Coalfield Rest Area Buildings ...................................................................................45
Table 24. Replacing HPS 70W Bulbs with Energy-Efficient LED and Induction Light Bulbs in the Coalfield Rest Area Buildings ...................................................................................46
Table 25. Percentage Occupancy for Restrooms and Vending Areas of the Coalfield Rest Area Buildings ............................................................................................................49
Table 26. Analysis of Motion-Activated Lighting for the Restrooms of the Coalfield Rest Area Buildings ............................................................................................................................50
Table 27. Analysis of Occupancy Controls for the Vending Machine Areas in the Coalfield Rest Area Buildings ............................................................................................................50
Table 28. Results of an LCC Analysis for Implementing Exhaust Fan Motion Sensors in the Coalfield Rest Area Buildings .............................................................................................51

xiii
Table 29. LCC Components for Replacing the Current HVAC System with a Geothermal Heat Pump in the Coalfield Rest Area Buildings .................................................................52
Table 30. LCC Components for the Current HVAC System in the Coalfield Rest Area Buildings ............................................................................................................................53
Table 31. Results of the LCC Analysis for Replacing the Current HVAC System with a Geothermal Heat Pump in the Coalfield Rest Area Buildings .............................................53
Table 32. Results of the Analysis for Replacing the Current HVAC System with an Energy- Efficient Air-Source Heat Pump in the Coalfield Rest Area Buildings .................................54
Table 33. Results of an LCC Analysis for Replacing the Current Glazing and Doors with Double-Pane Glass ............................................................................................................55
Table 34. Results of an LCC Analysis for Adding a Vestibule Entrance in the Coalfield Rest Area Buildings ....................................................................................................................56
Table 35. Results of an LCC Analysis for Replacing the Current Hand Dryers with Energy-Efficient Units in the Coalfield Rest Area Buildings .............................................................57
Table 36. Results of an LCC Analysis for Installing Solar Daylight Tubes in the Restrooms and Lobby of the Coalfield Rest Area Buildings ..................................................................58
Table 37. Cost Components for Installing a Grid-Connected Photovoltaic System in the Coalfield Rest Area Buildings .............................................................................................60
Table 38. Results of an LCC Analysis for Incorporating a Grid-Connected Photovoltaic System in the Coalfield Rest Area Buildings.......................................................................60
Table 39. LCC Components for Installing a Solar Water Heater in the Coalfield Rest Area Buildings ............................................................................................................................62
Table 40. Results of an LCC Analysis for Installing a Solar Water Heater in the Coalfield Rest Area Buildings ............................................................................................................62
Table 41. LCC Analysis for Replacing the Current Urinals and Toilets with Water- Conserving Fixtures in the Coalfield Rest Area Buildings ...................................................63
Table 42. All Promising Green Building Measures in the Coalfield Rest Area Buildings ............64 Table 43. Recommendations for Interior and Exterior Lighting in the Coalfield Rest Area
Buildings ............................................................................................................................73 Table 44. Recommendations for Vending Machines, Exhaust Fans, Hand Dryers, HVAC
System, Water Heater, PV System, and Water Fixtures in the Coalfield Rest Area Buildings ............................................................................................................................74
Table 45. User Satisfaction Results for Added Green Measures ............................................. B-3 Table 46. User Satisfaction Results for Green-Friendly Measures and Technologies.............. B-4 Table 47. Ease-of-Maintenance Results for Green-Friendly Measures and Technologies ....... B-5 Table 48. Ease-of-Maintenance Results for Added Measures ................................................. B-7 Table 49. Operation Problems and Repair Costs for Added Measures ................................... B-8 Table 50. Energy Savings and Payback Periods for Green-Friendly Measures ....................... B-9 Table 51. Energy Savings and Payback Periods for Added Measures .................................. B-10 Table 52. Interior Lighting in Coalfield Rest Area .................................................................... C-2 Table 53. Exterior Lighting in Coalfield Rest Area ................................................................... C-2 Table 54. Water Fixtures in Coalfield Rest Area ...................................................................... C-4 Table 55. Interior Lighting for Great Sauk Trail Rest Area ....................................................... C-5 Table 56. Exterior Lighting for Great Sauk Trail Rest Area ...................................................... C-6

xiv
Table 57. Water Fixtures in Great Sauk Trail Rest Area .......................................................... C-8 Table 58. Interior Lighting for Mackinaw Dells Rest Area ...................................................... C-10 Table 59. Exterior Lighting for Mackinaw Dells Rest Area ..................................................... C-10 Table 60. Water Fixture in Mackinaw Dells Rest Area ........................................................... C-12 Table 61. Interior Lighting for Cumberland Road Rest Area .................................................. C-14 Table 62. Exterior Lighting for Cumberland Road Rest Area ................................................. C-14 Table 63. Water Fixture in Cumberland Road Rest Area ....................................................... C-16 Table 64. Interior Lighting for Turtle Creek Rest Area ........................................................... C-18 Table 65. Exterior Lighting for Turtle Creek Rest Area .......................................................... C-18 Table 66. Water Fixtures in Turtle Creek Rest Area .............................................................. C-20 Table 67. Replacing U-Shape Fluorescent T12 Bulbs with Energy-Efficient T8 Light Bulbs in
Lobby and Restrooms of Cumberland Road Rest Area Building ...................................... D-4 Table 68. Replacing Linear Fluorescent T12 Bulbs with Energy-Efficient T8 Light Bulbs in
Lobby, Restrooms, Maintenance and Storage Rooms in Cumberland Road Rest Area Building ............................................................................................................................ D-4
Table 69. Replacing Fluorescent T12 bulbs with Energy-Efficient T8 Light Bulbs in Attic of Cumberland Road Rest Area Building .............................................................................. D-5
Table 70. Characteristics of Current and Replacement Lighting for Exterior Lighting of Cumberland Road Rest Area Building .............................................................................. D-7
Table 71. Replacing HPS 400W Bulbs with Energy-Efficient LED and Induction Light Bulbs in Cumberland Road Rest Area Building .......................................................................... D-7
Table 72. Replacing HPS 250W Bulbs with Energy-Efficient LED and Induction Light Bulbs in Cumberland Road Rest Area Building .......................................................................... D-8
Table 73. Replacing MH 100W Bulbs with Energy-Efficient LED and Induction Light Bulbs in Cumberland Road Rest Area Building .............................................................................. D-8
Table 74. Percentage Occupancy for Restrooms and Vending Area in Cumberland Road Rest Area Building ......................................................................................................... D-11
Table 75. Motion-Activated Lighting Analysis for Restrooms of Cumberland Road Rest Area Building .................................................................................................................. D-12
Table 76. Occupancy Controls Analysis for Vending Machines Area in Cumberland Road Rest Area Building ......................................................................................................... D-12
Table 77. Analysis Results for Implementing Motion-Sensor Exhaust Fans in Cumberland Road Rest Area Building ................................................................................................ D-13
Table 78. LCC Components for Replacing Current HVAC System with Geothermal Heat Pump in Cumberland Road Rest Area Building .............................................................. D-14
Table 79. LCC Components for Current HVAC System of Cumberland Road Rest Area Building .......................................................................................................................... D-14
Table 80. LCC Analysis Results for Replacing Current HVAC System with Geothermal Heat Pump in Cumberland Road Rest Area Building ..................................................... D-15
Table 81. Analysis Results for Replacing Current HVAC System With Energy Air-Source Heat Pump In Cumberland Road Rest Area Building ..................................................... D-16
Table 82. LCC Analysis Results for Replacing Current Glazing and Doors with Double- Pane Glass in Cumberland Road Rest Area Building ..................................................... D-16

xv
Table 83. LCC Analysis Results for Adding Vestibule Entrance in Cumberland Road Rest Area Building .................................................................................................................. D-17
Table 84. LCC Analysis Results for Replacing Current Hand Dryers with Energy-Efficient Units for Cumberland Road Rest Area Building .............................................................. D-18
Table 85. LCC Analysis Results for Installing Solar Daylight Tubes in Restrooms and Lobby in Cumberland Road Rest Area Building ............................................................. D-19
Table 86. Cost Components for Installing Grid-Connected Photovoltaic System in the Cumberland Road Rest Area Building ............................................................................ D-21
Table 87. LCC Analysis Results for Incorporating Grid-Connected Photovoltaic System in the Cumberland Road Rest Area Building .................................................................. D-21
Table 88. LCC Components for Installing Solar Water Heater in Cumberland Road Rest Area Building .................................................................................................................. D-22
Table 89. LCC Analysis Results for Installing Solar Water Heater in Cumberland Road Rest Area Building ......................................................................................................... D-23
Table 90. LCC Analysis for Replacing Current Urinals and Toilets with Water-Conserving Fixtures in Cumberland Road Rest Area Building .......................................................... D-23
Table 91. All Promising Green Building Measures for Cumberland Road Rest Area Building .......................................................................................................................... D-24
Table 92. Replacing U-Shape Fluorescent T12 Bulbs with Energy-Efficient T8 Light Bulbs in Lobby and Restrooms of Turtle Creek Rest Area Building ......................................... D-28
Table 93. Replacing Linear Fluorescent T12 Bulbs with Energy-Efficient T8 Light Bulbs in Restrooms and Maintenance Room of Turtle Creek Rest Area Building ......................... D-28
Table 94. Replacing Fluorescent T12 (U-Shape) Bulbs with Energy-Efficient T8 Light Bulbs in Tourism Office of Turtle Creek Rest Area Building ..................................................... D-29
Table 95. Replacing Fluorescent T12 bulbs with Energy-Efficient T8 Light Bulbs in Tourism Office of Turtle Creek Rest Area Building ....................................................................... D-29
Table 96. Characteristics of Current and Replacement Lighting for Exterior Lighting of Turtle Creek Rest Area Building ..................................................................................... D-31
Table 97. Replacing HPS 400W Bulbs with Energy-Efficient LED and Induction Light Bulbs in Turtle Creek Rest Area Building ................................................................................. D-31
Table 98. Replacing HPS 100W Bulbs with Energy-Efficient LED and Induction Light Bulbs in Turtle Creek Rest Area Building ................................................................................. D-31
Table 99. Percentage Occupancy for Restrooms and Vending Area in Turtle Creek Rest Area Building .................................................................................................................. D-34
Table 100. Motion-Activated Lighting Analysis for Restrooms of Turtle Creek Rest Area Building .......................................................................................................................... D-35
Table 101. Occupancy Controls Analysis for Vending Machine in Turtle Creek Rest Area Building .......................................................................................................................... D-35
Table 102. LCC Analysis Results for Implementing Motion-Sensor Exhaust Fans in Turtle Creek Rest Area Building ............................................................................................... D-36
Table 103. LCC Components for Replacing Current HVAC System with Geothermal Heat Pump in Turtle Creek Rest Area Building ....................................................................... D-37
Table 104. LCC Components for Current HVAC System in the Turtle Creek Rest Area Building .......................................................................................................................... D-37

xvi
Table 105. LCC Analysis Results for Replacing Current HVAC System with Geothermal Heat Pump at Turtle Creek Rest Area Building .............................................................. D-38
Table 106. Analysis Results for Replacing Current HVAC System with Energy- Efficient Air-Source Heat Pump at Turtle Creek Rest Area Building ............................................. D-39
Table 107. LCC Analysis Results for Replacing Current Glazing and Doors with Double- Pane Glass in Turtle Creek Rest Area Building .............................................................. D-39
Table 108. LCC Analysis Results for Replacing Current Hand Dryers with Energy- Efficient Units for Turtle Creek Rest Area Building ......................................................... D-40
Table 109. LCC analysis Results for Installing Solar Daylight Tubes in Restrooms and Lobby of Turtle Creek Rest Area Building ...................................................................... D-41
Table 110. Cost Components for Installing Grid-Connected Photovoltaic System in the Turtle Creek Rest Area Building ..................................................................................... D-43
Table 111. LCC Analysis Results for Incorporating Grid-Connected Photovoltaic System i n the Turtle Creek Rest Area Building ............................................................................ D-43
Table 112. LCC Components for Installing Solar Water Heater in Turtle Creek Rest Area Building .......................................................................................................................... D-44
Table 113. LCC Analysis Results for Installing Solar Water Heater in Turtle Creek Rest Area Building .................................................................................................................. D-44
Table 114. LCC Analysis for Replacing Current Urinals and Toilets with Water-Conserving Fixtures in Turtle Creek Rest Area Building .................................................................... D-45
Table 115. All Promising Green Building Measures for Turtle Creek Rest Area Building ....... D-46 Table 116. Replacing Linear Fluorescent T12 Bulbs with Energy-Efficient T8 Light Bulbs
in Lobby and Restrooms, Maintenance Rooms and Storage Rooms of Great Sauk Trail Rest Area. ...................................................................................................................... D-50
Table 117. Replacing Current Halogen Flood Lighting with CFL Light Bulbs in Lobby of Great Sauk Trail Rest Area. ........................................................................................... D-50
Table 118. Replacing Fluorescent T12 bulbs with Energy-Efficient T8 Light Bulbs in Attic of Great Sauk Trail Rest Area Buildings. ............................................................................ D-51
Table 119. Characteristics of Current and Replacement Lighting for Great Sauk Trail Rest Area Buildings ........................................................................................................ D-52
Table 120. Replacing HPS 400W Bulbs with Energy-Efficient LED and Induction Light Bulbs in Great Sauk Trail Rest Area Buildings ............................................................... D-53
Table 121. Replacing HPS 250W Bulbs with Energy-Efficient LED and Induction Light Bulbs in Great Sauk Trail Rest Area Buildings ............................................................... D-53
Table 122. Replacing HPS 50W Bulbs with Energy-Efficient LED and Induction Light Bulbs in Great Sauk Trail Rest Area Buildings ............................................................... D-53
Table 123. Percentage Occupancy for Restrooms and Vending Area for Great Sauk Trail Rest Area Buildings ................................................................................................ D-56
Table 124. Motion-Activated Lighting Analysis for Restrooms of Great Sauk Trail Rest Area Buildings ................................................................................................................ D-57
Table 125. Occupancy Controls Analysis for Vending Machine in Great Sauk Trail Rest Area Buildings ........................................................................................................ D-57
Table 126. LCC Analysis Results for Implementing Exhaust Fan Motion Sensors in Great Sauk Trail Rest Area Buildings ............................................................................. D-58

xvii
Table 127. LCC Components for Replacing Current HVAC System with Geothermal Heat Pump at Great Sauk Trail Rest Area Buildings ...................................................... D-59
Table 128. LCC Components for Current HVAC System in the Great Sauk Trail Rest Area Buildings ................................................................................................................ D-59
Table 129. LCC Analysis Results for Replacing Current HVAC System with Geothermal Heat Pump at Great Sauk Trail Rest Area Buildings ...................................................... D-60
Table 130. Analysis Results for Replacing Current HVAC System with Energy Star–Rated Air-Source Heat Pump at Great Sauk Trail Rest Area Buildings ..................................... D-61
Table 131. LCC Analysis Results for Replacing Current Glazing and Doors with Double- Pane Glass in Great Sauk Trail Rest Area Buildings ...................................................... D-61
Table 132. LCC Analysis Results for Replacing Current Hand Dryers with Energy- Efficient Units for Great Sauk Trail Rest Area Buildings ................................................. D-62
Table 133. LCC Analysis Results for Installing Solar Daylight Tubes in Restrooms and Lobby for Great Sauk Trail Rest Area Buildings ............................................................. D-63
Table 134. Cost Components for Installing Grid-Connected Photovoltaic System in the Great Sauk Trail Rest Area Buildings ............................................................................. D-65
Table 135. LCC Analysis Results for Incorporating Grid-Connected Photovoltaic System in the Great Sauk Trail Rest Area Buildings ................................................................... D-65
Table 136. LCC Components for Installing Solar Water Heater in Great Sauk Trail Rest Area Buildings ................................................................................................................ D-66
Table 137. LCC Analysis Results for Installing Solar Water Heater in Great Sauk Trail Rest Area Buildings ........................................................................................................ D-66
Table 138. LCC Analysis for Replacing Current Urinals and Toilets with Water-Conserving Fixtures in Great Sauk Trail Rest Area Buildings ............................................................ D-67
Table 139. All Promising Green Building Measures for Great Sauk Trail Rest Area Buildings ........................................................................................................................ D-68
Table 140. Replacing HPS Bulbs with Energy-Efficient CFL Light Bulbs for Restroom Corridors and Entrances in Northbound Building of Willow Creek Rest Area.................. D-73
Table 141. Replacing MH Bulbs with Induction Light Bulbs for Lobby in Northbound Building of Willow Creek Rest Area ................................................................................ D-74
Table 142. Replacing Fluorescent T12 (U-Shape) Bulbs with Energy-Efficient T8 Light Bulbs for Restrooms in Northbound Building of Willow Creek Rest Area ........................ D-74
Table 143. Replacing Linear Fluorescent T12 Bulbs with Energy-Efficient T8 Light Bulbs for Restrooms in Northbound Building of Willow Creek Rest Area ........................ D-75
Table 144. Replacing Light Bulbs of Maintenance and Storage Rooms with CFL Light Bulbs in Northbound Building of Willow Creek Rest Area ............................................... D-75
Table 145. Replacing HPS Bulbs with Energy-Efficient CFL Light Bulbs for Restroom Corridors and Entrances in Southbound Building of Willow Creek Rest Area ................. D-76
Table 146. Replacing MH Bulbs with Induction Light Bulbs for Upper Lobby in Southbound Building of Willow Creek Rest Area ................................................................................ D-76
Table 147. Replacing Fluorescent T12 (U-Shape) Bulbs with Energy-Efficient T8 Light Bulbs for Lobby and Restrooms in Southbound Building of Willow Creek Rest Area ...... D-77
Table 148. Replacing Linear Fluorescent T12 Bulbs with Energy-Efficient T8 Light Bulbs for Restrooms in Southbound Building of Willow Creek Rest Area ................................. D-77

xviii
Table 149. Replacing Light Bulbs of Maintenance and Storage Rooms with CFL Light Bulbs in Southbound Building of Willow Creek Rest Area .............................................. D-78
Table 150. Characteristics of Current and Replacement Lighting for Exterior Lighting of Willow Creek Rest Area Buildings .............................................................................. D-80
Table 151. Replacing HPS 400W Bulbs with Energy-Efficient LED and Induction Light Bulbs in Northbound Building of Willow Creek Rest Area ............................................... D-80
Table 152. Replacing HPS 50W Bulbs with Energy-Efficient LED and Induction Light Bulbs in Northbound Building of Willow Creek Rest Area ............................................... D-80
Table 153. Replacing HPS 400W Bulbs with Energy-Efficient LED and Induction Light Bulbs in Southbound Building of Willow Creek Rest Area .............................................. D-81
Table 154. Replacing HPS 50W Bulbs with Energy-Efficient LED and Induction Light Bulbs in Southbound Building of Willow Creek Rest Area .............................................. D-81
Table 155. Average Percentage Occupancy for Restrooms and Vending Area of illow Creek Rest Area Buildings ..................................................................................... D-84
Table 156. Motion-Activated Lighting Analysis for Restrooms of Willow Creek Rest Area Buildings ........................................................................................................................ D-85
Table 157. Occupancy Controls Analysis for Vending Machine in Willow Creek Rest Area Buildings ........................................................................................................................ D-85
Table 158. LCC Analysis Results for Implementing Exhaust Motion Sensors in Willow Creek Rest Area Buildings ............................................................................................. D-86
Table 159. LCC Components for Replacing Current HVAC System with Geothermal Heat Pump at Willow Rest Area Buildings ...................................................................... D-87
Table 160. LCC Components for Current HVAC System in Willow Rest Area Buildings ........ D-87 Table 161. LCC Analysis Results for Replacing Current HVAC System with Geothermal
Heat Pump in Willow Rest Area Buildings ...................................................................... D-88 Table 162. Analysis Results for Replacing Current HVAC System with Energy-Efficient
Air-Source Heat Pump at Willow Creek Rest Area Buildings .......................................... D-89 Table 163. LCC Analysis Results for Replacing Current Hand Dryers with Energy-
Efficient Units for Northbound Building of Willow Creek Rest Area ................................. D-90 Table 164. LCC Analysis Results for Replacing Current Hand Dryers with Energy-
Efficient Units for Southbound Building of Willow Creek Rest Area ................................ D-91 Table 165. Cost Components for Installing Grid-Connected Photovoltaic System in Willow
Creek Rest Area Buildings ............................................................................................. D-92 Table 166. LCC Analysis Results for Incorporating Grid-Connected Photovoltaic System in
Willow Creek Rest Area Buildings .................................................................................. D-92 Table 167. LCC Components for Installing Solar Water Heater in Willow Creek Rest Area
Buildings ........................................................................................................................ D-94 Table 168. LCC Analysis Results for Installing Solar Water Heater in Willow Creek Rest
Area Buildings ................................................................................................................ D-94 Table 169. LCC Analysis for Replacing Current Urinals and Toilets with Water-Conserving
Fixtures in Willow Creek Rest Area Buildings ................................................................. D-95 Table 170. All Analyzed Green Building Measures for Northbound Building of Willow
Creek Rest Area ............................................................................................................ D-96

xix
Table 171. All Analyzed Green Building Measures for Southbound Building of Willow Creek Rest Area ............................................................................................................ D-97
Table 172. Replacing U-Shape Fluorescent T8 Bulbs with More Energy-Efficient T8 Light Bulbs in Lobby and Restrooms of Mackinaw Dells Rest Area Buildings............... D-100
Table 173. Replacing Fluorescent T12 Bulbs with Energy-Efficient T8 Light Bulbs in Lobby of Mackinaw Dells Rest Area Buildings .............................................................. D-100
Table 174. Replacing Fluorescent T12 Bulbs with Energy-Efficient T8 Lighting Bulbs in Maintenance and Storage Rooms of Mackinaw Dells Rest Area Buildings ................... D-101
Table 175. Characteristics of Current and Replacement Lighting for Exterior Lighting of Mackinaw Dells Rest Area ........................................................................................... D-102
Table 176. Replacing HPS 400W Bulbs with Energy-Efficient LED and Induction Light Bulbs in Mackinaw Dells Rest Area .............................................................................. D-103
Table 177. Replacing HPS 100W Bulbs with Energy-Efficient LED and Induction Light Bulbs in Mackinaw Dells Rest Area .............................................................................. D-103
Table 178. Replacing HPS 250W Bulbs with Energy-Efficient LED and Induction Light Bulbs in Mackinaw Dells Rest Area .............................................................................. D-103
Table 179. Percentage Occupancy for Restrooms and Vending Area for Mackinaw Dells Rest Area Buildings ............................................................................................. D-106
Table 180. Motion-Activated Lighting Analysis for Restrooms of Mackinaw Dells Rest Area Buildings .............................................................................................................. D-107
Table 181. Occupancy Controls Analysis for Vending Machine in Mackinaw Dells Rest Area Buildings .............................................................................................................. D-107
Table 182. LCC Components for Replacing Current HVAC System with Geothermal Heat Pump at Mackinaw Dells Rest Area Buildings ...................................................... D-108
Table 183. LCC Components for Current HVAC System in Mackinaw Dells Rest Area Buildings ...................................................................................................................... D-109
Table 184. LCC Analysis Results for Replacing Current HVAC System with Geothermal Heat Pump at Mackinaw Dells Rest Area Buildings ...................................................... D-109
Table 185. Analysis Results for Replacing Current HVAC System with Air-Source Heat Pump at Mackinaw Dells Rest Area Buildings .............................................................. D-110
Table 186. LCC Analysis Results for Replacing Current Hand Dryers with Energy- Efficient Units for Mackinaw Dells Rest Area Buildings ................................................ D-111
Table 187. Cost Components for Installing Grid-Connected Photovoltaic System in Mackinaw Dells Rest Area Buildings ............................................................................ D-112
Table 188. LCC Analysis Results for Incorporating Grid-Connected Photovoltaic System i n the Mackinaw Dells Rest Area Buildings ................................................................... D-112
Table 189. LCC Components for Installing Solar Water Heater in Mackinaw Dells Rest Area Buildings .............................................................................................................. D-114
Table 190. LCC Analysis Results for Installing Solar Water Heater in Mackinaw Dells Rest Area Buildings ...................................................................................................... D-114
Table 191. LCC Analysis for Replacing Current Urinals with Water Conserving Fixtures in Mackinaw Dells Rest Area Buildings ........................................................................ D-115
Table 192. All Promising Green Building Measures for Mackinaw Dells Rest Area Buildings ...................................................................................................................... D-116

xx
Table 193. Modeling LEED-EB Prerequisites in the DST for Turtle Creek Rest Area ............ E-25 Table 194. Considered Credits of Sustainable Site Division in the DST and Associated
Upgrade Costs ............................................................................................................... E-26 Table 195. Considered Credits of Water-Efficiency Division in the DST and Associated
Upgrade Costs ............................................................................................................... E-27 Table 196. Considered Credits of Energy and Atmosphere Division in the DST and
Associated Upgrade Costs ............................................................................................. E-28 Table 197. Considered Credits of Material and Resources Division in the DST and
Associated Upgrade Costs ............................................................................................. E-29 Table 198. Considered Credits of Indoor Air Quality Division in the DST and Associated
Upgrade Costs ............................................................................................................... E-30 Table 199. Considered Credits of Innovation in Operation Division in the DST and
Associated Upgrade Costs ............................................................................................. E-31 Table 200. Accredited LEED Points Associated with Each Solution for Maximizing LEED
Points within a Certain Budget for Turtle Creek Rest Area ............................................. E-32 Table 201. Recommendations for Interior and Exterior Lighting in Cumberland Road
est Area Building .............................................................................................................. F-1 Table 202. Recommendations for Vending Machines, Exhaust Fans, Hand Dryers, HVAC
System, Water Heater, PV System, and Water Fixtures in Cumberland Road Rest Area Building ............................................................................................................................ F-2
Table 203. Recommendations for Interior and Exterior Lighting in Turtle Creek Rest Area Building ............................................................................................................................ F-3
Table 204. Recommendations for Vending Machines, Exhaust Fans, Hand Dryers, HVAC System, Water Heater, PV System, and Water Fixtures in Turtle Creek Rest Area Building ............................................................................................................................ F-4
Table 205. Recommendations for Interior and Exterior Lighting in Great Sauk Trail Rest Area Buildings .................................................................................................................. F-5
Table 206. Recommendations for Vending Machines, Exhaust Fans, Hand Dryers, HVAC System, Water Heater, PV System, and Water Fixtures in Great Sauk Trail Rest Area Buildings .......................................................................................................................... F-6
Table 207. Recommendations for Interior and Exterior Lighting in Northbound Willow Creek Rest Area Building ........................................................................................................... F-7
Table 208. Recommendations for Vending Machines, Exhaust Fans, Hand Dryers, HVAC System, Water Heater, PV System, and Water Fixtures in Northbound Willow Creek Rest Area Building .................................................................................................................... F-8
Table 209. Recommendations for Interior and Exterior Lighting in Southbound Willow Creek Rest Area Building ........................................................................................................... F-9
Table 210. Recommendations for Vending Machines, Exhaust Fans, Hand Dryers, HVAC System, Water Heater, PV System, and Water Fixtures in Southbound Willow Creek Rest Area Building ......................................................................................................... F-10
Table 211. Recommendations for Interior and Exterior Lighting in Mackinaw Dells Rest Area Buildings ........................................................................................................................ F-11

xxi
Table 212. Recommendations for Vending Machines, Exhaust Fans, Hand Dryers, HVAC System, Water Heater, PV System, and Water Fixtures in Mackinaw Dells Rest Area Buildings ........................................................................................................................ F-12

1
CHAPTER 1 INTRODUCTION
1.1 PROBLEM STATEMENT Interstate rest area buildings in Illinois are among the most visible traveler amenities in
the state. These facilities range in age from 10 to nearly 50 years old and are on display and used 365 days a year by nearly 40 million people annually. The rest area sites comprise 53 buildings that provide restroom facilities, vending machines, and 11 welcome centers offering tourism information for the traveling public. The facilities are presently being maintained as well as budgets allow; but these facilities are in need of upgrading, especially to improve their environmental and economic performance in support of recent initiatives by the State of Illinois to be more “green friendly.” These initiatives include the development of Green Building Guidelines for State Construction, by the Capital Development Board’s Green Building Advisory Council, as required in Public Act 094-0573 (Illinois CDB 2007). These guidelines were used as a basis for the Green Building Act (P.A. 096-0773), which requires all construction and major renovations of IDOT and any state-owned facilities to satisfy Leadership in Energy and Environmental Design (LEED), Green Globes or equivalent certification requirements. This Act also states that all construction and major renovation projects, regardless of size, must achieve the highest level of LEED, Green Globes or equivalent certification practicable within the project budget (Illinois General Assembly 2009).
The pressing need to upgrade IDOT rest areas, coupled with the requirements of the Green Buildings Act, presents a unique opportunity to implement cost-effective upgrade measures for these highly visible and frequently used facilities. To accomplish this goal, decision makers need to identify and implement an optimal set of upgrade measures that (1) maximize the green performance of IDOT rest areas, (2) reduce energy and water consumption, and (3) comply with limited upgrade budgets.
1.2 RESEARCH OBJECTIVES AND METHODOLOGY The main goal of the research in this phase was to investigate, determine, and provide a
list of green-friendly best management practices (BMPs) for the six interstate rest areas that have the highest energy consumption in Illinois. These six rest areas are Willow Creek, Coalfield, Great Sauk Trail, Mackinaw Dells, Cumberland Road, and Turtle Creek, which account for 32% of the IDOT rest areas’ energy bills. Improvements in energy consumption of these six facilities can provide significant annual savings in energy bills for IDOT. To accomplish this goal, the objectives of this research were as follows:
1. Conduct an online survey of state departments of transportation (DOTs) to gather
information on their experiences in implementing green-friendly measures in their rest areas, welcome centers, office buildings, and other state buildings.
2. Investigate the feasibility and cost effectiveness of installing temporary or permanent sub-metering systems to measure, monitor, and analyze the actual energy consumption of devices and fixtures in the selected rest areas.
3. Conduct on-site assessments and field measurements of the six rest areas that have the highest energy bills and highest energy consumption per square footage (i.e., Willow Creek, Coalfield, Great Sauk Trail, Mackinaw Dells, Cumberland Road, and Turtle Creek).

2
4. Explore and identify energy- and water-saving alternatives that can be implemented in the selected rest areas, including LED and induction lighting; motion sensors for interior lighting, vending machines, and exhaust fans; grid-connected photovoltaic systems; solar water heaters; solar tube lighting; double-pane glass; vestibule entrances; Energy Star–rated HVAC systems; geothermal heat pumps; and water-saving plumbing fixtures.
5. Perform energy audit analysis for the selected rest areas using eQuest energy simulation software to analyze the impact of implementing the energy-saving alternatives identified in the previous task.
6. Evaluate the economic feasibility of the identified energy-saving alternatives for the selected rest areas in terms of their required upgrade costs, life-cycle cost (LCC), and payback periods.
7. Develop a decision support tool (DST) to identify optimal upgrade measures for public buildings to provide the highest number of LEED points and certification level for any given upgrade budget or to identify the smallest possible budget to achieve a specified level of LEED certification, such as silver, gold, or platinum.
8. Prepare recommendations for the six rest areas detailing the green-friendly BMPs to use, along with cost estimates for full implementation, including payback periods.
These research tasks and their deliverables are described in more detail in the following chapters, as shown in Figure 1.
Figure 1. Project tasks and research deliverables.

3
CHAPTER 2 ENERGY AND WATER SUB-METERING SYSTEMS
Monitoring systems can be used to improve the efficiency of energy and water consumption in buildings. These systems include sub-metering systems to measure energy consumption, including electricity and natural gas, as well as water consumption (Pecko et al. 2011). Although metering systems can be used to measure the entire amount of energy/water consumption of a facility or a building, sub-metering systems can measure the energy/water consumption of individual units or specific systems in a building or facility. In the rest area buildings, these categories of energy/water consumption include HVAC systems, vending machines, exterior and interior lighting, water heaters, faucets, urinals, and toilets. An electricity meter, for example, can measure and register the continuous power consumption of one or more units that consume energy in the building. It typically consists of two parts: a transducer that converts power into a mechanical or electrical signal, and a counter that integrates and displays the value of the total energy that has been passed through the meter (MeterToCash 2013). Similarly, gas and water meters can be used to measure the consumption of natural gas and water in buildings. As shown in Figure 2, sub-metering systems often consist of three main components: (1) energy-metering units to measure electricity, natural gas, and/or water consumption; (2) a data collection and transmission system to collect and transmit data to various data repositories; and (3) a system that graphically displays the data received or generates data reports.
In addition to providing energy-use data and costs, sub-metering systems are capable of gathering interval data for load profiling. Information from the sub-meters can be read manually or gathered by automated meter-reading systems and can be presented and analyzed through various software tools, which are either installed on a personal computer (PC) or accessed via the Internet. These systems can also be programmed to highlight potential problem areas and alert operators when energy use strays outside the normal levels (Santee Cooper Power 2002). These systems can also be used to compare electricity consumption for a specific day in two successive years, as shown in Figure 3.
Figure 2. Sub-metering system (Byram Laboratories 2011).
Electric, gas, and water meters
Data collection and transmission
Wireless or cable
Tell/cell/Internet
On-site or off-site PC

4
Figure 3. An example of a daily comparison report for electricity consumption.
In addition to energy and water sub-metering systems, electronic people-counters can be used in rest areas to identify the number of visitors, which is essential in analyzing the efficiency of the energy and water consumption. Currently, the Illinois Department of Transportation (IDOT) generates estimates for the average number of visitors to interstate rest areas in Illinois based on the number of vehicles passing by the rest areas, the vehicles’ use rate of rest areas, and the vehicles’ occupancy. The number of visitors in rest areas can be measured with better accuracy by using electronic people-counting systems. These systems can be installed at entrances and exits of the rest areas, along with a collecting device that can collect and store the count data. The collecting device can provide data about the total number of visitors that are using a facility and interval visitation data that range from half an hour to monthly visitation rate.
2.1 TYPES OF ENERGY/WATER SUB-METERS Three types of meters are commonly used to measure energy and water consumption in
buildings: electricity meter, natural gas meter, and water meter. These meters typically consist of two parts: a transducer to convert the energy/water into a mechanical or electrical signal, and a counter to integrate and display the value of total energy/water consumption that has passed through the meter. Unlike utility billing, which mostly requires once-a-month reporting to develop consumption bills, frequent reporting has a value in providing a better understanding of the energy/water consumption and opportunities for reducing energy and water consumption (EnergyTracking 2009).
Electric meters continuously operate to measure the instantaneous voltage and current and calculate the product, to measure the electrical power. There are two types of electric meter categories: the electromechanical and the solid-state meters. The electromechanical meter operates by counting the number of revolutions of an aluminum disk, which rotates at a speed proportional to the power supplied. Therefore, the number of revolutions is proportional to the energy use. The meter consumes a small amount of energy, typically around 2W.
Energy use for a calendar day of a year
Energy use for the same calendar day of the succeeding year
kW
Time (hr)
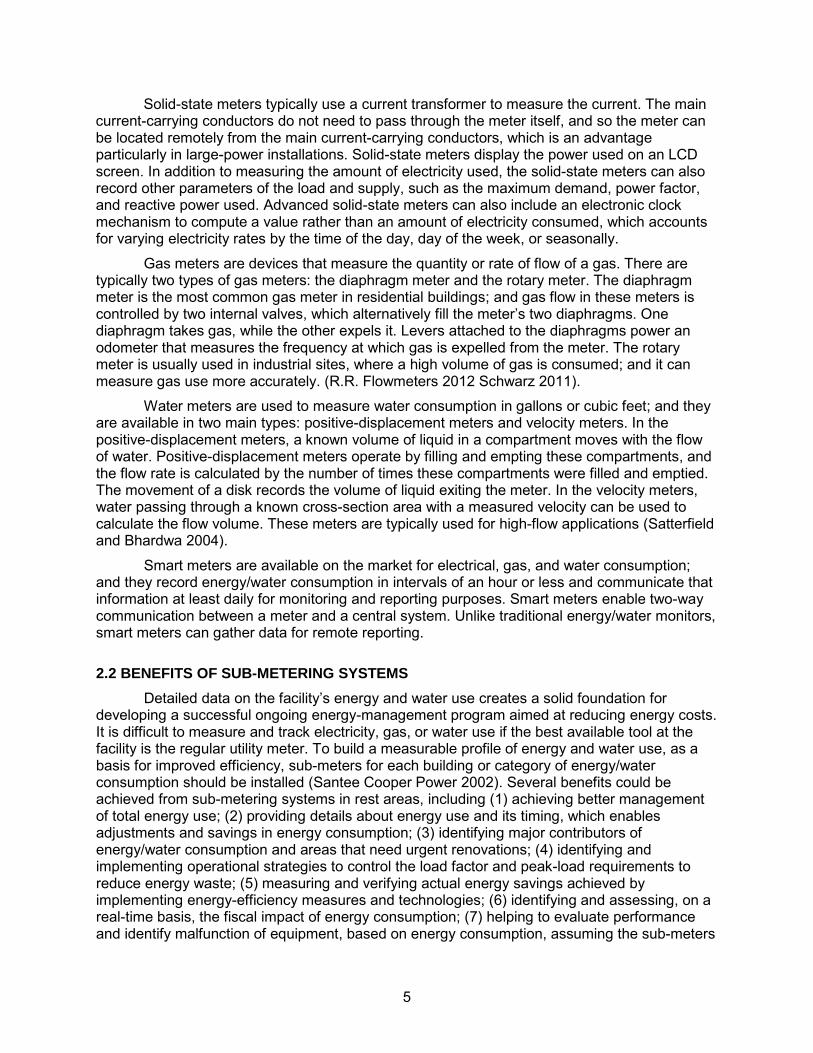
5
Solid-state meters typically use a current transformer to measure the current. The main current-carrying conductors do not need to pass through the meter itself, and so the meter can be located remotely from the main current-carrying conductors, which is an advantage particularly in large-power installations. Solid-state meters display the power used on an LCD screen. In addition to measuring the amount of electricity used, the solid-state meters can also record other parameters of the load and supply, such as the maximum demand, power factor, and reactive power used. Advanced solid-state meters can also include an electronic clock mechanism to compute a value rather than an amount of electricity consumed, which accounts for varying electricity rates by the time of the day, day of the week, or seasonally.
Gas meters are devices that measure the quantity or rate of flow of a gas. There are typically two types of gas meters: the diaphragm meter and the rotary meter. The diaphragm meter is the most common gas meter in residential buildings; and gas flow in these meters is controlled by two internal valves, which alternatively fill the meter’s two diaphragms. One diaphragm takes gas, while the other expels it. Levers attached to the diaphragms power an odometer that measures the frequency at which gas is expelled from the meter. The rotary meter is usually used in industrial sites, where a high volume of gas is consumed; and it can measure gas use more accurately. (R.R. Flowmeters 2012 Schwarz 2011).
Water meters are used to measure water consumption in gallons or cubic feet; and they are available in two main types: positive-displacement meters and velocity meters. In the positive-displacement meters, a known volume of liquid in a compartment moves with the flow of water. Positive-displacement meters operate by filling and empting these compartments, and the flow rate is calculated by the number of times these compartments were filled and emptied. The movement of a disk records the volume of liquid exiting the meter. In the velocity meters, water passing through a known cross-section area with a measured velocity can be used to calculate the flow volume. These meters are typically used for high-flow applications (Satterfield and Bhardwa 2004).
Smart meters are available on the market for electrical, gas, and water consumption; and they record energy/water consumption in intervals of an hour or less and communicate that information at least daily for monitoring and reporting purposes. Smart meters enable two-way communication between a meter and a central system. Unlike traditional energy/water monitors, smart meters can gather data for remote reporting.
2.2 BENEFITS OF SUB-METERING SYSTEMS Detailed data on the facility’s energy and water use creates a solid foundation for
developing a successful ongoing energy-management program aimed at reducing energy costs. It is difficult to measure and track electricity, gas, or water use if the best available tool at the facility is the regular utility meter. To build a measurable profile of energy and water use, as a basis for improved efficiency, sub-meters for each building or category of energy/water consumption should be installed (Santee Cooper Power 2002). Several benefits could be achieved from sub-metering systems in rest areas, including (1) achieving better management of total energy use; (2) providing details about energy use and its timing, which enables adjustments and savings in energy consumption; (3) identifying major contributors of energy/water consumption and areas that need urgent renovations; (4) identifying and implementing operational strategies to control the load factor and peak-load requirements to reduce energy waste; (5) measuring and verifying actual energy savings achieved by implementing energy-efficiency measures and technologies; (6) identifying and assessing, on a real-time basis, the fiscal impact of energy consumption; (7) helping to evaluate performance and identify malfunction of equipment, based on energy consumption, assuming the sub-meters
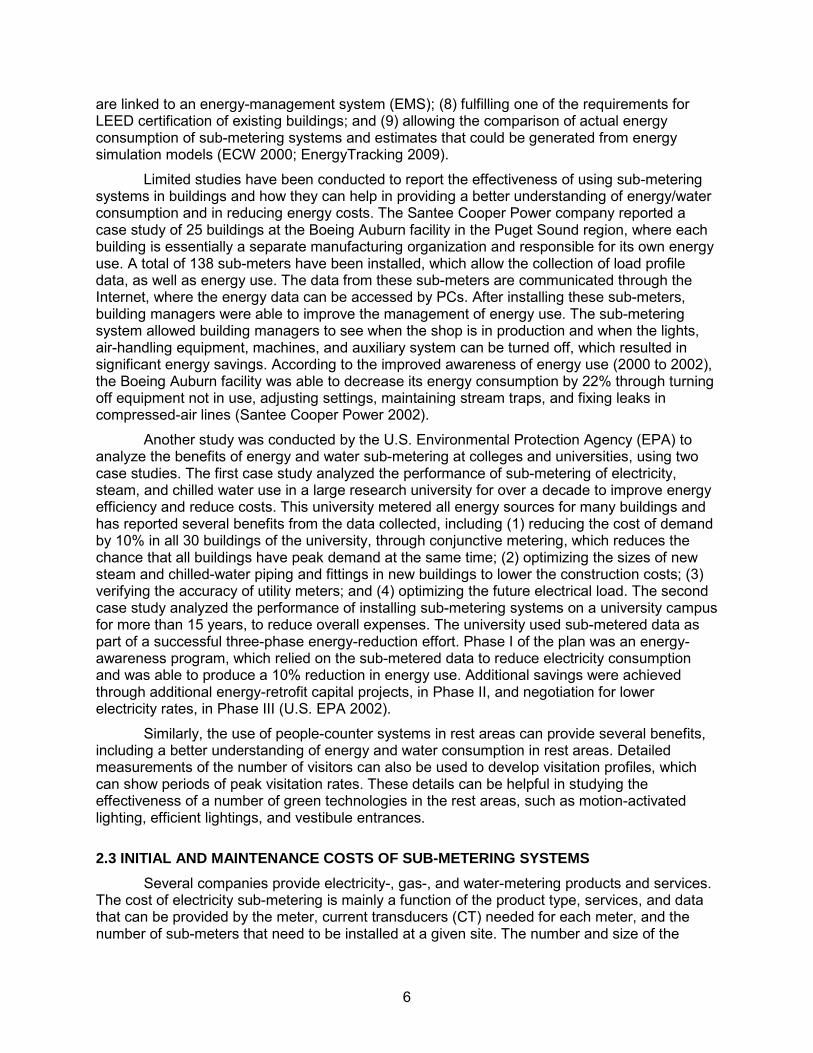
6
are linked to an energy-management system (EMS); (8) fulfilling one of the requirements for LEED certification of existing buildings; and (9) allowing the comparison of actual energy consumption of sub-metering systems and estimates that could be generated from energy simulation models (ECW 2000; EnergyTracking 2009).
Limited studies have been conducted to report the effectiveness of using sub-metering systems in buildings and how they can help in providing a better understanding of energy/water consumption and in reducing energy costs. The Santee Cooper Power company reported a case study of 25 buildings at the Boeing Auburn facility in the Puget Sound region, where each building is essentially a separate manufacturing organization and responsible for its own energy use. A total of 138 sub-meters have been installed, which allow the collection of load profile data, as well as energy use. The data from these sub-meters are communicated through the Internet, where the energy data can be accessed by PCs. After installing these sub-meters, building managers were able to improve the management of energy use. The sub-metering system allowed building managers to see when the shop is in production and when the lights, air-handling equipment, machines, and auxiliary system can be turned off, which resulted in significant energy savings. According to the improved awareness of energy use (2000 to 2002), the Boeing Auburn facility was able to decrease its energy consumption by 22% through turning off equipment not in use, adjusting settings, maintaining stream traps, and fixing leaks in compressed-air lines (Santee Cooper Power 2002).
Another study was conducted by the U.S. Environmental Protection Agency (EPA) to analyze the benefits of energy and water sub-metering at colleges and universities, using two case studies. The first case study analyzed the performance of sub-metering of electricity, steam, and chilled water use in a large research university for over a decade to improve energy efficiency and reduce costs. This university metered all energy sources for many buildings and has reported several benefits from the data collected, including (1) reducing the cost of demand by 10% in all 30 buildings of the university, through conjunctive metering, which reduces the chance that all buildings have peak demand at the same time; (2) optimizing the sizes of new steam and chilled-water piping and fittings in new buildings to lower the construction costs; (3) verifying the accuracy of utility meters; and (4) optimizing the future electrical load. The second case study analyzed the performance of installing sub-metering systems on a university campus for more than 15 years, to reduce overall expenses. The university used sub-metered data as part of a successful three-phase energy-reduction effort. Phase I of the plan was an energy-awareness program, which relied on the sub-metered data to reduce electricity consumption and was able to produce a 10% reduction in energy use. Additional savings were achieved through additional energy-retrofit capital projects, in Phase II, and negotiation for lower electricity rates, in Phase III (U.S. EPA 2002).
Similarly, the use of people-counter systems in rest areas can provide several benefits, including a better understanding of energy and water consumption in rest areas. Detailed measurements of the number of visitors can also be used to develop visitation profiles, which can show periods of peak visitation rates. These details can be helpful in studying the effectiveness of a number of green technologies in the rest areas, such as motion-activated lighting, efficient lightings, and vestibule entrances.
2.3 INITIAL AND MAINTENANCE COSTS OF SUB-METERING SYSTEMS Several companies provide electricity-, gas-, and water-metering products and services.
The cost of electricity sub-metering is mainly a function of the product type, services, and data that can be provided by the meter, current transducers (CT) needed for each meter, and the number of sub-meters that need to be installed at a given site. The number and size of the

7
current transducers depend on voltage, amps, and whether the meter supports one phase or three phases of electricity. By contrast, the cost of gas and water sub-meters depends on the product type and the size of the pipe whose flow will be metered. A sub-metering system also requires a collector to gather data from the different meters and transmit the data to a local PC or through the Internet/cellular network to a website. A local PC or a website on the Internet can be used to store consumption data and generate analysis and consumption reports. Tables 1 through 3 provide cost estimates for electricity, gas, and water meters, respectively; while Table 4 provides estimates for other components of sub-metering systems, including converters, an interval data recorder, software, a connector, and adopters.
Table 1. Electricity Meters That Can Be Used for the Selected Rest Areas
Meter Description Meter Wattage Unit Cost Meter Features
EKM-OmniMeter I v.3
200A~800A (can meter up to 5000A
with higher CT)
$160 + CT ($40~$120
each)
- Single-phase or 3-phase - Supports CT 100A to 5000A - Fast communication speed for remote
reading - Does not need a power cut to be installed - The meter provides data for maximum
demand (kW); and after setting, it can calculate the maximum demand for the following time periods: 15, 30, and 60 min.
E-Mon D-Mon class 1000
25A~200A $371~$406
- Utility-grade metering accuracy - Supports single-phase (2 wires) or 2-
phase (3 wires) - Nonvolatile memory - Remote mounting of the current sensors
up to 2,000 feet from the meter without power interruption
E-Mon D-Mon class 2000
100A~3200A $662~$1,352
- Utility-grade metering accuracy - Supports 3-phase and 2-phase - Nonvolatile memory - Remote mounting of current sensors up to
2,000 feet from the meter without power interruption
Table 2. Gas Meters That Can Be Used for the Selected Rest Areas
Meter Description Meter Pipe Size Unit Cost Meter Features EKM gas meter
3/4″ $90
- Used with the EKM-25EDSP-N v.2, 3x pulse input kWh meter to count and store the gas meter pulses ($160)
- Can be read remotely using the free EKM Reader software
- Maximum flow rate: 6 m3/hr - Minimum flow rate: 0.04 m3/hr
E-Mon D-Mon GDP250 series
3/4″ and 1″ $298 - Equipped with pulse output for interfacing
with interval data recorders - Used with loads ranging from 200 to 250
ft3/hr
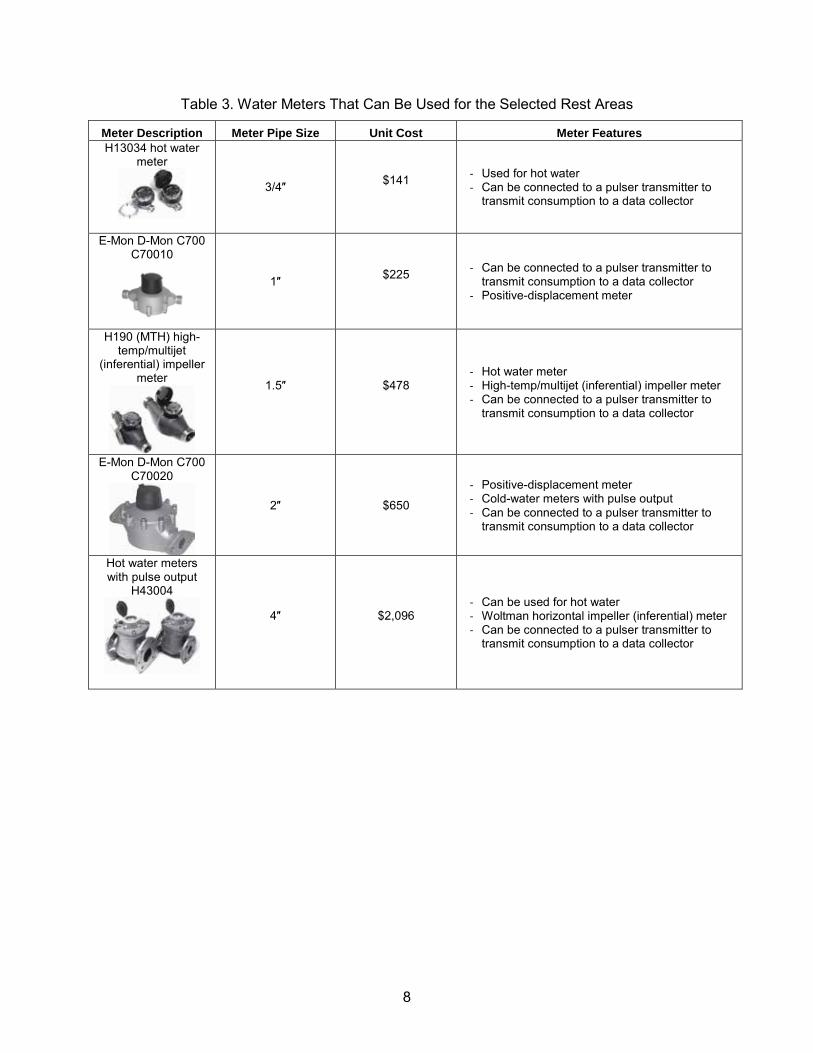
8
Table 3. Water Meters That Can Be Used for the Selected Rest Areas
Meter Description Meter Pipe Size Unit Cost Meter Features H13034 hot water
meter
3/4″ $141 - Used for hot water - Can be connected to a pulser transmitter to
transmit consumption to a data collector
E-Mon D-Mon C700 C70010
1″ $225 - Can be connected to a pulser transmitter to transmit consumption to a data collector
- Positive-displacement meter
H190 (MTH) high-temp/multijet
(inferential) impeller meter
1.5″ $478 - Hot water meter - High-temp/multijet (inferential) impeller meter - Can be connected to a pulser transmitter to
transmit consumption to a data collector
E-Mon D-Mon C700 C70020
2″ $650
- Positive-displacement meter - Cold-water meters with pulse output - Can be connected to a pulser transmitter to
transmit consumption to a data collector
Hot water meters with pulse output
H43004
4″ $2,096 - Can be used for hot water - Woltman horizontal impeller (inferential) meter - Can be connected to a pulser transmitter to
transmit consumption to a data collector

9
Table 4. Other Sub-Metering System Components That Can Be Used for the Selected Rest Areas
Meter description Type Unit Cost Meter Features EKM iSerial V.2
TCP/IP to serial converter
$65
- Supports 4- and 2-wire (RS-232 and RS-422/485) with AUTO-SEND™ and built-in terminator
- No on-site computer necessary if the Internet is available
- Can support multiple meters (unlimited)
E-Mon energy software
Energy software
$5,513 (1~50
meters)
- Creates load profiles and charts of energy-use data - Monitors all of the utilities, including electricity, gas,
water, and steam, with a single software package - Finds out if the facility is functioning at peak
performance and identifies inefficiencies quickly - Divides utility costs based on the actual energy use - Avoids estimations and collects accurate backup
records
E-Mon D-Mon interval data
recorder (IDR16E)
Interval data recorder
$2,460 - Reads kWh and kW in 5-, 15-, 30-, or 60-min intervals - Reads water, gas, and electric meters, which provide
pulse output or E-Mon D-Mon meters - Reads and records data from up to 8 or 16 meters
E-Mon EKM-T external
communication key with modem for
telephone access
Connects AMR system to host
a computer with modem
$753
- Converts RS-485 to RS-232 for input into a computer serial port
- Includes built-in telephone modem for easy connection to a telephone line
- Three RS-485 inputs (RJ-11 modular jack) from AMR system
E-Mon D-Mon PCA
Pulse contact adapter
$85
- Allows standard electromechanical style kWh meters to interface to the E-Mon energy automatic meter-reading system
- Allows interface with the E-Mon Energy™ Software system
- Models of the PCA are available for some types of gas meters to allow an interface with the E-Mon energy software system
E-Mon D-Mon ECA-2
External contact adapter
$48
- Monitors the utility electric meter with the E-Mon energy software
- Sends energy information via the ECA-2 to the IDR data accumulator
- Connects utility meters with pulse contacts to the E-Mon Energy system through the IDR interface unit
- ECA-2 can be used with water, gas, and BTU meters with contact (pulse) output
Calibration and maintenance of sub-meters depend mainly on the type of meter. Electricity meters are typically calibrated every 3 to 5 years. The calibration cost of electricity meters is not high because the current and voltage can be verified with an instantaneous demand meter. IDOT technicians can perform this calibration every 3 to 5 years. Calibration of water meters should be performed annually or more frequently if meter data stray beyond the expected ranges (U.S. EPA 2002).

10
2.4 COSTS OF SUB-METERING SYSTEMS IN THE SELECTED REST AREAS To estimate the cost of installing a sub-metering system in the rest areas, electric and
plumbing drawings need to be analyzed in conjunction with the site visits conducted for the six selected rest areas. Electric and plumbing drawings were provided for four of the selected rest areas: Turtle Creek, Cumberland Road, Coalfield, and Willow Creek. The existing electric metering system in the selected rest areas is limited to measuring the total electricity consumption of the rest area buildings. Table 5 lists the types and numbers of electricity meters in the six selected rest areas. Two cost estimates were developed for installing sub-metering systems in each of the selected rest areas. These two estimates were developed based on system components that were provided in Tables 1 through 4. The first cost estimate was developed for each rest area, based on electric meters, gas meters, and collectors from the EKM Metering, Inc. and water meters from the ElectricSubmeter Company, as shown in Table 6. EKM provides free software, which can remotely read total kWh, power (W), maximum demand, instantaneous voltage, instantaneous amperage, power factor, and pulse counts. This system can provide maximum demand for three time periods (15, 30, and 60 min); however, it cannot provide interval consumption data for electricity or water use. It should be noted that the estimated costs in Table 6 were provided for sub-metering system components only; shipping cost was not considered in the estimates. This cost estimate also assumes that these sub-metering systems will be installed by IDOT technicians, to reduce costs. The complexity of installing these sub-metering systems depends on the distribution panel and water networks in each rest area, system components, and any need for bypassing the electric cables or water pipes to be measured through the electricity/water meters.
The second cost estimate was developed for each rest area, as shown in Table 7. These sub-metering systems require an energy software package for cost allocation and graphing of energy use. This software package requires only one software license for all rest areas and is available from the ElectricSubmeter Company for $5,513. The sub-metering systems provided in Table 7 are capable of reading kW/demand and kW peak every 15 or 30 min, and it can collect information from meters every 5, 15, 30, or 60 min. Interval data collection can be used in generating graphs and charts to analyze when and where use takes place, to identify potential energy-saving opportunities in the rest areas. This arrangement will lead to better management for the building equipment and adjust the timing of energy loads to reduce overall energy use. Similar to the first estimate for sub-metering systems, shipping cost was not considered; and installation was assumed to be performed by IDOT technicians, to reduce initial costs.
Table 5. Existing Electricity Meters in the Selected Interstate Rest Areas in Illinois
Rest Area Existing Electricity Meters Coalfield One digital electricity meter for each side of the rest area
Cumberland Road One analog electricity meter in one bound and a digital electricity meter in the other bound
Turtle Creek One digital electricity meter Willow Creek One digital meter for each bound of the rest area Great Sauk Trail One analog electrical meter for each bound of the rest area Mackinaw Dells One analog electricity meter
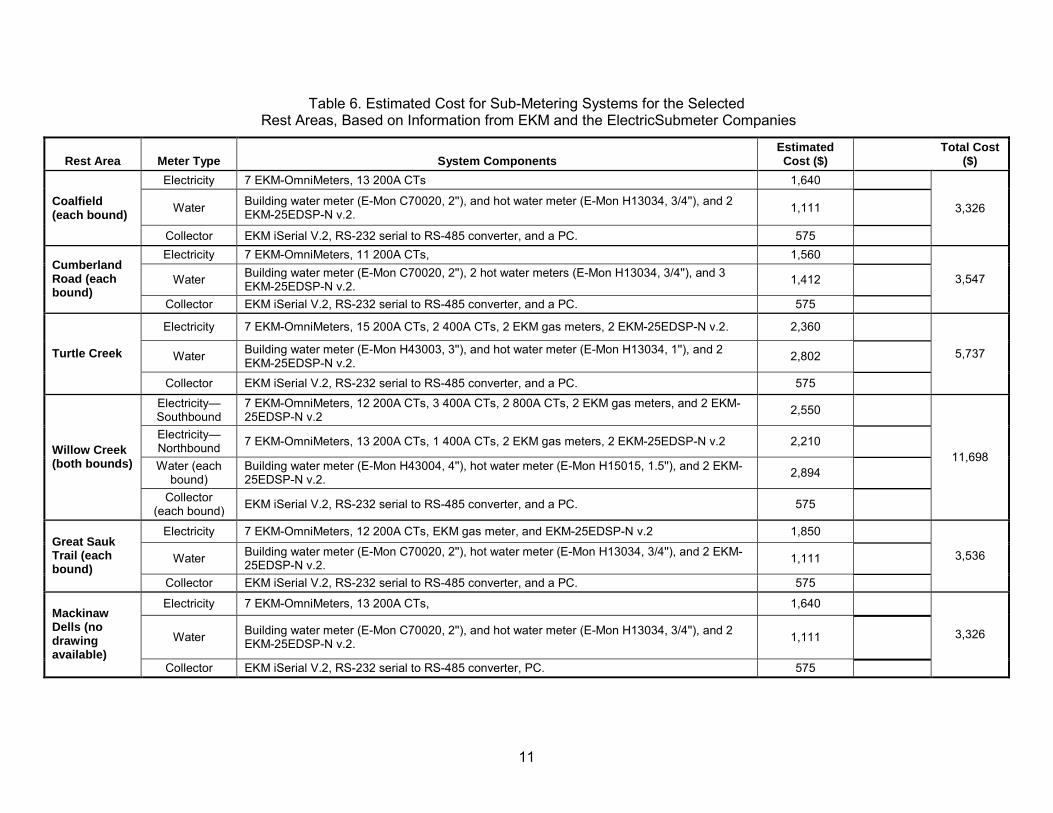
11
Table 6. Estimated Cost for Sub-Metering Systems for the Selected Rest Areas, Based on Information from EKM and the ElectricSubmeter Companies
Rest Area Meter Type System Components Estimated Cost ($)
Total Cost ($)
Coalfield (each bound)
Electricity 7 EKM-OmniMeters, 13 200A CTs 1,640
3,326 Water Building water meter (E-Mon C70020, 2''), and hot water meter (E-Mon H13034, 3/4''), and 2 EKM-25EDSP-N v.2. 1,111
Collector EKM iSerial V.2, RS-232 serial to RS-485 converter, and a PC. 575
Cumberland Road (each bound)
Electricity 7 EKM-OmniMeters, 11 200A CTs, 1,560
3,547 Water Building water meter (E-Mon C70020, 2''), 2 hot water meters (E-Mon H13034, 3/4''), and 3 EKM-25EDSP-N v.2. 1,412
Collector EKM iSerial V.2, RS-232 serial to RS-485 converter, and a PC. 575
Turtle Creek
Electricity 7 EKM-OmniMeters, 15 200A CTs, 2 400A CTs, 2 EKM gas meters, 2 EKM-25EDSP-N v.2. 2,360
5,737 Water Building water meter (E-Mon H43003, 3''), and hot water meter (E-Mon H13034, 1''), and 2 EKM-25EDSP-N v.2. 2,802
Collector EKM iSerial V.2, RS-232 serial to RS-485 converter, and a PC. 575
Willow Creek (both bounds)
Electricity—Southbound
7 EKM-OmniMeters, 12 200A CTs, 3 400A CTs, 2 800A CTs, 2 EKM gas meters, and 2 EKM-25EDSP-N v.2 2,550
11,698
Electricity— Northbound 7 EKM-OmniMeters, 13 200A CTs, 1 400A CTs, 2 EKM gas meters, 2 EKM-25EDSP-N v.2 2,210
Water (each bound)
Building water meter (E-Mon H43004, 4''), hot water meter (E-Mon H15015, 1.5''), and 2 EKM-25EDSP-N v.2. 2,894
Collector (each bound) EKM iSerial V.2, RS-232 serial to RS-485 converter, and a PC. 575
Great Sauk Trail (each bound)
Electricity 7 EKM-OmniMeters, 12 200A CTs, EKM gas meter, and EKM-25EDSP-N v.2 1,850
3,536 Water Building water meter (E-Mon C70020, 2''), hot water meter (E-Mon H13034, 3/4''), and 2 EKM-25EDSP-N v.2. 1,111
Collector EKM iSerial V.2, RS-232 serial to RS-485 converter, and a PC. 575
Mackinaw Dells (no drawing available)
Electricity 7 EKM-OmniMeters, 13 200A CTs, 1,640
3,326 Water Building water meter (E-Mon C70020, 2''), and hot water meter (E-Mon H13034, 3/4''), and 2 EKM-25EDSP-N v.2. 1,111
Collector EKM iSerial V.2, RS-232 serial to RS-485 converter, PC. 575
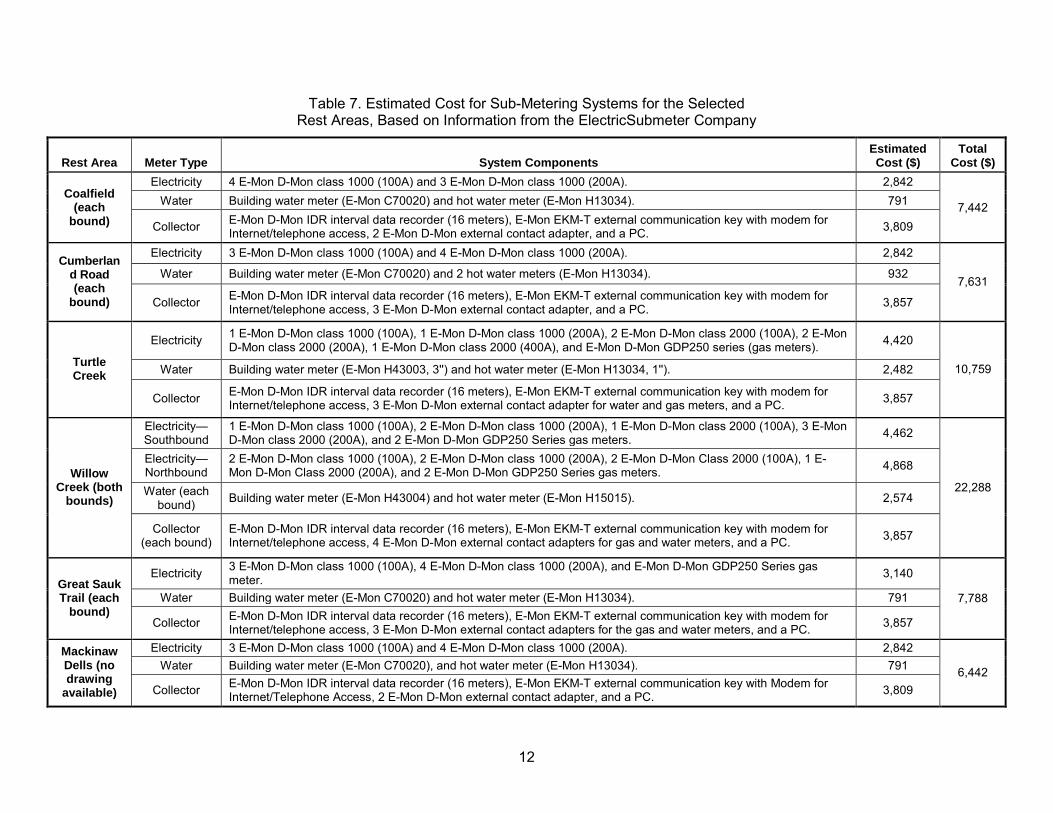
12
Table 7. Estimated Cost for Sub-Metering Systems for the Selected Rest Areas, Based on Information from the ElectricSubmeter Company
Rest Area Meter Type System Components Estimated Cost ($)
Total Cost ($)
Coalfield (each
bound)
Electricity 4 E-Mon D-Mon class 1000 (100A) and 3 E-Mon D-Mon class 1000 (200A). 2,842
7,442 Water Building water meter (E-Mon C70020) and hot water meter (E-Mon H13034). 791
Collector E-Mon D-Mon IDR interval data recorder (16 meters), E-Mon EKM-T external communication key with modem for Internet/telephone access, 2 E-Mon D-Mon external contact adapter, and a PC. 3,809
Cumberland Road (each
bound)
Electricity 3 E-Mon D-Mon class 1000 (100A) and 4 E-Mon D-Mon class 1000 (200A). 2,842
7,631 Water Building water meter (E-Mon C70020) and 2 hot water meters (E-Mon H13034). 932
Collector E-Mon D-Mon IDR interval data recorder (16 meters), E-Mon EKM-T external communication key with modem for Internet/telephone access, 3 E-Mon D-Mon external contact adapter, and a PC. 3,857
Turtle Creek
Electricity 1 E-Mon D-Mon class 1000 (100A), 1 E-Mon D-Mon class 1000 (200A), 2 E-Mon D-Mon class 2000 (100A), 2 E-Mon D-Mon class 2000 (200A), 1 E-Mon D-Mon class 2000 (400A), and E-Mon D-Mon GDP250 series (gas meters). 4,420
10,759 Water Building water meter (E-Mon H43003, 3'') and hot water meter (E-Mon H13034, 1''). 2,482
Collector E-Mon D-Mon IDR interval data recorder (16 meters), E-Mon EKM-T external communication key with modem for Internet/telephone access, 3 E-Mon D-Mon external contact adapter for water and gas meters, and a PC. 3,857
Willow Creek (both
bounds)
Electricity—Southbound
1 E-Mon D-Mon class 1000 (100A), 2 E-Mon D-Mon class 1000 (200A), 1 E-Mon D-Mon class 2000 (100A), 3 E-Mon D-Mon class 2000 (200A), and 2 E-Mon D-Mon GDP250 Series gas meters. 4,462
22,288
Electricity— Northbound
2 E-Mon D-Mon class 1000 (100A), 2 E-Mon D-Mon class 1000 (200A), 2 E-Mon D-Mon Class 2000 (100A), 1 E-Mon D-Mon Class 2000 (200A), and 2 E-Mon D-Mon GDP250 Series gas meters. 4,868
Water (each bound) Building water meter (E-Mon H43004) and hot water meter (E-Mon H15015). 2,574
Collector (each bound)
E-Mon D-Mon IDR interval data recorder (16 meters), E-Mon EKM-T external communication key with modem for Internet/telephone access, 4 E-Mon D-Mon external contact adapters for gas and water meters, and a PC. 3,857
Great Sauk Trail (each
bound)
Electricity 3 E-Mon D-Mon class 1000 (100A), 4 E-Mon D-Mon class 1000 (200A), and E-Mon D-Mon GDP250 Series gas meter. 3,140
7,788 Water Building water meter (E-Mon C70020) and hot water meter (E-Mon H13034). 791
Collector E-Mon D-Mon IDR interval data recorder (16 meters), E-Mon EKM-T external communication key with modem for Internet/telephone access, 3 E-Mon D-Mon external contact adapters for the gas and water meters, and a PC. 3,857
Mackinaw Dells (no drawing
available)
Electricity 3 E-Mon D-Mon class 1000 (100A) and 4 E-Mon D-Mon class 1000 (200A). 2,842
6,442 Water Building water meter (E-Mon C70020), and hot water meter (E-Mon H13034). 791
Collector E-Mon D-Mon IDR interval data recorder (16 meters), E-Mon EKM-T external communication key with Modem for Internet/Telephone Access, 2 E-Mon D-Mon external contact adapter, and a PC. 3,809

13
Digital clamp-on power meters can also be used as an alternative for installing the aforementioned electric sub-metering systems in the rest areas. Clamp meters are temporary meters that can be hocked to electric cables and measure electricity consumption. The clamp-on power HiTESTER (model 3169-20 or 21) (Figure 4) can be used in rest areas to measure electricity consumption and provide detailed information of energy use. It can simultaneously measure voltage, current, power (active, reactive, and apparent), integrated power, power factor, and frequency. This power meter supports several types of clamp-on current sensors to enable measurement of a variety of items that range from 0.5A to 5000A. One single unit of clamp-on power HiTESTER can measure four circuits (single-phase, 2 wires), two circuits (3-phase, 3 wires), or one circuit (3-phase, 4 wires). This capability can decrease the number of meters required to measure different categories of energy use in the rest areas. It can store valuable measurement data on PC cards up to 1GB, which provides a convenient way to store data for long periods. The data stored on PC cards can be transmitted to a PC, where data can be analyzed. Clamp-on power meters are easily installed in rest areas, and they provide the flexibility of data being transmitted to other buildings to monitor and measure energy consumption for energy audit of other buildings. By contrast, installing clamp-on power meters cannot identify a malfunction of the building equipment because it cannot be monitored through the Internet or linked to an energy-management system (EMS). To measure the major categorizes of energy consumption in each building of a rest area, three to six clamp-on power meters will be required. The number of clamp meters depends on capacity (amps) and the type of power (single or three-phase) in major categories of energy consumption in each rest area. Each clamp meter costs $2,678, and therefore the estimated cost of sub-metering electricity consumption using clamp meter in a single rest area building will range from $8,034 to $16,068.
Figure 4. HiTESTER clamp-on power meter (Hioki).
More details of energy consumption for the current electricity meters in the rest areas can be provided by installing Wattvision monitoring systems. Wattvision consists of a gateway and a sensor. Sensors can be installed on the current meters in the rest areas and monitor energy consumption using short time intervals (15 seconds). The gateway is wired to the sensor, where interval data consumption can be uploaded to wattvision.com through a wireless network. Wattvision can provide a live view of energy consumption in the rest areas, and the consumption data can be downloaded and analyzed through MS Excel or other analytic tools; and alerts can be received for energy spikes, as shown in Figure 5. The Wattvision sensor and

14
gateway costs $249; however, this system requires the availability of wireless Internet in the rest area buildings.
Figure 5. Wattvision for monitoring energy consumption in rest areas.
Based on the investigation conducted on installing sub-metering systems in the six selected interstate rest areas, the research team recommends that IDOT install sub-metering systems that are capable of collecting energy- and water-consumption data at 5-, 15-, 30-, or 60-min intervals, similar to the systems shown in Table 7. This type of interval data collection can be used to (1) achieve better management of total energy use; (2) provide details about energy use and its timing, which allows adjustments to be made and reduces energy consumption; (3) identify major contributors of energy/water consumption and areas that need urgent renovations; (4) identify operational strategies to control the load factor and peak-load requirements to reduce energy waste; (5) measure and verify actual energy savings that can be achieved by implementing energy-efficiency measures and technologies; and (6) help in evaluating performance and identifying any equipment malfunctions based on energy consumption, assuming the sub-meters are linked to an energy-management system. Furthermore, installing these sub-metering systems will allow the rest area buildings to earn up to four LEED points when applying for a certification level of the LEED rating system for existing buildings.
The cost of installing an electronic people-counter depends mainly on the number of counters that will be mounted on the entrances and exits of the rest area buildings and whether the counter will be mounted on the wall or the doorframe. Table 8 lists the costs for integrating an electronic people-counter in the selected rest areas. This cost estimate does not account for installation costs because it requires a simple installation procedure. The people-counter can be mounted easily on the wall or doorframe; and it can be connected wirelessly to the collection device, which can be placed within a reasonable distance from the people-counter.
Wattvision sensor for analog meters Wattvision sensor for digital meters
Wattvision gateway Detailed energy consumption
Or

15
Table 8. Costs of Electronic People-Counter in the Selected Rest Areas
Rest area Number of counters Installation Cost Coalfield (each bound) 2 $2,500 Cumberland Road (each bound) 2 $2,500 Turtle Creek 2 $2,500 Willow Creek (each bound) 4 $4,000 Great Sauk Trail (each bound) 3 $3,250 Mackinaw Dells (each bound) 2 $2,500

16
CHAPTER 3 SURVEY RESULTS AND ANALYSIS
This chapter presents the findings of a survey of state DOTs to gather information on their experiences in implementing green-friendly measures in their rest areas, welcome centers, office buildings, and other related buildings. The survey was designed to identify green-friendly measures that were implemented by different state DOTs and to evaluate their performance in terms of user satisfaction, ease of maintenance, problems encountered, repair costs, estimated savings, and payback periods.
The survey was conducted using an online tool (SurveyGizmo, http://www.surveygizmo.com) to facilitate its distribution to and completion by state DOT officials. An e-mail with a link to the survey website was sent to the members of the subcommittee on design of the American Association of State Highway and Transportation Officials (AASHTO). A total of 31 responses were received from 30 officials in state DOTs and one in the Ontario Ministry of Transportation in Canada. Responses were received from DOT officials in 26 states: a response from one official in Michigan, Indiana, Iowa, Pennsylvania, California, New York, Massachusetts, Florida, Texas, Arizona, Mississippi, North Dakota, South Dakota, Alabama, Utah, North Carolina, South Carolina, Louisiana, Idaho, Arkansas, Kentucky, and Wyoming; and responses from two officials in Washington, Colorado, New Mexico, and Minnesota. The affiliations of the survey respondents are maintenance analyst, facilities manager, roadside environmental engineer, roadside development program manager, manager of sustainable transportation, two principal landscape architects, associate landscape architect, rest area administrator, two capital facilities operations and inventory managers, capital improvements manager, facility project planner, project management architect, two maintenance and operations branch managers, chief landscape architect, roadside program administrator, facilities management section head, facilities engineer, maintenance engineer, consultant management engineer, architect, regional manager, business manager, chief of facilities management division, division director, architecture and highway standards engineer, safety rest area program manager, and maintenance officer from the Ontario Ministry of Transportation.
The survey was developed following the guidelines of the American Association for Public Opinion Research (AAPOR 2013). The survey consists of five sections (see Appendix A). The first section requires the state DOT officials to select green building measures that were implemented in their facilities and identify the types of the buildings where these green measures were implemented. The second section asks them to report their user satisfaction for each measure selected in the previous section. User satisfaction is identified for each selected measure based on a scale of five categories: “very satisfied,” “satisfied,” “neutral,” “dissatisfied,” and “very dissatisfied.” The third section requires them to indicate the ease of maintenance for each green measure selected. Ease of maintenance is identified for each selected measure using a scale that consists of three levels: “easy to maintain,” “moderate,” and “difficult to maintain.” The fourth section asks them to list problems encountered and the estimated repair cost for each green measure selected. The last section asks state DOT officials to report the average reduction experienced in electricity/water use and the expected payback period for each green measure. The following sections in this chapter provide detailed analysis of the survey responses in these five sections. Additional tables and figures that provide detailed analysis of the responses to the survey questions are presented in Appendix B.

17
3.1 IMPLEMENTED GREEN TECHNOLOGIES The survey respondents were asked to identify green-friendly measures implemented in
their buildings, using a list based on the findings of the first phase of this project and the recommendations of the project Technical Review Panel (TRP). This list is organized in four categories of green measures: (1) energy-efficient lighting, which includes LED lighting, induction lighting, and energy-efficient fluorescent lighting; (2) renewable energy, which includes solar panels, solar water-heating systems, solar daylight tubes, geothermal heat pumps, and wind-power technology; (3) energy-efficient measures, which include motion-activated lighting, double-pane glass windows, energy-efficient hand dryers, exhaust-heat recovery, and airtight entrances; and (4) water-efficient measures, which include water-conserving toilets, water-conserving urinals, water-conserving faucets, rain gardens, and gray water systems. In addition, the survey was designed to enable respondents to list up to three additional measures that they adopted if those are not included in the list provided. Table 9 summarizes the green measures implemented in various state DOT buildings. The survey results show that LED lighting; energy-efficient fluorescent lighting; geothermal heat pumps; motion-activated lighting; double-pane glass windows; and water-conservative toilets, urinals, and faucets are the most commonly used green technologies, which were reported by at least 14 respondents, representing 45.2% of the survey respondents. Other green measures implemented less frequently include induction lighting, solar water heaters, solar daylight tubes, wind-power technology, rain gardens, and gray water systems, each of which were reported by six respondents at most, representing 19.4% of the survey respondents. The additional green measures that were not included in the survey list but were reported by the respondents are summarized in Table 10. The survey respondents were also asked in this section to indicate the type of building where these green measures were implemented, as shown in Table 11.
Table 9. Green Measures Implemented in State DOT Buildings
Measures Category Green Measures Implemented
Number of Respondents
Percentage of Responses
Ener
gy-
effic
ient
lig
htin
g LED lighting 14 45.2% Induction lighting 4 12.9% Energy-efficient fluorescent lighting 28 90.3%
Ren
ewab
le
ener
gy Solar panels 11 35.5%
Solar water heaters 3 9.7% Solar daylight tubes 6 19.4% Geothermal heat pumps 14 45.2% Wind-power technology 3 9.7%
Ener
gy-
effic
ient
m
easu
res
Motion-activated lighting 18 58.1% Double-pane glass windows 25 80.6% Energy-efficient hand dryers 11 35.5% Exhaust-heat recovery 10 32.3% Airtight entrances 9 29.0%
Wat
er-
effic
ient
m
easu
res Water-conserving toilets 22 71.0%
Water-conserving urinals 21 67.7% Water-conserving faucets 22 71.0% Rain gardens 6 19.4% Gray water systems 3 9.7%

18
Table 10. Green Measures Not Listed in the Survey but Added by Respondents
Measure # Added Green Measure Number of
Respondents 1 Passive solar siting 3 2 Recycling 2 3 Using recycled materials 2 4 Native vegetation requiring no water other than naturally available 2 5 HVAC controls and temperature management 2 6 Cistern for flushing toilets 1 7 Cistern for watering landscaping 1 8 Waterless urinals 1 9 Radiant floor heating 1
10 Designed, constructed, and maintained to LEED Silver 1 11 LEED design 1 12 Switch-activated heaters 1 13 Installing T-12 lighting 1 14 Energy audits 1 15 Equipment upgrades/replacements 1 16 All new construction LEED certified 1 17 Evaporative cooling in desert rest areas 1 18 Hot water boilers 1 19 Building automation and controls 1 20 Local materials 1 21 Low/no VOC paints 1
Table 11. Types of Buildings with Green Measures
Rest Areas/Welcome Centers Office Buildings Other*
28 14 8 * Other reported buildings include a district complex, salt storage building, truck station, transit buildings, airport facilities, freeway lighting demo, and three maintenance facilities
3.2 USER SATISFACTION Survey respondents reported the level of user satisfaction for the green measures
implemented, using a five-point scale: “very satisfied,” “satisfied,” “neutral,” “dissatisfied,” or “very dissatisfied.” To identify an average user satisfaction for each green measure, these five levels are represented numerically, using a scale that ranges from 1.0 to 5.0, where 1.0 represents “very dissatisfied” and 5.0 represents “very satisfied”. These green building measures are ranked based on their average user satisfaction, as shown in Figure 6. The survey results show that seven green measures provided average satisfaction levels higher than 4.0, which is equivalent to “satisfied,” as shown in Figure 6. These seven satisfactory measures can be ranked based on their reported averages: double-pane glass windows, energy-efficient fluorescent lighting, exhaust-heat recovery, solar daylight tubes, geothermal
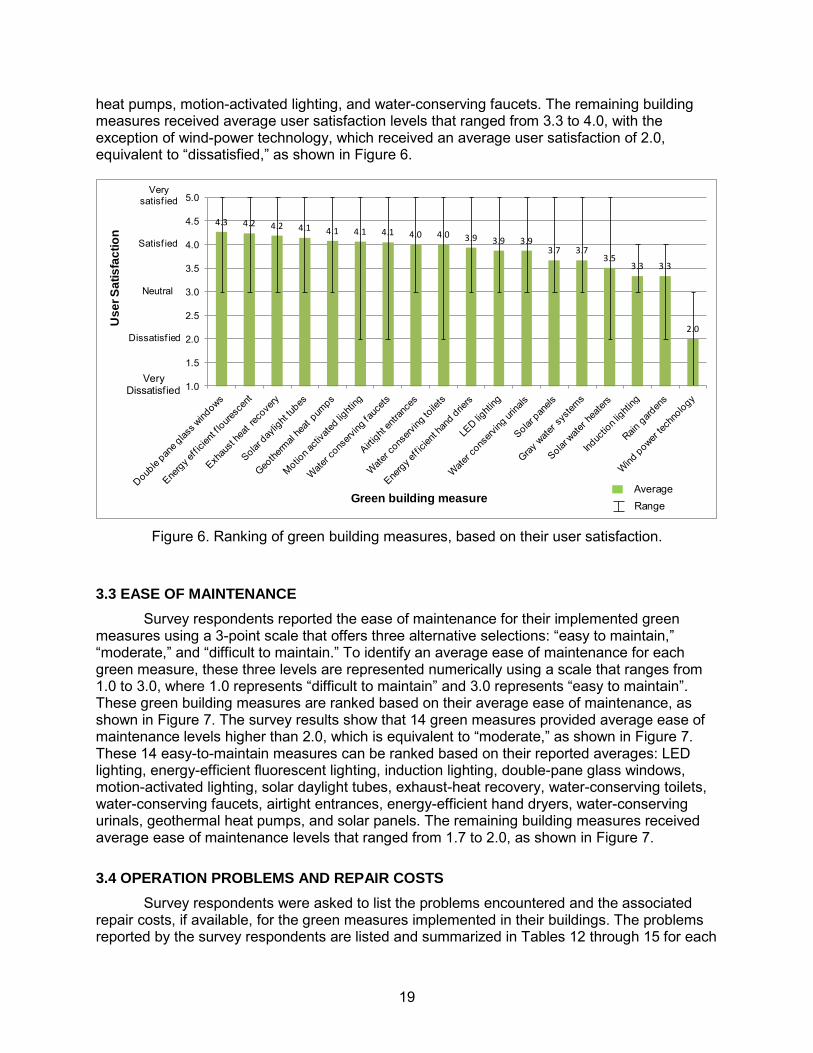
19
heat pumps, motion-activated lighting, and water-conserving faucets. The remaining building measures received average user satisfaction levels that ranged from 3.3 to 4.0, with the exception of wind-power technology, which received an average user satisfaction of 2.0, equivalent to “dissatisfied,” as shown in Figure 6.
Figure 6. Ranking of green building measures, based on their user satisfaction.
3.3 EASE OF MAINTENANCE Survey respondents reported the ease of maintenance for their implemented green
measures using a 3-point scale that offers three alternative selections: “easy to maintain,” “moderate,” and “difficult to maintain.” To identify an average ease of maintenance for each green measure, these three levels are represented numerically using a scale that ranges from 1.0 to 3.0, where 1.0 represents “difficult to maintain” and 3.0 represents “easy to maintain”. These green building measures are ranked based on their average ease of maintenance, as shown in Figure 7. The survey results show that 14 green measures provided average ease of maintenance levels higher than 2.0, which is equivalent to “moderate,” as shown in Figure 7. These 14 easy-to-maintain measures can be ranked based on their reported averages: LED lighting, energy-efficient fluorescent lighting, induction lighting, double-pane glass windows, motion-activated lighting, solar daylight tubes, exhaust-heat recovery, water-conserving toilets, water-conserving faucets, airtight entrances, energy-efficient hand dryers, water-conserving urinals, geothermal heat pumps, and solar panels. The remaining building measures received average ease of maintenance levels that ranged from 1.7 to 2.0, as shown in Figure 7.
3.4 OPERATION PROBLEMS AND REPAIR COSTS Survey respondents were asked to list the problems encountered and the associated
repair costs, if available, for the green measures implemented in their buildings. The problems reported by the survey respondents are listed and summarized in Tables 12 through 15 for each
4.3 4.2 4.2 4.1 4.1 4.1 4.1 4.0 4.0 3.9 3.9 3.93.7 3.7
3.53.3 3.3
2.0
1.0
1.5
2.0
2.5
3.0
3.5
4.0
4.5
5.0
Use
r Sat
isfa
ctio
n
Green building measure
Very Dissatisfied
Dissatisf ied
Neutral
Satisf ied
Very satisf ied
AverageRange

20
of the four identified categories of green building measures (i.e., energy-efficient lighting, renewable energy, energy-efficient measures, and water-efficient measures). The green building measures are ranked based on the percentage of respondents reporting problems, as shown in Figure 8. The survey results show that six green measures had no reported problems: LED lighting, energy-efficient fluorescent lighting, solar daylight tubes, double-pane glass windows, rain gardens, and gray water systems, as shown in Figure 8. The remaining building measures received varying numbers of reported problems that range from 1 to 5, as shown in Tables 12 through Table 15. The percentage of respondents reporting problems ranges from 9.1% to 66.7%, as shown in Figure 8.
Figure 7. Ranking of green-friendly measures, based on their ease of maintenance.
2.8 2.8 2.8 2.7 2.7 2.72.6
2.5 2.52.4 2.4 2.3
2.32.2
2.0 2.0
1.81.7
1.0
1.2
1.4
1.6
1.8
2.0
2.2
2.4
2.6
2.8
3.0
Ease
of m
aint
enan
ce
Green building measureAverage
Range
Easy to maintain
Moderate
Dif f icult to maintain

21
Table 12. Operation Problems and Repair Costs for Energy-Efficient Lighting
Energy-Efficient Lighting
Problems Encountered
Number of Respondents
Percentage of Respondents Reporting
Problems* Repair Cost Number of Respondents
Percentage of Respondents
Reporting Repair Cost*
All Problems
Sub- Problem
All Repair Costs
Sub- Repair Cost
LED lighting None 0 0.0% 0.0% None 0 0.0% 0.0%
Induction lighting Problems with initial fixtures 1 25.0% 25.0% Repaired under
warranty 1 25.0% 25.0%
Energy-efficient fluorescent None 0 0.0% 0.0% None 0 0.0% 0.0%
*Percentage of respondents reporting problems or repair cost = Number of respondents reporting problems or repair cost for green measure (e.g., LED lighting)Number of respondents implementing this green measure (e.g., LED lighting)
Table 13. Operation Problems and Repair Costs for Renewable Energy
Renewable Energy Problems Encountered Number of Respondents
Percentage of Respondents Reporting
Problems* Repair Cost Number of Respondents
Percentage of Respondents
Reporting Repair Cost*
All Problems
Sub- Problem
All Repair Costs
Sub- Repair Cost
Solar panels Vandalism/theft 3 27.3% 27.3% $6,900, total replacement 2 18.2% 18.2%
Solar water heaters Unavailability of parts for an old system 1 33.3% 33.3% None 0 0.0% 0.0%
Solar daylight tubes None 0 0.0% 0.0% None 0 0.0% 0.0%
Geothermal heat pumps
Pump replacement 2 21.4%
14.3% $250 1 14.3%
7.1%
Problem during installation 1 7.1% Repaired under warranty 1 7.1%
Wind-power technology
Maintenance costs were more than energy savings. 1
66.7%
33.3% Maintenance costs, $1,200 annually 1
66.7%
33.3%
Problem with initial units supplied 1 33.3% Repaired under warranty 1 33.3%
*Percentage of respondents reporting problems or repair cost = Number of respondents reporting problems or repair cost for green measure (e.g., solar panels)Number of respondents implementing this green measure (e.g., solar panels)
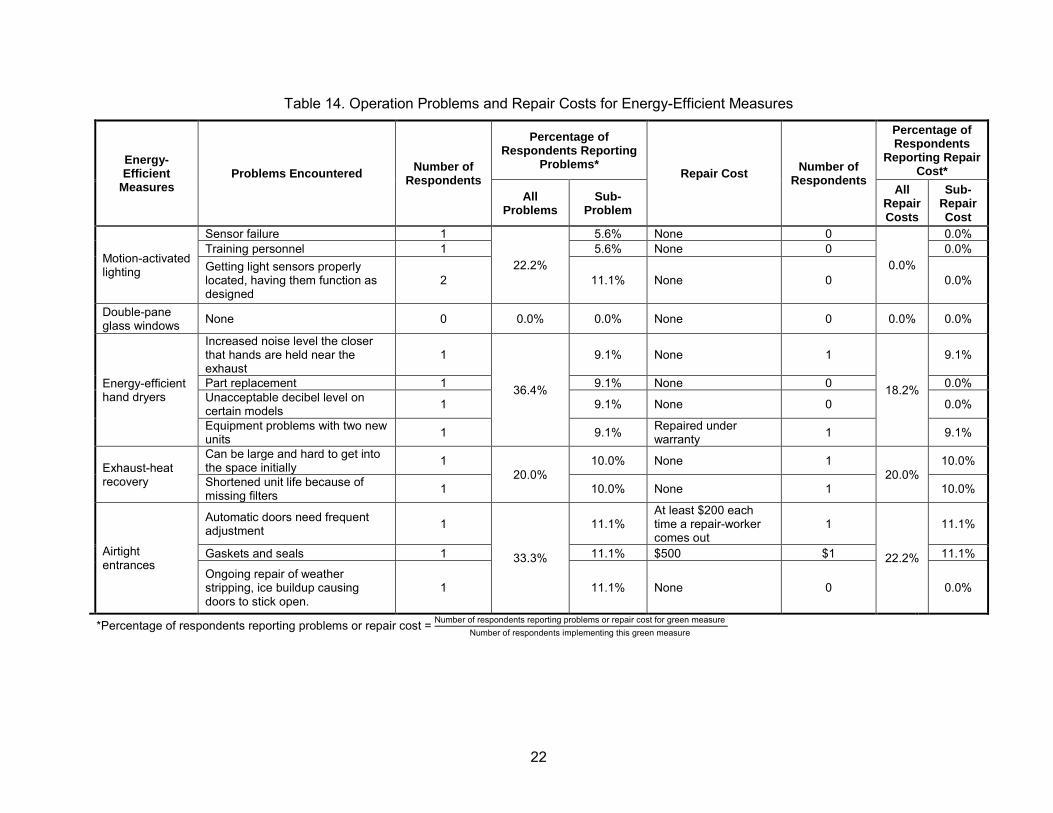
22
Table 14. Operation Problems and Repair Costs for Energy-Efficient Measures
Energy- Efficient
Measures Problems Encountered Number of
Respondents
Percentage of Respondents Reporting
Problems* Repair Cost Number of
Respondents
Percentage of Respondents
Reporting Repair Cost*
All Problems
Sub- Problem
All Repair Costs
Sub- Repair Cost
Motion-activated lighting
Sensor failure 1
22.2%
5.6% None 0
0.0%
0.0% Training personnel 1 5.6% None 0 0.0% Getting light sensors properly located, having them function as designed
2 11.1% None 0 0.0%
Double-pane glass windows None 0 0.0% 0.0% None 0 0.0% 0.0%
Energy-efficient hand dryers
Increased noise level the closer that hands are held near the exhaust
1
36.4%
9.1% None 1
18.2%
9.1%
Part replacement 1 9.1% None 0 0.0% Unacceptable decibel level on certain models 1 9.1% None 0 0.0%
Equipment problems with two new units 1 9.1% Repaired under
warranty 1 9.1%
Exhaust-heat recovery
Can be large and hard to get into the space initially 1
20.0% 10.0% None 1
20.0% 10.0%
Shortened unit life because of missing filters 1 10.0% None 1 10.0%
Airtight entrances
Automatic doors need frequent adjustment 1
33.3%
11.1% At least $200 each time a repair-worker comes out
1
22.2%
11.1%
Gaskets and seals 1 11.1% $500 $1 11.1%
Ongoing repair of weather stripping, ice buildup causing doors to stick open.
1 11.1% None 0 0.0%
*Percentage of respondents reporting problems or repair cost = Number of respondents reporting problems or repair cost for green measure Number of respondents implementing this green measure

23
Table 15. Operation Problems and Repair Costs for Water-Efficient Measures
Water-Efficient Measures Problems Encountered Number of
Respondents
Percentage of Respondents Reporting
Problems* Repair Cost Number of Respondents
Percentage of Respondents
Reporting Repair Cost*
All Problems
Sub- Problem
All Repair Costs
Sub- Repair Cost
Water-conserving toilets
Increases solids 1
18.2%
4.5% Adjustments needed, $0 1
12.5%
6.3%
Lower flows contribute to plugging and increased solids at rest areas.
1 4.5% Extra maintenance/time/ effort to keep operational 1 6.3%
Effectiveness 1 4.5% None 0 0.0% Incomplete flush 1 4.5% None 0 0.0%
Water-conserving urinals
Electronic controls 1
23.8%
4.8% $250/unit 1
5.6%
5.6% Odor problem 1 4.8% None 0 0.0% Odor and increased maintenance frequency 1 4.8% None 0 0.0%
Cartridge replacement 1 4.8% None 0 0.0% Increases solids 1 4.8% None 0 0.0%
Water-conserving faucets
Electronic controls 1 9.1% 4.5% None 0 6.3% 0.0% Initial adjustments 1 4.5% By contractor 1 6.3%
Rain gardens None 0 0.0% 0.0% None 0 0.0% 0.0% Gray water systems None 0 0.0% 0.0% None 0 0.0% 0.0%
*Percentage of respondents reporting problems or repair cost = Number of respondents reporting problems or repair cost for green measure Number of respondents implementing this green measure

24
Figure 8. Ranking of green building measures based, on percentage of respondents
reporting problems.
3.5 ENERGY SAVINGS AND PAYBACK PERIODS Survey respondents were asked to indicate the energy/water savings and payback
periods for the green measures implemented, if available. These green building measures are ranked based on their average energy/water savings, as shown in Figure 9. The survey results show that eight green measures provided energy/water savings that range from 10% to 60%, as shown in Figure 9. These eight green measures can be ranked based on their average energy/water savings: LED lighting; geothermal heat pumps; water-conserving urinals, toilets, and faucets; energy-efficient fluorescent lighting; motion-activated lighting; and exhaust-heat recovery. Four green building measures have average energy savings of less than or equal to 10%, as shown in Figure 9. These four green building measures can be ranked based on their energy savings: solar panels, energy-efficient hand dryers, airtight entrances, and double-pane glass windows. The survey respondents did not report savings for the remaining six building measures (induction lighting, solar water heaters, solar daylight tubes, wind-power technology, rain gardens, and gray water systems).
The green building measures are also ranked based on their average expected payback periods, as shown in Figure 10. The survey results show that ten green measures have a reasonable payback period of less than or equal to 10 years, as shown in Figure 10. These 10 green measures can be ranked based on their payback periods: energy-efficient hand dryers, energy-efficient fluorescent lighting, water-conserving faucets, toilets, and urinals; motion-activated lighting; exhaust-heat recovery; solar water heaters; solar daylight tubes; and airtight entrances. Five building measures have payback periods that range from 10.67 to 36 years, as shown in Figure 10. These five green building measures can be ranked based on their payback periods: geothermal heat pumps, double-pane glass windows, LED lighting, solar panels, and wind-power technology. The survey respondents did not report expected payback periods for the remaining three measures: induction lighting, rain gardens, and gray water systems.
9.1%
18.2%20.0%21.4%22.2%23.8%25.0%27.3%
33.3%33.3%36.4%
66.7%
0.0%
10.0%
20.0%
30.0%
40.0%
50.0%
60.0%
70.0%Pe
rcen
tage
of r
espo
nden
ts re
port
ing
prob
lem
s (%
)
Green building measure

25
Figure 9. Ranking of green-friendly measures, based on reported energy/water savings.
Figure 10. Ranking of green-friendly measures, based on reported payback periods.
60.0%
47.5%
40.0%33.3% 31.7%
22.5% 21.7%16.7%
10.0%5.0% 5.0% 4.0%
0.0%
10.0%
20.0%
30.0%
40.0%
50.0%
60.0%
70.0%Pe
rcen
tage
Sav
ing
(%)
Green building measureAverageRange
14.08 4.3 4.7 4.7 6 6.7
10 10 10 10.67 11.5 12.5
22.5
36
0
5
10
15
20
25
30
35
40
Payb
ack
Perio
d (y
ears
)
Green building measure AverageRange

26
CHAPTER 4 ON-SITE ASSESSMENT FOR SELECTED REST AREAS
A series of site visits and on-site assessments was conducted for the six selected rest areas to provide a better understanding of their current conditions and the potential for improving the performance of these facilities. The site visits and assessments for these six rest areas were conducted on April 6, 11, 13, and 29, 2011. The site visit and assessment team included the research team members, the chair of the Technical Review Panel, members of the panel, and Illinois Department of Transportation (IDOT) maintenance personnel. The main objectives of these site visits and on-site assessments were to study (1) the types of services provided by each rest area; (2) the conditions and characteristics of its appliances and fixtures; and (3) potential savings and energy-efficiency measures. These six rest areas were selected in this phase of the project for on-site assessment based on the highest annual energy cost and/or annual energy cost per square footage, as shown in Figures 11 and 12, respectively. These six high-potential rest areas were Willow Creek, Coalfield, Great Sauk Trail, Mackinaw Dells, Cumberland Road, and Turtle Creek; and they account for 32% of IDOT rest areas’ energy bills, as shown in Figure 13 (El-Rayes et al. 2010). This chapter presents the findings of the on-site assessment for the Willow Creek rest area. The findings of the on-site assessments for the remaining five rest areas are presented in Appendix C.
Figure 11. Annual energy consumption for interstate rest areas in Illinois (El-Rayes et al. 2010).
0
10000
20000
30000
40000
50000
60000
70000
80000
90000
Annu
al En
ergy
Cos
t ($)
Interstate Rest Areas in Illinois
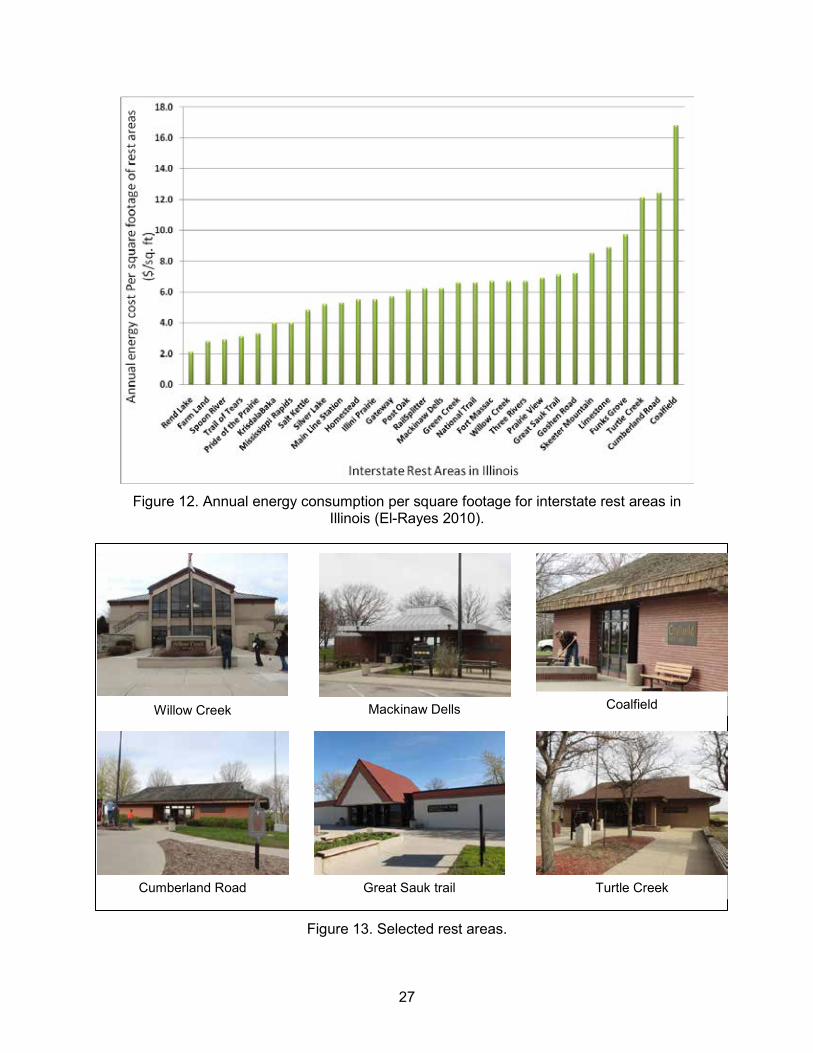
27
Figure 12. Annual energy consumption per square footage for interstate rest areas in
Illinois (El-Rayes 2010).
Figure 13. Selected rest areas.
Willow Creek Coalfield
Cumberland Road Turtle Creek
Mackinaw Dells
Great Sauk trail

28
4.1 WILLOW CREEK REST AREA Willow Creek rest area has approximately 1.1 million annual visitors, based on 2009
statistics, with a 0.49% annual increase in the visitation rate. It was built in 1993 and comprises two buildings that serve the north- and southbound lanes of I-39 at mile marker 85. The southbound portion of the rest area consists of one building with two floors to serve cars and trucks heading south on Interstate 39, while the northbound portion consists of one building with one floor to serve both cars and trucks heading north on Interstate 39. These buildings provide several services for visitors, including weather information, travel information and guides, restrooms, vending machines, and outdoor picnic areas; see Figure 14.
Figure 14. Willow Creek rest area.
The components of energy consumption in the northbound and southbound sides of the Willow Creek rest area include exterior lighting, interior lighting, space heating, air-conditioning, water heating, water treatment, vending machines, surveillance cameras, weather information, hand dryers, water coolers, and a pump station. The exterior lighting include light poles for the road between I-39 and the rest area parking lots, light poles for the parking lot, and outdoor lighting fixtures for the rest area building. The interior lighting includes light fixtures for the lobbies, men‘s restrooms, women‘s restrooms, mechanical room, water-treatment room, mechanical storage room, and vending storage room. The interior and exterior light fixtures in this rest area are summarized in Tables 16 and 17. Some lighting fixtures at the Willow Creek rest area are shown in Figure 15.
Southbound rest area
Northbound rest area

29
Table 16. Interior Lighting for the Willow Creek Rest Area
Location Type of Lighting Fixture Quantity
Lamp(s) per
Fixture Characteristics
Sou
thbo
und
Lobby
square fluorescent fixture 32 2 U-shape Sylvania Supersaver 34W
recessed light fixture, type 1 6 1 high-pressure sodium (HPS) (Philips) 70W
recessed light fixture, type 2 13 1 MH compact 400W
spotlight fixture 2 2 N.A.
exit signs 7 1 fluorescent 5W
Men's restrooms
square fluorescent fixture 8 2 U-shape Sylvania Supersaver 34W
rectangular fixture, type 1 12 4 fluorescent 4' GE F34 CW/FS/WM/ECO
rectangular fixture, type 2 12 2 fluorescent 4' GE F34 CW/FS/WM/ECO
recessed light fixture 6 1 HPS (Philips) 70W
Women's restrooms
square fluorescent fixture 8 2 U-shape Sylvania Supersaver 34W
rectangular fixture, type 1 12 4 fluorescent GE F34 CW/FS/WM/ECO
rectangular fixture, type 2 12 2 fluorescent 4' GE F34 CW/FS/WM/FRO
recessed light fixture 6 1 HPS (Philips) 70W Family
restroom square fluorescent fixture 2 1 U-shape Sylvania Supersaver 34W
Mechanical rooms surface light fixture 36 1 HPS (Philips) 70W
Storage rooms surface light fixture 10 1 HPS (Philips) 70W
Nor
thbo
und
Lobby
recessed light fixture, type 1 6 1 U-shape Sylvania Supersaver 34W
recessed light fixture, type 2 11 1 MH compact 400W
exit signs 4 1 fluorescent 5W
Men's restrooms
square fluorescent fixture 6 2 U-shape Sylvania Supersaver 34W
rectangular fixture, type 1 8 4 fluorescent 4' GE F34 CW/FS/WM/ECO
rectangular fixture, type 2 8 2 fluorescent 4' GE F34 CW/FS/WM/ECO
recessed light fixture 3 1 HPS (Philips) 70W
Women's restrooms
square fluorescent fixture 6 2 U-shape Sylvania Supersaver 34W
rectangular fixture, type 1 8 4 fluorescent 4’ GE F34 CW/FS/WM/ECO
rectangular fixture, type 2 8 2 fluorescent 4' GE F34 CW/FS/WM/ECO
recessed light fixture 3 1 HPS (Philips) 70W Family
restroom square fluorescent fixture 1 1 U-shape Sylvania Supersaver 34W
Mechanical rooms surface light fixture 15 1 HPS (Philips) 70W
Storage rooms surface light fixture 11 1 HPS (Philips) 70W

30
Table 17. Exterior Lighting for the Willow Creek Rest Area
Location Type of Lighting
Fixture Quantity Lamp(s)
per Fixture Characteristics
Sout
hbou
nd
Entrances and exits
lighting pole 1 9 1 N.A. lighting pole 2 10 1 N.A. lighting pole 3 1 2 N.A.
Building dusk–dawn fixture 10 1 HPS 50W Car parking lighting tower 1 1 4 N.A.
Truck parking lighting tower 1 2 4 N.A. lighting tower 2 1 6 N.A.
Nor
thbo
und
Entrances and exits
lighting pole 1 18 1 N.A. lighting pole 2 10 1 N.A. lighting pole 3 1 2 N.A.
Building Dusk-dawn fixture 10 1 HPS 50W
Car parking lighting tower 1 1 4 N.A.
lighting tower 2 1 2 N.A.
Truck parking lighting tower 2 2 4 N.A. lighting tower 3 1 6 N.A.
Figure 15. Lighting fixtures at the Willow Creek rest area.
The building of the southbound Willow Creek rest area is heated and air-conditioned using two rooftop units, which use natural gas for heating and electricity for cooling. Each unit has a CFM supply of 5,250, heat output of 142 MBh, and efficiency of 81%. Similarly, the building of the northbound Willow Creek rest area is heated and air-conditioned using two units, which use natural gas for heating and electricity for cooling. Each unit has a CFM supply of 2,790, heat output of 79 MBh, and efficiency of 79%. All four units were manufactured in 1994. One natural gas water heater is used for each building to heat water, with a capacity of 82 gallons. One of the HVAC units and a water heater are shown in Figure 16.

31
Figure 16. Rooftop unit and water heater in southbound Willow Creek rest area.
One well is used in each bound of the rest area to supply water, and a water-treatment system is used in each bound of the rest area to treat well water. Each system includes a pressure tank, hydro-pneumatic control panel, air compressor, water softener, and brine tank. Figure 17 shows some of the equipment used in the rest area building. The southbound rest area has four vending machines on the first floor and another four vending machines on the second floor. These vending machines include two vending machines for drinks, four for snacks, one for coffee, and one for ice cream. The northbound side of this rest area contains six vending machines: three for cold drinks, two for snacks, and one for coffee, as shown in Figure 18.
Figure 17. Water-treatment system components in the southbound Willow Creek rest area.
Rooftop unit Water heater
Pressure tank Air pump Hydro-pneumatic panel

32
Figure 18. Vending machines in the Willow Creek rest area.
Twelve surveillance cameras are used in the southbound side of the rest area and six in the northbound to maintain safety for visitors, and these cameras need interior lighting all the time to increase the clarity of video recording. The weather information service is provided using a television on the first and second floors of the southbound rest area and in the lobby of the northbound rest area. Four Code Blue emergency phones are available in the southbound rest area: one on each floor and one in each parking lot. Three Code Blue emergency phones are also available in the northbound rest area: one in the lobby and one in each parking lot. The southbound building also includes one computer for surveillance cameras, a refrigerator, and two ceiling fans.
The men‘s and women‘s restrooms of the southbound rest area include 18 hand dryers while the men’s and women’s restrooms of the northbound rest area include nine hand dryers. Each of these hand dryer units has 2,300W electrical capacity. Eight water coolers are available in the lobbies of the southbound rest area and four in the lobby of the northbound rest area to provide cold drinking water for visitors. Hand dryers and water coolers in the Willow Creek rest area are shown in Figure 19. Other water-consumption fixtures in the Willow Creek rest area include faucets, urinals, and toilets. The quantities and characteristics of these water fixtures in this rest area are shown in Table 18.
Figure 19. Hand dryers and water coolers in the Willow Creek rest area.

33
Table 18. Water Fixtures in the Willow Creek Rest Area
Location
Type of Water Fixture Quantity Characteristics
Sout
hbou
nd Men's restrooms
Faucets 8 Electronic faucets (Sloan) Toilets 8 Electronic 1.6 gal/flush
Urinals 8 Electronic 4 units, 1.6 gal/flush; 4 units, 1.0 gal/flush
Women's restrooms
Faucets 8 Electronic faucets (Sloan) Toilets 12 Electronic 1.6 gal/flush
Family restrooms Faucets 2 Electronic faucets (Sloan) Toilets 2 Electronic 1.6 gal/flush
Nor
thbo
und
Men's restrooms
Faucets 6 Electronic faucets (Sloan) Toilets 4 Electronic 1.6 gal/flush
Urinals 6 Electronic 2 units, 1.6 gal/flush; 4 units, 1.0 gal/flush
Women's restrooms
Faucets 6 Electronic faucets (Sloan) Toilets 8 Electronic 1.6 gal/flush
Family restroom Faucets 1 Electronic faucets (Sloan) Toilets 1 Electronic 1.6 gal/flush

34
CHAPTER 5 POTENTIAL LISTS OF BMPS AND THEIR ENERGY AND ECONOMIC PERFORMANCE
This chapter presents the findings of a detailed analysis of (1) the energy consumption of the six selected rest areas and (2) the potential green building measures that can be implemented in Coalfield rest area. The findings of the detailed analysis for the remaining five rest areas (Willow Creek, Great Sauk Trail, Mackinaw Dells, Cumberland Road, and Turtle Creek) are presented in Appendix D. The green building measures analyzed were energy-efficient lighting, such as fluorescent T8 bulbs, LED lighting, and induction lighting; occupancy controls for interior lighting, exhaust fans, and vending machines; efficient HVAC systems, including geothermal heat pumps and high-efficiency air-source heat pumps; double-pane glass for windows and doors; vestibule entrances; high-velocity hand dryers; solar daylight tubes, photovoltaic systems, and solar water heater; and water-conserving plumbing fixtures. Furthermore, a life-cycle cost (LCC) analysis was conducted to evaluate the cost effectiveness of implementing these green building measures in the rest areas. LCC analysis is suitable for evaluating building upgrades and design alternatives that satisfy the same requirements of performance, including occupant comfort, engineering standards, system reliability, and aesthetics considerations, however, being different in one or more elements of cost (Fuller and Petersen 1995). Elements of the cost include the initial cost, operating cost, maintenance cost, time value of money, and increase in electricity rates. The findings from these analyses can be used by IDOT decision makers to identify promising green building measures for each of the selected rest areas, based on their cost effectiveness. Moreover, the impact of these green building measures on the environment was analyzed based on their potential reduction of CO2 emission. The following sections describe the energy consumption analysis conducted for the Coalfield rest areas and a list of BMPs that can be implemented in it.
5.1 COALFIELD REST AREA The Coalfield rest area is located 25 miles from Springfield at mile marker 64 of I-55, and
it comprises two buildings to serve the north- and southbound lanes of I-55. It has approximately 1.8 million visitors, with an annual increase in visitation rate of 1.07%, based on 2009 statistics. The rest area was built in 1985 and had major renovations in 1991, when new vending areas were added to both buildings. The major sources of energy consumption in the rest area are the interior and exterior lighting, space heating and cooling, vending machines, hand dryers, pump station, and water heater. The next sections discuss the energy consumption analysis for the rest area building, as well as an LCC analysis for implementing different green building measures, including interior and exterior energy-saving light bulbs, motion-activated lighting, vending occupancy controls, motion exhaust sensors, geothermal heat pumps, an Energy Star air-source heat pump, double-pane glass windows, vestibule entrance, energy-efficient hand dryers, photovoltaic systems, solar water heater, solar daylight tubes, and water-saving plumbing fixtures.
5.1.1 Energy Audit and Analysis The Coalfield rest area has one utility meter to measure energy consumption in each building of the rest area. The two utility meters can be used to measure the monthly energy consumption of each building; however, they cannot provide a measure of the energy consumed by each device or piece of equipment in the rest area. To identify major sources of energy consumption in the rest area buildings and their costs, an energy simulation model was developed using the eQuest energy simulation software environment. The eQuest software can be used to simulate the

35
energy performance of a building, including its construction materials, weather, space heating and cooling, air ventilation, air infiltration and exhaust, temperature control, interior and exterior lighting, water use, windows and doors, skylights, operation schedule and occupancy, building activities, and equipment loads. Furthermore, eQuest can account for different scenarios for replacing any of the current equipment or devices in buildings and calculate the energy consumption accordingly. This capability of measuring a building’s energy consumption based on different scenarios of implementing various green building measures and equipment was used to analyze and identify a list of promising BMPs for the Coalfield rest area.
The Coalfield rest area was modeled by first setting its geographical location to Springfield, Illinois, which is the nearest major U.S. city that is available in the database of the eQuest software. The next modeling step was to define the analysis year, seasonal schedule of the rest area, and utility rates. This step was followed by defining the size and shape of the rest area building using the eQuest wizard forms to specify its square footage and architecture shape based on its plan dimensions, as shown in Figure 20. Building zones were also defined in the model to represent the interior design of the building and to assign different activities, as well as heating and cooling system(s), to the model created. The eQuest software was also used to define the building envelope, including its roof surface, above-grade walls, ground floor construction and interior finishing, ceiling finishing and insulation, air infiltration, and type of vertical walls, as shown in Figure 21. The model also defined the building’s doors and windows, including their surface areas and types, and overhangs, based on the building’s geometry and the surrounding trees. The building operation schedule was also defined in the model to specify that the rest area building operates 24 hr a day and 7 days a week. The model also defined the building’s activity area allocation by assigning percentages for various activities in the building, such as lobby, restrooms, mechanical and electrical, and storage. These percentages were determined based on the square footage of these areas with respect to the total square footage of the facility, as shown in Figure 22. Building occupancies were also assigned for these allocated areas because the eQuest software model considers the number of occupants throughout the operation of the building.
To model the occupancy for the rest areas in eQuest, we assumed that visitors spent an average of 5 min in the rest area building. The occupancy for the mechanical and storage rooms was assumed to be 0.5 person per mechanical room and 0.5 person per storage room to account for non-occupancy times in the rest area building. Ventilation and Infiltration were also defined by assigning rates for each occupied area. Infiltration rates were estimated based on the exhaust rates in the restroom areas, which were measured during the site visits.
Figure 20. Architectural layout and shape of the Coalfield rest area buildings.

36
Figure 21. Building envelope in eQuest for the Coalfield rest area.
Figure 22. Activity areas’ allocation and occupancy for the Coalfield rest area.

37
HVAC systems were then assigned to defined zones, as well as exhaust flow, as shown in Figure 23. During the site visit to the Coalfield rest area, exhaust flows were measured for the men’s and women’s restrooms as 77CFL and 76CFL, respectively. These values were used to assign exhaust for the simulation model. Interior lighting and miscellaneous equipment loads were also assigned to the model, where lighting loads were calculated by dividing the watt use of the building by its square footage, as shown in Figure 24. Similarly, equipment and device loads were assigned by dividing their watt use over the square footage of the allocated area. The energy use of water and wastewater pumps were estimated and assigned to the simulation model based on the working hours of pumps, pump rates, and square footage of the mechanical room. The energy use for water pumps, surveillance cameras, and a personal computer were assigned to the mechanical room load. An industry average watt use was assumed for a few pieces of equipment and devices in the rest area, such as vending machines, water coolers, weather station, fridges, and other small devices, owing to the inability to measure accurately their actual electricity consumption during the site visit. Energy consumption for hand dryers was estimated based on the assumption that half of the rest area visitors use the dryers for an average duration of 30 seconds each. Pump-station energy consumption was estimated based on water use in the rest area, which was reasonably assumed based on the number of rest area visitors and the water use of toilets, urinals, and faucets. An hourly profile for the interior lighting, devices, and equipment are set to full load to represent the full use of the interior lighting and other device such as vending machines. The watt use of other equipment or devices that do not operate 24 hr/day, such as the hand dryers and the interior lighting for the mechanical room and the storage rooms, was reduced, based on their estimated operation time. Miscellaneous equipment and devices were assigned to the model by dividing their total watt use by the building square footage, as shown in Figure 25.
Figure 23. HVAC system zones and exhaust flow.

38
Figure 24. Interior lighting loads.
Figure 25. Equipment and devices loads for the Coalfield rest area.

39
The required input data for the exterior lighting load in the eQuest software is expressed in watt/ft2 (see Figure 26); and accordingly, it was calculated in the developed simulation model by dividing the total wattage of the exterior lighting by the square footage of the building. The eQuest software accounts for the operating hours of the exterior lighting based on the location of the modeled building, which accounts for its seasonal hourly profiles. The HVAC system in the Coalfield rest area consists of two split-system air-conditioners with electric resistance duct heaters. The system has a total cooling capacity of 7.5 tons, and the heating system has a capacity of 35kW. Ducts of the HVAC system are routed through an unconditioned attic space where they were not insulated. The HVAC system for the Coalfield rest area was modeled in eQuest with an assumed energy-efficiency ratio (EER) of 8.9 for cooling and an auto-size capacity for heating. Seasonal thermostat set points were set in the model to 70ᵒF for cooling in summer and 74ᵒF for heating in winter. The water heater was modeled in eQuest based on the estimated daily water use per occupant; the supply water temperature was set to 94ᵒF, as it was reported during the site visit.
Figure 26. Exterior lighting loads and profiles for the Coalfield rest area buildings. After modeling the rest area building in eQuest, the simulation model was run to simulate
the building performance with respect to weather conditions throughout the year and calculate monthly and total energy consumption categories of the building. Because of the difficulty of measuring the air-infiltration rates for the entry doors during the site visit, several runs of the simulation model were conducted with varying reasonable rates of infiltration and ventilation to minimize the differences between simulated and actual energy consumption reported in the building’s energy bills. The parameters of infiltration were eventually set in the model to 35 CFM/person for the restrooms, lobby, and vending area; 300 CFM/person for the mechanical room; and 80 CFM/person for the storage room.
Figure 27 compares the simulated monthly energy consumption of the building based on the model developed in eQuest to the actual energy consumption reported in the utility bills of the Coalfield rest area buildings in 2009. Based on the results in Figure 27, the average absolute difference between the energy consumption for the simulation model developed and

40
the actual bills is 11.5%; and the maximum and minimum differences between the energy consumption for the simulation model developed and the actual bills were 20.3% in September and 2.2 % in March. The results also show that the Coalfield rest area has an average consumption of 239,332 kWh for each building.
Figure 27. Simulated and actual electricity consumption of the Coalfield rest area
buildings in 2009.
The square footage of the Coalfield rest area is 2,444 ft2; and its annual number of visitors is 880,000 per building, which leads to electricity consumption rates of 97.93 kWh/ft2/yr, $13.71/ft2/yr, and 0.27 kWh/visitor/yr. The breakdown of the electricity cost for the Coalfield rest area buildings for its main sources of consumption is shown in Figure 28. Space heaters account for 23% of the total energy consumption of the rest area building and represent the highest energy consumption. The lowest energy consumption is from hand dryers and water coolers, which account for 4% and 2%, respectively, of total energy consumption. This breakdown of energy costs will help in prioritizing energy-improvement efforts. The “other” category includes small equipment and devices such as vacuum cleaners, coffee machines, microwaves, and personnel laptops that are occasionally used in the rest area building and that were not considered in the simulation model.
The greatest use of energy for heating purposes (approximately 10% of total energy consumption) is for heating the space envelope of the rest area building. Additionally, 7% of the total energy cost is for heating infiltrated air that leaks into the building, primarily because of frequent opening and closing of the building doors (infiltration was modeled in eQuest model by 1.2 average air changes per hour).
0
5000
10000
15000
20000
25000
30000
35000
Jan Feb Mar Apr May Jun Jul Aug Sep Oct Nov Dec
Actual Bills
Simulation
Year 2009
Energy usage (KWH)

41
Figure 28. Energy cost breakdown of the Coalfield rest area.
5.1.2 Lighting Lighting in the Coalfield rest area represents approximately 21% of the total energy
consumption, with an annual cost of $6,616. The following two subsections analyze the feasibility of replacing the current interior and exterior lighting with more-efficient and energy-saving bulbs. The economic analysis of light replacement in these two sections follows the same procedures discussed in the first phase of this project and assumes an annual interest rate of 2% and escalation in utility rate of 5%.
Given the diversity of light characteristics, shapes, and fixtures, as well as the aesthetic requirements of each building, a spreadsheet was developed to (1) analyze the feasibility of using new lighting technologies such as LED or induction lighting in rest areas and (2) provide IDOT decision makers with the flexibility to analyze the impact of varying the LCCA assumptions on the net potential savings and payback periods of these new lighting technologies. The spreadsheet takes into consideration LCC components, including utility cost, annual increases in utility cost, discount rate, incentives, and a study period of 30 years. This spreadsheet was used to conduct an LCCA, as presented in the following sections.
5.1.2.1 Interior Lighting
Interior lighting in the Coalfield rest area consists of linear and U-shape fluorescent T12 bulbs. These bulbs can be replaced with linear and U-shaped fluorescent T8 bulbs to provide similar luminance level, less energy consumption, and longer life expectancy. Tables 19 and 20 summarize the impact of replacing current T12 with T8 fluorescent light bulbs for the Coalfield rest area. These lighting replacements can provide annual savings of $464 and reduce total energy consumption by 1.4%. The LCC analysis conducted for replacing all current T12 lighting with T8 bulbs is shown in Figure 29. The average payback period for all light replacement is 0.85 years, which represents a green building measure with a promising return on investment.
Interior Lighting$2,187
7%
Exterior Lighting$4,85114%Vending Machines
$3,28010%
Hand Dryers$1,181
4%
Sewer pumps$3,805
11%
Water Heater$2,415
7%
Space cooling$2,640
8%
Fans and Exhaust$1,728
5%
Water cooler$8412%
Surveliance, weather station and code blue
$1,5745% Others
$1,4114% Ventialtion
$2,1176%
Infilteration $2,274
7%
Envelope$3,31910%
Space Heating$7,71023%

42
Table 19. Replacing U-Shape Fluorescent T12 Bulbs with Energy-Efficient T8 Light Bulbs in the Lobby and Restrooms of the Coalfield Rest Area Buildings
Lighting Characteristics, Costs, and Savings Existing
Fixtures/Bulbs Replacement
Fixtures/Bulbs
Type of bulb Fluorescent (T12) Fluorescent (T8)
Sylvania (FB34/CW/6/SS/ECO
Sylvania 22305 (FBO28/841/XP/SS/ECO
Number of bulbs 32 32 Mean lumens (lumen) 2,279 2,265 Kelvin temperature (K) 4,200 4,100 Color rendering index (CRI) 62 75 Lifetime (hr) 18,000 26,000 Consumption per bulb (watt) 34 28 Lamp cost ($/each) 9.99 15.79 Change in lumens output levels (%) N.A. -0.6 Reduction in energy consumption (%) N.A. 17.6 Annual savings in energy consumption—first year ($) N.A. 236 Payback period (yr) N.A. 0.8
Table 20. Replacing Linear Fluorescent T12 Bulbs with Energy-Efficient T8 Light Bulbs in the Lobby, Restrooms, Maintenance Rooms, and Storage Rooms of the
Coalfield Rest Area Buildings
Lighting Characteristics, Costs, and Savings Existing
Fixtures/Bulbs Replacement
Fixtures/Bulbs
Type of bulb Fluorescent (T12) Fluorescent (T8)
34CW/RS/WM/ECO Sylvania 22234 (FO32/25W/841/XP/SS/ECO)
Number of bulbs 36 36 Mean lumens (lumen) 2,280 2,327 Kelvin temperature (K) 4,100 4,100 Color rendering index (CRI) 60 85 Lifetime (hr) 20,000 36,000 Consumption per bulb (watt) 34 25 Lamp cost ($/each) 1.8 7.39 Change in lumens output levels (%) N.A. +2.1 Reduction in energy consumption (%) N.A. 17.6 Annual savings in energy consumption—first year ($) N.A. 227 Payback period (yr) N.A. 0.51, 1.53, 5.77,*
* Payback period for lobby and restrooms, maintenance room, and storage rooms, respectively
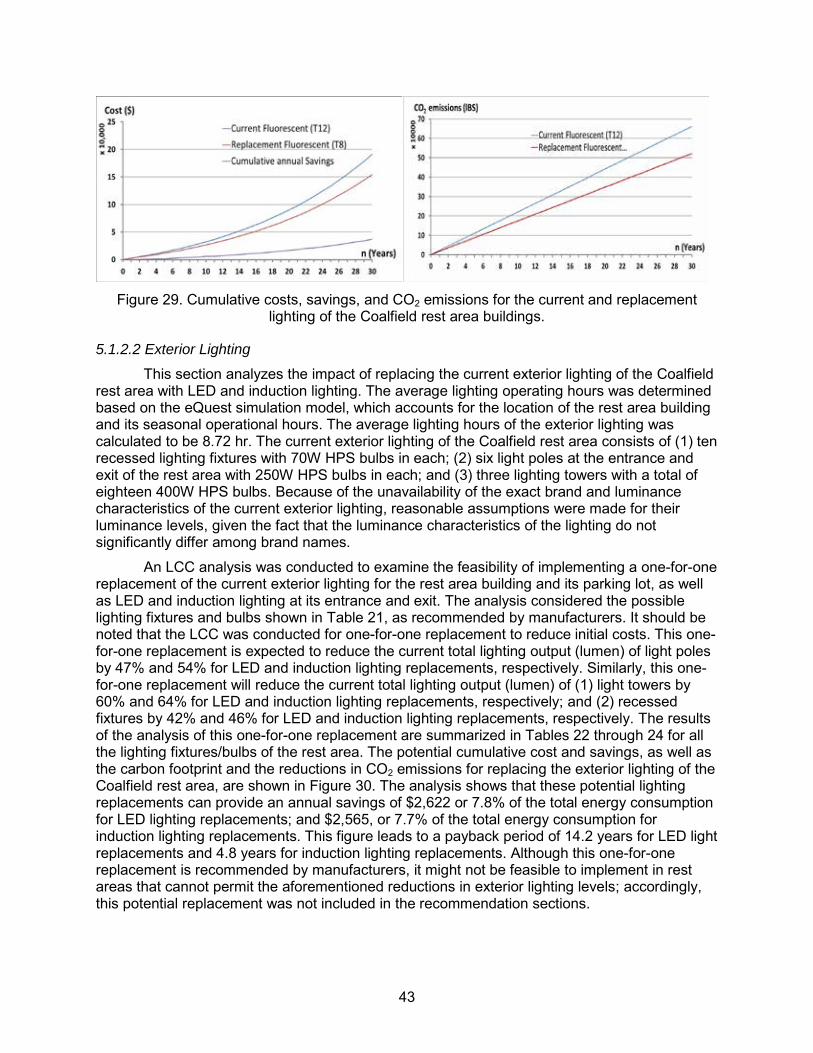
43
Figure 29. Cumulative costs, savings, and CO2 emissions for the current and replacement
lighting of the Coalfield rest area buildings.
5.1.2.2 Exterior Lighting
This section analyzes the impact of replacing the current exterior lighting of the Coalfield rest area with LED and induction lighting. The average lighting operating hours was determined based on the eQuest simulation model, which accounts for the location of the rest area building and its seasonal operational hours. The average lighting hours of the exterior lighting was calculated to be 8.72 hr. The current exterior lighting of the Coalfield rest area consists of (1) ten recessed lighting fixtures with 70W HPS bulbs in each; (2) six light poles at the entrance and exit of the rest area with 250W HPS bulbs in each; and (3) three lighting towers with a total of eighteen 400W HPS bulbs. Because of the unavailability of the exact brand and luminance characteristics of the current exterior lighting, reasonable assumptions were made for their luminance levels, given the fact that the luminance characteristics of the lighting do not significantly differ among brand names.
An LCC analysis was conducted to examine the feasibility of implementing a one-for-one replacement of the current exterior lighting for the rest area building and its parking lot, as well as LED and induction lighting at its entrance and exit. The analysis considered the possible lighting fixtures and bulbs shown in Table 21, as recommended by manufacturers. It should be noted that the LCC was conducted for one-for-one replacement to reduce initial costs. This one-for-one replacement is expected to reduce the current total lighting output (lumen) of light poles by 47% and 54% for LED and induction lighting replacements, respectively. Similarly, this one-for-one replacement will reduce the current total lighting output (lumen) of (1) light towers by 60% and 64% for LED and induction lighting replacements, respectively; and (2) recessed fixtures by 42% and 46% for LED and induction lighting replacements, respectively. The results of the analysis of this one-for-one replacement are summarized in Tables 22 through 24 for all the lighting fixtures/bulbs of the rest area. The potential cumulative cost and savings, as well as the carbon footprint and the reductions in CO2 emissions for replacing the exterior lighting of the Coalfield rest area, are shown in Figure 30. The analysis shows that these potential lighting replacements can provide an annual savings of $2,622 or 7.8% of the total energy consumption for LED lighting replacements; and $2,565, or 7.7% of the total energy consumption for induction lighting replacements. This figure leads to a payback period of 14.2 years for LED light replacements and 4.8 years for induction lighting replacements. Although this one-for-one replacement is recommended by manufacturers, it might not be feasible to implement in rest areas that cannot permit the aforementioned reductions in exterior lighting levels; accordingly, this potential replacement was not included in the recommendation sections.

44
Another analysis was conducted to examine the feasibility of exterior lighting replacements that maintain existing lumens output levels. To maintain the same light lumens, existing exterior HPS light bulbs can be replaced by LED luminaires that provide similar lumen output, such as HMLED14. This luminaire (HMLED14) has an initial cost of $2,400, energy consumption of 551 watts, and initial lumens of 41,934. Although this LED luminaire can provide one-for-one replacement of existing HPS 400-watt bulbs at comparable lumen levels, this potential replacement has a higher cost and consumes more energy than existing HPS 400W bulbs that consume 481W and have an initial cost of $54 each. Accordingly, based on current costs, this potential light replacement is not economically feasible. It should be noted, however, that the outcome of this economic feasibility analysis is expected to change because of the forecasted reduction in the initial cost of LED luminaries over time that are expected to be brought about by advancements in technology and increased competitiveness among manufacturers and vendors of LED luminaires.
Table 21. Characteristics of the Current and Replacement Lighting for the Exterior of the Coalfield Rest Area Buildings
Type Characteristics Type Characteristics Type CharacteristicsMean Lumens (lumen) HPS 70w 5200 LED Lamp 3000 Induction Lamp 2800
Color temperature (Kelvin) 3000 3000-5000 2700-6500Color rendering index (CRI) 75 80 83
Life time (hours) 10000 50000 100000Consumption (w) 70 40 40
Lamp cost ($) 33 335 215Lamp and fixture cost ($) - - -
Initial Lumens (lumen) HPS 250w 28500 LED Steet Light 15000 Induction Steet 13200Color temperature (Kelvin) 2000 2700-8000 Light 5000Color rendering index (CRI) 25 75 83
Life time (hours) 30000 50000 75000Consumption (w) 250 168 165
Lamp cost ($) 54 - -Lamp and fixture cost ($) - 1274 486
Initial Lumens (lumen) HPS 400w 50000 LED Steet Light 20000 Induction Steet 18000Color temperature (Kelvin) 2100 2700-8000 Light 5000Color rendering index (CRI) 20 75 83
Life time (hours) 24000 50000 75000Consumption (w) 400 224 225
Lamp cost ($) 54 - -Lamp and fixture cost ($) - 1493 538
Light Characteristic items Replacement (LED lighting) Replacement (Induction light)Current lighting

45
Table 22. Replacing HPS 400W Bulbs with Energy-Efficient LED and Induction Light Bulbs in the Coalfield Rest Area Buildings
Lighting Characteristics, Costs, and Savings Existing
Fixtures/Bulbs Replacemen
t 1 Replacemen
t 2 Type of bulb HPS LED Induction Number of bulbs 18 18 18 Initial lumens (lumens) 50,000 20,000 18,000 Kelvin temperature (K) 2100 2,700–8,000 5,000 Color rendering index (CRI) 20 75 83 Life time (hr) 24,000 50,000 75,000 Consumption per bulb, including ballast (watt) 481 224 230 Bulb cost ($) 54 1,493 538 Installation cost ($) 102 102 102 Reduction in lumens output levels (%) N.A. 60 64 Reduction in energy consumption (%) N.A. 53 52 Annual savings in energy—first year ($/yr) N.A. 2,064 2,016 Payback period (yr) N.A. 12.1 4.2
Table 23. Replacing HPS 250W Bulbs with Energy-Efficient LED and Induction Light Bulbs in the Coalfield Rest Area Buildings
Lighting Characteristics, Costs, and Savings Existing
Fixtures/Bulbs Replacemen
t 1 Replacemen
t 2 Type of bulb HPS LED Induction Number of bulbs 6 6 6 Initial lumens (lumens) 28,500 15,000 13,200 Kelvin temperature (K) 2,000 4,900 5,000 Color Rendering Index (CRI) 25 75 83 Life time (hr) 30,000 50,000 75,000 Consumption per bulb, including ballast (watt) 315 168 168 Bulb cost ($) 54 1,320 486 Installation cost ($) 102 102 102 Reduction in lumens output levels (%) N.A. 47 54 Reduction in energy consumption (%) N.A. 47 47 Annual savings in energy—first year ($/yr) N.A. 394 394 Payback period (yr) N.A. 22.4 6.2
Figure 30. Cumulative costs, savings, and CO2 emissions for LED and induction lighting
replacements for the Coalfield rest area buildings.

46
Table 24. Replacing HPS 70W Bulbs with Energy-Efficient LED and Induction Light Bulbs in the Coalfield Rest Area Buildings
Lighting Characteristics, Costs, and Savings
Existing fixtures/bulbs
Replacement 1
Replacement 2
Type of bulb HPS Cobra head LED Luminaire Induction
Number of bulbs 10 10 10 Initial lumens (lumens) 5,200 3,000 2,800 Kelvin temperature (K) 3,000 3,000–5,000 2,700–6,500 Color rendering index (CRI) 75 80 83 Lifetime (hr) 10,000 50,000 10,0000 Consumption per bulb, including ballast (W) 77 40 42 Bulb cost ($) $33 355 215 Reduction in lumens output levels (%) N.A. 42 46 Reduction in energy consumption (%) N.A. 48 36 Annual savings in energy—first year ($/yr) N.A. 165 156 Payback period (yr) N.A. 5 2.3
5.1.3 Motion Sensors Rest areas have a different operational schedule than most business and commercial
buildings, and they have to operate 24 hr a day with few or no occupants during low visitation periods at night. This makes motion sensors a promising technology for rest area buildings. This section analyzes the implementation of motion sensors to control the lighting of restrooms and vending machine areas. Motion sensors also can be used to reduce space heating and cooling by reducing the use of exhaust fans at night, when there are few or no occupants in the restrooms.
To estimate the energy savings in lighting and exhaust fans, the research team developed a separate simulation model using EZstrobe simulation language (Martinez 2006) to analyze and simulate the use of the restrooms and vending machines, based on the number and frequency of rest area visitors. The simulation model was developed to mimic the utilization of the rest area facilities by its visitors. The model was created to generate the number of visitors to the rest area using a beta distribution function to represent a high frequency of visitors during the morning, noon, and afternoon hours and a low frequency during the night and early morning hours. The model also assumes that the percentages of visitors that use the men’s restroom, women’s restroom, and vending machines are 40%, 40%, and 20%, respectively. Similarly, the probabilities that restroom visitors use urinals, toilets and only faucets were assumed to be 30%, 60%, and 10%, respectively, with reasonable random durations for each of these restroom tasks, as shown in Figure 31. It should be noted that the model assumes that each visitor using the toilet or urinal also uses the faucet afterwards. The model developed accounts for an amount of time for sensors to keep the light on after a visitor leaves a restroom. After a visitor leaves the restroom, the model assumes a 60% probability that the visitor leaves the rest area and a 40% probability that the visitor uses the vending machines. The model developed can estimate how long the lighting in the restrooms of the rest area will be turned off if motion-activated lighting were implemented in the restrooms. Similarly, the amount of time that vending machine lights and exhaust fans are turned/switched off can be calculated by the simulation model developed. Figure 32 shows the number of rest area visitors in the men’s restroom throughout a simulation day. Table 25 summarizes the percentages of occupancy for the restrooms and vending machines of the Coalfield rest area, assuming that the lights or fans

47
remain turned on for 5 min after the departure of the last visitor. The following subsections use the developed simulation model to estimate potential savings for using motion sensors in the rest area building and their expected payback periods. The economic analysis of the motion sensors accounts for an annual interest rate of 2% and an annual escalation in utility rates of 5% in calculating the payback period of implementing this technology.

48
Figure 31. Motion-sensor simulation model for the Coalfield rest area buildings.

49
Figure 32. Number of visitors in the men’s restroom throughout a simulation day
for the Coalfield rest area buildings.
Table 25. Percentage Occupancy for Restrooms and Vending Areas of the Coalfield Rest Area Buildings
Percentage of Occupancy in Men’s
Restroom
Percentage Occupancy in
Women’s Restroom
Percentage Average
Occupancy in Restrooms
Percentage Occupancy in Vending
Machines Area 60.9% 61.2% 61.1% 47.5%
5.1.3.1 Motion-Activated Lighting
Motion-activated lighting can be installed in restrooms to turn off lights automatically when the rooms are not occupied. As discussed in the previous section, restrooms in the Coalfield rest area have an average approximate occupancy of 61.1%, including 5 min for the occupancy sensors to turn off after detecting motion. This figure leads to an average of 38.9% savings in the lighting of restrooms. Table 26 shows the results of the LCC analysis for implementing motion-activated lighting in the restrooms of the Coalfield rest area. The analysis shows that the motion-activated lighting can provide approximate savings of $324, or 1.0% of total energy consumption of the Coalfield rest area buildings, which represents a payback period of 2.7 years for this green building measure. Furthermore, motion-activated lighting in restrooms can eliminate 3,267 lb of CO2 emissions annually.
Implementing motion-activated lighting in the lobby will not be feasible because of security requirements that the lights to be turned on at all times to ensure the proper operation of the surveillance cameras. Moreover, implementing motion-activated lighting in the maintenance rooms will not provide much savings, and the payback period will be long because the maintenance staff often turns off the light before leaving the mechanical rooms of the rest area.
0
2
4
6
8
10
12
14
0 200 400 600 800 1000 1200 1400Simulation Time
Content of MBR_OccupNumber of visitors in men's bathroom
Midnight 6:00am noon 6:00pm Midnight
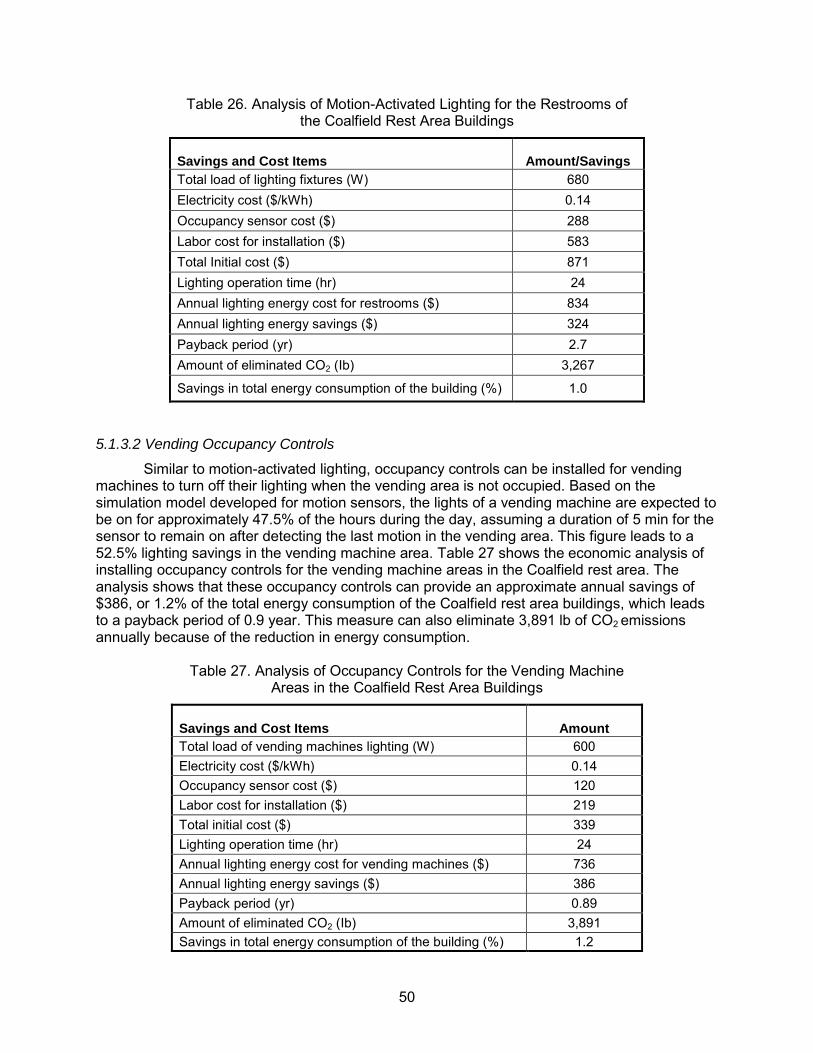
50
Table 26. Analysis of Motion-Activated Lighting for the Restrooms of the Coalfield Rest Area Buildings
Savings and Cost Items Amount/Savings Total load of lighting fixtures (W) 680 Electricity cost ($/kWh) 0.14 Occupancy sensor cost ($) 288 Labor cost for installation ($) 583 Total Initial cost ($) 871 Lighting operation time (hr) 24 Annual lighting energy cost for restrooms ($) 834 Annual lighting energy savings ($) 324 Payback period (yr) 2.7 Amount of eliminated CO2 (Ib) 3,267
Savings in total energy consumption of the building (%) 1.0
5.1.3.2 Vending Occupancy Controls
Similar to motion-activated lighting, occupancy controls can be installed for vending machines to turn off their lighting when the vending area is not occupied. Based on the simulation model developed for motion sensors, the lights of a vending machine are expected to be on for approximately 47.5% of the hours during the day, assuming a duration of 5 min for the sensor to remain on after detecting the last motion in the vending area. This figure leads to a 52.5% lighting savings in the vending machine area. Table 27 shows the economic analysis of installing occupancy controls for the vending machine areas in the Coalfield rest area. The analysis shows that these occupancy controls can provide an approximate annual savings of $386, or 1.2% of the total energy consumption of the Coalfield rest area buildings, which leads to a payback period of 0.9 year. This measure can also eliminate 3,891 lb of CO2 emissions annually because of the reduction in energy consumption.
Table 27. Analysis of Occupancy Controls for the Vending Machine
Areas in the Coalfield Rest Area Buildings
Savings and Cost Items Amount Total load of vending machines lighting (W) 600 Electricity cost ($/kWh) 0.14 Occupancy sensor cost ($) 120 Labor cost for installation ($) 219 Total initial cost ($) 339 Lighting operation time (hr) 24 Annual lighting energy cost for vending machines ($) 736 Annual lighting energy savings ($) 386 Payback period (yr) 0.89 Amount of eliminated CO2 (Ib) 3,891 Savings in total energy consumption of the building (%) 1.2

51
5.1.3.3 Motion Sensors for Exhaust
Similar to motion-activated lighting, exhaust fans can operate only during the times visitors are present. This arrangement will allow exhaust fans to be switched off automatically when there are no visitors, which will decrease the amount of outside air that needs to be heated or cooled. The eQuest software does not provide a direct method to account for the use of exhaust fan sensors; however, this feature can be modeled by decreasing the exhaust rate by a value that reflects the switching off of exhaust fans when there are no occupants. Accordingly, exhaust fan flow can be decreased with the average non-occupancy percentage of restrooms (38.9%). Table 28 summarizes the economic analysis results for implementing motion sensors for exhaust fans in the rest area building. The analysis shows that motion sensors for exhaust fans can provide approximate annual savings of $966, or 2.9% of total energy consumption of the Coalfield rest area buildings, which leads to a payback period of 0.6 year. This measure can also eliminate 9,729 lb of CO2 emissions annually because of reduction in energy consumption of heating and cooling.
Table 28. Results of an LCC Analysis for Implementing Exhaust Fan
Motion Sensors in the Coalfield Rest Area Buildings
Savings and Cost Items Amount/Savings Electricity cost ($/kWh) 0.14 Fan(s) and sensors cost ($) 433 Labor cost for installation ($) 109 Total initial cost ($) 542 Annual energy savings ($) 966 Payback period (yr) 0.57 Amount of eliminated CO2 (Ib) 9,729 Savings in total energy consumption of the building (%) 2.9
5.1.4 More-Efficient HVAC Systems The current HVAC system in the Coalfield rest area consists of two split-air conditioner
systems with electric resistance duct heaters. The system has a cooling capacity of about 7.5 tons, and the heating system has a capacity of 35kW. The current HVAC system can be replaced with a more energy-efficient system that reduces the consumption of heating and cooling energy. The following three subsections analyze the replacement of the current HVAC system with more-efficient units and setting back the temperature at night.
5.1.4.1 Geothermal Heat Pump
The existing HVAC system in the Coalfield rest area buildings operates continuously year round, and its consumption represents 36% of the building total. Ground-source heat pumps can be more efficient than air-source heat pumps because they use the nearly constant temperature of the earth (55°F) to heat and cool buildings. The eQuest simulation environment can be used to model the use of a geothermal HVAC system for the Coalfield rest area buildings. The system was modeled to have a heating coefficient performance (COP) of 4.0 and a cooling efficiency of 18 EER. This system was also modeled to operate in an economizer mode, which brings fresh air when the outside air temperature is sufficient to condition the space. After running the eQuest model with a geothermal heat pump, the model provides savings of 23% of total energy consumption.
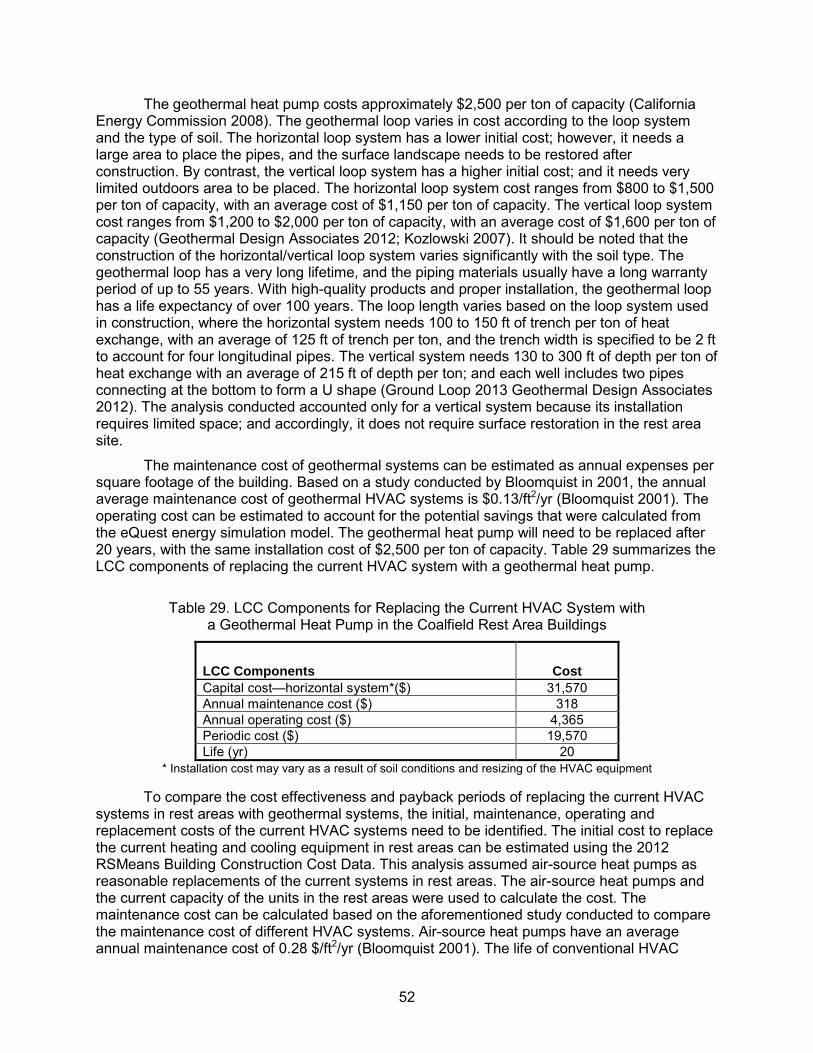
52
The geothermal heat pump costs approximately $2,500 per ton of capacity (California Energy Commission 2008). The geothermal loop varies in cost according to the loop system and the type of soil. The horizontal loop system has a lower initial cost; however, it needs a large area to place the pipes, and the surface landscape needs to be restored after construction. By contrast, the vertical loop system has a higher initial cost; and it needs very limited outdoors area to be placed. The horizontal loop system cost ranges from $800 to $1,500 per ton of capacity, with an average cost of $1,150 per ton of capacity. The vertical loop system cost ranges from $1,200 to $2,000 per ton of capacity, with an average cost of $1,600 per ton of capacity (Geothermal Design Associates 2012; Kozlowski 2007). It should be noted that the construction of the horizontal/vertical loop system varies significantly with the soil type. The geothermal loop has a very long lifetime, and the piping materials usually have a long warranty period of up to 55 years. With high-quality products and proper installation, the geothermal loop has a life expectancy of over 100 years. The loop length varies based on the loop system used in construction, where the horizontal system needs 100 to 150 ft of trench per ton of heat exchange, with an average of 125 ft of trench per ton, and the trench width is specified to be 2 ft to account for four longitudinal pipes. The vertical system needs 130 to 300 ft of depth per ton of heat exchange with an average of 215 ft of depth per ton; and each well includes two pipes connecting at the bottom to form a U shape (Ground Loop 2013 Geothermal Design Associates 2012). The analysis conducted accounted only for a vertical system because its installation requires limited space; and accordingly, it does not require surface restoration in the rest area site.
The maintenance cost of geothermal systems can be estimated as annual expenses per square footage of the building. Based on a study conducted by Bloomquist in 2001, the annual average maintenance cost of geothermal HVAC systems is $0.13/ft2/yr (Bloomquist 2001). The operating cost can be estimated to account for the potential savings that were calculated from the eQuest energy simulation model. The geothermal heat pump will need to be replaced after 20 years, with the same installation cost of $2,500 per ton of capacity. Table 29 summarizes the LCC components of replacing the current HVAC system with a geothermal heat pump.
Table 29. LCC Components for Replacing the Current HVAC System with a Geothermal Heat Pump in the Coalfield Rest Area Buildings
LCC Components Cost Capital cost—horizontal system*($) 31,570 Annual maintenance cost ($) 318 Annual operating cost ($) 4,365 Periodic cost ($) 19,570 Life (yr) 20
* Installation cost may vary as a result of soil conditions and resizing of the HVAC equipment
To compare the cost effectiveness and payback periods of replacing the current HVAC systems in rest areas with geothermal systems, the initial, maintenance, operating and replacement costs of the current HVAC systems need to be identified. The initial cost to replace the current heating and cooling equipment in rest areas can be estimated using the 2012 RSMeans Building Construction Cost Data. This analysis assumed air-source heat pumps as reasonable replacements of the current systems in rest areas. The air-source heat pumps and the current capacity of the units in the rest areas were used to calculate the cost. The maintenance cost can be calculated based on the aforementioned study conducted to compare the maintenance cost of different HVAC systems. Air-source heat pumps have an average annual maintenance cost of 0.28 $/ft2/yr (Bloomquist 2001). The life of conventional HVAC

53
systems ranges from 15 to 20 years. In this cost analysis, air-source heat pumps are assumed to have a useful life of 17 years. Table 30 summarizes the LCC components for the current HVAC system for the Coalfield rest area buildings.
Table 30. LCC Components for the Current HVAC
System in the Coalfield Rest Area Buildings
LCC Components Cost Capital cost ($) 13,020 Annual maintenance cost ($) 684 Annual operating cost ($) 10,388 Periodic cost ($) 13,020 Life (yr) 17 Manufacture year 2008 Replacement year 2025
An LCC analysis was conducted to compare the potential replacement of the current HVAC system with a geothermal heat pump, based on an annual interest rate of 2%, escalation in utility rate of 5%, and annual increase of maintenance cost of 2%. Table 31 summarizes the LCC analysis results for replacing the current HVAC with a geothermal heat pump. The analysis shows that replacing the current HVAC system with a vertical loop geothermal heat pump has a payback period of 3.8 years. The cumulative costs for the current HVAC system, a vertical loop geothermal system, and savings are shown in Figure 33. The geothermal heat pump can also be installed along with a desuperheater to heat water in the cooling season. The desuperheater uses heat that is removed from the building space to heat domestic hot water. This unit can provide free hot water in the summer or when the system is in cooling mode. It can provide an annual savings of $530, or 1.6% of the total energy consumption. The payback period of the desuperheater is 3 years, and it can eliminate 5,340 Ib of CO2 emissions.
Table 31. Results of the LCC Analysis for Replacing the Current HVAC System
with a Geothermal Heat Pump in the Coalfield Rest Area Buildings
Savings Amount Annual savings (kWh) 55,090 Annual energy savings—first year ($) 7,713 Annual eliminated CO2 emissions (lb) 77,677 Payback period—vertical system (yr) 3.8
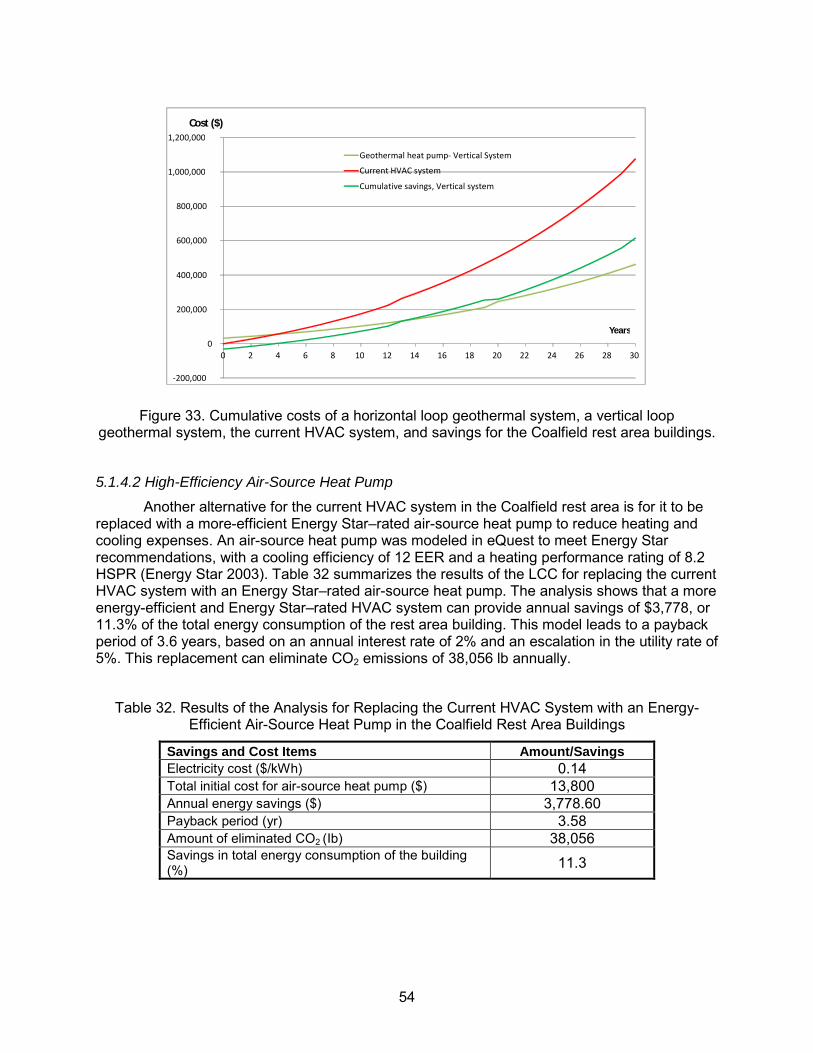
54
Figure 33. Cumulative costs of a horizontal loop geothermal system, a vertical loop
geothermal system, the current HVAC system, and savings for the Coalfield rest area buildings.
5.1.4.2 High-Efficiency Air-Source Heat Pump
Another alternative for the current HVAC system in the Coalfield rest area is for it to be replaced with a more-efficient Energy Star–rated air-source heat pump to reduce heating and cooling expenses. An air-source heat pump was modeled in eQuest to meet Energy Star recommendations, with a cooling efficiency of 12 EER and a heating performance rating of 8.2 HSPR (Energy Star 2003). Table 32 summarizes the results of the LCC for replacing the current HVAC system with an Energy Star–rated air-source heat pump. The analysis shows that a more energy-efficient and Energy Star–rated HVAC system can provide annual savings of $3,778, or 11.3% of the total energy consumption of the rest area building. This model leads to a payback period of 3.6 years, based on an annual interest rate of 2% and an escalation in the utility rate of 5%. This replacement can eliminate CO2 emissions of 38,056 lb annually.
Table 32. Results of the Analysis for Replacing the Current HVAC System with an Energy- Efficient Air-Source Heat Pump in the Coalfield Rest Area Buildings
Savings and Cost Items Amount/Savings Electricity cost ($/kWh) 0.14 Total initial cost for air-source heat pump ($) 13,800 Annual energy savings ($) 3,778.60 Payback period (yr) 3.58 Amount of eliminated CO2 (Ib) 38,056 Savings in total energy consumption of the building (%) 11.3
-200,000
0
200,000
400,000
600,000
800,000
1,000,000
1,200,000
0 2 4 6 8 10 12 14 16 18 20 22 24 26 28 30
Geothermal heat pump- Vertical System Current HVAC system Cumulative savings, Vertical system
Years
Cost ($)

55
5.1.4.3 Setting Back the HVAC System at Night
Another method to reduce energy consumption for space heating and cooling of the rest area is to set back the temperature of the HVAC system at night. The number of visitors using the rest area at night is very limited; and accordingly, setting back the temperature at night can reduce the energy consumption of heating and cooling. The temperature can be set at night to 68°F in the winter and 76°F in the summer. This measure can be modeled in eQuest by editing the temperature set points in the simulation model to a temperature that reflects the set points at night using interpolation. The eQuest model developed showed that setting back the temperature at night can provide annual savings of $140, or 0.4% reduction in total energy consumption. The Coalfield rest area buildings have programmable thermostats, which make this measure easy to be implemented in the rest area facility without any additional costs.
5.1.5 Double-Pane Glass for Windows and Doors Double-pane glass is a green building measure that can be added to the rest area
building to reduce space cooling and heating energy consumption. This measure requires replacing all glazing, as well as doors, in the rest area building with double-pane glass. This measure can be modeled in eQuest by replacing current single-glass glazing and doors with double-pane glass. The analysis of implementing this measure provided annual savings of $1,106, or 3.3% of total energy consumption, as shown in Table 33. The payback period for this measure is more than 30 years because it requires a major renovation for the rest area building, with high initial cost. This measure can eliminate 11,139 lb of CO2 annually.
Table 33. Results of an LCC Analysis for Replacing the Current
Glazing and Doors with Double-Pane Glass
Savings and Cost Items Amount/Savings Electricity cost ($/kWh) 0.14 Total initial cost for adding another door ($) 51,571 Annual energy savings (kWh) 7900 Annual energy savings ($) 1,106 Payback period (yr) More than 30 Amount of eliminated CO2 (Ib) 11,139 Savings in total energy consumption of building (%) 3.3
5.1.6 Vestibule Entrance Another measure to reduce energy consumption in the Coalfield rest area buildings is to
add a vestibule entrance to reduce air infiltration and provide better insulation in the lobby area. This measure can be modeled in eQuest by reducing air infiltration approximately from 2.0 to 1.6 air changes per hour (ACH) (i.e., a 20% reduction). Figure 34 shows the addition of a second door for the Coalfield rest area entrance to create a vestibule. Table 34 summarizes the results of the LCC analysis for adding a second door in the rest area entrance. This measure can provide annual savings of $623, or 1.9% of the total energy consumption of the rest area building. The analysis shows that this measure can pay back its installation cost in 5.2 years, based on an annual interest rate of 2% and an escalation in utility rate of 5%. This door replacement can eliminate 6,275 lb of CO2 emissions annually by reducing energy consumption.

56
Figure 34. Layout for adding a second door in
the Coalfield rest area to create a vestibule entrance.
Table 34. Results of an LCC Analysis for Adding a Vestibule Entrance in the Coalfield Rest Area Buildings
Savings And Cost Items Amount/Savings Electricity cost ($/kWh) 0.14 Total initial cost for adding vestibule entrance ($) 3,404 Annual energy savings (kWh) 4450 Annual energy savings ($) 623 Payback period (yr) 5.23 Amount of eliminated CO2 (Ib) 6,275 Savings in total energy consumption of the building (%) 1.9
5.1.7 Energy-Efficient Hand Dryers Energy-efficient hand dryers are one of the green building measures that can be
implemented in the Coalfield rest area buildings to reduce their energy consumption. The energy consumption of hand dryers was estimated based on a 50% use by rest area visitors each for 30 seconds, according to manufacturer’s use recommendations. Although the current hand dryers account for only approximately 3% of the total energy consumption, they are one of the most visible devices to the rest area visitors. Moreover, slow velocity or inefficient hand dryers may discourage people from using them. This analysis considers the impact of installing three different models of energy-efficient hand dryers in the Coalfield rest area buildings to reduce their energy consumption, as shown in Table 35. The analysis shows that replacing the current hand dryers may result in annual savings of $873 to $955, or 2.6% to 2.9% of the total energy consumption in the rest area building, based on three different models of energy-efficient
New door for energy- loss reduction
Storage room Mechanical room
Women’s restroom
Men’s restroom
Lobby and vending area
Visitors’ entrance
Backyard

57
hand dryers. These savings can provide a payback period of 1.2 to 6.9 years for the three different models, based on an annual interest rate of 2% and an escalation in the utility rate of 5%. This measure can eliminate up to 9,620 lb of CO2 of the Coalfield rest area buildings.
Table 35. Results of an LCC Analysis for Replacing the Current Hand Dryers
with Energy-Efficient Units in the Coalfield Rest Area Buildings
LCC Items/Savings
Current Hand Dryer, World Dryer
1- World Dryer
Airforce, J Series Hand
Dryers
2- Xlerator Series Hand
Dryers
3- Dyson Airblade
Series Hand Dryers
Number of hand dryers 4
Hand dryer consumption (W) 2,300 1,100 1,100 1,500
Drying time (s) 30 12 15 12
Initial cost ($) N.A. 1,092* 1,600* 6,400*
Annual visitors—2009 880,380
Savings over current hand dryers (%) N.A. 81 76 74
Utility cost ($/kWh) 0.14 Annual operating cost, based on 50% use by visitors ($) 1,181 226 282 308
Annual savings ($) N.A. 955 899 873
Annual operating cost, based on 50% use by visitors (%)
N.A. 2.9 2.7 2.6
Eliminated CO2 emissions (lb) N.A. 9,620 9,051 8,793
Payback period (yr) N.A. 1.2 1.8 6.9 * Restroom Direct 2013
5.1.8 Solar Measures Several solar measures can be used to reduce energy consumption in the rest area
buildings. These measures include solar daylight tubes, photovoltaic systems, and solar water heaters. These measures can reduce the energy consumption for internal lighting and heating water, as well as generating renewable and clean electricity. The next subsections discuss the installation of these systems in the Coalfield rest area buildings.
5.1.8.1 Solar Tube Lighting
Solar daylight tubes are one of the green building measures that can provide light for the building during daylight hours. The technology requires solar tubes to penetrate the building roof to the ceiling, where they transmit sunlight during the daytime. These lights can be installed in the restrooms and the lobby to decrease lighting use during daylight hours. They can be installed in the attic of the rest area building, along with controls that dim interior lighting during the day. The energy savings were calculated based on reducing daily lighting use by 5 hr. The analysis for solar daylight tubes is summarized in Table 36. Cumulative costs and savings for implementing solar daylight tubes in the restrooms and the lobby of the rest area are shown in Figures 35 and 36. The analysis shows that this measure can provide savings of $382 annually, or 1.14% of the total energy consumption, with a payback period of 24.92 years for restrooms and 18.25 years for the lobby. Correct installation of these lights is crucial in terms of the

58
amount of savings they can provide. Incorrect installation of solar daylight tubes or installation of solar daylight tubes with low insulation (low U value) can lead to a high dissipation of energy and increase the cooling and heating costs. By contrast, proper installation and use of sufficient U-value, Energy Star–rated solar daylight tubes could bring only slightly increased heating and cooling costs. The results from modeling solar tubes in eQuest with similar skylight areas showed an increase in energy cost $105 annually. Consequently, the expected savings achieved by this measure could be reduced to $277 annually.
Table 36. Results of an LCC Analysis for Installing Solar Daylight
Tubes in the Restrooms and Lobby of the Coalfield Rest Area Buildings
Savings and Cost Items Restrooms Lobby Total load of lighting fixtures (W) 680 816
Electricity cost ($/kWh) 0.14
Number of solar daylight tubes (10′’ diameter) 5 0
Number of solar daylight tubes (18″ diameter) 2 4
Total Initial cost ($) 4,165 3,300
Solar tubes’ operation time (hr) 5 5
Annual lighting energy cost ($) 834 1,001
Annual lighting energy savings ($) 174 208
Payback period (yr) 24.92 18.25
Amount of eliminated CO2 (Ib) 1,750 2,100
Savings in total energy consumption of the building (%) 0.52 0.62
Figure 35. Cumulative costs and savings for implementing solar daylight
tubes in the restrooms of the Coalfield rest area buildings.
-6,000
-4,000
-2,000
0
2,000
4,000
6,000
8,000
10,000
12,000
0 2 4 6 8 10 12 14 16 18 20 22 24 26 28 30
Fluorescent (T12) Solar daylight tubes
Cumulative annual savings
Cost ($)
n (yr)
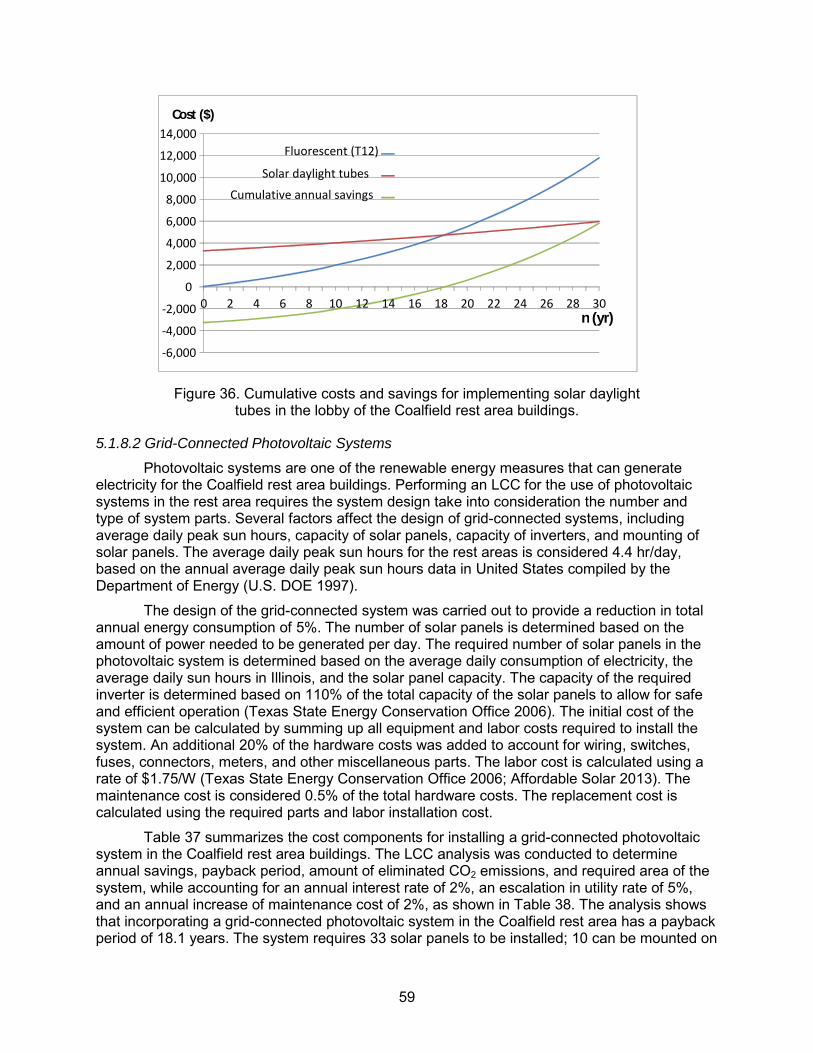
59
Figure 36. Cumulative costs and savings for implementing solar daylight
tubes in the lobby of the Coalfield rest area buildings.
5.1.8.2 Grid-Connected Photovoltaic Systems
Photovoltaic systems are one of the renewable energy measures that can generate electricity for the Coalfield rest area buildings. Performing an LCC for the use of photovoltaic systems in the rest area requires the system design take into consideration the number and type of system parts. Several factors affect the design of grid-connected systems, including average daily peak sun hours, capacity of solar panels, capacity of inverters, and mounting of solar panels. The average daily peak sun hours for the rest areas is considered 4.4 hr/day, based on the annual average daily peak sun hours data in United States compiled by the Department of Energy (U.S. DOE 1997).
The design of the grid-connected system was carried out to provide a reduction in total annual energy consumption of 5%. The number of solar panels is determined based on the amount of power needed to be generated per day. The required number of solar panels in the photovoltaic system is determined based on the average daily consumption of electricity, the average daily sun hours in Illinois, and the solar panel capacity. The capacity of the required inverter is determined based on 110% of the total capacity of the solar panels to allow for safe and efficient operation (Texas State Energy Conservation Office 2006). The initial cost of the system can be calculated by summing up all equipment and labor costs required to install the system. An additional 20% of the hardware costs was added to account for wiring, switches, fuses, connectors, meters, and other miscellaneous parts. The labor cost is calculated using a rate of $1.75/W (Texas State Energy Conservation Office 2006; Affordable Solar 2013). The maintenance cost is considered 0.5% of the total hardware costs. The replacement cost is calculated using the required parts and labor installation cost.
Table 37 summarizes the cost components for installing a grid-connected photovoltaic system in the Coalfield rest area buildings. The LCC analysis was conducted to determine annual savings, payback period, amount of eliminated CO2 emissions, and required area of the system, while accounting for an annual interest rate of 2%, an escalation in utility rate of 5%, and an annual increase of maintenance cost of 2%, as shown in Table 38. The analysis shows that incorporating a grid-connected photovoltaic system in the Coalfield rest area has a payback period of 18.1 years. The system requires 33 solar panels to be installed; 10 can be mounted on
-6,000 -4,000 -2,000
0 2,000 4,000 6,000 8,000
10,000 12,000 14,000
0 2 4 6 8 10 12 14 16 18 20 22 24 26 28 30
Fluorescent (T12) Solar daylight tubes
Cumulative annual savings
Cost ($)
n (yr)

60
the south part of the roof and 23 on the ground near the rest area building. The required area for solar panels on the ground is 270 ft2. These calculations accounted for a 51° tilt angle for the solar panels and prevention of any shading that might occur as a result of the layout of the solar panels in winter and summer. Figure 37 shows the cumulative savings of installing a grid-connected system in the rest area building.
Table 37. Cost Components for Installing a Grid-Connected
Photovoltaic System in the Coalfield Rest Area Buildings
Cost Components Amount/Savings Total number of solar panels 33 Number of inverters 1 System capacity (kW) 7.8 Utility cost ($/kWh) 0.140 Initial cost ($) 33,466 Annual maintenance cost ($) 101 Solar panels periodic cost ($) 11,453 Inverter periodic cost ($) 4,110 Annual savings ($) 1,675 Annual savings (kWh) 11,967 Cost per watt ($/W) 4.44
Table 38. Results of an LCC Analysis for Incorporating a Grid-Connected Photovoltaic System in the Coalfield Rest Area Buildings
LCC Items/Savings Amount/Savings Annual CO2 emissions eliminated (Ib) 16,873 Number of solar panels on roof 10 Number of solar panels on the ground 23 Required area for solar panels (SF) 270 Tilt angle of solar panels (degree) 51 Payback period (yr) 18.1
The stand-alone photovoltaic system was not considered in this analysis because the payback period identified in the first phase of this project was determined to be infeasible because of the high initial and periodic costs of battery systems.
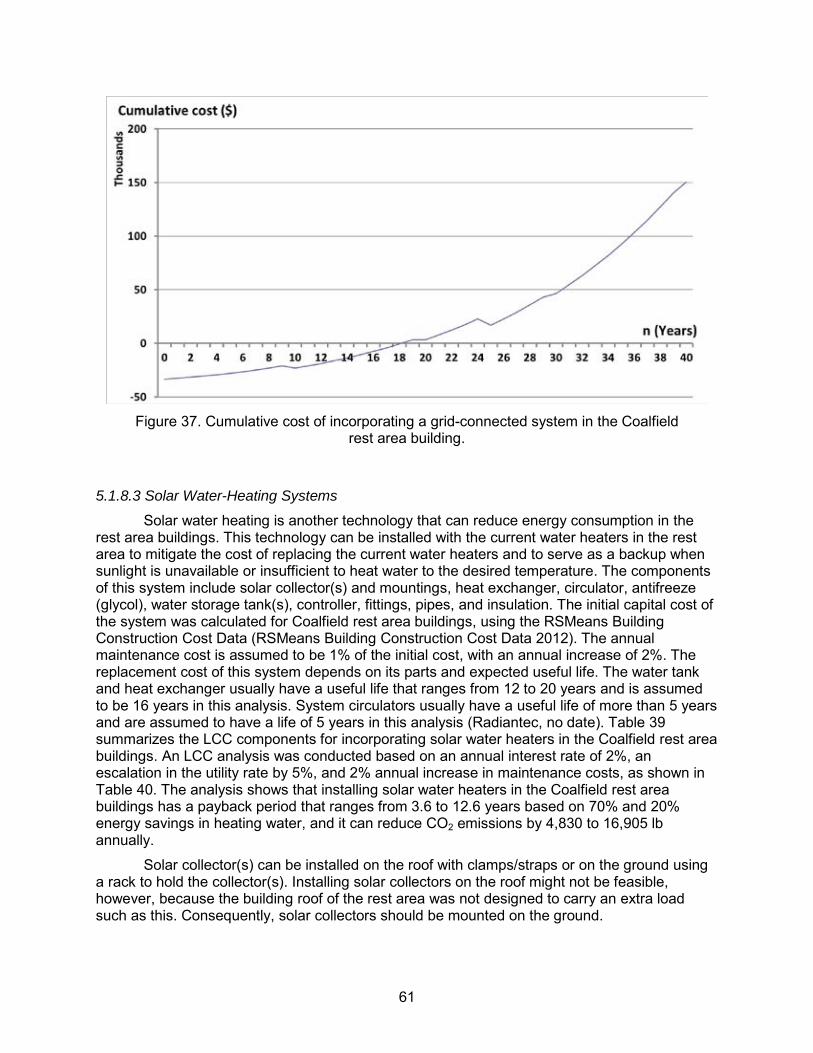
61
Figure 37. Cumulative cost of incorporating a grid-connected system in the Coalfield
rest area building.
5.1.8.3 Solar Water-Heating Systems
Solar water heating is another technology that can reduce energy consumption in the rest area buildings. This technology can be installed with the current water heaters in the rest area to mitigate the cost of replacing the current water heaters and to serve as a backup when sunlight is unavailable or insufficient to heat water to the desired temperature. The components of this system include solar collector(s) and mountings, heat exchanger, circulator, antifreeze (glycol), water storage tank(s), controller, fittings, pipes, and insulation. The initial capital cost of the system was calculated for Coalfield rest area buildings, using the RSMeans Building Construction Cost Data (RSMeans Building Construction Cost Data 2012). The annual maintenance cost is assumed to be 1% of the initial cost, with an annual increase of 2%. The replacement cost of this system depends on its parts and expected useful life. The water tank and heat exchanger usually have a useful life that ranges from 12 to 20 years and is assumed to be 16 years in this analysis. System circulators usually have a useful life of more than 5 years and are assumed to have a life of 5 years in this analysis (Radiantec, no date). Table 39 summarizes the LCC components for incorporating solar water heaters in the Coalfield rest area buildings. An LCC analysis was conducted based on an annual interest rate of 2%, an escalation in the utility rate by 5%, and 2% annual increase in maintenance costs, as shown in Table 40. The analysis shows that installing solar water heaters in the Coalfield rest area buildings has a payback period that ranges from 3.6 to 12.6 years based on 70% and 20% energy savings in heating water, and it can reduce CO2 emissions by 4,830 to 16,905 lb annually.
Solar collector(s) can be installed on the roof with clamps/straps or on the ground using a rack to hold the collector(s). Installing solar collectors on the roof might not be feasible, however, because the building roof of the rest area was not designed to carry an extra load such as this. Consequently, solar collectors should be mounted on the ground.
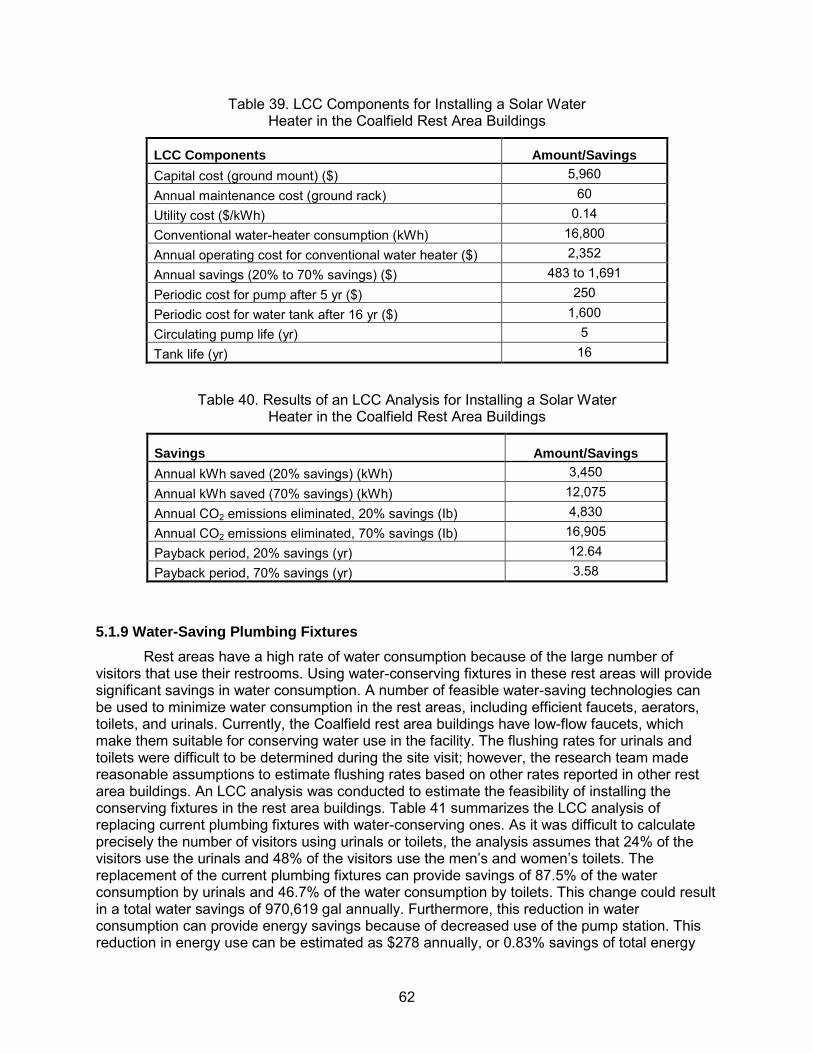
62
Table 39. LCC Components for Installing a Solar Water Heater in the Coalfield Rest Area Buildings
LCC Components Amount/Savings Capital cost (ground mount) ($) 5,960 Annual maintenance cost (ground rack) 60 Utility cost ($/kWh) 0.14 Conventional water-heater consumption (kWh) 16,800 Annual operating cost for conventional water heater ($) 2,352 Annual savings (20% to 70% savings) ($) 483 to 1,691 Periodic cost for pump after 5 yr ($) 250 Periodic cost for water tank after 16 yr ($) 1,600 Circulating pump life (yr) 5 Tank life (yr) 16
Table 40. Results of an LCC Analysis for Installing a Solar Water Heater in the Coalfield Rest Area Buildings
Savings Amount/Savings Annual kWh saved (20% savings) (kWh) 3,450 Annual kWh saved (70% savings) (kWh) 12,075 Annual CO2 emissions eliminated, 20% savings (Ib) 4,830 Annual CO2 emissions eliminated, 70% savings (Ib) 16,905 Payback period, 20% savings (yr) 12.64 Payback period, 70% savings (yr) 3.58
5.1.9 Water-Saving Plumbing Fixtures Rest areas have a high rate of water consumption because of the large number of
visitors that use their restrooms. Using water-conserving fixtures in these rest areas will provide significant savings in water consumption. A number of feasible water-saving technologies can be used to minimize water consumption in the rest areas, including efficient faucets, aerators, toilets, and urinals. Currently, the Coalfield rest area buildings have low-flow faucets, which make them suitable for conserving water use in the facility. The flushing rates for urinals and toilets were difficult to be determined during the site visit; however, the research team made reasonable assumptions to estimate flushing rates based on other rates reported in other rest area buildings. An LCC analysis was conducted to estimate the feasibility of installing the conserving fixtures in the rest area buildings. Table 41 summarizes the LCC analysis of replacing current plumbing fixtures with water-conserving ones. As it was difficult to calculate precisely the number of visitors using urinals or toilets, the analysis assumes that 24% of the visitors use the urinals and 48% of the visitors use the men’s and women’s toilets. The replacement of the current plumbing fixtures can provide savings of 87.5% of the water consumption by urinals and 46.7% of the water consumption by toilets. This change could result in a total water savings of 970,619 gal annually. Furthermore, this reduction in water consumption can provide energy savings because of decreased use of the pump station. This reduction in energy use can be estimated as $278 annually, or 0.83% savings of total energy
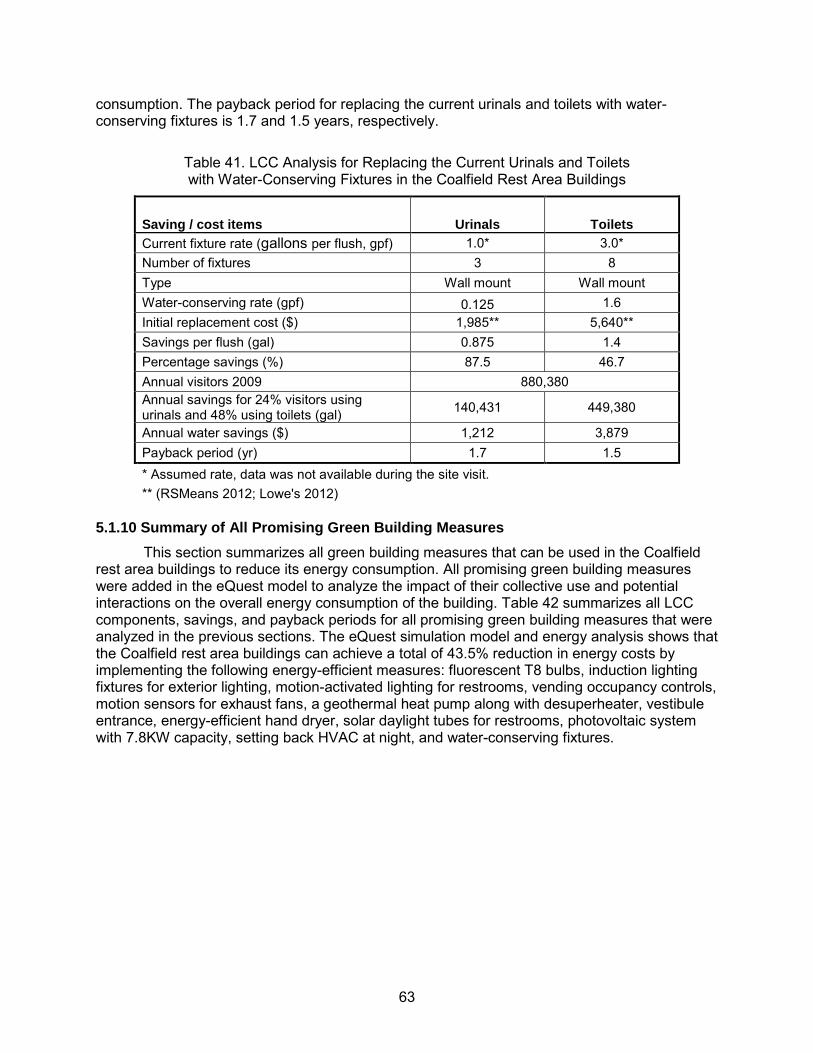
63
consumption. The payback period for replacing the current urinals and toilets with water-conserving fixtures is 1.7 and 1.5 years, respectively.
Table 41. LCC Analysis for Replacing the Current Urinals and Toilets with Water-Conserving Fixtures in the Coalfield Rest Area Buildings
Saving / cost items Urinals Toilets Current fixture rate (gallons per flush, gpf) 1.0* 3.0* Number of fixtures 3 8 Type Wall mount Wall mount Water-conserving rate (gpf) 0.125 1.6 Initial replacement cost ($) 1,985** 5,640** Savings per flush (gal) 0.875 1.4 Percentage savings (%) 87.5 46.7 Annual visitors 2009 880,380 Annual savings for 24% visitors using urinals and 48% using toilets (gal) 140,431 449,380
Annual water savings ($) 1,212 3,879 Payback period (yr) 1.7 1.5 * Assumed rate, data was not available during the site visit. ** (RSMeans 2012; Lowe's 2012)
5.1.10 Summary of All Promising Green Building Measures This section summarizes all green building measures that can be used in the Coalfield
rest area buildings to reduce its energy consumption. All promising green building measures were added in the eQuest model to analyze the impact of their collective use and potential interactions on the overall energy consumption of the building. Table 42 summarizes all LCC components, savings, and payback periods for all promising green building measures that were analyzed in the previous sections. The eQuest simulation model and energy analysis shows that the Coalfield rest area buildings can achieve a total of 43.5% reduction in energy costs by implementing the following energy-efficient measures: fluorescent T8 bulbs, induction lighting fixtures for exterior lighting, motion-activated lighting for restrooms, vending occupancy controls, motion sensors for exhaust fans, a geothermal heat pump along with desuperheater, vestibule entrance, energy-efficient hand dryer, solar daylight tubes for restrooms, photovoltaic system with 7.8KW capacity, setting back HVAC at night, and water-conserving fixtures.

64
Table 42. All Promising Green Building Measures in the Coalfield Rest Area Buildings
Green Building Measure
Estimated Initial Cost
Maintenance Cost, If
Applicable
Annual Energy/ Water
Savings
Annual CO2 Emissions Eliminated
(lb)
Reduction In Energy
Consumption
Payback Period
(yr) Interior lighting—Fluorescent T8 $771 N.A. $464 4,669 1.4% 0.8
Exterior lighting—induction lighting $17,198 N.A. $2,565 25,834 7.7% 4.1
Motion-activated lighting $871 N.A. $324 3,267 1.0% 2.7
Vending occupancy controls $339 N.A. $386 3,891 1.2% 0.9
Motion-sensor exhaust fans $542 N.A. $966 9,729 2.9% 0.6
Geothermal heat pump $31,570 $318 $7,713 77,677 23.0% 3.8
Desuperheater $1,600 N.A. $530 5,340 1.6% 3.0
Vestibule entrance $3,404 N.A. $623 6,275 1.9% 5.2 Energy-efficient hand dryers $1,092 N.A. $955 9,620 2.9% 1.2
Photovoltaic system $33,466 $101 $1,675 16,873 5.0% 18.1 Solar daylight tubes $7,465 N.A. $254 2,557 0.8% 21.6 Setting back the HVAC at night $0 N.A. $140 1,410 0.4% Immediate
Water-conserving fixtures $7,625 N.A. $5,091 N.A. N.A. N.A.
All promising green building measures together (eQuest model)
$106,243 $419 $19,311 194,696 43.5% 6.8

65
CHAPTER 6 DECISION SUPPORT TOOL DEVELOPED FOR OPTIMIZING UPGRADE DECISIONS OF ILLINOIS PUBLIC BUILDINGS
6.1 DECISION SUPPORT TOOL DESIGN AND CAPABILITIES The decision support tool (DST) developed for this project was designed to optimize the
upgrade decisions for IDOT rest areas and other buildings according to their conditions and potential for improvements. The two main objectives of the optimization tool were to minimize the total required upgrade costs and to maximize the sustainability of the interstate rest areas and other IDOT buildings. Accordingly, the DST was designed to identify a set of upgrade decisions that achieves an optimal tradeoff between sustainability (represented by the number of LEED points earned) and the required upgrade cost, as shown in Figure 38.
Figure 38. Optimal upgrade decisions for rest area buildings.
In this phase of the project, the DST was upgraded to (1) facilitate its use by IDOT decision makers by integrating the analysis of green-friendly measures into the tool developed; (2) improve the practicality of the DST by minimizing the amount of input data required by incorporating databases that contain updated data on the latest green products and technologies on the market; (3) facilitate its input and output data by incorporating user-friendly graphical user interfaces (GUIs) to maximize the tool’s use and adoption by IDOT decision makers; and (4) study and implement various optimization techniques to improve the efficiency and effectiveness of the optimization process and to enable development of additional capabilities and features.
The following section describes in detail how the DST was upgraded to account for new capabilities and features. The new methodologies for optimizing LEED upgrade decisions are then described in the subsequent section of this chapter.

66
6.2 DECISION SUPPORT TOOL UPGRADE The DST developed was upgraded to optimize the selection of (1) building measures,
including interior and exterior lighting, hand dryers, vending machines, grid-connected photovoltaic systems, other devices (e.g., PCs and surveillance cameras), HVAC systems, water heaters, and water fixtures; and (2) energy- and water-metering systems, including electricity, gas, and water sub-meters and whole-building meters. To implement all these building measures and metering systems, the DST developed is required to gather more building data to model buildings and monitor their performance accordingly. The implementation of these measures and metering systems in the DST developed is presented in Appendix E, along with the system design, databases, and graphical user interfaces (GUIs) that were implemented to improve the practicality of the tool developed and facilitate its use by IDOT decisions makers.
6.3 OPTIMIZING UPGRADE DECISIONS OF THE LEED RATING SYSTEM FOR EXISTING BUILDINGS
The DST is designed to identify optimal sets of upgrade decisions to qualify each of the analyzed IDOT buildings for LEED certification by earning the required number of LEED points while minimizing the required upgrade costs. The LEED rating system for existing buildings provides four certification levels: (a) certified level, which requires 40–49 points; (b) silver level, 50–59 points; (c) gold level, 60–79 points; and (d) platinum level, 80 points or more. Each of these levels requires a minimum number of LEED points, which can be earned by satisfying a set of requirements under seven credit areas for existing buildings: (1) sustainable sites; (2) water efficiency; (3) energy and atmosphere; (4) materials and resources; (5) indoor environmental quality; (6) innovation in operations; and (7) regional priority. Each of these credit levels can have prerequisites as well as credits that can potentially provide LEED points if certain measures are added to the building. As a result, there is a significantly large number of alternative upgrade measures, which need to be evaluated for each of the buildings analyzed; therefore, it is impractical to conduct all the evaluations to identify an optimal list of upgrade measures. To address this challenge, the DST developed uses a robust optimization technique that is capable searching and identifying an optimal set of upgrade measures for each of the buildings analyzed (U.S. GBC 2012).
The DST uses a genetic algorithm (GA) to optimize LEED upgrade decisions for public buildings because of its capabilities to optimize problems that include nonlinear and step changes among their inputs and outputs. The GA can provide better modeling for some LEED credits, such as performance of indoor water consumption, performance of outdoor water consumption, performance of building energy consumption, and on-site and off-site renewable energy. By contrast, the GA can be time-consuming when used to optimize large problems. The GA optimization model developed is integrated in an MS Excel spreadsheet because of Excel’s widespread use and practicality. The spreadsheet integrates an add-in, named EVOLVER, to perform GA computations in an Excel spreadsheet. This commercially available add-in can be purchased through Palisade Corporation (Palisade 2012). The following two optimization models were developed in the DST to optimize upgrade decisions for existing IDOT buildings to (1) minimize the total upgrade cost to accomplish a desired level of Leadership in Energy and Environmental Design for existing buildings (LEED-EB certification); and (2) maximize the number of accredited LEED-EB points for a specified budget.

67
6.3.1 Optimization Model 1: Minimize Upgrade Cost To Achieve a Specified LEED Certification Level
The first optimization model minimizes the total upgrade costs that are required to accomplish a specified LEED certification level such as silver or gold. The objective function of minimizing the upgrade cost of this model is illustrated in Equation 1, and its constraints are listed in Equations 2 through 12. The decision variable for each credit area is represented with an integer number that identifies which alternative should be selected during the optimization process; a value of zero indicates that no alternative is selected for this credit area, while a value of 1, 2, or more represents the alternative selected within the credit area. The decision variables for building energy and water performance credits, as well as energy- and water-metering systems, are represented with integer variables. These integer variables represent the selected products that can be implemented in the analyzed building to improve its energy or water performance or the selected meter/sub-meter to measure energy or water consumption. For example, an integer variable for interior lighting can select a product of energy-efficient light bulb that can improve the building energy performance by reducing its energy consumption.
The model constraints address the requirements for the LEED certification and the type of the decision variables, along with their minimum and maximum values; and building performance requirements, such as required lighting levels. The required number of LEED-EB points to achieve a certain LEED certificate is expressed in Equation 2. The decision variables of the optimization tool are defined as integer variables, as shown in Equations 3 through 5. According to the first required credit of the Material and Resources division, one credit should be achieved for credits MRc2 to MRc4, which is achieved in Equation 6. The number of achieved LEED points for the first credit of the Innovation in Operation division is limited to four points, as shown in Equation 7. The number of achieved LEED points for the credit of Regional Priority division is limited to four points, as shown in Equation 8. The minimum values for all decision variables are defined in Equation 9. The integer variables for energy and water measures are bounded by the total number of devices or fixtures available in the databases, as shown in Equation 10. The integer variables for energy and water meters/sub-meters are limited to the total number of meters/sub-meters available in the databases, as shown in Equation 11. Lighting levels are maintained similarly to the existing lighting, or a predefined reduction can be allowed, as shown in Equation 12.
𝐓. 𝐂. = � 𝐂𝐂𝐢(𝐗𝐢 ) +𝐈𝐢=𝟏 � ∑ 𝐂𝐆𝐤𝐫(𝐘𝐤𝐫)𝐑
𝐫=𝟏𝐊𝐤=𝟏 + ∑ 𝐂𝐌𝐦(𝐙𝐦)𝐌
𝐦=𝟏 Equation 1
Subject to
� Pi(Xi ) ≥ aI
i=1
Equation 2
∑ Xi → integer variables Ii=1 Equation 3
� � YKrj → integer variables R
r=1
K
k=1
Equation 4
� Zm → integer variables M
m=1
Equation 5

68
� Pi(Xi ) ≥ 1 ; i = MRc2, MRc3 , and MRc4 Equation 6
Xi , Yij, Zm ≥ 0 Equation 7
Pi(Xi ) ≤ 4 ; i = IOc1, RPc1 Equation 8
Xi , Yij, Zm ≥ 0 Equation 9
Ykr ≤ Yk ; k = 1 to K; r = 1 to R Equation 10
Zm ≤ Z ; m = 1 to M Equation 11
Lr ≤ Ar; r = 1 to R Equation 12
Where T. C. Total upgrade cost for achieving a certain LEED-EB certificate
CCi Cost of implementing alternative X in a LEED-EB credit area i
Xi An integer decision variable to decide which alternative, if any, can be implemented in an LEED-EB credit area (i), including sustainable sites, water efficiency, energy and atmosphere, material and resources, indoor environmental quality, and innovation in operation
CGkr(Ykr) Cost of implementing a green alternative Y of an energy or water building measure (k) in a location (r). Energy and water measures including interior lighting fixtures, interior light bulbs, exterior lighting fixtures, exterior light bulbs, vending machines, hand dryers, HVAC systems, water heaters, other devices, water faucets, urinals, and toilets; locations include rooms, building exterior, parking lot, and landscape
Ykr An integer decision variable to specify which energy or water building measure (k) is selected from the database in a location (r); locations include rooms, building exterior, parking lot, and landscape
CMm(Zm) Cost of installing a meter Z to measures a category of energy or water consumption (m), including building electricity consumption, building gas consumption, building water consumption, interior-lighting electricity consumption, exterior-lighting electricity consumption, vending-machines electricity consumption, hand dryer electricity consumption, HVAC system electricity/gas consumption, water-heater electricity/gas consumption, faucet water consumption, water consumption by urinals, and/or water consumption by toilets
Zm An integer decisions variable to specify which energy or water meter is selected from the database to measure energy or water consumption
I Total number of LEED-EB rating systems credits
K Total number of energy and water building measures
R Total number of energy and water measures’ locations
M Total number of metering systems categories

69
Pi(X) Possible LEED points that can be earned by implementing green alternative X in LEED-EB credit area i
a Number of required LEED-EB points for achieving a certain LEED certificate (certified, silver, gold, or platinum)
Yk Number of green alternatives available in the database for an energy or water building measure (k)
Z Number of meters available in the database for measuring electricity, gas, or water consumption
Lr [1 – Existing light intensity in a location (r) /light intensity after a bulb replacement in a location (r)]
Ar Allowable reduction of light intensity in a location (r)
6.3.2 Optimization Model 2: Maximizing Accredited LEED Points Within a Certain Budget The second model maximizes the number of accredited LEED-EB points that can be
earned. The objective function of maximizing LEED-EB points in this model is illustrated in Equation 13. The constraints of the second scenario optimization problem are listed in Equations 14 through 24. The decision variables that are used in this model are similar to those in model 1.
The constraints of model 2 address the available budget; the requirements for the LEED certification; the type of decision variables, along with their minimum and maximum values; and building performance requirements such as required lighting levels. The available budget for upgrading a certain building according to the LEED-EB rating system is represented in Equation 14. The decision variables of the optimization tool are defined as integer variables, as shown in Equations 15 through 17. According to the first required credit of the Material and Resources division, one credit should be achieved for credits MRc2 to MRc4, which is achieved in Equation 18. The number of LEED points achieved for the first credit of the Innovation in Operation division is limited to four points, as shown in Equation 19. The number of achievable LEED points for the credit of Regional Priority division is limited to four points, as shown in Equation 20. The minimum values for all decision variables are defined in Equation 21. The integer variables for the energy and water measures are bounded by the total number of devices or fixtures available in the databases, as shown in Equation 22. The integer variables for energy and water meters are limited to the total number of meters available in the databases, as shown in Equation 23. Lighting levels are maintained similarly to the existing lighting, or a predefined reduction can be allowed, as shown in Equation 24.
T. A. L. P. = � Pi(Xi ) I
i=1
Equation 13
Subject to
� CCi(Xi) +I
i=1
� � CGkr(Ykr)R
r=1
K
k=1
+ � CMm(Zm)M
m=1
≤ b Equation 14

70
� Xi → integer variables I
i=1
Equation 15
� � YKrj → integer variables R
r=1
K
k=1
Equation 16
� Zm → integer variables M
m=1
Equation 17
∑ Pi(Xi ) ≥ 1 ; i = MRc2, MRc3 , and MRc4 Equation 18
Xi , Yij, Zm ≥ 0 Equation 19
Pi(Xi ) ≤ 4 ; i = IOc1, RPc1 Equation 20
Xi , Yij, Zm ≥ 0 Equation 21
Ykr ≤ Yk ; k = 1 to K ; r = 1 to R Equation 22
Zm ≤ Z ; m = 1 to M Equation 23
Lr ≤ Ar; r = 1 to r Equation 24
Where T. A. L. P. Total Accredited LEED-EB Points (TALP)
Pi(X) Possible LEED points that can be earned by implementing green alternative X in LEED-EB credit area i
I: Total number of LEED-EB rating systems credits
b: Available budget for upgrading a certain building
CCi: Cost of implementing alternative X in a LEED-EB credit area i
Xi: An integer decision variable to decide which alternative, if any, can be implemented in an LEED-EB credit area (i), including sustainable sites, water efficiency, energy and atmosphere, material and resources, indoor environmental quality, and innovation in operation
CGkr(Ykr): Cost of implementing a green alternative Y of an energy or water building measure (k) in a location (r). Energy and water measures include interior lighting fixtures, interior light bulbs, exterior lighting fixtures, exterior light bulbs, vending machines, hand dryers, HVAC systems, water heaters, other devices, water faucets, urinals, and toilets; locations include rooms, building exterior, parking lot, and landscape
Ykr: An integer decision variable to specify which energy or water building measure (K) is selected from the database in a location (r); locations include rooms, building exterior, parking lot, and landscape

71
K: Total number of energy and water building measures
R: Total number of building locations for energy and water measures
CMm(Zm) ∶ Cost of installing a meter Z to measure energy or water consumption(m), including building electricity consumption, building gas consumption, building water consumption, interior-lighting electricity consumption, exterior-lighting electricity consumption, vending-machine electricity consumption, hand dryer electricity consumption, HVAC system electricity/gas consumption, water-heater electricity/gas consumption, faucet water consumption, water consumption by urinals, and/or water consumption by toilets
Zm: An integer decisions variable to specify which energy or water meter is selected to measure energy or water consumption
M: Total number of metering systems categories
Yk : Number of green alternatives available in the database for an energy or water building measure (k)
Z : Number of meters available in the database for measuring electricity, gas, or water consumption
Lr [1 - Existing light intensity in a location (r) /light intensity after a bulb replacement in a location (r)]
Ar: Allowable reduction of light intensity in a location (r)

72
CHAPTER 7 RECOMMENDATIONS AND FUTURE RESEARCH
7.1 RECOMMENDATIONS FOR SELECTED REST AREAS This section provides a list of recommended upgrade measures for the selected rest
areas based on the findings of this research study. These recommended green-friendly upgrade measures are summarized in the following section for each of the six selected rest areas. It should be noted that, these recommendations are developed based on the data gathered for the selected rest areas during the site visits in March 2011.
7.1.1 Coalfield Rest Area The Coalfield rest area was analyzed to investigate the feasibility of implementing
various green building measures to reduce its energy and water consumption, as well as to reduce its environmental impacts. This study of green building measures accounted for energy-efficient lighting, such as energy-efficient fluorescent bulbs, LED, and induction lighting; energy-efficient HVAC systems, such as geothermal heat pumps and high-efficiency air-source heat pumps; motion sensors for interior lighting, vending machines, and exhaust fans; energy-efficient hand dryers; solar practices such as solar daylight tubes, grid-connected photovoltaic systems, and solar water heaters; vestibule entrances; double-pane glass for windows and doors; and water-efficient faucets, toilets, and urinals. The results of this analysis provide a list of promising best management practices (BMPs) for the Coalfield rest area that includes fluorescent T8 bulbs for interior lighting, motion-activated lighting for restrooms, vending occupancy controls, motion sensors for exhaust fans, a geothermal heat pump along with desuperheater, vestibule entrance, energy-efficient hand dryer, solar daylight tubes for restrooms, photovoltaic system with 7.8KW capacity, setting back the HVAC at night, and water-conserving fixtures. The Coalfield rest area consists of two identical buildings to serve the north- and southbound sides of I-55. The recommendations for implementing this list of BMPs are listed in Tables 43 and 44; this list of recommendations can be implemented for each bound of the Coalfield rest area buildings. The implementation of this list of BMPs can reduce the total energy consumption of the rest area building by up to 35.8%.

73
Table 43. Recommendations for Interior and Exterior Lighting in the Coalfield Rest Area Buildings
Green-Friendly Measure Recommendations
Estimated Initial Cost
Energy/ Water
Reduction
Payback Period
(yr)
Interior lighting
Replace existing T12 lamps with energy-efficient T8 bulbs (28W and 25W) while maintaining the same lumens output levels, as discussed in Chapter 5. This light replacement will reduce electricity consumption of the interior lighting.
$771 1.4% 0.8
Motion sensors
Install motion sensors for lighting in the men’s and women’s restrooms. These motion sensors will reduce electricity consumption of the interior lighting.
$871 1.0% 2.7
Solar daylight tubes
Study the feasibility of installing solar daylight tubes in the restrooms and lobby to provide lighting during the daytime. This change can provide savings in electricity consumption; however, it can cause dissipation of energy for space heating and cooling, which leads to a long payback period. A detailed analysis of this potential replacement was discussed in Chapter 5.
$7,465 0.8% 21.6

74
Table 44. Recommendations for Vending Machines, Exhaust Fans, Hand Dryers, HVAC System, Water Heater, PV System, and Water Fixtures in the Coalfield Rest Area Buildings
Green-Friendly Measure Recommendations
Estimated Initial Cost
Energy/ Water
Reduction Payback
Period (yr)
Vending area
Install motion sensors for lighting in the vending area and lighting of vending machines. These sensors will reduce the electricity consumption of lighting the vending area and vending machines.
$339 1.2% 0.9
Exhaust fans
Install motion sensors for exhaust fans in the men’s and women’s restrooms. These motion sensors will allow the exhaust fans to operate only when the restrooms are occupied, which will reduce the unnecessary dissipation of energy for space heating and cooling when the restrooms are unoccupied.
$542 2.9% 0.6
Hand dryers
Replace the existing hand dryers in the women‘s and men‘s restrooms with more energy-efficient units such as Blast hand dryers.
$1,092 2.9% 1.2
HVAC system
Consider the feasibility of replacing the existing HVAC system with a geothermal heat pump. The rest area building is used 24/7; and accordingly, it can benefit from the use of an energy-efficient HVAC system, such as a geothermal heat pump, to reduce the energy consumption for space heating and cooling.
$31,570 23.0% 3.8
Water heater
Install desuperheater along with the geothermal heat pump to provide hot water during the summer and reduce the energy consumption of water heaters.
$1,600 1.6% 3.0
HVAC settings
Adjust the settings of the HVAC thermostat to allow the HVAC system to be set back at night during the low visitation periods.
$0 0.4% Immediate
Vestibule entrance
Add a vestibule entrance to the rest area building by installing a second door at the building entrance, as described in Chapter 5. This measure will reduce air infiltration and provide better insulation in the lobby of the rest area building.
$3,404 1.9% 5.2
Water fixtures
Replace existing water fixtures (toilets and urinals) with water-efficient units. A detailed analysis of this potential replacement is provided in Chapter 5.
$7,625 N.A. N.A.
PV system
Consider the possibility of installing a grid-connected photovoltaic system with a capacity of 7.8KW to generate 5% of the total electricity consumed at the rest area site. It should be noted that PV systems can generate renewable electricity on-site for the rest area; however, the payback period for this system is relatively long.
$33,466 5.0% 18.1
Code blue emergency phone
Consider the possibility of replacing existing bulbs in the Code Blue emergency phones with LED lights to reduce the electricity consumption, while considering the impact of this replacement on their visibility at night.
$300 %1.0 1.0
All measures
All the above energy measures were modeled in the energy simulation software to consider all interactions among the measures and to estimate the overall reduction in energy consumption.
$89,045 35.8% 6.9

75
The research team also developed a practical decision support tool (DST) that can be used to optimize the upgrade decisions for Illinois public buildings with two primary objectives: to (1) minimize the total upgrade cost to accomplish a desired level of LEED-EB certification and (2) maximize the number of accredited LEED-EB points for a specified budget. IDOT decision makers can use the DST to investigate the potential for achieving a specified LEED certification level (e.g., silver or gold) with the lowest possible upgrade cost or earning the maximum number of LEED credit points within a specified budget.
7.2 FUTURE RESEARCH During the course of this study, the research team identified a number of promising
research areas that need further in-depth analysis and investigation in a follow-up phase. Phase II of this completed project focused on six rest areas (Coalfield, Cumberland Road, Turtle Creek, Great Sauk Trail, Willow Creek, and Mackinaw Dells) that were selected based on their annual energy consumption and annual energy consumption per square foot. Building on the accomplishments in Phases I and II, the research team foresees an opportunity to continue in a Phase III research effort to (1) install sub-metering systems in three selected rest area buildings to measure and compare their energy and/or water consumption before and after the implementation of the recommended green building measures; (2) develop three showcases of green rest areas in Illinois by creating dynamic and interactive websites to provide real-time monitoring and reporting of the energy savings and positive environmental impacts that are realized from implementing green measures in these rest areas; (3) implement, monitor, and improve the effectiveness of the recommended green building measures in this project based on the readings of the installed sub-meters and the findings of the analyses of the previous phases; (4) investigate, determine, and provide a list of green-friendly best management practices (BMPs) for five additional rest areas that have the highest energy consumption rate in Illinois and account for account for 22% of IDOT rest areas’ energy bills; and (5) expand the capabilities of the DST developed in Phase II to enable the optimization model to minimize the operational cost of IDOT buildings while complying with the available upgrade budgets. To accomplish these five main goals, the objectives of the proposed Phase III research, subject to modifications in scope to adjust to the needs of IDOT, are to
1. Install sub-metering systems for three selected rest area buildings where electricity,
natural gas, and the number of visitors can be measured in real time to generate load profiles. These three rest areas will be selected based on the feedback and recommendations of the TRP.
2. Develop showcases of green rest areas in Illinois for the aforementioned three selected rest areas. This task will be accomplished by creating dynamic and interactive websites to provide real-time monitoring and reporting of the energy savings and the positive environmental impacts that are realized from implementing green measures in each of these three rest areas. These interactive websites can be displayed in each rest area using touch-screen monitors/tablets to inform and educate the visitors of these rest areas of the energy and cost savings realized, the improvements in operational performance, the impact of the renewable energy generated, and the reduction in carbon emissions over time. Furthermore, these websites will also be available on the Internet for the public at large, illustrating IDOT’s commitment to support the recent initiatives in the State of Illinois to be more green friendly.

76
3. Implement, monitor, and improve the effectiveness of the green building measures recommended in the previous phases of the project based on the readings of the installed sub-meters. This task will be accomplished in the same three rest area buildings that were selected in the aforementioned two objectives.
4. Develop a comparison between the analysis developed of the selected rest area buildings and their actual energy savings achieved after the implementation of green building measures.
5. Conduct on-site assessment and field measurements of five additional rest areas that have the next-highest energy consumption rates in Illinois and account for 22% of IDOT rest areas’ energy bills.
6. Explore and identify energy-saving measures that can be implemented in the five additional rest areas, such as energy-efficient lighting, motion-activated lighting, solar practices, double-pane glass, energy-efficient hand dryers, geothermal heat pumps, and water-saving plumbing fixtures.
7. Perform an energy audit analysis for the five additional rest areas using energy simulation tools such as eQuest and Ecotect to analyze the impact of implementing the energy-saving alternatives identified in the previous task.
8. Evaluate the economic feasibility of the identified energy-saving alternatives for the five additional rest areas in terms of their required upgrade costs, life-cycle costs (LCC), and payback periods.
9. Expand the capabilities of the DST developed in Phase II to enable the optimization model to minimize the operational cost of IDOT buildings while complying with the available upgrade budgets.
10. Prepare a plan/report with recommendations detailing (1) the recommended green-friendly BMPs to use with cost estimates for full implementation, including payback periods for the five additional rest areas; (2) instructions for using the expanded DST to identify optimal upgrade decisions for Illinois public buildings; and (3) a review of the green building measures implemented in the selected rest area building and their correlation with the analysis conducted.
This proposed future research is designed to support IDOT and the State of Illinois in their ongoing efforts to maximize the sustainability and green performance of their facilities. The expected deliverables of the proposed research include (1) monitoring of energy consumption, performance, and visitation rates in three selected rest areas, as well as measuring and calculating energy savings after implementing the green building measures recommended in Phases I and II; (2) conducting a detailed comparison between the energy simulation analysis results and the actual savings realized in these three selected rest area buildings; (3) developing three showcases for the three selected rest area buildings where green measures are implemented; (4) developing a comprehensive energy audit and analysis of five additional rest areas that have the second-highest energy consumption in Illinois; (5) identifying best management practices and specific recommendations to enable IDOT to identify the most economical and optimal building upgrade measures to achieve the highest possible energy savings and LEED certification for the five additional rest areas; (6) developing an expanded and practical DST that can identify optimal upgrade energy and water measures available on the market for minimizing operation cost of buildings while maintaining the upgrade cost within a specified budget; (7) achieving significant savings in IDOT rest areas’ energy consumption and bills; (8) achieving environmental benefits such as improving air and water quality; (9) achieving

77
social benefits such as enhancing visitors’ comfort and health. These deliverables will ensure that IDOT’s limited budgets for upgrading its buildings are spent in the most cost-effective manner. The proposed DST will also enable IDOT to monitor the performance of their buildings and implement the most cost-effective products on the market, which can reduce the operational cost of its buildings. The proposed research effort will also ensure IDOT's leadership in preserving the environment and in sustainability and green construction.

78
REFERENCES
American Association for Public Opinion Research (AAPOR). 2013. Best Practices: How to Produce a Quality Survey? http://www.aapor.org/Best_Practices.htm, accessed May 1, 2013.
Affordable Solar. 2013. Solar Photovoltaic Systems. http://www.affordable-solar.com, accessed May 1, 2013.
Bloomquist, R. Gordon. 2001. The Economics of Geothermal Heat Pump Systems for Commercial and Institutional Buildings. Olympia, WA: Washington State University Energy Program.
Byram Laboratories. 2011. Electrical Testing/Measurement Equipment/Sub-Metering Systems. http://www.byramlabs.com/kwh-meters.php, accessed February 14, 2013.
California Energy Commission, Consumer Energy Center. 2008. Geothermal or Ground Source Heat Source Heat Pumps. http://www.consumerenergycenter.org/home/heating_ cooling/geothermal.html, accessed June 26, 2013.
El-Rayes, K., L. Liu, and M. Abdallah. 2010. Green-Friendly Best Management Practices (BMPs) for Interstate Rest Areas. Rantoul, IL: Illinois Center for Transportation. http://ict.illinois.edu/publications/report%20files/FHWA-ICT-11-082.pdf, accessed June 26, 2013.
Energy Center of Wisconsin (ECW). 2000. Energy Sub-metering: Fact Sheet. http://www.ecw.org/ecwresults/427-1.pdf, accessed February 17, 2013.
Energy Star. 2003. Air-Source Heat Pumps and Central Air Conditioners Key Product Criteria. http://www.energystar.gov/index.cfm?c=airsrc_heat.pr_crit_as_heat_pumps, accessed February 17, 2013.
EnergyTracking. 2009. Technology Overview. http://www.energytracking.com/overview.htm, accessed February 14, 2013.
Fuller, Sieglinde K., and Stephen R. Petersen. 1995. Life-Cycle Costing Manual for The Federal Energy Management Program. Washington, DC: U.S. Department of Commerce, Technology Administration, National Institute of Standards and Technology.
Geothermal Design Associates. 2012. Open vs. Closed Geothermal Loop Systems. http://www.geothermaldesign.com/how-it-works/open-vs-closed.html, accessed February 17, 2013.
Ground Loop. 2013. Geothermal—How It Works. http://www.groundloop.com, accessed February 14, 2013.
Illinois Capital Development Board (Illinois CDB). 2007. Green Building Guidelines for State Construction. http://www.cdb.state.il.us/forms/download/CDB%20Green%20Building %20Guidelines.pdf, accessed May 1, 2013.
Illinois General Assembly. 2009. Green Buildings Act. Illinois Compiled Statutes, 20 ILCS 3130. http://www.ilga.gov/legislation/ilcs/ilcs3.asp?ActID=3109&ChapterID=5, accessed June 7, 2013.
Kozlowski, David. 2007. Simple, Reliable, and Efficient Geothermal Heat Pump Systems. http://www.facilitiesnet.com/energyefficiency/article/Simple-Reliable-and-Efficient-Geothermal-Heat-Pump-Systems--7220, accessed February 17, 2013.

79
Lowe’s. 2012. Plumbing Supplies. http://www.lowes.com, accessed January 25, 2012.
Martinez, Julio C. 2006. Discrete Event Simulation, Animation, and Virtual Environments of Processes and Operations. http://www.ezstrobe.com/2009/10/ezstrobe.html, accessed February 14, 2013.
MeterToCash. 2013. Electric Meter. http://www.metertocash.com, accessed February 17, 2013.
Palisade Corporation. 2012. Evolver6: Risk and Decision Analysis Toolkit. http://www.palisade.com/evolver, accessed February 14, 2013.
Pecko, A., V. Bulbenkiene, A. Sokolov, E. Zulkas, and G. Mumgaudis. 2011.Energy Sub-Metering Data Acquisition System. Electronics and Electrical Engineering, pp. 99–102.
Radiantec. No date. Owner's Manual: The Basic Radiantec Solar Domestic Water Heater. http://www.radiantsolar.com/pdf/Owners_Manual.pdf, accessed February 14, 2013.
Restroom Direct. 2013. Commercial Restroom Accessories, Energy-Efficient Hand Dryers. http://www.restroomdirect.com/index.aspx, accessed February 14, 2013.
R.R. Flowmeters. 2012. Diaphragm Meters. http://www.rrflowmeters.com/products.php?pname =Diaphragm%20Flowmeters,%20Mechanical, accessed February 17, 2013.
RSMeans Building Construction Cost Data 2012. Kingston, MA: R.S Means.
Santee Cooper Power. 2002. Energy Information: Electricity Sub-Meters. https://www.santeecooper.com/portal/page/portal/santeecooper/mybusiness/energymanagementtips/energyinformationelectricitysub-meters.pdf, accessed February 14, 2013.
Satterfield, Z., and V. Bhardwa. 2004. Water Meters. National Environmental Services Center, Tech Brief. http://www.nesc.wvu.edu/pdf/dw/publications/ontap/2009_tb/water_ meters_DWFSOM67.pdf, accessed February 14, 2013.
Schwarz, Frederick. 2011. Fundamental Principles of Rotary Displacement Meters. http://www.afms.org/Docs/liquids/Principles_of_Rotary.pdf, accessed February 14, 2013.
Texas State Energy Conservation Office. 2006 (Aug.) Feasibility of Photovoltaic System Fact Sheet. Austin, TX: State Energy Conservation Office.
U.S. Department of Energy (U.S. DOE). 1997. Energy Efficiency and Renewable Energy. DOE/GO-10097-377. Washington, DC: U.S. Department of Energy.
U.S. Environmental Protection Agency (U.S. EPA). 2002 (Dec.). Sub-Metering Energy Use in Colleges and Universities: Incentives and Challenges. A Resource Document for Energy, Facility, and Financial Managers. http://www.energystar.gov/ia/business/higher_ ed/Submeter_energy_use.pdf, accessed June 26, 2013.
U.S. Green Building Council (U.S. GBC). 2012. LEED Rating Systems. http://new.usgbc.org/leed/rating-systems, accessed February 14, 2013.

A-1
APPENDIX A SURVEY FORM
Evaluating Performance of Green Measures
Introduction and Contact Information
Introduction:
The Illinois Department of Transportation is sponsoring an ongoing research project that aims to study green-friendly Best Managements Practices (BMP) for Illinois interstate rest areas. This survey is designed to evaluate performance of green-friendly and sustainability measures in interstate rest areas, welcome centers, and DOT-owned facilities. Your valuable feedback is needed to complete this online survey that is designed to take less than 15 minutes. We would appreciate it if you can complete the survey by October 28th, 2011.
The research team will be glad to share with you the findings of this survey upon completion.
If you have any questions or comments, please contact the Proposed Investigator (PI) of this project: Khaled El-Rayes, Associate Professor, Department of Civil and Environmental Engineering, University of Illinois at Urbana-Champaign, Tel: (217) 265-0557, e-mail: [email protected].
Thank you in advance for your time.
Your Contact Information:
Name:: _________________________
Title: _________________________
State:: _________________________
Phone:: _________________________
E-mail: _________________________
Fax: _________________________

A-2
1. Use of Green Building Measures
Please, indicate which green measure(s) is/are currently used in your State Department of Transportation (DOT) buildings.
Energy-Efficient Lighting
[ ] LED lighting
[ ] Induction lighting
[ ] Energy-efficient fluorescent (T8)
[ ] None
Renewable Energy
[ ] Solar panels
[ ] Solar water-heating systems
[ ] Solar daylight tubes
[ ] Geothermal heat pumps
[ ] Wind-power technology
[ ] None
Energy-Efficient Measures
[ ] Motion-activated lighting
[ ] Double-pane glass windows
[ ] Energy-efficient hand dryers
[ ] Exhaust-heat recovery
[ ] Airtight entrances
[ ] None
Water-Efficient Measures
[ ] Water-conserving toilets
[ ] Water-conserving urinals
[ ] Water-conserving faucets
[ ] Rain gardens

A-3
[ ] Gray water systems
[ ] None
Other Green Measures (please state)
Measure # 1: _________________________
Measure # 2: _________________________
Measure # 3: _________________________
To what buildings have you implemented these green measures?
[ ] Rest areas/welcome centers
[ ] Office buildings
[ ] Other
Please list other buildings, if any.
____________________________________________

A-4
2. User Satisfaction
Please, indicate average user satisfaction of each green measure.
Energy-Efficient Lighting
Very Satisfied Satisfied Neutral Dissatisfied Very
Dissatisfied LED lighting Induction lighting Energy-efficient fluorescent (T8)
Renewable Energy
Very Satisfied Satisfied Neutral Dissatisfied Very
Dissatisfied Solar panels Solar water-heating systems
Solar daylight tubes Geothermal heat pumps Wind-power technology
Energy-Efficient Measures
Very Satisfied Satisfied Neutral Dissatisfied Very
Dissatisfied Motion-activated lighting Double-pane glass windows
Energy-efficient hand dryers
Exhaust-heat recovery Airtight entrances Water-Efficient Measures
Very Satisfied Satisfied Neutral Dissatisfied Very
Dissatisfied Water-conserving toilets Water-conserving urinals Water-conserving faucets Rain gardens Gray water systems Other Green Measures Listed on Page 2, If Any
Very Satisfied Satisfied Neutral Dissatisfied Very
Dissatisfied Measure # 1 Measure # 2 Measure # 3
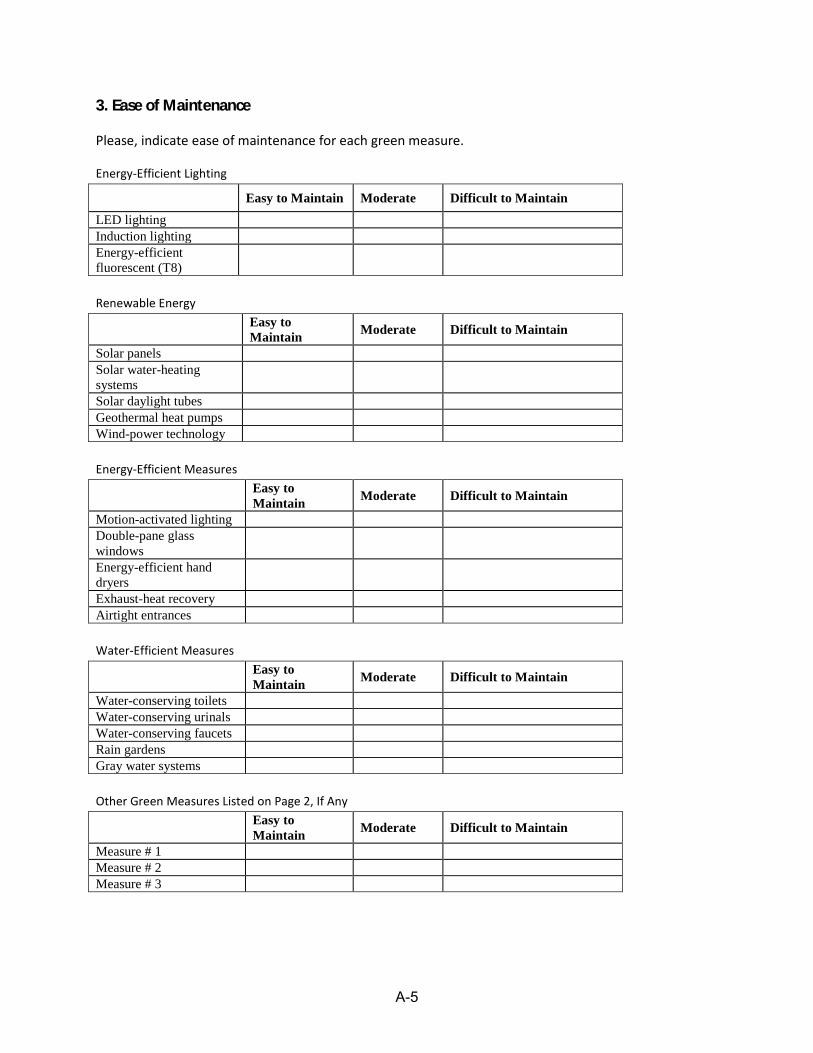
A-5
3. Ease of Maintenance
Please, indicate ease of maintenance for each green measure.
Energy-Efficient Lighting
Easy to Maintain Moderate Difficult to Maintain LED lighting Induction lighting Energy-efficient fluorescent (T8)
Renewable Energy
Easy to Maintain Moderate Difficult to Maintain
Solar panels Solar water-heating systems
Solar daylight tubes Geothermal heat pumps Wind-power technology Energy-Efficient Measures
Easy to Maintain Moderate Difficult to Maintain
Motion-activated lighting Double-pane glass windows
Energy-efficient hand dryers
Exhaust-heat recovery Airtight entrances Water-Efficient Measures
Easy to Maintain Moderate Difficult to Maintain
Water-conserving toilets Water-conserving urinals Water-conserving faucets Rain gardens Gray water systems Other Green Measures Listed on Page 2, If Any
Easy to Maintain Moderate Difficult to Maintain
Measure # 1 Measure # 2 Measure # 3

A-6
4. Encountered Operational Problems and Repair Cost
Please, list encountered problems and actual/estimated repair costs for each green measure, if available.
Energy-Efficient Lighting
Encountered Problems Repair Costs ($) LED lighting Induction lighting Energy-efficient fluorescent (T8)
Renewable Energy
Encountered Problems Repair Costs ($) Solar panels Solar water-heating systems
Solar daylight tubes Geothermal heat pumps Wind-power technology Energy-Efficient Measures
Encountered Problems Repair Costs ($) Motion-activated lighting Double-pane glass windows
Energy-efficient hand dryers
Exhaust-heat recovery Airtight entrances Water-Efficient Measures
Encountered Problems Repair Costs ($) Water-conserving toilets Water-conserving urinals Water-conserving faucets Rain gardens Gray water systems Other Green Measures Listed on Page 2, If Any
Encountered Problems Repair Costs ($) Measure # 1 Measure # 2 Measure # 3

A-7
5. Energy Savings
Please input the average reduction in electricity/water use and expected payback period for each green measure, if known.
Energy-Efficient Lighting
Reduction in Electricity Use (%) Expected Payback Period (yr) LED lighting Induction lighting Energy-efficient fluorescent (T8)
Renewable Energy
Reduction in Electricity Use (%) Expected Payback Period (yr) Solar panels Solar water-heating systems
Solar daylight tubes Geothermal heat pumps Wind-power technology Energy-Efficient Measures
Reduction in Electricity Use (%) Expected Payback Period (yr) Motion-activated lighting Double-pane glass windows
Energy-efficient hand dryers
Exhaust-heat recovery Airtight entrances Water-Efficient Measures
Reduction in Water Use (%) Expected Payback Period (yr) Water-conserving toilets Water-conserving urinals Water-conserving faucets Rain gardens Gray water systems Other Green Measures Listed on Page 2, If Any
Reduction in Electricity/Water Use (%) Expected Payback Period
Measure # 1 Measure # 2 Measure # 3
6. Sharing Information and Results

A-8
1) Are you willing to provide more information, if needed?
( ) Yes
( ) No
2) Are you interested to receive the main findings of this survey upon completion?
( ) Yes
( ) No
7. Thank You!
Thank you for taking our survey. Your response is very important to us.
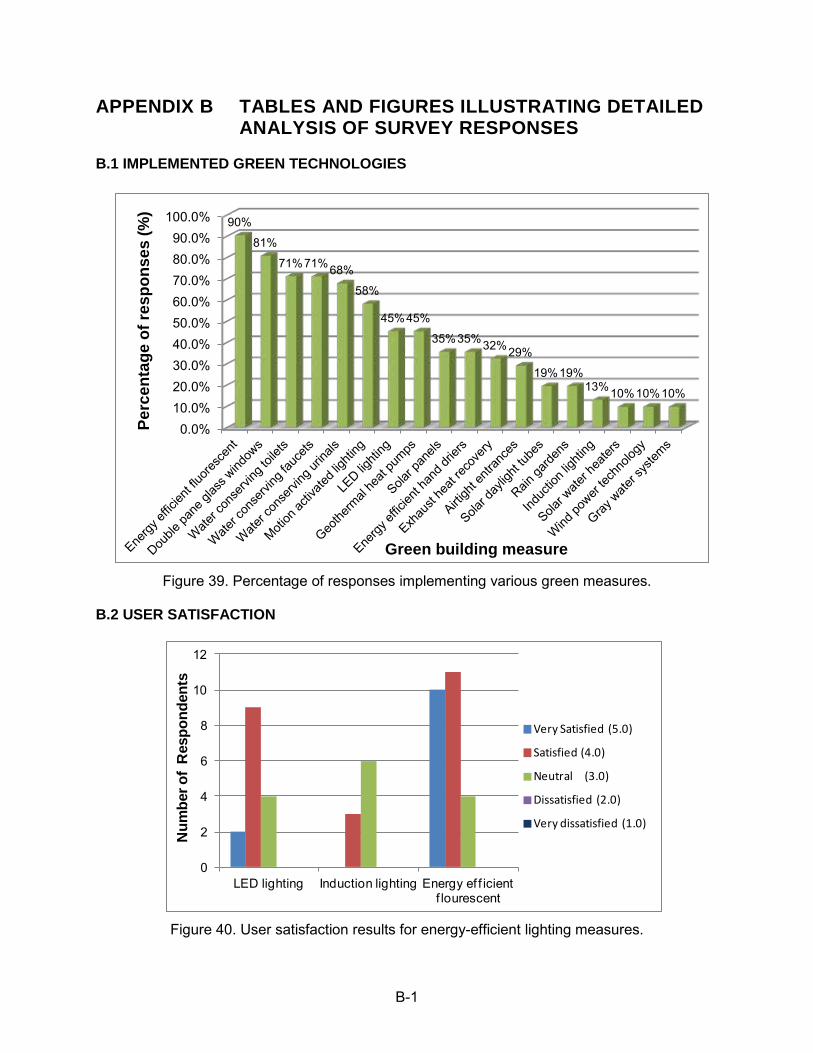
B-1
APPENDIX B TABLES AND FIGURES ILLUSTRATING DETAILED ANALYSIS OF SURVEY RESPONSES
B.1 IMPLEMENTED GREEN TECHNOLOGIES
Figure 39. Percentage of responses implementing various green measures.
B.2 USER SATISFACTION
Figure 40. User satisfaction results for energy-efficient lighting measures.
0.0%10.0%20.0%30.0%40.0%50.0%60.0%70.0%80.0%90.0%
100.0% 90%
81%
71% 71% 68%
58%
45% 45%
35% 35% 32% 29%
19% 19% 13% 10% 10% 10%
Perc
enta
ge o
f res
pons
es (%
)
Green building measure
0
2
4
6
8
10
12
LED lighting Induction lighting Energy ef f icient f lourescent
Very Satisfied (5.0)
Satisfied (4.0)
Neutral (3.0)
Dissatisfied (2.0)
Very dissatisfied (1.0)
Num
ber o
f R
espo
nden
ts

B-2
Figure 41. User satisfaction results for renewable energy.
Figure 42 User satisfaction results for energy-efficient measures.
Figure 43. User satisfaction results for water-efficient measures.
0
1
2
3
4
5
6
7
8
Solar panels
Solar water heaters
Solar daylight tubes
Geothermal heat pumps
Wind power technology
Very Satisf ied (5.0)
Satisf ied (4.0)
Neutral (3.0)
Dissatisf ied (2.0)
Very dissatisf ied (1.0)N
umbe
r of
Res
pond
ents
0
2
4
6
8
10
12
14
Motion activated lighting
Double pane glass windows
Energy ef f icient
hand driers
Exhaust heat
recovery
Airtight entrances
Very Satisf ied (5.0)
Satisf ied (4.0)
Neutral (3.0)
Dissatisf ied (2.0)
Very dissatisf ied (1.0)Num
ber o
f R
espo
nden
ts
0
2
4
6
8
10
12
14
Water conserving
toilets
Water conserving
urinals
Water conserving
faucets
Rain gardens
Gray water systems
Very Satisf ied (5.0)
Satisf ied (4.0)
Neutral (3.0)
Dissatisf ied (2.0)
Very dissatisf ied (1.0)Num
ber o
f R
espo
nden
ts
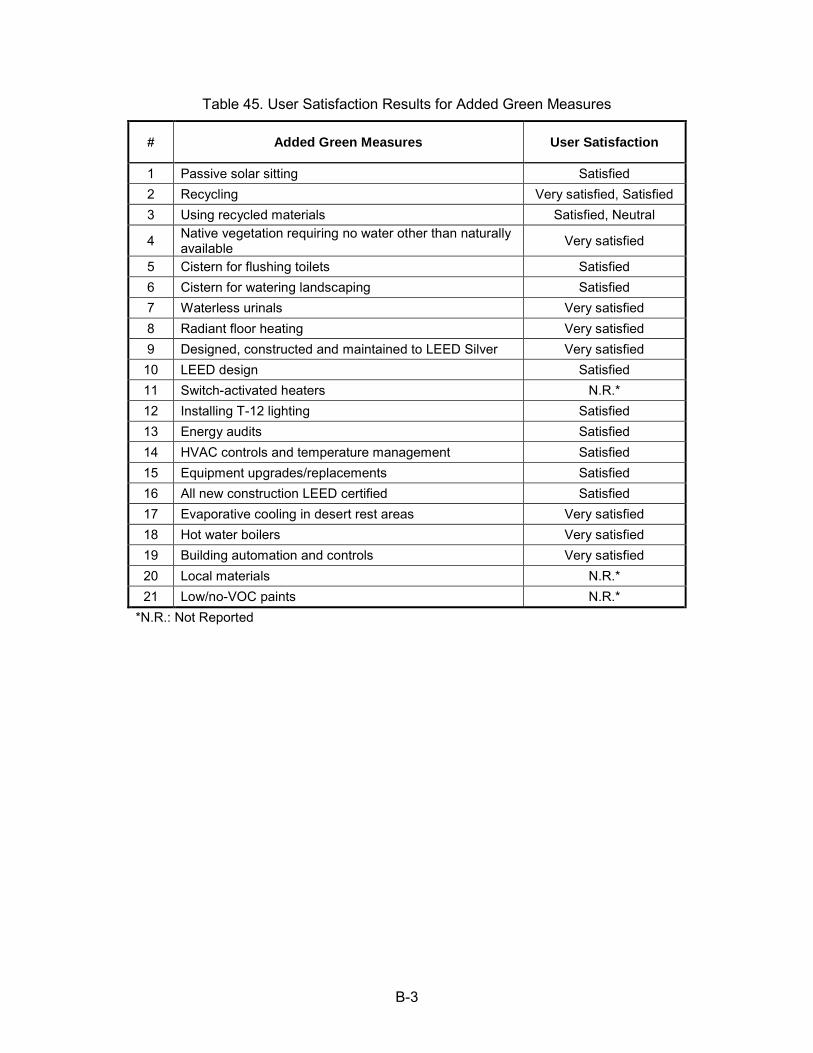
B-3
Table 45. User Satisfaction Results for Added Green Measures
# Added Green Measures User Satisfaction
1 Passive solar sitting Satisfied 2 Recycling Very satisfied, Satisfied 3 Using recycled materials Satisfied, Neutral
4 Native vegetation requiring no water other than naturally available Very satisfied
5 Cistern for flushing toilets Satisfied 6 Cistern for watering landscaping Satisfied 7 Waterless urinals Very satisfied 8 Radiant floor heating Very satisfied 9 Designed, constructed and maintained to LEED Silver Very satisfied 10 LEED design Satisfied 11 Switch-activated heaters N.R.* 12 Installing T-12 lighting Satisfied 13 Energy audits Satisfied 14 HVAC controls and temperature management Satisfied 15 Equipment upgrades/replacements Satisfied 16 All new construction LEED certified Satisfied 17 Evaporative cooling in desert rest areas Very satisfied 18 Hot water boilers Very satisfied 19 Building automation and controls Very satisfied 20 Local materials N.R.* 21 Low/no-VOC paints N.R.*
*N.R.: Not Reported

B-4
Table 46. User Satisfaction Results for Green-Friendly Measures and Technologies
Measures category Energy-Efficient Lighting
Very Satisfied
(5.0) Satisfied
(4.0) Neutral
(3.0) Dissatisfied
(2.0) Very
Dissatisfied (1.0)
Number of Responses
Average Satisfaction (1.0 To 5.0)
Ene
rgy-
effic
ient
lig
htin
g LED lighting 13% 60% 27% 0% 0% 15 3.9 Induction lighting 0% 33% 67% 0% 0% 9 3.3 Energy-efficient fluorescent 40% 44% 16% 0% 0% 25 4.2
Ren
ewab
le
ener
gy
Solar panels 8% 50% 42% 0% 0% 12 3.7 Solar water heaters 25% 25% 25% 25% 0% 4 3.5 Solar daylight tubes 43% 29% 29% 0% 0% 7 4.1 Geothermal heat pumps 29% 50% 21% 0% 0% 14 4.1 Wind-power technology 0% 0% 33% 33% 33% 3 2.0
Ene
rgy-
effic
ient
m
easu
res
Motion-activated lighting 24% 65% 6% 6% 0% 17 4.1 Double-pane glass windows 35% 57% 9% 0% 0% 23 4.3 Energy-efficient hand dryers 7% 79% 14% 0% 0% 14 3.9
Exhaust-heat recovery 36% 45% 18% 0% 0% 11 4.2 Airtight entrances 27% 45% 27% 0% 0% 11 4.0
Wat
er-e
ffici
ent
mea
sure
s
Water-conserving toilets 24% 57% 14% 5% 0% 21 4.0 Water-conserving urinals 14% 59% 27% 0% 0% 22 3.9 Water-conserving faucets 25% 60% 10% 5% 0% 20 4.1 Rain gardens 0% 50% 33% 17% 0% 6 3.3 Gray water systems 33% 0% 67% 0% 0% 3 3.7

B-5
B.3 EASE OF MAINTENANCE
Table 47. Ease-of-Maintenance Results for Green-Friendly Measures and Technologies
Measures Category Green Measure
Easy to Maintain
(3.0) Moderate
(2.0) Difficult to Maintain
(1.0) Number of Responses
Average Ease of Maintenance
(1.0 to 3.0)
Ene
rgy-
effic
ient
lig
htin
g LED lighting 83% 17% 0% 12 2.8 Induction lighting 75% 25% 0% 4 2.8 Energy-efficient fluorescent 80% 20% 0% 25 2.8
Ren
ewab
le
ener
gy
Solar panels 30% 60% 10% 10 2.2 Solar water heaters 33% 33% 33% 3 2.0 Solar daylight tubes 83% 0% 17% 6 2.7 Geothermal heat pumps 36% 55% 9% 11 2.3 Wind-power technology 33% 0% 67% 3 1.7
Ene
rgy-
effic
ient
m
easu
res
Motion-activated lighting 71% 29% 0% 17 2.7 Double-pane glass windows 74% 26% 0% 23 2.7 Energy-efficient hand dryers 43% 50% 7% 14 2.4 Exhaust-heat recovery 60% 40% 0% 10 2.6 Airtight entrances 60% 20% 20% 10 2.4
Wat
er-e
ffici
ent
mea
sure
s
Water-conserving toilets 52% 48% 0% 21 2.5 Water-conserving urinals 33% 67% 0% 21 2.3 Water-conserving faucets 57% 38% 5% 21 2.5 Rain gardens 25% 25% 50% 4 1.8 Gray water systems 0% 100% 0% 1 2.0
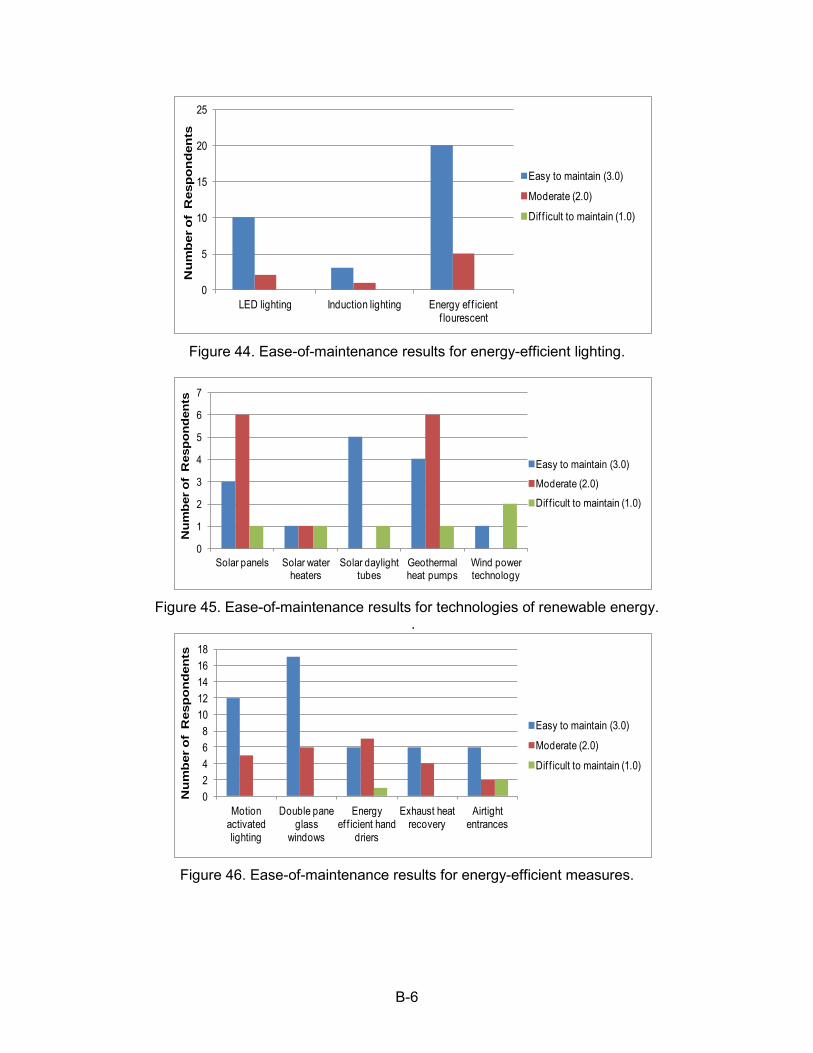
B-6
Figure 44. Ease-of-maintenance results for energy-efficient lighting.
Figure 45. Ease-of-maintenance results for technologies of renewable energy.
.
Figure 46. Ease-of-maintenance results for energy-efficient measures.
0
5
10
15
20
25
LED lighting Induction lighting Energy ef f icient f lourescent
Easy to maintain (3.0)
Moderate (2.0)
Dif f icult to maintain (1.0)
Nu
mb
er o
f R
esp
on
den
ts
0
1
2
3
4
5
6
7
Solar panels Solar water heaters
Solar daylight tubes
Geothermal heat pumps
Wind power technology
Easy to maintain (3.0)
Moderate (2.0)
Dif f icult to maintain (1.0)
Num
ber o
f R
espo
nden
ts
02468
1012141618
Motion activated lighting
Double pane glass
windows
Energy ef f icient hand
driers
Exhaust heat recovery
Airtight entrances
Easy to maintain (3.0)
Moderate (2.0)
Dif f icult to maintain (1.0)
Nu
mb
er o
f R
esp
on
den
ts

B-7
Figure 47. Ease-of-maintenance results for water-efficient measures.
Table 48. Ease-of-Maintenance Results for Added Measures
# Added Green Measures Ease-of-Maintenance Level
1 Passive solar sitting Easy to maintain 2 Recycling Easy to maintain 3 Using recycled materials Easy to maintain
4 Native vegetation requiring no water other than naturally available Easy to maintain
5 Cistern for flushing toilets Moderate 6 Cistern for watering landscaping Moderate 7 Waterless urinals Moderate 8 Radiant floor heating Moderate 9 Designed, constructed and maintained to LEED Silver Moderate 10 LEED design Moderate 11 Switch-activated heaters N.R.* 12 Installing T-12 lighting Easy to maintain 13 Energy audits Moderate 14 HVAC controls and temperature management Easy to maintain, moderate 15 Equipment upgrades/replacements Moderate 16 All new construction LEED certified Easy to maintain 17 Evaporative cooling in desert rest areas Easy to maintain 18 Hot water boilers Easy to maintain 19 Building automation and controls Easy to maintain 20 Local materials N.R.* 21 Low/no VOC paints N.R.* *N.R.: Not Reported
0
2
4
6
8
10
12
14
16
Water conserving
toilets
Water conserving
urinals
Water conserving
faucets
Rain gardens Gray water systems
Easy to maintain (3.0)
Moderate (2.0)
Dif f icult to maintain (1.0)
Num
ber o
f R
espo
nden
ts

B-8
B.4 OPERATIONAL PROBLEMS AND REPAIR COSTS
Table 49. Operation Problems and Repair Costs for Added Measures
# Added Green Measure Encountered Problems Repair Cost ($)
1 Passive solar sitting Unable to purchase solar louvers. N.R.* 2 Recycling None N.R.* 3 Using recycled materials None N.R.*
4 Native vegetation requiring no water other than naturally available None N.R.*
5 Cistern for flushing toilets Pump system that has been hit by lighting N.R.*
6 Cistern for watering landscaping No meter on this system to know amount of water collected. N.R.*
7 Waterless urinals
Cartridge must be changed after certain number of uses, and waste piping must be flushed out on a regular basis to avoid build up.
N.R.*
8 Radiant floor heating None N.R.*
9 Designed, constructed and maintained to LEED Silver None N.R.*
10 LEED design Added cost and effort during design and construction N.R.*
11 Switch-activated heaters None N.R.* 12 Installing T-12 lighting None N.R.* 13 Energy audits None N.R.*
14 HVAC controls and temperature management None N.R.*
15 Equipment upgrades/replacements None N.R.* 16 All new construction LEED certified None N.R.* 17 Evaporative cooling in desert rest areas Regular maintenance N.R.* 18 Hot water boilers No problems N.R.* 19 Building automation and controls Operator error N.R.* 20 Local materials None N.R.* 21 Low/no VOC paints None N.R.* *N.R.: Not Reported
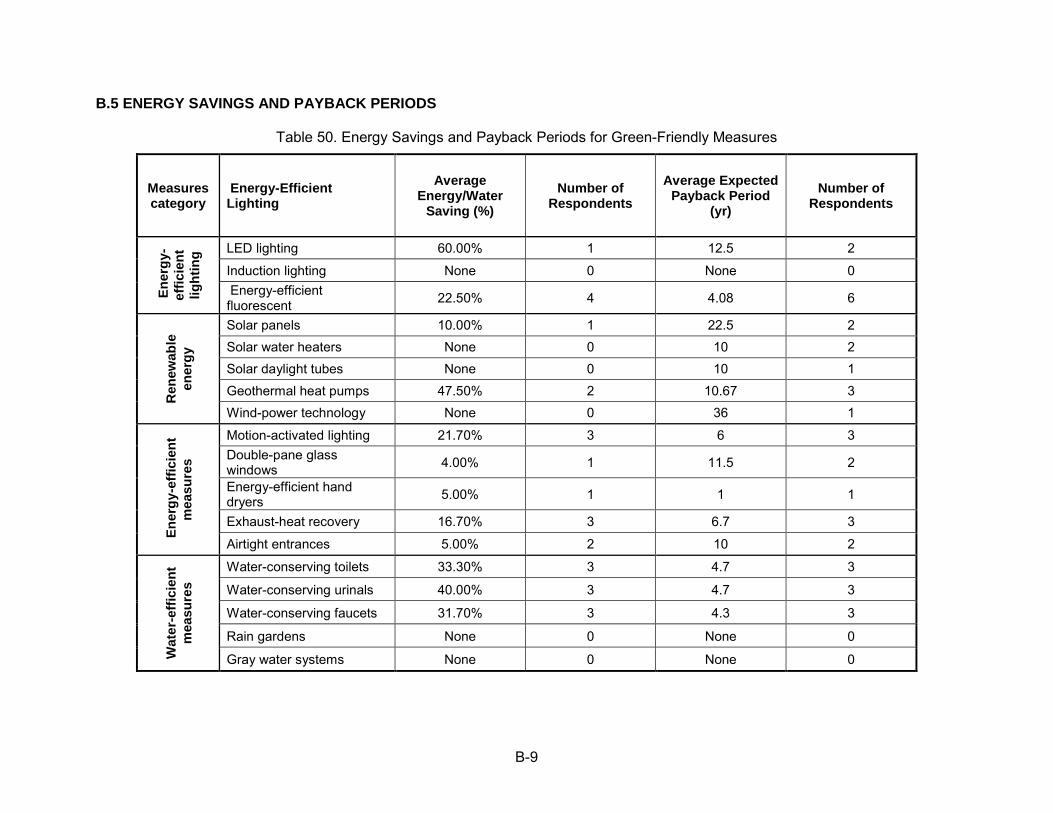
B-9
B.5 ENERGY SAVINGS AND PAYBACK PERIODS
Table 50. Energy Savings and Payback Periods for Green-Friendly Measures
Measures category
Energy-Efficient Lighting
Average Energy/Water
Saving (%) Number of
Respondents Average Expected
Payback Period (yr)
Number of Respondents
Ene
rgy-
effic
ient
lig
htin
g LED lighting 60.00% 1 12.5 2
Induction lighting None 0 None 0 Energy-efficient fluorescent 22.50% 4 4.08 6
Ren
ewab
le
ener
gy
Solar panels 10.00% 1 22.5 2 Solar water heaters None 0 10 2 Solar daylight tubes None 0 10 1 Geothermal heat pumps 47.50% 2 10.67 3 Wind-power technology None 0 36 1
Ene
rgy-
effic
ient
m
easu
res
Motion-activated lighting 21.70% 3 6 3 Double-pane glass windows 4.00% 1 11.5 2
Energy-efficient hand dryers 5.00% 1 1 1
Exhaust-heat recovery 16.70% 3 6.7 3
Airtight entrances 5.00% 2 10 2
Wat
er-e
ffici
ent
mea
sure
s
Water-conserving toilets 33.30% 3 4.7 3
Water-conserving urinals 40.00% 3 4.7 3
Water-conserving faucets 31.70% 3 4.3 3
Rain gardens None 0 None 0
Gray water systems None 0 None 0

B-10
Table 51. Energy Savings and Payback Periods for Added Measures
# Added Green Measure Energy/Water Savings (%)
Payback Period (yr)
1 Passive solar sitting N.R.* N.R.* 2 Recycling N.R.* N.R.* 3 Using recycled materials N.R.* N.R.*
4 Native vegetation requiring no water other than naturally available
N.R.* N.R.*
5 Cistern for flushing toilets N.R.* N.R.* 6 Cistern for watering landscaping N.R.* N.R.* 7 Waterless urinals N.R.* N.R.* 8 Radiant floor heating N.R.* N.R.* 9 Designed, constructed and maintained to LEED Silver N.R.* N.R.*
10 LEED design N.R.* N.R.* 11 Switch-activated heaters N.R.* N.R.* 12 Installing T-12 lighting N.R.* N.R.* 13 Energy audits 20% 10 14 HVAC controls and temperature management N.R.* N.R.* 15 Equipment upgrades/replacements N.R.* N.R.* 16 All new construction LEED certified N.R.* N.R.* 17 Evaporative cooling in desert rest areas N.R.* N.R.* 18 Hot water boilers 35% 3 19 Building automation and controls 25% 5 20 Local materials N.R.* N.R.* 21 Low/no VOC paints N.R.* N.R.* *N.R.: Not Reported
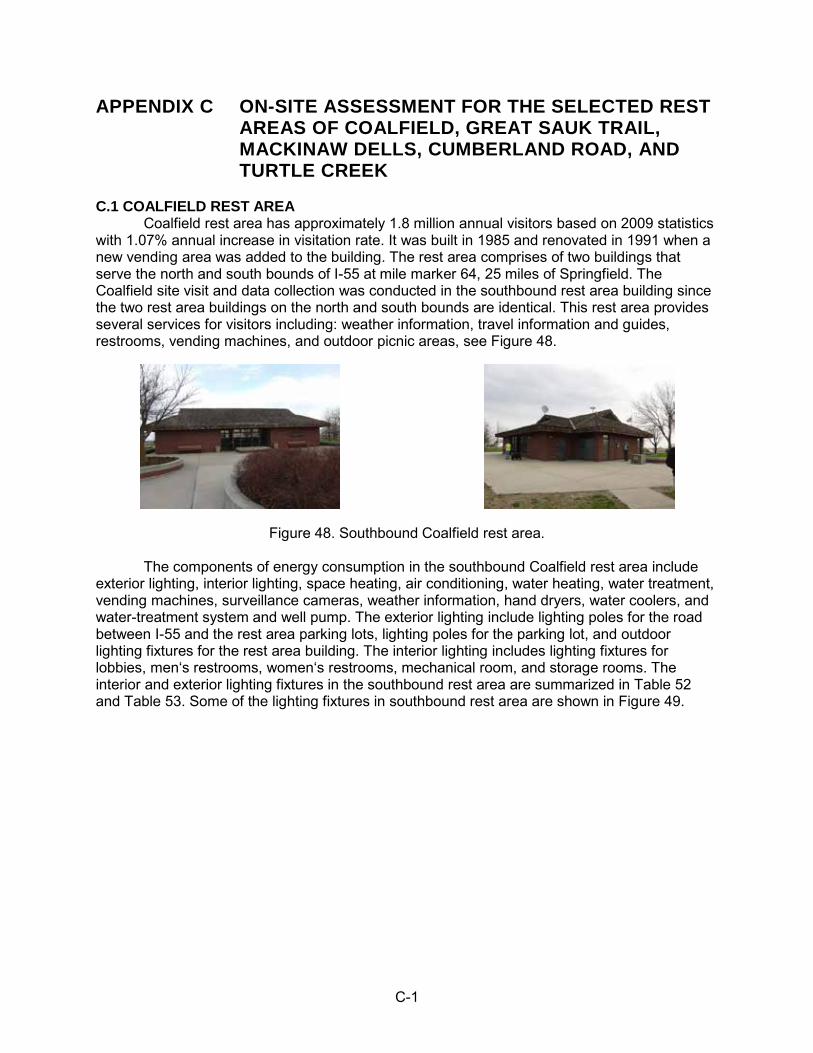
C-1
APPENDIX C ON-SITE ASSESSMENT FOR THE SELECTED REST AREAS OF COALFIELD, GREAT SAUK TRAIL, MACKINAW DELLS, CUMBERLAND ROAD, AND TURTLE CREEK
C.1 COALFIELD REST AREA
Coalfield rest area has approximately 1.8 million annual visitors based on 2009 statistics with 1.07% annual increase in visitation rate. It was built in 1985 and renovated in 1991 when a new vending area was added to the building. The rest area comprises of two buildings that serve the north and south bounds of I-55 at mile marker 64, 25 miles of Springfield. The Coalfield site visit and data collection was conducted in the southbound rest area building since the two rest area buildings on the north and south bounds are identical. This rest area provides several services for visitors including: weather information, travel information and guides, restrooms, vending machines, and outdoor picnic areas, see Figure 48.
Figure 48. Southbound Coalfield rest area.
The components of energy consumption in the southbound Coalfield rest area include
exterior lighting, interior lighting, space heating, air conditioning, water heating, water treatment, vending machines, surveillance cameras, weather information, hand dryers, water coolers, and water-treatment system and well pump. The exterior lighting include lighting poles for the road between I-55 and the rest area parking lots, lighting poles for the parking lot, and outdoor lighting fixtures for the rest area building. The interior lighting includes lighting fixtures for lobbies, men‘s restrooms, women‘s restrooms, mechanical room, and storage rooms. The interior and exterior lighting fixtures in the southbound rest area are summarized in Table 52 and Table 53. Some of the lighting fixtures in southbound rest area are shown in Figure 49.

C-2
Table 52. Interior Lighting in Coalfield Rest Area
Location Type of Lighting Fixture Quantity Lamp(s)
per Fixture
Characteristics
Sout
hbou
nd
Lobby square fluorescent fixture 12 2 U-shape fluorescent lamp rectangular fluorescent fixture 2 2 4' GE F34 CW-RS-WM ECO
Men's restrooms
square fluorescent fixture 2 2 U-shape fluorescent lamp rectangular fluorescent fixture 2 2 4' GE F34 CW-RS-WM ECO
Women's restrooms
square fluorescent fixture 2 2 U-shape fluorescent lamp rectangular fluorescent fixture 4 2 4' GE F34 CW-RS-WM ECO
Mechanical rooms rectangular fluorescent fixture 6 2 4' (2 GE F40 CW-RS-WM 34W
and 10 F34 CW-RS-WM-ECO)
Storage rooms rectangular fluorescent fixture 4 2
4' GE F34 CW-RS-WM ECO, vendors come once per day for 2 hours
Well room light fixture 6 1 100 watt light bulb, 15~20 min. per day
Table 53. Exterior Lighting in Coalfield Rest Area
Location Type of Lighting Fixture Quantity
Lamp(s) Per
Fixture Characteristics
Sout
hbou
nd Entrance and
exit wall light fixture 6 1 HPS 400 watts
Building recessed light fixture 10 1 HPS 70 watts
Parking lot lighting tower 1 2 8 HPS 400 watts lighting tower 2 1 2 HPS 400 watts
Figure 49. Lighting fixtures in southbound Coalfield rest area.
The southbound Coalfield rest area is heated and air-conditioned using two furnaces
and two air-cooled condensing units, which use electricity. One furnace and air-condensing unit are used for heating and cooling the vending area of the southbound building while the other furnace and air-cooled condensing unit are used for the rest of the building. Both furnaces have a capacity of 119.4 MBH and both air-cooled condensing units have a capacity of 7.5 tons. An electrical water heater is used for each bound of the rest area to heat water with a capacity of 40 gallons. Air-conditioning units and water heater are shown in Figure 50.

C-3
Figure 50. Air-conditioning units and water heater in Coalfield rest area.
The southbound rest area has six vending machines: three for drinks, two for snacks,
and one for coffee, as shown in Figure 51. Seven Surveillance cameras are used in the southbound rest area to maintain safety for visitors, and interior lighting is needed all the time for these cameras to ensure the clarity of video recording. The weather information is provided using a television in the lobby. Three Code Blue emergency phones are available in southbound of the rest areas: one in the lobby, one in the cars parking lot, and one in the trucks parking lot. The southbound building also includes a refrigerator, a vacuum cleaner, a computer for surveillance cameras, and two fans in the maintenance room.
Figure 51. Vending machines in Coalfield rest area.
The men‘s and women‘s restrooms of the southbound include four hand dryers, where
each has 2200 watt electrical capacity. Two water coolers are available in the lobby of the southbound rest area to provide cold drinking water for visitors. Hand dryers and water coolers are shown in Figure 52. Other water consumption fixtures in the southbound Coalfield rest area include faucets, urinals and toilets, as shown in Figure 53. The quantities and characteristics of water fixtures in the southbound rest area are shown in Table 54.
Furnace Air-cooled condensing units Water heater

C-4
Figure 52. Hand dryers and water coolers in southbound Coalfield rest area.
Table 54. Water Fixtures in Coalfield Rest Area
Location Type of Water Fixture Quantity Characteristics
Sout
hbou
nd
Men's restrooms Faucets 2 Electronic faucets Toilets 3 aqua flush, ZURN Urinals 2 Manual flush
Women's restrooms Faucets 2 Electronic faucets Toilets 5 aqua flush, ZURN
Figure 53. Water fixtures in Coalfield rest area.
C.2 GREAT SAUK TRAIL REST AREA
Great Sauk Trail rest area has approximately 980 thousand annual visitors based on 2009 statistics, and it was built in 1969 and renovated in 1989. The rest area comprises of two buildings that serve the east and west bounds of I-80 at mile marker 51, 5 miles west of Princeton. The Great Sauk Trail site visit and data collection was conducted in the westbound rest area building since the two rest area buildings on the east and west bounds are identical. This rest area provides several services for visitors including: weather information, travel information and guides, restrooms, vending machines, and outdoor picnic areas, see Figure 54.

C-5
Figure 54. Westbound Great Sauk Trail rest area.
The components of energy consumption in the westbound Great Sauk Trail rest area include exterior lighting, interior lighting, space heating, air conditioning, water heater, vending machines, surveillance cameras, weather information, hand dryers, water coolers, and water-treatment system and well pump. The exterior lighting include lighting poles for the road between I-80 and the rest area parking lots, lighting poles for the parking lot, and outdoor lighting fixtures for the rest area building. The interior lighting includes lighting fixtures for lobbies, men‘s restrooms, women‘s restrooms, mechanical room, and storage rooms. The interior and exterior lighting fixtures in the westbound rest area are summarized in Table 55 and Table 56. Some lighting fixtures for westbound rest area are shown in Figure 55.
Table 55. Interior Lighting for Great Sauk Trail Rest Area
Location Type of Lighting Fixture Quantity
Lamp(s) per
Fixture Characteristics
Wes
tbou
nd
Lobby recessed fixture 24 1 50 watt light bulb rectangular fluorescent fixture 6 2 4' Philips F32T8/TL741 32 watts
Men's restroom rectangular fluorescent fixture 11 2 4' Philips F32T8/TL741 32 watts
Women's restroom
rectangular fluorescent fixture 11 2 4' Philips F32T8/TL741 32 watts
Restroom storage surface light fixture 2 1 Energy-saving bulb 23 watts
Mechanical room rectangular fluorescent fixture 5 2 4' Philips F32T8/TL741 32 watts
Surface light fixture 7 1 Energy-saving bulb 23 watts
Vending storage rectangular fluorescent fixture 4 2 4' Philips F32T8/TL741 32 watts
surface light fixture 4 1 75 watt light bulb
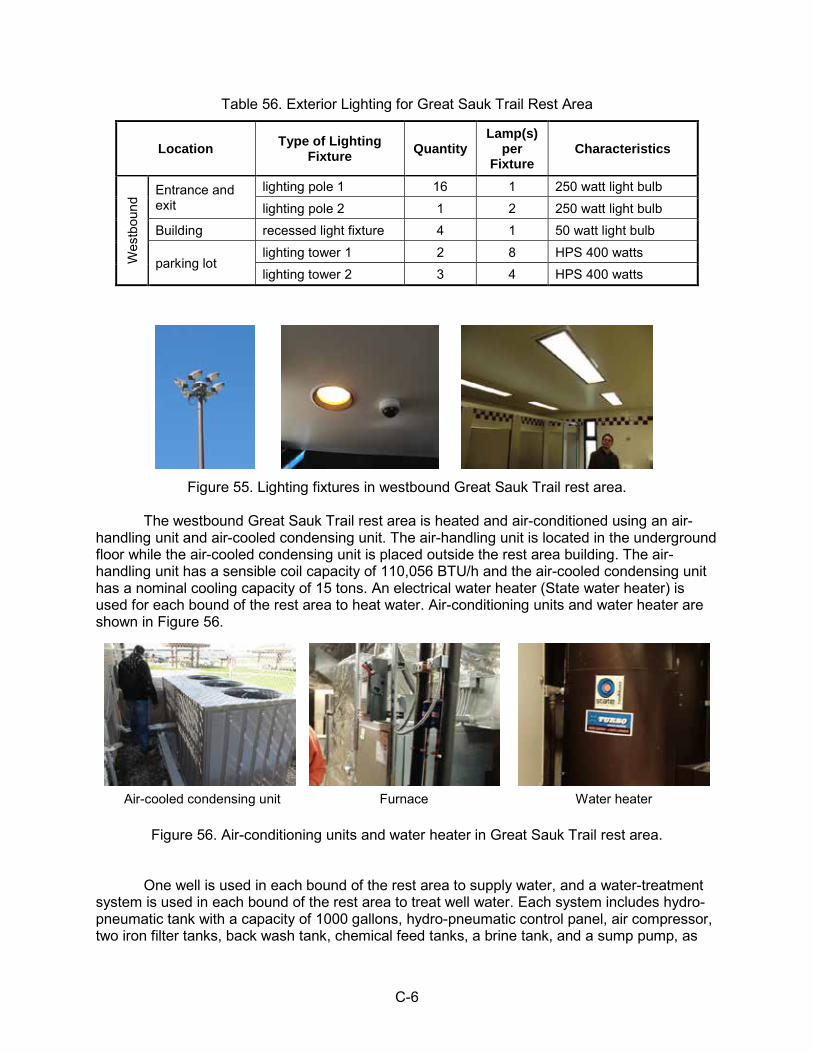
C-6
Table 56. Exterior Lighting for Great Sauk Trail Rest Area
Location Type of Lighting Fixture Quantity
Lamp(s) per
Fixture Characteristics
Wes
tbou
nd Entrance and
exit lighting pole 1 16 1 250 watt light bulb lighting pole 2 1 2 250 watt light bulb
Building recessed light fixture 4 1 50 watt light bulb
parking lot lighting tower 1 2 8 HPS 400 watts lighting tower 2 3 4 HPS 400 watts
Figure 55. Lighting fixtures in westbound Great Sauk Trail rest area.
The westbound Great Sauk Trail rest area is heated and air-conditioned using an air-
handling unit and air-cooled condensing unit. The air-handling unit is located in the underground floor while the air-cooled condensing unit is placed outside the rest area building. The air-handling unit has a sensible coil capacity of 110,056 BTU/h and the air-cooled condensing unit has a nominal cooling capacity of 15 tons. An electrical water heater (State water heater) is used for each bound of the rest area to heat water. Air-conditioning units and water heater are shown in Figure 56.
Figure 56. Air-conditioning units and water heater in Great Sauk Trail rest area.
One well is used in each bound of the rest area to supply water, and a water-treatment
system is used in each bound of the rest area to treat well water. Each system includes hydro-pneumatic tank with a capacity of 1000 gallons, hydro-pneumatic control panel, air compressor, two iron filter tanks, back wash tank, chemical feed tanks, a brine tank, and a sump pump, as
Air-cooled condensing unit Furnace Water heater

C-7
shown in Figure 57. The westbound rest area has contains six vending machines; three for drinks, two for snacks, and one for hot drinks, as shown in Figure 58. Seven Surveillance cameras are used in the westbound rest area to maintain safety for visitors, and interior lighting is needed all the time for these cameras in order to ensure clarity of video recording. The weather information is provided using a television in the lobby. Four Code Blue emergency phones are available in westbound of the rest areas: one in the lobby, and three in the parking lot of the rest area building. The westbound building also includes a small refrigerator, microwave, humidifier, toaster, and a computer for surveillance cameras in the maintenance room. The vending storage includes a refrigerator and an electric heater unit.
Figure 57. Water-treatment system components in Great Sauk Trail rest area.
Figure 58. Vending machines in Great Sauk Trail rest area.
The men‘s and women‘s restrooms of the southbound include eight hand dryers, where each has 2300 watt electrical capacity. Two water coolers are available in the lobby of the westbound rest area to provide cold drinking water for visitors. Hand dryers and water coolers are shown in Figure 59. Other water consumption fixtures in the westbound Great Sauk Trail rest area include faucets, urinals and toilets, as shown in Figure 60. The quantities and characteristics of water fixtures in the westbound rest area are shown in Table 57.
Pressure tank Air pump Iron filter tanks Well sump

C-8
Figure 59. Hand dryers and water coolers in westbound Great Sauk Trail rest area.
Table 57. Water Fixtures in Great Sauk Trail Rest Area
Location Type of Water Fixture Quantity Characteristics
Wes
tbou
nd
Men's restrooms Faucets 4 Electronic low-flow faucet Toilets 4 American standard 3.5 gpf Urinals 3 American standard 1 gpf
Women's restrooms Faucets 4 Electronic low-flow faucet Toilets 6 American standard 3.5 gpf
Figure 60. Water fixtures in Great Sauk Trail rest area.
C.3 MACKINAW DELLS REST AREA Mackinaw Dells rest area has approximately 1.54 million annual visitors based on 2009
statistics with annual increase of 0.18%. The rest area comprises of two buildings that serve the south and north bounds of I-74 at mile marker 114, 14 miles west of Bloomington. The Mackinaw Dells site visit and data collection was conducted in the southbound rest area building since the two rest area buildings on the north and south bounds are identical. This rest area provides several services for visitors including: travel information, restrooms, vending machines, and outdoor picnic areas, see Figure 61.

C-9
Figure 61. Southbound Mackinaw Dells rest area.
The components of energy consumption in the southbound Mackinaw Dells rest area include exterior lighting, interior lighting, space heating, air conditioning, water heater, vending machines, surveillance cameras, hand dryers, water coolers, and water-treatment system and well pump. The exterior lighting include lighting poles for the road between I-74 and the rest area parking lots, lighting poles for the parking lot, and outdoor lighting fixtures for the rest area building. The interior lighting includes lighting fixtures for lobbies, men‘s restrooms, women‘s restrooms, mechanical room, maintenance room and storage rooms. The interior and exterior lighting fixtures in the southbound rest area are summarized in Table 58 and Table 59. Some lighting fixtures of southbound Mackinaw Dells rest area are shown in Figure 62.
The southbound Mackinaw Dells rest area is heated and air-conditioned using an air handling unit, two water boilers, and two air-cooled condensing units. The air-handling unit and water boilers are located in the underground floor while the air-cooled condensing units are placed outside the rest area building. An electrical water heater (A.O. Smith) is used for each bound of the rest area to heat water with a capacity of 119 gallons. Air-conditioning units and water heater are shown in Figure 63.

C-10
Table 58. Interior Lighting for Mackinaw Dells Rest Area
Location Type of Lighting Fixture Quantity Lamp(s)
per Fixture
Characteristics
Sout
hbou
nd
Lobby
square recessed fixture 14 1 N.A.
rectangular fluorescent fixture 4 1 4' GE F-32T8-SP35-ECO 32 watts
square fluorescent fixture 4 3 4' GE F-32T8-SP35-ECO 32 watts
Vending area rectangular fluorescent fixture 2 2 4' GE F-32T8-SP35-ECO 32 watts
Men's restroom rectangular fluorescent fixture 9 2 4' GE F-32T8-SP35-ECO
32 watts
Women's restroom rectangular fluorescent fixture 9 2 4' GE F-32T8-SP35-ECO
32 watts
Maintenance room rectangular fluorescent fixture 4 2 4' Sylvania F34
CW/SS/ECO 34 watts
Mechanical room
rectangular fluorescent fixture 1 4 2 4' Sylvania F34
CW/SS/ECO 34 watts rectangular fluorescent fixture 2 2 2 4' Philips F40 LW-RS-EW
34 watts Vending storage rectangular fluorescent fixture 7 2 4' Sylvania F34
CW/SS/ECO 34 watts
Table 59. Exterior Lighting for Mackinaw Dells Rest Area
Location Type of Lighting Fixture Quantity Lamp(s)
per Fixture
Characteristics
Sout
hbou
nd
Entrance and exit
light pole 8 1 N.A. wall light fixture 1 1 N.A.
Building square recessed fixture 7 1 Philips 100w, 1480 average
lumens floodlight fixture 4 1 250 watt light bulb
parking lot
lighting tower 1 1 8 N.A. lighting tower 2 1 2 N.A. light pole 3 1 N.A.

C-11
Figure 62. Lighting fixtures in Mackinaw Dells rest area.
Figure 63. Air-conditioning units and water heater in Mackinaw Dells rest area.
One well is used in each bound of the rest area to supply water, and a water-treatment
system is used in each bound of the rest area to treat well water. Each system includes pressure tank, hydro-pneumatic control panel, air compressor, filter tanks, chemical tank, and a sump pump, as shown in Figure 64. The southbound rest area has six vending machines: three for drinks, two for snacks, and one for hot drinks, as shown in Figure 65. Six Surveillance cameras are used in the southbound rest area to maintain safety for visitors, and interior lighting is needed all the time for these cameras in order to ensure clarity of video recording. Three Code Blue emergency phones are available in southbound of the rest areas: one in the lobby, and two in the parking lot of the rest area building. The southbound building also includes two ceiling fans, two electric heater units, a small refrigerator, microwave, and a computer for surveillance cameras in the maintenance room.
Figure 64. Water-treatment system components for Mackinaw Dells rest area.
Furnace Air-cooled condensing unit Water heater
Filter tanks Air pump Chemical tank Hydro-pneumatic panel

C-12
Figure 65. Vending machines in Mackinaw Dells rest area.
The men‘s and women‘s restrooms of the southbound include six hand dryers, where
each has 2300 watt electrical capacity. A water cooler is available in the lobby of the southbound rest area to provide cold drinking water for visitors. Hand dryers and water coolers are shown in Figure 66. Other water consumption fixtures in the southbound Mackinaw Dells rest area include faucets, urinals and toilets, as shown in Figure 67. The quantities and characteristics of water fixtures in the southbound rest area are shown in Table 60.
Figure 66. Hand dryers and water coolers in Mackinaw Dells rest area.
Table 60. Water Fixture in Mackinaw Dells Rest Area
Location Type of Water Fixture Quantity Characteristics
Sout
hbou
nd
Men's restrooms Faucets 4 Electronic low-flow faucet Toilets 3 American standard 1.6 gpf Urinals 2 Aqua flush
Women's restrooms Faucets 4 Electronic low-flow faucet Toilets 5 American standard 1.6 gpf

C-13
Figure 67. Water fixtures in Mackinaw Dells rest area.
C.4 CUMBERLAND ROAD REST AREA Cumberland Road rest area has approximately 608 thousand annual visitors based on
2009 statistics with annual decrease of 1.53%. It was built in 1989 and renovated in 1992. The rest area comprises of one building that serves the south and north bounds of I-70 at mile marker 149, 7 miles west of Indiana line (boarder). This rest area provides several services for visitors including: weather information, travel information and guides, restrooms, vending machines, and outdoor picnic areas, see Figure 68.
Figure 68. Cumberland Road rest area.
The components of energy consumption in Cumberland Road rest area include exterior
lighting, interior lighting, space heating, air conditioning, water heater, vending machines, surveillance cameras, weather information, hand dryers, water coolers, and water-treatment system and well pump. The exterior lighting include lighting poles for the road between I-70 and the rest area parking lot, lighting towers for the parking lot, and outdoor lighting fixtures for the rest area building. The interior lighting includes lighting fixtures for lobbies, men‘s restrooms, women‘s restrooms, information room, garage, attic, mechanical room, and storage room. The interior and exterior lighting fixtures in this rest area are summarized in Table 61 and Table 62. Some lighting fixtures for Cumberland Road rest area are shown in Figure 69.
The Cumberland Road rest area is heated and air-conditioned using a furnace, two air-cooled condensing units, and two exhaust fans. The furnace is located in the storage room while the two air-cooled condensing units are placed outside the rest area building. Two electrical water heaters (Bradford White cooperation, PHCC) are used for the rest area building to heat water with capacities of 30 gallons and 40 gallons. Furnace, air-cooled conditioning units and one water heater are shown in Figure 70.
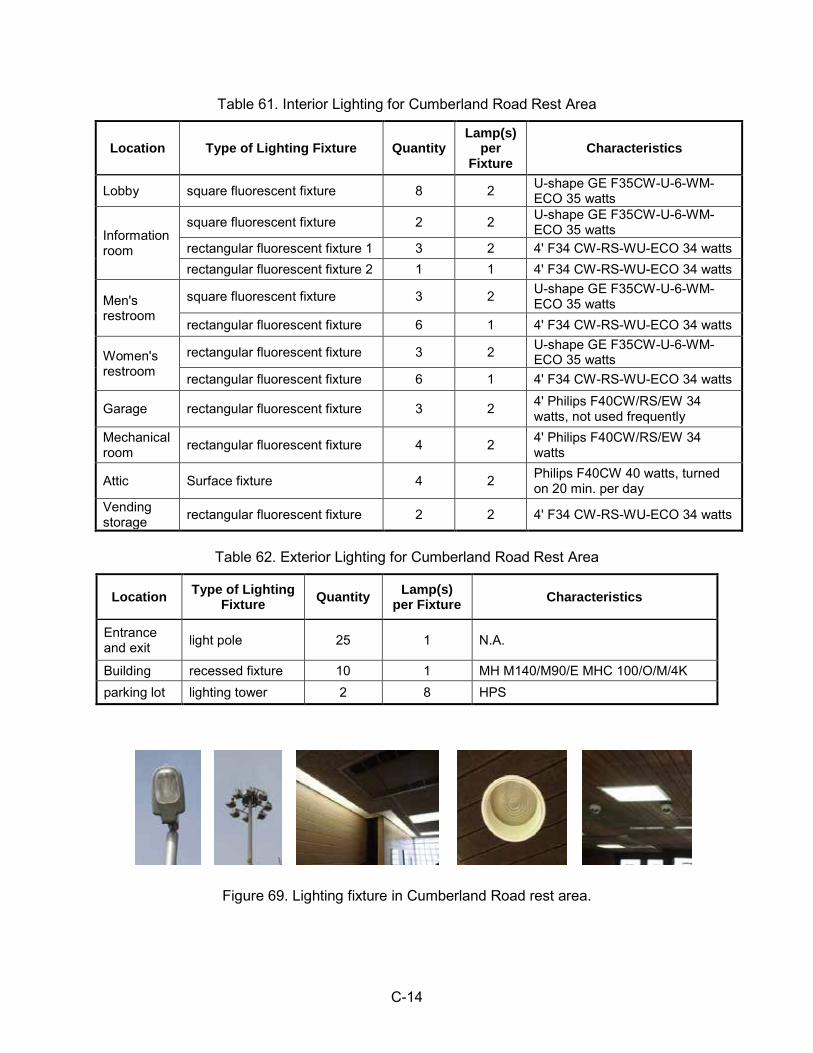
C-14
Table 61. Interior Lighting for Cumberland Road Rest Area
Location Type of Lighting Fixture Quantity Lamp(s)
per Fixture
Characteristics
Lobby square fluorescent fixture 8 2 U-shape GE F35CW-U-6-WM-ECO 35 watts
Information room
square fluorescent fixture 2 2 U-shape GE F35CW-U-6-WM-ECO 35 watts
rectangular fluorescent fixture 1 3 2 4' F34 CW-RS-WU-ECO 34 watts rectangular fluorescent fixture 2 1 1 4' F34 CW-RS-WU-ECO 34 watts
Men's restroom
square fluorescent fixture 3 2 U-shape GE F35CW-U-6-WM-ECO 35 watts
rectangular fluorescent fixture 6 1 4' F34 CW-RS-WU-ECO 34 watts
Women's restroom
rectangular fluorescent fixture 3 2 U-shape GE F35CW-U-6-WM-ECO 35 watts
rectangular fluorescent fixture 6 1 4' F34 CW-RS-WU-ECO 34 watts
Garage rectangular fluorescent fixture 3 2 4' Philips F40CW/RS/EW 34 watts, not used frequently
Mechanical room rectangular fluorescent fixture 4 2 4' Philips F40CW/RS/EW 34
watts
Attic Surface fixture 4 2 Philips F40CW 40 watts, turned on 20 min. per day
Vending storage rectangular fluorescent fixture 2 2 4' F34 CW-RS-WU-ECO 34 watts
Table 62. Exterior Lighting for Cumberland Road Rest Area
Location Type of Lighting Fixture Quantity Lamp(s)
per Fixture Characteristics
Entrance and exit light pole 25 1 N.A.
Building recessed fixture 10 1 MH M140/M90/E MHC 100/O/M/4K parking lot lighting tower 2 8 HPS
Figure 69. Lighting fixture in Cumberland Road rest area.

C-15
Figure 70. Air-conditioning units and water heater in Cumberland Road rest area.
The rest area has six vending machines: three for cold drinks, two for snacks, and one for hot drinks, as shown in Figure 71. Nineteen Surveillance cameras are used inside and outside the rest area building to maintain safety for visitors, and interior lighting is needed all the time for these cameras while exterior lighting is need during the night time in order to ensure clarity of video recording. The weather information is provided using a television in the lobby. Six Code Blue emergency phones are available in the rest area building: one in the building lobby and five in the parking lot. The rest area building also includes a refrigerator, a microwave, a humidifier, a coffee maker, a fan, two vacuum cleaners, an air-conditioning unit, and two computers for surveillance cameras (inside and outside cameras) in the maintenance room.
Figure 71. Vending machines in Cumberland Road rest area.
The men‘s and women‘s restrooms of the southbound include four hand dryers, where
each has 2300 watt electrical capacity. Five water coolers are available in the rest area to provide cold drinking water for visitors: two water coolers are available in the lobby of the rest area building and three water coolers are available outside the building. Hand dryers and water coolers in Cumberland Road rest area are shown in Figure 72. Other water consumption fixtures in the Cumberland Road rest area include faucets, urinals and toilets, as shown in Figure 73. The quantities and characteristics of water fixtures in this rest area are shown in Table 63.

C-16
Figure 72. Hand dryers and water coolers in Cumberland Road rest area.
Table 63. Water Fixture in Cumberland Road Rest Area
Location Type of Water Fixture Quantity Characteristics
Men's restrooms Faucets 3 Electronic low-flow faucet Toilets 3 Electronic 3.5 GPF Urinals 2 Electronic 1.6 GPF
Women's restrooms Faucets 3 Electronic low-flow faucet Toilets 5 Electronic 3.5 GPF
Figure 73. Water fixtures in Cumberland Road rest area.
C.5 TURTLE CREEK REST AREA
Turtle Creek rest area has approximately 839 thousand annual visitors based on 2009 statistics with estimated annual decrease of 1.05%. This rest area was built in 1980 and it comprises of one building that serve the east and west bounds of I-90 at mile marker 2, 2 miles south of Wisconsin line (boarder). This rest area provides several services for visitors including: weather information, travel information and guides, restrooms, vending machines, and outdoor picnic areas, see Figure 74.

C-17
Figure 74. Turtle Creek rest area.
The components of energy consumption on the westbound of Turtle Creek rest area
include exterior lighting, interior lighting, space heating, air conditioning, water heater, vending machines, surveillance cameras, weather information, hand dryers, water coolers, and water-treatment system and well pump. The exterior lighting include lighting poles for the road between I-90 and the rest area parking lot (both ways), lighting towers for the parking lot, and outdoor lighting fixtures for the rest area building. The interior lighting includes lighting fixtures for lobbies, men‘s restrooms, women‘s restrooms, Handicap toilet, mechanical room, and storage rooms. The interior and exterior lighting fixtures in this rest area are summarized in Table 64 and Table 65. Some lighting fixtures in Turtle Creek rest area are shown in Figure 75.
Figure 75. Lighting fixtures in Turtle Creek rest area.

C-18
Table 64. Interior Lighting for Turtle Creek Rest Area
Location Type of Lighting Fixture Quantity Lamp(s) per Fixture Characteristics
Lobby square fluorescent fixture 18 2 U-shape Sylvania Supersaver H018 34 watts
Tourism office
rectangular fluorescent fixture 5 2 4' Philips F30T12/CW/RS/EW-II 25
watts
square fluorescent fixture 2 2 U-shape Sylvania F20T12/CW 20 watts
Men's restroom
square fluorescent fixture 6 2 U-shape Sylvania Supersaver H018 34 watts
rectangular fluorescent fixture 4 4 4' Sylvania F34 CW/SS/ECO 34
watts
Women's restroom
square fluorescent fixture 6 2 U-shape Sylvania Supersaver H018 34 watts
rectangular fluorescent fixture 4 4 4' Sylvania F34 CW/SS/ECO 34
watts Handicap toilet square fluorescent fixture 1 2 U-shape Sylvania Supersaver
H018 34 watts Storage room
rectangular fluorescent fixture 3 2 4' Sylvania F34 CW/SS/ECO 34
watts Mechanical room
rectangular fluorescent fixture 1 4 2 4' Sylvania F34 CW/SS/ECO 34
watts and 4' GE F48 T12-CW-HO
Table 65. Exterior Lighting for Turtle Creek Rest Area
Location Type of Lighting Fixture Quantity Lamp(s)
per Fixture Characteristics
Building recessed fixture 15 1 MH ED17 PMH7100 100 watts parking lot lighting tower 2 6 N.A.

C-19
The Turtle Creek rest area building is heated and air-conditioned using two furnaces, two air-cooled condensing units, and an exhaust fan. The two furnaces are located in the attic of the building while the two air-cooled condensing units are placed outside the rest area building. Each furnace has a HTG coil capacity of 25 KW while each condensing unit has a capacity of 4 tons. A natural gas water heater (State water heater) is used in the rest area building to heat water with a capacity of 100 gallons. Air-conditioning units and water heater are shown in Figure 76.
Figure 76. Air-conditioning units and water heater in Turtle Creek rest area.
One well is used the rest area to supply water, and a water-treatment system is used to
treat well water. The treatment system includes hydro-pneumatic tank, hydro-pneumatic control panel, air compressor, chemical feed tanks, and a sump pump, as shown in Figure 77. The rest area has six vending machines: three for cold drinks, two for snacks, and one for hot drinks, as shown in Figure 78. Seven Surveillance cameras are used in the rest area to maintain safety for visitors inside and outside the rest area building. Interior lighting is needed all the time for these cameras and exterior lighting is needed at night time in order to ensure clarity of video recording. The weather information is provided using a television in the lobby. Four Code Blue emergency phones are available in rest areas: one in the lobby and three in the parking lot of the rest area building. The rest area building also includes a microwave, a kettle, a coffee maker, a cassette, and a computer for surveillance cameras in the maintenance room.
Figure 77. Two components of water-treatment system at the Turtle Creek rest area.
Furnace Air cooled condensing units Water heater
Pressure tank Air pump

C-20
Figure 78. Vending machines in Turtle Creek rest area.
The men‘s and women‘s restrooms on the southbound include eight hand dryers, where each has 2300 watt electrical capacity. Two water coolers are available in the lobby of the rest area building to provide cold drinking water for visitors. Hand dryers and water coolers in Turtle Creek rest area are shown in Figure 79. Other water consumption fixtures in the Turtle Creek rest area include faucets, urinals and toilets, as shown in Figure 80. The quantities and characteristics of water fixtures in this rest area are shown in Table 66.
Figure 79. Hand dryers and water coolers in Turtle Creek rest area.
Table 66. Water Fixtures in Turtle Creek Rest Area
Location Type of Water Fixture Quantity Characteristics
Men's restrooms Faucets 6 Electronic faucet Toilets 6 Electronic 3.5 GPF Urinals 4 Electronic 1.6 GPF
Women's restrooms Faucets 6 Electronic faucet Toilets 10 Electronic 3.5 GPF
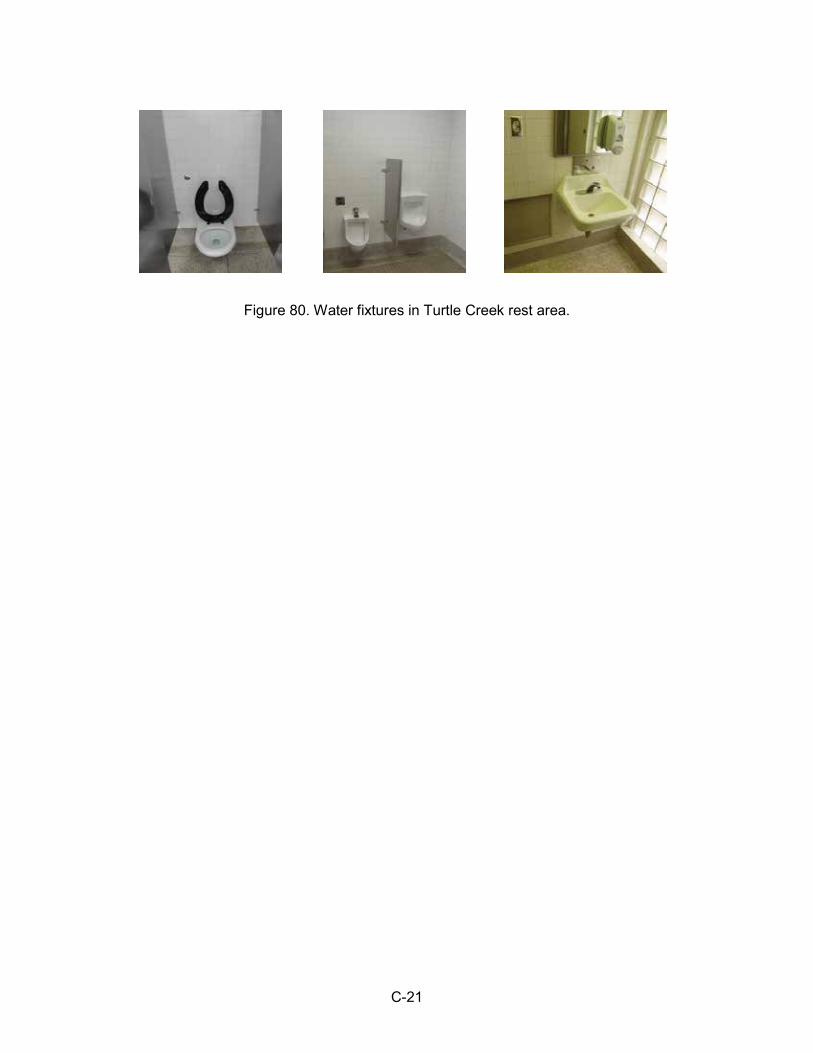
C-21
Figure 80. Water fixtures in Turtle Creek rest area.

D-1
APPENDIX D POTENTIAL BMPS AND THEIR ENERGY AND ECONOMIC PERFORMANCE FOR CUMBERLAND ROAD, TURTLE CREEK, GREAT SAUK TRAIL, WILLOW CREEK, AND MACKINAW DELLS REST AREAS
D.1 CUMBERLAND ROAD REST AREA
The Cumberland Road rest area is located at 7 miles west of the Indiana line (border), at mile marker 149 of I-70 and consists of one building that serves the north- and southbound lanes of I-70. It has approximately 608 thousands visitors with annual decrease of 1.53% in visitation rate based on 2009 statistics. The rest area was built in 1989 and renovated in 1992. The major sources of energy consumption in the rest area include the interior and exterior lighting, heating and cooling, vending machines, hand dryers, pump station, and water heater. The next sections discuss the energy consumption analysis for the rest area building as well as LCC analysis for implementing different green building measures including interior and exterior energy-saving light bulbs, motion-activated lighting, vending occupancy controls, motion exhaust sensors, geothermal heat pumps, Energy Star–rated air-source heat pump, thermal pane glass, vestibule entrance, energy-efficient hand dryers, photovoltaic systems, solar water heater, solar daylight tubes, and water-saving plumbing fixtures.
D.1.1 Energy Audit and Analysis The Cumberland Road rest area has one utility meter to measure energy consumption in
its building. The utility meter can be used to measure the monthly energy consumption of the rest area however they cannot provide energy consumed by each device or equipment in the rest area. In order to identify major sources of energy consumption in the rest area buildings and their costs, an energy simulation model was developed using the eQuest energy simulation software environment. The eQuest software can be used to simulate the energy performance of a building including its construction materials, weather, space heating and cooling, air ventilation, air infiltration and exhaust, temperature control, interior and exterior lighting, water use, windows and doors, skylights, operation schedule and occupancy, building activities, equipment loads. Furthermore, eQuest can account for different scenarios for replacing any of the current equipment or devices in buildings and calculate energy consumption accordingly. This capability of measuring building energy consumption based on different scenarios of implementing various green building measures and equipment will be used to analyze and identify a list of promising BMPs for Cumberland Road rest area.
The Cumberland Road rest area model was developed similar to the Coalfield rest area buildings. The model was developed based on the rest area’s location, square footage, architectural shape, zones, building envelope construction, infiltration, building orientation, operation schedule, building activities, building occupancy, ventilation, HVAC system, temperature control, and water heater. All energy consumption data for the Cumberland Road rest area including lighting, HVAC system, hand dryers, vending machines, ventilation, infiltration, exhaust, occupancy, water pump and water heater were modeled using a similar procedure to the one described earlier for the Coalfield rest area buildings.
After modeling the rest area building in eQuest, the simulation model was run to simulate the building performance with respect to weather conditions throughout a year and calculate monthly and total energy consumption categories of the building. Due to the difficulty of measuring air-infiltration rates for entry doors during the site visit; several runs of the simulation model were conducted with varying reasonable rates of infiltration and ventilation in

D-2
order to minimize the differences between simulated and actual energy consumption reported in the building’s energy bills. The parameters of infiltration were eventually set in the model to 15 CFM/ person for restrooms, lobby, and vending area, and 85 CFM/person for mechanical and storage rooms, infiltration rate was set to 2.0 air change per hour in the model to account for single entry of the rest area and match with energy bills. Figure 81 compares the simulated monthly energy consumption of the building based on the developed model in eQuest to the actual energy consumption reported in the utility bills of the Cumberland Road rest area building in 2009. Based on the results in Figure 81, the average absolute difference between the energy consumption for the developed simulation model and actual bills is 5.7% and the maximum and minimum difference between the energy consumption for the developed simulation model and actual bills were 10.0% in March and 0.4% in December.
Figure 81. Simulated and actual electricity consumption of Cumberland
Road rest area building in 2009.
It should be noted that the number of visitors per day was assumed to be constant throughout the year. Therefore, the difference in energy consumption between the eQuest simulation model and energy bills can be caused by the varying number of visitors per day which affects the building’s heating and cooling energy consumption as well as its water use. In addition, the occasional and varying use of other small devices such as a microwave, laptop, small fan or heater unit that were observed during the site visits in the maintenance room can contribute to this difference between the simulation results and the energy bills.
The square footage of Cumberland Road rest area is 2410 SF and its annual number of visitors is 607,725 which leads to electricity consumption rate of 87.27 kwh/SF per year, 13.71 $/SF per year, and 0.35 kwh/visitor per year. The breakdown of electricity cost for the Cumberland Road rest area building among its main sources of consumption is shown in Figure 82. The eQuest energy simulation model shows that the highest source of energy consumption is exterior lighting that represents 26% of the total energy consumption of the building. On the other hand, the two sources that consume the lowest energy in the building are hand dryers and water pump that represent 3% and 1% of the building’s total energy consumption, respectively. Space heating and cooling comprises 23% of total energy consumption of the building. The “other” category includes small equipment and devices such as vacuum cleaners, coffee machines, microwave, personnel laptop, etc., that are occasionally used in the rest area building and were not considered in the simulation model.
The greatest use of energy for heating purposes (approximately 7% of total energy consumption) is caused by air ventilation in the rest area building which represents the outside

D-3
air that replaces exhausted air from the restroom fans in addition to the outside air that enters the HVAC cycle. Additionally, 2% of the total energy costs is caused by infiltration which requires heating infiltrated air that leaks into the building mainly due to the frequent opening and closing of the building entry and exit doors (infiltration was modeled in eQuest model by 1.2 average air changes per hour).
Figure 82. Energy cost breakdown of Cumberland Road rest area building.
D.1.2 Lighting Lighting in the Cumberland Road rest area represents approximately 34% of total energy
consumption with an annual cost of $7,554. The following two subsections analyze replacing current interior and exterior lighting with more-efficient and energy-saving bulbs. The economic analysis of light replacement in these two sections assumes an annual interest rate of 2% and escalation in utility rate of 5%.
D.1.2.1 Interior Lighting
Interior lighting in the Cumberland Road rest area consists of linear and U-shape fluorescent T12 bulbs. These bulbs can be replaced by linear and U-shaped fluorescent T8 to provide similar luminance level, less energy consumption and longer life expectancy. Table 67 through Table 69 summarizes the impact of replacing current T12 with T8 fluorescent light bulbs for the Cumberland Road rest area. These lighting replacements can provide annual saving of $393 and reduce total energy consumption by 2.8%. The conducted LCC analysis for replacing all current T12 lighting with T8 bulbs is shown in Figure 83. The average payback period for all light replacement is 0 years (immediate payback period) which represents a green building measure with promising return on investment.
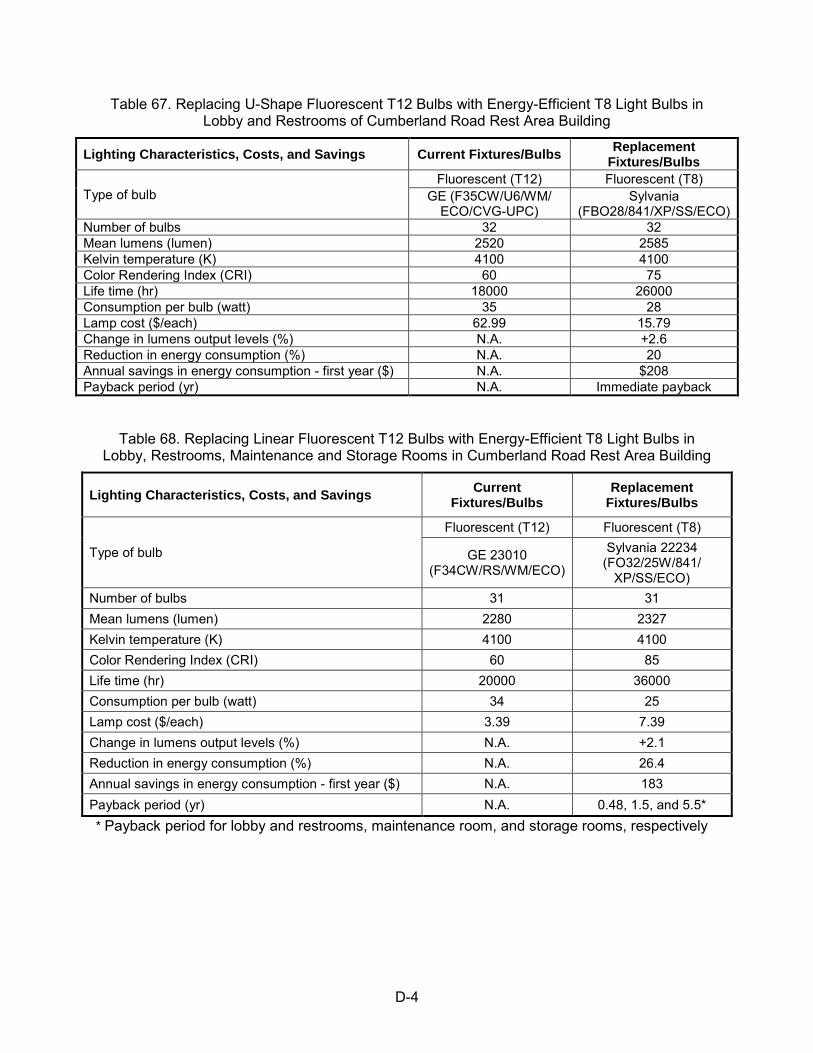
D-4
Table 67. Replacing U-Shape Fluorescent T12 Bulbs with Energy-Efficient T8 Light Bulbs in Lobby and Restrooms of Cumberland Road Rest Area Building
Lighting Characteristics, Costs, and Savings Current Fixtures/Bulbs Replacement Fixtures/Bulbs
Type of bulb Fluorescent (T12) Fluorescent (T8)
GE (F35CW/U6/WM/ ECO/CVG-UPC)
Sylvania (FBO28/841/XP/SS/ECO)
Number of bulbs 32 32 Mean lumens (lumen) 2520 2585 Kelvin temperature (K) 4100 4100 Color Rendering Index (CRI) 60 75 Life time (hr) 18000 26000 Consumption per bulb (watt) 35 28 Lamp cost ($/each) 62.99 15.79 Change in lumens output levels (%) N.A. +2.6 Reduction in energy consumption (%) N.A. 20 Annual savings in energy consumption - first year ($) N.A. $208 Payback period (yr) N.A. Immediate payback
Table 68. Replacing Linear Fluorescent T12 Bulbs with Energy-Efficient T8 Light Bulbs in Lobby, Restrooms, Maintenance and Storage Rooms in Cumberland Road Rest Area Building
Lighting Characteristics, Costs, and Savings Current Fixtures/Bulbs
Replacement Fixtures/Bulbs
Type of bulb
Fluorescent (T12) Fluorescent (T8)
GE 23010 (F34CW/RS/WM/ECO)
Sylvania 22234 (FO32/25W/841/
XP/SS/ECO) Number of bulbs 31 31 Mean lumens (lumen) 2280 2327 Kelvin temperature (K) 4100 4100 Color Rendering Index (CRI) 60 85 Life time (hr) 20000 36000 Consumption per bulb (watt) 34 25 Lamp cost ($/each) 3.39 7.39 Change in lumens output levels (%) N.A. +2.1 Reduction in energy consumption (%) N.A. 26.4 Annual savings in energy consumption - first year ($) N.A. 183 Payback period (yr) N.A. 0.48, 1.5, and 5.5* * Payback period for lobby and restrooms, maintenance room, and storage rooms, respectively

D-5
Table 69. Replacing Fluorescent T12 bulbs with Energy-Efficient T8 Light Bulbs in Attic of Cumberland Road Rest Area Building
Lighting Characteristics, Costs, and Savings Current Fixtures/Bulbs Replacement Fixtures/Bulbs
Type of bulb
Fluorescent (T12) Fluorescent (T8)
Philips (F40T12 CWX ALTO)
Sylvania 22234 (FO32/25W/841/
XP/SS/ECO) Number of bulbs 8 8 Mean lumens (lumen) 1800 2327 Kelvin temperature (K) 4100 4100 Color Rendering Index (CRI) 89 85 Life time (hr) 20000 36000 Consumption per bulb (watt) 40 25 Lamp cost ($/each) 3.99 7.39 Change in lumens output levels (%) N.A. +29 Reduction in energy consumption (%) N.A. 37.5 Annual savings in energy consumption - first year ($) N.A. 2
Payback period (yr) N.A. 19.8* *Attic lighting is used approximately 20 minutes per day.
Figure 83. Cumulative costs, savings, and CO2 emissions for current and replacement lighting in
Cumberland Road rest area building.
D.1.2.2 Exterior Lighting
This section analyzes the impact of replacing current exterior lighting of Cumberland Road rest area with LED and induction lighting. The average lighting operating hours was determined based on eQuest simulation model, which accounts for the location of the rest area building and its seasonal operational hours. The average lighting hours of exterior lighting was calculated to be 9.07 hours. The current exterior lighting of Cumberland Road rest area consists of (1) ten recessed light fixtures with 100 MH in each; (2) twenty-five light poles at entrance and exit of the rest area with HPS 250 watts in each (assumed bulbs); and (3) two lighting towers with a total of sixteen 400 watt HPS bulbs. Due to the unavailability of the exact brand and
0
50000
100000
150000
200000
250000
0 2 4 6 8 10 12 14 16 18 20 22 24 26 28 30
Current Fluorescent (T12)
Replacement Fluorescent (T8)
Cumulative annual Savings
Cost ($)
n (Years)
0
100000
200000
300000
400000
500000
600000
700000
0 2 4 6 8 10 12 14 16 18 20 22 24 26 28 30
Current Fluorescent (T12)Replacement Fluorescent…
CO2 emissions (IBS)
n (Years)

D-6
luminance characteristics of current exterior lighting, reasonable assumptions were made for their luminance level giving the fact that the luminance characteristics are not significantly affected by the manufacturers. It should be noted that LCC was conducted for one-for-one replacement to reduce initial costs. This one-for-one replacement is expected to reduce the current total lighting output (lumen) of light poles by 47% and 54% for LED and induction lighting replacements respectively. Similarly, this one-for-one replacement will reduce the current total lighting output (lumen) of (1) light towers by 60% and 64% for LED and induction lighting replacements, respectively; and (2) recessed fixtures by 33% and 38% for LED and induction lighting replacements, respectively. It should be noted that despite the lower average luminance of LED and induction lighting compared to HPS lighting, LED and induction lighting provide higher Color Rendering Index (CRI) than HPS lighting. CRI measures the effect of a light source on the perceived color of object and surface. Having high value of CRI makes virtually all colors look natural and reduces glare (Light Sout Services 2010). Furthermore, HPS light bulbs have low color temperature that ranges from 1900 to 2700 degrees K which is referred to as “warm” light sources, while LED and induction lighting have higher color temperature that ranges from 2700 to 8000 degrees K which is referred to as “cool” light source. Receptors in the eye respond to light sources differently, which can affect mood and human health. In addition, mixing light sources is not desirable and should be avoided in the light replacement (McColl & Veitch 2001; U.S. DOE 2008).
A LCC analysis was conducted to examine the feasibility of replacing a one-for-one replacement of the current exterior lighting of the rest area building, its parking lot as well as entrance and exit with LED and induction lighting. The conducted analysis considered the possible lighting fixtures and bulbs shown in Table 78 as recommended by manufactures.
The components and results of the conducted analysis of one-for-one replacements are summarized in Table 71 through Table 73 for all lighting fixtures/bulbs of the rest area. The cumulative cost and savings as well as carbon footprint and reductions in CO2 emissions for replacing exterior lighting of Cumberland Road rest area are shown in Figure 86. The analysis shows that these light replacements can provide annual savings of 2,989, or 13.4% of total energy consumption for LED lighting replacements and $2,947 or 13.2% of total energy consumption for induction lighting replacements. This leads to a payback period of 22.5 years for LED light replacements and 6.3 years for induction lighting replacements.
U.S. DOE “LED Application Series: Outdoor Area Lighting,“ U.S. Department of Energy, Energy Efficiency and Renewable Energy, 2008, http://apps1.eere.energy.gov/buildings/publications/pdfs/ssl/led-color-characteristics-factsheet.pdf, accessed June 8, 2013. McColl, S.L. and Veitch, J.A. “Full-spectrum fluorescent lighting: a review of its effects on physiology and health,” National Research Council Canada, NRCC-43097, 2001.

D-7
Table 70. Characteristics of Current and Replacement Lighting for Exterior Lighting of Cumberland Road Rest Area Building
Table 71. Replacing HPS 400W Bulbs with Energy-Efficient LED and Induction Light Bulbs in Cumberland Road Rest Area Building
Lighting Characteristics, Costs, and Savings
Current Fixtures/Bulbs
Replacement 1
Replacement 2
Type of bulb HPS LED Induction Number of bulbs 16 16 16 Initial lumens (lumen) 45000 20000 18000 Kelvin temperature 2100 2700-8000 5000 Color Rendering Index (CRI) 20 75 83 Life time (hr) 24000 50000 75000 Consumption per bulb, including ballast (watt) 481 224 230 Bulb cost ($) 54 1493 538 Reduction in lumens output levels (%) N.A. 60 64 Reduction in energy consumption (%) N.A. 53 52 Annual savings in energy - first year ($/year) N.A. 1,492 1,457 Payback period N.A. 18.6 5.1
Type Characteristics Type Characteristics Type CharacteristicsMean Lumens (lumen) MH 100w 9000 LED Lamp 6000 Induction Lamp 5600
Color temperature (Kelvin) 4200 3000-5000 2700-6500Color rendering index (CRI) 93 80 83
Life time (hours) 2400 50000 100000Consumption (w) 100 80 80
Lamp cost ($) 80 405 248Lamp and fixture cost ($) - - -
Initial Lumens (lumen) HPS 250w 28500 LED Steet Light 15000 Induction Steet 13200Color temperature (Kelvin) 2000 2700-8000 Light 5000Color rendering index (CRI) 25 75 83
Life time (hours) 30000 50000 75000Consumption (w) 250 168 165
Lamp cost ($) 54 - -Lamp and fixture cost ($) - 1274 486
Initial Lumens (lumen) HPS 400w 50000 LED Steet Light 20000 Induction Steet 18000Color temperature (Kelvin) 2100 2700-8000 Light 5000Color rendering index (CRI) 20 75 83
Life time (hours) 24000 50000 75000Consumption (w) 400 224 225
Lamp cost ($) 54 - -Lamp and fixture cost ($) - 1493 538
Light Characteristic items Replacement (LED lighting) Replacement (Induction light)Current lighting

D-8
Table 72. Replacing HPS 250W Bulbs with Energy-Efficient LED and Induction Light Bulbs in Cumberland Road Rest Area Building
Lighting Characteristics, Costs, and Savings
Current Fixtures/Bulbs
Replacement 1
Replacement 2
Type of bulb HPS LED Induction Number of bulbs 25 25 25 Initial lumens (lumen) 28500 15000 13200 Kelvin temperature 2000 4900 5000 Color Rendering Index (CRI) 25 75 83 Life time (hr) 30000 50000 75000 Consumption per bulb, including ballast (watt) 315 168 168 Bulb cost ($) 54 1274 486 Reduction in lumens output levels (%) N.A. 47 54 Reduction in energy consumption (%) N.A. 47 47 Annual savings in energy - first year ($/year) N.A. 1,334 1,334 Payback period (yr) N.A. 27.2 7.2
Table 73. Replacing MH 100W Bulbs with Energy-Efficient LED and Induction Light Bulbs in Cumberland Road Rest Area Building
Lighting Characteristics, Costs, and Savings
Current Fixtures/Bulbs
Replacement 1
Replacement 2
Type of bulb MH Cobra head LED Luminaire Induction
Number of bulbs 10 10 10 Initial lumens (lumen) 5200 3000 3500 Kelvin temperature 3000 3000-5000 5000 Color Rendering Index (CRI) 75 80 82 Life time (hr) 10000 50000 100000 Consumption per bulb, including ballast (watt) 110 80 82 Bulb cost ($) 33 405 248 Reduction in lumens output levels (%) N.A. 33 38 Reduction in energy consumption (%) N.A. 27 25 Annual savings in energy - first year ($/year) N.A. 109 102 Payback period ($) N.A. 20.9 6.8

D-9
Figure 84. Cumulative costs, savings, and CO2 emissions for LED and induction lighting
replacements for Cumberland Road rest area building.
D.1.3 Motion Sensors Rest areas have different operational schedule than business and commercial buildings
and they have to operate 24 hours a day with few or no occupants during low visitation periods at night. This makes motion sensors a promising technology for rest area buildings. This section analyzes the implementation of motion sensors to control the lighting of restrooms and vending machine areas. Motion sensors also can be used to reduce space heating and cooling by reducing the use of exhaust fans at night when there are few or no occupants in the restrooms.
In order to estimate the energy savings in lighting and exhaust fans, the research team developed a separate simulation model using EZstrobe simulation language (Martinez 2006) to analyze and simulate the use of restrooms and vending machines based on the number and frequency of rest area visitors. The simulation model was developed to mimic the utilization of the rest area facilities by its visitors. The model was created to generate the number of visitors to the rest area using a beta distribution function to represent a high frequency of visitors during the morning, noon, and afternoon hours and low frequency during the night and early morning hours. The model also assumes that the percentages of visitors that will use the men’s restroom, women’s restroom and vending machines are 40%, 40%, and 20%, respectively. Similarly, the probabilities that restroom visitors will use urinals, toilets and only faucets were assumed to be 30%, 60%, and 10%, respectively with reasonable random durations for each of these restroom tasks, as shown in Figure 85. It should be noted that the model assumes that each visitor using the toilet or urinal will also use the faucet afterwards. The developed model accounts for an amount of time for sensors to keep the light on after a visitor leaves a restroom. After a visitor leaves the restroom, the model assumes that there is a probability of 60% that the visitor will leave the rest area and 40% will use vending machines. The developed model can estimate how long the lighting in restrooms of the rest area will be turned off if motion-activated lighting were implemented in the restrooms. Similarly, the amount of time that lighting in vending machines and exhaust fans being turned/switched off can be calculated by the developed simulation model. Figure 86 shows rest area visitors while being in the men’s restroom throughout a simulation day. Table 74 summarizes the percentages of occupancy for restrooms and vending machines of the Cumberland Road rest area assuming that the lights or fans remain turned on for 5 minutes after the departure of the last visitor. The following subsections use the developed simulation model to estimate potential savings for using motion sensors in the rest area building and their expected payback periods. The economic analysis of motion sensors accounts for an annual interest rate of 2% and escalation in utility rate of 5% in calculating payback period of implementing this technology.
-100000
100000
300000
500000
700000
0 2 4 6 8 10 12 14 16 18 20 22 24 26 28 30
Cost ($)
n (Years)
Current bulbsLED replacementsCummulative annual Savings for LED lightingInduction lighting replacementCummulative annual Savings for induction lighting
0
500
1000
1500
2000
2500
0 2 4 6 8 10 12 14 16 18 20 22 24 26 28 30
CO2 emissions (IBS)
Thou
sand
s
n (Years)
"current exterior lighting"
LED Emission
Induction Emission

D-10
Figure 85. Motion-sensor simulation model for Cumberland Road rest area building.
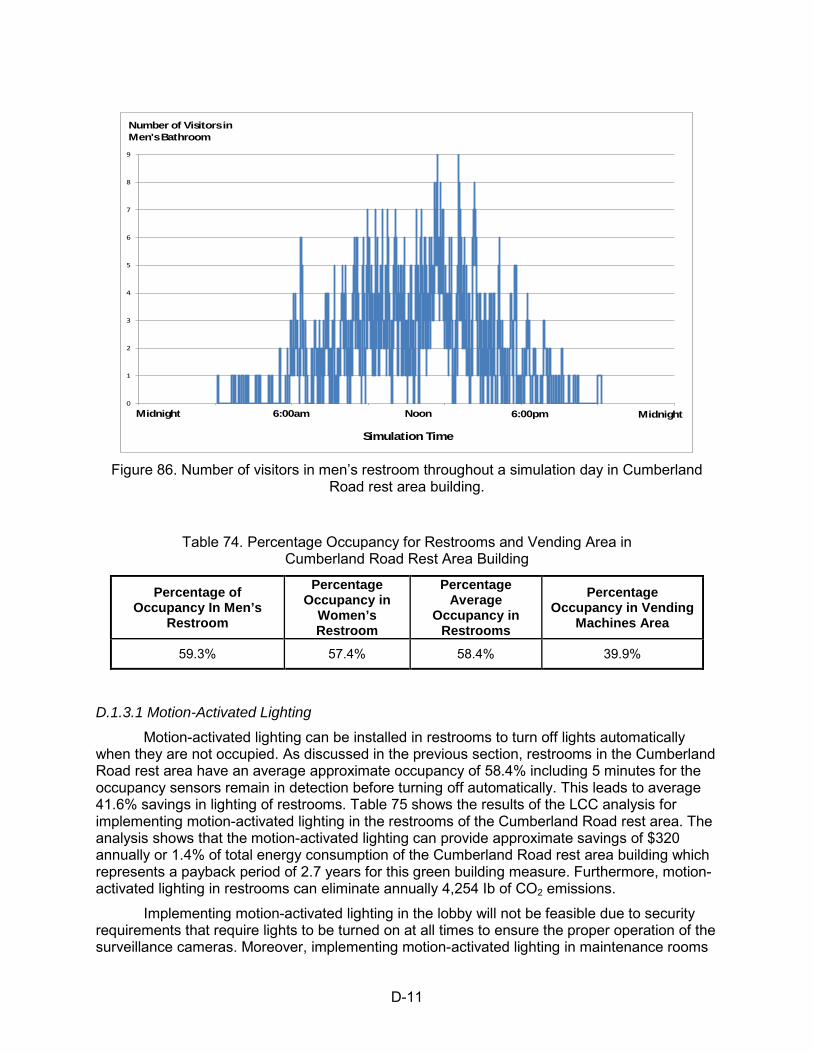
D-11
Figure 86. Number of visitors in men’s restroom throughout a simulation day in Cumberland
Road rest area building.
Table 74. Percentage Occupancy for Restrooms and Vending Area in Cumberland Road Rest Area Building
Percentage of Occupancy In Men’s
Restroom
Percentage Occupancy in
Women’s Restroom
Percentage Average
Occupancy in Restrooms
Percentage Occupancy in Vending
Machines Area
59.3% 57.4% 58.4% 39.9%
D.1.3.1 Motion-Activated Lighting
Motion-activated lighting can be installed in restrooms to turn off lights automatically when they are not occupied. As discussed in the previous section, restrooms in the Cumberland Road rest area have an average approximate occupancy of 58.4% including 5 minutes for the occupancy sensors remain in detection before turning off automatically. This leads to average 41.6% savings in lighting of restrooms. Table 75 shows the results of the LCC analysis for implementing motion-activated lighting in the restrooms of the Cumberland Road rest area. The analysis shows that the motion-activated lighting can provide approximate savings of $320 annually or 1.4% of total energy consumption of the Cumberland Road rest area building which represents a payback period of 2.7 years for this green building measure. Furthermore, motion-activated lighting in restrooms can eliminate annually 4,254 Ib of CO2 emissions.
Implementing motion-activated lighting in the lobby will not be feasible due to security requirements that require lights to be turned on at all times to ensure the proper operation of the surveillance cameras. Moreover, implementing motion-activated lighting in maintenance rooms
0
1
2
3
4
5
6
7
8
9
0 200 400 600 800 1000 1200 1400
Simulation Time
MidnightMidnight 6:00am Noon 6:00pm
Number of Visitors in Men's Bathroom

D-12
will not provide much savings and the payback period will be long since the maintenance staff often turn off the light before leaving the mechanical rooms of the rest area.
Table 75. Motion-Activated Lighting Analysis for Restrooms
of Cumberland Road Rest Area Building
Savings and Cost Items Amount/Savings Total load of lighting fixtures (watt) 828 Electricity cost ($/kwh) 0.106 Occupancy sensors cost ($) 288 Labor installation cost ($) 583 Total Initial cost ($) 871 Lighting operation time (hr) 24 Annual lighting energy cost for restrooms ($) 769 Annual lighting energy savings ($) 320 Payback period (yr) 2.7 Amount of eliminated CO2 (Ib) 4,254 Savings in total energy consumption of building (%) 1.4
D.1.3.2 Vending Occupancy Controls
Similar to motion-activated lighting, occupancy controls can be installed for vending machines to turn off their lighting when the vending area is not occupied. Based on the developed simulation model for motion sensors, lights of vending machines are expected to be on for approximately 39.9% of hours during the day assuming a duration of 5 minutes for the sensor to remain on after detecting the last motion in the vending area. This leads to 61.1% lighting savings of the vending machine area. Table 76 shows the economic analysis of installing occupancy controls for vending machines area in the Cumberland Road rest area. The analysis shows that these occupancy controls can provide approximate savings of $335 annually or 1.5% of total energy consumption of the Cumberland Road rest area building, which leads to a payback period of 1.03 years. This measure can also eliminate 4,454 Ib of CO2 emissions annually due to the achieved reduction in energy consumption.
Table 76. Occupancy Controls Analysis for Vending Machines Area in
Cumberland Road Rest Area Building
Motion-Activated Lighting Analysis Amount/Savings Total load of vending machines lighting (watt) 600 Electricity cost ($/kwh) 0.106 Occupancy sensors cost ($) 120 Labor installation cost ($) 219 Total Initial cost ($) 339 Lighting operation time (hr) 24 Annual lighting energy cost for restrooms ($) 557 Annual lighting energy savings ($) 335 Payback period (yr) 1.03 Amount of eliminated CO2 (Ib) 4,454 Savings in total energy consumption of building (%) 1.5

D-13
D.1.3.3 Motion Sensors for Exhaust
Similar to motion-activated lighting, exhaust fans can operate only during the occupancy times of visitors. This will allow exhaust fans to be switched off automatically when there are no visitors, which will decrease the amount of outside air that needs to be heated or cooled. eQuest software does not provide a direct method to account for the use of exhaust fan sensors; however, this can be modeled by decreasing the exhaust rate by a value which reflects the switching off of exhaust fans when there are no occupants. Accordingly, exhaust fan flow can be decreased with the average non-occupancy percentage of restrooms (41.6%). Table 77 summarizes the economic analysis results for implementing motion sensors for exhaust fans in rest area building. The analysis shows that motion sensors for exhaust fans can provide approximate annual savings of $915 annually or 4.1% of total energy consumption of Cumberland Road rest area building, which leads to a payback period of 0.6 years. This measure can also eliminate 12,168 Ib of CO2 emissions annually due to the reduction in energy consumption of heating and cooling.
Table 77. Analysis Results for Implementing Motion-Sensor
Exhaust Fans in Cumberland Road Rest Area Building
Savings and Cost Items Amount/Savings Electricity cost ($/kwh) 0.106 Fan(s) and sensors cost ($) 433 Labor installation cost ($) 109 Total Initial cost ($) 542 Annual energy savings ($) 915 Payback period (yr) 0.6 Amount of eliminated CO2 (Ib) 12,168 Savings in total energy consumption of building (%) 4.1
D.1.4 More-Efficient HVAC Systems The current HVAC system at the Cumberland Road rest area consists of a split system
with two condensers and electric resistance duct heaters. The system has a cooling capacity of about 7.5 tons and unknown heating capacity. The current HVAC system can be replaced with a more energy-efficient system that reduces heating and cooling energy consumption. The following three subsections analyze the replacement of the current HVAC system with more-efficient units and setting back the temperature at night.
D.1.4.1 Geothermal Heat Pump
The existing HVAC system in the Cumberland Road rest area building operates continuously year round and its consumption represents 27% of the total building consumption. Ground-source heat pumps can be more efficient than air-source heat pump as it uses the nearly constant temperature of earth (55°F) to heat and cool buildings. The eQuest simulation environment can be used to model the use of a geothermal HVAC system for Cumberland Road rest area building. The system was modeled to have heating coefficient of performance (COP) of 4.0 and a cooling efficiency of 18 EER. After running the eQuest model with geothermal heat pump, the model provides savings of 11.7% of total energy consumption. The installation and maintenance costs of geothermal heat pump were calculated similar to Coalfield rest area

D-14
buildings. Table 78 summarizes the LCC components of replacing the current HVAC system with a geothermal heat pump.
Table 78. LCC Components for Replacing Current HVAC System with
Geothermal Heat Pump in Cumberland Road Rest Area Building
Rest Area/LCC Components Cost/Life
Capital cost - vertical system* ($) 31,570
Annual maintenance cost ($) 325
Annual operating cost ($) 3,235
Periodic cost ($) 19,570
Life (yr) 20 * Installation cost may vary due to soil conditions and resizing of the HVAC equipment
In order to compare the cost effectiveness and payback periods of replacing the current HVAC systems in the rest area with geothermal systems, the initial, maintenance, operating and replacement costs of the current HVAC system need to be identified. These costs were estimated similar to the Coalfield rest area buildings in order to carry out the LCC analysis. Table 79 summarizes the LCC components for the current HVAC system of the Cumberland Road rest area building.
Table 79. LCC Components for Current HVAC System of
Cumberland Road Rest Area Building
Rest Area/LCC Components Cost/Life Capital cost ($) 13,020 Annual maintenance cost ($) 700 Annual operating cost ($) 5,975 Periodic cost ($) 13,020 Life (yr) 17 Manufacture year 2008 (assumed) Replacement year 2025
A LCC analysis was conducted to compare the potential replacement of the current HVAC system with a geothermal heat pump based on an annual interest rate of 2%, escalation in utility rate of 5%, and annual increase of maintenance cost of 2%. Table 80 summarizes the LCC analysis results for replacing current HVAC with geothermal heat pump. The analysis shows that replacing the current HVAC system with a vertical loop geothermal heat pump has a payback period of 9.5 years. The cumulative costs for the current HVAC system, a vertical loop geothermal system, and savings are shown in Figure 87. Geothermal heat pump can also be installed along with a desuperheater to heat water in the cooling season. The desuperheater uses heat that is removed from the building space to heat domestic hot water. This unit can provide free hot water in the summer or when the system is in cooling mode. It can provide annual savings of $705 or 3.2% of total energy consumption. The payback period of the desuperheater is 2.3 years and it can eliminate 9,384 Ib of CO2 emissions.

D-15
Table 80. LCC Analysis Results for Replacing Current HVAC System with Geothermal Heat Pump in Cumberland Road Rest Area Building
Rest Area Savings
Annual kwh saved 24,640
Annual energy savings - first year ($/yr) 2,612
Annual eliminated CO2 emissions (Ib) 34,742
Payback period - vertical system (yr) 9.5
Figure 87. Cumulative costs of current HVAC system, vertical loop geothermal system, and
savings for Cumberland Road rest area building. D.1.4.2 High-Efficiency Air-Source Heat Pump
Another alternative for the current HVAC system at the Cumberland Road rest area is to replace it with a more-efficient Energy Star–rated air-source heat pump to reduce heating and cooling expenses. An air-source heat pump was modeled in eQuest to meet Energy Star recommendations with cooling efficiency of 12 EER and heating performance rating of 8.2 HSPR (Energy Star 2003). Table 81 summarizes the economic analysis results for replacing the current HVAC system with an Energy Star–rated air-source heat pump. The analysis shows that Energy Star–rated HVAC systems can provide annual savings of $1,401 annually or 7.9% of total energy consumption of the rest area building. This leads to a payback period of 7.3 years based on an annual interest rate of 2% and escalation in utility rate of 5%. This replacement can eliminate CO2 emissions by 23,293 lb annually.

D-16
Table 81. Analysis Results for Replacing Current HVAC System With Energy Air-Source Heat Pump In Cumberland Road Rest Area Building
Savings and Cost Items Amount/Savings Electricity cost ($/kwh) 0.106 Total initial cost for air-source heat pump ($) 13,800 Annual energy savings ($) 1,751 Payback period (yr) 7.31 Amount of eliminated CO2 (Ib) 23,293 Savings in total energy consumption of the rest area building (%) 7.9
D.1.4.3 Setting Back HVAC System at Night
Another method to reduce energy consumption for space heating and cooling of the rest area is to set back the temperature of the HVAC system at night. The number of visitors using the rest area at night is very limited and, accordingly, setting back the temperature at night can reduce the energy consumption of heating and cooling. Temperature can be set at night to 66ᵒF in winter and 76ᵒF in summer. This measure can be modeled in eQuest by editing the temperature set points in the simulation model to a temperature that reflects the set points at night using interpolation. The developed eQuest model showed that setting back the temperature at night can provide annual savings of $504 or 2.3% reduction in total energy consumption. The Cumberland Road rest area building may need programmable thermostats in order to setback the HVAC temperature at night. This measure can be implemented easily to the rest area with low initial cost.
D.1.5 Thermal Pane Glass for Windows and Doors Thermal pane glass is a green building measure that can be added to the rest area
building in order to reduce its cooling and heating energy consumption. This measure requires replacing all glazing as well as doors and windows in the rest area building with double-pane glass. This measure can be modeled in eQuest by replacing current single pane glass with double-pane glass. The analysis of implementing this measure provides annual savings of $575 or 2.6% of total energy consumption, as shown in Table 82. There is no expected payback period for this measure within 30 years as it requires major renovation for the rest area building with high initial cost. This measure can eliminate 7,642 Ib of CO2 annually.
Table 82. LCC Analysis Results for Replacing Current Glazing
and Doors with Double-Pane Glass in Cumberland Road Rest Area Building
Savings and Cost Items Amount/Savings Electricity cost ($/kwh) 0.106 Total initial cost ($) 40,024 Annual energy savings (kwh) 5420 Annual energy savings ($) 575 Payback period (yr) More than 30 Amount of eliminated CO2 (Ib) 7,642 Savings in total energy consumption of the rest area building (%) 2.6
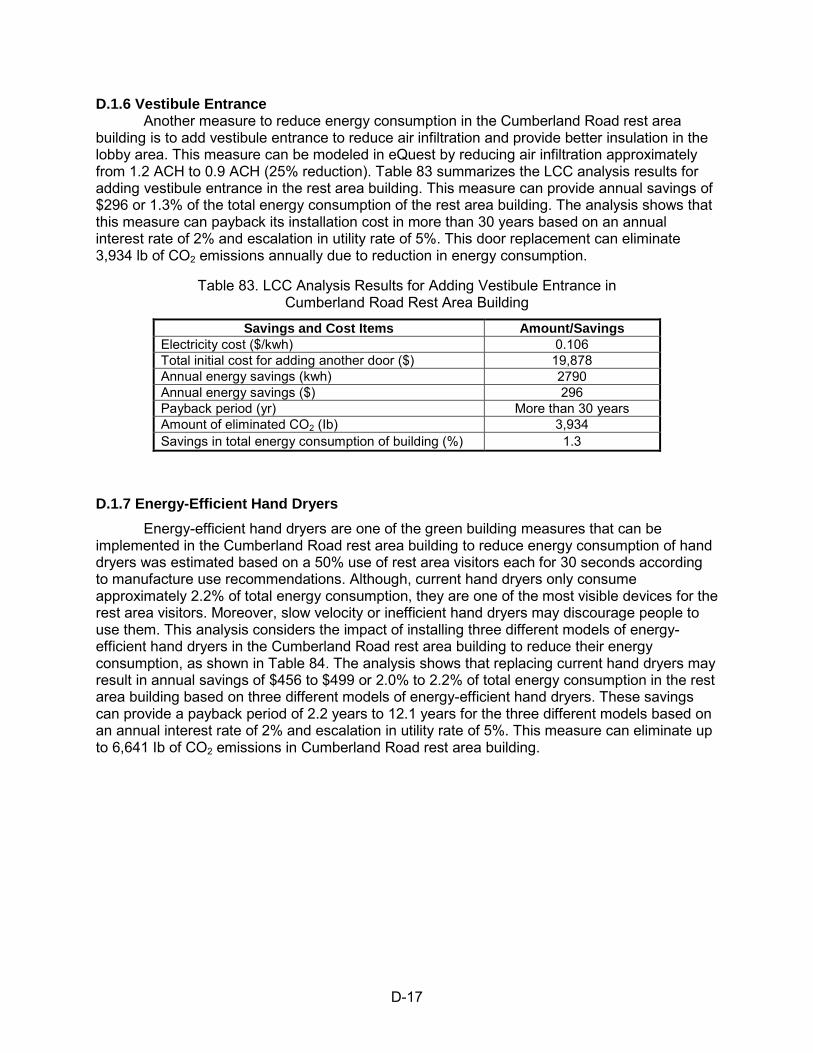
D-17
D.1.6 Vestibule Entrance Another measure to reduce energy consumption in the Cumberland Road rest area
building is to add vestibule entrance to reduce air infiltration and provide better insulation in the lobby area. This measure can be modeled in eQuest by reducing air infiltration approximately from 1.2 ACH to 0.9 ACH (25% reduction). Table 83 summarizes the LCC analysis results for adding vestibule entrance in the rest area building. This measure can provide annual savings of $296 or 1.3% of the total energy consumption of the rest area building. The analysis shows that this measure can payback its installation cost in more than 30 years based on an annual interest rate of 2% and escalation in utility rate of 5%. This door replacement can eliminate 3,934 lb of CO2 emissions annually due to reduction in energy consumption.
Table 83. LCC Analysis Results for Adding Vestibule Entrance in Cumberland Road Rest Area Building
Savings and Cost Items Amount/Savings Electricity cost ($/kwh) 0.106 Total initial cost for adding another door ($) 19,878 Annual energy savings (kwh) 2790 Annual energy savings ($) 296 Payback period (yr) More than 30 years Amount of eliminated CO2 (Ib) 3,934 Savings in total energy consumption of building (%) 1.3
D.1.7 Energy-Efficient Hand Dryers Energy-efficient hand dryers are one of the green building measures that can be
implemented in the Cumberland Road rest area building to reduce energy consumption of hand dryers was estimated based on a 50% use of rest area visitors each for 30 seconds according to manufacture use recommendations. Although, current hand dryers only consume approximately 2.2% of total energy consumption, they are one of the most visible devices for the rest area visitors. Moreover, slow velocity or inefficient hand dryers may discourage people to use them. This analysis considers the impact of installing three different models of energy-efficient hand dryers in the Cumberland Road rest area building to reduce their energy consumption, as shown in Table 84. The analysis shows that replacing current hand dryers may result in annual savings of $456 to $499 or 2.0% to 2.2% of total energy consumption in the rest area building based on three different models of energy-efficient hand dryers. These savings can provide a payback period of 2.2 years to 12.1 years for the three different models based on an annual interest rate of 2% and escalation in utility rate of 5%. This measure can eliminate up to 6,641 Ib of CO2 emissions in Cumberland Road rest area building.

D-18
Table 84. LCC Analysis Results for Replacing Current Hand Dryers with Energy-Efficient Units for Cumberland Road Rest Area Building
LCC Items/Savings Current
Hand Dryer - World Dryer
1- World Dryer Airforce - J Series Hand
Dryers
2- Xlerator Series Hand
Dryers
3- Dyson Airblade
Series Hand Dryers
Number of hand dryers 4 Hand dryer consumption (watt) 2,300 1,100 1100 1500 Drying time (second) 30 12 15 12 Initial cost ($) N.A. 1,092* 1,600* 6,400* Annual visitors - 2009 607,725 Savings over current hand dryers (%) N.A. 81 76 74 Utility cost ($/kwh) 0.106 Annual operating cost based on 50% use of visitors ($) 617 118 148 161
Annual savings (%) N.A. 499 470 456 Annual savings of total energy consumption (%) N.A. 2.2 2.1 2.0
Eliminated CO2 emissions (Ib) N.A. 6,641 6,248 6,070 Payback period (yr) N.A. 2.2 3.4 12.1 * (Restroom Direct 2012)
D.1.8 Solar Measures Several solar measures can be used to reduce energy consumption in the Cumberland
Road rest area building. These measures can include solar daylight tubes, photovoltaic systems, and solar water heaters. These measures can reduce energy consumption of interior lighting, heating water as well as generate renewable and clean electricity. The next subsections discuss the installation of these systems in the Cumberland Road rest area building. D.1.8.1 Solar Tube Lighting
Solar daylight tubes are one of the green building measures that can be used to provide lighting for the building during the day light hours. The technology requires solar tubes to penetrate the building roof to the ceiling where they transmit the sunlight during the day time. This technology can be installed in restrooms and lobby to decrease the lighting use during the day light time. It can be installed in the attic of the rest area building while installing light controls in restrooms and lobby to control/dim interior lighting during the day. The energy savings that this technology can provide was calculated based on reducing daily lighting use by 5 hours. The analysis for adding solar daylight tubes in the rest area building is summarized in Table 85. Cumulative costs and savings for implementing solar daylight tubes in restrooms and lobby of the rest area are shown in Figure 88 and Figure 89. The analysis shows that this measure can provide saving of $341 annually or 1.53% of the total energy consumption. This can lead to a payback period of 20.8 years for restrooms and 15 years for lobby. It should be noted that, the installation of this measure is crucial in terms of the amount of savings that it can provide. Improper installation of solar daylight tubes with low insulation (low U value) can lead to high dissipation of energy and subsequently increase cooling and heating costs. On the other hand, proper installation of this measure with sufficient U value, Energy Star–rated tubes, can slightly increase heating and cooling. Based on modeling solar tubes in eQuest with similar skylight areas, this can lead to an increase in energy cost $156 annually. As a result the expected savings of this measure may reduce to $185 annually.

D-19
Table 85. LCC Analysis Results for Installing Solar Daylight Tubes in Restrooms and Lobby in Cumberland Road Rest Area Building
Savings and Cost Items Restrooms Lobby
Total load of lighting fixtures (watt) 828 938
Electricity cost ($/kwh) 0.106
Number of Solar daylight tubes (10' diameter) 5 0
Number of Solar daylight tubes (18'' diameter) 4 4
Total Initial cost ($) $4,435 $3,300
Solar tubes operation time (hr) 5 5
Annual lighting energy cost ($) $769 $871
Annual lighting energy savings (%) $160 $181
Payback period (yr) 20.84 15.01
Amount of eliminated CO2 (Ib) 2,131 2,414
Savings in total energy consumption of building (%) 0.72 0.81
Figure 88. Cumulative costs and savingsfor implementing solar
daylight tubes in restrooms of Cumberland Road rest area building.
-6000-4000-2000
02000400060008000
10000120001400016000
0 2 4 6 8 10 12 14 16 18 20 22 24 26 28 30
Bathroom lighting
Solar tubes
Cumulative annual Savings
Cost ($)
n (Years)

D-20
Figure 89. Cumulative costs and savings for implementing solar daylight tubes in lobby of Cumberland Road rest area building.
D.1.8.2 Grid-Connected Photovoltaic Systems
Photovoltaic systems are one of the renewable energy measures that generate electricity to the Cumberland Road rest area building. In order to perform LCC for installing photovoltaic systems in the rest area, this system needs to be designed to estimate the number and type of system parts. Several factors affect the design of grid-connected systems including average daily peak sun hours, capacity of solar panels, capacity of inverters, and mounting of solar panels. The design of photovoltaic system for the Cumberland Road rest area was conducted using a similar procedure to the one described earlier in the Coalfield rest area.
This measure was analyzed to generate 5% of Cumberland Road total energy consumption. Table 86 summarizes the cost components for installing grid-connected photovoltaic system in the Cumberland Road rest area building. The LCC analysis was conducted to determine annual savings, payback period, amount of eliminated CO2 emissions, and required area of the system. The analysis accounted for an annual interest rate of 2%, escalation in utility rate of 5%, and an annual increase of maintenance cost by 2%, as shown in Table 87. The analysis shows that incorporating grid-connected photovoltaic system at the Cumberland Road rest area has a payback period of 25.9 years. The system requires 29 solar panels to be installed, 10 of which can be mounted on the south part of the roof and 19 solar panels on ground south of the rest area building. The required area for solar panels on the ground is 270 SF, these calculations accounted for 51ᵒ tilt angle for the solar panels and preventing shading that might occur due to layout of solar panels in winter and summer. Figure 90 shows the cumulative savings of installing a grid-connected system in the rest area building.
-5000
0
5000
10000
15000
20000
0 2 4 6 8 10 12 14 16 18 20 22 24 26 28 30
Lobby lighting
Solar tubes
Cumulative annual Savings
Cost ($)
n (Years)

D-21
Table 86. Cost Components for Installing Grid-Connected Photovoltaic System in the Cumberland Road Rest Area Building
Cost Components Amount/Savings Total number of solar panels 29
Number of inverters 1
System capacity (KW) 6.8
Utility cost ($/kwh) 0.140
Initial cost ($) 29,191
Annual maintenance cost ($) 88
Solar Panels periodic cost ($) 10,065
Inverter periodic cost ($) 3,550
Annual Savings ($) 1,115
Annual Savings (kwh) 10516 Cost per watt ($/w) 4.41
Table 87. LCC Analysis Results for Incorporating Grid-Connected Photovoltaic System in the Cumberland Road Rest Area Building
LCC Items/Savings Amount/Savings
Annual eliminated CO2 emissions (Ib) 14,827
Number of solar panels on roof 10
Number of solar panels on the ground 19
Required area for solar panels (SF) 270
Tilt angle of solar panels 51 Payback period (yr) 25.9
Figure 90. Cumulative cost of incorporating grid-connected system in the
Cumberland Road rest area building.
-40,000
-20,000
0
20,000
40,000
60,000
80,000
100,000
0 2 4 6 8 10 12 14 16 18 20 22 24 26 28 30 32 34 36 38 40
Years
Cumulative cost
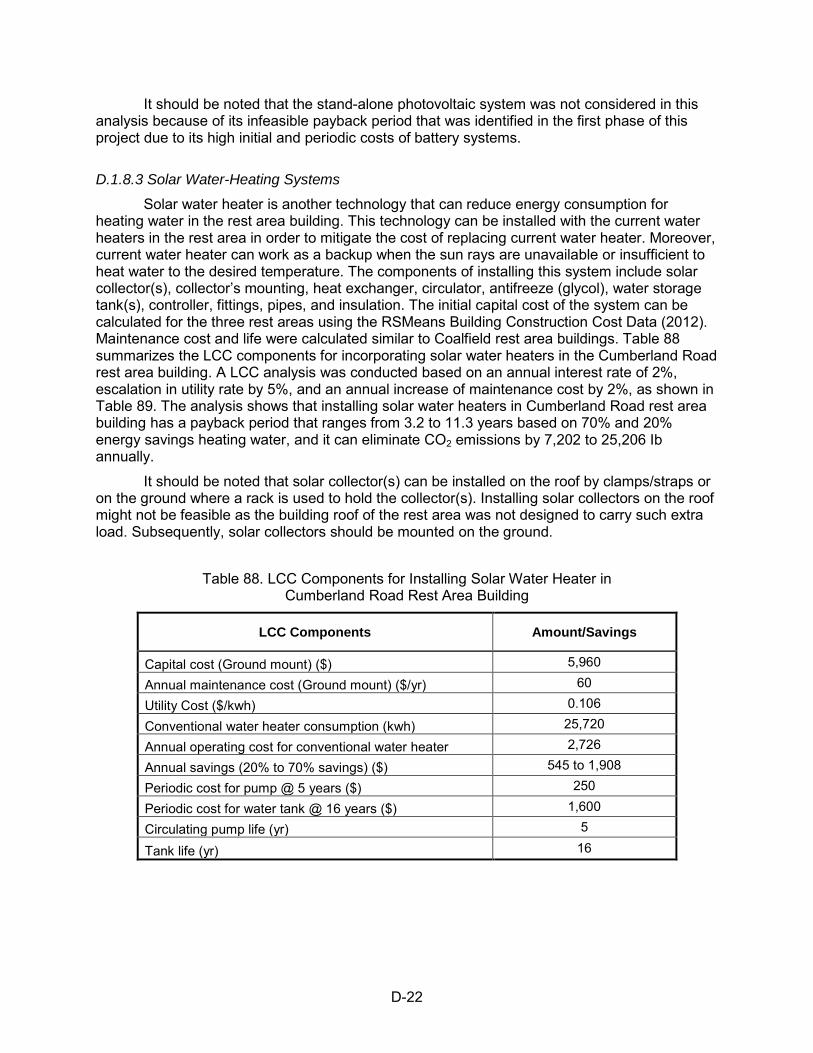
D-22
It should be noted that the stand-alone photovoltaic system was not considered in this analysis because of its infeasible payback period that was identified in the first phase of this project due to its high initial and periodic costs of battery systems.
D.1.8.3 Solar Water-Heating Systems
Solar water heater is another technology that can reduce energy consumption for heating water in the rest area building. This technology can be installed with the current water heaters in the rest area in order to mitigate the cost of replacing current water heater. Moreover, current water heater can work as a backup when the sun rays are unavailable or insufficient to heat water to the desired temperature. The components of installing this system include solar collector(s), collector’s mounting, heat exchanger, circulator, antifreeze (glycol), water storage tank(s), controller, fittings, pipes, and insulation. The initial capital cost of the system can be calculated for the three rest areas using the RSMeans Building Construction Cost Data (2012). Maintenance cost and life were calculated similar to Coalfield rest area buildings. Table 88 summarizes the LCC components for incorporating solar water heaters in the Cumberland Road rest area building. A LCC analysis was conducted based on an annual interest rate of 2%, escalation in utility rate by 5%, and an annual increase of maintenance cost by 2%, as shown in Table 89. The analysis shows that installing solar water heaters in Cumberland Road rest area building has a payback period that ranges from 3.2 to 11.3 years based on 70% and 20% energy savings heating water, and it can eliminate CO2 emissions by 7,202 to 25,206 Ib annually.
It should be noted that solar collector(s) can be installed on the roof by clamps/straps or on the ground where a rack is used to hold the collector(s). Installing solar collectors on the roof might not be feasible as the building roof of the rest area was not designed to carry such extra load. Subsequently, solar collectors should be mounted on the ground.
Table 88. LCC Components for Installing Solar Water Heater in Cumberland Road Rest Area Building
LCC Components Amount/Savings
Capital cost (Ground mount) ($) 5,960
Annual maintenance cost (Ground mount) ($/yr) 60
Utility Cost ($/kwh) 0.106
Conventional water heater consumption (kwh) 25,720
Annual operating cost for conventional water heater 2,726
Annual savings (20% to 70% savings) ($) 545 to 1,908
Periodic cost for pump @ 5 years ($) 250
Periodic cost for water tank @ 16 years ($) 1,600
Circulating pump life (yr) 5
Tank life (yr) 16

D-23
Table 89. LCC Analysis Results for Installing Solar Water Heater in Cumberland Road Rest Area Building
Savings Amount/Savings
Annual kwh saved (20% savings) 5,144
Annual kwh saved (70% savings) 18,004
Annual eliminated CO2 emissions - 20% savings (Ib) 7,202 Annual eliminated CO2 emissions - 70% savings (Ib) 25,206 Payback period - 20% savings (yr) 11.30
Payback period - 70% savings (yr) 3.18
D.1.9 Water-Saving Plumbing Fixtures Rest areas have a high rate of water consumption due to the large number of visitors
that use their restrooms. Using water-conserving fixtures in these rest areas will provide significant savings in water consumption. A number of feasible water-saving technologies can be used to minimize water consumption in the rest areas including efficient faucets, aerators, toilets, and urinals. Currently the Cumberland Road rest area building has low-flow faucets, which make them suitable for conserving water use in the facility. An analysis was conducted to estimate the feasibility of installing conserving toilets and urinals in the rest area building. Table 90 summarizes the analysis of replacing current plumbing fixtures with water-conserving ones. As it was difficult to calculate precisely the number of visitors using urinals or toilets, the analysis assumed that 24% of visitors use urinals and 48% of visitors use men’s and women’s toilets. The replacement of current plumbing fixtures can provide savings of 92.5% of water consumption by urinals and 54.3% of water consumption by toilets. This could result in a total water savings of 768,380 gallons annually. The payback period for these fixtures could not be calculated as water unit cost could not be identified as the rest area uses ground water to supply its needs.
Table 90. LCC Analysis for Replacing Current Urinals and Toilets with Water-Conserving Fixtures in Cumberland Road Rest Area Building
Saving/Cost Items Urinal Toilets Current fixture rate (GPF) 1.6 3.5 Number of fixtures 2 8 Type Wall mount Wall mount Water-conserving rate (GPF) 0.125 1.6 Initial replacement Cost ($) 1,323* 5,640* Savings per flush (G) 1.475 1.9 Percentage savings (%) 92.2% 54.3% Annual visitors 2009 880,380 Annual savings for 24% visitors using urinals and 48% using toilets (gallons) 215,135 554,245
* (RSMeans 2012; Lowe's 2012)

D-24
D.1.10 Summary of All Promising Green Building Measures This section summarizes all green building measures that can be used at the
Cumberland Road rest area building to reduce their energy consumption. All promising green building measures were added in the eQuest model in order to analyze the impact of their collective use and potential interactions on the overall energy consumption of the building. Table 91 summarizes all LCC components, savings and payback periods for all promising green building measures, which were analyzed in the previous sections. The eQuest simulation model and energy analysis shows that the Cumberland Road rest area building can achieve a total of 48.2% reduction in energy costs by implementing the following energy-efficient measures: fluorescent T8 bulbs, induction lighting fixtures for exterior lighting, motion-activated lighting for restrooms, vending occupancy controls, motion sensors for exhaust fans, geothermal heat pump along with desuperheater, energy-efficient hand dryer, solar daylight tubes for restrooms, photovoltaic system with 6.8KW capacity, setting back HVAC at night, and water-conserving fixtures.
Table 91. All Promising Green Building Measures for Cumberland Road Rest Area Building
Green Building Measure
Initial Cost
Annual Maintenance
Cost, If Applicable
Annual Energy Savings
Annual Eliminated
CO2 Emissions
(Ib)
Reduction in Energy
Consumption
Payback Period (yr)
Interior lighting - Fluorescent T8 $793.5 N.A. $393 5,233 1.8%
Immediate payback period
Exterior lighting - induction lighting $27,420 N.A. $2,947 39,202 13.2% 6.2
Motion-activated lighting $871 N.A. $320 4,254 1.4% 2.7
Vending occupancy controls $339 N.A. $335 4,454 1.5% 1.0
Motion-sensor exhaust fans $542 N.A. $473 12,168 4.1% 0.6
Geothermal heat pump $31,570 $325 $1,815 34,742 11.7% 9.5 Desuperheater $1,600 N.A. $705 9,384 3.2% 2.3 Energy-efficient hand dryers $1,092 N.A. $499 6,641 2.2% 2.2
Photovoltaic system $29,191 $88 $1,115 14,827 5.0% 25.9 Solar daylight tubes $7,735 N.A. $342 4,544 1.5% 17.9 Setting back HVAC at night $200 N.A. $442 6,698 2.3% 0.4
Water-conserving fixtures $6,963 N.A. N.A. N.A. N.A. N.A.
All promising green building measures together (eQuest model)
$108,317 $413 $10,745 142,932 48.2% 7.1

D-25
D.2 TURTLE CREEK REST AREA The Turtle Creek rest area is located at 2 miles south of Wisconsin border at mile marker
2 of I-90 and consists of one building that serves the east and west bounds of I-90. The rest area was built in 1980 and has approximately 839 thousand visitors with an annual decrease of 1.05% based on 2009 statistics. The major sources of energy consumption of the rest area include the interior and exterior lighting, heating and cooling, vending machines, hand dryers, pump station, and water heater. The next sections discuss the energy consumption analysis for the rest area building as well as LCC analysis for implementing different green building measures including interior and exterior energy-saving light bulbs, motion-activated lighting, vending occupancy controls, motion exhaust sensors, geothermal heat pumps, Energy Star air-source heat pump, thermal pane glass, energy-efficient hand dryers, photovoltaic systems, solar water heater, solar daylight tubes, and water-saving plumbing fixtures.
D.2.1 Energy Audit and Analysis The Turtle Creek rest area has one utility meter to measure energy consumption in its
building. The utility meters can be used to measure the monthly energy consumption of the rest area however they cannot provide energy consumed by each device or equipment in the rest area. In order to identify major sources of energy consumption in the rest area buildings and their costs, an energy simulation model was developed using the eQuest energy simulation software environment. The eQuest software can be used to simulate the energy performance of a building including its construction materials, weather, space heating and cooling, air ventilation, air infiltration and exhaust, temperature control, interior and exterior lighting, water use, windows and doors, skylights, operation schedule and occupancy, building activities, equipment loads. Furthermore, eQuest can account for different scenarios for replacing any of the current equipment or devices in buildings and calculate energy consumption accordingly. This capability of measuring building energy consumption based on different scenarios of implementing various green building measures and equipment will be used to analyze and identify a list of promising BMPs for Turtle Creek rest area.
The Turtle Creek rest area model was developed similar to the Coalfield rest area buildings. The model was developed based on the rest area’s location, square footage, architectural shape, zones, building envelope construction, infiltration, building orientation, operation schedule, building activities, building occupancy, ventilation, HVAC system, temperature control, and water heater. All energy consumption data for the Turtle Creek rest area including lighting, HVAC system, hand dryers, vending machines, ventilation, infiltration, exhaust, occupancy, water pump and water heater were modeled using a similar procedure to the one described earlier for the Coalfield rest area buildings.
After modeling the rest area building in eQuest, the simulation model was run to simulate the building performance with respect to weather conditions throughout the year and calculate monthly and total energy consumption categories of the building. Due to the difficulty to measure air infiltration rates for entry doors during the site visit; several runs of simulation model were conducted with varying reasonable rates of infiltration and ventilation in order to minimize the differences between simulated and actual energy consumption reported in the building’s energy bills. The parameters of infiltration were eventually set in the model to 93 CFM/ person for restrooms, lobby, and vending area, 490 CFM/person for mechanical room, and 442 CFM/person for storage room. Similarly, infiltration rates were set to 1.36 air change per hour to account for double doors entry of the rest area. Figure 91 and Figure 92 compare the simulated monthly electricity and gas consumption respectively of the building based on the developed model in eQuest to the actual energy consumption reported in the utility bills of the Turtle Creek rest area building in 2009. Based on the results in Figure 91 and Figure 92, the average

D-26
absolute differences between the electricity and gas consumption for the developed simulation model and actual bills are 6% and 14.9% respectively. The maximum and minimum difference in electricity consumption between the developed simulation model and actual bills are 16.1% in December and 0.7% in January respectively. Similarly, the maximum and minimum difference in gas consumption between the developed simulation model and actual bills are 32.8% in November and 1.7% in September respectively.
Figure 91. Simulated and actual electricity consumption of
Turtle Creek rest area building in 2009.
Figure 92. Simulated and actual gas consumption of
Turtle Creek rest area building in 2009.
It should be noted that the number of visitors per day was assumed to be constant throughout the year. Therefore, the difference in energy consumption between the eQuest simulation model and energy bills can be caused by the varying number of visitors per day which affects the building’s heating and cooling energy consumption as well as its water use. In addition, the occasional and varying use of other small devices such as a microwave, laptop, small fan or heater unit that were observed during the site visits in the maintenance room can contribute to this difference between the simulation results and the energy bills.
The square footage of Turtle Creek rest area building is 3575 SF and its annual number of visitors is 838,770 which leads energy consumption rates of 59.4kwh/SF per year plus 0.88 therm/SF per year, 6.76 $/SF per year, and 2.88 cents/visitor/yr. The breakdown of electricity cost for the Turtle Creek rest area building among its main sources of consumption is shown in
Figure 93. The eQuest energy simulation model shows that the highest energy consumption (35%) of the rest area building is represented in space heating while the lowest energy consumption of the building is represented in hand dryers, water pump, and water cooler
0
5000
10000
15000
20000
25000
30000
Jan Feb Mar Apr May Jun Jul Aug Sep Oct Nov Dec
Actual (Bills)
Simulation model
Electricity Consumption (KWH)
Year (2009)
0
100
200
300
400
500
600
700
Jan Feb Mar Apr May Jun Jul Aug Sep Oct Nov Dec
Actual (bills)
Simulation
Gas Consumption (Therm)
Year (2009)

D-27
at 3%,3%, and 2% respectively. The “others” category includes small equipment and devices such as vacuum cleaners, coffee machines, microwave, personnel laptop, etc., that are occasionally used in the rest area building and were not considered in the simulation model. This breakdown of energy costs will helps in prioritizing energy-improvement efforts for the rest area building.
Figure 93. Energy cost breakdown for Turtle Creek rest area building.
D.2.2 Lighting Lighting in the Turtle Creek rest area represents approximately 21% of total energy
consumption with an annual cost of $5,233. The following two subsections analyze replacing current interior and exterior lighting with more-efficient and energy-saving bulbs. The economic analysis of light replacement in these two sections assumes an annual interest rate of 2% and escalation in utility rate of 5%.
D.2.2.1 Interior Lighting
Interior lighting in the Turtle Creek rest area consists of linear and U-shape fluorescent T12 bulbs. These bulbs can be replaced by linear and U-shaped fluorescent T8 to provide similar luminance level, less energy consumption and longer life expectancy. Table 92 through Table 95 summarizes the impact of replacing current T12 with T8 fluorescent light bulbs for the Turtle Creek rest area. These lighting replacements can provide annual saving of $617 and reduce total energy consumption by 2.5%. The conducted LCC analysis for replacing all current T12 lighting with T8 bulbs is shown in Figure 94. The average payback period for all light replacement is 1.75 years, which represents a green building measure with promising return on investment.

D-28
Table 92. Replacing U-Shape Fluorescent T12 Bulbs with Energy-Efficient T8 Light Bulbs in
Lobby and Restrooms of Turtle Creek Rest Area Building
Lighting Characteristics, Costs, and Savings Current Fixtures/Bulbs
Replacement Fixtures/Bulbs
Type of bulb Fluorescent (T12) Fluorescent (T8)
Sylvania (FB34/CW/6/SS/ECO)
Sylvania (FBO28/841/XP/SS/ECO)
Number of bulbs 62 62 Mean lumens (lumen) 2279 2265 Kelvin temperature (K) 4200 4100 Color Rendering Index (CRI) 62 75 Life time (hr) 18000 26000 Consumption per bulb (watt) 34 28 Lamp cost ($/each) 9.99 15.79 Change in lumens output levels (%) N.A. -0.6 Reduction in energy consumption (%) N.A. 17.6 Annual savings in energy consumption - first year ($/yr) N.A. 326
Payback period (yr) N.A. 2.17
Table 93. Replacing Linear Fluorescent T12 Bulbs with Energy-Efficient T8 Light Bulbs in Restrooms and Maintenance Room of Turtle Creek Rest Area Building
Lighting Characteristics, Costs, and Savings Current Fixtures/Bulbs
Replacement Fixtures/Bulbs
Type of bulb
Fluorescent (T12) Fluorescent (T8)
(assumed) Sylvania 22234
(FO32/25W/841/ XP/SS/ECO)
Number of bulbs 38 38 Mean lumens (lumen) 2279 2327 Kelvin temperature (K) 4200 4100 Color Rendering Index (CRI) 62 85 Life time (hr) 20000 36000 Consumption per bulb (watt) 34 25 Lamp cost ($/each) 1.73 8.99 Change in lumens output levels (%) N.A. +2.1 Reduction in energy consumption (%) N.A. 26.4 Annual savings in energy consumption - first year ($/yr) N.A. 268
Payback period (yr) N.A. 0.94 and 2.74* Payback period for restrooms and maintenance room.

D-29
Table 94. Replacing Fluorescent T12 (U-Shape) Bulbs with Energy-Efficient T8 Light Bulbs in Tourism Office of Turtle Creek Rest Area Building
Lighting Characteristics, Costs, and Savings Current Fixtures/Bulbs
Replacement Fixtures/Bulbs
Type of bulb
Fluorescent (T12) 24'' Fluorescent (T8) 24''
Sylvania Cool White F20T12/CW 20W
Sylvania 21770 (FO17/741/ECO)
Number of bulbs 4 4 Mean lumens (lumen) 1200 1325 Kelvin temperature (K) 4200 4100 Color Rendering Index (CRI) 62 75 Life time (hr) 18000 20000 Consumption per bulb (watt) 20 17 Lamp cost ($/each) 1.89 5.79 Change in lumens output levels (%) N.A. +10.4 Reduction in energy consumption (%) N.A. 15 Annual savings in energy consumption - first year ($) N.A. 4 Payback period (yr) N.A. 5.84
*Tourism office lighting is used approximately 9 hr per day.
Table 95. Replacing Fluorescent T12 bulbs with Energy-Efficient T8 Light Bulbs in Tourism Office of Turtle Creek Rest Area Building
Lighting Characteristics, Costs, and Savings Current Fixtures/Bulbs
Replacement Fixtures/Bulbs
Type of bulb
Fluorescent (T12) Fluorescent (T8)
30T12/CW/RS/EW, ALTO (assumed)
Sylvania 22233 (FO32/25W/835/XP/
SS/ECO) Number of bulbs 10 8 Mean lumens (lumen) 1950 2475 Kelvin temperature (K) 4100 4100 Color Rendering Index (CRI) 62 75 Life time (hr) 18000 36000 Consumption per bulb (watt) 25 25 lamp cost ($/each) 3.5 7.99 Change in lumens output levels (%) N.A. +1.5 Reduction in energy consumption (%) N.A. 20 Annual savings in energy consumption - first year ($) N.A. 16 Payback period (yr) N.A. 1.9*
*Tourism office lighting is used approximately 9 hr per day.

D-30
Figure 94. Cumulative costs, savings, and CO2 emissions for current and replacement lighting in
Turtle Creek rest area building.
D.2.2.2 Exterior Lighting
This section analyzes the impact of replacing current exterior lighting of Turtle Creek rest area with LED and induction lighting. The average lighting operating hours was determined based on eQuest simulation model which accounts for the location of the rest area building and its seasonal operational hours. The average lighting hours of exterior lighting was calculated to be 8.74 hours. The current exterior lighting of Turtle Creek rest area consists of (1) fifteen recessed lighting fixtures with 100 watt MH bulbs in each; and (2) two lighting towers with a total of sixteen 400 watt HPS bulbs. Due to the unavailability of the exact brand and luminance characteristics of current exterior lighting, reasonable assumptions were made for their luminance levels given the fact that the luminance characteristics are not significantly affected by the manufacturers.
A LCC analysis was conducted to examine the feasibility of implementing a one-for-one replacement of current exterior lighting of the rest area building, its parking lot, as well as entrance and exit with LED and induction lighting. The conducted analysis considered the possible lighting fixtures and bulbs shown in Table 96 as recommended by manufactures. It should be noted that LCC was conducted for one-for-one replacement to reduce initial costs. This one-for-one replacement is expected to reduce the current total lighting output (lumen) of light towers by 60% and 64% for LED and induction lighting replacements, respectively; and recessed fixtures by 33% and 38% for LED and induction lighting replacements, respectively. It should be noted that despite the lower average luminance of LED and induction lighting compared to HPS lighting, LED and induction lighting provide higher Color Rendering Index (CRI) than HPS lighting. CRI measures the effect of a light source on the perceived color of object and surface. Having high value of CRI makes virtually all colors look natural and reduces glare (Light Sout Services 2010).
The components and results of the conducted analysis of one-for-one replacements are summarized in Table 97 and Table 98 for all lighting fixtures/bulbs of the rest area. The cumulative cost and savings as well carbon footprint and reductions in CO2 emissions for replacing exterior lighting of Turtle Creek rest area are shown in Figure 95. The analysis shows that these light replacements can provide annual savings of $1,199 or 4.96% of total energy consumption for LED lighting replacements and $1,167 or 4.83% of total energy consumption for induction lighting replacements. This leads to a payback period of 21.2 years for LED light replacements and 6.2 years for induction lighting replacements.
-50000
0
50000
100000
150000
200000
250000
300000
0 2 4 6 8 10 12 14 16 18 20 22 24 26 28 30
Current Bulbs
Replacement Bulbs
Cumulative annual Savings
Cost ($)
n (Years)0
200000
400000
600000
800000
1000000
1200000
1400000
0 2 4 6 8 10 12 14 16 18 20 22 24 26 28 30
Current BulbsReplacement Bulbs
CO2 emissions (IBS)
n (Years)

D-31
Table 96. Characteristics of Current and Replacement Lighting for Exterior Lighting of Turtle Creek Rest Area Building
Table 97. Replacing HPS 400W Bulbs with Energy-Efficient LED and Induction Light Bulbs in Turtle Creek Rest Area Building
Building Factors Current Fixtures/Bulbs
Replacement 1
Replacement 2
Type of bulb HPS LED Induction Number of bulbs 12 12 12 Initial lumens (lumen) 45000 20000 18000 Kelvin temperature 2100 2700-8000 5000 Color Rendering Index (CRI) 20 75 83 Life time (hr) 24000 50000 75000 Consumption per bulb, including ballast (watt) 481 224 230 Bulb cost ($) 54 1,493 538 Installation cost ($) 102 102 102 Reduction in lumens output levels (%) N.A. 60% 64 Reduction in energy consumption (%) N.A. 53% 52 Annual savings in energy - first year ($/year) N.A. 984 961 Payback period N.A. 20.7 5.7
Table 98. Replacing HPS 100W Bulbs with Energy-Efficient LED and Induction
Light Bulbs in Turtle Creek Rest Area Building
Building Factors Current Fixtures/Bulbs
Replacement 1
Replacement 2
Type of bulb MH LED Induction Number of bulbs 15 15 15 Initial lumens 5200 3000 3500 Kelvin temperature 3000 3000-5000 5000 Color Rendering Index (CRI) 75 80 82 Life time (jr) 10000 50000 100000 Consumption per bulb, including ballast (watt) 125 80 82 Bulb cost ($) 33 405 248 Reduction in lumens output levels (%) N.A. 33 38 Reduction in energy consumption (%) N.A. 36 34 Annual savings in energy - first year ($/year) N.A. 215 206 Payback period N.A. 22.7 7
Type Characteristics Type Characteristics Type CharacteristicsMean Lumens (lumen) MH 100w 9000 LED Lamp 6000 Induction Lamp 5600
Color temperature (Kelvin) 4200 3000-5000 2700-6500Color rendering index (CRI) 93 80 83
Life time (hours) 2400 50000 100000Consumption (w) 100 80 80
Lamp cost ($) 80 405 248Lamp and fixture cost ($) - - -
Initial Lumens (lumen) HPS 400w 50000 LED Steet Light 20000 Induction Steet 18000Color temperature (Kelvin) 2100 2700-8000 Light 5000Color rendering index (CRI) 20 75 83
Life time (hours) 24000 50000 75000Consumption (w) 400 224 225
Lamp cost ($) 54 - -Lamp and fixture cost ($) - 1493 538
Light Characteristic items Replacement (LED lighting) Replacement (Induction light)Current lighting

D-32
Figure 95. Cumulative costs, savings, and CO2 emissions for LED and induction lighting
replacements for Turtle Creek rest area building.
D.2.3 Motion Sensors Rest areas have different operational schedule than business and commercial buildings
and they have to operate 24 hours a day with few or no occupants during low visitation periods at night. This makes motion sensors a promising technology for rest area buildings. This section analyzes the implementation of motion sensors to control the lighting of restrooms and vending machine areas. Motion sensors also can be used to reduce space heating and cooling by reducing the use of exhaust fans at night when there are few or no occupants in the restrooms.
In order to estimate the energy savings in lighting and exhaust fans, the research team developed a separate simulation model using EZstrobe simulation language (Martinez 2006) to analyze and simulate the use of restrooms and vending machines based on the number and frequency of rest area visitors. The simulation model was developed to mimic the utilization of the rest area facilities by its visitors. The model was created to generate the number of visitors to the rest area using a beta distribution function to represent a high frequency of visitors during the morning, noon, and afternoon hours and low frequency during the night and early morning hours. The model also assumes that the percentages of visitors who will use the men’s restroom, women’s restroom, and vending machines are 40%, 40%, and 20%, respectively. Similarly, the probabilities that restroom visitors will use urinals, toilets and only faucets were assumed to be 30%, 60%, and 10%, respectively with reasonable random durations for each of these restroom tasks as, shown in Figure 96. It should be noted that the model assumes that each visitor using the toilet or urinal will also use the faucet afterwards. The developed model accounts for an amount of time for sensors to keep the light on after a visitor leaves a restroom. After a visitor leaves the restroom, the model assumes that there is a probability of 60% that the visitor will leave the rest area and 40% will use vending machines. The developed model can estimate how long the lighting in restrooms of the rest area will be turned off if motion-activated lighting were implemented in the restrooms. Similarly, the amount of time that lighting in vending machines and exhaust fans being turned/switched off can be calculated by the developed simulation model. Figure 97 shows rest area visitors while being in the men’s restroom throughout a simulation day. Table 99 summarizes the percentages of occupancy for restrooms and vending machines of the Turtle Creek rest area assuming that the lights or fans remain turned on for 5 minutes after the departure of the last visitor. The following subsections use the developed simulation model to estimate potential savings for using motion sensors in the rest area building and their expected payback periods. The economic analysis of motion sensors accounts for an annual interest rate of 2% and escalation in utility rate of 5% in calculating payback period of implementing this technology.
0
500
1000
1500
2000
2500
0 2 4 6 8 10 12 14 16 18 20 22 24 26 28 30
CO2 emissions (IBS)
Thou
sand
s
n (Years)
"current exterior lighting"
LED Emission
Induction Emission
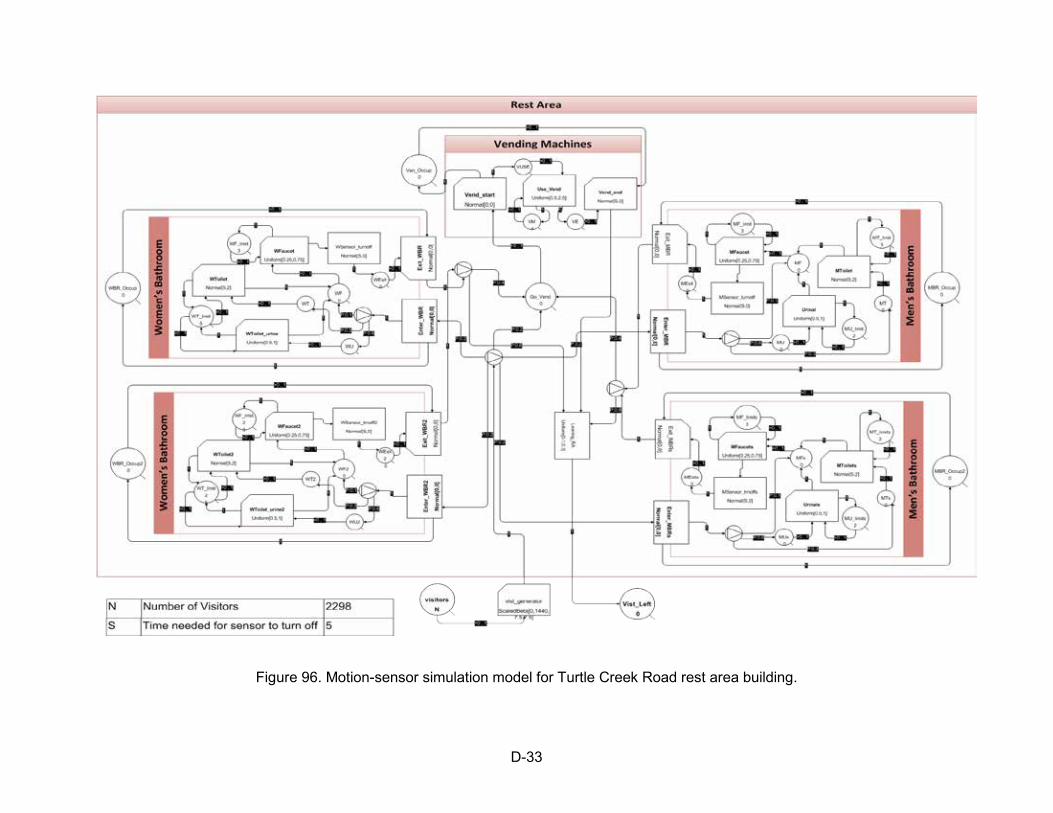
D-33
Figure 96. Motion-sensor simulation model for Turtle Creek Road rest area building.

D-34
Figure 97. Number of visitors in men’s restroom throughout a
simulation day in Turtle Creek rest area Building.
Table 99. Percentage Occupancy for Restrooms and Vending Area in
Turtle Creek Rest Area Building
Percentage of Occupancy In Men’s
Restrooms
Percentage Occupancy In
Women’s Restrooms
Percentage Average
Occupancy In All Restrooms
Percentage Occupancy In Vending
Machines Area
55.1% 53.9% 54.5% 47.4%
D.2.3.1 Motion-Activated Lighting
Motion-activated lighting can be installed in restrooms to turn off lights automatically when they are not occupied. As discussed in the previous section, restrooms in the Turtle Creek rest area have an average approximate occupancy of 54.5% including 5 minutes for the occupancy sensors remain in detection before turning off automatically. This leads to average 45.5 savings in lighting of restrooms. Table 100 shows the results of the LCC analysis for implementing motion-activated lighting in the restrooms of the Turtle Creek rest area. The analysis shows that the motion-activated lighting can provide approximate savings of $786 annually or 3.3% of total energy cost of the Turtle Creek rest area building which represents a payback period of 2 years. Furthermore, motion-activated lighting in restrooms can eliminate annually 11,083 Ib of CO2 emissions.
Implementing motion-activated lighting in the lobby will not be feasible due to security requirements that require lights to be turned on at all times to ensure the proper operation of the surveillance cameras. Moreover, implementing motion-activated lighting in maintenance rooms will not provide much savings and the payback period will be long since the maintenance staff often turn off the light before leaving the mechanical rooms of the rest area.
0
1
2
3
4
5
6
7
8
0 200 400 600 800 1000 1200 1400
Simulation Time
Number of Visitors in one of the Men's Bathrooms
Midnight Midnight6:00AM 6:00PMNoon

D-35
Table 100. Motion-Activated Lighting Analysis for Restrooms of Turtle Creek Rest Area Building
Savings and Cost Items Amount/Savings Total load of lighting fixtures (watt) 1972 Electricity cost ($/kwh) 0.1 Occupancy sensors cost ($) 536 Labor installation cost ($) 1,020 Total Initial cost ($) 1,556 Lighting operation time (hr) 24 Annual lighting energy cost for restrooms ($) 1,727 Annual lighting energy savings ($) 786.00 Payback period (yr) 1.99 Amount of eliminated CO2 (Ib) 11,083
Savings in total energy consumption of the rest area building (%) 3.3
D.2.3.2 Vending Occupancy Controls
Similar to motion-activated lighting, occupancy controls can be installed for vending machines to turn off their lighting when the vending area is not occupied. Based on the developed simulation model for motion sensors, lights of vending machine are expected to be on for approximately 47.4% of hours during the day assuming a duration of 5 minutes for the sensors to remain on after detecting the last motion in the vending area. This leads to 52.6% lighting savings of the vending machines area. Table 101 shows the economic analysis of installing occupancy controls for vending machines area in the Turtle Creek rest area. The analysis shows that these occupancy controls for vending machines can provide approximate savings of $276 annually or 1.1% of total energy cost of the Turtle Creek rest area building which leads to a payback period of 1.24 years. This measure can also eliminate 3,898 Ib of CO2 emissions annually due to the achieved reduction in energy consumption.
Table 101. Occupancy Controls Analysis for Vending Machine in
Turtle Creek Rest Area Building
Motion-Activated Lighting Analysis Amount/Savings Total load of vending machines lighting (watt) 600 Electricity cost ($/kwh) 0.1 Occupancy sensors cost ($) 120 Labor installation cost ($) 219 Total Initial cost ($) 339 Lighting operation time (hr) 24 Annual lighting energy cost for restrooms ($) 526 Annual lighting energy savings ($) 276 Payback period (yr) 1.24 Amount of eliminated CO2 (Ib) 3,898 Savings in total energy consumption of the rest area building (%) 1.1

D-36
D.2.3.3 Motion Sensors for Exhaust
Similar to motion-activated lighting, exhaust fans can operate only during the occupancy times of visitors. This will allow exhaust fans to be switched off automatically when there are no visitors, which will decrease the amount of outside air that needs to be heated or cooled. eQuest software does not provide a direct method to account for the use of exhaust fan sensors, however, this can be modeled by decreasing the exhaust rate by a value which reflects the switching off of exhaust fans when there are no occupants. Accordingly, exhaust fan flow can be decreased with the average non-occupancy percentage of restrooms (41.6%). Table 102 summarizes the economic analysis results for implementing motion sensors for exhaust fans in rest area building. The analysis shows that motion sensors for exhaust fans can provide approximate annual savings of $2,249 annually or 9.3% of total energy consumption of Turtle Creek rest area building, which leads to a payback period of 0.6 years. This measure can also eliminate 31,710 Ib of CO2 emissions annually due to the reduction in energy consumption of heating and cooling.
Table 102. LCC Analysis Results for Implementing Motion-Sensor Exhaust Fans in
Turtle Creek Rest Area Building
Savings and Cost Items Amount/Savings Electricity cost ($/kwh) 0.1 Gas cost ($/therm) 0.936 Fan(s) and sensors cost($) 866 Labor installation cost ($) 437 Total Initial cost ($) 1,303 Annual electricity savings (kwh) 22490 Annual gas savings (therm) 0 Annual energy savings ($) 2,249 Payback period (yr) 0.59 Amount eliminated CO2 (Ib) 31,710 Savings in total energy consumption of the rest area building (%) 9.3
D.2.4 More-Efficient HVAC Systems The current HVAC system at the Turtle Creek rest area consists of a split system with
four condensers and three electric resistance duct heaters. The system has an assumed cooling capacity of about 15 tons and approximate total heating capacity of 75KW. The current HVAC system can be replaced with a more energy-efficient system that reduces heating and cooling energy consumption. The following three subsections analyze the replacement of the current HVAC system with more-efficient units and setting back the temperature at night.
D.2.4.1 Geothermal Heat Pump
The existing HVAC system in the Turtle Creek rest area building operates continuously all year round and its consumption represents 47% of the total rest area consumption. Ground-source heat pump can be more efficient than air-source heat pump as it uses the nearly constant temperature of earth (55°F) to heat and cool buildings. The eQuest simulation environment can be used to model the use of a geothermal HVAC system for the Turtle Creek rest area building. The system was modeled to have heating coefficient of performance (COP)

D-37
of 4.0 and a cooling efficiency of 18 EER. This system was also modeled to operate in economizer mode, which brings fresh air when the outside air temperature is sufficient to condition the space. After running the eQuest model with geothermal heat pump, the model provides savings of 26% of total energy consumption. The installation and maintenance costs of geothermal heat pump were calculated similar to Coalfield rest area buildings. Table 103 summarizes the LCC components of replacing the current HVAC system with a geothermal heat pump.
Table 103. LCC Components for Replacing Current HVAC System with
Geothermal Heat Pump in Turtle Creek Rest Area Building
LCC Components Cost/Life Capital cost - vertical system* ($) 62,320 Annual maintenance cost ($) 318 Annual operating cost ($) 5,089 Periodic cost ($) 38,320 Life (yr) 20
* Installation cost may vary due to soil conditions and resizing of the HVAC equipment
In order to compare the cost effectiveness and payback periods of replacing the current HVAC system at the rest area with a geothermal system, the initial, maintenance, operating and replacement costs of the current HVAC systems need to be identified. These costs were estimated similar to the Coalfield rest area buildings in order to carry out the LCC analysis. Table 104 summarizes the LCC components for the current HVAC system in the Turtle Creek rest area building.
Table 104. LCC Components for Current HVAC System in the
Turtle Creek Rest Area Building
Rest Area/LCC Components Cost/Life
Capital cost ($) 24,420 Annual maintenance cost ($) 684 Annual operating cost ($) 11,370 Periodic cost ($) 24,420 Life (yr) 17 Manufacture year 1992 Replacement year 2009
A LCC analysis was conducted to compare the potential replacement of the current HVAC system with a geothermal heat pump based on an annual interest rate of 2%, escalation in utility rate of 5%, and annual increase of maintenance cost by 2%. Table 105 summarizes the LCC analysis results for replacing current HVAC with geothermal heat pump. This analysis shows that, geothermal heat pump can provide savings of $6,281 annually or 26% of total energy cost. The analysis shows that replacing the current HVAC system with a vertical loop geothermal heat pump has a payback period of 5.5 years. The cumulative costs for a vertical loop geothermal system, current HVAC system, and savings are shown in Figure 98. The geothermal heat pump can also be installed along with a desuperheater to heat water in the

D-38
cooling season. The desuperheater uses heat that is removed from the building space to heat domestic hot water. This unit can provide free hot water in the summer or when the system is in cooling mode. It can provide annual savings of $301 or 1.2% of the total energy consumption. The payback period of the desuperheater is 5.1 years and it can eliminate 4,251 Ib of CO2 emissions.
Table 105. LCC Analysis Results for Replacing Current HVAC System with Geothermal Heat Pump at Turtle Creek Rest Area Building
Savings Amount Annual electricity saved (kwh) 44,890 Annual gas saved (Therm) 1,915 Annual energy savings - first year ($/yr) 6,281 Percentage of total energy saved (%) 26.0 Annual eliminated CO2 emissions (Ib) 85,700 Payback period - vertical system (yr) 5.5
Figure 98. Cumulative costs of current HVAC system, vertical loop geothermal
system, and savings for Turtle Creek rest area building.
D.2.4.2 High-Efficiency Air-Source Heat Pump
Another alternative for the current HVAC system in the Turtle Creek rest area is replace it with a more-efficient Energy Star–rated, air-source heat pump to reduce heating and cooling expenses. An air-source heat pump was modeled in eQuest to meet Energy Star recommendations with cooling efficiency of 12 EER and heating performance rating of 8.2 HSPR (Energy Star 2003). Table 106 summarizes the economic analysis results for replacing the current HVAC system with an Energy Star–rated air-source heat pump. The analysis shows that Energy Star–rated HVAC systems can provide annual savings of $1,809 annually or 7.5% of total energy consumption of the rest area building. This leads to a payback period of 12.3 years based on an annual interest rate of 2% and escalation in utility rate of 5%. This replacement can eliminate CO2 emissions by 22,638 Ib annually.
-200,000
0
200,000
400,000
600,000
800,000
1,000,000
1,200,000
0 1 2 3 4 5 6 7 8 9 10 11 12 13 14 15 16 17 18 19 20 21 22 23 24 25 26 27 28 29 30
Geothermal Heat Pump - Vertical System
Current HVAC System
Cumulative Savings
Years
Cost ($)

D-39
Table 106. Analysis Results for Replacing Current HVAC System with Energy- Efficient Air-Source Heat Pump at Turtle Creek Rest Area Building
Savings and Cost Items Amount/Savings Electricity cost ($/kwh) 0.1 Gas cost ($/therm) 0.936 Total initial cost for air-source heat pump ($) 12,200 Annual energy savings ($) 1,809 Payback period (yr) 12.3 Amount of eliminated CO2 (Ib) 22,638 Savings in total energy consumption of the rest area building (%) 7.5
D.2.4.3 Setting Back HVAC System at Night
Another method to reduce energy consumption for space heating and cooling of the rest area is to set back the temperature of the HVAC system at night. The number of visitors using the rest area at night is very limited; therefore, it might be worth it to set back the temperature at night to reduce some of the energy consumption for heating and cooling. Temperature can be set at night to 64ᵒF in winter and 72ᵒF in summer. This measure can be modeled in eQuest by editing the temperature set points in the simulation model to a temperature that reflects the set points at night using interpolation. The developed eQuest model showed that setting back the temperature at night can provide annual savings of $92 or 0.4% reduction in total energy consumption. Turtle Creek rest area building has already programmable thermostats, which make this measure easy to be implemented in the rest area facility without any additional costs.
D.2.5 Thermal Pane Glass for Windows and Doors Thermal pane glass is a green building measure that can be added to the rest area
building in order to reduce its cooling and heating energy consumption. This measure requires replacing all glazing as well as doors and windows in the rest area building with double-pane glass. This measure can be modeled in eQuest by replacing current single pane glass with double-pane glass. The analysis of implementing this measure provides annual savings of $596 or 2.5% of total energy consumption, as shown in Table 107. There is no expected payback period for this measure within 30 years as it requires major renovation in the rest area building with high initial cost. This measure can eliminate 8,118 Ib of CO2 annually.
Table 107. LCC Analysis Results for Replacing Current Glazing and Doors
with Double-Pane Glass in Turtle Creek Rest Area Building
Savings and Cost Items Amount/Savings Electricity cost ($/kwh) 0.1 Gas cost ($/therm) 0.936 Total initial cost for double-pane glass glazing and doors ($) 52,124 Annual electricity savings ($) 4140 Annual gas savings (therm) 195 Annual energy savings (kwh) 596 Payback period (yr) More than 30 years Amount of eliminated CO2 (Ib) 8,118 Savings in total energy consumption of the rest area building (%) 2.5
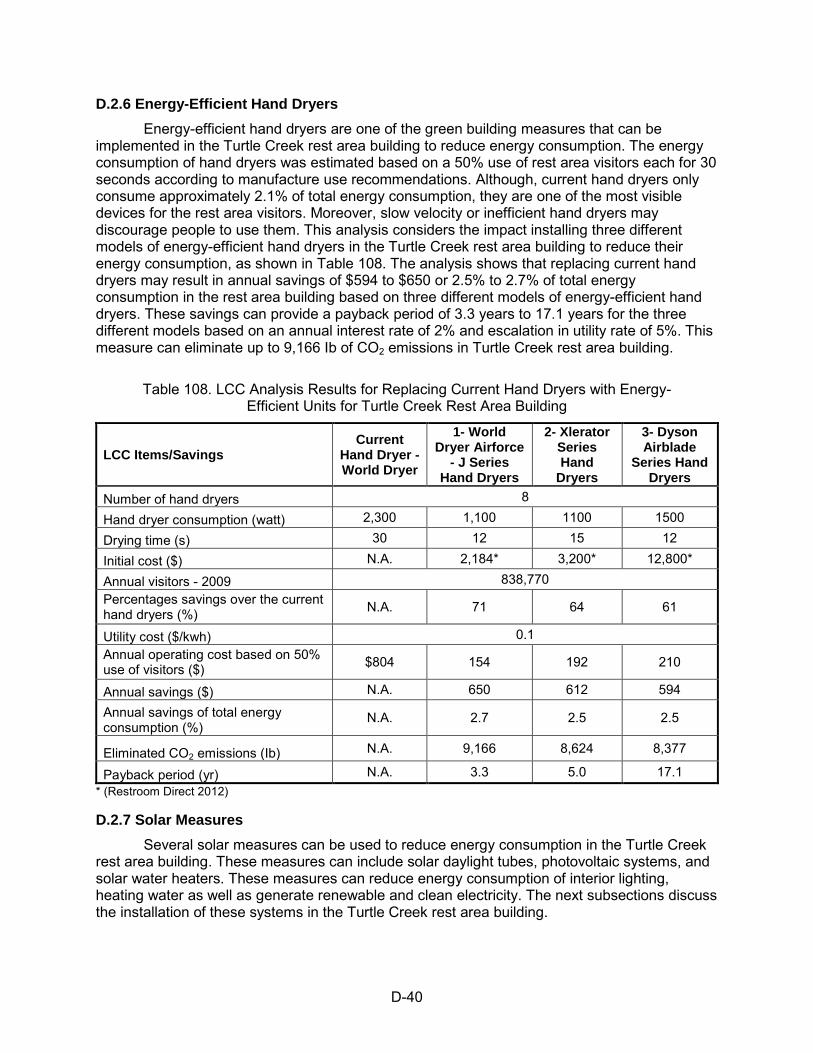
D-40
D.2.6 Energy-Efficient Hand Dryers Energy-efficient hand dryers are one of the green building measures that can be
implemented in the Turtle Creek rest area building to reduce energy consumption. The energy consumption of hand dryers was estimated based on a 50% use of rest area visitors each for 30 seconds according to manufacture use recommendations. Although, current hand dryers only consume approximately 2.1% of total energy consumption, they are one of the most visible devices for the rest area visitors. Moreover, slow velocity or inefficient hand dryers may discourage people to use them. This analysis considers the impact installing three different models of energy-efficient hand dryers in the Turtle Creek rest area building to reduce their energy consumption, as shown in Table 108. The analysis shows that replacing current hand dryers may result in annual savings of $594 to $650 or 2.5% to 2.7% of total energy consumption in the rest area building based on three different models of energy-efficient hand dryers. These savings can provide a payback period of 3.3 years to 17.1 years for the three different models based on an annual interest rate of 2% and escalation in utility rate of 5%. This measure can eliminate up to 9,166 Ib of CO2 emissions in Turtle Creek rest area building.
Table 108. LCC Analysis Results for Replacing Current Hand Dryers with Energy-
Efficient Units for Turtle Creek Rest Area Building
LCC Items/Savings Current
Hand Dryer - World Dryer
1- World Dryer Airforce
- J Series Hand Dryers
2- Xlerator Series Hand
Dryers
3- Dyson Airblade
Series Hand Dryers
Number of hand dryers 8
Hand dryer consumption (watt) 2,300 1,100 1100 1500
Drying time (s) 30 12 15 12
Initial cost ($) N.A. 2,184* 3,200* 12,800*
Annual visitors - 2009 838,770 Percentages savings over the current hand dryers (%) N.A. 71 64 61
Utility cost ($/kwh) 0.1 Annual operating cost based on 50% use of visitors ($) $804 154 192 210
Annual savings ($) N.A. 650 612 594
Annual savings of total energy consumption (%)
N.A. 2.7 2.5 2.5
Eliminated CO2 emissions (Ib) N.A. 9,166 8,624 8,377
Payback period (yr) N.A. 3.3 5.0 17.1 * (Restroom Direct 2012)
D.2.7 Solar Measures Several solar measures can be used to reduce energy consumption in the Turtle Creek
rest area building. These measures can include solar daylight tubes, photovoltaic systems, and solar water heaters. These measures can reduce energy consumption of interior lighting, heating water as well as generate renewable and clean electricity. The next subsections discuss the installation of these systems in the Turtle Creek rest area building.

D-41
D.2.7.1 Solar Tube Lighting
Solar daylight tubes are one of the green building measures that can be used to provide lighting for the building during the day light hours. The technology requires solar tubes to penetrate the building roof to the ceiling where they transmit the sunlight during the day time. This technology can be installed in restrooms to decrease the lighting use during the day light time. It can be installed in the roof of the rest area building while installing light controls in restrooms to control/dim interior lighting during the day. The energy savings that this technology can provide was calculated based on reducing daily lighting use by 5 hours. The analysis for adding solar daylight tubes in the rest area building is summarized in Table 109. Cumulative costs and savings for implementing solar daylight tubes in restrooms and lobby of the rest area are shown in Table 109. The analysis shows that this measure can provide saving of $347 annually or 1.44% of the total energy consumption. This can lead to a payback period of 13.4 years. It should be noted that, the installation of this measure is crucial in terms of the amount of savings that it can provide. Improper installation of solar daylight tubes with low insulation (low U value) can lead to high dissipation of energy and subsequently increase cooling and heating costs. On the other hand, proper installation of this measure with sufficient U value, Energy Star–rated tubes can slightly increase heating and cooling. Based on modeling solar tubes in eQuest with similar skylight areas, this can lead to an increase in energy cost $100 annually. As a result the expected savings of this measure may reduce to $247 annually.
Table 109. LCC analysis Results for Installing Solar Daylight Tubes in
Restrooms and Lobby of Turtle Creek Rest Area Building
Savings and Cost Items Amount Total load of lighting fixtures (watt) 1904 Electricity cost ($/kwh) 0.1 Number of Solar daylight tubes (10' diameter) 4 Number of Solar daylight tubes (18'' diameter) 8 Total Initial cost ($) 6,508 Solar tubes operation time (hr) 5 Annual lighting energy cost ($) 1,668 Annual lighting energy savings ($) 347 Payback period (yr) 13.36 Amount of eliminated CO2 (Ib) 4,899 Savings in total energy consumption of the rest area building (%) 1.44

D-42
Figure 99. Cumulative costs and savings for implementing solar daylight tubes in restrooms of Turtle Creek rest area building.
D.2.7.2 Grid-Connected Photovoltaic Systems
Photovoltaic systems are one of the renewable energy measures that can generate electricity to the Turtle Creek rest area building. In order to perform LCC for installing photovoltaic systems in the rest area, this system needs to be designed to estimate the number and type of system parts. Several factors affect the design of grid-connected systems including average daily peak sun hours, capacity of solar panels, capacity of inverters, and mounting of solar panels. The design of photovoltaic system for the Turtle Creek rest area was conducted using a similar procedure to the one described earlier in the Coalfield rest area.
This measure was analyzed to generate 6% of Turtle Creek total energy consumption. Table 110 summarizes the cost components for installing grid-connected photovoltaic system in the Turtle Creek rest area building. The LCC analysis was conducted in order to determine annual savings, payback period, amount of eliminated CO2 emissions, and required area of the system. The analysis accounted for an annual interest rate of 2%, escalation in utility rate of 5%, and an annual increase of maintenance cost by 2%, as shown in Table 111 The analysis shows that incorporating grid-connected photovoltaic system at the Turtle Creek rest area has a payback period of 26.6 years. The system requires 35 solar panels to be installed, 22 of which can be mounted on the south part of the roof and 13 on the ground south of the rest area building. The required area for solar panels on the ground is 270SF, these calculations accounted for 51ᵒ tilt angle for the solar panels and preventing shading that might occur due to layout of solar panels in winter and summer. Figure 101 shows the cumulative savings of installing a grid-connected system in the rest area building.
-6000-4000-2000
02000400060008000
10000120001400016000
0 2 4 6 8 10 12 14 16 18 20 22 24 26 28 30
Tluorscent (T12)
Fluorescent (T8)
Cumulative annual Savings
Cost ($)
n (Years)
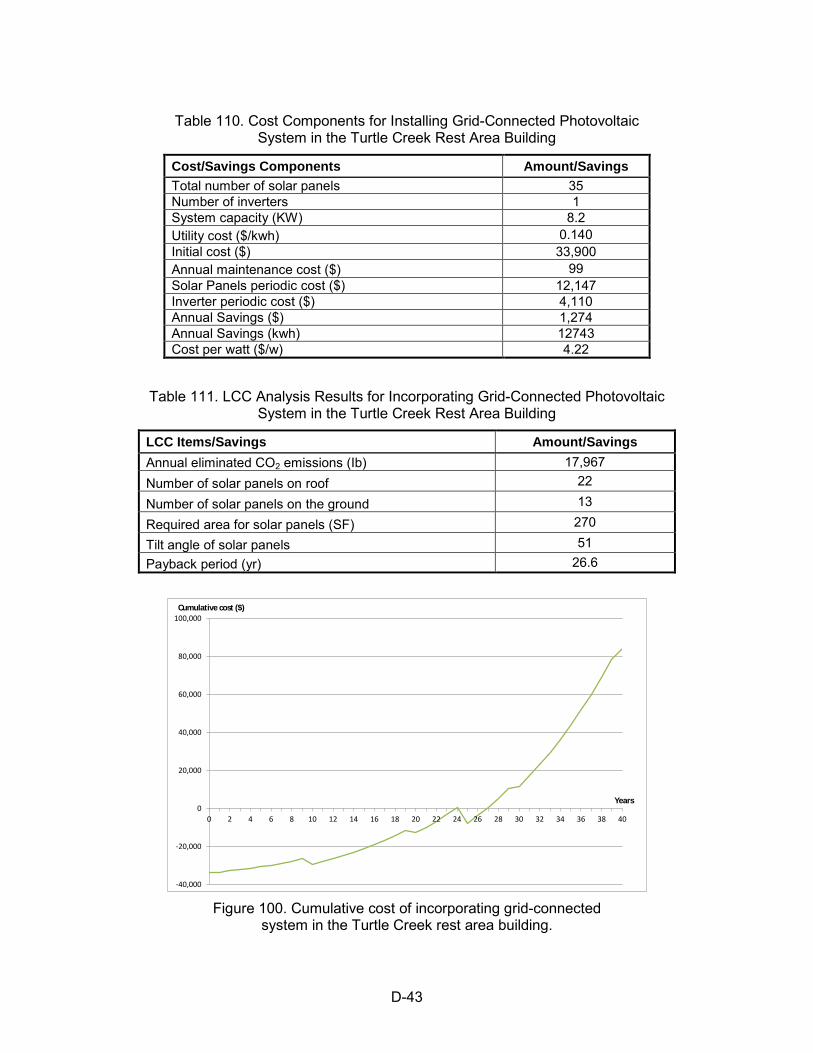
D-43
Table 110. Cost Components for Installing Grid-Connected Photovoltaic
System in the Turtle Creek Rest Area Building
Cost/Savings Components Amount/Savings Total number of solar panels 35 Number of inverters 1 System capacity (KW) 8.2 Utility cost ($/kwh) 0.140 Initial cost ($) 33,900 Annual maintenance cost ($) 99 Solar Panels periodic cost ($) 12,147 Inverter periodic cost ($) 4,110 Annual Savings ($) 1,274 Annual Savings (kwh) 12743 Cost per watt ($/w) 4.22
Table 111. LCC Analysis Results for Incorporating Grid-Connected Photovoltaic System in the Turtle Creek Rest Area Building
LCC Items/Savings Amount/Savings Annual eliminated CO2 emissions (Ib) 17,967 Number of solar panels on roof 22
Number of solar panels on the ground 13
Required area for solar panels (SF) 270
Tilt angle of solar panels 51 Payback period (yr) 26.6
Figure 100. Cumulative cost of incorporating grid-connected
system in the Turtle Creek rest area building.
-40,000
-20,000
0
20,000
40,000
60,000
80,000
100,000
0 2 4 6 8 10 12 14 16 18 20 22 24 26 28 30 32 34 36 38 40
Years
Cumulative cost ($)

D-44
It should be noted that the stand-alone photovoltaic system was not considered in this analysis because of its infeasible payback period that was identified in the first phase of this project due to its high initial and periodic costs of battery systems.
D.2.7.3 Solar Water-Heating Systems
Solar water heater is another technology that can reduce energy consumption for heating water in the rest area building. This technology can be installed with the current water heaters in the rest area in order to mitigate the cost of replacing current water heater. Moreover, current water heater can work as a backup when the sun rays are unavailable or insufficient to heat water to the desired temperature. The components of installing this system include solar collector(s), collector’s mounting, heat exchanger, circulator, antifreeze (glycol), water storage tank(s), controller, fittings, pipes, and insulation. The initial capital cost of the system can be calculated for the three rest areas using the RSMeans Building Construction Cost Data (2012). Maintenance cost and life were calculated similar to Coalfield rest area buildings. Table 112 summarizes the LCC components for incorporating solar water heaters in the Turtle Creek rest area building. A LCC analysis was conducted based on an annual interest rate of 2%, escalation in utility rate by 5%, and an annual increase of maintenance cost by 2%, as shown in Table 113. The analysis shows that installing solar water heaters in Turtle Creek rest area building has a payback period of more than 10 years based on 20% energy savings of heating water, and it can eliminate CO2 emissions by 2,912 to 10,192 Ib annually.
It should be noted that solar collector(s) can be installed on the roof by clamps/straps or on the ground where a rack is used to hold the collector(s). Installing solar collectors on the roof might not be feasible as the building roof of the rest area was not designed to carry such extra load. Subsequently, solar collectors should be mounted on the ground.
Table 112. LCC Components for Installing Solar Water Heater in Turtle Creek Rest Area Building
LCC Components Amount/Savings Capital cost (Ground mount) ($) 8,135 Annual maintenance cost (Ground rack) ($) 81 Utility gas Cost ($/therm) 0.94 Conventional water heater consumption (therm) 1,136 Annual operating cost for conventional water heater ($) 1,063 Annual savings (20% to 70% savings) ($) 223 815 Periodic cost for pump @ 5 years ($) 250 Periodic cost for water tank @ 16 years ($) 1,600 Circulating pump life (yr) 5 Tank life (yr) 16
Table 113. LCC Analysis Results for Installing Solar Water Heater in Turtle Creek Rest Area Building
LCC Items/Savings Amount/Savings Annual gas saved - 20% savings (therm) 249 Annual gas saved - 70% savings (therm) 871 Annual eliminated CO2 emissions - 20% savings (Ib) 2,912 Annual eliminated CO2 emissions - 70% savings (Ib) 10,192 Payback period - 20% savings (yr) More than 30 Payback period - 70% savings (yr) 10.22
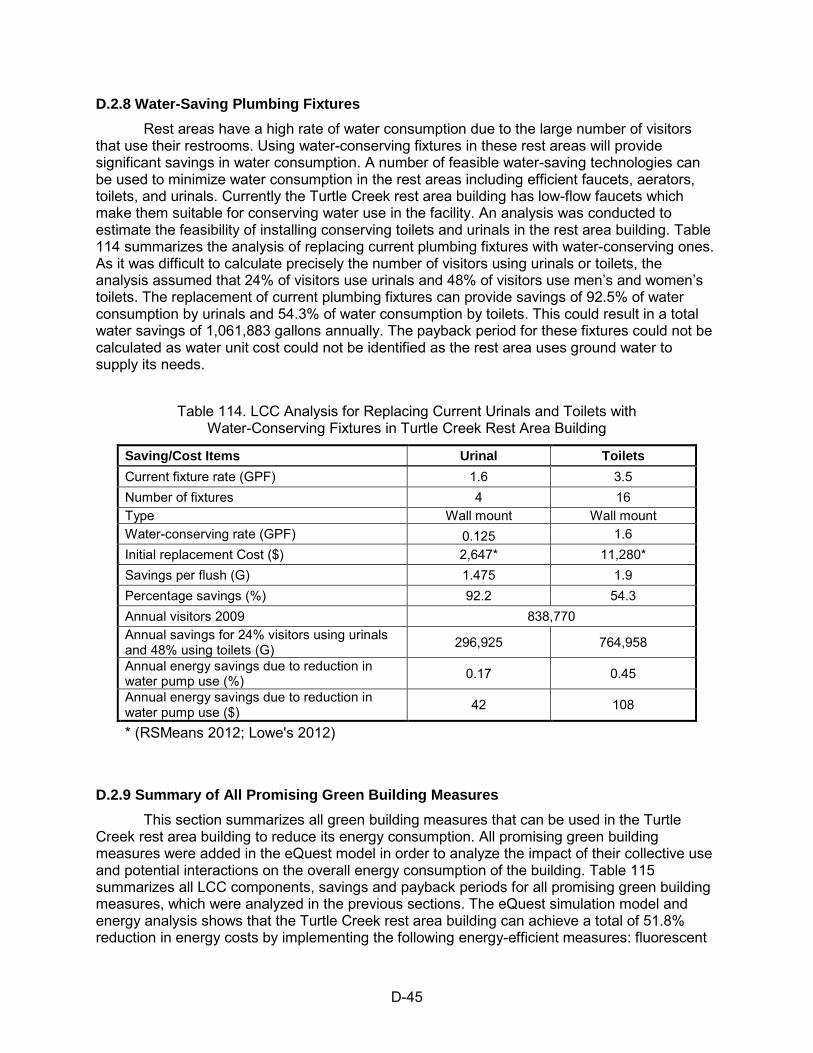
D-45
D.2.8 Water-Saving Plumbing Fixtures Rest areas have a high rate of water consumption due to the large number of visitors
that use their restrooms. Using water-conserving fixtures in these rest areas will provide significant savings in water consumption. A number of feasible water-saving technologies can be used to minimize water consumption in the rest areas including efficient faucets, aerators, toilets, and urinals. Currently the Turtle Creek rest area building has low-flow faucets which make them suitable for conserving water use in the facility. An analysis was conducted to estimate the feasibility of installing conserving toilets and urinals in the rest area building. Table 114 summarizes the analysis of replacing current plumbing fixtures with water-conserving ones. As it was difficult to calculate precisely the number of visitors using urinals or toilets, the analysis assumed that 24% of visitors use urinals and 48% of visitors use men’s and women’s toilets. The replacement of current plumbing fixtures can provide savings of 92.5% of water consumption by urinals and 54.3% of water consumption by toilets. This could result in a total water savings of 1,061,883 gallons annually. The payback period for these fixtures could not be calculated as water unit cost could not be identified as the rest area uses ground water to supply its needs.
Table 114. LCC Analysis for Replacing Current Urinals and Toilets with Water-Conserving Fixtures in Turtle Creek Rest Area Building
Saving/Cost Items Urinal Toilets Current fixture rate (GPF) 1.6 3.5 Number of fixtures 4 16 Type Wall mount Wall mount Water-conserving rate (GPF) 0.125 1.6 Initial replacement Cost ($) 2,647* 11,280* Savings per flush (G) 1.475 1.9 Percentage savings (%) 92.2 54.3 Annual visitors 2009 838,770 Annual savings for 24% visitors using urinals and 48% using toilets (G) 296,925 764,958
Annual energy savings due to reduction in water pump use (%) 0.17 0.45
Annual energy savings due to reduction in water pump use ($) 42 108
* (RSMeans 2012; Lowe's 2012)
D.2.9 Summary of All Promising Green Building Measures This section summarizes all green building measures that can be used in the Turtle
Creek rest area building to reduce its energy consumption. All promising green building measures were added in the eQuest model in order to analyze the impact of their collective use and potential interactions on the overall energy consumption of the building. Table 115 summarizes all LCC components, savings and payback periods for all promising green building measures, which were analyzed in the previous sections. The eQuest simulation model and energy analysis shows that the Turtle Creek rest area building can achieve a total of 51.8% reduction in energy costs by implementing the following energy-efficient measures: fluorescent

D-46
T8 bulbs, induction lighting fixtures for exterior lighting, motion-activated lighting for restrooms, vending occupancy controls, motion sensors for exhaust fans, geothermal heat pump along with desuperheater, energy-efficient hand dryer, solar daylight tubes for restrooms, photovoltaic system with 8.2KW capacity, setting back HVAC at night, and water-conserving fixtures.
Table 115. All Promising Green Building Measures for Turtle Creek Rest Area Building
Green Building Measure Initial Cost
Annual Maintenance
Cost, If Applicable
Annual Energy Savings
Annual Eliminated
CO2 Emissions
(Ib)
Reduction in Energy
Consumption
Payback Period (yr)
Interior lighting - Fluorescent T8 $1,637 N.A. $617 8,701 2.6% 1.8
Exterior lighting - induction lighting $11,400 N.A. $1,167 16,449 4.8% 6.2
Motion-activated lighting $1,556 N.A. $786 11,083 3.3% 2.0 Vending occupancy controls $339 N.A. $276 3,898 1.1% 1.2 Motion-sensor exhaust fans $1,303 N.A. $2,249 31,710 9.3% 0.6 Geothermal heat pump $62,320 $318 $6,281 88,568 26.0% 5.5 Desuperheater $1,600 N.A. $301 4,251 1.2% 5.1 Energy-efficient hand dryers $2,184 N.A. $650 9,166 2.7% 3.3 Photovoltaic system $33,900 $99 $1,274 17,967 5.3% 26.6 Solar daylight tubes $6,508 N.A. $347 4,899 1.4% 13.4
Setting back HVAC at night $0 N.A. $92 1,291 0.4% Immediate payback
Water-conserving fixtures $13,927 N.A. $150 2,120 0.6% N.A. All promising green building measures together (eQuest model)
$136,674 $417 $12,538 176,783 51.8% 9.8
D.3 GREAT SAUK TRAIL REST AREA
The Great Sauk Trail rest area is located at 5 miles west of Princeton, at mile marker 51 of I-80. It consists of two identical buildings that serve the north- and southbound lanes of I-80 and it has approximately 970 thousand visitors based on 2009 statistics. The rest area was built in 1969 and renovated in 1989. The major sources of energy consumption in the rest area include the interior and exterior lighting, heating and cooling, vending machines, hand dryers, pump station, and water heater. The next sections discuss the energy consumption analysis for the rest area buildings as well as LCC analysis for implementing different green building measures including interior and exterior energy-saving light bulbs, motion-activated lighting, vending occupancy controls, motion exhaust sensors, geothermal heat pumps, Energy Star air-source heat pump, thermal pane glass, energy-efficient hand dryers, photovoltaic systems, solar water heater, solar daylight tubes, and water-saving plumbing fixtures.
D.3.1 Energy Audit and Analysis The Great Sauk Trail rest area has two utility meters to measure energy consumption in
each building of the rest area. These two utility meters can be used to measure the monthly energy consumption of each building however they cannot provide energy consumed by each device or equipment in the rest area. In order to identify major sources of energy consumption in the rest area

D-47
buildings and their costs, an energy simulation model was developed using the eQuest energy simulation software environment. The eQuest software can be used to simulate the energy performance of a building including its construction materials, weather, space heating and cooling, air ventilation, air infiltration and exhaust, temperature control, interior and exterior lighting, water use, windows and doors, skylights, operation schedule and occupancy, building activities, equipment loads. Furthermore, eQuest can account for different scenarios for replacing any of the current equipment or devices in buildings and calculate energy consumption accordingly. This capability of measuring building energy consumption based on different scenarios of implementing various green building measures and equipment will be used to analyze and identify a list of promising BMPs for Great Sauk Trail rest area.
The Great Sauk Trail rest area model was developed similar to the Coalfield rest area buildings. The model was developed based on the rest area’s location, square footage, architectural shape, zones, building envelope construction, infiltration, building orientation, operation schedule, building activities, building occupancy, ventilation, HVAC system, temperature control, and water heater. All energy consumption data for the Great Sauk Trail rest area including lighting, HVAC system, hand dryers, vending machines, ventilation, infiltration, exhaust, occupancy, water pump and water heater were modeled using a similar procedure to the one described earlier for the Coalfield rest area buildings.
After modeling the rest area building in eQuest, the simulation model was run to simulate building performance with respect to weather conditions throughout the year and calculate monthly and total energy consumption categories of the building. Due to the difficulty of measuring air infiltration rates for entry doors during the site visit, several runs of simulation model were conducted with varying reasonable rates of infiltration and ventilation in order to minimize the differences between simulated and actual energy consumption reported in the building’s energy bills. The parameters of infiltration were eventually set in the model to 93 CFM/ person for restrooms, lobby, and vending area and 545 CFM/person for mechanical and storage rooms. Similarly, infiltration rate was set to 1.2 air change per hour in the model to account for double doors entry of the rest area and match with energy bills.
Figure 101 compares the simulated monthly energy consumption of the building based on the developed model in eQuest to the actual energy consumption reported in the utility bills of the Coalfield rest area buildings in 2010. Based on the results in Figure 101, the average absolute difference between the energy consumption for the developed simulation model and actual bills is 12.5% and the maximum and minimum difference between the energy consumption for the developed simulation model and actual bills were 35.4% in October and 0.3% in March.

D-48
Figure 101. Simulated and actual electricity consumption of
Great Sauk Trail rest area buildings in 2010.
It should be noted that the number of visitors per day was assumed to be constant throughout the year. Therefore, the difference in energy consumption between the eQuest simulation model and energy bills can be caused by the varying number of visitors per day which affects the building’s heating and cooling energy consumption as well as its water use. In addition, the occasional and varying use of other small devices such as a microwave, laptop, small fan or heater unit that were observed during the site visits in the maintenance room can contribute to this difference between the simulation results and the energy bills. The “other” category includes small equipment and devices such as vacuum cleaners, coffee machines, microwave, personnel laptop, etc., that are occasionally used in the rest area building and were not considered in the simulation model.
The square footage of Great Sauk Trail rest area is 3722 SF per building and its annual number of visitors is 979,660 visitors for both bounds which leads to electricity consumption rate of 68.86 kwh/SF per year, 8.75 $/SF per year, and 0.52 kwh/visitor per year. The breakdown of electricity cost for the Great Sauk Trail rest area buildings for their main sources of consumption is shown in Figure 102. The eQuest energy simulation model shows that the highest source of energy consumption is space heating, which represents 27% of the total energy consumption of the building. On the other hand, the two sources that consume the least energy in the building are hand dryers and a water pump, which represent 2% and 1% of the building’s total energy consumption, respectively. Space heating and cooling comprises 33% of total energy consumption of the building. This breakdown of energy costs will helps in prioritizing energy-improvement efforts. The “other” category includes small equipment and devices such as vacuum cleaners, coffee machines, microwave, personnel laptop, etc., that are occasionally used in the rest area building and were not considered in the simulation model.
The greatest use of energy for heating purposes (approximately 18% of total energy consumption) is caused by air ventilation in the rest area building which represents the outside air that replaces exhausted air from the restroom fans in addition to the outside air that enters the HVAC cycle. Additionally, 3% of the total energy costs is caused by infiltration which requires heating infiltrated air that leaks into the building mainly due to the frequent opening and closing of the building entry and exit doors (infiltration was modeled in eQuest model by 1.2 air change per hour).
0
5000
10000
15000
20000
25000
30000
35000
Jan Feb Mar Apr May Jun Jul Aug Sep Oct Nov Dec
Actual BillsSimulation
Energy Consumption (KWH)
Year 2010

D-49
Figure 102. Energy cost breakdown of Great Sauk Trail rest area buildings.
D.3.2 Lighting Lighting in the Great Sauk Trail rest area represents approximately 34% of total energy
consumption with an annual cost of $11,144.The following two subsections analyzes replacing current interior and exterior lighting with more-efficient and energy-saving bulbs. The economic analysis of light replacement in these two subsections assumes an annual interest rate of 2% and escalation in utility rate of 5%.
D.3.2.1 Interior Lighting
Interior lighting in the Great Sauk Trail rest area consists of linear fluorescent T12 and T8 bulbs and assumed flood light bulbs. These bulbs can be replaced by more-efficient linear fluorescent T8 and CFL to provide similar luminance levels, less energy consumption and longer life expectancy. Table 116 through Table 118 summarize the impact of replacing current fluorescent T12 and flood with fluorescent T8 and CFL light bulbs for the Great Sauk Trail rest area. These lighting replacements can provide annual saving of $1,139 and reduce total energy consumption by 3.5%. The conducted LCC analysis for replacing all current T12 lighting with T8 bulbs is shown in Figure 103. The average payback period for all light replacement is calculated to be 0.48 years which represents a green building measure with promising return on investment.
Interior Lighting$3,679
11%
Exterior Lighting$7,46523%
Vending Machines
$1,8646%
Hand Dryers$5712%
Water pump $4011%
Water Heater$2,602
8%
Space cooling$1,784
6%
Fans and Exhaust$1,869
6%
Surveliance and weather information
$1,9856%
Water cooler$6362%
Others$7322%
Ventialtion$5,78918%
Infilteration $1,115
3%Envelope$2,043
6%
Space Heating$8,94727%

D-50
Table 116. Replacing Linear Fluorescent T12 Bulbs with Energy-Efficient T8 Light Bulbs in Lobby and Restrooms, Maintenance Rooms and Storage Rooms of Great Sauk Trail Rest Area.
Lighting Characteristics, Costs, and Savings Current Fixtures/Bulbs
Replacement Fixtures/Bulbs
Type of bulb
Fluorescent (T8) Fluorescent (T8) Philips 360131 (F32T8/TL741 PLUS/ALTO)
Sylvania 22179 (FO28/841/XP/SS/ECO)
Number of bulbs 77 77 Mean lumens (lumen) 2660 2562 Kelvin temperature (K) 4200 4100 Color Rendering Index (CRI) 62 85 Life time (hr) 42000 36000 Consumption per bulb (watt) 32 28 Lamp cost ($/each) 6.49 8.99 Change in lumens output levels (%) N.A. -3.7 Reduction in energy consumption (%) N.A. 12.5 Annual savings in energy consumption - first year ($) N.A. 281 Payback period (yr) N.A. 0.57, 1.69, and 6.35* * Payback period for lobby and restrooms, maintenance room, and storage rooms, respectively
Table 117. Replacing Current Halogen Flood Lighting with CFL Light Bulbs in Lobby of Great Sauk Trail Rest Area.
Lighting Characteristics, Costs, and Savings Current Fixtures/Bulbs
Replacement Fixtures/Bulbs
Type of bulb
Halogen Flood Light Bulb CFL
Sylvania * Sylvania 20678 (CF18DD/841)
Number of bulbs 24 24 Mean lumens (lumen) 585 989 Kelvin temperature (K) 2200 2100 Color Rendering Index (CRI) 100 82 Life time (hr) 2500 12000 Consumption per bulb (watt) 50 18 Lamp cost ($/each) 8.49 4.99 Change in lumens output levels (%) N.A. +69 Reduction in energy consumption (%) N.A. 64 Annual savings in energy consumption - first year ($) N.A. 854 Payback period (yr) N.A. 0.41 * Light bulb characteristics were assumed as these characteristics were not available during the site visit.

D-51
Table 118. Replacing Fluorescent T12 bulbs with Energy-Efficient T8 Light Bulbs in Attic of Great Sauk Trail Rest Area Buildings.
Lighting Characteristics, Costs, and Savings Current Fixtures/Bulbs
Replacement Fixtures/Bulbs
Type of bulb Fluorescent (T12) Fluorescent (T8)
Philips 355669 (F60T12/CW/HO) (F60T12/CW/HO/ALTO)
Number of bulbs 4 4 Mean lumens (lumen) 4500 4300 Kelvin temperature (K) 4100 5400 Color Rendering Index (CRI) 62 90 Life time (hr) 12000 20000 Consumption per bulb (watt) 75 58 Lamp cost ($/each) 12.49 24.99 Change in lumens output levels (%) N.A. +4.4 Reduction in energy consumption (%) N.A. 22.7 Annual savings in energy consumption - first year ($) N.A. 5 Payback period (yr) N.A. 9.7* *Storage lighting is assumed to be used 2 hours per day.
Figure 103. Cumulative costs, savings, and CO2 emissions for current and replacement lighting
in Great Sauk Trail rest area buildings.
D.3.2.2 Exterior Lighting
This section analyzes the impact of replacing current exterior lighting of Great Sauk Trail rest area with LED and induction lighting. The average lighting operating hours was determined based on eQuest simulation model which accounts for the location of the rest area building and its seasonal operational hours. The average lighting hours of exterior lighting was calculated to be 8.74 hours. The current exterior lighting of Great Sauk Trail rest area consists of (1) four recessed light fixtures with 50 watt HPS bulbs in each; (2) 17 light poles at entrance and exit of the rest area with a total of eighteen 250 watt HPS bulbs in each; and (3) five lighting towers with a total of twenty-eight 400 watt HPS bulbs. Due to the unavailability of the exact brand and luminance characteristics of current exterior lighting, reasonable assumptions were made for their luminance levels given the fact that the luminance characteristics are not significantly affected by the manufacturers.
-50000
0
50000
100000
150000
200000
250000
300000
350000
400000
0 2 4 6 8 10 12 14 16 18 20 22 24 26 28 30
Current Bulbs
Replacement Bulbs
Cumulative annual Savings
Cost ($)
n (Years)
0
200000
400000
600000
800000
1000000
1200000
1400000
0 2 4 6 8 10 12 14 16 18 20 22 24 26 28 30
Current BulbsReplacement Bulbs
CO2 emissions (IBS)
n (Years)
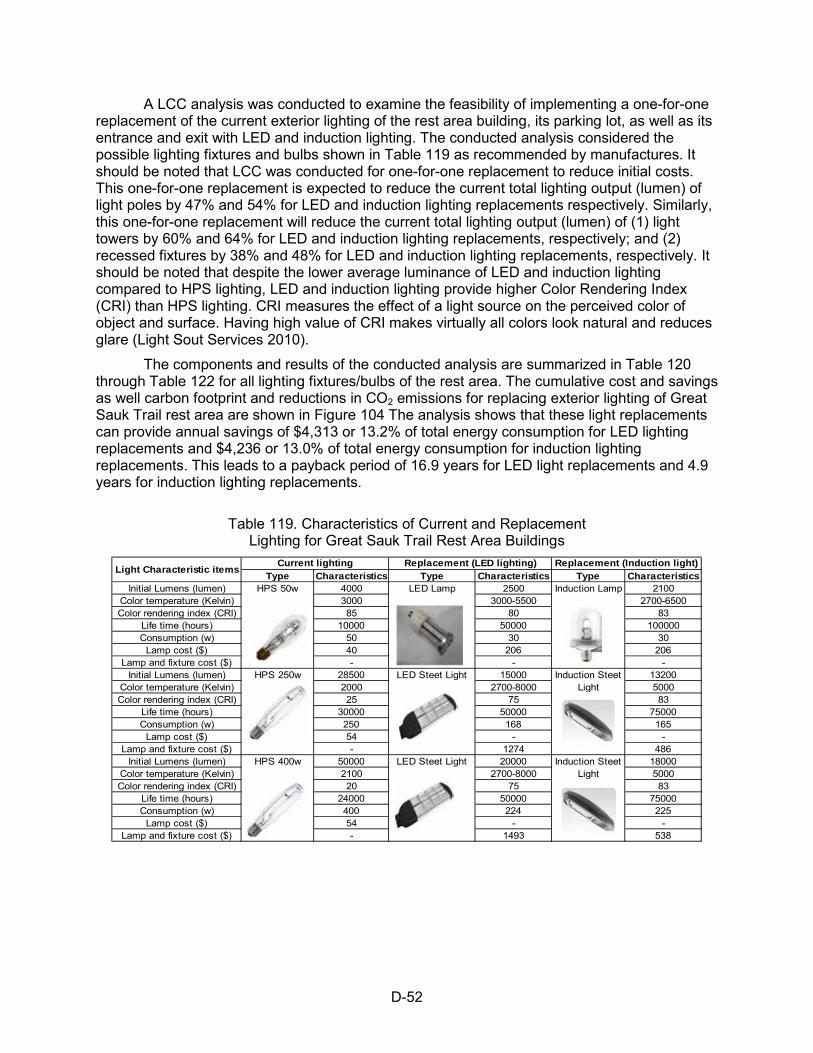
D-52
A LCC analysis was conducted to examine the feasibility of implementing a one-for-one replacement of the current exterior lighting of the rest area building, its parking lot, as well as its entrance and exit with LED and induction lighting. The conducted analysis considered the possible lighting fixtures and bulbs shown in Table 119 as recommended by manufactures. It should be noted that LCC was conducted for one-for-one replacement to reduce initial costs. This one-for-one replacement is expected to reduce the current total lighting output (lumen) of light poles by 47% and 54% for LED and induction lighting replacements respectively. Similarly, this one-for-one replacement will reduce the current total lighting output (lumen) of (1) light towers by 60% and 64% for LED and induction lighting replacements, respectively; and (2) recessed fixtures by 38% and 48% for LED and induction lighting replacements, respectively. It should be noted that despite the lower average luminance of LED and induction lighting compared to HPS lighting, LED and induction lighting provide higher Color Rendering Index (CRI) than HPS lighting. CRI measures the effect of a light source on the perceived color of object and surface. Having high value of CRI makes virtually all colors look natural and reduces glare (Light Sout Services 2010).
The components and results of the conducted analysis are summarized in Table 120 through Table 122 for all lighting fixtures/bulbs of the rest area. The cumulative cost and savings as well carbon footprint and reductions in CO2 emissions for replacing exterior lighting of Great Sauk Trail rest area are shown in Figure 104 The analysis shows that these light replacements can provide annual savings of $4,313 or 13.2% of total energy consumption for LED lighting replacements and $4,236 or 13.0% of total energy consumption for induction lighting replacements. This leads to a payback period of 16.9 years for LED light replacements and 4.9 years for induction lighting replacements.
Table 119. Characteristics of Current and Replacement
Lighting for Great Sauk Trail Rest Area Buildings
Type Characteristics Type Characteristics Type CharacteristicsInitial Lumens (lumen) HPS 50w 4000 LED Lamp 2500 Induction Lamp 2100
Color temperature (Kelvin) 3000 3000-5500 2700-6500Color rendering index (CRI) 85 80 83
Life time (hours) 10000 50000 100000Consumption (w) 50 30 30
Lamp cost ($) 40 206 206Lamp and fixture cost ($) - - -
Initial Lumens (lumen) HPS 250w 28500 LED Steet Light 15000 Induction Steet 13200Color temperature (Kelvin) 2000 2700-8000 Light 5000Color rendering index (CRI) 25 75 83
Life time (hours) 30000 50000 75000Consumption (w) 250 168 165
Lamp cost ($) 54 - -Lamp and fixture cost ($) - 1274 486
Initial Lumens (lumen) HPS 400w 50000 LED Steet Light 20000 Induction Steet 18000Color temperature (Kelvin) 2100 2700-8000 Light 5000Color rendering index (CRI) 20 75 83
Life time (hours) 24000 50000 75000Consumption (w) 400 224 225
Lamp cost ($) 54 - -Lamp and fixture cost ($) - 1493 538
Light Characteristic items Replacement (LED lighting) Replacement (Induction light)Current lighting

D-53
Table 120. Replacing HPS 400W Bulbs with Energy-Efficient LED and Induction Light Bulbs in Great Sauk Trail Rest Area Buildings
Lighting Characteristics, Costs, and Savings
Current Fixtures/Bulbs
Replacement 1
Replacement 2
Type of bulb HPS LED Induction Number of bulbs 28 28 28 Initial lumens (lumen) 50000 20000 18000 Kelvin temperature 2100 2700-8000 5000 Color Rendering Index (CRI) 20 75 83 Life time (hr) 24000 50000 75000 Consumption per bulb, including ballast (watt) 481 224 230 Bulb cost ($) 54 1,493 538 Reduction in lumens output levels (%) N.A. 60 64 Reduction in energy consumption (%) N.A. 53 52 Annual savings in energy - first year ($/year) N.A. 3,119 2,791 Payback period (yr) N.A. 14.1 4.3
Table 121. Replacing HPS 250W Bulbs with Energy-Efficient LED and Induction Light Bulbs in Great Sauk Trail Rest Area Buildings
Lighting Characteristics, Costs, and Savings
Current Fixtures/Bulbs
Replacement 1
Replacement 2
Type of bulb HPS LED Induction Number of bulbs 18 18 18 Initial lumens (lumen) 28500 15000 13200 Kelvin temperature 2000 4900 5000 Color Rendering Index (CRI) 25 75 83 Life time (hr) 30000 50000 75000 Consumption per bulb, including ballast (watt) 315 168 168 Bulb cost 54 1320 486 Reduction in lumens output levels (%) N.A. 47 54 Reduction in energy consumption (%) N.A. 47 47 Annual savings in energy - first year ($/year) N.A. 1,147 1,147 Payback period (yr) N.A. 23.0 6.4
Table 122. Replacing HPS 50W Bulbs with Energy-Efficient
LED and Induction Light Bulbs in Great Sauk Trail Rest Area Buildings
Lighting Characteristics, Costs, and Savings
Current Fixtures/Bulbs
Replacement 1
Replacement 2
Type of bulb HPS LED Induction Number of bulbs 10 10 10 Initial lumens (lumen) 4000 2500 2100 Kelvin temperature 3000 5000 2700-6500 Color Rendering Index (CRI) 85 80 83 Life time (hr) 10000 50000 100000 Consumption per bulb, including ballast (watt) 57 30 32 Bulb cost 40 206 206 Reduction in lumens output levels (%) N.A. 38 48 Reduction in energy consumption (%) N.A. 47 44 Annual savings in energy - first year ($/year) N.A. 47 43 Payback period (yr) N.A. 7.1 7.2

D-54
Figure 104. Cumulative costs, savings, and CO2 emissions for LED and induction lighting
replacements in Great Sauk Trail rest area buildings.
D.3.3 Motion Sensors Rest areas have different operational schedule than business and commercial buildings
and they have to operate 24 hours a day with few or no occupants during low visitation periods at night. This makes motion sensors a promising technology for rest area buildings. This section analyzes the implementation of motion sensors to control the lighting of restrooms and vending machine areas. Motion sensors also can be used to reduce space heating and cooling by reducing the use of exhaust fans at night when there are few or no occupants in the restrooms.
In order to estimate the energy savings in lighting and exhaust fans, the research team developed a separate simulation model using EZstrobe simulation language (Martinez 2006) to analyze and simulate the use of restrooms and vending machines based on the number and frequency of rest area visitors. The simulation model was developed to mimic the utilization of the rest area facilities by its visitors. The model was created to generate the number of visitors to the rest area using a beta distribution function to represent a high frequency of visitors during the morning, noon, and afternoon hours and low frequency during the night and early morning hours. The model also assumes that the percentages of visitors who will use the men’s restroom, women’s restroom, and vending machines are 40%, 40%, and 20%, respectively. Similarly, the probabilities that restroom visitors will use urinals, toilets and only faucets were assumed to be 30%, 60%, and 10%, respectively with reasonable random durations for each of these restroom tasks as, shown in Figure 105. It should be noted that the model assumes that each visitor using the toilet or urinal will also use the faucet afterwards. The developed model accounts for an amount of time for sensors to keep the light on after a visitor leaves a restroom. After a visitor leaves the restroom, the model assumes that there is a probability of 60% that the visitor will leave the rest area and 40% will use vending machines. The developed model can estimate how long the lighting in restrooms of the rest area will be turned off if motion-activated lighting were implemented in the restrooms. Similarly, the amount of time that lighting in vending machines and exhaust fans being turned/switched off can be calculated by the developed simulation model. Figure 106 shows rest area visitors while being in the men’s restroom throughout a simulation day. Table 123 summarizes the percentages of occupancy for restrooms and vending machines of the Great Sauk Trail rest area assuming that the lights or fans remain turned on for 5 minutes after the departure of the last visitor. The following subsections use the developed simulation model to estimate potential savings for using motion sensors in the rest area building and their expected payback periods. The economic analysis of motion sensors accounts for an annual interest rate of 2% and escalation in utility rate of 5% in calculating payback period of implementing this technology.
0
500
1000
1500
2000
2500
0 2 4 6 8 10 12 14 16 18 20 22 24 26 28 30
CO2 emissions (IBS)
Thou
sand
s
n (Years)
"current exterior lighting"
LED Emission
Induction Emission

D-55
Figure 105. Motion-sensor simulation model for Great Sauk Trail Road rest area building.

D-56
Figure 106. Number of visitors in men’s restroom throughout a simulation
day of Great Sauk Trail rest area buildings.
Table 123. Percentage Occupancy for Restrooms and Vending Area for Great Sauk Trail Rest Area Buildings
Percentage of Occupancy in Men’s
Restroom
Percentage Occupancy in
Women’s Restroom
Percentage Average
Occupancy in Restrooms
Percentage Occupancy in Vending
Machines Area
54.4% 56.0% 55.2% 37.2% D.3.3.1 Motion-Activated Lighting
Motion-activated lighting can be installed in restrooms to turn off lights automatically when they are not occupied. As discussed in the previous section, restrooms in the Great Sauk Trail rest area have an average approximate occupancy of 55.2% including 5 minutes for the occupancy sensors remain in detection before turning off automatically. This leads to average 44.8% savings in lighting of restrooms. Table 124 shows the results of the LCC analysis for implementing motion-activated lighting in the restrooms of the Great Sauk Trail rest area. The analysis shows that the motion-activated lighting can provide approximate savings of $702 annually or 2.8% of total energy consumption of Great Sauk Trail rest area buildings, which represents a payback period of 1.8 years for this green building. Furthermore, motion-activated lighting in restrooms can eliminate annually 17,391 Ib of CO2 emissions.
Implementing motion-activated lighting in the lobby will not be feasible due to security requirements that require lights to be turned on at all times to ensure the proper operation of the surveillance cameras. Moreover, implementing motion-activated lighting in maintenance rooms will not provide much savings and the payback period will be long since the maintenance staff often turn off the light before leaving the mechanical rooms of the rest area.
0
1
2
3
4
5
6
7
0 200 400 600 800 1000 1200 1400
Simulation Time
MidnightMidnight 6:00AM 6:00PMNoon
No. of Visitors in Men's Bathroom

D-57
Table 124. Motion-Activated Lighting Analysis for Restrooms of Great Sauk Trail Rest Area Buildings
Savings and Cost Items Amount/Savings
Total load of lighting fixtures (watt) 1,408 Electricity cost ($/kwh) 0.127 Occupancy sensors cost ($) 368 Labor installation cost ($) 874 Total Initial cost ($) 1,242 Lighting operation time (hr) 24 Annual lighting energy cost for restrooms ($) 1,566 Annual lighting energy savings ($) 702 Payback period (yr) 1.8 Amount of eliminated CO2 (Ib) 17,391 Savings in total energy consumption of the rest area building (%) 2.8
D.3.3.2 Vending Occupancy Controls
Similar to motion-activated lighting, occupancy controls can be installed for vending machines to turn off their lighting when the vending area is not occupied. Based on the developed simulation model for motion sensors, lights of vending machine are expected to be on for approximately 37.2% of hours during the day assuming a duration of 5 minutes for sensors to remain on after detecting the last motion in the vending area. This leads to 59.8% lighting savings of the vending machine area. Table 125 shows the economic analysis of installing occupancy controls for vending machines area in the Great Sauk Trail rest area. The analysis shows that these occupancy controls can provide approximate savings of $419.2 annually or 1.3% of total energy consumption of the Great Sauk Trail rest area buildings, which lead to a payback period of 0.82 years. This measure can also eliminate 4,654 Ib of CO2 emissions annually due to the achieved reduction in energy consumption.
Table 125. Occupancy Controls Analysis for Vending
Machine in Great Sauk Trail Rest Area Buildings
Savings and Cost Items Amount Total load of lighting fixtures (watt) 600 Electricity cost ($/kwh) 0.127 Occupancy sensors cost ($) 120 Labor installation cost ($) 219 Total Initial cost ($) 339 Lighting operation time (hr) 24 Annual lighting energy cost for restrooms ($) 668 Annual lighting energy savings ($) 419 Payback period (yr) 0.82 Amount of eliminated CO2 (Ib) 4,654 Savings in total energy consumption of the rest area building (%) 1.3
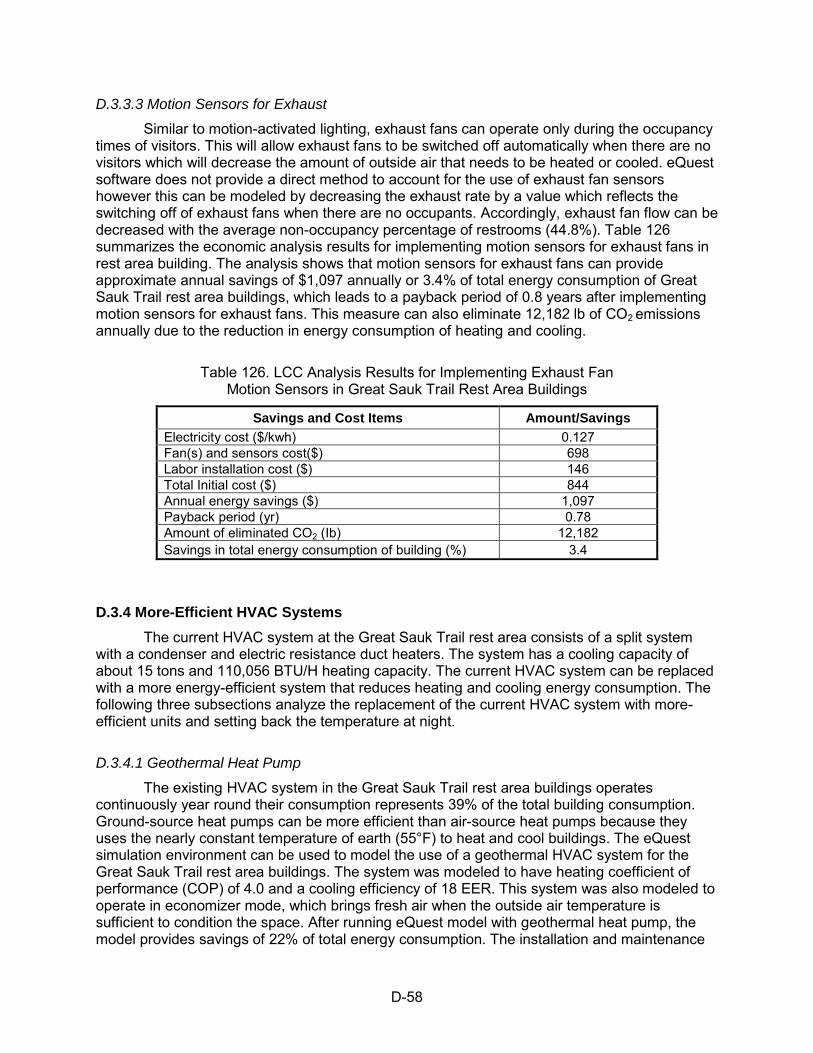
D-58
D.3.3.3 Motion Sensors for Exhaust
Similar to motion-activated lighting, exhaust fans can operate only during the occupancy times of visitors. This will allow exhaust fans to be switched off automatically when there are no visitors which will decrease the amount of outside air that needs to be heated or cooled. eQuest software does not provide a direct method to account for the use of exhaust fan sensors however this can be modeled by decreasing the exhaust rate by a value which reflects the switching off of exhaust fans when there are no occupants. Accordingly, exhaust fan flow can be decreased with the average non-occupancy percentage of restrooms (44.8%). Table 126 summarizes the economic analysis results for implementing motion sensors for exhaust fans in rest area building. The analysis shows that motion sensors for exhaust fans can provide approximate annual savings of $1,097 annually or 3.4% of total energy consumption of Great Sauk Trail rest area buildings, which leads to a payback period of 0.8 years after implementing motion sensors for exhaust fans. This measure can also eliminate 12,182 lb of CO2 emissions annually due to the reduction in energy consumption of heating and cooling.
Table 126. LCC Analysis Results for Implementing Exhaust Fan
Motion Sensors in Great Sauk Trail Rest Area Buildings
Savings and Cost Items Amount/Savings Electricity cost ($/kwh) 0.127 Fan(s) and sensors cost($) 698 Labor installation cost ($) 146 Total Initial cost ($) 844 Annual energy savings ($) 1,097 Payback period (yr) 0.78 Amount of eliminated CO2 (Ib) 12,182 Savings in total energy consumption of building (%) 3.4
D.3.4 More-Efficient HVAC Systems The current HVAC system at the Great Sauk Trail rest area consists of a split system
with a condenser and electric resistance duct heaters. The system has a cooling capacity of about 15 tons and 110,056 BTU/H heating capacity. The current HVAC system can be replaced with a more energy-efficient system that reduces heating and cooling energy consumption. The following three subsections analyze the replacement of the current HVAC system with more-efficient units and setting back the temperature at night.
D.3.4.1 Geothermal Heat Pump
The existing HVAC system in the Great Sauk Trail rest area buildings operates continuously year round their consumption represents 39% of the total building consumption. Ground-source heat pumps can be more efficient than air-source heat pumps because they uses the nearly constant temperature of earth (55°F) to heat and cool buildings. The eQuest simulation environment can be used to model the use of a geothermal HVAC system for the Great Sauk Trail rest area buildings. The system was modeled to have heating coefficient of performance (COP) of 4.0 and a cooling efficiency of 18 EER. This system was also modeled to operate in economizer mode, which brings fresh air when the outside air temperature is sufficient to condition the space. After running eQuest model with geothermal heat pump, the model provides savings of 22% of total energy consumption. The installation and maintenance
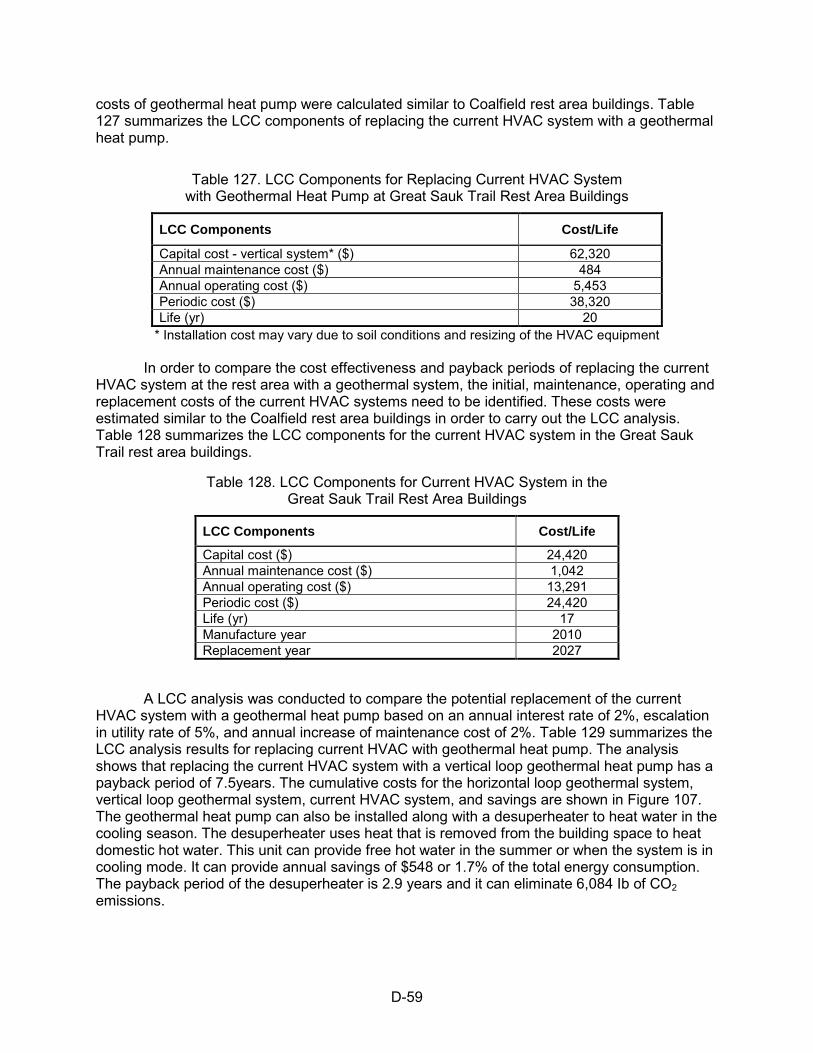
D-59
costs of geothermal heat pump were calculated similar to Coalfield rest area buildings. Table 127 summarizes the LCC components of replacing the current HVAC system with a geothermal heat pump.
Table 127. LCC Components for Replacing Current HVAC System
with Geothermal Heat Pump at Great Sauk Trail Rest Area Buildings
LCC Components Cost/Life
Capital cost - vertical system* ($) 62,320 Annual maintenance cost ($) 484 Annual operating cost ($) 5,453 Periodic cost ($) 38,320 Life (yr) 20
* Installation cost may vary due to soil conditions and resizing of the HVAC equipment In order to compare the cost effectiveness and payback periods of replacing the current
HVAC system at the rest area with a geothermal system, the initial, maintenance, operating and replacement costs of the current HVAC systems need to be identified. These costs were estimated similar to the Coalfield rest area buildings in order to carry out the LCC analysis. Table 128 summarizes the LCC components for the current HVAC system in the Great Sauk Trail rest area buildings.
Table 128. LCC Components for Current HVAC System in the Great Sauk Trail Rest Area Buildings
LCC Components Cost/Life
Capital cost ($) 24,420 Annual maintenance cost ($) 1,042 Annual operating cost ($) 13,291 Periodic cost ($) 24,420 Life (yr) 17 Manufacture year 2010 Replacement year 2027
A LCC analysis was conducted to compare the potential replacement of the current HVAC system with a geothermal heat pump based on an annual interest rate of 2%, escalation in utility rate of 5%, and annual increase of maintenance cost of 2%. Table 129 summarizes the LCC analysis results for replacing current HVAC with geothermal heat pump. The analysis shows that replacing the current HVAC system with a vertical loop geothermal heat pump has a payback period of 7.5years. The cumulative costs for the horizontal loop geothermal system, vertical loop geothermal system, current HVAC system, and savings are shown in Figure 107. The geothermal heat pump can also be installed along with a desuperheater to heat water in the cooling season. The desuperheater uses heat that is removed from the building space to heat domestic hot water. This unit can provide free hot water in the summer or when the system is in cooling mode. It can provide annual savings of $548 or 1.7% of the total energy consumption. The payback period of the desuperheater is 2.9 years and it can eliminate 6,084 Ib of CO2 emissions.

D-60
Table 129. LCC Analysis Results for Replacing Current HVAC System with Geothermal Heat Pump at Great Sauk Trail Rest Area Buildings
Rest Area Savings
Annual kwh saved 56,280
Annual energy savings - first year ($/yr) 7,148
Annual eliminated CO2 emissions (Ib) 79,355
Payback period - vertical system (yr) 7.5
Figure 107. Cumulative costs of current HVAC system, vertical loop geothermal system, and
savings for Great Sauk Trail rest area buildings.
D.3.4.2 High-Efficiency Air-Source Heat Pump
Another alternative for the current HVAC system at the Great Sauk Trail rest area is replacement with a more-efficient Energy Star–rated air-source heat pump to reduce heating and cooling expenses. An air-source heat pump was modeled in eQuest to meet Energy Star recommendations with a cooling efficiency of 12 EER and heating performance rating of 8.2 HSPR (Energy Star 2003). Table 130 summarizes the economic analysis results for replacing the current HVAC system with an Energy Star–rated air-source heat pump. The analysis shows that an Energy Star–rated HVAC system can provide annual savings of $3,858 annually or 11.9% of total energy consumption of the rest area building. This leads to a payback period of 6.3 years based on an annual interest rate of 2% and escalation in utility rate of 5%. This replacement can eliminate CO2 emissions by 42,836 Ib annually.
-200,000
0
200,000
400,000
600,000
800,000
1,000,000
1,200,000
0 1 2 3 4 5 6 7 8 9 10 11 12 13 14 15 16 17 18 19 20 21 22 23 24 25 26 27 28 29 30
Geothermal Heat Pump - Vertical Loop system
Current HVAC system
Cumulative savings
Years
Cost ($)

D-61
Table 130. Analysis Results for Replacing Current HVAC System with Energy Star–Rated Air-Source Heat Pump at Great Sauk Trail Rest Area Buildings
Savings and Cost Items Amount/Savings Electricity cost ($/kwh) 0.127 Total initial cost for air-source heat pump 23,600 Annual energy savings ($) 3,858 Payback period (yr) 6.3 Amount eliminated CO2 (Ib) 42,836 Savings in total energy consumption of building (%) 11.9
D.3.4.3 Setting Back HVAC System at Night
Another method to reduce energy consumption for space heating and cooling of the rest area is to set back the temperature of the HVAC system at night. The number of visitors using the rest area at night is very limited and, accordingly, setting back the temperature at night can reduce the energy consumption for heating and cooling. The temperature can be set at night to 68ᵒF in winter and 70ᵒF in summer. This measure can be modeled in eQuest by editing the temperature set points in the simulation model to a temperature that reflects the set points at night using interpolation. The developed eQuest model showed that setting back the temperature at night can provide annual savings of $136 or 0.4% reduction in total energy consumption. The Great Sauk Trail rest area buildings already have programmable thermostats that can be used to set back the HVAC temperature at night. This measure can be implemented easily to the rest area without additional costs.
D.3.5 Thermal Pane Glass for Windows And Doors Thermal pane glass is a green building measure that can be added to the rest area
building in order to reduce its cooling and heating energy consumption. This measure requires replacing all glazing as well as doors and windows in the rest area building with double-pane glass. This measure can be modeled in eQuest by replacing current single pane glass with double-pane glass. The analysis of implementing this measure provides annual savings of $692 or 2.1% of total energy consumption, as shown in Table 131. There is no expected payback period for this measure within 30 years as it requires major renovation for the rest area building with high initial cost. This measure can eliminate 7,685 Ib of CO2 annually.
Table 131. LCC Analysis Results for Replacing Current Glazing and
Doors with Double-Pane Glass in Great Sauk Trail Rest Area Buildings
Savings and Cost Items Amount/Savings Electricity cost ($/kwh) 0.127 Total initial cost for adding another door 51,206 Annual energy savings (kwh) 5450 Annual energy savings ($) 692 Payback period (yr) More than 30 years Amount of eliminated CO2 (Ib) 7,685 Savings in total energy consumption of building (%) 2.1

D-62
D.3.6 Energy-Efficient Hand Dryers Energy-efficient hand dryers are one of the green building measures that can be
implemented in the Great Sauk Trail rest area buildings to reduce energy consumption of hand dryers, which was estimated based on a 50% use of rest area visitors each for 30 seconds according to manufacture use recommendations. Although, current hand dryers only consume approximately 1.3% of total energy consumption, they are one of the most visible devices for the rest area visitors. Moreover, slow velocity or inefficient hand dryers may discourage people to use them. This analysis considers the impact of installing three different models of energy-efficient hand dryers in the Great Sauk Trail rest area buildings to reduce their energy use, as shown in Table 132.The analysis shows that replacing current hand dryers may result in annual savings of $441 to $482 or 1.4% to 1.5% of total energy consumption in the rest area building based on three different models of energy-efficient hand dryers. These savings can provide a payback period of 3.9 years to 19.5 years for the three different models based on an annual interest rate of 2% and escalation in utility rate of 5%. This measure can eliminate up to 5,353 Ib of CO2 emissions in Great Sauk Trail rest area buildings.
Table 132. LCC Analysis Results for Replacing Current Hand Dryers with
Energy-Efficient Units for Great Sauk Trail Rest Area Buildings
LCC Items/Savings
Current Hand
Dryer - World Dryer
1- World Dryer Airforce
- J Series Hand Dryers
2- Xlerator Series Hand
Dryers
3- Dyson Airblade
Series Hand Dryers
Number of hand dryers 7
Hand dryer consumption (w) 2,300 1,100 1100 1500
Drying time (s) 30 12 15 12
Initial cost ($) N.A. 1,911* 2,800* 11,200*
Annual visitors - 2009 489,830
Savings over the current hand dryers (%) N.A. 81 76 74
Utility cost ($/kwh) 0.127 Annual operating cost based on 50% use of visitors ($) 596 114 143 156
Annual savings ($) N.A. 482 454 441
Annual savings of total energy consumption (%)
N.A. 1.5 1.4 1.4
Eliminated CO2 emissions (Ib) N.A. 5,353 5,036 4,892
Payback period (yr) N.A. 3.9 5.9 19.5 * (Restroom Direct 2012)

D-63
D.3.7 Solar Measures Several solar measures can be used to reduce energy consumption in the Great Sauk
Trail rest area buildings. These measures can include solar daylight tubes, photovoltaic systems, and solar water heaters. These measures can reduce energy consumption of interior lighting, heating water as well as generate renewable and clean electricity. The next subsections discuss the installation of these systems in the Great Sauk Trail rest area buildings.
D.3.7.1 Solar Tube Lighting
Solar daylight tubes are one of the green building measures that can be used to provide lighting for the building during the day lighting hours. The technology requires solar tubes to penetrate the building roof to the ceiling where they transmit the sunlight during the day time. This technology can be installed in restrooms to decrease the interior lighting use during the day light time. It can be installed in the roof of the rest area building while installing light controls in restrooms to control/dim interior lighting during the day. The energy savings that this technology can provide was calculated based on reducing daily lighting use by 5 hours. The analysis for adding solar daylight tubes in the rest area building is summarized in Table 85. Cumulative costs and savings for implementing solar daylight tubes in restrooms of the rest area is shown in Table 133 The analysis shows that this measure can provide saving of $360 annually or 1.0% of the total energy consumption. This can lead to a payback period of 12.16 years. It should be noted that, the installation of this measure is crucial in terms of the amount of savings that it can provide. Improper installation of solar daylight tubes with low insulation (low U value) can lead to high dissipation of energy and subsequently increase cooling and heating costs. On the other hand, proper installation of this measure with sufficient U value, Energy Star–rated tubes can slightly increase heating and cooling. Based on modeling solar tubes in eQuest with similar skylight areas, this can lead to an increase in energy cost $99 annually. As a result the expected savings of this measure may reduce to $261 annually.
Table 133. LCC Analysis Results for Installing Solar Daylight Tubes in
Restrooms and Lobby for Great Sauk Trail Rest Area Buildings
Savings and Cost Items Restroom Total load of lighting fixtures (watt) 1,408 Electricity cost ($/kwh) 0.127 Number of Solar daylight tubes (10' diameter) 4 Number of Solar daylight tubes (18'' diameter) 6 Total Initial cost ($) 4,886 Solar tubes operation time (hr) 5 Annual lighting energy cost ($) 1,727 Annual lighting energy savings ($) 360 Payback period (yr) 12.16 Amount of eliminated CO2 (Ib) 3,623 Savings in total energy consumption of the rest area building (%) 1.00

D-64
Figure 108. Cumulative costs and savings for implementing solar daylight
tubes in restrooms of Great Sauk Trail rest area buildings. D.3.7.2 Grid-Connected Photovoltaic Systems
Photovoltaic systems are one of the renewable energy measures that generate electricity to the Great Sauk Trail rest area buildings. In order to perform LCC for installing photovoltaic systems in the rest area, this system needs to be designed to estimate the number and type of system parts. Several factors affect the design of grid-connected systems including average daily peak sun hours, capacity of solar panels, capacity of inverters, and mounting of solar panels. The design of photovoltaic system for the Great Sauk Trail rest area was conducted using a similar procedure to the one described earlier in the Coalfield rest area.
This measure was analyzed to generate 5% of Great Sauk Trail total energy consumption. Table 134 summarizes the cost components for installing grid-connected photovoltaic system in the Great Sauk Trail rest area buildings. The LCC analysis was conducted in order to determine annual savings, payback period, amount of eliminated CO2 emissions, and required area of the system. The analysis accounted for an annual interest rate of 2%, escalation in utility rate of 5%, and an annual increase of maintenance cost by 2%, as shown in Table 135. The analysis shows that incorporating grid-connected photovoltaic system at the Great Sauk Trail rest area has a payback period of 20.8 years. The system requires 35 solar panels to be installed and they can be placed on the roof of the restrooms. The required area for solar panels on the roof is 270 SF, these calculations accounted for 51ᵒ tilt angle for the solar panels and preventing shading that might occur due to layout of solar panels in winter and summer. Figure 109 shows the cumulative savings of installing grid-connected system in the rest area building.
-10000
-5000
0
5000
10000
15000
20000
25000
30000
0 2 4 6 8 10 12 14 16 18 20 22 24 26 28 30
Tluorscent (T12)
Solar tubes
Cumulative annual Savings
Cost ($)
n (Years)

D-65
Table 134. Cost Components for Installing Grid-Connected Photovoltaic System in the Great Sauk Trail Rest Area Buildings
Cost Components Amount/Savings Total number of solar panels 35 Number of inverters 1 System capacity (KW) 8.2 Utility cost ($/kwh) 0.127 Initial cost ($) 36,590 Annual maintenance cost ($) 112 Solar Panels periodic cost ($) 12,147 Inverter periodic cost ($) 4,110 Annual Savings ($) 1,628 Annual Savings (kwh) 12815 Cost per watt ($/w) 4.53
Table 135. LCC Analysis Results for Incorporating Grid-Connected Photovoltaic System in the Great Sauk Trail Rest Area Buildings
LCC Items/Savings Amount/Savings
Annual eliminated CO2 emissions (Ib) 18,069 Number of solar panels on roof 35 Number of solar panels on the ground 0 Required area for solar panels (SF) 270 Tilt angle of solar panels 51 Payback period (yr) 20.8
Figure 109. Cumulative cost of incorporating grid-connected system in the Great Sauk Trail rest area buildings.
It should be noted that the stand-alone photovoltaic system was not considered in this analysis because of its infeasible payback period that was identified in the first phase of this project due to its high initial and periodic costs of battery systems.
-60,000
-40,000
-20,000
0
20,000
40,000
60,000
80,000
100,000
120,000
140,000
160,000
0 2 4 6 8 10 12 14 16 18 20 22 24 26 28 30 32 34 36 38 40
Years
Cumulative cost

D-66
D.3.7.3 Solar Water-Heating Systems
Solar water heater is another technology that can reduce energy consumption for heating water in the rest area buildings. This technology can be installed with the current water heaters in the rest area in order to mitigate the cost of replacing current water heater. Moreover, current water heater can work as a backup when the sun rays are unavailable or insufficient to heat water to the desired temperature. The components of installing this system include solar collector(s), collector’s mounting, heat exchanger, circulator, antifreeze (glycol), water storage tank(s), controller, fittings, pipes, and insulation. The initial capital cost of the system can be calculated for the three rest areas using the RSMeans Building Construction Cost Data (2012). Maintenance cost and life were calculated similar to Coalfield rest area buildings. Table 136 summarizes the LCC components for incorporating solar water heaters in the Great Sauk Trail rest area buildings. A LCC analysis was conducted based on an annual interest rate of 2%, escalation in utility rate by 5%, and an annual increase of maintenance cost by 2%, as shown in Table 137. The analysis shows that installing solar water heaters in Great Sauk Trail rest area buildings has a payback period that ranges from 4.3 to 16.7 years based on 70% and 20% energy savings heating water, and it can eliminate CO2 emissions by 5,737 to 20,080 Ib annually.
It should be noted that solar collector(s) can be installed on the roof by clamps/straps or on the ground where a rack is used to hold the collector(s). Installing solar collectors on the roof might not be feasible as the building roof of the rest area was not designed to carry such extra load. Subsequently, solar collectors should be mounted on the ground.
Table 136. LCC Components for Installing Solar Water Heater in Great Sauk Trail Rest Area Buildings
LCC Components Amount/Savings Capital cost (Ground mount) ($) 7,735
Annual maintenance cost (Ground mount) ($/yr) 77
Utility Cost ($/kwh) 0.127
Conventional water heater consumption (kwh) 20,490
Annual operating cost for conventional water heater ($) 2,602
Annual savings (20% to 70% savings) ($) 520 to $,822
Periodic cost for pump @ 5 years ($) 250
Periodic cost for water tank @ 16 years ($) 1,600
Circulating pump life (yr) 5
Tank life (yr) 16
Table 137. LCC Analysis Results for Installing Solar Water
Heater in Great Sauk Trail Rest Area Buildings
Savings Amount Annual kwh saved (20% savings) 4,098
Annual kwh saved (70% savings) 14,343
Annual eliminated CO2 emissions - 20% savings (Ib) 5,737 Annual eliminated CO2 emissions - 70% savings (Ib) 20,080 Payback period - 20% savings (yr) 16.65
Payback period - 70% savings (yr) 4.33
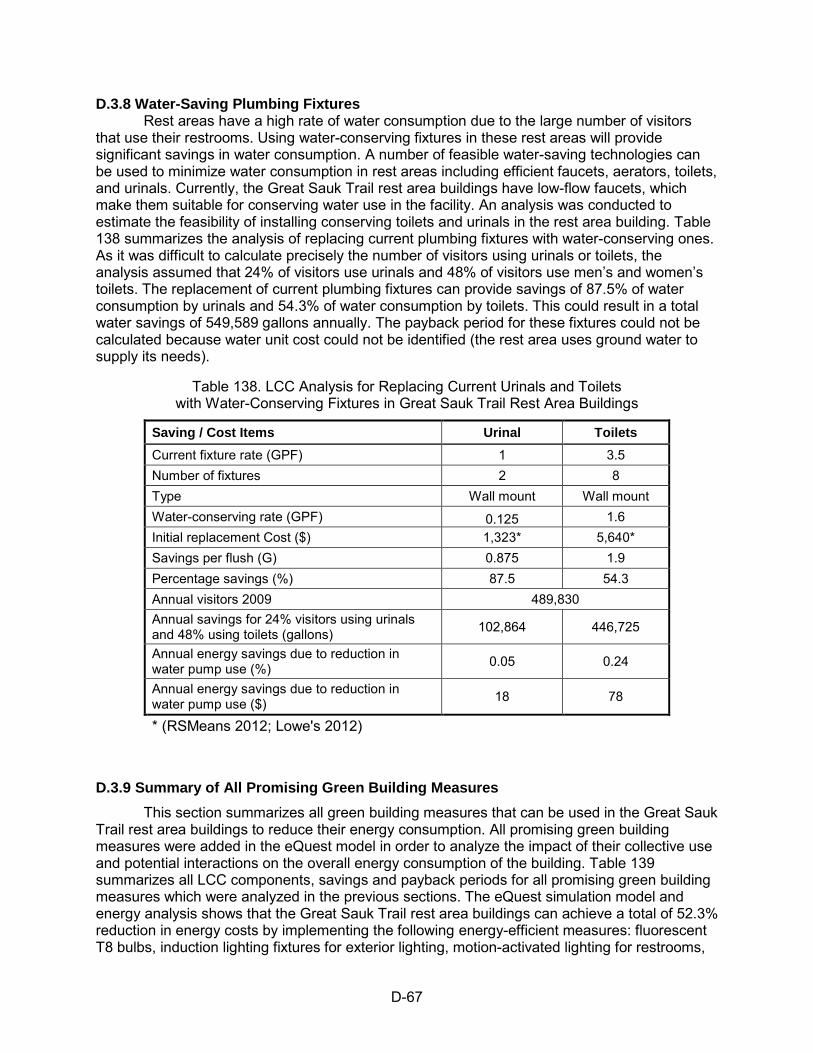
D-67
D.3.8 Water-Saving Plumbing Fixtures Rest areas have a high rate of water consumption due to the large number of visitors
that use their restrooms. Using water-conserving fixtures in these rest areas will provide significant savings in water consumption. A number of feasible water-saving technologies can be used to minimize water consumption in rest areas including efficient faucets, aerators, toilets, and urinals. Currently, the Great Sauk Trail rest area buildings have low-flow faucets, which make them suitable for conserving water use in the facility. An analysis was conducted to estimate the feasibility of installing conserving toilets and urinals in the rest area building. Table 138 summarizes the analysis of replacing current plumbing fixtures with water-conserving ones. As it was difficult to calculate precisely the number of visitors using urinals or toilets, the analysis assumed that 24% of visitors use urinals and 48% of visitors use men’s and women’s toilets. The replacement of current plumbing fixtures can provide savings of 87.5% of water consumption by urinals and 54.3% of water consumption by toilets. This could result in a total water savings of 549,589 gallons annually. The payback period for these fixtures could not be calculated because water unit cost could not be identified (the rest area uses ground water to supply its needs).
Table 138. LCC Analysis for Replacing Current Urinals and Toilets with Water-Conserving Fixtures in Great Sauk Trail Rest Area Buildings
Saving / Cost Items Urinal Toilets Current fixture rate (GPF) 1 3.5 Number of fixtures 2 8 Type Wall mount Wall mount Water-conserving rate (GPF) 0.125 1.6 Initial replacement Cost ($) 1,323* 5,640* Savings per flush (G) 0.875 1.9 Percentage savings (%) 87.5 54.3 Annual visitors 2009 489,830 Annual savings for 24% visitors using urinals and 48% using toilets (gallons) 102,864 446,725
Annual energy savings due to reduction in water pump use (%) 0.05 0.24
Annual energy savings due to reduction in water pump use ($) 18 78
* (RSMeans 2012; Lowe's 2012)
D.3.9 Summary of All Promising Green Building Measures This section summarizes all green building measures that can be used in the Great Sauk
Trail rest area buildings to reduce their energy consumption. All promising green building measures were added in the eQuest model in order to analyze the impact of their collective use and potential interactions on the overall energy consumption of the building. Table 139 summarizes all LCC components, savings and payback periods for all promising green building measures which were analyzed in the previous sections. The eQuest simulation model and energy analysis shows that the Great Sauk Trail rest area buildings can achieve a total of 52.3% reduction in energy costs by implementing the following energy-efficient measures: fluorescent T8 bulbs, induction lighting fixtures for exterior lighting, motion-activated lighting for restrooms,
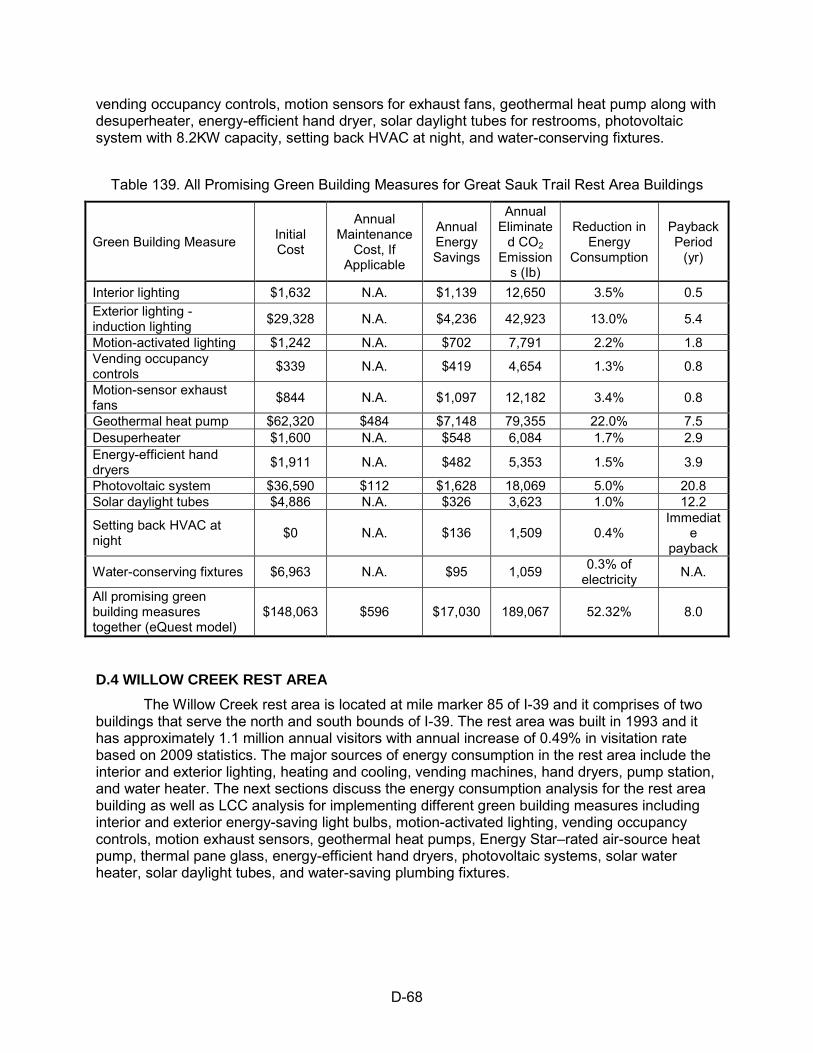
D-68
vending occupancy controls, motion sensors for exhaust fans, geothermal heat pump along with desuperheater, energy-efficient hand dryer, solar daylight tubes for restrooms, photovoltaic system with 8.2KW capacity, setting back HVAC at night, and water-conserving fixtures.
Table 139. All Promising Green Building Measures for Great Sauk Trail Rest Area Buildings
Green Building Measure Initial Cost
Annual Maintenance
Cost, If Applicable
Annual Energy Savings
Annual Eliminate
d CO2 Emission
s (Ib)
Reduction in Energy
Consumption
Payback Period
(yr)
Interior lighting $1,632 N.A. $1,139 12,650 3.5% 0.5 Exterior lighting - induction lighting $29,328 N.A. $4,236 42,923 13.0% 5.4
Motion-activated lighting $1,242 N.A. $702 7,791 2.2% 1.8 Vending occupancy controls $339 N.A. $419 4,654 1.3% 0.8
Motion-sensor exhaust fans $844 N.A. $1,097 12,182 3.4% 0.8
Geothermal heat pump $62,320 $484 $7,148 79,355 22.0% 7.5 Desuperheater $1,600 N.A. $548 6,084 1.7% 2.9 Energy-efficient hand dryers $1,911 N.A. $482 5,353 1.5% 3.9
Photovoltaic system $36,590 $112 $1,628 18,069 5.0% 20.8 Solar daylight tubes $4,886 N.A. $326 3,623 1.0% 12.2
Setting back HVAC at night $0 N.A. $136 1,509 0.4%
Immediate
payback
Water-conserving fixtures $6,963 N.A. $95 1,059 0.3% of electricity N.A.
All promising green building measures together (eQuest model)
$148,063 $596 $17,030 189,067 52.32% 8.0
D.4 WILLOW CREEK REST AREA
The Willow Creek rest area is located at mile marker 85 of I-39 and it comprises of two buildings that serve the north and south bounds of I-39. The rest area was built in 1993 and it has approximately 1.1 million annual visitors with annual increase of 0.49% in visitation rate based on 2009 statistics. The major sources of energy consumption in the rest area include the interior and exterior lighting, heating and cooling, vending machines, hand dryers, pump station, and water heater. The next sections discuss the energy consumption analysis for the rest area building as well as LCC analysis for implementing different green building measures including interior and exterior energy-saving light bulbs, motion-activated lighting, vending occupancy controls, motion exhaust sensors, geothermal heat pumps, Energy Star–rated air-source heat pump, thermal pane glass, energy-efficient hand dryers, photovoltaic systems, solar water heater, solar daylight tubes, and water-saving plumbing fixtures.

D-69
D.4.1 Energy Audit and Analysis The Willow Creek rest area has one electricity meter and two gas meters to measure
energy consumption in the two buildings, these three utility meters can be used to measure the monthly energy consumption of each building however they cannot provide energy consumed by each device or equipment in the rest area. In order to identify major sources of energy consumption in the rest area buildings and their costs, two energy simulation models were developed using the eQuest energy simulation software environment. Two simulation models were needed to mimic the performance of Willow Creek rest area buildings as one building consists of two floors to serve cars and trucks heading south on I-39 and the other building consists of one floor to serve cars and trucks heading north on I-39. The eQuest software can be used to simulate the energy performance of a building including its construction materials, weather, space heating and cooling, air ventilation, air infiltration and exhaust, temperature control, interior and exterior lighting, water use, windows and doors, skylights, operation schedule and occupancy, building activities, equipment loads. Furthermore, eQuest can account for different scenarios for replacing any of the current equipment or devices in buildings and calculate energy consumption accordingly. This capability of measuring building energy consumption based on different scenarios of implementing various green building measures and equipment will be used to analyze and identify a list of promising BMPs for Willow Creek rest area.
The Willow Creek rest area models were developed similar to the Coalfield rest area buildings. The models were developed based on the rest area’s location, square footage, architectural shape, zones, building envelope construction, infiltration, building orientation, operation schedule, building activities, building occupancy, ventilation, HVAC system, temperature control, and water heater. All energy consumption data for the Willow Creek rest area including lighting, HVAC system, hand dryers, vending machines, ventilation, infiltration, exhaust, occupancy, water pump and water heater were modeled using a similar procedure to the one described earlier for the Coalfield rest area buildings.
After modeling the rest area buildings in eQuest, the simulation models were run to simulate the building performance with respect to weather conditions throughout the year and calculate monthly and total energy consumption categories of the buildings. Due to the difficulty of measuring air infiltration rates for entry doors during the site visit; several runs of simulation models were conducted with varying reasonable rates of infiltration and ventilation in order to minimize the differences between simulated and actual energy consumption reported in the building’s energy bills. The parameters of infiltration were eventually set in the northbound model to 110 CFM/ person for restrooms, lobby, and vending area, 400 CFM/person for mechanical room and storage rooms. Infiltration rates were set to 0.4 air change per hour (ACH) in the model to account for vestibule entry of the rest area building. The parameters of infiltration were set in the southbound model to 296 CFM/person for restrooms, lobby, and vending area, and 810 CFM/person for mechanical and storage rooms. Infiltration rates were set to 0.3 air change per hour (ACH) in the model to account for vestibule entry of the rest area building.
Figure 110 compares the simulated monthly electricity consumption of the building to the actual energy consumption reported in the utility bills of the Willow Creek rest area buildings in 2010. Based on the results in Figure 110 the average absolute difference between the energy consumption for the developed simulation model and actual bills is 5.8% and the maximum and minimum difference in electricity consumption between the developed simulation model and actual bills are 12% in May and 0.5% in August. Similarly, Figure 111 and Figure 112 compare the simulated monthly gas consumption of the northbound and southbound buildings respectively based on the developed models in eQuest to the actual energy consumption reported in the utility bills of the Willow Creek rest area buildings in 2010. Based on the results
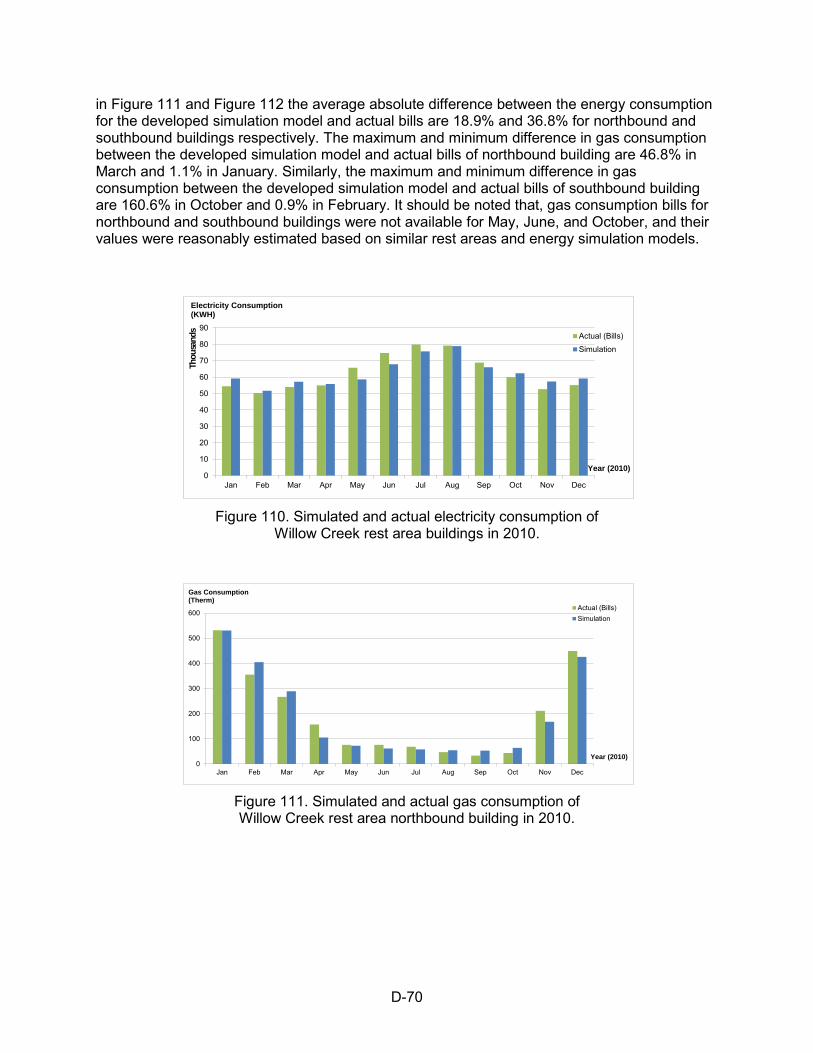
D-70
in Figure 111 and Figure 112 the average absolute difference between the energy consumption for the developed simulation model and actual bills are 18.9% and 36.8% for northbound and southbound buildings respectively. The maximum and minimum difference in gas consumption between the developed simulation model and actual bills of northbound building are 46.8% in March and 1.1% in January. Similarly, the maximum and minimum difference in gas consumption between the developed simulation model and actual bills of southbound building are 160.6% in October and 0.9% in February. It should be noted that, gas consumption bills for northbound and southbound buildings were not available for May, June, and October, and their values were reasonably estimated based on similar rest areas and energy simulation models.
Figure 110. Simulated and actual electricity consumption of
Willow Creek rest area buildings in 2010.
Figure 111. Simulated and actual gas consumption of Willow Creek rest area northbound building in 2010.
0
10
20
30
40
50
60
70
80
90
Jan Feb Mar Apr May Jun Jul Aug Sep Oct Nov Dec
Thou
sand
s
Actual (Bills)
Simulation
Electricity Consumption (KWH)
Year (2010)
0
100
200
300
400
500
600
Jan Feb Mar Apr May Jun Jul Aug Sep Oct Nov Dec
Actual (Bills)Simulation
Year (2010)
Gas Consumption (Therm)

D-71
Figure 112. Simulated and actual gas consumption of Willow Creek rest area southbound building in 2010.
It should be noted that the number of visitors per day was assumed to be constant throughout the year. Therefore, the difference in energy consumption between the eQuest simulation model and energy bills can be caused by the varying number of visitors per day, which affects the building’s heating and cooling energy consumption as well as its water use. In addition, the occasional and varying use of other small devices such as a microwave, laptop, small fan or heater unit that were observed during the site visits in the maintenance room can contribute to this difference between the simulation results and the energy bills. More importantly, the significant different between the developed energy simulation model of southbound building and actual reported bills of gas consumption (October through December) could result from improper reporting or measuring of gas consumption in the reported bills, malfunctioning of one of the furnaces equipment, or changes in settings of the HVAC system controls.
The square footage of Willow Creek rest area is 12,306 and its annual number of visitors is 1,117,265, which leads to energy consumption rate of 57.1 kwh/SF per year plus 0.75 Therm/SF per year, 6.69 $/SF per year, and 7.4 cents/visitor per year. The breakdown of energy cost for Willow Creek rest area buildings among their main sources of consumption are shown in Figure 113 and Figure 114 for northbound and southbound buildings respectively.
The eQuest energy simulation model shows that the highest source of energy consumption for northbound building is interior lighting that represents 32% of the total energy consumption. On the other hand, the two sources that consume the lowest energy in the northbound building are hand dryers and water pump that represent 2% and 1% of the building’s total energy consumption, respectively. Similarly, the highest source of energy consumption for southbound building is interior lighting that represents 29% of the total energy consumption. On the other hand, the two sources that consume the lowest energy in the southbound building are hand dryers and water heater that represent 1% each of the building’s total energy consumption.
0
200
400
600
800
1000
1200
Jan Feb Mar Apr May Jun Jul Aug Sep Oct Nov Dec
Actual (Bills)Simulation
Year (2010)
Gas Consumption (Therm)

D-72
Figure 113. Energy cost breakdown for
northbound building of Willow Creek rest area.
Figure 114. Energy cost breakdown for
southbound building of Willow Creek rest area.
D.4.2 Lighting
Lighting in the Willow Creek rest area represents the highest energy consumption of the rest area buildings; it represents approximately 56% for northbound building and 39% for southbound building with total annual cost of $34,789. The next two subsections analyze replacing current interior and exterior lighting with more-efficient and energy-saving bulbs. The economic analysis of light replacement in these two subsections assumes an annual interest rate of 2% and escalation in utility rate of 5%.
Space heating632.32%
Interior Lighting$8,50530%
Exterior Lighting$7,17826%
Vending Machines
$2,4489%
Hand Dryers$5162%
Water pumps$3541%
Water Heater$6082%
Space cooling$2,65810%
Fans and Exhaust$2,147
8%
water cooler$9663%
Surveliance and weather
info$2,006
7%
Others$1160%
Space heating2916.9
6%
Interior Lighting$13,469
27%
Exterior Lighting$5,63712%
Vending Machines
$4,0498%
Hand Dryers$5181%
Sewer and water pumps
$7,84116%
Water Heater$4961%
Space cooling$5,73412%
Fans and Exhaust$4,597
9%
water cooler$1,939
4%
Surveliance and weather info
$1,5393%
Others$3091%

D-73
D.4.2.1 Interior Lighting
Interior lighting in the Willow Creek rest area consists of linear and U-shape fluorescent T12 bulbs, 70w HPS bulbs and 400w MH bulbs. These bulbs can be replaced by linear and U-shaped fluorescent T8 to provide similar luminance level, less energy consumption and long life expectancy. Table 140 through Table 144 summarize the impact of replacing current fluorescent T12, HPS, and MH with fluorescent T8, CFL and induction light bulbs for the northbound building of the Willow Creek rest area. Similarly, Table 145 through Table 149 summarize the impact of replacing current fluorescent (T12), HPS, and MH with fluorescent (T8), CFL, and induction light bulbs for the southbound building of the Willow Creek rest area. It should be noted that replacing current HPS bulbs at the door entrances and corridors of the restrooms will reduce the lumens output levels by 44.6% and reduce the lumens output levels of current MH bulbs of the lobby by 31.4%. Despite the fact that CFL and induction lighting replacements have lower average lumens output levels however they provide higher Color Rendering Index (CRI) than HPS and MH. CRI measures the effect of a light source on the perceived color of object and surface. Having high value of CRI makes virtually all colors look natural and reduces glare (Light Sout Services 2010)
These lighting replacements can provide annual saving of $2,518 and reduce total energy consumption by 8.8% of the northbound building. Similarly, these lighting replacements can provide annual savings of $3,740 and reduce total energy cost by 7.6% of southbound building. The conducted LCC analysis for replacing all current T12, HPS, and MH lighting with T8, CFL, and induction light bulbs is shown in Figure 115 and Figure 116 for northbound and southbound buildings respectively. The average payback period for all light replacement is 3.7 years for northbound building and 3.2 years for southbound building. This represents a green building measure with promising return on investment.
Table 140. Replacing HPS Bulbs with Energy-Efficient CFL Light Bulbs for Restroom Corridors
and Entrances in Northbound Building of Willow Creek Rest Area
Lighting Characteristics, Costs, and Savings Current Fixtures/Bulbs
Replacement Fixtures/Bulbs
Type of bulb HPS CFL
Philips 33192-6 - LU70 - HPS /cam light bulb
Philips 139485 (EL/DT 42W)
Number of bulbs 12 12 Mean lumens (lumen) 5050 2800 Kelvin temperature (K) 2100 4100 Color Rendering Index (CRI) 21 82 Life time (hr) 24000 8000 Consumption per bulb (watt) 70 42 lamp cost ($/each) 1.73 22.99 Change in lumens output levels (%) N.A. -44.6 Reduction in energy consumption (%) N.A. 40 Annual savings in energy consumption - first year ($) N.A. 284 Payback period (yr) N.A. 5.5

D-74
Table 141. Replacing MH Bulbs with Induction Light Bulbs for Lobby in Northbound Building of Willow Creek Rest Area
Lighting Characteristics, Costs, and Savings Current Fixtures/Bulbs
Replacement Fixtures/Bulbs
Type of bulb
MH Induction lighting
Sylvania 64488 (M400/U/BT28)
Sylvania 26152 (ICE150/835/
2P/ECO) Number of bulbs 11 22 Mean lumens (lumen) 26000 8915 Kelvin temperature (K) 4000 5000 Color Rendering Index (CRI) 65 83 Life time (hr) 20000 100000 Consumption per bulb (watt) 455 161 Total consumption (watt) 5,005 3,542 lamp cost ($/each) $31.99 380 Change in lumens output levels (%) N.A. -31.4 Reduction in energy consumption (%) N.A. 29 Annual savings in energy consumption - first year ($) N.A. 1,238 Payback period (yr) N.A. 5.5
Table 142. Replacing Fluorescent T12 (U-Shape) Bulbs with Energy-Efficient T8 Light Bulbs for Restrooms in Northbound Building of Willow Creek Rest Area
Lighting Characteristics, Costs, and Savings Current Fixtures/Bulbs
Replacement Fixtures/Bulbs
Type of bulb Fluorescent (T12) Fluorescent (T8)
Sylvania (FB34/CW/6/SS/ECO
Sylvania 22305 (FBO28/841/XP/SS/ECO
Number of bulbs 24 24 Mean lumens (lumen) 2279 2265 Kelvin temperature (K) 4200 4100 Color Rendering Index (CRI) 62 75 Life time (hr) 18000 26000 Consumption per bulb (watt) 34 28 lamp cost ($/each) 9.99 15.79 Change in lumens output levels (%) N.A. +0.6 Reduction in energy consumption (%) N.A. 17.6 Annual savings in energy consumption - first year ($) N.A. 122 Payback period (yr) N.A. 2.2

D-75
Table 143. Replacing Linear Fluorescent T12 Bulbs with Energy-Efficient T8 Light Bulbs for Restrooms in Northbound Building of Willow Creek Rest Area
Lighting Characteristics, Costs, and Savings Current Fixtures/Bulbs
Replacement Fixtures/Bulbs
Type of bulb
Fluorescent (T12) Fluorescent (T8)
34CW/RS/WM/ECO Sylvania 22234 (FO32/25W/841/
XP/SS/ECO) Number of bulbs 96 96 Mean lumens (lumen) 2280 2327 Kelvin temperature (K) 4100 4100 Color Rendering Index (CRI) 60 85 Life time (hr) 20000 36000 Consumption per bulb (watt) 34 25 lamp cost ($/each) 1.8 7.39 Change in lumens output levels (%) N.A. +2.1 Reduction in energy consumption (%) N.A. 26.5 Annual savings in energy consumption - first year ($) N.A. 731 Payback period (yr) N.A. 0.74
Table 144. Replacing Light Bulbs of Maintenance and Storage Rooms with CFL Light Bulbs in Northbound Building of Willow Creek Rest Area
Lighting Characteristics, Costs, and Savings Current Fixtures/Bulbs
Replacement Fixtures/Bulbs
Type of bulb
Incandescent (assumed) CFL
Philips 213561 (50T60/HEA/WH)
Philips 137158 (EL/MDT 27W)
Number of bulbs 26 26 Mean lumens (lumen) 1600 1750 Kelvin temperature (K) 2900 2700 Color Rendering Index (CRI) 100 82 Life time (hr) 10000 10000 Consumption per bulb (watt) 70 27 lamp cost ($/each) 11.49 9.99 Change in lumens output levels (%) N.A. +9.4 Reduction in energy consumption (%) N.A. 61 Annual savings in energy consumption - first year ($) N.A. 142 Payback period (yr) N.A. Immediate return

D-76
Table 145. Replacing HPS Bulbs with Energy-Efficient CFL Light Bulbs for
Restroom Corridors and Entrances in Southbound Building of Willow Creek Rest Area
Lighting Characteristics, Costs, and Savings Current Fixtures/Bulbs
Replacement Fixtures/Bulbs
Type of bulb HPS CFL
Philips 33192-6 - LU70 - HPS /cam light bulb
Philips 139485 (EL/DT 42W)
Number of bulbs 18 18 Mean lumens (lumen) 5050 2800 Kelvin temperature (K) 2100 4100 Color Rendering Index (CRI) 21 82 Life time (hr) 24000 8000 Consumption per bulb (watt) 70 42 lamp cost ($/each) 1.73 22.99 Change in lumens output levels (%) N.A. -44.6 Reduction in energy consumption (%) N.A. 40 Annual savings in energy consumption - first year ($) N.A. 426 Payback period (yr) N.A. 5.5
Table 146. Replacing MH Bulbs with Induction Light Bulbs for Upper Lobby in Southbound Building of Willow Creek Rest Area
Lighting Characteristics, Costs, and Savings Current Fixtures/Bulbs
Replacement Fixtures/Bulbs
Type of bulb MH Induction lighting
Sylvania 64488 (M400/U/BT28)
Sylvania 26152 (ICE150/835/2P/ECO)
Number of bulbs 13 26 Mean lumens per bulb (lumen) 26000 8915 Kelvin temperature (K) 4000 5000 Color Rendering Index (CRI) 65 83 Life time (hr) 20000 100000 Consumption per bulb (watt) 455 161 Total consumption (watt) 5,915 4,186 lamp cost ($/each) $31.99 $380 Change in lumens output levels (%) N.A. -31.4 Reduction in energy consumption (%) N.A. 29.2 Annual savings in energy consumption - first year ($) N.A. 1,463 Payback period (yr) N.A. 5.5
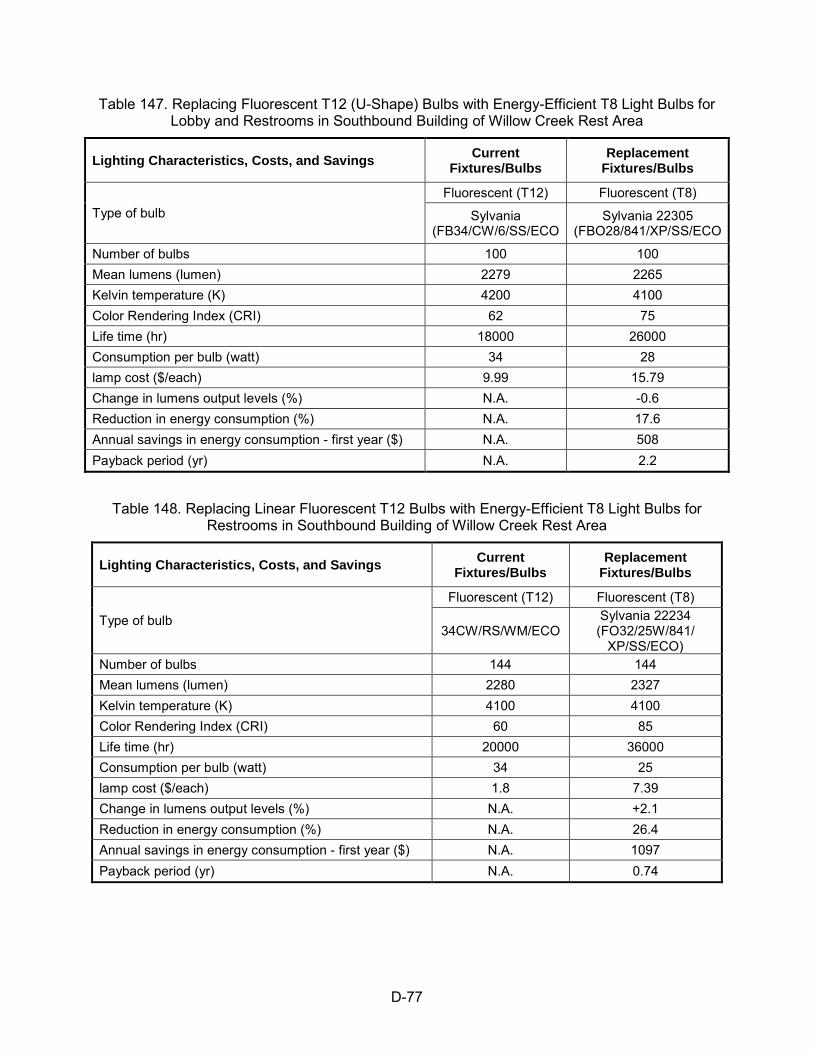
D-77
Table 147. Replacing Fluorescent T12 (U-Shape) Bulbs with Energy-Efficient T8 Light Bulbs for Lobby and Restrooms in Southbound Building of Willow Creek Rest Area
Lighting Characteristics, Costs, and Savings Current Fixtures/Bulbs
Replacement Fixtures/Bulbs
Type of bulb Fluorescent (T12) Fluorescent (T8)
Sylvania (FB34/CW/6/SS/ECO
Sylvania 22305 (FBO28/841/XP/SS/ECO
Number of bulbs 100 100 Mean lumens (lumen) 2279 2265 Kelvin temperature (K) 4200 4100 Color Rendering Index (CRI) 62 75 Life time (hr) 18000 26000 Consumption per bulb (watt) 34 28 lamp cost ($/each) 9.99 15.79 Change in lumens output levels (%) N.A. -0.6 Reduction in energy consumption (%) N.A. 17.6 Annual savings in energy consumption - first year ($) N.A. 508 Payback period (yr) N.A. 2.2
Table 148. Replacing Linear Fluorescent T12 Bulbs with Energy-Efficient T8 Light Bulbs for Restrooms in Southbound Building of Willow Creek Rest Area
Lighting Characteristics, Costs, and Savings Current Fixtures/Bulbs
Replacement Fixtures/Bulbs
Type of bulb
Fluorescent (T12) Fluorescent (T8)
34CW/RS/WM/ECO Sylvania 22234 (FO32/25W/841/
XP/SS/ECO) Number of bulbs 144 144 Mean lumens (lumen) 2280 2327 Kelvin temperature (K) 4100 4100 Color Rendering Index (CRI) 60 85 Life time (hr) 20000 36000 Consumption per bulb (watt) 34 25 lamp cost ($/each) 1.8 7.39 Change in lumens output levels (%) N.A. +2.1 Reduction in energy consumption (%) N.A. 26.4 Annual savings in energy consumption - first year ($) N.A. 1097 Payback period (yr) N.A. 0.74

D-78
Table 149. Replacing Light Bulbs of Maintenance and Storage Rooms with CFL Light Bulbs in Southbound Building of Willow Creek Rest Area
Lighting Characteristics, Costs, and Savings Current Fixtures/Bulbs
Replacement Fixtures/Bulbs
Type of bulb
Incandescent (assumed) CFL
Philips 213561 (50T60/HEA/WH)
Philips 137158 (EL/MDT 27W)
Number of bulbs 45 45 Mean lumens (lumen) 1600 1750 Kelvin temperature (K) 2900 2700 Color Rendering Index (CRI) 100 82 Life time (hr) 10000 10000 Consumption per bulb (watt) 70 27 lamp cost ($/each) 11.49 9.99 Change in lumens output levels (%) N.A. +9.4 Reduction in energy consumption (%) N.A. 61 Annual savings in energy consumption - first year ($) N.A. 246 Payback period (yr) N.A. Immediate return
Figure 115. Cumulative costs, savings, and CO2 emissions for current and replacement
lighting in northbound building of Willow Creek rest area.
Figure 116. Cumulative costs, savings, and CO2 emissions for current and replacement
lighting in southbound building of Willow Creek rest area.
-100000
0
100000
200000
300000
400000
500000
600000
700000
800000
0 2 4 6 8 10 12 14 16 18 20 22 24 26 28 30
Current Bulbs
Replacement Bulbs
Cumulative annual Savings
Cost ($)
n (Years)0
500000
1000000
1500000
2000000
2500000
3000000
3500000
4000000
0 2 4 6 8 10 12 14 16 18 20 22 24 26 28 30
Current BulbsReplacement Bulbs
CO2 emissions (IBS)
n (Years)
-200000
0
200000
400000
600000
800000
1000000
1200000
1400000
0 2 4 6 8 10 12 14 16 18 20 22 24 26 28 30
Current Bulbs
Replacement Bulbs
Cumulative annual Savings
Cost ($)
n (Years)0
1000000
2000000
3000000
4000000
5000000
6000000
7000000
0 2 4 6 8 10 12 14 16 18 20 22 24 26 28 30
Current BulbsReplacement Bulbs
CO2 emissions (IBS)
n (Years)

D-79
D.4.2.2 Exterior Lighting
This section analyzes the impact of replacing current exterior lighting of Willow Creek rest area with LED and induction lighting. The average lighting operating hours was determined based on eQuest simulation model, which accounts for the location of the rest area building and its seasonal operational hours. The average lighting hours of exterior lighting was calculated to be 8.73 hours. The current exterior lighting in northbound building of Willow Creek rest area consists of (1) 10 dusk-to-dawn light fixtures with 50 watt HPS bulbs in each; (2) 29 lighting poles with a total of thirty 250 watt HPS bulbs; and (3) five lighting towers with a total of twenty 400watt HPS bulbs. The current exterior lighting in southbound building of Willow Creek rest area consists of (1) ten dusk-to-dawn light fixtures with 50 watt HPS bulbs in each; (2) twenty lighting poles with a total of twenty-one 250 watt HPS bulbs; and (3) three lighting towers with eighteen 400 watt HPS bulbs. Due to the unavailability of the exact brand and luminance characteristics of current exterior lighting, reasonable assumptions were made for luminance level giving the fact that the luminance characteristics are not significantly affected by the manufacturers. Due to the unavailability of the exact brand and luminance characteristics of current exterior lighting, reasonable assumptions were made for their luminance level giving the fact that the luminance characteristics are not significantly affected by the manufacturers. It should be noted that LCC was conducted for one-for-one replacement to reduce initial costs. This one-for-one replacement is expected to reduce the current total lighting output (lumen) of light poles by 47% and 54% for LED and induction lighting replacements respectively. Similarly, this one-for-one replacement will reduce the current total lighting output (lumen) of (1) light towers by 60% and 64% for LED and induction lighting replacements, respectively; and (2) recessed fixtures by 38% and 48% for LED and induction lighting replacements, respectively. It should be noted that despite the lower average luminance of LED and induction lighting compared to HPS lighting, LED and induction lighting provide higher Color Rendering Index (CRI) than HPS lighting. CRI measures the effect of a light source on the perceived color of object and surface. Having high value of CRI makes virtually all colors look natural and reduces glare (Light Sout Services 2010).
A LCC analysis was conducted to examine the feasibility of a one-for-one replacement of the current exterior lighting of rest area buildings, their parking lots, as well as entrances and exits with LED and induction lighting replacements, the conducted analysis considered the possible lighting fixtures and bulbs shown in Table 150 as recommended by manufactures. The components and results of the conducted analysis of one-for-one replacements are summarized in Table 151 and Table 152 for all lighting fixtures/bulbs of northbound building, Table 153 and Table 154 for all lighting fixtures/bulbs of southbound building. The cumulative cost and savings as well as carbon footprint and reductions in CO2 emissions for replacing exterior lighting of Willow Creek rest area are shown in Figure 117 and Figure 118 for northbound and southbound respectively. The analysis shows that these light replacements in northbound building can provide annual savings of $4,032 or 14.1% of total energy consumption for LED lighting replacements and $3,934 or 13.7% of total energy consumption for induction lighting replacements. Similarly, these light replacements in southbound building can provide annual savings of $3,162 or 6.5% of total energy consumption for LED lighting replacements and $3,084 or 6.3% of total energy consumption for induction lighting replacements. This leads to a payback period of 22.1 years for LED light replacements and 6.2 years for induction lighting replacements in northbound building and 22 years for LED lighting and 6.2 years for induction lighting in the southbound building.

D-80
Table 150. Characteristics of Current and Replacement Lighting for Exterior Lighting of Willow Creek Rest Area Buildings
Table 151. Replacing HPS 400W Bulbs with Energy-Efficient LED and Induction
Light Bulbs in Northbound Building of Willow Creek Rest Area
Building Factors Current Fixtures/Bulbs
Replacement 1
Replacement 2
Type of bulb HPS LED Induction Number of bulbs 50 50 50 Initial lumens (lumen) 50000 20000 18000 Kelvin temperature 2100 2700-8000 5000 Color Rendering Index (CRI) 20 75 83 Life time (hr) 24000 50000 75000 Consumption per bulb, including ballast (watt) 481 224 230 Bulb cost ($) 54 1,493 538 Reduction in lumens output levels (%) N.A. 60 64 Reduction in energy consumption (%) N.A. 53 52 Annual savings in energy - first year ($/year) N.A. 3,955 3,863 Payback period N.A. 21.9 6.1
Table 152. Replacing HPS 50W Bulbs with Energy-Efficient LED and Induction Light Bulbs in Northbound Building of Willow Creek Rest Area
Building Factors Current Fixtures/Bulbs
Replacement 1
Replacement 2
Type of bulb HPS LED Induction Number of bulbs 10 10 10 Initial lumens (lumen) 4000 2500 2100 Kelvin temperature 2100 3000-5000 2700-6500 Color Rendering Index (CRI) 21 80 83 Life time (hr) 24000 50000 100000 Consumption per bulb, including ballast (watt) 55 30 32 Bulb cost 18 206 206 Reduction in lumens output levels (%) N.A. 38 48 Reduction in energy consumption (%) N.A. 45 42 Annual savings in energy - first year ($/year) N.A. 86 79 Payback period N.A. 26.7 17.8
Type Characteristics Type Characteristics Type CharacteristicsInitial Lumens (lumen) HPS 50w 4000 LED Lamp 2500 Induction Lamp 2100
Color temperature (Kelvin) 3000 3000-5500 2700-6500Color rendering index (CRI) 85 80 83
Life time (hours) 10000 50000 100000Consumption (w) 50 30 30
Lamp cost ($) 40 206 206Lamp and fixture cost ($) - - -
Initial Lumens (lumen) HPS 400w 50000 LED Steet Light 20000 Induction Steet 18000Color temperature (Kelvin) 2100 2700-8000 Light 5000Color rendering index (CRI) 20 75 83
Life time (hours) 24000 50000 75000Consumption (w) 400 224 225
Lamp cost ($) 54 - -Lamp and fixture cost ($) - 1493 538
Light Characteristic items Replacement (LED lighting) Replacement (Induction light)Current lighting

D-81
Figure 117. Cumulative costs, savings, and CO2 emissions for LED and induction lighting
replacements for northbound building of Willow Creek rest area.
Table 153. Replacing HPS 400W Bulbs with Energy-Efficient LED and Induction Light Bulbs in Southbound Building of Willow Creek Rest Area
Building Factors Current Fixtures/Bulbs
Replacement 1
Replacement 2
Type of bulb HPS LED Induction Number of bulbs 39 39 39 Initial lumens (lumen) 50000 20000 18000 Kelvin temperature 2100 2700-8000 5000 Color Rendering Index (CRI) 20 75 83 Life time (hr) 24000 50000 75000 Consumption per bulb, including ballast (watt) 481 224 230 Bulb cost ($) 54 1,493 538 Reduction in lumens output levels (%) N.A. 60 64 Reduction in energy consumption (%) N.A. 53 52 Annual savings in energy - first year ($/year) N.A. 3,085 3,013 Payback period N.A. 21.9 6.1
Table 154. Replacing HPS 50W Bulbs with Energy-Efficient LED and Induction Light Bulbs in Southbound Building of Willow Creek Rest Area
Building Factors Current Fixtures/Bulbs
Replacement 1
Replacement 2
Type of bulb HPS LED Induction Number of bulbs 10 10 10 Initial lumens (lumen) 4000 2500 2700-6500 Kelvin temperature 2100 3000-5000 5000 Color Rendering Index (CRI) 21 80 83 Life time (hr) 24000 50000 100000 Consumption per bulb, including ballast (watt) 55 30 32 Bulb cost ($) 18 206 206 Reduction in lumens output levels (%) N.A. 38 48 Reduction in energy consumption (%) N.A. 45 42 Annual savings in energy - first year ($/year) N.A. 77 71 Payback period N.A. 26.7 17.8
0
500
1000
1500
2000
2500
0 2 4 6 8 10 12 14 16 18 20 22 24 26 28 30
CO2 emissions (IBS)
Thou
sand
s
n (Years)
"current exterior lighting"
LED Emission
Induction Emission

D-82
Figure 118. Cumulative costs, savings, and CO2 emissions for LED and induction lighting
replacements for northbound building of Willow Creek rest area.
D.4.3 Motion Sensors Rest areas have different operational schedule than business and commercial buildings
and they have to operate 24 hours a day with few or no occupants during low visitation periods at night. This makes motion sensors a promising technology for rest area buildings. This section analyzes the implementation of motion sensors to control the lighting of restrooms and vending machine areas. Motion sensors also can be used to reduce space heating and cooling by reducing the use of exhaust fans at night when there are few or no occupants in the restrooms.
In order to estimate the energy savings in lighting and exhaust fans, the research team developed a separate simulation model using EZstrobe simulation language (Martinez 2006) to analyze and simulate the use of restrooms and vending machines based on the number and frequency of rest area visitors. The simulation model was developed to mimic the utilization of the rest area facilities by its visitors. The model was created to generate the number of visitors to the rest area using a beta distribution function to represent a high frequency of visitors during the morning, noon, and afternoon hours and low frequency during the night and early morning hours. The model also assumes that the percentages of visitors that will use the men’s restroom, women’s restroom and vending machines are 40%, 40%, and 20%, respectively. Similarly, the probabilities that restroom visitors will use urinals, toilets and only faucets were assumed to be 30%, 60%, and 10%, respectively with reasonable random durations for each of these restroom tasks as, shown in Figure 119. It should be noted that the model assumes that each visitor using the toilet or urinal will also use the faucet afterwards. The developed model accounts for an amount of time for sensors to keep the light on after a visitor leaves a restroom. After a visitor leaves the restroom, the model assumes that there is a probability of 60% that the visitor will leave the rest area and 40% will use vending machines. The developed model can estimate how long the lighting in restrooms of the rest area will be turned off if motion-activated lighting were implemented in the restrooms. Similarly, the amount of time that lighting in vending machines and exhaust fans being turned/switched off can be calculated by the developed simulation model. Figure 120 shows rest area visitors while being in the men’s restroom throughout a simulation day. Table 155 summarizes the percentages of occupancy for restrooms and vending machines of the Willow Creek rest area assuming that the lights or fans remain turned on for 5 minutes after the departure of the last visitor. The following subsections use the developed simulation model to estimate potential savings for using motion sensors in the rest area building and their expected payback periods. The economic analysis of motion sensors accounts for an annual interest rate of 2% and escalation in utility rate of 5% in calculating payback period of implementing this technology.
0
500
1000
1500
2000
2500
0 2 4 6 8 10 12 14 16 18 20 22 24 26 28 30
CO2 emissions (IBS)
Thou
sand
s
n (Years)
"current exterior lighting"
LED Emission
Induction Emission

D-83
Figure 119. Motion-sensor simulation model for Willow Creek rest area buildings.

D-84
Figure 120. Number of visitors in men’s restroom throughout a
simulation day in Willow Creek rest area buildings.
Table 155. Average Percentage Occupancy for Restrooms and Vending Area of Willow Creek Rest Area Buildings
Percentage of Occupancy In Men’s
Restrooms
Percentage Occupancy in
Women’s Restrooms
Percentage Average
Occupancy in All Restrooms
Percentage Occupancy in Vending
Machines Area
49.5% 49.9% 49.7% 40.2%
D.4.3.1 Motion-Activated Lighting
Motion-activated lighting can be installed in restrooms to turn off lights automatically when they are not occupied. As discussed in the previous section, restrooms in the Willow Creek rest area have an average approximate occupancy of 49.7% including 5 minutes for the occupancy sensors remain in detection before turning off automatically. This leads to average 50.3% savings in lighting of restrooms. Table 156 shows the results of the LCC analysis for implementing motion-activated lighting in restrooms of Willow Creek rest area buildings. The analysis shows that motion-activated lighting can provide approximate savings of $1,915 annually for northbound building and $2,963 for southbound building or 6.7% of total energy cost for northbound building and 6% for southbound building. This represents a payback period of 0.83 years for northbound building and 1.07 years for southbound building. Furthermore, motion-activated lighting in restrooms can eliminate annually 71,199 Ib of CO2 emissions for both buildings.
Implementing motion-activated lighting in the lobby will not be feasible due to security requirements that require lights to be turned on at all times to ensure the proper operation of the surveillance cameras. Moreover, implementing motion-activated lighting in maintenance rooms will not provide much savings and the payback period will be long since the maintenance staff often turn off the light before leaving the mechanical rooms of the rest area.
0
1
2
3
4
5
6
0 200 400 600 800 1000 1200 1400
Simulation Time
Number of Visitors in one of the men's bathrooms
Midnight MidnightNoon6:00AM 6:00PM
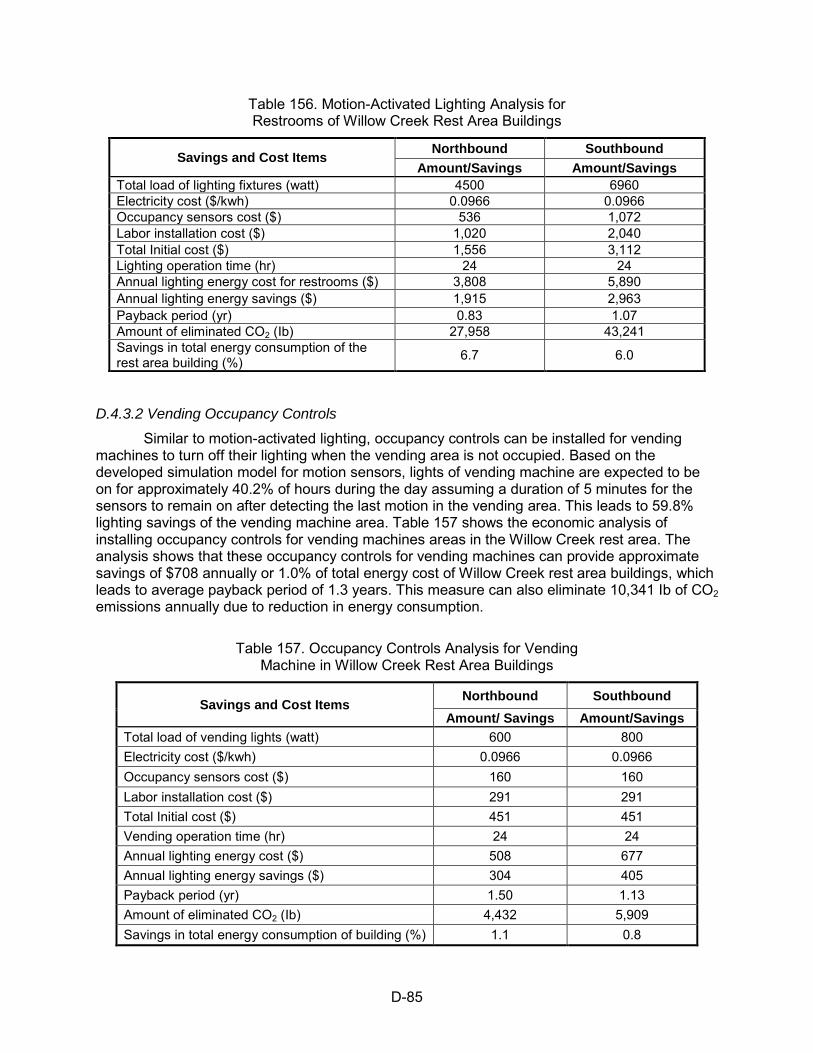
D-85
Table 156. Motion-Activated Lighting Analysis for Restrooms of Willow Creek Rest Area Buildings
Savings and Cost Items Northbound Southbound Amount/Savings Amount/Savings
Total load of lighting fixtures (watt) 4500 6960 Electricity cost ($/kwh) 0.0966 0.0966 Occupancy sensors cost ($) 536 1,072 Labor installation cost ($) 1,020 2,040 Total Initial cost ($) 1,556 3,112 Lighting operation time (hr) 24 24 Annual lighting energy cost for restrooms ($) 3,808 5,890 Annual lighting energy savings ($) 1,915 2,963 Payback period (yr) 0.83 1.07 Amount of eliminated CO2 (Ib) 27,958 43,241 Savings in total energy consumption of the rest area building (%) 6.7 6.0
D.4.3.2 Vending Occupancy Controls
Similar to motion-activated lighting, occupancy controls can be installed for vending machines to turn off their lighting when the vending area is not occupied. Based on the developed simulation model for motion sensors, lights of vending machine are expected to be on for approximately 40.2% of hours during the day assuming a duration of 5 minutes for the sensors to remain on after detecting the last motion in the vending area. This leads to 59.8% lighting savings of the vending machine area. Table 157 shows the economic analysis of installing occupancy controls for vending machines areas in the Willow Creek rest area. The analysis shows that these occupancy controls for vending machines can provide approximate savings of $708 annually or 1.0% of total energy cost of Willow Creek rest area buildings, which leads to average payback period of 1.3 years. This measure can also eliminate 10,341 Ib of CO2 emissions annually due to reduction in energy consumption.
Table 157. Occupancy Controls Analysis for Vending
Machine in Willow Creek Rest Area Buildings
Savings and Cost Items Northbound Southbound Amount/ Savings Amount/Savings
Total load of vending lights (watt) 600 800 Electricity cost ($/kwh) 0.0966 0.0966 Occupancy sensors cost ($) 160 160 Labor installation cost ($) 291 291 Total Initial cost ($) 451 451 Vending operation time (hr) 24 24 Annual lighting energy cost ($) 508 677 Annual lighting energy savings ($) 304 405 Payback period (yr) 1.50 1.13 Amount of eliminated CO2 (Ib) 4,432 5,909 Savings in total energy consumption of building (%) 1.1 0.8

D-86
D.4.3.3 Motion Sensors for Exhaust
Similar to motion-activated lighting, exhaust fans can operate only during the occupancy times of visitors. This will allow exhaust fans to be switched off automatically when there are no visitors, which will decrease the amount of outside air that needs to be heated or cooled. eQuest software does not provide a direct method to account for the use of exhaust fan motion sensors however this can be modeled by decreasing the exhaust rate by a value, which reflects the switching off of exhaust fans when there are no occupants. Accordingly, exhaust fan flow can be decreased with the average non-occupancy percentage of restrooms (50.3%). Table 158 summarizes the economic analysis results for implementing motion sensors for exhaust fans in rest area buildings. The analysis shows that motion sensors for exhaust fans can provide approximate annual savings of $1,979 annually or 2.4% of total energy consumption of Willow Creek rest area buildings, which leads to an average payback period of 3 years. This measure can also eliminate 29,624 Ib of CO2 emissions annually due to the reduction in energy consumption of heating and cooling.
Table 158. LCC Analysis Results for Implementing Exhaust Motion Sensors in Willow Creek Rest Area Buildings
Savings and Cost Items Northbound Southbound
Amount/Savings Amount/ Savings
Electricity cost ($/kwh) 0.0966 0.0966 Gas cost ($/therm) 0.77 0.77 Fan(s) and sensors cost ($) 1,732 1,732 Labor installation cost ($) 874 874 Total Initial cost ($) 2,606 2,606 Annual electricity savings (kwh) 3490 4320 Annual gas savings (therm) 397.0 1193.8 Annual energy savings ($) 643 1,337 Payback period (yr) 3.96 1.96 Amount eliminated CO2 (Ib) 9,566 20,059 Savings in total energy consumption of building (%) 2.2 2.7
D.4.4 More-Efficient HVAC Systems The current HVAC system at the Willow Creek rest area consists of two packaged
rooftop units for northbound building and two packaged rooftop units for southbound building. The northbound HVAC system has a cooling capacity of 17 tons and an approximate total heating capacity of 79MBH; the southbound HVAC system has a cooling capacity of 27 tons and an approximate total heating capacity of 142MBH. The current HVAC systems can be replaced with more energy-efficient systems that reduce heating and cooling energy consumption. The next three subsections analyze the replacement of the current HVAC systems with more-efficient units and setting back the temperature at night.

D-87
D.4.4.1 Geothermal Heat Pump
The existing HVAC systems in the Willow Creek rest area building operate continuously year round and their consumption represents 20% of the total energy cost in the northbound building and 27% of total energy cost in the southbound building. Ground-source heat pumps use the nearly constant temperature of earth (55°F) to heat and cool buildings. The eQuest simulation environment can be used to model the use of geothermal HVAC systems for Willow Creek rest area buildings. These systems were modeled to have heating coefficient of performance (COP) of 4.0 and a cooling efficiency of 18 EER. This system was also modeled to operate in economizer mode, which brings fresh air when the outside air temperature is sufficient to condition the space. After running the eQuest model with geothermal heat pump, the developed models provide annual savings of 8.2% of total energy cost in northbound building and 9.2% of total energy cost in southbound building. The installation and maintenance costs of geothermal heat pump were calculated similar to Coalfield rest area buildings. Table 159 summarizes the LCC components of replacing the current HVAC systems with geothermal heat pumps.
Table 159. LCC Components for Replacing Current HVAC System with Geothermal Heat Pump at Willow Rest Area Buildings
LCC Components Northbound Southbound
Costs/Life Costs/Life
Capital cost - vertical system ($) 70,520 111,520
Annual maintenance cost ($) 533 533
Annual operating cost ($) 5,051 9,827
Periodic cost ($) 43,320 68,320
Life (yr) 20 20 * Installation cost may vary due to soil conditions and resizing of the HVAC equipment
In order to compare the cost effectiveness and payback periods of replacing the current HVAC systems in the rest area with geothermal systems, the initial, maintenance, operating and replacement costs of the current HVAC systems need to be identified. These costs were estimated similar to the Coalfield rest area buildings in order to carry out the LCC analysis. Table 160 summarizes the LCC components for current HVAC system of Willow Creek rest area buildings.
Table 160. LCC Components for Current HVAC System in Willow Rest Area Buildings
LCC Components Northbound Southbound
Cost/Life Cost/Life Capital cost ($) 25,420 40,060 Annual maintenance cost ($/yr) 1,149 1,149 Annual operating cost ($/yr) 5,918 13,454 Periodic cost ($) 25,420 40,060 Life (yr) 17 17 Manufacture year 1995 1995 Replacement year 2012 2012

D-88
A LCC analysis was conducted to compare the potential replacement of the current HVAC system with a geothermal heat pump based on an annual interest rate of 2%, escalation in utility rate of 5%, and annual increase of maintenance cost of 2%. Table 161 summarizes the LCC analysis results for replacing current HVAC with geothermal heat pump. This analysis shows that a geothermal heat pump can provide savings of $2,349 in the northbound building and $4,530 annually in the southbound building. The analysis shows that replacing current HVAC systems with vertical loop geothermal heat pumps has a payback period of 13.4 years for the northbound building and 12.2 years for the southbound building. The cumulative costs for a vertical loop geothermal system, current HVAC systems, and savings are shown in Figure 121 and Figure 122 for the northbound and southbound buildings of Willow Creek rest area, respectively. The geothermal heat pump can also be installed along with a desuperheater to heat water in the cooling season. The desuperheater uses heat that is removed from the building space to heat domestic hot water. This unit can provide free hot water in the summer or when the system is in cooling mode. It can provide annual savings of $175 or 0.6% of the northbound building total energy consumption and annual savings of $140 or 0.3% of the southbound total energy consumption. The payback period of the desuperheater is 8.4 years for northbound building and 11.5 years for southbound building. These desuperheaters can eliminate 4,784 Ib of CO2 emissions for northbound building and 6,084 for southbound building.
Table 161. LCC Analysis Results for Replacing Current HVAC
System with Geothermal Heat Pump in Willow Rest Area Buildings
Savings Northbound Southbound Amount Amount
Annual electricity saved (kwh) 12,380 16,700 Annual gas saved (therm) 1,497 3,788 Annual energy savings - first year ($/yr) 2,349 4,530 Percentage of total energy saved (%) 8.2 9.2 Annual eliminated CO2 emissions (Ib) 34,971 67,869 Payback period - vertical system (yr) 13.4 12.2
Figure 121. Cumulative costs of current HVAC system,
vertical loop geothermal system, and savings for northbound building of Willow Creek rest area.
-100,000
0
100,000
200,000
300,000
400,000
500,000
600,000
700,000
0 1 2 3 4 5 6 7 8 9 10 11 12 13 14 15 16 17 18 19 20 21 22 23 24 25 26 27 28 29 30
Geothermal Heat Pump - Vertical System
Current HVAC System
Cumulative Savings
Years
Cost ($)

D-89
Figure 122. Cumulative costs of current HVAC system,
vertical loop geothermal system, and savings for southbound building of Willow Creek rest area.
D.4.4.2 High-Efficiency Packaged Furnace
Another alternative for the current HVAC system at the Willow Creek rest area is to replace it with a more-efficient Energy Star–rated packaged furnace to study the feasibility of reducing heating and cooling expenses. A packaged furnace was modeled in eQuest to meet Energy Star recommendations with cooling efficiency of 12 EER and heating performance of 0.95 AFUE (Energy Star 2003). Table 162 summarizes the economic analysis results for replacing the current HVAC system with an Energy Star–rated air-source heat pump. The analysis shows that an Energy Star–rated furnace can provide annual savings of $1,325 for the northbound building and $2,898 for the southbound building, with a payback period of 20.8 years for the northbound building and 14.2 years for the southbound building. This replacement can also eliminate CO2 emissions by 61,880 lb annually.
Table 162. Analysis Results for Replacing Current HVAC System with
Energy-Efficient Air-Source Heat Pump at Willow Creek Rest Area Buildings
Savings and Cost Items Northbound Southbound
Amount/Savings Amount/Savings Electricity cost ($/kwh) 0.0966 0.0966 Gas cost ($/therm) 0.77 0.77 Estimated initial cost for packaged furnace ($) 36,450 49,275 Annual energy savings ($) 1,325 2,898 Payback period (yr) 20.8 14.2 Amount of eliminated CO2 (Ib) 19,402 42,478 Savings in total energy consumption of the rest area building (%) 4.6 5.9
D.4.4.3 Setting Back HVAC System at Night
Another method to reduce energy consumption for space heating and cooling of the rest area is to set back the temperature of the HVAC system at night. The number of visitors using the rest area at night is very limited and, accordingly, setting back the temperature at night can
-200,000
0
200,000
400,000
600,000
800,000
1,000,000
1,200,000
1,400,000
0 1 2 3 4 5 6 7 8 9 10 11 12 13 14 15 16 17 18 19 20 21 22 23 24 25 26 27 28 29 30
Geothermal Heat Pump - Vertical System
Current HVAC System
Cumulative Savings
Years
Cost ($)

D-90
reduce the energy consumption for heating and cooling. The temperature can be set at night to 68ᵒF in winter and 76ᵒF in summer. This measure can be modeled in eQuest by editing the temperature set points in the simulation model to a temperature that reflects the set points at night using interpolation. The developed eQuest model showed that setting back the temperature at night can provide annual savings of $524 for northbound building and $403 for southbound building or 1.8% of total energy cost of northbound building and 0.8% of total energy cost of southbound building. Willow Creek rest area buildings have already programmable thermostats, which make this measure easy to be implemented in the rest area without additional cost.
D.4.5 Energy-Efficient Hand Dryers Energy-efficient hand dryers are one of the green building measures that can be
implemented in the Willow Creek rest area buildings to reduce energy consumption of hand dryers was estimated based on a 50% use of rest area visitors each for 30 seconds according to manufacture use recommendations. Although, current hand dryers only consume approximately 1.4% of total energy cost, they are one of the most visible devices for the rest area visitors. Moreover, slow velocity or inefficient hand dryers may discourage people to use them. This analysis considers the impact of installing three different models of energy-efficient hand dryers in Willow Creek rest area buildings to reduce their energy consumption, as shown in Table 163 and Table 164 for northbound and southbound buildings of Willow Creek rest area respectively. The analysis shows that replacing current hand dryers may result in annual savings of $382 to $418 or 1.3 % to 1.5% of total energy cost for northbound building and 0.8% to 0.9% of total energy cost for southbound building of the rest area based on the three different models of energy-efficient hand dryers. These savings can provide a payback period of more than 5.6 years based on an annual interest rate of 2% and escalation in utility rate of 5%. This measure can eliminate up to 12,208 lb of CO2 emissions in Willow Creek rest area buildings.
Table 163. LCC Analysis Results for Replacing Current Hand Dryers with Energy-Efficient Units for Northbound Building of Willow Creek Rest Area
LCC Items/Savings Current
Hand Dryer - World Dryer
1- World Dryer
Airforce - J Series Hand
Dryers
2- Xlerator Series Hand
Dryers
3- Dyson Airblade
Series Hand Dryers
Number of hand dryers 9 Hand dryer consumption (watt) 2,300 1,100 1100 1500 drying time (second) 30 12 15 12 Initial cost ($) N.A. 2,457* 3,600* 14,400* Annual visitors - 2009 558,633 Savings over current hand dryers (%) N.A. 81 76 74 Utility cost ($/kwh) 0.0966 Annual operating cost based on 50% use of visitors ($) 517 99 124 135
Annual savings ($) N.A. 418 393 382 Annual savings of total energy consumption (%) N.A. 1.5 1.4 1.3
Eliminated CO2 emissions (Ib) N.A. 6,104 5,743 5,579 Payback period (yr) N.A. 5.6 8.4 26.1
* (Restroom Direct 2012)

D-91
Table 164. LCC Analysis Results for Replacing Current Hand Dryers with Energy-Efficient Units for Southbound Building of Willow Creek Rest Area
LCC Items/Savings
Current Hand
Dryer - World Dryer
1- World Dryer
Airforce - J Series Hand
Dryers
2- Xlerator Series Hand
Dryers
3- Dyson Airblade
Series Hand Dryers
Number of hand dryers 18 Hand dryer consumption (watt) 2,300 1,100 1100 1500 drying time (second) 30 12 15 12 Initial cost ($) N.A. 4,914* 7,200* 28,800* Annual visitors - 2009 558,633 Savings over the current hand dryers (%) N.A. 81 76 74 Utility cost ($/kwh) 0.0966 Annual operating cost based on 50% use of visitors ($) $517 99 124 135
Annual savings ($) N.A. 418 393 382 Annual savings of total energy consumption (%) N.A. 0.9 0.8 0.8
Eliminated CO2 emissions (Ib) N.A. 6,104 5,743 5,579
Payback period (yr) N.A. 10.4 15.1 More than 30 years
* (Restroom Direct 2012)
D.4.6 Solar Measures Several solar measures can be used to reduce energy consumption in the Willow Creek
rest area buildings. These measures can include solar daylight tubes, photovoltaic systems, and solar water heaters. These measures can reduce energy consumption of interior lighting, heating water as well as generating renewable and clean electricity. Solar daylight tubes were not analyzed for Willow Creek rest area buildings as they have metal roofs, which obstruct the penetration of solar tubes. Moreover, due to the inexistence of attic in the Willow Creek rest area, the installation of solar tubes could affect the insulation of the building roof and subsequently increase heating and cooling costs. The next subsections discuss the installation of photovoltaic systems and solar water heater in Willow Creek rest area buildings. D.4.6.1 Grid-Connected Photovoltaic Systems
Photovoltaic systems are one of the renewable energy measures that generate electricity to the Willow Creek rest area buildings. In order to perform LCC for installing photovoltaic systems in the rest area, this system needs to be designed to the estimate number and type of system parts. Several factors affect the design of grid-connected systems including average daily peak sun hours, capacity of solar panels, capacity of inverters, and mounting of solar panels. The design of photovoltaic system for the Willow Creek rest area was conducted using a similar procedure to the one described earlier in the Coalfield rest area.
This measure was analyzed to generate 10% of annual electricity consumption in northbound building and 6% of annual electricity consumption in southbound building. Table 165 summarizes the cost components for installing grid-connected photovoltaic system in the Willow Creek rest area buildings. The LCC analysis was conducted to determine annual savings, payback period, amount of eliminated CO2 emissions, and required area of the system. The analysis accounted for an annual interest rate of 2%, escalation in utility rate of 5%, and an annual increase of maintenance cost by 2%, as shown in Table 166 for northbound and

D-92
southbound buildings respectively. The analysis shows that incorporating a grid-connected photovoltaic system at the Willow Creek rest area has a payback period of 27 years for the northbound building and 26.7 years for the southbound building. The northbound system requires 74 solar panels to be installed, 45 can be mounted on the south part of the roof and 29 solar panels can be placed on the ground south of the rest area building. Similarly, the southbound system requires 76 solar panels to be installed, 45 can be mounted on the south part of the roof and 31 solar panels can be placed on the ground south of the rest area building. The required area for solar panels on the ground is 270 SF in each bound, these calculations accounted for 51ᵒ tilt angle for the solar panels and preventing shading that might occur due to layout of solar panels in winter and summer. Figure 123 and Figure 124 show the cumulative savings of installing a grid-connected system in the northbound and southbound buildings of the rest area.
Table 165. Cost Components for Installing Grid-Connected Photovoltaic System in Willow Creek Rest Area Buildings
Cost Components Northbound Southbound Amount/Savings Amount/Savings
Total number of solar panels 74 76 Number of inverters 2 2 System capacity (KW) 17.4 17.9 Utility cost ($/kwh) 0.140 0.140 Initial cost ($) 71,977 73,836 Annual maintenance cost ($) 208 213 Solar Panels periodic cost ($) 25,682 26,376 Inverter periodic cost ($) 8,220 8,220 Annual Savings ($) 2,663 2,738 Annual Savings (kwh) 27565 28342 Cost per watt ($/w) 4.15 4.14
Table 166. LCC Analysis Results for Incorporating Grid-Connected Photovoltaic System in Willow Creek Rest Area Buildings
LCC Items / Savings Northbound Southbound
Amount/Savings Amount/Savings Annual eliminated CO2 emissions (Ib) 38,866 39,963 Number of solar panels on roof 45 45 Number of solar panels on the ground 29 31 Required area for solar panels (SF) 270 270 Tilt angle of solar panels 51 51 Payback period (yr) 27.0 26.7

D-93
Figure 123. Cumulative cost of incorporating grid-connected system in the northbound building of Willow Creek rest area.
Figure 124. Cumulative cost of incorporating grid-connected system in the southbound building of Willow Creek rest area.
It should be noted that the stand-alone photovoltaic system was not considered in this analysis because of its infeasible payback period that was identified in the first phase of this project due to its high initial and periodic costs of battery systems.
D.4.6.2 Solar Water-Heating Systems
Solar water heater is another technology that can reduce energy consumption for heating water in the rest area building. This technology can be installed with the current water heaters in the rest area in order to mitigate the cost of replacing current water heater. Moreover, current water heater can work as a backup when the sun rays are unavailable or insufficient to heat water to the desired temperature. The components of installing this system include solar collector(s), collector’s mounting, heat exchanger, circulator, antifreeze (glycol), water storage tank(s), controller, fittings, pipes, and insulation. The initial capital cost of the system can be calculated for the three rest areas using the RSMeans Building Construction Cost Data (2012). Maintenance cost and life were calculated similar to Coalfield rest area buildings. Table 167
-100,000
-50,000
0
50,000
100,000
150,000
200,000
0 2 4 6 8 10 12 14 16 18 20 22 24 26 28 30 32 34 36 38 40Years
Cumulative Savings ($)
-100,000
-50,000
0
50,000
100,000
150,000
200,000
0 2 4 6 8 10 12 14 16 18 20 22 24 26 28 30 32 34 36 38 40Years
Cumulative Savings ($)

D-94
summarizes the LCC components for incorporating solar water heaters in the Willow Creek rest area buildings. A LCC analysis was conducted based on an annual interest rate of 2%, escalation in utility rate by 5%, and an annual increase of maintenance cost by 2%, as shown in Table 168. The analysis shows that installing solar water heaters in the Willow Creek rest area buildings has a payback period more than 20.7 years based on 70% energy savings of water heater in northbound and southbound building. This measure can eliminate CO2 emissions by 3,355 to 11,743 Ib annually for Willow Creek rest area buildings.
It should be noted that solar collector(s) can be installed on the roof by clamps/straps or on the ground where a rack is used to hold the collector(s). Installing solar collectors on the roof might not be feasible as the building roof of the rest area was not designed to carry such extra load. Subsequently, solar collectors should be mounted on the ground.
Table 167. LCC Components for Installing Solar Water
Heater in Willow Creek Rest Area Buildings
LCC Components Amount/ Savings Amount/Savings Capital cost (Ground mount) 8,135 8,135 Annual maintenance cost (Ground rack) 81 81 Utility gas cost ($/therm) 0.77 0.77 Conventional water heater consumption (therm) 790 644 Annual operating cost for conventional water heater ($) 608 496 Annual savings (20% to 70% savings) ($) 122 to 426 99 to 347 Periodic cost for pump @ 5 years ($) 250 250 Periodic cost for water tank @ 16 years ($) 1,600 1,600 Circulating pump life (yr) 5 5 Tank life (yr) 16 16
Table 168. LCC Analysis Results for Installing Solar Water Heater in Willow Creek Rest Area Buildings
Savings Amount Amount Annual gas saved - 20% savings (therm) 158 129 Annual gas saved - 70% savings (therm) 553 451 Annual eliminated CO2 emissions - 20% savings (Ib) 1,848 1,507 Annual eliminated CO2 emissions - 70% savings (Ib) 6,468 5,275 Payback period - 20% savings (yr) More than 30 More than 30 Payback period - 70% savings (yr) 20.65 24.41
D.4.7 Water-Saving Plumbing Fixtures Rest areas have a high rate of water consumption due to the large number of visitors
that use their restrooms. Using water-conserving fixtures in these rest areas will provide significant savings in water consumption. A number of feasible water-saving technologies can be used to minimize water consumption in the rest areas including efficient faucets, aerators, toilets, and urinals. Currently, the Willow Creek rest area buildings have low-flow faucets, which makes them suitable for conserving water use in the facility. Furthermore, the current toilets in the Willow Creek rest area buildings provide efficient use of water for flushing toilets as they have a flushing rate 1.6 GPF. An analysis was conducted to estimate the feasibility of installing conserving urinals in the rest area buildings. Table 169 summarizes the analysis of replacing

D-95
current urinals with water-conserving ones. As it was difficult to calculate precisely the number of visitors using urinals, the analysis assumed that 24% of visitors use urinals. The replacement of current plumbing fixtures can provide savings of 87.5% to 92.5% of water consumption by urinals. This could result in a total water savings of 328,476 gallons annually. The payback period for these fixtures could not be calculated as water unit cost could not be identified as the rest area uses ground water to supply its needs.
Table 169. LCC Analysis for Replacing Current Urinals and Toilets with
Water-Conserving Fixtures in Willow Creek Rest Area Buildings
Saving/Cost Items Northbound Southbound
Urinals (Type 1)
Urinals (Type 2)
Urinals (Type 1)
Urinals (Type 2)
Current fixture rate (GPF) 1 1.6 1 1.6 Number of fixtures 2 4 4 4 Type Wall mount Wall mount Wall mount Wall mount Water-conserving rate (GPF) 0.125 0.125 0.125 0.125 Initial replacement Cost ($) 1,323 2,647 2,647 2,647 Savings per flush (G) 0.875 1.475 0.875 1.475 Percentage savings (%) 87.5 92.2 87.5 92.2 Annual visitors 2009 558,633 558,633 Annual water savings for 24% of visitors use urinals (G) 39,104 131,837 58,656 98,878
Annual energy savings due to reduction in water pump use (%) 0.02 0.07 0.02 0.03
Annual energy savings due to reduction in water pump use ($) 6 21 9 16
D.4.8 Summary of All Promising Green Building Measures This section summarizes all green building measures that can be used in the Willow
Creek rest area buildings to reduce their energy consumption. All promising green building measures were added in the eQuest model in order to analyze the impact of their collective use and potential interactions on the overall energy consumption of the building. Table 170 and Table 171 summarize all LCC components, savings and payback periods for all promising green building measures that were analyzed in the previous sections for northbound building and southbound building respectively. The eQuest simulation model and energy analysis shows that the northbound building of Willow Creek rest area building can achieve a total of 52.8% reduction in energy costs by implementing the following energy-efficient measures: fluorescent T8 bulbs, CFL, and induction bulbs for interior lighting; induction lighting fixtures for exterior lighting; motion-activated lighting for restrooms; vending occupancy controls; motion sensors for exhaust fans; geothermal heat pump along with desuperheater; energy-efficient hand dryer; solar daylight tubes for restrooms; photovoltaic system with 17.4KW capacity, setting back HVAC at night, and water-conserving fixtures. Similarly, the eQuest simulation model and energy analysis shows that the southbound building of Willow Creek rest area building can achieve a total of 39.8% reduction in energy costs by implementing the following energy-efficient measures: fluorescent T8 bulbs, CFL, and induction bulbs for interior lighting; induction lighting fixtures for exterior lighting; motion-activated lighting for restrooms; vending occupancy controls; motion sensors for exhaust fans; geothermal heat pump along with desuperheater;

D-96
energy-efficient hand dryer; solar daylight tubes for restrooms; photovoltaic system with 17.9KW capacity, setting back HVAC at night, and water-conserving fixtures.
Table 170. All Analyzed Green Building Measures for
Northbound Building of Willow Creek Rest Area
Green Building Measure Initial Cost
Annual Maintenance
Cost, If Applicable
Annual Energy Savings
Annual Eliminated
CO2 Emissions
(Ib)
Reduction in Energy
Consumption
Payback Period
(yr)
Interior lighting $9,984 N.A. $2,518 36,751 8.8% 3.7 Exterior lighting - induction lighting $34,060 N.A. $3,934 51,578 13.7% 6.2
Motion-activated lighting $1,556 N.A. $1,915 27,958 6.7% 0.8
Vending occupancy controls
$451 N.A. $304 4,432 1.1% 1.5
Motion-sensor exhaust fans $2,606 N.A. $643 9,383 2.2% 4.0
Geothermal heat pump $70,520 $533 $2,349 34,971 8.2% 13.4
Energy-efficient hand dryers $2,457 N.A. $418 6,104 1.5% 5.6
Photovoltaic system $71,977 $208 $2,663 38,866 9.3% 27.0
Solar water heater $8,135 $81 $274 3,994 1.0% 43.8
Setting back HVAC at night $0 N.A. $524 7,654 1.8% Immediate
payback Desuperheater $1,600 N.A. $175 2,652 0.6% 8.4 Water-conserving fixtures
$3,970 N.A. $27 401 0.1% N.A.
All promising green building measures together (eQuest model)
$207,617 $823 $15,142 221,020 52.8% 11.9

D-97
Table 171. All Analyzed Green Building Measures for Southbound Building of Willow Creek Rest Area
Green Building Measure
Initial Cost
Annual Maintenance
Cost, If Applicable
Annual Energy Savings
Annual Eliminated
CO2 Emissions
(Ib)
Reduction in Energy
Consumption
Payback Period
(yr)
Interior lighting $13,387 N.A. $3,740 54,585 7.6% 3.2 Exterior lighting - induction lighting $27,020 N.A. $3,084 43,241 6.3% 6.2
Motion-activated lighting $3,112 N.A. $2,963 43,241 6.0% 1.1 Vending occupancy controls $451 N.A. $405 5,909 0.8% 1.1
Motion-sensor exhaust fans $2,606 N.A. $1,337 19,508 2.7% 2.0
Geothermal heat pump $111,520 $533 $4,530 67,869 9.2% 12.2
Energy-efficient hand dryers $4,914 N.A. $418 6,104 0.9% 10.4
Photovoltaic system $73,836 $213 $2,738 39,963 5.6% 26.7 Solar water heater $8,135 $81 $223 3,258 0.5% 53.2
Setting back HVAC at night $0 N.A. $403 5,885 0.8%
Immediate
payback Desuperheater $1,850 N.A. $140 2,131 0.3% 11.5 Water-conserving fixtures $5,294 N.A. $25 370 0.1% N.A.
All promising green building measures together (eQuest model)
$252,125 $294 $8,069 117,782 39.75% 11.3
D.5 MACKINAW DELLS REST AREA
The Mackinaw Dells rest area is located at 14 miles west of Bloomington, at mile marker 114 of I-74. It consists of two buildings that serve the north- and southbound lanes of I-74. It has approximately 1.54 million visitors with annual increase of 0.18% in visitation rate based on 2009 statistics. The major sources of energy consumption in the rest area include the interior and exterior lighting, heating and cooling, vending machines, hand dryers, pump station, and water heater. The next sections discuss the energy consumption analysis for the rest area building as well as LCC analysis for implementing different green building measures including interior and exterior energy-saving light bulbs, motion-activated lighting, vending occupancy controls, motion exhaust sensors, geothermal heat pumps, Energy Star–rated air-source heat pump, thermal pane glass, energy-efficient hand dryers, photovoltaic systems, solar water heater, solar daylight tubes, and water-saving plumbing fixtures.
D.5.1 Energy Audit and Analysis The Mackinaw Dells rest area has two utility meters to measure energy consumption in
each building of the rest area. The two utility meters are used to measure the monthly energy consumption of each building however they cannot provide energy consumed by each device or equipment in the rest area. In order to identify major sources of energy consumption in the rest area building and its costs, an energy simulation model was developed using the eQuest energy

D-98
simulation software environment. The eQuest software can be used to simulate the energy performance of a building including its construction materials, weather, space heating and cooling, air ventilation, air infiltration and exhaust, temperature control, interior and exterior lighting, water use, windows and doors, skylights, operation schedule and occupancy, building activities, equipment loads. Furthermore, eQuest can account for different scenarios for replacing any of the current equipment or devices in buildings and calculate energy consumption accordingly. This capability of measuring building energy consumption based on different scenarios of implementing various green building measures and equipment will be used to analyze and identify a list of promising BMPs for Mackinaw Dells rest area.
The Mackinaw Dells rest area model was developed similar to the Coalfield rest area buildings. The model was developed based on the rest area’s location, square footage, architectural shape, zones, building envelope construction, infiltration, building orientation, operation schedule, building activities, building occupancy, ventilation, HVAC system, temperature control, and water heater. All energy consumption data for the Mackinaw Dells rest area including lighting, HVAC system, hand dryers, vending machines, ventilation, infiltration, exhaust, occupancy, water pump and water heater were modeled using a similar procedure to the one described earlier for the Coalfield rest area buildings.
After modeling the rest area building in eQuest, the simulation model was run to simulate building performance with respect to weather conditions throughout the year and calculate monthly and total energy consumption categories of the building. Due to the difficulty of measuring air infiltration rates for entry doors during the site visit, several runs of simulation model were conducted with varying reasonable rates of infiltration and ventilation in order to minimize the differences between simulated and actual energy consumption reported in the building’s energy bills. The parameters of infiltration were eventually set in the model to 55 CFM/ person for restrooms, lobby, and vending area and 500 CFM/person for mechanical and storage rooms. Similarly, infiltration rate was set to 0.68 air change per hour in the model to account for single door entry of the rest area and match with energy bills.
Figure 101 compares the simulated monthly energy consumption of the building based on the developed model in eQuest to the actual energy consumption reported in the utility bills of the Mackinaw Dells rest area buildings in 2009. Based on the results in Figure 101, the average absolute difference between the energy consumption for the developed simulation model and actual bills is 5.5% and the maximum and minimum difference between the energy consumption for the developed simulation model and actual bills were 10.7% in December and 0.8% in April.
Figure 125. Simulated and actual electricity consumption of
Mackinaw Dells rest area buildings in 2009.

D-99
It should be noted that the number of visitors per day was assumed to be constant throughout the year. Therefore, the difference in energy consumption between the eQuest simulation model and energy bills can be caused by the varying number of visitors per day, which affects the building’s heating and cooling energy consumption as well as its water use. In addition, the occasional and varying use of other small devices such as a microwave, laptop, small fan or heater unit that were observed during the site visits in the maintenance room can contribute to this difference between the simulation results and the energy bills.
The square footage of Mackinaw Dells rest area is 3736 SF per building and its annual number of visitors is 767,960 visitors for each building of the rest area. The breakdown of electricity cost for the Mackinaw Dells rest area buildings among its main sources of consumption is shown in Figure 102. The eQuest energy for model shows that the highest source of energy consumption is space heating that represents 31% of the total energy consumption of the building. On the other hand, the two sources that consume the lowest energy in the building are hand dryers and water pump that represent 2% each of the building’s total energy consumption. Space heating and cooling comprises 40% of total energy consumption of the building. This breakdown of energy costs will helps in prioritizing energy-improvement efforts. The “other” category includes small equipment and devices such as coffee machines, microwave, computer and surveillance cameras, personnel laptop, etc., that are used in the rest area building.
Figure 126. Energy cost breakdown of Mackinaw Dells rest area buildings.
D.5.2 Lighting Lighting in the Mackinaw Dells rest area represents approximately 28% of total energy
consumption with an annual cost of $7,612. The next two subsections analyze replacing current interior and exterior lighting with more-efficient and energy-saving bulbs. The economic analysis of light replacement in these two sections assumes an annual interest rate of 2% and escalation in utility rate of 5%.
D.5.2.1 Interior Lighting
Interior lighting in the Mackinaw Dells rest area consists of linear fluorescent T12 and T8 bulbs and incandescent (assumed) light bulbs. These bulbs can be replaced by more-efficient linear fluorescent T8 and CFL to provide similar luminance levels, less energy consumption and longer life expectancy. Table 172 through Table 174 summarize the impact of replacing current

D-100
fluorescent (T12 and T8, and incandescent bulbs with fluorescent T8 and CFL for the Mackinaw Dells rest area. These lighting replacements can provide annual saving of $1224 and reduce energy consumption by 4.5%. The conducted LCC analysis for replacing all current T12 lighting with T8 bulbs is shown in Figure 127. The average payback period for all light replacement is 1.3 years, which represents a green building measure with promising return on investment.
Table 172. Replacing U-Shape Fluorescent T8 Bulbs with More Energy-Efficient T8 Light Bulbs in Lobby and Restrooms of Mackinaw Dells Rest Area Buildings
Lighting Characteristics, Costs, and Savings Current Fixtures/Bulbs Replacement Fixtures/Bulbs
Type of bulb
Fluorescent T8 Fluorescent T8
GE - F32T8/SP35/ECO Sylvania -
FO28/841/XP/SS/ECO
Number of bulbs 56 56 Light output (lumen) 2660 2562 Kelvin temperature (K) 3500 4100 Color Rendering Index (CRI) 78 85 Life time (hr) 24000 36000 Consumption per bulb (watt) 32 28 Lamp cost ($/each) 2.57 8.99 Change in lumens output levels (%) N.A. -3.7 Reduction in energy consumption (%) N.A. 12.5 Annual savings in energy consumption - first year ($) N.A. 220 Payback period (yr) N.A. 1.4
Table 173. Replacing Fluorescent T12 Bulbs with Energy-Efficient T8 Light Bulbs in Lobby of Mackinaw Dells Rest Area Buildings
Lighting Characteristics, Costs, and Savings Current Fixtures/Bulbs
Replacement Fixtures/Bulbs
Type of bulb
Incandescent (assumed)* CFL
Philips 374744 Sylvania (CF30EL/TWIST/2700K)
Number of bulbs 14 14 Light output (lumen) 1600 2000 Kelvin temperature (K) 4200 2700 Color Rendering Index (CRI) 62 82 Life time (hr) 750 10000 Consumption per bulb (watt) 100 30 Lamp cost ($/each) 0.99 10.89 Change in lumens output levels (%) N.A. +25 Reduction in energy consumption (%) N.A. 70 Annual savings in energy consumption - first year ($) N.A. 961 Payback period (yr) N.A. 1.16
* Light bulb characteristics were assumed as these characteristics were not available during the site visit.

D-101
Table 174. Replacing Fluorescent T12 Bulbs with Energy-Efficient T8 Lighting Bulbs in Maintenance and Storage Rooms of Mackinaw Dells Rest Area Buildings
Lighting Characteristics, Costs, and Savings Current Fixtures/Bulbs
Replacement Fixtures/Bulbs
Type of bulb
Fluorescent T12 Fluorescent (T8)
Sylvania (F34 CW/SS/ECO)
Sylvania 22234 (FO32/25W/841/
XP/SS/ECO) Number of bulbs 28 28 Mean lumens (lumen) 2279 2327 Kelvin temperature (K) 4200 4100 Color Rendering Index (CRI) 62 85 Life time (hr) 20000 36000 Consumption per bulb (watt) 34 25 Lamp cost ($/each) 1.73 7.39 Change in lumens output levels (%) N.A. +2.1 Reduction in energy consumption (%) N.A. 26.4 Annual savings in energy consumption - first year ($) N.A. 42 Payback period (yr) N.A. 1.93 and 7.16*
* Payback period for maintenance and storage rooms, respectively.
Figure 127. Energy cost, savings, and CO2 emissions for current and replacement lighting in
Mackinaw Dells rest area buildings. D.5.2.2 Exterior Lighting
A LCC analysis was conducted to analyze the impact of replacing current exterior lighting of Mackinaw Dells rest area with LED and induction lighting. The average lighting operating hours was determined based on the previous rest area building that were analyzed using eQuest. The average lighting hours of exterior lighting was estimated as 8.94 hours. The current exterior lighting of Mackinaw Dells rest area consists of (1) seven recessed lighting fixtures with assumed 100 watt HPS bulbs in each; (2) four floodlight fixtures and a wall light fixture with assumed 250 watt HPS bulbs in each; (3) one wall light fixture with assumed 250 watt HPS bulb; (4) twelve light poles with a total of thirteen 250 watt HPS bulbs; and (5) one light tower with a total of eight 400 watt HPS bulbs. Due to the unavailability of the exact brand and luminance characteristics of current exterior lighting, reasonable assumptions were made for their luminance level giving the fact that the luminance characteristics are not significantly
-50000
0
50000
100000
150000
200000
250000
300000
350000
0 2 4 6 8 10 12 14 16 18 20 22 24 26 28 30
Current Bulbs
Replacement Bulbs
Cumulative annual Savings
Cost ($)
n (Years)
0
200000
400000
600000
800000
1000000
1200000
1400000
0 2 4 6 8 10 12 14 16 18 20 22 24 26 28 30
Current BulbsReplacement Bulbs
CO2 emissions (IBS)
n (Years)

D-102
affected by the manufacturers. It should be noted that LCC was conducted for one-for-one replacement to reduce initial costs. This one-for-one replacement is expected to reduce the current total lighting output (lumen) of light poles, wall fixture and flood light fixtures by 47% and 54% for LED and induction lighting replacements respectively. Similarly, this one-for-one replacement will reduce the current total lighting output (lumen) of light towers by 60% and 64% for LED and induction lighting replacements. It should be noted that despite the lower average luminance of LED and induction lighting compared to HPS lighting, LED and induction lighting provide higher Color Rendering Index (CRI) than HPS lighting. CRI measures the effect of a light source on the perceived color of object and surface. Having high value of CRI makes virtually all colors look natural and reduces glare (Light Sout Services 2010).
A LCC analysis was conducted to examine the feasibility of a one-for-one replacement of the current exterior lighting of rest area building, its parking lot, as well as entrance and exit with LED and induction lighting replacements. The conducted analysis considered the possible lighting fixtures and bulbs shown in Table 175 as recommended by manufactures.
The components and results of the conducted analysis of one-for-one replacements are summarized in Table 176 through Table 178 for all lighting fixtures/bulbs of the rest area. The cumulative cost and savings as well carbon footprint and reductions in CO2 emissions for replacing exterior lighting of Mackinaw Dells rest area are shown in Figure 128. The analysis shows that these light replacements can provide annual savings of $1,699 or 6.2% of total energy consumption for LED lighting replacements and $1,679, or 6.2% of total energy consumption for induction lighting replacements. This leads to a payback period of 21.7 years for LED light replacements and 6 years for induction lighting replacements.
Table 175. Characteristics of Current and Replacement
Lighting for Exterior Lighting of Mackinaw Dells Rest Area
Type Characteristics Type Characteristics Type CharacteristicsMean Lumens (lumen) Incandescent 1480 LED Lamp 1500 Induction Lamp 1400
Color temperature (Kelvin) 100w N.A. 3000-5000 2700-6500Color rendering index (CRI) N.A. 80 80
Life time (hours) 750 50000 100000Consumption (w) 100 20 20
Lamp cost ($) 1.0 117 204Lamp and fixture cost ($) - - -
Initial Lumens (lumen) HPS 250w 28500 LED Steet Light 15000 Induction Steet 13200Color temperature (Kelvin) 2000 2700-8000 Light 5000Color rendering index (CRI) 25 75 83
Life time (hours) 30000 50000 75000Consumption (w) 250 168 165
Lamp cost ($) 54 - -Lamp and fixture cost ($) - 1274 486
Initial Lumens (lumen) HPS 400w 50000 LED Steet Light 20000 Induction Steet 18000Color temperature (Kelvin) 2100 2700-8000 Light 5000Color rendering index (CRI) 20 75 83
Life time (hours) 24000 50000 75000Consumption (w) 400 224 225
Lamp cost ($) 54 - -Lamp and fixture cost ($) - 1493 538
Light Characteristic items Replacement (LED lighting) Replacement (Induction light)Current lighting

D-103
Table 176. Replacing HPS 400W Bulbs with Energy-Efficient LED and Induction Light Bulbs in Mackinaw Dells Rest Area
Lighting Characteristics, Costs, and Savings
Current Fixtures/Bulbs
Replacement 1
Replacement 2
Type of bulb HPS LED Induction Number of bulbs 8 8 8 Initial lumens 50000 20000 18000 Kelvin temperature 2100 2700-8000 5000 Color Rendering Index (CRI) 20 75 83 Life time (hr) 24000 50000 75000 Consumption per bulb, including ballast (watt) 481 224 230 Bulb cost ($) 54 1,493 538 Reduction in lumens output levels (%) N.A. 60 64 Reduction in energy consumption (%) N.A. 53 52 Annual savings in energy - first year ($/year) N.A. 751.4 733.9 Payback period N.A. 17.1 5.1
Table 177. Replacing HPS 100W Bulbs with Energy-Efficient LED
and Induction Light Bulbs in Mackinaw Dells Rest Area Lighting Characteristics, Costs, and
Savings Current
Fixtures/Bulbs Replacement
1 Replacement
2
Type of bulb Incandescent (assumed) LED Induction
Number of bulbs 11 11 11 Mean lumens 1480 1500 1400 Kelvin temperature N.A. 3000-5000 2700-6500 Color Rendering Index (CRI) N.A. 80 80 Life time (hr) 10000 50000 100000 Consumption per bulb, including ballast (watt) 125 20 21 Bulb cost 40 117 204 Change in lumens output levels (%) N.A. +1.4 -5.4 Reduction in energy consumption (%) N.A. 84 83 Annual savings in energy - first year ($/year) N.A. 422 418 Payback period (yr) N.A. 0.2 0.2
Table 178. Replacing HPS 250W Bulbs with Energy-Efficient LED and Induction Light Bulbs in Mackinaw Dells Rest Area
Lighting Characteristics, Costs, and Savings
Current Fixtures/Bulbs
Replacement 1
Replacement 2
Type of bulb HPS LED Induction Number of bulbs 13 13 13 Initial lumens 28500 15000 13200 Kelvin temperature 2000 4900 5000 Color Rendering Index (CRI) 25 75 83 Life time (hr) 30000 50000 75000 Consumption per bulb, including ballast (watt) 315 168 168 Bulb cost ($) 54 1274 486 Reduction in lumens output levels (%) N.A. 47 54 Reduction in energy consumption (%) N.A. 47 47 Annual savings in energy - first year ($/year) N.A. 698 698 Payback period (yr) N.A. > 30 9

D-104
Figure 128. Cumulative cost and savings and CO2 emission of LED and Induction exterior
lighting replacements for Mackinaw Dells rest area.
D.5.3 Motion Sensors Rest areas have different operational schedule than business and commercial buildings
and they have to operate 24 hours a day with few or no occupants during low visitation periods at night. This makes motion sensors a promising technology for rest area buildings. This section analyzes the implementation of motion sensors to control the lighting of restrooms and vending machine areas. Motion sensors also can be used to reduce space heating and cooling by reducing the use of exhaust fans at night when there are few or no occupants in the restrooms.
In order to estimate the energy savings in lighting and exhaust fans, the research team developed a separate simulation model using EZstrobe simulation language (Martinez 2006) to analyze and simulate the use of restrooms and vending machines based on the number and frequency of rest area visitors. The simulation model was developed to mimic the utilization of the rest area facilities by its visitors. The model was created to generate the number of visitors to the rest area using a beta distribution function to represent a high frequency of visitors during the morning, noon, and afternoon hours and low frequency during the night and early morning hours. The model also assumes that the percentages of visitors that will use the men’s restroom, women’s restroom and vending machines are 40%, 40%, and 20%, respectively. Similarly, the probabilities that restroom visitors will use urinals, toilets and only faucets were assumed to be 30%, 60%, and 10%, respectively with reasonable random durations for each of these restroom tasks as, shown in Figure 129. It should be noted that the model assumes that each visitor using the toilet or urinal will also use the faucet afterwards. The developed model accounts for an amount of time for sensors to keep the light on after a visitor leaves a restroom. After a visitor leaves the restroom, the model assumes that there is a probability of 60% that the visitor will leave the rest area and 40% will use vending machines. The developed model can estimate how long the lighting in restrooms of the rest area will be turned off if motion-activated lighting were implemented in the restrooms. Similarly, the amount of time that lighting in vending machines and exhaust fans being turned/switched off can be calculated by the developed simulation model. Figure 130 shows rest area visitors while being in the men’s restroom throughout a simulation day. Table 179 summarizes the percentages of occupancy for restrooms and vending machines of the Mackinaw Dells rest area assuming that the lights or fans remain turned on for 5 minutes after the departure of the last visitor. The following subsections use the developed simulation model to estimate potential savings for using motion sensors in the rest area building and their expected payback periods. The economic analysis of motion sensors accounts for an annual interest rate of 2% and escalation in utility rate of 5% in calculating payback period of implementing this technology.

D-105
Figure 129. Motion-sensor simulation model for Mackinaw Dells Road rest area building.
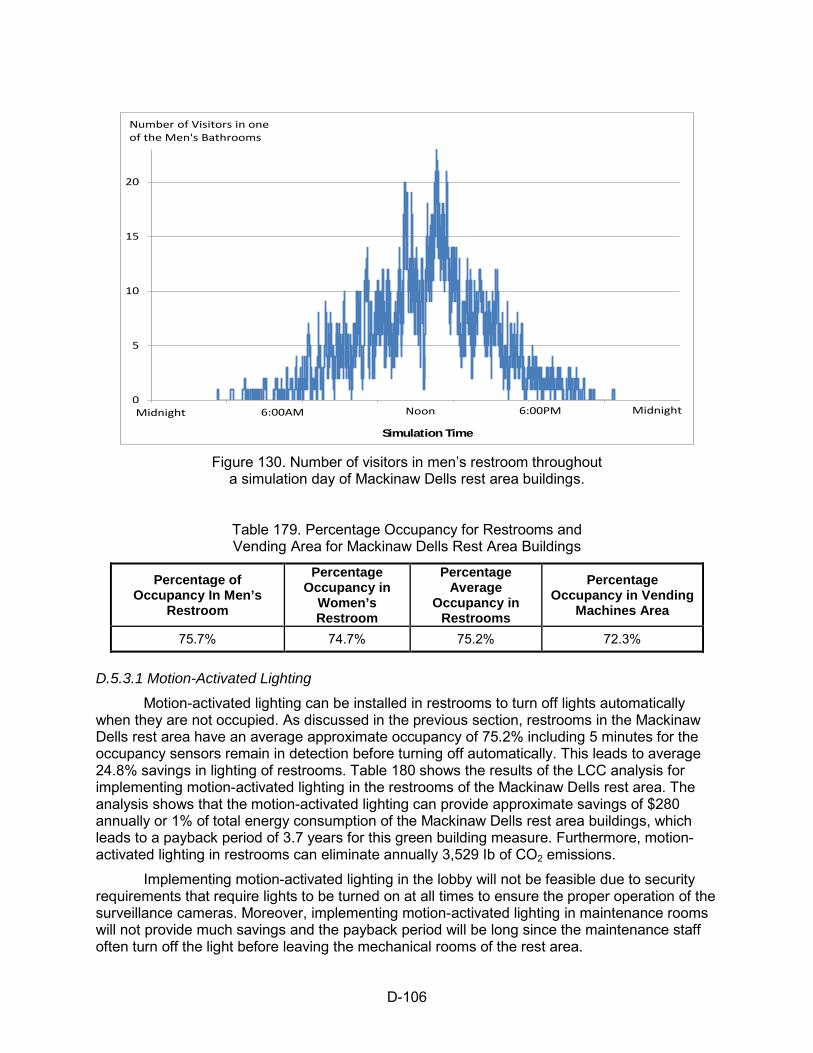
D-106
Figure 130. Number of visitors in men’s restroom throughout
a simulation day of Mackinaw Dells rest area buildings.
Table 179. Percentage Occupancy for Restrooms and Vending Area for Mackinaw Dells Rest Area Buildings
Percentage of Occupancy In Men’s
Restroom
Percentage Occupancy in
Women’s Restroom
Percentage Average
Occupancy in Restrooms
Percentage Occupancy in Vending
Machines Area
75.7% 74.7% 75.2% 72.3%
D.5.3.1 Motion-Activated Lighting
Motion-activated lighting can be installed in restrooms to turn off lights automatically when they are not occupied. As discussed in the previous section, restrooms in the Mackinaw Dells rest area have an average approximate occupancy of 75.2% including 5 minutes for the occupancy sensors remain in detection before turning off automatically. This leads to average 24.8% savings in lighting of restrooms. Table 180 shows the results of the LCC analysis for implementing motion-activated lighting in the restrooms of the Mackinaw Dells rest area. The analysis shows that the motion-activated lighting can provide approximate savings of $280 annually or 1% of total energy consumption of the Mackinaw Dells rest area buildings, which leads to a payback period of 3.7 years for this green building measure. Furthermore, motion-activated lighting in restrooms can eliminate annually 3,529 Ib of CO2 emissions.
Implementing motion-activated lighting in the lobby will not be feasible due to security requirements that require lights to be turned on at all times to ensure the proper operation of the surveillance cameras. Moreover, implementing motion-activated lighting in maintenance rooms will not provide much savings and the payback period will be long since the maintenance staff often turn off the light before leaving the mechanical rooms of the rest area.
0
5
10
15
20
0 200 400 600 800 1000 1200 1400
Simulation Time
Number of Visitors in one of the Men's Bathrooms
Midnight 6:00AM 6:00PMNoon Midnight

D-107
Table 180. Motion-Activated Lighting Analysis for Restrooms of Mackinaw Dells Rest Area Buildings
Savings and Cost Items Amount/Savings
Total load of lighting fixtures (watt) 1152 Electricity cost ($/kwh) 0.112 Occupancy sensors cost ($) 328 Labor installation cost ($) 729 Total Initial cost ($) 1,057 Lighting operation time (hr) 24 Annual lighting energy cost for restrooms ($) 1,130 Annual lighting energy savings ($) 280 Payback period (yr) 3.69 Amount of eliminated CO2 (Ib) 3,529 Savings in total energy consumption of building (%) 1.0
D.5.3.2 Vending Occupancy Controls
Similar to motion-activated lighting, occupancy controls can be installed for vending machines to turn off their lighting when the vending area is not occupied. Based on the developed simulation model for motion sensors, lights of vending machine are expected to be on for approximately 72.3% of hours during the day assuming a duration of 5 minutes for the sensors to remain on after detecting the last motion in the vending area. This leads to 27.3% lighting savings of the vending machine area. Table 181 shows the economic analysis of installing occupancy for vending machine area of Mackinaw Dells rest area. The analysis shows that occupancy controls for vending machines can provide approximate savings of $280 annually or 0.9% of total energy consumption of the Mackinaw Dells rest area buildings, which leads to a payback period of 1.3 years. This measure can also eliminate 3,202 Ib of CO2 emissions annually due to the achieved reduction in energy consumption.
Table 181. Occupancy Controls Analysis for
Vending Machine in Mackinaw Dells Rest Area Buildings
Savings and Cost Items Amount/Savings Total load of vending machines lighting (watt) 600 Electricity cost ($/kwh) 0.112 Occupancy sensors cost ($) 120 Labor installation cost ($) 219 Total Initial cost ($) 339 Lighting operation time (hr) 24 Annual lighting energy cost for restrooms ($) 589 Annual lighting energy savings ($) 254 Payback period (yr) 1.34 Amount of eliminated CO2 (Ib) 3,202 Savings in total energy consumption of the rest area building (%) 0.9

D-108
D.5.4 More-Efficient HVAC Systems The current HVAC system at the Mackinaw Dells rest area consists of a split system with
two condensers and electric resistance duct heaters. The current HVAC system can be replaced with a more energy-efficient system that reduces heating and cooling energy consumption. The next two subsections analyze the replacement of the current HVAC system with a geothermal heat pump and Energy Star–rated air-source heat pump.
D.5.4.1 Geothermal Heat Pump
The existing HVAC system in the Mackinaw Dells rest area buildings operates continuously year round, and its consumption represents 40% of the total building consumption. A ground-source heat pump can be more efficient than an HW boiler and chiller HVAC system as it uses the nearly constant temperature of earth (55°F) to heat and cool buildings. The eQuest simulation environment can be used to model the use of a geothermal HVAC system for the Mackinaw Dells rest area buildings. The system was modeled to have heating coefficient of performance (COP) of 4.0 and a cooling efficiency of 18 EER. This system was also modeled to operate in economizer mode, which brings fresh air when the outside air temperature is sufficient to condition the space. After running eQuest model with geothermal heat pump, the model provides savings of 22.9% of total energy consumption. The installation and maintenance costs of geothermal heat pump were calculated similar to Coalfield rest area buildings. Table 127 summarizes the LCC components of replacing the current HVAC system with a geothermal heat pump.
Table 182. LCC Components for Replacing Current HVAC System with
Geothermal Heat Pump at Mackinaw Dells Rest Area Buildings
Rest Area/LCC Components Cost/Life
Capital cost - vertical system* ($) 41,820 Annual maintenance cost ($) 486 Annual operating cost ($) 4,608 Periodic cost ($) 25,820 Life (yr) 20
* Installation cost may vary due to soil conditions and resizing of the HVAC equipment
In order to compare the cost effectiveness and payback periods of replacing the current HVAC system at the rest area with a geothermal system, the initial, maintenance, operating and replacement costs of the current HVAC systems need to be identified. These costs were estimated similar to the Coalfield rest area buildings in order to carry out the LCC analysis. Table 128 summarizes the LCC components for the current HVAC system in the Mackinaw Dells rest area buildings.

D-109
Table 183. LCC Components for Current HVAC System in Mackinaw Dells Rest Area Buildings
Rest Area/LCC Components Cost/Life
Capital cost ($) 18,400 Annual maintenance cost ($) 1,046 Annual operating cost ($) 10,917 Periodic cost ($) 18,400 Life (yr) 17 Manufacture year 2004 Replacement year 2021
A LCC analysis was conducted to compare the potential replacement of the current HVAC system with a geothermal heat pump based on an annual interest rate of 2%, escalation in utility rate of 5%, and annual increase of maintenance cost of 2%. Table 129 summarizes the LCC analysis results for replacing current HVAC with geothermal heat pump. The analysis shows that replacing current HVAC system with vertical loop geothermal heat pump has a payback period of 5.7 years. The cumulative costs for the horizontal loop geothermal system, vertical loop geothermal system, current HVAC system, and savings are shown in Figure 107. The geothermal heat pump can also be installed along with a desuperheater to heat water in the cooling season. The desuperheater uses heat that is removed from the building space to heat domestic hot water. This unit can provide free hot water in the summer or when the system is in cooling mode. It can provide annual savings of $795 or 2.9% of the total energy consumption. The payback period of the desuperheater is 2 years.
Table 184. LCC Analysis Results for Replacing Current HVAC System with Geothermal Heat Pump at Mackinaw Dells Rest Area Buildings
Rest Area Savings
Annual kwh saved 56,335
Annual energy savings - first year ($/yr) 6,310
Annual eliminated CO2 emissions (Ib) 79,432
Payback period - vertical system (yr) 5.7

D-110
Figure 131. Cumulative costs of current HVAC system, vertical loop geothermal system,
and savings for Mackinaw Dells rest area buildings.
D.5.4.2 High-Efficiency Air-Source Heat Pump
Another alternative for the current HVAC system at the Mackinaw Dells rest area is to replace it with a more-efficient Energy Star–rated air-source heat pump to reduce heating and cooling expenses. An air-source heat pump was modeled in eQuest to meet Energy Star recommendations with a cooling efficiency of 12 EER and a heating performance rating of 8.2 HSPR (Energy Star 2003). Table 130 summarizes the economic analysis results for replacing the current HVAC system with an Energy Star–rated air-source heat pump. The analysis shows that an Energy Star–rated HVAC system can provide annual savings of $5,608 annually or 20.3% of total energy consumption of the rest area building. This leads to a payback period of 3.2 years based on an annual interest rate of 2% and escalation in utility rate of 5%. This replacement can eliminate CO2 emissions by 70,606 Ib annually.
Table 185. Analysis Results for Replacing Current HVAC System with
Air-Source Heat Pump at Mackinaw Dells Rest Area Buildings
Savings and Cost Items Amount/Savings Electricity cost ($/kwh) 0.112 Total initial cost for air-source heat pump 18,400 Annual energy savings ($) 5,608 Payback period (yr) 3.23 Amount eliminated CO2 (Ib) 70,606 Savings in total energy consumption of building (%) 20.3

D-111
D.5.5 Energy-Efficient Hand Dryers Energy-efficient hand dryers are one of the green building measures that can be
implemented in the Mackinaw Dells rest area buildings to reduce energy consumption of hand dryers was estimated based on a 50% use of rest area visitors each for 30 seconds according to manufacture use recommendations. Although, current hand dryers only consume approximately 3.3% of total energy consumption, they are one of the most visible devices for the rest area visitors. Moreover, slow velocity or inefficient hand dryers may discourage people to use them. This analysis considers the impact of installing three different energy-efficient hand dryers with three different models in the Mackinaw Dells rest area buildings to reduce their energy use, as shown in Table 186. The analysis shows that replacing current hand dryers may result in annual savings of $607 to $667 or 2.5% to 13.4% of total energy consumption in the rest area building based on three different models of energy-efficient hand dryers. These savings can provide a payback period of 2.5 to 13.4 years for the three different models based on an annual interest rate of 2% and escalation in utility rate of 5%. This measure can eliminate up to 8,392 Ib of CO2 emissions in Mackinaw Dells rest area buildings.
Table 186. LCC Analysis Results for Replacing Current Hand Dryers with
Energy-Efficient Units for Mackinaw Dells Rest Area Buildings
LCC Items/Savings
Current Hand
Dryer - World Dryer
1- World Dryer Airforce
- J Series Hand Dryers
2- Xlerator Series Hand
Dryers
3- Dyson Airblade
Series Hand Dryers
Number of hand dryers 6 Hand dryer consumption (watt) 2,300 1,100 1100 1500 drying time (second) 30 12 15 12 Initial cost ($) N.A. 1,638 2,400 9,600 Annual visitors - 2009 767,960 Savings over the current hand dryers (%) N.A. 81 76 74 Utility cost ($/kwh) 0.112 Annual operating cost based on 50% use of visitors ($) 824 158 197 215
Annual savings ($) N.A. 667 627 609 Annual savings of total energy consumption (%) N.A. 2.4 2.3 2.2
Eliminated CO2 emissions (Ib) N.A. 8,392 7,896 7,670 Payback period (yr) N.A. 2.5 3.7 13.4 * (Restroom Direct 2012)
D.5.6 Solar Measures Several solar measures can be used to reduce energy consumption in rest area
buildings. These measures can include solar daylight tubes, photovoltaic systems, and solar water heaters. These measures can reduce energy consumption of interior lighting, heating water as well as generate renewable and clean electricity. Solar daylight tubes were not analyzed for the Mackinaw Dells rest area buildings as they have metal roof that obstruct the penetration of solar tubes. The next subsections discuss the installation of photovoltaic systems and solar water heaters in Mackinaw Dells rest area buildings.

D-112
D.5.6.1 Grid-Connected Photovoltaic Systems
Photovoltaic systems are one of the renewable energy measures that can generate electricity to the Mackinaw Dells rest area buildings. In order to perform LCC for installing photovoltaic systems in the rest area, this system needs to be designed to estimate the number and type of system parts. Several factors affect the design of grid-connected systems including average daily peak sun hours, capacity of solar panels, capacity of inverters, and mounting of solar panels. The design of photovoltaic system for the Mackinaw Dells rest area was conducted using a similar procedure to the one described earlier in the Coalfield rest area.
This measure was analyzed to generate 5% of Mackinaw Dells total energy consumption. Table 187 summarizes the cost components for installing grid-connected photovoltaic system in the Mackinaw Dells rest area buildings. The LCC analysis was conducted to determine annual savings, payback period, amount of eliminated CO2 emissions, and required area of the system. The analysis accounted for an annual interest rate of 2%, escalation in utility rate of 5%, and an annual increase of maintenance cost by 2%, as shown in Table 188. The analysis shows that incorporating a grid-connected photovoltaic system at the Mackinaw Dells rest area has a payback period of 24.1 years. The system requires 34 solar panels to be installed, approximately 5 of which can be placed on the roof of the rest area building and 29 on the ground south of the rest area building, which need 270SF. These calculations accounted for 51ᵒ tilt angle for the solar panels and preventing shading that might occur due to layout of solar panels in winter and summer. Figure 132 shows the cumulative savings of installing grid-connected system in the rest area building.
Table 187. Cost Components for Installing Grid-Connected Photovoltaic System in Mackinaw Dells Rest Area Buildings
Cost Components Amount/Savings Total number of solar panels 34 Number of inverters 1 System capacity (KW) 8.0 Utility cost ($/kwh) 0.112 Initial cost ($) 34,959 Annual maintenance cost ($) 107 Solar Panels periodic cost ($) 11,800 Inverter periodic cost ($) 4,110 Annual Savings ($) 1,381 Annual Savings (kwh) 12328 Cost per watt ($/w) 4.50
Table 188. LCC Analysis Results for Incorporating Grid-Connected Photovoltaic System in the Mackinaw Dells Rest Area Buildings
LCC Items/Savings Amount/Savings Annual eliminated CO2 emissions (Ib) 17,382 Number of solar panels on roof 5
Number of solar panels on the ground 29
Required area for solar panels (SF) 270
Tilt angle of solar panels 51 Payback period (yr) 24.1

D-113
Figure 132. Cumulative cost of incorporating grid-connected
system in the Mackinaw Dells rest area buildings.
It should be noted that the stand-alone photovoltaic system was not considered in this analysis because of its infeasible payback period that was identified in the first phase of this project due to its high initial and periodic costs of battery systems.
D.5.6.2 Solar Water-Heating Systems
Solar water heater is another technology that can reduce energy consumption for heating water in the rest area buildings. This technology can be installed with the current water heaters in the rest area in order to mitigate the cost of replacing current water heater. Moreover, current water heater can work as a backup when the sun rays are unavailable or insufficient to heat water to the desired temperature. The components of installing this system include solar collector(s), collector’s mounting, heat exchanger, circulator, antifreeze (glycol), water storage tank(s), controller, fittings, pipes, and insulation. The initial capital cost of the system can be calculated for the three rest areas using the RSMeans Building Construction Cost Data (2012). Maintenance cost and life were calculated similar to Coalfield rest area buildings. The annual electricity use for water heater was estimated based on the created energy simulation model.
Table 189 summarizes the LCC components for incorporating solar water heaters in Mackinaw Dells rest area buildings. A LCC analysis was conducted based on an annual interest rate of 2%, escalation in utility rate by 5%, and an annual increase of maintenance cost by 2%, as shown in Table 190. The analysis shows that installing solar water heaters in Mackinaw Dells rest area buildings has a payback period by 3.96 to 13.7 years based on 70% and 20% energy savings heating water, and it can eliminate CO2 emissions by 7,076 to 24,765 Ib annually.
It should be noted that solar collector(s) can be installed on the roof by clamps/straps or on the ground where a rack is used to hold the collector(s). Installing solar collectors on the roof might not be feasible as the building roof of the rest area was not designed to carry such extra load. Subsequently, solar collectors should be mounted on the ground.
-60,000
-40,000
-20,000
0
20,000
40,000
60,000
80,000
100,000
120,000
0 2 4 6 8 10 12 14 16 18 20 22 24 26 28 30 32 34 36 38 40
Years
Cumulative cost

D-114
Table 189. LCC Components for Installing Solar Water Heater in Mackinaw Dells Rest Area Buildings
LCC Components Amount/Savings
Capital cost (Ground mount) ($) 7,735
Annual maintenance cost (Ground mount) 77
Utility Cost ($/kwh) 0.112
Conventional water heater consumption (kwh) 25,270
Annual operating cost for conventional water heater ($) 2,830
Annual savings (20% to 70% savings) ($) 566 to 1,981
Periodic cost for pump @ 5 years ($) 250
Periodic cost for water tank @ 16 years ($) 1,600
Circulating pump life (yr) 5
Tank life (yr) 16
Table 190. LCC Analysis Results for Installing Solar Water Heater in Mackinaw Dells Rest Area Buildings
Savings Amount/Savings
Annual kwh saved (20% savings) 5,054
Annual kwh saved (70% savings) 17,689
Annual eliminated CO2 emissions - 20% savings (Ib) 7,076 Annual eliminated CO2 emissions - 70% savings (Ib) 24,765 Payback period - 20% savings (yr) 13.70 Payback period - 70% savings (yr) 3.96
D.5.7 Water-Saving Plumbing Fixtures Rest areas have a high rate of water consumption due to the large number of visitors
that use their restrooms. Using water-conserving fixtures in these rest areas will provide significant savings in water consumption. A number of feasible water-saving technologies can be used to minimize water consumption in the rest areas including efficient faucets, aerators, toilets, and urinals. Currently, the Mackinaw Dells rest area buildings have low-flow faucets,, which makes them suitable for conserving water use in the facility. Furthermore, the current toilets in Mackinaw Dells rest area building provide efficient use of water for flushing toilets as they have a flushing rate 1.6 GPF. The flushing rate for the current urinals in the rest area was not identified during the site visit, therefore, the flushing rate of urinals was assumed to be 1.0 GPF based on previously studied rest area buildings. An analysis was conducted to estimate the feasibility of installing conserving urinals in the rest area buildings. Table 191 summarizes the analysis of replacing current urinals with water-conserving ones. As it was difficult to calculate precisely the number of visitors using urinals or toilets, the analysis assumed that 24% of visitors use urinals. The replacement of current plumbing fixtures can provide savings of 87.5% to 92.5% of water consumption by urinals. This could result in a total water savings of

D-115
163,668 gallons annually. The payback period for these fixtures could not be calculated as water unit cost could not be identified as the rest area uses ground water to supply its needs.
Table 191. LCC Analysis for Replacing Current Urinals with Water
Conserving Fixtures in Mackinaw Dells Rest Area Buildings
Saving/Cost Items Urinals Current fixture rate (GPF) 1 Number of fixtures 2 Type Wall mount Conserving fixtures rate (GPF) 0.112 Initial replacement Cost ($) 1,323* Savings per flush (G) 0.888 Percentage savings (%) 88.8 Annual visitors 2009 767,960 Annual savings in water consumption for 24% of visitors use urinals (G) 163,668
* (RSMeans 2012; Lowe's 2012)
D.5.8 Summary of All Promising Green Building Measures This section summarizes all green building measures that can be used in the Mackinaw
Dells rest area buildings to reduce their energy consumption. All promising green building measures were added in the eQuest model in order to analyze the impact of their collective use and potential interactions on the overall energy consumption of the building. Table 192 summarizes all LCC components, savings and payback periods for all promising green building measures that were analyzed in the previous sections. The eQuest simulation model and energy analysis shows that the Mackinaw Dells rest area buildings can achieve a total of 49.1% reduction in energy costs by implementing the following energy-efficient measures: energy-efficient measures: fluorescent T8 bulbs, induction lighting fixtures for exterior lighting, motion-activated lighting for restrooms, vending occupancy controls, geothermal heat pump along with desuperheater, energy-efficient hand dryer, and a photovoltaic system with 7.8KW capacity.
.

D-116
Table 192. All Promising Green Building Measures for Mackinaw Dells Rest Area Buildings
Green Building Measure
Estimated Initial Cost
Maintenance Cost, if
Applicable
Annual Energy Savings
Annual Eliminated
CO2 Emissions
(lb)
Reduction in Energy
Consumption
Payback Period
(yr)
Interior lighting $1,872 N.A. $1,215 15,297 4.5% 1.3 Exterior lighting - induction lighting
$16,922 N.A. $1,850 23,295 6.8% 5.6
Motion-activated lighting
$1,057 N.A. $280 3,529 1.0% 3.7
Vending occupancy controls
$339 N.A. $254 3,202 0.9% 1.3
Geothermal heat pump $41,820 $486 $6,310 79,432 23.1% 5.7
Energy-efficient hand dryers
$1,638 N.A. $667 8,392 2.4% 2.5
Photovoltaic system $34,959 $107 $1,381 17,382 5.1% 24.1
Desuperheater $1,600 N.A. $825 10,392 3.0% 1.9 Code Blue emergency phone
$300 N.A. $256 3,224 0.9% 1.2
Water-conserving fixtures
$1,323 N.A. N.A. N.A. N.A. N.A.
All promising green building measures together (eQuest model)
$101,830 $593 $13,399 172,149 49.1% 7.1

E-1
APPENDIX E DECISION SUPPORT TOOL FOR OPTIMIZING UPGRADE DECISIONS OF ILLINOIS PUBLIC BUILDINGS
E.1 DST UPGRADE
E.1.1 Interior Lighting
Interior lighting is a feature that was added to the DST in order to allow the developed tool to replace current light bulbs and fixtures with more-efficient ones. The replacement of interior lighting with more energy-efficient lighting reduces the overall building energy consumption and help in complying with the LEED-EB requirements for building energy performance. The upgraded DST incorporates a database for interior lighting, which accounts for interior light bulbs and interior lighting fixtures. This database is designed to contain all relevant data on available alternatives for interior light bulbs and fixtures that can be used to replace existing lighting in order to reduce energy consumption while maintaining the required lighting levels in the building. The database for interior light bulbs contains key data sets that are needed to analyze the potential benefits of lighting replacement, including (1) general product characteristics such as brand name, model number, lamp type, fixture socket, initial lumens, mean lumens, Color Rendering Index, color temperature, and life expectancy; (2) cost data such as initial cost and annual maintenance cost; (3) energy characteristics such as bulb electricity consumption; (4) physical characteristics such as bulb dimensions; (5) vendor details such as vendor name, website, location, and data entry date, as shown in Figure 133.
Similarly, the database for interior lighting fixtures contains important data, including (1) general product characteristics such as fixture name, fixture socket, number of bulbs per fixture, ballast efficiency, and life expectancy; (2) energy consumption such as ballast consumption; (3) physical characteristics such as fixture dimensions; (4) cost data such as fixture cost, installation cost, and annual maintenance cost; and (5) vendor details such as vendor name, website, location, and data entry date, as shown in Figure 134. A GUI was designed in the DST to facilitate the input of interior lighting data in the database, as shown in Figure 135 and Figure 136.
It should be noted that, the DST is designed to search for the best lighting products that meet the current light requirement levels of buildings however it does not account for the effect of reducing light consumption on energy consumption for space heating and cooling.
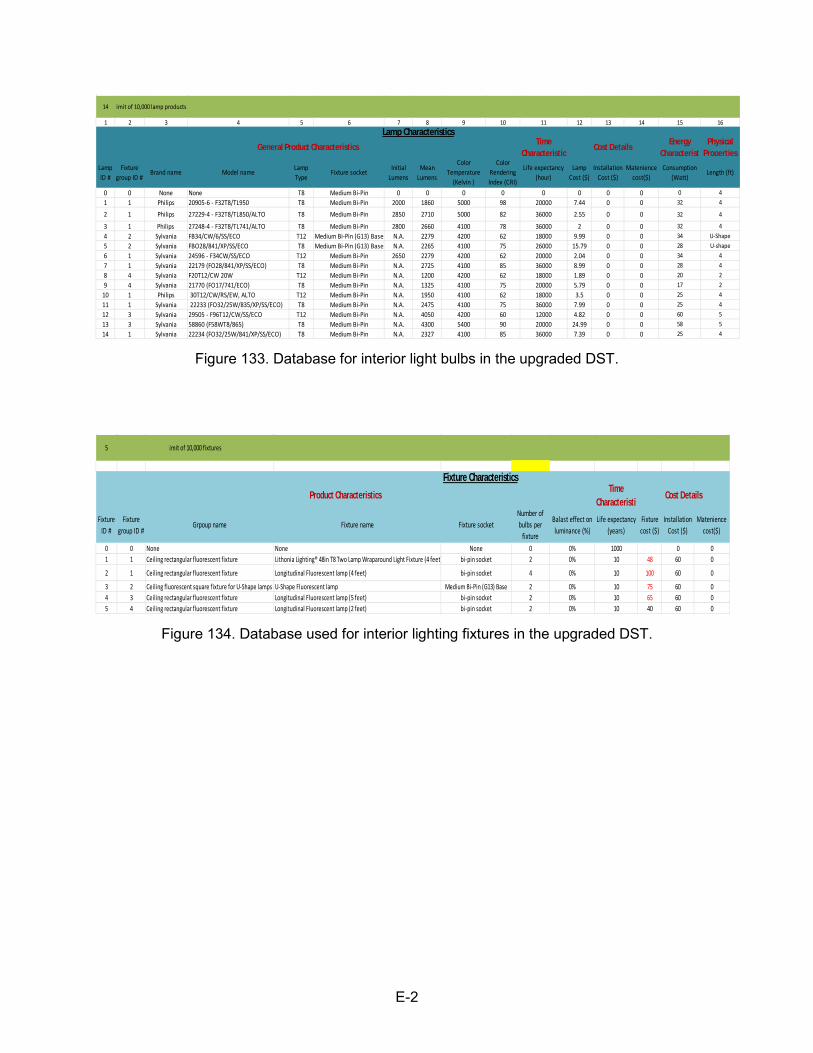
E-2
Figure 133. Database for interior light bulbs in the upgraded DST.
Figure 134. Database used for interior lighting fixtures in the upgraded DST.
14
1 2 3 4 5 6 7 8 9 10 11 12 13 14 15 16
Time Characteristic
Energy Characterist
Physical Properties
Lamp ID #
Fixture group ID #
Brand name Model name Lamp Type
Fixture socket Initial Lumens
Mean Lumens
Color Temperature
(Kelvin )
Color Rendering Index (CRI)
Life expectancy (hour)
Lamp Cost ($)
Installation Cost ($)
Matenience cost($)
Consumption (Watt)
Length (ft)
0 0 None None T8 Medium Bi-Pin 0 0 0 0 0 0 0 0 0 41 1 Philips 20905-6 - F32T8/TL950 T8 Medium Bi-Pin 2000 1860 5000 98 20000 7.44 0 0 32 4
2 1 Philips 27229-4 - F32T8/TL850/ALTO T8 Medium Bi-Pin 2850 2710 5000 82 36000 2.55 0 0 32 4
3 1 Philips 27248-4 - F32T8/TL741/ALTO T8 Medium Bi-Pin 2800 2660 4100 78 36000 2 0 0 32 44 2 Sylvania FB34/CW/6/SS/ECO T12 Medium Bi-Pin (G13) Base N.A. 2279 4200 62 18000 9.99 0 0 34 U-Shape5 2 Sylvania FBO28/841/XP/SS/ECO T8 Medium Bi-Pin (G13) Base N.A. 2265 4100 75 26000 15.79 0 0 28 U-shape6 1 Sylvania 24596 - F34CW/SS/ECO T12 Medium Bi-Pin 2650 2279 4200 62 20000 2.04 0 0 34 47 1 Sylvania 22179 (FO28/841/XP/SS/ECO) T8 Medium Bi-Pin N.A. 2725 4100 85 36000 8.99 0 0 28 48 4 Sylvania F20T12/CW 20W T12 Medium Bi-Pin N.A. 1200 4200 62 18000 1.89 0 0 20 29 4 Sylvania 21770 (FO17/741/ECO) T8 Medium Bi-Pin N.A. 1325 4100 75 20000 5.79 0 0 17 2
10 1 Philips 30T12/CW/RS/EW, ALTO T12 Medium Bi-Pin N.A. 1950 4100 62 18000 3.5 0 0 25 411 1 Sylvania 22233 (FO32/25W/835/XP/SS/ECO) T8 Medium Bi-Pin N.A. 2475 4100 75 36000 7.99 0 0 25 412 3 Sylvania 29505 - F96T12/CW/SS/ECO T12 Medium Bi-Pin N.A. 4050 4200 60 12000 4.82 0 0 60 513 3 Sylvania 58860 (F58WT8/865) T8 Medium Bi-Pin N.A. 4300 5400 90 20000 24.99 0 0 58 514 1 Sylvania 22234 (FO32/25W/841/XP/SS/ECO) T8 Medium Bi-Pin N.A. 2327 4100 85 36000 7.39 0 0 25 4
imit of 10,000 lamp products
Cost Details
Lamp CharacteristicsGeneral Product Characteristics
5
Time Characteristi
Fixture ID #
Fixture group ID #
Grpoup name Fixture name Fixture socketNumber of bulbs per
fixture
Balast effect on luminance (%)
Life expectancy (years)
Fixture cost ($)
Installation Cost ($)
Matenience cost($)
0 0 None None None 0 0% 1000 0 01 1 Ceiling rectangular fluorescent fixture Lithonia Lighting® 48in T8 Two Lamp Wraparound Light Fixture (4 feet) bi-pin socket 2 0% 10 48 60 0
2 1 Ceiling rectangular fluorescent fixture Longitudinal Fluorescent lamp (4 feet) bi-pin socket 4 0% 10 100 60 0
3 2 Ceiling fluorescent square fixture for U-Shape lamps U-Shape Fluorescent lamp Medium Bi-Pin (G13) Base 2 0% 10 75 60 04 3 Ceiling rectangular fluorescent fixture Longitudinal Fluorescent lamp (5 feet) bi-pin socket 2 0% 10 65 60 05 4 Ceiling rectangular fluorescent fixture Longitudinal Fluorescent lamp (2 feet) bi-pin socket 2 0% 10 40 60 0
Product Characteristics
imit of 10,000 fixtures
Fixture CharacteristicsCost Details

E-3
Figure 135. Designed GUI for interior light bulbs in the upgraded DST.
Figure 136. Designed GUI for interior lighting fixtures in the upgraded DST.

E-4
E.1.2 Exterior Lighting
Exterior lighting is a feature that was added to the DST in order to allow the decision maker to optimize the potential replacement of current light bulbs and fixtures with more-efficient ones. The replacement of exterior lighting with more energy-efficient lighting reduces the overall energy consumption and help in complying with the LEED-EB requirements for building energy performance. The upgraded DST incorporates databases that contain exterior light bulbs and exterior lighting fixtures. These databases are designed to contain all relevant data on available alternatives for exterior light bulbs and fixtures that can be used to replace existing ones to reduce energy consumption while maintaining the required lighting levels. The database for exterior light bulbs contains key data that are needed to analyze the potential benefits of lighting replacement, including (1) general product characteristics such as brand name, model number, lamp type, fixture socket, initial lumens, mean lumens, Color Rendering Index, color temperature, and life expectancy; (2) cost data such as initial cost and annual maintenance cost; (3) energy characteristics such as bulb electricity consumption; and (4) vendor details such as vendor name, website, location, and data entry date. Similarly, the database for exterior lighting fixtures contains important data, including (1) general product characteristics such as fixture name, fixture socket, number of bulbs per fixture or lighting pole, ballast efficiency, and life expectancy; (2) energy consumption such as ballast consumption; (3) physical characteristics such as fixture dimensions; (4) cost data such as fixture cost, installation cost, and annual maintenance cost; and (5) vendor details such as vendor name, website, location, and data entry date. A GUI was designed in the DST to facilitate the input of exterior lighting data in the database, as shown in Figure 136 and Figure 137
Figure 137. Designed GUI for exterior light bulbs in the upgraded DST.

E-5
Figure 138. Designed GUI for exterior lighting fixtures in the upgraded DST.
E.1.3 Hand Dryers
Another feature was added to the DST to analyze and optimize the potential replacement of existing hand dryers with more energy-efficient units. The replacement of existing hand dryers with more energy-efficient hand dryers can reduce the overall building energy consumption and help in complying with the LEED-EB requirements for building energy performance. The upgraded DST incorporates a database of hand dryer units that contains key data that are needed in the optimization analysis, including (1) general product characteristics such as brand name, model number, air flow, loudness, life expectancy and drying time; (2) physical characteristics such as product dimensions; (3) cost data such as unit cost, installation cost, and annual maintenance cost; (4) energy characteristics such as electricity consumption; and (4) vendor details such as vendor name, website, location, and data entry date. A GUI was designed in the DST to facilitate the input data of hand dryers in the created database. Figure 139 shows a user-friendly form where input data for hand dryer can be entered and added to the DST database.

E-6
Figure 139. Designed GUI for hand dryers in the upgraded DST.
E.1.4 Vending Machines
Another feature was added to the DST to support the analysis and optimization of replacing existing vending machines with more energy-efficient units in order to reduce the overall building energy consumption and help in complying with the LEED-EB requirements. The upgraded DST incorporates a database of vending machines that contains key product data that are needed in the optimization analysis, including (1) general product characteristics such as brand name, model number, type of machine and life expectancy; (2) energy characteristics such as electricity consumption; (3) cost data such as unit cost, and annual maintenance cost; and (4) vendor details such as vendor name, website, location, and data entry date. A GUI was designed in the DST to facilitate the input data of vending machines for the created database. Figure 140 shows a user-friendly form where input data for vending machines can be entered and added to the DST database.
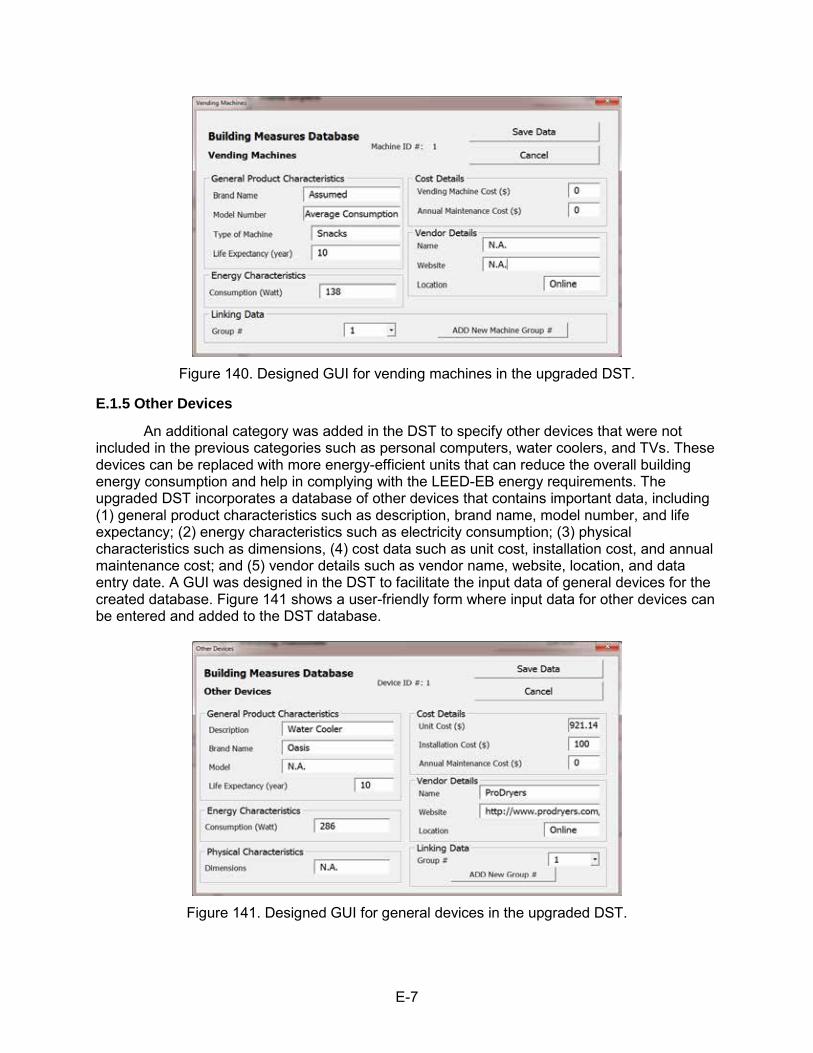
E-7
Figure 140. Designed GUI for vending machines in the upgraded DST.
E.1.5 Other Devices
An additional category was added in the DST to specify other devices that were not included in the previous categories such as personal computers, water coolers, and TVs. These devices can be replaced with more energy-efficient units that can reduce the overall building energy consumption and help in complying with the LEED-EB energy requirements. The upgraded DST incorporates a database of other devices that contains important data, including (1) general product characteristics such as description, brand name, model number, and life expectancy; (2) energy characteristics such as electricity consumption; (3) physical characteristics such as dimensions, (4) cost data such as unit cost, installation cost, and annual maintenance cost; and (5) vendor details such as vendor name, website, location, and data entry date. A GUI was designed in the DST to facilitate the input data of general devices for the created database. Figure 141 shows a user-friendly form where input data for other devices can be entered and added to the DST database.
Figure 141. Designed GUI for general devices in the upgraded DST.

E-8
E.1.6 Water Heaters
The DST is also designed to analyze and optimize the potential replacement of existing water heaters with more energy-efficient units. Water heater replacement can reduce the overall building energy consumption and help in complying with the LEED-EB requirements for building energy consumption. The DST incorporates a database for water heaters that contains key data on water heater products, including (1) general product characteristics such as brand name, model number, type of water heater, tank capacity and life expectancy; (2) energy savings such as percentage reduction in electricity consumption, percentage reduction in gas consumption, electricity consumption from energy simulation software, and gas consumption from energy simulation software; (3) energy characteristics such as standby loss, energy factor, and input rating; (4) cost data such as unit cost, installation cost, and annual maintenance cost; and (5) vendor details such as vendor name, website, location, and data entry date. The database in the DST was designed to add water heaters with their percentage energy savings or energy consumption. The percentage energy savings or energy consumption can be computed from energy simulation software and added to the database. The DST can assist in selecting the heater unit that can reduce energy consumption while achieving LEED-ED energy requirements. A graphical user interface (GUI) was designed in the DST to facilitate the input of water heaters data easily. Figure 142 shows a user-friendly form where input data for water heaters can be entered and added to the DST database.
Figure 142. Designed GUI for water heater in the upgraded DST.
E.1.7 HVAC Systems
Another feature was added to the DST to allow the developed tool to consider and optimize the potential replacement of existing HVAC equipment with more energy-efficient units. HVAC replacement can reduce the overall building energy consumption and help in complying with the LEED-EB requirements for building energy consumption. The DST incorporates a database for HVAC equipment that contains key data, including (1) general product characteristics such as brand name, model number, cooling capacity, heating capacity, type of

E-9
loop for geothermal heat pump if any, type of energy used for HVAC equipment, and life expectancy; (2) energy characteristics such as energy-efficiency ratio, coefficient of performance, and direct geo-exchange; (3) physical characteristics such as dimension and loop total length; (4) cost data such as HVAC equipment cost, equipment installation cost, loop installation cost, and annual maintenance cost; (5) energy consumption details such as percentage reduction in electricity consumption, percentage reduction in gas consumption, electricity consumption from energy simulation software, and gas consumption from energy simulation software; and (6) vendor details such as vendor name, website, location, and data entry date. The database in the upgraded DST was designed to add HVAC equipment with their percentage energy savings or energy consumption. The percentage energy savings or energy consumption can be computed from energy simulation software and added to the database with which the DST selects the HVAC unit that can reduce energy consumption while achieving LEED-ED energy requirements. This new user interface was designed in the DST to facilitate the input of HVAC equipment data, as shown in Figure 143.
Figure 143. Designed GUI for HVAC equipment in the upgraded DST.
E.1.8 Grid-Connected Photovoltaic Systems
The DST is also designed to evaluate and optimize the potential integration of grid-connected photovoltaic systems in the analyzed building. Adding on-site renewable energy sources such as photovoltaic systems in buildings can reduce their utility consumption and achieve LEED-EB credits. The upgraded DST incorporates database systems for the two main components of grid-connected photovoltaic systems: solar panels and electricity inverters. The databases contain key data on solar panels and inverter products to enable the DST to search for and identify the optimal type and number of solar panels and inverters for a building being analyzed. The database for solar panels contains important data on (1) general product characteristics such as brand name, model number, and life expectancy; (2) physical characteristics such as length, width, depth, and weight; (3) cost data such as solar panel cost; (4) energy characteristics such as power, efficiency, and maximum volt; and (5) vendor details

E-10
such as vendor name, website, location, and data entry date. Similarly, the database for electricity inverters contains important data on (1) general product characteristics such as brand name, model number, and life expectancy; (2) physical characteristics such as length, width, depth, and weight; (3) cost data such as inverter unit cost; (4) energy characteristics such as minimum inverter power, average inverter power, maximum power, volts, and efficiency; and (5) vendor details such as vendor name, website, location, and data entry date. The feature in the DST is designed to facilitate the input of the photovoltaic system components data, as shown in Figure 144and Figure 145.
Figure 144. Designed GUI for solar panels in the upgraded DST.
Figure 145. Designed GUI for inverters in the upgraded DST.

E-11
E.1.9 Water Fixtures
The DST is also designed to analyze and optimize the potential replacement of existing water fixtures with more-efficient units in order to reduce the overall building water consumption and help in complying with the LEED-EB water consumption requirements. The DST includes database systems for building water fixtures such as faucets, toilets, and urinals. The database for water facets contain important data, including (1) general product characteristics such as brand name, model number, type of faucet, and life expectancy; (2) water characteristics such as discharge rate; (3) cost data such as unit cost, installation cost, and annual maintenance cost; and (4) vendor details such as vendor name, website, location, and data entry date. The databases for water toilets and urinals were designed similar to the aforementioned water faucets database. This feature in the DST is designed to facilitate the input of all the required water fixtures data, as shown in Figure 146.
Figure 146. Designed GUI for water fixtures in the upgraded DST.
E.1.10 Metering Systems
The DST is designed to achieve LEED credits through the integration of metering and sub-metering systems for energy and water consumption in buildings. The integration of energy and water metering and sub-metering systems can achieve LEED-EB credits based on the water efficiency and energy-efficiency divisions. The DST incorporates databases for metering and sub-metering systems including water, electricity, and gas meters. The databases contain all the data that the DST requires to select meters/sub-meters based on their capacity, LEED-EB requirements, and number of LEED credits that need to be achieved. The database for metering systems contains important data including (1) general product characteristics such as brand name, model number, type of meter, meter capacity, and data log feature; (2) cost data such as unit cost, installation cost, and annual maintenance cost; and (3) vendor details such as vendor name, website, location, and data entry date. Similarly, the database for sub-metering

E-12
systems contains data on (1) general product characteristics such as brand name, model number, type of meter, meter capacity, data log feature, collector ID number if any, and any additional ID number; (2) cost data such as sub-meter cost, collector cost, additional device cost, and annual maintenance cost; and (3) vendor details such as vendor name, website, location, and data entry date. The GUI in the DST is designed to facilitate the input of meters and sub-meters data, as shown in Figure 147.
Figure 147. Designed GUI for electricity sub-meter in the upgraded DST.
E.1.11 Building Input Data
The DST includes a newly created tab to enable users to select and enter the specific data of buildings that are being investigated to achieve LEED-EB certification. This enables users to input building data, including building geometry and service information, building rooms, energy consumption historical data, interior lighting fixtures and bulbs, exterior lighting fixtures and bulbs, hand dryers, motion sensors, water heaters, water fixtures, HVAC systems, and energy and water metering systems. The DST is designed to assign these data into several sections. The first section is “general building data” that includes data on building name, geometry, building type, occupancy and visitation rates, historical data of electricity and gas consumption, and billing rates, as shown in Figure 148. This section also includes a button named “building measures” that can be used to show available databases for all building measures and add new products to these databases, if needed. The gathered building data in this section are used in the energy and water calculations as well as in the analysis of replacing existing building measures with more-efficient ones.

E-13
Figure 148. General building data section in the created building input data tab.
The second section of building input data is “building rooms” that includes data on room name, type, geometry and eligibility for implementing motion-activated lighting, as shown in Figure 149. This section can include up to 30 rooms in the analyzed building.
Figure 149. Building rooms section in the created building input data tab.
The third section of building input data is “interior lighting” that includes data on lighting fixture ID number, number of fixtures, light bulbs ID number, light working hours per day, and allowed reduction in existing light lumens, as shown in Figure 150. This section can account for three separate lighting sets per room and up to 30 rooms. Users can input a light fixture number where the tool can extract and show the information of this fixture automatically, as shown in Figure 150. The user can also update the interior lighting database by pressing the “Add Fixture” button and add a new fixture. Similarly, users can enter a light bulb number where the tool can extract and show the light bulb brand name, model number, and consumption, as
1
General Building Data
BuildingInput Data
3575838770Service
12298
0
Turtle Creek Rest Area
Building data
955.2864.67
9247.33
Building ID number
General Building Data Building NameNumber of RoomsAverage Width (feet)Average Length (feet)Average cleasr height inside buildingBuilding Perimeter (feet)Building Size (sq ft)Annual Number of visitorsType of Building Daily number of Full-Time equivelant (FTE) occupants - if any (occupant)Daily number of transients per day - if any (student/visitor)Number of retail customers - if any (customer)
Building Measures
Building Rooms
Average Room Width (feet)
Average Room Length (feet)
Average Room height (feet)
Eligibility for Motion lighting
Room 1 19.3 29.7 573.5 YesRoom 2 19.3 29.7 573.5 YesRoom 3 6.0 10.5 63.0 YesRoom 4 16.5 22.7 373.3 YesRoom 5 10.5 20.5 215.3 YesRoom 6 24.7 55.3 1363.8 NoRoom 7 8.0 12.0 96.0 YesRoom 8 8.0 12.0 96.0 YesRoom 9 12.2 18.2 221.0 Yes
Storage 2 StorageStorage 3 Storage
Travel information room
Building Rooms
OfficeLobby HallStorage 1 Storage
Women's bathroom 1 BathroomFamily bathroom BathroomMechnical room Office
Name Type of room
BathroomMen's bathrrom 1
26210 KWH23000 KWH18725 KWH17491 KWH12433 KWH13418 KWH14113 KWH14343 KWH12548 KWH13157 KWH18798 KWH28145 KWH
212381 KWH
Electricity Consumption (KWH)
JanuaryFebruaryMarchAprilMayJuneJulyAugustSeptemberOctoberNovemberDecember
Total
Reported Year
ConsumptionMonth
2008
585 Therm527 Therm360 Therm325 Therm132 Therm89 Therm92 Therm87 Therm98 Therm
222 Therm213 Therm409 Therm
3139 Therm
OctoberNovemberDecember
Total
AprilMay
Consumption
Reported Year
September
Month
JanuaryFebruary
March
JuneJuly
August
2008
Natural Gas Consumption (therm)
Billing RatesAverage elerecity rate 0.0998 $/KWHAverage Natural gas rate 0.93588 $/thermAverge water rate 0 $/gallon

E-14
shown in Figure 150. The user can also update the interior lighting database by pressing the “Add Bulb” button and add a new bulb, which provides flexibility to add any light fixture or bulb in the database and assign it to a room in a building. The gathered data in this section are used in the DST to calculate electricity consumption for existing light bulbs and fixtures as .well as to study the feasibility of replacing existing interior lighting with more energy-efficient ones during the optimization process.
Figure 150. Interior lighting section in the created building input data tab.
The fourth section of building input data is “exterior lighting” that includes data on lighting fixture ID number, number of fixtures, light bulb ID number, light working hours per day, and allowed reduction in existing light lumens, as shown in Figure 151. This section gathers data for three categories of exterior lighting including building, parking lot, and landscape and can account for up to two lighting sets per category. Users can enter a light fixture number to prompt the DST to extract and show the information of this fixture automatically, as shown in Figure 151. Similarly, users can input a light bulb number and DST will provide a collection of light bulb brand name, model number, and consumption, as shown in Figure 151. The user can also update the exterior lighting database by pressing the “Add Fixture” and/or “Add Bulb” buttons in order to add a new fixture and/or a bulb. The gathered data in this section are used in the DST to calculate electricity consumption for existing light bulbs and fixtures as well as to study the feasibility of replacing existing light bulbs and fixtures with more energy-efficient ones during the optimization process.
Type of Lighting Fixture (Fixture
Number)
Number of Fixtures
Type of Lighting Bulb
(Bulb Number)
Extracted bulb energy
consumption - Database -
(Watt)
Number of Light working hours per day
(Hours)
3 6 4 34
3 6 4 34
3 1 4 34
4 4 12 60
5 2 8 20
3 18 4 34
1 1 6 34
1 1 6 34
0 0 0
Building - Interior Lighting
Family bathroom
Storage 1
Room Name
Ceiling fluorescent square fixture for U-Shape lamps
Sylvania 27248-4 - F32T8/TL741/ALTO T8
24
Room Lighting - Set # 1
Room 9
Room 3
Room 4
Room 5
Room 6
Room 7
Men's bathrrom 1
Women's bathroom 1
Room 1
Room 2
Ceiling rectangular fluorescent fixtureSylvania FBO28/841/XP/SS/ECO
T8
24Ceiling fluorescent square fixture for U-Shape lamps
Sylvania 27248-4 - F32T8/TL741/ALTO T8
Mechnical room
24
0.33
Travel information
room9
Room 8
Ceiling rectangular fluorescent fixtureSylvania FB34/CW/6/SS/ECO
T12
Ceiling fluorescent square fixture for U-Shape lamps
Sylvania 27248-4 - F32T8/TL741/ALTO T8
2Ceiling rectangular fluorescent fixture
Sylvania 20905-6 - F32T8/TL950 T8
Lobby 24Ceiling fluorescent square fixture for U-Shape lamps
Sylvania 27248-4 - F32T8/TL741/ALTO T8
2
2Ceiling rectangular fluorescent fixture
Sylvania 20905-6 - F32T8/TL950 T8
Storage 2
Storage 3
Building Rooms
Add Bulb Add Fixture

E-15
The fifth section of the building input data is “motion lighting sensors, hand dryers, vending machines, other devices, and general load assignment” that includes data on motion-sensor ID number and number of sensors per room, hand dryer ID number and number of hand dryers per room, vending machine ID number and number of vending machines per room, device ID number and number of devices, devices working hours per day, general loads electricity and gas consumption, and working hours for general loads per day, as shown in Figure 152. The DST is designed to account for one set of motion sensors per room, one set of hand dryers per room, three sets of vending machines per room, two sets for other devices per room, and one set for general loads. Users of the DST can assign motion-sensor ID number, hand dryer ID number, vending machine ID number, and/or device ID number to prompt the DST to extract and show the information of these machines/devices automatically, as shown in Figure 152. The user can also update the existing databases for motion sensors, hand dryers, vending machines and devices by pressing any of the available buttons in this section and add a new unit, as shown in Figure 152. The gathered data in this section are used within the DST to calculate electricity consumption for hand dryers, vending machines, and other devices, electricity and gas consumption from general loads, reduction in lighting use due to the use of motion sensors. The gathered data of this section can also be used to study the feasibility of replacing existing hand dryers, vending machines, and other devices with more energy-efficient unit and calculate their additional costs accordingly during the optimization process.
Figure 151. Exterior lighting section in the created building input data tab.
The sixth section of the building input data is “water heaters and water fixtures” that includes data on water heater ID number and number of water heaters, percentage of electricity consumption as of the total building electricity consumption, percentage of gas consumption as of total building gas consumption, faucet ID number and number of faucets, toilet ID number and number of toilets, urinals ID number and number of urinals, percentage of Full-Time Equivalent (FTE) using room, percentage of visitors using room as of the total building visitors, percentage of customers using room, and installation or renovation year of water fixtures, as shown in Figure 153. During the optimization process, the DST will investigate the feasibility of replacing existing water heater(s) with more energy-efficient ones. Energy savings for water heaters can be calculated using energy simulation software such as eQuest. Users of the DST can assign water heater ID number, faucet ID number, toilet ID number, or urinal ID number to prompt the DST to extract and show the information of it automatically, as shown in Figure 153. The user can also update the existing databases with water heaters and/or water fixtures by pressing any of the available buttons in this section and add a new unit, as shown in Figure 153.
Exterior Lighting
Type of Lighting Fixture (Fixture
Number)
Number of Fixtures
Type of Lighting Bulb
(Bulb Number)
Bulb Energy Consumption
(Watt)
Average annual
working hours per day (Hour)
Aloowed Reduction in lumen levels
(%)
1 15 2 110
5 2 1 465
0 0 0
30%
30%
30%
Exterior Lighting - Set # 1
Location
Building Recessed lighting fixtures for buildings entrance and exit MH 100Watt
8.56
Landscape
Parking Lot
8.56
8.56Light pole with six fixtures for street and parking lighting HPS 400Watt
Add Bulb Add Fixture

E-16
This provides flexibility for users to add any unavailable product in the database and assign it to a room in a building. The gathered data in this section are used in the DST to calculate electricity and gas consumption for water heaters and to calculate water consumption for each room. The gathered data can also be used to study the feasibility of replacing existing water heaters and/or water fixtures with more energy-efficient units and calculate their additional costs accordingly during the optimization process.
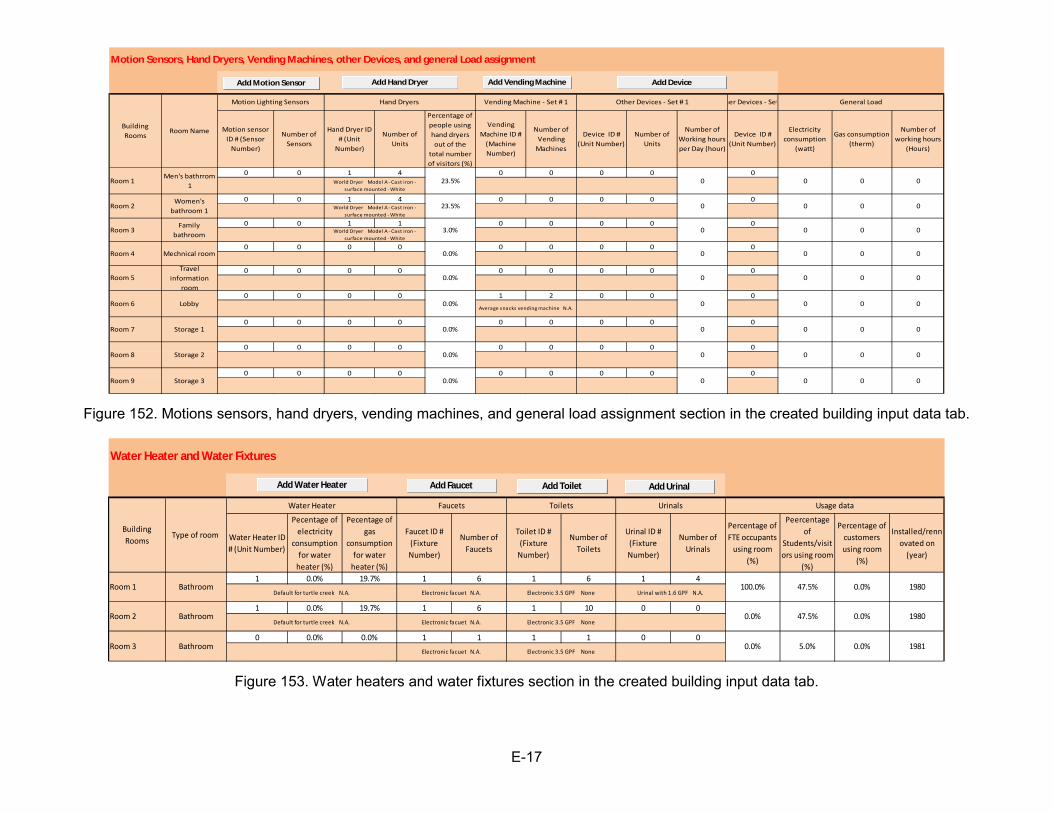
E-17
Figure 152. Motions sensors, hand dryers, vending machines, and general load assignment section in the created building input data tab.
Figure 153. Water heaters and water fixtures section in the created building input data tab.
Motion Sensors, Hand Dryers, Vending Machines, other Devices, and general Load assignment
Motion sensor ID # (Sensor
Number)
Number of Sensors
Hand Dryer ID # (Unit
Number)
Number of Units
Percentage of people using hand dryers out of the
total number of visitors (%)
Vending Machine ID #
(Machine Number)
Number of Vending
Machines
Device ID # (Unit Number)
Number of Units
Number of Working hours per Day (hour)
Device ID # (Unit Number)
Electricity consumption
(watt)
Gas consumption (therm)
Number of working hours
(Hours)
0 0 1 4 0 0 0 0 0
0 0 1 4 0 0 0 0 0
0 0 1 1 0 0 0 0 0
0 0 0 0 0 0 0 0 0
0 0 0 0 0 0 0 0 0
0 0 0 0 1 2 0 0 0
0 0 0 0 0 0 0 0 0
0 0 0 0 0 0 0 0 0
0 0 0 0 0 0 0 0 0
General Load
0 0 0
0 0 0
0 0 0
0 0 0
0 0 0
0 0 0
0 0 0
0 0 0
0 0 0
Room Name
Men's bathrrom 1
Women's bathroom 1
Family bathroom
Mechnical room
Travel information
room
Lobby
Storage 1
Storage 2
Storage 3
Room 6
Room 7
Room 8
Room 9
Room 1
Room 2
Room 3
Room 4
Room 5
Hand Dryers Motion Lighting Sensors Vending Machine - Set # 1 Other Devices - Set # 1 her Devices - Set
Building Rooms
23.5% 0World Dryer Model A - Cast iron - surface mounted - White
023.5%World Dryer Model A - Cast iron - surface mounted - White
0.0% 0
3.0% 0World Dryer Model A - Cast iron - surface mounted - White
0.0% 0Average snacks vending machine N.A.
0.0% 0
0.0% 0
0.0% 0
0.0% 0
Add Motion Sensor Add Hand Dryer Add Vending Machine Add Device
Water Heater and Water Fixtures
Water Heater ID # (Unit Number)
Pecentage of electricity
consumption for water
heater (%)
Pecentage of gas
consumption for water
heater (%)
Faucet ID # (Fixture Number)
Number of Faucets
Toilet ID # (Fixture
Number)
Number of Toilets
Urinal ID # (Fixture Number)
Number of Urinals
Percentage of FTE occupants
using room (%)
Peercentage of
Students/visitors using room
(%)
Percentage of customers using room
(%)
Installed/rennovated on
(year)
1 0.0% 19.7% 1 6 1 6 1 4
1 0.0% 19.7% 1 6 1 10 0 0
0 0.0% 0.0% 1 1 1 1 0 0Bathroom
100.0% 47.5% 0.0% 1980
Usage data
0.0% 47.5% 0.0% 1980
0.0% 5.0% 0.0% 1981
Electronic 3.5 GPF None
Electronic facuet N.A. Electronic 3.5 GPF None
Toilets Urinals
Electronic facuet N.A. Electronic 3.5 GPF None Urinal with 1.6 GPF N.A.
Water Heater
Default for turtle creek N.A.
Faucets
Default for turtle creek N.A. Electronic facuet N.A.
Building Rooms
Room 1
Room 2
Room 3
Type of room
Bathroom
Bathroom
Add Water Heater Add Faucet Add Toilet Add Urinal
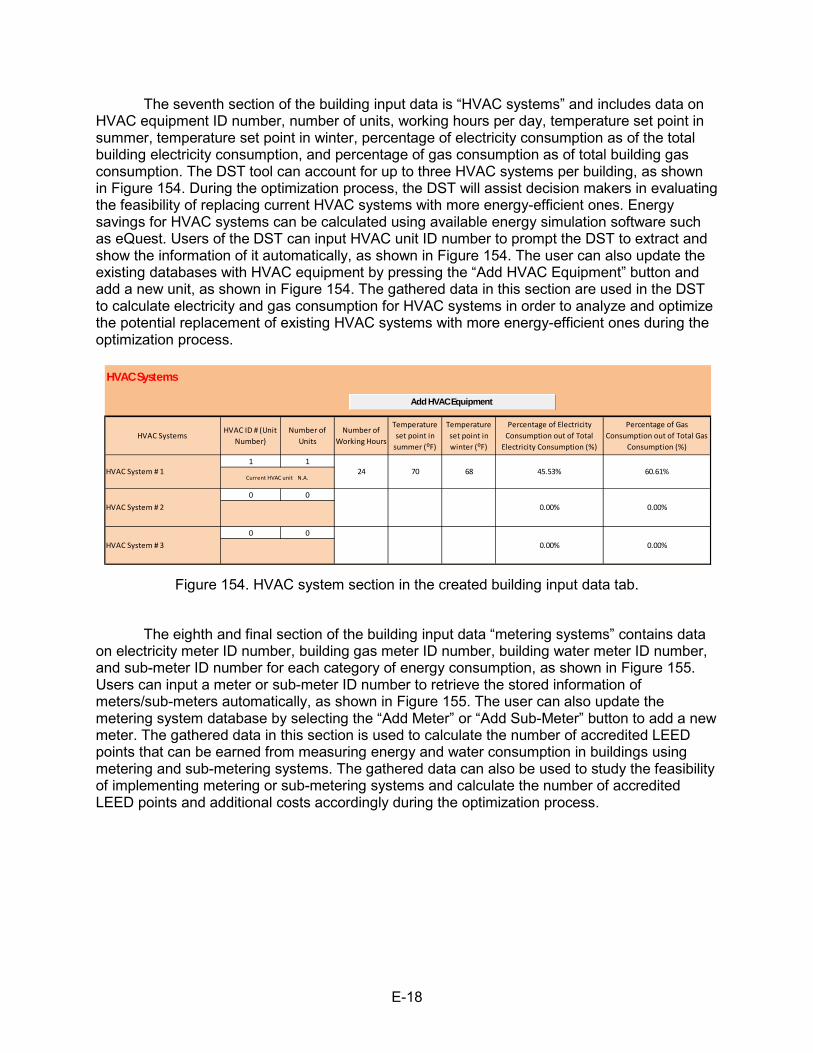
E-18
The seventh section of the building input data is “HVAC systems” and includes data on HVAC equipment ID number, number of units, working hours per day, temperature set point in summer, temperature set point in winter, percentage of electricity consumption as of the total building electricity consumption, and percentage of gas consumption as of total building gas consumption. The DST tool can account for up to three HVAC systems per building, as shown in Figure 154. During the optimization process, the DST will assist decision makers in evaluating the feasibility of replacing current HVAC systems with more energy-efficient ones. Energy savings for HVAC systems can be calculated using available energy simulation software such as eQuest. Users of the DST can input HVAC unit ID number to prompt the DST to extract and show the information of it automatically, as shown in Figure 154. The user can also update the existing databases with HVAC equipment by pressing the “Add HVAC Equipment” button and add a new unit, as shown in Figure 154. The gathered data in this section are used in the DST to calculate electricity and gas consumption for HVAC systems in order to analyze and optimize the potential replacement of existing HVAC systems with more energy-efficient ones during the optimization process.
Figure 154. HVAC system section in the created building input data tab.
The eighth and final section of the building input data “metering systems” contains data on electricity meter ID number, building gas meter ID number, building water meter ID number, and sub-meter ID number for each category of energy consumption, as shown in Figure 155. Users can input a meter or sub-meter ID number to retrieve the stored information of meters/sub-meters automatically, as shown in Figure 155. The user can also update the metering system database by selecting the “Add Meter” or “Add Sub-Meter” button to add a new meter. The gathered data in this section is used to calculate the number of accredited LEED points that can be earned from measuring energy and water consumption in buildings using metering and sub-metering systems. The gathered data can also be used to study the feasibility of implementing metering or sub-metering systems and calculate the number of accredited LEED points and additional costs accordingly during the optimization process.
HVAC Systems
HVAC ID # (Unit Number)
Number of Units
Number of Working Hours
Temperature set point in
summer (⁰F)
Temperature set point in winter (⁰F)
1 1
0 0
0 0
0.00% 0.00%
0.00% 0.00%
HVAC Systems Percentage of Electricity
Consumption out of Total Electricity Consumption (%)
Percentage of Gas Consumption out of Total Gas
Consumption (%)
HVAC System # 1
HVAC System # 2
HVAC System # 3
Current HVAC unit N.A.24 70 68 45.53% 60.61%
Add HVAC Equipment

E-19
Figure 155. Metering systems section in the created building input data tab.
E.1.12 Action Report for Energy and Water Measures
The DST includes a new tab that is named “action report” that summarizes the output results of its analysis in a clear and concise format. The action report for energy and water measures shows building measures that need to be added or replaced in order to reduce or monitor energy and water consumption in buildings. This action report contains seven sections: (1) interior lighting, (2) exterior lighting, (3) vending machines, motion sensors, and other devices, (4) water heaters, water fixtures, and hand dryers, (5) HVAC systems, (vi) grid-connected photovoltaic systems, and (6) metering and sub-metering systems. Each of these sections provides recommendations for implementing energy and water measures as well as metering and sub-metering systems. The first section of interior lighting shows recommendations for interior lighting fixtures and bulbs per room, as shown in Figure 156. These recommendations identify whether a fixture or the kind of light bulbs needs to be replaced in order to reduce the current building electricity consumption. Similarly, the remaining sections of the action report show recommendations for (1) exterior light bulbs and fixtures (see Figure 157), (2) vending machines, motions sensors, and other devices (see Figure 158); (3) water fixtures, water heaters, hand dryers, and motion sensors (see Figure 159); (4) HVAC systems (see Figure 160); (5) grid-connected photovoltaic system (see Figure 161); and (6) metering and sub-metering systems (see Figure 162).
Metering System
Meter ID # 1
Meter ID # 0
Meter ID # 0
Meter ID # 0
Meter ID # 0
Meter ID # 0
Meter ID # 0Water Heater
Electricty meter
Existing Digital Meter N.A.
Category
Whole building meter
Interior Lighting
Exterior Lighting
Vending Machines
Hand Dryers
HVAC system
Add Meter Add Sub-MeterMeter ID # 1
Meter ID # 0
Meter ID # 0
Whole building meterExisting Analog Meter N.A.
Category Gas meter
HVAC system
Water Heater
Add Meter Add Sub-Meter
Meter ID # 0
Category Gas meter
Water whole building meter
Add Meter Add Sub-Meter

E-20
Figure 156. Action report for interior light bulbs and fixtures per room.
Figure 157. Action report for exterior light bulbs and fixtures.
Keep exis ting l ight fixture
Keep exis ting l ight bulb
Keep exis ting l ight fixture
Replace exis ting l ight bulb [FB34/CW/6/SS/ECO] With [Sylvania ;
FBO28/841/XP/SS/ECO]
Set # 1 Set # 2Rooms
Keep exis ting l ight fixture
Replace exis ting l ight bulb [FB34/CW/6/SS/ECO] With [Sylvania ;
FBO28/841/XP/SS/ECO]
Keep exis ting l ight fixture
Keep exis ting l ight bulb
Keep exis ting l ight fixture
Replace exis ting l ight bulb [24596 - F34CW/SS/ECO] With [Sylvania ;
22179 (FO28/841/XP/SS/ECO)]
Keep exis ting l ight fixture
Replace exis ting l ight bulb [24596 - F34CW/SS/ECO] With [Sylvania ;
22179 (FO28/841/XP/SS/ECO)]
Keep exis ting l ight fixture
Replace exis ting l ight bulb [24596 - F34CW/SS/ECO] With [Sylvania ;
22179 (FO28/841/XP/SS/ECO)]
Keep exis ting l ight fixture
Keep exis ting l ight bulb
Keep exis ting l ight fixture
Keep exis ting l ight bulb
Keep exis ting l ight fixture
Keep exis ting l ight bulb
Keep exis ting l ight fixture
Keep exis ting l ight bulb
Keep exis ting l ight fixture
Keep exis ting l ight bulb
Set # 3
Fixture
Bulb
Men's bathrrom 11
2
3
4
5
6
7
Women's bathroom 1
Family bathroom
Mechnical room
Travel information room
Lobby
8
Fixture
Bulb
Fixture
Bulb
Fixture
Bulb
Storage 1
Storage 2
Fixture
Bulb
Fixture
Bulb
Fixture
Bulb
Fixture
Bulb
Interior Lighting
Action NeededItem
Exterior Lighting
Location ItemAction Needed
Fixture
Bulb
Fixture
Bulb
Fixture
Bulb
1
2
3
Building
Parking Lot
Landscape
Set # 2Set # 1
Keep exis ting l ight fixture
Keep exis ting l ight fixture
Keep exis ting l ight bulb
Keep exis ting l ight bulb

E-21
Figure 158. Action report for vending machines, motion sensors, and other devices.
Figure 159. Action report for water fixtures, water heater, and hand dryers.
Figure 160. Action report for HVAC system.
1
2
3
4
5
6
7
8
9
Family bathroom
Mechnical roomTravel information room
Lobby
Vending Machines, Motion Sensors, and Other Devices
Other Devices - Set # 2Rooms
Vending Machines - Set # 1
Vending Machines - Set # 2
Vending Machines - Set # 3 Motion Sensors
Other Devices - Set # 1
Storage 1
Storage 2
Storage 3
insta l l 1 motion sensor [Cooper Lighting ;
MS180W ]
ins ta l l 5 motion sensor [Cooper Lighting ;
MS180W ]
ins ta l l 1 motion sensor [Levi ton ; ODC0S-I1W ]
insta l l 0 motion sensor [Cooper Lighting ;
MS180W ]
ins ta l l 5 motion sensor [Cooper Lighting ;
MS180W ]
ins ta l l 4 motion sensor [Cooper Lighting ;
MS180W ] ins ta l l 2 motion sensor
[Cooper Lighting ; MS180W ]
ins ta l l 1 motion sensor [Cooper Lighting ;
MS180W ]
Keep exis ting machine
Men's bathrrom 1
Women's bathroom 1
Keep exis ting machine Keep exis ting machine
1
2
3
Keep exis ting water heaterReplace exis ting hand dryers with [World Dryer Ai rforce ; J
Series - White]
Keep exis ting faucet Keep exis ting toi let
Faucets Toilets Urinals
Replace exis ting hand dryers with [World Dryer Ai rforce ; J
Series - White]
Replace exis ting urina l with [Electronic flush
urina l (0.125GPF) ; N.A.]
Keep exis ting toi letKeep exis ting faucet Keep exis ting water heaterReplace exis ting hand dryers with [World Dryer Ai rforce ; J
Series - White]
Keep exis ting faucetReplace exis ting toi let with [Electronic 1.6 GPF
; None]
Water fixtures, water heaters, and hand dryers
Water Heater Hand DryersRooms
Men's bathrrom 1
Women's bathroom 1
Family bathroom
HVAC system
HVAC System # 1 HVAC System # 2 HVAC System # 3
Turtle Creek Rest Area
Replace exis ting HVAC system with [Gas HVAC system ; N.A.]

E-22
Figure 161. Action report for grid-connected photovoltaic system.
Figure 162. Action report for metering and sub-metering systems.
Photovoltaic Sysyem Component Type of component Number of components
Solar Panel
Grid Connect Photovoltaic System
45
2Inverter
Water Heater
Install electricity sub-meter [EKM-OmniMeter
; V1.3]
Install electricity sub-meter [EKM-OmniMeter
; V1.3]
Install electricity sub-meter [EKM-OmniMeter
; V1.3]Install electricity sub-
meter [EKM-OmniMeter ; V1.3]
Keep existing building electricity meter
Building electricity meter
Interior Lighting
Exterior Lighting
Water building meterInstall building water
meter [E-Mon D-Mon ; E-Mon D-Mon]
Category Electricty meter Category
Building gas meter
HVAC system
Water Heater
Vending Machines
Hand Dryers
HVAC system
Install gas sub-meter [E-Mon D-Mon ; GDP250
Series]Install gas sub-meter [E-
Mon D-Mon ; GDP250 Series]
Metering systems
Gas meter
Category Water meter
System Characteristics Value
Number of solar panels on roof 22
23
0
17148
13.94%
Number of solar panels on ground
Required area for solar panels next to building
System capacity
percentage of gnerated electricty as of building electricity consumption

E-23
E.2 PERFORMANCE EVALUATION OF DEVELOPED DST An application example using the Turtle Creek rest area data was developed to (1)
illustrate the use of the developed DST; (2) demonstrate its newly upgraded features and unique optimization capabilities; and (3) evaluate its performance and verify the results. The following sections provide a brief description of the Illinois rest area example, specify its input data that are required by the DST, and summarize the findings of this analysis.
E.2.1 Brief Description of the Rest Area Example
Turtle Creek rest area was built in 1980 and it is one of the highly visited rest areas in Illinois with approximately 839 thousand annual visitors based on 2009 statistics and a total square footage of 3575. It comprises of one building that serves the east and west bounds of I-90 at mile marker 2. The rest area building includes lobby, women’s restroom, men’s restroom, mechanical room, storage room, travel information desk, and technician office, see Figure 74. The rest area building has also a parking lot for visitors that accommodate cars and semi-trucks, and a large landscaped area and outdoor picnic seats.
The components of energy consumption in the Turtle Creek rest area include exterior lighting, interior lighting, space heating, air conditioning, water heating, vending machines, surveillance cameras, “Code Blue” emergency phones, weather information, hand dryers, and water coolers. The exterior lighting includes lighting poles for the parking lot of the rest area, and outdoor lighting fixtures for the rest area entrance. The interior lighting includes lighting fixtures for the lobby, men’s restroom, women’s restroom, mechanical room, and maintenance office. The Turtle Creek rest area building is heated and air-conditioned using two furnaces, two air-cooled condensing units, and an exhaust fan. A natural gas water heater (State water heater) is used in the rest area building to heat water with a capacity of 100 gallons. The rest area building has six vending machines for snacks, cold and hot drinks. Surveillance cameras and Code Blue units are used to maintain safety for visitors of the rest area. The weather information is provided using a television in the rest area lobby. The water consumption components of this rest area building include faucets, urinals, toilets, and drinking water.
Figure 163. Turtle Creek rest area.

E-24
E.2.2 Modeling of the Rest Area Example
In order to optimize the upgrade decisions for Turtle Creek rest area building, the upgrade cost of prerequisites and LEED credits as well as its associated LEED points need to be identified. This requires the decision maker to input the following data: (1) general input parameters, historical data of energy use, and existing energy and water consuming devices; (2) upgrade costs for satisfying the prerequisites of the LEED-EB rating system divisions; and (3) identifying the LEED-EB credits that are applicable to the building and their upgrade costs credit and associated LEED points. Due to the unavailability of some of this data, reasonable assumptions were made to estimate the upgrade costs for LEED-EB credits.
The LEED-EB rating system consists of seven divisions including: Sustainable Sites (SS), Water Efficiency (WE), Energy and Atmosphere (EA), Material and Resources (MR), Indoor Environmental Quality (IEQ), Innovation in Operation (IO), and Regional Priority (RP). These seven divisions require nine prerequisites and can be used to earn up to 50 credits. The required general input parameters, historical energy use, energy and water measures data for the Turtle Creek rest area building are specified and shown previously in Figure 148 to Figure 155.
The LEED-EB prerequisites and their upgrade costs for the Turtle Creek rest area building are specified and listed in Table 193. The remaining input data for the optional LEED points including their upgrade costs for the six main LEED divisions: Sustainable Sites (SS), Water Efficiency (WE), Energy and Atmosphere (EA), Material and Resources (MR), Indoor Environmental Quality (IEQ), and Innovation in Operation (IO) are specified and listed in Table 194, Table 195, Table 196, Table 197, Table 198, and Table 199, respectively. The potential credits of the Regional Priority division are automatically calculated by the developed DST based on the zip code of the building. The maximum number of LEED credit points that can be earned by the Turtle Creek rest area is 61 points.
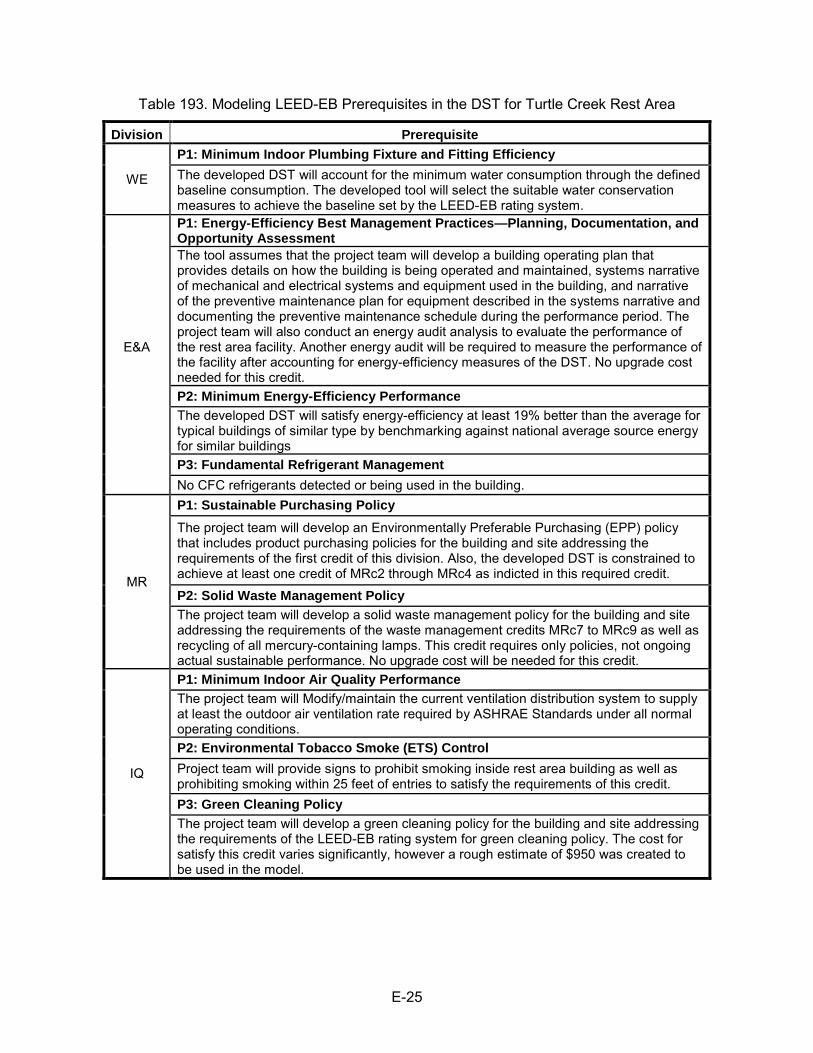
E-25
Table 193. Modeling LEED-EB Prerequisites in the DST for Turtle Creek Rest Area
Division Prerequisite
WE
P1: Minimum Indoor Plumbing Fixture and Fitting Efficiency The developed DST will account for the minimum water consumption through the defined baseline consumption. The developed tool will select the suitable water conservation measures to achieve the baseline set by the LEED-EB rating system.
E&A
P1: Energy-Efficiency Best Management Practices—Planning, Documentation, and Opportunity Assessment The tool assumes that the project team will develop a building operating plan that provides details on how the building is being operated and maintained, systems narrative of mechanical and electrical systems and equipment used in the building, and narrative of the preventive maintenance plan for equipment described in the systems narrative and documenting the preventive maintenance schedule during the performance period. The project team will also conduct an energy audit analysis to evaluate the performance of the rest area facility. Another energy audit will be required to measure the performance of the facility after accounting for energy-efficiency measures of the DST. No upgrade cost needed for this credit. P2: Minimum Energy-Efficiency Performance The developed DST will satisfy energy-efficiency at least 19% better than the average for typical buildings of similar type by benchmarking against national average source energy for similar buildings P3: Fundamental Refrigerant Management No CFC refrigerants detected or being used in the building.
MR
P1: Sustainable Purchasing Policy The project team will develop an Environmentally Preferable Purchasing (EPP) policy that includes product purchasing policies for the building and site addressing the requirements of the first credit of this division. Also, the developed DST is constrained to achieve at least one credit of MRc2 through MRc4 as indicted in this required credit. P2: Solid Waste Management Policy The project team will develop a solid waste management policy for the building and site addressing the requirements of the waste management credits MRc7 to MRc9 as well as recycling of all mercury-containing lamps. This credit requires only policies, not ongoing actual sustainable performance. No upgrade cost will be needed for this credit.
IQ
P1: Minimum Indoor Air Quality Performance The project team will Modify/maintain the current ventilation distribution system to supply at least the outdoor air ventilation rate required by ASHRAE Standards under all normal operating conditions. P2: Environmental Tobacco Smoke (ETS) Control Project team will provide signs to prohibit smoking inside rest area building as well as prohibiting smoking within 25 feet of entries to satisfy the requirements of this credit. P3: Green Cleaning Policy The project team will develop a green cleaning policy for the building and site addressing the requirements of the LEED-EB rating system for green cleaning policy. The cost for satisfy this credit varies significantly, however a rough estimate of $950 was created to be used in the model.

E-26
Table 194. Considered Credits of Sustainable Site Division in the DST and Associated Upgrade Costs
Credit Cost ($) Accredited Points
Building Exterior and Hardscape Management Plan Alternative 1: The LEED accredited professionals of IDOT will develop a plan for practices that reduce harmful chemical use, energy waste, water waste, air pollution, solid waste, and/or chemical runoff during the performance period of the rest area. IDOT has LEED accredited professionals who can help in developing this plan. No upgrade cost needed for this credit.
0 1
Integrated Pest Management, Erosion Control, and Landscape Management Plan Alternative 1: The LEED accredited professionals of IDOT will develop a low-impact site and green building exterior management plan that addresses overall site management, chemicals, fertilizers, landscape waste and pest management. This plan will include using of least toxic chemical pesticides, minimum use of the chemicals, and using only in targeted locations and targeted species. IDOT has LEED accredited professionals who can help in developing this plan. No upgrade cost needed for this credit.
0 1
Site Development-Protect or Restore Open Habitat
Alternative 1: The current landscape and vegetation covers more than 25% of the site area as indicated in the LEED-EB rating system. No additional cost needed to account for this credit
0 1
Storm-water Quantity Control Alternative 1: The project team will implement a storm-water management plan that infiltrates, collects and reuses runoff. Turtle Creek rest area will account for rainwater catchments for water reuse and rain gardens for water infiltration. The cost for installing rainwater catchment varies significantly; however, a rough estimate of $50,000 was created to be used in the model.
50,000 1
Heat Island Reduction-Non-roof Alternative 1: Using permeable pavement to cover 50% of pavement area, the cost for installing permeable pavement can vary significantly however an estimate of $110,000 was used in the model.
110,000 1
Heat Island Reduction-Roof Alternative 1: The current roof of Turtle Creek rest area will need to be replaced with a new roof material; a rough estimate of $11,500 was calculated and used in the model.
11,500 1
Alternative 1: Installing Solar panels on the roof of the rest area building that cover more than 75% of the roof area ( this alternative is considered only if the PV of renewable energy measure that is installed on roof is considered)
0 1

E-27
Table 195. Considered Credits of Water-Efficiency Division in the DST and Associated Upgrade Costs
Credit Cost ($)
Accredited Points
Water Performance Measurement This credit will be investigated through the upgraded DST, the tool will use the available meters in the database for metering systems and calculate the accredited LEED points accordingly.
Varied Up to 2 points
Additional Indoor Plumbing Fixture and Fitting Efficiency - conservative faucets This credit will be investigated through the upgraded DST; the tool will use the available water fixtures in the database to reduce the building water consumption and calculate the accredited LEED points accordingly. The cost for water fixture replacement will be calculated in the tool automatically from the database.
Varied Up to 5
Water-Efficient Landscaping
Rainwater is used for the current irrigation system in the Turtle Creek rest area, which achieves100% savings in water irrigation. 0 5

E-28
Table 196. Considered Credits of Energy and Atmosphere Division in the DST and Associated Upgrade Costs
Credit Cost ($)
Accredited Points
C1-Optimize Energy-Efficiency Performance This credit will be investigated through the upgraded DST; the tool will use the available energy measures in the database to reduce the building energy consumption and calculate the accredited LEED points accordingly. The cost for the implementation/replacement of energy measures will be calculated in the tool automatically from the database.
Varied Up to 18 points
C2.1-Existing Building Commissioning-Investigation and Analysis Alternative 1: The developed energy audit that was prepared in the previous tasks for Turtle Creek rest area shows the energy consumption distribution, major contributors of energy consumption, and measures that can provide annual savings, and improve comfort. No additional cost needed to achieve this credit.
0 2
Existing Building Commissioning-Implementation Alternative 1: The decision makers of IDOT will implement the no or low-cost operational improvements based on the conducted analysis of this study. These no or low-cost operation improvements will end up with low upgrade cost that can be paid back within 1~2 years. By the time for admission for a LEED certificate, these initial costs should be paid back. The major retrofits or upgrades for energy performance are considered in the first credit of this division.
0 2
Performance Measurement-System Level Metering This credit will be investigated through the upgraded DST, the tool will use the available meters in the database for metering systems and calculate the accredited LEED points accordingly.
Varied Up to 2 points
C4-On-site and Off-site Renewable Energy This credit will be investigated through the upgraded DST; the tool will use the available grid-connected photovoltaic system components in the database to reduce the building energy consumption and generate on-site renewable energy. The DST will calculate the accredit LEED points automatically based on the percentage of renewable energy as of total building electricity consumption. The additional costs for this credit will be calculated based on the selected components from the database and the considered assumptions in the system design for labor and miscellaneous parts costs.
Varied Up to 6 points
Emissions Reduction Reporting Alternative 1: The LEED APs of IDOT will identify and quantify the reduction in energy consumption and emissions based on the results of this DST and carbon footprint analysis develop in the previous reports.
0 1

E-29
Table 197. Considered Credits of Material and Resources Division in the DST and Associated Upgrade Costs
Credit Cost ($) Accredited Points
Sustainable Purchasing-Ongoing Consumables Alternative 1: The project team will account for sustainable purchases for paper, binders, and disk accessories. Also, the project team will account for rechargeable batteries for devices used in the rest area. These sustainability purchases will have slightly higher annual cost however there is no upgrade cost for achieving this item.
0 1
Sustainable Purchasing-Durable Goods Alternative 1: Installing three Energy Star vending machines for cold drinks. 10,200 1
Alternative 2: Replacing two snacks vending machines with Energy Star units. 7,100 1 Sustainable Purchasing-Food Alternative 1: The project team will account for 25% sustainable food purchases according to the LEED-EB rating system. No additional cost required for this credit.
0 1
Solid Waste Management-Facility Alterations and Additions Alternative 1: The project team will Divert 70% of waste (by volume) generated by facility during facility renovations, demolitions, and refits from disposal to landfills and incineration facilities. No upgrade cost needed for this credit however renovation or demolishing costs might increase.
0 1
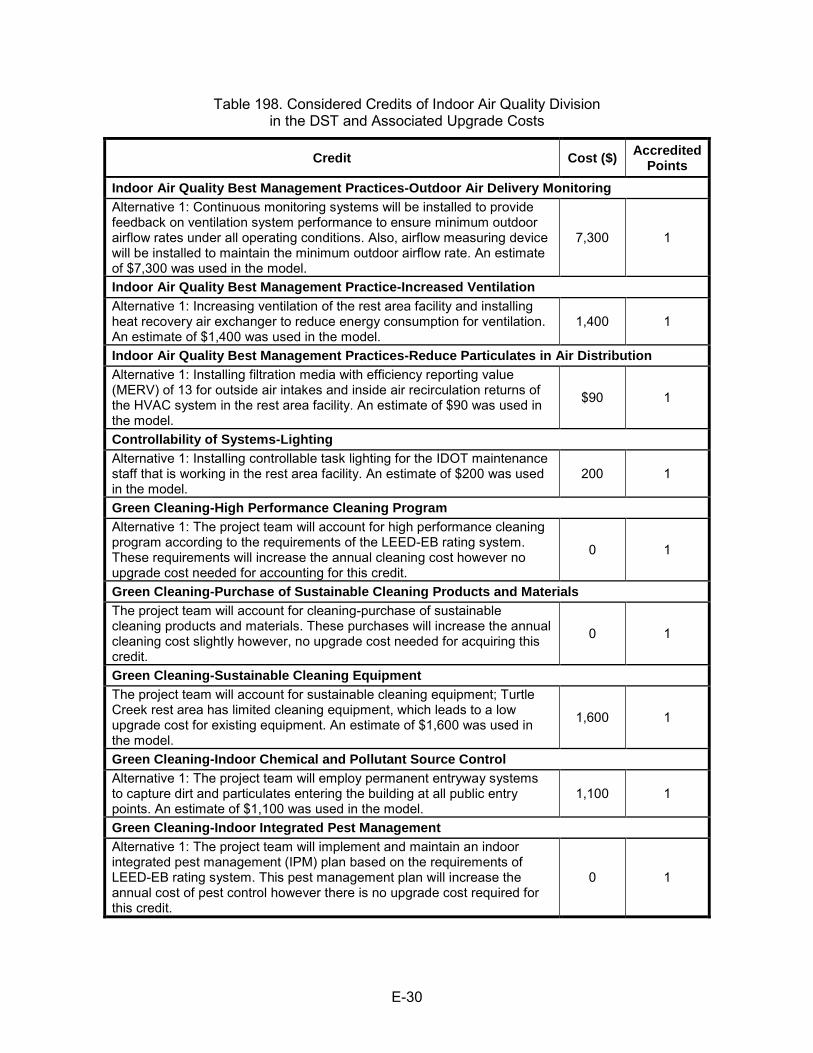
E-30
Table 198. Considered Credits of Indoor Air Quality Division in the DST and Associated Upgrade Costs
Credit Cost ($) Accredited Points
Indoor Air Quality Best Management Practices-Outdoor Air Delivery Monitoring Alternative 1: Continuous monitoring systems will be installed to provide feedback on ventilation system performance to ensure minimum outdoor airflow rates under all operating conditions. Also, airflow measuring device will be installed to maintain the minimum outdoor airflow rate. An estimate of $7,300 was used in the model.
7,300 1
Indoor Air Quality Best Management Practice-Increased Ventilation Alternative 1: Increasing ventilation of the rest area facility and installing heat recovery air exchanger to reduce energy consumption for ventilation. An estimate of $1,400 was used in the model.
1,400 1
Indoor Air Quality Best Management Practices-Reduce Particulates in Air Distribution Alternative 1: Installing filtration media with efficiency reporting value (MERV) of 13 for outside air intakes and inside air recirculation returns of the HVAC system in the rest area facility. An estimate of $90 was used in the model.
$90 1
Controllability of Systems-Lighting Alternative 1: Installing controllable task lighting for the IDOT maintenance staff that is working in the rest area facility. An estimate of $200 was used in the model.
200 1
Green Cleaning-High Performance Cleaning Program Alternative 1: The project team will account for high performance cleaning program according to the requirements of the LEED-EB rating system. These requirements will increase the annual cleaning cost however no upgrade cost needed for accounting for this credit.
0 1
Green Cleaning-Purchase of Sustainable Cleaning Products and Materials The project team will account for cleaning-purchase of sustainable cleaning products and materials. These purchases will increase the annual cleaning cost slightly however, no upgrade cost needed for acquiring this credit.
0 1
Green Cleaning-Sustainable Cleaning Equipment The project team will account for sustainable cleaning equipment; Turtle Creek rest area has limited cleaning equipment, which leads to a low upgrade cost for existing equipment. An estimate of $1,600 was used in the model.
1,600 1
Green Cleaning-Indoor Chemical and Pollutant Source Control Alternative 1: The project team will employ permanent entryway systems to capture dirt and particulates entering the building at all public entry points. An estimate of $1,100 was used in the model.
1,100 1
Green Cleaning-Indoor Integrated Pest Management Alternative 1: The project team will implement and maintain an indoor integrated pest management (IPM) plan based on the requirements of LEED-EB rating system. This pest management plan will increase the annual cost of pest control however there is no upgrade cost required for this credit.
0 1

E-31
Table 199. Considered Credits of Innovation in Operation Division in the DST and Associated Upgrade Costs
Credit Cost ($)
Accredited Points
LEED Accredited Professional The project team will consider at least one of their IDOT LEED accredited professionals in this project. No additional cost required for this credit. 0 1
Documenting Sustainable Building Cost Impacts The project team will document the additional cost needed to achieve a LEED certificate for Turtle Creek rest area building. No additional cost required for this credit.
0 1
E.2.3 Analysis Results
The developed DST was used to analyze the aforementioned input data to explore and optimize the upgrade decisions for Turtle Creek rest area. Two types of optimization analyses were conducted to illustrate the capabilities of the DST in optimizing the aforementioned two practical objectives of: (1) minimizing the total upgrade costs that are required to accomplish a specified LEED certification level including Certified, Silver and Gold levels; and (2) maximizing the number of accredited LEED points that can be earned under a specified limited upgrade cost.
The results of the first optimization analysis indicate that the minimum upgrade cost to achieve 60 points (i.e., Gold LEED-EB level) was estimated by the DST to be $154,961. The DST also provides a detailed description of the optimal solution that produced this optimal result, including the identified optimal upgrade measures, as well as their upgrade costs and accredited points. Figure 164 and Figure 165 show a sample of the output results of the DST for optimizing upgrade decisions of the Turtle Creek rest area building. The action report of energy and water decisions for achieving a Gold LEED level is previously shown in Figure 156 through Figure 162. The DST was then used to identify another set of optimal upgrade decisions that can achieve Certified and Silver LEED-EB levels. The DST estimated that the minimum upgrade cost to achieve Certified and Silver levels was $34,184, and $58,486 respectively. The DST was not able to provide a feasible solution for the platinum LEED-EB level since the maximum number of LEED credits that can be earned by this building is 61 points due to the inapplicability of some credit areas for the rest area building such as “Alternative Commuting Transportation”. This credit area is not applicable for Turtle Creek rest area building and can achieve up to 15 points.
The second optimization analysis focused on maximizing the number of accredited LEED points that can be earned under a specified limited budget for upgrade costs. This analysis used varying scenarios of budget limits that range from $20,000 to $360,000 and the DST was able to identify the maximum number of LEED points that can be achieved under each of these budget limits as, shown in Table 200 and Figure 166. The DST searches a huge number of solutions to reach the maximum number of LEED points within a specified budget.

E-32
Table 200. Accredited LEED Points Associated with Each Solution for Maximizing LEED Points within a Certain Budget for Turtle Creek Rest Area
Budget Cost for Upgrade ($) Actual Budget ($) Maximum LEED Points
20,000 19,326 15 40,000 39,284 42 60,000 58,486 50 80,000 79,187 55 100,000 89,094 57 120,000 103,968 58 180,000 155,239 60 240,000 155,239 60 300,000 265,207 61 360,000 265,239 61
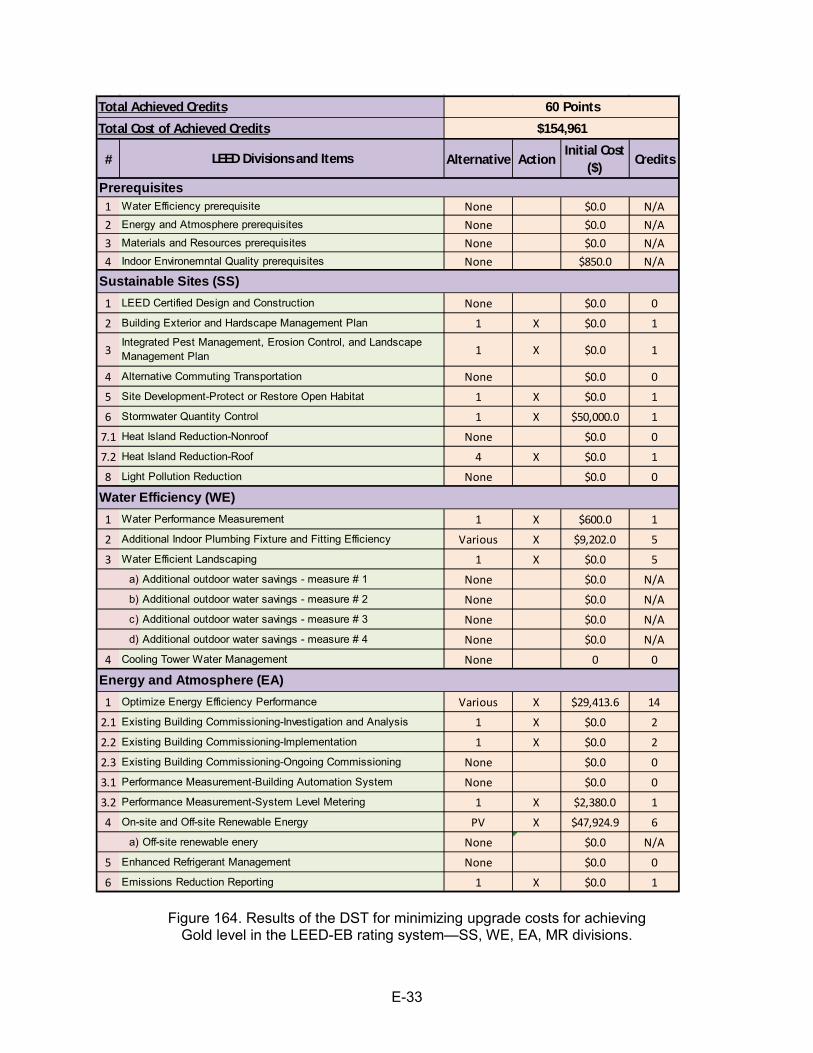
E-33
Figure 164. Results of the DST for minimizing upgrade costs for achieving Gold level in the LEED-EB rating system—SS, WE, EA, MR divisions.
# Alternative ActionInitial Cost
($) Credits
1 None $0.0 N/A2 None $0.0 N/A3 None $0.0 N/A4 None $850.0 N/A
1 None $0.0 0
2 1 X $0.0 1
3 1 X $0.0 1
4 None $0.0 0
5 1 X $0.0 1
6 1 X $50,000.0 1
7.1 None $0.0 0
7.2 4 X $0.0 1
8 None $0.0 0
1 1 X $600.0 1
2 Various X $9,202.0 5
3 1 X $0.0 5Additional outdoor water savings - measure # 1 None $0.0 N/AAdditional outdoor water savings - measure # 2 None $0.0 N/AAdditional outdoor water savings - measure # 3 None $0.0 N/AAdditional outdoor water savings - measure # 4 None $0.0 N/A
4 None 0 0
1 Various X $29,413.6 14
2.1 1 X $0.0 2
2.2 1 X $0.0 2
2.3 None $0.0 0
3.1 None $0.0 0
3.2 1 X $2,380.0 1
4 PV X $47,924.9 6Off-site renewable enery None $0.0 N/A
5 None $0.0 0
6 1 X $0.0 1
PrerequisitesWater Efficiency prerequisite
Energy and Atmosphere prerequisites
Materials and Resources prerequisites
Indoor Environemntal Quality prerequisites
Water Performance Measurement
Additional Indoor Plumbing Fixture and Fitting Efficiency
Water Efficient Landscaping
Cooling Tower Water Management
Optimize Energy Efficiency Performance
b)
a)
c)
d)
Water Efficiency (WE)
Heat Island Reduction-Roof
Light Pollution Reduction
LEED Certified Design and Construction
Building Exterior and Hardscape Management Plan
Integrated Pest Management, Erosion Control, and Landscape Management Plan
Alternative Commuting Transportation
Site Development-Protect or Restore Open Habitat
Stormwater Quantity Control
Heat Island Reduction-Nonroof
Existing Building Commissioning-Investigation and Analysis
Existing Building Commissioning-Implementation
Energy and Atmosphere (EA)
Existing Building Commissioning-Ongoing Commissioning
Performance Measurement-Building Automation System
Performance Measurement-System Level Metering
On-site and Off-site Renewable Energy
Enhanced Refrigerant Management
Emissions Reduction Reporting
LEED Divisions and Items
a)
Sustainable Sites (SS)
$154,961
60 PointsTotal Achieved Credits
Total Cost of Achieved Credits

E-34
Figure 165. Results of the DST for minimizing upgrade costs for achieving
Gold level in the LEED-EB rating system IQ, IO, and RP divisions.
1 1 X $0.0 1
2 1 X $10,200.0 1
3 None $0.0 0
4 None $0.0 0
5 1 X $0.0 1
6 None $0.0 0
7 None $0.0 0
8 None $0.0 0
9 1 X $0.0 1
1.1 None $0.0 0
1.2 None $0.0 0
1.3 1 X $1,400.0 1
1.4 1 X $90.0 1
1.5 None $0.0 0
2.1 None $0.0 0
2.2 1 X $200.0 1
2.3 None $0.0 0
2.4 None $0.0 0
3.1 1 X $0.0 1
3.2 None $0.0 0
3.3 1 X $0.0 1
3.4 1 X $1,600.0 1
3.5 1 X $1,100.0 1
3.6 1 X $0.0 1
1 N/A $0.0 0Innovation in operation None $0.0 0Exemplary performance None $0.0 0Pilot credit None $0.0 0
2 1 X $0.0 1
3 1 X $0.0 1
1Regional credit # 1 SSc2 X N/A 1Regional credit # 2 SSc4(25%) N/A 0Regional credit # 3 WEc3(100%) X N/A 1Regional credit # 4 MRc6 N/A 0Regional credit # 5 IEQc1.3 X N/A 1Regional credit # 6 IEQc1.4 X N/A 1
Sustainable Purchasing-Ongoing Consumables
Sustainable Purchasing-Durable Goods
Materials and Resources (MR)
Sustainable Purchasing-Facility Alterations and Additions
Sustainable Purchasing-Reduced Mercury in Lamps
Sustainable Purchasing-Food
Solid Waste Management-Waste Stream Audit
Solid Waste Management-Ongoing Consumables
Solid Waste Management-Durable Goods
Solid Waste Management-Facility Alterations and Additions
Indoor Air Quality Best Management Practices-Indoor Air Quality Management Program
Indoor Air Quality Best Management Practices-Outdoor Air Delivery Monitoring Indoor Air Quality Best Management Practice-Increased Ventilation
Indoor Environmental Quality (IEQ)
Green Cleaning-Sustainable Cleaning Equipment
Indoor Air Quality Best Management Practices-Reduce Particulates in Air Distribution
Indoor Air Quality Best Management Practices-Indoor Air Quality Management for Facility Alterations and Additions
Occupant Comfort-Occupant Survey
Controllability of Systems-Lighting
Occupant Comfort-Thermal Comfort Monitoring
a)
b)
b)
a)
Regional Priority
Green Cleaning-Indoor Chemical and Pollutant Source Control
Green Cleaning-Indoor Integrated Pest Management
Innovation in Operations
Innovation in Operations (IO)
Daylight and Views
Green Cleaning-High Performance Cleaning Program
Green Cleaning-Custodial Effectiveness Assessment
Green Cleaning-Purchase of Sustainable Cleaning Products and Materials
c)
d)
e)
f)
c)
Regional Priority (RP)
LEED Accredited Professional
Documenting Sustainable Building Cost Impacts
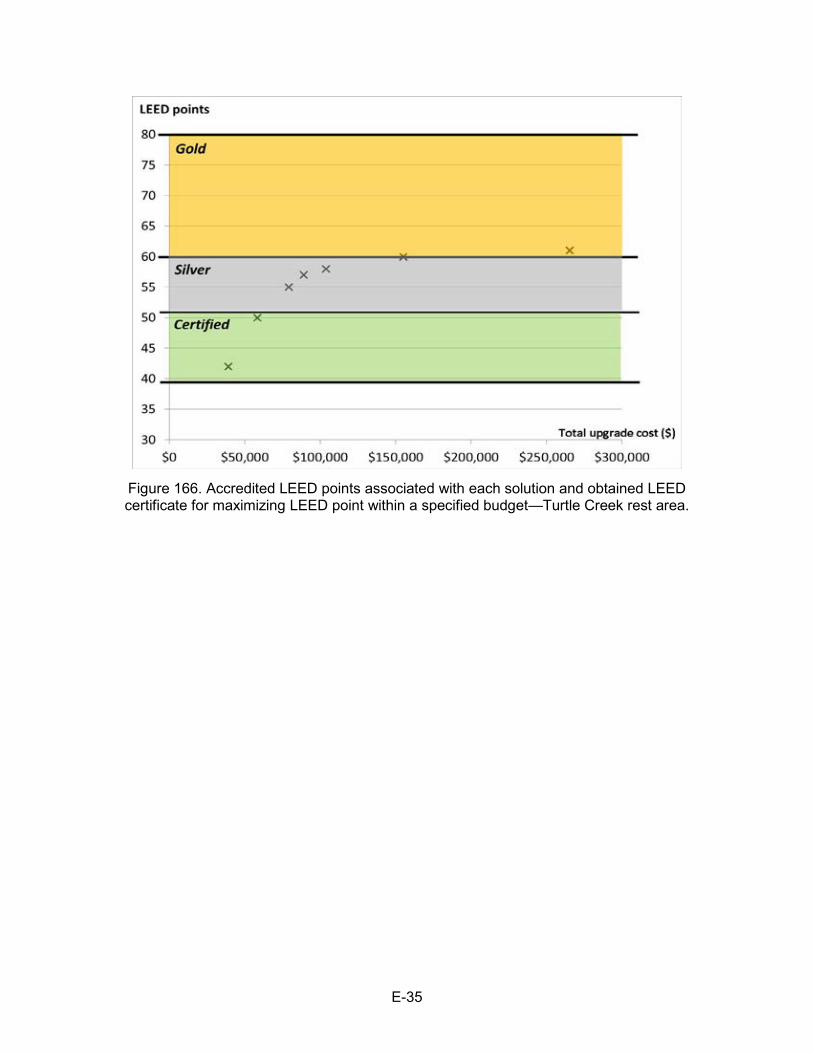
E-35
Figure 166. Accredited LEED points associated with each solution and obtained LEED certificate for maximizing LEED point within a specified budget—Turtle Creek rest area.

F-1
APPENDIX F RECOMMENDATIONS FOR SELECTED REST AREAS
F.1 CUMBERLAND ROAD REST AREA
The Cumberland Road rest area was analyzed to investigate the feasibility of implementing various green building measures to reduce its energy and water consumption as well as environmental impacts. This study of green building measures accounted for energy-efficient lighting such as energy-efficient fluorescent bulbs, LED, and induction lighting; energy-efficient HVAC systems such as geothermal heat pumps and high-efficiency air-source heat pumps; motion sensors for interior lighting, vending machines, and exhaust fans; energy-efficient hand dryers; solar practices such as solar daylight tubes, grid-connected photovoltaic systems, and solar water heaters; vestibule entrances, thermal pane glass for door and windows, and water-efficient faucets, toilets, and urinals. The results of this analysis provide a list of promising Best Management Practices (BMPs) for Cumberland Road rest area that includes: fluorescent T8 bulbs for interior lighting, motion-activated lighting for restrooms, vending occupancy controls, motion sensors for exhaust fans, geothermal heat pump along with desuperheater, energy-efficient hand dryer, solar daylight tubes for restrooms, photovoltaic system with 6.8KW capacity, setting back HVAC at night, and water-conserving fixtures. The recommendations of implementing this list of BMPs are listed in Table 201 and Table 202. The implementation of this list of BMPs can reduce the energy consumption of the rest area building up to 35%.
Table 201. Recommendations for Interior and Exterior Lighting in
Cumberland Road Rest Area Building
Green-Friendly Measure
Recommendations Estimated Initial Cost
Energy/ Water
Reduction
Payback Period
(yr)
Interior lighting
Replace existing T12 lamps with energy-efficient T8 bulbs (28W and 25W) while maintaining the same lumens output levels as discussed previously in Appendix D. This light replacement will reduce electricity consumption for interior lighting.
$793.5 1.8% Immediate payback period
Motion sensors
Install motion sensors for lighting in the men’s and women’s restrooms. These motion sensors will reduce electricity consumption of interior lighting.
$871 1.4% 2.7
Solar daylight tubes
Study the feasibility of installing solar daylight tubes in the restrooms and lobby to provide lighting during the daytime. This can provide savings in electricity consumption; however, it can cause dissipation of energy for space heating and cooling, which leads to a long payback period. A detailed analysis of this potential replacement was discussed previously in Appendix D.
$7,735 1.5% 17.9

F-2
Table 202. Recommendations for Vending Machines, Exhaust Fans, Hand Dryers, HVAC System, Water Heater, PV System, and Water Fixtures in Cumberland Road Rest Area Building
Green-Friendly Measure
Recommendations Estimated Initial Cost
Energy/ Water
Reduction
Payback Period
(yr)
Vending area
Install motion sensors for lighting in the vending area and lighting of vending machines. These sensors will reduce electricity consumption of lighting in the vending area and vending machines.
$339 1.5% 1.0
Exhaust fans
Install motion sensors for exhaust fans in the men’s and women’s restrooms. These motion sensors will allow exhaust fans to operate only when the restrooms are occupied, which will reduce the unnecessary dissipation of energy for space heating and cooling when the restrooms are unoccupied.
$542 4.1% 0.6
Hand dryers
Replace existing hand dryers in the women‘s and men‘s restrooms with more energy-efficient units such as Blast hand dryers.
$1,092 2.2% 2.2
HVAC system
Consider the feasibility of replacing the existing HVAC system with geothermal heat pump. The rest area building is used 24/7, and accordingly it can benefit from the use of energy-efficient HVAC system such as geothermal heat pump to reduce the energy consumption for space heating and cooling.
$31,570 11.7% 9.5
Water heater
Install desuperheater along with the geothermal heat pump to provide hot water during the summer and to reduce the energy consumption of water heaters.
$1,600 3.2% 2.3
HVAC settings
Adjust the settings of the HVAC thermostat to allow the HVAC system to set back at night during the low visitation periods.
$200 2.3% 0.4
Water fixtures
Replace existing water fixtures (toilets and urinals) with water-efficient units. A detailed analysis of this potential replacement is provided in Appendix D.
$6,963 N.A. N.A.
PV system
Investigate the feasibility of installing grid-connected photovoltaic system with a capacity of 6.8KW to generate 5% of total electricity consumed at the rest area site. It should be noted that PV systems can generate renewable electricity on-site for the rest area; however, the payback period for this system is relatively long.
$29,191 5.0% 25.9
Code Blue emergency phone
Consider the possibility of replacing existing bulbs in the Code Blue emergency phones with LED lights to reduce electricity consumption while considering the impact of this replacement on their visibility at night.
$500 %1.8 1.25
All measures
All the above energy measures were modeled in the energy simulation software to consider all interactions among the measures and to estimate the overall reduction in energy consumption.
$81,397 35% 9.4
The research team also developed a practical decision support tool (DST) that can be used to optimize the upgrade decisions for Illinois public buildings with two primary objectives (1) minimize the total upgrade cost to accomplish a desired level of LEED-EB certification; and (2) maximize the number of accredited LEED-EB points for a specified budget. IDOT decision

F-3
makers can use the developed decision support tool (DST) in this research study to investigate the potential for achieving a specified LEED certification level (e.g. silver or gold) with the lowest possible upgrade cost or earning the maximum number of LEED credit points within a specified budget.
F.2 TURTLE CREEK REST AREA
The Turtle Creek rest area was analyzed to investigate the feasibility of implementing various green building measures to reduce its energy and water consumption as well as to reduce its environmental impacts. This study of green building measures accounted for energy-efficient lighting such as energy-efficient fluorescent bulbs, LED, and induction lighting; energy-efficient HVAC systems such as geothermal heat pumps and high-efficiency air-source heat pumps; motion sensors for interior lighting, vending machines, and exhaust fans; energy-efficient hand dryers; solar practices such as solar daylight tubes, grid-connected photovoltaic systems, and solar water heaters; vestibule entrances, thermal pane glass for door and windows, and water-efficient faucets, toilets, and urinals. The results of this analysis provide a list of promising Best Management Practices (BMPs) for Turtle Creek rest area that includes: fluorescent T8 bulbs for interior lighting, motion-activated lighting for restrooms, vending occupancy controls, motion sensors for exhaust fans, geothermal heat pump along with desuperheater, energy-efficient hand dryer, solar daylight tubes for restrooms, photovoltaic system with 8.2KW capacity, setting back HVAC at night, and water-conserving fixtures. The recommendations of implementing this list of BMPs are listed in Table 203 and Table 204. The implementation of this list of BMPs can reduce the energy consumption of the rest area building up to 47%.
Table 203. Recommendations for Interior and Exterior Lighting
in Turtle Creek Rest Area Building
Green-Friendly Measure
Recommendations Estimated Initial Cost
Energy/ Water
Reduction
Payback Period
(yr)
Interior lighting
Replace existing linear and U-shaped fluorescent T12 lamps with reduced wattage T8 (28W, 25W, and 17W) as discussed previously in Appendix D. This light replacement will reduce electricity consumption of interior lighting.
$1,637 2.6% 1.8
Motion sensors
Install motion sensors for lighting in the men’s and women’s restrooms. These motion sensors will reduce the electricity consumption of interior lighting.
$1,556 3.3% 2.0
Solar daylight tubes
Study the feasibility of installing solar daylight tubes in the restrooms and lobby to provide lighting during the daytime. This can provide savings in electricity consumption; however, it can cause dissipation of energy for space heating and cooling, which leads to a long payback period. A detailed analysis of this potential replacement was discussed previously in Appendix D.
$6,508 1.4% 13.4

F-4
Table 204. Recommendations for Vending Machines, Exhaust Fans, Hand Dryers, HVAC System, Water Heater, PV System, and Water Fixtures in Turtle Creek Rest Area Building
Green-Friendly Measure
Recommendations Estimated Initial Cost
Energy/ Water
Reduction
Payback Period
(yr)
Vending area
Install motion sensors for lighting in the vending area and lighting of vending machines, these sensors will reduce electricity consumption of lighting the vending area and vending machines.
$339 1.1% 1.2
Exhaust fans
Install motion sensors for exhaust fans in the men’s and women’s restrooms, these motion sensors will allow the exhaust fans to operate only when the restrooms are occupied, this will reduce the unnecessary dissipation of energy for space heating and cooling when the restrooms are unoccupied.
$1,303 9.3% 0.6
Hand dryers
Replace existing hand dryers in women‘s and men‘s restrooms with more energy-efficient units such as Blast hand dryers
$2,184 2.7% 3.3
HVAC system
Consider the feasibility of replacing the existing HVAC system with geothermal heat pump. The rest area building is used 24/7, and accordingly it can benefit from the use of energy-efficient HVAC system such as geothermal heat pump to reduce the energy consumption for space heating and cooling.
$62,320 26.0% 5.5
Water heater
Install desuperheater along with the geothermal heat pump to provide hot water during the summer and to reduce the energy consumption of water heaters.
$1,600 1.2% 5.1
HVAC settings
Adjust the settings of the HVAC thermostat to allow the HVAC system to set back at night during the low visitation periods.
$0 0.4% Immediat
e payback
Water fixtures
Replace existing water fixtures (toilets and urinals) with water-efficient units. A detailed analysis of this potential replacement is provided in Appendix D.
$13,927 0.6% N.A.
PV system
Investigate the feasibility of installing grid-connected photovoltaic system with a capacity of 8.2KW to generate 6% of total electricity consumed at the rest area site. It should be noted that PV systems can generate renewable electricity on-site for the rest area; however, the payback period for this system is relatively long.
$33,900 5.3% 26.6
Code Blue emergency phone
Consider the possibility of replacing existing bulbs in the Code Blue emergency phones with LED lights to reduce electricity consumption while considering the impact of this replacement on their visibility at night.
400 1.3% 1.32
All measures
All the above energy measures were modeled in the energy simulation software to consider all interactions among the measures and to estimate the overall reduction in energy consumption.
$125,674 47% 9.9
The research team also developed a practical decision support tool (DST) that can be used to optimize the upgrade decisions for Illinois public buildings with two primary objectives (1) minimize the total upgrade cost to accomplish a desired level of LEED-EB certification; and (2) maximize the number of accredited LEED-EB points for a specified budget. IDOT decision

F-5
makers can use the developed decision support tool (DST) in this research study to investigate the potential for achieving a specified LEED certification level (e.g. silver or gold) with the lowest possible upgrade cost or earning the maximum number of LEED credit points within a specified budget.
F.3 GREAT SAUK TRIAL REST AREA
The Great Sauk Trail rest area was analyzed to investigate the feasibility of implementing various green building measures to reduce its energy and water consumption as well as to reduce its environmental impacts. This study of green building measures accounted for energy-efficient lighting such as energy-efficient fluorescent bulbs, LED, and induction lighting; energy-efficient HVAC systems such as geothermal heat pumps and high-efficiency air-source heat pumps; motion sensors for interior lighting, vending machines, and exhaust fans; energy-efficient hand dryers; solar practices such as solar daylight tubes, grid-connected photovoltaic systems, and solar water heaters; vestibule entrances, thermal pane glass for door and windows, and water-efficient faucets, toilets, and urinals. The results of this analysis provide a list of promising Best Management Practices (BMPs) for Great Sauk Trail rest area that includes: fluorescent T8 and CFL bulbs for interior lighting, motion-activated lighting for restrooms, vending occupancy controls, motion sensors for exhaust fans, geothermal heat pump along with desuperheater, vestibule entrance, energy-efficient hand dryer, solar daylight tubes for restrooms, photovoltaic system with 7.8KW capacity, setting back HVAC at night, and water-conserving fixtures. Great Sauk Trail rest area consists of two identical buildings to serve the east and west sides of I-80. The recommendations of implementing this list of BMPs are listed in Table 205 and Table 206. This list of recommendations can be implemented for each bound of the rest area buildings. The implementation of this list of BMPs can reduce the total energy consumption of the rest area building up to 39.3%.
Table 205. Recommendations for Interior and Exterior
Lighting in Great Sauk Trail Rest Area Buildings
Green-Friendly Measure
Recommendations Estimated Initial Cost
Energy/ Water
Reduction
Payback Period
(yr)
Interior lighting
Replace existing linear fluorescent T12 and halogen flood lighting lamps with reduced wattage T8 (58W and 28W) and CFL (18W) bulbs respectively as discussed previously in Appendix D. This light replacement will reduce electricity consumption for interior lighting.
$1,632 3.5% 0.5
Motion sensors
Install motion sensors for lighting in the men’s and women’s restrooms. These motion sensors will reduce the electricity consumption of interior lighting.
$1,242 2.2% 1.8
Solar daylight tubes
Study the feasibility of installing solar daylight tubes in the restrooms and lobby to provide lighting during the daytime. This can provide savings in electricity consumption; however, it can cause dissipation of energy for space heating and cooling, which leads to a long payback period. A detailed analysis of this potential replacement was discussed previously in Appendix D.
$4,886 1.0% 12.2
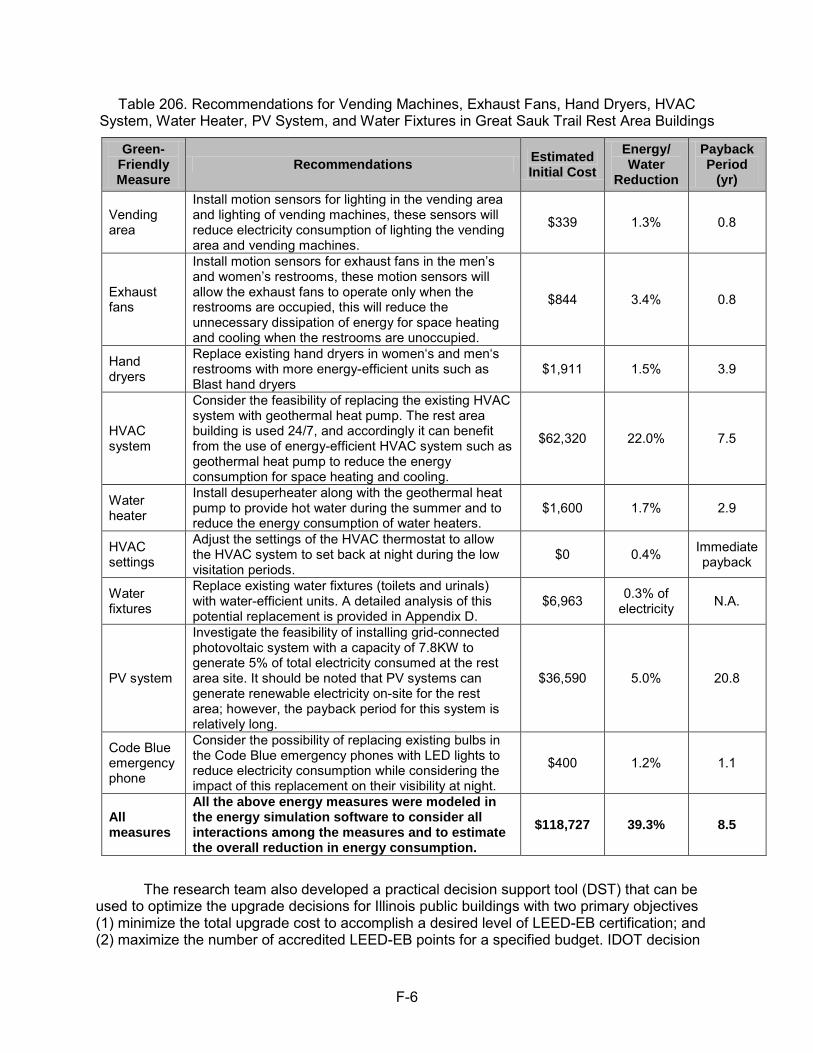
F-6
Table 206. Recommendations for Vending Machines, Exhaust Fans, Hand Dryers, HVAC System, Water Heater, PV System, and Water Fixtures in Great Sauk Trail Rest Area Buildings
Green-Friendly Measure
Recommendations Estimated Initial Cost
Energy/ Water
Reduction
Payback Period
(yr)
Vending area
Install motion sensors for lighting in the vending area and lighting of vending machines, these sensors will reduce electricity consumption of lighting the vending area and vending machines.
$339 1.3% 0.8
Exhaust fans
Install motion sensors for exhaust fans in the men’s and women’s restrooms, these motion sensors will allow the exhaust fans to operate only when the restrooms are occupied, this will reduce the unnecessary dissipation of energy for space heating and cooling when the restrooms are unoccupied.
$844 3.4% 0.8
Hand dryers
Replace existing hand dryers in women‘s and men‘s restrooms with more energy-efficient units such as Blast hand dryers
$1,911 1.5% 3.9
HVAC system
Consider the feasibility of replacing the existing HVAC system with geothermal heat pump. The rest area building is used 24/7, and accordingly it can benefit from the use of energy-efficient HVAC system such as geothermal heat pump to reduce the energy consumption for space heating and cooling.
$62,320 22.0% 7.5
Water heater
Install desuperheater along with the geothermal heat pump to provide hot water during the summer and to reduce the energy consumption of water heaters.
$1,600 1.7% 2.9
HVAC settings
Adjust the settings of the HVAC thermostat to allow the HVAC system to set back at night during the low visitation periods.
$0 0.4% Immediate payback
Water fixtures
Replace existing water fixtures (toilets and urinals) with water-efficient units. A detailed analysis of this potential replacement is provided in Appendix D.
$6,963 0.3% of electricity N.A.
PV system
Investigate the feasibility of installing grid-connected photovoltaic system with a capacity of 7.8KW to generate 5% of total electricity consumed at the rest area site. It should be noted that PV systems can generate renewable electricity on-site for the rest area; however, the payback period for this system is relatively long.
$36,590 5.0% 20.8
Code Blue emergency phone
Consider the possibility of replacing existing bulbs in the Code Blue emergency phones with LED lights to reduce electricity consumption while considering the impact of this replacement on their visibility at night.
$400 1.2% 1.1
All measures
All the above energy measures were modeled in the energy simulation software to consider all interactions among the measures and to estimate the overall reduction in energy consumption.
$118,727 39.3% 8.5
The research team also developed a practical decision support tool (DST) that can be used to optimize the upgrade decisions for Illinois public buildings with two primary objectives (1) minimize the total upgrade cost to accomplish a desired level of LEED-EB certification; and (2) maximize the number of accredited LEED-EB points for a specified budget. IDOT decision

F-7
makers can use the developed decision support tool (DST) in this research study to investigate the potential for achieving a specified LEED certification level (e.g. silver or gold) with the lowest possible upgrade cost or earning the maximum number of LEED credit points within a specified budget.
F.4 WILLOW CREEK REST AREA
Willow Creek rest area was analyzed to investigate the feasibility of implementing various green building measures to reduce its energy and water consumption as well as to reduce its environmental impacts. This study of green building measures accounted for energy-efficient lighting such as energy-efficient fluorescent bulbs, LED, and induction lighting; energy-efficient HVAC systems such as geothermal heat pumps and high-efficiency air-source heat pumps; motion sensors for interior lighting, vending machines, and exhaust fans; energy-efficient hand dryers; solar practices such as solar daylight tubes, grid-connected photovoltaic systems, and solar water heaters; vestibule entrances, thermal pane glass for door and windows, and water-efficient faucets, toilets, and urinals. The results of this analysis provide a list of promising Best Management Practices (BMPs) for Willow Creek rest area that includes: fluorescent T8, CFL, and induction light bulbs for interior lighting, motion-activated lighting for restrooms, vending occupancy controls, motion sensors for exhaust fans, geothermal heat pump along with desuperheater, vestibule entrance, energy-efficient hand dryer, solar daylight tubes for restrooms, photovoltaic system with, setting back HVAC at night, and water-conserving fixtures. The recommendations of implementing the developed list of BMPs for Northbound of Willow Creek rest area are summarized in Tables 207 and 209 Similarly, the recommendations of implementing the developed list of BMPs for Southbound of Willow Creek rest area are summarized in Tables 209 and 210. These two lists of BMPs can reduce the total energy consumption of the rest area buildings up to 39.1% and 33.45% for Northbound and Southbound buildings respectively.
Table 207. Recommendations for Interior and Exterior
Lighting in Northbound Willow Creek Rest Area Building Green-
Friendly Measure
Recommendations Estimated Initial Cost
Energy/ Water
Reduction
Payback Period
(yr)
Interior lighting
Replace existing linear and U-shaped fluorescent T12 lamps with reduced wattage T8 (28W and 25W as discussed previously in Appendix D. This replacement will reduce electricity consumption for interior lighting. Investigate the feasibility of replacing existing HPS and MH bulbs with reduced wattage CFL (42W and 27W), and induction light bulbs (161W) respectively, while considering the impact of this replacement on lumens output levels in the corridors and lobby of the northbound building.
$9,984 8.8% 3.7
Motion sensors
Install motion sensors for lighting in the men’s and women’s restrooms. These motion sensors will reduce the electricity consumption of interior lighting.
$1,556 6.7% 0.8

F-8
Table 208. Recommendations for Vending Machines, Exhaust Fans, Hand Dryers, HVAC System, Water Heater, PV System, and Water Fixtures in Northbound
Willow Creek Rest Area Building
Green-Friendly Measure
Recommendations Estimated Initial Cost
Energy/ Water
Reduction
Payback Period
(yr)
Vending area
Install motion sensors for lighting in the vending area and lighting of vending machines, these sensors will reduce electricity consumption of lighting the vending area and vending machines.
$451 1.1% 1.5
Exhaust fans
Install motion sensors for exhaust fans in the men’s and women’s restrooms, these motion sensors will allow the exhaust fans to operate only when the restrooms are occupied, this will reduce the unnecessary dissipation of energy for space heating and cooling when the restrooms are unoccupied.
$2,606 2.2% 4.0
Hand dryers
Replace existing hand dryers in women‘s and men‘s restrooms with more energy-efficient units such as Blast hand dryers
$2,457 1.5% 5.6
HVAC system
Consider the feasibility of replacing the existing HVAC system with geothermal heat pump. The rest area building is used 24/7, and accordingly it can benefit from the use of energy-efficient HVAC system such as geothermal heat pump to reduce the energy consumption for space heating and cooling.
$70,520 8.2% 13.4
Water heater
Install desuperheater along with the geothermal heat pump to provide hot water during the summer and to reduce the energy consumption of water heaters.
$1,600 0.6% 8.4
HVAC settings
Adjust the settings of the HVAC thermostat to allow the HVAC system to set back at night during the low visitation periods.
$0 1.8% Immediat
e payback
Water fixtures
Replace existing water fixtures (toilets and urinals) with water-efficient units. A detailed analysis of this potential replacement is provided in Appendix D.
$3,970 0.1% of electricity N.A.
PV system
Investigate the feasibility of installing grid-connected photovoltaic system with a capacity of 17.4KW to generate 9.9% of total electricity consumed at the rest area site. It should be noted that PV systems can generate renewable electricity on-site for the rest area; however, the payback period for this system is relatively long.
$71,977 9.3% 27.0
Code Blue emergency phone
Consider the possibility of replacing existing bulbs in the Code Blue emergency phones with LED lights to reduce electricity consumption while considering the impact of this replacement on their visibility at night.
$300 0.8% 1.4
All measures
All the above energy measures were modeled in the energy simulation software to consider all interactions among the measures and to estimate the overall reduction in energy consumption.
$165,422 39.1% 12.3

F-9
Table 209. Recommendations for Interior and Exterior Lighting in Southbound Willow Creek Rest Area Building
Green-Friendly Measure
Recommendations Estimated Initial Cost
Energy/ Water
Reduction Payback
Period (yr)
Interior lighting
Replace existing linear and U-shaped fluorescent T12 lamps with reduced wattage T8 (28W and 25W as discussed previously in Appendix D. This light replacement will reduce electricity consumption for interior lighting. Investigate the feasibility of replacing existing HPS and MH bulbs with reduced wattage CFL (42W and 27W), and induction light bulbs (161W), respectively, while considering the impact of this replacement on lumens output levels in the corridors and lobby of the southbound building.
$13,387 7.6% 3.2
Motion sensors
Install motion sensors for lighting in the men’s and women’s restrooms. These motion sensors will reduce the electricity consumption of interior lighting.
$3,112 6.0% 1.1
The research team also developed a practical decision support tool (DST) that can be used to optimize the upgrade decisions for Illinois public buildings with two primary objectives (1) minimize the total upgrade cost to accomplish a desired level of LEED-EB certification; and (2) maximize the number of accredited LEED-EB points for a specified budget. IDOT decision makers can use the developed decision support tool (DST) in this research study to investigate the potential for achieving a specified LEED certification level (e.g. silver or gold) with the lowest possible upgrade cost or earning the maximum number of LEED credit points within a specified budget.

F-10
Table 210. Recommendations for Vending Machines, Exhaust Fans, Hand Dryers, HVAC System, Water Heater, PV System, and Water
Fixtures in Southbound Willow Creek Rest Area Building
Green-Friendly Measure
Recommendations Estimated Initial Cost
Energy/ Water
Reduction
Payback Period
(yr)
Vending area
Install motion sensors for lighting in the vending area and lighting of vending machines, these sensors will reduce electricity consumption of lighting the vending area and vending machines.
$451 0.8% 1.1
Exhaust fans
Install motion sensors for exhaust fans in the men’s and women’s restrooms, these motion sensors will allow the exhaust fans to operate only when the restrooms are occupied, this will reduce the unnecessary dissipation of energy for space heating and cooling when the restrooms are unoccupied.
$2,606 2.7% 2.0
Hand dryers
Replace existing hand dryers in women‘s and men‘s restrooms with more energy-efficient units such as Blast hand dryers
$4,914 0.9% 10.4
HVAC system
Investigate the feasibility of replacing the existing HVAC system with geothermal heat pump, the rest area building is being used 24/7, which promotes the use of energy-efficient HVAC system such as geothermal heat pump to reduce the energy consumption for space heating and cooling.
$111,520 9.2% 12.2
Water heater
Install desuperheater along with the geothermal heat pump to provide hot water during the summer and to reduce the energy consumption of water heaters.
$1,850 0.3% 11.5
HVAC settings
Adjust the settings of the HVAC thermostat to allow the HVAC system to set back at night during the low visitation periods.
$0 0.8% Immediat
e payback
Water fixtures
Replace existing water fixtures (toilets and urinals) with water-efficient units. A detailed analysis of this potential replacement is provided in Appendix D.
$5,294 0.1% of electricity N.A.
PV system
Investigate the feasibility of installing grid-connected photovoltaic system with a capacity of 17.9KW to generate 6% of total electricity consumed at the rest area site. It should be noted that PV systems can generate renewable electricity on-site for the rest area; however, the payback period for this system is relatively long.
$73,836 5.6% 26.7
Code Blue emergency phone
Consider the possibility of replacing existing bulbs in the Code Blue emergency phones with LED lights to reduce electricity consumption while considering the impact of this replacement on their visibility at night.
$400 0.6% 1.4
All measures
All the above energy measures were modeled in the energy simulation software to consider all interactions among the measures and to estimate the overall reduction in energy consumption.
$217,370 33.45% 11.5

F-11
F.5 MACKINAW DELLS REST AREA
The Mackinaw Dells rest area was analyzed to investigate the feasibility of implementing various green building measures to reduce its energy and water consumption as well as to reduce its environmental impacts. This study of green building measures accounted for energy-efficient lighting such as energy-efficient fluorescent bulbs, LED, and induction lighting; energy-efficient HVAC systems such as geothermal heat pumps and high-efficiency air-source heat pumps; motion sensors for interior lighting, vending machines, and exhaust fans; energy-efficient hand dryers; solar practices such as solar daylight tubes, grid-connected photovoltaic systems, and solar water heaters; vestibule entrances, thermal pane glass for door and windows, and water-efficient faucets, toilets, and urinals. The results of this analysis provide a list of promising Best Management Practices (BMPs) for Mackinaw Dells rest area that includes: fluorescent T8 bulbs for interior lighting, motion-activated lighting for restrooms, vending occupancy controls, motion sensors for exhaust fans, geothermal heat pump along with desuperheater, vestibule entrance, energy-efficient hand dryer, solar daylight tubes for restrooms, photovoltaic system with 7.8KW capacity, setting back HVAC at night, and water-conserving fixtures. Mackinaw Dells rest area consists of two identical buildings to serve the north and south bounds of I-74. The recommendations of implementing the list of BMPs are listed in Table 211and Table 212. This list of recommendations can be implemented for each bound of the rest area buildings. The implementation of this list of BMPs can reduce the total energy consumption of the rest area building up to 42.3%.
Table 211. Recommendations for Interior and Exterior
Lighting in Mackinaw Dells Rest Area Buildings
Green-Friendly Measure
Recommendations Estimated Initial Cost
Energy/ Water
Reduction
Payback Period
(yr)
Interior lighting
Replace existing linear and U-shaped fluorescent T12 and incandescent lamps with reduced wattage T8 (28W and 25W) and CFL (30W) respectively as discussed previously in Appendix D. This light replacement will reduce electricity consumption for interior lighting.
$1,872 4.5% 1.3
Motion sensors
Install motion sensors for lighting in the men’s and women’s restrooms. These motion sensors will reduce the electricity consumption of interior lighting.
$1,057 1.0% 3.7
The research team also developed a practical decision support tool (DST) that can be used to optimize the upgrade decisions for Illinois public buildings with two primary objectives (1) minimize the total upgrade cost to accomplish a desired level of LEED-EB certification; and (2) maximize the number of accredited LEED-EB points for a specified budget. IDOT decision makers can use the developed decision support tool (DST) in this research study to investigate the potential for achieving a specified LEED certification level (e.g. silver or gold) with the lowest possible upgrade cost or earning the maximum number of LEED credit points within a specified budget.

F-12
Table 212. Recommendations for Vending Machines, Exhaust Fans, Hand Dryers, HVAC System, Water Heater, PV System, and Water Fixtures in Mackinaw Dells Rest Area Buildings
Green-Friendly Measure
Recommendations Estimated Initial Cost
Energy/ Water
Reduction
Payback Period
(yr)
Vending area
Install motion sensors for lighting in the vending area and lighting of vending machines, these sensors will reduce electricity consumption of lighting the vending area and vending machines.
$339 0.9% 1.3
Hand dryers
Replace existing hand dryers in women‘s and men‘s restrooms with more energy-efficient units such as Blast hand dryers
$1,638 2.4% 2.5
HVAC system
Consider the feasibility of replacing the existing HVAC system with geothermal heat pump. The rest area building is used 24/7, and accordingly it can benefit from the use of energy-efficient HVAC system such as geothermal heat pump to reduce the energy consumption for space heating and cooling.
$41,820 23.1% 5.7
Water heater
Install desuperheater along with the geothermal heat pump to provide hot water during the summer and to reduce the energy consumption of water heaters.
$1,600 3.0% 1.9
Water fixtures
Replace existing water fixtures (toilets and urinals) with water-efficient units. A detailed analysis of this potential replacement is provided in Appendix D.
$1,323 N.A. N.A.
PV system
Investigate the feasibility of installing grid-connected photovoltaic system with a capacity of 7.8KW to generate 5% of total electricity consumed at the rest area site. It should be noted that PV systems can generate renewable electricity on-site for the rest area; however, the payback period for this system is relatively long.
$34,959 5.1% 24.1
Code Blue emergency phone
Consider the possibility of replacing existing bulbs in the Code Blue emergency phones with LED lights to reduce electricity consumption while considering the impact of this replacement on their visibility at night.
$300 0.9% 1.2
All measures
All the above energy measures were modeled in the energy simulation software to consider all interactions among the measures and to estimate the overall reduction in energy consumption.
$84,908 42.3% 6.9