Green Communities Designation and Grant · PDF fileGreen Communities Designation and Grant...
40
October 2015
Transcript of Green Communities Designation and Grant · PDF fileGreen Communities Designation and Grant...

October 2015

Green Communities Designation and Grant Program i
Table of Contents
Executive Summary ................................................................................................................. 1
Program Background .............................................................................................................. 1 Criterion-Specific Background ................................................................................................ 2 Key Findings from 2014 Annual Reports ................................................................................ 3
CRITERION-SPECIFIC REPORT CARD ................................................................................... 5 Criteria 1 & 2: Development Potential ..................................................................................... 5 Criterion 3: Energy Baseline and Savings ............................................................................... 6 Criterion 4: FEVs purchased ..................................................................................................10 Criterion 5: Minimize life-cycle energy costs for new construction ..........................................11
COMMUNITY SPOTLIGHTS ....................................................................................................11 Arlington ................................................................................................................................11 Belchertown ...........................................................................................................................12 Cambridge .............................................................................................................................13 Natick ....................................................................................................................................13 Palmer ...................................................................................................................................14 Springfield .............................................................................................................................15 Sutton ....................................................................................................................................15
CONCLUSION ..........................................................................................................................16
List of Figures Figure 1. Cumulative Energy Savings and GHG Reductions by Year of ERP ......................... 7 Figure 2. Comparing Projected to Realized Energy Savings by Category of Usage ................ 8
List of Tables
Table 1. Communities with Projects Sited in their Criterion 1 Designated Zone ...................... 5 Table 2. Total Cost and Savings from Energy Efficiency Projects Reported by 99 Green
Communities in 2013 Annual Reports for FY2008-FY2014............................................. 6 Table 3. Breakdown of Green Communities’ ECMs by Type................................................... 9 Table 4. Year 5 and Beyond: Green Communities Achieving Their 20 Percent Goals ............ 9 Table A-1. List of Communities that Submitted a 2014 Annual Report ...................................17 Table A-3. Criterion 3: Energy Usage and Reductions by Category for Baseline Year and
Most Recent Data Year .................................................................................................21 Table A-4: Criterion 4 2014 Vehicle Fleet Additions ...............................................................29 Table A-5. Criterion 5: Projects Built to the Stretch Code through 2014 .................................32 Table A-5. Criterion 5: Projects Built to the Stretch Code through 2014 .................................32 Table A-6. Criterion 5: Total Number of Projects with HERS Below 55 for 2013 and 2014 ....35 Table A-6. Criterion 5: Total Number of Projects with HERS Below 55 for 2013 and 2014 ....35

Green Communities Designation and Grant Program 1
Executive Summary
As part of the Massachusetts Department of Energy
Resources’ (DOER) mission to accelerate the adoption of
energy efficiency and clean energy technologies in the
Commonwealth, the Green Communities Designation and
Grant Program (the Program) provides qualifying
municipalities with financial and technical assistance.
DOER engaged the consulting firm ICF International (ICF) to
provide support to the Program’s annual report review
process and evaluate the Program’s progress. This report
provides an update to the 2013 Progress Report, touching on
key metrics from the annual reports submitted by Green
Communities. ICF conducted a review of each of the ninety-
nine 2014 annual reports submitted to DOER by participating
Green Communities and updated the metrics for each
designation criterion that could be used to benchmark the Program’s success. This report also provides a
brief look into the experiences of seven communities that have reached the goal of reducing their
municipal energy use by 20 percent after five years, focusing on activities and strategies that enabled
them to accomplish their goals.
Program Background
Following the passage of the Green Communities Act in 2008, DOER launched the Green Communities
Designation and Grant Program in 2009. To achieve designation as a Green Community, municipalities
must meet five criteria, as outlined in the statute:
1. Provide as-of-right siting in designated locations for renewable/alternative energy
generation, or research and development, or manufacturing facilities
2. Adopt an expedited application and permit process for as-of-right renewable/alternative
energy facilities
3. Establish an energy use baseline and develop a plan to reduce municipal energy use by
20 percent after five years
4. Purchase only fuel-efficient vehicles
5. Set requirements to minimize life-cycle energy costs for new construction. (The
recommended way to meet these requirements is to adopt the Board of Building
Regulations and Standards (BBRS) Stretch Code.)
Green Communities are eligible for funding to support clean energy projects. Funding is provided from
proceeds of carbon allowance auctions under the Regional Greenhouse Gas Initiative (RGGI) and
Alternative Compliance Payments (ACP) made by electricity suppliers that do not meet their statutory
Renewable Portfolio Standard obligation to purchase a sufficient percentage of renewable energy.
Upon designation, a community is awarded a base grant of $125,000, plus an adder based on population
and per capita income and a bonus of $10,000 if it met Criterion 1 through zoning for
renewable/alternative energy generation (as opposed to renewable/alternative energy manufacturing or
research and development (R&D), which are also options). Designation grants are capped at $1,000,000.

Green Communities Designation and Grant Program 2
Once all previous funding has been spent and all
required reporting is complete, a designated Green
Community may apply for competitive grants. The
total amount of competitive awards depends on
available funds and the number of applications. The
annual competitive grant program was first offered
in March 2012 and has thus far offered annual
grants of up to $250,000 per successful applicant.
Communities typically combine Program
designation and competitive grants with Mass
Save® incentives and other funding to complete
their energy projects.
The Commonwealth’s first 35 Green Communities
received designation in 2010. There have been
eight designation rounds since the Program
originated, and there are currently 136 participating
municipalities. More than 50 percent of Massachusetts’ population now lives in a Green Community. As of
July 1, 2015, Green Communities grants totaling close to $40 million were at work in 136 communities
($25.7 million in eight rounds of designation grants, and $13.7 million in three rounds of competitive
grants).
Communities that have been designated for a full year must submit annual reports to the Division to
demonstrate that they continue to adhere to the requirements of all five criteria.
Criterion-Specific Background
Criterion 1 requires that the community provides as-of-right siting in designated locations for
renewable/alternative energy generation, R&D, or manufacturing facilities. Allowable renewable and
alternative energy generation includes on-shore wind, offshore wind, solar photovoltaic, or biomass
combined heat and power (CHP). During the designation process, communities are required to submit a
description of the bylaw or ordinance that identifies designated locations, zoning information, any
applicable local regulations, and other related documentation. For annual reporting, Green Communities
must notify DOER if any changes have been made to the zoning districts identified during designation.
Criterion 2 requires that the community adopt an expedited application and permit process of one year
for clean energy facilities located in the areas designated as-of-right under Criterion 1. For annual
reporting, Green Communities must notify DOER if any projects have applied for approval under the
zoning that qualified them for designation.
Criterion 3 requires that the community establish an energy use baseline and adopt an energy reduction
plan (ERP) to decrease energy use by 20 percent from that baseline after five years of implementing the
ERP. During the designation process, communities establish a baseline year and determine their baseline
energy usage. Most communities use a fiscal year schedule (July 1 through June 30), but some choose
to use the calendar year (January 1 through December 31). DOER allows communities to opt for a
baseline that is up to two years prior to their designation in order to account for energy efficiency work
they completed before applying for designation. For communities that choose to set the baseline a year or
two prior to designation, their first year in the Program may actually be the second or third year of working
on their ERP. Similarly, DOER allows communities that have installed energy conservation measures
(ECM) in their fifth year to achieve the full energy savings from these measures by waiting a year to
Medford is a designated Green Community

Green Communities Designation and Grant Program 3
assess their progress toward the 20 percent energy reduction commitment. Effectively, this means that
some communities will achieve their 20 percent reduction after year six and still be considered to have
met their designation target.
The baseline energy use inventory must include all municipal divisions and departments, including all
municipal buildings, school buildings, municipal and school vehicles, street and traffic lighting, drinking
water and wastewater plants, pumping stations, and open spaces owned by the city or town. For annual
reporting, communities are required to report on their energy use during the past year, any ECMs that
were implemented, and if they used any energy produced by renewable sources. To track their energy
use, communities are encouraged to use MassEnergyInsight (MEI), a municipal energy inventory tool
sponsored by the Green Communities Division and offered to municipalities and other public entities free
of charge.
Criterion 4 requires that the community adopt a policy to purchase only fuel efficient vehicles (FEV) for
municipal use whenever they are available and practicable. Heavy duty vehicles with a gross vehicle
weight rating (GVWR) of more than 8,500 pounds, as well as
police cruisers and passenger and cargo vans, are exempt from
the FEV policy. For annual reporting, communities are required
to submit an updated vehicle inventory of both exempt and non-
exempt vehicles, noting any changes from the previous year.
Criterion 5 requires the community to set requirements to
minimize life-cycle energy costs for new construction. The
recommended way to meet this requirement is by adopting the
Board of Building Regulations and Standards (BBRS) Stretch
Code. A Home Energy Rating System (HERS) assigns a
numerical rating to a newly-constructed residential building
based on its energy efficiency features. To comply with the
Stretch Code, homes greater than 3,000 square feet must have
a HERS score of 65 or less and homes less than 3,000 square
feet must have a HERS score of 70 or less. Commercial
buildings larger than 100,000 square feet must be designed to
use 20 percent less energy relative to ASHRAE 90.1-20071, as
demonstrated through modeling, while those between 5,000 and
100,000 square feet must either adhere to the same approach or include a set of prescriptive
requirements for particular efficiency measures. For annual reporting, communities are required to submit
a list of all residential and commercial projects affected by the Stretch Code, noting completion and
Certificate of Occupancy dates for all projects, as well as the final HERS rating for new homes.
Key Findings from 2014 Annual Reports
This progress report documents Program-level, as well as criterion-specific, findings from the 2014
Annual Reports of 99 Green Communities.
Criteria 1 and 2: Based on data current as of the 2014 Annual Reports, only 11 municipalities have
projects sited and permitted within their designated zones. A spillover impact of the Criteria 1 and 2
1 ASHRAE 90.1 is a US standard that provides minimum requirements for energy efficient designs for buildings
except for low-rise residential buildings. ASHRAE 90.1-2007 is the version that was updated in 2007 and covers many sections of a building, which include building envelope, HVAC, hot water, and lighting. It has since been updated in 2010 and 2013 to reflect newer and more efficient technologies.
Green Communities Designation and Grant Program 4
emphasis on renewable power, however, has been that designated Green Communities have developed
new renewable energy projects within their municipalities at large (i.e., not necessarily within the
designated zones, but within their borders). Fifty-seven Green Communities have completed or are
planning 180 renewable energy projects. Solar is the most prevalent, but wind and thermal projects are
also cited.
Criterion 3: Based on data current as of the 2014 Annual Reports, Green Communities have seen
energy savings of approximately 2.2 million MMBtu, equivalent to 17,117 Massachusetts homes powered
and heated over 7 years, with the highest savings seen in ECMs implemented in buildings. As of the
writing of this report, seven communities have achieved the 20 percent reduction committed to in their
ERP after at least five years of ERP implementation. (See Community Spotlights on these seven
municipalities below.)
Criterion 4: Based on data current as of the 2014 Annual Reports, 44 Green Communities acquired 222
fuel-efficient vehicles in 2014. These were made up of new purchases, replacement vehicles, and
acquisitions by drug seizure. This figured represents growth from the previous year, when 36 Green
Communities acquired 104 fuel-efficient vehicles with an average fuel economy of 24 mpg.
Criterion 5: In 2014, Green Communities reported 188 more projects with HERS ratings below 55
compared to what was reported in 2013. Based on data current as of the 2014 Annual Reports, 4,803
new residential projects conforming to the Stretch Code have received Certificates of Occupancy in
Green Communities through 2014.

Green Communities Designation and Grant Program 5
CRITERION-SPECIFIC REPORT CARD
This section provides a discussion of each criterion associated with the Green Communities Program. It
presents metrics derived from the 99 Annual Reports submitted in 2014 that can be used to benchmark
the criterion-specific progress of participating Green Communities.
Criteria 1 & 2: Development Potential
Criteria 1 and 2 require communities to establish as-of-right siting in designated locations for
renewable/alternative energy generation, research and development, or manufacturing facilities, and to
adopt an expedited application and permit process for energy facilities in these locations. Results from
the 2014 Annual Report review indicate that 11 municipalities have projects sited and permitted within
their designated zones.
Table 1. Communities with Projects Sited in their Criterion 1 Designated Zone
Community Date Description
Ashland 2012 Solar
Harvard 2012 Solar
Kingston 2012 Wind
Leverett 2014 Solar
Monson 2013 Solar
New Salem 2011 Solar
Provincetown 2013 Solar
Salem 2012 R&D
Scituate 2012 Solar
Somerville 2013 R&D
West Tisbury 2013 Solar
In addition to the 11 projects sited within Criterion 1 designated-zones, Criteria 1 and 2 requirements
have also created a spillover effect that has catalyzed the development of new renewable energy projects
elsewhere within these cities and towns. According to the 2014 Annual Reports, an additional 17
communities have sited renewable energy projects outside their Criterion 1 designated areas. Fifty-seven
of the Green Communities have completed, or are planning 180 renewable energy projects on municipal
property. Solar is the most prevalent technology among these municipal projects, but wind and thermal
projects are also included.

Green Communities Designation and Grant Program 6
Criterion 3: Energy Baseline and Savings
Criterion 3 requires that each community establish an energy use baseline and adopt an ERP to
decrease energy use by 20 percent from that baseline after five years of implementing the ERP.
Participating communities use energy in a variety of ways, but buildings comprise the largest portion of
their use.
Annual Reports submitted to DOER in 2014 show that communities have invested more than $290 million
in energy efficiency projects over the course of the Program so far (Table 2), including through energy
savings performance contracts. This represents a $135 million increase in the total investment in energy
efficiency since the 2013 Annual Reports. Mass Save incentives and Green Community grants make up
approximately $56 million of the installed costs, an increase of approximately $15 million since the 2013
Annual Report. Green Communities reported completing efficiency projects with no Green Community
grant funding, representing a significant leveraging of the program funding. Participating communities are
projected to save more than $25 million annually from completion of projects cited in these Annual
Reports, a $10 million increase since 2013. These savings will last over multiple years, grow as additional
efficiency projects are completed, and be supplemented with additional cost savings from avoided
maintenance.
Table 2. Total Cost and Savings from Energy Efficiency Projects Reported by 99 Green Communities in 2013 Annual Reports for FY2008-FY2014
Green Communities
Grant?
Sum of Projected
Annual Cost Savings
Sum of Total Installed Cost
Sum of Green Community
Grant
Sum of Mass Save Incentives
Yes $19,783,045 $172,601,531 $23,121,831 $27,549,158
No $5,853,195 $121,746,163 − $5,472,047
Total $25,636,239 $294,347,693 $23,121,831 $33,021,205
The resulting energy use reductions from these energy efficiency projects varies by community,
depending upon a number of factors, including a community’s energy use profile and its efficiency
accomplishments prior to its baseline year. When looking at the progress of municipalities, results vary.
The range of energy reductions achieved by individual communities is substantial, regardless of their
baseline years. In the 2014 annual reports, communities reported a change in energy use from a 37
percent decrease to a 22 percent increase. Those that have completed year three of their ERP report
energy usage ranging from an increase of 28 percent to reductions of 43 percent across all years. These
ranges reflect various circumstances in each of the communities, including their energy use profiles and
staff capacity, as well as the realities of weather impacts on energy usage. For example, the significantly
colder winter in 2013-2014 required additional energy usage, as seen by relatively smaller average
reductions (compare Baseline vs. All Years to Baseline vs. 2014). In addition, efficiency projects are often
accompanied by efforts to address deferred maintenance, which can cause an increase in energy use.
For example, efforts to improve a building ventilation system’s efficiency will sometimes uncover
ventilation that does not operate properly. Although these corrections may increase the energy usage of
the building, they can also greatly improve the safety, comfort and productivity of its occupants. Refer to
Appendix A for a full list of energy reductions for ERP years one through five.
The cumulative energy savings and the resulting reductions in greenhouse gas emissions (GHG)
attributable to participating communities can be seen in Figure 1. The energy savings from each

Green Communities Designation and Grant Program 7
community is included in the total energy savings for each year the community participated. For example,
a Green Community with a 2009 baseline would have reported energy usage for 2010, 2011, 2012, and
2013, and its energy savings for each year would be included in the total savings for year’s one through
four. Thus, the cumulative energy savings illustrated represent both the amount of energy savings per
Green Community and the number of Green Communities included.
Based on data included in the 2014 Annual Reports, the 90 Green Communities with Criteria 3 data in
their Annual Reports2 saw a total energy savings of approximately 2.2 million MMBtu through 2014. This
is equivalent to the energy needed to heat and power 17,117 Massachusetts homes for a year.
Interestingly, there is a significant increase in the cumulative amount of energy savings between years 3
and 4 despite a decrease in the number of Green Communities having completed their fourth year versus
their third year. Thus, the efforts in the first three years to invest in energy efficiency appear to achieve
significant energy savings during the fourth year and beyond.
Figure 1. Cumulative Energy Savings and GHG Reductions by Year of ERP3
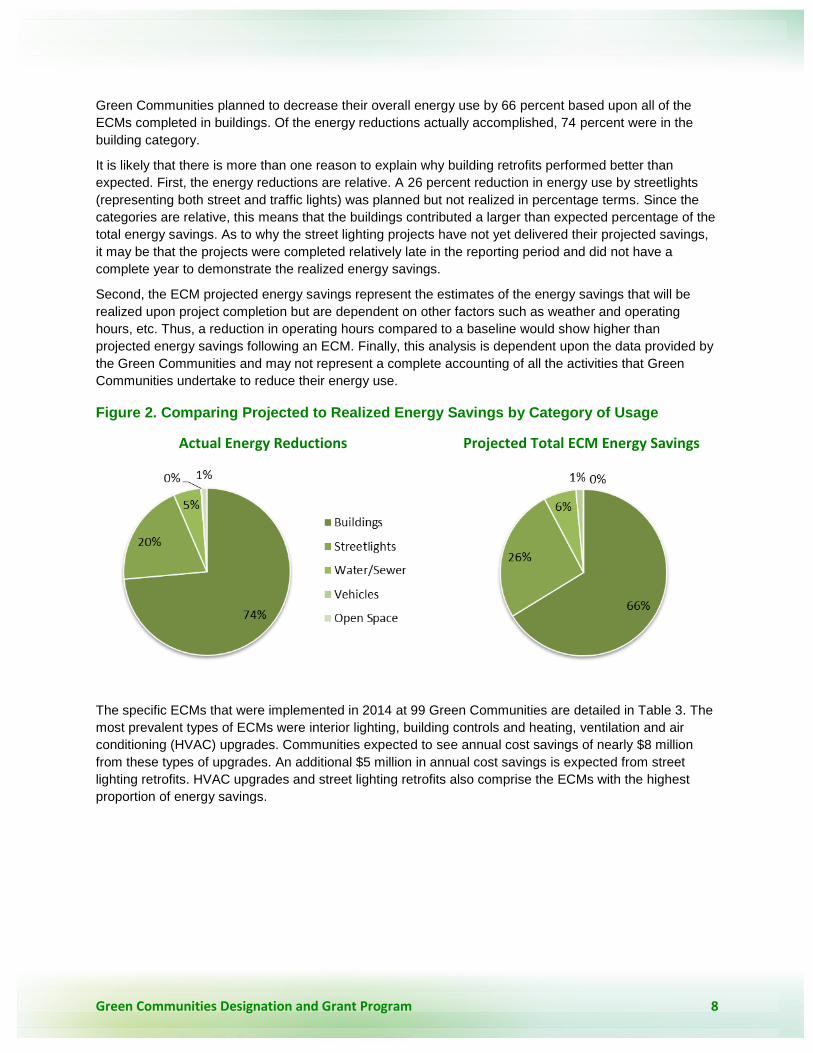
To begin to explain how Green Communities are reducing their energy usage, we can compare the
energy reductions by categories (Actual Energy Reductions in Figure 2) with the projected (planned)
energy savings from ECMs implemented for those categories (Projected Total ECM Energy Savings in
Figure 2). In both graphs, it is immediately apparent that Green Communities have focused first on
reducing their building energy use and secondly on reducing the energy use by streetlights. For example,
2 Nine Green Communities submitting 2014 Annual Reports did not include Criterion 3 data.
3 Number of communities listed above the bars reflects the number of communities that are in that year of ERP. GHG
reductions are estimates that may not fully represent all the energy savings due to lack of conversion factors for certain fuel types and/or changes in conversion factors over the years. The years shown in this figure represent the year of the ERP. Year 1 could represent 2007 to 2012 depending on the selected baseline year, Year 2 could represent 2008 to 2012, and so on.
Green Communities Designation and Grant Program 8
Green Communities planned to decrease their overall energy use by 66 percent based upon all of the
ECMs completed in buildings. Of the energy reductions actually accomplished, 74 percent were in the
building category.
It is likely that there is more than one reason to explain why building retrofits performed better than
expected. First, the energy reductions are relative. A 26 percent reduction in energy use by streetlights
(representing both street and traffic lights) was planned but not realized in percentage terms. Since the
categories are relative, this means that the buildings contributed a larger than expected percentage of the
total energy savings. As to why the street lighting projects have not yet delivered their projected savings,
it may be that the projects were completed relatively late in the reporting period and did not have a
complete year to demonstrate the realized energy savings.
Second, the ECM projected energy savings represent the estimates of the energy savings that will be
realized upon project completion but are dependent on other factors such as weather and operating
hours, etc. Thus, a reduction in operating hours compared to a baseline would show higher than
projected energy savings following an ECM. Finally, this analysis is dependent upon the data provided by
the Green Communities and may not represent a complete accounting of all the activities that Green
Communities undertake to reduce their energy use.
Figure 2. Comparing Projected to Realized Energy Savings by Category of Usage
Actual Energy Reductions Projected Total ECM Energy Savings
The specific ECMs that were implemented in 2014 at 99 Green Communities are detailed in Table 3. The
most prevalent types of ECMs were interior lighting, building controls and heating, ventilation and air
conditioning (HVAC) upgrades. Communities expected to see annual cost savings of nearly $8 million
from these types of upgrades. An additional $5 million in annual cost savings is expected from street
lighting retrofits. HVAC upgrades and street lighting retrofits also comprise the ECMs with the highest
proportion of energy savings.

Green Communities Designation and Grant Program 9
Table 3. Breakdown of Green Communities’ ECMs by Type
ECM Type Number of Complete Projects
Projected Energy Savings (MMBtu)
Projected Annual Cost Savings ($)
Total Installed Cost ($)
Interior Lighting 460 74,602 $3,070,760 $17,094,685
Building Controls 416 98,669 $2,271,929 $14,426,088
HVAC 345 151,125 $2,671,271 $49,498,294
Weatherization 306 44,923 $665,434 $32,085,927
Refrigeration 112 2,519 $117,336 $769,011
Pumps/Motors/Drives 99 53,774 $766,992 $4,352,102
Streetlights 87 205,851 $5,584,344 $22,224,605
Exterior Lighting 85 7,456 $347,364 $1,841,291
Vehicles 77 11,229 $350,792 $1,841,151
Other 58 15,800 $396,181 $2,213,672
Retrocommissioning 52 23,509 $394,123 $1,024,051
Hot Water 45 3,907 $63,617 $842,473
Comprehensive 28 87,473 $1,575,848 $46,175,225
Fuel Conversion 11 4,185 $60,031 $525,487
Behavior & Training 4 2,498 $46,837 $0
Grand Total 2,185 787,520 $18,382,857 $194,914,063
As of this report’s writing, seven communities have achieved their 20 percent energy reduction goals
following completion of the fifth year or beyond of their ERPs (Table 4). For those communities that have
not achieved the goal, but have completed their fifth year, the majority have seen energy reductions
greater than 10 percent. All Green Communities completing their fifth year have seen reductions in the
energy use of their buildings, reflecting the focus on implementing energy efficiency measures in
buildings. These reductions, however, may be overshadowed by examining the total portfolio of energy
use of municipal facilities and operations. Energy use by vehicles, in particular, represents a real barrier
to many Green Communities working to accomplish their 20 percent energy reduction goal.
DOER permits communities that have installed energy conservation measures in their fifth year of ERP
implementation to achieve the full energy savings from these measures. To ensure this, DOER allows
communities to wait a full year after year five before assessing their progress towards the 20 percent
energy reduction commitment. The following seven communities have achieved their 20 percent energy
reduction.
Table 4. Year 5 and Beyond: Green Communities Achieving Their 20 Percent Goals
Community Year 5 or 6
Energy Reduction
Year Reached 20% and 5+ Years
Community Year 5 or 6
Energy Reduction
Year Reached 20% and 5+
Years
Arlington 23.3% FY2014 Palmer 37.1% FY2014
Belchertown 20.9% FY2014 Springfield 24.2% FY2013
Cambridge 20.1% FY2014 Sutton 21.4% FY2014
Natick 20.2% FY2013

Green Communities Designation and Grant Program 10
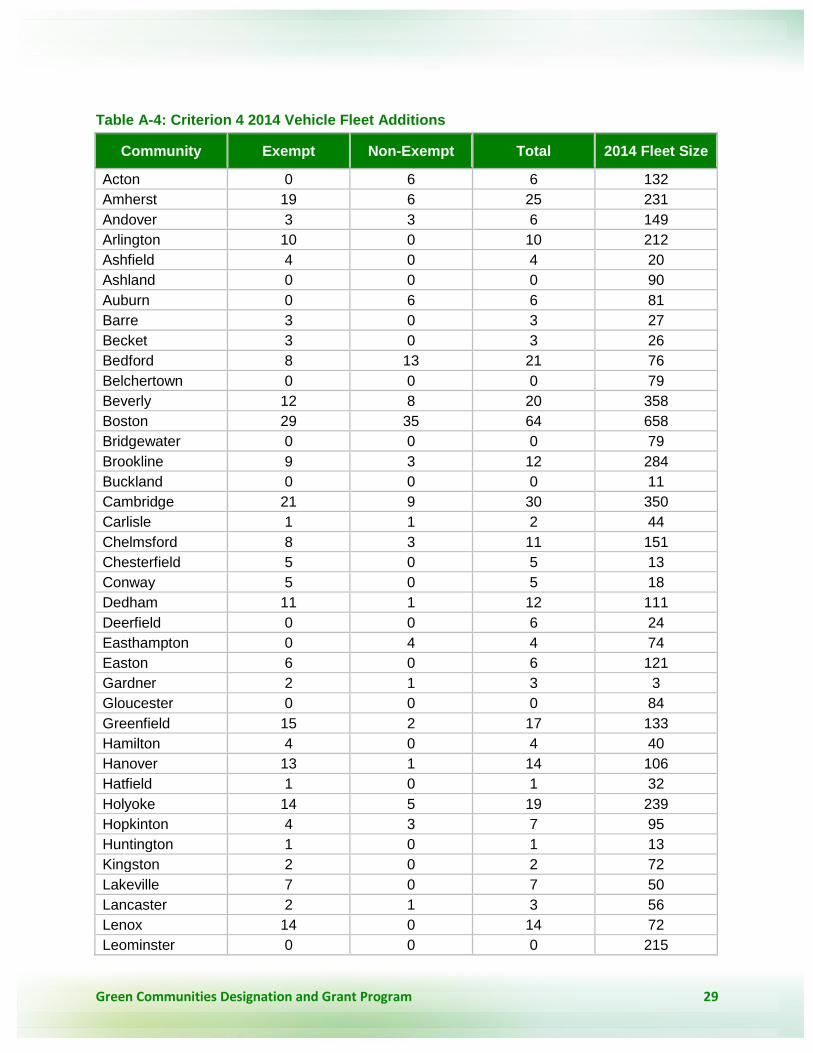
Criterion 4: FEVs purchased
Criterion 4 requires communities to purchase only fuel-efficient vehicles, where practicable, when adding
new vehicles to their fleets. Heavy duty vehicles with a gross vehicle weight rating (GVWR) of more than
8,500 pounds, as well as police cruisers and passenger and cargo vans, are exempt from the FEV policy.
Based on data current as of the 2014 Annual Reports, 44 Green Communities acquired 222 fuel-efficient
vehicles in 2014. These comprised new purchases, replacement vehicles, and, in a small number of
cases, acquisition through drug seizure. The remaining Green Communities either did not expand their
fleets in 2014 or only purchased exempt vehicles. For a full list of the new purchases, refer to Appendix
A.
Alternative Compliance
During this reporting period, five communities reported under the Alternative Compliance method for
Criterion 4, and several additional communities offered additional Alternative Compliance initiatives,
though not required to do so. This is a reduction from the ten communities that reported meeting Criterion
4 requirements via Alternative Compliance in 2013. In general, this compliance option ensures that
municipalities with a vehicle fleet composed entirely of exempt vehicles can still commit to reducing
vehicle fuel consumption. The most common Alternative Compliance methods reported were idle
reduction (four communities) and bike racks (four communities). Other methods include plans to introduce
biodiesel and electric-vehicle charging infrastructure. Alternative Compliance municipalities also
committed to reporting their annual vehicle miles driven and fuel consumption as part of their Fuel
Efficient Vehicle Policy.
While Criterion 4 focuses specifically on vehicle efficiency, several communities reported alternative fuel
vehicles in their fleets. A few municipalities noted their efforts to install electric-vehicle charging stations,
specifically through the Massachusetts Department of Environmental Protection’s Massachusetts Electric
Vehicle Incentive Program (MassEVIP). For example, Melrose received $15,000 in grant funding to
contribute toward purchases of electric vehicles (EVs) or hybrid electric vehicles (HEV). Scituate will also
be utilizing financial incentives from the program in order to purchase HEVs already approved by the
Town.
Several communities are taking innovative approaches, including:
Ashfield plans to begin using a biodiesel blend in its diesel Highway Department vehicles
when the Northeast Biodiesel plant (still under construction in Greenfield) is complete. It
could be subsidized using a portion of the savings from energy reduction improvements
achieved under Criterion 3.
Whately and Huntington are evaluating the feasibility of switching several town vehicles
from diesel to either B5 or B20 biodiesel.
Amherst planned to install a dual-head EV charging station and to purchase an all-
electric vehicle for staff use in the spring of 2015.
In response to a proposal to discontinue the transit bus route along Route 63 through
Leverett, the town has requested to become a member of the Franklin Regional Transit
Authority and is working with the agency to expand service to include a loop through
other parts of the town, rather than limiting it to Route 63.

Green Communities Designation and Grant Program 11
Criterion 5: Minimize life-cycle energy costs for new construction
Criterion 5 requires communities to set requirements to minimize life-cycle energy costs for new
construction. The only approach cities and towns have followed to achieve this is to date is adoption of
the BBRS Stretch Code. Based on data current as of the 2014 Annual Reports, 4,803 new residential
projects conforming to the Stretch Code have received Certificates of Occupancy in Green Communities
through 2014. These projects saw HERS ratings up to 70, with the majority of communities averaging in
the 50s and 60s. Compared to the totals reported through 2013, the 2014 reporting period found
increasing numbers of new residential projects with HERS ratings below 55 – an indication of increasing
energy efficiency since the lower the HERS rating, the more efficient the building. Overall, 188 more
projects with HERS ratings below 55 were reported in 2014 compared to 2013. The 2014 annual reports
also revealed 4,553 residential renovation projects and 700 commercial projects were built through 2014.
The full list of projects built to the Stretch Code up through 2014 can be found in Appendix A.
COMMUNITY SPOTLIGHTS
Seven communities achieved their 20 percent energy reduction goals following completion of the fifth
year of their ERPs. They are: Arlington, Belchertown, Cambridge, Natick, Palmer, Springfield, and Sutton.
This section provides a brief description of the energy use reductions that have taken place in these
seven communities.
Arlington
By taking charge of its energy use, the Town of Arlington is
not only reducing its environmental impact, but also locking
long-term savings into its municipal budget. The town
expects to save over $100,000 annually as a result of
measures funded with Green Communities grants.
Arlington‘s energy efficiency projects started with its largest
buildings – the high school and middle school – and have
included repairing steam traps, replacing old boilers with new
highly efficient condensing models, and installing state-of-
the-art energy management systems (EMS). These efforts
have resulted in an 18 percent reduction of electricity use at
the high school and 22 percent at the middle school. In
addition, the town has reaped significant energy savings
through interior and exterior lighting projects, including an
LED streetlight retrofit. Arlington has also made a significant
investment in the purchase of energy efficient vehicles – 11
to date. To build upon these successes, Arlington is
continuing to pursue innovative energy efficiency efforts. For
example, Arlington implemented a pilot project of fault
detection and diagnostic software at the Peirce Elementary
School, which is among the first such systems at a municipal facility in Massachusetts. Multiple layers of
real time data are available in one place and analyze operational and efficiency issues within the HVAC
New EMS Controller at Ottoson
Middle School in Arlington

Green Communities Designation and Grant Program 12
system, effectively creating constant commissioning. In order to effectively manage this new data stream
and those of other EMS systems, Arlington has sent four staff members for EMS training. On the
renewable energy side, Arlington has signed a power purchase agreement with Ameresco, utilizing a
DOER Municipal Energy Technical Assistance grant, to install approximately 600,000 kWh of solar PV on
several school buildings.
Belchertown
Belchertown earned its Green Community
designation in May, 2010 - DOER's
inaugural Green Community designation
round - and has since then performed,
tracked and overseen a variety of
worthwhile projects geared towards
municipal energy reduction and costs
savings. Prior to becoming a Green
Community, Belchertown received a
federal Energy Efficiency and
Conservation Block Grant through DOER
that allowed the town to complete a series
of energy efficiency measures at Lawrence
Memorial Hall. The town then teamed up
with Siemens Building Technologies, Inc.
to conduct an investment grade audit
designed to detect energy waste in all town-owned buildings, including schools, and identify specific
areas in need of improvement. This analysis yielded a detailed compilation of overall energy loss and it
helped the town to target and prioritize its energy efficiency investments. In June 2011, Belchertown
residents voted unanimously to authorize the town to enter into an energy savings performance contract
with guaranteed savings from myriad projects, including new boilers at the Lawrence Memorial Hall,
Recreation Building lighting controls, and installation of smart thermostats, energy efficient drives, ducting
and exterior lighting. Since that time, Belchertown’s Department of Public Works has improved the
efficiency of its lighting and heating and cooling devices. Finally, Belchertown continues to make a
significant effort to purchase energy efficient vehicles as well as to reduce town-wide gas and diesel
consumption through a behavioral program utilizing a vehicle fuel software management system.
Smart thermostat for classrooms on Belchertown

Green Communities Designation and Grant Program 13
Cambridge
The City of Cambridge’s most significant energy
reduction achievements are tied to its two highest
energy-consuming facilities - the high school and
the water treatment facility. A comprehensive
renovation project at the high school resulted in
41 percent energy savings without reducing the
building’s overall footprint. The Leadership in
Energy and Environmental (LEED) Gold building
incorporated a chilled beam HVAC system, a
rooftop solar PV array, high efficiency lighting
(some of which was funded by a Green
Communities grant), and daylighting. Extensive
process and equipment improvements are
ongoing at the city’s water treatment plant at Fresh Pond. To date, the facility has reduced energy
consumption by 34 percent. A 170 kW solar PV array for the water facility is out to bid and will further
reduce the plant’s use of fossil fuels. Cambridge has been busy upgrading HVAC and lighting systems at
other city buildings. Green Communities grants funded variable frequency drives and direct digital
controls at two highly used youth centers, and interior lighting upgrades at schools and DPW facilities. In
conjunction with its efficiency efforts, Cambridge is equally focused on further deployment of renewable
energy. The City is developing a plan to install sufficient onsite solar PV on public buildings to supply 5
percent of municipal energy consumption by 2020. In addition to the array planned for the water treatment
plant, a 700 kW system is planned for the reconstructed King Elementary school, which is being designed
along zero net energy principles.
Natick
The Town of Natick has been
chipping away at its energy
use for a number of years, so
it is no surprise it surpassed
the 20 percent energy
reduction goal it established in
FY 2008. Like most other
Green Communities, the town
first focused efficiency efforts
on town and school buildings.
In 2008, Natick’s buildings
consumed 102,000 MMBtus of
energy and represented
nearly 75 percent of the
town’s energy use. Since
then, Green Communities
grants have funded the
installation of carbon dioxide
sensors to optimize ventilation
at Town Hall and the Community Senior Center; solar panels on school rooftops; and retro-
High School renovation in Cambridge
Solar panels on Kennedy Middle School in Natick

Green Communities Designation and Grant Program 14
commissioning projects at the Morse Institute Library, Public Safety Facility, Bennett-Hemenway
Elementary School and the Cole Recreation Center. The town has also invested in oil-to-gas conversion
and high efficiency boiler replacements at numerous buildings. Together these investments reduced
Natick’s buildings’ energy consumption by more than 30 percent to 72,000 MMBtus annually. Non-
building sites have also been a priority for Natick, which retrofitted over 2,000 streetlights and parking lot
lights with LED technology in 2013. A Green Communities grant funded 25 energy efficiency projects at
the Natick Water and Sewer Department. Moving forward, the town plans to use circuit-level monitoring to
assess the electricity use of all town and school buildings to identify issues with scheduling and set
points. It has successfully piloted this approach at five buildings, and has seen adjustments to these
buildings’ energy management systems result in reductions of at least 5 percent per building. The town
also plans to retrofit interior and exterior lighting at school and municipal buildings with LEDs, further
reducing costs and energy use.
Palmer
Over the past five years, the town of
Palmer has taken a leading role in
reducing its energy consumption. This
has been accomplished through the
completion of 11 separate energy
improvement projects. The town’s
estimated $400,000 investment has
been leveraged by programs offered
through the Green Communities
Division, Massachusetts School
Building Authority, and Mass Save.
These partnerships have allowed $1.3
million of improvements to occur at five
municipal buildings. These consist of
four HVAC, three building envelope,
and two pump/motor/drive projects, a
lighting retrofit, and the installation of a
10 kW roof-mounted solar domestic hot
water system. Specifically, Green
Community funds were integral in upgrading the Town Hall’s HVAC system. This project was selected for
the significant savings that would be quickly realized and is currently saving the town approximately
$27,000 annually in electric and natural gas costs. To further its pursuit of greener energy, the town is
contracted to purchase 100 percent of its electric needs through net metering credits from a local solar
project and is engaged in a lease agreement with a separate PV developer to construct a 5 megawatt
ground-mounted PV system on closed municipal landfill.
Palmer Town Hall HVAC upgrade

Green Communities Designation and Grant Program 15
Boiler replacement at Springfield town library
Springfield
The City of Springfield has long been active in saving energy in
municipal buildings. The City was quick to take advantage of
funds made available through the American Recovery and
Reinvestment Act of 2009. Having already assembled a
prioritized list of projects, the City immediately began replacing
antiquated heating systems in schools, fire stations, and
libraries, as well as updating control systems in order to ensure
that the new systems ran at peak efficiency and on a schedule
that made sense. When the Green Communities Designation
and Grant Program was announced in 2009, Springfield
examined the designation criteria and became one of the very
first Green Communities. Funds made available through that
program were leveraged with funds from Mass Save to
continue the city's infrastructure updates. Springfield was
successful in applying for subsequent Green Communities
Competitive Grants in 2012 and again in 2014. None of this
would have been possible If City leaders and staff hadn’t led
the charge to make sure the City did not miss an opportunity to
improve its buildings and save energy and taxpayer funds.
While Springfield is pleased to meet its 20 percent municipal
energy reduction goal, the city is not resting on its laurels, but
rather remains focused on its goal to make Springfield the state’s most energy efficient municipality.
Sutton
Sutton has pursued a
multipronged approach to
reach its goal of 20 percent
municipal energy reduction
over five years. The first step in
the process was staff and
public education about energy
usage and costs and a related
program to implement
behavioral changes to reduce
energy usage. The Town
conducted informational staff
meetings and posted signage
to remind people to turn off
lights, computers and other sources of electricity use. The Town then removed obvious unnecessary
sources of electricity draw such as soda machines, began to replace outdated fixtures, and installed
occupancy sensors in all town buildings. The town also purchased its first hybrid municipal vehicles and
began selecting municipal vehicles more carefully, with fuel efficiency at the forefront of decision-making.
With the assistance of its first Green Communities grant, Sutton accomplished several energy saving
projects including additional significant lighting upgrades that included daylight and occupancy sensors at
the Sutton school complex and four other municipal buildings, and installed a heat recovery system at the
municipal complex. At this point, Sutton reached its 20 percent goal. To ensure further progress, the
Upgraded Sutton town library lighting

Green Communities Designation and Grant Program 16
Town applied for and received a Green Communities competitive grant and has accomplished nearly all
of the funded projects, including installation of demand control ventilation and variable frequency drives at
the school complex, conversion of outdoor lighting at the school complex to LED fixtures, and installation
of an energy efficient water heater at the municipal complex. The final project that will be partially funded
with this grant is conversion of municipal streetlights to LED technology during the summer of FY15.
Town residents unanimously voted to approve the balance of funds to complete that project, which will
put Sutton in the forefront of LED streetlight conversion among Central Massachusetts communities.
CONCLUSION
The Green Communities Act was passed by unanimous vote of the Legislature in 2008 and it continues to
enjoy strong legislative support. A key component of the Act, the Green Communities Designation and
Grant Program has significantly outpaced expectations and is now a national model for clean energy
success at the local level. Beginning in 2010 with 35 communities achieving designation, there are
currently 136 designated communities. Green Communities are located all across the state from the Cape
and Islands to the Berkshires, and demographically diverse, from the tiny western Massachusetts town of
Rowe to the state capital in Boston.
The 136 Green Communities have committed to reduce their municipal energy usage over five years by
20 percent, or 2 million MMBTU—an amount equal to the total average energy use of more than 15,500
Massachusetts homes. This five-year commitment is also projected to cut greenhouse gas emissions by
194,682 tons, which equates to taking nearly 37,000 cars off the road for a year. It also equates to more
than $21 million in avoided energy costs if all the current Green Communities meet their 20 percent
energy use reduction commitments.
As of December 2014, Green Communities reported using their designation or competitive grants to
complete nearly 548 interior lighting upgrade projects, 348 weatherization projects, and 4,875 HVAC
upgrade projects. In 2014, 99 Green Communities submitted Annual Reports to DOER and, based on
their reported data, are saving approximately 2.2 million MMBtu—equivalent to the total energy usage of
17,117 Massachusetts homes.
From the launch of the Program in 2010 through July 1, 2015, the Green Communities Division has
awarded some $40 million in grants to designated communities to undertake projects that reduce
municipal energy bills and improve the local environment. Moreover, Program participants have been
able to combine Green Communities monies with Mass Save funding to get an even greater benefit.
Mass Save incentives and Green Community grants make up approximately $56 million of the installed
costs associated with these projects.
Looking ahead, the Division anticipates as many as 20 additional municipalities may apply for Green
Community designation in the fall 2015 designation round. With funding secured through Alternative
Compliance Payments under the state’s Renewable Portfolio Standard and carbon allowance auction
proceeds under the Regional Greenhouse Gas Initiative, the Program is poised to continue to support
and advance the clean energy goals of Massachusetts municipalities well into the foreseeable future.

Green Communities Designation and Grant Program 17
APPENDIX: ADDITIONAL CRITERION-SPECIFIC DATA
Table A-1. List of Communities that Submitted a 2014 Annual Report
Acton Hamilton Newburyport Westminster
Amherst Hanover Newton Weston
Andover Harvard Northampton Westwood
Arlington Hatfield Northfield Whately
Ashfield Holyoke Palmer Williamstown
Ashland Hopkinton Petersham Winchester
Athol Huntington Pittsfield Winthrop
Auburn Kingston Provincetown Woburn
Ayer Lakeville Quincy Worcester
Barre Lancaster Revere
Becket Lenox Rowe
Bedford Leominster Salem
Belchertown Leverett Scituate
Beverly Lexington Sherborn
Boston Lincoln Shirley
Bridgewater Lowell Somerville
Brookline Marlborough Springfield
Buckland Mashpee Sudbury
Cambridge Maynard Sutton
Carlisle Medford Swampscott
Chelmsford Medway Tewksbury
Chesterfield Melrose Topsfield
Conway Mendon Townsend
Dedham Middlefield Truro
Deerfield Millbury Tyngsborough
Easthampton Milton Watertown
Easton Monson Wayland
Gardner Montague Wendell
Gloucester Natick Wenham
Greenfield New Salem West Tisbury

Green Communities Designation and Grant Program 18
Table A-2. Criteria 1 & 2: Sited Projects, 2014
Community Projects? Date Description Comments
Acton No
Amherst No
Andover No Solar Project but not under town’s Green Community Designation
Arlington No
Ashfield No
Ashland Yes 2012 Solar Permits granted
Athol No
Auburn No
Ayer No
Barre No
Becket No
Bedford No
Belchertown No
Beverly No Solar Project but not under town's Green Community Designation
Boston No
Bridgewater No Solar Project but not under town's Green Community Designation
Brookline No Solar Project but not under town's Green Community Designation
Buckland No
Cambridge No Solar Project but not under town's Green Community Designation
Carlisle No
Chelmsford No
Chesterfield No
Conway No
Dedham No
Deerfield No
Easthampton No
Easton No Solar Project but not under town’s Green Community Designation
Gardner No
Gloucester No
Greenfield
Hamilton No
Hanover No
Harvard Yes 2012 Solar Permit granted for 1 of 2 projects
Hatfield No

Green Communities Designation and Grant Program 19
Community Projects? Date Description Comments
Holyoke No Solar Project but not under town's Green Community Designation
Hopkinton No
Huntington No
Kingston Yes 2012 Wind
Lakeville No
Lancaster No Solar Project but not under town's Green Community Designation
Lenox No Solar Project but not under town's Green Community Designation
Leominster No
Leverett Yes 2014 Solar
Lexington No
Lincoln No
Lowell No Solar Project but not under town's Green Community Designation
Marlborough No
Mashpee No
Maynard No Project listed but not under town’s Green Community Designation
Medford No
Medway No
Melrose No
Mendon No
Middlefield No
Millbury No Solar Project but not under town's Green Community Designation
Milton No
Monson Yes 2013 Solar
Montague No
Natick No Solar Project but not under town's Green Community Designation
New Salem Yes 2011 Solar
Newburyport No
Newton No
Northampton No
Northfield No
Palmer No
Petersham No
Pittsfield No
Provincetown Yes 2013 Solar
Quincy No
Revere No

Green Communities Designation and Grant Program 20
Community Projects? Date Description Comments
Rowe No
Salem Yes 2012 R&D
Scituate Yes 2012 Solar
Sherborn No
Shirley No
Somerville Yes 2013, 2014 R&D 4 R&D projects
Springfield No
Sudbury No Solar Project but not under town's Green Community Designation
Sutton No Project listed but not under town’s Green Community Designation
Swampscott No
Tewksbury No
Topsfield No
Townsend No
Truro No
Tyngsborough No R&D Project but not under town's Green Community Designation
Watertown No
Wayland No Project listed but not under town’s Green Community Designation
Wendell No
Wenham No
West Tisbury Yes 2013 Solar
Westminster No
Weston No
Westwood No
Whately No
Williamstown No
Winchester No
Winthrop No
Woburn No
Worcester No

Green Communities Designation and Grant Program 21
Table A-3. Criterion 3: Energy Usage and Reductions by Category for Baseline Year and Most Recent Data Year
Community Year4 Buildings Open
Space5 Streetlights Vehicles Water/Sewer Total
% Energy Reduction6
Acton FY2009 83,932 0 1,900 18,176 3,284 107,292
FY2014 71,527 0 1,184 18,823 2,948 93,942 12.4%
Amherst FY2011 29,375 462 1,770 15,964 13,071 60,642
FY2014 30,469 467 1,069 12,407 13,535 57,947 4.4%
Andover FY2008 86,638 0 4,656 16,871 28,998 137,163
FY2014 89,028 0 2,947 16,400 28,827 137,202 0.0%
Arlington FY2008 104,929 0 5,203 17,823 575 128,530
FY2014 80,092 0 1,051 16,967 470 98,580 23.3%
Ashfield FY2010 988 0 34 1,558 793 3,373
FY2014 1,008 0 29 1,796 451 3,284 2.6%
Ashland FY2011 38,304 42 1,100 5,636 5,543 50,625
FY2014 - - - - - - -
Athol FY2009 7,270 0 0 6,014 7,806 21,090
FY2014 5,936 0 0 6,027 7,094 19,057 9.6%
Auburn FY2011 33,700 0 1,900 9,624 2,616 47,840
FY2014 30,361 0 1,902 9,715 2,497 44,475 7.0%
Ayer FY2009 6,011 0 780 1,806 10,025 21,244
FY2014 6,203 0 669 4,428 7,444 19,937 6.2%
Barre FY2011 6,989 6 0 0 3.930 10,925
FY2014 3,514 2 0 3,198 3,928 10,642 2.6%
Becket FY2009 1,518 0 82 3,525 0 5,125
FY2014 1,356 0 99 3,373 0 4,828 5.8%
Bedford FY2009 47,753 0 2,145 10,592 4,811 65,301
FY2014 49,519 0 1,932 9,857 3,924 65,232 0.1%
Belchertown FY2009 48,771 5 453 7,159 3,501 59,889
FY2014 35,822 6 441 8,216 2,886 47,371 20.9%

Green Communities Designation and Grant Program 22
Community Year4 Buildings Open
Space5 Streetlights Vehicles Water/Sewer Total
% Energy Reduction6
Beverly FY2009 89,880 457 7,313 9,798 5,683 113,131
FY2014 79,139 578 5,428 8,929 5,567 99,641 11.9%
Boston FY2010 1,225,147 13,931 311,351 413,123 0 1,963,552
FY2014 1,285,458 11,440 220,167 449,461 0 1,966,526 -0.2%
Bridgewater FY2009 11,577 822 2,075 6,756 7,807 29,037
FY2014 10,453 568 1,961 8,821 7,493 29,296 -0.9%
Brookline FY2009 126,471 2,488 11,181 17,063 15 157,218
FY2014 140,032 2,686 9,927 19,459 5 172,109 -9.5%
Buckland FY2009 1,252 0 149 1,349 0 2,750
FY2014 1,233 0 166 1,618 0 3,017 -9.7%
Cambridge FY2008 192,115 6,821 22,204 41,725 41,591 304,456
FY2014 151,747 5,944 19,065 38,884 27,759 243,399 20.1%
Carlisle FY2009 12,066 109 0 4,268 404 16,847
FY2014 12,183 38 0 5,075 791 18,087 -7.4%
Chelmsford CY2008 78,817 410 2,467 15,525 12,725 109,944
CY2013 82,733 416 2,418 17,530 11,178 114,275 -3.9%
Chesterfield FY2010 1,681 0 22 1,447 0 3,150
FY2014 1,307 0 24 2,031 0 3,363 -6.8%
Conway FY2010 3,347 0 0 1,778 0 5,125
FY2014 3,255 0 0 2,007 0 5,262 -2.7%
Dedham FY2009 54,047 274 304 5,910 169 60,704
FY2014 55,105 467 108 345 424 56,449 7.0%
Deerfield FY2009 8,165 0 517 2,568 2,113 13,363
FY2014 6,444 0 398 3,180 1,941 11,963 10.5%
Easthampton FY2009 29,129 9 1,342 7,640 8,355 46,475
FY2014 32,360 8 1,264 6,657 7,044 47,333 -1.8%
Easton FY2009 57,488 0 2,132 11,569 5,434 76,623
FY2014 54,125 0 1,558 11,777 5,226 72,686 5.1%

Green Communities Designation and Grant Program 23
Community Year4 Buildings Open
Space5 Streetlights Vehicles Water/Sewer Total
% Energy Reduction6
Gardner FY2008 43,468 79 2,005 10,739 6,350 62,641
FY2014 34,566 35 2,017 10,708 5,268 51,594 16.0%
Gloucester FY2009 71,786 0 5,140 13,292 11,988 102,206
FY2014 62,346 0 5,028 14,489 11,292 93,155 8.9%
Greenfield FY2008 49,742 0 4,928 12,335 6,036 73,041
FY2014 48,754 0 2,436 13,967 5,388 70,545 3.4%
Hamilton FY2009 20,401 149 550 3,741 2,038 26,879
FY2014 19,549 168 546 3,501 1,856 25,620 4.7%
Hanover FY2008 32,419 0 818 9,090 5,920 48,247
FY2014 32,970 0 770 8,063 5,959 47,762 1.0%
Harvard FY2009 20,521 2 91 3,706 419 24,739
FY2014 19,289 5 90 3,278 579 23,241 6.1%
Hatfield FY2010 5,840 0 161 2,721 1,799 10,521
FY2014 6,509 0 153 2,852 1,798 11,312 -7.5%
Holyoke FY2009 137,527 0 22,271 29,473 18,556 207,827
FY2014 123,045 0 15,361 30,636 17,101 186,143 10.4%
Hopkinton CY2009 48,644 0 599 7,272 2,182 58,697
CY2013 42,996 0 477 6,223 2,296 51,992 11.4%
Huntington FY2011 2,865 0 130 1,254 552 4,801
FY2014 1,782 0 134 1,548 510 3,974 17.2%
Kingston CY2009 28,131 135 39 8,013 9,254 45,572
CY2013 23,181 121 48 8,037 8,694 40,081 12.0%
Lakeville FY2011 10,074 69 358 7,245 0 17,746
FY2014 9,864 46 294 7,014 0 17,218 3.0%
Lancaster CY2008 4,925 0 252 4,125 1,182 10,484
CY2013 4,719 0 197 3,884 1,243 10,043 4.2%
Lenox FY2009 21,689 14 476 4,491 4,189 30,859
FY2014 23,276 7 544 2,616 4,486 30,929 -0.2%

Green Communities Designation and Grant Program 24
Community Year4 Buildings Open
Space5 Streetlights Vehicles Water/Sewer Total
% Energy Reduction6
Leominster FY2010 82,162 1,387 15,355 17,912 6,156 122,972
FY2014 71,252 1,452 4,996 19,345 14,058 111,104 9.7%
Leverett FY2009 3,459 0 4 1,486 0 4,949
FY2014 4,540 0 38 1,257 0 5,835 -17.9%
Lexington FY2008 105,804 681 7,727 15,023 1,889 131,124
FY2014 110,654 454 2,771 18,185 1,679 133,744 -2.0%
Lincoln FY2008 22,826 7 66 4,462 2,277 29,638
FY2014 22,122 0 0 4,018 2,545 28,685 -0.2%
Lowell FY2008 266,267 8,268 14,699 37,607 68,741 395,582
FY2014 238,556 3,746 2,704 35,908 70,508 651,422 11.2%
Marlborough FY2009 81,329 133 5,480 15,405 28,206 130,554
FY2014 80,548 162 5,294 - 25,943 111,1947 -
Mashpee FY2009 23,662 0 441 8,243 0 32,346
FY2014 22,478 0 390 8,169 0 31,037 4.0%
Maynard FY2011 34,198 0 191 4,857 9,261 48,507
FY2014 21,825 0 127 4,842 6,947 33,741 30.4%
Medford FY2009 112,423 1,077 8,250 17,550 101 139,401
FY2014 90,731 894 7,775 16,179 128 115,707 17.0%
Medway FY2009 42,311 82 721 5,532 2,735 51,381
FY2014 37,816 112 627 6049 2,769 47,373 7.8%
Melrose FY2009 55,049 0 4,956 14,765 1,167 75,937
FY2014 60,593 0 4,828 17,887 972 84,280 -11.0%
Mendon FY2010 7,635 13 272 3,316 0 11,236
FY2014 7,205 24 200 2,931 0 10,360 7.8%
Millbury FY2009 33,997 102 1,013 6,158 2,589 43,859
FY2014 32,362 46 1,023 6,222 2,842 42,495 3.1%
Milton FY2008 66,919 27 3,834 11,725 629 83,136
FY2014 56,484 78 247 14,403 648 71,860 13.6%

Green Communities Designation and Grant Program 25
Community Year4 Buildings Open
Space5 Streetlights Vehicles Water/Sewer Total
% Energy Reduction6
Monson FY2010 24,504 0 277 8,965 1,354 35,100
FY2014 26,520 0 270 9,412 1,072 37,274 -6.2%
Montague FY2008 20,336 0 16 5,179 0 25,531
FY2014 16,725 0 16 5,158 0 21,899 14.2%
Natick FY2008 102,029 8 2,813 21,450 13,113 139,413
FY2014 72,141 0 3,483 25,112 10,454 111,190 20.2%
New Salem FY2009 1,336 0 0 1,223 0 2,559
FY2014 448 0 0 1,573 0 2,216 13.4%
Newburyport FY2009 39,522 0 3,366 11,770 16,501 71,159
FY2014 40,202 0 3,121 9,855 16,542 69,719 2.0%
Newton FY2008 245,902 528 15,192 34,753 3,469 299,844
FY2014 223,250 511 11,747 34,015 2,861 272,384 9.2%
Northampton FY2009 74,103 1,439 4,514 15,829 15,743 111,628
FY2014 67,617 1,297 4,502 15,195 17,632 106,243 4.8%
Northfield FY2011 1,820 0 206 2,666 460 5,152
FY2014 1,988 0 157 2,989 289 5,423 -5.3%
Palmer FY2009 35,205 635 3,209 5,744 14,999 59,792
FY2014 21,524 636 1,796 6,147 7,481 37,584 37.1%
Petersham FY2011 3,290 0 0 1,295 0 4,585
FY2014 3,443 0 0 1,496 0 4,939 -7.7%
Pittsfield FY2008 117,297 1,905 8,750 32,532 25,633 186,117
FY2014 143,670 1,317 8,190 34,266 23,173 210,616 -13.2%
Provincetown FY2009 17,047 56 153 8,145 1,699 27,100
FY2014 15,253 62 488 8,244 946 24,993 7.8%
Quincy FY2011 185,000 871 15,901 38,138 2,500 242,410
FY2014 173,699 1,047 15,828 42,904 2,219 235,697 2.8%
Revere FY2009 93,272 0 9,076 13,295 617 116,260
FY2014 88,857 0 8,490 9,759 312 107,418 7.6%

Green Communities Designation and Grant Program 26
Community Year4 Buildings Open
Space5 Streetlights Vehicles Water/Sewer Total
% Energy Reduction6
Rowe FY2009 3,478 30 48 1,394 0 4,960
FY2014 - - - - - - -
Salem FY2009 68,295 3,595 8,623 18,075 1,003 99,590
FY2014 71,071 3,731 7,635 18,886 1,092 102,415 -2.8%
Scituate FY2010 40,745 199 2,326 15,142 16,622 75,034
FY2014 44,134 250 2,304 15,682 13,314 75,684 -0.9%
Sherborn FY2009 9,385 23 58 8,019 19 17,504
FY2014 9,892 9 47 8,951 17 18,916 -8.1%
Shirley FY2011 5,048 0 350 2,226 927 8,551
FY2014 5,501 0 244 2,131 903 8,779 -2.7%
Somerville CY2008 91,694 485 921 - 7 93,107
CY2013 71,668 784 1,424 17,735 9 91,620 -
Springfield FY2007 444,623 4,054 36,116 75,809 0 560,602
FY2014 317,826 3,536 32,038 78,197 0 431,597 23.0%
Sudbury FY2008 65,757 1,264 1,135 11,713 3,401 83,270
FY2014 60,518 1,162 549 10,171 3,588 75,988 8.7%
Sutton CY2008 27,872 0 37 7,181 1,346 36,436
CY2013 19,720 0 21 7,583 1,313 28,637 21.4%
Swampscott FY2009 37,063 177 2,964 4,562 1,536 46,302
FY2014 40,051 178 2,925 4,779 1,439 49,372 -6.6%
Tewksbury FY2009 81,095 0 2,430 10,893 11,848 106,266
FY2014 - - - - - - -
Topsfield FY2009 12,942 0 37 4,171 925 18,074
FY2014 13,865 0 21 3,760 838 18,484 -2.3%
Townsend FY2010 5,345 4 16 4,464 1,786 11,615
FY2014 5,588 13 6 4,417 1,415 11,439 1.5%
Truro FY2010 8,428 0 53 2,834 0 11,315
FY2014 7,255 0 49 3,569 0 10,873 3.9%

Green Communities Designation and Grant Program 27
Community Year4 Buildings Open
Space5 Streetlights Vehicles Water/Sewer Total
% Energy Reduction6
Tyngsborough FY2008 26,683 0 927 11,202 849 39,661
FY2014 25,991 0 937 8,8533 1,272 36,733 16.6%
Watertown FY2010 74,011 0 2,035 11,965 0 88,011
FY2014 62,983 237 1,865 12,087 0 77,173 12.3%
Wayland FY2010 42,891 0 1,553 7,410 3,467 55,321
FY2014 44,122 0 1,330 6,509 2,063 54,024 2.3%
Wendell FY2011 1,667 10 0 915 2 2,594
FY2014 1,556 22 0 916 5 2,499 3.7%
Wenham FY2009 12,182 0 413 3,381 899 16,875
FY2014 13,447 0 412 2,834 1,031 17,724 -5.0%
West Tisbury CY2011 1,309 0 75 1,159 0 2,543
CY2013 1,273 0 75 1,159 0 2,186 14.0%
Westminster FY2011 5,636 53 228 - 0 5,917
FY2014 5,686 51 228 5,330 0 11,295 -
Weston FY2011 69,301 532 836 16,585 1,586 88,840
FY2014 70,567 415 804 15,517 1,392 88,695 0.2%
Westwood FY2012 44,682 0 1,385 7,504 1,441 55,012
FY2014 54,722 0 1,459 9,165 1,797 67,072 -14.2%
Whately FY2011 3,377 0 2 1,213 204 4,797
FY2014 3,949 0 0 1,232 212 5,609 -16.9%
Williamstown FY2008 8,678 0 0 5,148 2,574 16,400
FY2014 8,273 0 0 5,307 1,905 15,485 5.6%
Winchester FY2010 65,298 101 2,242 9,963 2,085 79,662
FY2014 58,362 84 1,083 11,152 1,824 72,505 9.0%
Winthrop FY2011 29,724 148 2,417 6,487 589 39,365
FY2014 31,660 60 277 7,160 601 39,758 -1.0%
Woburn FY2010 71,819 1,066 654 11,609 8,451 93,599
FY2014 73,536 1,029 693 12,617 17,066 104,940 -12.2%

Green Communities Designation and Grant Program 28
Community Year4 Buildings Open
Space5 Streetlights Vehicles Water/Sewer Total
% Energy Reduction6
Worcester FY2009 399,510 6,165 30,998 69,375 37,491 558,267
FY2014 443,539 8,203 32,669 97,940 25,827 613,929 -10.0%
Green Communities Designation and Grant Program 29
Table A-4: Criterion 4 2014 Vehicle Fleet Additions
Community Exempt Non-Exempt Total 2014 Fleet Size
Acton 0 6 6 132
Amherst 19 6 25 231
Andover 3 3 6 149
Arlington 10 0 10 212
Ashfield 4 0 4 20
Ashland 0 0 0 90
Auburn 0 6 6 81
Barre 3 0 3 27
Becket 3 0 3 26
Bedford 8 13 21 76
Belchertown 0 0 0 79
Beverly 12 8 20 358
Boston 29 35 64 658
Bridgewater 0 0 0 79
Brookline 9 3 12 284
Buckland 0 0 0 11
Cambridge 21 9 30 350
Carlisle 1 1 2 44
Chelmsford 8 3 11 151
Chesterfield 5 0 5 13
Conway 5 0 5 18
Dedham 11 1 12 111
Deerfield 0 0 6 24
Easthampton 0 4 4 74
Easton 6 0 6 121
Gardner 2 1 3 3
Gloucester 0 0 0 84
Greenfield 15 2 17 133
Hamilton 4 0 4 40
Hanover 13 1 14 106
Hatfield 1 0 1 32
Holyoke 14 5 19 239
Hopkinton 4 3 7 95
Huntington 1 0 1 13
Kingston 2 0 2 72
Lakeville 7 0 7 50
Lancaster 2 1 3 56
Lenox 14 0 14 72
Leominster 0 0 0 215

Green Communities Designation and Grant Program 30
Community Exempt Non-Exempt Total 2014 Fleet Size
Leverett 6 0 6 21
Lexington 4 1 5 84
Lincoln 1 0 1 38
Lowell 9 0 9 347
Marlborough 0 3 3 142
Mashpee 9 0 9 98
Maynard 0 0 0 54
Medford 11 7 18 161
Medway 6 6 12 12
Melrose 4 9 13 119
Mendon 3 0 3 35
Millbury 6 0 6 57
Milton 8 2 10 138
Monson 14 0 14 85
Montague 2 0 2 43
Natick 14 1 15 134
New Salem 2 0 2 19
Newburyport 7 2 9 122
Newton 8 0 8 215
Northampton 9 3 12 238
Northfield 2 1 3 24
Palmer 12 0 12 46
Petersham 0 0 0 21
Pittsfield 57 2 59 331
Provincetown 6 0 6 78
Quincy 39 14 53 116
Revere 11 2 13 141
Rowe 2 0 2 16
Salem 8 5 13 182
Scituate 14 3 17 156
Sherborn 0 0 0 30
Shirley 0 0 0 33
Somerville 0 0 0 264
Springfield 22 17 39 584
Sudbury 8 3 11 49
Sutton 1 0 1 69
Swampscott 13 1 14 70
Tewksbury 7 0 7 119
Topsfield 0 0 0 30
Townsend 3 1 4 54

Green Communities Designation and Grant Program 31
Community Exempt Non-Exempt Total 2014 Fleet Size
Truro 1 0 1 56
Tyngsborough 0 0 0 12
Watertown 6 0 6 103
Wayland 0 0 0 14
Wendell 0 0 0 13
Wenham 2 0 2 31
West Tisbury 3 0 3 16
Westminster 10 0 10 33
Weston 0 0 0 32
Westwood 0 4 4 19
Whately 0 1 1 19
Williamstown 10 0 10 36
Winchester 4 1 5 120
Winthrop 0 0 0 75
Woburn 15 7 22 174
Worcester 31 13 44 298

Green Communities Designation and Grant Program 32
Table A-5. Criterion 5: Projects Built to the Stretch Code through 2014
Community New Residential
(NR) Residential
Renovation (RR) Commercial (C) HERS Range
Acton 260 511 118 45-70
Amherst 33 121 23 51-70
Andover 128 44 9 47-70
Arlington 10 0 0 48-66
Ashfield 6 3 0 58-58
Ashland - - - -
Athol 16 190 16 64-64
Auburn 22 29 4 50-66
Ayer 0 20 1 N/A
Barre 26 0 1 -
Becket 33 2 0 47-70
Bedford 58 62 39 41-66
Belchertown 61 0 0 4-70
Beverly 62 138 28 49-66
Boston - - - -
Bridgewater 58 0 0 54-70
Brookline 65 447 65 51-70
Buckland 2 0 0 60-60
Cambridge 44 630 45 42-65
Carlisle 44 0 0 38-65
Chelmsford 64 2 9 49-70
Chesterfield 6 5 0 57-67
Conway 5 0 0 -
Dedham 50 0 3 54-70
Deerfield 3 43 9 52-52
Easthampton 39 1 4 38-70
Easton 94 1 6 40-70
Gardner 43 368 47 56-67
Gloucester 88 17 0 28-70
Greenfield 14 0 13 55-70
Hamilton 13 6 0 46-68
Hanover 16 14 2 63-68
Harvard 20 0 0 -
Hatfield 7 0 0 70-70
Holyoke 29 2 22 54-69
Hopkinton 438 3 0 44-70
Huntington 2 0 0 66-66
Kingston 70 17 0 49-70
Lakeville 47 80 2 51-70

Green Communities Designation and Grant Program 33
Community New Residential
(NR) Residential
Renovation (RR) Commercial (C) HERS Range
Lancaster 17 1 0 54-70
Lenox 4 0 5 41-70
Leominster 42 3 3 54-70
Leverett 6 0 0 5-58
Lexington 188 65 5 38-69
Lincoln 7 24 0 53-53
Lowell 248 0 0 48-62
Marlborough 131 28 2 43-70
Mashpee 125 1 0 48-70
Maynard 28 58 1 55-70
Medford 23 605 59 58-70
Medway 55 0 0 51-70
Melrose 5 121 1 58-61
Mendon 36 7 3 51-70
Millbury 53 25 8 -
Milton 19 2 3 48-65
Monson 19 2 3 49-70
Montague 1 0 0 -
Natick 110 1 0 43-70
New Salem 2 0 0 57-61
Newburyport 42 0 0 45-70
Newton 222 0 0 44-70
Northampton 88 0 12 11-69
Northfield 1 26 0 60-60
Palmer 11 2 0 53-70
Petersham 0 0 0 N/A
Pittsfield 10 38 2 54-65
Provincetown 15 234 4 55-68
Quincy 56 2 9 46-70
Revere 13 0 0 42-68
Rowe 1 0 0 67-67
Salem 31 0 2 44-70
Scituate 86 18 0 46-70
Sherborn 3 5 0 57-57
Shirley 40 6 0 52-69
Somerville 5 0 0 -
Springfield 160 3 15 52-70
Sudbury 51 17 7 41-67
Sutton 61 1 0 51-66
Swampscott 11 3 1 48-70

Green Communities Designation and Grant Program 34
Community New Residential
(NR) Residential
Renovation (RR) Commercial (C) HERS Range
Tewksbury 90 0 0 33-68
Topsfield 26 0 0 52-69
Townsend 23 94 3 11-70
Truro 50 115 1 50-66
Tyngsborough 25 0 0 54-70
Watertown 0 224 47 N/A
Wayland 59 0 0 46-66
Wendell 3 0 0 -
Wenham 12 13 0 59-65
West Tisbury 11 1 1 48-48
Westminster 56 21 4 51-70
Weston 82 1 0 -
Westwood 17 2 0 45-64
Whately 10 0 0 67-67
Williamstown 3 12 6 47-62
Winchester 84 0 2 47-70
Winthrop 5 0 0 66-66
Woburn 25 19 10 50-64
Worcester 207 0 16 48-86

Green Communities Designation and Grant Program 35
Table A-6. Criterion 5: Total Number of Projects with HERS Below 55 for 2013 and 2014
Community 2013 Total <55
HERS 2014 Total <55
HERS
Acton 7 41
Amherst 4 4
Andover 9 17
Arlington 1 3
Ashfield 0 0
Ashland 0 0
Athol 0 0
Auburn 0 1
Ayer 0 0
Barre 0 0
Becket 2 9
Bedford 1 11
Belchertown 3 5
Beverly 0 3
Boston 105 147
Bridgewater 1 4
Brookline 1 2
Buckland 0 0
Cambridge 2 8
Carlisle 8 28
Chelmsford 1 5
Chesterfield 0 1
Conway 0 0
Dedham 1 2
Deerfield 0 1
Easthampton 15 25
Easton 1 4
Gardner 0 0
Gloucester 8 16
Greenfield 3 4
Hamilton 1 6
Hanover 0 0
Harvard 0 0
Hatfield 0 0
Holyoke 1 1
Hopkinton 25 208
Huntington 0 0
Kingston 1 2
Lakeville 2 3

Green Communities Designation and Grant Program 36
Community 2013 Total <55
HERS 2014 Total <55
HERS
Lancaster 0 1
Lenox 1 1
Leominster 1 2
Leverett 1 2
Lexington 45 87
Lincoln 2 2
Lowell 3 19
Marlborough - -
Mashpee 1 5
Maynard 0 1
Medford 0 0
Medway 1 4
Melrose 0 0
Mendon 1 1
Millbury 4 4
Milton 1 1
Monson 4 7
Montague 0 0
Natick 9 22
New Salem 0 0
Newburyport 0 4
Newton 89 128
Northampton 20 30
Northfield 0 0
Palmer 3 3
Petersham 0 0
Pittsfield 1 2
Provincetown 0 1
Quincy 3 5
Revere 2 9
Rowe 0 0
Salem 2 2
Scituate 3 7
Sherborn 0 0
Shirley 1 6
Somerville 0 0
Springfield 1 3
Sudbury 3 21
Sutton 5 9
Swampscott 0 3

Green Communities Designation and Grant Program 37
Community 2013 Total <55
HERS 2014 Total <55
HERS
Tewksbury 4 22
Topsfield 6 7
Townsend 0 0
Truro 0 1
Tyngsborough 0 1
Watertown 0 0
Wayland 9 13
Wendell 0 0
Wenham 0 0
West Tisbury 0 1
Westminster 0 3
Weston 0 0
Westwood 0 11
Whately 0 0
Williamstown 0 1
Winchester 5 18
Winthrop 0 0
Woburn 0 6
Worcester 6 10
TOTAL 184 372

79 Green Commun i t ies Des igna t ion and Gran t Program
www.mass.gov/doer/