Green Commodities Facility...UNDP Green Commodities Facility Palm oil scoping paper 6 | P a g e Area...
41
UNITED NATIONS DEVELOPMENT PROGRAMME Palm Oil Scoping Paper Green Commodities Facility UNDP Internal working document: March 2010
Transcript of Green Commodities Facility...UNDP Green Commodities Facility Palm oil scoping paper 6 | P a g e Area...

UNITED NATIONS DEVELOPMENT PROGRAMME
Palm Oil Scoping Paper
Green Commodities Facility
UNDP
Internal working document: March 2010

UNDP Green Commodities Facility Palm oil scoping paper
2 | P a g e
TABLE OF CONTENTS
1. Global Importance of Palm Oil ...................................................................................................... 4
1.1 Scale and global distribution of crop production ........................................................................... 4
1.2 Importance of palm oil in producing countries .............................................................................. 5
1.3 Food Security Issues ...................................................................................................................... 7
2. Global production and trade .......................................................................................................... 8
2.1 Identification of highest ranking producing countries ................................................................... 8
3. Supply chain dynamics .................................................................................................................. 10
3.1 Description of Supply Chain ........................................................................................................ 10
3.2 Description of major market flows ............................................................................................... 12
3.3 Role of the public sector in the supply chain ................................................................................ 12
3.4 Supply chain risks to companies from continued environmental degradation.............................. 14
4. Commodity Production Systems .................................................................................................. 16
4.1 Typology of production systems ................................................................................................... 16
4.2 Spatial distribution of different production systems ..................................................................... 17
4.3 Description of unsustainable practices of current production systems ......................................... 18
5. Relationship between commodity and ecosystem services ........................................................... 20
5.1 Contribution of ES to palm oil production ................................................................................... 21
5.2 Impact of commodity production on ES ....................................................................................... 22
5.3 Link to climate change ................................................................................................................ 25
5.4 Summary of environmental concerns due to commodity cultivation ............................................ 26
6. Commodity and livelihoods of low income producers ................................................................. 26
7. Green Commodity Production practices ..................................................................................... 27
7.1 Farm management practices ....................................................................................................... 27

UNDP Green Commodities Facility Palm oil scoping paper
3 | P a g e
8. Economic value of good agricultural practice showing benefits and trade offs .......................... 29
8.1 Input costs ................................................................................................................................... 29
8.3 Livelihood benefits from green commodity production ................................................................ 30
9. Barriers to scale up of good practices for change at a global level and national level ................ 31
10. Tools to promote sustainable palm oil production....................................................................... 32
10.1 Certification............................................................................................................................... 32
11. GCF STRATEGY ........................................................................................................................ 37
ANNEX I (Additional charts, tables and graphs to keep for database) .................................................... 38

UNDP Green Commodities Facility Palm oil scoping paper
4 | P a g e
1. GLOBAL IMPORTANCE OF PALM OIL
Summary
Palm oil is a significant and versatile raw material for both food and non-food industries. Consumption of
vegetable oils like rapeseed, soybean and palm oil has increased more than any other food over the past 30
years.1 Cooking oils comprise the majority of palm oil use, while products like margarine, cookies,
crackers, ice cream, candy, soap, candles, cosmetics and lubricants also require it. Well-known companies
such as Unilever, Procter & Gamble, Cargill and Nestle, to name a few, use palm oil in many of their
products. For example, Unilever is one of the world's largest buyers of palm oil, and the company alone
purchases 1.5 million tonnes a year for use in their products, which accounts for about 4% of the total
world supply.2
Globally palm oil tree cultivation exists on a total of 9.7 million hectares3 and Malaysia and Indonesia
account for about 85 percent of palm oil sold on the world market.4 Latin America and Africa sell the
remaining 15 percent.
Global demand for the oil is increasing due to population surges, as well as palm oil‟s potential as a first
generation biofuel. Countries like Malaysia and Indonesia are expected to become the world leaders of
palm oil-based biofuel exports. This increasing demand and consumption has placed palm oil on the
agendas of many international NGOs, multi-lateral organizations and governments.
1.1 Scale and global distribution of crop production
Major palm oil producers extend across Asia, Africa and South America. Top producing Asian countries
include Malaysia, Indonesia and Thailand. Nigeria, Cote D‟Ivoire, Colombia, Ecuador and Brazil lead
production in Africa and South America. Germany leads EU production of a small amount of palm oil,
followed by France and Italy. Below is a table from Oil World‟s 2006 report on major producing palm oil
countries dating back to the 1980s into the present (Figures x1000 metric tonnes).
Table 1: Major producing countries
Country 1980 1985 1990 1995 2000 2005 2005
Market
Share
Malaysia 2576 4133 6088 8123 10,842 14,962 44%
Indonesia 691 1243 2413 4220 7050 14,070 42%
Nigeria 433 386 580 660 740 800 2%
Thailand - - 232 354 525 685 2%
Colombia - - 226 388 524 661 2%
Papua
New
Guinea
- - 145 223 336 310 1%
Cote - - 270 285 278 260 1%
1 Clay, J. WWF 2004. World Agriculture and the Environment, pg 204. 2 http://www.unilever.com/sustainability/environment/agriculture/sustainablepalmoil/ (retrieved on 09/22/2009) 3 Clay, J. WWF 2004. World Agriculture and the Environment, pg 203.
(These figures are from 2004, Malaysia and Indonesia have since expanded their cultivated land), 4 Mongobay http://news.mongabay.com/2008/1108-palm_oil.html (retrieved on 09/15/2009)

UNDP Green Commodities Facility Palm oil scoping paper
5 | P a g e
D‟Ivoire
Brazil 12 29 66 75 108 169 0%
Others 875 1041 1000 5994 5191 1826 5%
World
Total
4587 6832 11,020 20,322 25,594 33,733 100%
Source: World´s Oil Report 2006
1.2 Importance of palm oil in producing countries
Employment and GDP
Palm oil cultivation and production employs close to seven million people worldwide, a combined labor
force of workers, smallholders and their families.
In Malaysia, palm oil provides employment and
livelihoods for 1.4 million people, directly employing
570,000. In 2003, Palm oil contributed to a little more
than 14 percent of Malaysian GDP, a number that has
been gradually shrinking. GDP in this country far
exceeds any other country as far as growth, and Chart 1
shows that increase from the 1970s through 2005.
Palm oil in Malaysia also contributes to 25 percent of
the world‟s traded oils and fats.
In other countries, such as Papua New Guinea, GDP
from agriculture accounts for 32.8%, and palm oil
production and processing have become the leading
commodity beating coffee and cocoa.
The Colombian palm oil farmers‟ and producer‟s
organization known as Fedepalma, which has presence
in 73 of its municipalities, provides 80,000 jobs
benefiting thousands of families and generates regional development.5
Brazil, another up-and-coming palm oil producer in Latin America, roughly produces about 110,000 tons of
crude oil per year. Recently Brazilian mining company VALE invested in a US$500 million palm oil deal
to produce 160,000 tons of biodiesel. In Brazil, this palm oil deal could offer a higher financial return than
could cattle ranching one of Brazil´s strong agriculture activities; in addition palm is estimated to employ
one employee for every 8-10 hectares, thus becoming highly attractive as a new source of employment.
This figure is extremely different than those from the cattle ranching industry, because a single cattle
rancher needs hundreds and thousands acres for his cattle to graze.6
5 Fedepalma http://www.fedepalma.org/palma.htm (retrieved on 10/07/2009) 6 Mongobay http://news.mongabay.com/2009/0624-vale_palm_oil_amazon.html (retrieved on 10/07/2009)
Chart 1: Palm oil share in Malaysia

UNDP Green Commodities Facility Palm oil scoping paper
6 | P a g e
Area of land covered
Malaysia alone produces 16-17 million tonnes of palm oil, a crop yield of about 20.6 tonnes per hectare.7
There are about 126 mills that can produce close to five million tonnes of palm oil and palm oil kernel.
Palm oil plantations have grown dramatically since the 1960s, from around 60,000 hectares to a current
four million hectares of cultivated land, representing 13 percent of Malaysia´s land. The state of Sabah is
the largest producer with 35 percent of the country´s total. Sarawak is the second largest producer with 13
percent of the country´s total production. Both states represent an approximate of 1.7 million hectares.8
The state of Kalimantan in Indonesia has also seen dramatic plantation expansion. In the mid 1980s there
was approximately around 13,140 hectares planted, a figure that has currently expanded into one million
hectares.9 According to Forest Watch Indonesia (FWI), in 2005 palm oil plantations had reached a total of
8.5 million hectares, which on a yearly average has amounted to about 260 thousand hectares.10
Expansion
of palm oil plantations is projected to increase another 4 million hectares by 2015, due to an increase in
world demand for biofuels.11
Map 1 below shows tropical forest loss from 2000-2005, where palm oil expansion has been the major
driver.
Map 1: Forest cover loss in Southeast Asia
The map illustrates three levels of forest cover
loss by region. Region 1 (in red) covers 6
percent of the total biome and contains 55
percent of forest cover loss; Region 2 covers 44
percent of the total biome and contains 40
percent of clearing; and region 3 covers 50
percent of the total biome and contains 5 percent
of the clearing.12
7 FAO 2007 State of Food and Agriculture, Page 16 8 Mongobay http://www.mongabay.com/borneo.html#oil_palm (retrieved on 12/21/2009) 9 Mongobay http://www.mongabay.com/borneo.html#oil_palm (retrieved on 12/21/2009) 10 Forest Watch Indonesiahttp://fwi.or.id/english/?p=140 11 Greenpeace http://www.greenpeace.org.uk/forests/palm-oil (retrieved on 11/02/2009) 12 World Resource Institute http://www.wri.org/stories/2008/07/groundbreaking-study-finds-hotspots-most-responsible-deforestation (retrieved on 11/05/2009)

UNDP Green Commodities Facility Palm oil scoping paper
7 | P a g e
In 2008, Thailand palm oil plantations reached 320,000 hectares13
, a number suspecting to increase
dramatically within the next 25 years because the government has issued a mandate that all diesel fuel must
have a component of palm oil in it. The government is already planning to increase plantations by 16
percent; from a current estimated 566,000 hectares, to 890,000 hectares by 2012.14
This mandate will
reduce imports of energy but will raise the prices of palm oil products, especially cooking oil. The
settlement is still in debate, but the expansions of new hectares of palm oil are foreseen in Thailand because
they are trying to become competitors in the Asian market.
1.3 Food Security Issues
Food security has become a pressing issue for the palm oil industry due to the emergence of biofuels; staple
foods have experienced price increases, making it a struggle for those living on less that a US$1 a day.
According to the FAO, palm oil plays a crucial role in the everyday diets of humans since it is in many
edible consumer products, and in a study conducted in 2008 palm oil globally represented a daily per capita
calorie intake of 50 out of approximately 2800.15
This is an important figure to note, since cooking oil is
one of the most common products used from palm oil cultivation.
Furthermore, Indonesia and Malaysia are emerging as major players in biofuels market. In the year 2017,
Indonesia is projected to produce close to three billion liters of fuel and Malaysia approximately 1.1 billion
liters.16
This production will surpass the current major biofuel producers like Brazil, the US and the EU.
Figure 6 is the FAO´s projections of major palm oil producing countries that will increase their efforts to
produce more fuel.
13 Inter Press Service http://www.wrm.org.uy/bulletin/137/Thailand_2.html (retrieved on 12/8/09) 14 Energy-Daily http://www.energy-daily.com/reports/Thailandz_worries_over_food_shortages_amid_palm_oil_debate_999.html (retrieved on 10/07/2009) 15 FAOSTAT 2006. World Food and Agriculture Outlook. Pg 2 http://faostat.fao.org/portals/_faostat/documents/pdf/world.pdf
(retrieved 09/18/2009) 16 FAO 2008. State of Food and Agriculture, The outlook for biodiesel. Pg. 49 (retrieved 09/09/09)
Future expansion from State Plantation Corporation PT Perkenunan Nusantara (PTPN) in Indonesia
Expansion of palm oil plantations is projected to double by 2025, when Indonesia will develop about 1.8 million hectares in the Kalimantan/Malaysia border region, where most of Borneo's remaining intact forests exists. The PTPN is partnering with China,
which will invest$7.5 billion in energy and infrastructure projects, including palm oil plantation expansion. Chinese investors
would directly control about 600,000 hectares of oil-palm plantations, while 1.2 million hectares would be slated for Indonesian companies. Based on extrapolations from an average 100,000 hectare concession, the total cost of the project is forecasted by
Friends of the Earth to be $8.6 billion.
The project would eventually employ nearly 400,000 people and generate an annual inflow of $45 million in tax revenue to the
state. The PTPN proposal calls for plantations to be established in three national parks, Betung Kerihun (800,000 hectares), Kayan
Mentarang (1,360,000 hectares), and Danau Sentarum (132,000) as well as surrounding "protection forest" and production forest under logging concessions.
According to Friends of the Earth (FOE), outside the parks, most forests areas in the region are under concession to logging firms, but due to the remoteness and lack of roads, few companies have fully logged their concessions.
Summary of article from FOE, 2006

UNDP Green Commodities Facility Palm oil scoping paper
8 | P a g e
Figure 6: Biofuel projection17
As the figure shows Indonesia and Malaysia will be the major players in the production of biofuels which
could continue to have repercussions on the increasing costs of inputs and the clearing of more tropical
forests and peatlands to fulfill a rising demand.
2. GLOBAL PRODUCTION AND TRADE
2.1 Identification of highest ranking producing countries
In the chart below, Indonesia (46 percent) and Malaysia (41 percent) own most of the market share.
Forecasts into the future will most likely continue to look like this chart as Indonesia and Malaysia continue
to expand their production.
Chart 2: Global market share for palm oil
The palm oil industry is extremely
lucrative. In Malaysia, 2008 monthly palm
oil prices were peaking around RM 3,489
(US$1,014) compared to RM 1,930
(US$561) in 2007 for Federal Land
Development Authority (FELDA)
settlers.18
However, these figures have
dramatically decreased because of the
global financial and economic crisis.
Crude palm oil in Indonesia has an export
value of US$4.43 billion and brought in
officially $42.4 million to the treasury in
2007. In that same year the prices per
17 FAO 2008. State of Food and Agriculture: The outlook for biodiesel. Pg. 49 (retrieved 09/09/09) 18 http://www.bnm.gov.my/files/publication/ar/en/2008/cp01_002_whitebox.pdf (retrieved on 09/21/2009)
46%
41%
3% 2%2%
6%
Market share of production
Indonesia
Malaysia
Thailand
Colombia
Nigeria
Other

UNDP Green Commodities Facility Palm oil scoping paper
9 | P a g e
metric ton were $400 an estimated $54 per barrel, making palm oil quite competitive with fluctuating oil
prices.19
Exports of palm oil from Malaysia to the rest of the world account for 90 percent.20
Table 2 is a
timeline that shows major oil crop production globally and estimated projections up to 2030.
Table 2: Oil crop timeline
Production of oil crops
(millions of tonnes)
Actual
oil
production
Growth rates, % per annum
1964/66 1974/76 1984/86 1997/99 2015 2030 1997/99 1969-
99
1979-
99
1989-
99
1999-
2015
2015-
2030
Soy 5.8 10.8 17.2 27.7 42 58 22.5 4.1 3.2 4.5 2.5 2.2
Palm 2.1 3.7 8.7 21.6 35 49 21.6 8.2 7.7 6.5 2.8 2.3
Total oil crops (soybeans, palm oil, rapeseed, sunflower seeds, groundnuts, coconuts, cottonseed, sesame
seed, other oil crops)
29 39 62 104 157 217 83 4.1 4.1 4.3 2.5 2.2
(Source FAO)
The first two rows represent both soy and palm oil production, and the bottom represents the total of all oil
crops production combined together. From Table 2, production of palm oil is quickly catching up to soy
and growth rates are slowly decreasing, which could have a correlation with the smaller amount of
available land available for cultivation.21
Characteristics of the international market
The international consumer market spans the globe, and as Table 3 below shows that China, EU countries
and India are the major importers of palm oil. Indonesia and Malaysia lead exports.
Table 3: Major palm oil exports, imports and consumption (figures in million of tonnes)
Country Exports
Imports Palm Oil
consumption
% of Global
Consumption
China 5.66 5.64 14.6%
Colombia 0.24 0.51 1.3%
EU-27 4.91 4.74 12.3%
India 0.01 3.55 3.58 9.3%
Indonesia 13.15 3.99 10.3%
Malaysia 14.15 0.39 2.32 6.0%
Nigeria 0.01 0.23 1.04 2.7%
Pakistan 1.67 1.58 4.1%
Thailand 0.25 0.04 0.74 1.9%
USA 0.71 0.67 1.7%
Other
Total
2.59
30.40
13.14
30.30
13.65
38.48
35.4%
Source from Lipidlibrary22
19 http://news.mongabay.com/2006/0425-oil_palm.html (retrieved on 09/21/2009) 20 Clay, J. WWF 2004. World Agriculture and the Environment, pg 207. 21 FAO 2003. World Agriculture Towards 2015, Pg. 101 (retrieved on 11/02/2009) 22 Lipidlibrary Data http://www.lipidlibrary.co.uk/market/palmoil.htm (retrieved on 11/02/2009)
UNDP Green Commodities Facility Palm oil scoping paper
10 | P a g e
3. SUPPLY CHAIN DYNAMICS
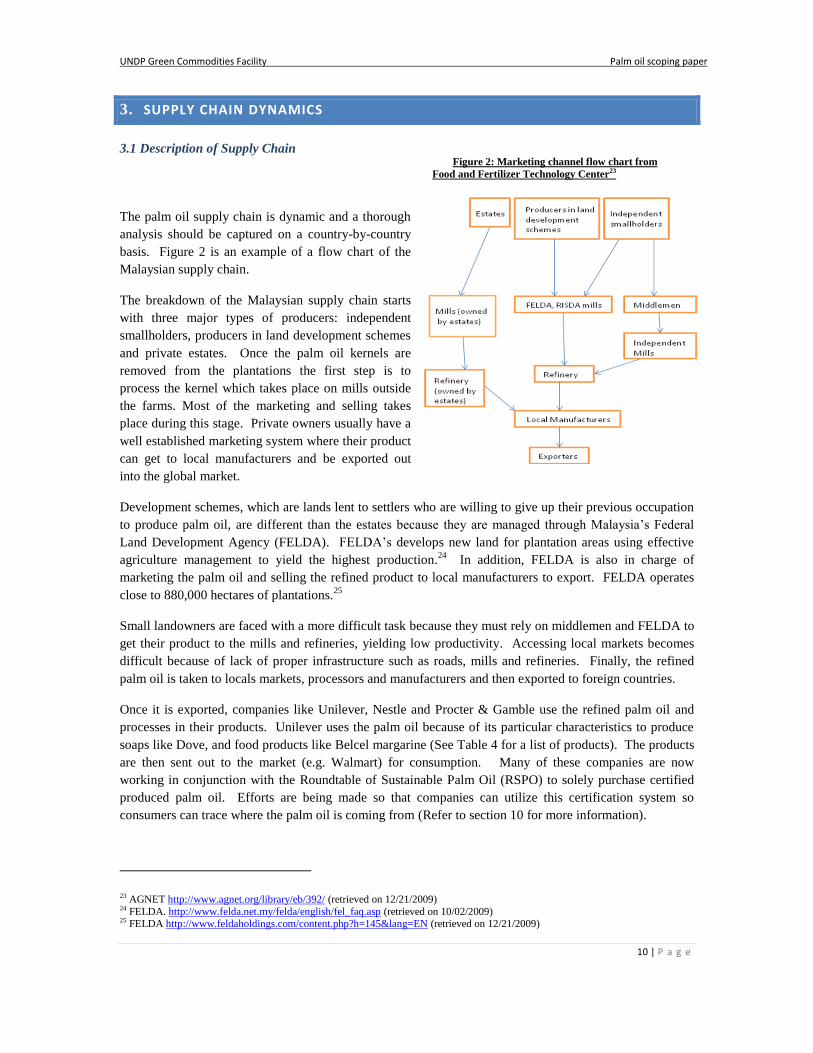
3.1 Description of Supply Chain Figure 2: Marketing channel flow chart from
Food and Fertilizer Technology Center23
The palm oil supply chain is dynamic and a thorough
analysis should be captured on a country-by-country
basis. Figure 2 is an example of a flow chart of the
Malaysian supply chain.
The breakdown of the Malaysian supply chain starts
with three major types of producers: independent
smallholders, producers in land development schemes
and private estates. Once the palm oil kernels are
removed from the plantations the first step is to
process the kernel which takes place on mills outside
the farms. Most of the marketing and selling takes
place during this stage. Private owners usually have a
well established marketing system where their product
can get to local manufacturers and be exported out
into the global market.
Development schemes, which are lands lent to settlers who are willing to give up their previous occupation
to produce palm oil, are different than the estates because they are managed through Malaysia‟s Federal
Land Development Agency (FELDA). FELDA‟s develops new land for plantation areas using effective
agriculture management to yield the highest production.24
In addition, FELDA is also in charge of
marketing the palm oil and selling the refined product to local manufacturers to export. FELDA operates
close to 880,000 hectares of plantations.25
Small landowners are faced with a more difficult task because they must rely on middlemen and FELDA to
get their product to the mills and refineries, yielding low productivity. Accessing local markets becomes
difficult because of lack of proper infrastructure such as roads, mills and refineries. Finally, the refined
palm oil is taken to locals markets, processors and manufacturers and then exported to foreign countries.
Once it is exported, companies like Unilever, Nestle and Procter & Gamble use the refined palm oil and
processes in their products. Unilever uses the palm oil because of its particular characteristics to produce
soaps like Dove, and food products like Belcel margarine (See Table 4 for a list of products). The products
are then sent out to the market (e.g. Walmart) for consumption. Many of these companies are now
working in conjunction with the Roundtable of Sustainable Palm Oil (RSPO) to solely purchase certified
produced palm oil. Efforts are being made so that companies can utilize this certification system so
consumers can trace where the palm oil is coming from (Refer to section 10 for more information).
23 AGNET http://www.agnet.org/library/eb/392/ (retrieved on 12/21/2009) 24 FELDA. http://www.felda.net.my/felda/english/fel_faq.asp (retrieved on 10/02/2009) 25 FELDA http://www.feldaholdings.com/content.php?h=145&lang=EN (retrieved on 12/21/2009)

UNDP Green Commodities Facility Palm oil scoping paper
11 | P a g e
However, because of public pressure some of the major palm oil producing companies have been taking
action. Chances are that these palm oil companies already knew but are only taking action because of the
public outcry about the environmental impacts that they create. One of the major organizations aiding the
palm oil companies is as just mentioned the RSPO, a conglomerate association that unites stakeholders
from seven sectors of the palm oil industry: Oil palm producers, palm oil processors or traders, consumer
goods manufacturers, retailers, banks and investors, environmental or nature conservation NGOs and social
or developmental NGOs developing and implementing global standards for sustainable palm oil. The table
below describes each sectors functions and interests (Refer to section 10 for more information).
Table 4: Main stakeholder´s interests and functions
Stakeholder Function and Interest
Oil palm producers Produce palm oil and achieve accredited sustainable status for their crop. Therefore must comply with no-burn policy for land management, conserve
biologically diverse areas, mitigation from palm oil pollution, reduce use of
fertilizers and pesticides, fair labor practices and improve yields.26 4 members
from this group sit on the RSPO General Assembly.
Palm oil processors/traders Process palm oil and are interested that the product they process comes from a
reliable RSPO member source. Processed palm is traded into the market as an accredited product. 2 members from this group sit on the RSPO General
Assembly.
Consumer goods manufacturers Manufacture products such as cooking oils, soaps, margarine, etc. Then product
is sold to retailers with an accredited certification status. 2 members from this group sit on the RSPO General Assembly.
Retailers Sell and showcase sustainable palm oil products for consumers to purchase. 2
members from this group sit on the RSPO General Assembly.
Banks and investors Responsible investment for palm oil industry, where they engage in improving
risk analysis and decision-making tools. 2 members from this group sit on the
RSPO General Assembly.
Environmental/Nature NGOs Represent civil society on the issues pertaining to environmental advocacy towards the palm oil industry (e.g. biodiversity protection). 2 members from this
group sit on the RSPO General Assembly.
Social/development NGOs Represent civil society on the issues pertaining to social aspects of the palm oil
industry (e.g. workers rights) 2 members from this group sit on the RSPO
General Assembly.
Table 5: List of palm oil products
26 Mongobay. http://news.mongabay.com/2008/1110-palm_oil.html (retrieved on 10/05/2009)
Major Buyers Edible Products Non-edible products
Unilever Bacel margarine Dove soap, Lux
Nestle KitKat, Good Start
Procter & Gamble Pringles
Cargill Cooking oil, butter oil replacement
Cadbury Schweppes plc Canada Dry, Dr. Pepper Halls Throat
Newman O‟s Newman O‟s champion chip cookies
Maruchan Instant Lunch noodle soups
Smart Balance Butter
HJ Heinz Heinz Ketchup, Bagel Bites
ConAgra Foods Blue Bonnet table spread
Nabisco Ritz crackers, Oreo
Arnott‟s Tim Tam chocolate
Johnson & Johnson Ben Gay, Purpose Soap
Reckitt Benckiser AirWick, Clearasil,
L‟Oreal Garnier

UNDP Green Commodities Facility Palm oil scoping paper
12 | P a g e
3.2 Description of major market flows
Palm oil produces more per hectare of land than any other oil-producing crop. Palm also is used in about
50 percent of all packaged foods in supermarkets today. As mentioned previously, palm can be found in
foods (i.e. margarine, ice cream) and non-edible products (i.e. shampoos, soap). Table 6 and 7 are a list of
the major buyers, manufacturers and producers of palm oil world wide.
Table 6: Major buyers of palm oil
Major Buyers and Manufacturers27 Sector
Sainsbury (UK), Marks & Spencer (UK), Migros (Switzerland), Asda (UK), Coop Switzerland
(Switzerland), Carrefour (France), Tesco (UK), ICA (Sweden), Co-Op (UK/Sweden), Ahold/Albert Hejin (Netherlands), SOK (Finland), IKEA (Sweden), Morrisons (UK), Delhaize (Belgium), Waitrose (UK),
Lidl (UK), Kesko (Finland), Rewe Group (Germany), E. Leclerc (France), Deen (Netherlands), Edeka
Zenntrale (Germany), Superunie (Netherlands), Super de Boer (Netherlands), Aldi (UK/Germany), Auchan (France), C1000 (Netherlands), Colruyt Group (Belgium), Geant Casino (France), Les
Mousquetaires (France), Magasin U (France), Metro (Germany), Spar International (Netherlands)
Retail
Young´s/Findus (UK), Unilever (UK/Netherlands), United Biscuits (UK), Burton´s Foods (UK), Premier Foods (UK), Arla (Sweden), Northern Foods (UK), Birds Eye (UK), Jordans Ryvita (UK), Mildola
(Finland), Nestle (Switzerland), Britannia Food Ingredients (UK), Warburtons (UK), Danone (France),
Axfood (Sweden), Raisio (Finland), Associated British Foods (UK), Brioche Pasquier (France)
Food
Unilever (UK/Netherlands), The Body Shop (UK/France), L´Oreal (France), Henkel (Germany), Reckitt Benckiser (UK), Boots (UK), Croda International (UK)
Personal/household care
Table 7: Largest palm oil producers
Producing Countries Major Companies
Indonesia, Malaysia, Thailand and Papua New Guinea
Astra Agro Lestari, Salim Group, Sinar Mas Group/PT SMART,
Barito Pacific, Bakrie Brothers, Duta Palma, PT Perkebunan
Nusantara, SOCFIN, PT PP London Sumatra, SIPEF, Cargill Indonesia, IOI Corporation, Wilmar International, Pacific Rim
Palm Oil Limited, IJM, IPOC, New Britain Palm Oil
Colombia FEDEPALMA
Nigeria PRESCO PLC
According to the WWF, In Sumatra, as of 2000, 70% of forest areas converted to oil palm plantations in
Indonesia lay within the six Sumatran provinces of Riau (658,139 hectares), Jambi (259,115 hectares),
Aceh (219,382 hectares), West Sumatra (134,885 hectares), Central Kalimantan (120,413 hectares) and
South Kalimantan (103,557 hectares) (Refer to page 15 for more information).28
An example of ownership
from the above table is Astra Agro Lestari; where they manage 250,883 hectares of oil palm plantations in
Kalimantari, Sumatra, and Sulawesi, and employs around 22,000 people.29
3.3 Role of the public sector in the supply chain
Description of marketing and purchasing by state
The two main institutions in Malaysia that oversee marketing information and pricing for palm oil are the
Palm Oil Registering and Licensing Authority (PORLA) and the Kuala Lumpur Commodity Exchange
(KLCE). PORLA is in charge of ensuring efficient market monitoring, collecting data and information
dissemination. KLCE is a price hedging facility that reduces the risks to industry participants. 30
27 WWF http://assets.panda.org/downloads/wwfpalmoilbuyerscorecard2009.pdf (retrieved 12/31/2009) 28 WWF 2007. Climate Change, Deforestation and the Role of Sustainable Palm Oil pg. 3 29 Astra Agro Lestari 2008 Annual Report. http://www.astra-agro.co.id/images/stories/Article/AnnualReport08.pdf (retrieved on
09/21/2009) 30 Mohd et al. Faculty of Economics and Management, Universiti Pertanian Malaysia. Pg 6 http://www.agnet.org/library/eb/392/ (retrieved 09/09/09)

UNDP Green Commodities Facility Palm oil scoping paper
13 | P a g e
Subsidies and incentives (agrochemical use, land extensification, energy)
Europe and the US have been major players behind subsidizing crops that can be used for biofuel
production. In the case of Europe, biodiesel is largely demanded as an alternative to petroleum. Malaysia
and Indonesia are setting aside parts of their production because palm oil is becoming another global
energy option. However, the urge to push biofuels on country´s agendas has caused skepticism because
now vast tracks of tropical forest and peatlands are being converted to palm oil plantations.
Europe is now beginning to rethink the large investment that they placed in subsidies for biofuels. In 2003,
the EU put forth a mandate called the EU Biofuels Directive, which demands that participating countries
have a minimum percentage (5.75%) of biofuels as an alternative to petroleum and diesel. The mandate is
under review since palm oil is one of the types of biofuels covered under this legislation (other sources are:
bioethanol, biodiesel, biogas, biomethanol and bio-oil).31
In spite of this, Malaysia and Indonesia´s efforts to feed the world´s demand for palm oil and most recently
as a biofuel, smallholder farmers are subsidized by the government to produce the crop. They are given
subsidies to purchase seedlings, fertilizers, herbicides and other supplies. In Indonesia, the government has
planned to pay 1000 rupiah (EU 0.07) per liter of palm oil produced; this remains true if the prices of
biofuels are higher than the price of crude oil.32
Producer country regulations on the commodity
In the case of the Malaysian palm oil industry, it is highly regulated. Currently, the industry is adhered to
more than 15 laws and regulations and following represent a few examples of them:
- Land Acquisition Act 1960
- Environmental Quality Act 1974
- Environmental Quality (Clean Air Regulations) 1978
- Pesticides Act 1974 (Pesticides Registration Rules)
- Occupational Safety and Health Act (1977)
- Protection of Wildlife Act 1972.
The industry also needs to comply with Hazard & Critical Control Points (HACCP) and the Environmental
Impact Assessment (EIA) requirements. Being sensitive and proactive with respect to current
environmental concerns, the industry is actively pursuing ISO 14000 standard series discussions and
formulations notably on climate change, life cycle analysis (LCA), eco-labeling & Design for the
Environment (DfE), environmental communications, and environmental management system (EMS).33
The Malaysian government recently released a public note that it will now prohibit the clear-cutting of
forests for any new establishment of palm oil plantations. The only areas that will be allowed the
development of plantations are areas that are specifically zoned for agriculture. The Malaysian Prime
Minister stated that they will not encourage deforestation for the purpose of palm oil plantations, that there
31 EU http://europa.eu/legislation_summaries/internal_market/single_market_for_goods/motor_vehicles/interactions_industry_policies/l210
61_en.htm (retrieved on 12/09/2009) 32 PalmOil HQ http://www.palmoilhq.com/PalmOilNews/indonesia-to-subsidise-palm-oil-biofuel/ (retrieved on 12/09/2009) 33 Malaysian Palm Oil Council (MPOC). http://www.mpoc.org.my/Palm_Oil_and_The_Environment.aspx (retrieved on 09/22/2009)

UNDP Green Commodities Facility Palm oil scoping paper
14 | P a g e
is still plenty of agriculture land available.34
The Malaysian government is trying to clean up their image
and improve their environmental standards. They have not joined the RSPO but do have an active chapter
in Malaysia, where many palm oil producers are members.
However, there exists somewhat of a flaw in this note presented by the Malaysian Federal Government.
The Federal structure relating to land (including land conversion) is under the jurisdiction of state
governments rather than the federal government, so the aforementioned policy would only hold its truth if
states agree to it. So far this is not a problem in most states, except in Sarawak. In this state the
government is still expanding into new areas where most of the remaining forests exist, including the
majority of the peat forests.35
Import regulations into US, EU, etc.
Regulations on imports are increasing especially in the EU. The demand for biofuel is rising and the EU is
setting targets of making them 5.75 percent of fuels for transport by 2010. However, the EU is concerned
that production of biofuel can increase deforestation rates and thus increase greenhouse gases.
The EU is proposing a ban on certain types of crops that come from forests, wetlands and grasslands. The
ban is targeting biofuels that come from crops such as palm oil. This would highly affect the Southeast
Asia palm oil industry, specifically in Indonesia where deforestation rates and peatland conversion are
expanding at alarming rates. The ban is being taken into consideration by EU officials until further
advancements, however officials emphasize that the source of palm oil come from sustainable sources (i.e.
RSPO).36
Regulations in the US, China and India are also rising. The regulations being created are pressures from
consumers demanding sustainable sources of palm oil in their products. Although China and India are the
major importers of palm oil, countries like Malaysia who export over 90 percent of their product, must
comply with what the world demands.37
3.4 Supply chain risks to companies from continued environmental degradation
Advocacy pressure groups
The palm oil industry is showing signs of improving their image. Companies are at risk because of the
public‟s pressure on the high rates of deforestation, habitat conversion and threats to critically endangered
species. The industry is at risk because of the purchasing power consumers have, especially when pristine
forests and the species living in them are directly threatened. Species such as orangutans, tigers, and bird
species are disappearing and have become the identity of many campaigns to boycott unsustainable palm
oil.
Advocacy groups such as Friends of the Earth, Greenpeace and The Palm Oil Action Group have been
pushing companies to eliminate palm oil or source RSPO certified palm oil for their products. Cadbury
34 Mongobay http://news.mongabay.com/2008/0626-palm_oil.html (retrieved on 09/28/2009) 35 Joseph De Cruz. Regional Advisor for GC Facility in Asia (retrieved on 11/05/2009) 36 NY Times http://www.nytimes.com/2008/01/15/business/worldbusiness/15biofuel.html (retrieved on 10/02/2009) 37 CEO Palm oil http://www.ceopalmoil.com/de-linking-ngos-concerns-over-deforestation-and-palm-oil/ (retrieved on 12/21/2009)

UNDP Green Commodities Facility Palm oil scoping paper
15 | P a g e
New Zealand recently issued a press release that they are eliminating all palm oil from their dairy milk
chocolate because of consumer pressure.
KFC Australia also recently issued a press release that it will be moving away from palm oil because of
consumer pressure to change the cooking oil used for frying. Health issues have been associated to the use
of palm oil, which is low in trans-fat but high in saturated fat contributing to cardiovascular diseases.38
Unilever by far is the biggest consumer of palm oil, whose popular products Dove soap and Flora
margarine use the oil as the primary component. Greenpeace groups have been protesting against Unilever
and about how they are not sourcing their palm oil from sustainable sources. As a founding member of the
RSPO, Unilever has recently halted contracts from two of their palm oil sources in Indonesia, Duta Palma
and PT Smart.39
Both these companies are members of the RSPO, but have been contributing to illegal
logging and the disappearance of orangutans, which is against Indonesian law.
Availability of land and expansion
Tropical forests and peatlands in Indonesia and Brazil are the two areas in the world where the largest and
fastest amount of land is being cleared for agricultural purposes. Indonesian palm oil production in the
1990s tripled, and from 2000 thru 2007 it doubled. This expansion is due to the global demand for food,
feed, and now biofuels. Agricultural subsidies in Indonesia are also adding incentives for farmers to
increase production in palm oil.
The following table shows how much land as of 2006 are currently plantations and what projections are
there for the future. To see a detailed map of the planned expansion, please see Map A.2 of Annex I.
Table 8: Area of Palm Oil Plantation and Future Government Planned Expansion
Province Area (Ha.) Area (Ha. Of expansion)
Sumatra
Nanggroe Aceh Darussalam 222,389 Sumatera Utara 1,093,033 1,000,000
Sumatera Barat 489,000 500,000 Riau 1,486,989 3,000,000
Jambi 350,000 1,000,000
Sumatera Selatan 416,000 1,000,000 Bangka Belitung 112,762 500,000
Bengkulu 81,532
Lampung Aceh
145.619
500,000 340,000
Java
Jawa Barat 3,747 Banten 17,375
Kalimantan
Kalimantan Barat 349,101 5,000,000 Kalimantan Tengah 583,000 1,000,000
Kalimantan Selatan 391,671 500,000
Kalimantan Timur 303,040 1,000,000
Sulawesi
Sulawesi Tengah 43,032 500,000
Sulawesi Selatan 72,133 500,000 Sulawesi Tenggara 3,602 500,000
Papua
38 The Sydney Morning Herald June 2009 http://www.smh.com.au/lifestyle/wellbeing/finally-kfc-opts-for-the-good-oil-20090616-
cdla.html (retrieved on 02/22/2010) 39 The Independent February 2010 http://www.independent.co.uk/environment/nature/unilever-drops-major-palmoil-producer-1906474.html (retrieved on 02/23/2010)

UNDP Green Commodities Facility Palm oil scoping paper
16 | P a g e
Papua 40,889 3,000,000
Total 6,059,441 19,840,000
Source: Forest People (2006)40
As seen in the table above, the expansion of palm oil in Indonesia is massive. The Indonesian Department
of Agriculture states that are approximately 27 million hectares of unproductive or degraded forest land
(i.e. logging and cultivation) that investors are interested in.41
This data brings forward multiple risks for
an industry already under large amounts of public pressure. Organizations such as the WWF, WRI, and
IUCN state that current palm oil practices are not sustainable, and forest laws like those that exist in
Indonesia are not being enforced. Furthermore, palm oil companies who are members of RSPO only put
the system under check, since one of their underlying principles for certification is not to plant on forested
lands. However, the lands in the table above are categorized under degraded lands; further research should
be conducted to determine the status of those degraded lands.
4. COMMODITY PRODUCTION SYSTEMS
4.1 Typology of production systems
Types of production systems
It is estimated that that more than 95 percent of palm oil is grown on acidic, less fertile soils. Most palm oil
soils have a pH less than 5.0, and six out of eight have low to very low nitrogen content, available
phosphorus and exchangeable potassium.
Palm oil planted on these types of soils reacts to the applications of fertilizers, and characteristics such as
texture and depth are crucial for large-scale plantations. Palm oil can grow on a wide range of soils, such
as igneous, sedimentary rocks, peat, and volcanic ash. In a study conducted by Better Crops International
(BCI), most palm oil is found planted in soils of about 60 cm deep. Palms that reach heights of over eight
meters, ideally need an extensive root expansion (>80 cm), adequate application of water and nutrients,
which why fertilizers are commonly used.42
Proportion of production carried out by small producers vs. agro-business and average
sizes/dimensions of production sites
In producing countries, palm oil is normally grown on three types of farms: small-scale, medium-scale and
large-scale farms. Although originally palm oil trees grow in the wild, the popularity of this commodity
has led to large-scale plantations.
40 Forest People (2006) http://www.forestpeoples.org/documents/prv_sector/oil_palm/promised_land_eng.pdf (retrieved on
02/23/2010) 41 Ibid 42 Better Crops International 1999. Suitability of Soils for Oil Palm in Southeast Asia,
http://www.ipni.net/ppiweb/bcropint.nsf/$webindex/0E6C325D25A04F80852568F6005A0DC1/$file/i99-1p36.pdf (retrieved 09/14/2009)

UNDP Green Commodities Facility Palm oil scoping paper
17 | P a g e
Small-scale farms are primarily used for basic subsistence. In Africa, a family cultivates in a small plot.
These plots may cover approximately 7.5 hectares and are usually scattered. The land tenure system does
not permit large-scale farming unless the government acquires the land for public use.43
Medium-scale farms can range from 10-500 hectares. The practices usually include modern agricultural
practices like fertilization, weeding, plant spacing and cover cropping. Contrary to small-scale farmers,
medium-scale farmers sometimes own their mills because of poor conditions and access to roads.44
In parts
of the Americas, farmers with palm oil plantations of 400 hectares have been constructing their own mills.45
This is because many of these areas are extremely rural and do not access to an efficient roadway system.
Large-scale farms cover areas that extend across 500 hectares or more. In Africa they are well established
state-owned enterprises that use sophisticated farming techniques. Many large-scale farms are now being
bought by private entities so governments will not engage in businesses.46
In Latin America and Southeast Asia palm oil production is comprised mainly of large-scale plantations. In
Southeast Asia plantations can range in size anywhere from four square kilometers (400 hectares) to 729
square kilometers (72,900 hectares).47
In addition, large-scale farms usually have nurseries that accompany
their operations. These nurseries grow palm oil seedlings that are planted within a year. Within two to
three years the palms start to flower, and can produce fruits anywhere up to 50 years.48
4.2 Spatial distribution of different production systems
Map showing geographical distribution of different systems of production
Map 2: USDA49
Map 2 is an example of where and how large
the Indonesian palm oil production has
expanded and grown throughout the country,
specifically in Sumatra where production is
the greatest. To see an example of the major
Malaysian palm oil regions refer to Map A.1
in Annex I.
43 FAO 2002. Small-scale oil processing in Africa, http://www.fao.org/DOCREP/005/y4355e/y4355e03.htm#TopOfPage (retrieved
09/14/2009) 44 FAO 2002. Small-scale oil processing in Africa, http://www.fao.org/DOCREP/005/y4355e/y4355e03.htm#TopOfPage (retrieved 09/14/2009) 45 Clay, J. WWF 2004. World Agriculture and the Environment, pg 212. 46 FAO 2002. Small-scale oil processing in Africa, http://www.fao.org/DOCREP/005/y4355e/y4355e03.htm#TopOfPage (retrieved 09/14/2009) 47 Clay, J. WWF 2004. World Agriculture and the Environment, pg 208. 48 Clay, J. WWF 2004. World Agriculture and the Environment, pg 208. 49 FAO 03/19/2009. http://www.pecad.fas.usda.gov/highlights/2009/03/Indonesia/ (retrieved on 09/15/2009)

UNDP Green Commodities Facility Palm oil scoping paper
18 | P a g e
4.3 Description of unsustainable practices of current production systems
Production extension (deforestation)
Figure 3: Photo from Treehugger
Indonesia and Malaysia are the main countries in the world
where deforestation for palm oil is occurring at alarming
rates. Forests are being replaced by medium and large-
scale plantations, for which they must be clear-cut or
burned. The lands are then shaped into grids, as shown in
Figure 3.50
Current rates of deforestation in Indonesia are some of the
largest in the world. According to the FAO, between 2000
and 2005 Indonesia became the nation with the second
largest area of deforestation in the world with about 1.87
million hectares cleared annually, nearly two percent of its
forest each year.51
Brazil is currently in the lead with 4.3
million hectares from 2000-2005.52
During the mid-1990s, the Indonesian government set aside 9.13
million hectares for palm oil cultivation. By 2004, 58 percent of this area was planted, and the rest is still
being cleared because of their 2025 projections doubling palm oil production.53
Most recently and
according to Global Forest Watch, 16 million hectares of natural forest have been designated to timber
companies or agriculture plantations.54
In the beginning of the 20th
century, crops such as cocoa, rubber, palm oil, coffee, pineapple and tea were
the main crops being planted in Indonesia and Malaysia. However, through the great depression, WWI and
WWII, most of these crops gave way to palm oil as the main crop. Rubber and cocoa farms are still
present, but are struggling to remain profitable, which is why palm oil is the leading commodity for export.
Therefore, Indonesia and Malaysia have a good quantity of hectares of degraded land that can be used
instead of pristine rainforests, a fact that some palm oil companies are taking into consideration. A few
cases where this is most notable are in the regions of Sabah and Sarawak in Malaysia, where rubber farms
are being replaced by palm oil.55
The conversion of tropical forests to palm oil plantations has raised many issues across the globe. In
Southeast Asia deforestation poses a major threat to biodiversity and the ecosystems of the region.
According to the World Resource Institute (WRI), at current rates of deforestation Indonesia is losing two
million hectares of forest every year.56
Malaysia and Indonesia are categorized by the World Resource
Institute (WRI) as biologically diverse hotspots, home to some of the most unique species in the world.
Habitat conversion of tropical and peatland forests is also affecting endangered species in Southeast Asia,
specifically orangutans in Sumatra and Borneo. Scientists estimate that there are only around 60,000
50 Treehugger photo http://www.treehugger.com/20090217-oil-palm-plantation.jpg (retrieved on 09/15/2009) 51 FAO 2006. http://www.palmoilaction.org.au/pages/deforestation.html (retrieved on 09/15/2009) 52 Mongobay. http://news.mongabay.com/2005/1115-forests.html (retrieved 10/02/2009) 53 Mongobay, http://news.mongabay.com/2006/0425-oil_palm.html (retrieved 10/02/2009) 54 Global Forest Watch http://www.globalforestwatch.org/english/indonesia/forests.htm (retrieved on 12/08/2009) 55 Clay, J. WWF 2004. World Agriculture and the Environment, pg 209. 56 World Resource Institute (WRI). http://www.globalforestwatch.org/english/indonesia/overview.htm (retrieved on 09/17/2009)

UNDP Green Commodities Facility Palm oil scoping paper
19 | P a g e
orangutans in wild and on average about 5000 orangutans are killed yearly. At this rate it is possible that
orangutans go extinct in close to 12 years. According to the IUCN orangutans in Sumatra are listed as
critically endangered. As palm oil plantations continue to expand habitat fragmentation will be the
orangutan‟s number one threat. In addition, orangutans are also illegally poached and deliberate forest fires
are set to clear cut their habitat.57
The following are other species that are under severe threat from the
expansion of palm oil in Southeast Asia: Borneo Orangutan, Sumatran Orangutan, Sumatran Tiger, Borneo
Wild Cats, Asian Elephant, Jaguars, Sumatran Rhinoceros, Tapir and Sun Bear.
The island of Borneo is also another area with high deforestation rates. The map below shows forest cover
in 1950 compared to 2005. During the 1990s many forested areas caught fire clearing many thousands of
acres and international NGOs blame the logging and palm oil corporations.
Map 3: Forest cover from WWF58
Labour requirements and mechanization
Palm oil plantations are labor-intensive. The trees must be looked after and protected so they can develop
into productive crops, requiring careful pruning and cutting of the kernel bunches to avoid damaging the
plant. Healthy plantations require protecting the palm oil tree throughout its fruit-producing life and
making sure that other crops do not take away the resources it needs, such as nutrients, water and light.
Therefore, fertilizers and herbicides are applied to keep the trees pest-free and productive.
Water use requirements and mechanization
Palm oil is a fast growing crop with high productivity, so it is water-intensive. Most palm oil is grown in
tropical regions, and rain water is utilized to the fullest. However, because palm oil plantations intend to
produce fruit at the highest yields, many plantations in Southeast Asia have been implementing drip
irrigation systems. The crop water requirement is estimated at 1.4 to 2.8 mm/day in the nursery stage and
2.4 to 5.5 mm/day in the main field.59
However according to an article written by AllBusiness, plantations do waste rain and surface water
through inefficient storage and distribution. The inefficiency is high because many palm oil plantations are
57 http://goliath.ecnext.com/coms2/gi_0199-4243373/Runaway-fires-smoke-haze-pollution.html (retrieved on 10/02/2009) 58 WWF map. http://hubpages.com/hub/The-Problem-With-Palm-Oil (retrieved 09/17/2009) 59 Netafim 2009. http://www.netafim.com/crop/oil-palm (retrieved on 09/18/2009)

UNDP Green Commodities Facility Palm oil scoping paper
20 | P a g e
in areas that yearly receive rainfall of about 2000mm+. Since proper storage is unavailable, fertilizer
runoff and pollution of local waterways commonly occurs. If irrigation was to be developed on field, scale
benefits could be far greater than just higher yields-water could be harnessed in irrigation structures which
are commonly utilized for drinking water as well.60
Chemical inputs
Rats are the most common pests found in palm oil plantations, because they feed on the palm oil seeds.
When forests are cleared, rats lose their predators like snakes, and poison is used to kill them off. This is
successful; however the poison spreads and kills other animals as well. Other pests that exist on plantations
are bagworms and nettle caterpillars. These insects feed on the palm oil branches and fronds damaging
them to point of decay. Insecticides are used and are either applied by spot spraying or injection into the
trunks of the palm oil tree.
Furthermore Paraquat is an herbicide used on plantations and is commonly used worldwide, and has
negative side effects if inhaled or exposed to skin. Paraquet has been a successful herbicide used on weeds
like ferns and woody shrubs. However, the main risk associated with this herbicide is the plantation
workers‟ exposure to it, because it can cause nosebleeds, eye irritation and skin irritation.
Other chemical inputs for oil plantations are the use of fertilizers to enhance the palm oil yields, although,
palm oil requires fewer fertilizers than other oil seeds. The major fertilizers used for palm oil plantations
are nitrogen, phosphorus and potassium. Problems arise from the runoff of these chemicals because they
get into the local waterways contaminating downstream communities‟ water supply.
Review of intensification processes, green revolution, and higher yielding varieties for the crop.
Palm oil yields have grown due to implementation of newer agricultural techniques, such as the application
of fertilizers. Trees are now more productive than previous generations of palm oil; trees would reach their
prime in years 20-25, however now the palm oil tree can begin to produce extractable fruit within 2-3
years.
In Indonesia and Malaysia, the agriculture sector is experimenting with eight new hybrid clones, which are
expected to increase production from 3.5 tons of oil per hectare per year, to as much as 6.8-8.0 tons per
hectare per year.61
5. RELATIONSHIP BETWEEN COMMODITY AND ECOSYSTEM
SERVICES
According to the Millennium Ecosystem Assessment, ecosystem services are the benefits humans receive
from resources and processes that natural ecosystems provide. They are broken down into four different
types of services, provisioning (food, water, timber and fibers); regulating (affects climate, floods, disease,
wastes, and water quality); cultural (recreational, aesthetic and spiritual benefits); and supporting (soil
formation, photosynthesis and nutrient cycling).
60 http://www.allbusiness.com/manufacturing/food-manufacturing-grain-oilseed-milling/306427-1.html (retrieved on 10/02/2009) 61 Forest Peoples Programme pg. 26 http://www.forestpeoples.org/documents/prv_sector/oil_palm/promised_land_eng.pdf (retrieved on 02/23/2010)

UNDP Green Commodities Facility Palm oil scoping paper
21 | P a g e
This next section will aid in the understanding of what ecosystem services, like those just mentioned above,
contribute to the cultivation and production of palm oil.
5.1 Contribution of ES to palm oil production
Pollination
Palm oil is a cross-pollinated crop. Pollination of can be aided if a weevil (Elaedobius kamerunicus) is
introduced into the plantation to assist in fertilizing the female flowers. The weevils congregate and
multiply on male inflorescence during flower opening, and visit the female flowers and pollinate them
effectively.
Water Availability and Quality
Water availability and quality are essential for the cultivation of palm oil. The majority of palm oil is
planted in areas that receive large amounts of rain, such as in the tropics, where a healthy tree needs close
to 1800-2000mm of rainfall per year, high air humidity and at least 1900 hours of sunshine. Water quality
is also another important component since it helps cycle nutrients and maintains pH levels suitable for
proper growth of palm oil tree.
Pest control
As stated before, rats are the biggest pests to palm oil plantations, and pesticides are used to remove them.
The pesticides kill the rats but the pesticides also kill other animals. In an effort to reduce the use of
pesticides, barn owls are becoming a common technique to remove rats. According to Chumporn Palm Oil
Industry Public Company Limited (CPI) a major palm oil company in Thailand, a barn owl can eat two rats
a day or 700 per year.62
Therefore, this company has implemented their own barn owl project to alleviate
the use of pesticides on their plantations.
Soil fertility
For palm oil, measures are taken to ensure soil productivity. Many plantations have slopes; therefore silt
pits are applied to shrink the size of the slope and prevent soil erosion. These pits also help contain the
necessary nutrients for soil fertility. In addition, ground cover or leguminous crops are planted to maintain
nitrogen, decompose organic matter, reduce erosion, and to keep weeds away. 63
Organic matter plays an
important role in soil fertility of palm oil. Old palm fronds and old palm oil kernel bunches can serve as
good contributors to creating organic matter.
Agro-Biodiversity
Buffer zones can play important roles in crop cultivation. Monocultures such as palm oil can benefit from
buffer zones surrounding a plantation because they contribute to reducing runoff from soil erosion, enrich
soil quality, assist in pollination, attract wildlife and manage pests that affect palm oil.
62 http://www.cpi-th.com/en/rd.php (retrieved 09/22/2009) 63 http://www.mpoc.org.my/Palm_Oil_and_The_Environment.aspx (retrieved 09/22/2009)

UNDP Green Commodities Facility Palm oil scoping paper
22 | P a g e
Crop Genetic Diversity
There are two types of palm oil species, Elaeis oleifera (H.B.K) Cortes is native of America; and the
species Elaeis guineensis Jacq., which originated in the Gulf of Guinea in West Africa better known as the
African oil palm.64
The palm oil trees are quite similar, however, they are diverse in the sense that they can
grow on various types of soil, such as igneous, sedimentary rocks, peat, and volcanic ash.
5.2 Impact of commodity production on ES
Deforestation Map 4: Forest change rates
Deforestation is the number one environmental
impact associated with this commodity. Indonesia
and Malaysia are losing forests at rates exceeding
1.5 percent per year and according to the FAO‟s
2007 report, “State of the World‟s Forests”; these
are among the highest rates of loss in the world.
Palm oil is one of the drivers of deforestation.65
Around three-quarters of the world's palm oil is
grown in Indonesia and Malaysia where much of the
recent expansion of the industry has been onto
peatlands and into tropical rainforests.
Indonesia
In Indonesia forest fires dominated deforestation rates during the 1990s, a result from poor logging and
agricultural practices, and the expansion of palm oil plantations. Furthermore, pests and diseases also
impacted forest productivity and an approximate 10 million hectares were affected during 1998-2002.
Figure 466
below shows the different disturbances that have
contributed to deforestation rates.
According to Global Forest Watch, Indonesia was heavily
forested in the 1950s, of which 40 percent of them were
cleared in the next 50 years. The forest cover of Indonesia
fell from 162 million hectares to 98 million hectares. Their
figures estimate that about one million hectares per year were
cleared in the 1980s, an amount that rose to 1.7 million
hectares in the 1990s, and is expected to have reached 2
million hectares.
64 http://www.kissankerala.net/kissan/kissancontents/oilpalm.htm (retrieved on 02/17/2009) 65 FAO 2007 State of the World´s Forests pg. 15 66 FAO 2007 State of the World´s Forests pg. 18
Figure 4: Forest disturbances

UNDP Green Commodities Facility Palm oil scoping paper
23 | P a g e
However, according to the UK Department for International Development (DFID), Indonesia lost 30
percent of forest cover over the last few decades and now forests cover 60 percent of land. It is estimated
that by the year 2020, Indonesia will clear another 16 million hectares of a combination of tropical forests
and peatlands. However, the World Bank states that since 1990, deforestation rates have declined to a third
of that rate. Additionally, the Indonesian Ministry of Forestry currently plans to reforest 33 million
hectares of degraded land.67
There are two drivers behind deforestation in Indonesia, logging and agriculture. Concessions are licensed
to logging firms who thus clear land for palm oil plantations. It is estimated that since the early 2000s,
palm oil has expanded 273,000 hectares per year, with a current total of seven million hectares of planted
palm. Alarming though to note that expansion is suspected to continue, doubling in ten years.68
Malaysia
In Malaysia deforestation rates have also been accelerating. According to Friends of the Earth (FOE), they
state that 87 percent of the deforestation between 1985 and 2000 was directly related to palm oil
cultivation. During that time, there were approximately six million hectares of rainforest converted to palm
oil in Borneo and Sumatra. It is also estimated that in Borneo, there will be another six million hectares
converted into palm oil.69
More specifically and according to a more recent report produced by Friends of the Earth, the region of
Sarawak in Malaysia is still foreseen to have continued expansions of plantations over the next decade.
The region has licensed hundreds of companies to more than double the state´s palm oil acreage from 2007
levels to 1.3 million hectares in 2010. In addition, the Sarawak government has licensed 2.8 million
hectares to multiple logging groups, 290.000 hectares will be specifically plantations.70
Table 9: Land use planned changes for agriculture (in 1000 hectares)
Crop 2005 2010 Difference
Palm Oil 4,049 4,555 506 Rubber 1,250 1,179 -71
Cocoa 33 45 12
Coconut 180 180 0
Other 870 932 62
Total 6,382 6,891 509
Source Friends of the Earth
67 UK Department for International Development http://www.dfid.gov.uk/media-room/press-releases/2010/uk-partners-with-
indonesia-to-fight-climate-change/ (retrieved on 02/08/2010) 68 Ibid 69 New America Media http://news.newamericamedia.org/news/view_article.html?article_id=37e104044bb11d19d566ac8f3621c63f
(retrieved on 12/22/2009) 70 Friends of the Earth (October 2008) ¨Malaysian Palm Oil – green gold or green wash¨ pg. 5
Greenpeace´s pledge to insert Indonesia´s deforestation rates in to Guinness Book of World Records:
Between the years 2000-2005, Indonesia had the fastest rate of deforestation, destroying an equivalent of 300 soccer fields every
hour. Greenpeace applied to the Guinness Book of World Records to have Indonesia as the number one in rainforest deforestation acknowledged in the 2008 edition of the book, and the citation reads as the following: ¨Of the 44 countries which collectively
account for 90% of the world's forests, the country which pursues the highest annual rate of deforestation is Indonesia with 1.8
million hectares (4.4 million acres) of forest destroyed each year between 2000-2005; a rate of 2% annually or 51 km2 (20 miles2) destroyed every day.¨
Greenpeace 2008

UNDP Green Commodities Facility Palm oil scoping paper
24 | P a g e
Table 9 above shows the planned changes in land use in relation to agriculture, and as can be seen from
2005 to 2010 the majority of land use is related to palm oil expansion.71
This expansion is part of
Malaysia´s ninth version Master Development Plan, also known as MP9. Important to note from the MP9,
the palm oil industry can no longer depend on the conversion of rubber or cocoa plantations, and all new
palm oil expansion will have to depend on natural forest.72
Carbon emissions
The clearance and burning of Southeast Asia's peat forests release two billion tonnes of greenhouse gases
every year. According to some estimates, deforestation in Indonesia alone accounts for four percent of
global greenhouse gas emissions, making it the third-highest emitter behind the US and China.73
According to a study done by the University of Leicester, peatlands serve as tremendous carbon sinks,
accumulating 2.6 metric tons of CO2 per hectare per year. Extrapolating for the 420,000 hectares of oil
palm plantations established on peatlands in Malaysia and 2,800,000 hectares for Indonesia, the researchers
estimate emissions of 3,220 million metric tons of CO2.74
Indonesia is also one of the largest emitters of
CO2 as a result of the „slash and burn‟ techniques often employed by palm oil companies to clear land.
However, the Malaysian Palm Oil Council (MPOC) states that their plantations serve as carbon sinks, and
in efforts to combat climate change, recently released a video claiming that their 600 million oil palm trees
make their plantations one of the world‟s largest carbon sinks, and that 60 percent of Malaysia is still
covered by tropical rainforests. International NGOs have criticized these types of statements, accusing
MPOC of greenwashing. NGOs state that many of their alleged statements are not true, especially when
they reference biodiversity and deforestation.
Water pollution
Runoff from pesticides, herbicides and soil erosion from plantations contaminate waterways. The most
severe type of water pollutant comes from the mills that process the palm oil. The palm oil when refined
produces a sludge that is often times released into the local waterways without any proper treatment,
harming fish. Downstream from the processing mills local villages lose an important source of viable food.
Habitat degradation
African palm oil for many generations has been a subsistence crop, but monocultures have been popping up
in West Africa, and also in Latin America. However, the planting of palm oil globally has its largest
effects on habitat degradation in Southeast Asia, specifically in Indonesia. There exists about 20 million
hectares of abandoned land that is designated for agricultural purposes, instead during the 1990s
concessions were granted mostly for forests to plant palm oil.75
Most of the degradation of forests is
occurring on low lying forest and peatlands, prime orangutan habitat. The current rate of degradation in
71 Friends of the Earth (October 2008) ¨Malaysian Palm Oil – green gold or green wash¨ pg. 29 72 Ibid 73 Unilever http://www.unilever.com/sustainability/environment/agriculture/sustainablepalmoil/ (retrieved on 09/22/2009) 74 Mongobay News http://news.mongabay.com/2007/1217-palm_oil.html (retrieved on 09/23/2009) 75 Clay, J. WWF 2004. World Agriculture and the Environment, pg 218..

UNDP Green Commodities Facility Palm oil scoping paper
25 | P a g e
Sumatra shows estimates that yearly 800 orangutans die through palm oil related causes, and the largest
populations are foreseen to decline by 50 percent in the next 4-6 years.76
5.3 Link to climate change
GHG emissions contribution by commodity production and transport and mitigation options
Agriculture and deforestation are heavy contributors of GHG. Figure 5 below is from a report developed
by the World Bank and on it states that on an aggregate agriculture and deforestation compromised 26
percent of the total global GHG emissions.
Figure 5 Agriculture and deforestation contribution to GHG77
The palm oil industry has had a significant
affect on contributing to the driving forces
behind climate change. In tropical forested
countries (i.e. Indonesia and Malaysia) the
level of GHG emissions has increased due to
the conversion of habitat (i.e. tropical forests
and peatlands).
Source World Bank
Currently, Indonesia is ranked third on the GHG emissions list, falling short behind the US and China
taking up 20 percent of the world´s emissions. According to the WWF, habitat conversion of tropical
forests and peatlands to palm oil plantations results in high levels of CO2 emissions. They state that
Indonesia´s primary forests can store approximately 230 tonnes of carbon per hectares, while secondary
forests store close to 176 tonnes per hectare. This figure is different for palm oil plantations, where they
can store around 91 tonnes per hectare, making a difference in close to 160 tonnes per hectare (primary
forest conversion).78
Adaptation strategies required in supply chains in light of climate change
In the forefront of adapting and mitigating climate change for the palm oil industry, the Roundtable of
Sustainable Palm Oil (RSPO) with its founding partners WWF and Unilever, have begun confronting and
engaging the palm oil industry. In 2007, the WWF released a report that highlighted the main drivers in
reducing emissions directly for the palm oil sector, and the following is a list of their interventions79
:
- Reviewing the permit allocation process for oil palm developments
- Strong cross-sectoral coordination to review the permits.
- Reallocating palm oil away from forest and peatlands
- Optimising degraded lands
76 The oil for ape scandal. How palm oil is threatening orangutan survival, 2005, pp 17 – 18
http://www.foe.co.uk/resource/reports/oil_for_ape_full.pdf 77 World Bank 2008. World Development Report ¨Agriculture for Development¨ pg. 17 http://siteresources.worldbank.org/INTWDR2008/Resources/2795087-1192111580172/WDROver2008-ENG.pdf (retrieved
12/10/2009) 78 WWF 2007. Climate Change, Deforestation and the Role of Sustainable Palm Oil pg. 2 79 Ibid

UNDP Green Commodities Facility Palm oil scoping paper
26 | P a g e
- Increasing yields of smallholder plantations
- To replant over-mature plantations
- Prevention measures that can minimize the risks of destructive fires
5.4 Summary of environmental concerns due to commodity cultivation
Table 10: Cultivation methods
Cultivation Type Main Characteristics of Cultivation Type Associated problems
Monoculture
*Side note: Some plantations are placed on grades, thus
runoff can cause problems
down slope, however silts are applied to contain soil erosion
and trap nutrients. For the
purpose of this scoping paper this what not necessarily any
different than what is normally
done
-Conversion of Forests
-Pesticides
-Herbicides
-Fertilizers
-Refinery/Mills
.
Loss of biodiversity and habitat
encroachment of endangered species (i.e. orangutan, tiger, Asian elephant,
rhinoceros, bird species). CO2 emissions released when forests are
cleared or peatlands burned.
Kills rats but also kills other animals.
Health risks to plantation workers, such as eye and skin irritation.
Runoff causes soil erosion and pollution to waterways.
Disposal of untreated palm oil sludge from the mills is released into the water
contaminating fish stocks.
6. COMMODITY AND LIVELIHOODS OF LOW INCOME
PRODUCERS
Small scale and subsistence farming
In many palm oil plantation areas such as Borneo, lack of economic activity creates a stress on small scale
farmers. Employment opportunities are normally given out by large palm oil firms since many small scale
farmers lack proper land titles and the capital to invest in inputs for a larger scale type production. Many
large scale palm oil firms offer deals to employees to give them a hectares of land to develop while they
work on the plantations. This is a difficult burden for a small scale farmer since daily wages on a
plantation are around $2.50 a day, and a palm oil tree takes roughly seven years to produce fruit.80
In efforts to boost production and increase income generation, small scale farmers are looking into the
feasibility of certifying their plantations. In Indonesia, small scale farmers own approximately 3.3 million
(46 percent) of the 7.7 million hectares planted on Indonesian soils. However, many small scale farmers
are not committing to the certification because of the high price to become certified and there are no
80 Mongobay News http://www.mongabay.com/borneo/borneo_oil_palm.html (retrieved on 02/17/2010)

UNDP Green Commodities Facility Palm oil scoping paper
27 | P a g e
premiums offered for palm oil on the world market. Similarly in Malaysia, the government has pledged
$15 million to help farmers move towards more sustainable practices.81
Health impacts from commodity production
As previously mentioned, Paraquat is used on palm oil plantations and is commonly used worldwide,
however it has negative side effects if inhaled or exposed to skin. Therefore, the risks associated with this
herbicide is the exposure and inhalation of Paraquat, thus it causes nosebleeds, eye and skin irritation.
The burning of peatlands also causes health issues. Respiratory illnesses and smog are created and are
posing serious health risks throughout Southeast Asia because of the constant forest fires that are lit to clear
land for palm oil.
7. GREEN COMMODITY PRODUCTION PRACTICES
7.1 Farm management practices
Integrated farming and integrated pest mgmt (IPM) strategies
Current techniques of pest management use pesticides and herbicides as their main source of control. The
following table is a breakdown of the different strategies used to control pests.
Table 11: IPM strategies
Pest Type Problem associated to pest IPM
Rats Eat on the palm oil kernels, thus reducing
yields
Barn owls are now being widely used throughout
many plantations. Certain plantations use owl boxes
to attract the species, and place them every 10 hectares of palm oil. This is highly successful,
promotes biodiversity and controls the rat problems
on palm oil plantations.
Bagworms and Nettle
caterpillars
Can devastate large areas of palm oil if not
detected early
Use of selective insecticide application, e.g., trunk
injection or spot spraying with pyrethroid is common. Fungi is applied to control nettle
caterpillars and also nectiriferous plants so pests can
eat and have shelter.
Gannderma Basal Stem Rot
Disease that infects the palm fronds and
eventually can kill the tree
Proper deboling and shredding of oil palm debris
during replanting and timely removal of infected palms in existing stands have brought about
effective management of the disease. In prime-aged infected palms, soil mounding has been shown to
prolong productive life of such palms.
Soil management
Table 12: Types of management and benefits
Type of management Benefits
Minimizing soil exposure Soil exposure should be minimized, therefore when clearing or
replanting cover crops should be inserted, also helps keep pests out
81 Jakarta Globe 2009 http://thejakartaglobe.com/business/indonesias-small-scale-palm-oil-farmers-finding-green-certification-costly/342212 (retrieved on 02/16/2010)

UNDP Green Commodities Facility Palm oil scoping paper
28 | P a g e
Evaluating soil type Soils are analyzed before planting (e.g. coastal wetlands contain
sulpher) to assure no soil erosion is possible
Continuous soil management
-Protection from heavy machineries
-No blanket spraying of herbicides
-Organic matter should be kept on surface -Nitrogen-fixing cover crops (natural fertilizer)
Water management
Maximizing water usage for the palm oil industry is crucial for plantations to produce the highest yield as
possible. According to the America Palm Oil Council (APOC) the following table shows what many palm
oil plantations strive for as water management goals.
Table 13: Water management82
Goal Examples of Importance
Minimizing impact of drought and floods -Aimed at maintaining water quality so pH levels are suitable for
palm oil growth.
Optimizing utilization of rainwater and freshwater from streams -Aimed to minimize soil erosion and nutrient losses. Maximizing utilization of effluent and EFB from the oil mill
Minimizing impact of salt-water intrusion
Habitat management
Efforts to manage habitat sustainably are in the agendas of many plantations. Lands exist in both Indonesia
and Malaysia that do not require any further expansion via deforestation or habitat conversion. As
mentioned before, many palm oil producers are using some of the degraded rubber plantations to plant new
palm. The RSPO has been putting forth efforts to no longer convert forests into plantations, and many
companies look to the RSPO for consultation.
Proper habitat management is one of the RSPO‟s standards for their certification system. Now
governments are beginning to comply with habitat management and correctly zone areas for agricultural
purposes. The following table is RSPO‟s recommendations to palm oil plantations for habitat management:
Table 14: Habitat management83
Recommendation Benefits
Acquisition of land for buffer zones and wildlife corridors Beneficial for both biodiversity conservation and as a buffer for
species intruding into plantations
Acquisition of land adjacent and around the bottlenecks of
protected areas (PAs)
Allows migration of wildlife species
Acquisition of land to connect Pas
Allows for connectivity and contiguity
Habitat restoration programme
Enhances biodiversity conservation
Carbon management
Conversion of land into palm oil plantations releases vast amounts of CO2. Tropical forests and peatlands
are the two types of biomes that are being converted. Tropical forests globally can store around 1.3 Gt of
82 America Palm Oil Council (APOC) http://www.americanpalmoil.com/sustainable-water.html (retrieved on 09/29/2009) 83 RSPO http://www.rspo.org/PDF/RT3/Proceedings/Paper%202%20(SWD,%20HUTAN,%20ZERI%20&%20JICA%20BBEC).pdf (retrieved on 09/30/2009)

UNDP Green Commodities Facility Palm oil scoping paper
29 | P a g e
CO2. In Central and South America, forests are estimated to uptake 0.6 Gt of carbon. Africa is estimated
to uptake 0.4 Gt of carbon, and Asia around 0.25 Gt of carbon.84
Peatlands have capacity of storage far
higher than tropical forests. It is estimated that peat soils globally store approximately 550 Gt of carbon,
and a global average of 1450 Gt of carbon.85
Therefore, avoiding any forest conversion aids the reduction of CO2 emissions. As previously mentioned
in section 4.3, old rubber and cocoa farms that have become difficult to remain profitable, are now being
converted into palm oil plantations. These degraded lands are an option to eliminate any further expansion
into tropical forests.
Livelihood impacts
Palm oil can provide a family with an honest living on a smaller area of land than most other crops. In
Indonesia, subsistence for a family can require about 37 hectares per household, but an oil plantation
employs about one worker per 8 hectares.86
This is advantageous because a farmer can support his family
and at the same time make a profit from the sale of his crop. However, this support can come with an
initial cost such as the displacement of indigenous and local communities.
The RSPO has developed criteria strengthening the livelihoods of indigenous and local communities about
their land rights, securing income generation, protecting their health and environment, labor rights
and legal support.
Table 15: Criteria for livelihood impact from RSPO87
Criteria for livelihood improvement
-The right to use the land can be demonstrated, and is not legitimately contested by local communities with demonstrable rights. Use
of the land does not diminish legal or customary rights of other users without their free, prior and informed consent.
-Pay and conditions for employees and for employees of contractors meet legal or industry minimum standards and are sufficient to
provide decent living wages.
-The employer respects the right of all personnel to form and join trade unions and to bargain collectively. Where laws restrict such
rights, the employer facilitates other ways of independent and free association and bargaining.
-An occupational health and safety plan is effectively communicated and implemented. The use of pesticides may not endanger
people‟s health or the environment. In general, pesticides are only used if there‟s a real threat.
-Children are not employed or exploited. Work by children is acceptable only on family farms, under adult supervision, and when not
interfering with education. Children are never exposed to hazardous working conditions.
-Smallholders are paid and treated fairly by oil mills.
8. ECONOMIC VALUE OF GOOD AGRICULTURAL PRACTICE
SHOWING BENEFITS AND TRADE OFFS
8.1 Input costs
84 UNEP http://www.grida.no/publications/rr/natural-fix/page/3725.aspx (retrieved on 09/30/2009) 85 Mongobay http://news.mongabay.com/2009/0330-palm_oil_vs_redd.html (retrieved on 09/30/2009) 86 Oikos. http://www.oikos-stiftung.unisg.ch/homepage/winner2_2006.pdf (retrieved on 10/07/2009) 87 RSPO http://www.rspo.org

UNDP Green Commodities Facility Palm oil scoping paper
30 | P a g e
Costs of production in certain countries are estimated to be higher because of input costs. In the case of
Malaysia, early 2009 figures show input costs to be higher than previous years. In Sarawak and Sabah,
plantations saw an increase from 15 percent to 26 percent this year in comparison to planters on the
peninsula. The increase in input costs for palm oil includes the price of hiring foreign workers, transport
costs and freight costs.88
This trend of increasing input costs could also grow because palm oil´s potential as a biofuel. An increase
in input costs thus would affect the palm oil supply chain in the essence that price spikes are commonly
seen when parts of production are moved away from current goods into to fuel. In addition, the expansion
of palm oil plantations is leading into further deforestation of tropical forests in Indonesia, Malaysia and
Papa New Guinea, due to China´s promotion of biofuels to cut foreign dependence on petroleum.
8.2 Different scenarios for agrochemical and its effect on yields
Paraquat is the number one herbicide used on palm oil plantations. This herbicide is commonly used to
control leguminous cover on immature plantings, and studies show that under good climatic conditions (no
wind and rain) it is quite effective. Rats as mentioned before are a common pest on palm oil plantations.
Pesticides are used to eliminate the rats, but barn owls are being implemented to hunt rats. Both these
agrochemicals aid the productivity of palm oil yields.
8.3 Livelihood benefits from green commodity production
Uses of organisms harvested from production sites, besides crops
As noted before palm oil has multiple uses, for both food and non-food products. However, one of the
largest non food product potentials is biofuels, and is foreseen as a major source of energy. Global demand
for biofuels has increased, and Indonesia and Malaysia alone plan to supply 20 percent of Europe´s
biodiesel requirement.
However, there have been some other case studies where intercropping was executed, such as in Africa and
Latin America. In Ghana and Nigeria, mature oil plantations have been planted with cocoa, since most
cocoa is planted underneath thin shaded forests. The issue of yields is somewhat a problem, since
traditional practices in Ghana count on intercropping palm oil with cassava, plantain, maize, cocoyam and
peppers. When the palm oil reaches a certain height and shades out the crops below, this becomes an
unviable method. But since crops like cocoa and even coconuts can grow in shade grown areas, there are
possibilities if harvesting other crops besides palm oil.89
In Colombia, some palm oil plantations are intercropped with maize. Maize is planted in between palm oil
rows, and on average three to four maize harvests are extracted while the palm oil tree completes its growth
cycle.90
Summary of palm oil practices and production
88 The Star online, http://biz.thestar.com.my/news/story.asp?file=/2009/7/3/business/4245562&sec=business (retrieved on 11/17/2009) 89 Springlink http://www.springerlink.com/content/t68n041l27115214/ (retrieved on 02/23/2010) 90 International Maize and Wheat Improvement Center (CIMMYT) http://blog.cimmyt.org/?p=2511&cpage=1 (retrieved on 02/23/2010)

UNDP Green Commodities Facility Palm oil scoping paper
31 | P a g e
Table 16 below is a summary and comparison from this scoping paper of current unsustainable practice
versus green sustainable practices.
Table 16: Comparison of section 4.3 (Unsustainable practices) and 7.0 (Green practices)
Business as Usual (BAU) Sustainable Commodity Mechanisms (SCM)
Habitat conversion -Create more Protected Areas -Wildlife corridors
- Effective zoning, land use planning and enforcement for
agriculture - Plant palm oil on degraded lands
Threats to critical habitat for endangered species -Making the case for conservation (i.e. ecosystem services)
Poisons to control rats -Employ barn owls on plantations (IPM)
Soil Erosion -Plant leguminous cover crops -Build silt pits to trap nutrients
Water intensification -Trap and store rainwater
Agrochemical use (fertilizers and pesticides) -Reduce fertilizer use
Pollution from processing plants -Promote conversion to smaller mills
Burning and Air Pollution -Enforce no burn policies -Better clearing practices that don´t force to burn
9. BARRIERS TO SCALE UP OF GOOD PRACTICES FOR CHANGE
AT A GLOBAL LEVEL AND NATIONAL LEVEL
Governance
Palm oil is a lucrative crop. Expansion in Indonesia and Malaysia is foreseen to continue to grow.
Deforestation and habitat conversion are the major areas of conflict created by the palm oil industry (not to
forget social issues such as displacement of people from their lands). Governments have been criticized for
poor management of protected areas, agriculture zoning and the vast amounts of deforestation that
continues to occur. Many countries are putting a boycott on palm oil products that are sourced from
unsustainable plantations.
The RSPO is one of the major players that works with key stakeholders (i.e. NGOs, governments,
companies) to ensure that palm oil plantations work towards certification standards. Barriers to upscale
better practices are being addressed by certain companies who have been portrayed as unsustainable and
are becoming conscious because of public pressure. These standards intentions are to scale up better
practices throughout the palm oil supply chain, whether at the farm, processing and manufacturing level
(Refer to section 10 for more information).
The WWF is one of the major players pushing companies to scale up better management practices, and
created the ¨Palm Oil Buyer´s Scorecard¨. The scorecard ranks commitments and actions of major players
in the industry. They also are asking companies to make public commitments that they will use 100
percent certified palm oil by 2015.
Market
The main barrier to scale up better management practices is the demand for certified and sustainable palm
oil. Many consumers are willing to pay a premium for certified palm oil products. The key lies in the
hands of companies and producers since this is becoming a common trend. However with the growing
demand for biofuels, consumers are factoring in further expansion into tropical forests to feed the demand

UNDP Green Commodities Facility Palm oil scoping paper
32 | P a g e
for a new energy source. In addition, certified palm oil has also run into other problems with the same
companies that use a certified source, because facts show that the palm oil in their products is sometimes
not traceable.
10. TOOLS TO PROMOTE SUSTAINABLE PALM OIL PRODUCTION
10.1 Certification
Roundtable for Sustainable Palm Oil (RSPO)
Figure 7: RSPO stakeholders
In 2007, RSPO in conjunction with
WWF and Unilever released the first
ever Sustainable Palm Oil
certification system. The RSPO
certification is a voluntary system
aimed at promoting sustainable palm
oil development, taking into account
economic, environmental and social
aspects of palm oil production in a
balanced way.
The RSPO works with seven
different sectors: palm oil producers,
processors or traders, manufacturers,
retailers, banks/investors,
environmental NGOs and social
NGOs. The table below is the RSPO´s schematic diagram on how to reach the goal of sustainable palm oil.
Principles and Criteria for Certification
Table 17: Principles and criteria for certification91
Commitment to
Transparency
Criterion 1.1 Oil palm growers and millers provide adequate information to other stakeholders on
environmental, social and legal issues relevant to RSPO Criteria, in appropriate languages & forms to allow for effective participation in decision making.
Criterion 1.2 Management documents are publicly available, except where this is prevented by
commercial confidentiality or where disclosure of information would result in negative environmental or social outcomes.
Compliance with
applicable laws and
regulations
Criterion 2.1 There is compliance with all applicable local, national and ratified international laws and
regulations. Criterion 2.2 The right to use the land can be demonstrated, and is not legitimately contested by local
communities with demonstrable rights.
Criterion 2.3 Use of the land for oil palm does not diminish the legal rights, or customary rights, of other users, without their free, prior and informed consent.
Commitment to long-term
economic and financial
viability
Criterion 3.1 There is an implemented management plan that aims to achieve long-term economic and
financial viability.
Use of appropriate best Criterion 4.1 Operating procedures are appropriately documented and consistently implemented and
91 RSPO http://www.rspo.org/resource_centre/RSPO%20Criteria%20Final%20Guidance%20with%20NI%20Document.pdf (retrieved on 11/23/2009)

UNDP Green Commodities Facility Palm oil scoping paper
33 | P a g e
practices by grower and
millers
monitored.
Criterion 4.2 Practices maintain soil fertility at, or where possible improve soil fertility to, a level that
ensures optimal and sustained yield.
Criterion 4.3 Practices minimize and control erosion and degradation of soils. Criterion 4.4 Practices maintain the quality and availability of surface and ground water.
Criterion 4.5 Pests, diseases, weeds and invasive introduced species are effectively managed using
appropriate Integrated Pest Management (IPM) techniques. Criterion 4.6 Agrochemicals are used in a way that does not endanger health or the environment.
There is no prophylactic use, and where agrochemicals are used that are
categorised as World Health Organisation Type 1A or 1B, or are listed by the Stockholm or Rotterdam Conventions, growers are actively seeking to identify alternatives, and this is
Criterion 4.7 An occupational health and safety plan is documented, effectively communicated and
implemented. Criterion 4.8 All staff, workers, smallholders and contractors are appropriately trained.
Environmental
responsibility and
conservation of natural
resources and
biodiversity
Criterion 5.1 Aspects of plantation and mill management that have
environmental impacts are identified, and plans to mitigate the negative impacts and promote the positive ones are made,
implemented and monitored, to demonstrate continuous
improvement. Criterion 5.2 The status of rare, threatened or endangered species
and high conservation value habitats, if any, that exist in the
plantation or that could be affected by plantation or mill management, shall be identified and their conservation taken into
account in management plans and operations.
Criterion 5.3 Waste is reduced, recycled, re-used and disposed of in an environmentally and socially responsible manner.
Criterion 5.4 Efficiency of energy use and use of renewable energy is maximised.
Criterion 5.5 Use of fire for waste disposal and for preparing land
for replanting is avoided except in specific situations, as identified in the ASEAN guidelines or other regional best practice.
Criterion 5.6 Plans to reduce pollution and emissions, including
greenhouse gases, are developed, implemented and monitored.
Responsible
consideration of
employees and
individuals and
communities affected by
growers and mills
Criterion 6.1 Aspects of plantation and mill management that have social impacts are identified in a
participatory way, and plans to mitigate the negative impacts and promote
the positive ones are made, implemented and monitored, to demonstrate continuous improvement. Criterion 6.2 There are open and transparent methods for communication and consultation between
growers and/or millers, local communities and other affected or interested parties.
Criterion 6.3 There is a mutually agreed and documented system for dealing with complaints and grievances, which is implemented and accepted by all parties.
Criterion 6.4 Any negotiations concerning compensation for loss of legal or customary rights are dealt
with through a documented system that enables indigenous peoples, local communities and other stakeholders to express their views through their own representative
institutions.
Criterion 6.5 Pay and conditions for employees and for employees of contractors always meet at least legal or industry minimum standards and are sufficient to meet basic needs of personnel and to provide
some discretionary income.
Criterion 6.6 The employer respects the right of all personnel to form and join trade unions of their choice and to bargain collectively. Where the right to freedom of association
and collective bargaining are restricted under law, the employer facilitates parallel means of
independent and free association and bargaining for all such personnel. Criterion 6.7 Child labour is not used. Children are not exposed to hazardous working conditions.
Work by children is acceptable on family farms, under adult supervision, and
when not interfering with education programmes. Criterion 6.8 The employer shall not engage in or support discrimination based on race, caste, national
origin, religion, disability, gender, sexual orientation, union membership,
political affiliation, or age. Criterion 6.9 A policy to prevent sexual harassment and all other forms of violence against women
and to protect their reproductive rights is developed and applied.
Criterion 6.10 Growers and mills deal fairly and transparently with smallholders and other local businesses.
Criterion 6.11 Growers and millers contribute to local sustainable development wherever appropriate.
Responsible development
of new plantings
Criterion 7.1 A comprehensive and participatory independent social and environmental impact assessment is undertaken prior to establishing new plantings or operations, or expanding existing ones,
and the results incorporated into planning, management and
operations.

UNDP Green Commodities Facility Palm oil scoping paper
34 | P a g e
Criterion 7.2 Soil surveys and topographic information are used for site planning in the establishment
of new plantings, and the results are incorporated into plans and operations.
Criterion 7.3 New plantings since November 2005 (which is the expected date of adoption of these
criteria by the RSPO membership), have not replaced primary forest or any area containing one or more High Conservation Values.
Criterion 7.4 Extensive planting on steep terrain, and/or on marginal and fragile soils, is avoided.
Criterion 7.5 No new plantings are established on local peoples‟ land without their free, prior and informed consent, dealt with through a documented system that enables indigenous peoples, local
communities and other stakeholders to express their views
through their own representative institutions. compensated for any agreed land Criterion 7.6 Local people are acquisitions and relinquishment of rights, subject to their free, prior and
informed consent and negotiated agreements.
Criterion 7.7 Use of fire in the preparation of new plantings is avoided other than in specific situations, as identified in the ASEAN guidelines or other regional best practice.
Commitments to
continuous improvement
in key areas of activity
Criterion 8.1 Growers and millers regularly monitor and review their activities and develop and
implement action plans that allow demonstrable continuous improvement in key operations.
Markets for certified commodity
According to the WWF, only one percent of sustainable palm oil in the market has been bought. Also an
approximate of 1.3 million tonnes of certified sustainable palm oil (CSPO) has been produced with partners
of RSPO, but only 15,000 tonnes has been sold.92
The RSPO is committed to working with companies to increase their purchase of sustainable palm oil. In
January of 2009, Wilmar International was one of the first major palm oil companies to utilize the RSPO‟s
certification system. Three of Wilmar International´s mills were awarded certification, which produce
123,000 metric tonnes from four plantations in eastern Malaysia.93
However more recently, the RSPO issued a press release stating that as of October 2009, 250,000 tonnes of
CSPO has been sold, where 100,000 tonnes were sold in the last two months. In 2009, CSPO producers
were able to sell 22 percent of their oil, and in September and October the market rose 50 percent.94
Most important producers of certified commodity
The following table shows a list of 10 different producers that are affiliated to the RSPO. These are just 10
of the 80 different producers who have a partnership with the RSPO. This link:
http://rspo.org/member_search.aspx?catid=37&ddlID=161 has a detailed description of all the producers
associated to the RSPO, and also a link to their current progress reports.
Table 18: Certified producers of palm oil
Name of producer Country Member since Website
CTP Holdings Pte Ltd Singapore May-2004 http://www.cargill.com/
FEDEPALMA-National Federation
of Oil Palm Growers of Colombia
Colombia Sept.-2004 http://www.fedepalma.org/
FELDA Malaysia Oct.-2004 http://www.felda.net.my/felda2008/
Hap Seng Consolidated Berhad Malaysia Sept.-2005 http://www.hapseng.com.my
Agropalma Group Brazil June-2004 http://www.agropalma.com.br/
92 WWF May 12th 2009 press release http://www.panda.org/wwf_news/news/?163902/WWF-to-grade-palm-oil-buyers (retrieved on 09/30/2009) 93 Wilmar International. http://www.wilmar-international.com/news/press_releases/20090120%20-
%20RSPO_Certification_announcement.pdf (retrieved 09/22/2009) 94 RSPO October 2009 Press Release, pg. 1

UNDP Green Commodities Facility Palm oil scoping paper
35 | P a g e
Genting Plantations Berhad Malaysia Nov.-2006 http://www.genting.com/
PT Perkebunan Nusantara III Indonesia Dec.-2006 http://www.ptpn3.co.id/
Boustead Plantations Berhad Malaysia Oct.-2004 http://www.boustead.com.my/
IJM Plantations Berhad Malaysia Sept.-2004 http://www.ijm.com/
Indonesian Palm Oil Producers Association (GAPKI)
Indonesia Sept.-2004 http://gapki.org
According to an article written by Reuters, OVID, a German edible oil industry group began to receive
certified sustainable palm oil in their products in the latter part of 2008. The head of OVID stated that
although content that certified palm oil is becoming available, will consumers be willing to pay a 10
percent premium on certified products, especially during a global recession.
Traceability of certified palm oil (Identity Preserved, Segregation and Mass Balance)
A key challenge that rises from the RSPO certification system is the issue of traceability. As mentioned
previously in this section, there has only been a small quantity of CSPO purchased, and some companies
state that it is difficult to track where the palm oil is coming from. In recent efforts to upscale the
traceability of RSPO certified palm oil, UTZ Certified has partnered with the RSPO to address this issue
and the following are the approaches being taken.
Identity Preserved (IP)
The IP model assures that RSPO certified palm oil is delivered to the end user and identified by the mill
and kept separate from all other non-certified palm oil.
Figure 8: RSPO IP(Source UTZ)
The principal factor to the IP model is
there is proof of separation and full
traceability of the CSPO throughout the
supply chain starting at the plantation
and ending with the end user.95
Segregation (SG) Figure 9: RSPO segregation supply chain
The SG model assures that RSPO certified palm oil is delivered to the end user and only comes from
certified RSPO sources. Figure 9 below
draws out how the model works.
The SG approach requires that the certified
palm oil is kept separate from the palm oil
that is not certified and that it be done at every
95 UTZ Certified http://www.utzcertified.org/index.php?pageID=225&showdoc=225_1_10 (retrieved on 02/24/2010)

UNDP Green Commodities Facility Palm oil scoping paper
36 | P a g e
step and stage of production, processing, refining and manufacturing throughout the supply chain.96
Mass Balance (MB)
The MB model monitors the trade of the RSPO certified palm oil throughout the entire supply chain and
mainstreams into the sustainable palm oil trade.97
Figure 10: MB model (Source UTZ)
In addition, the MB model consists of
tracing the supply and demand of the
certified palm oil, who buys and who
sells the product.
Book and Claim (BC)
The BC model provides tradable
certificates for certified palm oil to a
palm oil supply base. Then the supply
base can offer these certificates on a
web based transaction to those interested end user who wish to support certified palm oil.
Figure 11: BC (Source UTZ)
The credits can only be introduced
in the system by RSPO certified
mills, and are traded electronically
directly to the end users so that
there are no traceability
requirements.98
96 UTZ Certified http://www.utzcertified.org/index.php?pageID=225&showdoc=225_1_10 (retrieved on 02/24/2010) 97 Ibid 98 Ibid

UNDP Green Commodities Facility Palm oil scoping paper
37 | P a g e
11. GCF STRATEGY
Based on the above analysis and GCF components and country service lines outline based strategy for GCF
for commodity including companies to engage, countries to select, key partners and country level
approaches.
11.1 Target Countries
Malaysia and Indonesia: Both these countries are world leaders in palm oil production, and scored a total of
23 out of 24 possible points. One of GCF´s regional advisors is located in Asia for a possible initial
scoping mission.
Nigeria, Thailand, Colombia, Cote D´Ivore, and Ecuador: These countries should not be discarded as
target countries, but should be considered for future reference as they are also major producing countries.
11.2 Country level strategies
GCF can provide policy and technical assistance at country levels through the following components:
1. Generating demand for certified sustainable palm oil: The availability of sustainable palm oil is
increasing; however demand for it has not. The RSPO, alongside with its partners WWF and Unilever
are pushing for certified sustainable palm oil, especially in Indonesia and Malaysia. Therefore see
where GC Facility might be able to partner with RSPO.
2. Land Use planning: One of the major issues of the production of palm oil is the continuous expansion
into tropical forests. In both countries there are opportunities to use degraded lands or old rubber and
cocoa plantations. Thus, GC Facility could provide technical advice on land management issues.
3. Improve policy, legislative and institutional framework: GC Facility can establish national platforms
for all supply chain stakeholders to coordinate support for land use planning, reducing habitat
conversion and deforestation.
4. Knowledge management: GC Facility can contribute in the creation of guidance documents for
stakeholders in the palm oil industry. These documents can be land use planning documents, manuals
on economic importance of biodiversity conservation and best management practices to achieve
accredited sustainable palm oil.
11.3 Corporate engagement strategy
Corporate engagement strategy should include the following:
Identify major importers and retailers purchasing from Malaysia and Indonesia.
Identify major growers and producers from the palm oil industry.

UNDP Green Commodities Facility Palm oil scoping paper
38 | P a g e
ANNEX I (ADDITIONAL CHARTS, TABLES AND GRAPHS TO KEEP FOR DATABASE)
Figure A.1: Palm Oil Production
Data from USDA.99
Figure A.2: Worldwide plantations
Data from FAOSTAT.100
99 PECAD http://www.pecad.fas.usda.gov/highlights/2007/12/Indonesia_palmoil/ (retrieved on 10/10/2009)

UNDP Green Commodities Facility Palm oil scoping paper
39 | P a g e
Figure A.3: Forest Cover vs. Palm Oil Production
Data from Mongobay101
Figure A.4: Palm oil prices
Source World bank
100 WWF website. http://assets.panda.org/img/original/globalareaoilpalmplantation.gif (retrieved on 09/23/2009) 101 Mongobay News http://news.mongabay.com/2009/0909-palm_oil_ifc.html (retrieved on 11/22/2010)

UNDP Green Commodities Facility Palm oil scoping paper
40 | P a g e
Figure A.5: Flowchart from MPOC.
Figure from MPOC102
Map A.1: Major regions of palm oil in Malaysia103
Source Global-DVC
102 MPOC http://www.mpoc.org.my/Processing_Flow_Chart.aspx (retrieved on 09/21/2009) 103 Global-DVC http://www.global-dvc.org/map%20borneo.jpg (retrieved on 09/21/2009)

UNDP Green Commodities Facility Palm oil scoping paper
41 | P a g e
Map A.2: Expansion of palm oil in Indonesia
Source Forest People104
104 Forest Peoples Programme http://www.forestpeoples.org/documents/prv_sector/oil_palm/promised_land_eng.pdf (retrieved on 02/23/2010)