
Green Chemistry: Evaluation of Alternative Reaction ...
35
Michigan Technological University 1 Green Chemistry: Evaluation of Alternative Reaction Pathways Chapters 7 and 8 David R. Shonnard Department of Chemical Engineering Michigan Technological University
Transcript of Green Chemistry: Evaluation of Alternative Reaction ...

Michigan Technological University1
Green Chemistry:Evaluation of Alternative Reaction Pathways
Chapters 7 and 8
David R. ShonnardDepartment of Chemical Engineering
Michigan Technological University

Michigan Technological University2
Outline
l Educational goals and topics covered in the module
l Green Chemistry (Chapter 7) and
l assessing potential environmental impacts based on limited information (Chapter 8)
The selection of a reaction pathway is the key step to establish the environmentalperformance of a chemical process, affecting the downstream separation units
and their energy requirements, emissions, and impacts.

Michigan Technological University3
Educational goals and topics covered in the module
Students will:l understand a “Tier 1” approach for chemical process
environmental evaluation
l learn qualitative and quantitative approaches to Green Chemistry
l be able to evaluate alternative reaction pathways; both economically and environmentally.
Education Goals and Topics Covered in the Module. In addition, students should be thinking about environmental issues at each stage of the design process.

Michigan Technological University4
l Guiding principles for Green Chemistry» Maximum incorporation of raw materials into final
products» All chemicals should be nontoxic yet functional» Auxiliary substances (solvents) should be nontoxic» High energy efficiency» Use of renewable resources is recommended» Recyclable reagents and raw materials» End products should not persist in the environment
Green Chemistry - Ch 7
Anastas, P.T. and Warner, J.C. 1998, Green Chemistry: Theory and Practice, Oxford University Press, New York
Green Chemistry -- Chapter 7. None.

Michigan Technological University5
l Important considerations
» Human / ecosystem health properties– Bioaccumulative?– Persistent?– Toxic?– Global warming, Ozone depletion, Smog formation?– Flammable or otherwise hazardous?– Renewable or non renewable resource?
» Life cycle environmental burdens? - Ch 13, 14
Feedstocks and solvents
Feedstocks and Solvents. Life cycle environmental burdens is a concept that as engineers we need to think about including the ultimate use and disposal of products.

Michigan Technological University6
Synthesis pathways
Reaction Type Waste Generation Potential
Addition Reaction Isobutylene + methanol → methyl tert-butyl ether C4H8 + CH3OH → (C4H9)-O-CH3
• completely incorporate starting material into product
Substitution Reaction Phenol + ammonia → analine + water C6H5-OH+ NH3 → C6H5-NH2 + H2O
• stoichiometric amounts of waste are generated
Elimination Reaction Ethylbenzene → styrene + hydrogen C6H5-C2H5 → C6H5-C2H3 + H2
• stoichiometric amounts of waste are generated
Synthesis Pathways. Note: Different types of chemicals create different products and byproducts.

Michigan Technological University7
Atom and mass efficiency:magnitude of improvements possible
Atom Efficiency- the fraction of starting material incorporated into the desired product -
C6H5-OH+ NH3 → C6H5-NH2 + H2O• Carbon - 100%• Hydrogen - 7/9 x 100 = 77.8%• Oxygen - 0/1 x 100 = 0%• Nitrogen - 100%
Mass Efficiency (Basis 1 mole of product)
C6H5-OH+ NH3 → C6H5-NH2 + H2OMass in Product = (6 C)(12) + (7 H)(1) + (0 O)(16) + (1 N)(14) = 93 grams
Mass in Reactants = (6 C)(12) + (9 H)(1) + (1 O)(16) + (1 N)(14) = 111 grams
Mass Efficiency = 93/111 x 100 = 83.8%
Atom and Mass Efficiency: Magnitude of Improvements Possible. Atom efficiency is a concept you see frequently in green chemistry, it is one way to look at efficiency but it is not the only way.

Michigan Technological University8
Chapter 7: Adipic Acid SynthesisTraditional vs. New
Traditional Route - from cyclohexanol/cyclohexanoneCu (.1-.5%)
C6H12O+ 2 HNO3 + 2 H2O C6H10O4 + (NO, NO2, N2O, N2)V (.02-.1%)
92-96% Yield of Adipic Acid
• Carbon - 100%• Oxygen - 4/9 x 100 = 44.4%• Hydrogen - 10/18 x 100 = 55.6%• Nitrogen - 0%
Product Mass = (6 C)(12) + (10 H)(1) + (4 O)(16) = 146 g
Reactant Mass = (6 C)(12) + (18 H)(1) + (9 O)(16) + (2 N)(14) = 262 g
Mass Efficiency = 146/262 x 100 = 55.7%
global warmingozone depletion
hazardous
Davis and Kemp, 1991, Adipic Acid, in Kirk-Othmer Encyclopedia of Chemical Technology, V. 1, 466 - 493

Michigan Technological University9
New Route - from cyclohexeneNa2WO4•2H2O (1%)
C6H10 + 4 H2O2 C6H10O4 + 4 H2O[CH3(n-C8H17) 3N]HSO4 (1%)
90% Yield of Adipic Acid
• Carbon - 100%• Oxygen - 4/8 x 100 = 50%• Hydrogen - 10/18 x 100 = 55.6%
Product Mass = (6 C)(12) + (10 H)(1) + (4 O)(16) = 146 g
Reactant Mass = (6 C)(12) + (18 H)(1) + (8 O)(16) = 218 g
Mass Efficiency = 146/218 x 100 = 67%
Chapter 7: Adipic Acid SynthesisTraditional vs. New
Sato, et al. 1998, A “green” route to adipic acid:…, Science, V. 281, 11 Sept. 1646 - 1647
Michigan Technological University10
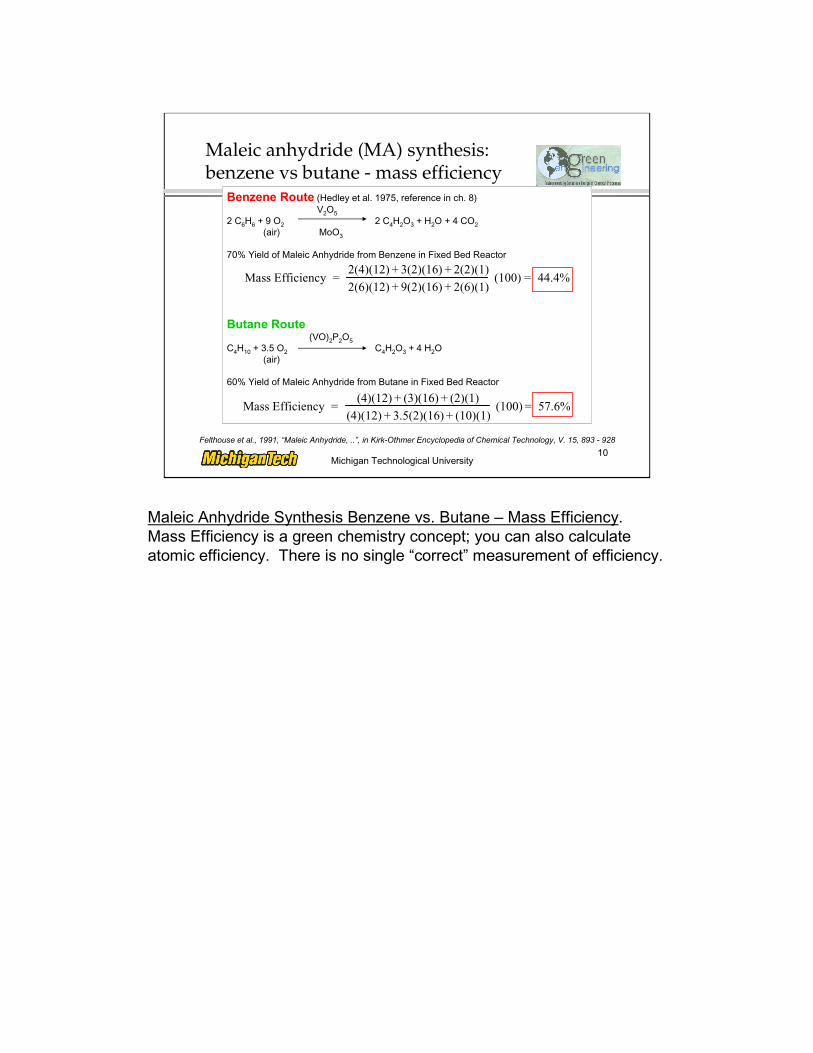
Maleic anhydride (MA) synthesis:benzene vs butane - mass efficiency
Benzene Route (Hedley et al. 1975, reference in ch. 8)V2O5
2 C6H6 + 9 O2 2 C4H2O3 + H2O + 4 CO2(air) MoO3
70% Yield of Maleic Anhydride from Benzene in Fixed Bed Reactor
Butane Route(VO)2P2O5
C4H10 + 3.5 O2 C4H2O3 + 4 H2O(air)
60% Yield of Maleic Anhydride from Butane in Fixed Bed Reactor
Mass Efficiency = 2(4)(12) + 3(2)(16) + 2(2)(1)
2(6)(12) + 9(2)(16) + 2(6)(1) (100) = 44.4%
Mass Efficiency = (4)(12) + (3)(16) + (2)(1)
(4)(12) + 3.5(2)(16) + (10)(1) (100) = 57.6%
Felthouse et al., 1991, “Maleic Anhydride, ..”, in Kirk-Othmer Encyclopedia of Chemical Technology, V. 15, 893 - 928
Maleic Anhydride Synthesis Benzene vs. Butane – Mass Efficiency. Mass Efficiency is a green chemistry concept; you can also calculate atomic efficiency. There is no single “correct” measurement of efficiency.
Michigan Technological University11
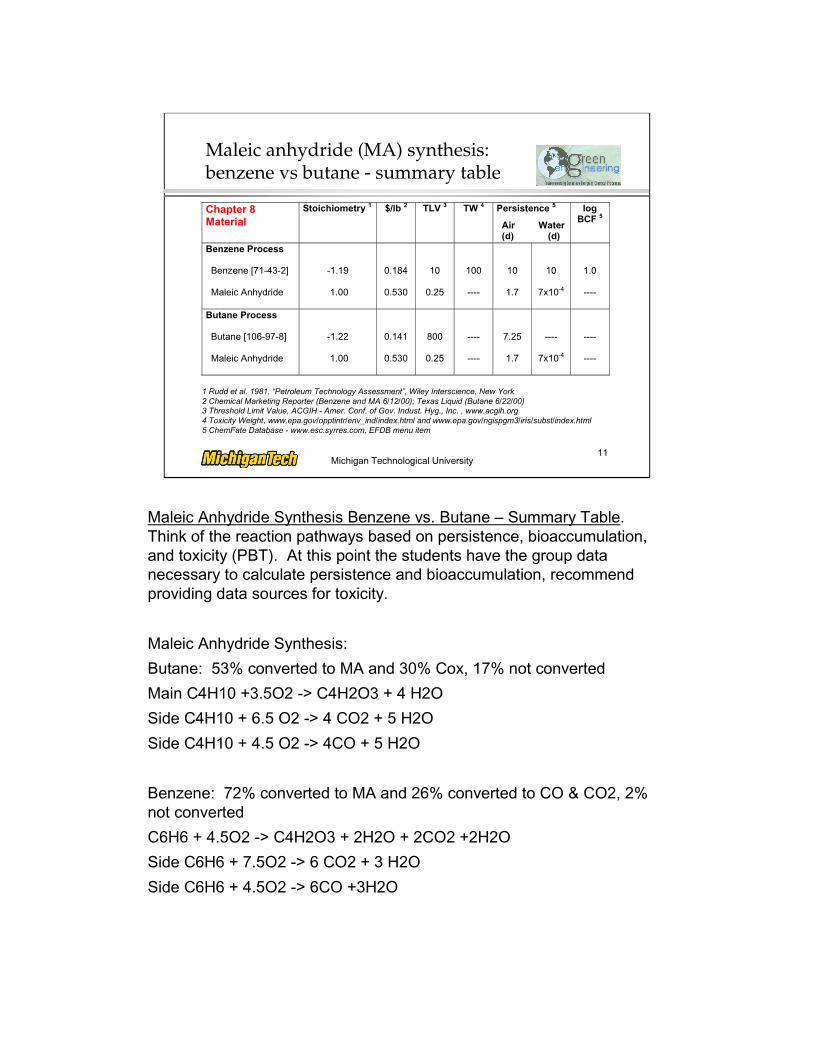
Maleic anhydride (MA) synthesis:benzene vs butane - summary table
Chapter 8Material
Stoichiometry 1 $/lb 2 TLV 3 TW 4 Persistence 5
Air Water (d) (d)
logBCF 5
Benzene Process
Benzene [71-43-2]
Maleic Anhydride
-1.19
1.00
0.184
0.530
10
0.25
100
----
10
1.7
10
7x10⁻⁴
1.0
----
Butane Process
Butane [106-97-8]
Maleic Anhydride
-1.22
1.00
0.141
0.530
800
0.25
----
----
7.25
1.7
----
7x10⁻⁴
----
----
1 Rudd et al. 1981, “Petroleum Technology Assessment”, Wiley Interscience, New York2 Chemical Marketing Reporter (Benzene and MA 6/12/00); Texas Liquid (Butane 6/22/00)3 Threshold Limit Value, ACGIH - Amer. Conf. of Gov. Indust. Hyg., Inc. , www.acgih.org4 Toxicity Weight, www.epa.gov/opptintr/env_ind/index.html and www.epa.gov/ngispgm3/iris/subst/index.html5 ChemFate Database - www.esc.syrres.com, EFDB menu item
Maleic Anhydride Synthesis Benzene vs. Butane – Summary Table. Think of the reaction pathways based on persistence, bioaccumulation, and toxicity (PBT). At this point the students have the group data necessary to calculate persistence and bioaccumulation, recommend providing data sources for toxicity.
Maleic Anhydride Synthesis:
Butane: 53% converted to MA and 30% Cox, 17% not converted
Main C4H10 +3.5O2 -> C4H2O3 + 4 H2O
Side C4H10 + 6.5 O2 -> 4 CO2 + 5 H2O
Side C4H10 + 4.5 O2 -> 4CO + 5 H2O
Benzene: 72% converted to MA and 26% converted to CO & CO2, 2% not converted
C6H6 + 4.5O2 -> C4H2O3 + 2H2O + 2CO2 +2H2O
Side C6H6 + 7.5O2 -> 6 CO2 + 3 H2O
Side C6H6 + 4.5O2 -> 6CO +3H2O

Michigan Technological University12
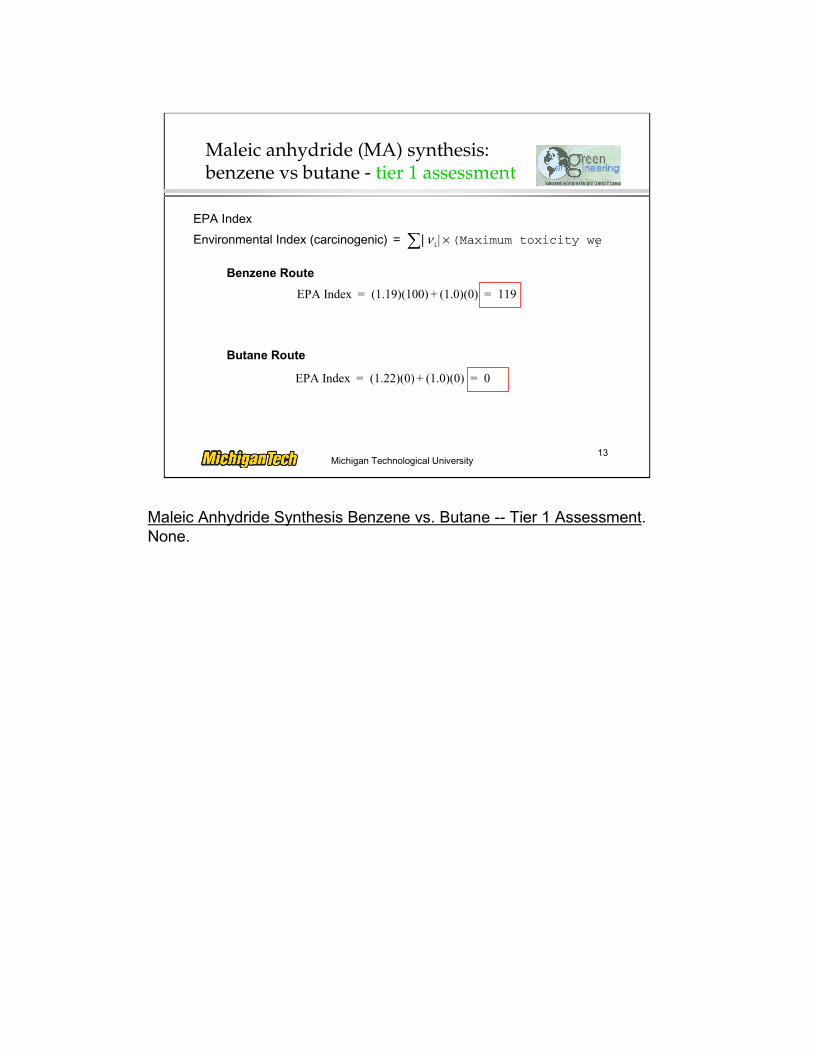
Maleic anhydride (MA) synthesis:benzene vs butane - tier 1 assessment
Benzene Route
Butane Route
(TLV Index)
Environmental Index (non - carcinogenic) = | ν i | × (TLVi )−1
i∑
TLV Index = (1.19)(1 / 10) + (1.0)(1 / .25) = 4.12
TLV Index = (1.22)(1 / 800) + (1.0)(1/ .25) = 4.00
Where ννννi is the overall stoichiometric coefficient of reactant or product i
Maleic Anhydride Synthesis Benzene vs. Butane -- Tier 1 Assessment. None.
Michigan Technological University13
EPA Index
Environmental Index (carcinogenic) = | νi| × (Maximum toxicity weii i∑
Benzene Route
Butane Route
EPA Index = (1.19)(100) + (1.0)(0) = 119
EPA Index = (1.22)(0) + (1.0)(0) = 0
Maleic anhydride (MA) synthesis:benzene vs butane - tier 1 assessment
Maleic Anhydride Synthesis Benzene vs. Butane -- Tier 1 Assessment. None.

Michigan Technological University14
A More Detailed Analysis of MA Production
n-Butane ProcessBenzene Process
OHCOOHCOHC 22324266 44292 ++→+
OHCOOOHC 22324 4 +→+
OHCOOHC 2266 61292 +→+
OHCOOOHC 222324 43 +→+
OHCOOHC 22266 612152 +→+
OHOHCOHC 23242104 8272 +→+
OHCOOOHC 22324 4 +→+OHCOOOHC 222324 43 +→+
OHCOOHC 22104 10892 +→+
OHCOOHC 222104 108132 +→+
V2O5-MoO3 VPO
n-butane conversion, 85%MA Yield, 60% Air/n-butane, ~ 62 (moles)Temperature, 400°CPressure, 150 kPa
Benzene conversion, 95%MA Yield, 70% Air/Benzene, ~ 66 (moles)Temperature, 375°CPressure, 150 kPa
Level 1. Input / Output InformationLevel 1. Input / Output InformationLevel 1. Input / Output InformationLevel 1. Input / Output Information
Shown are the major reactions for product and byproduct generation, with expected conversions, yields, and reaction conditions (temperature, pressure, etc.) for MA production from either benzene or n-butane. Most MA production has migrated from benzene to n-butane, and this represents one of the earliest examples of Green Chemistry making a significant change in chemical production.

Michigan Technological University15
Maleic anhydride (MA) production: Costs
nnnn----Butane ProcessButane ProcessButane ProcessButane Process
Benzene ProcessBenzene ProcessBenzene ProcessBenzene Process
Level 1. Input / Output InformationLevel 1. Input / Output InformationLevel 1. Input / Output InformationLevel 1. Input / Output Information““““Tier 1Tier 1Tier 1Tier 1”””” Economic analysisEconomic analysisEconomic analysisEconomic analysis ((((raw materials costs onlyraw materials costs onlyraw materials costs onlyraw materials costs only))))
1 mole/(0.70 mole) × (78 g/mole) × (0.00028 $/g) = 0.0313 $/mole of MA
1mole/(0.60 mole) × (58 g/mole) × (0.00021 $/g) = 0.0203 $/mole of MA
MA YieldMA YieldMA YieldMA Yield BzBzBzBz MWMWMWMW Benzene costBenzene costBenzene costBenzene cost
MA YieldMA YieldMA YieldMA Yield nC4 MWnC4 MWnC4 MWnC4 MW nC4 costnC4 costnC4 costnC4 cost
Assumption: raw material costs dominate total cost of the process
NNNN----butane process butane process butane process butane process has lower costhas lower costhas lower costhas lower cost
Using this input / output information for the reaction step, we can compute raw material costs for each reaction route for MA production. n-butane is superior to benzene with regard to raw material costs, even when the benzene route exhibits higher conversions and yields compared to n-butane. One reason is because 2 of the carbons on the benzene molecule are not incorporated into the final product, MA.

Michigan Technological University16
MA production: IO assumptions
Level 1. Input / Output InformationLevel 1. Input / Output InformationLevel 1. Input / Output InformationLevel 1. Input / Output Information““““Tier 1Tier 1Tier 1Tier 1”””” Environmental Impact AnalysisEnvironmental Impact AnalysisEnvironmental Impact AnalysisEnvironmental Impact Analysis
Reactor ProductRecovery
PollutionControl
BenzeneBenzeneBenzeneBenzeneorororornnnn----butanebutanebutanebutane
AirAirAirAir MA, CO,MA, CO,MA, CO,MA, CO,COCOCOCO2 2 2 2 , H, H, H, H2222OOOOairairairair
CO, COCO, COCO, COCO, CO2 2 2 2 , H, H, H, H2222O, air, MAO, air, MAO, air, MAO, air, MA
1 mole 1 mole 1 mole 1 mole MA MA MA MA
UnreactedUnreactedUnreactedUnreactedBenzeneBenzeneBenzeneBenzeneorororornnnn----butanebutanebutanebutane
COCOCOCO2 2 2 2 HHHH2222O, airO, airO, airO, airtraces of CO, MA traces of CO, MA traces of CO, MA traces of CO, MA benzene, nbenzene, nbenzene, nbenzene, n----butanebutanebutanebutane
99% control
99% MA recovery
A production rate of 1 mole of MA is chosen as the basis for this impact analysis. Shown also are estimated recoveries and pollution control efficiency for the chemicals in the process.

Michigan Technological University17
MA of ebutane/mol-n mole 2.53x10 MA) of mole/mole (0.2525 (0.01)
:Control Pollution from Emission Butane-n
MA of ebutane/mol-n mole 0.2525 0.85) - (1 0)(.99))mole/((0.6 (1
:Reactor Exiting Butane-n
MA of lebenzene/mo mole 7.22x10 MA) of mole/mole (0.0722 (0.01)
:Control Pollution from Emission Benzene
MA of lebenzene/mo mole 0.0722 0.95) - (1 0)(.99))mole/((0.7 (1
:Reactor Exiting Benzene
3-
4-
=×
=×
=×
=×
Maleic Anhydride SynthesisBenzene vs Butane - Tier 1 Assessment

Michigan Technological University18MA mole
CO mole 8.42x10 MA) of mole/mole (0.842 (0.01)
:Control Pollution from Emission CO :Process Butane-n
MA moleCO mole
0.842 24
0.6)-(0.85 0)(.99))mole/((0.6 (1
:Reactor Exiting CO :Process Butane-n
MA moleCO mole
1.08x10 MA) of mole/mole (1.082 (0.01)
:Control Pollution from Emission CO :Process Benzene
MA moleCO mole
1.082 26
0.7)-(0.95 0)(.99))mole/((0.7 (1
:Reactor Exiting CO :Process Benzene
3-
2-
=×
=××
=×
=××
Maleic Anhydride SynthesisBenzene vs Butane - Tier 1 Assessment

Michigan Technological University19MA mole
CO mole 2.705 9)(4)(0.01)(0.9 5)(4)(0.99)(0.2 42)(0.99)(0.8 (0.842)
:Control Pollution from Emission CO :Process Butane-n
MA moleCO mole
0.842 24
0.6))-(0.85 0)(.99))mole/((0.6 (1
:Reactor Exiting CO :Process Butane-n
MA moleCO mole
4.622 9)(4)(0.01)(0.9 722)(6)(0.99)(0.0 82)(0.99)(1.0 (3.082)
:Control Pollution from Emission CO :Process Benzene
MA moleCO mole
3.082 26
0.7)-(0.95 )(.99))mole/((0.7 (1 )MA moleCO mole 2
MA)( mole (1
:Reactor Exiting CO :Process Benzene
2
2
2
2
2
2
22
2
=+++
=××
=+++
=××+
Chapter 8: Maleic Anhydride SynthesisBenzene vs Butane - Tier 1 Assessment
Michigan Technological University20
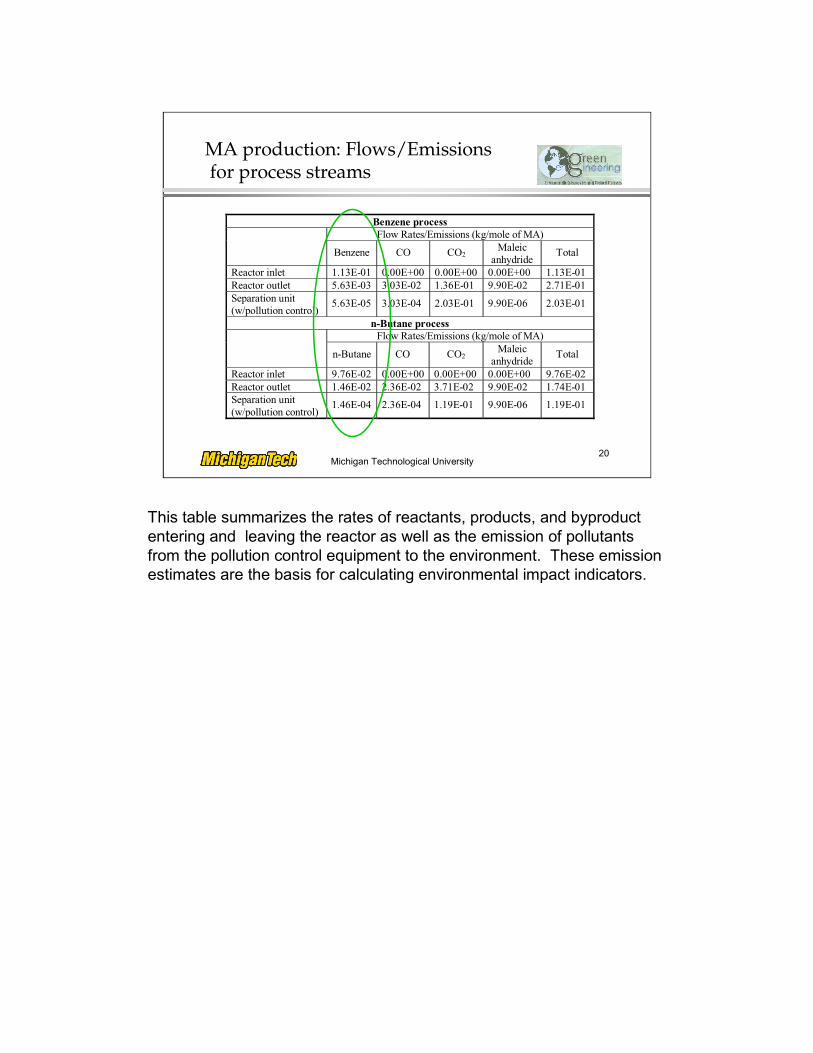
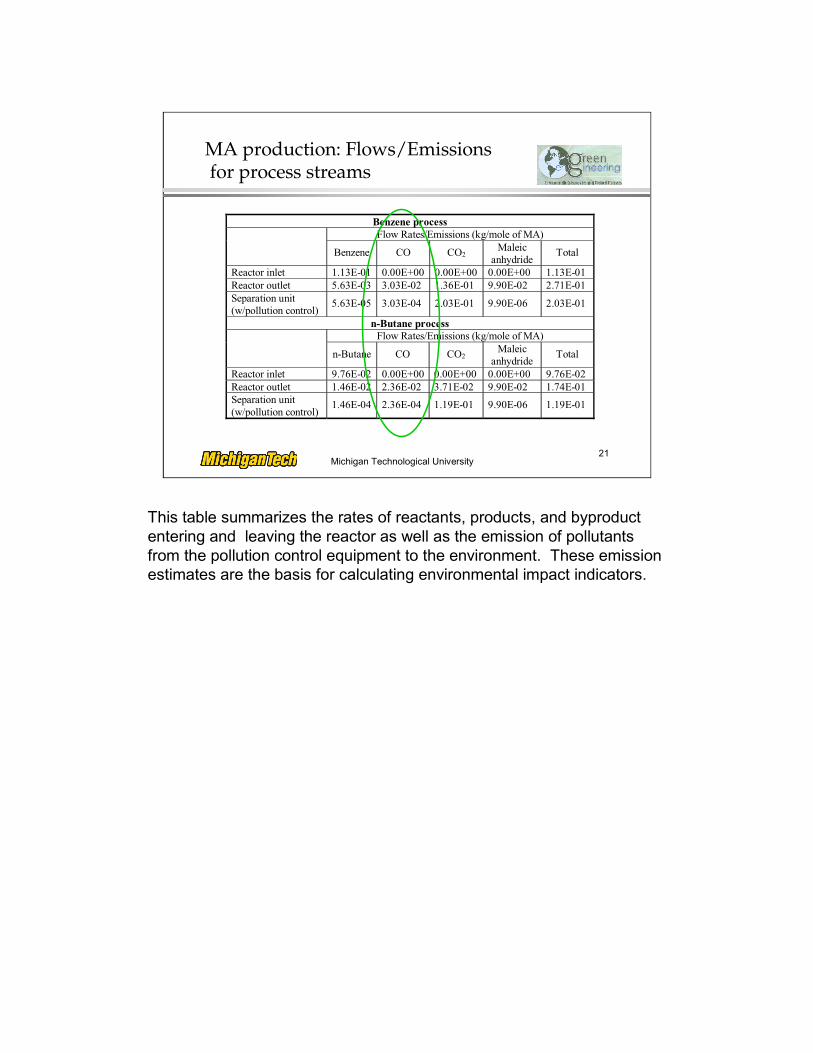
MA production: Flows/Emissions for process streams
Benzene process Flow Rates/Emissions (kg/mole of MA)
Benzene CO CO2 Maleic
anhydride Total
Reactor inlet 1.13E-01 0.00E+00 0.00E+00 0.00E+00 1.13E-01 Reactor outlet 5.63E-03 3.03E-02 1.36E-01 9.90E-02 2.71E-01 Separation unit (w/pollution control)
5.63E-05 3.03E-04 2.03E-01 9.90E-06 2.03E-01
n-Butane process Flow Rates/Emissions (kg/mole of MA)
n-Butane CO CO2 Maleic
anhydride Total
Reactor inlet 9.76E-02 0.00E+00 0.00E+00 0.00E+00 9.76E-02 Reactor outlet 1.46E-02 2.36E-02 3.71E-02 9.90E-02 1.74E-01 Separation unit (w/pollution control)
1.46E-04 2.36E-04 1.19E-01 9.90E-06 1.19E-01
This table summarizes the rates of reactants, products, and byproduct entering and leaving the reactor as well as the emission of pollutants from the pollution control equipment to the environment. These emission estimates are the basis for calculating environmental impact indicators.
Michigan Technological University21
MA production: Flows/Emissions for process streams
Benzene process Flow Rates/Emissions (kg/mole of MA)
Benzene CO CO2 Maleic
anhydride Total
Reactor inlet 1.13E-01 0.00E+00 0.00E+00 0.00E+00 1.13E-01 Reactor outlet 5.63E-03 3.03E-02 1.36E-01 9.90E-02 2.71E-01 Separation unit (w/pollution control)
5.63E-05 3.03E-04 2.03E-01 9.90E-06 2.03E-01
n-Butane process Flow Rates/Emissions (kg/mole of MA)
n-Butane CO CO2 Maleic
anhydride Total
Reactor inlet 9.76E-02 0.00E+00 0.00E+00 0.00E+00 9.76E-02 Reactor outlet 1.46E-02 2.36E-02 3.71E-02 9.90E-02 1.74E-01 Separation unit (w/pollution control)
1.46E-04 2.36E-04 1.19E-01 9.90E-06 1.19E-01
This table summarizes the rates of reactants, products, and byproduct entering and leaving the reactor as well as the emission of pollutants from the pollution control equipment to the environment. These emission estimates are the basis for calculating environmental impact indicators.

Michigan Technological University22
MA production: Flows/Emissions for process streams
Benzene process Flow Rates/Emissions (kg/mole of MA)
Benzene CO CO2 Maleic
anhydride Total
Reactor inlet 1.13E-01 0.00E+00 0.00E+00 0.00E+00 1.13E-01 Reactor outlet 5.63E-03 3.03E-02 1.36E-01 9.90E-02 2.71E-01 Separation unit (w/pollution control)
5.63E-05 3.03E-04 2.03E-01 9.90E-06 2.03E-01
n-Butane process Flow Rates/Emissions (kg/mole of MA)
n-Butane CO CO2 Maleic
anhydride Total
Reactor inlet 9.76E-02 0.00E+00 0.00E+00 0.00E+00 9.76E-02 Reactor outlet 1.46E-02 2.36E-02 3.71E-02 9.90E-02 1.74E-01 Separation unit (w/pollution control)
1.46E-04 2.36E-04 1.19E-01 9.90E-06 1.19E-01
This table summarizes the rates of reactants, products, and byproduct entering and leaving the reactor as well as the emission of pollutants from the pollution control equipment to the environment. These emission estimates are the basis for calculating environmental impact indicators.

Michigan Technological University23
MA production: Flows/Emissions for process streams
Benzene process Flow Rates/Emissions (kg/mole of MA)
Benzene CO CO2 Maleic
anhydride Total
Reactor inlet 1.13E-01 0.00E+00 0.00E+00 0.00E+00 1.13E-01 Reactor outlet 5.63E-03 3.03E-02 1.36E-01 9.90E-02 2.71E-01 Separation unit (w/pollution control)
5.63E-05 3.03E-04 2.03E-01 9.90E-06 2.03E-01
n-Butane process Flow Rates/Emissions (kg/mole of MA)
n-Butane CO CO2 Maleic
anhydride Total
Reactor inlet 9.76E-02 0.00E+00 0.00E+00 0.00E+00 9.76E-02 Reactor outlet 1.46E-02 2.36E-02 3.71E-02 9.90E-02 1.74E-01 Separation unit (w/pollution control)
1.46E-04 2.36E-04 1.19E-01 9.90E-06 1.19E-01
This table summarizes the rates of reactants, products, and byproduct entering and leaving the reactor as well as the emission of pollutants from the pollution control equipment to the environment. These emission estimates are the basis for calculating environmental impact indicators.
Michigan Technological University24
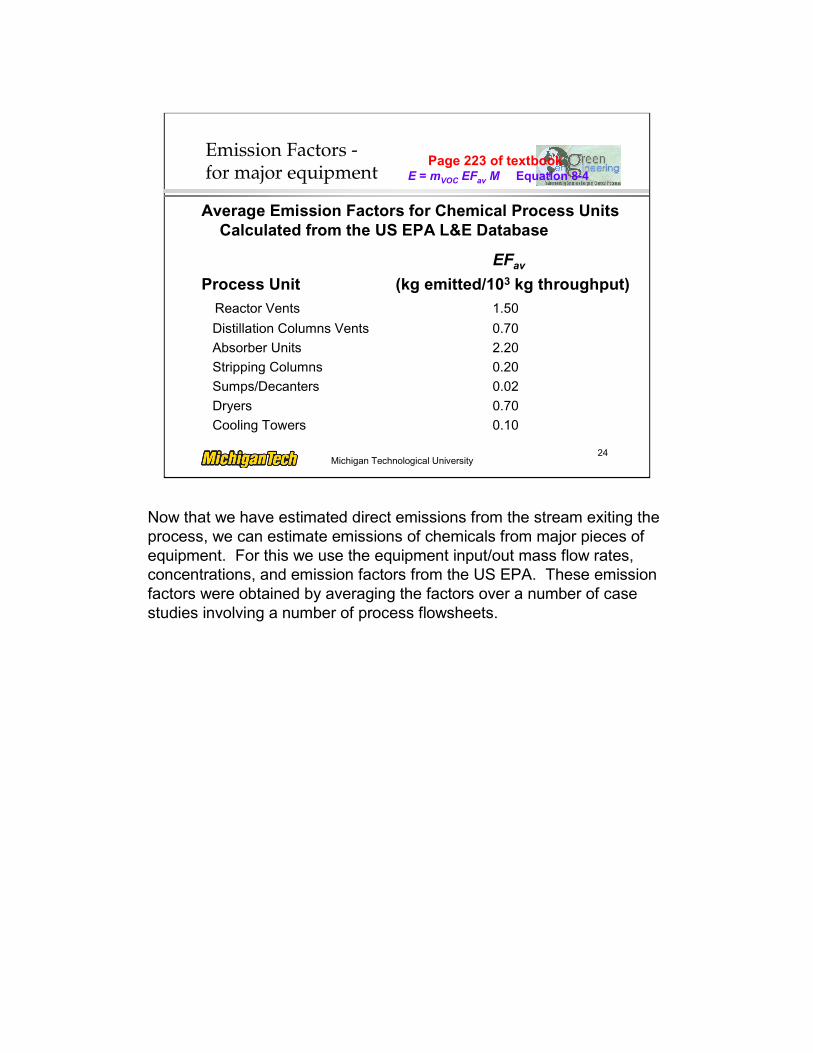
Emission Factors -for major equipment
Average Emission Factors for Chemical Process Units Calculated from the US EPA L&E Database
EFav
Process Unit (kg emitted/103 kg throughput)Reactor Vents 1.50
Distillation Columns Vents 0.70Absorber Units 2.20Stripping Columns 0.20Sumps/Decanters 0.02Dryers 0.70Cooling Towers 0.10
Page 223 of textbookE = mVOC EFav M Equation 8-4
Now that we have estimated direct emissions from the stream exiting the process, we can estimate emissions of chemicals from major pieces of equipment. For this we use the equipment input/out mass flow rates, concentrations, and emission factors from the US EPA. These emission factors were obtained by averaging the factors over a number of case studies involving a number of process flowsheets.

Michigan Technological University25
SCENE program
Start, Programs, CPAS Programs, SCENEStart, Programs, CPAS Programs, SCENEStart, Programs, CPAS Programs, SCENEStart, Programs, CPAS Programs, SCENE
The SCENE software is used to estimate emissions from process equipment using emission factors listed previously, it calculates environmental fate using a "Level I" multimedia compartment model (partitioning among air, water, soil, and sediment), and calculates nine impact indices, similar to those listed in the previous slides. We will calculate environmental indices using the emissions estimated for the MA process in the previous table.
Michigan Technological University26
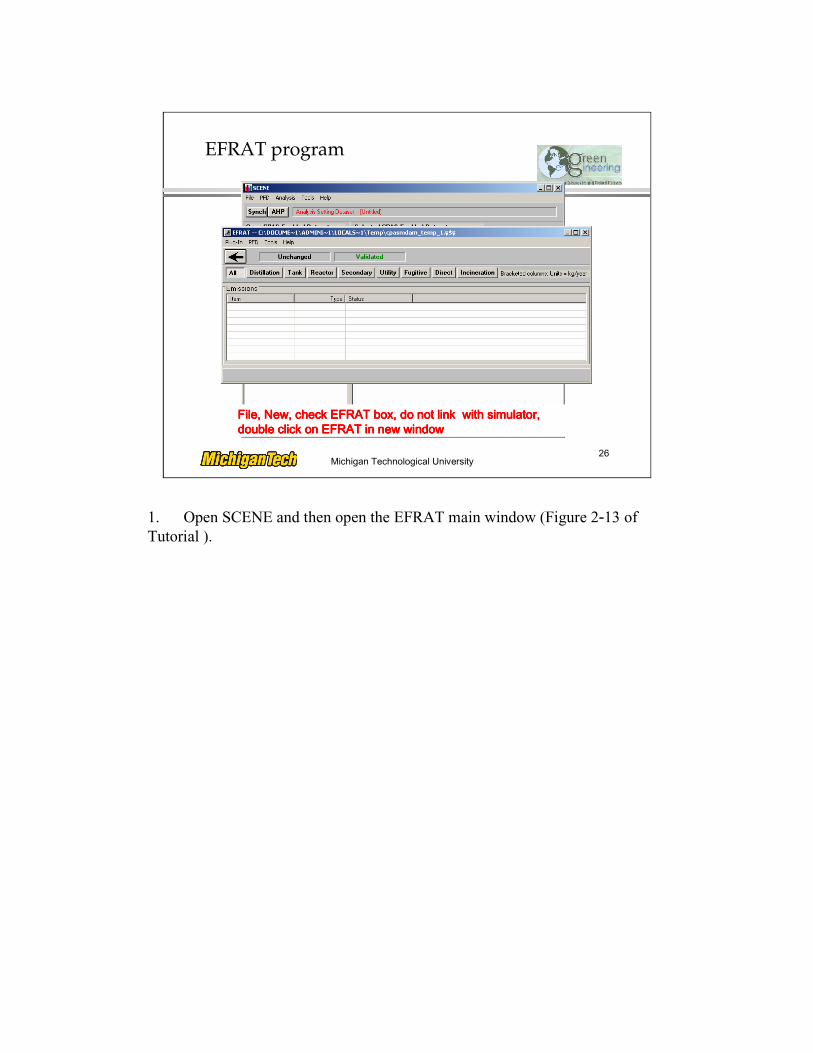
EFRAT program
File, New, check EFRAT box, do not link with simulator, File, New, check EFRAT box, do not link with simulator, File, New, check EFRAT box, do not link with simulator, File, New, check EFRAT box, do not link with simulator, double click on EFRAT in new windowdouble click on EFRAT in new windowdouble click on EFRAT in new windowdouble click on EFRAT in new window
1. Open SCENE and then open the EFRAT main window (Figure 2-13 of Tutorial ).

Michigan Technological University27
EFRAT program: Add chemicals
2. Add chemicals: benzene, CO, CO2 and maleic anhydride.
• Open ‘PFD’ menu, select ‘chemical list’ and then open the following window (Figure 3-2 of Tutorial).
This window contains a list of ‘Chemicals in Database’. You can choose chemicals from this list and import them to the list of ‘Chemicals in Current PFD’.
• Find chemical benzene. Use the vertical scroll bar of the chemical list to move down the list until benzene becomes visible, then highlight it.
• Import chemical benzene. Click ‘Import This Chemical’ button. Benzene will appear in the list of ‘Chemicals in Current PFD’ (Figure 3-3 of Tutorial).
On the right side of this window, it displays two pages of ‘Properties of Selected Chemical (Benzene)’. If there are some data unavailable for one chemical, the data cell will display ‘Unavailable’ and will be highlighted.

Michigan Technological University28
EFRAT program: Benzene
2. Add chemicals: benzene, CO, CO2 and maleic anhydride.
• Open ‘PFD’ menu, select ‘chemical list’ and then open the following window (Figure 3-2).
This window contains a list of ‘Chemicals in Database’. You can choose chemicals from this list and import them to the list of ‘Chemicals in Current PFD’.
• Find chemical benzene. Use the vertical scroll bar of the chemical list to move down the list until benzene becomes visible, then highlight it.
• Import chemical benzene. Click ‘Import This Chemical’ button. Benzene will appear in the list of ‘Chemicals in Current PFD’ (Figure 3-3).
On the right side of this window, it displays two pages of ‘Properties of Selected Chemical (Benzene)’. If there are some data unavailable for one chemical, the data cell will display ‘Unavailable’ and will be highlighted.

Michigan Technological University29
EFRAT program: All chemicals added
• Import chemicals CO, CO2, and maleic anhydride following the same procedures as benzene (Figure 3-4 of Tutorial).
• Click ‘OK’, exit this window and return to the EFRAT main window, or click ‘Cancel’ to abandon these changes.

Michigan Technological University30
EFRAT program: emissions
3. Add reactor emission.
• Open ‘PFD’ menu, select ‘Emissions’ and then click ‘Add New Emission…’. You can choose to add emissions from eight different sources (Figure 3-5 of Tutorial).
• Select ‘Reactor’, then click ‘OK’ and enter into the reactor emissions window (Figure 3-6). EFRAT gives this emission a default name, ‘Reactor 1’. You can rename it by activating ‘Item Name’ field and inputting a new name.
• Input total feed flow rate and total product flow rate from Table 3-2. Please note that the unit of the flow rate in this evaluation is kg/mole of MA. However, in EFRAT, this unit does not exist. We can use the unit of flow rate as ‘kg/yr’ and then substitute it with ‘kg/mole of MA’ in the final results.

Michigan Technological University31
EFRAT program: Reactor Emission
3. Add reactor emission.
• Select ‘Reactor’, then click ‘OK’ and enter into the reactor emissions window (Figure 3-6 of Tutorial). EFRAT gives this emission a default name, ‘Reactor 1’. You can rename it by activating ‘Item Name’ field and inputting a new name.
• Input total feed flow rate and total product flow rate from Table 3-2 of Tutorial. Please note that the unit of the flow rate in this evaluation is kg/mole of MA. However, in EFRAT, this unit does not exist. We can use the unit of flow rate as ‘kg/yr’ and then substitute it with ‘kg/mole of MA’ in the final results.
• Input mass fraction of each chemical in both feed and product streams. These can be calculated from Table 3-2 by dividing the flow rate of one chemical by the total flow rate.
• Click ‘OK’ to save the changes and return to the EFRAT main window, or click ‘Cancel’ to abandon these changes.
Michigan Technological University32
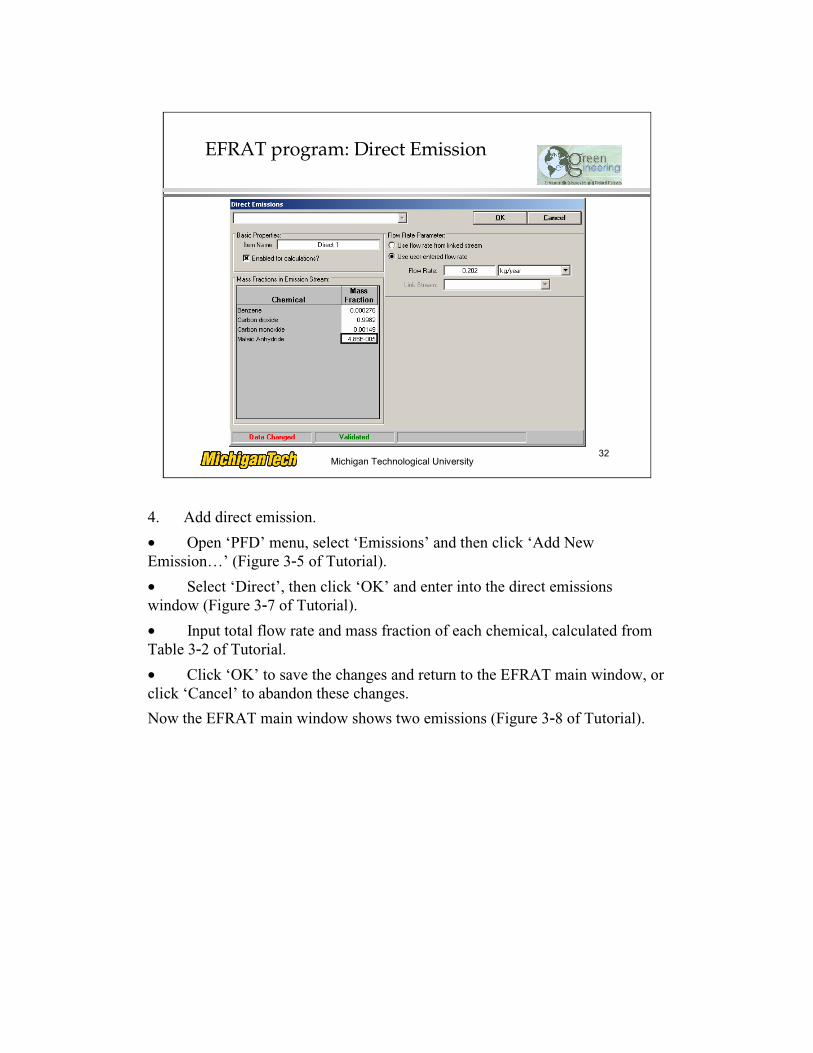
EFRAT program: Direct Emission
4. Add direct emission.
• Open ‘PFD’ menu, select ‘Emissions’ and then click ‘Add New Emission…’ (Figure 3-5 of Tutorial).
• Select ‘Direct’, then click ‘OK’ and enter into the direct emissions window (Figure 3-7 of Tutorial).
• Input total flow rate and mass fraction of each chemical, calculated from Table 3-2 of Tutorial.
• Click ‘OK’ to save the changes and return to the EFRAT main window, or click ‘Cancel’ to abandon these changes.
Now the EFRAT main window shows two emissions (Figure 3-8 of Tutorial).

Michigan Technological University33
EFRAT program: Emissions Window

Michigan Technological University34
EFRAT program: Viewing ResultsEmission Summary
5. View the results.
Open menu ‘PFD’ and select ‘Emission Summary…’ to view the results.
This table can be pasted into MS Excel by clicking ‘Edit’ menu and then selecting its submenu.
• Click ‘Close’ and return to the EFRAT main window.

Michigan Technological University35
Recap
Green Chemistry concepts and Atom Economy are useful for designingmore environmentally beneficial reaction pathways. Early design GreenEngineering analysis methods for environmental impacts of alternatives.
l Educational goals and topics covered in the module
l Green Chemistry (Chapter 7) and assessing potential impacts based on limited information (Chapter 8)
l Estimating emissions from processes in early design.


