Greater Toronto Area R User’s Group - Meetupfiles.meetup.com/1718572/Unsupervised Neural Networks...
34
Presentation to December 2012 Masoud Charkhabi Advanced Analytics Canadian Imperial Bank of Commerce Public Greater Toronto Area R User’s Group Unsupervised Neural Networks through Self-Organizing Maps in R, with Interesting Applications in Data Visualization and Text Mining
Transcript of Greater Toronto Area R User’s Group - Meetupfiles.meetup.com/1718572/Unsupervised Neural Networks...
Presentation to
December 2012
Masoud CharkhabiAdvanced AnalyticsCanadian Imperial Bank of Commerce
Public
Greater Toronto Area R User’s Group
Unsupervised Neural Networks through Self-Organizing Maps in R, with Interesting Applications in Data Visualization and Text Mining
| 2
Presentation Outline• Background
• Amplifying Domain Knowledge• Unsupervised Learning• Understanding Lossy Compression• Projection and Resolution• Data Visualization
• Details of the Self-Organizing Map Technique• The Self-Organizing Map• Mechanics of the Basic Algorithm• More on SOMs
• Implementation of the Self-Organizing Map• Software Tools• R Packages• A Few Words on the Status of R
• Applications and Interpretation• Applications of the SOM• Text Mining Applications: The Nature of the Problem• Text Mining Applications: The Shape of the Data• Text Mining Applications: Engineering Features• Text Mining Applications: Tuning Parameters• Text Mining Applications: Tuning Parameters, Topology 1• Text Mining Applications: Tuning Parameters, Topology 2• Text Mining Applications: Tuning Parameters, Topology 3• Text Mining Applications: Labeling 1• Text Mining Applications: Labeling 2• Text Mining Applications: Other Tuning Parameters• Text Mining Applications: Interpretation and the Knowledge Map• Philosopher or Pet?• Geospatial Applications: Political Maps vs. Knowledge Maps• Scanning a Self-Organizing Map• Applications in Network Analytics
• Conclusions
• References

| 3
Disclaimer
All values and figures in the following presentation are intended solely for the purpose of demonstration. The findings do not necessarily reflect any literal data from historical studies. Many labels have been removed to protect the intellectual property of CIBC. Any views or opinions
presented are solely those of the presenter and do not necessarily represent those of CIBC.
| 4
Amplifying Domain Knowledge
“Now "problem solving" is largely, perhaps entirely, a matter of appropriate
selection. ... It is also clear that many of the
tests used for measuring "intelligence“
are scored essentially according to the candidate's power of appropriate selection. ... Thus it is not impossible that what is commonly referred to as "intellectual power" may be equivalent to "power of appropriate selection". …
If this is so, and as we know that power of selection can be amplified, it seems to follow that intellectual power, like physical power, can be amplified. Let no one say that it cannot be done, for the gene-patterns do it every time they form a brain that grows up to be something better than the gene-pattern could have specified in detail. What is new is that we can now do it synthetically, consciously, deliberately.”
(William Ross Ashby)
Artificial Intelligence vs. Intelligent Augmentation
Most practitioners agree that domain knowledge is the foundation
for which successful data mining projects are built upon. One must recognize when to bring data mining output to a domain expert, or domain expertise to the data mining expert. In either case the goal can be seen as amplifying domain knowledge.

| 5
Unsupervised Learning
Some Unsupervised Learning methods include:
•Cluster Analysis: observation summary
•Principal Components, Curves and Surfaces: dimension reduction
•Multi-Dimensional Scaling: preserve pairwise distances
•Unsupervised Learning
methods are primarily focused on revealing the properties of dataset. These properties are in fact the essence of domain knowledge.
Referring to the Bible:
•Supervised Learning
problems require training data and a well-defined objective. Unfortunately these requirements rarely exist.
•The focus of this presentation will be on the methods that fall in the category of Clustering
or Dimension Reduction.
•It is interesting to note that the second edition of The Elements of Statistical Learning: Data Mining, Inference and Prediction
by Hastie, Tibshirani and Friedman
includes several new techniques in the Unsupervised Learning section.

| 6
"You do not really understand something unless you can explain it to your grandmother." (Albert Einstein)
Understanding Lossy Compression
Lossy Compression:
Some (non-essential)
information is lost during the encoding/decoding process

| 7
•At times the problem at hand is that too many attributes have been observed. This is often referred to as the “Curse of Dimensionality”. In these case most techniques attempt to project data onto a lower dimensional space. The two techniques described above are often used to complement each other.
•Clustering techniques attempt to collapse rows/observations into
similar groups. This process can be seen as analogous to reducing resolution
or highlighting similarities. The main utility of the technique
is that it makes the idea-generating and planning process more practical. Once the groups are explained, a prescription or plan can be prepared based on the description.
Projection and Resolution
Source: (Hastie et al. 2008)
K = 1000 K = 200 K = 20 K = 3

| 8
Data Visualization
Domain Expert
Data Mining Expert
Data
Visualization
The ability to summarize information to an appropriate level are
where domain expertise and data mining expertise overlap the most. Data Visualization lies in this area
as a catalyst to provoke communication between the data miner and the domain expert. It is not a coincidence then that many of the innovative Data Visualization methods have been developed in the area of Unsupervised Learning.
Statistical Learning
Story
| 9
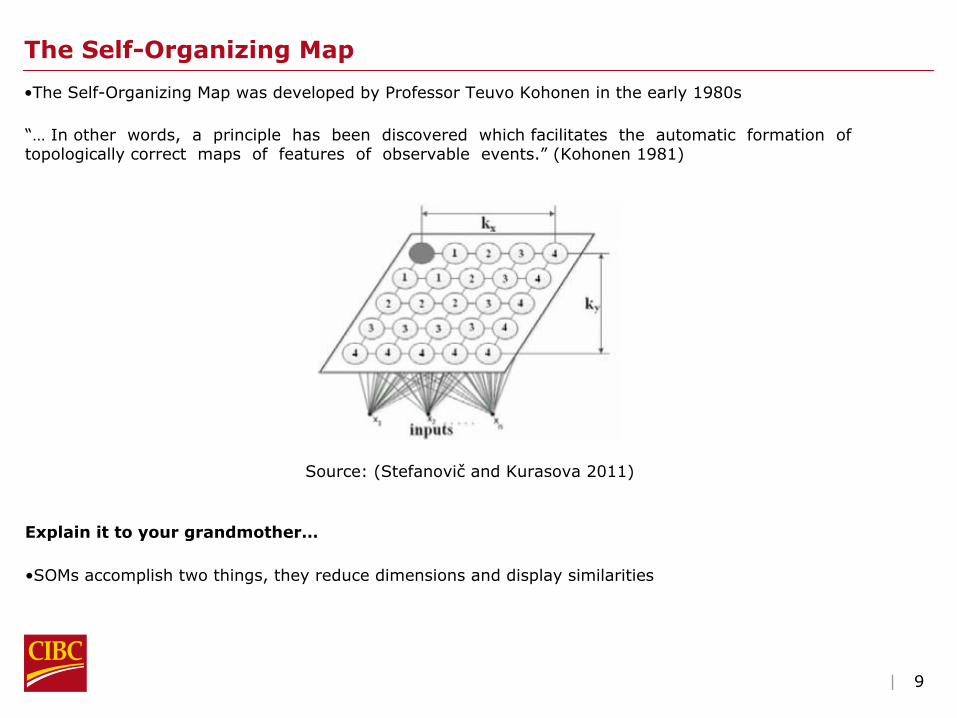
The Self-Organizing Map
•The Self-Organizing Map was developed by Professor Teuvo Kohonen in the early 1980s
Source: (Stefanovič
and Kurasova 2011)
“…
In other words, a principle has been discovered which facilitates the automatic formation of topologically correct maps of features of observable events.”
(Kohonen 1981)
Explain it to your grandmother…
•SOMs accomplish two things, they reduce dimensions and display similarities

| 10
Mechanics of the Basic Algorithm
•Components of the neuron vectors Mij
are initialized at random (usually this is done by using the first two principal components). If n-dimensional vectors X1 , X2
,..., Xm
are needed to map, the components of these vectors x1
, x2
, ... , xn
are passed to the network as the inputs, where m
is the number of the vectors, n
is the number of components of the vectors.
•At each learning step, an input vector Xp
Є
{ X1 , X2
,..., Xm
}
is passed to the neural network. The vector Xp
is compared with all neurons Mij
. The distance between this input vector Xp
and each neuron Mij
are calculated. The vector (neuron) Mc
with the smallest distance to Xp
is selected as a winner.
•All neurons components are adapted according to the learning function:
Mij
(t+1) = Mij
(t) + hijc(t)(Xp
– Mij
(t))
Here t
is the number of iterations, hijc(t) is a neighboring function, c
is a pair of indices of the neuron winner of vector Xp
. The learning is repeated until the required number of iterations is reached.
(Stefanovič
and Kurasova 2011)

| 11
More on the SOM
•Topology is the key value add of the SOM technique
Similar techniques
K-means:
the batch SOM version is often called a constrained version of K-means (Ripley 1996)
Principal Surfaces:
continuous neurons
Multi-dimensional Scaling:
concentrates dissimilarities
•SOMs do not rely on distributional assumptions
•SOMs are scalable to large datasets
•“There is some evidence (Lynch et al. 1978) that topographic maps
of the exterior environment are formed in the hippocampus.”
(Lagus et al. 1981)
•Can be extended to more than two dimensions and to more layers
•Make many maps
•Distance measures, topologies, learning rate, neighborhood function, etc. are some of the tuning parameters. Many agree that the neighborhood function is the most important tuning parameter of the algorithm. Albeit, the impact of Feature Engineering dwarfs any algorithm tuning.
| 12
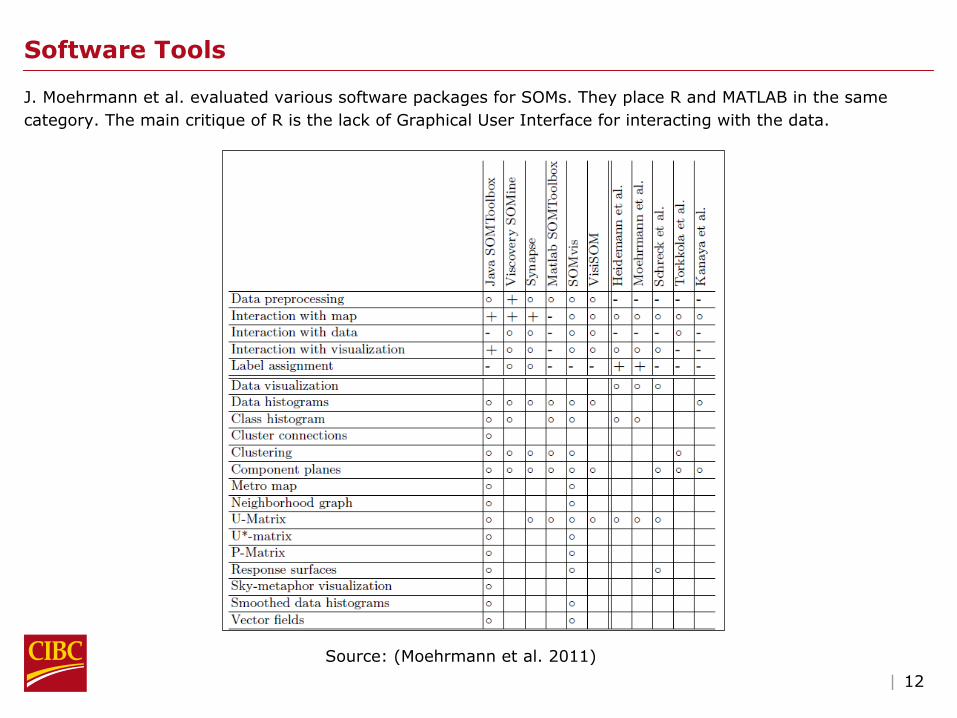
Software Tools
J. Moehrmann et al. evaluated various software packages for SOMs. They place R and MATLAB in the same category. The main critique of R is the lack of Graphical User Interface for interacting with the data.
Source: (Moehrmann et al. 2011)

| 13
•
Flexible learning rate and neighborhood function
•
Allows manual initialization of codebook vectors
R Packages
•
Includes some data preparation tools
Package "wccsom“
•
Weighted Cross Correlation and Autocorrelation for assessing similarities, instead of Euclidean distance
•
Quite a bit of functions to work with new data after a base map is developed
•
Less flexibility with learning rate, neighborhood function and initialization
•
Creative integration with Supervised Learning
Package "som“
•
Allows inspection of the learning process
•
Allows further training with updated parameters
Package "rsnss"
•
Comprehensive Neural Networks package, SOMs are only a small portion of the package
•
Allows multiple layers
•
Integration with Supervised Learning methods
Package "kohonen’
•
Less flexibility with learning rate, neighborhood function, although flexible with initialization
•
Creative integration with Supervised Learning
•
More layers possible through “Super-Organized Maps”
| 14
A Few Words on the Status of R
•
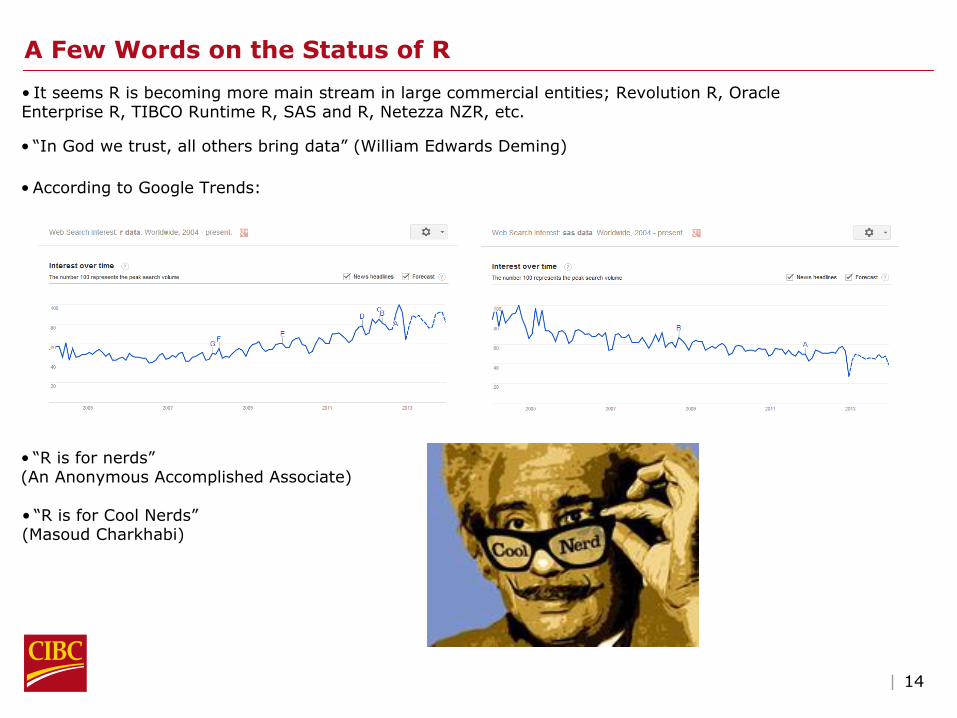
It seems R is becoming more main stream in large commercial entities; Revolution R, Oracle Enterprise R, TIBCO Runtime R, SAS and R, Netezza NZR, etc.
•
“R is for nerds”(An Anonymous Accomplished Associate)
•
According to Google Trends:
•
“R is for Cool Nerds”(Masoud Charkhabi)
•
“In God we trust, all others bring data”
(William Edwards Deming)

| 15
Applications of the SOM
Today we will review these applications:
•Text Mining
•Geospatial analysis
•Network Analytics
The 8th International Workshop on Self-Organizing Maps, WSOM 2011, placed papers in the below categories:
•Financial and Societal Applications
•Theory and Methodology
•Applications of Data Mining and Analysis
•Language Processing and Document Analysis
•Visualization and Image Processing

| 16
Text Mining Applications: The Nature of the Problem
•Topology is embedded in Natural Language; WordNet, word similarity, semantic similarity
“Happy families
are
all alike; every unhappy family is unhappy in its own way”
(Leo Tolstoy)
•Regularization seems to be critical in extremely high dimensional problems
•Text is high-dimensional in nature, adding structured data only adds to the problem
•Analyzing text in isolation is of little practical value
•Labeled datasets are infrequent
•Text data is mostly negative; complaints, errors, etc.
•Far more missing values than non-missing values

| 17
ID Question 1 Question 2 Text 1 Text 2 Attribute 1 Attribute 2
1 Excellent Extremely Likely
Great service. Very polite. I like the new credit card.
… 25 51
2 Very Good Not Likely I’m not sure yet. I haven’t been with the bank very long. Check back in a few months.
… 15 59
3 Average No Response I don’t have much business with you guys. I live closer to a competitor.
… 89 12
Sentiment 1 Sentiment 2 Card Related Too New Location
10 … 1 0 0
5 … 0 1 0
2 … 0 0 1
great service polite credit card
1 1 1 1 1
0 0 0 0 0
0 0 0 0 0
Structured Data
LabelsN-grams
Structured Data
Text Mining Applications: The Shape of the DataUnstructured Data

| 18
Personal Pronoun Present Tense Verb Determiner New Credit Card
1 1 1 1 1 1
Create interesting language features:
•WordNet and Semantic distance to themes of interest (Burkovski et al. 2011)
•N-gram indicators or counts, weighted with “Term Frequency”
x “Inverse Document Frequency”. This does not work well when the “Documents”
are actually short comments.
•Part-Of-Speech tags mixed with N-grams. For example; “I like the new credit card.”
= “PRP VBP DT new credit card”
•Output from many classifiers with domain expertise and custom segmentation. The above methods are often extremely difficult to interpret. Passing the data through classifiers naturally reduces dimensions and hence assists interpretation greatly. This is the most powerful but most time consuming method:
Text Revolving Credit Lending Secured
I like the new credit card. 1 1 0
The process to complete the mortgage application was cumbersome.
0 1 1
Text Mining Applications: Engineering Features

| 19
Text Mining Applications: Tuning Parameters
•Topology:
examination with the number of neurons and the desired topology
•Neighborhood Function:
Gaussian, Radial, etc.
•Learning Rate:
linear decreasing, non-linear decreasing, etc.
•Initialization:
multiple random initialization, first two principal components,
previous SOMs
| 20
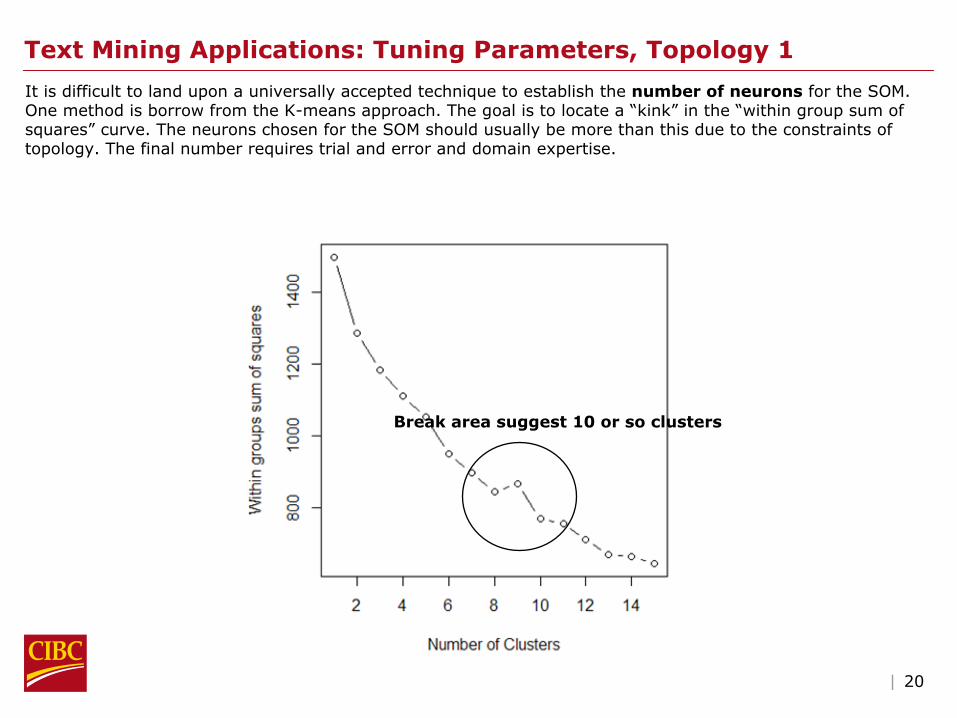
Text Mining Applications: Tuning Parameters, Topology 1
It is difficult to land upon a universally accepted technique to
establish the number of neurons
for the SOM. One method is borrow from the K-means approach. The goal is to locate a “kink”
in the “within group sum of squares”
curve. The neurons chosen for the SOM should usually be more than this due to the constraints of topology. The final number requires trial and error and domain expertise.
Break area suggest 10 or so clusters

| 21
Text Mining Applications: Tuning Parameters, Topology 2
•Establish a configuration that is best interpretable using the codebook vector plots
…
5x2 5x3 5x4

| 22
Text Mining Applications: Tuning Parameters, Topology 3
•Evaluate the counts plot in combination with the codebook vectors to make grouping decisions
1 2 2
3 4 2
5
5
6
6
7 7
8 9 9
10
Codebook Vector Plot Counts Plot

| 23
Text Mining Applications: Labeling 1
•Evaluate quality by plotting distance to neighbors (U-matrix) and mean distance of observations to the codebook vector. Re-evaluate the cluster groupings.
1 2 2
3 4 2
5
5
6
6
7 7
8 9 9
10
Count of Observations Distance to Neighbors Mean Distance to Neuron
! ? √
√ √ √
!
!
?
√
√ √
? ! !
?
1a 2a 2b
1b 4 2c
5
5
6
6
7 7
8 9 9
9

| 24
Text Mining Applications: Labeling 2
•Label and interpret the segments to allow the domain expert to become familiar with the topology
•
Complaints related to …•
Favorable response to questions related to …•
Sentiment …•
Survey completed during …•
…
?
?

| 25
Text Mining Applications: Other Tuning Parameters
•Initialize according to domain expertise. Use previous SOMs or PCAs.
•Initialize class and continuous data separately
•See (Stefanovič
and Kurasova 2011) for a good study on Learning Rates and Neighborhood Functions

| 26
Text Mining Applications: Interpretation of the Knowledge Map
•SOMs have been successful in large scale applications of text collections
Source: (Mayer and Rauber 2011)

| 27
Philosopher or Pet?
•As ridiculous as this may seem, taking the SOM Knowledge Map literally without consideration of it’s limitations and domain considerations is nearly as intelligent
OR ?
•
Premise 1: All cats die
•
Premise 2: Aristotle is dead
•
Conclusion: Aristotle was a cat

| 28
Geospatial Applications: Political Maps vs. Knowledge Maps
Political Map
Knowledge Map 1
Knowledge Map 2
Opportunity!

| 29
Scanning a Self-Organized Map
•Try to get a sense of the expectation of the problem at hand then compare to the SOM. Look for “interesting information”.
Y X
•What was thought to a major effect is actually negligible
•What was thought to be complicated is actually very simple
•Where there was thought to be no pattern, there actually is a pattern
•“Information is related to surprise”
(Claude Shannon)
•“What was thought to be X is really Y”
(Cachon 2011)

| 30
Applications in Network Analytics
•Self-Organizing Maps as a Layout Algorithm:
•More edges often exist between nodes in the same cluster.
•The relationship between Clustering and Network Analytics is the
topic of many papers. See the work of Jure
Leskovic.
•Spectral Clustering rephrases the clustering problem as a graph-partition problem (Hatie
et al. 2008)
Random Layout SOM Node Layout

| 31
Conclusions
•Amplify domain knowledge by leveraging Unsupervised Learning techniques
•Self-Organizing Maps are one of the more useful Unsupervised Learning
techniques
•Useful applications in Text Mining, Geospatial and Network Analytics
•R is cool
•Focus on Feature Engineering and Interpretation
Thank you for attending

| 32
References
Bergmeir, C., Benitez, J. M. 2012. Neural Networks in R Using the Stuttgart Neural Network Simulator: RSNNS. Journal of Statistical Software. January 2012, Volume 46, Issue 7. Available at <Neural Networks in R Using the Stuttgart Neural Network Simulator: RSNNS> [Accessed 1 November 2012]
Burkovski, A., Kessler, W., Heidemann, G., Kobdani, H., Sch¨utze, H. 2011. Self Organizing Maps in NLP: Exploration of Coreference Feature Space. In: Proceedings of the
8th Annual Workshop on Self-Organizing Maps (WSOM), Finland, pp. 228–237
Cachon, G. P., 2011. What is Interesting in Operations Management. The Wharton School, University of Pennsylvania. Available at <http://opim.wharton.upenn.edu/~cachon/pdf/Interesting_v3.pdf> [Accessed 20 November 2012]
Hammer, B., Gisbrecht, A., Hasenfuss, A., Mokbel, B., Schleif, F. M., Zhu, X. 2011. Topographic Mapping of Dissimilarity Data. In: Proceedings of the 8th Annual Workshop on Self-Organizing Maps (WSOM), Finland, pp. 1–15
Hastie, T., Tibshirani, R., & Friedman, J. H., 2008. The Elements of Statistical Learning: Data Mining, Inference, and Prediction. New York, Springer.
Honkela, T. Self-Organizing Maps in Natural Language Processing. Neural Networks Research Centre. Helsinki University of Technology. 1997. Available at: <http://users.ics.aalto.fi/tho/thesis/index.html> [Accessed 14 September 2012]
Kaski, S., Data exploration using self-organizing maps. Acta Polytechnica Scandinavica, Mathematics, Computing and Management in Engineering Series No. 82, Espoo 1997, 57 pp. Published by the Finnish Academy of Technology. ISBN 952-5148-13-0. ISSN 1238-9803. UDC 681.327.12:159.95:519.2 Available at <http://users.ics.aalto.fi/sami/thesis/index.html> [Accessed 1 September 2012]
Lagus, K., Honkela, T., Kaski, S., Kohonen, T. 1997. WEBSOM for Textual Data Mining. Neural Networks Research Centre. Helsinki University of Technology. Available at
<http://users.ics.aalto.fi/krista/papers/lagus99aire.pdf> [Accessed 1 July 2012]

| 33
References
Mayer, R., Rauber, A. 2011. On Wires and Cables: Content Analysis of WikiLeaks Using Self-Organising Maps. In: Proceedings of the 8th Annual Workshop on Self-Organizing Maps (WSOM), Finland, pp. 238–246
Moehrmann, J., Burkovski, A., Baranovskiy, E., Heinze, G. A., Rapoport, A., Heidemann, G. 2011. A Discussion on Visual Interactive Data Exploration Using Self-Organizing Maps. In: Proceedings of the 8th Annual Workshop on Self-Organizing Maps (WSOM), Finland, pp. 178–187
Neme, O., Pulido, J., Neme, A., 2011. Mining the City Data: Making Sense of Cities with Self-Organizing Maps. In: Proceedings of the 8th Annual Workshop on Self-Organizing Maps (WSOM), Finland, pp. 168–177
Sarlin, P., Eklund, T. 2011. Fuzzy Clustering of the Self-Organizing Map: Some Applications on Financial Time Series. In: Proceedings of the 8th Annual Workshop on Self-Organizing Maps (WSOM), Finland, pp. 40–50
Sayed, I. Q. Issues in Anaphora Resolution, 2003. Available at: <http://nlp.stanford.edu/courses/cs224n/2003/fp/iqsayed/project_report.pdf> [Accessed 1 September 2012]
Stefanovič
P., Kurasova O. 2011. Influence of Learning Rates and Neighboring Functions on Self-Organizing Maps. In: Proceedings of the 8th Annual Workshop on Self-Organizing Maps (WSOM), Finland, pp. 141–150
Wang, Y., Van Hamme, H. 2011. Gaussian Selection Using Self-Organizing Map for Automatic Speech Recognition. In: Proceedings of the 8th Annual Workshop on Self-Organizing Maps (WSOM), Finland, pp. 218–227
Wehrens, R., Buydens, L. M. C. 2007. Self and Super-Organizing Maps in R: The kohonen Package. Journal of Statistical Software. October 2007, Volume 21, Issue 5. Available at <http://www.jstatsoft.org/v21/i05/paper> [Accessed November 2010]
Wehrens. R., Package “wccsom”. 2012. Available at <http://cran.r-
project.org/web/packages/wccsom/wccsom.pdf> [Accessed June 2012]

| 34
References
Yan, J., Package “som”. 2010. Available at <http://cran.r-project.org/web/packages/som/som.pdf> [Accessed June 2012]