
Greater Manchester Strategic Housing Market Assessment
231
Greater Manchester’s Plan for Homes, Jobs and the Environment Greater Manchester Strategic Housing Market Assessment
Transcript of Greater Manchester Strategic Housing Market Assessment
Greater Manchester’s Plan for Homes, Jobs and the Environment
Greater Manchester Strategic Housing Market Assessment

Greater ManchesterStrategic Housing Market Assessment
Update August 2020

The Greater Manchester Combined Authority (GMCA) Research Team has
prepared the report. For any enquiries, please contact:
3
Contents
Executive summary ................................................................................. 6
1 Introduction and policy background ................................................ 10
1.1 Background and objectives ........................................................ 10
1.2 Policy background ..................................................................... 12
1.3 Report structure ....................................................................... 15
2 Defining the Housing Market Area ................................................... 16
Chapter summary ............................................................................... 17
2.1 Introduction ............................................................................. 18
2.2 Household migration ................................................................ 19
2.3 Commuting patterns ................................................................. 24
2.4 House prices ............................................................................. 29
2.5 Summary .................................................................................. 31
3 Local Housing Need ......................................................................... 34
Chapter summary ............................................................................... 35
3.1 Introduction ............................................................................. 36
3.2 Standard methodology: Local Housing Need .............................. 37
4 Characteristics of the Housing Market Area ..................................... 47
Chapter summary ............................................................................... 48
4.1 Introduction ............................................................................. 49
4.2 Population and household profile .............................................. 49
Population and age structure ........................................................... 49
Population projections..................................................................... 55
Household characteristics .............................................................. 60
Black and Minority Ethnic (BME) communities ................................ 63
Young people ................................................................................... 66
4.3 Socio-economic profile .............................................................. 69
Economic activity and employment rate .......................................... 69
Qualifications .................................................................................. 73
4
Occupation ...................................................................................... 75
Industry of employment .................................................................. 78
Household incomes.......................................................................... 82
Deprivation ..................................................................................... 84
Homelessness .................................................................................. 86
4.4 Dwelling stock profile .............................................................. 90
Profile of current dwellings ............................................................ 90
Overcrowding, under-occupation and concealed households ............ 97
Council Tax bands ......................................................................... 101
Energy Performance Certificate ratings ......................................... 104
4.5 Migration characteristics ........................................................ 105
4.6 Need for different sizes, types and values of homes ................ 108
5 Market Signals ............................................................................... 115
Chapter summary ..............................................................................116
5.1 Introduction ............................................................................ 117
5.2 House prices ........................................................................... 118
5.3 Land values............................................................................. 127
5.4 Rental trends .......................................................................... 128
5.5 Households in need and affordability ...................................... 133
5.6 Housing development rates ...................................................... 151
5.7 Overcrowding, under-occupation and concealed households ... 153
5.8 Vacancy levels ........................................................................ 156
6 Housing needs of particular groups ............................................... 160
Chapter summary ..............................................................................161
6.1 Introduction ........................................................................... 163
6.2 Older persons housing ............................................................ 163
6.3 Housing with care (households with specific needs) ............... 169
Older people .................................................................................. 170
People with disabilities ................................................................. 172
6.4 People with a housing and support need ................................. 175

5
6.5 Private renters ........................................................................ 179
6.6 People wishing to build their own homes ................................ 188
6.7 Students ................................................................................. 190
6.8 Family housing ....................................................................... 196
6.9 Armed Forces .......................................................................... 198
6.10 Gypsies and Travellers ........................................................... 200
7 Affordable Housing Need Assessment ............................................... 205
Chapter summary ............................................................................. 206
7.1 Introduction ........................................................................... 207
7.2 Methodology ........................................................................... 208
7.3 Stages of the assessment .......................................................... 211
8 Appendices .................................................................................... 228

6
Executive summary
This Strategic Housing Market Assessment (SHMA) has been produced by
the Greater Manchester Combined Authority (GMCA) to provide an
update to the SHMA produced in 20191. The purpose of the SHMA is to
present a clear, evidenced picture of the housing market in Greater
Manchester. The SHMA shows how the housing market is changing and
provides an assessment of the future needs for both market and
affordable housing. The SHMA also explores the housing needs of
different groups within the population over the next twenty years. To do
that, this update includes a great deal of information and analysis, and an
executive summary necessarily presents a very selective story in
comparison. However, some key messages can be outlined, as follows:
Greater Manchester is a large and diverse city region that, while well
connected to our neighbours, can reasonably be defined as a housing
market for planning purposes. More than four out of every five
households who move into a home in Greater Manchester already live
here. Nearly nine in ten working people who live in Greater Manchester
also work here, and of Greater Manchester residents who work here,
two-fifths travel to another Greater Manchester district for work,
showing how interconnected we are as a city region. See Chapter 2 for
how we have concluded that Greater Manchester can be defined as a
housing market.
Using the Government’s proposed new standard methodology, we
calculate an annual housing need for Greater Manchester of 10,583 new
homes per year. Chapter 3 sets out that calculation in more detail.
With 2.8 million people living in 1.2 million homes across ten districts,
Greater Manchester and our residents are of course hugely diverse. At a
headline level, we can say that:
we are relatively youthful, with over 20% of residents under 30;
while numbers in the older age groups are growing fast too;
1 https://www.greatermanchester-ca.gov.uk/media/1732/gm-shma-summary-report-
jan-19.pdf

7
we are slightly more ethnically diverse than England & Wales as a
whole;
more of us live alone than in any other type of household;
we are increasingly likely to rent our home in the private sector,
especially if we are young or if we are from a black and minority
ethnic community;
household incomes are significantly lower than the national
average and we have higher levels of deprivation;
homelessness and rough sleeping have risen in recent years
compared to the rest of the country, our homes are more likely be
terraced or semi-detached and have one or two bedrooms, and less
likely to be detached, bungalows or flats, or to have four or more
bedrooms;
about six out of ten households are owner-occupiers, and almost
half of those have bought their property outright. About two in ten
households rent from a housing association or local authority, with
the remainder renting privately;
around one in twenty households are in overcrowded
accommodation, concentrated in the rented sector;
two-thirds of households (and 80% of owner-occupiers) have at
least one spare bedroom.
Chapter 4 gives you much more detail on these and other characteristics
of Greater Manchester’s housing.
Looking at the housing market, house prices in Greater Manchester have
remained substantially below national averages; however, these are
improving and have shown a higher increase. Between 2018 and 2019,
there was an increase of 3.9% compared to 2.6% for the North West
region as a whole and 0.9% for England & Wales. In 2019, the average
price paid was £173,366, compared to £242,125 in England & Wales as a
whole. Our private rents are also lower than national averages – our
average monthly rent in 2018/19 was £600, compared to £695 in England
as a whole. However, given our relatively low average household
incomes, that still means that many of us find meeting housing costs a
challenge.
Average figures for Greater Manchester mask patterns within the city
region. For both buying and renting Trafford and Stockport, averages are
significantly higher than Greater Manchester as a whole. Rents in
8
Manchester are also higher, reflecting the city centre market. In all
districts, the variations between neighbourhoods can be substantial.
One in five homes in Greater Manchester are in the social housing sector,
and around 95% of those are at social rents, which are generally
substantially below private sector rents. Even so, over 99,000
households were on local authorities’ housing registers in 2018/19, of
which over 30,000 were assessed as having a priority need for a home.
New housebuilding continues to recover slowly from the post-2008
collapse in delivery. There were 11,525 net additional dwellings built in
Greater Manchester in 2018/19. This is a 29% increase on the 9,000 net
additional homes delivered in 2017/18. The 2017/18 and 2018/19 totals
are the highest net additional homes built since 2007/08, driven by new
developments in the central areas of Salford and Manchester. Empty
dwellings are at low levels, and matching that of England as a whole,
another sign of strong demand for additional homes. Chapter 5 explores
the housing market signals.
Different households need different types of homes. We know that people
in Greater Manchester have relatively poor health. By 2035 nearly three
in twenty of us will be 75 years or older - and one in twenty 85 or older –
though our population profile will still be younger than the national
average. At the same time, the number of homes needed for families with
dependent children will grow by almost 10%, though almost all that
growth will be in families with only one child. Again by 2035, almost one
in three of us aged 65 or over will have a long-term illness that limits our
day-to-day activities ‘a lot’, and just under 8% will have dementia.
Alongside changes in the population, we know the housing sector is
changing. Private renting is likely to continue to grow, to evolve in terms
of the investors and management of rented homes, and in the types of
households living in the sector. National policy, regulation and taxation
regimes may have a significant impact on changes in the sector, but on
current trend, more families with children and older households will rent
privately. Chapter 6 looks more closely at the housing requirements of
different groups.
It is important that our residents can find homes they can afford but
defining ‘affordability’ is complex. Government gives us a wide definition

9
of ‘affordable housing’ and a methodology to calculate how much of it we
need. Using that gives a figure of 5,850 households per annum. That is
not a target for building new affordable house building through the
planning system, but it is something we need to consider in developing
the Greater Manchester Spatial Framework (GMSF), and in our work with
Homes England, housing providers and other partners to deliver the
affordable homes we need for the future. This is outlined further in
Chapter 7.

10
1 Introduction and policy background
1.1 Background and objectives
1.1 This Strategic Housing Market Assessment (SHMA) has been
produced for the Greater Manchester Combined Authority (GMCA).
The purpose of the SHMA is to develop a robust understanding of
housing market dynamics and to provide an assessment of future
needs for both market and affordable housing and the housing
needs of different groups within the population over the next
twenty years.
1.2 It supports the aspirations in the Greater Manchester Strategy
(GMS)2, which lays out an ambitious vision for Greater Manchester
as one of the best places in the world to grow up, get on and grow
old. The GMS defines a culturally and economically dynamic city
region, with social justice and equality at its core, which prioritises
achieving safe, decent and affordable housing for all Greater
Manchester residents.
1.3 This document is being published alongside the final draft of the
Greater Manchester Spatial Framework (GMSF). The GMSF
provides a spatial and physical interpretation of the GMS that will
help make Greater Manchester one of the best places in the world
by providing the right land needed in the right places to deliver the
jobs and homes required to match Greater Manchester’s ambitions.
1.4 The SHMA provides an objective assessment of the need for housing
within Greater Manchester3 and sets out evidence to inform the
overall housing requirements for the conurbation and the ten
individual local authorities, which will be set through the GMSF.
2 Available at: https://www.greatermanchester-ca.gov.uk/who-we-are/the-greater-
manchester-strategy/ 3 Greater Manchester is comprised of the following unitary authorities: Bolton, Bury,
Manchester, Oldham, Rochdale, Salford, Stockport, Tameside, Trafford and Wigan.

11
These requirements will need to be informed by the SHMA but will
also consider a range of other evidence, including those relating to
land supply; Green Belt; other development constraints (such as
flooding and areas of environmental protection) and infrastructure.
1.5 The SHMA also provides evidence that will be used to inform other
housing-related activities of the GMCA, including monitoring the
Greater Manchester Housing Strategy, as well as the local plans and
strategies of individual districts.
1.6 This SHMA responds to and is compliant with the current
requirements of both the National Planning Policy Framework
(NPPF)4 and the Planning Practice Guidance (PPG).5 This study
reflects the content of the PPG at the time of writing. It provides an
assessment of the future need for housing, with the intention that
this will inform future development of planning policies.
1.7 This SHMA presents the most up-to-date analysis of the Greater
Manchester housing market and updates where possible on that
which was consulted upon in 2019.
4 NPPF, February 2019a, available at:
https://www.gov.uk/government/publications/national-planning-policy-framework--2 5 PPG, updated October 2019, available at:
https://www.gov.uk/government/collections/planning-practice-guidance

12
Map 1.1: Greater Manchester’s districts
Source: MappingGM
1.2 Policy background
National Planning Policy Framework
1.8 The NPPF provides the national policies for plan making. It details
key policies against which development plans will be assessed and
with which they must comply. It requires plans to be justified and
based on proportionate evidence, taking into account relevant
market signals.
1.9 The original NPPF was published in March 2012. A revised NPPF
was issued in July 2018. Since then the NPPF was updated with a
further version published in February 2019. Paragraph 10 of the
updated NPPF sets out a presumption in favour of sustainable
development whereby plans should positively seek opportunities to
meet the development needs of their area and be sufficient
flexibility to respond to rapid change.
1.10 Paragraphs 60 and 61 of the NPPF requires local authorities to plan
for a mix of housing based on current and future demographic
13
trends, market trends and the needs of different groups in the
community. This includes the recommendation that planning
authorities should assess the size, type and tenure of housing
needed for affordable housing, families with children, older people,
students, people with disabilities, service families, travellers,
people who rent their homes and people wishing to commission or
build their own homes.
1.11 Paragraph 31 of the NPPF states that each local planning authority
should ensure the local plan uses a proportionate evidence base
that is relevant and up-to-date. This should be adequate and
focused tightly on supporting and justifying policies and taking into
account the relevant market signals. This SHMA brings together
relevant evidence to comply with this.
Planning Practice Guidance
1.12 The PPG on “Housing and economic needs assessment” was
originally issued by Government on 20 March 2015 and last
updated on 22 July 2019.6 This provides advice on how key
elements of the NPPF are to be interpreted, including the approach
to deriving an assessment of Local Housing Need (LHN). The
approach used in this report takes account of this PPG.
1.13 Throughout this document, relevant sections of the NPPF and PPG
are referenced. The guidance provides the basis for the evidence
presented in the corresponding chapters of the SHMA.
Local Housing Need methodology
1.14 On 14 September 2017, the Government published a wide-ranging
consultation entitled “Planning for the right homes in the right
6 Available at: https://www.gov.uk/guidance/housing-and-economic-development-
needs-assessments

14
places.”7 This followed the publication of the Housing White Paper,
“Fixing our broken housing market”, in the spring of 20178 that
included a proposed standardised national methodology for
calculating housing need.
1.15 The consultation ran until 9 November 2017, and in March 2018, the
Government published their response to this consultation. This
response concluded their LHN methodology as the most appropriate
method to assess need.9
1.16 Government subsequently published the revised NPPF in July 2018
(updated in July 2019), which sets out plans to “consider adjusting
the [Local Housing Need] method after the household projections10 are
released in September 2018.”11 On 26 October 2018, the Government
released their consultation to update PPG on housing need
assessment (and the LHN methodology), taking account of the 2016-
based household projections.12 Specifically, they proposed, “that the
2014-based data will provide the demographic baseline for assessment
of local housing need.”
1.17 At the time of writing (August 2020) the methodology, that results
in an annual need figure of 10,243 per annum, is a proposal that is
7 Available at: https://www.gov.uk/government/consultations/planning-for-the-right-
homes-in-the-right-places-consultation-proposals 8 Government Housing White Paper. Fixing our broken housing market. February 2017.
Available at:
https://www.gov.uk/government/uploads/system/uploads/attachment_data/file/59046
4/Fixing_our_broken_housing_market_-_print_ready_version.pdf 9 Available at:
https://assets.publishing.service.gov.uk/government/uploads/system/uploads/
system/uploads/attachment_data/file/685293/Government_response_to_Planning_for_t
he_right_homes_in_the_right_places_consultation.pdf 10 As of 23 January 2017, responsibility for household projections transferred from the
then Department of Communities and Local Government (DCLG) to the Office for
National Statistics (ONS). 11 See:
https://assets.publishing.service.gov.uk/government/uploads/system/uploads/attachme
nt_data/file/728498/180724_NPPF_Gov_response.pdf pp.25-26 12 Available at: https://www.gov.uk/government/consultations/changes-to-planning-
policy-and-guidance-including-the-standard-method-for-assessing-local-housing-need

15
being consulted on by Government and is not the LHN for Greater
Manchester. The LHN for Greater Manchester is 10,534 as per the
original methodology, which is set out in Chapter 3 of this report.
1.3 Report structure
1.18 This report provides a Greater Manchester SHMA, presenting
evidence on the housing market and estimates of housing demand
and housing need for Greater Manchester.
1.19 The report is structured as follows;
Chapter 2 considers the definition of the Housing Market Area
(HMA);
Chapter 3 sets out the Greater Manchester LHN;
Chapter 4 presents characteristics of the HMA;
Chapter 5 reviews housing market signals including affordability;
Chapter 6 presents the housing needs of particular groups;
Chapter 7 provides an affordable housing need assessment.
1.20 The report includes an Appendix in Chapter 8. This provides more
detailed sources of the material that underpins the core outputs of
the SHMA.

16
2 Defining the Housing Market Area
17
Chapter summary
Is Greater Manchester the right area for us to think about and plan for as
a housing market? Such a large and diverse city region must be well
connected to our neighbours, but practically we need to understand how
most people make their choices about where to live if we are to make
decisions about the future. We have looked at three main kinds of
evidence to see if Greater Manchester makes sense as a coherent area
where different places are bound together.
Our analysis shows that more than four out of every five households who
move into a home in Greater Manchester already live here. That
proportion is higher for households moving into homes in the districts
around the boundary of Greater Manchester and lower for Manchester
and Salford, which are the main arrival destinations for households
moving to the city region, which will include large numbers of students.
Looking at where people live and work, we see that nearly nine in ten
working people who live in Greater Manchester also work here, with
Wigan the only district where more than 15% of workers travel outside
Greater Manchester to work. Of those residents who work in Greater
Manchester, two-fifths travel to another district for work, an indicator of
the interconnectedness within the city region.
Looking at house prices as an indicator of the way the housing market is
functioning, we see a general pattern of lower house prices in the inner
urban areas and higher prices around the periphery of Greater
Manchester. However, this is not universal and all of Greater
Manchester’s ten districts have areas of both high and low value,
sometimes in close proximity to each other.
So, while Greater Manchester has important and valuable relationships
with neighbouring districts and further afield, we can reasonably define
it as a HMA for strategic planning purposes.

18
2.1 Introduction
2.1 This chapter has two primary purposes:
To identify the appropriate areas of assessment for determining
the need/demand for housing and employment floor space that
should be planned for through the GMSF; and
To consider the implications of those areas of assessment for
translating the geography of need/demand into district
requirements for housing and employment floor space in the
GMSF.
National guidance
2.2 Paragraph 39 of the Plan-making PPG states that authorities will
need a clear understanding of housing needs in their area, in part by
working with key stakeholders to establish the housing market area,
or geography which is the most appropriate to prepare policies for
meeting housing need across local authority boundaries.
2.3 The PPG defines a housing market area as follows:
A housing market area is a geographical area defined by household
demand and preferences for all types of housing, reflecting the key
functional linkages between places where people live and work.
(Paragraph 018 Reference ID: Reference ID: 61-018-20190315)13
2.4 The same paragraph in that PPG states that housing market areas
can be broadly defined by using three different sources of
information, which are detailed below:
Housing demand and supply
2.5 The relationship between housing demand and supply across
different locations, using house prices and rates of change in house
13 PPG, Plan-making, Published 13 September 2018, Last updated 21 July 2020, available
at: https://www.gov.uk/guidance/plan-making
19
prices. This should identify areas which have clearly different price
levels compared to surrounding areas.
Migration flow and housing search patterns
2.6 This can help identify the extent to which people move house
within an area, in particular where a relatively high proportion of
short household moves are contained, (due to connections to
families, jobs, and schools).
Contextual data such as travel to work areas, retail and school catchment areas
2.7 These can provide information about the areas within which people
move without changing other aspects of their lives (e.g. work or
service use).This chapter considers these in turn and summarises
the key factors identified in the PPG, with a particular focus on
migration and commuting.
2.2 Household migration
2.8 The use of migration data in the identification of HMAs tends to
focus on analysing migration flow patterns to help identify the
extent to which people move house within an area, determining the
level of self-containment. A high degree of self-containment
supports the case for an HMA. For comparison the previous PPG
(dated March 2015, archived June 201814) referred to 70% as an
appropriate threshold. The data also helps to establish the levels of
connectivity between places.
2.9 Migration data from the 2011 Census can be used to identify self-
containment rates of districts, by examining the origins of those
who moved into Greater Manchester from elsewhere in the year
preceding the Census.
14 Archived PPG, Housing and Economic Development Needs Assessments, available at:
http://webarchive.nationalarchives.gov.uk/20180607114246/https://www.gov.uk/guid
ance/housing-and-economic-development-needs-assessments

20
Figure 2.1: Self-contained migration in Greater Manchester districts, 2011
Source: 2011 Census
2.10 Figure 2.1 shows that five of the ten Greater Manchester districts
have self-containment rates below the 70% threshold and five have
self-containment rates above. The northern districts of Greater
Manchester (Oldham, Wigan, Bolton, Rochdale and Tameside) are
more self-contained than districts in the south (Stockport,
Manchester, Trafford and Salford) apart from Bury. However, when
taken as a whole, Greater Manchester has a self-containment rate
of 81%. This is higher than rates for the individual districts,
suggesting a level of interdependence between districts in the
conurbation.
21
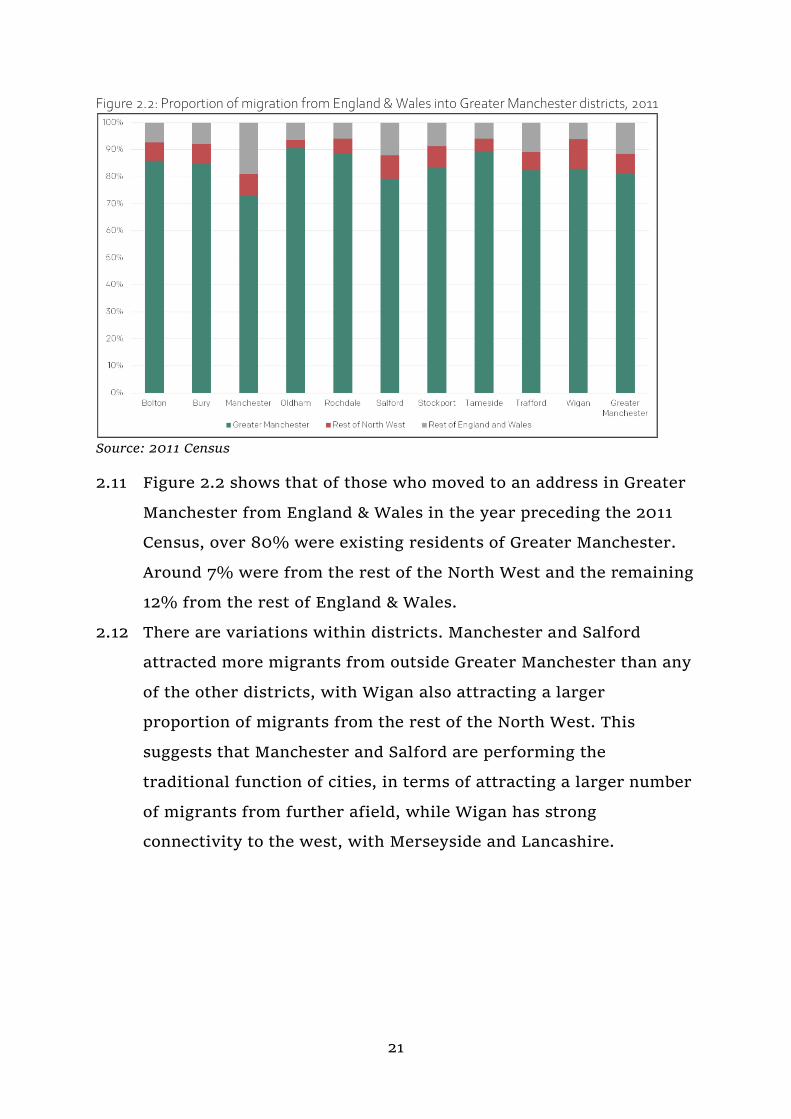
Figure 2.2: Proportion of migration from England & Wales into Greater Manchester districts, 2011
Source: 2011 Census
2.11 Figure 2.2 shows that of those who moved to an address in Greater
Manchester from England & Wales in the year preceding the 2011
Census, over 80% were existing residents of Greater Manchester.
Around 7% were from the rest of the North West and the remaining
12% from the rest of England & Wales.
2.12 There are variations within districts. Manchester and Salford
attracted more migrants from outside Greater Manchester than any
of the other districts, with Wigan also attracting a larger
proportion of migrants from the rest of the North West. This
suggests that Manchester and Salford are performing the
traditional function of cities, in terms of attracting a larger number
of migrants from further afield, while Wigan has strong
connectivity to the west, with Merseyside and Lancashire.

22
Table 2.1: Proportion of moves to Greater Manchester districts from England and Wales, 2011
Source: 2011 Census
Origin- moved from
Destination- moved to
Bolton Bury Manchester Oldham Rochdale Salford Stockport Tameside Trafford Wigan Greater
Manchester
Bolton 73.0% 3.9% 0.5% 0.3% 0.5% 2.2% 0.4% 0.3% 0.7% 3.1% 7.4%
Bury 2.8% 63.7% 0.9% 1.0% 2.6% 2.7% 0.4% 0.6% 0.9% 0.3% 4.7%
Manchester 1.7% 6.5% 60.2% 4.8% 5.1% 10.6% 11.4% 6.7% 16.2% 1.2% 24.4%
Oldham 0.5% 1.0% 1.1% 75.2% 4.8% 0.8% 0.4% 3.3% 0.4% 0.3% 6.0%
Rochdale 0.6% 3.5% 0.8% 4.1% 72.3% 1.1% 0.5% 0.7% 0.6% 0.2% 5.9%
Salford 3.0% 4.1% 2.9% 0.7% 1.2% 54.5% 1.4% 1.1% 4.0% 2.5% 7.7%
Stockport 0.3% 0.4% 2.4% 0.3% 0.5% 1.0% 62.9% 4.8% 1.8% 0.3% 6.2%
Tameside 0.2% 0.7% 1.1% 3.4% 0.7% 1.1% 3.7% 71.1% 0.8% 0.2% 5.7%
Trafford 0.5% 1.0% 2.8% 0.3% 0.4% 3.2% 1.9% 0.6% 56.2% 0.4% 5.5%
Wigan 3.4% 0.5% 0.6% 0.2% 0.3% 2.2% 0.3% 0.3% 0.8% 74.4% 7.5%
Greater
Manchester 86.0% 85.2% 73.3% 90.6% 88.5% 79.3% 83.3% 89.5% 82.4% 83.0% 81.1%
Rest of
England &
Wales
14.0% 14.8% 26.7% 9.4% 11.5% 20.7% 16.7% 10.5% 17.6% 17.0% 18.9%

23
2.13 The table above shows the different patterns of connectivity of
moves between districts, with Bolton and Wigan, Oldham and
Rochdale and Manchester and Salford showing obvious links. The
data also reiterates the role of Manchester and Salford in attracting
migrants from further afield, with over 20% of moves to each city
from the rest of England & Wales. Census data shows that the north
of the conurbation has greater self-containment than the south.
However, the table also shows increasing rates of moves between
areas that did not show particularly strong migration relationships
at the 2001 Census, indicating greater integration across Greater
Manchester districts, such as:
Bury - with Manchester and Rochdale;
Tameside - with Manchester and Stockport;
Salford - with Trafford and Bury.
2.14 These relationships demonstrate that most migration flows operate
at an intra-Greater Manchester level and as such, there is strong
justification to consider Greater Manchester as a distinct HMA.
Map 2.1: Absolute migration flows into and out of Greater Manchester and surrounding districts, 2011
Source: 2011 Census

24
2.15 Map 2.1 shows the largest flows of moves into and out of Greater
Manchester from each of the surrounding districts. The analysis
suggests that there is a greater level of movement in the south and
west of Greater Manchester to the surrounding districts, with
Manchester having relationships with Cheshire East, Cheshire West
and Chester, Warrington and to a lesser extent Kirklees. Wigan also
has several relationships with areas to the south and west:
Warrington, St. Helens and West Lancashire. Trafford and
Stockport also have relatively strong relationships with Cheshire
East. In the north of Greater Manchester, Bury and Rochdale have
workplace flows with Rossendale and to a lesser extent Bolton with
Chorley.
2.16 The analysis also shows that flows out of Greater Manchester are
generally slightly stronger than flows in (except for Manchester),
leading to a small net loss in population to the surrounding
districts. The largest net outflows are in the east of Greater
Manchester, with around 300 more moves from Stockport to
Cheshire East than vice versa, and around 60 more moves from
Tameside to High Peak than vice versa.
2.17 Oldham and Salford were the only Greater Manchester districts
without 300 people moving in from or out to a district outside
Greater Manchester.
2.3 Commuting patterns
2.18 Commuting patterns have been analysed both in terms of where
Greater Manchester residents work and in terms of where people
who work in Greater Manchester travel from. The analysis shows
very strong commuting links within the Greater Manchester
conurbation; of Greater Manchester residents that are in work,
88% work inside Greater Manchester and 85% of those working in
Greater Manchester are resident in the conurbation.
25
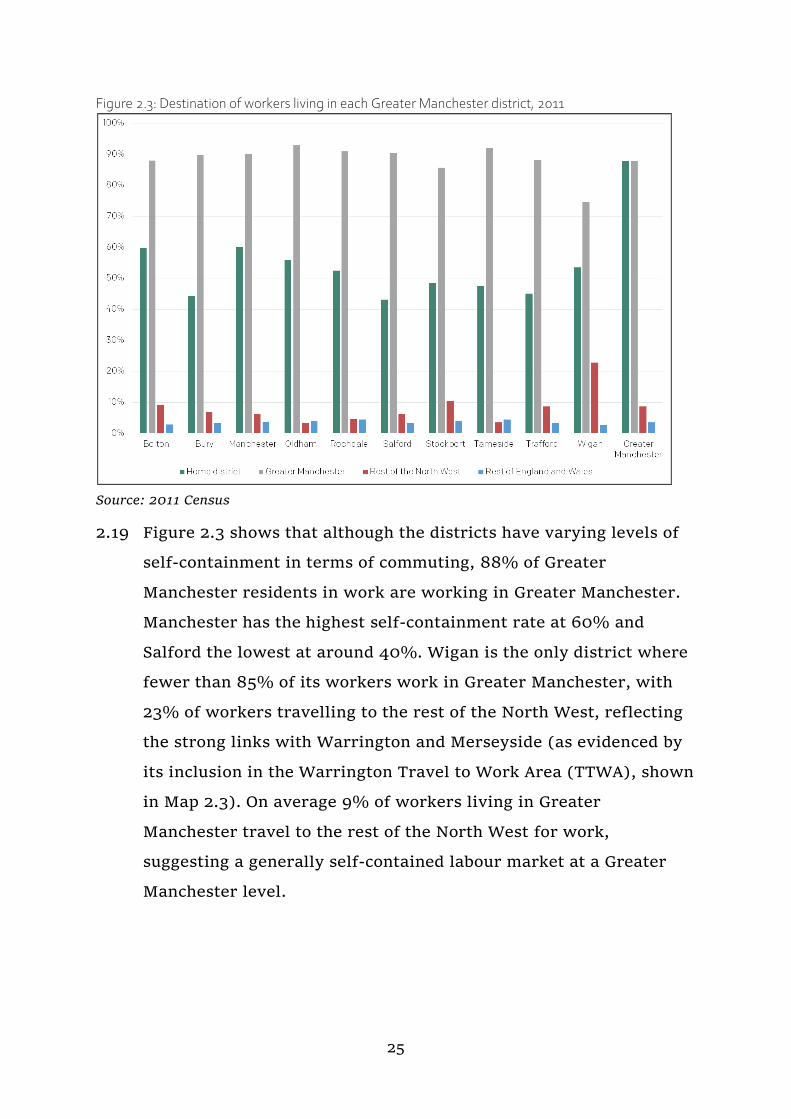
Figure 2.3: Destination of workers living in each Greater Manchester district, 2011
Source: 2011 Census
2.19 Figure 2.3 shows that although the districts have varying levels of
self-containment in terms of commuting, 88% of Greater
Manchester residents in work are working in Greater Manchester.
Manchester has the highest self-containment rate at 60% and
Salford the lowest at around 40%. Wigan is the only district where
fewer than 85% of its workers work in Greater Manchester, with
23% of workers travelling to the rest of the North West, reflecting
the strong links with Warrington and Merseyside (as evidenced by
its inclusion in the Warrington Travel to Work Area (TTWA), shown
in Map 2.3). On average 9% of workers living in Greater
Manchester travel to the rest of the North West for work,
suggesting a generally self-contained labour market at a Greater
Manchester level.
26
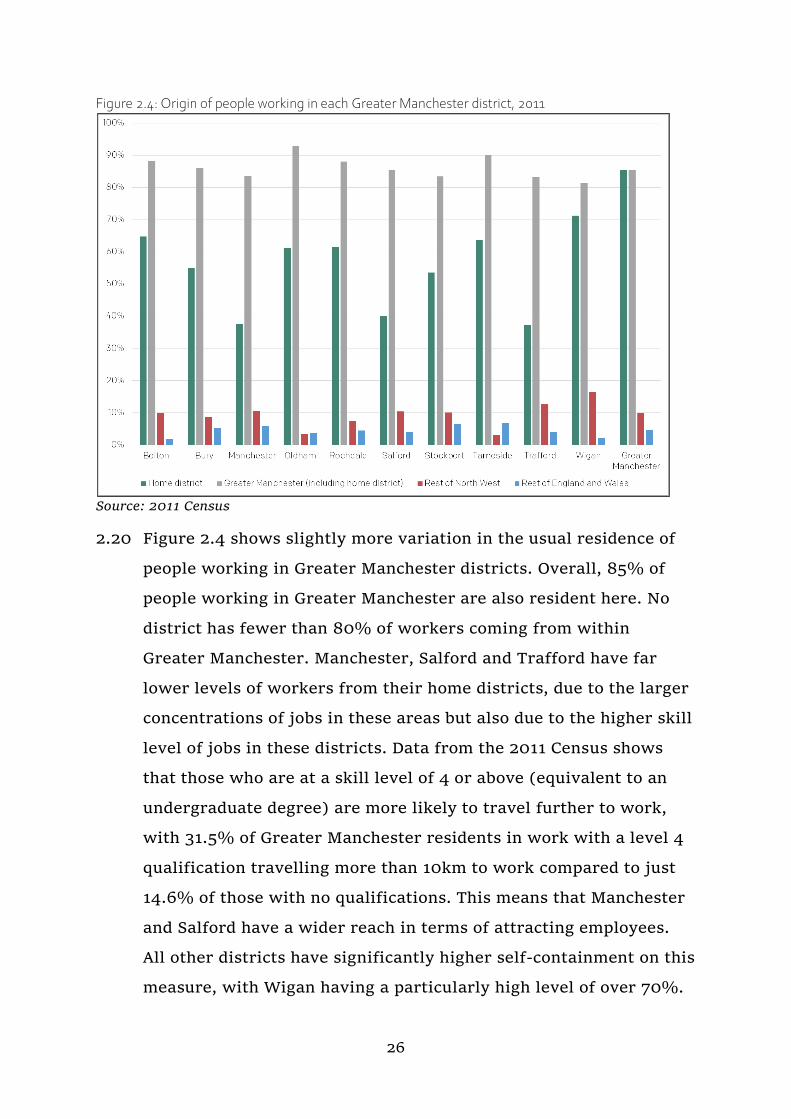
Figure 2.4: Origin of people working in each Greater Manchester district, 2011
Source: 2011 Census
2.20 Figure 2.4 shows slightly more variation in the usual residence of
people working in Greater Manchester districts. Overall, 85% of
people working in Greater Manchester are also resident here. No
district has fewer than 80% of workers coming from within
Greater Manchester. Manchester, Salford and Trafford have far
lower levels of workers from their home districts, due to the larger
concentrations of jobs in these areas but also due to the higher skill
level of jobs in these districts. Data from the 2011 Census shows
that those who are at a skill level of 4 or above (equivalent to an
undergraduate degree) are more likely to travel further to work,
with 31.5% of Greater Manchester residents in work with a level 4
qualification travelling more than 10km to work compared to just
14.6% of those with no qualifications. This means that Manchester
and Salford have a wider reach in terms of attracting employees.
All other districts have significantly higher self-containment on this
measure, with Wigan having a particularly high level of over 70%.
27
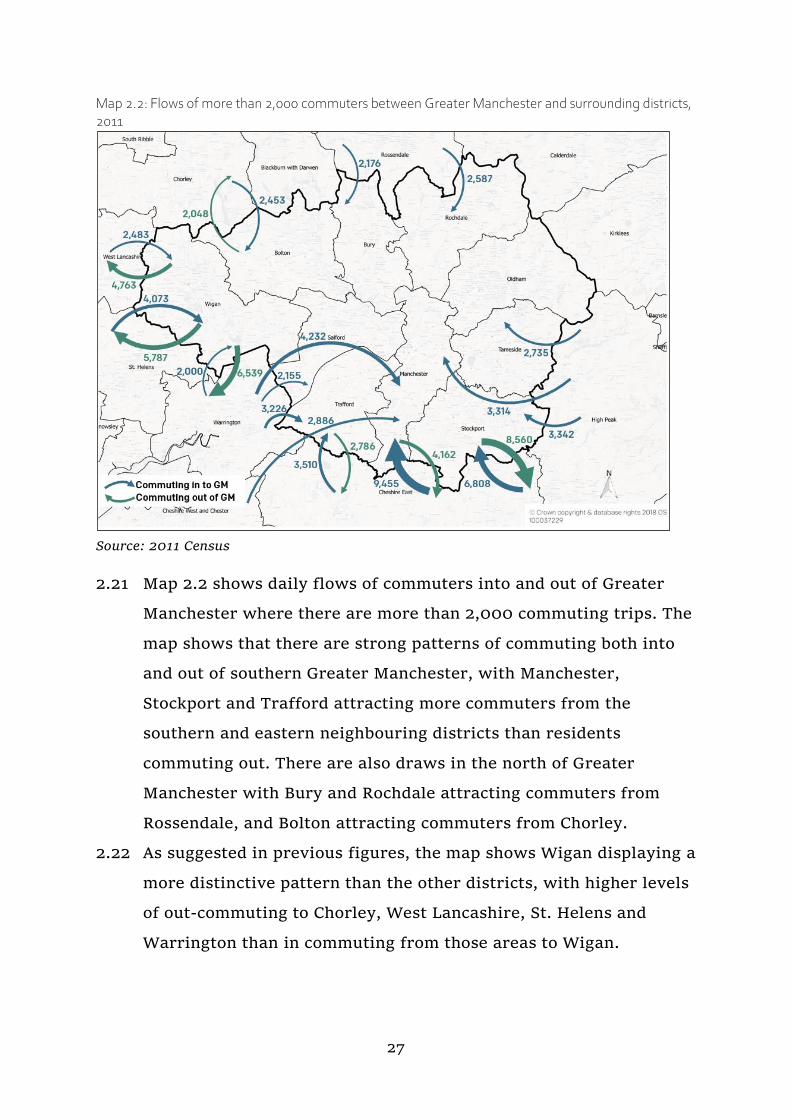
Map 2.2: Flows of more than 2,000 commuters between Greater Manchester and surrounding districts, 2011
Source: 2011 Census
2.21 Map 2.2 shows daily flows of commuters into and out of Greater
Manchester where there are more than 2,000 commuting trips. The
map shows that there are strong patterns of commuting both into
and out of southern Greater Manchester, with Manchester,
Stockport and Trafford attracting more commuters from the
southern and eastern neighbouring districts than residents
commuting out. There are also draws in the north of Greater
Manchester with Bury and Rochdale attracting commuters from
Rossendale, and Bolton attracting commuters from Chorley.
2.22 As suggested in previous figures, the map shows Wigan displaying a
more distinctive pattern than the other districts, with higher levels
of out-commuting to Chorley, West Lancashire, St. Helens and
Warrington than in commuting from those areas to Wigan.
28
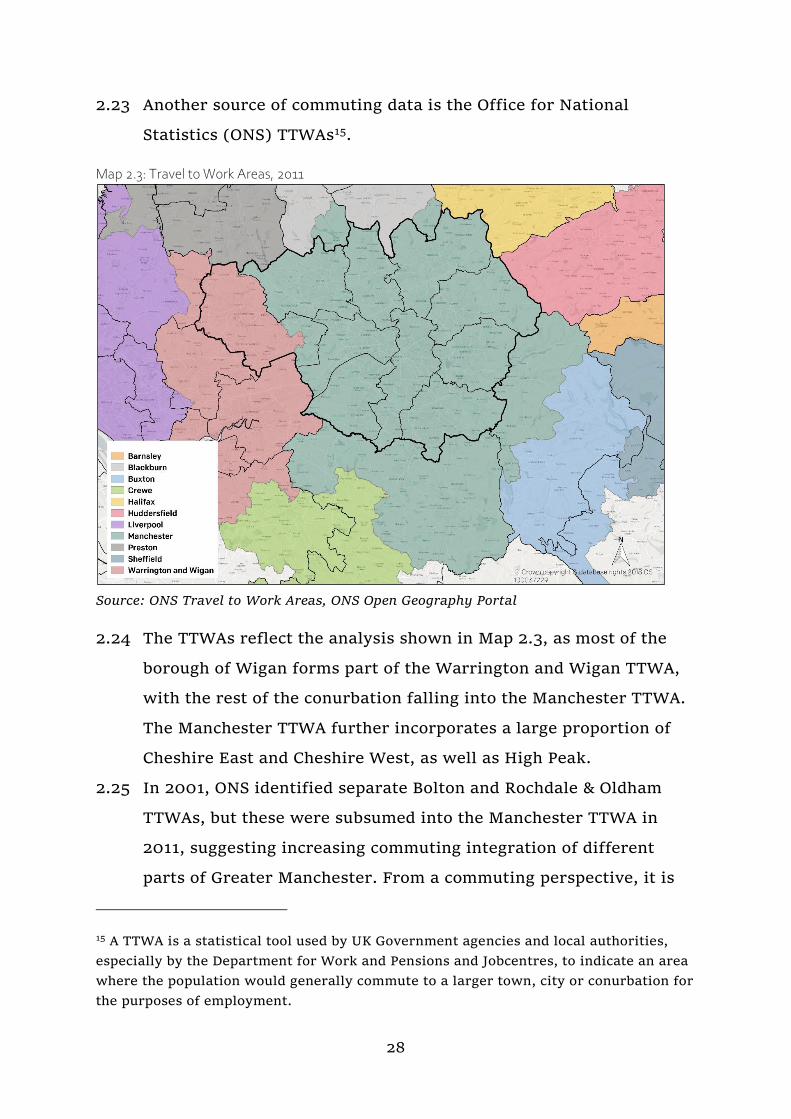
2.23 Another source of commuting data is the Office for National
Statistics (ONS) TTWAs15.
Map 2.3: Travel to Work Areas, 2011
Source: ONS Travel to Work Areas, ONS Open Geography Portal
2.24 The TTWAs reflect the analysis shown in Map 2.3, as most of the
borough of Wigan forms part of the Warrington and Wigan TTWA,
with the rest of the conurbation falling into the Manchester TTWA.
The Manchester TTWA further incorporates a large proportion of
Cheshire East and Cheshire West, as well as High Peak.
2.25 In 2001, ONS identified separate Bolton and Rochdale & Oldham
TTWAs, but these were subsumed into the Manchester TTWA in
2011, suggesting increasing commuting integration of different
parts of Greater Manchester. From a commuting perspective, it is
15 A TTWA is a statistical tool used by UK Government agencies and local authorities,
especially by the Department for Work and Pensions and Jobcentres, to indicate an area
where the population would generally commute to a larger town, city or conurbation for
the purposes of employment.
29
sensible to consider Greater Manchester to be a functional
employment area.
2.4 House prices
2.26 PPG states that house prices can be analysed in order to identify
areas in which house prices are significantly different from those in
other neighbouring areas. Analysis of house prices can also provide
information on the differences across an area in terms of the price
people pay for similar housing, market ‘hotspots’, low demand
areas and volatility.
2.27 House prices are affected in the short-term by factors such as
economic and market conditions, employment trends, migration
patterns and interest rates and mortgage availability. Longer-term,
population and economic trends such as changing household
formation rates and sizes of households have an impact on demand
for housing of different types.
2.28 House prices are also affected by a few local factors, including:
Availability and suitability of housing;
Location of family, friends and cultural communities;
Quality of schools and catchment areas;
Commuting times/routes to work;
Lifestyle factors such as access to shops, facilities, etc.; and
The quality of place and environment.
2.29 The relative importance of these factors can vary significantly
between different households and some may generally be more
important for particular household types and age groups than
others may.
30
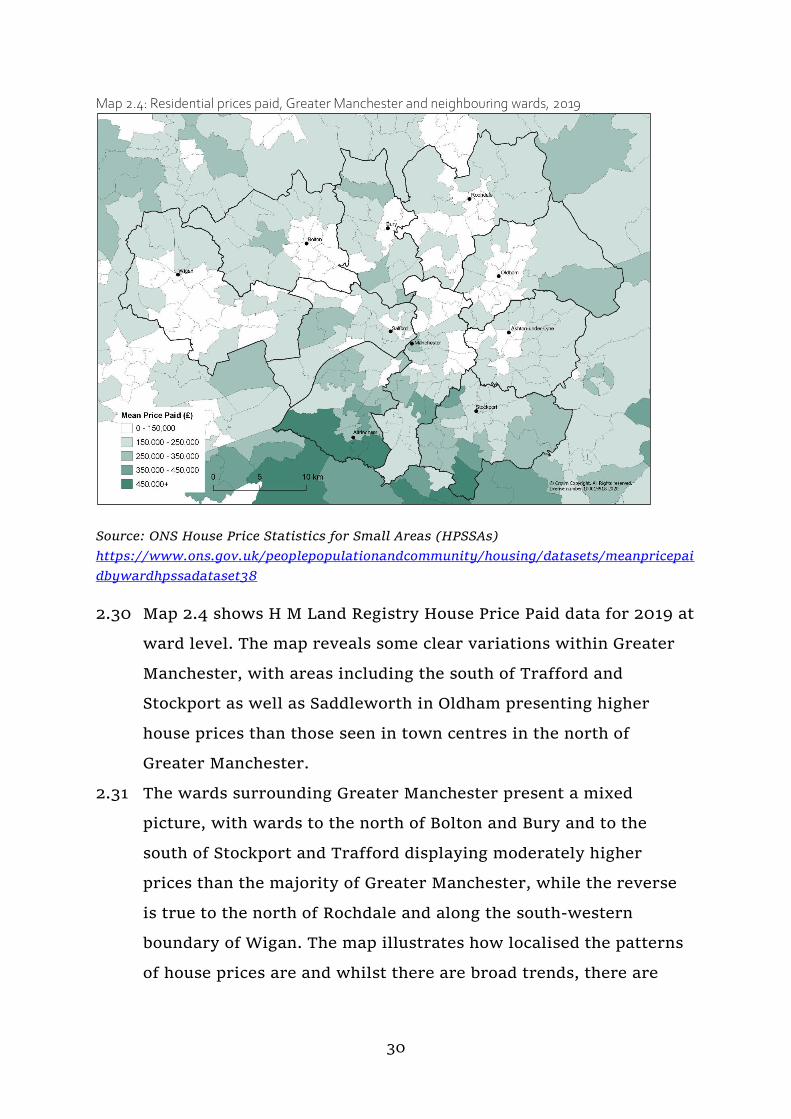
Map 2.4: Residential prices paid, Greater Manchester and neighbouring wards, 2019
Source: ONS House Price Statistics for Small Areas (HPSSAs)
https://www.ons.gov.uk/peoplepopulationandcommunity/housing/datasets/meanpricepai
dbywardhpssadataset38
2.30 Map 2.4 shows H M Land Registry House Price Paid data for 2019 at
ward level. The map reveals some clear variations within Greater
Manchester, with areas including the south of Trafford and
Stockport as well as Saddleworth in Oldham presenting higher
house prices than those seen in town centres in the north of
Greater Manchester.
2.31 The wards surrounding Greater Manchester present a mixed
picture, with wards to the north of Bolton and Bury and to the
south of Stockport and Trafford displaying moderately higher
prices than the majority of Greater Manchester, while the reverse
is true to the north of Rochdale and along the south-western
boundary of Wigan. The map illustrates how localised the patterns
of house prices are and whilst there are broad trends, there are
31
pockets of relatively high and low prices throughout Greater
Manchester and its immediately surrounding areas.
2.5 Summary
2.32 The analysis of migration and commuting patterns strongly
suggests that overall Greater Manchester has very high levels of
self-containment, reflecting both its size and the distance and
travelling time separating the conurbation from many of the
nearest settlements beyond the Greater Manchester boundary.
2.33 Furthermore, Greater Manchester is an important administrative
unit, establishing the first Combined Authority in England under
the devolution deal in 2014, extending a long history of joint
working by the ten local authorities as the Association of Greater
Manchester Authorities (AGMA) after the abolition of the Greater
Manchester Council (GMC).
2.34 The evidence on both migration and commuting shows that there
are important connections with areas adjoining Greater Manchester
that need to be taken into account. The nature of these connections
varies depending on the proximity of settlements within and
outside Greater Manchester, the location and relative strength of
key employment areas and the availability of direct transport
connections. Broadly the connections are as follows:
To the south and east of Greater Manchester there are strong
connections to Cheshire West and Chester, Cheshire East and
High Peak.
To the west of Greater Manchester there are links with
Warrington, Merseyside and Lancashire - this is particularly
true in Wigan; and
To the north of Greater Manchester, there are connections with
Rossendale and Blackburn with Darwen.
32
2.35 Many of the interactions are localised, contained around the
boundaries of Greater Manchester, but the strength of the regional
centre as an employment location is felt across a much broader
area. In some cases, the importance of the interactions may be
important to the districts adjoining Greater Manchester but are of
less relative significance to Greater Manchester and the districts
within it. This is due to the differing size of the areas involved and
the availability of alternative sources of employment and labour.
2.36 The migration analysis shows that in Greater Manchester most
people migrate over relatively small distances (as is generally the
case in the UK), resulting in a series of small, overlapping markets
rather than relatively discrete HMAs. Migration patterns are
generally quite predictable, based on issues such as proximity,
transport connections, employment opportunities and local
identity, rather than reflecting previously identified HMAs.
2.37 Similarly, most employment areas see people commuting primarily
from quite nearby, again leading to overlapping catchments.
However, the major concentration of employment opportunities
around the regional centre has a different effect, drawing people in
from longer distances and limiting the commuting catchment of
some of the other employment areas within Greater Manchester.
2.38 The analysis also reveals other broader patterns across Greater
Manchester. There are higher levels of self-containment in the
north of Greater Manchester; a generally more fluid market in the
south; in-migration in the west and out-migration in the east. There
is an extensive in-migration catchment for the core of the
conurbation. This is redistributed to some extent to surrounding
areas. Wigan tends to have weaker connections to the rest of
Greater Manchester than the other nine districts, both in terms of
migration and commuting, as might be expected given its location.
33
2.39 This complex functioning of housing and labour markets within
Greater Manchester means that there is no simple way of
subdividing the conurbation into identifiable HMAs or functional
economic areas. Any internal boundaries or divisions would
essentially be arbitrary and risk masking important relationships.
2.40 Based upon the migration, commuting and house price evidence to
some extent, as well as historically strong institutional
relationships between authorities in the area, it is sensible to
conclude that Greater Manchester forms a functional HMA. Given
the complexity of the housing and labour markets within Greater
Manchester, together with the relatively small distances involved in
most migration and commuting, the issues of district identity and
the availability of population and household projection data, it is
considered that the most appropriate unit of analysis below the
Greater Manchester level is the individual districts. This is the
approach adopted in this SHMA.

34
3 Local Housing Need
35
Chapter summary
Government wants local authorities to have a clear and consistent
understanding of the number of new homes needed in an area. They have
proposed a standard methodology to calculate a figure for ‘local housing
need’. The method was published in early 2019 and sets out the method
for the minimum housing need for an area. It does not work out the
housing requirement for an area. Under the current (at time of writing
August 2020), methodology the overall annual housing need for Greater
Manchester is 10,534 homes per annum.
The total housing need figure is worked out district-by-district and added
together to give a Greater Manchester total figure. However, if it makes
sense, we can decide to share out that total between districts differently,
through the GMSF process.

36
3.1 Introduction
3.1 The NPPF sets out that all plans should determine the minimum
number of homes needed using the standard method.
“To determine the minimum number of homes needed, strategic
policies should be informed by a local housing need assessment,
conducted using the standard method in national planning guidance –
unless exceptional circumstances justify an alternative approach
which also reflects current and future demographic trends and market
signals. In addition to the local housing need figure, any needs that
cannot be met within neighbouring areas should also be taken into
account in establishing the amount of housing to be planned for.”
(NPPF, Paragraph 60, February 2019).
3.2 PPG (Housing and Economic Needs Assessment) 16 sets out in more
detail the standard method to assess the minimum number of homes
needed in an area. Housing need in the guidance is defined as below:
“Housing need is an unconstrained assessment of the number of homes
needed in an area. Assessing housing need is the first step in the
process of deciding how many homes need to be planned for. It should
be undertaken separately from assessing land availability,
establishing a housing requirement figure and preparing policies to
address this such as site allocations.” (Paragraph: 001 Reference ID:
2a-001-20190220, Revision date: 20 02 2019).
3.3 At the time of writing (August 2020) Government have released a
consultation on a new standard method to calculate the LHN17.
Alongside the current method, this chapter will set out the LHN for
Greater Manchester if the new method is adopted following the
consultation.
16 https://www.gov.uk/guidance/housing-and-economic-development-needs-assessments
17 https://www.gov.uk/government/consultations/planning-for-the-right-homes-in-the-
right-places-consultation-proposals
37
3.4 The first section of this chapter sets out the current LHN method as
set out in PPG (Housing and Economic Needs Assessment) and the
second section sets out the proposed LHN in the current
consultation.
3.2 Standard methodology: Local Housing Need
3.5 The LHN methodology consists of three components. The first step
is to set a demographic baseline. There is then a modification for
market signals and a cap is applied to ensure that local authorities
are left with a deliverable and achievable housing need figure after
updating their plans.
3.6 The LHN methodology states that local authorities should be
encouraged to work together to identify their housing need,
including at a Combined Authority level, where appropriate:
“Local housing need assessments may cover more than one area, in
particular where strategic policies are being produced jointly, or
where spatial development strategies are prepared by elected
Mayors, or combined authorities with strategic policy-making
powers.
In such cases the housing need for the defined area should at least be
the sum of the local housing need for each local planning authority
within the area. It will be for the relevant strategic policy-making
authority to distribute the total housing requirement which is then
arrived at across the plan area.” (Paragraph: 013 Reference ID: 2a-
013-20190220, Revision date: 20 02 2019)18
3.7 Therefore, the LHN has been calculated for each of the ten local
authorities within Greater Manchester. The summed figure is the
Greater Manchester LHN.
18 https://www.gov.uk/guidance/housing-and-economic-development-needs-
assessments

38
Step 1: Setting the baseline
3.8 As described above, the starting point for the LHN calculation is
projections of future household growth. The starting point is to use
the 2014-based household projections:
3.9 The household projections are derived using the ONS Sub National
Population Projections (SNPP), which provide projections of the
future size and age structure of the population of regions and local
authorities in England. The Department of Communities and Local
Government (now MHCLG) produces the 2014-based Sub National
Household Projections (SNHP). Since 2016 ONS have produced the
SNHP. The PPG states that the 2014-based projections should be
used in order to:
“The 2014-based household projections are used within the standard
method to provide stability for planning authorities and
communities, ensure that historic under-delivery and declining
affordability are reflected, and to be consistent with the
Government’s objective of significantly boosting the supply of
homes.” (Paragraph: 005 Reference ID: 2a-005-20190220, Revision
date: 20 02 2019)
3.10 It is recommended that ten-year average household growth figures
are used for the calculation - this should be ten consecutive years
using the current year as the starting point - as plans are expected
to be reviewed every five years and so average growth over a ten-
year period gives a baseline for effective planning for the
preparation and duration of the plan.
3.11 These projections should be seen as the minimum housing need
figure for the area. The 2014-based household projections for
Greater Manchester local authorities are set out below.
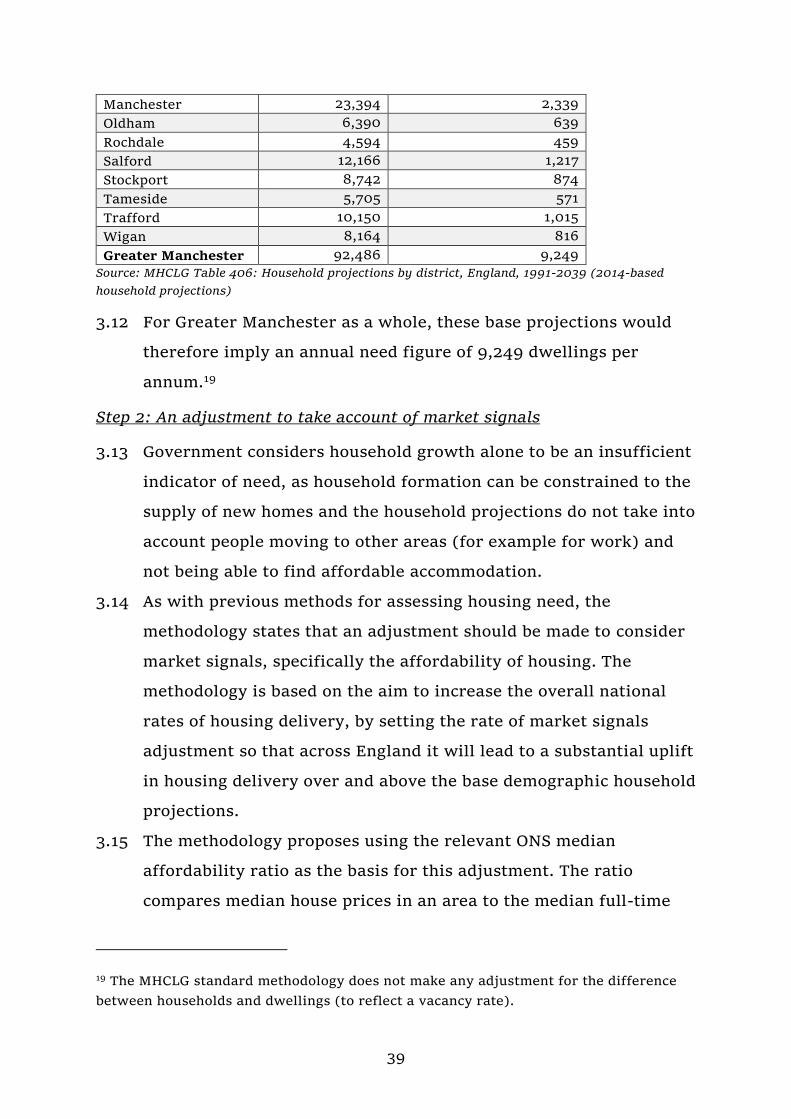
Table 3.1: Household growth projections for Greater Manchester, 2020-2030
Area Total household growth, 2020-30
Average annual household growth over the 10 year period
Bolton 7,168 717
Bury 5,106 511
39
Manchester 23,394 2,339
Oldham 6,390 639
Rochdale 4,594 459
Salford 12,166 1,217
Stockport 8,742 874
Tameside 5,705 571
Trafford 10,150 1,015
Wigan 8,164 816
Greater Manchester 92,486 9,249
Source: MHCLG Table 406: Household projections by district, England, 1991-2039 (2014-based
household projections)
3.12 For Greater Manchester as a whole, these base projections would
therefore imply an annual need figure of 9,249 dwellings per
annum.19
Step 2: An adjustment to take account of market signals
3.13 Government considers household growth alone to be an insufficient
indicator of need, as household formation can be constrained to the
supply of new homes and the household projections do not take into
account people moving to other areas (for example for work) and
not being able to find affordable accommodation.
3.14 As with previous methods for assessing housing need, the
methodology states that an adjustment should be made to consider
market signals, specifically the affordability of housing. The
methodology is based on the aim to increase the overall national
rates of housing delivery, by setting the rate of market signals
adjustment so that across England it will lead to a substantial uplift
in housing delivery over and above the base demographic household
projections.
3.15 The methodology proposes using the relevant ONS median
affordability ratio as the basis for this adjustment. The ratio
compares median house prices in an area to the median full-time
19 The MHCLG standard methodology does not make any adjustment for the difference
between households and dwellings (to reflect a vacancy rate).
40
earnings of those working in the area. This considers the fact that if
areas have higher house prices, they may not be less affordable if
earnings in the area are also high. As before, the most recently
published data should be used, which at the time of writing was the
2019 data, released in March 2020.
3.16 The method applies an affordability uplift “For each 1% the ratio is
above 4 (with a ratio of 8 representing a 100% increase), the average
household growth should be increased by a quarter of a percent”. The
reason the adjustment factor is applied is set out below:
“An affordability adjustment is applied as household growth on its own is
insufficient as an indicator of future housing need because:
household formation is constrained to the supply of available properties
– new households cannot form if there is nowhere for them to live; and
people may want to live in an area in which they do not reside
currently, for example to be near to work, but be unable to find
appropriate accommodation that they can afford.
The affordability adjustment is applied in order to ensure that the standard
method for assessing local housing need responds to price signals and is
consistent with the policy objective of significantly boosting the supply of
homes. The specific adjustment in this guidance is set at a level to ensure
that minimum annual housing need starts to address the affordability of
homes.” (Paragraph: 006 Reference ID: 2a-006-20190220, Revision date:
20 02 2019).
41
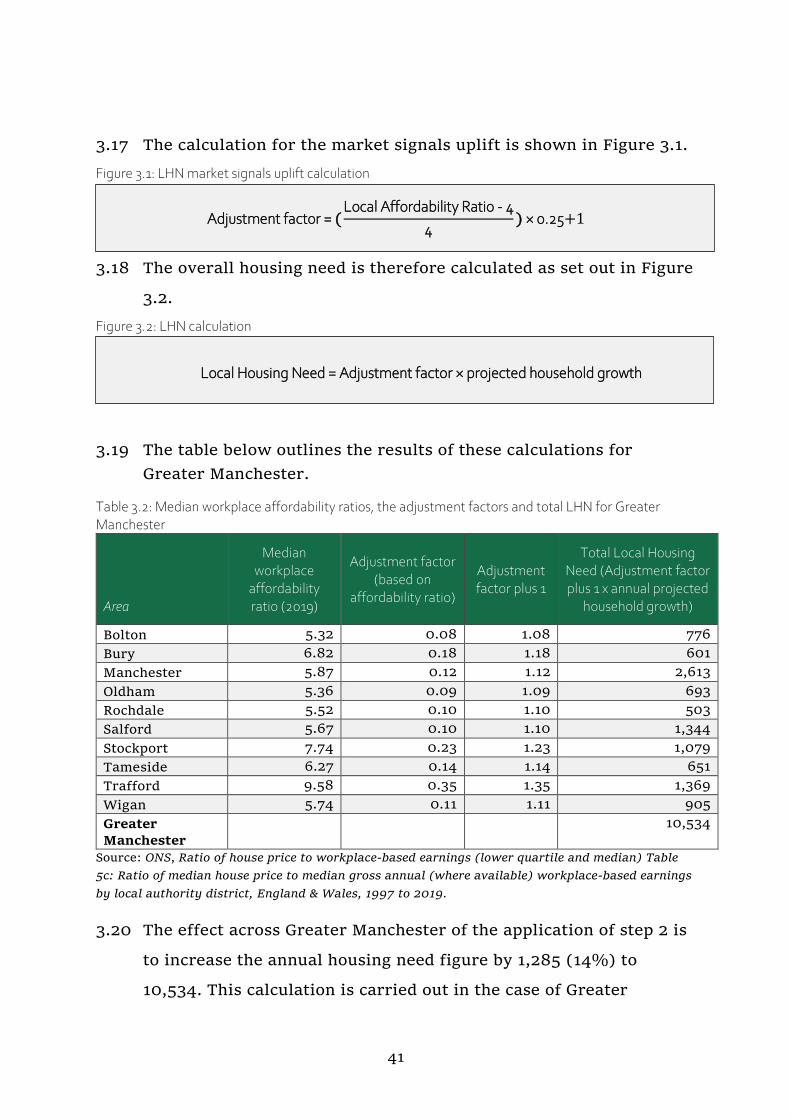
3.17 The calculation for the market signals uplift is shown in Figure 3.1.
Figure 3.1: LHN market signals uplift calculation
Adjustment factor = (Local Affordability Ratio - 4
4) × 0.25+1
3.18 The overall housing need is therefore calculated as set out in Figure
3.2.
Figure 3.2: LHN calculation
Local Housing Need = Adjustment factor × projected household growth
3.19 The table below outlines the results of these calculations for
Greater Manchester.
Table 3.2: Median workplace affordability ratios, the adjustment factors and total LHN for Greater Manchester
Area
Median workplace
affordability ratio (2019)
Adjustment factor (based on
affordability ratio)
Adjustment factor plus 1
Total Local Housing Need (Adjustment factor plus 1 x annual projected
household growth)
Bolton 5.32 0.08 1.08 776
Bury 6.82 0.18 1.18 601
Manchester 5.87 0.12 1.12 2,613
Oldham 5.36 0.09 1.09 693
Rochdale 5.52 0.10 1.10 503
Salford 5.67 0.10 1.10 1,344
Stockport 7.74 0.23 1.23 1,079
Tameside 6.27 0.14 1.14 651
Trafford 9.58 0.35 1.35 1,369
Wigan 5.74 0.11 1.11 905
Greater
Manchester
10,534
Source: ONS, Ratio of house price to workplace-based earnings (lower quartile and median) Table
5c: Ratio of median house price to median gross annual (where available) workplace-based earnings
by local authority district, England & Wales, 1997 to 2019.
3.20 The effect across Greater Manchester of the application of step 2 is
to increase the annual housing need figure by 1,285 (14%) to
10,534. This calculation is carried out in the case of Greater

42
Manchester at a district level, as there is no median affordability
data available for Greater Manchester as a whole. However, the
resultant need figure summed from individual districts must be
seen as a Greater Manchester-wide need figure.
Step 3: Capping the level of any increase
3.21 The final stage of the method is to cap the LHN figure to ensure
that the housing need figures are deliverable. A cap is applied to
local authorities’ housing need figures as follows:
1) Where the local strategic housing policies were adopted in the
last five years or reviewed and not updated, “the local housing
need figure is capped at 40% above the average annual housing
requirement figure set out in the existing policies.”
2) “Where the relevant strategic policies for housing were adopted
more than 5 years ago (at the point of making the calculation),
the local housing need figure is capped at 40% above whichever
is the higher of:
a. the projected household growth for the area over the 10-year
period identified in step 1; or
b. the average annual housing requirement figure set out in the
most recently adopted strategic policies (if a figure exists).”
3.22 Under these criteria, none of the LHN figures for the Greater
Manchester districts requires capping. The overall figure for
Greater Manchester in Table 3.2 above is therefore proposed as
representing the LHN for Greater Manchester.
3.23 On 6 August 2020, Government released a consultation on a new
standard methodology for calculating housing need. At the time of
writing (August 2020) this approach is still subject to consultation
and does not replace the present methodology. Below sets out the

43
proposed methodology and the resulting annual housing need for
Greater Manchester.
Stage 1 proposed methodology: Set the baseline
3.24 The government proposes the following to set the baseline: “We
consider that the baseline for the standard method should be
whichever is the higher of 0.5% of existing housing stock in each
local authority OR the latest projected average annual household
growth over a 10-year period.” 20
3.25 For the ten Greater Manchester districts the following baseline is
used:
Table 3.3: Stage 1 - setting the baseline Stage 1 set the baseline - whichever is high 0.5% of existing stock or
average household growth over a 10-year period
Area
0.5% stock (2019) Average household growth
2020 -2030 (2018 household
projections)
Baseline
Bolton 622 443 622
Bury 420 407 420
Manchester 1,135 983 1,135
Oldham 478 693 693
Rochdale 469 780 780
Salford 597 1,078 1,078
Stockport 648 619 648
Tameside 515 509 515
Trafford 500 559 559
Wigan 735 794 794
Source: MHCLG table 125, 2019 and ONS household projections table 406.
Stage 2 Proposed methodology: An adjustment for local affordability.
3.26 The government proposes that the baseline is amended to account
for local affordability looking at two points, current local
20
https://assets.publishing.service.gov.uk/government/uploads/system/uploads/attachme
nt_data/file/907215/200805_Changes_to_the_current_planning_system_FINAL_version
44
affordability and change in local affordability over the last ten
years. The consultation states:
“We propose the standard method will include two adjustments to
the baseline using the workplace-based median house price to median
earnings ratio. Initially it is proposed that the ratio for the most
recent year for which data is available in order to address current
affordability of homes would be used. Then how affordability has
changed over the last 10 years of published data would be
incorporated, using that same statistic.”21
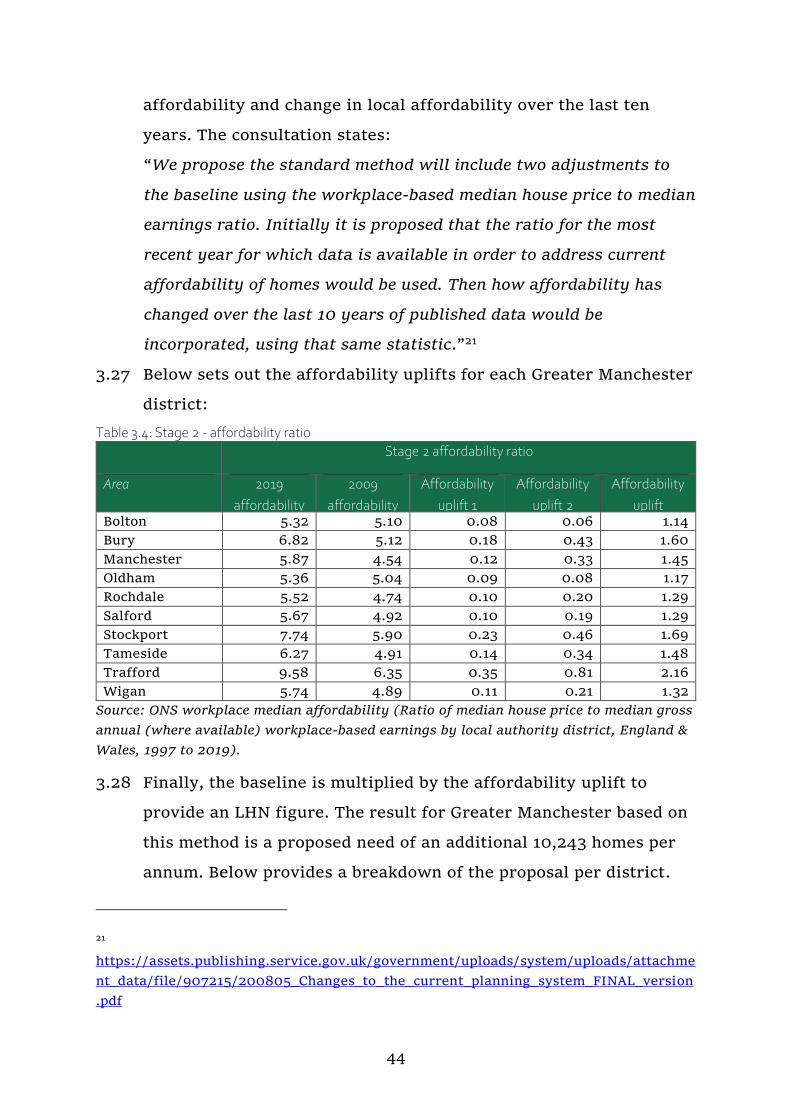
3.27 Below sets out the affordability uplifts for each Greater Manchester
district:
Table 3.4: Stage 2 - affordability ratio
Stage 2 affordability ratio
Area 2019
affordability
2009
affordability
Affordability
uplift 1
Affordability
uplift 2
Affordability
uplift Bolton 5.32 5.10 0.08 0.06 1.14
Bury 6.82 5.12 0.18 0.43 1.60
Manchester 5.87 4.54 0.12 0.33 1.45
Oldham 5.36 5.04 0.09 0.08 1.17
Rochdale 5.52 4.74 0.10 0.20 1.29
Salford 5.67 4.92 0.10 0.19 1.29
Stockport 7.74 5.90 0.23 0.46 1.69
Tameside 6.27 4.91 0.14 0.34 1.48
Trafford 9.58 6.35 0.35 0.81 2.16
Wigan 5.74 4.89 0.11 0.21 1.32
Source: ONS workplace median affordability (Ratio of median house price to median gross
annual (where available) workplace-based earnings by local authority district, England &
Wales, 1997 to 2019).
3.28 Finally, the baseline is multiplied by the affordability uplift to
provide an LHN figure. The result for Greater Manchester based on
this method is a proposed need of an additional 10,243 homes per
annum. Below provides a breakdown of the proposal per district.
21
https://assets.publishing.service.gov.uk/government/uploads/system/uploads/attachme
nt_data/file/907215/200805_Changes_to_the_current_planning_system_FINAL_version

45
46
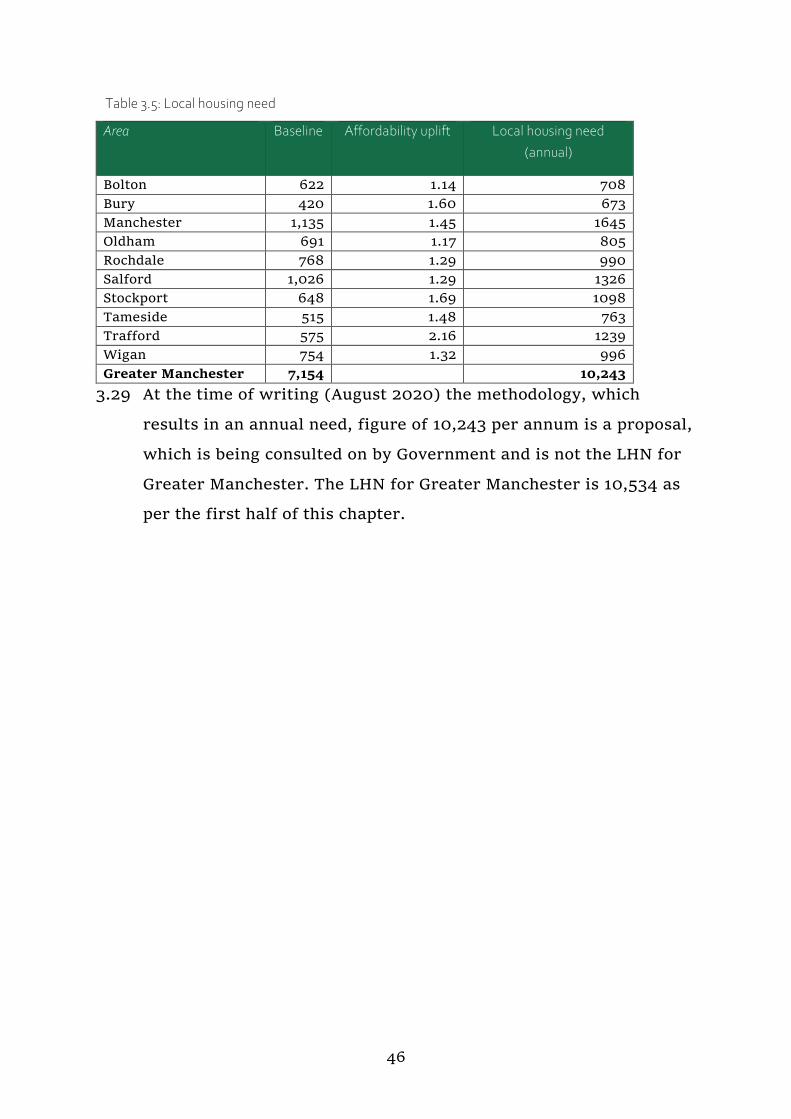
Table 3.5: Local housing need
Area Baseline Affordability uplift Local housing need
(annual)
Bolton 622 1.14 708
Bury 420 1.60 673
Manchester 1,135 1.45 1645
Oldham 691 1.17 805
Rochdale 768 1.29 990
Salford 1,026 1.29 1326
Stockport 648 1.69 1098
Tameside 515 1.48 763
Trafford 575 2.16 1239
Wigan 754 1.32 996
Greater Manchester 7,154
10,243
3.29 At the time of writing (August 2020) the methodology, which
results in an annual need, figure of 10,243 per annum is a proposal,
which is being consulted on by Government and is not the LHN for
Greater Manchester. The LHN for Greater Manchester is 10,534 as
per the first half of this chapter.

47
4 Characteristics of the Housing Market
Area
48
Chapter summary
What is Greater Manchester like as an HMA? With 2.8 million people
living in 1.2 million homes across ten districts, it is of course hugely
diverse and a challenge to sum up in a few words. However, it is possible
to pick out some of the more important factors and trends.
Greater Manchester has a relatively youthful population, with over
20% of residents under 30, but at the same time, the numbers in
the older age groups are growing fast too.
We are slightly more ethnically diverse than England & Wales as a
whole and more of us (almost 400,000) live alone than in any
other type of household.
We are increasingly likely to rent our home in the private sector,
especially if we are young or if we are from a black and minority
ethnic community.
We are slightly less likely to be economically active than the
national average and more of us have no qualifications than in the
country as a whole, although over a third of us are qualified to
degree level or above.
Our household incomes are significantly lower than the national
average, contributing to high levels of multiple deprivation, and
homelessness and rough sleeping have risen in recent years.
The homes we live in are more likely to be terraced or semi-
detached and have one or two bedrooms than nationally. They are
less likely to be detached, bungalows or flats or to have four or
more bedrooms.
About six out of ten households are owner-occupiers and almost
half of those have bought their property outright. About two in ten
households rent from a housing association or local authority, with
the remainder renting privately.

49
Around 1 in 20 households are in overcrowded accommodation,
disproportionately concentrated in the rented sector. Conversely,
two-thirds of households (and 80% of owner-occupiers) have at
least one spare bedroom, according to the official definition.
Given the diversity of our population and households, we have
considered a number of scenarios to ensure that we are planning to
build the right mix of type and size of housing to cater to our
residents and make sure we are attractive to potential new
residents over the next 20 years.
All these factors do vary greatly across Greater Manchester, between
districts and down to neighbourhood and street level.
4.1 Introduction
4.1 This chapter provides demographic and socio-economic information
about the residents of Greater Manchester, as well as those
working in the conurbation and provides information on the
housing stock in terms of numbers and characteristics.
4.2 Data is analysed at a district and Greater Manchester level and
where appropriate includes national and regional comparators. The
purpose of this chapter is to strengthen understanding of the
economic and demographic dynamics of the conurbation to help
inform future housing needs.
4.2 Population and household profile
Population and age structure
4.3 Greater Manchester at mid-2018 had an estimated total population
of 2.81 million people, making it the second largest of the former
metropolitan county areas after the West Midlands.22
22 ONS, Population Estimates by Local Authority and single year of age, 2018.

50
Figure 4.1: Population by age for Greater Manchester, 2018
Source: ONS Population Estimates Analysis Tool, mid-2018.
4.4 Figure 4.1 shows that those aged between 19 and 35 make up the
largest section of the population in Greater Manchester. There are
also large numbers of 40-55 year olds and a peak in the population
of those in their very late 60s.
4.5 The Greater Manchester picture masks variation between districts,
with Manchester in particular having a very high proportion of 19-
26 year olds.
25000 20000 15000 10000 5000 0 5000 10000 15000 20000 25000
0
4
8
12
16
20
24
28
32
36
40
44
48
52
56
60
64
68
72
76
80
84
88
Female Male
Source: ONS 2018, Population Estimates for UK, England and Wales, Scotland and Northern Ireland: Mid-2018. Found online at: https://www.ons.gov.uk/peoplepopulationandcommunity/populationandmigration/populationestimates

51
Figure 4.2: Population age profile, 2018
Source: ONS Population Estimates for UK, Mid-2018 https://www.ons.gov.uk/peoplepopulationandcommunity/populationandmigration/populationestimates
4.6 Figure 4.2 shows the variation between Greater Manchester and the
regional and national averages. It illustrates that Manchester has a
markedly different population profile from that of the other nine
Greater Manchester districts, and that the population of Manchester
contributes to setting Greater Manchester apart from regional and
national averages.
4.7 Broadly speaking, Greater Manchester has a younger population
profile than the North West and England & Wales, with larger
proportions of the population aged under 40. Those aged between 40
and 50 are largely in line with the regional and national average
proportions and those over 50 make up a smaller proportion of the
population than that of the North West and England & Wales.
4.8 Manchester has a younger age profile, with above average
proportions of children aged under 5 and a significantly above
average proportion of 19-30 year olds; this is likely to be a result of
0.00%
0.50%
1.00%
1.50%
2.00%
2.50%
3.00%
0 3 6 9 12 15 18 21 24 27 30 33 36 39 42 45 48 51 54 57 60 63 66 69 72 75 78 81 84 87 90
Greater Manchester Manchester North West England
52
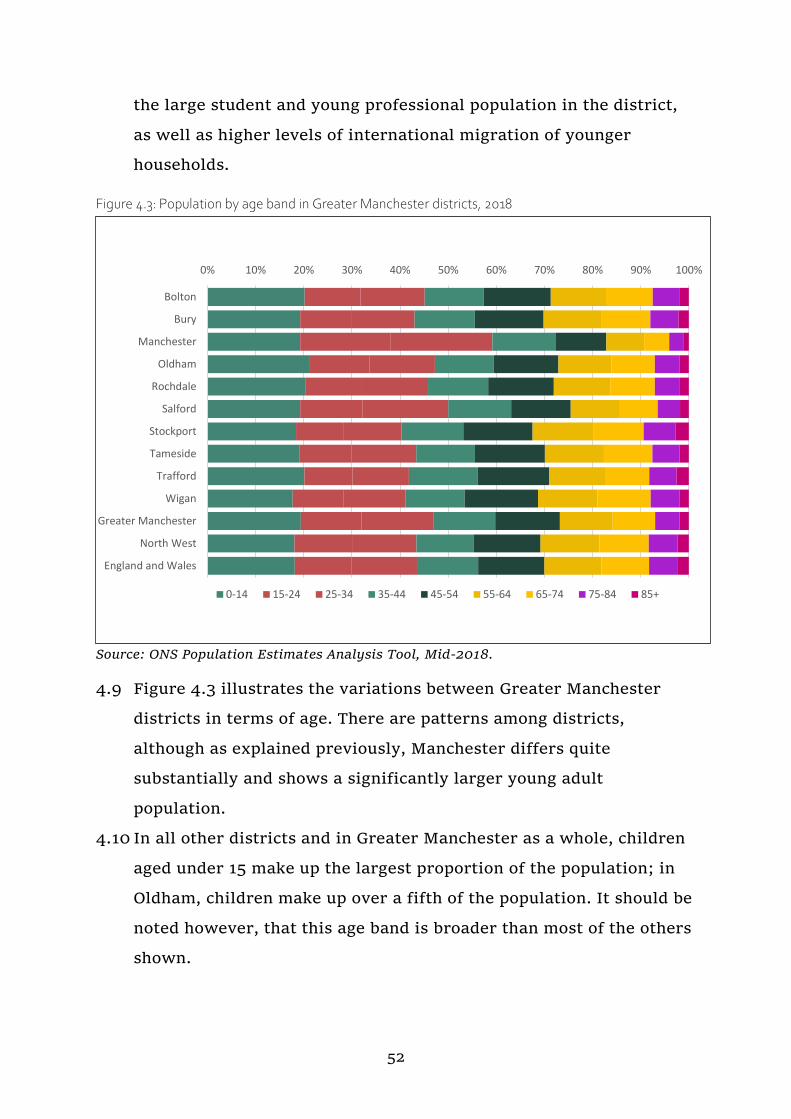
the large student and young professional population in the district,
as well as higher levels of international migration of younger
households.
Figure 4.3: Population by age band in Greater Manchester districts, 2018
Source: ONS Population Estimates Analysis Tool, Mid-2018.
4.9 Figure 4.3 illustrates the variations between Greater Manchester
districts in terms of age. There are patterns among districts,
although as explained previously, Manchester differs quite
substantially and shows a significantly larger young adult
population.
4.10 In all other districts and in Greater Manchester as a whole, children
aged under 15 make up the largest proportion of the population; in
Oldham, children make up over a fifth of the population. It should be
noted however, that this age band is broader than most of the others
shown.
0% 10% 20% 30% 40% 50% 60% 70% 80% 90% 100%
Bolton
Bury
Manchester
Oldham
Rochdale
Salford
Stockport
Tameside
Trafford
Wigan
Greater Manchester
North West
England and Wales
0-14 15-24 25-34 35-44 45-54 55-64 65-74 75-84 85+
53
4.11 Those aged 15-24 and 25-34 account for 32% of Greater
Manchester’s population, up 4% points from 2016, with higher
concentrations of these age bands found in Manchester and Salford.
Those aged 35-44 account for 13% of the population, as do those
aged 45-54. The population in the 55-64 year old age band accounts
for 11% of the Greater Manchester population. At a Greater
Manchester level, 16% of the population is aged over 65, but with a
significant variation at the district level: with 9% of Manchester
residents and 21% of Stockport residents in this age band.
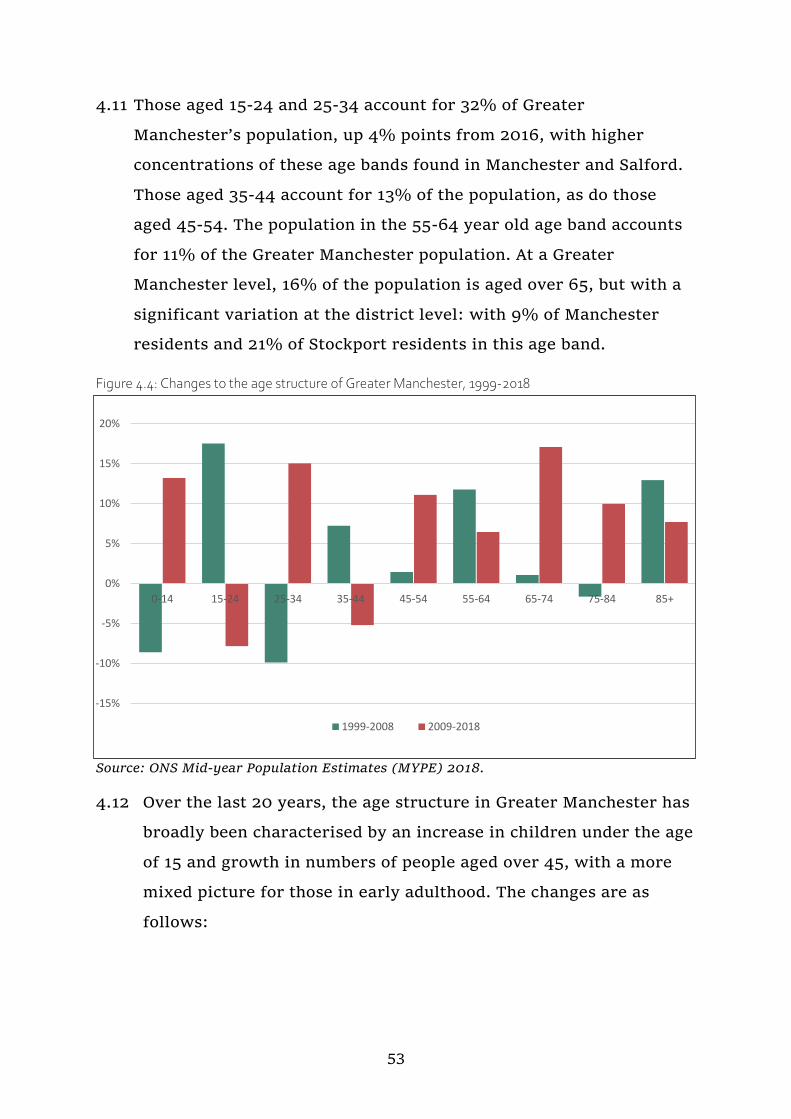
Figure 4.4: Changes to the age structure of Greater Manchester, 1999-2018
Source: ONS Mid-year Population Estimates (MYPE) 2018.
4.12 Over the last 20 years, the age structure in Greater Manchester has
broadly been characterised by an increase in children under the age
of 15 and growth in numbers of people aged over 45, with a more
mixed picture for those in early adulthood. The changes are as
follows:
-15%
-10%
-5%
0%
5%
10%
15%
20%
0-14 15-24 25-34 35-44 45-54 55-64 65-74 75-84 85+
1999-2008 2009-2018

54
The number of children under 15 fell by 9% between 1999 and
2008. However, this cohort subsequently increased by 13% in
the decade between 2009 and 2018, to just over 545,000;
The population of young adults aged 15-24 increased by 18%
over the period 1999-2008, but then declined by 8% between
2009 and 2018;
Subsequently the 25-34 year old cohort, after a decline of 10%
during the period 1999-2008, increased by 15% between 2009
and 2018, to over 422,000;
After growth between 1999 and 2008, the 35-44 year old cohort
experienced a decline over the period 2009-2018, reflecting the
earlier decline in 25-34 year olds;
A small increase in the 45-54 cohort between 1999 and 2008
was followed by growth of 11% in the decade to 2018. The 55-64
age cohort experienced double the growth over the first decade
than the second (12% as opposed to 6%);
The second strongest population growth seen over the period
has been in the 65-74 age cohort, reflecting the ageing of the
population. After a small increase between 1997 and 2006 this
age cohort increased by 17% between 2009 and 2018. The 75-84
age band had a small decrease followed by a 10% increase; and
The cohort of people aged over 85 saw the largest increase
proportionally, with a 13% rise over the period 1999-2008
followed by an 8% increase between 2009 and 2018.23
23 For further discussion of the growth of the older population in Greater Manchester, see Older
persons housing in Chapter 6.

55
Population projections
Population change
4.13 Figure 4.5 shows the percentage change in population using the
2018-based SNPP between the years 2018 and 2043.24 The largest
percentage population growth in this period is in Salford (19.4%)
and Rochdale (14.0%). In terms of projected change, the largest
increases are for Manchester (50,522) and Salford (49,481). The
lowest percentage population growth is in Bolton (4.9%) and
Wigan (7.1%). Bolton (13,966) and Bury (16,983) are projected to
have the smallest absolute growth. The percentage change across
Greater Manchester (10.1%) is higher than the North West rate
(8.5%) but is slightly lower than the rate for England (10.3%).
Figure 4.5: Percentage change in population, 2018 to 2043
Source: ONS 2018-based SNPP for local authorities and higher administrative areas in
England.
24 More information on ONS SNPP, including the methodology used to produce the projections and information on changes to this methodology is available at: https://www.ons.gov.uk/peoplepopulationandcommunity/populationandmigration/populationprojections/bulletins/subnationalpopulationprojectionsforengland/2018based
0.0
2.0
4.0
6.0
8.0
10.0
12.0
14.0
16.0
18.0
20.0
Bolton Bury Manchester Oldham Rochdale Salford Stockport Tameside Trafford Wigan GreaterManchester
North West England
56
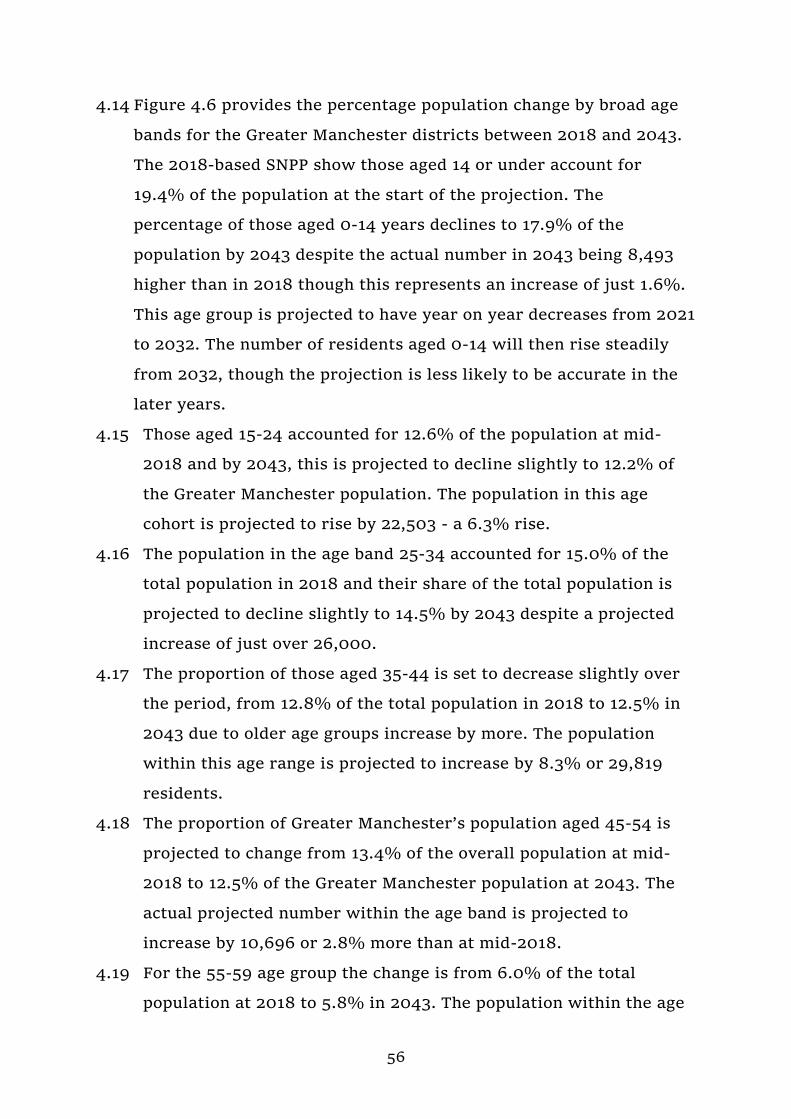
4.14 Figure 4.6 provides the percentage population change by broad age
bands for the Greater Manchester districts between 2018 and 2043.
The 2018-based SNPP show those aged 14 or under account for
19.4% of the population at the start of the projection. The
percentage of those aged 0-14 years declines to 17.9% of the
population by 2043 despite the actual number in 2043 being 8,493
higher than in 2018 though this represents an increase of just 1.6%.
This age group is projected to have year on year decreases from 2021
to 2032. The number of residents aged 0-14 will then rise steadily
from 2032, though the projection is less likely to be accurate in the
later years.
4.15 Those aged 15-24 accounted for 12.6% of the population at mid-
2018 and by 2043, this is projected to decline slightly to 12.2% of
the Greater Manchester population. The population in this age
cohort is projected to rise by 22,503 - a 6.3% rise.
4.16 The population in the age band 25-34 accounted for 15.0% of the
total population in 2018 and their share of the total population is
projected to decline slightly to 14.5% by 2043 despite a projected
increase of just over 26,000.
4.17 The proportion of those aged 35-44 is set to decrease slightly over
the period, from 12.8% of the total population in 2018 to 12.5% in
2043 due to older age groups increase by more. The population
within this age range is projected to increase by 8.3% or 29,819
residents.
4.18 The proportion of Greater Manchester’s population aged 45-54 is
projected to change from 13.4% of the overall population at mid-
2018 to 12.5% of the Greater Manchester population at 2043. The
actual projected number within the age band is projected to
increase by 10,696 or 2.8% more than at mid-2018.
4.19 For the 55-59 age group the change is from 6.0% of the total
population at 2018 to 5.8% in 2043. The population within the age

57
group is set to rise in the long term with an additional 12,261
residents of this age by 2043 representing an increase of 7.3%.
4.20 Those aged 60-64 are projected to increase in numerical terms and
as a proportion of the total population. In 2018, they accounted for
5.0% of the population and by 2043 this will increase to 5.3%. This
rise is projected to be 23,866 or 17.1% more than in the age group
at mid-2018.
4.21 The 65-74 year olds are projected to account for 9.0% of the
Greater Manchester population by 2043 – a slight increase from
8.8% of the population at mid-2018. The actual population within
the age group is projected to increase by 30,572 or 12.3% higher
than at mid-2018.
4.22 Those aged 75-84 are projected to change the most over the full
projection period. At the start of the projection there were 142,959
residents in this cohort, which accounted for 5.1% of the 2018
population across Greater Manchester. By 2043, the population in
this cohort is projected to be 224,877. This represents an increase
of 81,918 on the 2018 population equivalent to a 57.3% rise. By
2043, this age group is projected to account for 7.3% of all
residents in Greater Manchester.
4.23 The population aged 85 or more are also projected to show large
increases in the years to 2043. At the start of the projection period
at mid-2018 the population aged 85 or more was 54,368 across
Greater Manchester. The projection shows that by 2043 there will
be 92,932 residents aged 85 or more. This is an increase of 38,564,
which is equivalent to an increase of 70.4% in the numbers in this
age group. As a proportion of the Greater Manchester population,
this age range is projected to change from 1.9% in 2018 to 3.0% of
the total population in 2043.

58
Figure 4.6: Greater Manchester population projections by broad age bands, 2018-2043
Source: ONS 2018-based SNPP for local authorities and higher administrative areas in
England.
4.24 Figure 4.7 below shows that the greatest percentage rise in
population between 2018 and 2043 is projected to be in the older
age groups, with those aged over 85 increasing by 70.9% over the
period. There will be strong growth in all age groups over 60. The
75-84 age group are projected to rise by 57.3%. The smallest
growth will be in the number aged 0-14 with just a 1.6% rise.
Overall, across all bands the population is projected to rise by
10.1%.
0.0%
2.0%
4.0%
6.0%
8.0%
10.0%
12.0%
14.0%
16.0%
18.0%
20.0%
20
18
20
19
20
20
20
21
20
22
20
23
20
24
20
25
20
26
20
27
20
28
20
29
20
30
20
31
20
32
20
33
20
34
20
35
20
36
20
37
20
38
20
39
20
40
20
41
20
42
20
43
0-14 15-24 25-34 35-44 45-54
55-59 60-64 65-74 75-84 85+
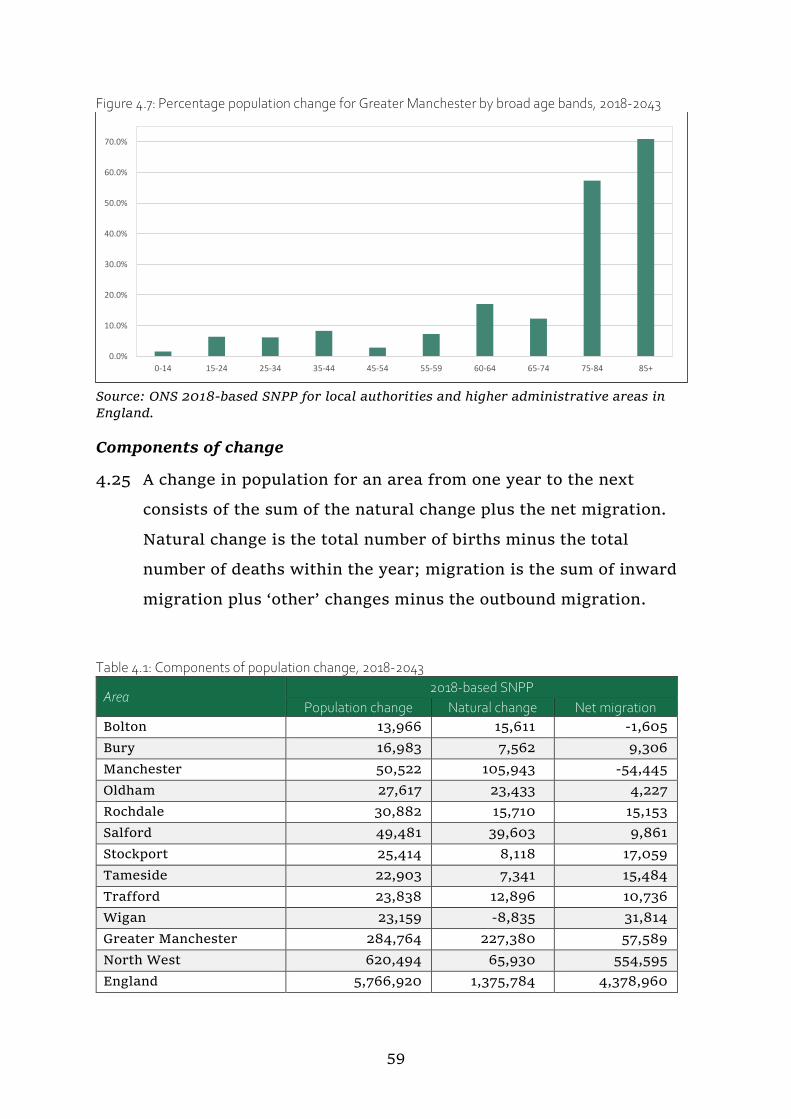
59
Figure 4.7: Percentage population change for Greater Manchester by broad age bands, 2018-2043
Source: ONS 2018-based SNPP for local authorities and higher administrative areas in
England.
Components of change
4.25 A change in population for an area from one year to the next
consists of the sum of the natural change plus the net migration.
Natural change is the total number of births minus the total
number of deaths within the year; migration is the sum of inward
migration plus ‘other’ changes minus the outbound migration.
Table 4.1: Components of population change, 2018-2043
Area 2018-based SNPP
Population change Natural change Net migration
Bolton 13,966 15,611 -1,605
Bury 16,983 7,562 9,306
Manchester 50,522 105,943 -54,445
Oldham 27,617 23,433 4,227
Rochdale 30,882 15,710 15,153
Salford 49,481 39,603 9,861
Stockport 25,414 8,118 17,059
Tameside 22,903 7,341 15,484
Trafford 23,838 12,896 10,736
Wigan 23,159 -8,835 31,814
Greater Manchester 284,764 227,380 57,589
North West 620,494 65,930 554,595
England 5,766,920 1,375,784 4,378,960
0.0%
10.0%
20.0%
30.0%
40.0%
50.0%
60.0%
70.0%
0-14 15-24 25-34 35-44 45-54 55-59 60-64 65-74 75-84 85+

60
Source: ONS 2018-based SNPP for local authorities and higher administrative areas in
England.
Natural change
4.26 For Greater Manchester natural change is far more important to
overall population growth than migration, accounting for 79.8% of
the population increase between 2018 and 2043, or 227,380 people.
This contrasts with England as a whole and the North West where
net migration is of greater importance than natural change. In the
North West natural change accounts for just 10.6% of growth and
in England natural change accounts for 23.8% of growth.
4.27 The number of births in the 25-year period is projected to be
896,354 for Greater Manchester and the number of deaths
projected is 658,974.
Net migration
4.28 Over the period 2018-2043, Manchester loses population due to net
migration (-54,445 residents), though many of the movers will be
relocating to other parts of Greater Manchester. Bolton is projected
to experience negative migration over the period totalling -1,605.
Overall, the population of Greater Manchester is projected to have a
net migration figure of 57,589 over the full projection period to
2043.
Household characteristics
Number of households
4.29 The 2018-based projection for the number of households in 2020
was 1,192,483 households in Greater Manchester, the district
breakdown of which is shown below.
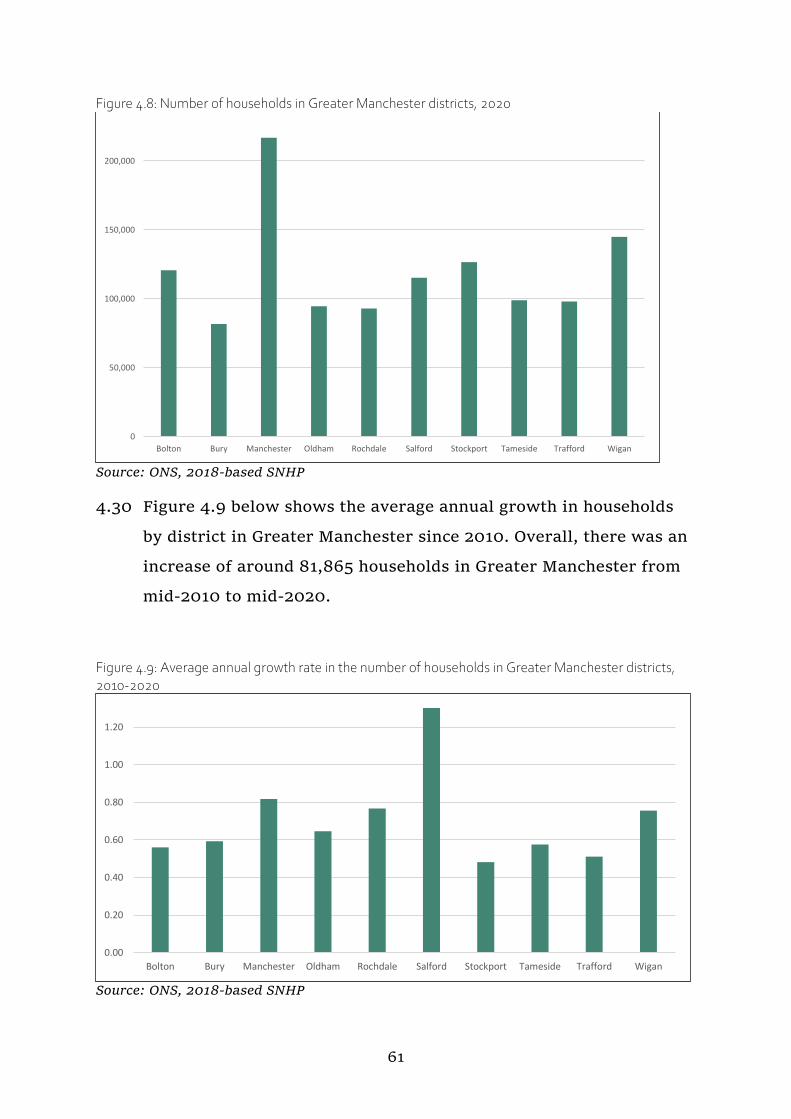
61
Figure 4.8: Number of households in Greater Manchester districts, 2020
Source: ONS, 2018-based SNHP
4.30 Figure 4.9 below shows the average annual growth in households
by district in Greater Manchester since 2010. Overall, there was an
increase of around 81,865 households in Greater Manchester from
mid-2010 to mid-2020.
Figure 4.9: Average annual growth rate in the number of households in Greater Manchester districts, 2010-2020
Source: ONS, 2018-based SNHP
0
50,000
100,000
150,000
200,000
Bolton Bury Manchester Oldham Rochdale Salford Stockport Tameside Trafford Wigan
0.00
0.20
0.40
0.60
0.80
1.00
1.20
Bolton Bury Manchester Oldham Rochdale Salford Stockport Tameside Trafford Wigan
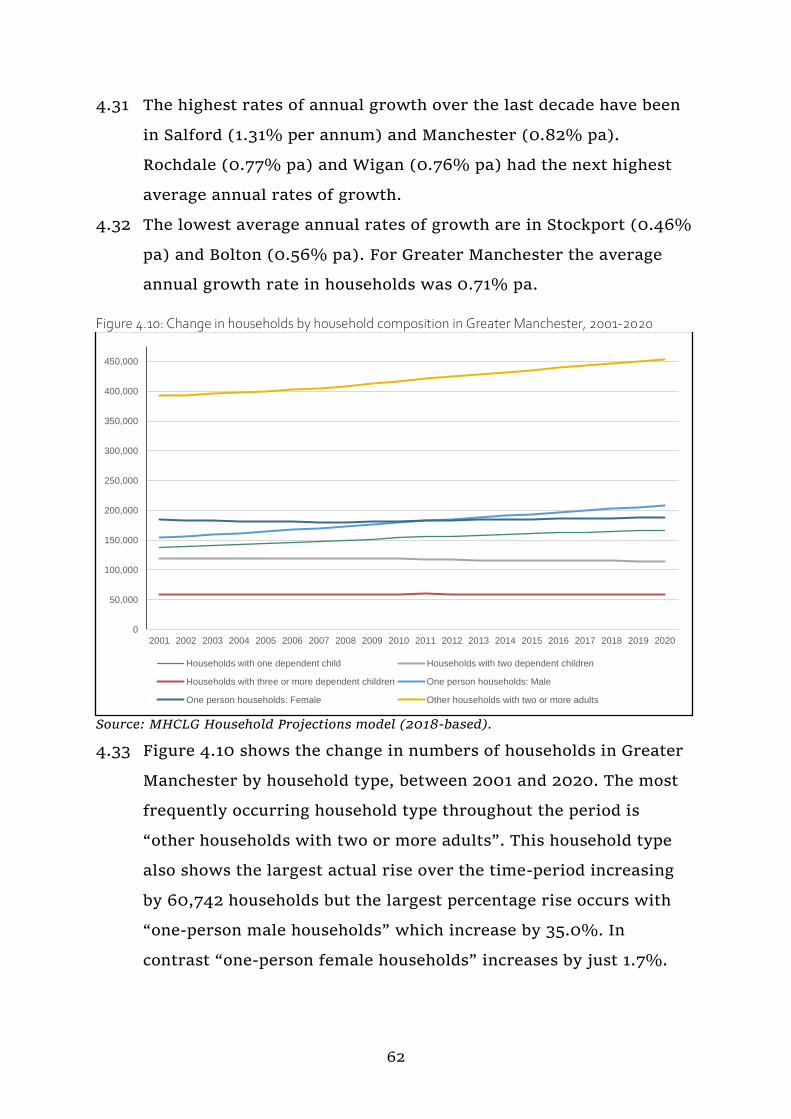
62
4.31 The highest rates of annual growth over the last decade have been
in Salford (1.31% per annum) and Manchester (0.82% pa).
Rochdale (0.77% pa) and Wigan (0.76% pa) had the next highest
average annual rates of growth.
4.32 The lowest average annual rates of growth are in Stockport (0.46%
pa) and Bolton (0.56% pa). For Greater Manchester the average
annual growth rate in households was 0.71% pa.
Figure 4.10: Change in households by household composition in Greater Manchester, 2001-2020
Source: MHCLG Household Projections model (2018-based).
4.33 Figure 4.10 shows the change in numbers of households in Greater
Manchester by household type, between 2001 and 2020. The most
frequently occurring household type throughout the period is
“other households with two or more adults”. This household type
also shows the largest actual rise over the time-period increasing
by 60,742 households but the largest percentage rise occurs with
“one-person male households” which increase by 35.0%. In
contrast “one-person female households” increases by just 1.7%.
0
50,000
100,000
150,000
200,000
250,000
300,000
350,000
400,000
450,000
2001 2002 2003 2004 2005 2006 2007 2008 2009 2010 2011 2012 2013 2014 2015 2016 2017 2018 2019 2020
Households with one dependent child Households with two dependent children
Households with three or more dependent children One person households: Male
One person households: Female Other households with two or more adults

63
Single male households are now outnumbering single female
households.
4.34 Households with one dependent child increases by 21.1% over the
period. The number of households with three or more children
increases by 2.0%. The number of households with two dependent
children falls by -4.6%.
4.35 The total increase in households from 2001 to 2020 is 142,555 or
13.6%. At mid-2002, the 2018-based projections show a total
number of 1,190,464 households in Greater Manchester.
Black and Minority Ethnic (BME) communities
4.35 Greater Manchester is a little more ethnically diverse than England
& Wales as a whole, with a larger proportion of the population who
identify as Asian/Asian British but a slightly lower proportion who
identify as Black/African/Caribbean/Black British.
Figure 4.11: Population by ethnic group in Greater Manchester districts, 2011
Source: 2011 Census
4.36 Figure 4.11 shows the breakdown of districts by ethnic group. In
Greater Manchester 84% of residents identified as white as
opposed to 86% in England & Wales and 90% in the North West.

64
People identifying as Asian or Asian British account for 10% of the
Greater Manchester population, compared to 7.5% nationally and
6% in the North West. Manchester is the most ethnically diverse
district within the conurbation, with 67% of the population
identifying as white, 17% as Asian or Asian British, 9% as Black
African, Caribbean or Black British, 5% as a mixed or multiple
ethnic groups and 3% as another ethnic group.
Figure 4.12: Ethnic group by household tenure in Greater Manchester, 2011
Source: 2011 Census
4.37 Figure 4.12 shows that there is some variation in tenure by the
ethnic group of household head in Greater Manchester. Overall, just
over 60% of Greater Manchester residents are owner-occupiers,
with 27% of the population owning their home outright.
Households headed by someone identifying as white are most likely
to own their own home, with 28% of households owning outright
and 34% with a mortgage. Households headed by someone
identifying as being in a black ethnic group are least likely to be
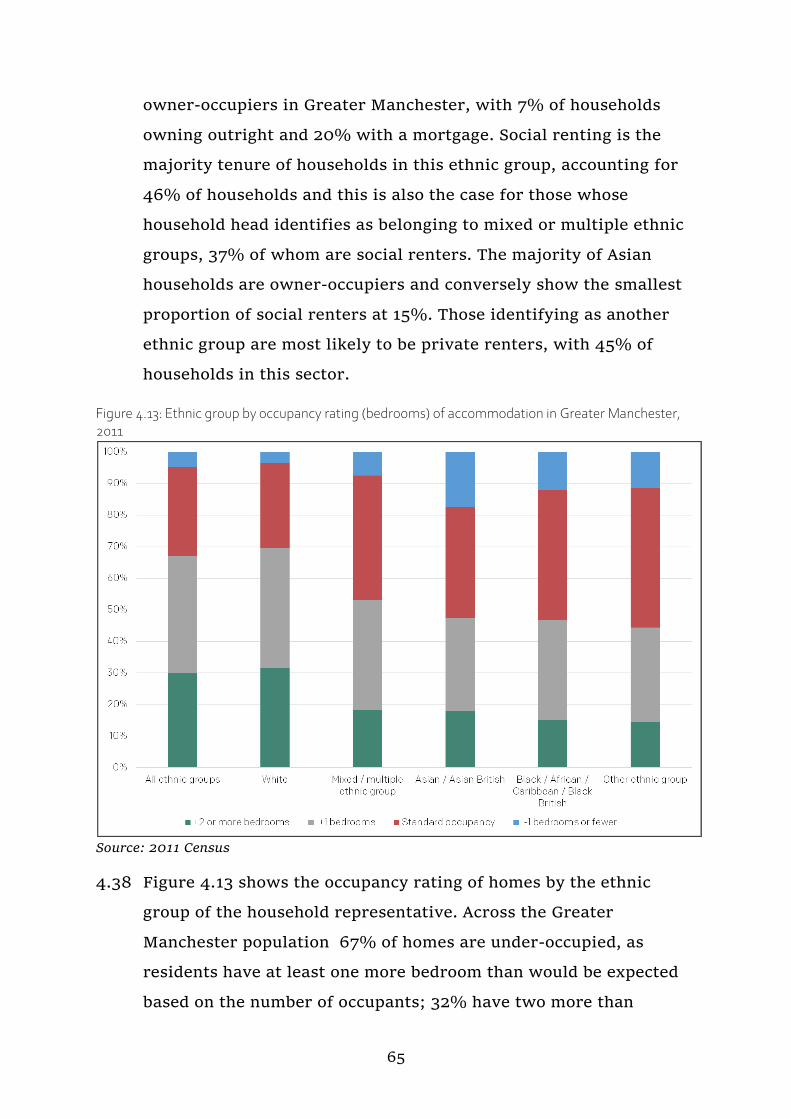
65
owner-occupiers in Greater Manchester, with 7% of households
owning outright and 20% with a mortgage. Social renting is the
majority tenure of households in this ethnic group, accounting for
46% of households and this is also the case for those whose
household head identifies as belonging to mixed or multiple ethnic
groups, 37% of whom are social renters. The majority of Asian
households are owner-occupiers and conversely show the smallest
proportion of social renters at 15%. Those identifying as another
ethnic group are most likely to be private renters, with 45% of
households in this sector.
Figure 4.13: Ethnic group by occupancy rating (bedrooms) of accommodation in Greater Manchester, 2011
Source: 2011 Census
4.38 Figure 4.13 shows the occupancy rating of homes by the ethnic
group of the household representative. Across the Greater
Manchester population 67% of homes are under-occupied, as
residents have at least one more bedroom than would be expected
based on the number of occupants; 32% have two more than
66
expected. Around 28% of homes are occupied at the expected
standard and 5% are overcrowded.
4.39 Households in the white ethnic group are more likely to be under-
occupied, with 70% of the households having spare bedrooms. Only
3% of white households are overcrowded.
4.40 Around 53% of households comprising mixed or multiple ethnic
groups are under-occupying, with 40% of homes occupied to
standard and 7.5% overcrowded, which is above the Greater
Manchester average. Those who are Asian or Asian British are also
more likely to have at least one bedroom fewer than needed, with
17% of households overcrowded. Black African, Caribbean and
British households, as well as those from another ethnic group, are
also more likely to be overcrowded (12% and 11% respectively), but
over 40% of both groups are occupied to the expected standard.
Young people
4.41 As already noted, Greater Manchester has a relatively young
population, with over 20% of people aged under 30; this compares
to 18% in the North West and nationally. The cities of Manchester
and Salford have younger than average populations, with a third of
Manchester residents aged under 30.25
4.42 In recent years, household formation among younger people has
been suppressed due to housing affordability issues, with non-
dependent children living at home for longer than previously, as
shown below.
25 2011 Census

67
Figure 4.14: Percentage change in families with non-dependent children, 2001-2011
Source: 2001 Census and 2011 Census.
4.43 Figure 4.14 shows that there has been an increase of 11% in
families with non-dependent children in England & Wales between
2001 and 2011. At a Greater Manchester level, the change has been
smaller, at 8%, roughly in line with the regional figure. However,
Manchester has seen an increase that is far above average at 17%
over the period. Trafford and Tameside have also seen increases in
these family types. Salford has seen only a very small increase in
this family type over the decade.
Tenure
4.44 The housing situation of young people has traditionally been
different from that of the general population, with a far larger
proportion of young people living in the private rented sector
(PRS). This is partly due to the flexibility of the tenure allowing
people to move for work or study, as well as young people being
less likely to have had time to save for a deposit in order to buy a
home. Between 2001 and 2011, the concentration of young people in
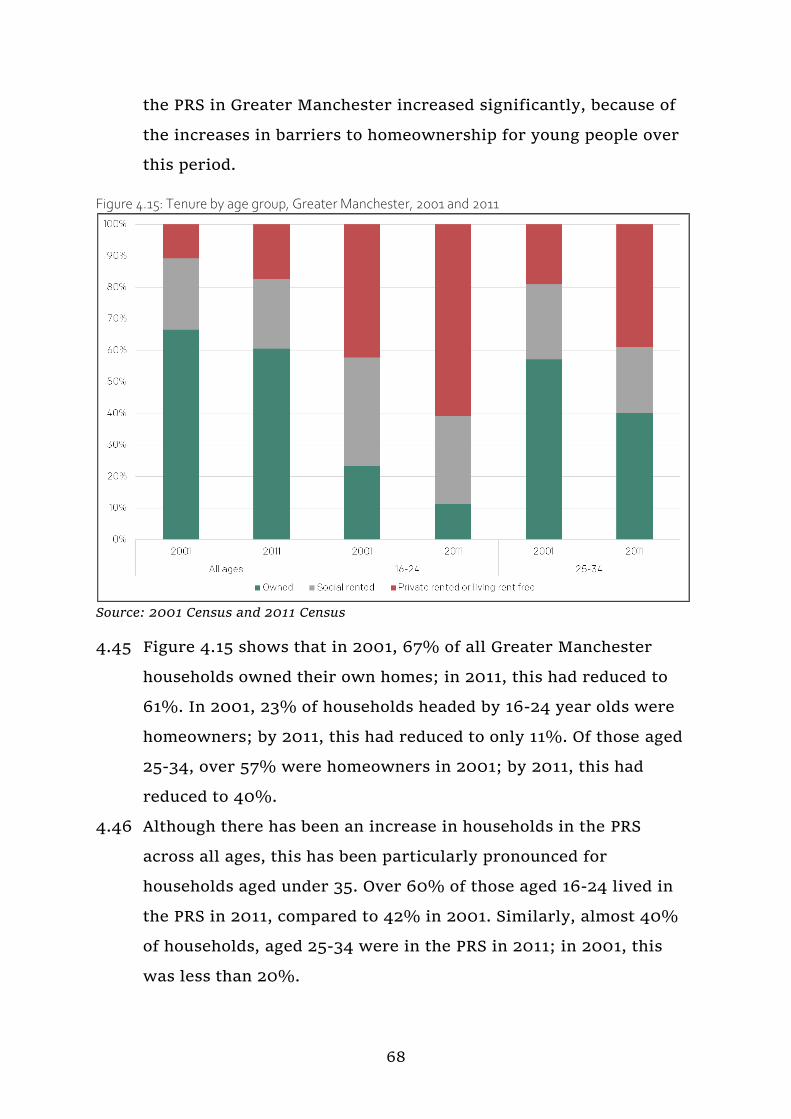
68
the PRS in Greater Manchester increased significantly, because of
the increases in barriers to homeownership for young people over
this period.
Figure 4.15: Tenure by age group, Greater Manchester, 2001 and 2011
Source: 2001 Census and 2011 Census
4.45 Figure 4.15 shows that in 2001, 67% of all Greater Manchester
households owned their own homes; in 2011, this had reduced to
61%. In 2001, 23% of households headed by 16-24 year olds were
homeowners; by 2011, this had reduced to only 11%. Of those aged
25-34, over 57% were homeowners in 2001; by 2011, this had
reduced to 40%.
4.46 Although there has been an increase in households in the PRS
across all ages, this has been particularly pronounced for
households aged under 35. Over 60% of those aged 16-24 lived in
the PRS in 2011, compared to 42% in 2001. Similarly, almost 40%
of households, aged 25-34 were in the PRS in 2011; in 2001, this
was less than 20%.
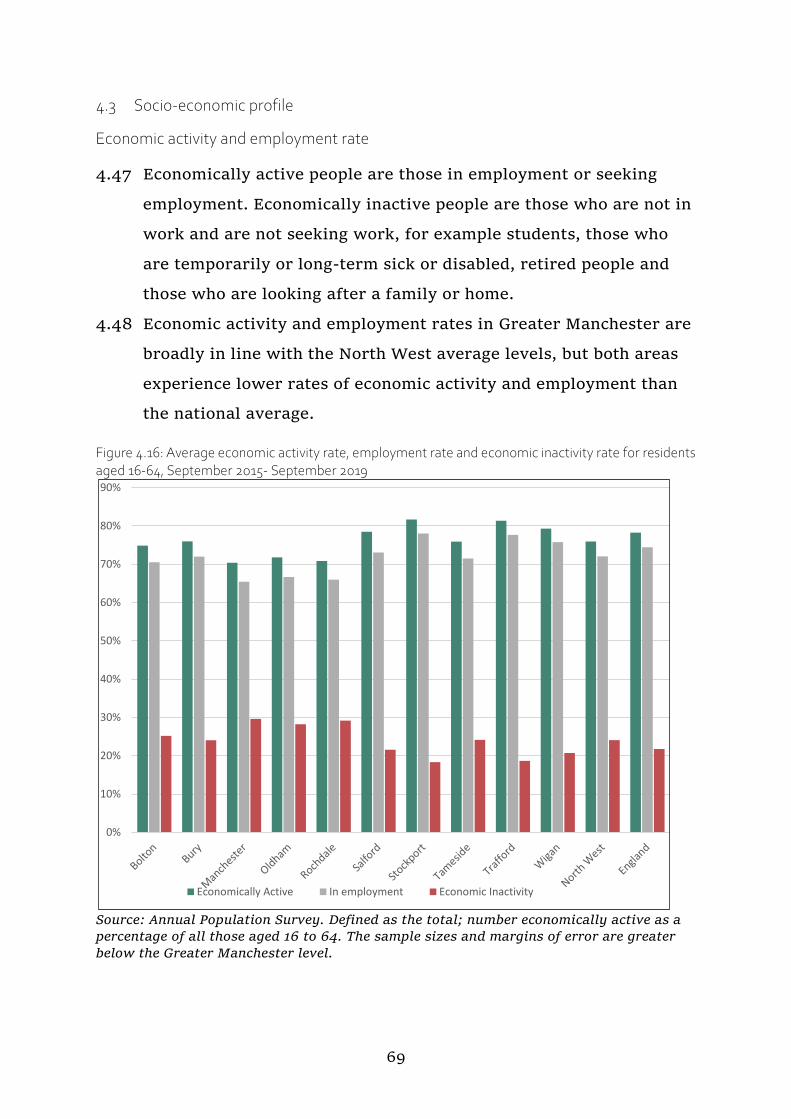
69
4.3 Socio-economic profile
Economic activity and employment rate
4.47 Economically active people are those in employment or seeking
employment. Economically inactive people are those who are not in
work and are not seeking work, for example students, those who
are temporarily or long-term sick or disabled, retired people and
those who are looking after a family or home.
4.48 Economic activity and employment rates in Greater Manchester are
broadly in line with the North West average levels, but both areas
experience lower rates of economic activity and employment than
the national average.
Figure 4.16: Average economic activity rate, employment rate and economic inactivity rate for residents aged 16-64, September 2015- September 2019
Source: Annual Population Survey. Defined as the total; number economically active as a
percentage of all those aged 16 to 64. The sample sizes and margins of error are greater
below the Greater Manchester level.
0%
10%
20%
30%
40%
50%
60%
70%
80%
90%
Economically Active In employment Economic Inactivity
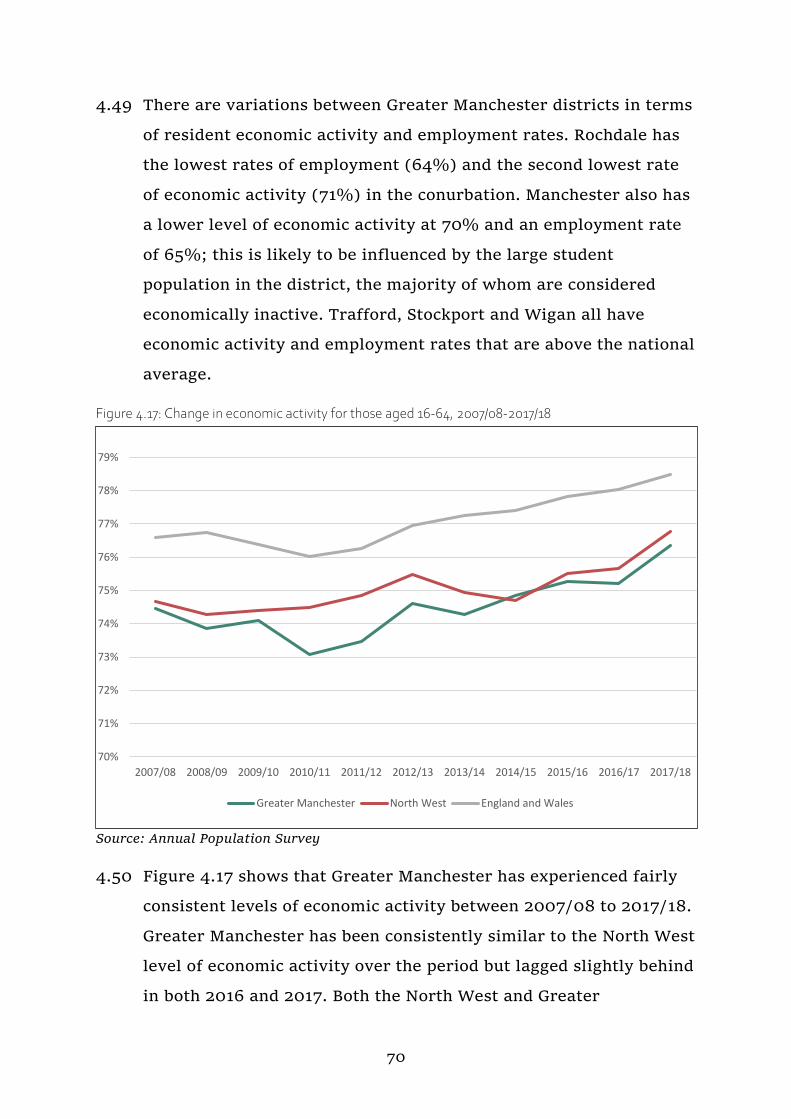
70
4.49 There are variations between Greater Manchester districts in terms
of resident economic activity and employment rates. Rochdale has
the lowest rates of employment (64%) and the second lowest rate
of economic activity (71%) in the conurbation. Manchester also has
a lower level of economic activity at 70% and an employment rate
of 65%; this is likely to be influenced by the large student
population in the district, the majority of whom are considered
economically inactive. Trafford, Stockport and Wigan all have
economic activity and employment rates that are above the national
average.
Figure 4.17: Change in economic activity for those aged 16-64, 2007/08-2017/18
Source: Annual Population Survey
4.50 Figure 4.17 shows that Greater Manchester has experienced fairly
consistent levels of economic activity between 2007/08 to 2017/18.
Greater Manchester has been consistently similar to the North West
level of economic activity over the period but lagged slightly behind
in both 2016 and 2017. Both the North West and Greater
70%
71%
72%
73%
74%
75%
76%
77%
78%
79%
2007/08 2008/09 2009/10 2010/11 2011/12 2012/13 2013/14 2014/15 2015/16 2016/17 2017/18
Greater Manchester North West England and Wales

71
Manchester have been a few percentage points below the national
average in terms of economic activity rate.
Figure 4.18: Average economic activity rate and employment rate of those aged 16-64 by city region, September 2015-September 2018
Source: Annual Population Survey
4.51 Figure 4.18 shows the performance of Greater Manchester relative
to the other Combined Authority areas in terms of employment and
economic activity rates. This shows that Greater Manchester
performs well in relation to the other northern Combined Authority
areas, with higher employment rates than all except West
Yorkshire and higher economic activity rates than all except the
Sheffield City Region and West Yorkshire Combined Authorities.
North East, Greater Manchester and North of Tyne combined
authorities all had the same economic activity rate of 75%.
60%
65%
70%
75%
80%
85%
Economic Rate Employment Rate
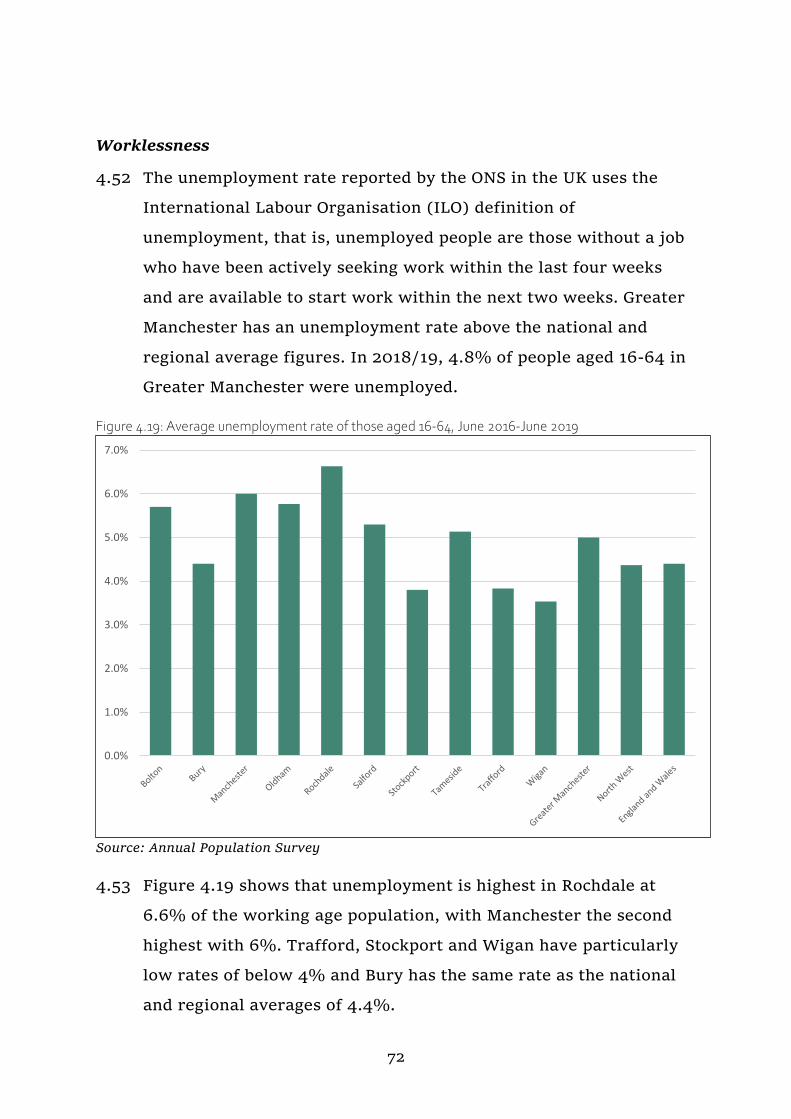
72
Worklessness
4.52 The unemployment rate reported by the ONS in the UK uses the
International Labour Organisation (ILO) definition of
unemployment, that is, unemployed people are those without a job
who have been actively seeking work within the last four weeks
and are available to start work within the next two weeks. Greater
Manchester has an unemployment rate above the national and
regional average figures. In 2018/19, 4.8% of people aged 16-64 in
Greater Manchester were unemployed.
Figure 4.19: Average unemployment rate of those aged 16-64, June 2016-June 2019
Source: Annual Population Survey
4.53 Figure 4.19 shows that unemployment is highest in Rochdale at
6.6% of the working age population, with Manchester the second
highest with 6%. Trafford, Stockport and Wigan have particularly
low rates of below 4% and Bury has the same rate as the national
and regional averages of 4.4%.
0.0%
1.0%
2.0%
3.0%
4.0%
5.0%
6.0%
7.0%

73
Qualifications
4.54 The qualifications profile of Greater Manchester differs somewhat
from the regional and national picture. Greater Manchester has a
higher proportion of residents with no qualifications than the
regional and national averages. Greater Manchester has slightly
smaller proportion of the population qualified to National
Vocational Qualification (NVQ) level 4 or above (equivalent to an
undergraduate degree) than the North West or England & Wales.
Figure 4.20: Qualification levels for residents aged 16-64, January-December 2018
Source: Annual Population Survey (APS)
4.55 Figure 4.20 shows that over half of Greater Manchester’s
population is qualified to NVQ level 3 or above, which is equivalent
to A-Level or higher. This is slightly higher than the North West,
but slightly lower than the national average for these qualification
levels.
0% 10% 20% 30% 40% 50% 60% 70% 80% 90% 100%
Bolton
Bury
Manchester
Oldham
Rochdale
Salford
Stockport
Tameside
Trafford
Wigan
Greater Manchester
North West
England and Wales
No Qualifications (NVQ) Other Qualifications (NVQ) NVQ1
NVQ2 Trade Apprenticenships NVQ3
NVQ4+
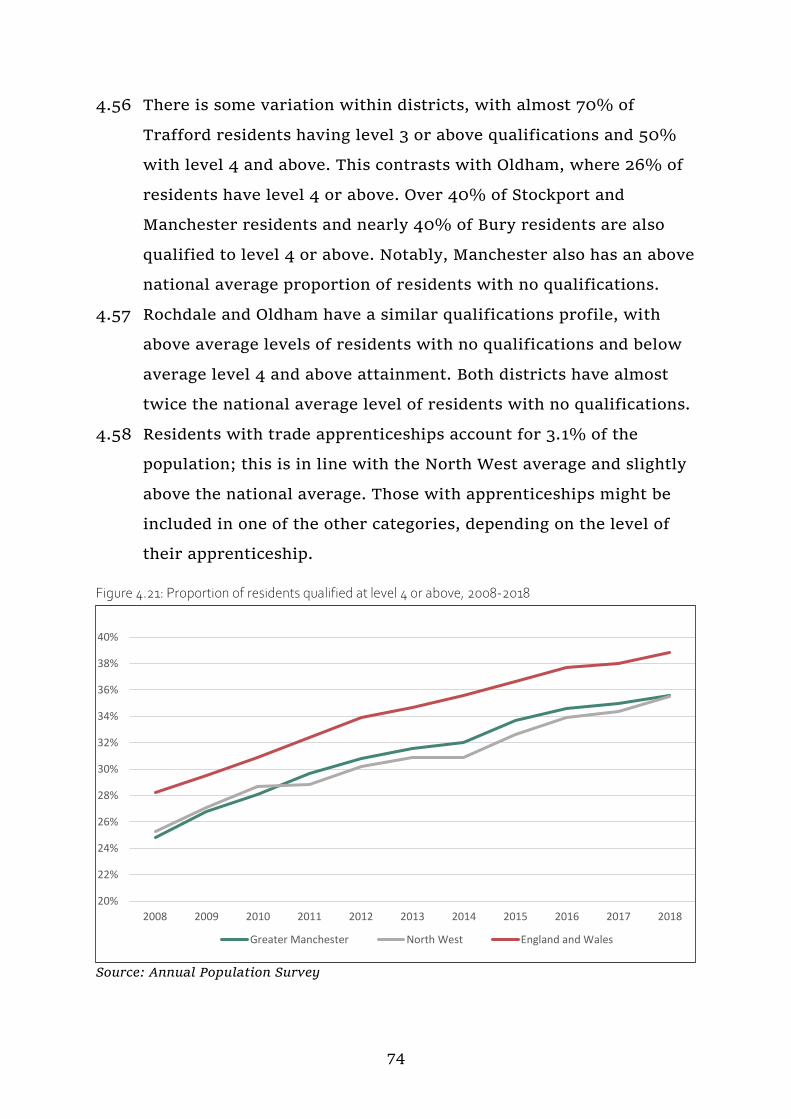
74
4.56 There is some variation within districts, with almost 70% of
Trafford residents having level 3 or above qualifications and 50%
with level 4 and above. This contrasts with Oldham, where 26% of
residents have level 4 or above. Over 40% of Stockport and
Manchester residents and nearly 40% of Bury residents are also
qualified to level 4 or above. Notably, Manchester also has an above
national average proportion of residents with no qualifications.
4.57 Rochdale and Oldham have a similar qualifications profile, with
above average levels of residents with no qualifications and below
average level 4 and above attainment. Both districts have almost
twice the national average level of residents with no qualifications.
4.58 Residents with trade apprenticeships account for 3.1% of the
population; this is in line with the North West average and slightly
above the national average. Those with apprenticeships might be
included in one of the other categories, depending on the level of
their apprenticeship.
Figure 4.21: Proportion of residents qualified at level 4 or above, 2008-2018
Source: Annual Population Survey
20%
22%
24%
26%
28%
30%
32%
34%
36%
38%
40%
2008 2009 2010 2011 2012 2013 2014 2015 2016 2017 2018
Greater Manchester North West England and Wales
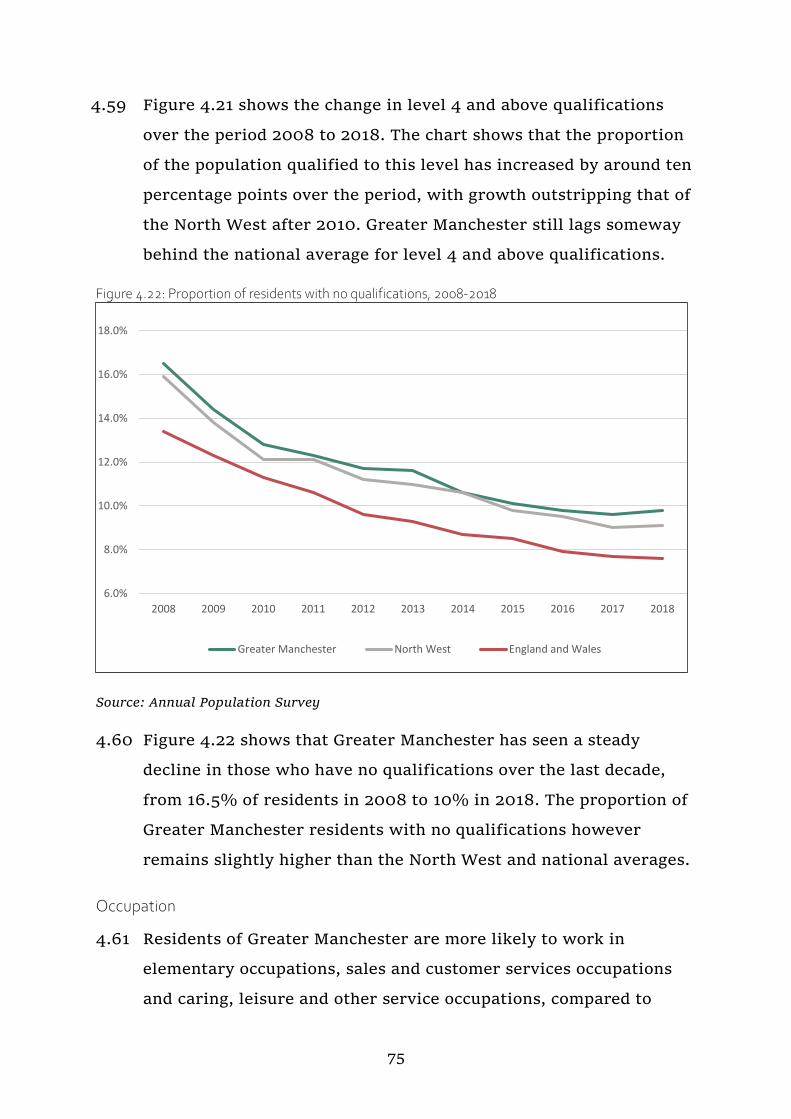
75
4.59 Figure 4.21 shows the change in level 4 and above qualifications
over the period 2008 to 2018. The chart shows that the proportion
of the population qualified to this level has increased by around ten
percentage points over the period, with growth outstripping that of
the North West after 2010. Greater Manchester still lags someway
behind the national average for level 4 and above qualifications.
Figure 4.22: Proportion of residents with no qualifications, 2008-2018
Source: Annual Population Survey
4.60 Figure 4.22 shows that Greater Manchester has seen a steady
decline in those who have no qualifications over the last decade,
from 16.5% of residents in 2008 to 10% in 2018. The proportion of
Greater Manchester residents with no qualifications however
remains slightly higher than the North West and national averages.
Occupation
4.61 Residents of Greater Manchester are more likely to work in
elementary occupations, sales and customer services occupations
and caring, leisure and other service occupations, compared to
6.0%
8.0%
10.0%
12.0%
14.0%
16.0%
18.0%
2008 2009 2010 2011 2012 2013 2014 2015 2016 2017 2018
Greater Manchester North West England and Wales
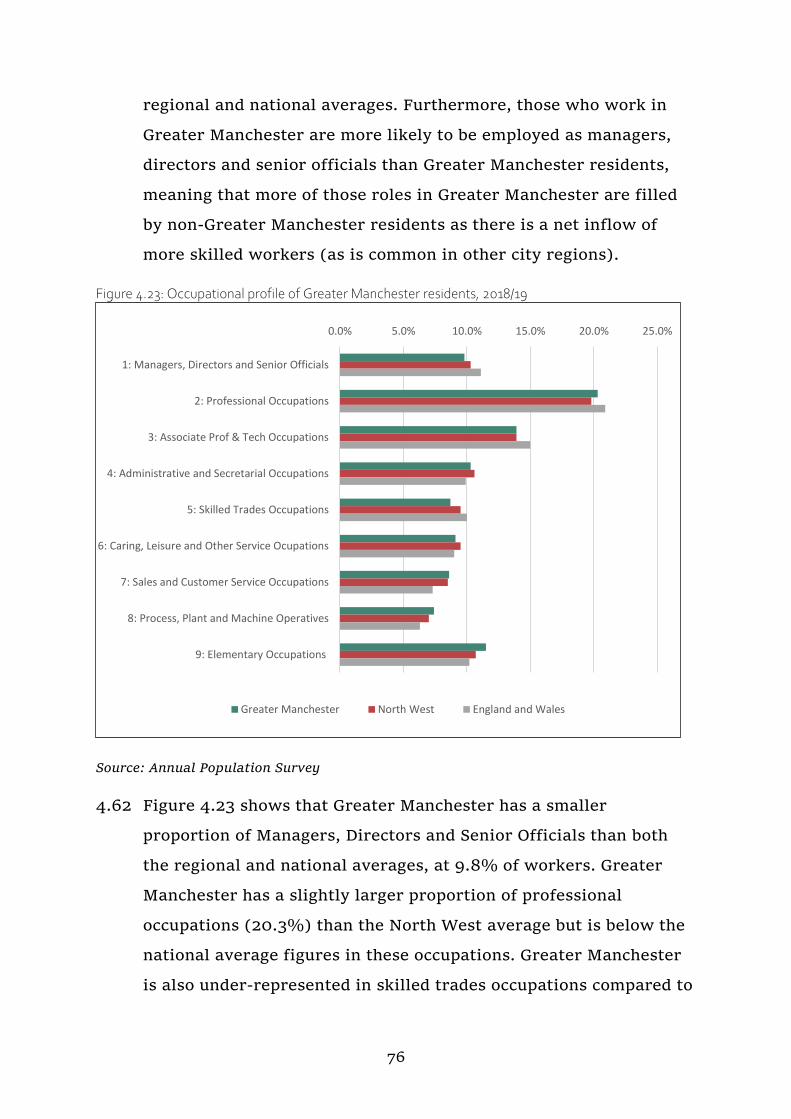
76
regional and national averages. Furthermore, those who work in
Greater Manchester are more likely to be employed as managers,
directors and senior officials than Greater Manchester residents,
meaning that more of those roles in Greater Manchester are filled
by non-Greater Manchester residents as there is a net inflow of
more skilled workers (as is common in other city regions).
Figure 4.23: Occupational profile of Greater Manchester residents, 2018/19
Source: Annual Population Survey
4.62 Figure 4.23 shows that Greater Manchester has a smaller
proportion of Managers, Directors and Senior Officials than both
the regional and national averages, at 9.8% of workers. Greater
Manchester has a slightly larger proportion of professional
occupations (20.3%) than the North West average but is below the
national average figures in these occupations. Greater Manchester
is also under-represented in skilled trades occupations compared to
0.0% 5.0% 10.0% 15.0% 20.0% 25.0%
1: Managers, Directors and Senior Officials
2: Professional Occupations
3: Associate Prof & Tech Occupations
4: Administrative and Secretarial Occupations
5: Skilled Trades Occupations
6: Caring, Leisure and Other Service Ocupations
7: Sales and Customer Service Occupations
8: Process, Plant and Machine Operatives
9: Elementary Occupations
Greater Manchester North West England and Wales

77
the North West and England & Wales; the North West region is
slightly over-represented in skilled trades occupations compared to
England & Wales.
Figure 4.24: Occupation profile of Greater Manchester, workplace and residence-based comparison, 2018
Source: Annual Population Survey
4.63 Figure 4.24 shows that those who work in Greater Manchester are
more likely to be managers, directors and senior officials than
those who are resident in Greater Manchester; this is also the case
for professional occupations and, to a lesser extent, administrative
and secretarial occupations. Greater Manchester residents are more
likely to be employed in skilled trades’ occupations, as well as
caring occupations. Those living in Greater Manchester are also
more likely to be employed as process, plant and machine
operatives or in elementary occupations. These differences are
typical for most cities/city regions in England.
0.0% 5.0% 10.0% 15.0% 20.0% 25.0%
1. Managers, Directors and Senior Officials
2. Professional Occupations
3. Associate Prof & Tech Occupation
4. Administrative and Secretarial Occupations
5. Skilled Trades Occupations
6. Caring, Leisure and Other Service Occupations
7. Sales and Customer Service Occupations
8. Process, Plant and Machine Operatives
9. Elementary occupations
Workplace based Residence based
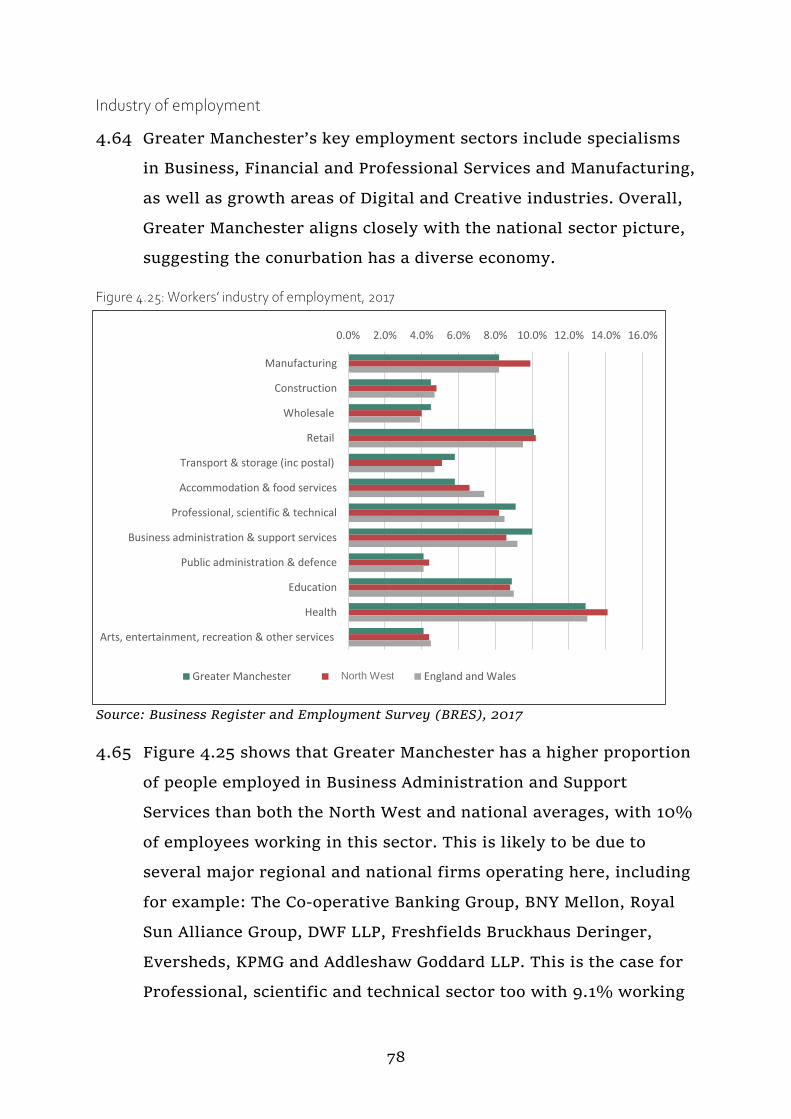
78
Industry of employment
4.64 Greater Manchester’s key employment sectors include specialisms
in Business, Financial and Professional Services and Manufacturing,
as well as growth areas of Digital and Creative industries. Overall,
Greater Manchester aligns closely with the national sector picture,
suggesting the conurbation has a diverse economy.
Figure 4.25: Workers’ industry of employment, 2017
Source: Business Register and Employment Survey (BRES), 2017
4.65 Figure 4.25 shows that Greater Manchester has a higher proportion
of people employed in Business Administration and Support
Services than both the North West and national averages, with 10%
of employees working in this sector. This is likely to be due to
several major regional and national firms operating here, including
for example: The Co-operative Banking Group, BNY Mellon, Royal
Sun Alliance Group, DWF LLP, Freshfields Bruckhaus Deringer,
Eversheds, KPMG and Addleshaw Goddard LLP. This is the case for
Professional, scientific and technical sector too with 9.1% working
0.0% 2.0% 4.0% 6.0% 8.0% 10.0% 12.0% 14.0% 16.0%
Manufacturing
Construction
Wholesale
Retail
Transport & storage (inc postal)
Accommodation & food services
Professional, scientific & technical
Business administration & support services
Public administration & defence
Education
Health
Arts, entertainment, recreation & other services
Greater Manchester Noth West England and WalesNorth West

79
in this sector and this could be attributed to work in and around the
universities.
4.66 Retail and Wholesale is a significant employment sector for Greater
Manchester accounting for 10.1% of employment, as is Health and
Social Care that employs 13% of workers.
4.67 Transport and Storage is an important sector for Greater
Manchester, employing 5.8% of workers, which is above the North
West and national average levels. The key locations for logistics
employment include Port Salford and Carrington, Logistics North
and Manchester Airport.
4.68 Wholesale industries also account for an above average proportion
of workers in Greater Manchester compared to the North West as a
whole and national statistics.
Salaries by industry of employment
4.69 Table 4.2 shows the median annual pay by sector in the North West
region in 2018. The data shows that some of the most important
sectors for Greater Manchester have some of the highest median
salaries in the North West (£22,641), with Information and
Communication, Electricity, Gas, Steam and Air Conditioning
Supply also having a median salary over £30,000 in the North
West. Eight other sectors have median salaries above the North
West median. Seven sectors have salaries below the North West
median. Accommodation and Food Services median pay is the
lowest paying much less than any other sector in the North West.

80
Table 4.2: Annual pay (North West) – gross (£) – for all employee jobs, 2018 (revised)
Sector Median full-time
equivalent salary (£)
Mining and Quarrying 35,489
Electricity, Gas, Steam and Air Conditioning Supply 32,756
Information and Communication 31,471
Manufacturing 29,868
Public Administration and Defence, Compulsory Social Security 29,167
Construction 29,116
Professional, Scientific and Technical activities 28,254
Financial and Insurance 27,824
Water Supply, Sewerage, Waste Management and Remediation Activities 27,294
Transportation and Storage 26,006
Real Estate activities 23,682
Education 21,814
Administrative and Support Services 21,162
Human Health and Social Work activities 20,449
Wholesale and Retail Trade; repair of motor vehicles and motorcycles 17,903
Other service activities 16,472
Arts, Entertainment and Recreation 15,335
Accommodation and Food Service Industries 12,471
Agriculture, Forestry, Fishing n/a
All Industries and Services 22,641 Source: Annual Survey of Hours and Earnings (ASHE, 2018) SIC07 Work Region Industry
(2) SIC2007 Table 5.7a Annual pay - Gross 2018 (revised edition) – all employees (Data
not available for all sectors.) (n/a - small sample size)
Future Employment Growth
4.70 The Greater Manchester Forecasting Model (GMFM) forecasts
employment growth by sector for the period 2018-2037.
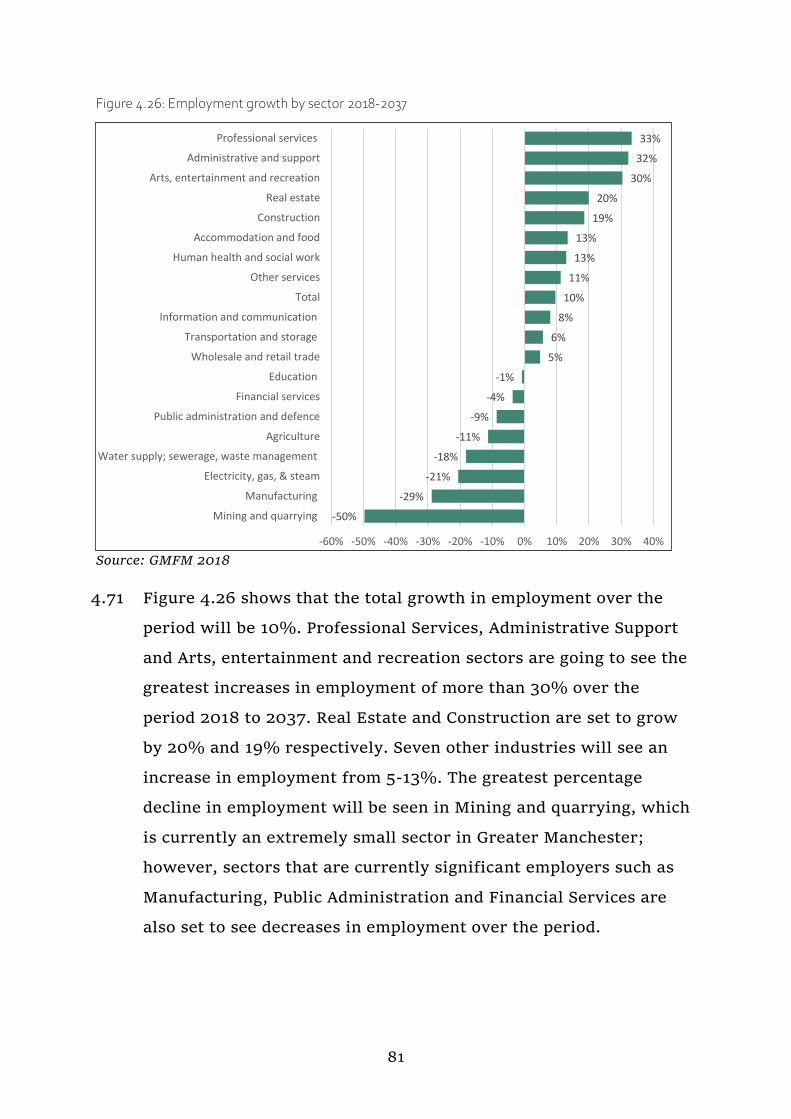
81
Figure 4.26: Employment growth by sector 2018-2037
Source: GMFM 2018
4.71 Figure 4.26 shows that the total growth in employment over the
period will be 10%. Professional Services, Administrative Support
and Arts, entertainment and recreation sectors are going to see the
greatest increases in employment of more than 30% over the
period 2018 to 2037. Real Estate and Construction are set to grow
by 20% and 19% respectively. Seven other industries will see an
increase in employment from 5-13%. The greatest percentage
decline in employment will be seen in Mining and quarrying, which
is currently an extremely small sector in Greater Manchester;
however, sectors that are currently significant employers such as
Manufacturing, Public Administration and Financial Services are
also set to see decreases in employment over the period.
-50%
-29%
-21%
-18%
-11%
-9%
-4%
-1%
5%
6%
8%
10%
11%
13%
13%
19%
20%
30%
32%
33%
-60% -50% -40% -30% -20% -10% 0% 10% 20% 30% 40%
Mining and quarrying
Manufacturing
Electricity, gas, & steam
Water supply; sewerage, waste management
Agriculture
Public administration and defence
Financial services
Education
Wholesale and retail trade
Transportation and storage
Information and communication
Total
Other services
Human health and social work
Accommodation and food
Construction
Real estate
Arts, entertainment and recreation
Administrative and support
Professional services
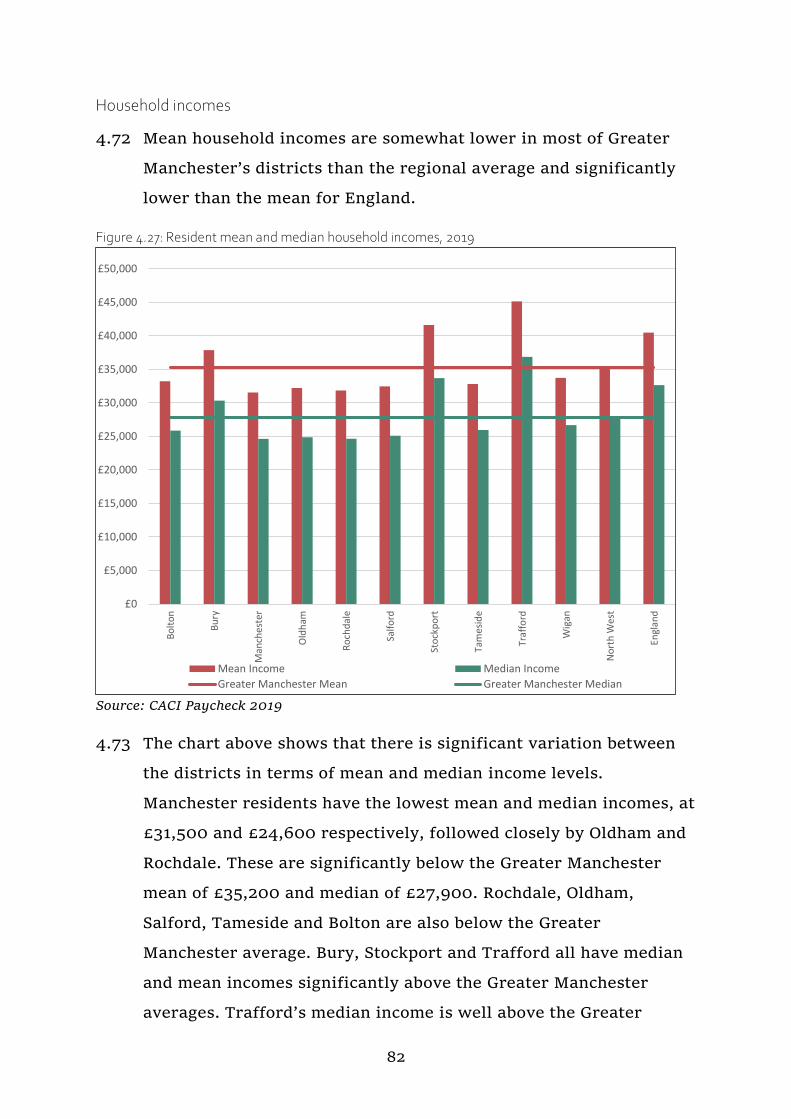
82
Household incomes
4.72 Mean household incomes are somewhat lower in most of Greater
Manchester’s districts than the regional average and significantly
lower than the mean for England.
Figure 4.27: Resident mean and median household incomes, 2019
Source: CACI Paycheck 2019
4.73 The chart above shows that there is significant variation between
the districts in terms of mean and median income levels.
Manchester residents have the lowest mean and median incomes, at
£31,500 and £24,600 respectively, followed closely by Oldham and
Rochdale. These are significantly below the Greater Manchester
mean of £35,200 and median of £27,900. Rochdale, Oldham,
Salford, Tameside and Bolton are also below the Greater
Manchester average. Bury, Stockport and Trafford all have median
and mean incomes significantly above the Greater Manchester
averages. Trafford’s median income is well above the Greater
£0
£5,000
£10,000
£15,000
£20,000
£25,000
£30,000
£35,000
£40,000
£45,000
£50,000
Bo
lto
n
Bu
ry
Man
ches
ter
Old
ham
Ro
chd
ale
Salf
ord
Sto
ckp
ort
Tam
esid
e
Traf
ford
Wig
an
No
rth
Wes
t
Engl
and
Mean Income Median Income
Greater Manchester Mean Greater Manchester Median
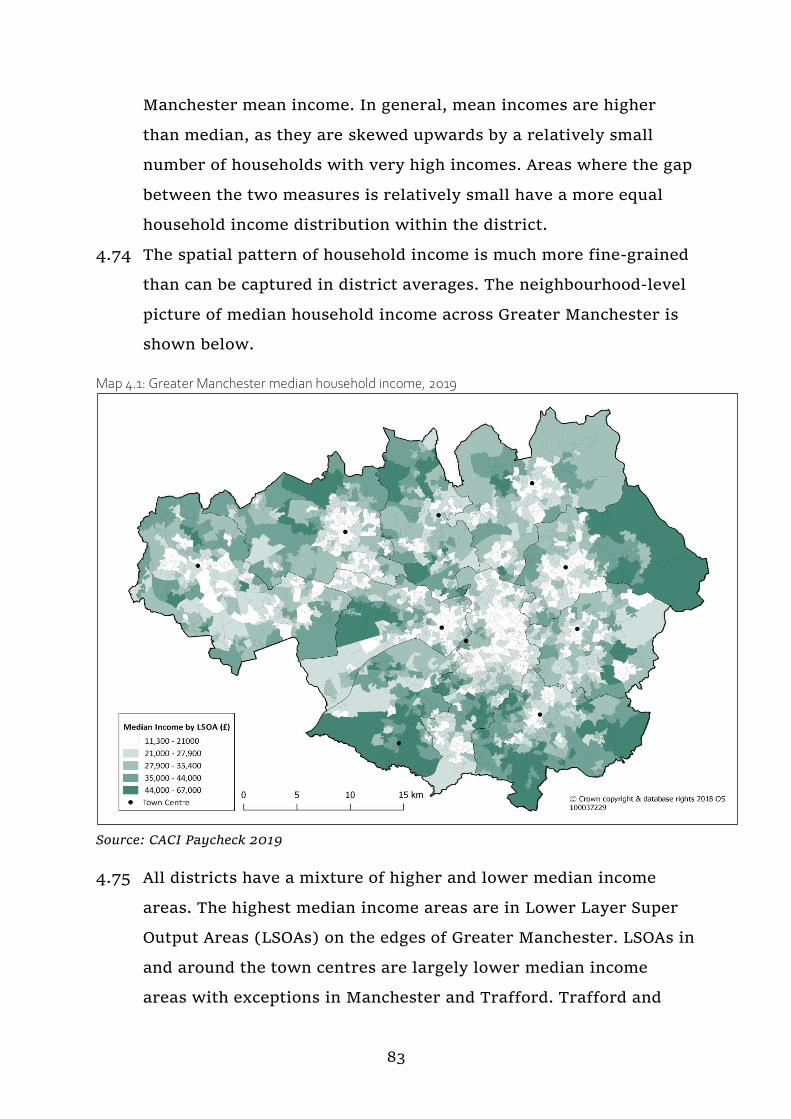
83
Manchester mean income. In general, mean incomes are higher
than median, as they are skewed upwards by a relatively small
number of households with very high incomes. Areas where the gap
between the two measures is relatively small have a more equal
household income distribution within the district.
4.74 The spatial pattern of household income is much more fine-grained
than can be captured in district averages. The neighbourhood-level
picture of median household income across Greater Manchester is
shown below.
Map 4.1: Greater Manchester median household income, 2019
Source: CACI Paycheck 2019
4.75 All districts have a mixture of higher and lower median income
areas. The highest median income areas are in Lower Layer Super
Output Areas (LSOAs) on the edges of Greater Manchester. LSOAs in
and around the town centres are largely lower median income
areas with exceptions in Manchester and Trafford. Trafford and
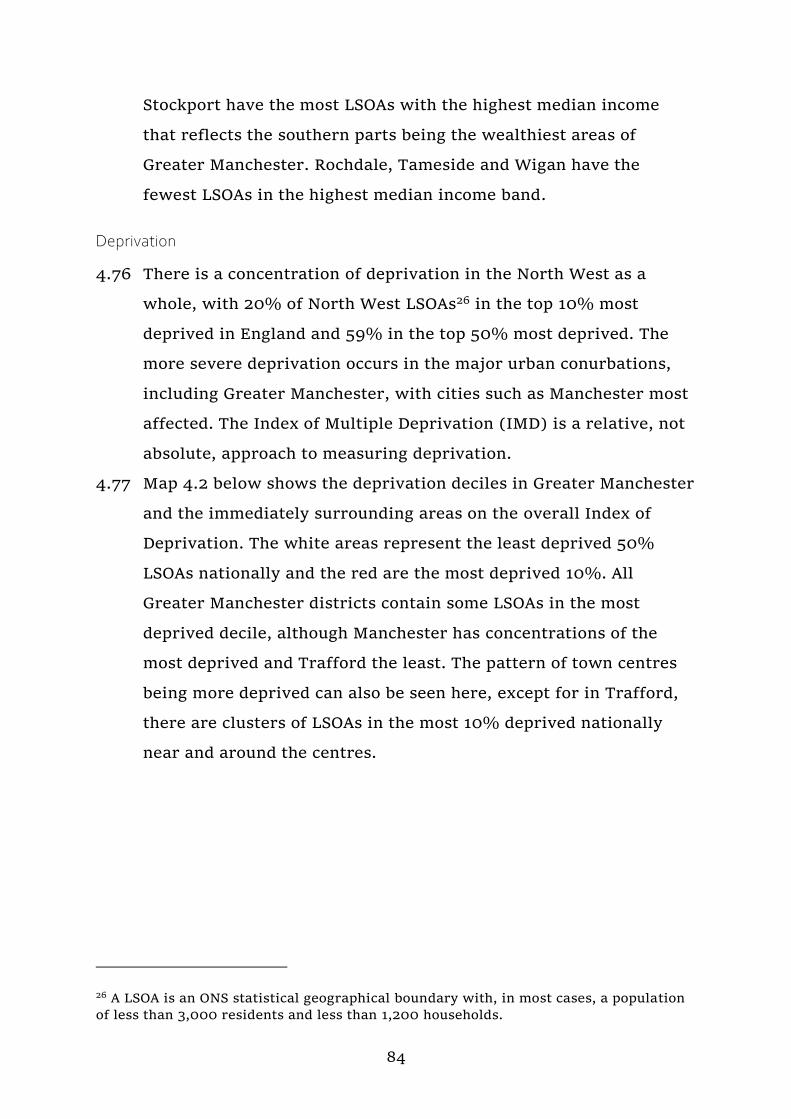
84
Stockport have the most LSOAs with the highest median income
that reflects the southern parts being the wealthiest areas of
Greater Manchester. Rochdale, Tameside and Wigan have the
fewest LSOAs in the highest median income band.
Deprivation
4.76 There is a concentration of deprivation in the North West as a
whole, with 20% of North West LSOAs26 in the top 10% most
deprived in England and 59% in the top 50% most deprived. The
more severe deprivation occurs in the major urban conurbations,
including Greater Manchester, with cities such as Manchester most
affected. The Index of Multiple Deprivation (IMD) is a relative, not
absolute, approach to measuring deprivation.
4.77 Map 4.2 below shows the deprivation deciles in Greater Manchester
and the immediately surrounding areas on the overall Index of
Deprivation. The white areas represent the least deprived 50%
LSOAs nationally and the red are the most deprived 10%. All
Greater Manchester districts contain some LSOAs in the most
deprived decile, although Manchester has concentrations of the
most deprived and Trafford the least. The pattern of town centres
being more deprived can also be seen here, except for in Trafford,
there are clusters of LSOAs in the most 10% deprived nationally
near and around the centres.
26 A LSOA is an ONS statistical geographical boundary with, in most cases, a population
of less than 3,000 residents and less than 1,200 households.
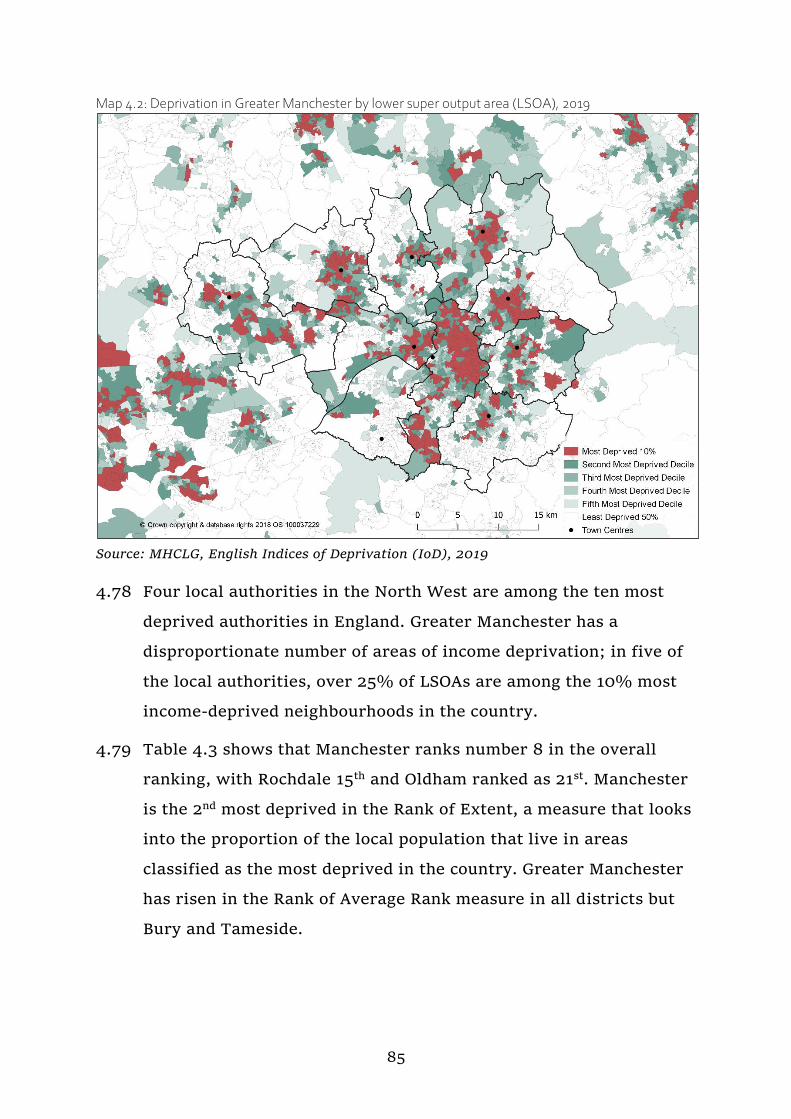
85
Map 4.2: Deprivation in Greater Manchester by lower super output area (LSOA), 2019
Source: MHCLG, English Indices of Deprivation (IoD), 2019
4.78 Four local authorities in the North West are among the ten most
deprived authorities in England. Greater Manchester has a
disproportionate number of areas of income deprivation; in five of
the local authorities, over 25% of LSOAs are among the 10% most
income-deprived neighbourhoods in the country.
4.79 Table 4.3 shows that Manchester ranks number 8 in the overall
ranking, with Rochdale 15th and Oldham ranked as 21st. Manchester
is the 2nd most deprived in the Rank of Extent, a measure that looks
into the proportion of the local population that live in areas
classified as the most deprived in the country. Greater Manchester
has risen in the Rank of Average Rank measure in all districts but
Bury and Tameside.
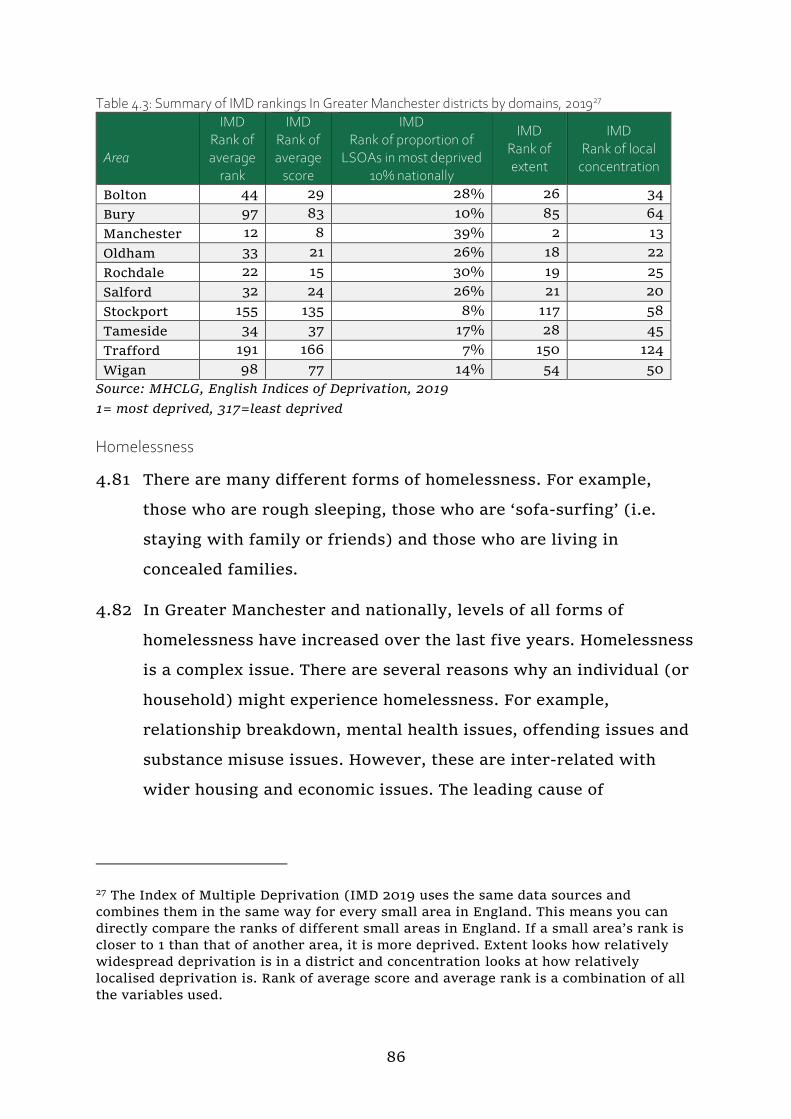
86
Table 4.3: Summary of IMD rankings In Greater Manchester districts by domains, 201927
Area
IMD Rank of average
rank
IMD Rank of average
score
IMD Rank of proportion of
LSOAs in most deprived 10% nationally
IMD Rank of extent
IMD Rank of local
concentration
Bolton 44 29 28% 26 34
Bury 97 83 10% 85 64
Manchester 12 8 39% 2 13
Oldham 33 21 26% 18 22
Rochdale 22 15 30% 19 25
Salford 32 24 26% 21 20
Stockport 155 135 8% 117 58
Tameside 34 37 17% 28 45
Trafford 191 166 7% 150 124
Wigan 98 77 14% 54 50
Source: MHCLG, English Indices of Deprivation, 2019
1= most deprived, 317=least deprived
Homelessness
4.81 There are many different forms of homelessness. For example,
those who are rough sleeping, those who are ‘sofa-surfing’ (i.e.
staying with family or friends) and those who are living in
concealed families.
4.82 In Greater Manchester and nationally, levels of all forms of
homelessness have increased over the last five years. Homelessness
is a complex issue. There are several reasons why an individual (or
household) might experience homelessness. For example,
relationship breakdown, mental health issues, offending issues and
substance misuse issues. However, these are inter-related with
wider housing and economic issues. The leading cause of
27 The Index of Multiple Deprivation (IMD 2019 uses the same data sources and
combines them in the same way for every small area in England. This means you can
directly compare the ranks of different small areas in England. If a small area’s rank is
closer to 1 than that of another area, it is more deprived. Extent looks how relatively
widespread deprivation is in a district and concentration looks at how relatively
localised deprivation is. Rank of average score and average rank is a combination of all
the variables used.
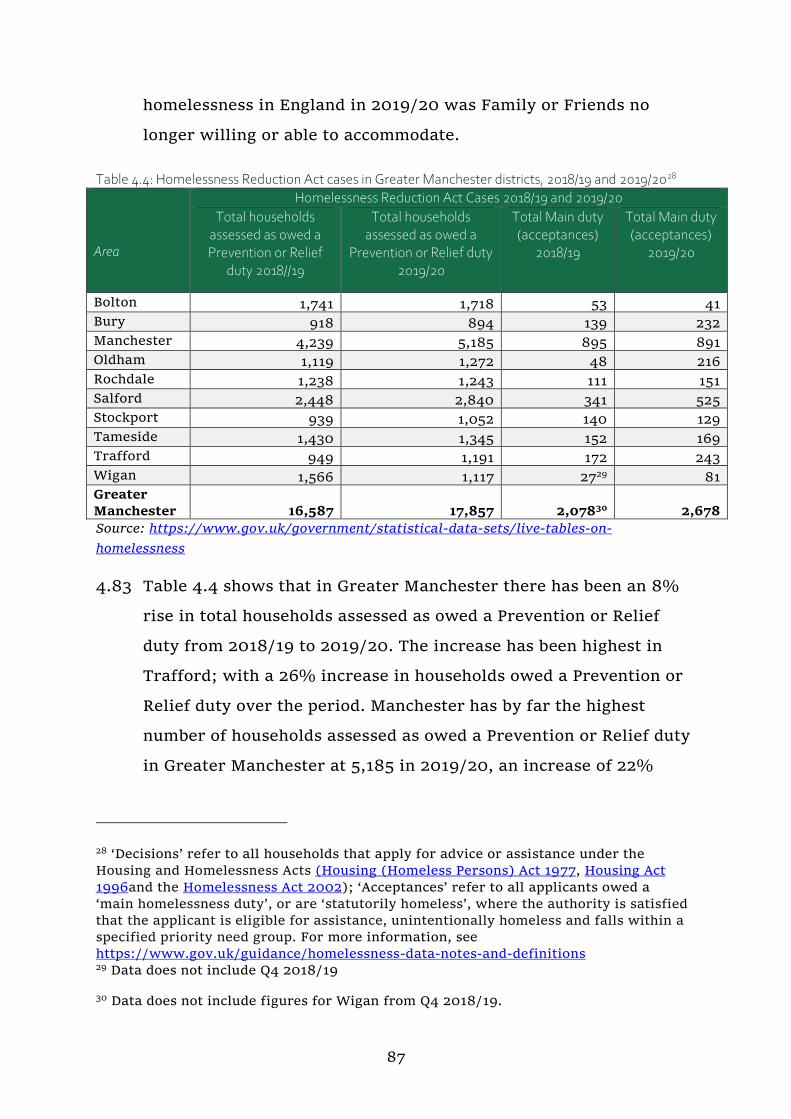
87
homelessness in England in 2019/20 was Family or Friends no
longer willing or able to accommodate.
Table 4.4: Homelessness Reduction Act cases in Greater Manchester districts, 2018/19 and 2019/2028
Area
Homelessness Reduction Act Cases 2018/19 and 2019/20
Total households assessed as owed a Prevention or Relief
duty 2018//19
Total households assessed as owed a
Prevention or Relief duty 2019/20
Total Main duty (acceptances)
2018/19
Total Main duty (acceptances)
2019/20
Bolton 1,741 1,718 53 41
Bury 918 894 139 232
Manchester 4,239 5,185 895 891
Oldham 1,119 1,272 48 216
Rochdale 1,238 1,243 111 151
Salford 2,448 2,840 341 525
Stockport 939 1,052 140 129
Tameside 1,430 1,345 152 169
Trafford 949 1,191 172 243
Wigan 1,566 1,117 2729 81
Greater
Manchester 16,587 17,857 2,07830 2,678
Source: https://www.gov.uk/government/statistical-data-sets/live-tables-on-
homelessness
4.83 Table 4.4 shows that in Greater Manchester there has been an 8%
rise in total households assessed as owed a Prevention or Relief
duty from 2018/19 to 2019/20. The increase has been highest in
Trafford; with a 26% increase in households owed a Prevention or
Relief duty over the period. Manchester has by far the highest
number of households assessed as owed a Prevention or Relief duty
in Greater Manchester at 5,185 in 2019/20, an increase of 22%
28 ‘Decisions’ refer to all households that apply for advice or assistance under the
Housing and Homelessness Acts (Housing (Homeless Persons) Act 1977, Housing Act
1996and the Homelessness Act 2002); ‘Acceptances’ refer to all applicants owed a
‘main homelessness duty’, or are ‘statutorily homeless’, where the authority is satisfied
that the applicant is eligible for assistance, unintentionally homeless and falls within a
specified priority need group. For more information, see
https://www.gov.uk/guidance/homelessness-data-notes-and-definitions 29 Data does not include Q4 2018/19
30 Data does not include figures for Wigan from Q4 2018/19.

88
from 22018/19. There has been an 8% increase in households owed
a Prevention or Relief duty by local authorities in Greater
Manchester over the past two years, indicating that the number of
people who are homeless or at threatened with homelessness
within 56 days in the conurbation has increased. For those owed a
Main Duty (acceptances), Greater Manchester has seen a 29% rise
from 2018/19 to 2019/20. The increase has been the highest in
Oldham; with a 350% increase in households owed a Main Duty
(acceptance).
Homelessness Prevention and Relief
4.84 Following the introduction of the Homelessness Reduction Act 2017
and its implementation in April 2018, all households who approach
the local authority and are homeless or threatened with
homelessness, eligible for assistance are entitled to receive
meaningful support and assistance.
4.85 The Prevention and Relief duties see the household being helped by
the local authority to prevent them becoming homeless, or by
finding them alternative accommodation and relieving
homelessness.
Table 4.5: Homelessness Prevention and Relief, 2018/19 and 2019/20
Area
Total owed a Prevention
Duty 18/19
Total owed a Prevention Duty 19/20
Total owed a Prevention
Duty % change
Total owed a Relief
Duty 18/19
Total owed a Relief
Duty 19/20
Total owed a Relief Duty %
change
Bolton 697 724 4% 1,044 994 -5%
Bury 315 152 -52% 603 742 23%
Manchester 1,417 2,286 61% 2,822 2,899 3%
Oldham 571 683 20% 548 589 7%
Rochdale 597 586 -2% 641 657 2%
Salford 549 720 31% 1,899 2,120 12%
Stockport 542 576 6% 397 476 20%
Tameside 770 684 -11% 660 661 0%
Trafford 575 665 16% 374 526 41%

89
Wigan 882 444 -50% 684 673 -2%
Greater
Manchester 6,915 7,520 9% 9,672 10,337 7%
Source: https://www.gov.uk/government/statistical-data-sets/live-tables-on-
homelessness
4.86 The table above shows that in 2018/19 Greater Manchester Local
Authorities assessed 16,587 cases as being owed either a Prevention
or Relief Duty. Of these around 58% were owed Relief Duty. This
remained broadly constant in 2019/20.
Rough Sleeping
4.87 Rough sleeping has increased significantly in Greater Manchester
since 2010, with Manchester experiencing the highest levels of
rough sleeping.
Figure 4.28: Rough sleeping in Greater Manchester, districts 2010-2019
Source: MHCLG Rough sleeping statistics England autumn 2019 Table 1: Street counts and
estimates of rough sleeping in England, autumn 2010 – 2019
4.88 The chart above shows that the number of people sleeping rough in
Greater Manchester increased from 41 in 2010 to a high of 268 in
2017, an increase of 554% but has sharply decreased since to 151
for 2019, a 44% decrease after consecutive years in the reduction
0
25
50
75
100
125
150
175
200
225
250
275
2010 2011 2012 2013 2014 2015 2016 2017 2018 2019
Bolton Bury Manchester* Oldham
Rochdale Salford* Stockport Tameside*
Trafford Wigan* Greater Manchester
90
of people rough sleeping. Manchester has seen both the highest
number of rough sleepers and the largest increase in numbers, from
seven in 2010 to 123 in 2018, an increase of 1,657% - but it saw a
26% reduction for 2019 to 91. Rough sleeper data are based on
estimates and counts of rough sleepers on one night and as such is
not seen as a very robust data source. It is likely that the number of
rough sleepers in Greater Manchester and particularly in
Manchester is higher than the totals presented here.
4.4 Dwelling stock profile
Profile of current dwellings
Type and size of dwellings
4.89 In September 2019, just over 1.22 million dwellings were recorded
in Greater Manchester for Council Tax purposes. Of these, the
largest proportion are terraced houses (accounting for just over
400,000 dwellings), closely followed by semi-detached houses (just
over 365,000).

91
Figure 4.29: Total dwellings by type, 2019
Source: Valuation Office Agency, Table CTSOP3.0: Number of properties by Council Tax
band, property type and region, county and local authority district, 2019.
4.90 Figure 4.29 shows that Greater Manchester’s dwelling composition
differs from the national and regional picture, with higher
proportions of terraced and semi-detached housing and lower
proportions of bungalows, flats and detached housing.
4.91 Tameside, Bolton, Manchester, Rochdale and Oldham have higher
levels of terraced housing than the Greater Manchester average,
and Stockport and Trafford have considerably lower levels. The
latter districts have larger proportions of detached housing than
the Greater Manchester average, as do Bolton, Bury, Rochdale and
Wigan. Manchester has only 2.7% detached housing. Manchester
and Salford both have significantly higher proportions of flats than
the Greater Manchester, regional and national averages; in
Manchester, flats are the most prevalent property type. This is
likely to be a reflection of the past tower block social housing
construction, the relatively new city centre apartment market and
0%
10%
20%
30%
40%
50%
60%
70%
80%
90%
100%
Bo
lto
n
Bu
ry
Man
ches
ter
Old
ham
Ro
chd
ale
Salf
ord
Sto
ckp
ort
Tam
esid
e
Traf
ford
Wig
an
Gre
ater
Man
ches
ter
No
rth
Wes
t
Engl
and
& W
ales
Bungalow Flat/Maisonette House: Terraced House: Semi Detached House: Detached Annexe/Other/Unknown

92
the number of large houses split into flats to cater for students and
young professionals as well as housing with multiple occupation
(HMO) in light of the bedroom tax.
Figure 4.30: Total dwellings by number of bedrooms, 2019
Source: Valuation Office Agency, Table CTSOP3.0: Number of properties by Council Tax
band, property type and region, county and local authority district, 2019.
4.92 Figure 4.30 shows that Greater Manchester has a higher proportion
of one-bedroomed dwellings than the North West as a whole, but a
slightly lower proportion than England & Wales.
4.93 Greater Manchester has a larger proportion of two bedroomed
dwellings than the North West and nationally. Three bedroomed
dwellings are in line with the national average but slightly lower
than the North West, and Greater Manchester has a lower
proportion of dwellings with four or more bedrooms than both the
regional and national averages.
4.94 Manchester has the highest proportion of one bedroomed dwellings
at 17% and Salford has a larger proportion than the national
average (13%). Bolton’s proportion of one-bedroom properties is
0%
10%
20%
30%
40%
50%
60%
70%
80%
90%
100%
Bo
lto
n
Bu
ry
Man
ches
ter
Old
ham
Ro
chd
ale
Salf
ord
Sto
ckp
ort
Tam
esid
e
Traf
ford
Wig
an
Gre
ater
Man
ches
ter
No
rth
Wes
t
Engl
and
& W
ales
1 Bedroom 2 Bedroom 3 Bedroom 4 Bedrooms or More Unknown

93
nearly half the national average, but it has far more three-bedroom
properties than other Greater Manchester districts, regional and
national averages.
4.95 Half of the districts have similar proportions of four bedroom or
more houses as the Greater Manchester (12%), regional (11%) and
England & Wales (14%) averages - Bolton, Manchester, Salford,
Tameside and Wigan are those that differ with under 10%.
Tenure of housing
4.96 Figure 4.31 shows that overall, Greater Manchester is largely in line
with the national average in terms of tenure, with a slightly higher
proportion of social rented (21% as opposed to 17%) and slightly
lower proportion of people that own their property outright (27%
as opposed to 31%), with overall homeownership at 60%.
Figure 4.31: Tenure type by district, Greater Manchester, North West and England & Wales, 2011
Source: 2011 Census
4.97 The above chart shows that Manchester and, to a lesser extent,
Salford present a different tenure structure to the rest of Greater

94
Manchester, with both having lower proportions of owner-
occupation (38% and 50% respectively). In Manchester, this is due
to far larger proportions of households living in both social
housing, which accounts for almost 32% of stock, and private
rented accommodation. This tenure represents 30% of stock in
Manchester, as opposed to the 18% seen nationally. Salford also
has above average levels of social renting (29%) and private
renting (20%) compared to both Greater Manchester and England &
Wales as a whole.
Map 4.3: Spatial distribution of owner-occupation in Greater Manchester, 2011
Source: 2011 Census
4.98 Map 4.3 shows that levels of owner-occupation are low in the
regional centre, towards south Manchester and in the town centres
in Greater Manchester (notably Bolton, Oldham and Rochdale). In
contrast, the outer areas of the conurbation see higher levels of
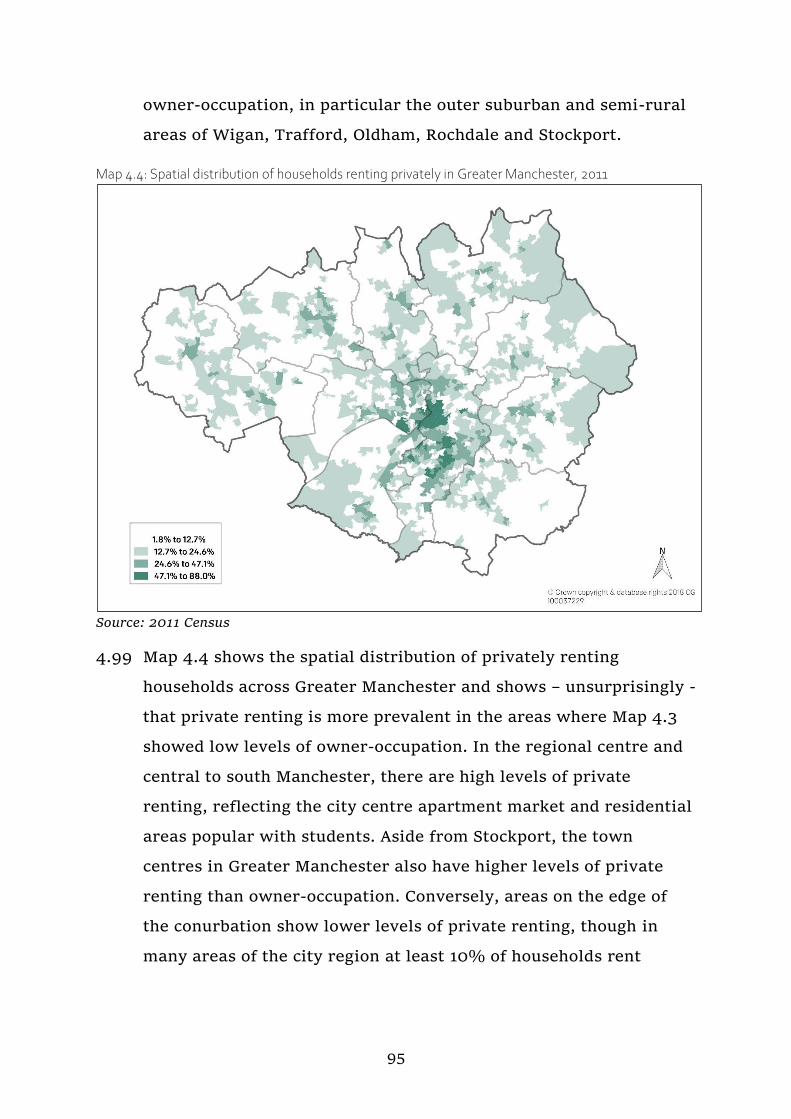
95
owner-occupation, in particular the outer suburban and semi-rural
areas of Wigan, Trafford, Oldham, Rochdale and Stockport.
Map 4.4: Spatial distribution of households renting privately in Greater Manchester, 2011
Source: 2011 Census
4.99 Map 4.4 shows the spatial distribution of privately renting
households across Greater Manchester and shows – unsurprisingly -
that private renting is more prevalent in the areas where Map 4.3
showed low levels of owner-occupation. In the regional centre and
central to south Manchester, there are high levels of private
renting, reflecting the city centre apartment market and residential
areas popular with students. Aside from Stockport, the town
centres in Greater Manchester also have higher levels of private
renting than owner-occupation. Conversely, areas on the edge of
the conurbation show lower levels of private renting, though in
many areas of the city region at least 10% of households rent
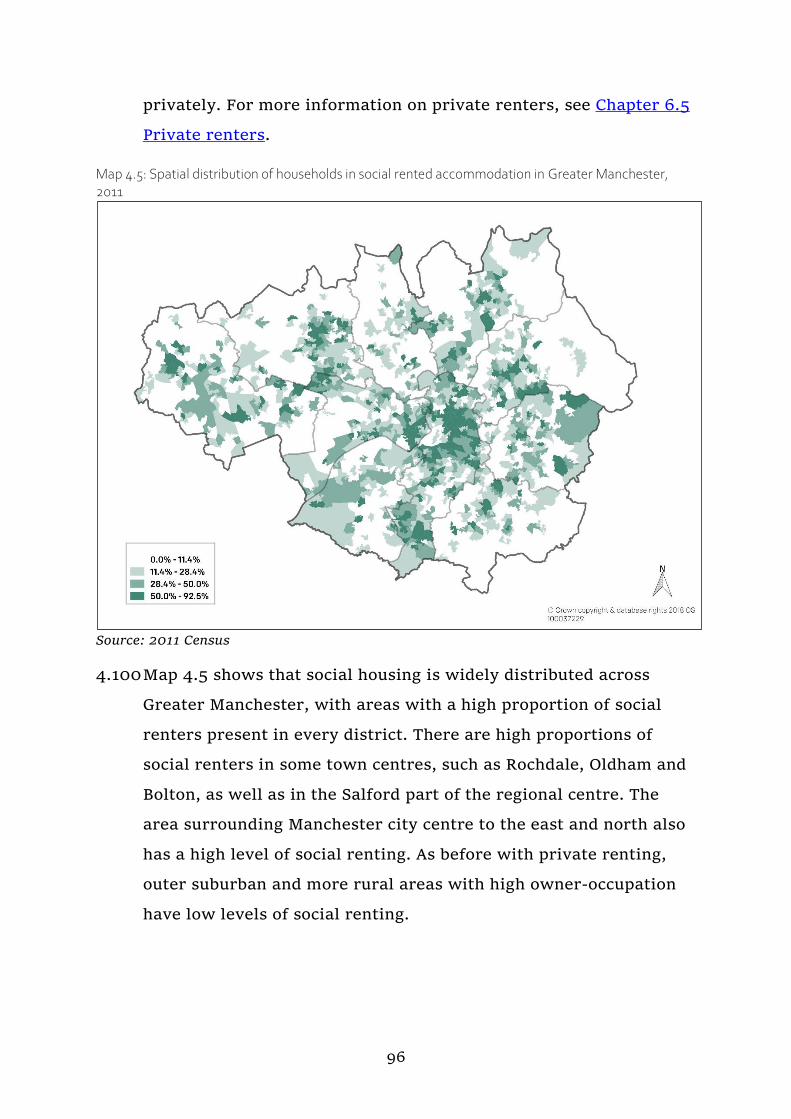
96
privately. For more information on private renters, see Chapter 6.5
Private renters.
Map 4.5: Spatial distribution of households in social rented accommodation in Greater Manchester, 2011
Source: 2011 Census
4.100 Map 4.5 shows that social housing is widely distributed across
Greater Manchester, with areas with a high proportion of social
renters present in every district. There are high proportions of
social renters in some town centres, such as Rochdale, Oldham and
Bolton, as well as in the Salford part of the regional centre. The
area surrounding Manchester city centre to the east and north also
has a high level of social renting. As before with private renting,
outer suburban and more rural areas with high owner-occupation
have low levels of social renting.
97
Overcrowding, under-occupation and concealed households
Overcrowding and under-occupation
4.101 To determine levels of overcrowding and under-occupancy, the
Census uses the ages of the household members and their
relationships to each other to derive the number of bedrooms they
require, based on a standard formula. The number of bedrooms
required is subtracted from the number of bedrooms in the
household's accommodation to obtain the occupancy rating.
4.102 Using this occupancy-based measure of overcrowding, 4.7% of
Greater Manchester households lived in overcrowded
accommodation in 2011, compared to 4.6% nationally. Over 67% of
households in Greater Manchester under-occupy homes against this
measure and is relatively similar to that seen across England as a
whole (69%). Within Greater Manchester, the highest proportions
of overcrowded households are in Manchester, Oldham and
Rochdale, with low levels observed in Wigan, Stockport, Trafford
and Bury. Levels of overcrowding and under-occupancy as a
proportion of total households across Greater Manchester are
shown in Figure 4.32 below.

98
Figure 4.32: Level of occupancy (bedrooms), 2011
Source: 2011 Census
4.103 Manchester has the lowest levels of under-occupancy across the
districts at 57% and above Greater Manchester and national
average levels of both homes occupied to the expected standard and
overcrowded homes (8% of homes). In addition, Oldham, Rochdale
and Salford have lower levels of under-occupancy than the Greater
Manchester and national average, with Oldham and Rochdale in
particular experiencing higher levels of overcrowding at 7% and
6% respectively. Wigan and Stockport have notably low levels of
overcrowding, with overcrowded households accounting for less
than 3% of households in both districts.
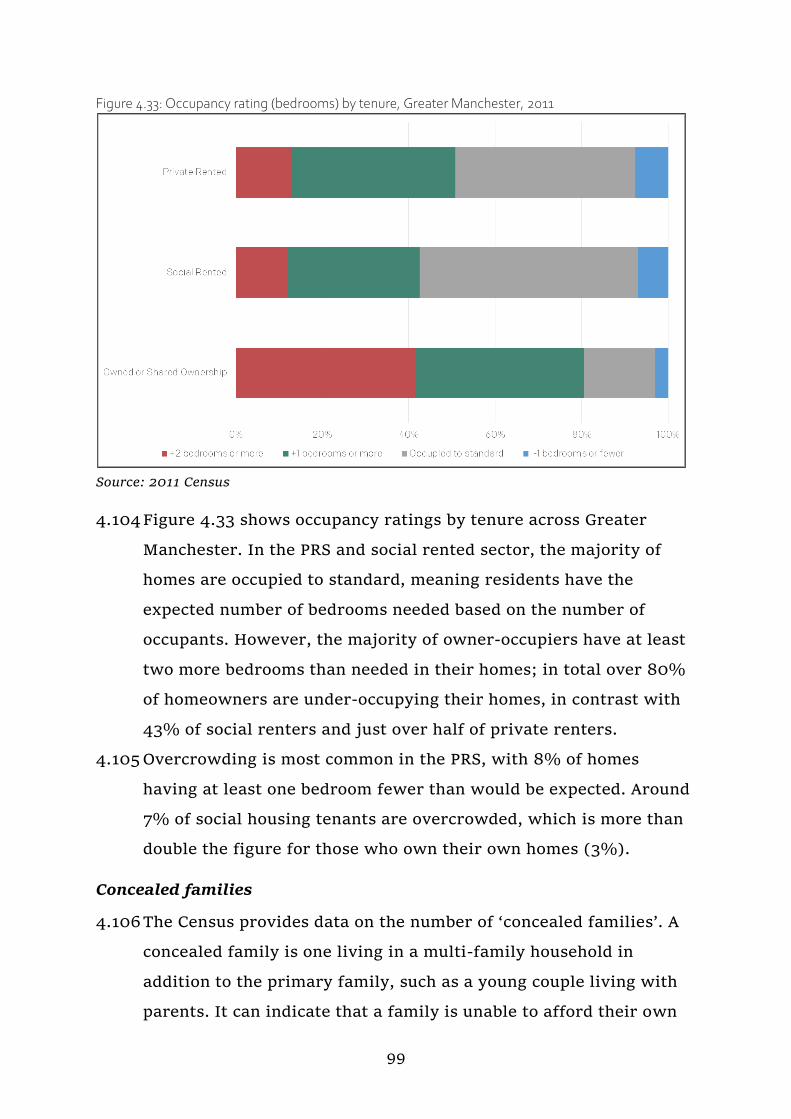
99
Figure 4.33: Occupancy rating (bedrooms) by tenure, Greater Manchester, 2011
Source: 2011 Census
4.104 Figure 4.33 shows occupancy ratings by tenure across Greater
Manchester. In the PRS and social rented sector, the majority of
homes are occupied to standard, meaning residents have the
expected number of bedrooms needed based on the number of
occupants. However, the majority of owner-occupiers have at least
two more bedrooms than needed in their homes; in total over 80%
of homeowners are under-occupying their homes, in contrast with
43% of social renters and just over half of private renters.
4.105 Overcrowding is most common in the PRS, with 8% of homes
having at least one bedroom fewer than would be expected. Around
7% of social housing tenants are overcrowded, which is more than
double the figure for those who own their own homes (3%).
Concealed families
4.106 The Census provides data on the number of ‘concealed families’. A
concealed family is one living in a multi-family household in
addition to the primary family, such as a young couple living with
parents. It can indicate that a family is unable to afford their own

100
accommodation and/or may suggest overcrowding. A single person
is not considered a concealed family and so one elderly parent
living with their adult child and family, or an adult child returning
to the parental home, is not counted as a concealed family. Because
of these definitions, the data presented here reflects families rather
than households.
Figure 4.34: Proportion of concealed families by Greater Manchester district, 2011
Source: 2011 Census
4.107 There were around 13,000 concealed families recorded at the 2011
Census, representing almost 2% of families in Greater Manchester,
which is in line with the rate for England but slightly above the
average for the North West. Manchester has the highest absolute
number of concealed families. The highest proportion of concealed
families is in Oldham, followed by Manchester, Rochdale and
Bolton, which all have rates above the national average. Wigan and
Salford show the lowest rates of concealed families, with less than
1.5% of households in each district classed as concealed
households.

101
4.108 In Chapter 5, there is further information on occupancy ratings and
concealed households.
Council Tax bands
4.109 The VOA sets Council Tax bands based on the value of properties in
1991. In Greater Manchester, over 80% of properties are in Council
Tax band C or below, which covers properties valued at £68,000 or
less in 1991. Annual charges for bandings vary between districts;
the average Greater Manchester resident living in a band C
property would pay around £1,430 per year in Council Tax. This
increases to around £3,000 for those in band H, which account for
only 0.2% of dwellings in Greater Manchester.
Figure 4.35: Proportion of housing stock in each Council Tax band, 2019
Source: Valuation Office Agency, Table CTSOP3.0: Number of properties by Council Tax
band, property type and region, county and local authority district, 2019.
4.110 Figure 4.35 shows that Greater Manchester has a higher proportion
of band A properties than the North West and nearly double the
0%
10%
20%
30%
40%
50%
60%
70%
80%
90%
100%
Bo
lto
n
Bu
ry
Man
ches
ter
Old
ham
Ro
chd
ale
Salf
ord
Sto
ckp
ort
Tam
esid
e
Traf
ford
Wig
an
Gre
ater
Man
ches
ter
No
rth
Wes
t
Engl
and
& W
ales
A B C D E F G H

102
rate for England & Wales. Band B properties are largely in line with
the North West and England & Wales averages; the proportion of
properties in band C is in line with the North West average but
below the England & Wales average. Greater Manchester has
slightly lower proportions of properties in the remaining bands
than the North West average, and both Greater Manchester and the
North West have significantly lower proportions of these properties
than the national average.
4.111 Trafford and Stockport have the lowest proportions of band A stock,
reflecting the larger share of higher value properties in these
districts. These districts, alongside Bury and Wigan are the only
ones not to have over half of properties in band A. In the North
West, 41% of stock is band A, and 24% for England & Wales.
Stockport is in line with national averages in all tax bands.
Manchester has the largest proportion of its housing in band A at
58%, followed by Rochdale at 54%. There is less variation between
districts in terms of band B properties. In band C, Trafford (27%)
has nearly double the proportion of houses that Manchester does
(14%). Apart from Trafford and Stockport, and Bury to a lesser
extent, the remaining districts have similar proportions to each
other in bands D-H.
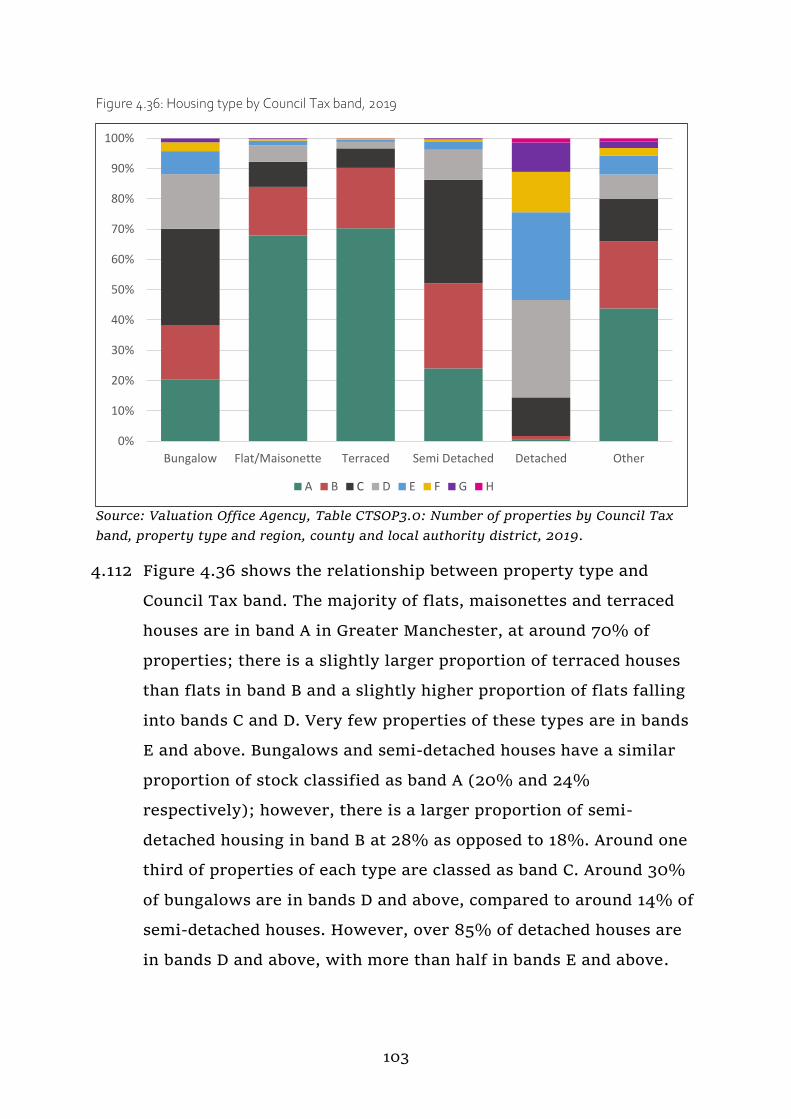
103
Figure 4.36: Housing type by Council Tax band, 2019
Source: Valuation Office Agency, Table CTSOP3.0: Number of properties by Council Tax
band, property type and region, county and local authority district, 2019.
4.112 Figure 4.36 shows the relationship between property type and
Council Tax band. The majority of flats, maisonettes and terraced
houses are in band A in Greater Manchester, at around 70% of
properties; there is a slightly larger proportion of terraced houses
than flats in band B and a slightly higher proportion of flats falling
into bands C and D. Very few properties of these types are in bands
E and above. Bungalows and semi-detached houses have a similar
proportion of stock classified as band A (20% and 24%
respectively); however, there is a larger proportion of semi-
detached housing in band B at 28% as opposed to 18%. Around one
third of properties of each type are classed as band C. Around 30%
of bungalows are in bands D and above, compared to around 14% of
semi-detached houses. However, over 85% of detached houses are
in bands D and above, with more than half in bands E and above.
0%
10%
20%
30%
40%
50%
60%
70%
80%
90%
100%
Bungalow Flat/Maisonette Terraced Semi Detached Detached Other
A B C D E F G H

104
Energy Performance Certificate ratings
4.113 An Energy Performance Certificate (EPC) is required for properties
when constructed, sold or let. This is one of a range of measures
that could provide a proxy for ‘decent’ homes. Data is available for
properties built, let or sold from 2008 onwards via MHCLG’s
Energy Performance of Buildings Data England and Wales.
4.114 As from 1 April 2018, there will be a requirement for any properties
rented out in the PRS to have a minimum energy performance
rating of E on an EPC. Any property with a rating of F or G would
therefore not meet Government’s minimum standards and could be
assumed to be non-decent.
4.115 There are however limitations with EPC data:
The data is drawn from EPCs issued for domestic buildings only
constructed, sold or let since 2008;
Properties that have not been built, sold or let since 2008 are
not captured, so may disproportionately exclude older owner-
occupied households (although unlikely to have a large
implication for using EPC as a Decent Homes measure in the
PRS); and
‘Tenure’ is not directly captured in the dataset, although
Transaction Type of rental and rental (private) has been
assumed to cover PRS lets (highlighted in the table below).
4.116 Table 4.6 provides EPC data for Greater Manchester districts and
shows the number of domestic properties meeting rating standards.
Across Greater Manchester, 95% of domestic dwellings were above
Government’s minimum advised rating of E in 2017, however this
dropped to 89% in the 2018 data. However, the proportion of
properties with a rating of B and above more than doubled from 7%
in 2017 to 15.7% in 2018.

105
Table 4.6: Greater Manchester domestic property EPC ratings - all transactions, 2018
Area
EPC rating
A B C D E F G
Bolton 0.1% 9.7% 33.4% 44.4% 9.5% 2.4% 0.6%
Bury 0.0% 11.4% 30.0% 45.5% 11.0% 1.5% 0.6%
Manchester 0.0% 13.9% 41.3% 35.3% 8.1% 1.0% 0.4%
Oldham 0.0% 12.1% 33.7% 39.4% 12.6% 1.7% 0.6%
Rochdale 0.0% 17.8% 30.8% 40.1% 9.0% 1.5% 0.9%
Salford 0.0% 24.2% 41.5% 27.8% 5.2% 1.1% 0.2%
Stockport 0.1% 14.6% 24.9% 45.7% 11.7% 2.5% 0.6%
Tameside 0.1% 11.7% 33.8% 42.4% 9.9% 1.5% 0.7%
Trafford 0.0% 8.6% 33.5% 41.2% 13.9% 2.1% 0.7%
Wigan 0.3% 23.6% 24.3% 39.4% 10.3% 1.6% 0.5%
Greater
Manchester 0.1% 15.6% 34.5% 38.4% 9.4% 1.5% 0.5%
Source: MHCLG, Energy Performance of Buildings Data England & Wales, 2018.
4.5 Migration characteristics
4.117 The use of migration data to determine the Greater Manchester
market area was discussed in Chapter 3.1 Household Migration.
This section looks in a little more detail at the characteristics of the
migrating households between areas of England & Wales in terms
of composition and age.
Household Composition
4.118 Table 4.7 below shows that in the 12 months before the Census was
taken, 30,200 households flowed into Greater Manchester and
26,432 flowed out (from both the rest of the UK and outside the
UK) – a net figure of 3,768 households moving in to Greater
Manchester. Of this household flow, 52.5% were one-person
households and 40.4% were one family households. In percentage
terms, 45.6% of outflows were families and 50.7% were one-
person households. The North West shows similar patterns to
Greater Manchester but there were slightly more in flows of one-
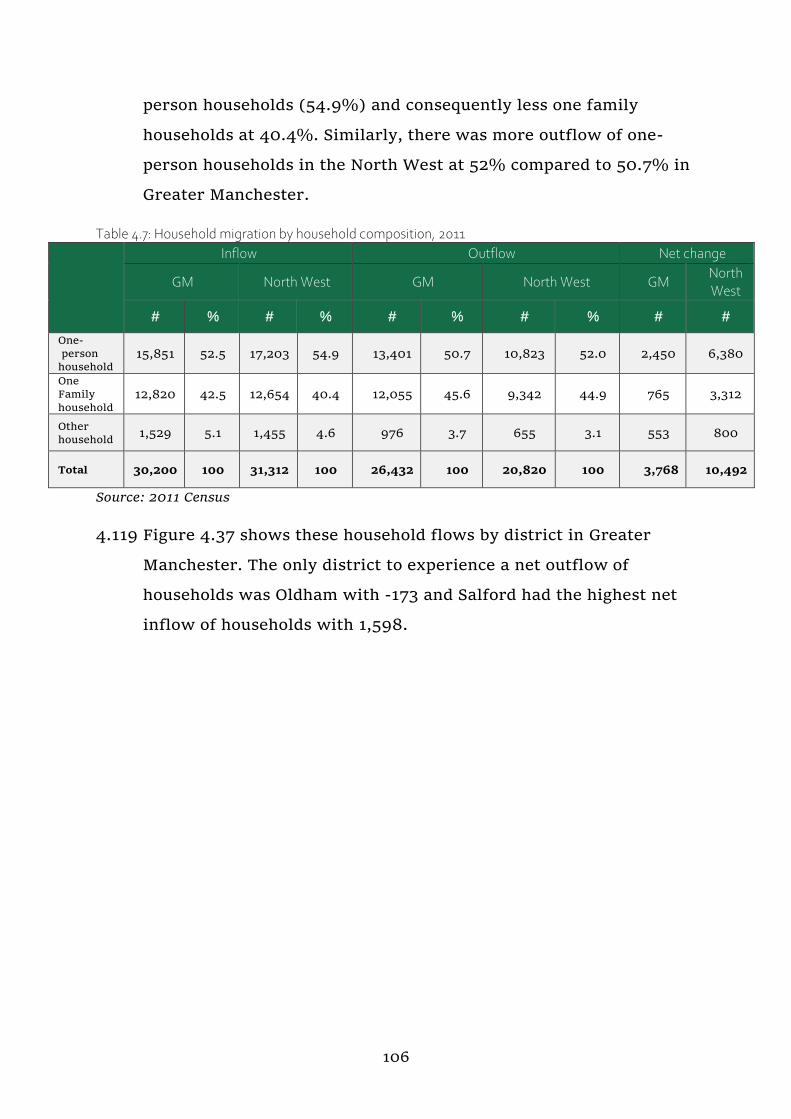
106
person households (54.9%) and consequently less one family
households at 40.4%. Similarly, there was more outflow of one-
person households in the North West at 52% compared to 50.7% in
Greater Manchester.
Table 4.7: Household migration by household composition, 2011
Inflow Outflow Net change
GM North West GM North West GM North West
# % # % # % # % # #
One- person household
15,851 52.5 17,203 54.9 13,401 50.7 10,823 52.0 2,450 6,380
One Family
household 12,820 42.5 12,654 40.4 12,055 45.6 9,342 44.9 765 3,312
Other household
1,529 5.1 1,455 4.6 976 3.7 655 3.1 553 800
Total 30,200 100 31,312 100 26,432 100 20,820 100 3,768 10,492
Source: 2011 Census
4.119 Figure 4.37 shows these household flows by district in Greater
Manchester. The only district to experience a net outflow of
households was Oldham with -173 and Salford had the highest net
inflow of households with 1,598.

107
Figure 4.37: Household migration by Greater Manchester districts, 2011
Source: 2011 Census
Age
4.120 Table 4.8 below shows the inflow and outflow of households by age
group (by age of the head of household or household reference
person [HRF]) for Greater Manchester and the North West. In
Greater Manchester, most incoming households were aged between
26 and 49 (68.3%), 16.8% were aged over 50 and 14.9% were aged
under 24. The North West region had a slightly higher percentage
of HRFs aged under 24 flowing into the area and a significantly
higher percentage of HRF inflows over 50 at 23.8%.
Table 4.8: Household migration by age, 2011
Area
Inflow Outflow Net
Greater Manchester
North West
Greater Manchester
North West
Greater Manchest
er
North West
# % # % # % # % # #
Under 24 4,494 14.9 4,956 15.8 3,592 13.6 2,687 12.9 902 2,269
Aged 25 to
49 20,622 68.3 18,89
7 60.4 17,499 66.2 11,847 56.9 3,123 7,050
Aged 50+ 5,084 16.8 7,459 23.8 5,341 20.2 6,286 30.2 -257 1,173
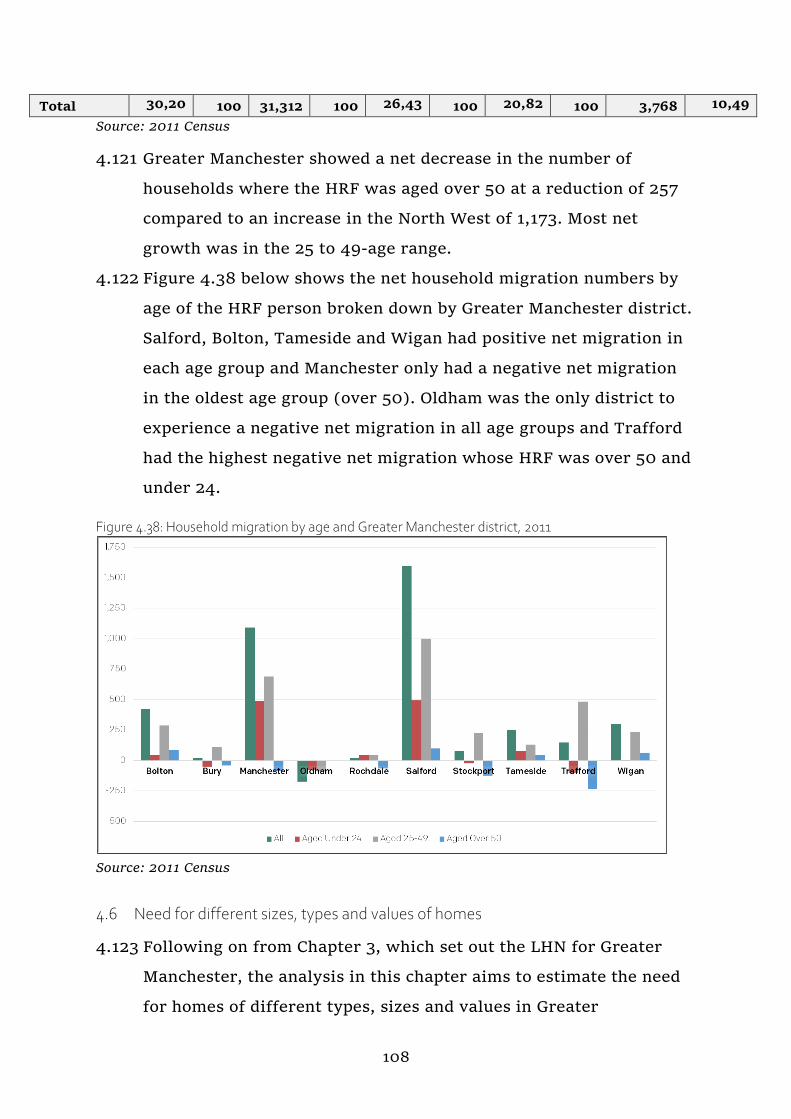
108
Total 30,20
0 100 31,312 100 26,43
2 100 20,82
0 100 3,768 10,49
2 Source: 2011 Census
4.121 Greater Manchester showed a net decrease in the number of
households where the HRF was aged over 50 at a reduction of 257
compared to an increase in the North West of 1,173. Most net
growth was in the 25 to 49-age range.
4.122 Figure 4.38 below shows the net household migration numbers by
age of the HRF person broken down by Greater Manchester district.
Salford, Bolton, Tameside and Wigan had positive net migration in
each age group and Manchester only had a negative net migration
in the oldest age group (over 50). Oldham was the only district to
experience a negative net migration in all age groups and Trafford
had the highest negative net migration whose HRF was over 50 and
under 24.
Figure 4.38: Household migration by age and Greater Manchester district, 2011
Source: 2011 Census
4.6 Need for different sizes, types and values of homes
4.123 Following on from Chapter 3, which set out the LHN for Greater
Manchester, the analysis in this chapter aims to estimate the need
for homes of different types, sizes and values in Greater

109
Manchester. The type, size and tenure of housing needs to be
considered separately from the LHN, which is not broken down by
these variables.
4.124 The NPPF suggests that analysis of current and future trends in the
age profile, household composition, housing stock and tenure
should be brought together, in order to examine whether
continuing trends in dwelling type, size and tenure would meet the
future needs of households.
4.125 The NPPF states that local plans should consider:
“60. To determine the minimum number of homes needed, strategic policies
should be informed by a local housing need assessment, conducted using
the standard method in national planning guidance – unless exceptional
circumstances justify an alternative approach which also reflects current
and future demographic trends and market signals. In addition to the local
housing need figure, any needs that cannot be met within neighbouring
areas should also be taken into account in establishing the amount of
housing to be planned for.
61. Within this context, the size, type and tenure of housing needed for
different groups in the community should be assessed and reflected in
planning policies (including, but not limited to, those who require
affordable housing, families with children, older people, students, people
with disabilities, service families, travellers, people who rent their homes
and people wishing to commission or build their own homes).” (NPPF,
February 2019).
4.126 The LHN for Greater Manchester is based on the 2014-based
household projections. The projections for 2020–2030 are used
alongside an affordability uplift to calculate the minimum number
of homes needed for Greater Manchester. The data provides a view
of the household type over the period that in turn provides an
indication of the size of homes that may be needed. It should be
noted that some ‘new’ households e.g. single person households of

110
older people may be households which are existing households but
have changed in size due to bereavement so one household
becoming a smaller household as opposed to one household
splitting into multiple households.
4.127 The 2014- based household projections show an overall increase in
households over the period 2020-2037 as shown below.
Figure 4.39: Household change 2020 – 2037 (2014-based household projections)
4.128 Manchester and Salford are the districts with the largest projected
household increase that is also reflective of the population
projections for the two cities. In terms of overall household change
in the period 2020 - 2037, the projections project that ‘Other’
households will be the biggest change these are defined as:
“Other Households – This is a household type within Stage Two of the
household projections. This category is of multi-person households and will
contain the majority of adults living in house shares.” (Household
Projections 2014-based: Methodological Report, MHCLG, July 2016)
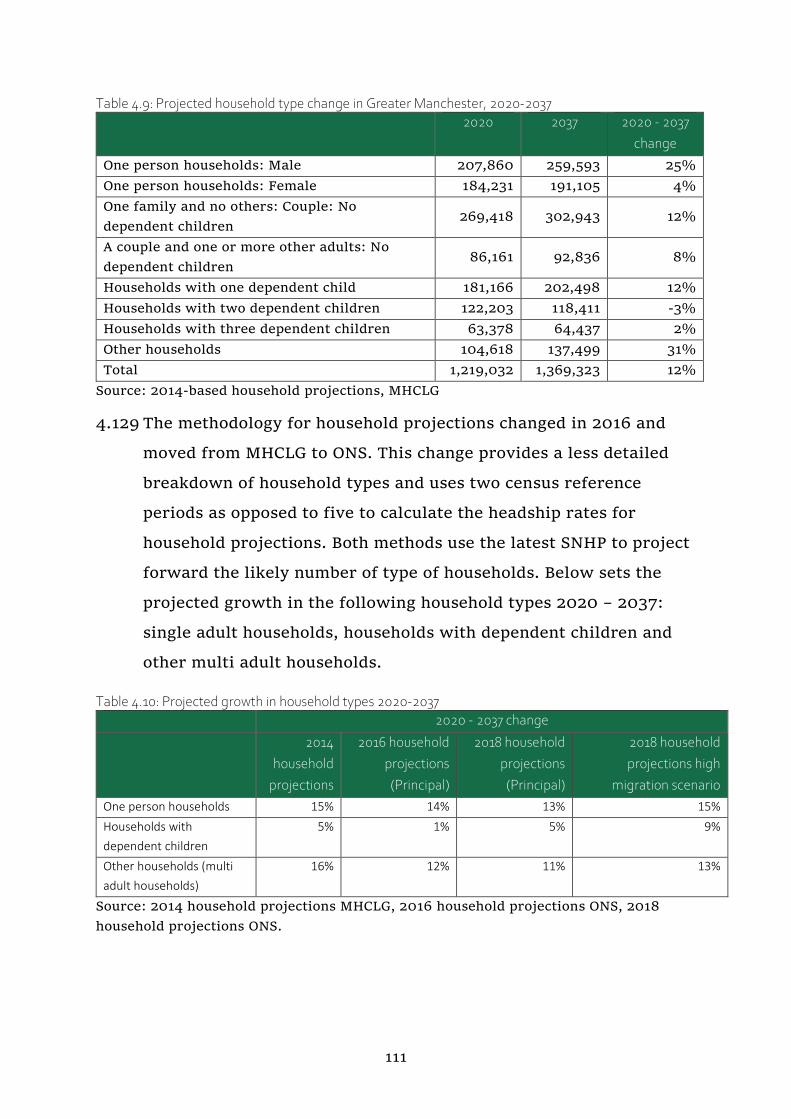
111
Table 4.9: Projected household type change in Greater Manchester, 2020-2037 2020 2037 2020 - 2037
change
One person households: Male 207,860 259,593 25%
One person households: Female 184,231 191,105 4%
One family and no others: Couple: No
dependent children 269,418 302,943 12%
A couple and one or more other adults: No
dependent children 86,161 92,836 8%
Households with one dependent child 181,166 202,498 12%
Households with two dependent children 122,203 118,411 -3%
Households with three dependent children 63,378 64,437 2%
Other households 104,618 137,499 31%
Total 1,219,032 1,369,323 12%
Source: 2014-based household projections, MHCLG
4.129 The methodology for household projections changed in 2016 and
moved from MHCLG to ONS. This change provides a less detailed
breakdown of household types and uses two census reference
periods as opposed to five to calculate the headship rates for
household projections. Both methods use the latest SNHP to project
forward the likely number of type of households. Below sets the
projected growth in the following household types 2020 – 2037:
single adult households, households with dependent children and
other multi adult households.
Table 4.10: Projected growth in household types 2020-2037
2020 - 2037 change
2014
household
projections
2016 household
projections
(Principal)
2018 household
projections
(Principal)
2018 household
projections high
migration scenario
One person households 15% 14% 13% 15%
Households with
dependent children
5% 1% 5% 9%
Other households (multi
adult households)
16% 12% 11% 13%
Source: 2014 household projections MHCLG, 2016 household projections ONS, 2018
household projections ONS.

112
4.130 All four projections project an increase in one person households
and multi-adult households with a smaller increase in households
with dependent children.
4.131 The rise in one-person households is mainly amongst older people
in all projections reflecting the ageing population this means that
some of the new one-person households are existing households,
which may have been a multi adult household that have become a
one-person household. The rise in multi adult households is
amongst a younger cohort. The 2016 and 2018 projections include
couple multi adult households under other households, so it is not
possible to distinguish those other households defined in the 2014
method that are mainly adults in house shares. Below sets out the
difference in working age and non-working age projected change by
households' type in the 2014-based projections:
Table 4.11: Working age and non-working age projected by household type
2014 (2020 - 2037 change)
Working age Non-working age
One person households: Male 21,337 30,405
One person households: Female - 1,399 8,281
One family and no others: Couple: No
dependent children - 22,565 56,087
A couple and one or more other adults: No
dependent children - 6,689 13,371
Households with one dependent child 17,247 4,086
Households with two dependent children - 4,167 366
Households with three dependent children 1,053 4
Other households 20,485 12,398
Source: 2014 household projections MHCLG
4.132 The 2016 and 2018 projections do not provide this data in such
granular detail. The above household projections are based on the
ONS’s SNPP that in turn are based on past trends. The Accelerated
Growth Scenario (AGS) for Greater Manchester sets out a forecast
that supports Greater Manchester’s overall economic growth
ambitions and has a population derived from the economic
forecasts. Within these forecasts, there is a net migration of c.
75,000 people in the period 2020 – 2037. This is higher than the
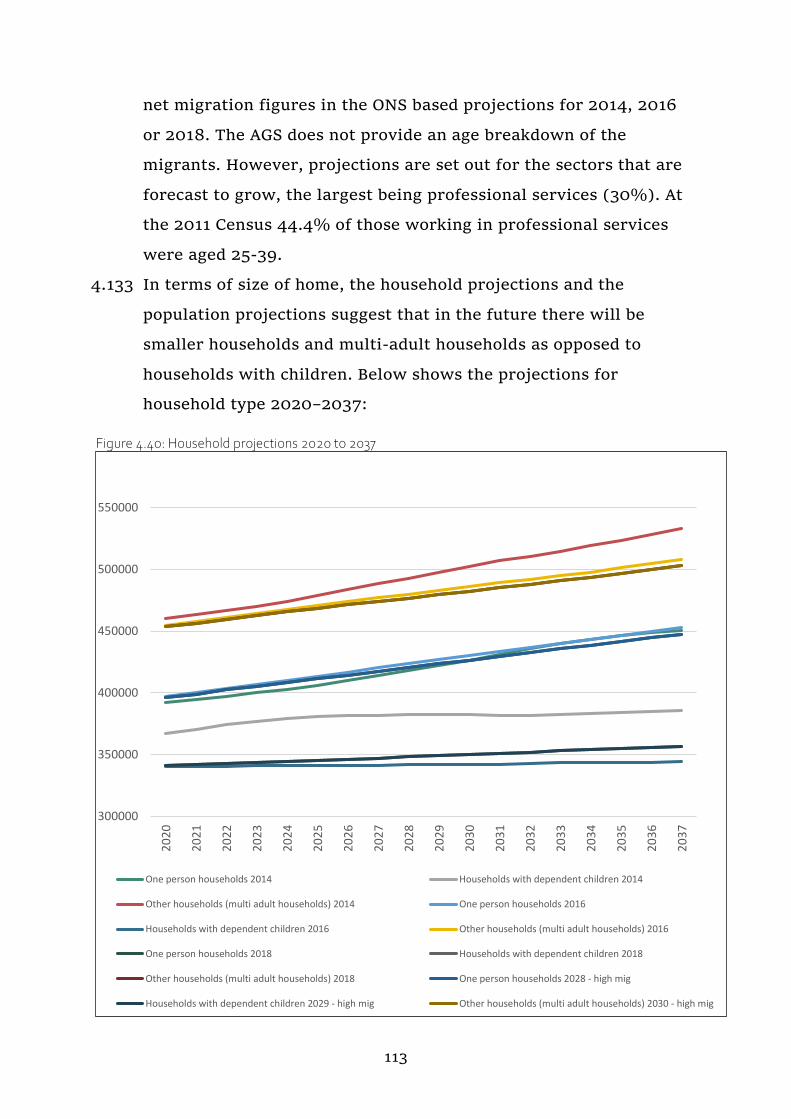
113
net migration figures in the ONS based projections for 2014, 2016
or 2018. The AGS does not provide an age breakdown of the
migrants. However, projections are set out for the sectors that are
forecast to grow, the largest being professional services (30%). At
the 2011 Census 44.4% of those working in professional services
were aged 25-39.
4.133 In terms of size of home, the household projections and the
population projections suggest that in the future there will be
smaller households and multi-adult households as opposed to
households with children. Below shows the projections for
household type 2020–2037:
Figure 4.40: Household projections 2020 to 2037
300000
350000
400000
450000
500000
550000
20
20
20
21
20
22
20
23
20
24
20
25
20
26
20
27
20
28
20
29
20
30
20
31
20
32
20
33
20
34
20
35
20
36
20
37
One person households 2014 Households with dependent children 2014
Other households (multi adult households) 2014 One person households 2016
Households with dependent children 2016 Other households (multi adult households) 2016
One person households 2018 Households with dependent children 2018
Other households (multi adult households) 2018 One person households 2028 - high mig
Households with dependent children 2029 - high mig Other households (multi adult households) 2030 - high mig

114
Source: MHCLG 2014 household projections, ONS 2016 and 2018 household projections.
4.134 Reflecting this growth in households, the type of homes, which may
be wanted, may not reflect the current housing stock on offer. Both
smaller households and multi-adult households may want a diverse
housing offer. Recent evidence is that that city centre has the
strongest housing market in Greater Manchester in terms of sales
volumes, with the apartments being a significant part of the offer.
4.135 There is evidence of a growth in demand for more suitable housing
for older people who are the main growth in single person
households. This demand is in all sizes of households and there is a
growing market in purpose-built accommodation for older people.
Older people are a diverse group. They will seek a range of
accommodation that may or may not be adapted to specialist
accommodation.
4.136 The four sets of household projections alongside the population
forecast from the AGS suggest a growth in households without
dependent children. A combination of migration and natural change
drives the growth. The natural change component of the growth is
due in part to an ageing population with increasing life expectancy.

115
5 Market Signals
116
Chapter summary
What can we tell from the housing market that might help us make
decisions about the housing we will require for the future?
Average house prices in Greater Manchester have historically
been below the national average. Between 2018 and 2019 there
was an increase of 3.9% compared to 2.6% for the North West
region and 0.9% for England & Wales. In 2019, the average
price paid in Greater Manchester was £173,366, compared to
£242,125 in England & Wales.
Government estimates show average land values for residential
land in Greater Manchester are also below national levels, even
when those exclude the exceptional values in London.
Our private rents are also lower than national averages – the
median monthly rent in 2018/19 was £600 in Greater
Manchester and £695 in England.
Average figures such as these for Greater Manchester mask
patterns within the city region. For both sale and rental costs
Trafford and Stockport averages are significantly higher than
Greater Manchester as a whole, and rents in Manchester are
higher, reflecting the city centre market. In all districts,
variations between neighbourhoods are of course substantial.
One in five homes in Greater Manchester are in the social
housing sector and around 95% of those are rented at social
rents, which are generally substantially below private sector
rents, though in some neighbourhoods there can be little
difference in cost.
In Greater Manchester, there were over 99,800 households on
the housing register in 2018/19. Of these households, over
30,000 (31%) were in reasonable preference, meaning they
were identified by the local authority as being in housing need.

117
New housebuilding levels continue to recover slowly from the
post-2008 collapse in delivery, with the 2018/19 total around
11,000 net additional homes being the highest since 2007/08.
New developments in the central areas of Salford and
Manchester drove the increase.
At the same time, the numbers of empty dwellings are still
declining, having reached historically low levels close to and in
some districts below national averages. This indicates strong
demand for more homes whilst also plugging a gap in the
shortfall in new build development in the recent years.
5.1 Introduction
5.1 This chapter examines the operation of the housing market in
Greater Manchester and identifies market signals that provide
evidence of housing requirements. It firstly examines house prices
and land values across Greater Manchester, followed by a review of
the PRS. Following that is information on rental affordability and
allocations in the social and affordable rented sector with analysis
of the intermediate sector (such as rent to buy and shared
ownership products). The evidence is used to derive a range of
threshold cost levels for market housing for sale and to rent, for
intermediate tenures and for social and affordable rented housing.
These thresholds form an important input into the calculation of
the need for affordable housing presented in Chapter 7. This
chapter then presents an analysis of overcrowding, under-
occupation and concealed households, before finally examining
vacancy levels in Greater Manchester.
5.2 The NPPF paragraph 31 states that in the preparation and review of
local plans and spatial strategies:

118
…all policies should be underpinned by relevant and up-to-date
evidence. This should be adequate and proportionate, focused tightly
on supporting and justifying the policies concerned, and take into
account relevant market signals.
5.3 The LHN methodology as discussed in Chapter 3, includes an
adjustment for housing signals in the form of an affordability
uplift.
5.4 It is however important to monitor the performance of the housing
market, and so this chapter considers a range of market signals for
Greater Manchester including house prices, rents, affordability and
overcrowding.
5.2 House prices
Long-term trends
5.5 There are two key sources of house price data, the H M Land
Registry House Price Index (HPI) and ONS House Price Statistics for
Small Areas (HPSSAs).31 H M Land Registry data is used at district
level and above and ONS at ward level for the purposes of this
report. Figure 5.1 shows this data in Greater Manchester between
January 2007 and December 2019.
5.6 Average house prices in Greater Manchester increased steadily
until March 2009, when they dipped before levelling out in the next
three years. Prices returned to growth from September 2012
onwards. The relatively stark increase in London compared to the
other areas illustrated in the chart below. Whilst there has been
similar peaks and troughs, Greater Manchester has narrowed the
31 HPSSAs use data from the H M Land Registry to provide statistics on the price paid
and composition of residential property transactions for properties that were sold in
England & Wales. Properties sold at a discount to market level, such as properties sold
under the Right to Buy scheme, are excluded from the data.
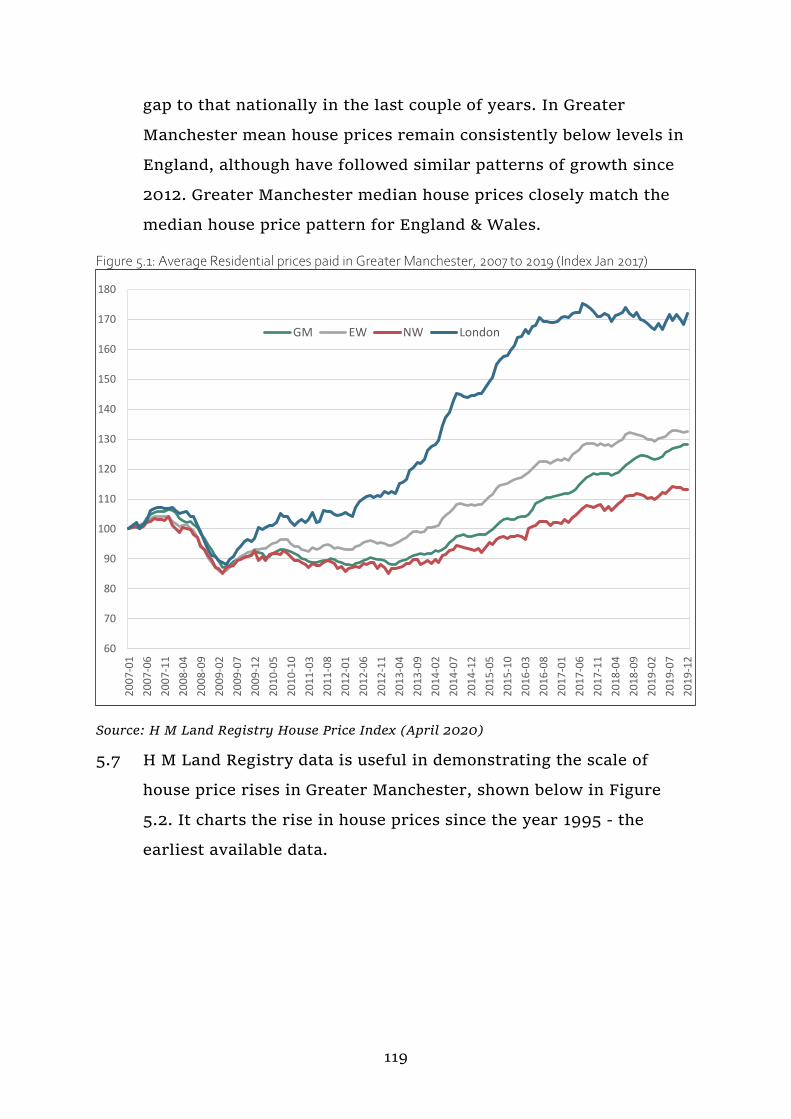
119
gap to that nationally in the last couple of years. In Greater
Manchester mean house prices remain consistently below levels in
England, although have followed similar patterns of growth since
2012. Greater Manchester median house prices closely match the
median house price pattern for England & Wales.
Figure 5.1: Average Residential prices paid in Greater Manchester, 2007 to 2019 (Index Jan 2017)
Source: H M Land Registry House Price Index (April 2020)
5.7 H M Land Registry data is useful in demonstrating the scale of
house price rises in Greater Manchester, shown below in Figure
5.2. It charts the rise in house prices since the year 1995 - the
earliest available data.
60
70
80
90
100
110
120
130
140
150
160
170
180
20
07
-01
20
07
-06
20
07
-11
20
08
-04
20
08
-09
20
09
-02
20
09
-07
20
09
-12
20
10
-05
20
10
-10
20
11
-03
20
11
-08
20
12
-01
20
12
-06
20
12
-11
20
13
-04
20
13
-09
20
14
-02
20
14
-07
20
14
-12
20
15
-05
20
15
-10
20
16
-03
20
16
-08
20
17
-01
20
17
-06
20
17
-11
20
18
-04
20
18
-09
20
19
-02
20
19
-07
20
19
-12
GM EW NW London

120
Figure 5.2: Average residential prices in Greater Manchester districts 1995 and 2019 and percentage increase in the period
Source: H M Land Registry Price Paid data (April 2020).
5.8 In 1995, the average property price in Manchester (£34,188) was
the lowest in Greater Manchester. Property prices have risen the
most in Manchester in percentage terms and Manchester is now the
third most expensive area in Greater Manchester. Wigan now has
the lowest mean house price across the conurbation at £134,841.
Wigan has experienced the least increase too.
5.9 There has been a geographical element to house price inflation with
districts to the north experiencing rates lower than those districts
located in the south of Greater Manchester. This may partly be a
function of the type and value of housing rather than just the level
of underlying demand.
5.10 Table 5.1 shows the figure highlighted above in more detail.
0%
50%
100%
150%
200%
250%
300%
350%
400%
450%
500%
£0
£50,000
£100,000
£150,000
£200,000
£250,000
£300,000
£350,000
Bo
lto
n
Bu
ry
Ma
nch
est
er
Old
ha
m
Ro
ch
da
le
Sa
lfo
rd
Sto
ck
po
rt
Ta
me
sid
e
Tra
ffo
rd
Wig
an
1995 2019 % Increase - 1995-2019
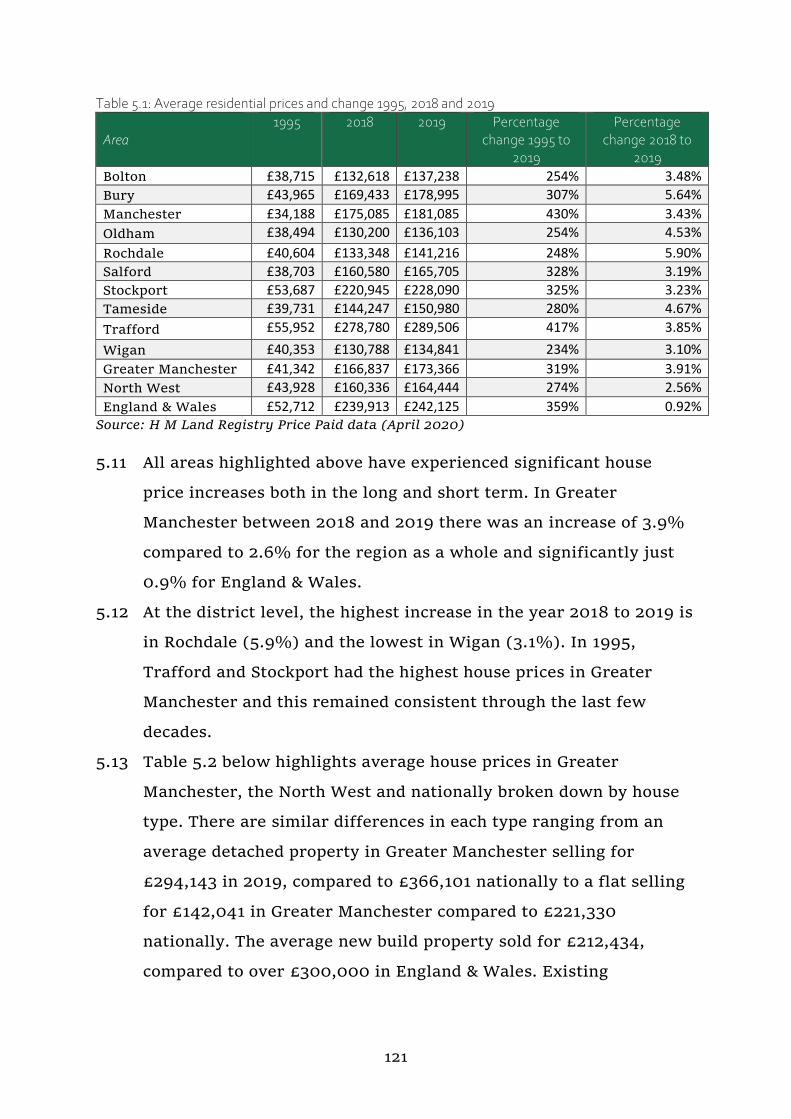
121
Table 5.1: Average residential prices and change 1995, 2018 and 2019
Area
1995 2018 2019 Percentage change 1995 to
2019
Percentage change 2018 to
2019
Bolton £38,715 £132,618 £137,238 254% 3.48%
Bury £43,965 £169,433 £178,995 307% 5.64%
Manchester £34,188 £175,085 £181,085 430% 3.43%
Oldham £38,494 £130,200 £136,103 254% 4.53%
Rochdale £40,604 £133,348 £141,216 248% 5.90%
Salford £38,703 £160,580 £165,705 328% 3.19%
Stockport £53,687 £220,945 £228,090 325% 3.23%
Tameside £39,731 £144,247 £150,980 280% 4.67%
Trafford £55,952 £278,780 £289,506 417% 3.85%
Wigan £40,353 £130,788 £134,841 234% 3.10%
Greater Manchester £41,342 £166,837 £173,366 319% 3.91%
North West £43,928 £160,336 £164,444 274% 2.56%
England & Wales £52,712 £239,913 £242,125 359% 0.92% Source: H M Land Registry Price Paid data (April 2020)
5.11 All areas highlighted above have experienced significant house
price increases both in the long and short term. In Greater
Manchester between 2018 and 2019 there was an increase of 3.9%
compared to 2.6% for the region as a whole and significantly just
0.9% for England & Wales.
5.12 At the district level, the highest increase in the year 2018 to 2019 is
in Rochdale (5.9%) and the lowest in Wigan (3.1%). In 1995,
Trafford and Stockport had the highest house prices in Greater
Manchester and this remained consistent through the last few
decades.
5.13 Table 5.2 below highlights average house prices in Greater
Manchester, the North West and nationally broken down by house
type. There are similar differences in each type ranging from an
average detached property in Greater Manchester selling for
£294,143 in 2019, compared to £366,101 nationally to a flat selling
for £142,041 in Greater Manchester compared to £221,330
nationally. The average new build property sold for £212,434,
compared to over £300,000 in England & Wales. Existing

122
properties in Greater Manchester had an average selling price in
2019 of £171,071 and £238,340 for England & Wales.

123
Table 5.2: Average prices by type, 2019 (average of 12 months)
Area All properties Detached Semi-detached Terraced Flat New Existing
Bolton £137,238 £241,869 £145,893 £108,757 £90,682 £169,213 £136,712
Bury £178,995 £299,101 £193,007 £138,682 £104,882 £265,410 £175,325
Manchester £181,085 £322,724 £221,359 £167,670 £160,454 £210,197 £178,153
Oldham £136,103 £238,260 £152,543 £111,067 £100,245 £183,719 £133,917
Rochdale £141,216 £237,875 £148,551 £109,976 £81,418 £196,760 £136,397
Salford £165,705 £298,562 £195,920 £145,914 £134,369 £201,611 £161,492
Stockport £228,090 £387,235 £241,852 £173,677 £143,335 £243,139 £227,733
Tameside £150,980 £256,110 £164,961 £125,062 £102,422 £201,568 £147,470
Trafford £289,506 £525,149 £315,402 £241,787 £187,830 £282,272 £289,685
Wigan £134,841 £221,081 £135,735 £103,563 £77,415 £220,938 £131,541
Greater Manchester £173,366 £294,143 £191,750 £138,022 £142,041 £212,434 £171,071
North West £164,444 £282,766 £174,544 £125,506 £121,746 £221,157 £161,303
England & Wales £242,125 £366,101 £227,356 £195,192 £221,330 £300,269 £238,340
Source: H M Land Registry House Price Paid Data (April 2020).
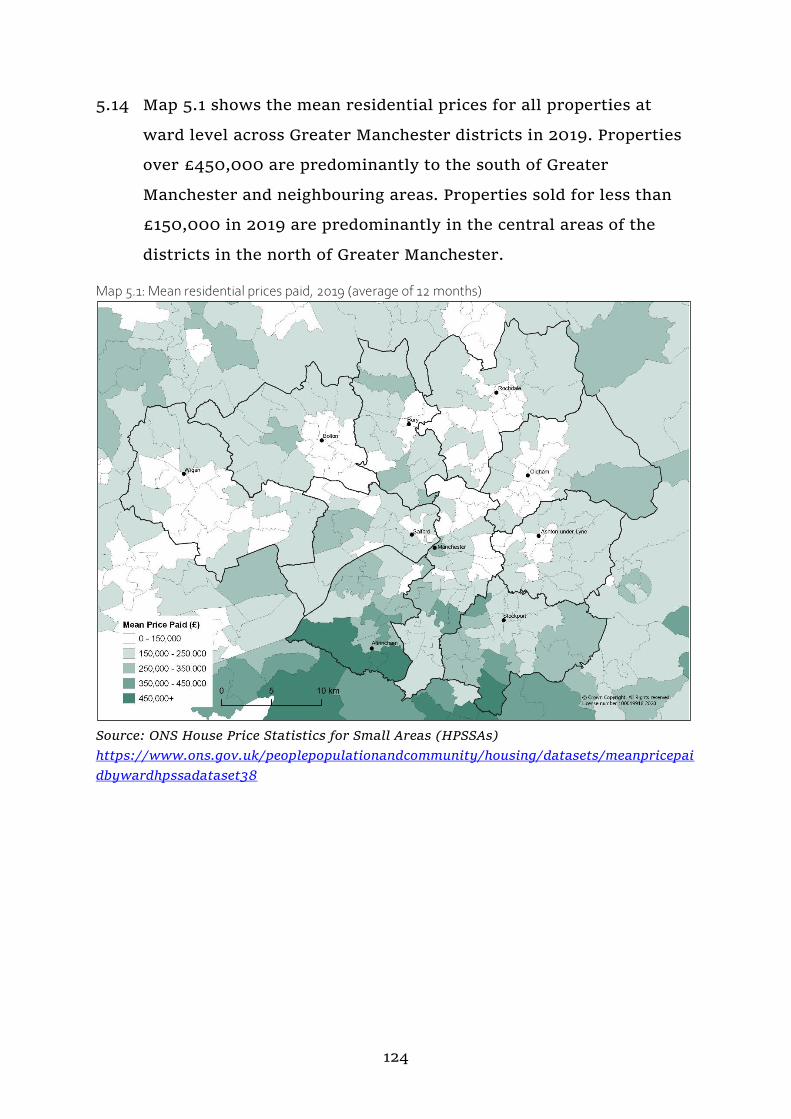
124
5.14 Map 5.1 shows the mean residential prices for all properties at
ward level across Greater Manchester districts in 2019. Properties
over £450,000 are predominantly to the south of Greater
Manchester and neighbouring areas. Properties sold for less than
£150,000 in 2019 are predominantly in the central areas of the
districts in the north of Greater Manchester.
Map 5.1: Mean residential prices paid, 2019 (average of 12 months)
Source: ONS House Price Statistics for Small Areas (HPSSAs)
https://www.ons.gov.uk/peoplepopulationandcommunity/housing/datasets/meanpricepai
dbywardhpssadataset38
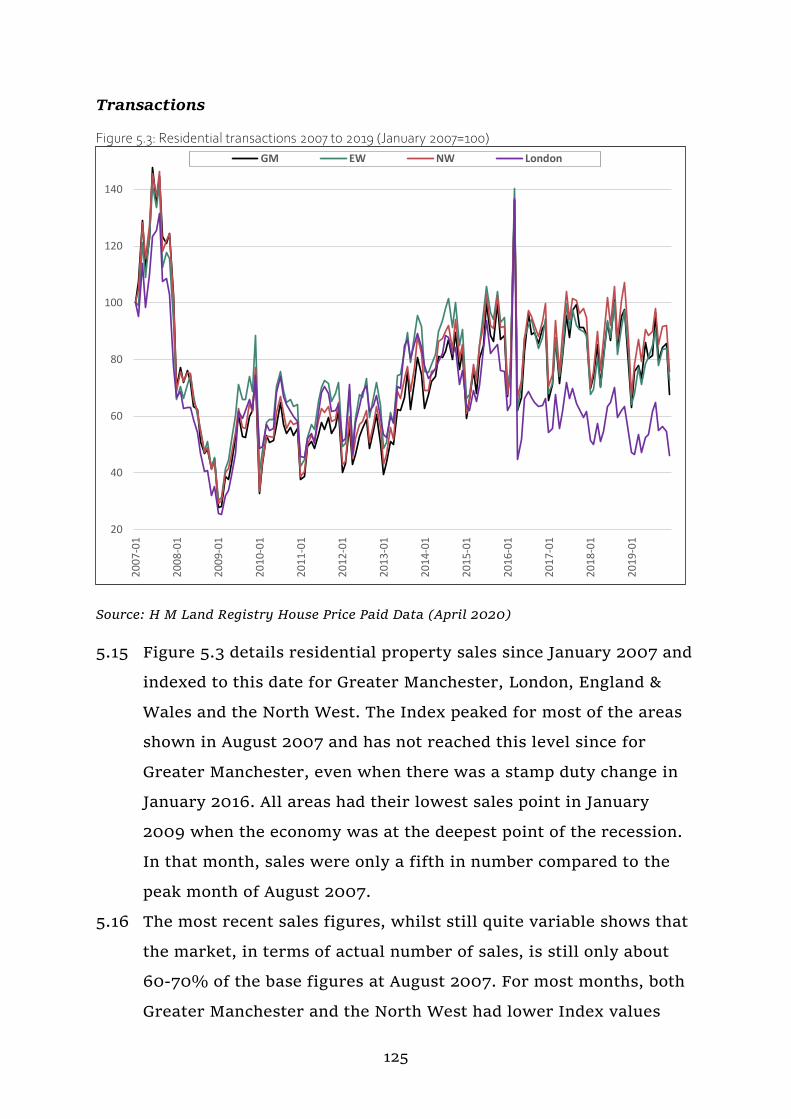
125
Transactions
Figure 5.3: Residential transactions 2007 to 2019 (January 2007=100)
Source: H M Land Registry House Price Paid Data (April 2020)
5.15 Figure 5.3 details residential property sales since January 2007 and
indexed to this date for Greater Manchester, London, England &
Wales and the North West. The Index peaked for most of the areas
shown in August 2007 and has not reached this level since for
Greater Manchester, even when there was a stamp duty change in
January 2016. All areas had their lowest sales point in January
2009 when the economy was at the deepest point of the recession.
In that month, sales were only a fifth in number compared to the
peak month of August 2007.
5.16 The most recent sales figures, whilst still quite variable shows that
the market, in terms of actual number of sales, is still only about
60-70% of the base figures at August 2007. For most months, both
Greater Manchester and the North West had lower Index values
20
40
60
80
100
120
140
20
07
-01
20
08
-01
20
09
-01
20
10
-01
20
11
-01
20
12
-01
20
13
-01
20
14
-01
20
15
-01
20
16
-01
20
17
-01
20
18
-01
20
19
-01
GM EW NW London
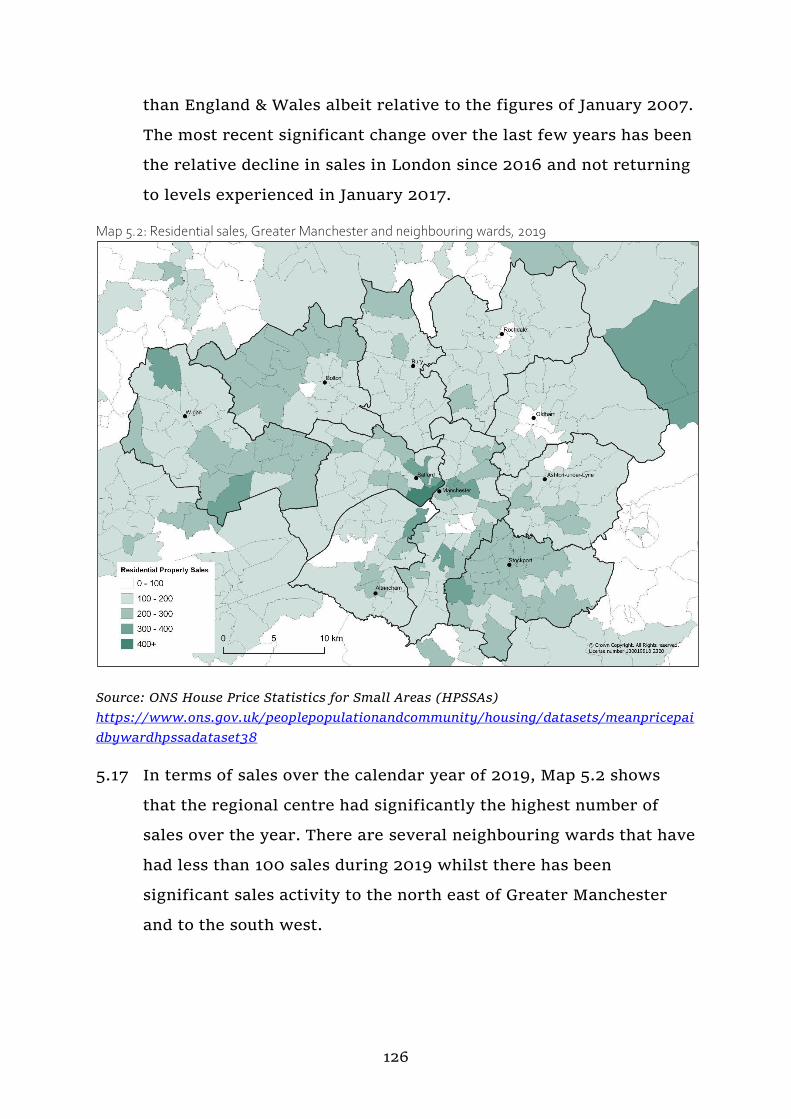
126
than England & Wales albeit relative to the figures of January 2007.
The most recent significant change over the last few years has been
the relative decline in sales in London since 2016 and not returning
to levels experienced in January 2017.
Map 5.2: Residential sales, Greater Manchester and neighbouring wards, 2019
Source: ONS House Price Statistics for Small Areas (HPSSAs)
https://www.ons.gov.uk/peoplepopulationandcommunity/housing/datasets/meanpricepai
dbywardhpssadataset38
5.17 In terms of sales over the calendar year of 2019, Map 5.2 shows
that the regional centre had significantly the highest number of
sales over the year. There are several neighbouring wards that have
had less than 100 sales during 2019 whilst there has been
significant sales activity to the north east of Greater Manchester
and to the south west.
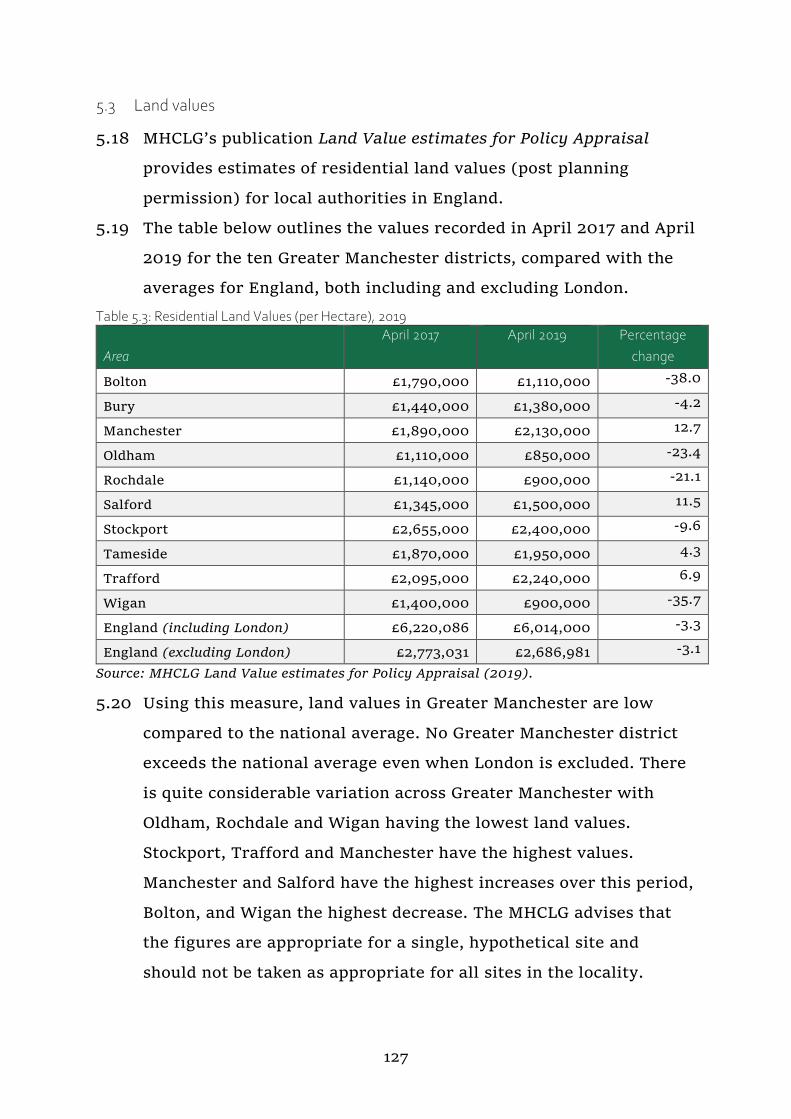
127
5.3 Land values
5.18 MHCLG’s publication Land Value estimates for Policy Appraisal
provides estimates of residential land values (post planning
permission) for local authorities in England.
5.19 The table below outlines the values recorded in April 2017 and April
2019 for the ten Greater Manchester districts, compared with the
averages for England, both including and excluding London.
Table 5.3: Residential Land Values (per Hectare), 2019
Area
April 2017 April 2019 Percentage
change
Bolton £1,790,000 £1,110,000 -38.0
Bury £1,440,000 £1,380,000 -4.2
Manchester £1,890,000 £2,130,000 12.7
Oldham £1,110,000 £850,000 -23.4
Rochdale £1,140,000 £900,000 -21.1
Salford £1,345,000 £1,500,000 11.5
Stockport £2,655,000 £2,400,000 -9.6
Tameside £1,870,000 £1,950,000 4.3
Trafford £2,095,000 £2,240,000 6.9
Wigan £1,400,000 £900,000 -35.7
England (including London) £6,220,086 £6,014,000 -3.3
England (excluding London) £2,773,031 £2,686,981 -3.1
Source: MHCLG Land Value estimates for Policy Appraisal (2019).
5.20 Using this measure, land values in Greater Manchester are low
compared to the national average. No Greater Manchester district
exceeds the national average even when London is excluded. There
is quite considerable variation across Greater Manchester with
Oldham, Rochdale and Wigan having the lowest land values.
Stockport, Trafford and Manchester have the highest values.
Manchester and Salford have the highest increases over this period,
Bolton, and Wigan the highest decrease. The MHCLG advises that
the figures are appropriate for a single, hypothetical site and
should not be taken as appropriate for all sites in the locality.
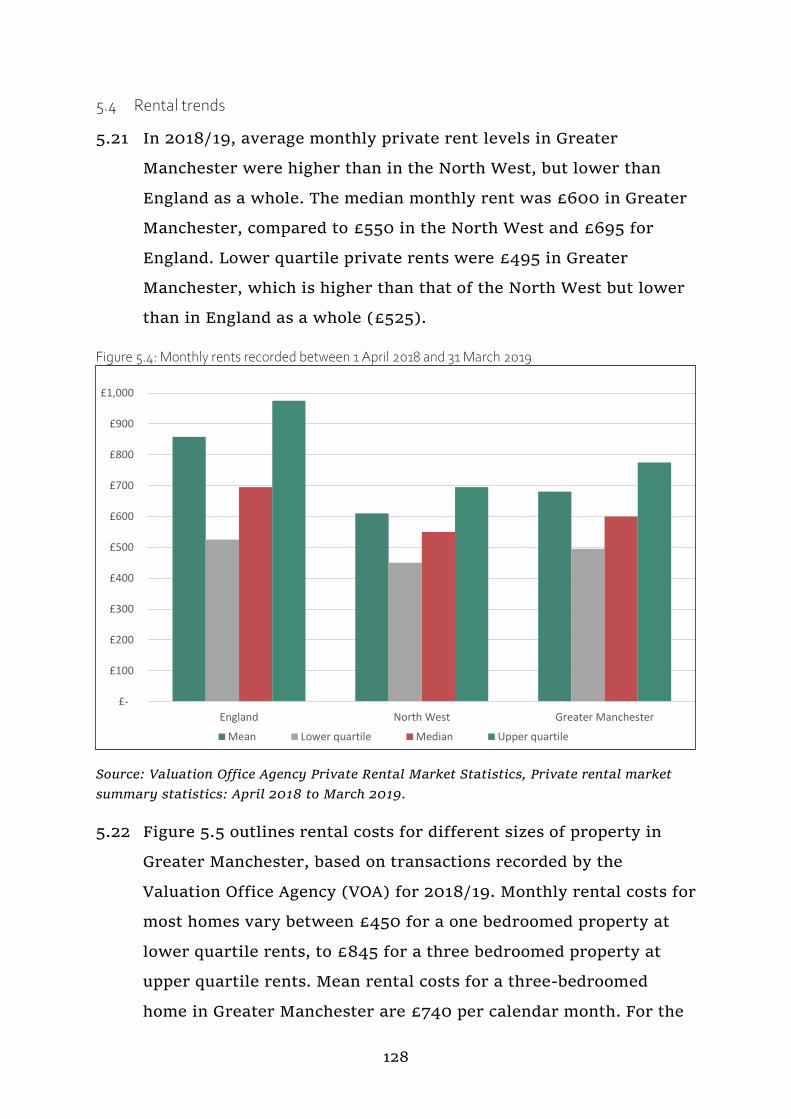
128
5.4 Rental trends
5.21 In 2018/19, average monthly private rent levels in Greater
Manchester were higher than in the North West, but lower than
England as a whole. The median monthly rent was £600 in Greater
Manchester, compared to £550 in the North West and £695 for
England. Lower quartile private rents were £495 in Greater
Manchester, which is higher than that of the North West but lower
than in England as a whole (£525).
Figure 5.4: Monthly rents recorded between 1 April 2018 and 31 March 2019
Source: Valuation Office Agency Private Rental Market Statistics, Private rental market
summary statistics: April 2018 to March 2019.
5.22 Figure 5.5 outlines rental costs for different sizes of property in
Greater Manchester, based on transactions recorded by the
Valuation Office Agency (VOA) for 2018/19. Monthly rental costs for
most homes vary between £450 for a one bedroomed property at
lower quartile rents, to £845 for a three bedroomed property at
upper quartile rents. Mean rental costs for a three-bedroomed
home in Greater Manchester are £740 per calendar month. For the
£-
£100
£200
£300
£400
£500
£600
£700
£800
£900
£1,000
England North West Greater Manchester
Mean Lower quartile Median Upper quartile
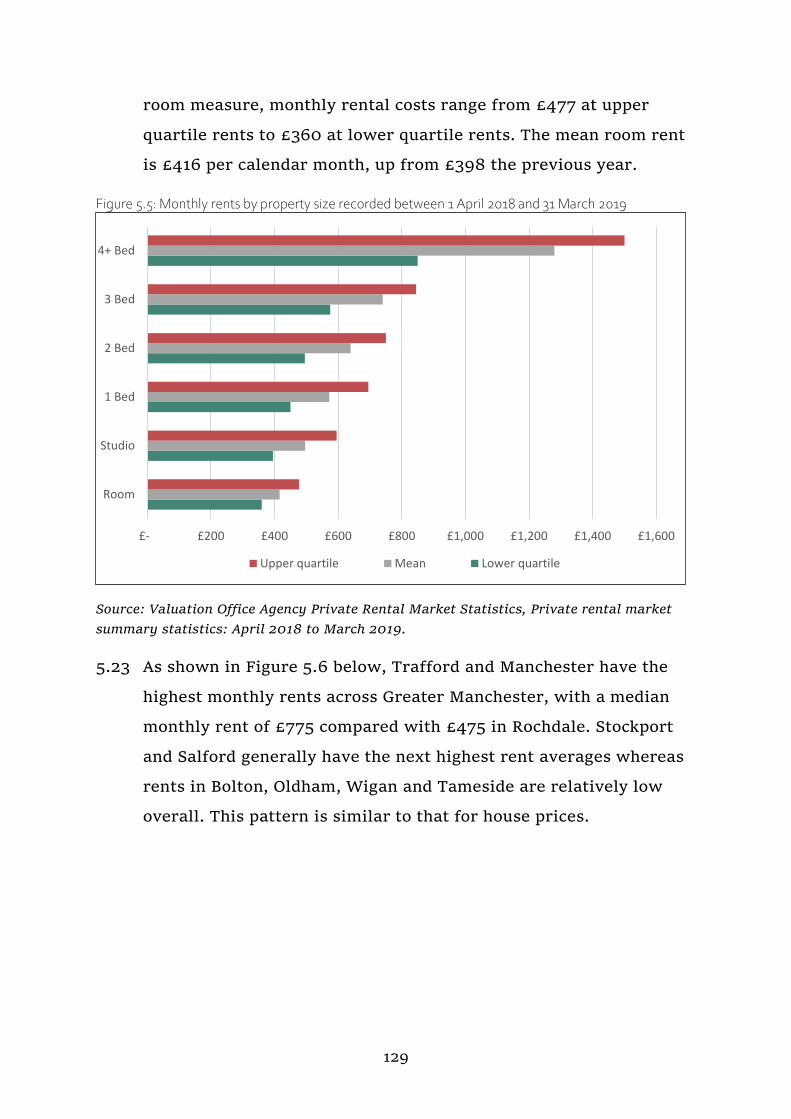
129
room measure, monthly rental costs range from £477 at upper
quartile rents to £360 at lower quartile rents. The mean room rent
is £416 per calendar month, up from £398 the previous year.
Figure 5.5: Monthly rents by property size recorded between 1 April 2018 and 31 March 2019
Source: Valuation Office Agency Private Rental Market Statistics, Private rental market
summary statistics: April 2018 to March 2019.
5.23 As shown in Figure 5.6 below, Trafford and Manchester have the
highest monthly rents across Greater Manchester, with a median
monthly rent of £775 compared with £475 in Rochdale. Stockport
and Salford generally have the next highest rent averages whereas
rents in Bolton, Oldham, Wigan and Tameside are relatively low
overall. This pattern is similar to that for house prices.
£- £200 £400 £600 £800 £1,000 £1,200 £1,400 £1,600
Room
Studio
1 Bed
2 Bed
3 Bed
4+ Bed
Upper quartile Mean Lower quartile
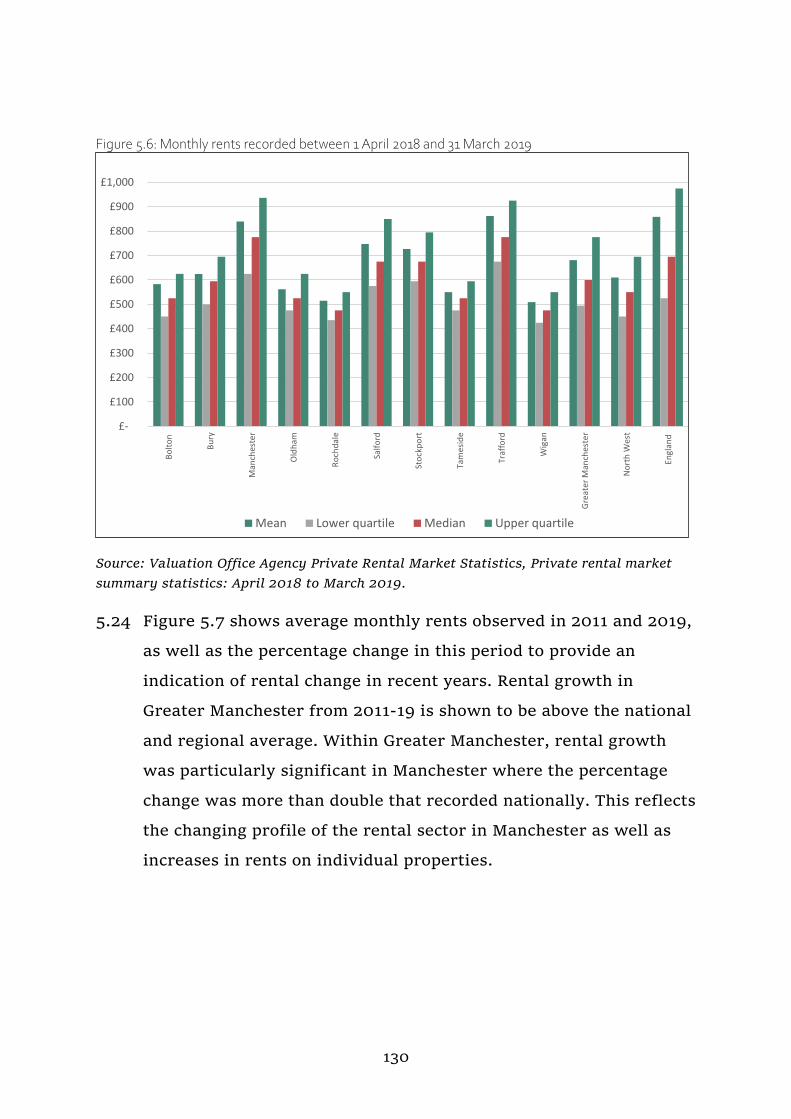
130
Figure 5.6: Monthly rents recorded between 1 April 2018 and 31 March 2019
Source: Valuation Office Agency Private Rental Market Statistics, Private rental market
summary statistics: April 2018 to March 2019.
5.24 Figure 5.7 shows average monthly rents observed in 2011 and 2019,
as well as the percentage change in this period to provide an
indication of rental change in recent years. Rental growth in
Greater Manchester from 2011-19 is shown to be above the national
and regional average. Within Greater Manchester, rental growth
was particularly significant in Manchester where the percentage
change was more than double that recorded nationally. This reflects
the changing profile of the rental sector in Manchester as well as
increases in rents on individual properties.
£-
£100
£200
£300
£400
£500
£600
£700
£800
£900
£1,000
Bo
lto
n
Bu
ry
Man
ches
ter
Old
ham
Ro
chd
ale
Salf
ord
Sto
ckp
ort
Tam
esid
e
Traf
ford
Wig
an
Gre
ater
Man
ches
ter
No
rth
Wes
t
Engl
and
Mean Lower quartile Median Upper quartile
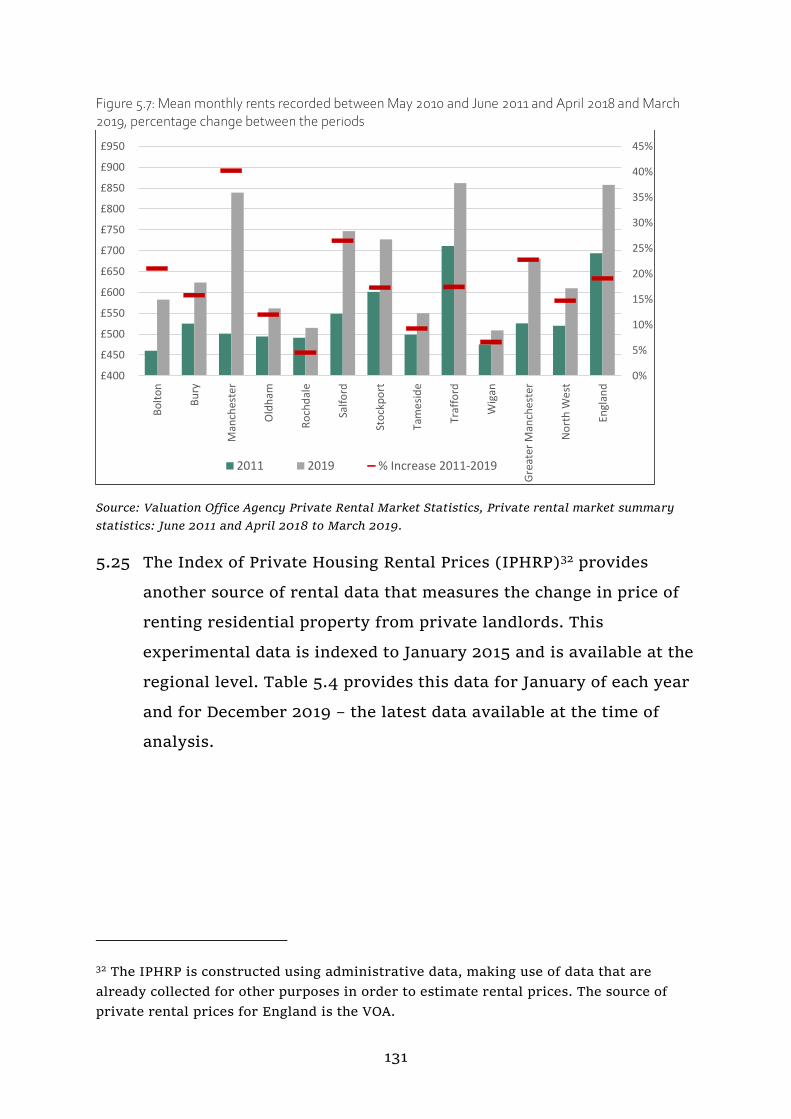
131
Figure 5.7: Mean monthly rents recorded between May 2010 and June 2011 and April 2018 and March 2019, percentage change between the periods
Source: Valuation Office Agency Private Rental Market Statistics, Private rental market summary
statistics: June 2011 and April 2018 to March 2019.
5.25 The Index of Private Housing Rental Prices (IPHRP)32 provides
another source of rental data that measures the change in price of
renting residential property from private landlords. This
experimental data is indexed to January 2015 and is available at the
regional level. Table 5.4 provides this data for January of each year
and for December 2019 – the latest data available at the time of
analysis.
32 The IPHRP is constructed using administrative data, making use of data that are
already collected for other purposes in order to estimate rental prices. The source of
private rental prices for England is the VOA.
0%
5%
10%
15%
20%
25%
30%
35%
40%
45%
£400
£450
£500
£550
£600
£650
£700
£750
£800
£850
£900
£950B
olt
on
Bu
ry
Man
ches
ter
Old
ham
Ro
chd
ale
Salf
ord
Sto
ckp
ort
Tam
esi
de
Traf
ford
Wig
an
Gre
ater
Man
ches
ter
No
rth
We
st
Engl
and
2011 2019 % Increase 2011-2019
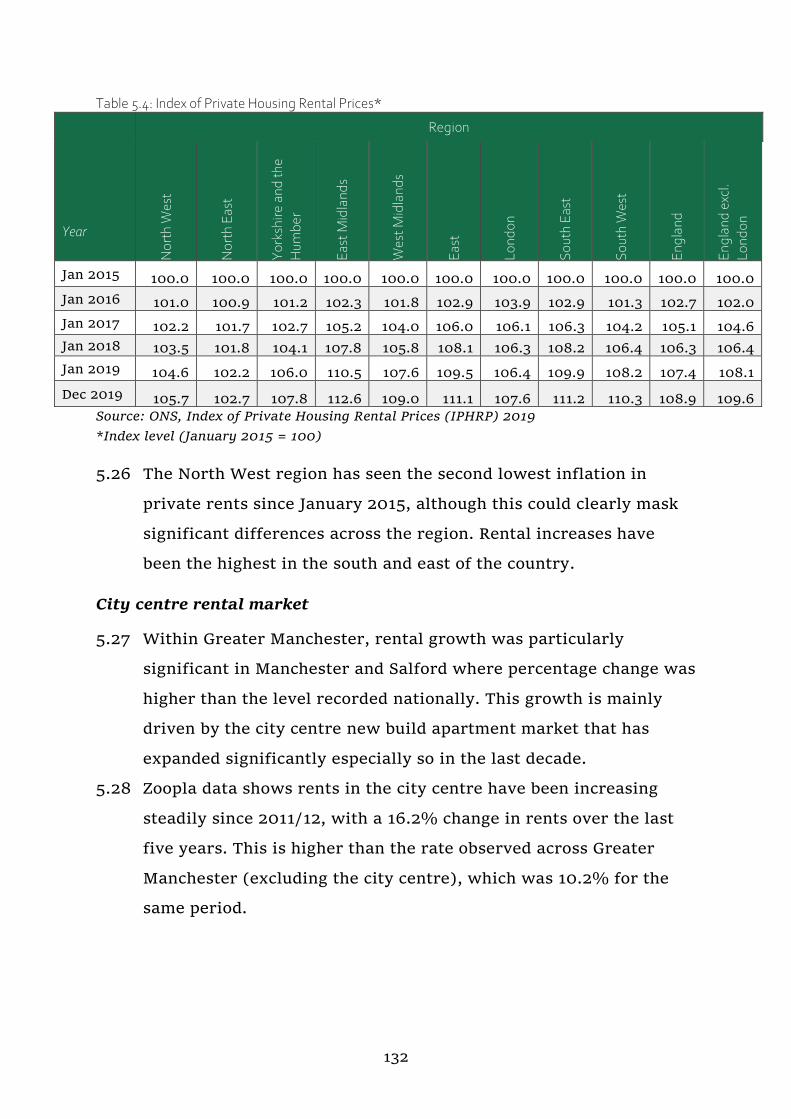
132
Table 5.4: Index of Private Housing Rental Prices*
Year
Region
No
rth
Wes
t
No
rth
Eas
t
Yo
rksh
ire
and
th
e
Hum
ber
Eas
t M
idla
nd
s
Wes
t M
idla
nd
s
Eas
t
Lo
nd
on
So
uth
Eas
t
So
uth
Wes
t
En
gla
nd
En
gla
nd
exc
l.
Lo
nd
on
Jan 2015 100.0 100.0 100.0 100.0 100.0 100.0 100.0 100.0 100.0 100.0 100.0
Jan 2016 101.0 100.9 101.2 102.3 101.8 102.9 103.9 102.9 101.3 102.7 102.0
Jan 2017 102.2 101.7 102.7 105.2 104.0 106.0 106.1 106.3 104.2 105.1 104.6
Jan 2018 103.5 101.8 104.1 107.8 105.8 108.1 106.3 108.2 106.4 106.3 106.4
Jan 2019 104.6 102.2 106.0 110.5 107.6 109.5 106.4 109.9 108.2 107.4 108.1
Dec 2019 105.7 102.7 107.8 112.6 109.0 111.1 107.6 111.2 110.3 108.9 109.6
Source: ONS, Index of Private Housing Rental Prices (IPHRP) 2019
*Index level (January 2015 = 100)
5.26 The North West region has seen the second lowest inflation in
private rents since January 2015, although this could clearly mask
significant differences across the region. Rental increases have
been the highest in the south and east of the country.
City centre rental market
5.27 Within Greater Manchester, rental growth was particularly
significant in Manchester and Salford where percentage change was
higher than the level recorded nationally. This growth is mainly
driven by the city centre new build apartment market that has
expanded significantly especially so in the last decade.
5.28 Zoopla data shows rents in the city centre have been increasing
steadily since 2011/12, with a 16.2% change in rents over the last
five years. This is higher than the rate observed across Greater
Manchester (excluding the city centre), which was 10.2% for the
same period.
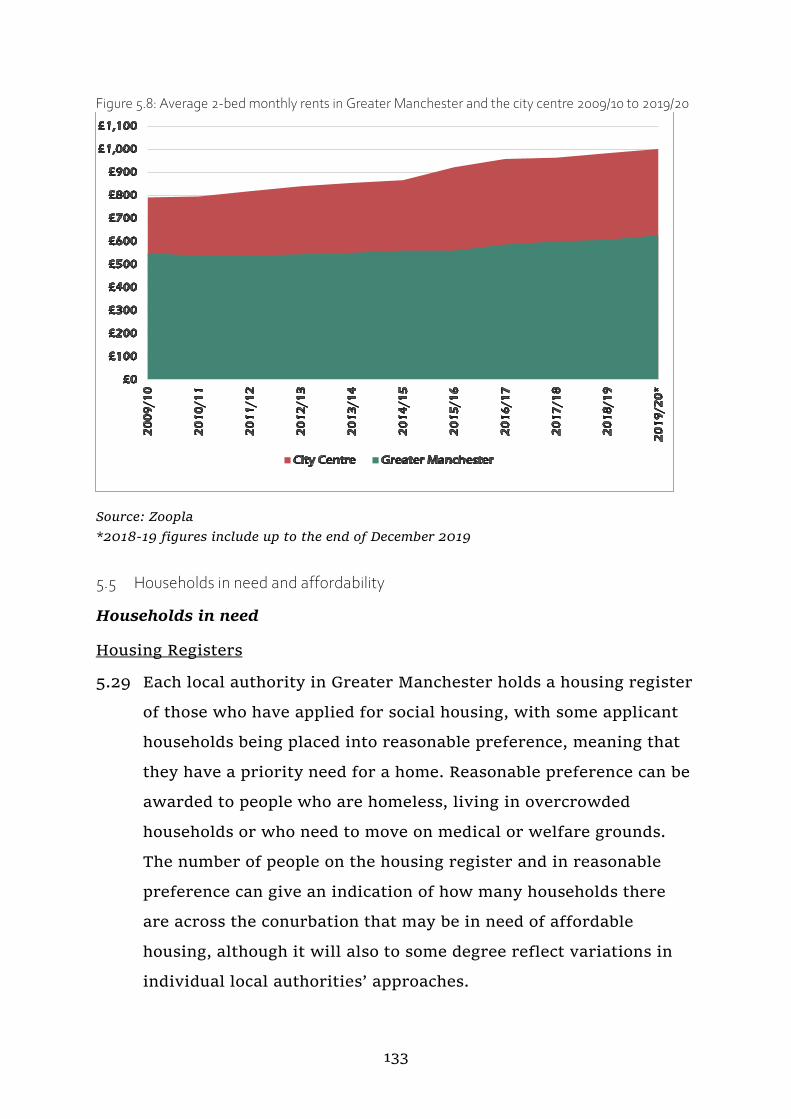
133
Figure 5.8: Average 2-bed monthly rents in Greater Manchester and the city centre 2009/10 to 2019/20
Source: Zoopla
*2018-19 figures include up to the end of December 2019
5.5 Households in need and affordability
Households in need
Housing Registers
5.29 Each local authority in Greater Manchester holds a housing register
of those who have applied for social housing, with some applicant
households being placed into reasonable preference, meaning that
they have a priority need for a home. Reasonable preference can be
awarded to people who are homeless, living in overcrowded
households or who need to move on medical or welfare grounds.
The number of people on the housing register and in reasonable
preference can give an indication of how many households there
are across the conurbation that may be in need of affordable
housing, although it will also to some degree reflect variations in
individual local authorities’ approaches.
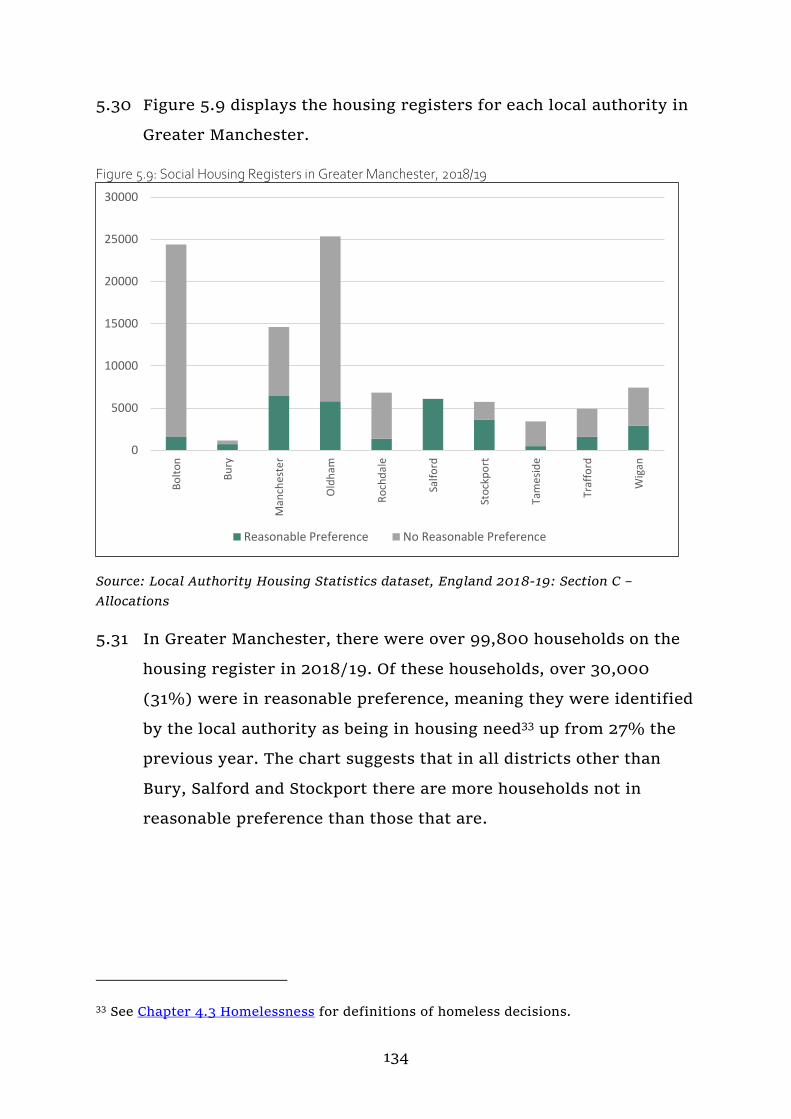
134
5.30 Figure 5.9 displays the housing registers for each local authority in
Greater Manchester.
Figure 5.9: Social Housing Registers in Greater Manchester, 2018/19
Source: Local Authority Housing Statistics dataset, England 2018-19: Section C –
Allocations
5.31 In Greater Manchester, there were over 99,800 households on the
housing register in 2018/19. Of these households, over 30,000
(31%) were in reasonable preference, meaning they were identified
by the local authority as being in housing need33 up from 27% the
previous year. The chart suggests that in all districts other than
Bury, Salford and Stockport there are more households not in
reasonable preference than those that are.
33 See Chapter 4.3 Homelessness for definitions of homeless decisions.
0
5000
10000
15000
20000
25000
30000
Bo
lto
n
Bu
ry
Man
ches
ter
Old
ham
Ro
chd
ale
Salf
ord
Sto
ckp
ort
Tam
esi
de
Traf
ford
Wig
an
Reasonable Preference No Reasonable Preference
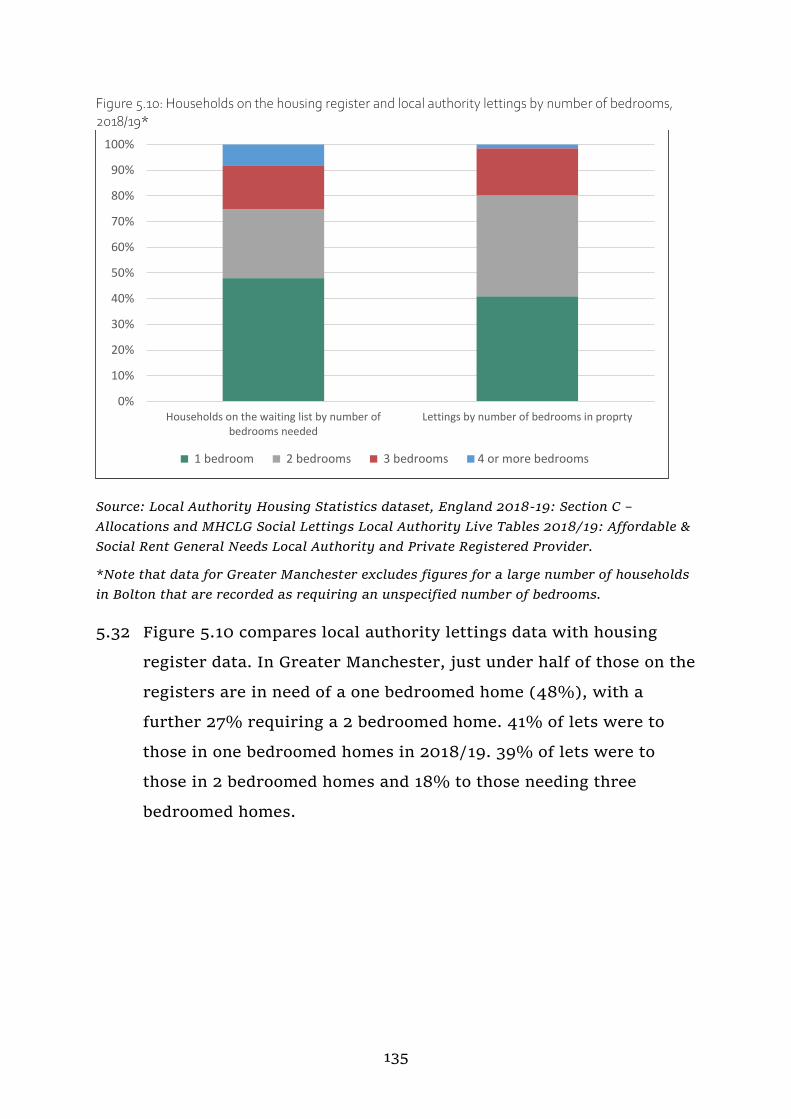
135
Figure 5.10: Households on the housing register and local authority lettings by number of bedrooms, 2018/19*
Source: Local Authority Housing Statistics dataset, England 2018-19: Section C –
Allocations and MHCLG Social Lettings Local Authority Live Tables 2018/19: Affordable &
Social Rent General Needs Local Authority and Private Registered Provider.
*Note that data for Greater Manchester excludes figures for a large number of households
in Bolton that are recorded as requiring an unspecified number of bedrooms.
5.32 Figure 5.10 compares local authority lettings data with housing
register data. In Greater Manchester, just under half of those on the
registers are in need of a one bedroomed home (48%), with a
further 27% requiring a 2 bedroomed home. 41% of lets were to
those in one bedroomed homes in 2018/19. 39% of lets were to
those in 2 bedroomed homes and 18% to those needing three
bedroomed homes.
0%
10%
20%
30%
40%
50%
60%
70%
80%
90%
100%
Households on the waiting list by number ofbedrooms needed
Lettings by number of bedrooms in proprty
1 bedroom 2 bedrooms 3 bedrooms 4 or more bedrooms
136
Affordability
Defining affordability
5.34 The Institute for Public Policy Research (IPPR) looked at definitions
of affordability in their 2017 report on the affordability crisis in
London.34 They found that:
the commonly accepted way of assessing upfront affordability is as a
proportion of net household income (after taxes and benefits). Within
this, the most widely accepted measure is a 35 per cent threshold of
total household income (Bibby 2015), below which housing is
considered to be affordable and above which it is deemed
unaffordable.35
5.35 However, in the report they note that this is not applied
universally, with other examples including:
The Mayor of London applies a measure of 40% of net income to
intermediate housing.
The Joseph Rowntree Foundation (JRF) has devised the
Minimum Income Standard to determine the necessary income
needed to maintain an adequate standard of living.36
The other measure IPPR use is a loan-to-income ratio (mortgage
to household income) to ensure that where upfront costs are
affordable under the 35% net income cap, a household would
actually be capable of getting a mortgage.
5.36 IPPR conclude that:
In truth, no measure is perfect because some households will always
be willing to pay more than others and one might argue that those at
34 IPPR (2017), Priced Out? The affordability crisis in London. Available at:
https://www.ippr.org/research/publications/priced-out 35 Bibby (2015), What is ‘affordable housing’? Shelter. Available at:
http://blog.shelter.org.uk/2015/08/what-is-affordable-housing/ 36 The Minimum Income Standard is calculated based on research with groups of
members of the public specifying what items need to be included in a minimum
household budget. See more here:
http://www.lboro.ac.uk/research/crsp/mis/whatismis/
137
the upper end of the income spectrum with greater levels of
disposable income can more easily afford higher housing costs.
(IPPR, 2017)
5.37 The definition of affordable housing used by Government and set
out in the NPPF37 is as follows:
Affordable housing: housing for sale or rent, for those whose needs are not met by the
market (including housing that provides a subsidised route to home ownership and/or is
for essential local workers); and which complies with one or more of the following
definitions:
a) Affordable housing for rent: meets all of the following conditions: (a) the rent is set
in accordance with the Government’s rent policy for Social Rent or Affordable Rent, or is
at least 20% below local market rents (including service charges where applicable); (b)
the landlord is a registered provider, except where it is included as part of a Build to
Rent scheme (in which case the landlord need not be a registered provider); and (c) it
includes provisions to remain at an affordable price for future eligible households, or
for the subsidy to be recycled for alternative affordable housing provision. For Build to
Rent schemes affordable housing for rent is expected to be the normal form of
affordable housing provision (and, in this context, is known as Affordable Private Rent).
b) Starter homes: is as specified in Sections 2 and 3 of the Housing and Planning Act
2016 and any secondary legislation made under these sections. The definition of a
starter home should reflect the meaning set out in statute and any such secondary
legislation at the time of plan-preparation or decision-making. Where secondary
legislation has the effect of limiting a household’s eligibility to purchase a starter home
to those with a particular maximum level of household income, those restrictions should
be used.
c) Discounted market sales housing: is that sold at a discount of at least 20% below
local market value. Eligibility is determined with regard to local incomes and local
house prices. Provisions should be in place to ensure housing remains at a discount for
future eligible households.
d) Other affordable routes to home ownership: is housing provided for sale that
provides a route to ownership for those who could not achieve home ownership through
the market. It includes shared ownership, relevant equity loans, other low-cost homes
for sale (at a price equivalent to at least 20% below local market value) and rent to buy
(which includes a period of intermediate rent). Where public grant funding is provided,
there should be provisions for the homes to remain at an affordable price for future
eligible households, or for any receipts to be recycled for alternative affordable housing
provision, or refunded to Government or the relevant authority specified in the funding
agreement.
37 NPPF Annex 2, July 2018. Available at:
https://www.gov.uk/government/publications/national-planning-policy-framework--2
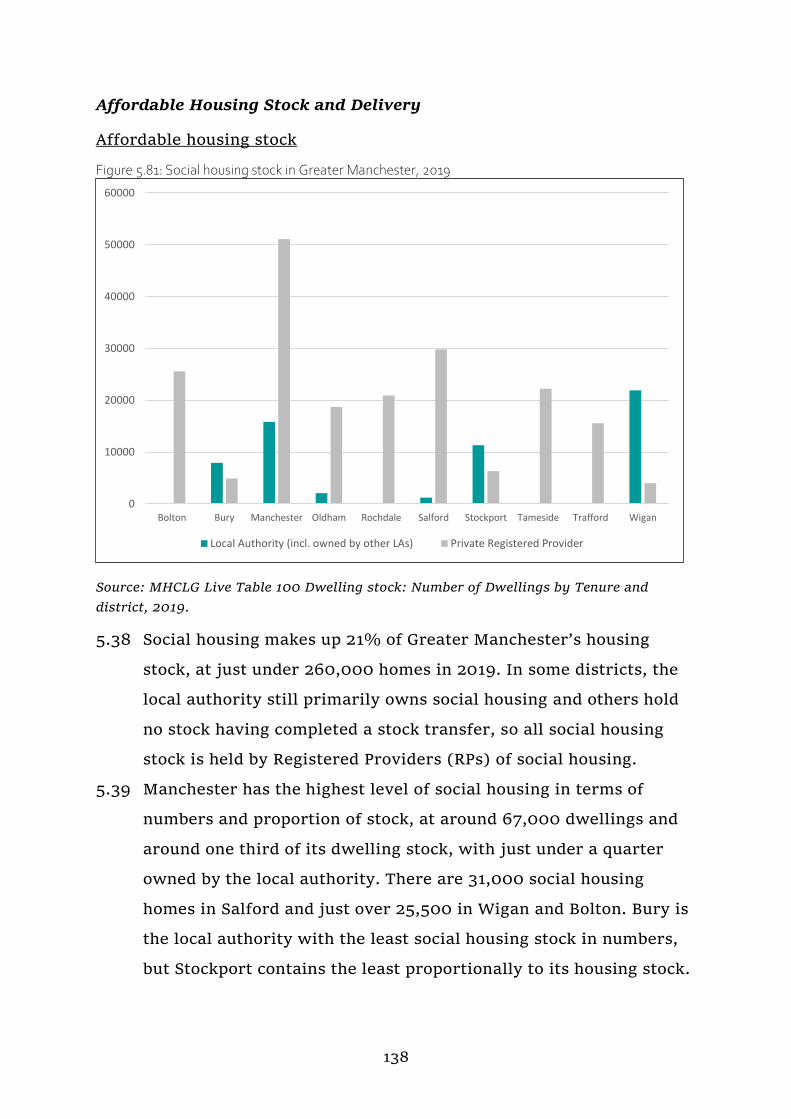
138
Affordable Housing Stock and Delivery
Affordable housing stock
Figure 5.81: Social housing stock in Greater Manchester, 2019
Source: MHCLG Live Table 100 Dwelling stock: Number of Dwellings by Tenure and
district, 2019.
5.38 Social housing makes up 21% of Greater Manchester’s housing
stock, at just under 260,000 homes in 2019. In some districts, the
local authority still primarily owns social housing and others hold
no stock having completed a stock transfer, so all social housing
stock is held by Registered Providers (RPs) of social housing.
5.39 Manchester has the highest level of social housing in terms of
numbers and proportion of stock, at around 67,000 dwellings and
around one third of its dwelling stock, with just under a quarter
owned by the local authority. There are 31,000 social housing
homes in Salford and just over 25,500 in Wigan and Bolton. Bury is
the local authority with the least social housing stock in numbers,
but Stockport contains the least proportionally to its housing stock.
0
10000
20000
30000
40000
50000
60000
Bolton Bury Manchester Oldham Rochdale Salford Stockport Tameside Trafford Wigan
Local Authority (incl. owned by other LAs) Private Registered Provider
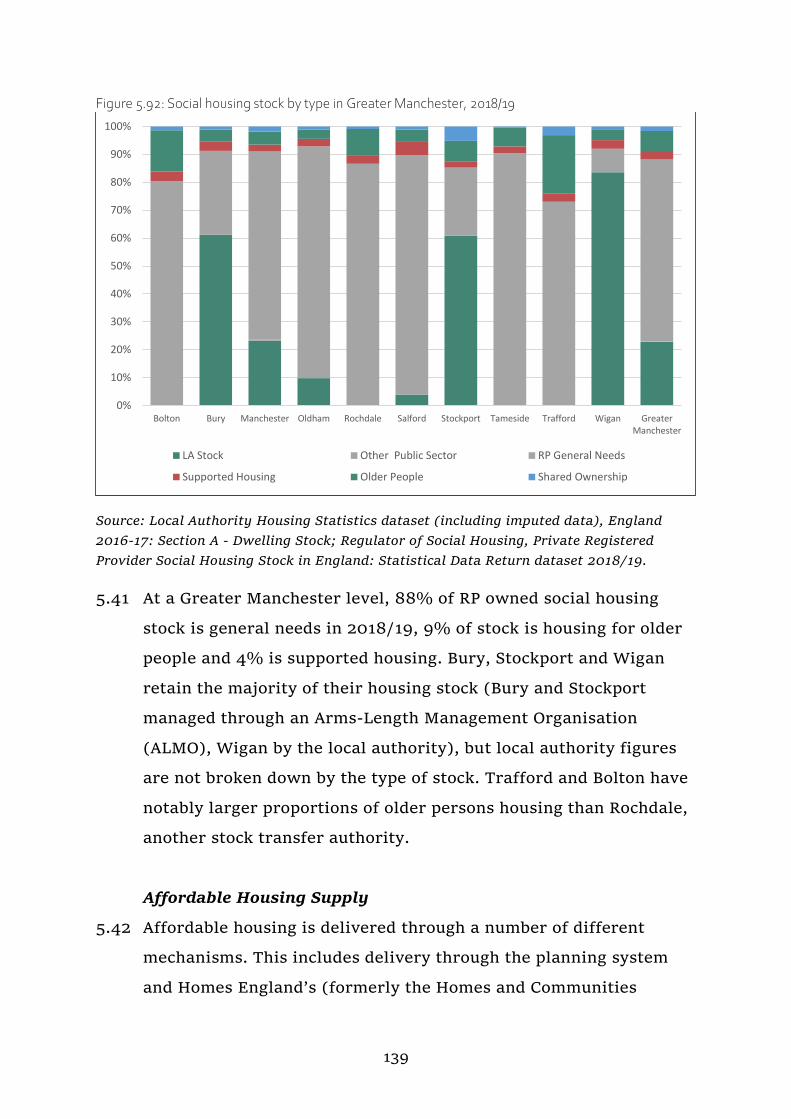
139
Figure 5.92: Social housing stock by type in Greater Manchester, 2018/19
Source: Local Authority Housing Statistics dataset (including imputed data), England
2016-17: Section A - Dwelling Stock; Regulator of Social Housing, Private Registered
Provider Social Housing Stock in England: Statistical Data Return dataset 2018/19.
5.41 At a Greater Manchester level, 88% of RP owned social housing
stock is general needs in 2018/19, 9% of stock is housing for older
people and 4% is supported housing. Bury, Stockport and Wigan
retain the majority of their housing stock (Bury and Stockport
managed through an Arms-Length Management Organisation
(ALMO), Wigan by the local authority), but local authority figures
are not broken down by the type of stock. Trafford and Bolton have
notably larger proportions of older persons housing than Rochdale,
another stock transfer authority.
Affordable Housing Supply
5.42 Affordable housing is delivered through a number of different
mechanisms. This includes delivery through the planning system
and Homes England’s (formerly the Homes and Communities
0%
10%
20%
30%
40%
50%
60%
70%
80%
90%
100%
Bolton Bury Manchester Oldham Rochdale Salford Stockport Tameside Trafford Wigan GreaterManchester
LA Stock Other Public Sector RP General Needs
Supported Housing Older People Shared Ownership
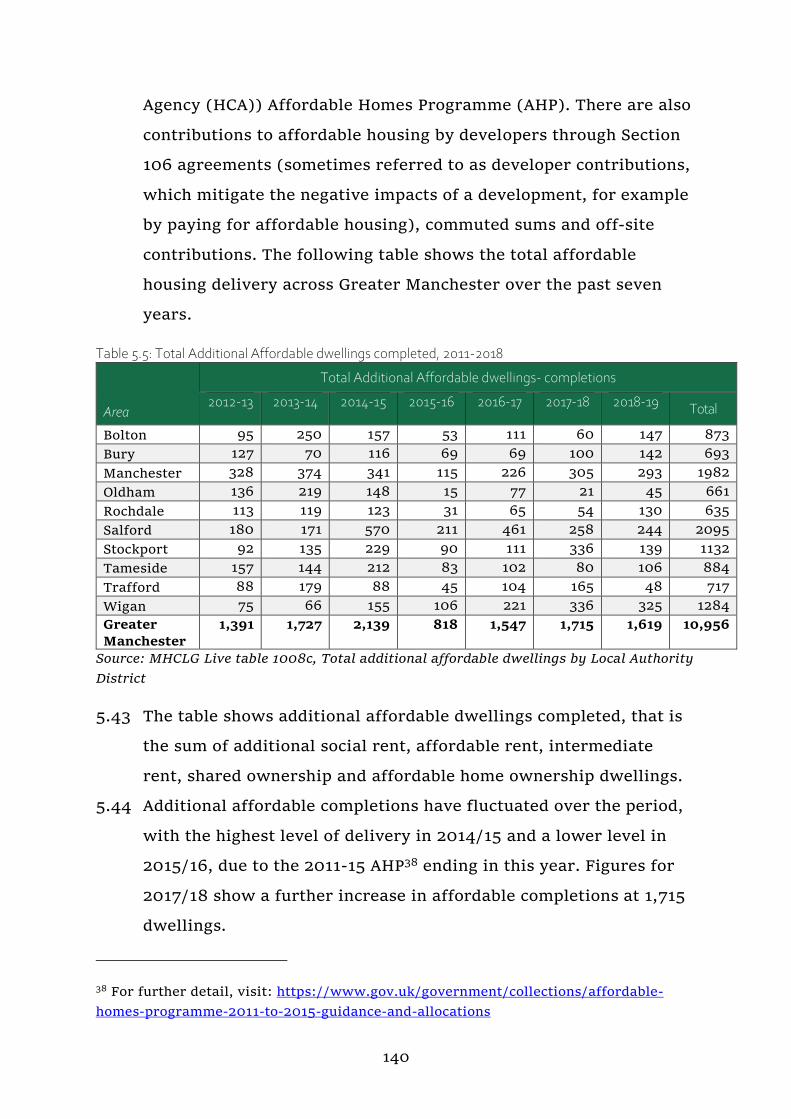
140
Agency (HCA)) Affordable Homes Programme (AHP). There are also
contributions to affordable housing by developers through Section
106 agreements (sometimes referred to as developer contributions,
which mitigate the negative impacts of a development, for example
by paying for affordable housing), commuted sums and off-site
contributions. The following table shows the total affordable
housing delivery across Greater Manchester over the past seven
years.
Table 5.5: Total Additional Affordable dwellings completed, 2011-2018
Area
Total Additional Affordable dwellings- completions
2012-13 2013-14 2014-15 2015-16 2016-17 2017-18 2018-19 Total
Bolton 95 250 157 53 111 60 147 873
Bury 127 70 116 69 69 100 142 693
Manchester 328 374 341 115 226 305 293 1982
Oldham 136 219 148 15 77 21 45 661
Rochdale 113 119 123 31 65 54 130 635
Salford 180 171 570 211 461 258 244 2095
Stockport 92 135 229 90 111 336 139 1132
Tameside 157 144 212 83 102 80 106 884
Trafford 88 179 88 45 104 165 48 717
Wigan 75 66 155 106 221 336 325 1284
Greater
Manchester
1,391 1,727 2,139 818 1,547 1,715 1,619 10,956
Source: MHCLG Live table 1008c, Total additional affordable dwellings by Local Authority
District
5.43 The table shows additional affordable dwellings completed, that is
the sum of additional social rent, affordable rent, intermediate
rent, shared ownership and affordable home ownership dwellings.
5.44 Additional affordable completions have fluctuated over the period,
with the highest level of delivery in 2014/15 and a lower level in
2015/16, due to the 2011-15 AHP38 ending in this year. Figures for
2017/18 show a further increase in affordable completions at 1,715
dwellings.
38 For further detail, visit: https://www.gov.uk/government/collections/affordable-
homes-programme-2011-to-2015-guidance-and-allocations

141
5.45 Manchester and Salford saw the highest numbers of additional
affordable dwellings over the period, accounting for 40% of
Greater Manchester’s total additional affordable homes. The lowest
levels of affordable completions in the period were in Bury,
Rochdale and Trafford.
5.46 The table shows additional affordable dwellings completed, that is
the sum of additional social rent, affordable rent, intermediate
rent, shared ownership and affordable home ownership dwellings.
Section 106 Delivery
5.47 The following table shows the number of homes delivered through
Section 106 agreements in Greater Manchester over the last three
years, by type. These numbers do not include average deals
negotiated, which may contribute to more affordable homes being
delivered. Stockport and Wigan have had the highest number of
Section 106 completions at 252 and 428 completions respectively.
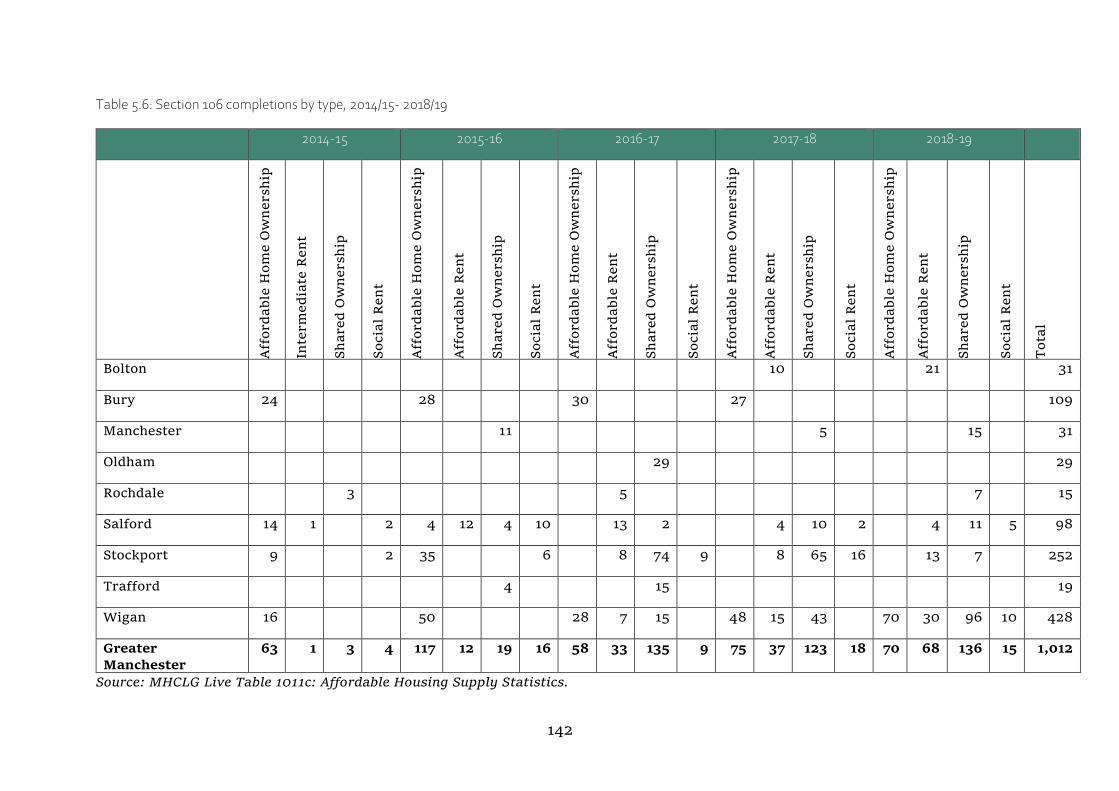
142
Table 5.6: Section 106 completions by type, 2014/15- 2018/19
Source: MHCLG Live Table 1011c: Affordable Housing Supply Statistics.
2014-15 2015-16 2016-17 2017-18 2018-19
Aff
ord
able
Hom
e O
wn
ersh
ip
Inte
rm
ed
iate
Ren
t
Sh
are
d O
wn
ersh
ip
Socia
l R
en
t
Aff
ord
able
Hom
e O
wn
ersh
ip
Aff
ord
able
Ren
t
Sh
are
d O
wn
ersh
ip
Socia
l R
en
t
Aff
ord
able
Hom
e O
wn
ersh
ip
Aff
ord
able
Ren
t
Sh
are
d O
wn
ersh
ip
Socia
l R
en
t
Aff
ord
able
Hom
e O
wn
ersh
ip
Aff
ord
able
Ren
t
Sh
are
d O
wn
ersh
ip
Socia
l R
en
t
Aff
ord
able
Hom
e O
wn
ersh
ip
Aff
ord
able
Ren
t
Sh
are
d O
wn
ersh
ip
Socia
l R
en
t
Tota
l
Bolton
10
21
31
Bury 24
28
30
27
109
Manchester
11
5
15
31
Oldham
29
29
Rochdale
3
5
7
15
Salford 14 1
2 4 12 4 10
13 2
4 10 2
4 11 5 98
Stockport 9
2 35
6
8 74 9
8 65 16
13 7
252
Trafford
4
15
19
Wigan 16
50
28 7 15
48 15 43
70 30 96 10 428
Greater
Manchester
63 1 3 4 117 12 19 16 58 33 135 9 75 37 123 18 70 68 136 15 1,012
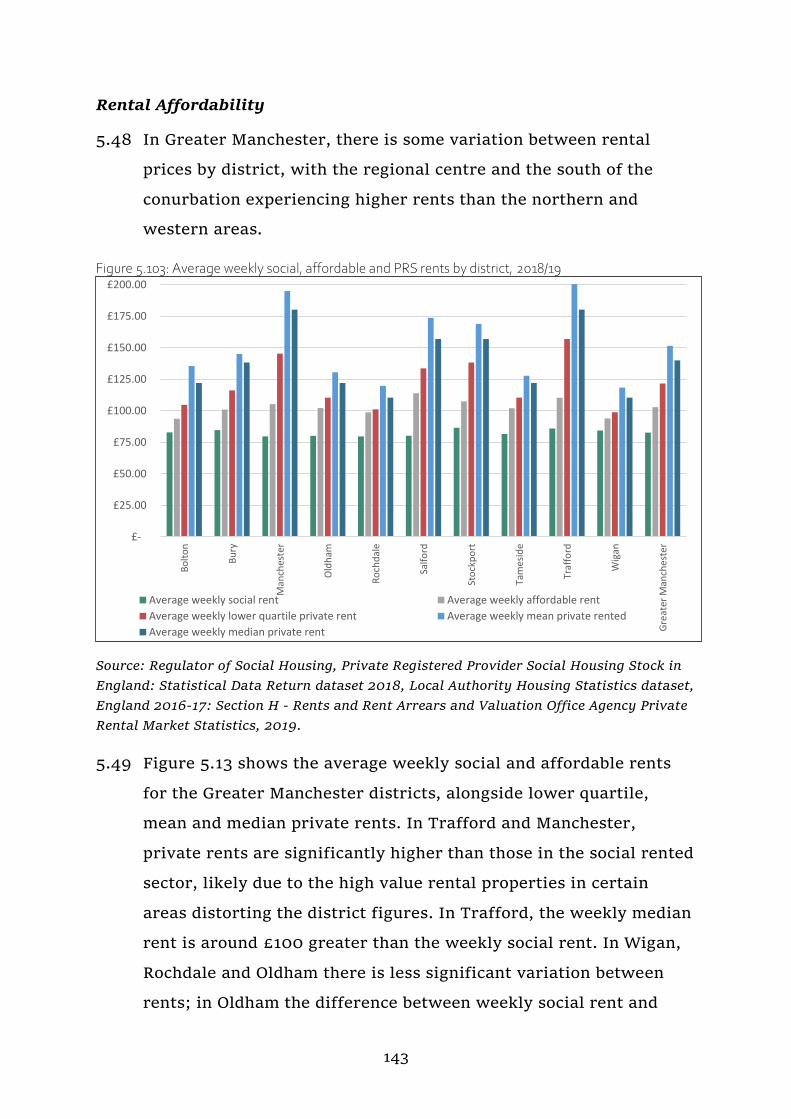
143
Rental Affordability
5.48 In Greater Manchester, there is some variation between rental
prices by district, with the regional centre and the south of the
conurbation experiencing higher rents than the northern and
western areas.
Figure 5.103: Average weekly social, affordable and PRS rents by district, 2018/19
Source: Regulator of Social Housing, Private Registered Provider Social Housing Stock in
England: Statistical Data Return dataset 2018, Local Authority Housing Statistics dataset,
England 2016-17: Section H - Rents and Rent Arrears and Valuation Office Agency Private
Rental Market Statistics, 2019.
5.49 Figure 5.13 shows the average weekly social and affordable rents
for the Greater Manchester districts, alongside lower quartile,
mean and median private rents. In Trafford and Manchester,
private rents are significantly higher than those in the social rented
sector, likely due to the high value rental properties in certain
areas distorting the district figures. In Trafford, the weekly median
rent is around £100 greater than the weekly social rent. In Wigan,
Rochdale and Oldham there is less significant variation between
rents; in Oldham the difference between weekly social rent and
£-
£25.00
£50.00
£75.00
£100.00
£125.00
£150.00
£175.00
£200.00
Bo
lto
n
Bu
ry
Man
ches
ter
Old
ham
Ro
chd
ale
Salf
ord
Sto
ckp
ort
Tam
esid
e
Traf
ford
Wig
an
Gre
ater
Man
che
ster
Average weekly social rent Average weekly affordable rent
Average weekly lower quartile private rent Average weekly mean private rented
Average weekly median private rent

144
median private rent is around £40, and in Wigan and Rochdale it is
around £30.
Figure 5.114: 30% of monthly household earnings in relation to renting the average privately rented property by district, 2018/19
Sources: Valuation Office Agency Private Rental Market Statistics, 2018; CACI Paycheck
2020.
5.50 Figure 5.14 shows private rents in relation to 30% of household
earnings. The chart suggests that Manchester is least affordable in
terms of monthly private rents; although this is likely to be the case
for many apartments in the regional centre, there are substantial
variations within the city that mean that the affordability challenge
may not be as stark as is depicted here.
5.51 Across Greater Manchester there appears to be more of an issue
around affordability at the lower quartile, with no boroughs having
lower quartile rents that are significantly lower than 30% of lower
quartile earnings. This suggests that those on lower incomes could
be spending a larger proportion of their earnings on housing costs
than those earning more money.
£-
£200.00
£400.00
£600.00
£800.00
£1,000.00
£1,200.00
£-
£200.00
£400.00
£600.00
£800.00
£1,000.00
£1,200.00
Bo
lto
n
Bu
ry
Man
ches
ter
Old
ham
Ro
chd
ale
Salf
ord
Sto
ckp
ort
Tam
esid
e
Traf
ford
Wig
an
LQ weekly PRS rent Median weekly PRS rent Mean weekly PRS rent
30% HH income - LQ (weekly) 30% HH income - median (weekly) 30% HH income - mean (weekly)
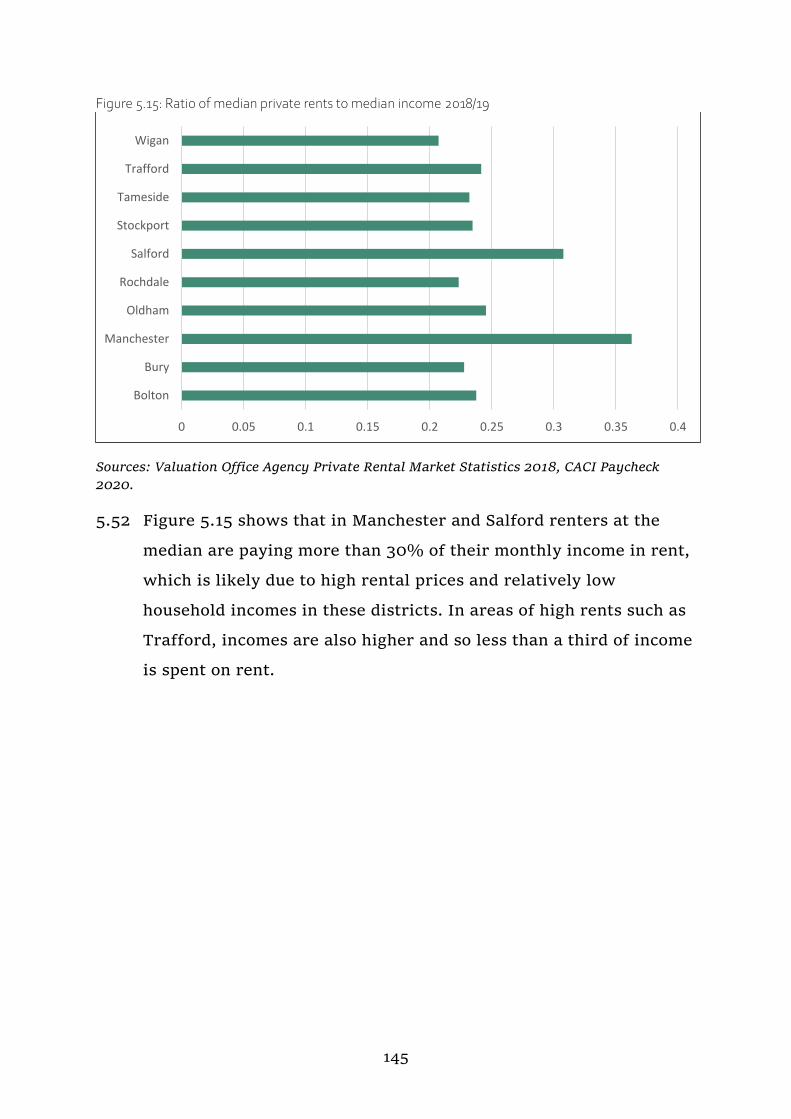
145
Figure 5.15: Ratio of median private rents to median income 2018/19
Sources: Valuation Office Agency Private Rental Market Statistics 2018, CACI Paycheck
2020.
5.52 Figure 5.15 shows that in Manchester and Salford renters at the
median are paying more than 30% of their monthly income in rent,
which is likely due to high rental prices and relatively low
household incomes in these districts. In areas of high rents such as
Trafford, incomes are also higher and so less than a third of income
is spent on rent.
0 0.05 0.1 0.15 0.2 0.25 0.3 0.35 0.4
Bolton
Bury
Manchester
Oldham
Rochdale
Salford
Stockport
Tameside
Trafford
Wigan
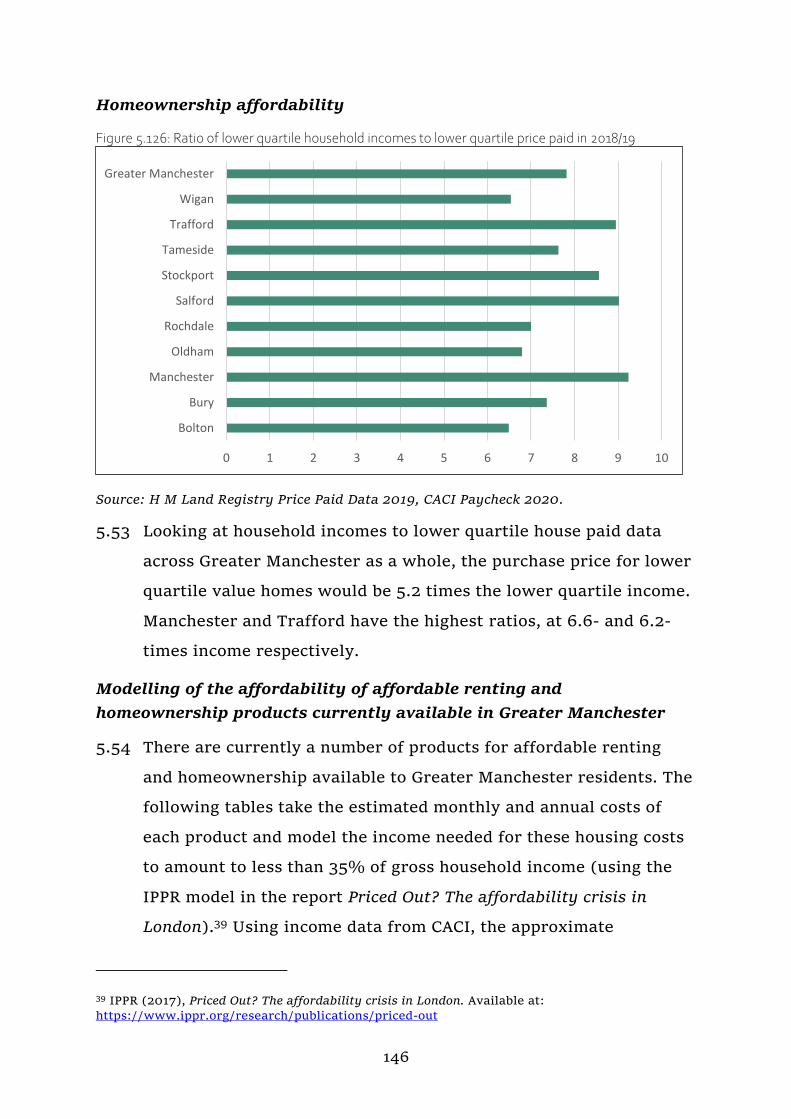
146
Homeownership affordability
Figure 5.126: Ratio of lower quartile household incomes to lower quartile price paid in 2018/19
Source: H M Land Registry Price Paid Data 2019, CACI Paycheck 2020.
5.53 Looking at household incomes to lower quartile house paid data
across Greater Manchester as a whole, the purchase price for lower
quartile value homes would be 5.2 times the lower quartile income.
Manchester and Trafford have the highest ratios, at 6.6- and 6.2-
times income respectively.
Modelling of the affordability of affordable renting and
homeownership products currently available in Greater Manchester
5.54 There are currently a number of products for affordable renting
and homeownership available to Greater Manchester residents. The
following tables take the estimated monthly and annual costs of
each product and model the income needed for these housing costs
to amount to less than 35% of gross household income (using the
IPPR model in the report Priced Out? The affordability crisis in
London).39 Using income data from CACI, the approximate
39 IPPR (2017), Priced Out? The affordability crisis in London. Available at:
https://www.ippr.org/research/publications/priced-out
0 1 2 3 4 5 6 7 8 9 10
Bolton
Bury
Manchester
Oldham
Rochdale
Salford
Stockport
Tameside
Trafford
Wigan
Greater Manchester

147
proportion of households that fall below this income level has been
calculated.
Table 5.7: Renting options in Greater Manchester (based on 2-bedroomed rental values)
Product Total
monthly payment
Total annual
payment
Income needed to spend less than 35%
on housing
costs
Approx. % Greater
Manchester households
below income level
needed*
Sources Assumptions
Social rent £355 £4,263 £12,180 23%
Private Registered
Provider Social
Housing Stock in
England:
Statistical Data
Return dataset
2019
Assumes
average of
RP Social
Rent in
Greater
Manchester,
2018/19 Affordable
rent £442 £5,308 £15,167 23%
Private Registered
Provider Social
Housing Stock in
England:
Statistical Data
Return dataset
2019
Private
rent: lower
quartile
£523 £6,276 £17,931 34% VOA Private
Rental Market
Summary
Statistics
Private
rent:
median
£602 £7,224 £20,640 34%
Rent to
Buy: just
rental costs
£482 £5,779 £16,512 34% Modelled from
VOA
Assumes
rental costs
to be 80% of
median rent
*Proportion of households below required income level modelled from CACI data which is displayed
in £5k income bands, approximate proportions have been modelled assuming an even split of people
across all incomes in bands.
5.55 The table shows that approximately 20% of Greater Manchester
households are at an income level below that needed to afford
social rents and affordable rent. However, analysis of Housing
Benefit (HB) and Universal Credit (UC) data suggests that at least
70% of households in the social rented sector in Greater
Manchester are in receipt of HB or UC covering housing costs. This
148
suggests that those who would not be able to afford their rent are
covered by HB.40 It is likely also that some low-income households
will be owner-occupiers who own their homes outright. While that
still raises questions about their financial ability to maintain their
property, this does mean that the figures above may overstate the
proportions of Greater Manchester households below each of the
thresholds identified.
5.56 Nonetheless, with that caveat, the model suggests that lower
quartile private rents are unaffordable to approximately 34% of
households in Greater Manchester and at the median private rent of
£604 per month.
5.57 Interestingly, the Rent to Buy product, which allows households to
rent a property at 80% of the median rent in order to save for a
deposit to buy the property, could potentially be more affordable
than even lower quartile rents, which are more than 80% of the
median. However, the product is targeted by Government at
households who are unable to afford market rent and thus by
definition will find it hard to save up a deposit to buy.
5.58 However, as discussed earlier, all these rent levels and incomes are
Greater Manchester average figures. Local variations within the
market in each district may offer the scope for individual
households to seek lower cost choices within the various elements
of the rental sector and thus this high- level analysis potentially
overstates the affordability problem at Greater Manchester level.
40 Analysis of HB data shows that in May 2017, 173,100 people were claiming HB or
households were claiming the housing element of UC (Source: DWP Stat-Xplore) This is
70% of the households in the social rented sector at the 2011 Census (247,540); trends
suggest that the number of households in the social rented sector in 2017 are likely to be
lower than that at the 2011 Census.
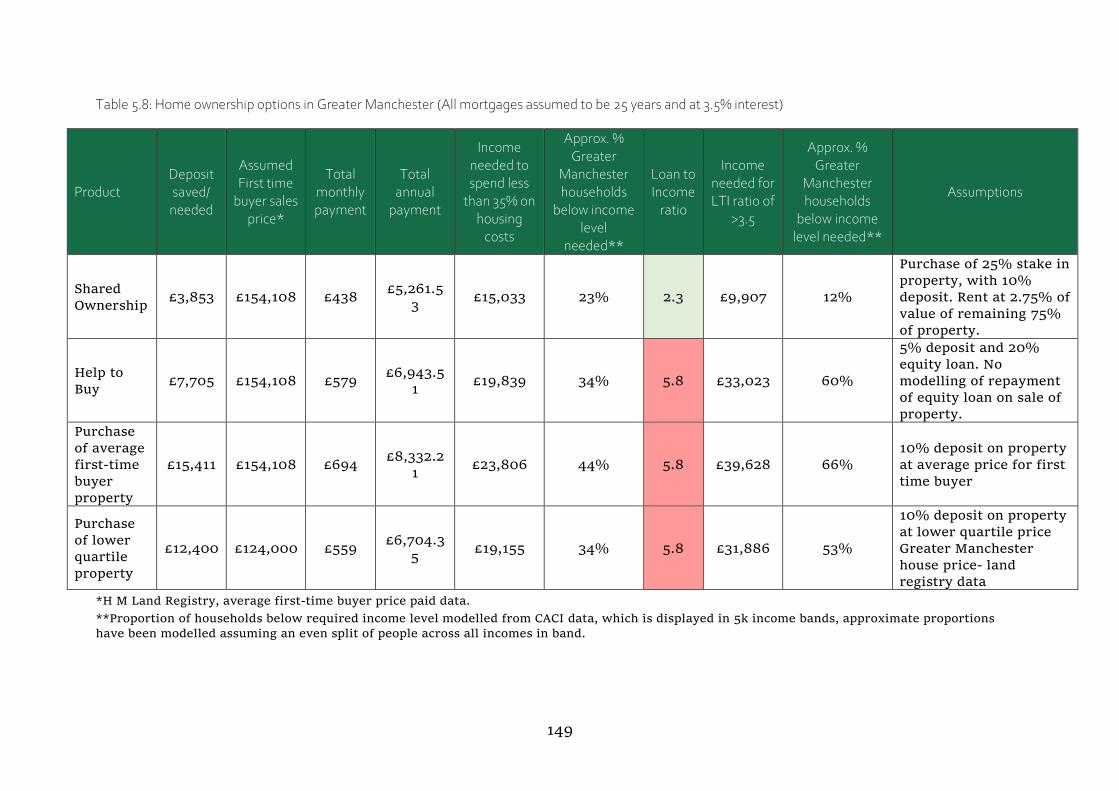
149
Table 5.8: Home ownership options in Greater Manchester (All mortgages assumed to be 25 years and at 3.5% interest)
*H M Land Registry, average first-time buyer price paid data.
**Proportion of households below required income level modelled from CACI data, which is displayed in 5k income bands, approximate proportions
have been modelled assuming an even split of people across all incomes in band.
Product Deposit saved/
needed
Assumed First time
buyer sales price*
Total monthly payment
Total annual
payment
Income needed to spend less
than 35% on housing
costs
Approx. % Greater
Manchester households
below income level
needed**
Loan to Income
ratio
Income needed for LTI ratio of
>3.5
Approx. % Greater
Manchester households
below income level needed**
Assumptions
Shared
Ownership £3,853 £154,108 £438
£5,261.5
3 £15,033 23% 2.3 £9,907 12%
Purchase of 25% stake in
property, with 10%
deposit. Rent at 2.75% of
value of remaining 75%
of property.
Help to
Buy £7,705 £154,108 £579
£6,943.5
1 £19,839 34% 5.8 £33,023 60%
5% deposit and 20%
equity loan. No
modelling of repayment
of equity loan on sale of
property.
Purchase
of average
first-time
buyer
property
£15,411 £154,108 £694 £8,332.2
1 £23,806 44% 5.8 £39,628 66%
10% deposit on property
at average price for first
time buyer
Purchase
of lower
quartile
property
£12,400 £124,000 £559 £6,704.3
5 £19,155 34% 5.8 £31,886 53%
10% deposit on property
at lower quartile price
Greater Manchester
house price- land
registry data
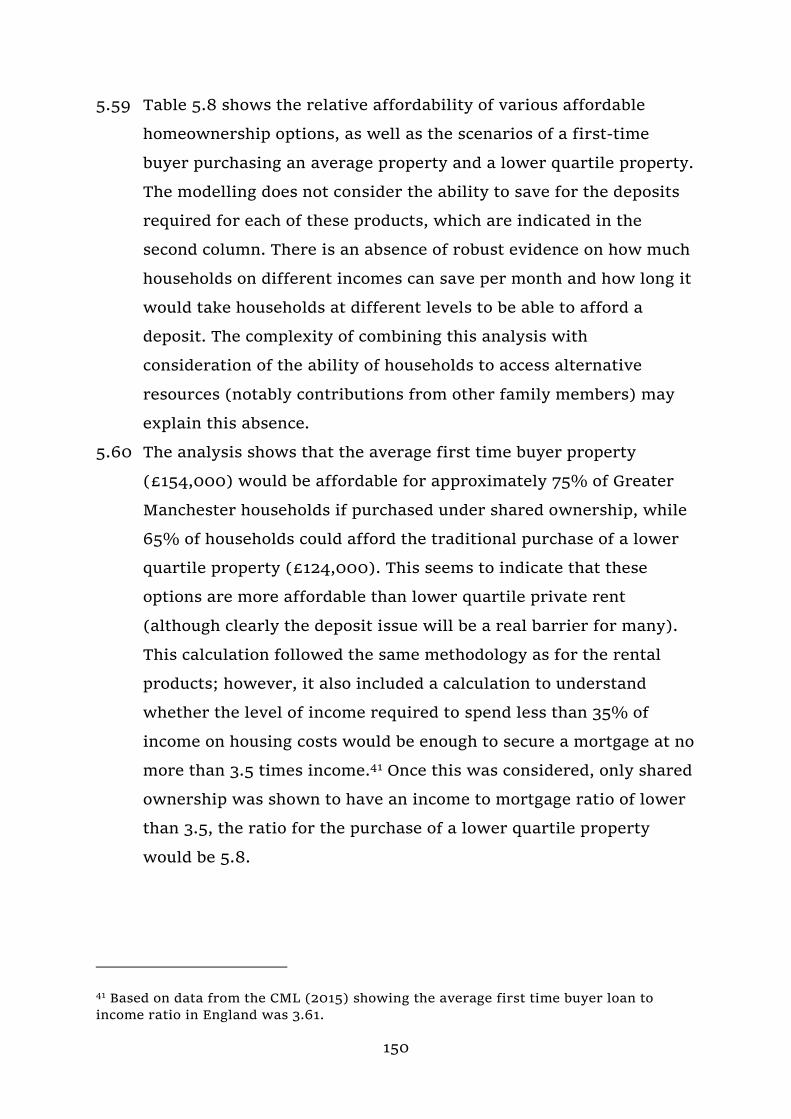
150
5.59 Table 5.8 shows the relative affordability of various affordable
homeownership options, as well as the scenarios of a first-time
buyer purchasing an average property and a lower quartile property.
The modelling does not consider the ability to save for the deposits
required for each of these products, which are indicated in the
second column. There is an absence of robust evidence on how much
households on different incomes can save per month and how long it
would take households at different levels to be able to afford a
deposit. The complexity of combining this analysis with
consideration of the ability of households to access alternative
resources (notably contributions from other family members) may
explain this absence.
5.60 The analysis shows that the average first time buyer property
(£154,000) would be affordable for approximately 75% of Greater
Manchester households if purchased under shared ownership, while
65% of households could afford the traditional purchase of a lower
quartile property (£124,000). This seems to indicate that these
options are more affordable than lower quartile private rent
(although clearly the deposit issue will be a real barrier for many).
This calculation followed the same methodology as for the rental
products; however, it also included a calculation to understand
whether the level of income required to spend less than 35% of
income on housing costs would be enough to secure a mortgage at no
more than 3.5 times income.41 Once this was considered, only shared
ownership was shown to have an income to mortgage ratio of lower
than 3.5, the ratio for the purchase of a lower quartile property
would be 5.8.
41 Based on data from the CML (2015) showing the average first time buyer loan to
income ratio in England was 3.61.

151
5.6 Housing development rates
5.59 MHCLG Live Table 122 provides data on the number of net
additional dwellings provided each year since 2001. This data is
based on the Housing Flows Reconciliation (HFR) forms completed
by local authorities; there are some differences between the
figures in the Live Table and those reported by districts through
their development monitoring. This is likely to be partly a result of
MHCLG information being rebased in light of the 2011 Census.
5.60 There were 11,525 net additional dwellings built in Greater
Manchester in 2018/19. This is a 29% increase on the 2017/18
completions. Notably Salford developed 117% more dwellings than
in 2017/18. Nationally there was a 9% increase in net additional
dwellings and only Manchester, Stockport and Rochdale were below
this national change figure with Manchester and Stockport
experiencing some decline.
Figure 5.137: Net additional dwellings in Greater Manchester, 2001/02 – 2018/19
Source: MHCLG Live Table 122 Net additional dwellings by local authority district,
England.
0
2,000
4,000
6,000
8,000
10,000
12,000
14,000
16,000
20
01
-02
20
02
-03
20
03
-04
20
04
-05
20
05
-06
20
06
-07
20
07
-08
20
08
-09
20
09
-10
20
10
-11
20
11
-12
20
12
-13
20
13
-14
20
14
-15
20
15
-16
20
16
-17
20
17
-18
20
18
-19
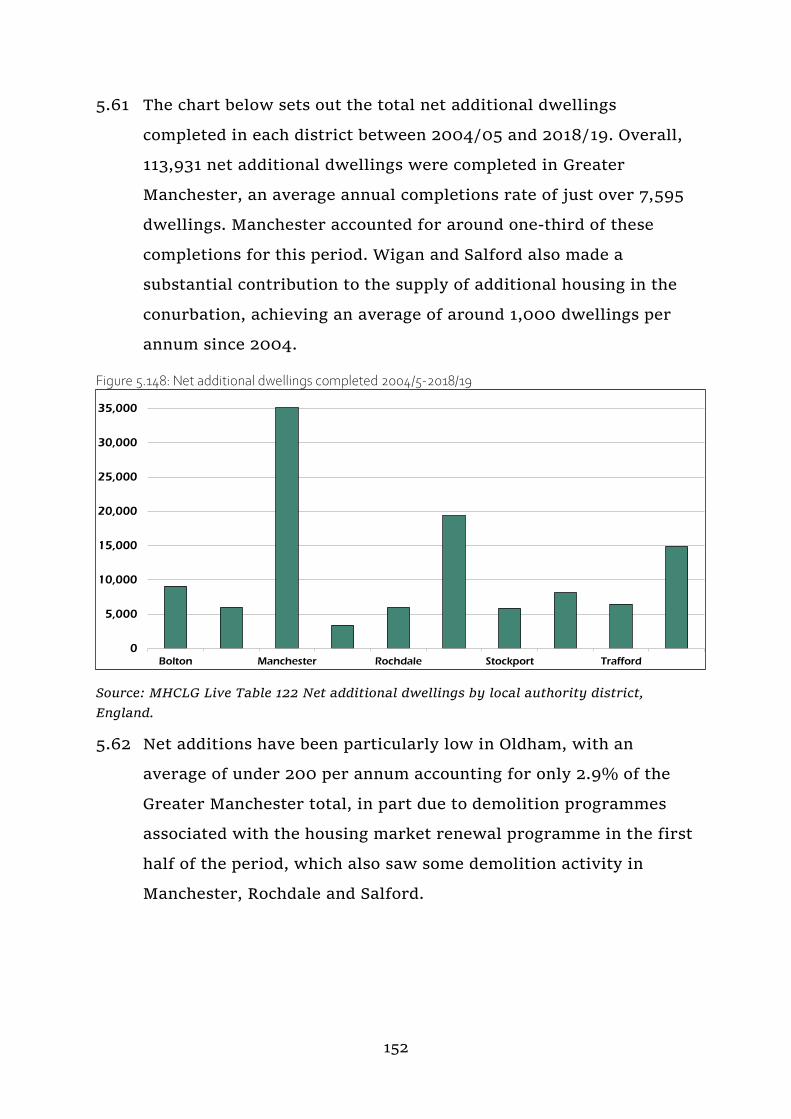
152
5.61 The chart below sets out the total net additional dwellings
completed in each district between 2004/05 and 2018/19. Overall,
113,931 net additional dwellings were completed in Greater
Manchester, an average annual completions rate of just over 7,595
dwellings. Manchester accounted for around one-third of these
completions for this period. Wigan and Salford also made a
substantial contribution to the supply of additional housing in the
conurbation, achieving an average of around 1,000 dwellings per
annum since 2004.
Figure 5.148: Net additional dwellings completed 2004/5-2018/19
Source: MHCLG Live Table 122 Net additional dwellings by local authority district,
England.
5.62 Net additions have been particularly low in Oldham, with an
average of under 200 per annum accounting for only 2.9% of the
Greater Manchester total, in part due to demolition programmes
associated with the housing market renewal programme in the first
half of the period, which also saw some demolition activity in
Manchester, Rochdale and Salford.
0
5,000
10,000
15,000
20,000
25,000
30,000
35,000
Bolton Manchester Rochdale Stockport Trafford

153
5.7 Overcrowding, under-occupation and concealed households
Overcrowding and under-occupancy
5.64 Between 2001 and 2011, all Greater Manchester districts saw an
increase in overcrowding, as was the case nationally. Most of the
increase was in households requiring one additional room to meet
the Census standard. The rise in the proportion of households
requiring two or more additional rooms was generally low and
seven Greater Manchester districts saw a decline on this measure
(Bury, Oldham, Rochdale, Stockport, Tameside, Trafford and
Wigan).
5.65 Table 5.9 compares the levels of overcrowding recorded between
the 2001 and 2011 Census periods. The Census uses the ‘room’
rather than ‘bedroom’ definition but the occupancy level is
calculated in the same way as described above. Using this measure
of ‘rooms’, overcrowding in Greater Manchester is below the
national average but the gap has narrowed very slightly between
2001 and 2011.
Table 5.9: Percentage change in level of overcrowding (total number of rooms short) 2001-2011
Area 2001 2011
1 room 2+ rooms Total 1 room 2+ rooms Total Bolton 4.5 1.5 6.0 5.4 1.5 6.9
Bury 3.8 1.2 4.9 4.3 1.0 5.3
Manchester 7.7 3.5 11.2 12.2 4.2 16.4
Oldham 5.1 2.2 7.3 5.7 1.9 7.6
Rochdale 5.2 1.9 7.0 6.0 1.8 7.8
Salford 4.6 1.3 5.9 7.2 2.4 9.5
Stockport 3.5 1.0 4.5 3.9 0.9 4.8
Tameside 4.6 1.2 5.8 4.9 1.2 6.1
Trafford 3.4 1.3 4.7 4.4 1.2 5.6
Wigan 3.3 0.9 4.2 3.6 0.9 4.4
Greater Manchester 4.7 1.7 6.4 6.3 1.9 8.2
England 5.0 2.1 7.1 6.4 2.3 8.7
Source: 2001 Census and 2011 Census.
5.66 Both Manchester and Salford saw a significant increase in
overcrowding, with Manchester more closely resembling the
154
situation in London. Salford scored comparatively much worse on
the ‘rooms’ measure than on the ‘bedrooms’ measure. The
remaining Greater Manchester districts in general saw quite
modest increases in overcrowding over this period.
5.67 The rooms’ occupancy rating assumes that every household,
including one-person households, requires a minimum of two
rooms excluding bathrooms, in addition to the number of
bedrooms needed. Based on this definition it is likely that the
increase in overcrowding in Manchester and Salford is related to
the expanding apartment market across the two cities in recent
years, where there may only be one room other than bedrooms
and bathrooms, (for example where the kitchen and lounge are
combined rather than being separate). Such accommodation may
be adequate for the households involved and so an increase in
overcrowding on this measure may not necessarily mean that the
quantity or type of housing supply is not meeting household need.
Concealed families
5.68 Between 2001 and 2011, the number of concealed families living
with households in Greater Manchester increased from 8,300 to
13,640, an increase of 5,340 households (64%). As shown in Figure
5.19 below, the highest proportions of concealed families are in
Oldham, Manchester and Rochdale, with relatively low levels in
Wigan, Salford, Stockport and Bury.
155
Figure 5.159: Proportion of concealed families 2001 and 2011
Source: 2011 Census
5.69 Higher levels of concealment may not necessarily relate to issues of
housing availability and affordability, and the ONS has observed
that they could be a function of cultural issues:
Concealed family proportions may relate to cultural differences in
familial ties between ethnic groups. Within England and Wales,
‘other households’ are more than twice as likely to have a HRP
[household reference person] of non-white or mixed ethnic group (24
per cent) compared with all households (11 per cent). The ten LAs
[local authorities] with the highest proportions of concealed families
… also have the highest proportions of the population identifying
with a non-white ethnic group; high proportions of the population of
these areas identified as Indian, Pakistani or Bangladeshi. The high
proportions of concealed families in these areas may be a result of
closer familial ties in Asian cultures.42
5.70 Increases in the proportion of residents identifying themselves as
Asian may therefore explain the increase in the proportion of
concealed families at the regional and national levels identified
42 ONS (February 2014), What does the 2011 Census tell us about concealed families living
in multi-family households in England and Wales?, p.11
156
above. For example, the proportion of residents identifying
themselves as Asian has increased from 6% to 10% in Greater
Manchester, 3% to 6% in the North West and 5% to 8% in England
between 2001 and 2011.43
5.71 Manchester and Oldham have the highest proportions of residents
identifying themselves as Asian in Greater Manchester, as well as
the highest levels of overcrowding and concealed families, which
would seem to support the ONS hypothesis. Wigan has the lowest
proportions in Greater Manchester on all these measures, with
Salford and Stockport next lowest in terms of both the proportions
of concealment and of residents identifying themselves as Asian.
Further information on concealed families is available in Chapter 4.
5.8 Vacancy levels
5.72 Vacant dwellings, or empty homes, are a necessary part of any
functioning housing market as homes are bought, sold, re-let and
refurbished. Concentrations of empty homes vacant for extended
periods are potentially problematic, while conversely extremely
low levels of vacant properties may indicate extremely high
demand. Just over 2.5% of dwellings across Greater Manchester
were classed as empty in 2018, which is slightly lower than the
level in England as a whole (2.6%). At a district level, vacancy
rates were lowest in Manchester, at 1.7% and highest in Oldham
(3.1%). Between 2017 and 2018, the number of vacant dwellings in
Greater Manchester increased by 2.8% but this was lower than for
England (4.7%).
5.73 Table 5.10 below provides an overall comparison of the number and
proportion of vacant dwellings, including long-term empty homes
43 2001 Census and 2011 Census.
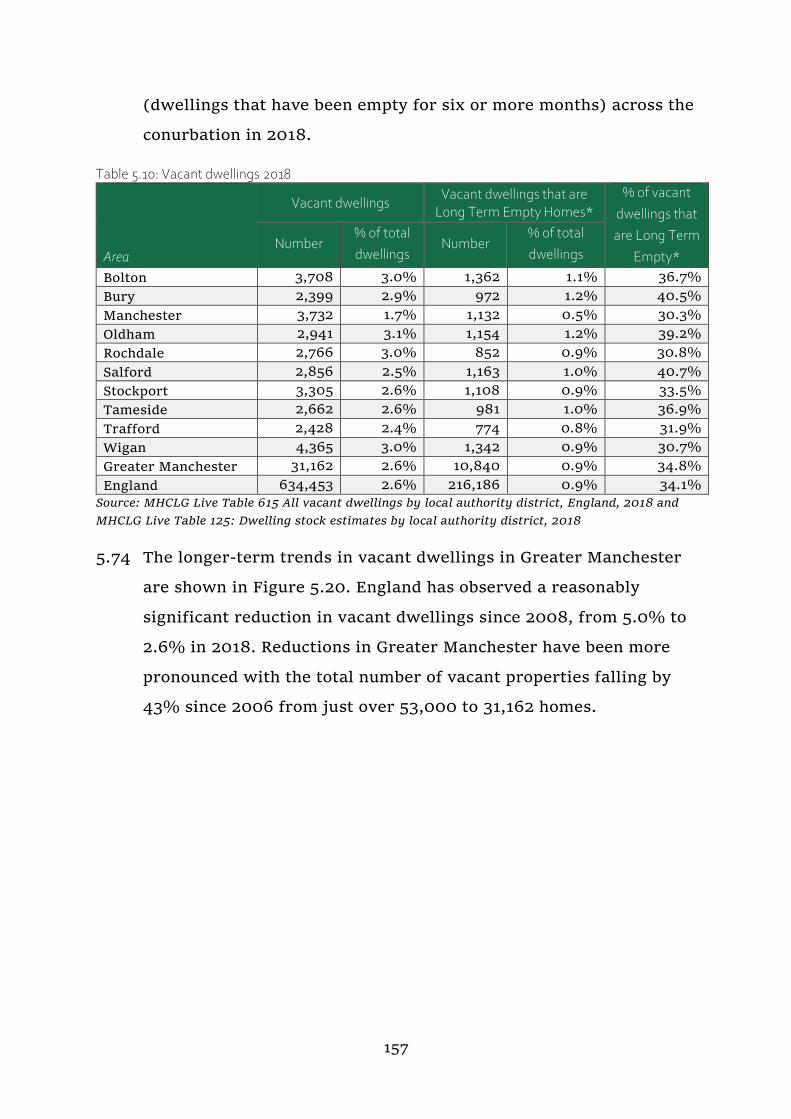
157
(dwellings that have been empty for six or more months) across the
conurbation in 2018.
Table 5.10: Vacant dwellings 2018
Area
Vacant dwellings Vacant dwellings that are
Long Term Empty Homes*
% of vacant
dwellings that
are Long Term
Empty* Number
% of total
dwellings Number
% of total
dwellings
Bolton 3,708 3.0% 1,362 1.1% 36.7%
Bury 2,399 2.9% 972 1.2% 40.5%
Manchester 3,732 1.7% 1,132 0.5% 30.3%
Oldham 2,941 3.1% 1,154 1.2% 39.2%
Rochdale 2,766 3.0% 852 0.9% 30.8%
Salford 2,856 2.5% 1,163 1.0% 40.7%
Stockport 3,305 2.6% 1,108 0.9% 33.5%
Tameside 2,662 2.6% 981 1.0% 36.9%
Trafford 2,428 2.4% 774 0.8% 31.9%
Wigan 4,365 3.0% 1,342 0.9% 30.7%
Greater Manchester 31,162 2.6% 10,840 0.9% 34.8%
England 634,453 2.6% 216,186 0.9% 34.1%
Source: MHCLG Live Table 615 All vacant dwellings by local authority district, England, 2018 and
MHCLG Live Table 125: Dwelling stock estimates by local authority district, 2018
5.74 The longer-term trends in vacant dwellings in Greater Manchester
are shown in Figure 5.20. England has observed a reasonably
significant reduction in vacant dwellings since 2008, from 5.0% to
2.6% in 2018. Reductions in Greater Manchester have been more
pronounced with the total number of vacant properties falling by
43% since 2006 from just over 53,000 to 31,162 homes.

158
Figure 5.20: Vacant dwellings 2004-2018
Source: MHCLG Live Table 615 All vacant dwellings by local authority district, England,
2004-2018 and MHCLG Live Table 125: Dwelling stock estimates by local authority
district, 2004-2018.
5.75 There has also been a significant reduction in long-term vacancies
in Greater Manchester, from a peak of 2.8% of all dwellings in
2008 to just under 0.9% in 2018, the same rate as that nationally.
Since 2006, long-term vacancies have reduced by 64%, from 28,815
in 2006 to 10,840 recorded in 2018. Almost 35% of all vacant
dwellings in Greater Manchester have been empty for over six
months, slightly higher than the England average (34%).
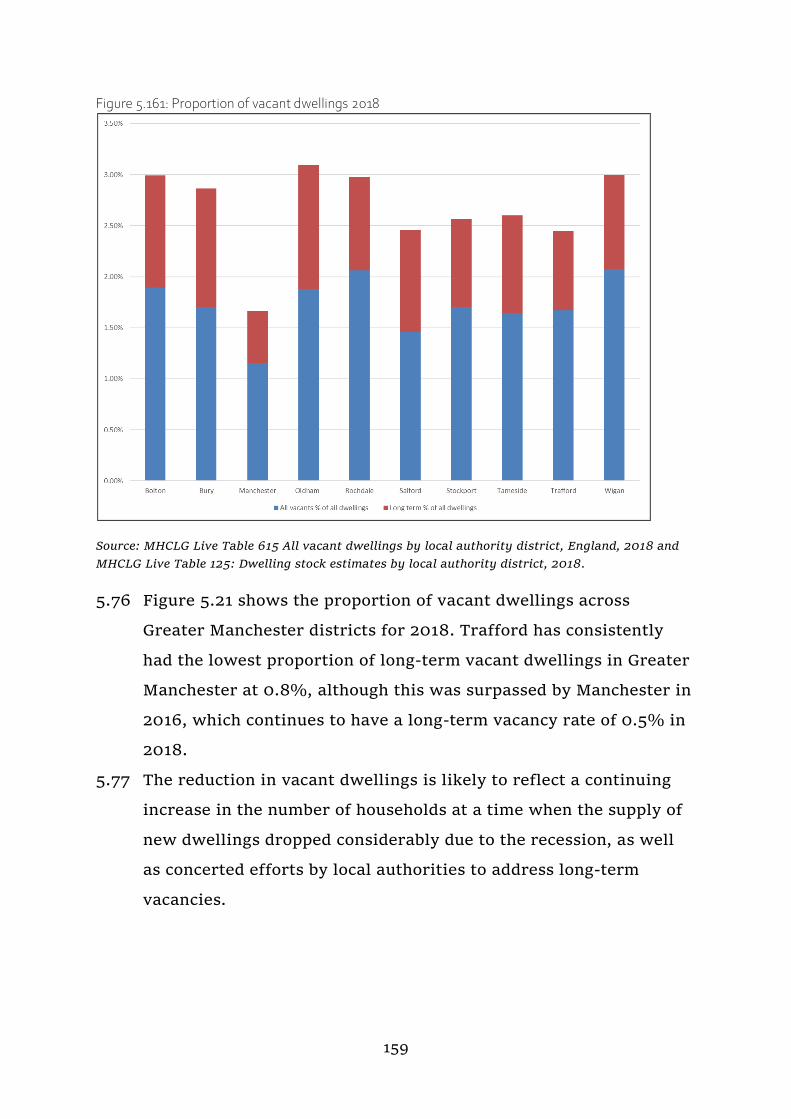
159
Figure 5.161: Proportion of vacant dwellings 2018
Source: MHCLG Live Table 615 All vacant dwellings by local authority district, England, 2018 and
MHCLG Live Table 125: Dwelling stock estimates by local authority district, 2018.
5.76 Figure 5.21 shows the proportion of vacant dwellings across
Greater Manchester districts for 2018. Trafford has consistently
had the lowest proportion of long-term vacant dwellings in Greater
Manchester at 0.8%, although this was surpassed by Manchester in
2016, which continues to have a long-term vacancy rate of 0.5% in
2018.
5.77 The reduction in vacant dwellings is likely to reflect a continuing
increase in the number of households at a time when the supply of
new dwellings dropped considerably due to the recession, as well
as concerted efforts by local authorities to address long-term
vacancies.

160
6 Housing needs of particular groups
161
Chapter summary
Finding the right home is an essential for all of us. The diverse needs of
the different cohorts of the population should be reflected in the housing
choices available across Greater Manchester. How well do we understand
the different elements of our housing jigsaw?
Our average life expectancy is almost two years lower than the
average for England and the gap is even bigger (nearly three years
for men, almost four for women) in the number of years of good or
very good health we can expect to enjoy.
There is a higher proportion of people with a long-term health
problem or disability that limits their day-to-day activities living in
the social rented sector than in either owner-occupation or private
renting.
In 20 years’ time, nearly three in twenty of Greater Manchester’s
residents will be 75 years or older - and one in twenty of us will be
85 or older – though our population profile will still be younger
than the national average.
Again, in 20 years’ time, almost one in three of us aged 65 or over
will have a limiting long-term illness that limits our day-to-day
activities ‘a lot’ and just under 8% will have dementia.
The Greater Manchester Supported Housing Census shows that we
have over 33,000 units of accommodation for those who need
support as well as housing in Greater Manchester.
The five higher education institutions (HEIs) in Greater Manchester
together have a student body of around 100,000 and around 13,000
student households live in mainstream housing stock in Salford,
Bolton and Manchester (which houses around 85% of total
students).
The private rented sector is likely to continue to grow, to evolve in
terms of the investors and management of rented homes and in the
types of households living in the sector. National policy, regulation

162
and taxation regimes may have a significant impact on changes in
the sector. On current trend, more families with children and older
households will rent privately.
By 2035/36, we will need to provide up to 103 Gypsy and Traveller
plots across Greater Manchester based on the expected net cultural
need, and 204 Travelling Showpeople plots.

163
6.1 Introduction
6.1 This chapter reviews the needs of groups within the population
who have specialist housing needs, or whose housing needs differ
from the wider population. Paragraph 001 of the Housing Needs of
Different Groups44 PPG states that authorities must consider the
housing needs of particular groups when producing plans. The
Greater Manchester SHMA will complement work carried out at a
local level.
6.2 The following key groups have been identified and analysed as
potentially having housing needs which may differ from those of
the wider population in Greater Manchester:
Older people.
People who require housing with care (including those with disabilities).
Private renters.
People wishing to build their own homes.
Students.
Families.
Members and ex-members of the Armed Forces; and
Gypsies and Travellers.
6.2 Older persons housing
6.3 Within Greater Manchester, there is a lower proportion of older
people than the national average, with 18.7% of households aged
over 65 compared to 20.7% in England.45 The population is
projected to increase for all age groups (except 5-9) but especially
so for those aged 70 or more. Those 90 or over are projected to
44 PPG, Housing needs of different groups, July 2019, available at:
https://www.gov.uk/guidance/housing-needs-of-different-groups
45 2011 Census

164
increase by 87% between 2018 and 2043. The overall population of
Greater Manchester is projected to increase by 10.1% in the same
time-period.46
Figure 6.1: Percentage change in population by five-year age band in Greater Manchester, 2018 to 2043
Source: ONS 2018-based SNPP
6.4 The latest household projections (2018-based) show that in Greater
Manchester 3.5% of all Household Reference Persons (HRF) were
aged 85 or older at mid-2018 and 12.5% were aged 75 or over. By
2043, this is projected to rise to 5.3% for those aged over 85 and
17.8% for those aged 75 to 84.47 In terms of households, in 2016
3.5% of all heads of households in Greater Manchester were aged
over 85 and 8.8% were aged between 75 and 84. By 2036, this is
expected to rise to 5.6% for those aged over 85 and 11.5% for those
aged 75 to 84.48
6.5 Map 6.1 below shows the areas where there are higher
concentrations of older people in Greater Manchester, most notably
46 ONS, 2018-based SNPP. 47 ONS, 2018-based SNHP. 48 ONS, 2016-based SNHP.
-5.0%
5.0%
15.0%
25.0%
35.0%
45.0%
55.0%
65.0%
75.0%
85.0%
0-4
5-9
10
-14
15
-19
20
-24
25
-29
30
-34
35
-39
40
-44
45
-49
50
-54
55
-59
60
-64
65
-69
70
-74
75
-79
80
-84
85
-89
90
+
All
age
s

165
in districts to the south (Stockport and Trafford), to the east of
Oldham and the border of Bolton and Bury.
Map 6.1: Percentage of population aged over 55
Source: 2011 Census
Healthy and life expectancy
6.6 Table 6.1 highlights the life expectancies and healthy life
expectancies by gender in Greater Manchester, the North West and
England. Expectancies in Greater Manchester are lower for both
measures and genders, with male life expectancy being 78.0 years
and female life expectancy 81.5 years.
6.7 Calculations of healthy life expectancies add a quality of life
dimension to estimates of life expectancy by dividing expected
lifespan into time spent in different states of health or disability.
Healthy life expectancy estimates the period of time that an
individual can expect to live in “very good” or “good” health and is
based on how individuals perceive their general health based on a
rolling three-year aggregate period. Healthy life expectancy is
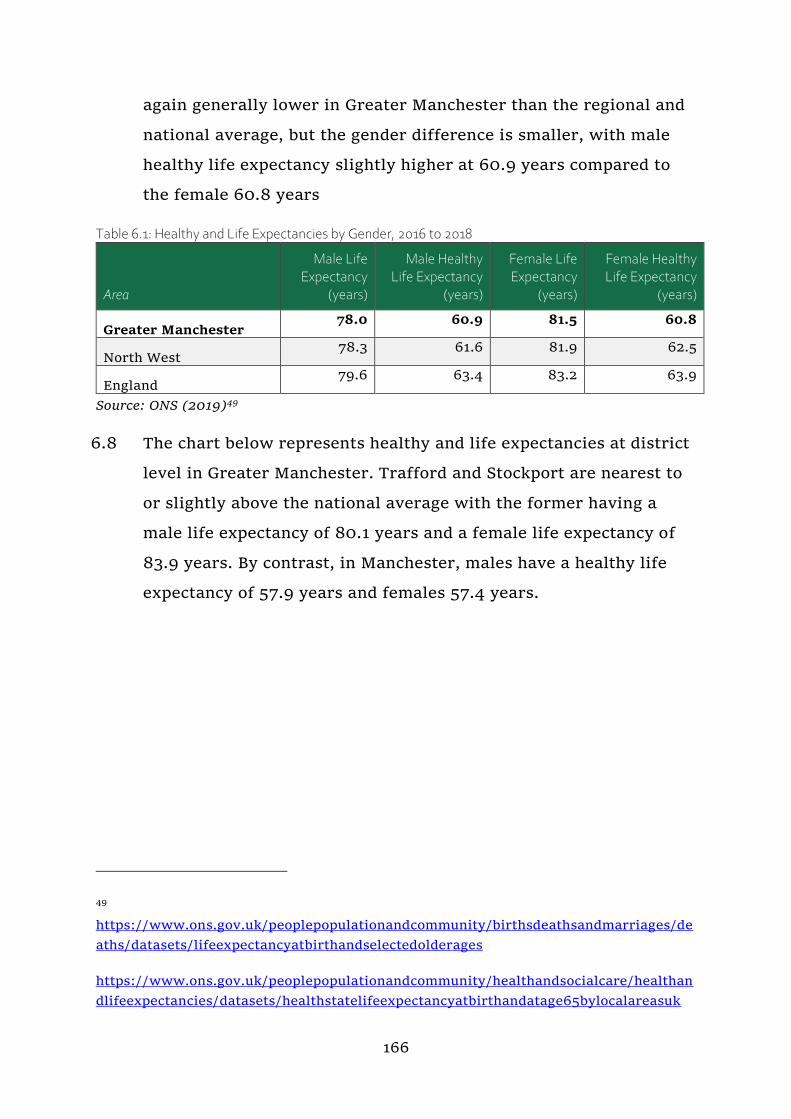
166
again generally lower in Greater Manchester than the regional and
national average, but the gender difference is smaller, with male
healthy life expectancy slightly higher at 60.9 years compared to
the female 60.8 years
Table 6.1: Healthy and Life Expectancies by Gender, 2016 to 2018
Area
Male Life Expectancy
(years)
Male Healthy Life Expectancy
(years)
Female Life Expectancy
(years)
Female Healthy Life Expectancy
(years)
Greater Manchester 78.0 60.9 81.5 60.8
North West 78.3 61.6 81.9 62.5
England 79.6 63.4 83.2 63.9
Source: ONS (2019)49
6.8 The chart below represents healthy and life expectancies at district
level in Greater Manchester. Trafford and Stockport are nearest to
or slightly above the national average with the former having a
male life expectancy of 80.1 years and a female life expectancy of
83.9 years. By contrast, in Manchester, males have a healthy life
expectancy of 57.9 years and females 57.4 years.
49
https://www.ons.gov.uk/peoplepopulationandcommunity/birthsdeathsandmarriages/de
aths/datasets/lifeexpectancyatbirthandselectedolderages
https://www.ons.gov.uk/peoplepopulationandcommunity/healthandsocialcare/healthan
dlifeexpectancies/datasets/healthstatelifeexpectancyatbirthandatage65bylocalareasuk
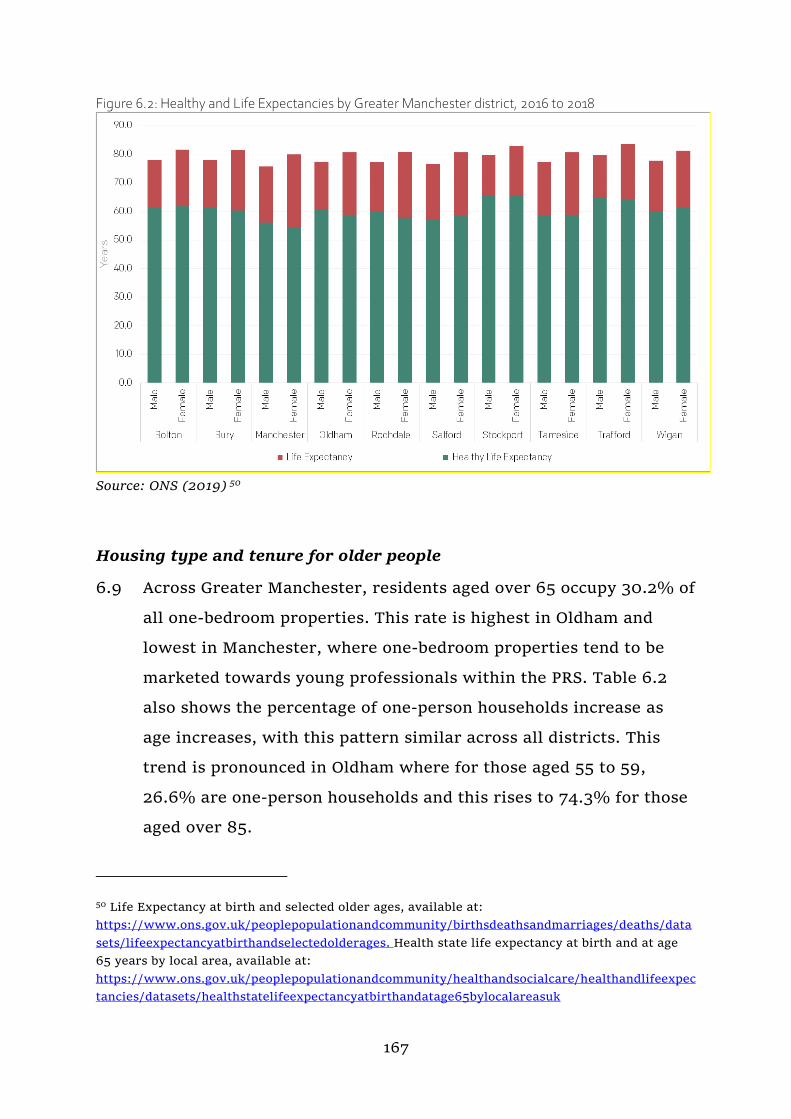
167
Figure 6.2: Healthy and Life Expectancies by Greater Manchester district, 2016 to 2018
Source: ONS (2019) 50
Housing type and tenure for older people
6.9 Across Greater Manchester, residents aged over 65 occupy 30.2% of
all one-bedroom properties. This rate is highest in Oldham and
lowest in Manchester, where one-bedroom properties tend to be
marketed towards young professionals within the PRS. Table 6.2
also shows the percentage of one-person households increase as
age increases, with this pattern similar across all districts. This
trend is pronounced in Oldham where for those aged 55 to 59,
26.6% are one-person households and this rises to 74.3% for those
aged over 85.
50 Life Expectancy at birth and selected older ages, available at:
https://www.ons.gov.uk/peoplepopulationandcommunity/birthsdeathsandmarriages/deaths/data
sets/lifeexpectancyatbirthandselectedolderages. Health state life expectancy at birth and at age
65 years by local area, available at:
https://www.ons.gov.uk/peoplepopulationandcommunity/healthandsocialcare/healthandlifeexpec
tancies/datasets/healthstatelifeexpectancyatbirthandatage65bylocalareasuk
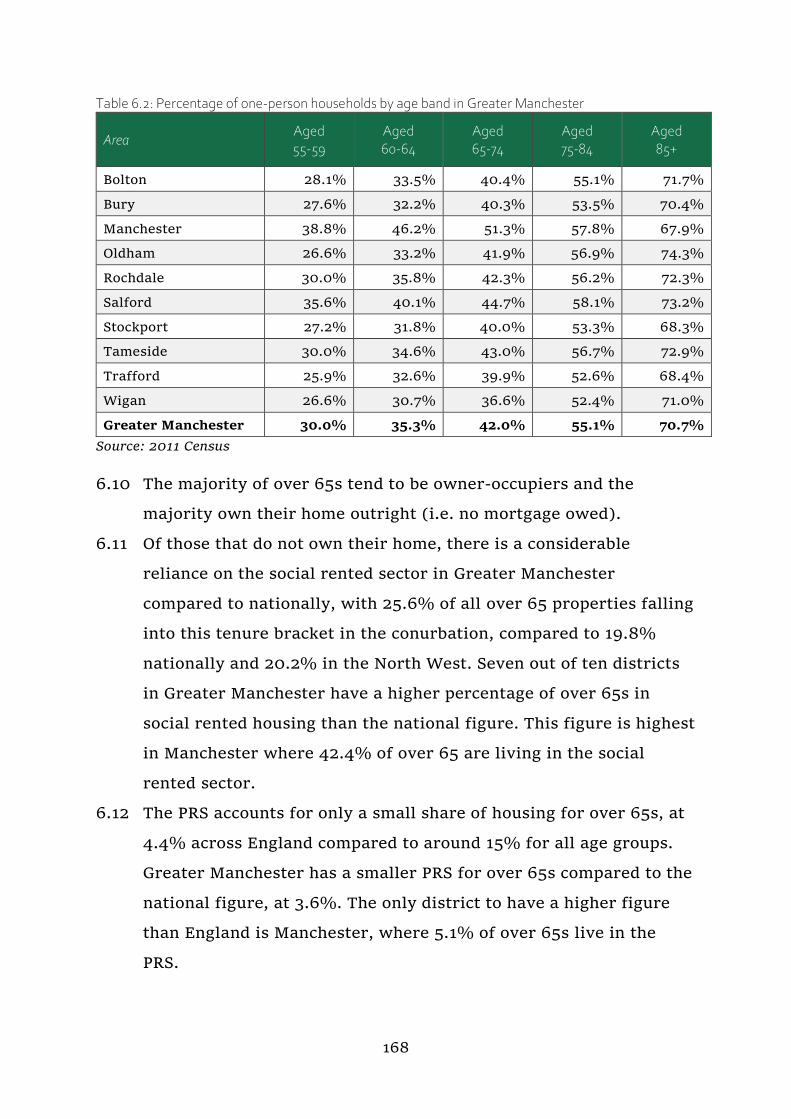
168
Table 6.2: Percentage of one-person households by age band in Greater Manchester
Area Aged 55-59
Aged 60-64
Aged 65-74
Aged 75-84
Aged 85+
Bolton 28.1% 33.5% 40.4% 55.1% 71.7%
Bury 27.6% 32.2% 40.3% 53.5% 70.4%
Manchester 38.8% 46.2% 51.3% 57.8% 67.9%
Oldham 26.6% 33.2% 41.9% 56.9% 74.3%
Rochdale 30.0% 35.8% 42.3% 56.2% 72.3%
Salford 35.6% 40.1% 44.7% 58.1% 73.2%
Stockport 27.2% 31.8% 40.0% 53.3% 68.3%
Tameside 30.0% 34.6% 43.0% 56.7% 72.9%
Trafford 25.9% 32.6% 39.9% 52.6% 68.4%
Wigan 26.6% 30.7% 36.6% 52.4% 71.0%
Greater Manchester 30.0% 35.3% 42.0% 55.1% 70.7%
Source: 2011 Census
6.10 The majority of over 65s tend to be owner-occupiers and the
majority own their home outright (i.e. no mortgage owed).
6.11 Of those that do not own their home, there is a considerable
reliance on the social rented sector in Greater Manchester
compared to nationally, with 25.6% of all over 65 properties falling
into this tenure bracket in the conurbation, compared to 19.8%
nationally and 20.2% in the North West. Seven out of ten districts
in Greater Manchester have a higher percentage of over 65s in
social rented housing than the national figure. This figure is highest
in Manchester where 42.4% of over 65 are living in the social
rented sector.
6.12 The PRS accounts for only a small share of housing for over 65s, at
4.4% across England compared to around 15% for all age groups.
Greater Manchester has a smaller PRS for over 65s compared to the
national figure, at 3.6%. The only district to have a higher figure
than England is Manchester, where 5.1% of over 65s live in the
PRS.
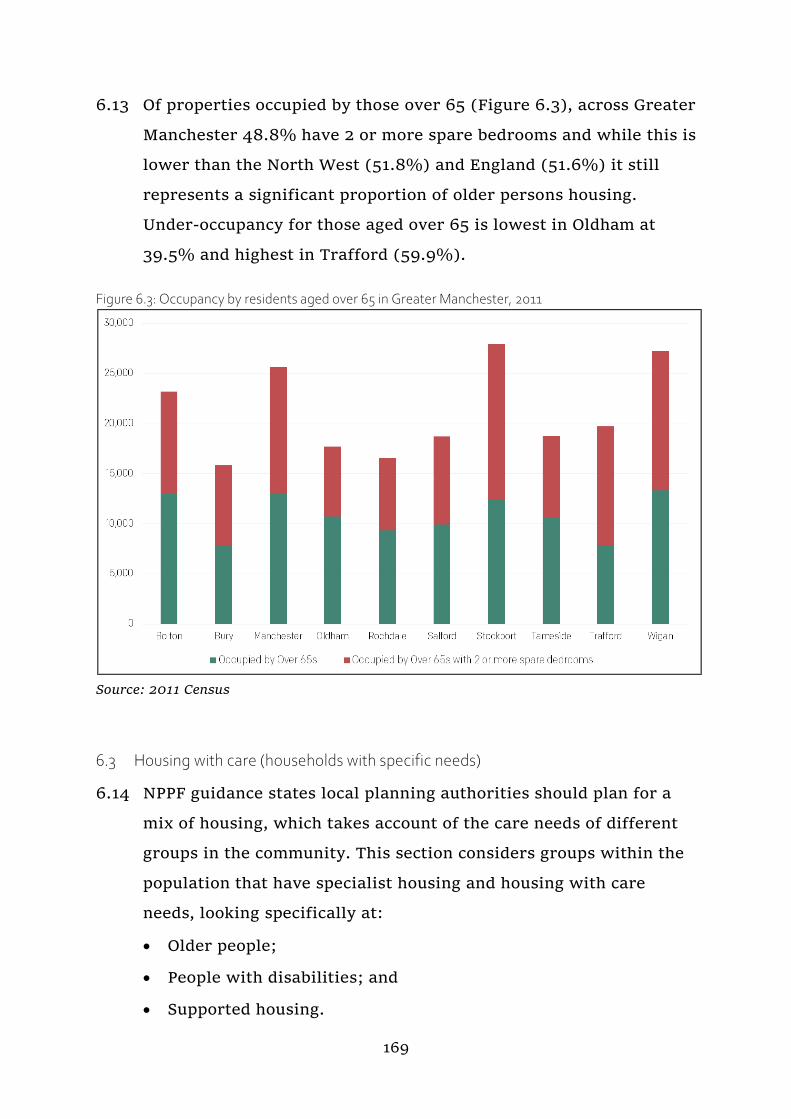
169
6.13 Of properties occupied by those over 65 (Figure 6.3), across Greater
Manchester 48.8% have 2 or more spare bedrooms and while this is
lower than the North West (51.8%) and England (51.6%) it still
represents a significant proportion of older persons housing.
Under-occupancy for those aged over 65 is lowest in Oldham at
39.5% and highest in Trafford (59.9%).
Figure 6.3: Occupancy by residents aged over 65 in Greater Manchester, 2011
Source: 2011 Census
6.3 Housing with care (households with specific needs)
6.14 NPPF guidance states local planning authorities should plan for a
mix of housing, which takes account of the care needs of different
groups in the community. This section considers groups within the
population that have specialist housing and housing with care
needs, looking specifically at:
Older people;
People with disabilities; and
Supported housing.

170
Older people
6.15 In In Greater Manchester there will be 33.7% more people aged
over 65 living alone by 2035 rising from 15,793 to 20,729 people
(although this is slightly below the national average increase of
38.4%) and just over 50% more people requiring accommodation
with high level support in a care home (compared to an almost 60%
increase nationally). Around 35% more people over 65 in Greater
Manchester will be unable to carry out at least one domestic task
on their own and would therefore need some form of care rising
from 127,772 to 173,060 people in 2035.51
6.16 By 2035, 29.5% of those aged over 65 in Greater Manchester will
have a limiting long-term illness that limits their day-to-day
activities a lot (higher than the national average of 24.9%). In
Greater Manchester, 7.4% of over 65s are predicted to have
dementia in 2035, an increase of 44.6% from 2019. This is a lower
proportion than for the North West as a whole (7.6%) and
nationally (7.8%) but still represents an increase from 30,464 to
44,059 people in 2035The districts of Wigan and Tameside are
expected to experience the largest increase in the numbers of
people with dementia in Greater Manchester (53% in Wigan and
48% in Tameside)52
Housing stock
6.17 As of 2018/19, the current stock of housing specifically designed for
older people in Greater Manchester consists of 1,108 properties with
51 http://www.poppi.org.uk/ 52 ibid

171
32,447 dwelling units.53 The majority of these are for rent (24,845)
rather than for sale (4,991).
6.18 Analysis by the Housing Learning and Improvement Network
(LIN)/Elderly Accommodation Counsel (EAC),54 produced for GMCA,
estimates that the shortfall - the ‘gap’ between future demand and
current supply, for specialist housing and accommodation for older
people, is likely to be by 2037 over 18,000 units of housing for older
people. This consists of approximately 7,300 units for sale and over
6,300 units for rent (including shared ownership). Furthermore, there
will be a shortfall of approximately 4,960 units of housing with care
made up of 3,115 units of extra care housing for rent and 1,850 units
of extra care housing for sale (including shared ownership). This is
broken down by district as in the table below:
Table 6.3: Estimated shortfall in specialist accommodation for older people, by type and tenure, in each local authority and across Greater Manchester by 2037.
Area
Housing for Older
People for sale (units)
Housing for Older
People for rent (units)
Housing with care for sale (units)
Housing with care for rent (units)
Total estimated shortfall (units)
Bolton 528 528 121 363 1,540
Bury 656 656 186 186 1,684
Manchester 574 574 102 305 1,555
Oldham 396 396 84 253 1,129
Rochdale 473 473 120 359 1,425
Salford 528 560 75 224 1,387
Stockport 1,350 665 349 349 2,713
Tameside 528 752 131 393 1,804
Trafford 1,026 505 227 227 1,985
Wigan 1,252 1,252 455 455 3,414
Greater Manchester 7,309 6,360 1,850 3,115 18,634
Source: Housing Learning and Improvement Network (LIN)/Elderly Accommodation
Counsel (EAC) (2020). 50/50% split assumed of the total estimated need where figures
are the same for both sale and rent columns.
53 Elderly Accommodation Council (EAC) 54 The Strategic Housing for Older People Analysis Tool (SHOP@) has been developed by
the Housing LIN and EAC. Extra Care and Enhanced Sheltered sectors are combined into
a single Housing with Care typology.

172
6.19 At a district level, only Wigan and Rochdale are estimated to have
a shortfall below 1,000 units by 2037 in Housing for Older People
(without care). Stockport are projected to have the highest number
of property shortfalls in Housing for Older People (without care)
by 2035 at over 2,000 each. In Stockport the projected shortfall
includes more properties for sale rather than rent, which is also
the case in Trafford. Tameside, however, have more of a shortfall
for rent rather than to lease.
The projected estimates for Housing with Care (often called
assisted living in the private sector) suggest that there will be
shortfall of just over 1,800 units for sale and over 3,100 for rent in
Greater Manchester by 2037 with the greatest combined need in
Wigan (901 units) and the lowest in Salford (299).
People with disabilities
6.20 The 2011 Census defines a limiting long-term illness or disability
(LLTI) as:
(a condition) that limits a person's day-to-day activities and has
lasted, or is expected to last, at least 12 months. This includes
problems that are related to old age. People were asked to assess
whether their daily activities were limited a lot or a little by such a
health problem, or whether their daily activities were not limited at
all.55
6.21 This definition is adopted for the analysis presented in this section.
6.22 Greater Manchester has a similar proportion of people with a self-
reported LLTI compared to the North West, though with a smaller
proportion reporting an issue that limits their daily activities ‘a
little.’ However, both Greater Manchester and the North West have
a greater share of people with a LLTI than England as a whole.
55 2011 Census: Glossary of Terms, ONS May 2014 http://www.ons.gov.uk/ons/guide-
method/census/2011/census-data/2011-census-data/2011-first-release/2011-census-
definitions/2011-census-glossary.pdf
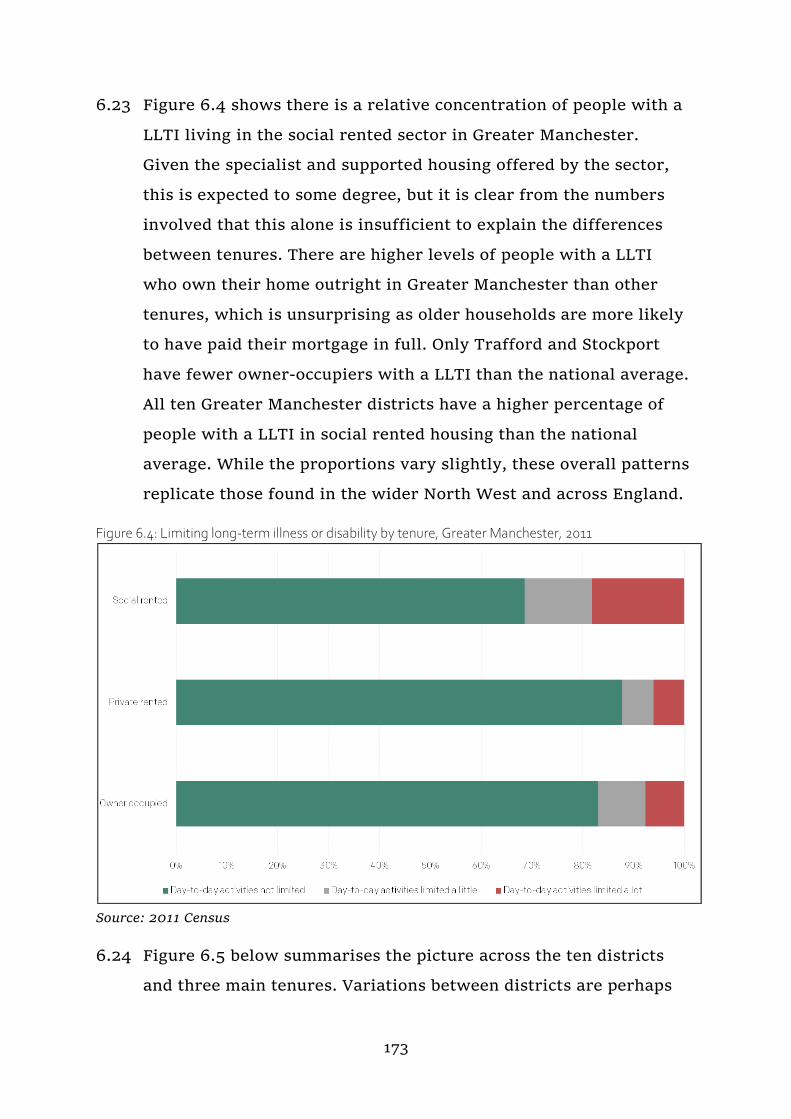
173
6.23 Figure 6.4 shows there is a relative concentration of people with a
LLTI living in the social rented sector in Greater Manchester.
Given the specialist and supported housing offered by the sector,
this is expected to some degree, but it is clear from the numbers
involved that this alone is insufficient to explain the differences
between tenures. There are higher levels of people with a LLTI
who own their home outright in Greater Manchester than other
tenures, which is unsurprising as older households are more likely
to have paid their mortgage in full. Only Trafford and Stockport
have fewer owner-occupiers with a LLTI than the national average.
All ten Greater Manchester districts have a higher percentage of
people with a LLTI in social rented housing than the national
average. While the proportions vary slightly, these overall patterns
replicate those found in the wider North West and across England.
Figure 6.4: Limiting long-term illness or disability by tenure, Greater Manchester, 2011
Source: 2011 Census
6.24 Figure 6.5 below summarises the picture across the ten districts
and three main tenures. Variations between districts are perhaps

174
surprisingly limited, with the most notable being the lower levels
of people with LLTI in the PRS in Manchester, Salford and Trafford,
possibly reflecting the younger age profile of households in this
tenure.
Figure 6.5: Tenure, long-term health problem or disability in Greater Manchester, 2011
Source: 2011 Census
6.25 Projecting Adult Needs and Service Information (PANSI)56 is a
programme designed to help explore the possible impact that
demography and certain conditions may have on populations aged
18 to 64. A selection of these indicators are outlined below.
6.26 In Greater Manchester, 2.2% of the population are projected to
have a serious physical disability by 2035, a rate similar to the
North West and nationally, both at 2.3%. Manchester and Salford
are expected to have the lowest proportions of people with a
serious physical disability but are projected to have the greatest
increase over the period 2017 to 2035 across the city region.
56 More information available at: http://www.pansi.org.uk/

175
6.27 Compared to physical disability, a smaller proportion of the
population are estimated to have a moderate or severe learning
disability, although this is substantially higher in Greater
Manchester (0.57%) than the region and England as a whole (both
0.15%).
6.28 Just over 16% of the population in the age group 18 to 64 are
expected to have a common mental disorder in Greater Manchester
by 2035 – similar to that for the region as a whole and nationally.
Salford and Manchester have the lowest proportions of common
mental disorders. However, they are projected to experience the
largest increases up to 2035.
6.4 People with a housing and support need
6.29 The Think Local Act Personal partnership describes how there is no
single agreed definition of supported housing, as it is an umbrella
term that covers a great variety of provision. They adopt the
following definition in their report ‘Making it Real for Supported
Housing: A guide for providers and commissioners’:
… [Supported housing is] any scheme where housing, support and
sometimes care services are provided with the purpose of enabling the
person receiving the support to live as independently as possible in the
community.57
6.30 Supported housing may be provided for several different client
groups, including (but not limited to) the following:
Older people with varying levels of support needs;
People with physical and learning disabilities;
People with mental health needs;
People and families at risk of or affected by homelessness;
People recovering from alcohol or drug dependency;
57 https://www.thinklocalactpersonal.org.uk/_assets/MakingItReal/MIRHousing.pdf
176
People at risk of or seeking refuge from domestic abuse;
Offenders and ex-offenders; and
Vulnerable young people (such as young parents and young people leaving care).
6.31 In England, supported housing is mostly owned by RPs, with some
local authorities owning their own supported housing units; there
are also a number of supported housing schemes that are run by the
voluntary sector, such as charities and faith groups, as well as some
units provided by the private sector.
6.32 The care or support package is usually commissioned by the local
authority and is sometimes provided by the housing provider, with
charities and specialist care or support providers also delivering
these services. An exception to this is sheltered accommodation,
which is largely not commissioned by local authorities, but wholly
owned and managed by RPs or private sector providers.
Supported housing provision in Greater Manchester
6.33 It is difficult to assess the total number of units of supported
housing in Greater Manchester from official datasets. Local
authorities return housing data to MHCLG annually; however, stock
is not broken down into general needs and supported units. RPs
complete a Statistical Data Return to the Regulator of Social
Housing (formerly the Homes and Communities Agency) each year,
which gives us limited information on supported housing stock in
Greater Manchester.
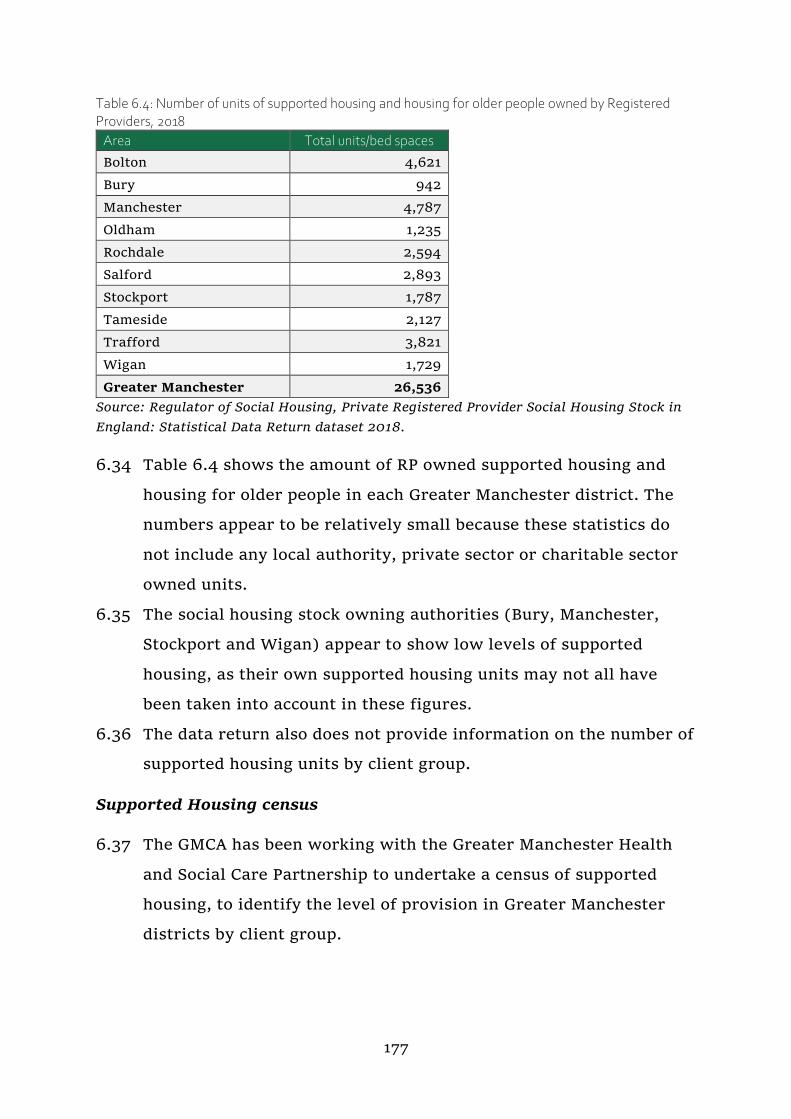
177
Table 6.4: Number of units of supported housing and housing for older people owned by Registered Providers, 2018
Area Total units/bed spaces
Bolton 4,621
Bury 942
Manchester 4,787
Oldham 1,235
Rochdale 2,594
Salford 2,893
Stockport 1,787
Tameside 2,127
Trafford 3,821
Wigan 1,729
Greater Manchester 26,536
Source: Regulator of Social Housing, Private Registered Provider Social Housing Stock in
England: Statistical Data Return dataset 2018.
6.34 Table 6.4 shows the amount of RP owned supported housing and
housing for older people in each Greater Manchester district. The
numbers appear to be relatively small because these statistics do
not include any local authority, private sector or charitable sector
owned units.
6.35 The social housing stock owning authorities (Bury, Manchester,
Stockport and Wigan) appear to show low levels of supported
housing, as their own supported housing units may not all have
been taken into account in these figures.
6.36 The data return also does not provide information on the number of
supported housing units by client group.
Supported Housing census
6.37 The GMCA has been working with the Greater Manchester Health
and Social Care Partnership to undertake a census of supported
housing, to identify the level of provision in Greater Manchester
districts by client group.

178
Table 6.5: Supported Housing in Greater Manchester by client group, 2017
Client group Total schemes Total units Complex Needs 20 720
Domestic Abuse 40 300
Extra Care 30 1,160
Homeless Families 20 200
Homelessness 370 740
Learning Disability 950 3,230
Mental Health 250 1,050
No client group provided 270 1,110
Offenders/Ex-Offenders/ At risk of offending 20 130
Older people 720 16,170
Other 60 180
Physical Disability 30 90
Refugees 10 60
Rough sleepers 20 220
Sheltered 490 5,520
Single Homeless 80 740
Substance Misuse 60 270
Veterans - 20
Vulnerable adults 50 50
Women with support needs - 30
Young homeless people 10 110
Young parents 10 60
Young People 120 460
Young People leaving care 20 60
Young people with Learning disabilities 10 20
Total 3,660 32,690
Source: Greater Manchester Supported Housing Census, 2017.
Future need for supported housing
6.38 The future need for housing with care for older people is outlined
in Chapter 6.2 of this document, along with projections of the
number of people with physical and learning disabilities and
common mental disorders.
6.39 For other client groups, national data is available to project the
future need of supported housing. MHCLG and the Department of
Health commissioned research by the Personal Social Services
Research Unit of London School of Economics (LSE) which suggests
that there will be a 4.2% increase in need for supported housing for

179
single homeless people and a 4.3% increase in need for supported
housing for other working age clients between 2015 and 2030.58
6.5 Private renters
6.40 The PRS consists of homes that are rented from a private landlord,
letting agency or other private organisations or individuals.
6.41 Between 2001 and 2011, the share of households living in the PRS in
Greater Manchester rose from 11% to 17.5%, with the majority of
those households in Manchester and Salford. The rise was across all
household types, but particularly young people and families with
children.59
6.42 A total of 96% of household growth in Greater Manchester between
the 2001 and 2011 Censuses was focused in the PRS and by 2011,
the number of households in the PRS in Greater Manchester totalled
196,000.60
6.43 Figure 6.6 below sets out the proportion of households in the PRS in
Greater Manchester, the North West and England & Wales at the
2001 and 2011 Censuses.
58 DCLG (now MHCLG) & Department of Health commissioned research by Personal
Social Services Research Unit of London School of Economics (2017), Projected demand
for supported housing in Great Britain 2015 to 2030,
http://eprints.lse.ac.uk/84075/1/Wittenberg_Projected%20demand_2017_author.pdf 59 2011 Census 60 2001 Census and 2011 Census. Note that in the 2011 Census the definition changed to
include households living rent free, but this change is not perceived to have contributed
largely to growth in this category over the period.

180
Figure 6.6: Households private renting in Greater Manchester, 2001 and 2011
Source: 2001 Census and 2011 Census
6.44 Growth in the PRS in Greater Manchester has outpaced that of the
North West and England & Wales and it is anticipated that this
growth will continue; in part due to Government policies such as
support for institutional PRS investment, as well as due to the
changing nature of the housing market and structural changes to
households.
6.45 This section provides a spatial analysis of the sector across Greater
Manchester and highlights the policy context for the PRS.
Scale and distribution of PRS in Greater Manchester
6.46 There are PRS households within all districts across Greater
Manchester. Map 6.2 shows the distribution of all private rented
households from the 2011 Census across Greater Manchester. There
are clear clusters of private renting in central parts of the districts
and the town and city centres.
6.47 High concentrations of PRS households (more than 50% of
households) are found in the regional centre in Manchester and
Salford. The map shows that although PRS renters are present
across the conurbation, there are far higher numbers in the
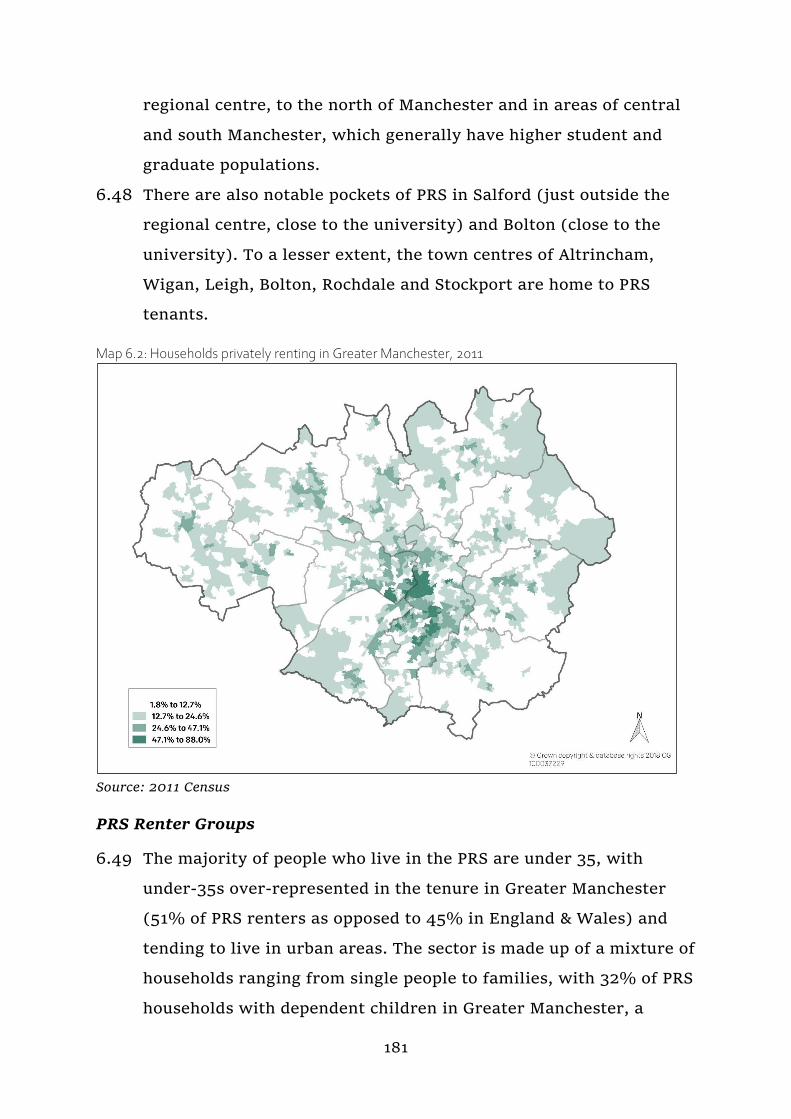
181
regional centre, to the north of Manchester and in areas of central
and south Manchester, which generally have higher student and
graduate populations.
6.48 There are also notable pockets of PRS in Salford (just outside the
regional centre, close to the university) and Bolton (close to the
university). To a lesser extent, the town centres of Altrincham,
Wigan, Leigh, Bolton, Rochdale and Stockport are home to PRS
tenants.
Map 6.2: Households privately renting in Greater Manchester, 2011
Source: 2011 Census
PRS Renter Groups
6.49 The majority of people who live in the PRS are under 35, with
under-35s over-represented in the tenure in Greater Manchester
(51% of PRS renters as opposed to 45% in England & Wales) and
tending to live in urban areas. The sector is made up of a mixture of
households ranging from single people to families, with 32% of PRS
households with dependent children in Greater Manchester, a
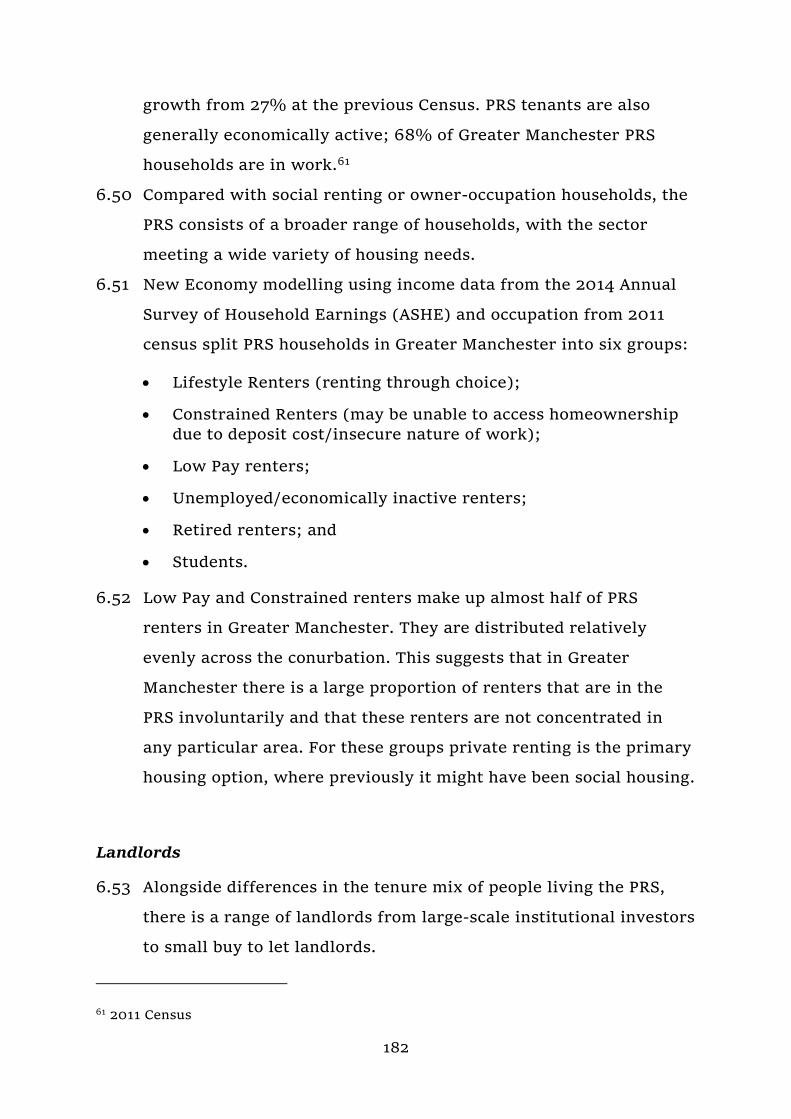
182
growth from 27% at the previous Census. PRS tenants are also
generally economically active; 68% of Greater Manchester PRS
households are in work.61
6.50 Compared with social renting or owner-occupation households, the
PRS consists of a broader range of households, with the sector
meeting a wide variety of housing needs.
6.51 New Economy modelling using income data from the 2014 Annual
Survey of Household Earnings (ASHE) and occupation from 2011
census split PRS households in Greater Manchester into six groups:
Lifestyle Renters (renting through choice);
Constrained Renters (may be unable to access homeownership due to deposit cost/insecure nature of work);
Low Pay renters;
Unemployed/economically inactive renters;
Retired renters; and
Students.
6.52 Low Pay and Constrained renters make up almost half of PRS
renters in Greater Manchester. They are distributed relatively
evenly across the conurbation. This suggests that in Greater
Manchester there is a large proportion of renters that are in the
PRS involuntarily and that these renters are not concentrated in
any particular area. For these groups private renting is the primary
housing option, where previously it might have been social housing.
Landlords
6.53 Alongside differences in the tenure mix of people living the PRS,
there is a range of landlords from large-scale institutional investors
to small buy to let landlords.
61 2011 Census

183
6.54 Research from the LSE and the Council for Mortgage Lenders (CML)
found that 62% of landlords sampled owned only one property.
Those who owned more than one property also owned 40% of the
PRS stock. A total of 30% of landlords sampled had at least one buy
to let mortgage, but 50% of the properties owned by landlords
sampled were purchased with a buy to let mortgage.62
6.55 There is emerging evidence that the growth in institutional
landlords developing new homes in the PRS is focused in apartment
blocks and, to a lesser extent, housing for families. PRS developers
in Greater Manchester include Sigma Capital (developing PRS
homes for families), Legal and General, Renaker and Manchester
Life (largely developing apartments).
6.56 Government’s Housing White Paper Fixing our broken housing
market set out the need for more institutional investment in the
PRS, including through pension funds and expanding the ‘Build to
Rent’ market, particularly into family housing.63
Security of tenure
6.57 The PRS has traditionally provided shorter-term tenancies than the
social rented sector (where tenancies have generally been
indefinite, sometimes after an introductory period), reflecting the
fact that the PRS was often seen as a temporary tenure for young
people before moving into owner-occupation.
6.58 PRS research conducted in Greater Manchester by New Economy in
2014 found that 46% of tenant survey respondents indicated that a
62 CML Research, ‘The profile of UK private landlords’, Kath Scanlon and Christine
Whitehead, LSE London, December 2016 63 Government Housing White Paper. Fixing our broken housing market. February 2017.
Available at:
https://www.gov.uk/government/uploads/system/uploads/attachment_data/file/59046
4/Fixing_our_broken_housing_market_-_print_ready_version.pdf

184
medium-term tenancy of 1-5 years would be their favoured
length.64
6.59 The English Housing Survey (EHS) showed that in 2015/16, 81% of
PRS tenants were given an initial tenancy of 6 or 12 months.
Furthermore, 26% of PRS tenants had been in their current home
for less than one year, as opposed to 8% of social renters and 5% of
owner-occupiers. Data from MHCLG shows those households that
were accepted as homeless due to the end of an assured short-hold
tenancy increased by 25% between 2015/16 and 2016/17.65
Type and condition of stock
6.60 The latest source of data on all PRS stock in Greater Manchester
comes from the 2011 Census. The stock profile is varied across the
districts in Greater Manchester; however, the conurbation is
broadly in line with that of England & Wales.
64 New Economy, ‘Private Rented Sector in Greater Manchester’, 2014. 65 MHCLG Live Tables on Homelessness, Table 784a: local authorities' action under the
homelessness provisions of the Housing Acts: quarterly data for 2014 Q2 to 2017 Q1
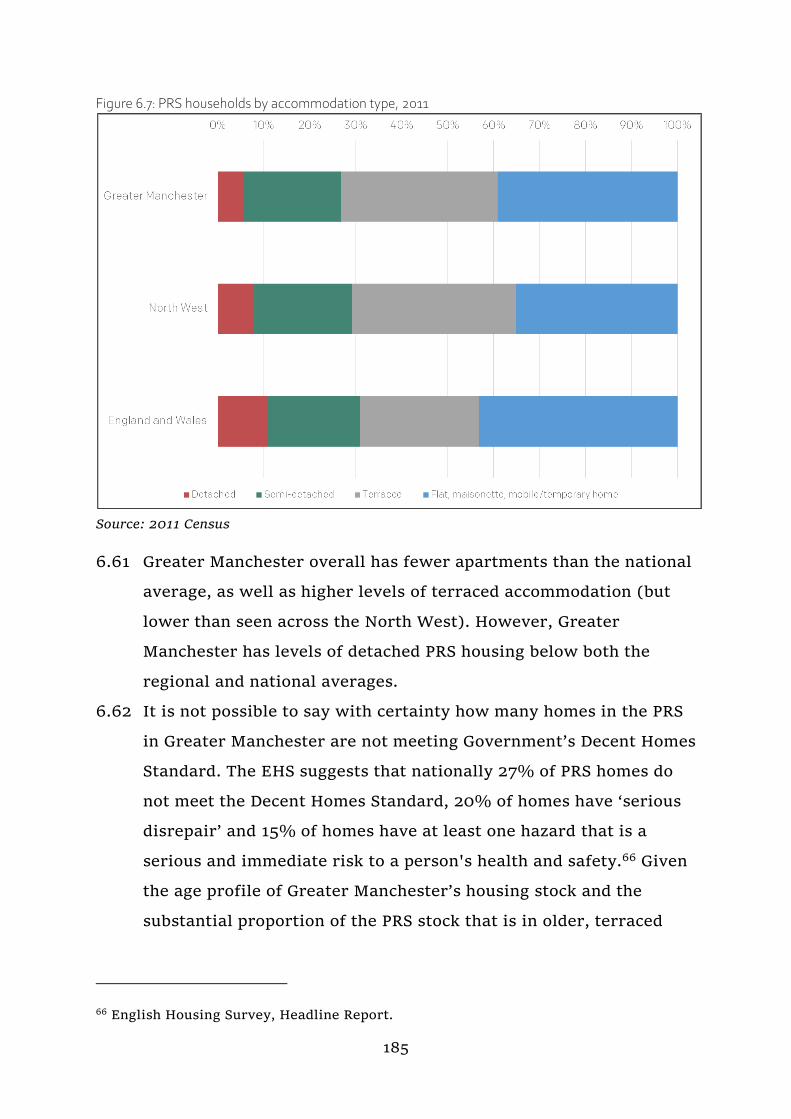
185
Figure 6.7: PRS households by accommodation type, 2011
Source: 2011 Census
6.61 Greater Manchester overall has fewer apartments than the national
average, as well as higher levels of terraced accommodation (but
lower than seen across the North West). However, Greater
Manchester has levels of detached PRS housing below both the
regional and national averages.
6.62 It is not possible to say with certainty how many homes in the PRS
in Greater Manchester are not meeting Government’s Decent Homes
Standard. The EHS suggests that nationally 27% of PRS homes do
not meet the Decent Homes Standard, 20% of homes have ‘serious
disrepair’ and 15% of homes have at least one hazard that is a
serious and immediate risk to a person's health and safety.66 Given
the age profile of Greater Manchester’s housing stock and the
substantial proportion of the PRS stock that is in older, terraced
66 English Housing Survey, Headline Report.

186
properties, it is reasonable to assume that conditions may be worse
in Greater Manchester than nationally.
Future trends in the PRS
6.63 Recent trends suggest that the PRS will continue to grow, with
more households in the constrained renters and low pay categories.
The increases in these groups are influenced by lack of access to
home ownership (for example due to deposit and income
requirements of mortgage lenders and changes in the nature of the
job market) and decreasing access to social housing.
6.64 Trends also suggest an increase in families living in the PRS, which
has implications for the stock profile as well as security of tenure.
New Economy’s PRS research found that families prioritise security
of tenure when choosing a PRS property.
6.65 Growth in the sector is predicted to continue. Those groups who
may have traditionally accessed home ownership will continue to
live in the PRS. Modelling of increase in the sector has been
undertaken by both the Cambridge Centre of Housing and Planning
Research (CCHPR 2012) and Clapham et al (2012). The CCHPR
modelling looked at growth based on a cautious economic growth
scenario and continuing weak growth scenario, both models
predicted a growth in the sector. The CCHPR model expects a
continuing weak economy and, in this scenario, they predict a
growth in PRS from 18% in 2012 to 22% in 2025. Clapham et al
(2012) looked at growth in the sector for young people (18-30) to
2020. In their scenario, they predicted an increase from 1.3 million
young people in the PRS in 2008 to 3.7 million living in the sector
by 2020.
6.66 Several factors have influenced the significant growth in the sector
over the last ten years. A range of commentators have analysed the

187
reasons for this and deemed that it is related to the housing supply
and demand of both owner-occupation and social housing. The
common themes that have influenced the growth of the PRS are as
follows.67
Demand for PRS
Undersupply of all housing tenures.
Mortgage constraints and difficulties in saving for a deposit due
to high house prices in comparison to wages (see Chapter 5 for
more information).
Changes to the overall supply of social housing - the overall
reduction in new build social housing has meant that those who
traditionally would have accessed social housing are now in the
PRS.
Flexibility and mobility in housing choice.
The availability of HB within the rental sector.
Not being solely responsible for property repairs and
maintenance.
Avoidance of housing debt.
Supply side factors
Deregulation of the sector in the 1980s through the introduction
of the Assured Short-hold Tenancy in 1988 and 1996 and making
them the default for most private rented lettings.
Buy-to-let mortgages were introduced in 1996 and spurred the
growth of the PRS. The CML estimate that there are about 1.5
million outstanding buy to let mortgages.
67 The Building and Social Housing Foundation (BSHF 2012: 14-15).

188
Changes to HB entitlement of those in the social rented sector
may lead to an increase in demand for private sector properties.
This is particularly so in areas (such as some of the districts of
Greater Manchester) where social rent levels are similar to or
higher than those of private rents. From April 2018, social
housing tenants will only be entitled to HB to the level of the
Local Housing Allowance (LHA), which means their entitlement
will be equal to that of private tenants. In particular, single
people under the age of 35 will only be entitled to the Shared
Accommodation Rate (SAR), or the level to cover a room in a
shared house. Therefore, people may be discouraged from
renting in the social sector if they will encounter a significant
shortfall in paying their rent and may instead look to the PRS for
accommodation.
6.6 People wishing to build their own homes
6.67 Planning guidance states that Government wants to enable more
people to build or commission their own home and wants to make
this form of housing a mainstream housing option. Historically,
data regarding levels of self-build has been hard to come by.
However, in accordance with The Self-build and Custom
Housebuilding (Register) Regulations 2016, since 1 April 2016, each
local authority is required to keep a register of individuals and
associations of individuals who are seeking to acquire serviced
plots of land in their area in order to build their own homes.
6.68 These registers may provide a false impression of demand because
theoretically anyone can apply to be on a register even if they have
no realistic means to build their own home. There is also nothing to
prevent people from signing up to registers in numerous
authorities, thus potentially inflating demand. They do nonetheless
act as a barometer for demand for self-build plots.
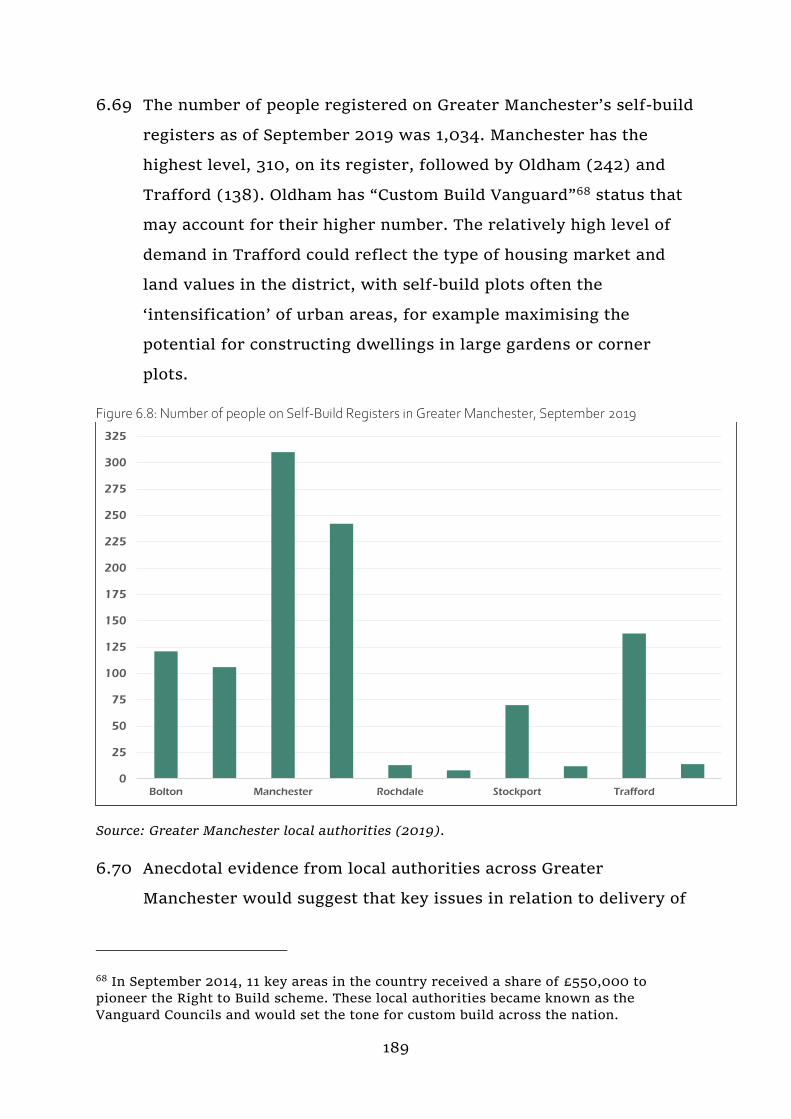
189
6.69 The number of people registered on Greater Manchester’s self-build
registers as of September 2019 was 1,034. Manchester has the
highest level, 310, on its register, followed by Oldham (242) and
Trafford (138). Oldham has “Custom Build Vanguard”68 status that
may account for their higher number. The relatively high level of
demand in Trafford could reflect the type of housing market and
land values in the district, with self-build plots often the
‘intensification’ of urban areas, for example maximising the
potential for constructing dwellings in large gardens or corner
plots.
Figure 6.8: Number of people on Self-Build Registers in Greater Manchester, September 2019
Source: Greater Manchester local authorities (2019).
6.70 Anecdotal evidence from local authorities across Greater
Manchester would suggest that key issues in relation to delivery of
68 In September 2014, 11 key areas in the country received a share of £550,000 to
pioneer the Right to Build scheme. These local authorities became known as the
Vanguard Councils and would set the tone for custom build across the nation.
0
25
50
75
100
125
150
175
200
225
250
275
300
325
Bolton Manchester Rochdale Stockport Trafford

190
this type of unit are associated with skills and risk. Whilst there
may be people with an ‘interest’ in self-build in Greater
Manchester, there is normally a significant financial outlay, risks
and time delays associated with self-build.
6.71 The evidence to date would suggest that this is currently a
relatively niche sector, which could deliver a small number of new
homes, including some bespoke high-end homes, but also more
modest homes for sale. Given the nature and numbers involved
with this type of unit, it is expected that most new delivery will be
on small windfall sites and it is therefore unlikely to contribute
significant numbers to Greater Manchester’s housing land supply
over the next twenty years.
6.72 Nevertheless, the Self-build and Custom Housebuilding Act (2015)
(as amended) places a duty on relevant bodies to have regard to the
self-build and custom housebuilding register when carrying out
their planning, housing, land disposal and regeneration functions
and to give suitable development permission to enough serviced
plots of land to meet demand.
6.7 Students
6.73 Greater Manchester has a significant student population, reflecting
its strong university base largely situated in the regional centre.
6.74 The 2011 Census shows the proportion of Greater Manchester
households consisting solely of full-time students is slightly above
the national average; with Manchester having a relatively high
figure of 3.2% compared to the England average of 0.6%.
Spatial Distribution of Student households
6.75 Student households are mostly in the area stretching from the
Manchester City Centre ward to Withington, with more than 20%

191
of households in the latter consisting wholly of full-time students,
by far the highest proportion in Greater Manchester (although nine
other wards in Manchester exceed 5%). The immediately
surrounding areas also typically have above average proportions of
student households, including adjoining wards to the city centre as
well as those of Langworthy and Broughton in Salford.
6.76 Outside this area, only the ward of Halliwell in Bolton has more
than 0.6% of households consisting solely of full-time students.
This spatial pattern of student households means that 86% are
located in Manchester, with 8% in Salford and 3% in Bolton. This is
reflected in the map below.
Map 6.3: Distribution of students across Greater Manchester by Output Area, 2011
Source: 2011 Census
6.77 There are 13 Further Education colleges providing education and
training and offer higher-level qualifications for young people
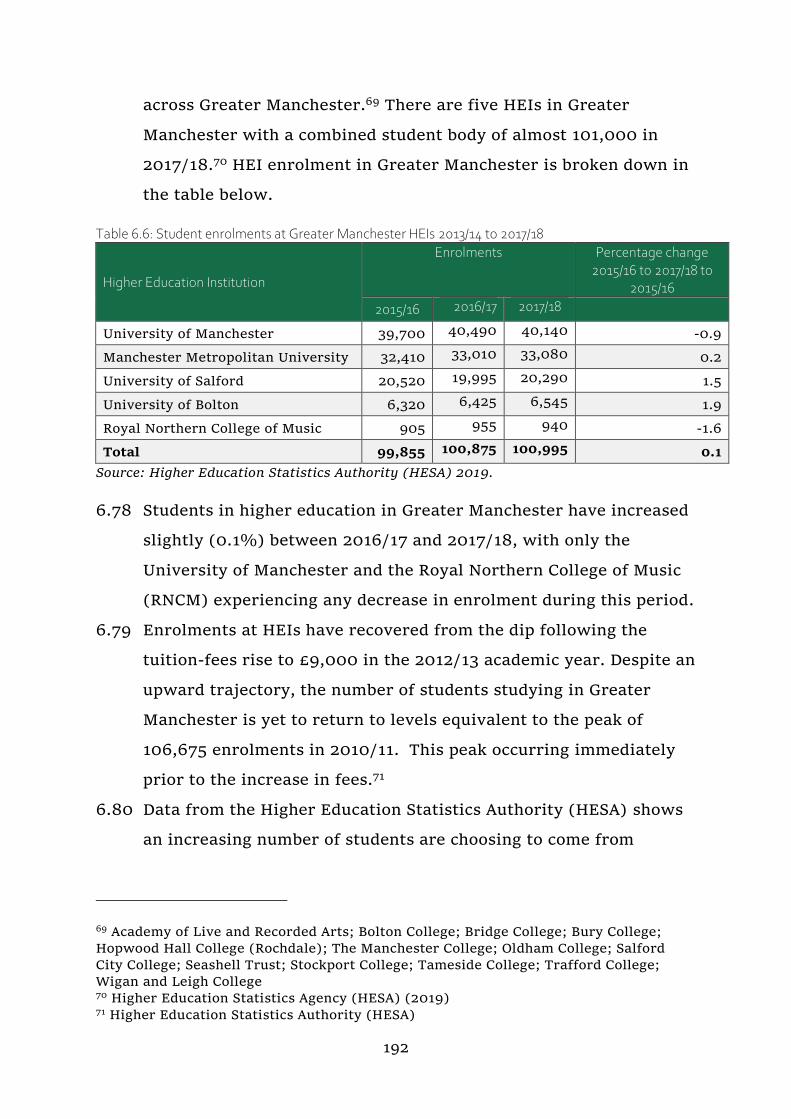
192
across Greater Manchester.69 There are five HEIs in Greater
Manchester with a combined student body of almost 101,000 in
2017/18.70 HEI enrolment in Greater Manchester is broken down in
the table below.
Table 6.6: Student enrolments at Greater Manchester HEIs 2013/14 to 2017/18
Higher Education Institution
Enrolments Percentage change 2015/16 to 2017/18 to
2015/16
2015/16 2016/17 2017/18
University of Manchester 39,700 40,490 40,140 -0.9
Manchester Metropolitan University 32,410 33,010 33,080 0.2
University of Salford 20,520 19,995 20,290 1.5
University of Bolton 6,320 6,425 6,545 1.9
Royal Northern College of Music 905 955 940 -1.6
Total 99,855 100,875 100,995 0.1
Source: Higher Education Statistics Authority (HESA) 2019.
6.78 Students in higher education in Greater Manchester have increased
slightly (0.1%) between 2016/17 and 2017/18, with only the
University of Manchester and the Royal Northern College of Music
(RNCM) experiencing any decrease in enrolment during this period.
6.79 Enrolments at HEIs have recovered from the dip following the
tuition-fees rise to £9,000 in the 2012/13 academic year. Despite an
upward trajectory, the number of students studying in Greater
Manchester is yet to return to levels equivalent to the peak of
106,675 enrolments in 2010/11. This peak occurring immediately
prior to the increase in fees.71
6.80 Data from the Higher Education Statistics Authority (HESA) shows
an increasing number of students are choosing to come from
69 Academy of Live and Recorded Arts; Bolton College; Bridge College; Bury College;
Hopwood Hall College (Rochdale); The Manchester College; Oldham College; Salford
City College; Seashell Trust; Stockport College; Tameside College; Trafford College;
Wigan and Leigh College 70 Higher Education Statistics Agency (HESA) (2019) 71 Higher Education Statistics Authority (HESA)
193
outside of Greater Manchester and outside of the UK. This is having
an impact upon both the relative scale of demand for
accommodation, as fewer students are living at home whilst
studying at Greater Manchester HEIs.
Types of student accommodation
6.81 Broadly speaking there are two forms of student accommodation
that students in Greater Manchester occupy. Purpose Built Student
Accommodation (PBSA), refers to developments that have gone
through planning as a dedicated student scheme and can only be let
to student occupiers. Either they can be university halls of
residence or schemes developed and managed by private providers.
The second accommodation type is mainstream accommodation –
i.e. properties let within the standard PRS. These can range from
shared houses or HMOs through to flats and serviced apartments.
6.82 The number of student households exempt from Council Tax in May
2019 across Greater Manchester was 20,577. This has increased
steadily over the last 5 years with an average exemption figure of
19,349 households. In May 2019, 71% of these student exemptions
were in mainstream accommodation as opposed to custom-built
student accommodation.

194
Table 6.7: Student enrolments at Greater Manchester HEIs 2013/14 to 2017/18
Greater Manchester
Number households
2019 Average
2015-2019 Percentage change
2015 to 2019 Occupied only by students, the foreign
spouses of students, or school and college
leavers (mainstream) 14,717 n/a n/a
A hall of residence provided predominantly
for the accommodation of students. (Purpose
built) 5,860 n/a n/a
Total 20,577 19,349 9.8
England
Number of households
2019 Average
2015-2019 Percentage change
2015 to 2019 Occupied only by students, the foreign
spouses of students, or school and college
leavers. (mainstream) 270,860 n/a n/a
A hall of residence provided predominantly
for the accommodation of students. (purpose
built) 65,664 n/a n/a
Total 336,524 314,426 18.0
Source: MHCLG Council Tax Base Local Authority Level: Council Tax Base (CTB)
Supplementary Form.
Figure 6.9: Mainstream exemptions in Council Tax 2019
Source: MHCLG Council Tax Base Local Authority Level: Council Tax Base (CTB)
Supplementary Form.
Manchester
0
2000
4000
6000
8000
10000
12000
14000
16000
18000
Bolton Bury Manchester Oldham Rochdale Salford Stockport Tameside Trafford Wigan
Class M - purpose built Class N - mainstream

195
6.83 The student housing market in Manchester has shifted north
towards the city centre - into the Oxford Road Corridor area - away
from the traditional student neighbourhoods in south Manchester
over recent years. The ongoing rationalisation of Manchester
Metropolitan University’s (MMU) estate has played a key role in
this redistribution, particularly the closure of the Didsbury campus
and the opening of the Birley Fields campus in Hulme.
6.84 This redistribution is largely due to a growing number of students
living in mainstream apartments, facilitated by the large-scale
residential development in the regional centre. Table 6.8 shows the
number of students occupying accommodation in the city centre.
Table 6.8 Student Council Tax exemptions within the Manchester city centre apartment market
2014-15 2015-
16 2016-17 2017-18
2018-19
2019-20
Purpose Built Student
Accommodation 2,833 2,891 3,082 3,080 3,485 3,635
Mainstream 3,040 2,655 2,941 2,727 2,818 3,242
Total exemptions 5,873 5,546 6,023 5,807 6,303 6,877
Source: Manchester City Council
Salford
6.85 In line with the University of Salford’s Campus Plan (2011) the
University has recently expanded its offer of university
accommodation with an extra 1,300 beds at Peel Park Quarter
delivered at the start of the 2015/16 academic year.
6.86 The concentration of students living in mainstream accommodation
in and around the University of Salford campus has remained
relatively consistent over time, with particular concentrations in
parts of the terraced and apartment market in Langworthy and
Broughton. There is also a growing concentration of student
households living in Salford Quays, reflecting the offer from the
University of Salford in terms of courses and study facilities at
MediaCityUK.
196
Bolton
6.87 Students studying at the University of Bolton are more likely to live
in mainstream accommodation during term time. This is reflected
in the student households exempt from Council Tax in the table
above.72
6.88 Student households are concentrated in the terraced housing stock
in neighbourhoods close to the University’s campus. Students also
occupy purpose-built accommodation in the town centre, following
the completion of a number of these schemes over the last five
years.
Trafford
6.89 A new university ‘UA92’ is now open in Trafford. As part of this
proposal, PBSA will be delivered in phases from 2020. This
purpose-built accommodation is expected to house around one third
of the students.
Summary
6.90 The spatial distribution of students is not expected to alter greatly
in the near future in Greater Manchester. The need of students is
expected to be met predominantly in Manchester, Salford and
Bolton and within Trafford in the future.
6.8 Family housing
6.91 In 2018, Greater Manchester had an estimated 339,030 households
with dependent children, 164,596 of these households contained
just one dependent child and 59,422 contained three or more
children (Table 6.9). By 2043, the number of dwellings in Greater
Manchester containing any dependent children is projected to rise
to just over 361,529, a rise of 6.6% or an actual change of 22,499.
72 Bolton Student Housing Survey 2016.
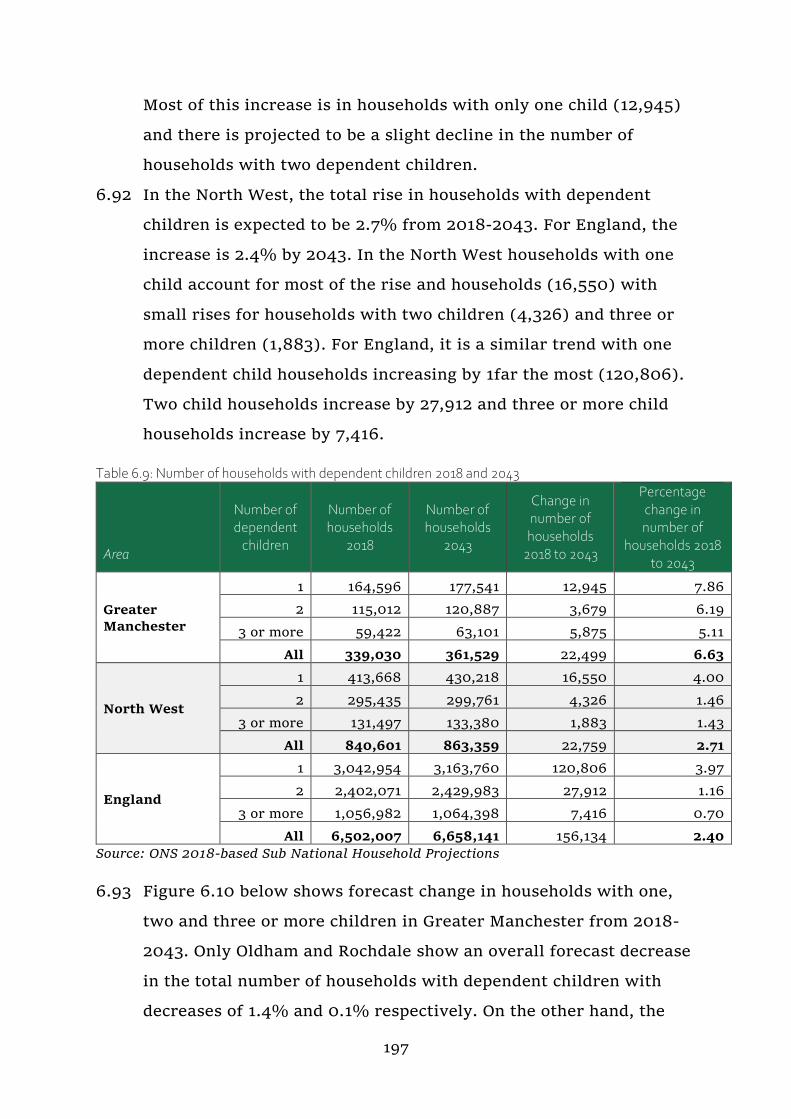
197
Most of this increase is in households with only one child (12,945)
and there is projected to be a slight decline in the number of
households with two dependent children.
6.92 In the North West, the total rise in households with dependent
children is expected to be 2.7% from 2018-2043. For England, the
increase is 2.4% by 2043. In the North West households with one
child account for most of the rise and households (16,550) with
small rises for households with two children (4,326) and three or
more children (1,883). For England, it is a similar trend with one
dependent child households increasing by 1far the most (120,806).
Two child households increase by 27,912 and three or more child
households increase by 7,416.
Table 6.9: Number of households with dependent children 2018 and 2043
Area
Number of dependent
children
Number of households
2018
Number of households
2043
Change in number of households
2018 to 2043
Percentage change in number of
households 2018 to 2043
Greater
Manchester
1 164,596 177,541 12,945 7.86
2 115,012 120,887 3,679 6.19
3 or more 59,422 63,101 5,875 5.11
All 339,030 361,529 22,499 6.63
North West
1 413,668 430,218 16,550 4.00
2 295,435 299,761 4,326 1.46
3 or more 131,497 133,380 1,883 1.43
All 840,601 863,359 22,759 2.71
England
1 3,042,954 3,163,760 120,806 3.97
2 2,402,071 2,429,983 27,912 1.16
3 or more 1,056,982 1,064,398 7,416 0.70
All 6,502,007 6,658,141 156,134 2.40
Source: ONS 2018-based Sub National Household Projections
6.93 Figure 6.10 below shows forecast change in households with one,
two and three or more children in Greater Manchester from 2018-
2043. Only Oldham and Rochdale show an overall forecast decrease
in the total number of households with dependent children with
decreases of 1.4% and 0.1% respectively. On the other hand, the

198
districts of Salford (22.6%) Trafford (16.1%) and Manchester
(15.1%) are expected to show the highest increase in households
with dependent children.
6.94 When this is analysed by the number of dependent children,
Manchester, Salford and Trafford again are projected to experience
an increase in all dependent children groups (i.e. one child, two
children and over three children). Oldham is only projected to
increase the number of households with over 3 children (15.5%)
and the increase in Tameside is only in the number of households
with one child (16.5%). The highest increases are in households
with one child in Salford (37.1%), Trafford (26.3%) and Stockport
(24%).
Figure 6.10: Change in number of dwellings with dependent children 2018 and 2043
Source: ONS, 2018-based subnational household projections
6.9 Armed Forces
6.95 The Armed Forces Covenant covers serving and former members of
the Armed Forces and their families. The Government in 2011
published this. It is supported by local authorities, including the
-1,000
0
1,000
2,000
3,000
4,000
5,000
6,000
Bo
lto
n 1
Bo
lto
n 2
Bo
lto
n 3
+
Bu
ry 1
Bu
ry 2
Bu
ry 3
+
Man
ches
ter
1
Man
ches
ter
2
Man
ches
ter
3+
Old
ham
1
Old
ham
2
Old
ham
3+
Ro
chd
ale
1
Ro
chd
ale
2
Ro
chd
ale
3+
Salf
ord
1
Salf
ord
2
Salf
ord
3+
Sto
ckp
ort
1
Sto
ckp
ort
2
Sto
ckp
ort
3+
Tam
esid
e 1
Tam
esid
e 2
Tam
esid
e 3+
Traf
ford
1
Traf
ford
2
Traf
ford
3+
Wig
an 1
Wig
an 2
Wig
an 3
+

199
GMCA, which reaffirmed its commitment in June 2017 and was
awarded a grant of £232,000 to continue to support the Armed
Forces through access to services and online learning tools.73 The
covenant is a commitment to ensure fair treatment of members of
the armed forces in many aspects of civilian life, including housing.
Serving members of the armed forces
6.96 Serving members of the armed forces are generally entitled to
service accommodation, either Single Living Accommodation (SLA)
or Service Family Accommodation (SFA) if they have dependent
children. Ministry of Defence statistics show that around 78% of
serving personnel are housed in this type of accommodation.74
6.97 As of February 2017, there were almost 50,000 SFA units in
England; no units of SFA were recorded in Greater Manchester, but
there were 308 in Lancashire. No detailed geographical breakdown
was given for SLA, but there are 126,000 units in England.75
Ex-service personnel
6.98 The Armed Forces Covenant also covers the housing of ex-service
personnel. There are a number of housing options for those who
have left the armed forces, including:
Forces Help to Buy: a scheme currently in its pilot stage to allow
service personnel to borrow up to half of their salary (up to a
maximum of £25,000) interest free, to pay for a deposit for a
home and other costs such as legal fees;76
73 GMCA Press Release, £232,000 BOOST FOR FORCES PERSONNEL, FAMILIES AND
VETERANS IN GREATER MANCHESTER, 30 June 2017 74 House of Commons Library Briefing Paper: Armed Forces Housing, June 2017 75Armed Forces: Housing: Written question – 68441,
http://www.parliament.uk/written-questions-answers-statements/written-
question/commons/2017-03-20/68441 76 https://www.gov.uk/guidance/forces-help-to-buy

200
Government funded shared ownership: ex-service personnel and
surviving partners are given priority for these schemes for 2
years after service;77 and
Accessing social housing through housing registers and housing
associations.
Access to social housing for ex-service personnel
6.99 Local authorities are able to make provision for ex-service
personnel and their families to receive additional priority for
rehousing in their allocations policies. Provisions include awarding
additional preference to ex-service personnel in housing need, as
well as removing local connection criteria for ex-service personnel
and their families. All local authorities in Greater Manchester refer
to ex-service personnel in their allocations policies, with provisions
to award higher need and forego local connection criteria.
Supported housing for the armed forces
6.100 In Greater Manchester there are some schemes providing supported
housing for ex-service personnel, including Broughton House in
Salford. The Greater Manchester Supported Housing Census has
shown that there are a small number of supported housing schemes
for veterans with around 20 bed spaces.
6.10 Gypsies and Travellers
6.101 A robust evidence base has been developed in Greater Manchester
for the current and future accommodation needs of Gypsies and
Travellers and Travelling Showpeople across the city region.
77 The Armed Forces Covenant Annual Report, 2016
201
6.102 A comprehensive Gypsy and Traveller Accommodation Assessment
(GTAA)78 was completed in 2014, with findings based on interviews
with 496 Gypsy and Traveller and Travelling Showperson
households across Greater Manchester. This evidence base was
subsequently updated in 201879 and included a desktop review of
relevant data sources and careful fieldwork observations across
sites/yards80 in Greater Manchester.
6.103 The 2018 GTAA Update takes into account the change in definition
of the need for Gypsy and Traveller groups, which was revised in
the Government’s ‘Planning policy for traveller sites’ (PPTS)
(August 2015). The definition now excludes, for planning purposes,
Gypsies and Travellers who have stopped travelling on a permanent
basis, although continues to include those who have ceased to
travel temporarily. This has created a more restricted ‘PPTS 2015’
definition that applies to those who follow a nomadic habit of life,
as compared with a broader ‘cultural’ definition.
6.104 The 2018 study provides analysis of households likely to meet this
PPTS 2015 definition (based on the travelling practices) and which
households do not (because they do not travel) but instead are
included within a broader cultural definition.
6.105 Using both the PPTS and cultural definition of need allows a range of
pitch need to be considered. The study recommends PPTS-defined
need as a minimum need figure and the higher culturally defined
78 Gypsy and Traveller and Travelling Showperson Accommodation Assessment (GTAA)
arc4 (2014). Available at: https://gmsf-consult.objective.co.uk/file/3651006 79 Gypsy and Traveller and Travelling Showperson Accommodation Assessment Update
(GTAA Update) arc4 (2018). Available at: https://www.greatermanchester-
ca.gov.uk/info/20175/research/217/greater_
manchester_and_traveller_and_travelling_showperson_accommodation_assessment_up
date_2018 80 “Pitch” means a pitch on a “gypsy and traveller” site and “plot” means a caravan on a
“travelling showpeople” site (often called a “yard”). This terminology differentiates
between residential pitches for “gypsies and travellers” and mixed-use plots for
“travelling showpeople” which may/will need to incorporate space or to be split to
allow for the storage of equipment.
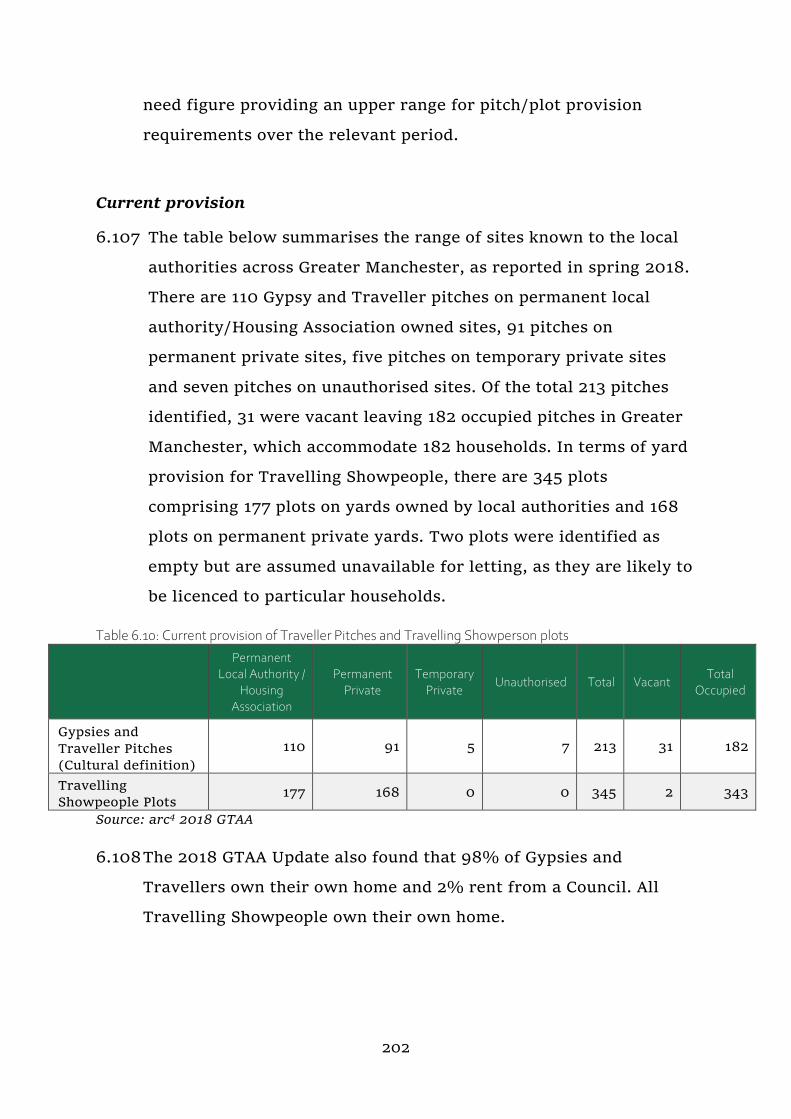
202
need figure providing an upper range for pitch/plot provision
requirements over the relevant period.
Current provision
6.107 The table below summarises the range of sites known to the local
authorities across Greater Manchester, as reported in spring 2018.
There are 110 Gypsy and Traveller pitches on permanent local
authority/Housing Association owned sites, 91 pitches on
permanent private sites, five pitches on temporary private sites
and seven pitches on unauthorised sites. Of the total 213 pitches
identified, 31 were vacant leaving 182 occupied pitches in Greater
Manchester, which accommodate 182 households. In terms of yard
provision for Travelling Showpeople, there are 345 plots
comprising 177 plots on yards owned by local authorities and 168
plots on permanent private yards. Two plots were identified as
empty but are assumed unavailable for letting, as they are likely to
be licenced to particular households.
Table 6.10: Current provision of Traveller Pitches and Travelling Showperson plots
Permanent Local Authority /
Housing Association
Permanent Private
Temporary Private
Unauthorised Total Vacant Total
Occupied
Gypsies and
Traveller Pitches
(Cultural definition)
110 91 5 7 213 31 182
Travelling
Showpeople Plots 177 168 0 0 345 2 343
Source: arc4 2018 GTAA
6.108 The 2018 GTAA Update also found that 98% of Gypsies and
Travellers own their own home and 2% rent from a Council. All
Travelling Showpeople own their own home.
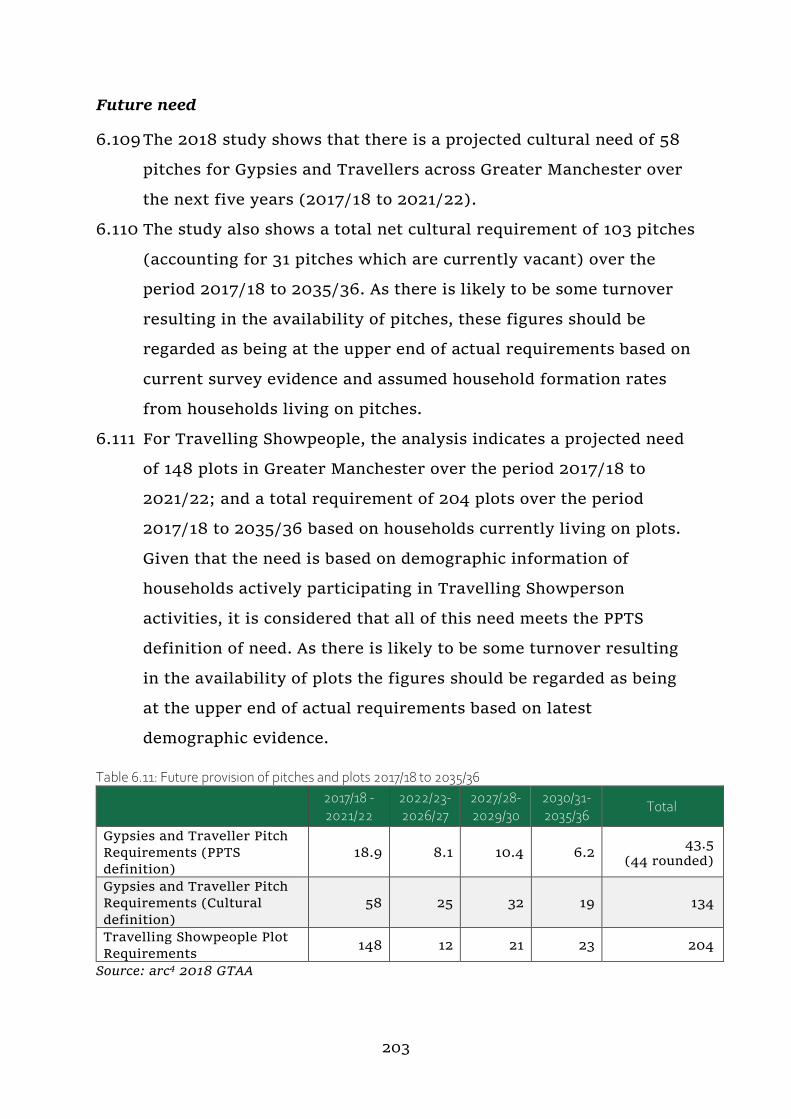
203
Future need
6.109 The 2018 study shows that there is a projected cultural need of 58
pitches for Gypsies and Travellers across Greater Manchester over
the next five years (2017/18 to 2021/22).
6.110 The study also shows a total net cultural requirement of 103 pitches
(accounting for 31 pitches which are currently vacant) over the
period 2017/18 to 2035/36. As there is likely to be some turnover
resulting in the availability of pitches, these figures should be
regarded as being at the upper end of actual requirements based on
current survey evidence and assumed household formation rates
from households living on pitches.
6.111 For Travelling Showpeople, the analysis indicates a projected need
of 148 plots in Greater Manchester over the period 2017/18 to
2021/22; and a total requirement of 204 plots over the period
2017/18 to 2035/36 based on households currently living on plots.
Given that the need is based on demographic information of
households actively participating in Travelling Showperson
activities, it is considered that all of this need meets the PPTS
definition of need. As there is likely to be some turnover resulting
in the availability of plots the figures should be regarded as being
at the upper end of actual requirements based on latest
demographic evidence.
Table 6.11: Future provision of pitches and plots 2017/18 to 2035/36
2017/18 - 2021/22
2022/23-2026/27
2027/28-2029/30
2030/31-2035/36
Total
Gypsies and Traveller Pitch
Requirements (PPTS
definition)
18.9 8.1 10.4 6.2 43.5
(44 rounded)
Gypsies and Traveller Pitch
Requirements (Cultural
definition)
58 25 32 19 134
Travelling Showpeople Plot
Requirements 148 12 21 23 204
Source: arc4 2018 GTAA
204
6.112 The 2018 GTAA update identifies a considerable level of
overcrowding on existing yards and recommends that up to 19
acres of land is identified for Travelling Showperson yard
development, assuming that each acre would support 10 plots i.e. a
caravan and space for equipment.
6.113 The study also provides an assessment of the need for temporary
places to stop while travelling. Temporary, or transit, sites are
intended for short-term use while in transit. Analysis of
unauthorised encampment data and contextual information in the
2018 study indicates that new transit provision is needed across
Greater Manchester and recommends provision for 59 transit
pitches be made across the city-region.
The full 2018 GTAA Update provides a detailed analysis on current and future need
by district, and is available at: https://www.greatermanchester-ca.gov.uk/info/20175
/research/217/greater_manchester_gypsy_and_traveller_and_travelling_showperson_acc
ommodation_assessment_update_2018

205
7 Affordable Housing Need Assessment
206
Chapter summary
We all need homes that we can afford, but as we saw in Chapter 5, trying
to agree what we mean by ‘affordable’ homes can be a complex task.
Government guidance tells us we should try to assess affordable housing
need to help us decide how much additional housing we need overall,
based on their definition of “social rented, affordable rented and
intermediate housing, provided to eligible households whose needs are
not met by the market.”
The method Government asks us to follow includes estimates of:
The need for affordable housing now;
How that might change through time;
How many affordable homes will be available to re-let as people
move out of them;
How many affordable homes will be built or could be made
available from empty properties.
To make that calculation, we also need to make forecasts and
assumptions about a range of things including how many and what types
of households will emerge in the future, how many might be homeless, in
temporary or overcrowded accommodation, what household incomes
might be and the future costs of renting and buying property, across
different parts of Greater Manchester.
The figure we come to is a total annual need figure for affordable housing
of 5,850 households. That is not a target for building new affordable
house building through the planning system, but it is something we need
to consider in developing the GMSF and in our work with Homes England,
housing providers and other partners to deliver the affordable homes we
need for the future.

207
7.1 Introduction
7.1 An assessment of affordable housing need has been undertaken,
which is compliant with Government guidance to identify whether
there is a shortfall or surplus of affordable housing in Greater
Manchester. This has estimated current annual housing need of
5,850 households; this figure excludes existing social housing
tenants where they would release a home for another household in
need.
7.2 The link between the affordable housing need and the overall need
for housing (or the LHN) is complex. Many of the households in
need are already living in accommodation (existing households)
and simply require an alternative form of housing, and the analysis
does not suggest that there is any strong evidence of a need to
allocate additional housing land specifically to help address the
affordable need.
7.3 It should be stressed that these final figures are not targets for
affordable house building but a check to understand likely future
demand. Besides delivery of affordable housing on mixed-tenure
development schemes, there are also several other mechanisms that
could deliver affordable housing. These include a wide range of
funding programmes from Homes England, including their Shared
Ownership and AHP and funding for specialist forms of affordable
housing, such as extra care provision. Other sources such as
Community Land Trusts may also deliver new affordable housing.
Net changes in affordable housing stock may also be influenced by
estate regeneration schemes, as well other factors such as the
proposed extension of the Right-to-Buy to housing association
properties.
7.4 The affordable housing need does not therefore represent an
assessment of what proportion of additional households might

208
require affordable housing. Instead, the model considers what
needs can be expected to arise from both existing and newly
forming households who require financial support to access
suitable housing. This is then compared with the projected supply
of affordable housing expected to arise from the turnover of
existing stock and affordable housing in the development pipeline.
7.5 The affordable housing model thus includes supply-side factors. The
net need figures derived are influenced by the current stock of
affordable housing and its turnover. This is influenced by past
policies, funding mechanisms and investment decisions (at both the
national and local levels), which in turn influence the need today.
7.6 Given that there has been some decrease in affordable housing
stock over the last 15 years, the PRS has in effect taken on an
increasing role in providing housing for households that require
financial support in meeting their housing needs, supported by
Local Housing Allowance. While the PRS does not fall within the
definition of “affordable housing” it has evidently been playing a
role in meeting the needs of households who require financial
support with housing costs. The Government recognised this and
indeed legislated through the 2011 Localism Act to allow councils to
discharge their “homelessness duty” through providing an offer of a
suitable property in the PRS.
7.2 Methodology
7.7 The affordable housing need must be calculated to establish the
unmet need for affordable housing notwithstanding any conclusions
around LHN in Chapter 3 of this document, or our analysis of
housing affordability in Chapter 5.
7.8 Affordable housing is defined in the NPPF as:
209
“Housing for sale or rent, for those whose needs are not met by the
market (including housing that provides a subsidised route to home
ownership and/or is for essential local workers)”81
7.9 PPG (Housing and Economic Needs Assessment) provides guidance
on calculating affordable housing need, replacing the 2007 SHMA
Practice Guidance,82 stating that local authorities need to:
“…estimate the current number of households and projected number
of households who lack their own housing or who cannot afford to
meet their housing needs in the market.”
(Paragraph: 019 Reference ID: 2a-019-20190220)
7.10 This approach focuses on the use of secondary data and careful
consideration must be given to the data available and relevant to
calculating affordable housing need. For example, households who
have a need due to issues such as insecure tenancies or an inability
to meet housing costs are not readily captured from secondary data
sources. Assumptions also need to be made about the likely income
levels of different groups of the population (such as newly forming
households), recognising that such households’ incomes may differ
from those in the general population.
7.11 The same PPG suggests that housing registers can inform estimate
levels of affordable housing need. The allocations policies of
districts can however vary considerably in their approaches to
awarding banding and points to households on housing registers.
This makes it difficult to use a housing register to define underlying
needs in a consistent way. Housing registers also include
81 NPPF, Annex 2: Glossary, available at:
https://www.gov.uk/government/publications/national-planning-policy-framework--2
82 Available at:
https://assets.publishing.service.gov.uk/government/uploads/system/uploads/attachme
nt_
data/file/11813/Strategic_Housing_Market_Assessments-_Annexes.pdf

210
households who no longer have a need and there will be households
in need who do not register because they perceive (rightly or
wrongly) that they have little chance of being allocated a suitable
home.
7.12 The PPG83 advises how to calculate unmet need for affordable
housing by assessing past trends and estimates of:
homeless households;
those in priority need who are currently housed in temporary
accommodation;
households in over-crowded housing;
concealed households;
existing affordable housing tenants in need (i.e. householders
currently housed in unsuitable dwellings); and
households from other tenures in need and those that cannot
afford their own homes, either to rent, or to own, where that is
their aspiration.
7.13 The process used to model to a total net housing need per year is
illustrated below (Figure 7.1). The flow diagram shows future
housing need and supply coming together with current need and
supply to provide an estimate of the expected total net current
housing need per year.
83 PPG - Housing and Economic Needs Assessment, Paragraph: 020 Reference ID: 2a-
020-20190220

211
Figure 0.1: The Basic Needs Assessment model
7.14 The data used to underpin the methodology has been agreed
through a collaborative approach working with Greater
Manchester’s ten districts.
7.3 Stages of the assessment
7.15 From the PPG the following broad stages can be outlined to assess
affordable housing need:
Table 7.1: Stages to assess affordable housing need
Stage Details
Stage 1 Current unmet housing need (gross backlog)
Stage 2 Future housing need (net annual)
Stage 3 Affordable housing supply (net annual)
Stage 4 Total housing need (net annual)
Stage 1: Current unmet housing need (gross backlog)
7.16 Stage 1 assesses the number of households who lack their own
housing or live in unsuitable housing and cannot afford to meet
their housing needs in the market. It provides an understanding of
the scale of housing need, including any backlog. All of Greater

212
Manchester’s districts use a housing register to record households
who have expressed an interest in living in accommodation
managed by the local authority or RPs.
7.17 Local authorities report these statistics to MHCLG, which are then
compiled into a national statistical data return.84 The figures for
Greater Manchester are shown in Table 7.2. The figures provide a
summary of the total current unmet housing need in Greater
Manchester.
7.18 These figures include homeless households, overcrowded and
concealed households and any other groups in reasonable
preference (see Section 5.5 for a further discussion of reasonable
preference). To ensure the robustness of this data, these figures
have been discussed and approved by each of the ten Greater
Manchester districts, with five districts providing revised data.
Otherwise, an average of unmet need has been used with the
available data from 2011/12 to 2018/19 to smooth out some
anomalies over time.
Table 0.2: Total current unmet housing need (gross backlog)
Area
Total households on the housing waiting list in a reasonable preference category
Bolton* 3,261
Bury 938
Manchester 5,997
Oldham 4,015
Rochdale* 1,661
Salford* 6,094
Stockport 3,217
Tameside* 4,040
Trafford 1,369
Wigan* 1,510
Greater Manchester 32,102
Source: *=District figure provided otherwise MHCLG Local Authority Return – Section C –
Allocations 2011/12 to 2018/19
84 https://www.gov.uk/government/statistical-data-sets/local-authority-housing-
statistics-data-returns-for-2015-to-2016

213
Stage 2: Total newly arising affordable housing need (gross per year)
7.19 Stage 2 of the need's assessment model estimates the scale of newly
arising need. This is based on estimating how many newly formed
households will be unable to buy or rent in the market and the
number of existing households who become unable to buy or rent in
the market in any year.
Step 2.1: New household formation
7.20 This stage begins with estimating the number of new households
likely to form each year. The PPG suggests that MHCLG household
projections are an appropriate data source for this and that a gross
figure should be used.
7.21 This has been undertaken by considering the changes in households
in specific five-year age bands relative to numbers in the age band
below five years previously, to provide an estimate of gross
household formation.85 To put it more simply, whatever else is
happening in terms of overall household change, a person aged 15
in 2016 will be aged 35 in 2036 and would be likely to form a
household at some point over this period.
7.22 During this stage, only newly forming households headed by a
person aged under 45 have been considered. This is consistent with
MHCLG 2007 SHMA Practice Guidance that after age 45 headship
(household formation) rates ‘plateau’. There will be new
households formed by older household heads (e.g. due to
relationship breakdown) but the number is expected to be
relatively small.
85 This differs from numbers presented in the demographic projections which are for net
household growth and the two are not directly comparable (although there will be some
relationship between the two).
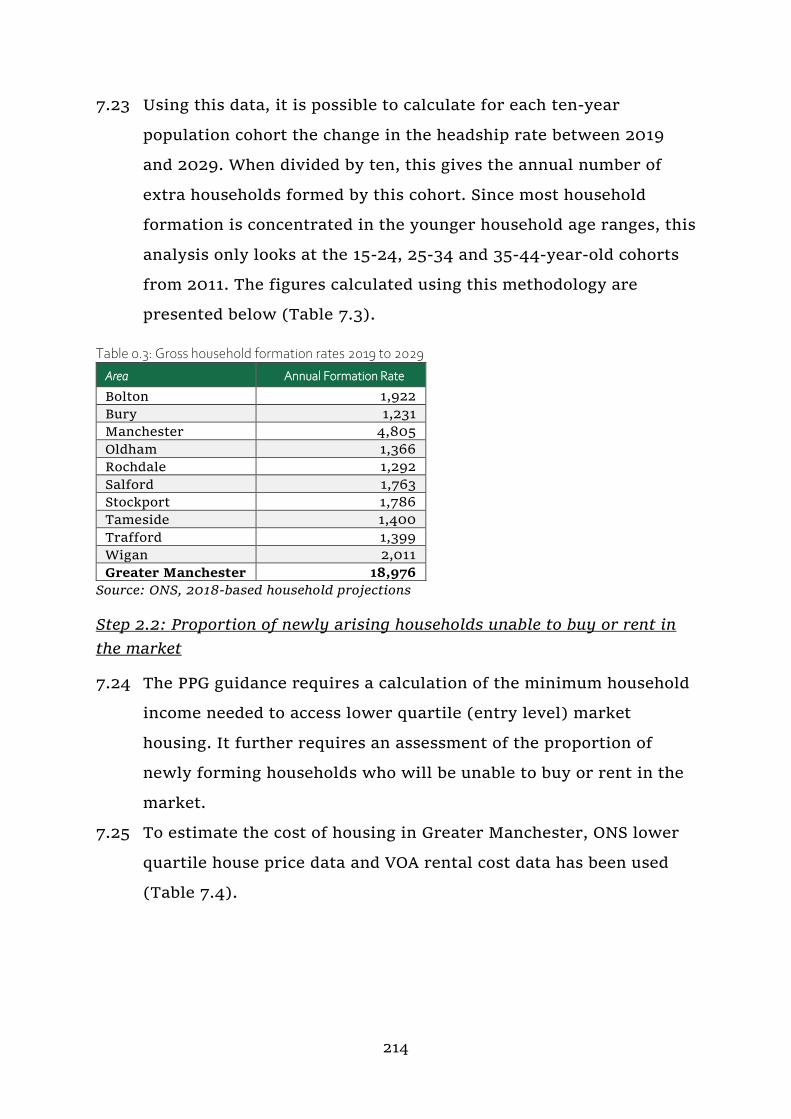
214
7.23 Using this data, it is possible to calculate for each ten-year
population cohort the change in the headship rate between 2019
and 2029. When divided by ten, this gives the annual number of
extra households formed by this cohort. Since most household
formation is concentrated in the younger household age ranges, this
analysis only looks at the 15-24, 25-34 and 35-44-year-old cohorts
from 2011. The figures calculated using this methodology are
presented below (Table 7.3).
Table 0.3: Gross household formation rates 2019 to 2029
Area Annual Formation Rate
Bolton 1,922
Bury 1,231
Manchester 4,805
Oldham 1,366
Rochdale 1,292
Salford 1,763
Stockport 1,786
Tameside 1,400
Trafford 1,399
Wigan 2,011
Greater Manchester 18,976
Source: ONS, 2018-based household projections
Step 2.2: Proportion of newly arising households unable to buy or rent in
the market
7.24 The PPG guidance requires a calculation of the minimum household
income needed to access lower quartile (entry level) market
housing. It further requires an assessment of the proportion of
newly forming households who will be unable to buy or rent in the
market.
7.25 To estimate the cost of housing in Greater Manchester, ONS lower
quartile house price data and VOA rental cost data has been used
(Table 7.4).
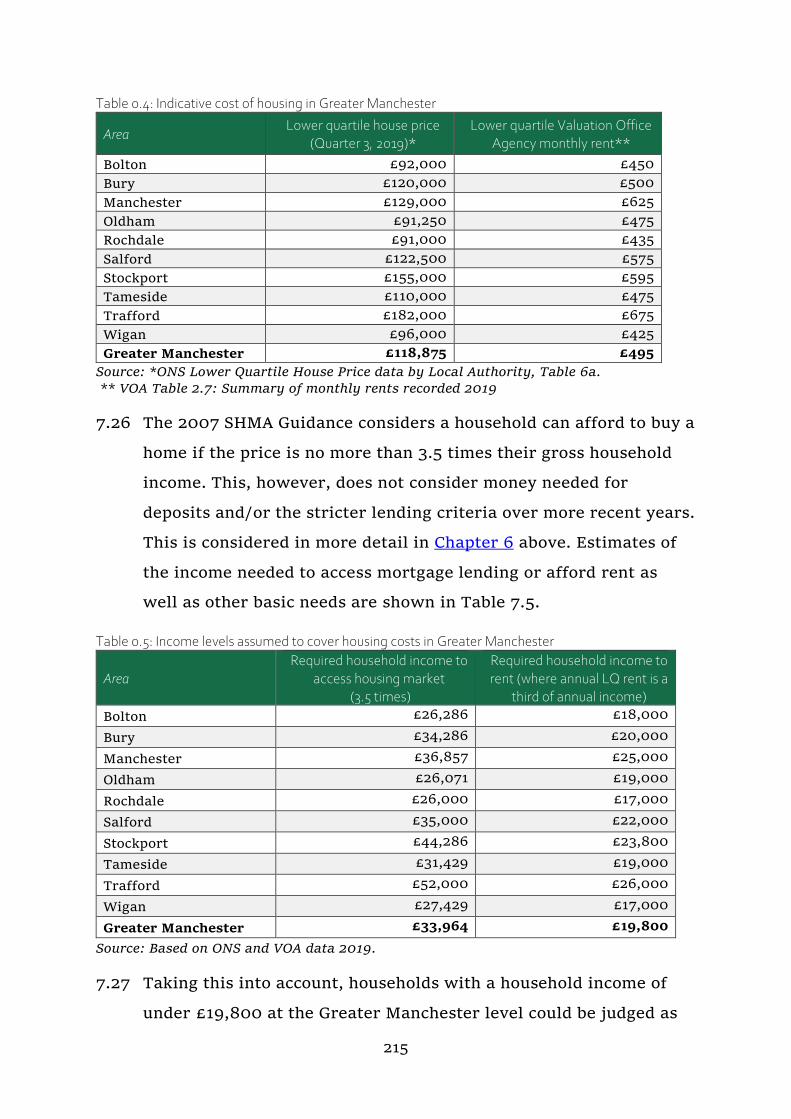
215
Table 0.4: Indicative cost of housing in Greater Manchester
Area Lower quartile house price
(Quarter 3, 2019)* Lower quartile Valuation Office
Agency monthly rent**
Bolton £92,000 £450
Bury £120,000 £500
Manchester £129,000 £625
Oldham £91,250 £475
Rochdale £91,000 £435
Salford £122,500 £575
Stockport £155,000 £595
Tameside £110,000 £475
Trafford £182,000 £675
Wigan £96,000 £425
Greater Manchester £118,875 £495
Source: *ONS Lower Quartile House Price data by Local Authority, Table 6a.
** VOA Table 2.7: Summary of monthly rents recorded 2019
7.26 The 2007 SHMA Guidance considers a household can afford to buy a
home if the price is no more than 3.5 times their gross household
income. This, however, does not consider money needed for
deposits and/or the stricter lending criteria over more recent years.
This is considered in more detail in Chapter 6 above. Estimates of
the income needed to access mortgage lending or afford rent as
well as other basic needs are shown in Table 7.5.
Table 0.5: Income levels assumed to cover housing costs in Greater Manchester
Area Required household income to
access housing market (3.5 times)
Required household income to rent (where annual LQ rent is a
third of annual income)
Bolton £26,286 £18,000
Bury £34,286 £20,000
Manchester £36,857 £25,000
Oldham £26,071 £19,000
Rochdale £26,000 £17,000
Salford £35,000 £22,000
Stockport £44,286 £23,800
Tameside £31,429 £19,000
Trafford £52,000 £26,000
Wigan £27,429 £17,000
Greater Manchester £33,964 £19,800
Source: Based on ONS and VOA data 2019.
7.27 Taking this into account, households with a household income of
under £19,800 at the Greater Manchester level could be judged as
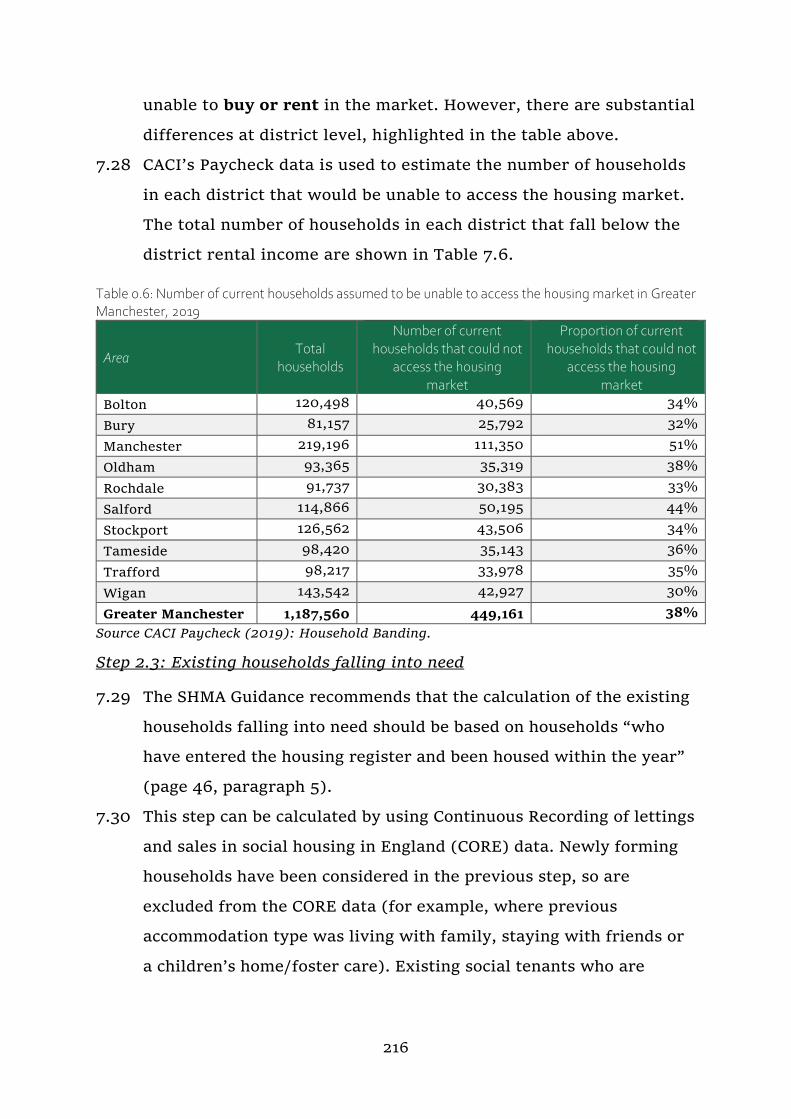
216
unable to buy or rent in the market. However, there are substantial
differences at district level, highlighted in the table above.
7.28 CACI’s Paycheck data is used to estimate the number of households
in each district that would be unable to access the housing market.
The total number of households in each district that fall below the
district rental income are shown in Table 7.6.
Table 0.6: Number of current households assumed to be unable to access the housing market in Greater Manchester, 2019
Area Total
households
Number of current households that could not
access the housing market
Proportion of current households that could not
access the housing market
Bolton 120,498 40,569 34%
Bury 81,157 25,792 32%
Manchester 219,196 111,350 51%
Oldham 93,365 35,319 38%
Rochdale 91,737 30,383 33%
Salford 114,866 50,195 44%
Stockport 126,562 43,506 34%
Tameside 98,420 35,143 36%
Trafford 98,217 33,978 35%
Wigan 143,542 42,927 30%
Greater Manchester 1,187,560 449,161 38%
Source CACI Paycheck (2019): Household Banding.
Step 2.3: Existing households falling into need
7.29 The SHMA Guidance recommends that the calculation of the existing
households falling into need should be based on households “who
have entered the housing register and been housed within the year”
(page 46, paragraph 5).
7.30 This step can be calculated by using Continuous Recording of lettings
and sales in social housing in England (CORE) data. Newly forming
households have been considered in the previous step, so are
excluded from the CORE data (for example, where previous
accommodation type was living with family, staying with friends or
a children’s home/foster care). Existing social tenants who are

217
transferring between social/affordable homes are also excluded as
their need is for a different, rather than additional, affordable home.

218
Table 0.7: Estimated existing households falling into need
Area
Total count
[1]
Previous tenure Step 2.3 Existing households
falling into need (i.e. excluding
all newly forming
households [10] (5-8))
LA General Needs
tenancy [2]
HA/PRP General needs
tenancy [3]
Existing Social tenants-
"transfers" [4] (2 + 3)
Existing (non-social) Households
falling into need [5] (1-(2+3))
Other* [6]
Previously Living with Friends or Family [7]
Newly forming
households [8] (6+7)
Bolton 2,320 266 407 673 1,647 368 407 775 872
Bury 1,071 289 95 384 687 101 205 306 381
Manchester 3,394 346 514 860 2,534 216 829 1,045 1,489
Oldham 1,785 216 351 567 1,218 194 326 520 698
Rochdale 1,847 158 424 582 1,265 198 470 668 597
Salford 2,194 277 380 657 1,537 193 458 651 886
Stockport 963 177 131 308 655 83 267 350 305
Tameside 1,982 78 351 429 1,553 139 614 753 800
Trafford 1,075 45 345 390 685 69 248 317 368
Wigan 2,245 503 205 708 1,537 268 516 784 753
Greater
Manchester
18,876 2,355 3,203 5,558 13,318 1,829 4,340 6,169 7,149
Source: CORE Lettings data 2018/19 https://www.gov.uk/government/statistics/social-housing-lettings-in-england-april-2018-to-march-2019
*Other includes more sensitive categories that have been combined to avoid disclosure. This includes previous tenure being that of children’s
home/foster care, hospitals, women’s refuges, Home Office asylum support, prison/approved hostel support. It is not possible in this dataset to
isolate children’s homes/foster care so the broader definition has been used.

219
7.31 CORE lettings data for the period 1 April 2018 to 31 March 2019 has
been used to estimate the number of existing households falling
into need in 2018/19 as 7,149 across Greater Manchester, shown as
step 2.3 in Table 7.7.
Step 2.4: Total newly arising housing need (gross per year)
7.32 The assumed total newly arising housing need can be calculated by
adding the number of existing households falling into need to the
number of newly formed households unable to afford market
housing. In Greater Manchester, there are an estimated 14,326
people classed as newly arising housing need per year.
7.33 Table 7.8 illustrates the calculation of the gross annual arising
housing need:
Table 0.8: Assumed total newly arising housing need (gross per year)
Area
Step 2.1 Step 2.2 Step 2.3 Step 2.4
New household formation
(MHCLG figures (see above Figure
3)
Proportion of newly arising households
unable to buy or rent in the market
Existing households falling
into need
Total newly arising housing need (gross per
year) = (2.1 x 2.2 + 2.3
Bolton 1,922 0.34 872 1,519
Bury 1,231 0.32 381 772
Manchester 4,805 0.51 1,489 3,930
Oldham 1,366 0.38 698 1,215
Rochdale 1,292 0.33 597 1,025
Salford 1,763 0.44 886 1,662
Stockport 1,786 0.34 305 919
Tameside 1,400 0.36 800 1,300
Trafford 1,399 0.35 368 852
Wigan 2,011 0.30 753 1,354
Greater Manchester 18,976 0.38 7,149 14,548
New household formation figures based on 2018 projections.
Stage 3: Current and future affordable housing supply
Step 3.1: Affordable dwellings occupied by households in need
7.34 The PPG indicates that the number of dwellings vacated by current
occupiers that are fit for use by other households in need should be
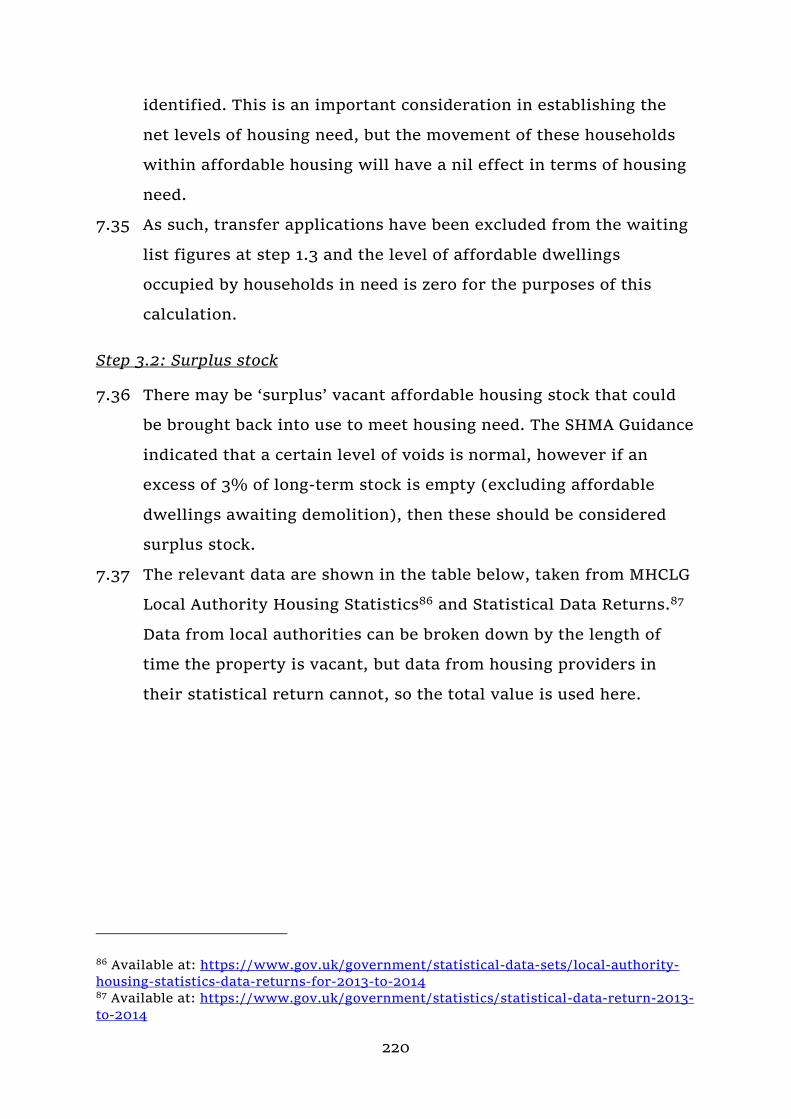
220
identified. This is an important consideration in establishing the
net levels of housing need, but the movement of these households
within affordable housing will have a nil effect in terms of housing
need.
7.35 As such, transfer applications have been excluded from the waiting
list figures at step 1.3 and the level of affordable dwellings
occupied by households in need is zero for the purposes of this
calculation.
Step 3.2: Surplus stock
7.36 There may be ‘surplus’ vacant affordable housing stock that could
be brought back into use to meet housing need. The SHMA Guidance
indicated that a certain level of voids is normal, however if an
excess of 3% of long-term stock is empty (excluding affordable
dwellings awaiting demolition), then these should be considered
surplus stock.
7.37 The relevant data are shown in the table below, taken from MHCLG
Local Authority Housing Statistics86 and Statistical Data Returns.87
Data from local authorities can be broken down by the length of
time the property is vacant, but data from housing providers in
their statistical return cannot, so the total value is used here.
86 Available at: https://www.gov.uk/government/statistical-data-sets/local-authority-
housing-statistics-data-returns-for-2013-to-2014 87 Available at: https://www.gov.uk/government/statistics/statistical-data-return-2013-
to-2014

221
Table 0.9: Calculation of surplus stock
Area
Local Authority* Housing Provider** Total
Stock
Vacant dwellings for over 6
months and available for rent
Total Stock of General Needs – self-contained - owned low cost
rental accommodation
General Needs self -contained
units vacant and available for
letting
Stock
Vacant dwellings
available for rent
Percentage of vacant stock
Bolton 0 0 20,813 106 20,813 106 0.5
Bury 7,940 9 3,499 14 11,439 23 0.2
Manchester 15,845 0 45,579 172 61,424 172 0.3
Oldham 2,062 5 16,809 68 18,871 73 0.4
Rochdale 0 0 18,127 141 18,127 141 0.8
Salford 1,227 0 26,848 84 28,075 84 0.3
Stockport 11,306 0 4,185 17 15,491 17 0.1
Tameside 0 0 19,157 147 19,157 147 0.8
Trafford 0 0 11,699 37 11,699 37 0.3
Wigan 21,896 43 2,081 24 23,977 67 0.3
Greater
Manchester
60,276 57 168,797 810 229,073 867 0.4
Source: MHCLG* https://www.gov.uk/government/collections/local-authority-housing-data#2018-to-2019
**https://www.gov.uk/government/statistics/statistical-data-return-2018-to-2019

222
7.38 Table 7.9 demonstrates there is no surplus stock, since the
percentage of vacant stock is well below 3% in all districts. The
figure for this step of the assessment is therefore zero.
Step 3.3: Committed supply of new affordable units
7.39 New affordable dwellings that are committed at the time of the
assessment should also be considered. This includes housing on
sites with full or outline planning permission, or where
Government funding has been allocated to a specific scheme. This
estimate includes developments by RPs and sites where affordable
housing will be provided through Section 106 agreements. Guidance
suggests that only those affordable dwellings that have been
secured on sites and are most likely to go ahead or currently under
construction be included.
Table 0.10: Committed supply of new affordable units
Area Total affordable starts on site
2018/19
Bolton 49
Bury 26
Manchester 491
Oldham 57
Rochdale 236
Salford* 1,245
Stockport 236
Tameside 63
Trafford 124
Wigan 266
Greater Manchester 2,007
Source: *District own data. Homes England 2018/19.
https://www.gov.uk/government/statistics/housing-statistics-1-april-2018-to-31-
march-2019
Step 3.4: Units to be taken out of management
7.40 Guidance outlines the need to estimate any likely losses of
affordable housing units that will result in households needing to
be re-housed. Planned demolitions are only counted if they are
currently occupied. In the absence of a robust and consistent

223
published dataset, Greater Manchester districts have been
consulted and confirmed it is reasonable to assume this number to
be zero for our purposes.
Step 3.5: Assumed total affordable housing stock available
7.41 The total affordable dwelling stock that is available is therefore
assumed to be the sum of steps 3.1 (dwellings currently occupied by
households in need), 3.2 (surplus stock) and 3.3 (committed
additional housing stock), minus 3.4 (units to be taken out of
management). The following table illustrates this calculation.
Table 0.11: Total available affordable housing stock
Area
Step 3.1 Step 3.2 Step 3.3 Step 3.4 Step 3.5
Affordable dwellings
occupied by households in
need
Surplus stock
Committed supply of
new affordable
housing
Units to be taken out of
management
Total affordable housing stock
available = 3.1 + 3.2 + 3.3 – 3.4
Bolton 0 0 49 0 49
Bury 0 0 26 0 26
Manchester 0 0 491 0 491
Oldham 0 0 57 0 57
Rochdale 0 0 236 0 236
Salford 0 0 1,245 0 1,245
Stockport 0 0 236 0 236
Tameside 0 0 63 0 63
Trafford 0 0 124 0 124
Wigan 0 0 266 0 266
Greater
Manchester 0 0
2,793 0
2,793
Step 3.6: Estimated annual supply of social housing re-lets
7.42 Step 3.6 estimates the number of units that become available for re-
let to a new household, with the PPG clear that this should be
calculated based on past trends. The average number of re-lets over
the previous four years have been used to predict future levels.
Transfers of tenancies to other household members have not been
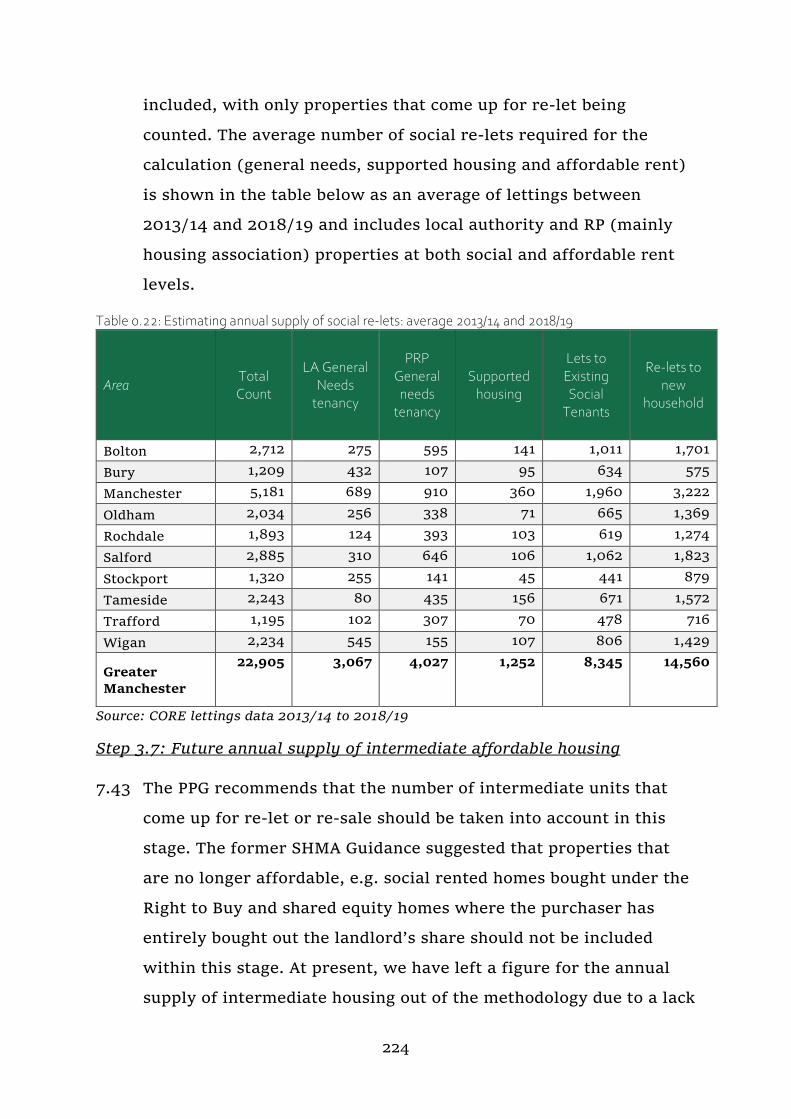
224
included, with only properties that come up for re-let being
counted. The average number of social re-lets required for the
calculation (general needs, supported housing and affordable rent)
is shown in the table below as an average of lettings between
2013/14 and 2018/19 and includes local authority and RP (mainly
housing association) properties at both social and affordable rent
levels.
Table 0.22: Estimating annual supply of social re-lets: average 2013/14 and 2018/19
Area Total Count
LA General Needs
tenancy
PRP General needs
tenancy
Supported housing
Lets to Existing Social
Tenants
Re-lets to new
household
Bolton 2,712 275 595 141 1,011 1,701
Bury 1,209 432 107 95 634 575
Manchester 5,181 689 910 360 1,960 3,222
Oldham 2,034 256 338 71 665 1,369
Rochdale 1,893 124 393 103 619 1,274
Salford 2,885 310 646 106 1,062 1,823
Stockport 1,320 255 141 45 441 879
Tameside 2,243 80 435 156 671 1,572
Trafford 1,195 102 307 70 478 716
Wigan 2,234 545 155 107 806 1,429
Greater
Manchester
22,905 3,067 4,027 1,252 8,345 14,560
Source: CORE lettings data 2013/14 to 2018/19
Step 3.7: Future annual supply of intermediate affordable housing
7.43 The PPG recommends that the number of intermediate units that
come up for re-let or re-sale should be taken into account in this
stage. The former SHMA Guidance suggested that properties that
are no longer affordable, e.g. social rented homes bought under the
Right to Buy and shared equity homes where the purchaser has
entirely bought out the landlord’s share should not be included
within this stage. At present, we have left a figure for the annual
supply of intermediate housing out of the methodology due to a lack

225
of robust and consistent figures across the districts. It is considered
that any such figures would be low for the Greater Manchester
districts, as levels of shared ownership are low across the
conurbation.
Step 3.8: Future annual supply of affordable housing units
7.44 The PPG clarifies that the future annual supply of affordable
housing units is the sum of social re-lets (step 3.6) and
intermediate affordable units that are re-let or resold (step 3.7).
The table below illustrates this calculation.
Table 0.33: Assumed future annual supply of affordable housing units
Area
Step 3.6 Step 3.7 Step 3.8
Annual supply of social re-lets
(net)
Future annual supply of intermediate affordable
housing
Annual supply of affordable housing
(3.6 + 3.7)
Bolton 1,701 0 1,701
Bury 575 0 575
Manchester 3,222 0 3,222
Oldham 1,369 0 1,369
Rochdale 1,274 0 1,274
Salford 1,823 0 1,823
Stockport 879 0 879
Tameside 1,572 0 1,572
Trafford 716 0 716
Wigan 1,429 0 1,429
Greater Manchester 14,560 0 14,560
Source: CORE
Stage 4 Estimate of net additional affordable housing requirement
7.45 The PPG advises that the total need for affordable housing be
calculated by subtracting total available stock from total gross need
and converting into an annual flow. This can then be used to
establish an aggregate estimate of net annual affordable housing
requirement.
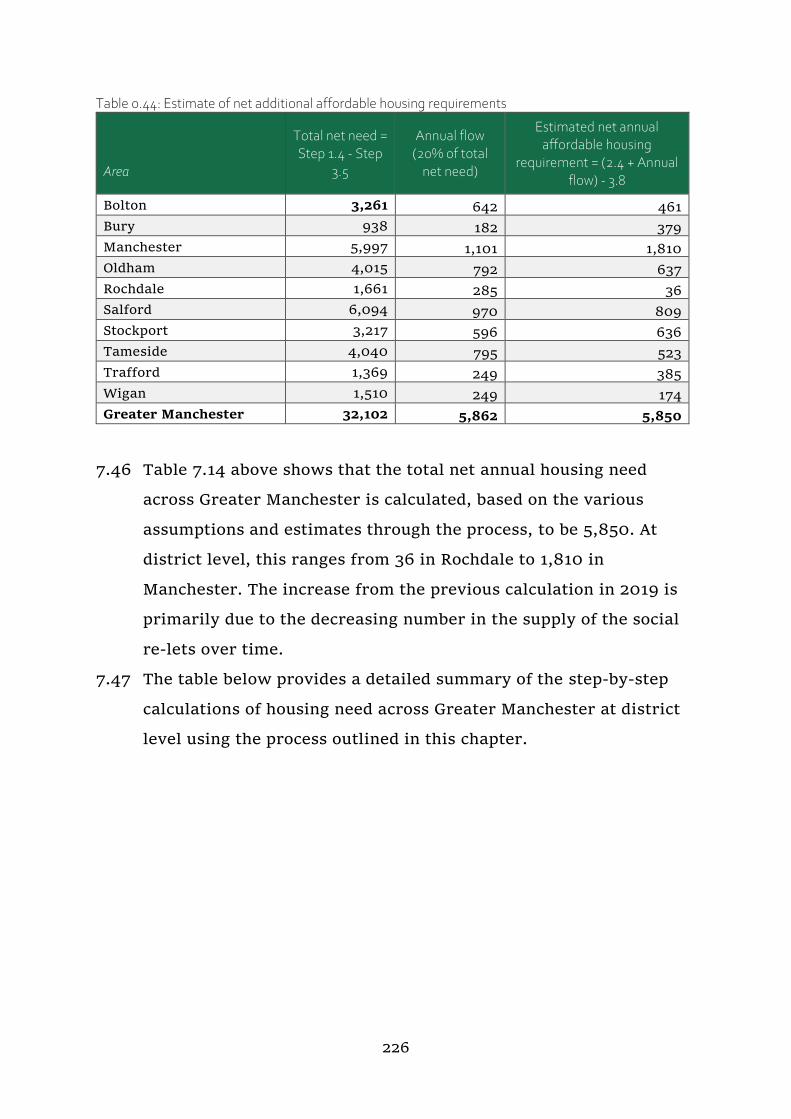
226
Table 0.44: Estimate of net additional affordable housing requirements
Area
Total net need = Step 1.4 - Step
3.5
Annual flow (20% of total
net need)
Estimated net annual affordable housing
requirement = (2.4 + Annual flow) - 3.8
Bolton 3,261 642 461
Bury 938 182 379
Manchester 5,997 1,101 1,810
Oldham 4,015 792 637
Rochdale 1,661 285 36
Salford 6,094 970 809
Stockport 3,217 596 636
Tameside 4,040 795 523
Trafford 1,369 249 385
Wigan 1,510 249 174
Greater Manchester 32,102 5,862 5,850
7.46 Table 7.14 above shows that the total net annual housing need
across Greater Manchester is calculated, based on the various
assumptions and estimates through the process, to be 5,850. At
district level, this ranges from 36 in Rochdale to 1,810 in
Manchester. The increase from the previous calculation in 2019 is
primarily due to the decreasing number in the supply of the social
re-lets over time.
7.47 The table below provides a detailed summary of the step-by-step
calculations of housing need across Greater Manchester at district
level using the process outlined in this chapter.

227
Table 0.55: Summary of Affordable Housing Needs Assessment by Greater Manchester district
Bolton Bury Manchester Oldham Rochdal
e Salford Stockport Tameside Trafford Wigan
Greater Manchester
Step 1 – Estimated Current Unmet Housing Need (Gross Backlog)
1 Total current housing need (gross) 3,261 938 5,997 4,015 1,661 6,094 3,217 4,040 1,369 1,510 32,102
Step 2 – Assumed Future Housing Need (Net Annual)
2.1 New Household formation 1,922 1,231 4,805 1,366 1,292 1,763 1,786 1,400 1,399 2,011 18,976
2.2 Proportion of households unable to
buy
0.34 0.32 0.51 0.38 0.33 0.44 0.34 0.36 0.35 0.30 0.38
2.3 Existing households falling into
need
872 381 1,489 698 597 886 305 800 368 753 7,149
2.4 Total newly arising need (gross per year) = (2.1 x 2.2) + 2.3
1,519 772 3,930 1,215 1,025 1,662 919 1,300 852 1,354 14,458
Step 3 – Estimated Affordable Housing Supply (Net Annual)
3.1 Affordable dwellings occupied by
households in need
0 0 0 0 0 0 0 0 0 0 0
3.2 Surplus Stock 0 0 0 0 0 0 0 0 0 0 0
3.3 Committed supply of new
affordable housing
49 26 491 57 236 1,245 236 63 124 266 2,793
3.4 Units to be taken out of
management
0 0 0 0 0 0 0 0 0 0 0
3.5 Total affordable housing stock available = 3.1 + 3.2 + 3.4 - 3.4
49 26 491 57 236 1,245 236 63 124 266 2,793
3.6 Annual supply of social re-lets (net) 1,701 575 3,222 1,369 1,274 1,823 879 1,572 716 1,429 14,560
3.7 Annual supply of intermediate affordable housing available for re-let
or resale at sub-market levels
0 0 0 0 0 0 0 0 0 0 0
3.8 Annual supply of affordable
housing = 3.6 + 3.7
1,701 575 3,222 1,369 1,274 1,823 879 1,572 716 1,429 14,560
Step 4 – Estimated Total Housing Need (Net Annual)
Total net need = 1 - 3.5 3,212 912 5,506 3,958 1,425 4,849 2,981 3,977 1,245 1,244 29,309
Annual flow (20% of total net need) 642 182 1,101 792 285 970 596 795 249 249 5,862
Net annual housing need = (2.4 +
Annual flow) - 3.8
461 379 1,810 637 36 809 636 523 385 174 5,850

8 Appendices
8.1 This section provides a summary of data sources of supporting material for each chapter.
Chapter 2: Defining the Housing Market
2011 Census http://www.nomisweb.co.uk/
H M Land Registry House Price Index (2020) http://landregistry.data.gov.uk/app/ukhpi/
Chapter 3:Local Housing Need
MHCLG Table 406: Household projections by district, England 2018 https://www.gov.uk/government/statistical-data-sets/live-tables-on-household-projections
Ratio of house price to workplace-based earnings (lower quartile and median) Table 5c https://www.ons.gov.uk/peoplepopulationandcommunity/housing/datasets/ratioofhousepricetoworkplacebasedearningslowerquartileandmedian
Chapter 4: Characteristics of the Housing Market Area
ONS Mid-Year Population Estimates (MYPE) 2018 https://www.ons.gov.uk/peoplepopulationandcommunity/populationandmigration/populationestimates/bulletins/annualmidyearpopulationestimates/mid2018
ONS Sub National Population Projections (SNPP) 2018 https://www.ons.gov.uk/releases/subnationalpopulationprojectionsforengland2018based
2011 Census http://www.nomisweb.co.uk/
Annual Population Survey (APS) 2018 NOMIS/ONS 2019 http://www.nomisweb.co.uk/
BRES 2018 http://www.nomisweb.co.uk/
Greater Manchester Forecasting Model (GMFM) https://www.greatermanchester-ca.gov.uk/what-we-do/economy/greater-manchester-forecasting-model/
CACI Paycheck 2019 Licensed to GMCA from CACI
MHCLG Live Table 784 https://www.gov.uk/government/statistical-data-sets/live-tables-on-homelessness
MHCLG Rough sleeping statistics England https://www.gov.uk/government/statistical-data-sets/live-tables-on-homelessness#rough-sleeping-tables Rough sleeping snapshot in England: autumn 2019 – Table 1 total
Valuation Office Agency (VOA), Table CTSOP3.0 https://www.gov.uk/government/statistics/council-tax-stock-of-properties-2019 Table CTSOP3.0: number of properties by Council Tax band, property type and region, county and local authority district
Annual Survey for Hours and Earnings (ASHE) 2018 https://www.ons.gov.uk/employmentandlabourmarket/peopleinwork/earningsandworkinghours/datasets/regionbyindustry2digitsicashetable5

Index of Multiple Deprivation (IMD) 2019 https://www.gov.uk/government/statistics/english-indices-of-deprivation-2019
MHCLG, Energy Performance of Buildings Data England & Wales https://epc.opendatacommunities.org/
H M Land Registry House Price Index (2020) http://landregistry.data.gov.uk/app/ukhpi/
Chapter 5: Market Signals
ONS House Price Statistics for Small Areas (HPSSAs) https://www.ons.gov.uk/peoplepopulationandcommunity/housing/bulletins/housepricestatisticsforsmallareas/previousReleases
H M Land Registry House Price Index (2020) http://landregistry.data.gov.uk/app/ukhpi/
Valuation Office Agency (VOA) Private Rental Market Statistics 2018 to 2019 https://www.gov.uk/government/statistics/private-rental-market-summary-statistics-april-2018-to-march-2019
Local Authority Housing Statistics dataset, England 2018-19: Section C – Allocations https://www.gov.uk/government/statistical-data-sets/local-authority-housing-statistics-data-returns-for-2018-to-2019
CACI Paycheck 2019 Licensed to GMCA from CACI
2011 Census http://www.nomisweb.co.uk/
Zoopla 2020 Manchester City Council
Regulator of Social Housing, Private Registered Provider Social Housing Stock in England: Statistical Data Return dataset 2018, Local Authority Housing Statistics dataset, England 2016-17: Section H - Rents and Rent Arrears and Valuation Office Agency Private Rental Market Statistics, 2018
https://www.gov.uk/government/statistics/statistical-data-return-2018-to-2019
MHCLG Live Table 122 https://www.gov.uk/government/statistical-data-sets/live-tables-on-net-supply-of-housing
MHCLG Live Table 125 https://www.gov.uk/government/statistical-data-sets/live-tables-on-net-supply-of-housing
MHCLG Live Table 615 https://www.gov.uk/government/statistical-data-sets/live-tables-on-dwelling-stock-including-vacants
Residential Land Values (per Hectare), 2019 MHCLG
Index of Private Housing Rental Prices ONS, Index of Private Housing Rental Prices (IPHRP)
Local Authority and Private Registered Provider housing stock in Greater Manchester by rent level, 2018/19
Local Authority Housing Statistics dataset (including imputed data), England 2018-19: Section A - Dwelling Stock; Regulator of Social Housing, Private Registered Provider Social Housing Stock in England: Statistical Data Return dataset 2018
MHCLG Live table 1008c, Total additional affordable dwellings by Local Authority District https://www.gov.uk/government/statistical-data-sets/live-tables-on-affordable-housing-supply
MHCLG Live Table 1011c: Affordable Housing Supply Statistics https://www.gov.uk/government/statistical-data-sets/live-tables-on-affordable-housing-supply
MHCLG Live Table 615 All vacant dwellings by local authority district, England, 2019 https://www.gov.uk/government/statistical-data-sets/live-tables-on-dwelling-stock-including-vacants
Chapter 6: Housing needs of particular groups
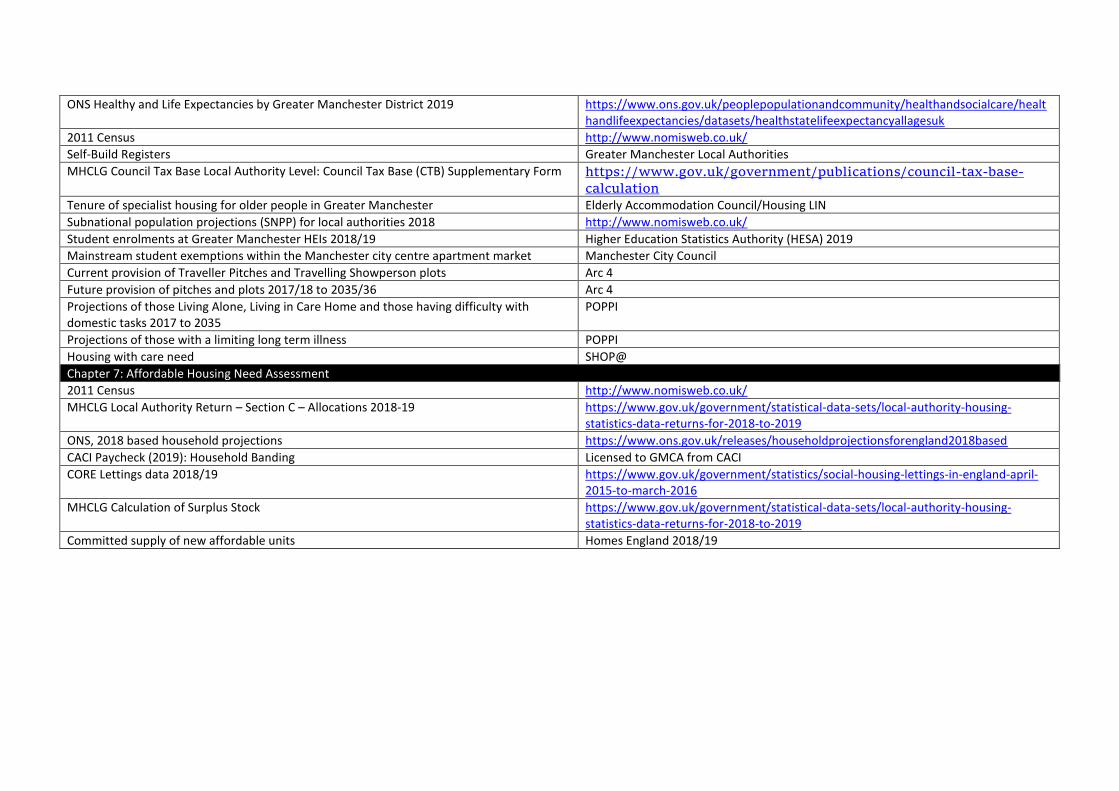
ONS Healthy and Life Expectancies by Greater Manchester District 2019 https://www.ons.gov.uk/peoplepopulationandcommunity/healthandsocialcare/healthandlifeexpectancies/datasets/healthstatelifeexpectancyallagesuk
2011 Census http://www.nomisweb.co.uk/
Self-Build Registers Greater Manchester Local Authorities
MHCLG Council Tax Base Local Authority Level: Council Tax Base (CTB) Supplementary Form https://www.gov.uk/government/publications/council-tax-base-
calculation
Tenure of specialist housing for older people in Greater Manchester Elderly Accommodation Council/Housing LIN
Subnational population projections (SNPP) for local authorities 2018 http://www.nomisweb.co.uk/
Student enrolments at Greater Manchester HEIs 2018/19 Higher Education Statistics Authority (HESA) 2019
Mainstream student exemptions within the Manchester city centre apartment market Manchester City Council
Current provision of Traveller Pitches and Travelling Showperson plots Arc 4
Future provision of pitches and plots 2017/18 to 2035/36 Arc 4
Projections of those Living Alone, Living in Care Home and those having difficulty with domestic tasks 2017 to 2035
POPPI
Projections of those with a limiting long term illness POPPI
Housing with care need SHOP@
Chapter 7: Affordable Housing Need Assessment
2011 Census http://www.nomisweb.co.uk/
MHCLG Local Authority Return – Section C – Allocations 2018-19 https://www.gov.uk/government/statistical-data-sets/local-authority-housing-statistics-data-returns-for-2018-to-2019
ONS, 2018 based household projections https://www.ons.gov.uk/releases/householdprojectionsforengland2018based
CACI Paycheck (2019): Household Banding Licensed to GMCA from CACI
CORE Lettings data 2018/19 https://www.gov.uk/government/statistics/social-housing-lettings-in-england-april-2015-to-march-2016
MHCLG Calculation of Surplus Stock https://www.gov.uk/government/statistical-data-sets/local-authority-housing-statistics-data-returns-for-2018-to-2019
Committed supply of new affordable units Homes England 2018/19
https://www.gov.uk/government/statistics/social-housing-lettings-in-england-april-2015-to-march-2016