
Greater Dublin Area Travel Demand Management Study
225
Initial Report Final Report Greater Dublin Area Travel Demand Management Study Dublin, October 2004 Submitted to: Submitted by: Booz Allen Hamilton Ltd ock 4 Centre Regus House, Bl Harcourt Harcourt Road Dublin 2 In association with:
Transcript of Greater Dublin Area Travel Demand Management Study

Initial Report
Final Report
Greater Dublin Area Travel Demand Management Study
Dublin, October 2004
Submitted to:
Submitted by:
Booz Allen Hamilton Ltd
ock 4 Centre
Regus House, BlHarcourt Harcourt Road Dublin 2 In association with:

Status of this Report The Greater Dublin Area Travel Demand Management Study Final Report was presented to the DTO Steering Committee in November 2004. The report was considered at a number of meetings and the following decisions were made: 1. Proposed Travel Demand Management Promotion Measures In May 2005, the DTO Steering Committee accepted the recommendations of the Travel Demand Management (TDM) Study Report in relation to the promotion of Travel Demand Management. In December 2005, the DTO executive proposed the establishment of a Regional TDM Promotion Unit to develop and oversee the development of the TDM study recommendations in this area. The DTO Steering Committee noted that the proposal for the Regional Unit raised issues regarding staffing (within the constraints of government numbers), and funding. For these reasons, it decided not to proceed with the establishment of a Regional TDM Promotion Unit at this time
In the interim, the Steering Committee suggested that the DTO Executive should look at ways to move the proposals forward. 2. Proposal on Managing Travel Demand through the Land Use
Planning System In September 2006, Section 6 of the TDM Study Report – “Managing Travel Demand Through the Planning System” - was agreed by the DTO Steering Committee, with some amendments. The agreed version is contained in the Final Study Report. 3. Proposed Travel Demand Management Fiscal Measures In May 2005, the DTO Steering Committee decided not to proceed with further work on charging for free workplace parking. In May 2005, the DTO Steering Committee also agreed in principle to procure additional investigative work in relation to a congestion charging scheme This work was to include a stated preference survey, to better determine the expected driver reaction to congestion charging. In November 2005, the Steering Committee decided to proceed with this work in 2007. In the meantime, the Steering Committee suggested that the DTO look into a variety of different technology options for road user charging– aiming to build on technologies that have been tested elsewhere. In this regard, the DTO Executive is continuing to keep technology options tested or in use elsewhere under regular review. Dublin Transportation Office - March 2006

GREATER DUBLIN AREA TRAVEL DEMAND MANAGEMENT STUDY The authors of this report are employed by Booz Allen Hamilton Ltd. The work reported herein was carried out under a Contract placed by the Dublin Transportation Office (DTO). This report was prepared solely for the information and use of DTO for the Travel Demand Management Study. No third parties shall have a right to rely on the report or be regarded as a third-party beneficiary of the agreement between the DTO and Booz Allen. The report was prepared by Booz Allen after due and careful enquiry, based on information provided by the DTO and other information on which Booz Allen relied and did not independently verify. The report states a number of assumptions made during our analysis. While we have no reasons to believe any of these assumptions are unreasonable, we note that if any prove incorrect, actual results could vary from those we have projected. Booz Allen expressly disclaims any warranties with respect to the information, findings and conclusions stated in the report.

GREATER DUBLIN AREA TRAVEL DEMAND MANAGEMENT STUDY EXECUTIVE SUMMARY
Executive Summary
Background
Booz Allen Hamilton, in association with ERM, HOP and Halcrow, was engaged by the Dublin Transportation Office (DTO) in November 2002 to undertake a Demand Management Study for the Greater Dublin Area (GDA). Travel Demand Management is part of the Dublin Transportation Office’s A Platform for Change – Transport Strategy 2000-2016 which describes Demand Management as the second, interdependent element of the Strategy:
“which seeks to reduce the growth in the demand for travel while maintaining economic progress, and which is designed to encourage a transfer of trips to sustainable modes”
The first element of the strategy is the supply of infrastructure projects and service improvements. What is Travel Demand Management?
Travel Demand Management (TDM) is the implementation of programmes of measures which seek to change travel demand patterns by: • Trip reduction – to reduce the need to travel and thereby reduce overall travel demand • Reduction in vehicle use – in particular, to reduce the amount of car travel • Increase in vehicle occupancy – to reduce the amount of single occupancy car trips and
increase car occupancy • Increased travel by alternative modes – this includes measures to encourage public
transport use, walking and cycling in preference to car • Trip retiming – to encourage travel at less congested times • Offering alternative destinations – to encourage travel to destinations that are closer,
and that lead to less overall congestion • Reduction in trip length – by planning for the provision of employment, retail and other
services closer to where people live. TDM programmes are thus primarily demand oriented rather than supply oriented i.e. they attempt to manage people’s travel rather than seeking to provide more physical capacity for travel (such as more roads, bus and train services etc). Study Objectives
The main objectives for this TDM study can be summarised as:
• To reduce the need to travel, particularly by private car; and
4TH OCTOBER 2004 i
GREATER DUBLIN AREA TRAVEL DEMAND MANAGEMENT STUDY EXECUTIVE SUMMARY
• To yield a greater modal share for public transport over and above that achievable
through the transport supply measures/infrastructure proposals described in ‘A Platform for Change 2000 – 2016’.
Study Process
The study process was set out in the DTO’s Terms of Reference as follows:
• Initial consultation;
• Research and development of potential measures based on international experience, previous experience in the GDA and current travel demand trends in the GDA;
• Initial assessment of potential measures;
• Consultation on feasible measures;
• Assessment of the transport impact of feasible measures and packages of measures; and
• Evaluation of preferred package(s) of measures. Why is Travel Demand Management required in the Greater Dublin
Area?
Demand for travel in the GDA has increased rapidly as a result of increased economic activity and prosperity, reflected in a growing population and workforce.
• The Irish GDP grew from €36,300 million in 1990 to €129,3000 million in 2002;
• The population of the GDA grew from 1,405,000 in 1996 to 1,535,000 in 2002; and
• The number of residents of the GDA in employment grew from 511,000 in 1996 to 680,000 in 2002.
Transport demands generated by a growing population and workforce are challenging to meet. The task is made more difficult as increasing numbers of people are housed in outer parts of the GDA where public transport supply is limited and where local services may only be accessible by car. Average speeds on roads into the city in the morning peak hour (8am-9am) in 2001 were 16kph (10mph)1. By 2008, without travel demand management, it is forecast that slow speeds will be more widespread and average speeds on the routes into the city will be 11kph (7 mph). Such congested road conditions are inefficient and detrimental to the economy of the GDA and the well being of its inhabitants. For sustained economic development, travel demand needs to be better managed, employing two tactics:
• Reducing demand by locating activities so that travel distances are shorter – or using information and communications technology (ICT) to substitute physical trips with virtual trips; and
1 DTO Transport Model
ii

GREATER DUBLIN AREA TRAVEL DEMAND MANAGEMENT STUDY EXECUTIVE SUMMARY
• Encouraging a shift from private car trips to more sustainable modes including public
transport, walking and cycling. There are two aspects to the second tactic. The first aspect takes the form of major public transport improvements such as the Luas and the upgrading of the DART and suburban rail network. In the longer term, very substantial public transport infrastructure is proposed in the Platform for Change. Along with initiatives to promote cycling and walking, these amount to a large incentive to change travel behaviour. Nevertheless, a second aspect, that of car restraint, will still be needed to persuade people not to continue to use their cars. This is evidenced by the forecast that, without demand management, average morning peak hour speeds on the radial routes into the city would fall to 9 kph (5.5 mph) in the year 2016, even with the proposed Platform for Change infrastructure completely in place. The Problems to be Tackled
The problems to be tackled by TDM can be summarised as follows:
• The population has become more dispersed resulting in less sustainable settlement patterns which are reflected in a high mode share for car use – over 80% of trips made outside the M50 between 8am and 9am are by car;
• The share of trips to school and work made by car is increasing;
• The absolute number of trips to work by car is increasing;
• In 2002, 50% of all those travelling to work (150,000 people) in the Dublin City Council area did so by car;
• In the future, average car speeds are forecast to decline throughout the GDA; and
• Speeds are currently slower in the central areas than elsewhere, and this trend will continue into the future.
The Preferred Package of Travel Demand Management Measures
To address the problems, a package of TDM measures is required that:
• Influences land use planning policy and practice leading to more sustainable, less car dependent, settlement patterns in the GDA
• Facilitates drivers who would like to reduce their car use, particularly for trips to work and to school; and
• Strongly discourages unnecessary car use in certain areas where alternatives are available.
The package of measures also needs to be capable of implementation throughout the GDA in the short to medium term (to 2008). To achieve this, a package of measures is being considered which is best described in three groupings: • Measures that can be implemented through the planning system – this includes
measures through from long term spatial planning to development control for individual developments to regional parking restraint measures;
iii

GREATER DUBLIN AREA TRAVEL DEMAND MANAGEMENT STUDY EXECUTIVE SUMMARY
• Measures to promote travel demand management - incentive measures including car
sharing, flexible working, individual marketing and all measures to encourage people to change their travel behaviour in favour of less driving. Typically, these measures would be packaged into a Travel Plan for an individual site or group of sites; and
• Fiscal measures – measures that introduce financial penalties to discourage car use. The Preferred Package
• Land use planning measures
• Measures to promote travel demand management
• Fiscal Measures:
o A City Centre Congestion Charge of €10 applicable between the hours of 7am and 10am to drive in the area within the canals
o A workplace parking levy in the rest of the Dublin Counties and the Development Centres in the Hinterland Counties. This would be set in line with the market price for parking in each local area which is within the following ranges €1,000 - €4,500 in the City Council area (outside congestion charging area), €600 - €3,6000 in the other Dublin Local Authorities and €350 - €900 in the Hinterland Growth Towns.
Managing Travel Demand Through the Planning System
The measures proposed for implementation through the planning system are diverse and wide ranging. They aim to achieve promote land use and transport integration at the strategic level and local level by:
• Consolidation as far as practicable of population growth in existing built up areas in the GDA region, where accessibility to work, leisure and other destinations by foot, cycle and public transport is generally better;
• Location of major trip-intensive land uses in areas well served by public transport or in areas that will be well served by public transport in future2;
• Relating the scale of urban centres to public transport accessibility3;
• Location of major trip-intensive land-uses as far as practicable in defined higher-order centres (e.g. city, town or district centre);
• Regional maximum parking standards, and the relation of maximum permitted parking provision to the scale and density of new developments to current and future4 public transport accessibility, and to the scale and proximity of the nearest centre;
• Providing a mix of local services within walking distance of their surrounding neighbourhood;
• Designing all new developments with walking, cycling and public transport in mind;
2 As set out in the DTO’s strategy A Platform for Change. 3 Accessibility measure based on existing and future population within a maximum public transport journey time, taking
account of walk, wait and transfer time, and access delays that may occur due to lack of provision of sufficient public transport capacity.
4 As set out in the DTO’s strategy A Platform for Change.
iv
GREATER DUBLIN AREA TRAVEL DEMAND MANAGEMENT STUDY EXECUTIVE SUMMARY
• Relating maximum permitted parking provision for new developments to existing and
future public transport accessibility, and proximity to the nearest centre. Some of the above recommendations were proposed for inclusion in the Regional Planning Guidelines for the Greater Dublin Area, during their preparation in 2004. Guidance at a regional level is required so that all local authorities act in a consistent manner, providing a “level playing field” in terms of TDM policy. In summary, new development should be oriented towards non car use and should underpin existing centres of activity. In addition, new development that is likely to attract a large number of people should be highly accessible by public transport, cycle and on foot. Measures to Promote Travel Demand Management
The application of incentives, marketing initiatives or other practical measures to promote travel demand management has been considered in terms of their potential to reduce car use for journeys to work and education. The measures focus on the workplace, schools, information and communications technology (ICT) applications and the possible role of marketing. Going forward, the larger employers, including local authorities and Government Departments, are considered to be key to a wider take up of workplace travel plans by implementing plans and advertising the positive results. It is therefore important that they put in place work place travel plans within the next few years. Guidance on implementing plans has already been prepared by the DTO5.
Potential components of workplace travel plans, or Mobility Management Plans, may include:
• Working with employees to address perceptions, fears and practical difficulties in overcoming car dependency;
• Establishing databases to assist ridesharing;
• Developing car pooling schemes;
• Providing shuttle services to nearby rail or bus services;
• Putting in place on-site measures to make cycling and walking safer and more attractive, e.g. footpaths, cycle lanes, crossings, secure cycle parking, shower facilities for cyclists;
• Providing incentives to use non-car modes;
• Introducing staggered or flexible working hours so that employees can avoid travel in the peak hour;
• Allowing compressed working weeks so that employees work a four day week, or nine day fortnight, but a longer day;
• Promotion of working at home, teleworking or working at another site to employers and assistance or technical support with implementation;
• Reducing the amount of car travel undertaken for work purposes by increasing the use of telecommunications;
5 “The Route to Sustainable Commuting”: An Employers Guide to Mobility Management Plans, DTO, 2001
v

GREATER DUBLIN AREA TRAVEL DEMAND MANAGEMENT STUDY EXECUTIVE SUMMARY
• Introducing travel allowances and reimbursements that encourage non-car travel as a
replacement for the current arrangements in some organisations which act as a financial incentive to unnecessary use of cars for commuting and business trips; and
• Restricting parking, e.g. giving priority for parking to ride sharers or individuals with certain needs - many successful travel plans are driven by a shortage of on-site parking.
In the longer term, employers’ recruitment policies can also be included in the workplace travel plan. For example, employers can target employment in local areas, particularly those served by public transport. Employees can also be recruited with the understanding that free parking is not provided. Additionally, a long term workplace travel plan can ensure that any future relocation of the workplace is to a site that is accessible by non-car modes. A workplace travel plan is, in effect, a site-specific (or multi-site in the case of some employers) demand management plan. Workplace travel plans can also cover more than one employer, for example, at the East Point Business Park, one plan serves all the employers located within the park School travel plans are designed to overcome the barriers for pupils to walk, cycle or take public transport to school. The basic aim of school travel plans is to arrest the rapid growth in travel to school by car. School travel plans may include some or all of the following measures:
• Working with teachers, pupils and families to address perceptions, fears and practical difficulties in overcoming reliance on the car and agreeing a school policy to actively promote sustainable school travel;
• A toolkit of practical measures including walking, cycling, training, encouraging bus use, car lift sharing, incentive schemes, curriculum based promotion and managing parking and drop off; and
• Putting in place infrastructure to support the school travel plan and make the route to school safer to walk or cycle and creating a pupil centred front of school environment.
Individual marketing provides transport advice and information to people, based on an understanding of their personal trip patterns. This involves one-to-one interviews. Travel information is then offered which has been individually tailored and which encourages modal shift away from the car. The individual marketing approach is effective because many people make journeys by car for which a reasonable alternative (public transport, walking or cycling) already exists, of which they are unaware. An individual marketing programme in the GDA may be worthwhile, particularly as public transport, pedestrian facilities and the cycle network have improved markedly in recent years and will continue to do so with the introduction of Luas, the DART upgrade, the Quality Bus Network and the expansion of the regional cycle network. It would be advisable to start with a pilot project in one area before embarking on a large-scale programme. Rather than changing the mode by which people travel, information and communications technology can be used to alter the ways in which people fulfil their aspirations for mobility and access to work, services and shopping. This is referred to as “virtual mobility”, a term that focuses on how activities can be undertaken without being dependent on physical mobility. The following possible measures are recommended to promote virtual mobility as
vi

GREATER DUBLIN AREA TRAVEL DEMAND MANAGEMENT STUDY EXECUTIVE SUMMARY
an alternative to physical mobility. They require working in partnership with other agencies and would not be promoted purely as travel demand management measures.
• Awareness campaigns both for organisations and for the wider public about the possibilities for reducing travel through virtual mobility;
• E-work pilots and programmes, promoting e-work amongst local organisations, including public sector organisations, with the development of flagship pilots and programmes;
• Telework centres - developing “telework centres” as have been developed in and around some US cities;
• E-commerce - promoting online shopping/home delivery amongst local firms and consumers;
• E-services – continuing to promote the use of online services – government and local authority services, online learning, telemedicine, etc and/or
• Development of “wired-up communities” - in collaboration with other stakeholders (public agencies, telecommunications companies, etc.) promoting “wired up communities” projects, to help overcome the digital divide, promote local work opportunities in less favoured areas away from the urban centre, and encourage use of online services.
Fiscal Measures
The two fiscal measures that are under consideration are a charge on free workplace parking and city centre congestion charging. Congestion Charging The preferred congestion charging area would be the area “within the canals”. The area has the advantages of a well defined boundary and the highest level of public transport provision in the GDA. Dublin City Council’s Outer Orbital Route would be outside the zone, providing diversion routes. The proposed Macken Street Bridge, which has been assumed to be in place by 2008, would also be outside the zone. All vehicles moving in the charging zone during the hours of operation would need to purchase a licence, which would allow unlimited trips during that period. The charge would not apply at weekends and on bank holidays. Stakeholder consultation indicated a strong preference for morning peak only operation (7am to 10am), so that shoppers and other visitors arriving late morning onwards would not have to pay the charge. The most appropriate technology to administer and enforce the congestion charge is currently considered to be that used in the London congestion charging scheme. Other feasible alternatives may emerge in future when the London scheme matures and planned schemes are introduced in Stockholm (2005) and Edinburgh (2006). The preferred system would work as follows:
• Drivers purchase a licence to drive in advance or on the day of travel by various media e.g. retail outlets, online, telephone, text message, etc;
vii

GREATER DUBLIN AREA TRAVEL DEMAND MANAGEMENT STUDY EXECUTIVE SUMMARY
• The driver’s registration number is then entered in a database of vehicles licensed to
drive in the charging area on that day;
• Cameras monitor and record the registration numbers of cars entering and driving within the charging zone during the charging hours; and
• The registration numbers are compared with the database and penalty notices are issued to registered owners of any vehicles without a valid licence.
Charges on Free Workplace Parking A charge on free workplace parking is considered to be a measure that would be effective across the entire GDA, addressing the rapid growth in demand even in non-central areas. The charge could be implemented either by a workplace parking levy or “benefit in kind” taxation policy. With a levy, the employer would pay in the first place and then choose whether or not to pass onto the employee. With a taxation policy, the parking space would be declared by the employer and/or employee as a benefit in kind and would be paid for by the employee. Of these two options, the workplace parking levy was preferred, however, benefit in kind taxation would also be a possible option, and much better than doing nothing. For these reasons, a charge on free workplace parking is included in the preferred package of measures, as follows:
• It would apply in the Metropolitan Area and Development Centres (Large Growth Towns and possibly other Growth Towns) in the Hinterland Area of the GDA;
• It would not apply in the same area as the Congestion Charge; and
• The cost of the levy would vary locally depending on the local market price for parking. By comparison with the congestion charge, a workplace parking levy (or taxation) would not be costly to introduce and administer. However, many practical difficulties have been recognised such as setting an acceptable yet effective level of charge, ensuring all the required spaces were registered, compiling an inventory of spaces, ensuring local on-street parking controls were in place to prevent transfer from car parks etc. As a result, there is less confidence that such a charge would be acceptable throughout the GDA, or even within designated centres in the GDA, or that it would be implemented in an effective manner. There is no comparable example of a regional workplace parking levy elsewhere that could be used as a model. Other Fiscal Measures Considered and Rejected Other fiscal measures considered and rejected during the study include an increase in fuel duty, tolls on the M50, regional road user charging and a road user charge for inbound traffic on radial roads crossing the M50. When assessed, these options were seen to be either less effective or likely to be less acceptable, at least in the short term than the preferred options of central area road user charging and workplace parking charges. Some also had less scope for implementation in the short to medium term. However, we consider all of these options should remain under consideration for the longer term when congestion is likely to be more widespread, or public transport is improved, or additional technological options become available.
viii

GREATER DUBLIN AREA TRAVEL DEMAND MANAGEMENT STUDY EXECUTIVE SUMMARY
Complementary Measures
Complementary measures may be required to make the TDM measures effective, for example:
• City Centre congestion charging would be more effective if traffic signals on the junctions on the Outer Orbital Route were adjusted;
• For the workplace parking levy to be effective, on-street parking controls would be required in all areas where the levy is applied; and
• For school travel plans or workplace travel plans to be effective, investment in, for example, footpaths on the approaches to the site may be required if footpaths are not already provided or are of a poor standard.
Other complementary measures may be required to make the TDM measures acceptable, for example:
• Traffic management measures in residential areas (or other sensitive areas) to deter through traffic diversion as a result of congestion charging;
• Parking measures in areas on the congestion charging zone boundary to deter “informal park and ride” or park and walk; and
• Rewards for employers in the hinterland Development Centres/Growth Towns e.g. financial support for a travel plan which would off-set the workplace parking levy and provide a more level playing field with employers outside the workplace levy area.
The above examples are all directly related to the proposed TDM measures, and would not take place otherwise. Equally, the TDM measures are less likely to be adopted without the complementary measures. Therefore a budget has been allowed for their provision, although individual measures have not been specified.
There are two further categories of complementary measures which it may be appropriate to finance from the TDM budget:
• Non-transport measures, for example, marketing initiatives to ensure the City Centre remains a vital and vibrant centre for shopping and cultural activities; and
• Additional buses. The TDM measures are themselves complementary to long term transport strategy, for example, A Platform for Change . The Benefits
The benefits of the preferred package would be primarily to reduce the number of car trips on the road network in the GDA. The resultant impacts were calculated using the DTO Transportation Model, for the morning peak hour (8am to 9am):
• Congestion would be reduced substantially – some 30,000 vehicle-hours (over 12% of total) would be removed from the road network in the morning peak hour alone;
• The amount of travel undertaken by car would be reduced substantially – total travel in the peak hour would be reduced by some 340,000 vehicle-kilometres (5% of total);
ix

GREATER DUBLIN AREA TRAVEL DEMAND MANAGEMENT STUDY EXECUTIVE SUMMARY
• Some 25,000 people would transfer from car to public transport in the peak hour,
representing a 19% increase in public transport patronage;
• Average morning peak hour bus speeds would increase by 15%; and
• Average morning peak hour car speeds would increase by 8%. These changes would result in other benefits:
• An estimated saving of 70 road traffic accidents per year, 15 of which would be fatal or serious; and
• An estimated 33,000 tonne reduction in CO2 emissions per year, as well as substantial reductions in local air pollution.
The monetary value of the benefits arising from the preferred package is substantial, and has been calculated to be over €400 million per annum.
The Estimated Costs
The estimates of costs associated with the Preferred Package for the first full year of implementation (2008) are set out below. Establishment costs over the first three years are expected to reach €154 million, this will include traffic management measures which will be spread out as they are implemented over time. It is expected that a number of one off launch costs, estimated at €8 million will also be incurred. The annual operating costs of the congestion charge far outweigh those associated with the other measures combined and are likely to account for over 95% of the annual operating costs of the Preferred Package. The cost estimate assumes that the economic-life for the congestion charging equipment is 12 years. Thereafter renewal is required. Given the total recurrent cost range of €67 – 127 million per annum, we assumed a mid range estimate of €97million per annum for the purpose of the appraisal. The annual operating cost (recurrent cost) of the scheme has been based on the scheme currently operating in London. It is possible that the costs of congestion charging will fall in future as more experience is gained in London and other cities such as Stockholm (congestion charging planned for 2005) and Edinburgh (congestion charging planned for 2006).
x

GREATER DUBLIN AREA TRAVEL DEMAND MANAGEMENT STUDY EXECUTIVE SUMMARY
Costs Associated with Preferred Package
Item € million Capital Costs Congestion Charge System set-up – over 3 years 50 Complementary traffic management measures – over 2 years 44 Education / awareness programme – one-off 5 Work Place Parking Levy Inventory & database development – one-off 1 Complementary traffic management measures – over 3 years 25 Education / awareness programme – one-off 1 TDM Support Measures Establishment costs – one-off 2 Complementary traffic management measures – over 3 years 25 Launch costs - one-off 1.5 Total Capital Costs (over 3 years) 154.5 Recurrent Costs Congestion Charge Scheme administration – recurrent 5 pa Scheme operations – recurrent 60-120 pa Work Place Parking Levy Scheme administration – recurrent 1.3 pa TDM Support Measures Scheme administration – recurrent 1.0 pa Total recurrent costs 67-127 pa
The Economic Case
The economic case examines the balance between the costs of introducing and operating the package, and the benefits to the community such as travel time savings, reduced road traffic accidents, reduced vehicle operating costs and environmental improvements. The costs and benefits associated with the preferred package over a 25-year period were calculated, indicating: • Present Value Costs: €1.62 billion • Present Value Economic Benefits: €4.59 billion • Benefit/Cost Ratio: 2.84. This represents a very strong economic case for the Preferred Package. Sensitivity analyses indicated that the economic case is also very robust – there would be a strong case even if the capital and operating costs were 50% higher than forecast, or if there was less reduction in traffic than forecast. In summary, the Preferred Package would deliver overwhelming net economic benefits to the community. If the Preferred Package was implemented without the workplace parking levy, (referred to as Reduced Package 1) the resultant reduction in economic benefits would be significant, but there would still be a strong economic case for the reduced package, even if the capital and operating costs were higher than forecast.
xi

GREATER DUBLIN AREA TRAVEL DEMAND MANAGEMENT STUDY EXECUTIVE SUMMARY
The economic case for a package with a €5 congestion charge and measures to promote TDM and without the parking levy (Reduced Package 2), indicated a reasonable economic case, unless outturn capital and operational costs were significantly greater than expected. The Financial Case
The financial case examines the balance between the revenue raised by the Preferred Package and the capital and operating costs. As indicated in the table below, the annual revenues are substantial.
Annual Revenues Associated with Preferred Package Item € million Revenues (annual) Congestion Charge fees paid by those crossings the canals 144 Congestion Charge fees paid by residents within the canals 94 Work Place Parking levies paid for spaces within the GDA 81 Total 319
These estimates assume a congestion charge of €10 (payable for travel in the congestion charging zone between 7am and 10am, Monday to Friday) and average annual workplace parking levies of €2,000 in Dublin City Council area, €1,000 in Fingal, Dun Laoghaire-Rathdown and South Dublin and €500 in the Development Centres/Growth Towns in the Hinterland counties. In practice, the levy may vary across each local authority area in line with the local market price for parking. Over a 25-year period, the Present Value of Revenues would total some €3.58 billion. Given a Present Value of Costs over the same period of €1.62 billion, this represents a 2.21 ratio of revenues to costs. A strong financial case for the Preferred Package is therefore indicated. Sensitivity analyses show that the financial case is robust, that it would be an attractive commercial proposition even if revenues were 30% lower then forecast and capital and operating costs were 30% higher than forecast. If, as is the case in London, various categories of drivers were to be exempted from paying the congestion charge or heavily discounted (e.g. residents of the zone, taxis, emergency services, disabled badge holders and several other candidates), this could reduce the revenue by some €1.21 billion over the 25-year evaluation period. However, the financial case would still be reasonably strong. The preference for morning only operation of the congestion charging scheme has significant financial implications. An all-day scheme, operating from 7am to 7pm (or 6:30pm as in London), would raise some €4.7 billion additional revenue over the 25-year evaluation period. It would therefore be stronger financially and give greater scope to offer discounts and exemptions and fund complementary measures. Conversely, if congestion charging was to operate in the morning only (7am – 10am), as proposed, the need to offer extensive exemptions and discounts is questionable as drivers would have the choice to drive without paying after 10am. As far as potential exemptions for residents of the charging zone are concerned, it is noteworthy that they form the group
xii

GREATER DUBLIN AREA TRAVEL DEMAND MANAGEMENT STUDY EXECUTIVE SUMMARY
that will benefit most from reduced traffic flows and the resulting environmental benefits, and from faster bus and tram services. If the Preferred Package were amended so that the congestion charge was set at €5 per day, and the workplace parking levy were not included (referred to as Reduced Package 2), significantly less revenue would be generated. The financial case would be substantially weakened and commercial success would only be achieved if the operating costs associated with the congestion charge were at the lower end of the expected range and/or the congestion charging scheme operated all day. Conclusions
A viable travel demand management package and programme, capable of implementation in the short to medium term, has been prepared for the Greater Dublin Area. It is the result of extensive research of best practice internationally and locally, consultation and the assessment of the performance of a wide range options in the GDA for the forecast year of 2008. The Preferred Package
• Land use planning measures
• Measures to promote travel demand management
• Fiscal Measures:
o A City Centre Congestion Charge of €10 between the hours of 7am and 10am to drive in the area within the canals
o A workplace parking levy in the rest of the Dublin City Council area, the other Dublin local authorities and the Development Centres/Growth Towns in the Hinterland Area set in line with the market price for parking in each local area
The introduction of this package of measures would have very substantial benefits for the GDA, even in the short to medium term, which would greatly outweigh the costs of introducing the scheme. These include a reduction in congestion, a reduction in overall car use, an increase in public transport patronage, increased speeds for buses and other vehicles, accident savings and reductions in emissions. The extent of the benefits means that the economic case for the Preferred Package of measures is overwhelmingly strong. There is also a robust financial case for the introduction of the measures i.e. the revenues raised would amply cover the capital and operating costs, and provide funds for complementary measures such as public transport improvements. If the workplace parking levy were not introduced, the resulting “reduced package” would also have a strong economic case, as it too would deliver substantial benefits to the GDA. Excluding the workplace parking levy would reduce the revenue generated, but there would still be a robust financial case for such a package.
xiii
GREATER DUBLIN AREA TRAVEL DEMAND MANAGEMENT STUDY
Table of Contents
Table of Contents ii
1 Introduction 1 Background 1 What is Travel Demand Management? 1 Why is Travel Demand Management Required in the Greater Dublin Area? 2 Study Objectives 3 Study Process 4 The Structure of this Report 5
2 Travel Demand in the Greater Dublin Area 6 Past and Current Trends 6 Forecast Future Trends (without Demand Management) 10 Summary of Problems to be Tackled by TDM 21
3 Overview of Potential TDM Measures 23 Introduction 23 Application of Travel Demand Management (TDM) 23 Area of Application 24 Overview of TDM Strategies 25 Application and Effectiveness Factors 26 TDM Measures Implemented in the GDA 29 Potential TDM Measures for GDA 33
4 Consultation and Market Research 37 Introduction 37 Outcome 38
5 Measures to be Developed 43 Introduction 43 Key Issues for Consideration 43 Complementary Measures 44

GREATER DUBLIN AREA TRAVEL DEMAND MANAGEMENT STUDY 6 Managing Travel Demand through the Planning System 45
Land Use Planning as the Foundation of Travel Demand Management 45 Travel Demand Management measures that can be implemented through the planning system 45 How these measures can contribute to Travel Demand Management in the GDA 47 Modelling the Potential Impact of Certain Land Use Measures 56 Actions and Leading Agencies 60
7 Measures to Promote Travel Demand Management 63 Introduction 63 Workplace Travel Plans 63 School Travel Plans 70 Individual Marketing 73 Information and Communications Technology Applications 75 Transport Impact of a Combination of Measures that Promote TDM 78
8 Fiscal Measures to Manage Travel Demand 80 Fiscal Measures Considered 80 Congestion Charging 83 Charges on Free Workplace Parking 107
9 Package of TDM Measures 123 Packaging of Measures 123 Fitting together the Package 126 Complementary Measures 127 The Overall Programme 130 Transport Impacts 131
10 Appraisal of a Package of Measures 137 Overview 137 Assumptions 137 Cost Assumptions 142 Revenue Assumptions 143 Economic Appraisal 144 Financial Appraisal 153 Discounts and Exemptions 157 Summary of Appraisal 159 Winners and Losers 160

GREATER DUBLIN AREA TRAVEL DEMAND MANAGEMENT STUDY 11 Conclusions and Next Steps 162
A Viable TDM Package and Programme for the GDA 162 Complementary Measures 164 Decisions regarding Fiscal Measures 164 Next Steps 165 Further Market Research and Consultation on Proposed Measures 166 Communications Strategy 166
Appendix A: Study Terms of Reference 168
Appendix B: Demand Management Steering Group 172
Appendix C: List of TDM References 173
Appendix D: Person Trips to work by Mode to work destinations in the GDA176
Appendix E: Transport Model Network and Service Assumptions 177
Appendix F: Long List of TDM Measures 178
Appendix G: International Practice with TDM Measures 182
Appendix H: Application and Effectiveness of TDM Measures 185
Appendix I: TDM Stakeholders Consulted 192
Appendix J: Register of Submissions 194
Appendix K: Planning Data and Future Scenarios 196
Appendix L: Other Behavioural Responses 197
Appendix M: Approach to Economic and Financial Appraisal 200
Appendix N: Further Details of Cost Assumptions 203

GREATER DUBLIN TRAVEL DEMAND MANAGEMENT STUDY
1 Introduction
Background 1.1. Booz Allen Hamilton, in association with ERM, HOP and Halcrow, was engaged by the Dublin Transportation Office (DTO) in November 2002 to undertake a Demand Management Study for the Greater Dublin Area. Travel Demand Management is part of the Dublin Transportation Office’s A Platform for Change – Transport Strategy 2000-2016 which describes Demand Management as the second, interdependent element of the Strategy:
“which seeks to reduce the growth in the demand for travel while maintaining economic progress, and which is designed to encourage a transfer of trips to sustainable modes”
1.2. The first element of the strategy is the supply of infrastructure projects and service improvements. 1.3. The Terms of Reference for the study are provided in Appendix A to this report. What is Travel Demand Management? 1.4. Travel Demand Management (TDM) is the implementation of programmes of measures designed to reduce journey times and congestion by:
• Increasing the number of persons in a vehicle; or • Influencing the time of travel; or • Influencing the need to travel; or • Influencing the destination of travel.
1.5. TDM programmes are thus primarily demand oriented rather than supply oriented i.e. they attempt to manage people’s travel rather than seeking to provide more physical capacity for travel (such as more roads, bus and train services etc). TDM programmes can, however, complement supply oriented programmes by, for example, providing priority in traffic for new public transport services. They can also ensure that the benefits of improvements in supply are not eroded by induced traffic. 1.6. There are seven different types of travel change which TDM measures can seek to achieve, as shown on the next page.
1

GREATER DUBLIN TRAVEL DEMAND MANAGEMENT STUDY Types of Travel Change sought by TDM Programmes Trip reduction – to reduce the need to travel and thereby reduce overall travel demand. Reduce vehicle use – in particular, to reduce the amount of car travel. Increase vehicle occupancy – to reduce the amount of single occupancy car trips, and increase car occupancy. Increase travel by alternative modes – this includes measures to encourage public transport use, walking and cycling in preference to car. Trip retiming – to encourage travel at less congested times. Alternative destinations – to encourage travel to destinations that are closer, and that lead to less overall congestion. Reduction in trip length – by planning for the provision of employment, retail and other services closer to where people live. 1.7. The objectives for this TDM study can be summarised as:
• To reduce the need to travel, particularly by private car; and
• To yield a greater modal share for public transport over and above that
achievable through the transport supply measures/infrastructure proposals described in ‘A Platform for Change 2000 – 2016’.
Why is Travel Demand Management Required in the Greater Dublin Area? 1.8. Demand for travel is increasing rapidly in the Dublin area, derived from increased economic activity. The growth is evident across all modes, although demand for bus and rail travel has grown more slowly than for private transport. Increased economic activity and prosperity has made the GDA more attractive resulting in an increase in population of 130,000 (or 9%) between 1996 and 2002 to a total of 1,535,0001. During the same period, the number of residents of the GDA in employment grew dramatically by some 169,000 to over 680,0002, an increase of 33%.
1.9. Transport demands generated by a growing population and workforce are challenging to meet. The task is made more difficult as increasing numbers of people are housed in outer parts of the GDA where public transport supply is limited and where local services may only be accessible by car.
1.10. Average speeds on routes into the city in the morning peak hour (8am-9am) are 16kph (10mph)3. By 2008, without travel demand management, it is forecast that
1 Census 2002, Principal Demographic Results, Table 4 2 Census 1996 and Census 2002, Travel to Work School and College, Tables 9A 3 DTO Transport Model
2

GREATER DUBLIN TRAVEL DEMAND MANAGEMENT STUDY slow speeds will be more widespread and average speeds on the routes into the city will be 11kph (7 mph). 1.11. Such congested road conditions are inefficient and detrimental to the economy of the GDA and the well being of its inhabitants. For sustained economic development, travel demand needs to be better managed, employing two tactics:
• Reducing demand by locating activities so that travel distances are shorter – or using information and communications technology (ICT) to substitute physical trips with virtual trips; and
• Encouraging a shift from private car trips to more sustainable modes including public transport, walking and cycling.
1.12. This second tactic requires a “Carrot and Stick” approach. The “carrot” takes the form of major public transport improvements such as the Luas and the upgrading of the DART and suburban rail network. In the longer term, very substantial public transport infrastructure is proposed in Platform for Change. Along with initiatives to promote cycling and walking, these amount to a large incentive to change travel behaviour. Yet, regardless of how attractive this “carrot” is, a corresponding “stick” of car restraint measures is also needed to persuade people not to continue to use their cars. Without demand management, average morning peak hour speeds on the radial routes into the city are forecast to fall to 9 kph (5.5 mph) in the year 2016, even with the proposed Platform for Change infrastructure completely in place. 1.13. Travel demand management can be tackled across a wide range of policy
areas, including:
• Planning policy and practice;
• Fiscal measures;
• Traffic and parking management measures;
• Mobility management plans; and
• Information and Communications Technology (ICT) applications such as teleworking
Study Objectives 1.14. The Demand Management Study Brief sets out the following main objectives for Demand Management:
3

GREATER DUBLIN TRAVEL DEMAND MANAGEMENT STUDY
• To reduce the growth in overall travel by motorised modes of travel in the Greater Dublin Area (GDA);
• To effect further modal transfer from private car to public transport modes over and above that achievable through the infrastructure and service enhancement measures described in A Platform for Change;
• To achieve a good level of service on the road network for essential road users; and
• To encourage more sustainable trip distributions and modal split throughout the Greater Dublin Area (Dublin, Meath, Kildare and Wicklow).
1.15. The Demand Management Study objectives, as set out above, relate primarily to reducing motorised mode travel, particularly at peak times, and in encouraging more sustainable trip distributions and modal share. Study Process 1.16. The study process was set out in the Terms of Reference included in Appendix A as follows:
• Initial consultation;
• Research and development of potential measures;
• International experience;
• GDA experience; and
• GDA trends;
• Initial assessment of potential measures;
• Consultation on feasible measures;
• Stakeholder liaison;
• Public consultation; and
• Market research;
• Assessment of the transport impact of feasible measures and packages of measures; and
• Evaluation of preferred package(s) of measures. 1.17. The DTO’s Demand Management Steering Group directed the study. Members of the Group are listed in Appendix B.
4

GREATER DUBLIN TRAVEL DEMAND MANAGEMENT STUDY 1.18. The initial consultation, the research and development of potential measures and the assessment of those measures were discussed in the Interim Report, May 2003, and are summarised in this report. The outcome of the consultation on feasible measures is described in the Consultation Report, June 2003, and is summarised in this report. 1.19. Appendix C contains a list of TDM references (i.e. bibliography). The Structure of this Report 1.20. Following this introductory section, Section 2 expands on the characteristics of the growing travel demand in the GDA. An overview of potential travel demand management measures (TDM) is set out in Section 3. Section 4 summarises the outcome of the consultation and market research work undertaken. Section 5 brings together the work of the early stages of the study and identifies the key issues going forward into the detailed assessment. Options for managing travel demand through the planning system are discussed in Section 6. Section 7 discusses the most appropriate measures that can be used to promote TDM in the GDA. Feasible fiscal measures to manage demand are described in Section 8. Section 9 describes a Preferred Package of measures for implementation in the short to medium term, and the impact of that package. The economic and financial appraisal of the package is explained in Section 10. Section 11 presents the conclusions and outlines the possible next steps. There are several appendices to this report, contained at the back of the main report and listed in the Table of Contents.
5

GREATER DUBLIN TRAVEL DEMAND MANAGEMENT STUDY
2 Travel Demand in the Greater Dublin Area
Past and Current Trends 2.1. Demand for transport is derived from other demands, such as the need to work, attend school, shop etc. Since the late 1990s, demand for transport has increased enormously as a result of greatly increased economic activity. This is shown by the large increase in GDP from €36,312m in 1990 to €129,344m by the year 2002 (current prices). As indicated in Figure 2.1, on average, individuals became more prosperous: GDP/capita increased by 90% between 1991 and 2002. Real personal disposable income increased by almost 70% between 1991 and 2001.
Figure 2.1 Indicators of Increased Relative Prosperity in Ireland
170
180
190
90
100
110
120
130
140
150
160
Inde
x (1
991
= 10
0)
200
1991
1992
1993
1994
1995
1996
1997
1998
1999
2000
2001
2002
2003
2004
YearsReal GNP / Capita Real GDP / CapitaCPI Real Personal Disposable Income
Source: Booz Allen, based on ESRI data Note: “Real” GNP, GDP and disposable income are adjusted for inflation , using the consumer price indices (CPI) published by the CSO.
2.2. Within the GDA, disposable income per person grew from €9,490 in 1994 to €18,620 in 2001 in the Dublin Region and from €7,941 in 1994 to €15,860 in the Mid-East Region.
2.3. Increased economic activity has made the area more attractive. The population of the GDA area grew by 138,000 (or 9%) between 1996 and 2002 to a total of 1,535,000. As Figure 2.2 shows, growth has not been evenly spread. The population of County Dublin has increased by 6%, compared with 21% in County Kildare, 22% in Meath and 12% in Wicklow.
6

GREATER DUBLIN TRAVEL DEMAND MANAGEMENT STUDY
re 2.2 Change in Population in the GDA Counties Figu
400,00
600,00
800,00
1,000,00
1,200,00
200,00
-
1996 Population 1,058,264 134,992 109,732 102,683 2002 Population 1,122,600 163,995 133,936 114,719
Dublin Kildar Meath Wicklow e
Source: CSO
2.4. Within County Dublin there has been growth in the Inner City, reflecting the City’s regeneration. This is a positive step for travel demand management because people living or working in the Inner City have generally good alternative travel choices as well as shorter distances to travel. Another trend, however, is the growth
the greenfield sites on the county’s fringes and the decline in population in the
Figure 2.3 Change in Population in the GDA, 1996 – 2002
inestablished suburbs closer to the city. The implication of these new settlement patterns is for longer distance, generally car dependent, commuter trips. The changing population patterns are shown in Figure 2.3.
Source: CSO
7

GREATER DUBLIN TRAVEL DEMAND MANAGEMENT STUDY 2.5. As a result of increased economic ac vity and increased population, travel demand management in the GDA has become a much larger task. More dispersed settlement patterns mean that travel demand management has also become a more difficult task for two reasons. Firstly, dispersed settlement in most cases lacks the “critical mass” needed for public transport services to operate. Secondly, new housing areas often lack local services, schools or employment opportunities within walking or cycling distance. 2.6. Nationally, the proportion of people travelling to work by car4 has increased to 62% in 2002 from 47% in 1991 and 42% in 1981. As the number of people in work
as increased greatly too, the result is around 50% more cars travelling to work now an in 1981, as shown in Figure 2.4.
Figure 2.4 Growth in Trips to Work Figure 2.5 Growth in Trips to Education
ti
hth 2.7. For school travel, the shift to car has been even greater. Nationally, 38% of trips to education are by car, compared with 16% in 1981. The effect of this is mitigated by the fact that the number of people in education has not changed significantly, unlike the number of people working. Figure 2.5 shows how travel to school has changed historically.
National Number of Trips to Work
-
500,000
1,000,000
1,500,000
2,000,000
car 498,646 533,292 995,550
non-car 631,698 604,165 615,331
1981 1991 2002
Source: Census 2002
National Number of Trips to Education
-
500,000
1,000,000
1,500,000
2,000,000
car 138,777 205,439 342,234
non car 749,087 740,489 548,520
1981 1991 2002
2.8. As Figure 2.6 shows, there has been high growth in new car registrations in the GDA, albeit at a slower rate than the country as a whole. Table 2.1 shows that, of the approximately 680,000 workers in the GDA, the majority (63%) travel to work by car, which is similar to the proportion for the country as a whole (62%). Within the GDA, some 336,000 persons travel to education of which some 107,000 (32%) travel by car, by comparison with 26% in the country as a whole.
“Non-car” includes walk, cycle, bus, coach, train, motorcycle and goods vehicles.4 Includes car passengers.
8

GREATER DUBLIN TRAVEL DEMAND MANAGEMENT STUDY
Figure 2.6 Growth in New Car Registrations
-
300,000
50,000
100,000
150,000
200,000
250,000
1994 1995 1996 1997 1998 1999 2000 2001 2002 2003
Year
New Vehicle Registrations - Republic of Ireland New Vehicle Registrations - Greater Dublin Area
Source: Derived from CSO data
Table 2.1 Travel to Work and Education in the GDA
By all modes By car (driver and passenger)
Residents travelling to work 679,752 426,710 Residents travelling to education 336,204 107,807 Source: Census 2002, Volume 9: Travel to Work, School and College
2.9. As Table 2.1 indicates, within the GDA, car trips to school and college represent less than 20% of all car trips to work, school and college, two in five of which are combined with a work trip5. Yet, school trips often seem to have a
isproportionate impact on the road network in some locations. This may be
ause parents take holidays or alter their working
e. To the City
dbecause they are more peaked than work trips. Also, unlike a work trip, a school car trip that is not combined with a work trip may lead to a return car trip to home in the peak period. It is also noted that when schools are closed for holidays, many work trips also change becarrangements. 2.10. Within the GDA, there is great variation in the level of car usagCouncil area, some 50% travel to work by car. To the rest of the region, the proportion ranges from 69% in Dun Laoghaire Rathdown to 77% in Meath and Kildare, which is well above the national average. Figure 2.7 shows these mode share trends. It also illustrates the absolute number of trips. Two issues are
5 DTO’s Schools Survey, Spring 2002
9

GREATER DUBLIN TRAVEL DEMAND MANAGEMENT STUDY
ct in the city. A more detailed breakdown of the way people travel to work in the GDA is provided in Appendix D.
apparent. Firstly, despite having a relatively high proportion of non-car use, TDM is required in the City Council area as well as in the counties. Secondly, because of the sheer volume of trips and the availability of other modes, TDM is likely to have the greatest impa
Figure 2.7 Trips to Work in the GDA by Mode
0
100,000
200,000
300,000
400,000
Car 151,753 42,171 53,585 37,462 19,391 32,472 18,069
Public Transport 83,968 7 7,853 651 1,552,236 7,471 1,510
Other* 68,522 9,198 12,769 9,317 5,074 8,114 6,136
CiFingal South Dun Laoire Meath Kildare WicklowDublin
ty Dublin Rathdown
Source: DTO, based on Census 2002. *Other includes walking and cycling
2.11. Census 2002 reports that 172,153 people travel into the City Centre (within the canals) to work. Of these, 69,750 travel by car (driver and passenger), representing a 41% car mode share. A further 63,130 travel by public transport, representing a 37% public transport mode share.
Forecast Future Trends (without Demand Management) 2.12. The DTO transportation model provided the base for analysis of future problems in the GDA road network. The analysis assumed that no new travel demand management measures were in place. It took into account all the proposed public transport improvement and road schemes that are assumed to be in place in the short to medium term (within five years), including Luas, the DART and
u grade, the Dublin Port Tunnel and the South East motorway service assumptions are summarised in
Appendix E.
suburban rail extension. These future network and
p
2.13. The forecast growth in car trips in the short to medium term across the GDA is shown in Figure 2.8. These forecasts were produced by the DTO Transportation Model, based on a DTO population distribution derived from local authority
10

GREATER DUBLIN TRAVEL DEMAND MANAGEMENT STUDY
forecasts, by area, constrained to Strategic Planning Guidelines6 totals. Car trips are predicted to grow more rapidly in the outer areas that are not served by rail, and in the areas where development is taking place. A decrease in car trips originating inside the M50 and in other areas with improving public transport is forecast, except in areas with significant development, e.g. the “North Fringe” (the development area to the North East, straddling the Fingal County Council and Dublin City Council borders), Docklands and Cherrywood.
6 The Strategic Planning Guidelines (1999) have been superseded by the Regional Planning Guidelines published on 8th July
2004. The planning data assumed for the purpose of this study for the year 2016 are broadly in line with the RPG forecasts for the year 2010.
11

GREATER DUBLIN TRAVEL DEMAND MANAGEMENT STUDY
Figure 2.8 Forecast Growth in Car Trips 2001-2008 Forecas M Trips t Growth in orning Peak Hour (8am-9am) Private Vehicle
2001-2008 Origins
Destinations
Source: DTO Model. Booz Allen analysis
2.14. then, will be in place. Consequently, public transport would be provided for most of the trips originating in the metropolitan r development centres, and a decrease in car t ating from a p I a re trips o de e x p h icant
Figure 2.9 shows the growth in car trips forecast in the longer term (2016). By it has been assumed that the infrastructure proposed in Platform for Change
area oreas is exrips origin those e
ccted. n particul r,
aa dec ase in car
riginating insi the M50 is exp ted, e ce t for reas wit signif
12

GREATER DUBLIN TRAVEL DEMAND MANAGEMENT STUDY development, e.g. North Fringe, Airport, Docklands and Cherrywood. By contrast, a substantial increase is forecast in car trips o ating e Hi nd, o e the development centres. Growth in car trip destinations is also predicted to be generally greatest outside the M50 and in areas not served by rail. By 2016, although the major improvements planned in Platform for Change will improve access to many a t be p h ls of t pro to all parts of the GDA. Therefore, TDM wil d to ple ed th the planning s areas with poor public transport access.
rigin in th nterla utsid
reas, it will no ossible to provide igh leve public ransport vision l nee be im ment rough
ystem to curb development in
13

GREATER DUBLIN TRAVEL DEMAND MANAGEMENT STUDY
Figure 2.9 Forecast Growth in Car Trips 2001 – 2016 Forecast Growth in Morning Peak Hour (8am-9am) Private Vehicle Trips
2001-2016 Origins
Destinations
Source: DTO Model
.15. Table 2.2 shows how transport demand is forecast to increase in both the short and longer term. In the short term (to the year 2008), both public transport trips and car trips are forecast to grow by about 15% across the whole GDA. In the longer term, public transport trips are forecast to grow by 78% overall, but private vehicle trip growth is forecast to “flatten off”. The combination of the extensive public transport network proposed in Platform for Change, and the highly congested
2
14

GREATER DUBLIN TRAVEL DEMAND MANAGEMENT STUDY conditions nagement) expla
2.2 also shows how the forecast growth in public transport use by 2016 will be most dramatic for residents of the area outside the M50, where the number of public transport trips is forecast to almost treble. By comparison, the growth in car trips by this group is only forecast to grow by 29%, and the car mode share will decline from 81% to 67%. Within the M50, by 2016 public transport is forecast to account for over half of all morning peak hour trips.
Table 2.2 Future Growth in Morning Peak Hour (8am-9am) Trip Origins
forecast on the road network by 2016 (without demand mains the high rates of public transport growth that are forecast.
2.16. Table
2001 2008 2016
Car Public
Transport Car Public
Transport Car Public
Transport City Centre Peak hour person trips 26,216 14,900 28,961 15,113 26,703 21,171 Mode share 64% 36% 66% 34% 56% 44% % Increase from 2001 10% 1% 2% 42% Between canals and M50 Peak hour trips 113,417 69,002 123,898 73,868 121,091 96,396 Mode share 62% 38% 63% 37% 56% 44% % Inc ase from 2001 9% 7% 7% 40%
re
Outside M50 Peak hour trips 138,563 31,513 167,053 45,074 178,498 87,714 Mode share 81% 19% 79% 21% 67% 33% % Inc2001
rease from 21% 43% 29% 178%
Total
282 278,196 115,415 319,912 134,053 326,292 205,Mode share 71% 29% 70% 30% 61% 39% % Incre2001 16% 17% 78%
ase from 15%
2.17. Vehicle-hours and vehicle-km are both predicted to grow far more rapidly than vehicle trips, in both the short and the longer term, as shown in Table 2.3. By 2016, vehicle-hours are forecast to double and vehicle-km to increase by 86%. This is with the full Platform for Change infrastructure in place. Increased vehicle kilometres indicate both more trips and longer trips due to origins and destinations becoming further apart and diversion onto longer routes to avoid congestion. Increased vehicle-hours indicate longer length of trips and slower, more congested journeys. The fact that vehicle hours are forecast to increase more rapidly than vehicle-km indicates that the average journey speed by car is going to be slower in future.
15

GREATER DUBLIN TRAVEL DEMAND MANAGEMENT STUDY
uture Growth in Travel Demand and Changes in Journey Speed7Table 2.3 F
2001 2008 2016
Vehicle hours
Vehicle km
Speed kph
Vehicle hours
Vehicle km
Speed kph
Vehicle hours
Vehicle km
Speed kph
City Centre 8am-9am 11,261 135,194 12.0 17,607 179,437 10.2 14,125 157,844 11.2% Increase from 2001 56% 33% -15% 25% 17% -7%
Between Canals and M50 8am-9am 38,183 758,129 19.9 64,281 1,151,621 17.9 83,313 1,590,362 19.1% Increase from 2001 68% 52% -10% 118% 110% -4%
Outside M50 8am-9am 96,999 3,435,598 35.4 166,203 5,222,109 31.4 215,710 6,472,338 30.0% Increase from 2001 71% 52% -11% 122% 88% -15%
Total 8am-9am 146,443 4,328,922 29.6 248,091 6,553,167 26.4 299,022 8,062,699 27.0% Increase from 69% 51% -11% 104% 86% -9%2001
2.18. Looking across the GDA, in the short term, vehicle-km are forecast to grow
most rapidly in around the South East Motorway Extension, the Docklands and the North Fringe area. Rapid growth in most of Meath and Kildare is also forecast. In the longer term, forecast growth in vehicle-km is most pronounced in the hinterland, and a few development areas within the M50. The spatial distribution of growth in vehicle-km is illustrated in Figure 2.10.
7 The data in this table are for the period 8am-9am only, not for the overspill beyond 9am when some trips are
still being completed. The data are for links only, data relating to centroid connectors has not been included. Vehicle-km are calculated by multiplying the flow on each link between 8am and 9am by the link distance, and summing to get a total for the area presented. Similarly, vehicle-hours are calculated by multiplying the flow on each link by the time taken on that link. Speeds are calculated by dividing the vehicle-km by the vehicle-hours.
16

GREATER DUBLIN TRAVEL DEMAND MANAGEMENT STUDY
Figure 2.10 Forecast Change in Vehicle-km across the GDA Change in Vehicle-km by comparison with base case for 2008 (i.e. no TDM)
Change from 2001 to 2008
Change from 2001 to 2016
2.19. Figure 2.11 shows how growth in vehicle-hours across the GDA follows similar patterns to the growth in vehicle-km, but at higher rates of growth.
17

GREATER DUBLIN TRAVEL DEMAND MANAGEMENT STUDY
Figure 2.11 Forecast Change in Vehicle-hours across the GDA Change in Vehicle-hours by comparison with base case for 2008 (i.e. no
TDM) Change from 2001 to 2008
Change from 2001 to 2016
2.20. Figure 2.12 shows morning peak hour speeds for the years 2001, 2008 and 2016, without travel demand management. It can be seen that, by 2008, average speeds of less than 15kph will be more common within the M50. Outside the M50, speeds will be greatly reduced, even in the rural Hinterland. The same trends will continue to 2016, when a large part of the area within the M50 will have average
18

GREATER DUBLIN TRAVEL DEMAND MANAGEMENT STUDY speed omorning peak hour speeds of less than 30kph.
s f less than 15kph, and where almost all of the GDA will have average
19

GREATER DUBLIN TRAVEL DEMAND MANAGEMENT STUDY
Figure 2.12 Average Morning Peak Hour Speeds Forecast Morning Peak Hour (8am-9am) Private Vehicle Speeds (kph)
2001
2008
2016
20

GREATER DUBLIN TRAVEL DEMAND MANAGEMENT STUDY
8 and to ecline thereafter. Traffic leaving the city in the AM peak is predicted to increase
redicted to increase by 2008 then decrease back to 2001 levels in 2016 in e northbound direction but, by 2016, it declines in the southbound direction.
Table 2.5 Increase in Morning Peak Hour Traffic Flows in the City Centre
2.21. As Table 2.5 shows, traffic leaving the City Centre in the morning peak hour is forecast to increase, particularly in the northbound direction. Traffic entering the city from the south is forecast to decline slightly by 2008 and by 12% in 2016. Traffic entering the city from the north is forecast to continue to increase until 200dsignificantly by 2008, probably in response to greater numbers of residents living in the city and more jobs outside, but by 2016, driving out of the city appears to become less attractive with public transport alternatives coming on-stream. Traffic crossing the Liffey is pth
2001 2008% increase from 2001 2016
% increase from 2001
Canal cordon south inbound 14,451 13,915 -4% 12,759 -12%outbound 8,974
Increase in AM Peak Hour (8am-9am) Traffic Flows
11,151 24% 11,216 25%Canal cordon north inbound 10,082 11,598 15% 9,894 -2%
feoutbound 5,802 9,431 63% 8,515 47%
Lif y Bridges northbound 7,253 8,155 12% 7,222 0%southbound 9,699 9,836 1% 8,647 -11%
Sum a 2.22. Bafollows:
•
• trips to school and work is increasing;
•
•
m ry of Problems to be Tackled by TDM
sed on the above analysis, the problems to be tackled can be summarised as
The population has become more dispersed resulting in less sustainable settlement patterns which are reflected in a high mode share for car use – over 80% of trips made outside the M50 between 8am and 9am are by car8;
Car use for
• The absolute number of trips to work by car is increasing;
Some 50% of all those travelling to work in the Dublin City Council area do so by car. While this is a relatively low car mode share compared with that of people travelling to work elsewhere in the GDA, it accounts for over 150,000 workers entering the City by car every morning9;
In the future, speeds will become slower throughout the GDA. By 2016, if no demand management is undertaken, the morning peak hour speed will have fallen to below 15kph through much of the GDA10; and
8 Source: DTO model for 2001 9 Source: DTO, from Census 2002 10 Source: DTO Model for 2016, Booz Allen analysis
21

GREATER DUBLIN TRAVEL DEMAND MANAGEMENT STUDY
• Speeds are slower in the central areas than elsewhere, and this trend will
s planning policy and practice leading to more
cili ivers who would ce their car use, particularly for trips chool; and
• strongly discouraging unnec alter
2.24. It is an DM policieareas) will be the most effective because:
• Thes p
• City ntinue to ar mod re in the GD
2.25. TDM policies to curb growth in trips by car to destinations outside the M50 are also neede ver, given that pu e to many of these destinations, even by eveloping acceptable TDM solutions for t c The emphasis would be on tackling future g t in car dependent are ing TDM in extent to which the existing problem will
Potenti r applica the following section of this report.
continue into the future 2.23. It is these problems that a set of mutually reinforcing travel demand management measures will need to address in the GDA in the future, by:
• influencing land u e sustainable and less car dependent settlement patterns in the GDA
• fa tating dr like to redu to work and to s
essary car use in certain areas wherenatives are available
ticipated that T s that tackle work trips to the city (from all
e account for the greatest roportion of trips in the peak hour; and
destinations co have a greater level of access by non-ces than elsewhe A
d. Howe blic transport options will not be availablthe year 2016, d
hose that have already lo ated in these areas will be challenging. rowth in unsustainable developmen
as by reflect the planning system. This would limit the continue into the future.
2.26. al measures, thei tion and effectiveness are discussed in
22
GREATER DUBLIN TRAVEL DEMAND MANAGEMENT STUDY
DM Measures
.1. During the early stages of the study, extensive work was undertaken to ational practice with TDM. This examined the TDM measures that are ve been considered and investigated how effective they have been and
how yTDM working this section of this report. App a 3.2. TDM can be applied to work, school, shopping, leisure, tourist and other trips. etrip. Thi
• n on the road
•
• ammes to promote travel demand management
3.3. Dsuccess. Tstudents)trip has ing focus as its effect on peak period congestion has increased with ever-larger proportions of school trips being made by private car and
cycle.
3.4. oshoppinggeograph 3.5. Insystem. planning to individual site-specific development design, will ultimately do most to ensure that unne sensure thother, or
3 Overview of Potential T
Introduction 3review internin place, or ha
the might be applied in the GDA context. A review of experience to date with in the GDA was also undertaken. The Interim Report (May 2003) and the
papers (February 2003) describe the work in detail which is summarised in
lic tion of Travel Demand Management (TDM)
Th most common trip market for TDM measures has generally been the work s has been because:
The work trip generally causes the greatest level of congestiosystem;
It is the trip for which there are the greatest number of alternatives available (e.g. higher level of public transport service available at this time); and
The workplace has been found to be the most effective unit for organising progr
T M measures have also been applied to other trip markets with some hese markets have mainly been trips to tertiary education facilities (mainly
, trips to large hospitals (staff and visitors), and trips to school. The school become an increas
less by walk or
S me TDM measures also affect other trip markets besides commuting (e.g. , business travel) as they are implemented to cover a relatively wide ical area and a wide time frame (for example, road pricing).
its most fundamental application, TDM is pursued through the planning Integrated transport and land use planning, from strategic spatial
ces ary car travel is minimised. Integrated transport and land use planning can at different activities are located within walking or cycling distance of each
that they are served by public transport. The challenge for assessing the
23

GREATER DUBLIN TRAVEL DEMAND MANAGEMENT STUDY impact ois requirein a rapidly developing urban area like the GDA, the overall amount of new developm by comparison to that which already exists. 3.6. lfor succmanagemurban are Area of 3.7. The focus on the work trip has t the main institutional focus for TDM acapabilityin three d
•
• . This generally involves participation by a number of
to reduce traffic congestion in the commuter influence area. In
•
ertain measures need to be applied on a regional basis to have any effect. For example, if land use measures are not applied regionally, development can simply move to another part of the region to avoid the planning constraint.
f land use planning on travel demand management is that a long time frame d to properly demonstrate the benefits – say 40 years. This is because, even
ent each year is small
A though appropriate land use policy and practice is a necessary condition essful travel demand management in the long term, travel demand ent measures are needed to curb car use, even in the most well planned of as.
Application
meant tha h s been the employer - a well-defined organisational structure with the
of reaching the intended travel market. However, TDM has been applied ifferent geographic dimensions:
Individual site. This can be an individual employer (seeking to implement TDM measures for its employees) or an individual trip end (e.g. a business park, university, hospital, or school).
Sub-area or corridororganisations, and brings together organisations that have a common interest in good transport provision (e.g. developers, chambers of commerce, public transport agencies, employers etc). One result of this has been the formation of ‘associations’ that are generally formed by developers or employers with the primary focus on implementing a TDM programmeaddition, some TDM measures are applied on an area basis rather than at an individual site (road pricing falls into this category, as do land use measures).
Regional level. This has involved the use of TDM as one element of an overall congestion reduction strategy, or as a mechanism for implementing legislation focused on such things as growth management or air quality. For example, the South Coast Air Quality Management District in California established specific trip reduction targets for all employers with 100 or more employees. C
24

GREATER DUBLIN TRAVEL DEMAND MANAGEMENT STUDY
3.8. Ta to those measures which seek to manage t th sou in some way (with a r ffec
Table 3
Overview of TDM Strategies
ble 3.1 sets out an overview of possible TDM strategies separated in travel demand by attempting to alter conditions a
e demandesultant e
rce, and those which alter the supply of transport on demand)11. t
.1 Overview of Travel Demand Management Strategies Orientation Strategy Description
Financial Measures Financial incentives to use alternative travel modes. T
alternative modes. This could include ‘benefit-in-kind’ tax axation Measures Adjustments to the taxation system, which favour travel by
on employer provided parking. RC
oad Pricing or Congestion harging
Imposing a charge on road users travelling at a certain time, or in a certain area (or both) to manage travel demand.
Alternative Hours Measures which involve employees working non-standard work hours.
Rtogether by private vehicle transport on a regular basis.
idesharing Measures which promote two or more people travelling
InT
formation Communications echnology (ICT)
Enable substitution of travel by telecommunications based arrangements, e.g. teleworking.
A rnative Modes Measures to promote walking and cycling (car sharing ltealso included here).
P rking Restraint Parking pricing and supply measures which make car use
amore expensive and less convenient, thereby increasingthe attractiveness of non-car modes.
Travel Plans A package of TDM measures tailored to a particular site. L e Planning measures aimed at fostering land use location and Us
and design, which is favourable to public transport, walking and cycling.
In(I s to provide information for travellers
telligent Transport Systems S)
The coupling of information technology and communicationTenabling them to make informed travel choices.
Aframework for implementation of particular TDM measures
dministrative Administrative and regulatory measures which provide a
Demand
Eport modes
ducation/ Marketing Education and marketing programmes which aim to encourage people to use alternative trans
Traffic Management Road infrastructure measures aimed at giving public transport and high occupancy vehicles priority, and slowing down or redirecting traffic.
P es to encourage arking Restraint Controlling the supply of parking spacnon-car travel modes.
Public Transport Improving the quality of public transport services, and increasing service levels.
Supply
In(I
telligent Transport Systems TS)
Using information technology to improve public transport information systems
Note: several TDM strate strategies (e.g. Parking Restraint and TS')
gies are both 'demand' and 'supply''I
11 The ‘link’ between the potential success of a TDM programme and public transport supply is recognised.
25

GREATER DUBLIN TRAVEL DEMAND MANAGEMENT STUDY Application and Effectiveness Factors .9. A review of international experience with TDM identified the main situations
diffee the e
tailo ple, a shortage in parking,
the nrequir
• The pdetermining whether or not many TDM measures are likely to be applicable.
ere a good quality high frequency public transport service is available. This ensures that people have a travel
.
e types of organisations than others. For example, ridesharing is more suited to organisations or groups of organisations with a substantial number of staff working largely fixed and regular hours
Effectiveness
• Generally, TDM measures which do not involve either an incentive to start a new travel behaviour or a disincentive to an existing behaviour, achieve only limited results. For example, simply setting up a ridesharing scheme without providing any incentives to rideshare (e.g. high occupancy vehicle (HOV) parking, carpool allowance) or disincentives to drive alone (e.g. charged parking) will only have a minimal effect on modal share.
• TDM measures are most effective when implemented as a package rather than as individual measures. This enables both incentives and disincentives to be provided, which increases both the acceptability of the TDM
3in which rent TDM measures are best applied, and the key factors which
ectiveness of TDM measures. determin ff
pplicationA
• Ceremp
n TDM measures are regularly applied at the worksite level when yers are faced with local issues, for exameed to provide travel options for employees, or as a planning ement.
resence of significant road congestion is also an important factor in
• Most TDM measures are best applied wh
option available apart from the private car (this does not apply to measures which are a substitute for public transport, e.g. ridesharing)
• Measures which aim to significantly increase the cost of car use such as parking restraint and road pricing are generally only applicable in medium to large urban areas. These generally have a spread of business activities and sufficient amenity, character and ambience to which make them attractive to businesses, even if costs increase. They also generally provide greater opportunity for making a trip on public transport, by bicycle or on foot.
• Certain measures are more applicable to som
26

GREATER DUBLIN TRAVEL DEMAND MANAGEMENT STUDY
measures and their effectiveness. It also recognises that certain TDM mea so that the combined effect effect of
measures.
• to inc e igate the fects of other measu lp compensate for particular
which may arise. F ex ficulty with le if needing to work later than
vanp aranteed Ride u l give employees confidence that
they will not be caught out when will increase ridesharing sch
• are most effectiv on iv m ort
services, so that travel options are tial mode switchers.
• ome measur will be very dependent on local factors organisations involved. For example, public parking
straint is most effective in reducing traffic levels in areas with a relatively through-traffic and a high proportion of parking spaces
in local authority control.
rget organisations. This has been found to be particularly the case with teleworking in which the beliefs of
as to what constitutes effective work practices, and their
review of international practice with TDM measures is shown in Appendix F. Appendix G provides a brief overview of international practice with TDM measures. Appendix H expands upon the issues of application and effectiveness. A summary
sures tend to reinforce the benefits of other measures, of a package of measures is greater than the total
individual
TDM packages also need lud measures which help mitadverse ef res, or hedifficulties, or ample, a potential difridesharing schemes is being abthe scheduled carpool or
over this event
to get homeool time. Providing a Gu
Home scheme to c ality wil working late and
participation in the eme.
Many TDM measures e when implemented in conjunctiodes, particularly public transpwith improvements to alternat e
available for poten
The effectiveness of s es and the actions ofrelow proportion of
• Compliance is an important effectiveness factor for some measures, for example, parking restraint, workplace parking levies, road user charging (congestion charging), high occupancy vehicle (HOV) lanes, and public transport priority (e.g. bus lanes). Poor compliance, perhaps due to inadequate enforcement, will render theses types of TDM schemes ineffective.
• The take-up of certain TDM measures is also significantly affected by the perceptions and 'paradigms' of the ta
managementperceptions towards teleworking (and unsupervised work in non-office locations) are often the most important factor in determining whether or not teleworking is taken up in a particular organisation. Education programmes specially prepared for target organisations will be important for measures of this type.
3.10. The “Long List” of TDM measures available which was determined from a
27

GREATER DUBLIN TRAVEL DEMAND MANAGEMENT STUDY
work of this study are summarised in Table 3.2. of the measures implemented elsewhere which have been most effective and which have most influenced the
Table 3.2 Leading TDM Examples from International Experience
Measure Leading Examples from International Experience
Fiscal
cluding
London congestion charging was introduced in 2003 and is widely considereduced traffic significantly and is generating revenue to be re-invested in In
Financial
e
red to be a success. It has public transport improvements.
In the Norwegian cities of Bergen, Oslo & Trondheim toll rings around the urban core were introduced in the early 1990s to raise finance. They achieved that goal. Now the authorities are considering their retention as TDM measures.
s 8.
nic road user charging for heavy goods vehicles has been introduced in Switzerland and Austria. An us scheme to introduced satellite positioning system based HGV scheme in Germany ran into
difficulties and was abandoned in February 2004. Development is now underway again and the signs are that all requirements will be met.
ydney and Perth have a workplace parking levy. The city of Nottingham, UK, is proposing a workplace
Incentives Taxation Measur s Road Pricing
Singapore was the first country to implement an area licensing scheme to alleviate congestion. The first scheme in 1975 required a fee to enter the restricted zone in the morning peak. An evening restriction wasubsequently introduced in 1989 and extended across the day in 1994. Full electronic pricing started in 199 Electroambitio
Sparking levy. Ireland has introduced a tax free commuter ticket scheme.
Education/ Marketing
Major “Individual Marketing” programmes have been successfully implemented in the UK, Australia, Germany and Austria. Travel awareness campaigns are undertaken by local authorities in many countries.Throughout Europe, many towns and cities participate in the annual “Car Free Day”.
formation aIn
Cnd
ommunication
The Eurobarometer reported that, in 2002, 2.4% of the Irish workforce was teleworking regularly. This compared with a European average of 5%. In Denmark, the same survey found that 17% of the workforce
workers. The US Federal government has promoted teleworking for many years. Currently f workers telework regularly in the GDA.
U uced their travel to work mileage by an average 2182 miles over the year that was
monitored. Car commuters in this group reduced their mileage by 2559 miles.
Technologies (ICT)
was regular telearound 4% o Teleworkers under the BT Workabout scheme (UK), working on average 2-3 days per week from home, saved an average 93 miles per week in car commuting, or 143 miles per week in rail commuting. A telework pilot at the Dutch Ministry of Transport found that teleworking resulted in a 17% decrease in the total number of trips by teleworkers, with peak-hour travel by car reduced by 26%. Local Authority workers in the Yorkshire & Humberside area (UK) who undertook telework as part of the ETARGET project red
Site sp cific Travel Plans Including Workplace and School Travel plans
Workplace travel plans, which incorporate a range of site-specific TDM measures, have been adopted by public and private sector employers in many countries. They have been operating for the longest in the Uand the Netherlands. In the Netherlands, it is reported that basic plans (e.g. car sharing schemes) achiev6-8% reduction in vehicle-km to a site and extensive plans (including measures such as work buses and parking restraint) achieve a 15-20% reduction in vehicle-km. In the US, an average car trip reduction of 15%to sites where a plan is implemented was reported. School travel plans, or “Safe Routes to Schools”, also incorporate a range of site-specific TDM measures.They were first introduced in the UK in 1995 where it is reported that 4% of primary schools and 5.5% of secondary schools had a plan by 2001. An average car trip reduction of 20% associated with each plan isreported. Safe Routes to Schools are currently being piloted in the GDA.
eS e
28

GREATER DUBLIN TRAVEL DEMAND MANAGEMENT STUDY
Measure Leading Examples from International Experience
Land Use Including Parking Restraint at New Developments
UK Government has established planning guidelines to foster land use development that supports public transport, walking and cycling, i.e. high density, mixed use, located on public transport corridors. Construction of the Docklands Light Rail and, later, the Jubilee Line Extension were integrated into the development of the London Docklands. Hong Kong is a leading example of transport led development where large scale commercial and residential developments were incorporated into the design of each station on the mass transit system.
Integration and PriorityMeasur s
The introduction of priority signalling in Bern, Switzerland, has resulted in a 75% saving in delays for tramsand 50% saving to buses. An initiative in the Danish town of Aarhus encouraging the use of cycling resul
e
In the Netherlands, with the introduction of bus lanes, gates and signal priority on all major routes in some cities, daily ridership is 20% higher than the national average.
ted in an increase of 44% of trips by bike with a reduction in the use of a car of 45%.
TDM Measures Implemented in the GDA 3.11. Several TDM measures have been introduced and accepted in the GDA. Various pilot schemes have also been trialled with varying results. 3.12. The measures have all been implemented to deal with specific transport
etimes in a very specific location. Measures tend not to have been
management measures implemented have involved affic management and parking, as shown in Table 3.3, which sets out the various
h have been implemented in the GDA.
issues, somimplemented as part of an overall demand management strategy, which would include other measures to increase the effectiveness of the measure implemented. 3.13. The majority of demandtrmeasures whic
29

GREATER DUBLIN TRAVEL DEMAND MANAGEMENT STUDY
ffic
• QBC’s
• Maximum Off Street parking standards
Pay as you Drive Car Sharing
Teleworking • 4% of workforce in the Dublin region, 4.5%
of the workforce in the Mid East region.12
Table 3.3 – TDM measures piloted/implemented in GDA
Tra Management • Environmental Traffic Cells • Traffic Relief/Management Schemes • Car Free Day • Bus Gates
Park and Ride • DART and Suburban rail stations. Car Sharing •
• Pedestrianisation (complemented by high density commercial and residential development and no/low car development).
• Safe Routes to Schools
Ride Sharing • www.dublintraffic.ie Financial • Taxsaver Commuter Tickets
Parking • Pay and Display Parking • Residents parking schemes.
(Administered under the planning process) Mobility Management • Mobility Management Plans • Oracle Commuter Centre Cycling • Strategic Cycle Network
Integration Measures • Real time passenger information pilot • GUADI Smartcard project
3.14. In addition, changes in land use development are occurring that complement and facilitate TDM. In Dublin, there is an increase in higher density mixed use
evelopment in the centre of the Ciddeveloping outer areas. Resi
ty, in some of the local town centres and in dents will often have little or no use for the car and may
not require parking. Visitors can travel to these areas by public transport, or park on the edge, and then move about by foot. This trend for city living and mixed developments is reflected in numerous other cities throughout the world and has been largely driven by urban renewal initiatives.
Traffic Management 3.15. The Quality Bus Corridors (QBCs) are arguably the most well known measure thus far implemented. These involve the reallocation of sections of road space to buses along designated routes and improvements to the network to reduce bus journey times and improve timetable reliability. While aimed at increasing the capacity of a road corridor in terms of people moved, they have had the secondary impact of restricting road capacity for cars in many places. 3.16. Seven environmental traffic cells have been implemented in the City Centre with others being finalised. The purpose of the cells is to remove ‘through traffic’
12 CSO, Quarterly National Household Survey, Q3, 2002
30

GREATER DUBLIN TRAVEL DEMAND MANAGEMENT STUDY and cr e cell, pedestrian
nu de vo s to identified routes used by
ng an ities. 3.1 raffic s and pe been implemented with positive results.
Parking emes inv
Re its hCity Council area. The majority are aimed at removing all day
ba e 1,900 d
the etai nd along existing QBC routes. This can cause difficulties for residents and local businesses, leading to demand for parking
Moloyer Travel Plans”) are
b
f staff.
vario s Clontarf
by the business park ma ere are 5,000 employees at the
t wo k has set up f to use public transport and alternative
The oarking spaces
eate a safer and more sustainable environment for the residents of ths and cyclists.
3.17. There are at present a
veloped. These schemes inmber of “Safe Routes to Schools” schemes beinglve improvement
students through traffic calmi
8. A number of other tdestrianisation, have
d the provision of cycling and crossing facil
management measures such as bus gate
3.19. A number of schsidents Only parking perm
olving ‘Pay and Display’ parking restriction and ave also been implemented, largely in the Dublin of these schemes
commuter parking.
Park and Ride 3.20. Some 4,748 car parking spaces are provauthorities at DART and subur
ided by Iarnród Éireann and local n rail stations in the GDA. In addition, som
park and ride spaces are locate car parks of out of town r
at Luas stops. Informal ‘Park and Ride’ occurs in l centres a
controls.
bility Management Mobility Management Plans (“Workplace” or “Emp3.21.
used y private companies and business parks to encourage staff to use public transport and alternative modes to the car. The main reasons for their implementation by the employer are the lack of parking at the employer’s site and retention/attraction o 3.22. There are shuttle bus from
u examples of mobility management initiatives such as the DART station to Eastpoint Business Park, which is funded nagement company. Th
Business Park and it is estimated that 3,000remainder drive carsa commuter centre on site to encourage staf
use public transport or cycle/walk, therk. More recently, the Eastpoint Business Paro
modes to the car.number of p
m tivation for setting up the commuter centre is the limited at Eastpoint and attraction/retention of staff.
31

GRE
ATER DUBLIN TRAVEL DEMAND MANAGEMENT STUDY
32
ategic cycle neArea. The aim is to encourage the use of cy vel, particularly for
is network has already been implemented. Experience h
Ride Sharing 3.25. A website was set up in the year 2000 which aimed to encourage and facilitate commuters who wished to ride share to work. The website allows commuters to post their travel details and contact information. The information is displayed geographically to help commuters identify possible car poolers in their area or along their route.
Financial 3.26. The Taxsaver Commuter Tickets scheme was introduced in the year 2002 in Ireland. It offers employers and employees tax deductions on the cost of monthly or yearly public transport tickets.
Teleworking 3.27. The CSO Quarterly National Household Survey (Q3, 2002) reported that in the Dublin Region some 4% of the workforce works at home (with or without a computer) on a regular basis. In the Mid East, 4.5% of the workforce work from home on a regular basis.
Integration Measures 3.28. Measures to improve public transport integration within the GDA have been underway for several years. These address travel information, ticketing and fares. 3.29. With respect to integrated travel information, plans for a GDA-wide, multi-modal passenger travel information system, including real time passenger information (RTPI), but also including improved paper information, internet journey planners and telephone inquiry systems, were formulated by a DTO working group of stakeholders. This is under consideration by the Department of Transport. As yet there are no firm plans for implementation. It is noted that Dublin Bus has been
Cycling 3.23. A str twork is currently being developed for the Greater Dublin
cling as a mode of tracommuters. Some 300 km of thwith t e current network is currently being reviewed. This process will inform that design of an additional 150 km of network in future, and identify any revisions required to existing sections.
Car Sharing 3.24. A car-sharing club was piloted in Dublin city in 1997. The ‘Pay as You Drive Car Sharing’ scheme had three cars located at two DART stations and ten members. The scheme ceased due to difficulties with motor insurance issues.
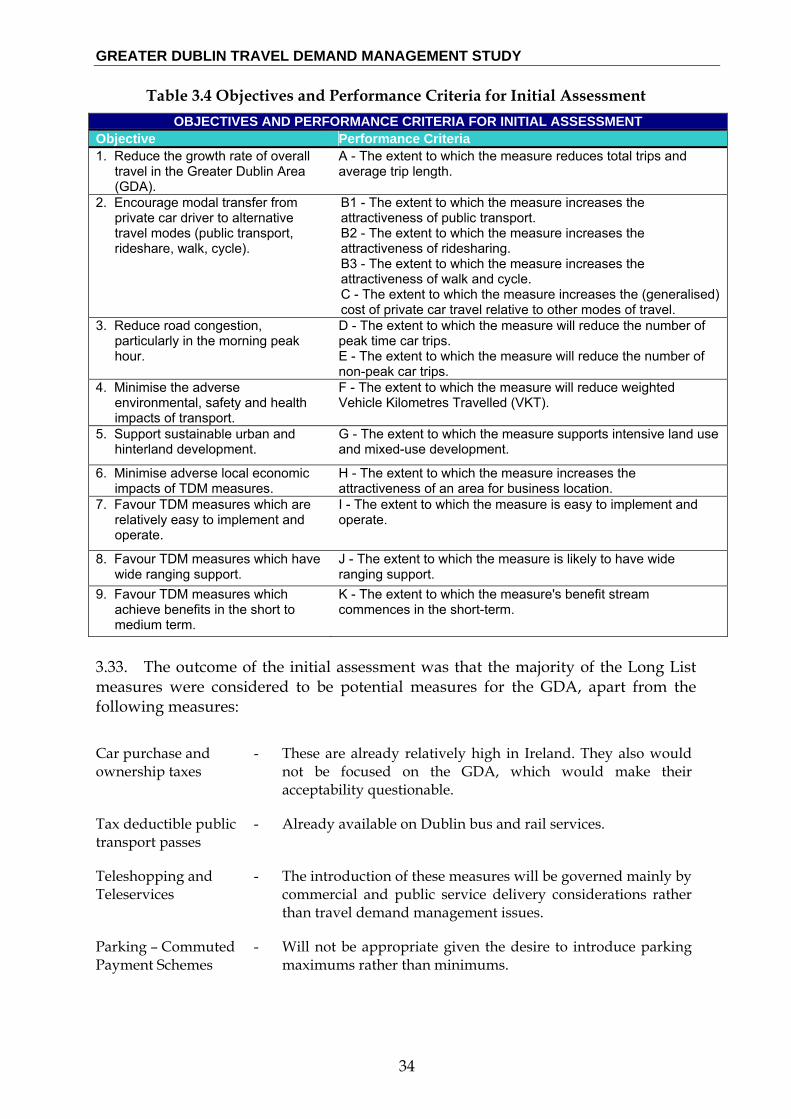
GREATER DUBLIN TRAVEL DE D M G ENT UDY MAN ANA EM ST
33
pilotin g or me. y m is similar to cu r i des o f the next bus and estimated time of arrival. Luas has RTPI at all stops. 3.3 t re cy is currently de o r et for the GDA. Th s 3.3 on l penalties for passengers that need to use more than one service per trip is currently being co d b he p ment Tr r roug ts Fare icy dy. Potential TDM Measures for GDA
. A t a ssm of List e en F) to tify r i co u o fferent measures to achieving the DTO's spor se c undert e s th initial ssm o ov b oritising TDM measures, and to assist with dev f po e f TDM s e A. oals ieve M t p f multi-criteria analysis) has been used for init s m t. The assessment enabled TDM measures to be ranked rdin h r all c ied rms ow w h . T jec and
e n
g an Rt DAR
In termping a due to
Impro
ere
TPI syT and
s of cont be op
ved in
y t
stem sub
integactle
era
teg
De
alonurban
rated ss smational by
ration o
art
the Luail sys
icketintcard the e
f fares
of
cte
g,band
th
an
an Qm a
the sed of
rou
spo
BC fnd it g
Railway integrat2005.
gh the r
t th
sometives the
Procued tick
educti
h i
The stinati
nt Agg syst
f finan
ol
sten o
enem
cia
Stu
rren
0. velis i
1.
ns
mein
o
s P
id
3.32identranassethe Achthe accoof hcrit
n th
t enelomeialg e
se
inie
andt' wpinnt
asto tll td i
ial elat lanas tg o
aesseirey s the
sseve d u pr a
rix aen
overauppo init
ent ntrib objeide a ssibl
proach
ll perfort diffe asses
then es is foackaa fo
annt oent
Longf di
was r prige o
rm o
ce ovebjectiv.
of TDM m
aken. Th
measure
riteria; and,able 3.4 pro
asures
purpo
for th
to be clvides th
(App
e of
GD
assife ob
dix
is '
A
intiv
tiotivas
p (
rmresm
G
tees es
ria u ial

GREATER DUBLIN TRAVEL DEMAND MANAGEMENT STUDY
T sment able 3.4 Objectives and Performance Criteria for Initial AssesOBJECTIVES AND PERFORMANCE CRITERIA FOR INITIAL ASSESSMENT
Objective Performance Criteria 1. Reduce the grow
travel in the Greath rate of overall ter Dublin Area
(GDA).
A - The extent to which the measure reduces total trips and average trip length.
2. Encourage modal transfer from B1 - The extent to which the measure increases theprivate car driver to alternative travel modesrideshare, wa
attractiveness of public transport.
tent to which the measure increases the ss of ridesharing.
The extent to which the measure increases the attractiveness of walk and cycle. C - The extent to which the measure increases the (generalised) cost of private car travel relative to other modes of travel.
(public transport, lk, cycle).
B2 - The exattractiveneB3 -
3. Re ce road congestion, particularly in the morning peak hour.
D - The extent to which the measure will reduce the number of peak time car trips. E - The extent to which the measure will reduce the number of non-peak car trips.
du
4. Minimise the adverse environmental, safety and health
F - The extent to which the measure will reduce weighted Vehicle Kilometres Travelled (VKT).
impacts of transport. 5. Support sustainable urban and
hinterland development. G - The extent to which the measure supports intensive land uand mixed-use development.
se
6. Minimise adverse local economic impacts of TDM measures.
H - The extent to which the measure increases the attractiveness of an area for business location.
7. Favour TDM measures which are relatively easy to implement and operate.
I - The extent to which the measure is easy to implement and operate.
8. Favour TDM measures which have wide ranging support.
J - The extent to which the measure is likely to have wide ranging support.
9. Favour TDM measures which achieve benefits in the short to medium term.
K - The extent to which the measure's benefit stream commences in the short-term.
3.33. The outcome of the initial assessment was that the majority of the Long List measures were considered to be potential measures for the GDA, apart from the following measures:
Car purchase and ownership taxes
- These are already relatively high in Ireland. They also would not be focused on the GDA, which would make their acceptability questionable.
Tax deductible public transport passes
- Already available on Dublin bus and rail services.
Teleshopping and - The introduction of these meTeleservices
asures will be governed mainly by commercial and public service delivery considerations rather than travel demand management issues.
Parking – mmPayment S em
en the desire to introduce parking imums.
Co uted ch es
- Will not be appropriate givmaximums rather than min
34

GREATER DUBLIN TRAVEL DEMAND MANAGEMENT STUDY
Trip Reduction Ordinances nvironment (and has also been discarded
in most places where it has been trialled).
3.34. Table 3.5 lists potential TDM measures which, on the basis of the
s undertaken, are considered to be feasible for the GDA. These feasible otential TDM measures cover 11 of the TDM strategies identified in Table 3.1. In
five other TDM strategies (bus priority measures, walking measures,
- This type of regulatory control of employers is not suitable to the Irish regulatory e
investigationpaddition, cycling measures, integration measures and traffic management measures) are already being implemented in the GDA and are included in the DTO's A Platform for Change strategy. It has been assumed that implementation of these five particular TDM strategies will continue as planned. The measures identified in this report are incremental (and in many cases complementary) to those five measures.
35

GREATER DUBLIN TRAVEL DEMAND MANAGEMENT STUDY
36
Table 3.5 Feasible Potential TDM Measures Incentives Disincentives System Changes and Information Employer bilit• Pro ans of
assi upp• Prov nding t fra
Trav ent cost• Inco elow u our
Ride ncial M• Pro ans for g
empl
Travel Plansmotion of travstance/technision Seed/el Plan deverporates Actsharing, and
motion of travoyers.
(Moel plical s
initial fulopmions b Finael pl
y Management Plans) to employers, and provisionort with implementation.
o employers to help des.
nder: ICT, Alternative Heasures. roups of neighbouring
y/offset
s,
Information cations Tec• Pro working to e of
assi ical support • Prov d Funding to y s
cost
ngree
I re A. R g y CUse ate seuse oIntrod rki mepossi
eet PaMaxi for ndredev el acceParki CEmpl ar eawith esParki ar noresid artrans
Communimotion of telestance/technision of Sees.
hnology mployers, and provisionwith implementation. employers to help defra
et-up
ParkiOn-st• •
•
•
Off-str•
• •
•
Restraint t Parking:
mpose charges in town centeduce the number of parkinentre.
of pricing policy to regulf parking. uction of Controlled Pable road pricing. rking:
mum parking standards elopment tied to the lev
ssibility – whole GDA. ng ceiling/cap for Dublinoyee parking spaces chhigh public transport accng Levy on workplace pential parking spaces inport accessibility.
s throughout the GDspaces in Dublin Cit
demand and optimi
ng Zones to comple
new development aof public transport
ity Centre. ged or removed in arsibility.
king spaces or othereas with high public
the
nt
s
n-
Alternative• Pro mpressed W . • Stag ing hours and
Hours motion of Cogered work
ork Weeks to employers Flexible working hours.
Ridesharin• Pro sharing to e e with
setti aring schem
tial d lower on a ssib s. Com elopment ing High rt A cations. ntr on the
or growth es. n of Tr pment an Desig pment es at Exis posed
n of Integ pment port dev roaches idential n ds. w Car ho es. ent Cont on Car cluding p rt). of Travel ity ent Plans ement for ermissio
ents. parking r new ent and r nt tied to sport ac vels. g
motion of rideng up ridesh
mployers, and assistances.
Land Use • Higher Re
parking prTransport
• Higher dewith lowerPublic Tra
• Hierarchypotential f
• ApplicatioArea/ Urbapproachcentres.
• Applicatioand Transto new res
• No and Lo• Developm
Modes (in• Inclusion
Managemplanning pdevelopm
• Maximumdevelopmpublic tran
sidenovisi Accensity parknspo of Ce
densities ant High Publicility locationmercial dev
provision at ccessibility loes focussed within centr
ansport Develon land develoting and Pro
rated Develoelopment appeighbourhoousing schem
ributions to Nublic transpoPlans (Mobil) as a requir
n for large
standards foedevelopmecessibility le
Financial M• Pos for set up co mes (e
ride ftware/syste rt-up matc for employer
• Pos o employers nd cyclfacili pport cycling lmet purc
estion
main (A) A pa adrive e e para don, c forhour ixed c eapape based) ce Num(B) C – pay ossthe c ters: n, charg tial ch dause (C) or B, b tiooute ally im
easures sible subsidymatching sohing grants
sible grants tties, and suhase).
sts for carpooling schems), and provision of sta
carpooling allowances. who improve walking acosts (e.g. cycle and he
.g.
ing
Cong Three•
•
•
Charging
options: rea Licence Scheme – unlimited during schemmeters: City Centre cors (e.g. 7am – 6.30pm), fr licence with (camera ber recognition. ordon Charge Schemeordon. Possible parameed all the time, differen
of GPS technology. Extension of options A r cordons, e.g. strategic
y once to enter areatime period. Possibl
harge weekdays harge to enter ar Automatic Licen
every time to crCity Centre cordoarges by time of
ut with the addiportant routes
nd
11 ,
y,
n of
School Tra• Pro ravel plans ovision
assi ical support
ion Empl s a tax ind'. Incre .
Marketin Individu ting es in con public mprovemareness
vel Plans motion of tstance/techn
to schools, and prwith implementation.
of Taxat• •
oyee parking subsidy aases in motor fuel taxes
able 'benefit-in-k
Education and • Roll out of
programmtransport i
• Travel Aw
g alised Markejunction withents.
Campaigns.
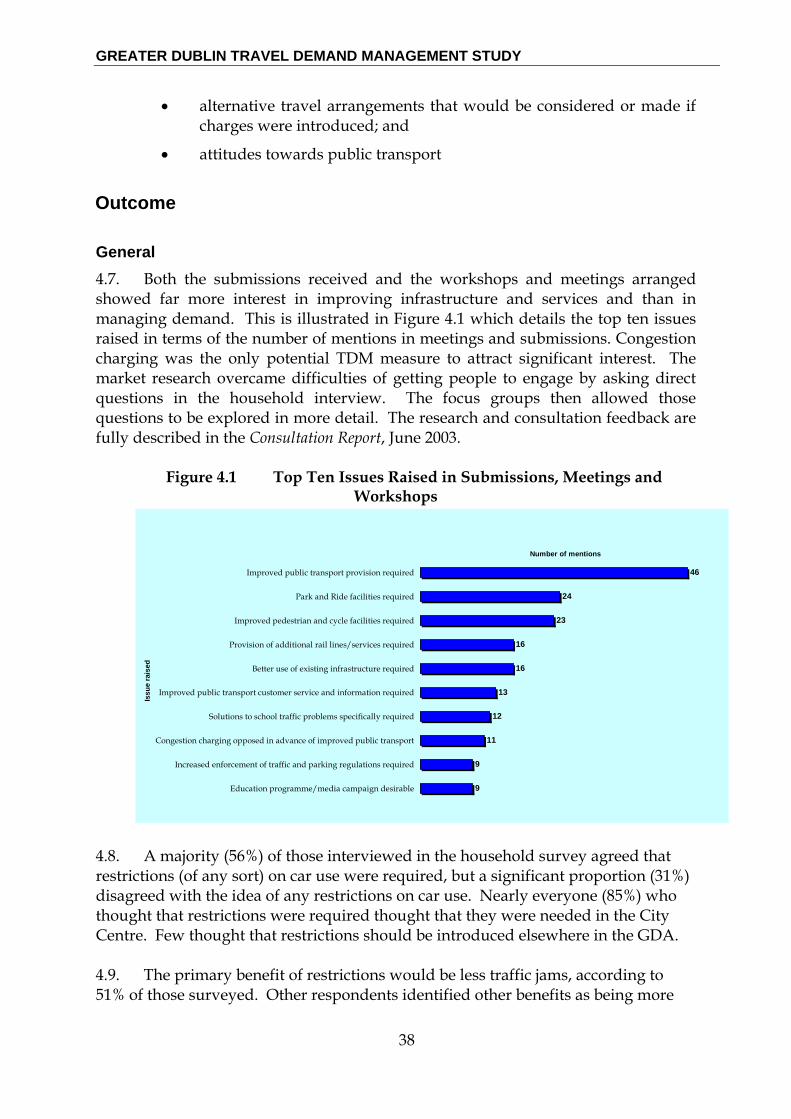
GREATER DUBLIN TRAVEL DEMAND MANAGEMENT STUDY
4 Consultation and Market Research
Introduction 4.1. There were three different strands in the overall consultation process:
• on-going stakeholder liaison; • public consultation; and • market research.
4.2. In each case, the approach was framed following discussions with the
ection 3.
t of meetings and workshops as part of the main consultation phase. ppendix I provides a list of the stakeholders.
tial TDM measures shown on able 3.5. Advertisements were placed in national and local newspapers within the
ritten submissions were invited and a total of 58 written ains a list of people and organisations
, around 650 household interviews were undertaken. he qualitative research comprised two focus groups.
the areas of Leinster in which restrictions on travel are needed;
Demand Management Steering Group. The process was informed by the review of international experience and “long-listing” of feasible measures as described in S 4.3. Stakeholder liaison aimed to stimulate debate and information flow so that any TDM measures proposed are pragmatic, acceptable and coordinated with other transport initiatives. Stakeholders were first consulted in the initial stages of the study when a series of workshops were held. The workshops were followed up with another seA 4.4. The public consultation process was concerned with getting information on the study into the public domain, to develop awareness and seek initial feedback. Some 10,000 leaflets were distributed around the Greater Dublin Area, in libraries and towns halls. The leaflet set out the feasible potenTGreater Dublin Area. Wsubmissions were received. Appendix J contthat made written submissions. 4.5. The market research was a structured exercise designed to obtain attitudes of the adult population in Leinster towards measures to restrict car travel such as road user charging, working from home, use of public transport and parking restrictions. A dual approach was taken using quantitative and qualitative methods of research. For the quantitative researchT 4.6. Specifically, the market research focused on:
•
• the benefits of restrictions on travel;
• willingness to pay tolls/other charges;
37

GREATER DUBLIN TRAVEL DEMAND MANAGEMENT STUDY
• alternative travel arrangements that would be considered or made if charges were introduced; and
• attitudes towards public transport
ure and services and than in anaging demand. This is illustrated in Figure 4.1 which details the top ten issues
the household interview. The focus groups then allowed those uestions to be explored in more detail. The research and consultation feedback are
Figure 4.1 Top Ten Issues Raised in Submissions, Meetings and
Outcome General 4.7. Both the submissions received and the workshops and meetings arranged showed far more interest in improving infrastructmraised in terms of the number of mentions in meetings and submissions. Congestion charging was the only potential TDM measure to attract significant interest. The market research overcame difficulties of getting people to engage by asking direct questions inqfully described in the Consultation Report, June 2003.
Workshops
46
24
23
16
Park and Ride facilities required
Improved pedestrian and cycle facilities required
Provision of additional rail lines/services required
16
13
9
9
Improved public transport provision required
Better use of existing infrastructure required
e and information required
Increased enforcement of traffic and parking regulations required
Issu
e ra
ised
Number of mentions
4.8. A majorrestrictions (of t a significant proportion (31%) disagreed iththought that restrictions were required thought that they were needed in the City Centre. F th sewhere in the GDA. 4.9. The primary benefit of restrictions would be less traffic jams, according to 51% of those surveyed. Other respondents identified other benefits as being more
Improved public transport customer servic
12
11
Solutions to school traffic problems specifically required
Congestion charging opposed in advance of improved public transport
Education programme/media campaign desirable
ity (56%) of those interviewed in the household survey agreed that any sort) on car use were required, bu
w the idea of any restrictions on car use. Nearly everyone (85%) who
ew ought that restrictions should be introduced el
38

GREATER DUBLIN TRAVEL DEMAND MANAGEMENT STUDY
important, such as quicker journey times (27%), nicer walking conditions (13%), (8%), better
n
unpopular concept (preference for a “stay at home car” model was frequently voicharge avel to the City Centre, 33% wo 4.11. Some participants in the focus groups regarded free workplace parking in the
at w he charge, according to 3taking %). 4.1
be tackled first; however, parking
app t be imposed on ng
4.14. On the other hand, a strong appreciation of the practical difficulties of providing Park and Ride (including cost, difficulty of site acquisition, planning approval and car park security) emerged in discussions with local authorities having direct experience of the issue. It was also noted that informal park and ride throughout the GDA is an increasing problem for local residents, the Gardaí and businesses, leading to demand for parking controls (permit and pay and display systems).
Congestion Charging 4.15. Congestion charging raised much interest, reflecting a high level of awareness due to the publicity surrounding the London scheme which was seen to be working by those consulted in the GDA. Consequently there was no strongly negative
better air quality (12%), better street atmosphere (9%), easier parkingcycling conditions (7%) and more pleasant driving conditions (5%).
Parki g Measures 4.10. Parking restraint was widely understood and supported as a demand management measure, except in the case of no/low car housing which was an
ced). Of those interviewed in the household survey, 64% said that if parking s increased, they would use public transport to tr
uld switch to public transport for trips to their local shopping centre.
City Centre as a luxury upon which a levy would be fair. If those with free parking ork were charged the most likely reaction would be to pay t
4% of those interviewed in the household survey. Other likely reactions were public transport (15%) or car sharing (10
2. In general, increased restrictions on parking were broadly supported. It was thought that commuter parking shouldrestrictions at suburban shopping centres were generally not considered
ropriate. It was also felt that parking restrictions could noexisti developments, although they may emerge through market forces (e.g. redevelopment of car parks as other land uses or introduction of charging to manage space better). 4.13. Although Park and Ride was not one of the potential measures listed for consideration13, it was raised as an issue by many consultees and stakeholders. In the hinterland and outer counties it is seen by many as an essential measure to encourage people to use public transport.
13 As a separate initiative, the DTO is preparing strategies for park and ride for bus and for rail.
39

GREATER DUBLIN TRAVEL DEMAND MANAGEMENT STUDY
reaction to the concept of a congestion charging schemsense that some form of congestion charging is inevita
e in Dublin. There was a ble in the future; however,
a difficult project to implement and other, s should be tried first.
ptable. While there was some concern about an
dditional cost/tax on motoring, a significant proportion (20%) of those interviewed in the hou h the roads less conge eased to 32% if the money raised was used f 4.17. Of those people willing to pay a charge, 41% lived in Dublin and 59% in the
st of Leinster, 58% drove to work regularly and 49% have free car parking at work.
were likely to change avel plans to avoid a peak hour charge to enter the City Centre, but a large
hose
cation, congestion charging outside the City Centre was not nvisaged; however, some of the City Centre business groups opposed the idea of
ed is
implemented through the planning
ved owth. It idential
ld help local authorities in the outer counties provide services for eir increased populations.
s not limited to the outer counties. In fact,
e
there was also a sense that it would be simpler, measure 4.16. All consultees considered that public transport alternatives would need to bein place for charging to be accea
se old survey said that they would be willing to pay if it madested. The proportion willing to pay incrto und public transport improvements.
re 4.18. Almost half (42%) of those surveyed said that theytrminority (31%) said that they were unlikely to change their travel plans. Tliving in Dublin were more likely to change their travel plans than those living in therest of Leinster, possibly reflecting the greater travel choice available to Dublin residents. 4.19. In terms of loecongestion charging within the City Centre, particularly because of the perceivimpact it would have on shopper trips to the City Centre. These groups felt that italready difficult to compete with suburban locations.
The Planning System .20. In terms of measures that could be4
system, the location of jobs to balance housing growth was suggested on manyoccasions. This was in response to the understanding that new housing has moto outer areas, and now local jobs are sought to balance that residential grwas also recognised that the increased rates base generated by more non-resdevelopment wouth .21. The desire for more jobs wa4
competition for jobs between local authorities throughout the GDA is intense. It wasstressed that travel demand management proposals that gave uneven competitivadvantage would not be welcome. 4.22. Many local authorities and other stakeholders discussed the difficulties ofimproving public perception of the benefits of increased development density. Thiswas reflected in the focus groups where many participants did not see an immediate connection between development density and the viability of public transport.
40

GREATER DUBLIN TRAVEL DEMAND MANAGEMENT STUDY
However, the majority (62%) of household survey respondents agreed that awith higher density development should
reas be given priority in public transport
rovision.
.23. Increased fuel taxes were unpopular with most consultees. The majority ed
t
.24. There was a positive attitude to most other measures, although they were nd
ocal
re ures.
s were seen as a good idea. It was recognised that ur society and that people may not be aware of
s
one ted
ravel
.28. A set of critical success factors for the introduction of demand management measures emerged from the consultation:
• The benefits clearly explained;
• Existing systems optimised through management and enforcement before moving to complex or contentious measures; Satisfactory public transport alternatives in place;
• Local economic activity and competition between centres taken into account; and
• Funds raised used to improve non-car modes.
p
Other Measures to Promote TDM 4(70%) of those interviewed in the household survey did not agree that an increasfuel tax would be preferable to toll charges or increased parking charges. If the taxwere used to fund public transport improvements, the majority (53%) still thoughthat toll charges or parking charges were preferable. 4frequently regarded as ineffective in practice. Support for enforcement amonitoring of Mobility Management Plans (MMPs) was widely called for by lauthorities. 4.25. Flexible working was regarded positively in general by the public but thewas a mixed response to ride sharing and car pooling meas 4.26. Public education campaignar dependency is ingrained in oc
either the environmental damage it causes or the alternative travel arrangementavailable. 4.27. Public transport fare reductions, especially for trips needing more than bus or train service were called for. Other financial incentives were suggesincluding weekend tax and insurance schemes and increased business texpenses for non-car use.
Critical Factors for Success 4
41

GREATER DUBLIN TRAVEL DEMAND MANAGEMENT STUDY
Sum ry of Direction from Consultation and Market Research ma
e points:
king charges seem to be the most immediately acceptable to
as a
blic transport alternatives exist;
ion
e,
ce
d likely to bring about a big change in the short term.
e e rural
Blanchardstown, strictions on car use are generally not seen to be acceptable anywhere except in the
lic ansport schemes and the “softer” measures to promote TDM is something to be vercome in developing TDM with both stakeholders and the general public.
4.29. The consultation and market research gave clear direction on som
Of all the options, par•people in general:
• Free workplace parking, especially in the City, is regarded by somereasonable target for charging; and
• General increases in the cost of parking would be acceptable where pu
• Due to the recently introduced London scheme, awareness of congestcharging is high and it is regarded as a measure that works:
• The prevailing response was one of acceptance as a longer term measurgiven public transport alternatives; and
• A significant proportion would be willing to pay a charge in order to reducongestion;
• The response to the majority of other measures was positive, but these were not considere
4.30. Some conflict is apparent. For example, while there is a desire to tackle thobvious growth in travel demand in areas beyond the M50, including thhinterland as well as centres such as Swords, Tallaght andreCity Centre. The apparent lack of confidence in the implementation of pubtro
42

GREATER DUBLIN TRAVEL DEMAND MANAGEMENT STUDY
5 Measures to be Developed
Introduction 5.1. The measures to be developed as candidate TDM measures for application inthe GDA were selected based on:
• The analysis of current and future travel demand problems; • The review of international practice; • The consultation and market research; and • The way in which TDM could be combined and applie
d at a strategic
5.2. Going forward to consmeasures v 5.3. Measuincludes measures through from long term spatial planning to development control for individ awill address tpatterns that bring homes, workplaces and services closer together, or at least linked by public n 5.4. Me uincluding car es to encourage eTypically, t esite or group of sites. They will facilitatdevelopments. 5.5. Fiscal uce financial penalties to discourage car use. “Car sunder measures to promote travel demand management or complementary measures. These will strongly dalternativ e Key Issues for Consideration
periods are to work. Work trips to the City are the primary target as they are the most numerous as well as being most likely to have a non-car alternative. Trips to all other areas also need to be addressed. This includes trips to the developing areas outside the M50 where public transport access is poor and where public transport access is likely to remain relatively poor even in the longer term. Ultimately, further
level across the GDA.
ider TDM in Dublin on the above basis, the potential ha e been gathered into three distinct groupings.
res that can be implemented through the planning system – this
u l developments to regional parking restraint measures. These measures he need to travel which can be achieved by more sustainable settlement
tra sport.
as res to promote travel demand management - the “softer” measures sharing, flexible working, individual marketing and all measur
p ople to change their travel behaviour in favour of less driving. h se measures would be packaged into a Travel Plan for an individual
e new travel behaviour at current and future
measures – “sticks” that introdrot ” such as fiscal incentives to use other modes would be considered
iscourage car use in certain situations where es xist.
5.6. Travel demand management policies to restrain the use of the private car for the work trip are the priority, as most of the car trips undertaken during peak
43

GREATER DUBLIN TRAVEL DEMAND MANAGEMENT STUDY
future growth in such areas needs to be limited through TDM measures that are implemented through the planning system.
ies are required to tackle this demand.
the review of international practice, potential measures to tackle
ly short time frame. Such short to medium term
5.10. The TDM strategies already being implemSection 3 of ebus prioritymeasures (such While these
f these strategies may need to be reinforced or extended on a local basis to complement specific TDM proposals. Also, other comp ered. This is discussed in Section 9 of i
5.7. School trips also account for a significant proportion of peak hour car trips at present. The proportion of children being driven to school is growing enormously and TDM polic 5.8. Followingthe identified issues were sifted down to those measures that were applicable in theGDA, or at least that were worthy of consideration. It also showed that there are a great number of potential measures available, but which can be gathered together into the three groupings set out above. 5.9. The public consultation and market research confirmed that an integrated approach was required that would address land use planning as the underlying cause of many travel demand problems, but that would also address measures that could take effect within a relativemeasures would need to address fiscal measures to actively discourage car use as well as other measures to promote demand management. Complementary Measures
ented in the GDA and outlined in th report are important parts of a total TDM package. These comprise , park and ride, walking, cycling, traffic management and integration
as integrated fares, ticketing, and information).measures act as TDM measures, they also improve transport provision for public transport users, cyclists and pedestrians. All o
lementary measures may need to be consid th s report.
44

GREATER DUBLIN TRAVEL DEMAND MANAGEMENT STUDY
6 Managing Travel Demand through the Planning System
Land Use Planning as the Foundation of Travel Demand Management 6.1. Land use planning and transport planning are inextricably linked, and their
.
s
aking a d car orientated design of
els
d
l travel demand management. Where development is properly integrated with transp to or from a development will have a range of transport c c demand management measures t n ay be more acceptable. 6.6. Amo transport planning ovoverall and
6.7. For l d ted, land use planning is required at both the strategic (“where to build it”) level and the local (“how to build it”) level. The relevant statutory planning policy documents for the Greater Dublin
proper integration is a key determinant of the sustainability of development in transport terms. At the same time, it is important to acknowledge that there are important non-transport factors (e.g. water supply, drainage) that need to be considered and taken into account by the relevant land use planning authorities 6.2. Urban policies from the 1950s to the 1990s tended to promote low-density suburban development, the separation of land use zonings, and the use of the car athe dominant mode of transport. The resultant dispersed pattern of development increased distances between housing, services and places of employment, mwalking and cycling more difficult. The lower densities nsuch development also made it more difficult to serve with public transport. As a result patterns of land use over time have worked to undermine public transport provision in the GDA and have been a contributor to increasing car congestion levin the Area. 6.3. However, some land use policies that support TDM are in place, and are setout in the National Spatial Strategy, the Regional Planning Guidelines for theGreater Dublin Area and in City and County Development Plans. 6.4. A glossary of terms used is provided at the end of this section of the report. Travel Demand Management measures that can be implementethrough the planning system 6.5. Appropriate land use policy and practice is a necessary condition for successfu
ort, the people who travel hoi es. When transport choice is available, travel o e courage travel by means other than the car m
ng the benefits of an integrated approach to land use ander time will be shorter average journey distances, less motorised travel
in particular less travel by car.
an use and transport to be successfully integra
45
GREATER DUBLIN TRAVEL DEMAND MANAGEMENT STUDY
Area includ t idelines, Local
ort
Two of the policies underlying the Residential Density Guidelines (DEHLG, ore
the
re lly
ed by ort
lity15;
defined higher-order centres (e.g. city, town or district centre);
d
x of local services within walking distance of their surrounding neighbourhood;
• Dtransport in mind;
• Relating maximum permitted parking provision for new developments to existing and future public transport accessibility, and proximity to t
re being established,
e he National Spatial Strategy, the Regional Planning GuAuthority Development Plans, and Local Area Plans. Non-statutory policy documents include County/City Development Board Strategies and Development Briefs. Each must foster the integration of land use and transport policies to suppsustainable travel throughout the Region.
6.8.1999) are the need to optimise the use of infrastructure and the need for msustainable commuting patterns. Suitably located development land, and theinfrastructure needed to support on-going development are scarce and often non-renewable resources. One of the principles of sustainable development is thatconsumption of such resources should be minimised.
6.9. Land use and transport integration therefore can be achieved at the strategic level and local level by:
• Consolidation as far as practicable of population growth in existing built up areas in the GDA region, where accessibility to work, leisuand other destinations by foot, cycle and public transport is generabetter;
• Location of major trip-intensive land uses in areas well servpublic transport or in areas that will be well served by public transpin future14;
• Relating the scale of urban centres to public transport accessibi
• Location of major trip-intensive land-uses as far as practicable in
• Relating the scale and density of new developments to current anfuture16 public transport accessibility, and to the scale and proximity of the nearest centre;
• Providing a mi
esigning all new developments with walking, cycling and public
he nearest centre.
6.10. In other words, new development must be more orientated towards non-car use and should underpin existing centres. Where new centres a
14 As set out in D15 Accessibility meas n within a maximum public transport journey time, taking
account of walk, that may occur due to lack of provision of sufficient public transport c i
16 As set out in the DTO’s strategy A Platform for Change.
the TO’s strategy A Platform for Change. ure based on existing and future populatiowait and transfer time, and access delays
apac ty.
46

GREATER DUBLIN TRAVEL DEMAND MANAGEMENT STUDY
developme ssuch proposed
oss ining
lated to lling as
or
). In order to identify appropriate
onsolidation policies to redress the forecast population decline in established areas, can be attributed to a
areas
ting
both pment, and to provide better quality open
e.g. )
er
nt hould support fully integrated transport choice to, from and within areas.
How these measures can contribute to Travel Demand Management in the GDA Consolidation 6.11. One of the most coherent themes that emerges from comparing cities acrthe developed world is that density of development is a major factor in determlevels of car use/dependence. Levels of private transport use are inversely reurban density (measured as persons per hectare), with car use per person fadensities increase17. Car use for commuting is observed to fall and the share fpublic transport is observed to rise in line with the degree of urbanisation. Averagetravel distances to work and shopping destinations are also lower in more consolidated cities18.
6.12. There has been a decline in population in many established residential areaswithin the Greater Dublin Area (GDActhe reasons for the decline need to be identified. The declinenumber of factors including:
• Falling average household size generally; • “Empty nest” households – most prevalent in mature residential
dominated by a single (family) household type
6.13. Measures to encourage consolidation of population in existing built up areas might include support for and promotion of:
• Redevelopment of under-utilised sites;
• Construction of additional dwellings within the curtilage of exisdwellings;
• Review of inappropriate existing open spaces, seekingopportunities for develospaces with improved facilities for the local community; and
• A greater mix of dwelling types in an area, to permit up-sizing (couples and young families) and down-sizing (e.g. older peoplewithout the need to move out of an area.
6.14. Many of these measures are already being pursued, not least due to developinitiatives driven by the strength of the residential market in the GDA at present. However, there is scope for greater local authority involvement to further promote
17 Newman P and Kenworthy J, Sustainability and Cities: Overcoming Automobile Dependence, Island Press, 199918 Tim Schwanen, Martin Dijst and Frans M. Dieleman, Policies for Urban Form and their Impact on Travel: The
Netherlands Experience, Urban Studies, Vol. 41, No. 3, March 2004.
.
47

GREATER DUBLIN TRAVEL DEMAND MANAGEMENT STUDY
the process, through development plan policies, which set out the general oband criteria under which such densification in established areas would be considered. Development plans could also identify locations where such
jectives
consolidation policies would be appropriate, and where appropriate local authorities ould develop Local Area Plans and Integrated Development Briefs (see Paragraph
cated in
e a
highest, was 37%, compared to only 3% to 6% for
se of
rt
nodes
• Business facilities, e.g. exhibition/conference centre;
• Leisure facilities, e.g. cinemas or concert hall;
• Higher and further education facilities; and
c6.45) for potential investors and developers.
Location of trip-intensive land uses in areas well served by public transport 6.15. If developments that are likely to attract a large number of trips are loareas well served by public transport, it may be expected that more people will choose to access them by public transport. This is evident in cities that havreasonably well-developed public transport network, Dublin included. In 2002, the public transport share for trips to work destinations in Dublin City Centre, where public transport accessibility is trips to work destinations in the outer GDA counties of Kildare, Meath and Wicklow, where public transport accessibility is lowest19.
6.16. The location of developments likely to attract a large number of trips (such as major retail, employment or leisure uses) in areas well served by public transport will make it more likely that a higher proportion of trips to the developments are made by public transport. This will have the added benefit of making best uexisting and future investment in public transport.
6.17. The optimum location of development in terms of the resultant patterns of travel will be assisted if development areas are defined in relation to highly accessible locations on public transport networks (“Public Transport Nodes”). Advice on the identification and treatment of such areas should be provided as paof the implementation of the regional planning guidelines for the Area. Critically, suitable development areas around public transport nodes need to be defined in each local planning authority’s Development Plan. The delivery of this objective could then be achieved through Local Area Plans for these areas (similar to a “Transport Development Area”) (setting out acceptable land uses, densities etc).
6.18. Suitable land uses for Local Area Plans focussed on public transport include:
• High density housing;
• High trip generating employment activities;
• Larger retail sites;
19 CSO, Census 2002
48

GREATER DUBLIN TRAVEL DEMAND MANAGEMENT STUDY
• Major public facilities, e.g. hospitals, civic offices etc.
6.19. A Local Area Plan prepared on this basis would typically be centred on a rail
ay include retail, employment,
e e use
elated to
ith
PG context meaning
y.
.23. From the point of view of public transport, it may be appropriate to review nd refine hierarchies of centres into a common Urban Centre hierarchy, covering
al
public transport investment
f
on Towns
of RPG Moderate Growth Towns); and
station or bus/rail interchange point, which would be surrounded by relatively high-density development, with the highest densities in the centre.
Relating the scale of urban centres to public transport accessibility 6.20. For the purposes of this report an Urban Centre is defined as the core commercial area of a city or town or village in the Greater Dublin Area. An Urban Centre will have a range of services, which minstitutional and other uses depending on its scale and function.
6.21. The attractiveness of an Urban Centre to the population within its travel timcatchment is in general related to the scale of the centre. In order to maximise thof public transport in accessing them, the scale of Urban Centres should be rtheir accessibility by (local and regional) public transport. This can be achieved by defining, and applying through the planning process, a hierarchy of Centres, wthe scale of each type of land use permitted in a Centre based on public transportaccessibility to the centre.
6.22. The Regional Planning Guidelines, the Retail Planning Strategy for the Greater Dublin Area and development plans acknowledge the need for a clearly defined hierarchy of centres. A hierarchy of centres (in the Rcentres and their associated settlements) is set out in the Regional Planning Guidelines. A separate “retail centre” hierarchy is set out in the GDA Retail PlanningStrateg
6aemployment, retail, and other service provision encompassing the regional and loclevel, related to their accessibility by public transport. The purpose of a refined hierarchy would be to act as:
• Guidance on the location of new development, particularly major tripattracting uses, e.g. employment, retail, other services;
• A focus for higher density residential development and mixed usedevelopment; and
• A focus for co-ordinated6.24. In the context of the GDA, the classification need have no more than four or five levels, (which could be based on the Regional Planning Guidelines hierarchy ocentres (Section 7.6 of the Regional Planning Guidelines)) e.g.:
• City Centre;
• Major Town Centre (e.g. centre of Metropolitan Consolidatiand Large Growth Towns);
• Town Centre (e.g. centre
49

GREATER DUBLIN TRAVEL DEMAND MANAGEMENT STUDY
• Neighbourhood/Local Centre (e.g. RPG Small Growth Towns andVillages)
6.25. The placing of each Urban Centre in the hierarchy should be related to the level of existing and future p
ublic transport accessibility. It would also need to take account of the scale of existing retail, employment, leisure and other services already present in a Centre. The Regional Planning Guidelines appear to be the appropriate place er (city/major town centre/town centre) level. Local authority development plans are the place for setting out hierarchies at the lower together with the higher-order Cent outfunction and scale of an Urban Centre may evolve over time in line with the development of the network of pub
6.26. uid clust d a ntres (including associated settlements), loyment and ente gio her-order Urba within dynamic clus n Centres within the dynamic cluster
Location of key destinations in d6.27. The grouping of key attractiprovides the opportunity for multi e, people can make these trips on foot d the opportunity to work, shop and socia ut tattractions of higher -order Centresdiffe
.28. Some traditional Urban Centres, for example, the City Centre, have a good mix of employment, retail, leisure and other services. Many Urban Centres however
any
ent
as
6.30. The geographical boundaries of Urban Centres should be defined on the Planning Authority development plans. As an overall guiding principle, key land
for setting out a refined hierarchy of Centres at the higher-ord
order level,res for that authority as set in the Regional Planning Guidelines. The
lic transport services serving a Centre.
The Regional Planning Gers”, which can be visualise
elines introduce the concept of “dynamics groupings of complementary Urban Cewith the objective of supporting emp
rprise growth. Generally, ren Centres
nal public transport will serve higters. Local public transport will link the Urba.
efined Urban Centres ons in a defined higher-order Urban Centre -purpose trips to the Centre. Within the Centr. Indee
lise in the one place, witho he need to travel elsewhere, is one of the key . By avoiding the need to travel to several
rent destinations, overall travel demand can be reduced.
6
lack the mix or scale of uses corresponding to their function. For example, mHinterland Centres do not currently have a good range of employment or comparison retail uses. Also, while newer Centres in the Metropolitan Area tend to have a better range of retail uses, there can be a limited range of employment opportunities within walking distance.
6.29. The GDA Planning Authorities need to ensure that adequate provision is made, in the defined Centres, for employment (especially employment-intensive uses such as offices), retail, leisure and other services. Some retail and employmuses are less suitable for Urban Centres (e.g. where good road access is required to transport heavy/bulky items or for distribution purposes). Where these uses are likely to attract relatively large numbers of trips, they should be located as close possible to the defined Urban Centre. Low employment-intensive distribution based uses should not be located in urban centres, their primary location consideration being accessibility to the strategic road network.
50

GREATER DUBLIN TRAVEL DEMAND MANAGEMENT STUDY
uses likely to attract large numbers of person-trips should be located within comfortable walking distance of each other. Development Plans should include an
tunity for urban consolidation may exist in areas that have into
.g.
e -
.32. The Residential Density Guidelines, published by the Department of the nt and Local Government in 1999, set out residential density standards
town erally better than
be incorporated into the
be listed in the guidance note to
f
tion for a
objective to improve the safety and comfort of those who walk to centres.
Relating development densities and scale to existing and future20 public transport accessibility21 and proximity to nearest centre 6.31. Considerable opporgood public transport accessibility. This is because the capacity to move people and out of these areas from the surrounding areas, without adding to road congestion, will be greater than elsewhere. Areas close to higher-order centres (etown centres and the City Centre - see Paragraph 6.24) also provide good opportunities for consolidation because of the opportunity to make multi-purpostrips without the need to travel long distances, and the greater scope for using noncar modes to access the centre.
6Environmeappropriate for development on public transport corridors and in proximity to centres. Within the GDA, where the public transport network is genelsewhere in the country, higher minimum densities for certain locations should be specified by local authorities, related to their public transport accessibility.
6.33. Regional guidelines on appropriate retail and employment densities, related to public transport accessibility, should also be developed initially in the form of a regional guidance/advice note, which may ultimately Regional Planning Guidelines for the Mid East and Dublin Regional Authorities.
6.34. Densities could be specified at a regional level with the acknowledgement that they may not always be achievable due to site-specific constraints, for example in areas of high amenity. Such constraints shouldfoster consistency of application across the planning authorities. Local authorities should then specify minimum densities for areas in their development plans, taking into account local site constraints.
6.35. Ensuring developments are appropriately located is a necessary but insufficient condition to promote sustainable travel. Each individual development also needs to be designed according to integrated transport and land use principles itravel demand management is to be promoted. Paragraph 6.36 to 6.57 set out appropriate land use measures for travel demand management, once a locadevelopment has been decided upon.
20 As set out in the DTO’s strategy A Platform for Change 21 Accessibility measure based on existing and future population within a maximum public transport journey time, taking
account of walk, wait and transfer time, and access delays that may occur due to lack of provision of sufficient public transport capacity.
51

GREATER DUBLIN TRAVEL DEMAND MANAGEMENT STUDY
Providing a mix of local services within walking distance of their surroundneighbourhood 6.36. If local services (e.g. convenience store, crèche, primary school, pharmacy, doctor’s surgery, community centres, post offices, pubs, etc.) are within walkin
ing
g t.
well as older towns and
e or
Department of
a Plan is the most effective statutory planning instrument for ed
6.40. or walking, cycling b ew developments need to be d r needs in mind. If a journey on foot requires a circuitous rout ment (be undary wall surrounding the development site, for example) then it is much less likely to be made on foot. Furthermore developments that do not properly facilitate access to local b nd train station cycle wi n adverse impact on public . Besides di ortant rations for an attractive route are quality and safety.
6.41. ents shof acc destrians, cyclist u
here s barriers to movem ist, me provide more direct ccess should be actively considered. In some cases this may include re-development
6.42. Greater guidance on development design is required to ensure that development control and advice to encourage sustainable travel is undertaken consistently in all planning authorities.
distance, along a safe and well-designed route, many local trips can be made on fooMost parts of Dublin’s City Centre and its inner suburbs, asvillages in the GDA, have local services that are only a short walk away. However, much of the new housing of the past 30 years has not been built with this in mind. Distance to local services is perceived as not conducive to walking and cycling, and as a result many local trips are made by car.
6.37. There is often a lengthy delay between new residential development, and thdelivery of required neighbourhood facilities such as crèches/primary schools medical centres. The Department of Education and Science andHealth and Children are responsible for the funding of these facilities. It is important that greater coordination takes place between local authorities and these government departments to ensure timely provision of the required facilities.
6.38. Where a new housing development is provided away from existing local services, it is critical that local services are provided as an integral part of that development. In existing residential areas where these services are not currently provided for, the planning authorities should seek opportunities for the provision of these services, having regard to their resource constraints.
6.39. The Local Arethe delivery of services at the local level, and can apply to both new and establishareas.
Designing developments with walking, cycling and public transport in mind F or public transport use to
esigned with non-car usee through a develop
ecome popular choices, n
cause of a long bo
us stops a s on foot or by ll have a transport use stance, other imp conside
All new developmess for pe
ould be designed with ease and safety and security s and public transport sers in mind. In addition,
asures to wa
seriou ent currently ex
of sites that act as serious barriers.
52

GREATER DUBLIN TRAVEL DEMAND MANAGEMENT STUDY
6.43. Desi out in Table 6.particularlytransport fr
Table
gn considerations appropriate for large residential developments are set 1. They should be taken into account wherever possible. It is
important to design the layout of large-scale development in a public iendly manner.
6.1: Design considerations for larger residential sites Design Consideration Description New and EDesire Line
xisting Routes and s
Both within the site and across the whole of the site perimeter so that pedestrian movement is un-interrupted by vehicle based layout, cul-de-sacs or boundary walls.
Direct, uPedestrian
Sec re and Attractive and Cycle Linkages
Linkages to strategic, local and neighbourhood amenities and transport routes, shops, places of work, entertainment, schools and colleges.
Efficient anTransp
d Attractive Public Connecting discrete communities and ort neighbourhoods to local and central facilities such as
shops, places of work, entertainment, schools and colleges.
Safe MovemTransport
as an integral part of road and street patterns. Public
ent for all Modes of Motorised, pedestrian, cycle; pedestrian and cycle routes integrated with the mainstream of movement patterns, keeping cyclist and pedestrian movement
transport priority provided where advantageous for users.
A Quality S of movement, pedestrian, vehicular and cycle.
treet Environment Which helps to integrate the spatial needs of differing modes
(Source: based on Large Sites, Lle e
“Sustainable Residential Quality – Exploring the Housing Potential of w lyn-Davies, January 2000, page 53.”)
6.44. The above design considerationsdevelopments, su l areas. In addition, it is hightypes of developments should be in close proximity to roads, or front directly onto
e sites their area, where considered appropriate by the local authority. This would
riefs,
should also apply for “destination” ch as new workplaces, educational establishments and retai
ly desirable that the pedestrian entrances of buildings in these
them, particularly where public transport is provided along that road.
6.45. It is further recommended that local planning authorities prepare Integrated Development Briefs (IDBs) for strategically important residential or mixed-usindepend on developer cooperation with the process. Integrated Development B
hich should not be confused with Strategic Development Zones, would focus in wparticular on design around facilities for walking, cycling and public transport. These would provide the detailed site design requirements consistent with the localauthority Development Plan and Local Area Plan objectives. Ideally, they would beprepared after the adoption of a Local Area Plan for a wider neighbourhood. Integrated Development Briefs would provide a valuable framework for developers
53

GREATER DUBLIN TRAVEL DEMAND MANAGEMENT STUDY
for planning application purposes, by setting out the desired design and layout of a development, from the local authority point of view.
6.46. A typical process for creating Integrated Development Briefs could comprisetwo stages. During the first stage, the policy context and design considerations would be defined and forwarded to the applicant by the Local Authority, i
n advance f a planning application. During the second stage, the developer could undertake
consultation and prepare options for consideration by the local authority in advance of
6.47. A modified IDB approach would alsresidential sites in each local planning authority area. Such IDBs could set out a desired approach for grouping together common and complementary uses (e.g. clustering employment uses with local shops, cafeterias or child-care centres). This could make an important contribution towards reducing the need to travel, and studies22 have shown that levels of car travel to and from employment centres in particular tend to decline if designed in this manner.
Relating maximum permitted parking provision for new developments to public transport accessibility, and proximity to nearest centre 6.48. Parking supply acts as an important constraint on car travel, and there may be scope to reduce the parking provision in new developments, especially if they are well served by public transport. In addition, if a development is located close to or in a higher-order centre that can be easily accessed by other non-car modes, there is a case for providing less parking for that development.
6.49. Many current development plans specify residential and commercial parking standards that must be met by a developer, with the intention of providing fully for car demand. Parking supply at a destination is a key factor for many when deciding
, of 1 space per 400 sq. m is applied in the City Centre, and
ween
maxima.
6.51. By comparison, office parking standards in Greater London are expressed as maxima across the region, and range from a maximum of 1 to 1000 sq. m. gross floor area in Central London to a maximum of 1 to 100 sq. m. gross floor area in Outer
o
a planning application.
o be appropriate for important non-
how to travel, especially for the journey to work.
6.50. In the City Council area, a maximum office-parking standard, based on publictransport accessibilityother areas with good public transport accessibility, with 1 space per 100 sq. m applied in the least accessible areas. However, office parking standards in the GDAoutside the Dublin City Council area are much more generous. They range bet1 space per 50 sq. m and 1 space per 20 sq. m gross floor area, and typically provide for the majority of the workforce to access the workplace by car. Some, but not all, parking standards outside the City Council area are expressed as
22 One study (Davidson 1994, cited by the Victoria Transport Policy Institute) found that the presence of worksite
amenities such as banking services, on-site childcare, a cafeteria, a gym and postal services reduced average weekday car travel by 14%, due to a combination of reduced errand trips and increased trip linking.
54

GREATER DUBLIN TRAVEL DEMAND MANAGEMENT STUDY
London23. O ectly related to floor area. As the scale of some retgrows, the ready supply of parking spaces, which are usually not charged for, has a significant impact on local road congestion, and congestion levels on the M50.
6.52. The DTO recommends maximum levels of permitted parking provision for new developments to restrain parking supply in the GDA.
6.53. It is further recommended that all parking standards currently treated as minima in local authority development plans, or not specified as minima or maxima, should be replaced by maximum parking standards. In determining appropriate parking levels, allowance is made for greater flexibility in special circumstances in certain parts of the Hinterland Area, on a case-by-case basis. Each case should be justified against the background of the general policy of relating development location to (existing and future) public transport accessibility.
6.54. It is recommended that parking provision for new developments in the GDA should not exceed the maximum standards set out in Table 6.2. It is recommended that the maximum standards set out in Table 6.2, or similar standards which may provide for less parking for certain uses, should be incorporated into local authority development plans. It would be appropriate to apply more restrictive maximum
arking standards than the regional maximum in the Metropolitan area of the GDA nd in areas with good public transport accessibility. For example, a more restrictive
e per 50 sq. m may be appropriate for office development within the ea.
utside Dublin City Centre, new retail parking provision is dirail centres located close to the M50
palevel than 1 spacMetropolitan Ar
6.55. A similar approach to this is in place in the UK where national maximum parking standards are defined in policy guidance (similar to those set out in Table 6.2), with more restrictive standards in many regions, and local authority areas, where transport choices are greater.
Table 6.2: Proposed Maximum Regional Parking Standards (non residential use)
Maximum Parking Standard (per gross floor area unless
otherwise specified)
Threshold from and above which standard applies
(gross floor space) Employment, including offices
1 space per 50 m2 1,500 m2
Food retail 1 space per 14m2 1,000 m2
Non food retail 1 space per 20 m2 1,000 m2
Cinemas and conference facilities
1 space per 5 seats 1,000 m2
Higher and further education
1 space per 2 staff + 1 space per 15 students
2500 m2
Stadia 1 space per 15 seats 1,500 seats
ded that: 6.56. At the GDA local planning authority level, it is recommen
23 Insufficient data on parking standards in other European cities is available to make a meaningful comparison
55

GREATER DUBLIN TRAVEL DEMAND MANAGEMENT STUDY
• Non-residential parking standards should be specified as maxparking standards (already the case in some local authorities);
• More use-specific parking standards than those in Table 6.2 above should be specified (e.g. separate standards for office, industrial andwarehousing use, and for different user types (e.g. staff, visitordeliveries, etc.));
imum
s,
• Non-residential parking standards should be reviewed in the light of egional maximum specified for each use, and amended as
e
be
s; and
be a
aces,
residential llowing
for the following factors:
eth de e po y hou acharacterised by low car ownership;
Whether the level of public transport access is high; and
Whether the proposed development is in an area with a n ng e r ee c .
6 ithstanding the above, appropriate m um king st ards disabled car users will need to be specified by each local authority, and incorporated into the maximum permitted overall car parking standard for each land use.
Modelling the Potential Impact of Certain Land Use Measures
6.58. To provide a basis for the land use planning analysis, the DTO developed population projections for the year 2016, in consultation with the local authorities. These projections were compatible with the Strategic Planning Guidelines’ (SPG) forecasts at the county level but may require some revision in light of the adoption of the Regional Planning Guidelines. The data are presented in Appendix K.
the rappropriate. Parking standards should be more restrictive than regional standards in certain areas, particularly within thMetropolitan area and where public transport accessibility is good;
• Residential and non-residential parking standards shouldreviewed and amended to be similar to those in the City Council areafor areas in other local authorities that have equivalent levels of public transport accessibility and provision of local service
• Consideration should also be given to capping the level of parking inmajor town centres outside the City Centre. (Charges could thenintroduced by the town centre car park operator(s), to ensurecontinuing balance between demand and supply of parking spand to reduce local congestion caused by cars queuing to access aparking space); and
• Reduced residential parking provision (including “no car” development) should be permitted in certain circumstances, a
Wh er the velopm nt pro ses a t pe of sing th t is
reside ts’ parki schem or othe on-str t parking ontrols
.57. Notw inim par and for
56

GREATER DUBLIN TRAVEL DEMAND MANAGEMENT STUDY
6.59. Figure 6.1 shows the forecast population density (population per hectare) for ost of the metropolitan area of the GDA in the year 2016, with the “base” scenario
g ging – notably in the
City Centre, Docklands, North D
Figure 6.1: P
mpopulation projections. It indicates that, in response to recent changes in planninpolicy and practice, areas of high residential density are emer
ublin and some other development sites.
rojected Population Density in the GDA in 2016 (persons/hectare)
6.60. Overall, the population of the GDA is projected to grow by 18% in the period 2002 to 2016. The overall growth comprises areas of growth and areas of decline, as shown in Figure 6.2.
6.61. Incre ethere is undevare forecast forresidential development are also apparent on brownfield sites in dockland areas and to the west of the City Centre. There are althe existing r
as s in population are forecast to take place outside the M50, and where eloped land available along the M50. Large increases in population the Development Centres in the Hinterland. Pockets of future
so some greenfield opportunities within u ban area, more commonly to the north of the city.
57

GREATER DUBLIN TRAVEL DEMAND MANAGEMENT STUDY
Figure 6.2 Changes in Population in the GDA 2002 to 2016
Consolidation 6.62. A scenario for redressing population decline in established areas was developed for the purpose of assessing transport impact. This assumed that, by 2016, decline in those areas where decline is predicted would stabilise at 90% of the 2002 population. There would be a corresponding reduction in growth elsewhere as a lower level of new development would be required to accommodate the same overall population growth in the GDA. Areas of the GDA not currently served by suburban rail/DART were targeted for reduced growth. Details of the analysis are provided in Appendix K. The outcome from the scenario would be slightly increased growth in the City Council and South Dublin areas and slightly reduced forecast growth in the other counties. The analysis showed that, with no consolidation in established areas, some 55,000 of the growth in population to 2016 could be housed in areas that were poorly served by public transport, while the population level would decline in areas where investment in suburban rail/DART, Luas and bus services/routes, is occurring. With the suggested scenario, more growth could be accommodated within the rail, Luas and Metro corridors such that some 15,000 less people would be housed in areas poorly served by public transport, in the year 2016.
Intensified Development along Public Transport Corridors 6.63. A second scenario was developed which intensified development in the parts of the GDA that are best served by public transport. This redirected future population and employment growth in the period 2008 to 2016 away from areas that are poorly served into growth areas that are currently served by suburban
58

GREATER DUBLIN TRAVEL DEMAND MANAGEMENT STUDY
rail/DART. In other words, new residential and business development in rail ld be more intensive than envisaged in the “Base” scenario. Details of
e analysis are provided in Appendix K. The outcome of the scenario would be that,
obs
rt impact of the land use planning scenarios. By omparison with the base situation for 2016, the scenario of urban consolidation
il corridors
wo ehicle-km red cle hours by 5% and vehicle-km by 2%, and intensification of dev y 2% nce an
ns
Table 6.3 Transport Impact of Land Use Planning Measures
corridors wouthover the period 2008-16, an additional 38,000 of the GDA’s future residents could be housed in areas with good public transport access. Similarly, some 9,500 more jcould be located in areas with good public transport access.
Transport Impact 6.64. Table 6.3 shows the transpocwould reduce total morning peak hour (8am-9am) vehicle hours by 3% across theentire GDA, and vehicle-km by 2%. Intensifying development in ra
uld reduce total morning peak hour (8am- 9am) vehicle-hours by 2% and v by 1%. The effect is strongest outside the M50 where urban consolidation woulduce vehielopment in rail corridors would reduce vehicle-hours by 3% and vehicle-km b
. The inner areas, particularly within the canals, are forecast to experieincrease in both vehicle-hours and vehicle-km under either scenario, as increased population and employment in those areas would result in some increase in car travel as well as travel by other modes. This effect is off-set by the wider reductioin vehicle-hours and vehicle-km in the GDA as a whole.
Comparison with the base situation in 2016 during the AM Peak (8am – 9am)
All GDA Inside Canals Between canals and
M50 Outside M50 Veh-hrs Veh-km Veh-hrs Veh-km Veh-hrs Veh-km Veh-hrs Veh-km
2016 Base: No d use planning
measures (see Table 2.3) 299,022 8,062,699 14,125 157,844 69,188 1,432,517 215,710 6,472,338
lan
2016 with urban consolidation 289,355 7,893,517 14,549 159,150 69,386 1,421,101 205,421 6,313,266 Reduction 9,667 169,182 -423 -1,305 -198 11,416 10,289 159,072 % Reduction 3% 2% -3% -1% 0% 1% 5% 2% 2016 with intensified development in rail corridors 293,785 7,956,311 14,539 158,379 69,528 1,422,934 209,718 6,374,998 Reduction 5,237 106,389 -414 -534 -340 9,584 5,992 97,339 % Reduction 2% 1% -3% 0% 0% 1% 3% 2%
59

GREATER DUBLIN TRAVEL DEMAND MANAGEMENT STUDY
Actions and Leading Agencies 6.65. The proposed measures to manage travel demand through the planning system could be implemented, in the first instance, through:
review of the appropriateness, from the point of view of public transport, of refining existing hierarchies of RPG and retail centres
GDA local planning authorities of employment, retail, r services provision in higher-order Urban Centres (as
Review by local planning authorities of current local retail and other commercial service provision, and amendment of Development Plan
Preparation of a regional guidance note on minimum development
ay not always be or example in areas of e RPG Implementation
tion Team);
ts;
The development of regional guidance/advice notes on the design of
Steering Committee/Implementation
• Expansion of the use by local planning authorities of “Integrated
Development Briefs” for key residential, mixed use or other sites in their functional areas;
• Active identification by local planning authorities of sites within built
up areas, which have potential for intensification of development, and
• A
into a common hierarchy for Urban Centres (as defined in this report), covering employment, retail, and other service provision, related to their accessibility by public transport (led by RPG Implementation Steering Committee/Implementation Team);
• Reviews by the leisure and othedefined in this report), and amendment of City and County Development Plans as necessary;
•
where appropriate to provide for additional local services;
•densities related to public transport accessibility and proximity to nearest centre (with the proviso that they machievable due to site-specific constraints, fhigh amenity or landscape value) (led by thSteering Committee/Implementa
• Subsequent translation by local planning authorities of guideline
densities into more specific minimum development densities for areas defined in their development plans, taking into account local site constrain
•developments with walking, cycling and public transport in mind (led by RPG Implementation Team);
• Preparation by local planning authorities of Local Area Plans for sites that are, or will be, highly accessible by public transport;
60

GREATER DUBLIN TRAVEL DEMAND MANAGEMENT STUDY
of areas of poor quality open spaces that could provide opportunities for rationalisation, including development, combined with qualitative
•
.
improvements in terms of urban design and local amenity provision;
Promotion by local planning authorities of a greater mix of housing sizes in an area, through Local Area Plans, and other means;
• The adoption of maximum parking standards by all GDA local planning authorities ;
• The incorporation of maximum guideline parking standards (as set out in Paragraph 6.55 above) into local authority development plans ; and
• The adoption by the GDA local authorities of more restrictive
location-specific maximum parking standards for the Greater Dublin Area, in particular the Metropolitan Area and areas of high public transport accessibility
61

GREATER DUBLIN TRAVEL DEMAND MANAGEMENT STUDY
62
Glossary Dynamic Cluster: A c eptonc
rou contained in the GDA Regional Planning Guidelines which can
f mutually dependent urban centres and associated be summarised as a g ping osett efine the Rcomplementary functions. Urban Centre: For the purpose core com cial area of a or tow Area. An Urban Centre will have a range of services, which ional and other uses depending on its scale and function Retail Centre Hierarchy: Retail centres as defined in the GDA Retail Planning Strategy (November 2001) hierarchy of Reta
1. Dublin City Centre a r
4. Metropolitan Area: Neighbourhood Centres. Hinterland Area: Local Retail Centres. 5. Metropolitan Area: Corner Shops. Hinterland Area: Rural Villages/Shops
lack of provision of sufficient public transport capacity and transfer time.
lements (as d d by PGs Section 7.6) within the Greater Dublin Area, with
s of this report an Urban Centre is defined as themer city n or village in the Greater Dublin
may include retail, employment, institut.
il Centres (Figure 5.1 and Table 5.2):
2. Metropolit n Area: Majo Town Centre. Hinterland Area: County Retail Centre 3. Metropolitan Area: Town and/or District Centres. Hinterland Area: Sub-County Retail Centres
Transport Development Area: Defined by the UK RICS (Royal Institute of Chartered Surveyors) as ‘An integrated land/use planning approach operating around urban public transport interchanges or nodal points well served by public transport in which a more specific relationship between development density and public transport service level is instituted.’ Public Transport Accessibility: Measure of ease of access to a defined destination (e.g. Urban Centre) based on the (existing or future) population within a defined public transport journey time. The measure takes account of walk time, wait time including boarding delays that may occur due to

GREATER DUBLIN TRAVEL DEMAND MANAGEMENT STUDY
7 Measures to Promote Travel Demand Management
troduction
lace has
dependency;
• Establishing databases to assist ridesharing;
but a longer day;
In 7.1. The application of incentives, marketing initiatives or other “soft” measures to promote travel demand management have been considered in terms of their potential to reduce car use for journeys to work and to education. They focus on the workplace, schools, ICT applications and the possible role of marketing.
Workplace Travel Plans 7.2. The rationale behind the focus on the commuter trip and the workpalready been outlined in Section 3 of this report. In brief, for every car trip to school, there are four car trips to work24, so it makes sense to tackle this demand as a priority.
7.3. Potential components25 of workplace travel plans, or Mobility Management Plans26, may include:
• Working with employees to address perceptions, fears and practical difficulties in overcoming car
• Developing car pooling schemes;
• Providing shuttle services to nearby rail or bus services;
• Putting in place on-site27 measures to make cycling and walking safer and more attractive, e.g. footpaths, cycle lanes, crossings, secure cycle parking;
• Providing incentives to use non-car modes;
• Introducing staggered or flexible working hours so that employees can avoid travel in the peak hour;
• Allowing compressed working weeks so that employees work a four day week, or nine day fortnight,
• Promotion of working at home, teleworking or working at another site to employers and assistance or technical support with implementation;
24 CSO, Census 2002, Volume 9, Travel to Work, School and College. Some of these are linked trips which include a
school drop-off. 25 More details of component measures are provided in Appendices F, G, and H and in the Interim Report (May2003) 26 The t27
erm Mobility Management Plan can be used generically to cover any situation e.g. office, shopping centre, school Outside the site, it will be the responsibility of the local authority to provide these facilities, possibly funded through
developer contributions as part of the Planning and Development Act Section 48/49 Developer Levy Scheme.
63

GREATER DUBLIN TRAVEL DEMAND MANAGEMENT STUDY
• Reducing the amount car travel undertaken for work purposes by increasing the use of telecommunications;
• Introducing travel allowances and reimbursements that encourage non-car travel as a replacement for the current arrangements in some organisations which act as a financial incentive to unnecessary use of cars for commuting and business trips; and
• Restricting parking, e.g. giving priority for parking to car sharers or individuals with certain needs - many successful travel plans are driven by a shortage of on-site parking.
7.4. In the longer term, employers’ recruitment policies can also be included in the workplace travel plan. For example, employers can target employment in local areas, particularly those served by public transport. A local workforce helps reduce overall commuting distances and is more likely to generate sustainable travel to work patterns. Employees can also be recruited with the understanding that free
A workplace travel plan is, in effect, a site-specific (or multi-site in the case of
parking is not provided. Additionally, relocation policies can be incorporated in the long term workplace travel plan so that any relocation of the workplace is to a site that is accessible by non-car modes.
7.5. some employers) demand management plan to which the packaging principles apply. Workplace travel plans can also cover more than one employer, for example, at the East Point Business Park, one plan serves all the employers located within the park.
Impact of Workplace Travel Plans 7.6. Research in the UK28 has explored the potential impact of workplace travel plans on a national basis by considering firstly the individual impact of plans and secondly the rate of adoption of plans by companies.
7.7. In terms of the impact of individual plans, international experience shows that about a 15% reduction in car travel is achievable with a comprehensive plan, as shown in Table 7.1 which summarises the review of experience with workplace travel plans in the UK, the Netherlands and the US where plans have been operating for longer.
28 “Less Traffic where People Live: How local transport schemes can help cut traffic”, Lynn Sloman, Transport for Quality
of Life, April 2003
64

GREATER DUBLIN TRAVEL DEMAND MANAGEMENT STUDY
Table 7.1 Effectiveness of Workplace Travel Plans Country No of. Results
Travel Plans Reviewed
UK 20 Reduced the number of commuter cars by more than 14 per 100 staff
Netherlands 40 Basic plans (e.g. car-sharing schemes): 6-8% reduction in vehicle-km Extensive plans (e.g. with measures such as works buses or parking restrictions): 15-20% reduction in vehicle-km
US 49 Average car trip reduction: 15%. Average car trip reduction from plans that:
• provided only information: no effect • supplied alternatives to the car: 8.5% • included a financial incentive: 16.4 % • provided financial incentives and alternative services:
24.5%. US and Netherlands
20 paired case studies
US: vehicle trip reduction rates: 6.4% - 49.4%, average of 19% NL: reductions in vehicle-km: 6% - 32%, average 19%.
Source: Sloman (2003), based on literature review undertaken for UK Department of Transport (Transport 2000, ESRC Transport Studies Unit and Adrian Davis Associates, 2002)
7.8. There has been a high rate of implementation of travel plans in the UK ocal authorities and 62% of
travel plan in place or to be actively developing a
me 21% of businesses with
amongst public sector companies. Some 69% of lhospitals were reported to have aplan, as shown in Table 7.2. By contrast, only 7% of private sector businesses had a plan or were developing one. Size of company has a great influence on interest in travel plans and it is notable that local authorities and hospitals frequently have thousands of employees. Within the private sector, somore than 300 employees were reported to have a plan, compared with 2% to 4% of smaller companies.
Table 7.2 UK Employers with a Travel Plan, 2001 Type of Employer Have a travel plan
or are developing a plan
Have considered a plan but have taken no action, or are
thinking about a plan
Not considering a travel plan
Local authorities 69% 22% 8% Private Businesses 7% 4% 89% Hospitals 62% 22% 16% Third Level Education
52% 10% 38%
In addition to these employers, more than 1000 buildings occupied by government departments, executive agencies and regional government offices have drawn up travel plans Source: Sloman (2003) based on research for DTLR (Steer Davies Gleave, 2001) drawing on responses from 293
cal authorities, 554 businesses, 45 hospitals and 29 colleges of higher education. Percentages may not total 100% ue to rounding.
idence to forecast that, by the year 2010, workplace travel
ambitious scenario where 30% of private sector companies were persuaded to
lod
7.9. Sloman used this evplans might cover around 15% of the workforce in England and that these workplace travel plans would cut single occupancy car trips to work by an average of 14 per 100 staff. To deliver this scenario, a determined effort to roll-out current best practice would be required, facilitated by additional local authority travel plan co-ordinators, with continued government support. Sloman also outlined a more
65

GREATER DUBLIN TRAVEL DEMAND MANAGEMENT STUDY
introduce travel plans by 2010 – possibly due to incentives (support from local authorities or fiscal incentives), regulatory change, or the introduction of a workplace parking levy.
Application in the GDA 7.10. The concept of workplace travel plans, or Mobility Management Plans
een in existence in the GDA for some time, and many plans have been
are interested in developing travel plans, typically driven by a shortage of on-site parking supply or local traffic ge have fallen sho as meant that littl the implementation of many of these plans.
7.11. In su ma workplace trcan be expectedeliver plans, by 2010 would also apply in the GDA by 2016. In the shorter term, to 2008, a modest
he perception that workplace travel plans, or mobility anagement plans (MMP), apply to the private sector only. In the UK, as shown
place travel plans are far more common in the public sector than the r, and within the private sector workplace travel plans are found mainly
hin each local authority, for its iple objectives. Firstly, it would reduce
avel demand and therefore reduce congestion locally, as each authority is a major rea. Secondly, it would set an example to other employers in
(MMPs), has bdevised in support of planning applications. A few successful plans are well known, notably the Eastpoint Business Park plan. Other major employers
congestion issues. Some plans that were devised at the planning start of expectation. In general, however, lack of formal monitoring he is known about
m ary, the current proportion of workers in the GDA that is covered by avel plan is negligible and there are no signs that significant growth d in the short term. In the longer term, with co-ordinated efforts to
it may be that Sloman’s forecast of 15% coverage of workers in the UK
increase of up to 5% would be a potential target. It could be expected that each workplace travel plan would reduce the number of car trips to that workplace by 15%, in line with international experience.
Workplace Travel Plans within the Public Sector 7.12. A fresh impetus is needed if successful workplace travel plans are to be implemented more widely throughout the GDA. An important step in this direction would be overcoming tmabove, workprivate sectoin the larger companies. In the GDA, no public sector bodies have a plan at present, although it is noted that the City Council already have taken measures to encourage cycling and teleworking and that Dun Laoghaire Rathdown Council provides bicycles for staff to borrow for business trips.
7.13. It is recommended that plans be established witown workforce. This would achieve multtremployer in its own aits area and provide more leverage in negotiating plans with employers and developers. Finally, it would develop in-house experience in the implementation of workplace travel plans in order to provide practical guidance to employers in the area.
66

GREATER DUBLIN TRAVEL DEMAND MANAGEMENT STUDY
7.14. An efficient and practical approach may be for one authority to develop an initial travel plan. This could be used as a blueprint for others. Based on that experience, practical guidelines could be set out to complement the DTO guide29. Nominated travel plan co-ordinators in other local authorities could then be trained.
here would be several advantages in Dublin City Council acting as the lead local er and consequently could have the biggest
oices in the City Council area are more extensive, so a
e in ccessible locations in both Dun Laoghaire and Dundrum.
’s local elections, each local authority will need to prepare before the end of the 2004. This represents an opportunity
loyers would also need workplace tr vdirectly invoDepartment of Transport and the DTO. The Department of the Environment would be another arecommendedbodies that em IÉ Group companies, Tdependent becmore important for these groups, albeit challenging to prepare.
lace parking levy and congestion charging measures. When the other
.18. In many public sector organisations, the existing arrangements for car allowances and/or car mileage rates are such that it is financially rewarding to choose the car over other modes. It is recommended that these arrangements be
Tauthority. Firstly, it is the biggest employimpact. Secondly, travel chplan may be easiest to establish there and, finally, the commercial advantages in relinquishing parking supply may be greater in the city council area. Alternatively, another, smaller, local authority could be selected to lead the way, and other advantages can be identified. For example, South Dublin Co. Co. has already started to develop a plan, in response to the opening of Luas at its headquarters in Tallaght. Fingal Co. Co. could link its plan to the on-going relocation of staff. Dun Laoghaire Rathdown Co. Co. could establish a plan relatively easily as the offices ara
7.15. Following this year Corporate Strategy Plana
to develop travel awareness and to commit to the introduction of a workplace travel plan.
7.16. For consistency and to show leadership, other public sector empto establish workplace travel plans. As a blueprint for wider action,
a el plans could be developed for the workforces in the agencies most lved in promoting sustainable transport choices, notably the
c ndidate agency for early adoption of a travel plan. It is also that a blueprint travel plan be established in one of the public sector ploy a large proportion of shift-workers, e.g. one of the C
R É, the Gardaí or a hospital. Shift workers are typically more car ause they have less travel choice and consequently a travel plan is
7.17. Once the lead authority has an operational travel plan, travel plans would be instigated in the other authorities, and the lead authority would begin a campaign of encouraging employers to put in place travel plans in advance of the potential workpauthorities have their plans up and running, they should begin similar campaigns with local employers groups.
Car Allowances and Mileage Allowances 7
29 “The Route to Sustainable Commuting”: An Employers Guide to Mobility Management Plans, DTO, 2001
67

GREATER DUBLIN TRAVEL DEMAND MANAGEMENT STUDY
amended in favour of a mode-neutral travel allowance that allows employees to
nt of these changes should not be
ful. Research undertaken in the UK30 has oncluded that all employers, whatever their starting point, can achieve reductions
7.22. emplo eased pressure on levies and/or cong ocal authorities out to employers to offer assistance in developing plans, and this could be best achieved through Chambers of Commerce, IBEC and other business groups, stressing the benefits of a ha
7.23. Research in the UK found that the adoption of travel plans amongst private
a
choose the most efficient means of travel for their work, without financial penalty.
7.19. Changes to the car allowance system should be incorporated in the workplace travel plan development. Complete achievemeseen as a necessary condition for a workplace travel plan because any robust plan should be capable of implementation in manageable stages.
Dynamic Process 7.20. All workplace travel plans, across all sectors, should be continuously evolving and improving in response to changing opportunities, changing traffic conditions, changing transport supply and in response to on-going monitoring of the plan. Travel plan coordinators should consider adding measures to the plan over time, or removing measures that are not successcin staff car use.
The Role of the Private Sector 7.21. Local authorities would continue to work with developers/employers to ensure that workplace travel plans are established as part of the planning process. Increased resourcing and experience should ensure improved enforcement and monitoring of plans once developments are operational.
Increased demand for workplace travel plans from existing private sector yers would be expected in response to travel awareness campaigns, incr
parking and road capacity, and proposals for workplace parkingestion charging. L would need to reach
ppier, healthier workforce.
sector businesses is low overall, but that bigger companies are much more likely to have a travel plan, or to be developing one (31% of companies with over 300 employees as opposed to 2% of companies with less than 50 employees).
Third Party Agreements 7.24. It was reported during the consultation for this study that mobility management plans that had been negotiated between the developer/employer and the local authority as a planning condition had, in some cases, failed to materialise because the public transport had not been delivered. This situation represents
30 Sloman (2003), based on UK Department for Transport research (2002)
68
GREATER DUBLIN TRAVEL DEMAND MANAGEMENT STUDY
fundamental misunderstanding of the MMP, which is a contract/planning condition between the developer and the local authority and which is not enforceable if it involves a third party. If, for example, the agreed travel plan includes a shuttle bus from a local railway station to the site, the planning condition should require the employer/developer to provide a licensed bus service, at an agreed frequency, for an agreed length of time.
Resourcing
7.25. The introduction of effective workplace travel plans throughout the GDA would be a major effor reso
• Workplace travel plan co-ordinators in each local authority and nd monitor the internal
travel plans; and
ithin each local authority or,
ugh the Environment Fund.
Section 10 o h
Timescale 7.28. Althouggoing process, ing the resources, all the main public sector organisations in the GDA could have a workplace travel plan in operatio tinvolved in thexpertise to as
Traffic Engineering 7.29. In numerous locations throughout the GDA, employees cannot be expected to seriously consider walking or cycling to work until it becomes a safer, more attractive alternative. Retrofitting the road network to provide footpaths, pedestrian crossings, safe junction arrangements, etc. requires a great deal of traffic engineering
t, requiring urces which would include:
Government Department to co-ordinate a
• Workplace travel plan units walternatively, in a central agency such as the DTO, that work with developers and employers, advising on how to establish a plan, co-ordinating efforts throughout the area, and monitoring travel plans post implementation
7.26. At least one travel plan coordinator would be required within each local authority. More should be considered in the City Council and Dublin Counties. The Government could offer bursaries to local authorities for travel plan co-ordinators. This could function in a similar way to the financing of local environmental enforcement staff that are part funded by the Department of Environment Heritage and Local Government thro
7.27. The costs of resourcing the workplace travel plan initiative have been taken into account in the overall economic and financial appraisal and are set out in
f t is report.
h the implementation of workplace travel plans would be an on- it is envisaged that within three years of obtain
n. I is also envisaged that the private sector, through IBEC, etc., would be e initiative and that the local authorities would have the resources and sist the private sector in creating plans.
69

GREATER DUBLIN TRAVEL DEMAND MANAGEMENT STUDY
effort, the time and cost of which is typically underestimated. Guidance on how to h work is available in the DTO’s Traffic Management Guidelines Manual
lans may include some or all of the following measures:
• Working with teachers, pupils and families to address perceptions, fears and practical difficulties in overcoming reliance on the car and
.32. Adjusting school hours to avoid commuter travel periods is another potential any families have
ts involving siblings in other schools as well as parents at ork.
approach suc(May 2003), and local authorities should aim to be improving the environment for pedestrians and cyclists as part of their overall work programme.
Risks to Implementation 7.30. Based on experience to date, there is a risk that adoption of workplace travel plans would be slow unless pro-actively encouraged. There is also the risk of underestimating the level of detail required, and consequently underestimating the resources needed. The introduction of workplace parking levies or other fiscal measures could reduce the risk of slow implementation. Additionally, in the longer term, the reduced workplace parking supply that will arise from the proposed changes to parking standards will generate demand for workplace travel plans.
School Travel Plans 7.31. School travel plans are school based implementation plans designed to overcome the barriers for pupils to walk, cycle or take public transport to school. School travel p
agreeing a school policy to actively promote sustainable school travel;
• A toolkit of practical measures including walking, cycling, training, encouraging bus use, car sharing, incentive schemes, curriculum based promotion and managing parking and drop off; and
• Putting in place infrastructure to support the school travel plan and make the route to school safer to walk or cycle and creating a pupil centred front of school environment
7measure that may be worth consideration while noting that mcomplex travel arrangemenw
7.33. The basic aim of school travel plans is to arrest the rapid growth in travel to school by car. Census 2002 reports that, in the GDA, the numbers of primary school children being driven to school has increased from 32% in 1997 to 50% in 2002 and from 15% to 30% for secondary school children. Paragraph 2.7 of this report discusses some of the other trends in travel to school.
70

GREATER DUBLIN TRAVEL DEMAND MANAGEMENT STUDY
Impact of School Travel Plans 7.34. As with workplace travel plans, the potential impact of school travel plans on a regional basis can be assessed by examining the impact of individual plans and the rate of adoption of plans throughout the region.
7.35. In the UK, the first pilot school travel plans (Safe Routes to Schools) were introduced in 1995. Recent research31 reported that 4% of primary schools, 4% of middle schools and 5.5% of secondary schools in the UK had implemented a school travel plan by 2001, and that a comparable proportion had a school travel plan “firmly planned.” The best school travel plans have shown substantial shifts in the number of journeys to school being made by car, but this is not always the case. Some schools do not have “before” data so the impact of their plans has not been measured. Nevertheless, the average car trip reduction in the UK is around 20% which relates to plans that concentrated on walking and cycling as this was the focus of the early projects.
e UK xperience, but obviously only represent a sample of two.
Progress to Date in the GDA 7.36. The pilot Safe Routes to Schools Initiative, led by the DTO, started in 2000. Later this year (2004), the first report of the outcome of five pilot projects is expected, along with guidelines on implementation. Early results from the pilot in the Bray area suggested a 4% reduction in travel to school by car. More recent results, as shown in Table 7.3 and reported by the DTO, show a 22% reduction in car trips at Donabate SRTS pilot and 15% at the Bray pilot. These results are in line with the
Table 7.3 Results of Pilot Safe Routes to Schools Schemes in the GDA Results of Pilot Safe Routes to Schools Schemes in the GDA
Donabate Bray 22% reduction in car use 11% increase in walking 8% increase in bus use
15% reduction in car use 4% increase in cycling.
1% increase in cycling Source: DTO
7.37. Follo i lot Safe Routes oprogramme, with a five-year plan to introduce school travel plans throughout the GDA and appropriate funding.
7.38. As Ta lall secondary school trips, are less than th
under Department of Health and Children and Department of Education policies.
w ng the publication of the forthcoming report on the results of the pi t Schools schemes, it would be sensible to consider a coordinated
b e 7.4 shows, the majority of primary school trips, and around half of ree miles and therefore within walking or
cycling distance for many pupils. In view of growing concerns regarding childhood obesity, the health potential for these trips to be undertaken by foot or by bicycle should be recognised. This could accelerate the introduction of school travel plans
31 Sloman, 2003 based on research for the DTLR (by TRL, 2001)
71

GREATER DUBLIN TRAVEL DEMAND MANAGEMENT STUDY
7.39. It is important that future school travel plans address public transport and ride-sharing, in addition to measures to make it safer to walk or cycle to school. The
test research in the UK32 found that improvements to public transport offer great traffic because most car mileage is on trips too long to be walked
ly in the
lapotential to reduceor cycled. The data shown in Table 7.4 suggest that the same would appGDA where a substantial proportion of primary school children and about half of all secondary school children travel 3 miles or more to school. This data is in line with market research undertaken for this study which reported that 31% of people surveyed would not walk or cycle to school (or work) because the distance was too long.
Table 7.4 Distance travelled to school County Children between 5 and 12 years Students between 13 and 18 years
Total trips Trips of 3 miles and over Total trips Trips of 3 miles and overDublin Co. and City 111,077 38,791 35% 79,705 37,118 47%Kildare 055 36% 13,611 7,276 53%MeathWicklow
19,786 7, 16,313 6,762 41% 11,716 7,990 68%13,563 5,291 39% 9,575 5,841 61%
Source: s
Local Issues and Wider Multi-Agency Interest 7.40. It is not envisaged that school travel plans would be iThere are tschools in somis different in ment and
ent of Education – responsible for all schools, all issues
of Environment and Local Government/local authorities – undertaking the physical work “outside the school gate” such as footpaths, pedestrian crossings, cycle routes; and
Cen us 2002, Volume 9, Travel to Work, School and College
mposed upon a school. oo many sensitive issues ranging from children’s security to the lack of
e new housing areas. Take up would remain voluntary. Each school terms of its pupils, staff and parents, as well as in its catch
access arrangements. Attitudes towards car restraint will vary greatly between schools, and will not necessarily relate to traffic issues at the school. Nevertheless, a clear mandate from the Department of Education to the school principals may help in getting more school travel plans off the ground. There may also be opportunities to put school travel plans more firmly on the agenda through the City/County Development Boards.
7.41. A cross-department working group may also assist the implementation process, as several government departments have an interest in school travel plans:
• The Department of Health and Children – with the objective of improving children’s heath and fitness, and tackling the problem of obesity in children;
• The Departm“inside the school gate” and also for procurement of school bus services which operate outside the urban areas;
• The Department
32 Sloman (2003) based on Jones and Bradshaw (2000)
72

GREATER DUBLIN TRAVEL DEMAND MANAGEMENT STUDY
• Department of Transport/DTO – responsible for objectives to reduce travel demand and improve road safety
Resourcing 7.42. The school travel plans could draw upon some of the €12.7 million which was allocated to the Safe Routes to Schools programme in the National Development
DTO, or each local authority could have a school
work within the local authorities, which will require dedicated school travel plan
i
ement by funding measures inside the
creased activity in all agencies concerned would see a far greater number f plans in operation. Where cross-departmental agreement is achieved and both nancial and personnel resources are dedicated to a school travelplan programme it
ductive as the awareness spreads to schools/parents and
Individua 7.46. Individu to people, based on an understanding of their personal trip patterns. This involves one-to-one interviews. rand which enapproach is ereasonable alternative (public transport, walking or cycling) already exists, of which they are unaware.
Plan.
7.43. Increased implementation effort will require more skills and experience, which would involve recruitment and training. The expertise could be held in a central organisation such as thetravel plan coordinator. Either approach has its benefits and the reports on the pilot schemes that are due later this year should inform the decision as to how best to organise resources in future. The result should be an intensive programme of
coord nators and increased funding for small-scale street and junction improvements to support the school travel plan. The Department of Education could support initiatives to raise school involvschool such as cycle parking.
7.44. The costs of resourcing the school travel plan initiative have been taken into account in the overall economic and financial appraisal and are set out in Section 10 if this report.
Timescale 7.45. As with workplace travel plans, it is expected that three to four years of greatly inofishould become more proexpertise in LA’s and other agencies develops. In that context, the DTO’s aspiration is that the number of school travel plans should increase to 10 in 2005, 20 in 2006, 50 in 2007 and 80 in 2008.
l Marketing
al marketing provides transport advice and information
T avel information is then offered which has been individually tailored courages modal shift away from the car. The individual marketing ffective because many people make journeys by car for which a
73

GREATER DUBLIN TRAVEL DEMAND MANAGEMENT STUDY
Impact and A7.47. Individu , Austria, Sweden, A rthe name Travplace in a subuhouseholds. The programme found that, although 80% of trips were made by car, adequate public transport alternatives existhat were epersonalised ptickets and inreported a 14%reduction in llowing the success of the project, the governmenindividual mato cover half oestimated at A r person approached. If applied in Dublin, wh€22 per per n
7.48. Individupeople, but it hcar travel withof the behavioto be for tripscheme was already had comprehensive
the expansi
7.50. Costs oorder:
•
•
pplication al marketing techniques have been applied in Germany
ust alia and the UK. Similar techniques have also been employed under el Blending. The largest individual marketing programme to date took rb of Perth, Western Australia and involved contact with some 15,000
ted for half of those trips. Households int rested in using environmentally friendly modes were issued with
ackages of information including timetables, free public transport test formation about walking and cycling. Before and after surveys reduction in car driver trips as a result of the project, and a 17%
vehicle kilometres. Fot of Western Australia is planning a larger, city-wide programme of
rketing. Over 10 years, the TravelSmart programme will be expanded f the 1.3 million people who live in Perth. The cost over 10 years is $29 million or A$22 (€13) pe
ich is a higher cost location than Perth, the cost could be in the region of so .
al marketing is costly as it requires detailed one-to-one working with as been estimated that, in the UK, it could produce a 5% reduction in
in an entire urban area if it were focussed on that area33. Around 70% ur change associated with individual marketing schemes is estimated s to shops, leisure facilities and other services. Consequently, if a implemented in an urban area that
workplace travel plans it would be expected to produce a 3.5% reduction in overall travel (i.e. 70% of 5%), much of which would take place outside the peak hour.
Application in the GDA 7.49. An individual marketing programme has never been considered in the GDA, but it may be worthwhile, particularly as public transport, pedestrian facilities and the cycle network have improved markedly in recent years and will continue to do so with the introduction of Luas, the DART upgrade, the Quality Bus Network and
on of the regional cycle network.
f individual marketing schemes in the GDA may be of the following
Entire GDA (assuming 50% of all residents contacted): €17 million;
All Dublin City and County (assuming 50% of all residents contacted) €12.4 million; and
• Dublin City workforce (assuming 50% of all workers in the city council area contacted): €2.4 million
33 “Less Traffic Where People Live: How local transport schemes can help cut traffic, Lynn Sloman”, 2003
74

GREATER DUBLIN TRAVEL DEMAND MANAGEMENT STUDY
7.51. It wouldarea, as in Per a large-scale programme. The pilot should be in a residenCentre emp ywere to be imp
Information ations 7.52. Rathcommunicatioaspirations forto as “virtual without being
7.53. Informa he ability to reduce ork-related travel through the following e-work applications, most of which could
• Home-based work;
but eliminating travel through practice such as online collaboration,
con onitoring, etc
worki ch practices, on the principle that work is uctive, cost effective and
work e all of these by some tors, but is p arily to the first three
categories. “Telecomm n the same as teleworking, take ourneys
ing fr a telecentre/local ffice, etc). The latter three categories of e-work listed above will largely have an
embrace e-work practices.
7.56. E-commerce and e-services could affect non-work travel and travel undertaken in the course of work and consequently would be expected to have little effect on the morning peak hour.
be advisable to start with a pilot individual marketing project in one th, before embarking on
tial area, although there may also be merit in a project focussing on City lo ees in the run up to a congestion charging scheme, if such a measure
lemented (see Section 8).
and Communications Technology Applicer than changing the mode by which people travel, information and
ns technology can be used to alter the ways in which people fulfil their mobility and access to work, services and shopping. This is referred mobility”, a term that focuses on how activities can be undertaken dependent on physical mobility.
tion and communications technology (ICT) has twbe addressed through workplace travel plans:
• Local office, e.g. telecentre, satellite office, local touch-down centre;
• Mobile working – on public transport, from vehicles, at hotels, airports, cafes, etc.;
• Working from client site; and
• Office-based e-work, i.e. not changing normal workplace
video ferencing, remote diagnostics and m
7.54. A fully e- ng organisation will use a range of suundertaken where it is most prod
satisfying. “Telecommenta
ing” is a word used to describopularly understood as applying primuting” is sometimes used to mea
but generally it iswholly (by work
n to mean those practices that eliminatefrom
commute jom home) or in part (by working
oimpact on business travel.
7.55. Organisations usually introduce e-work for reasons such as enabling workers to become more productive, reducing property cost and promoting better work-life balance. Transport reasons are unlikely to be the main reason for an organisation to
75

GREATER DUBLIN TRAVEL DEMAND MANAGEMENT STUDY
Experience and Application 7.57. The Eurobarometer34 survey reported that, in 2000, 2.4% of the adult
orkforce in Ireland was teleworking regularly and 6.1% was teleworking occasio rking and 6.6% fIr economy, the same survey found that 17.3% of the workforce were regular teleworkers.
7.58. 35 recently reported that the pro the wr times work m bli Cou4.5% in the hinterland counties. This com ith tion throughout Ireland as a whole.
7.59. An indicator of the potential rate of growth in teleworking is provided by the UK Labourforce Survey which showed that 7.4% of the workforce in 2001 were regulart nting a 13% u lew e 1997
7 racti t- ple n averdays per week away from the normal workplace, and this appears to be consistent across case studies in the UK, US and Europe.
7.61. Research indicates that, on balance, teleworking does reduce car usage a however, the ate ten eT r exam el ostwith the most difficult trips to work. Often these are by public transport, not by car. T her members of households, y use the o make ot journeys during the day (for example, to schools, shops or sports centres) which may not have been made before, or were previously made as part of a linked trip to work.
• E-work pilots and programmes, promoting e-work amongst local organisations, including public sector organisations, with the
wnally. This compared with a European average of 5% for regular telewo
or occasional teleworkers. In Denmark, a country of similar population to eland which places a similar emphasis on developing a high-tech workforce and
In Ireland, the CSOegularly or some
portion of n City and
orkforce nties and ing at ho e as 4% in Du
pared w a propor of 3.5%
. eleworkers, represe per ann m growth in te orking sinc
.60. Most teleworking p ce is par time with peo working o age 1.5
mongst teleworkers; deb about the po tial role of t leworking in DM is quite complex. Fo ple, t eworking is m attractive to individuals
eleworkers, or ot the ma car t her
However, many of these new trips are likely to be local in nature and therefore shorter.
Application in the GDA 7.62. The following possible measures are recommended to promote virtual mobility as an alternative to physical mobility. All of the measures require working in partnership with other agencies and would not be promoted purely as travel demand management measures.
• Awareness campaigns both for organisations and for the wider public about the possibilities for reducing travel through virtual mobility, led by the DTO and the Information Society Commission;
34 Summarised in eWork 2002 – Status Report on New Ways to Work in the Knowledge Economy, published by the
European Commission 35 CSO Quarterly National Household Survey, Q3, 2002
76

GREATER DUBLIN TRAVEL DEMAND MANAGEMENT STUDY
development of flagship pilots and programmes led by the Information Society Commission with reference to the existing e-government initiative by the
• Telework centres - d
Department of the Taoiseach;
eveloping “telework centres” as have been in
ry amongst suring that other demand
urage them. This initiative s IBEC and the
– g,
government initiative; and/or
h nies,
e s favoured
itiative,
ties of er d
nd e-benefits.
are, however, several factors critical for the success of the
• The success of the awareness-raising programme: while to some nt e-work, e-commerce and e-services are developing anyway, the
re is an ese
these phenomena are developed in ways that maximise the potential to eliminate habitual but
in
developed in and around some US cities. Local authorities conjunction with Enterprise Ireland would be best suited to promotetelework centres;
• E-commerce - promoting online shopping/home delivelocal firms and consumers, and enmanagement measures do not discoshould be promoted by private sector agencies such aChambers of Commerce;
• E-services – continuing to promote the use of online services government and local authority services, online learnintelemedicine, etc. – through the Department of the Taoiseach’s e-
• Development of “wired-up communities” - in collaboration witother stakeholders (public agencies, telecommunications compaetc.) promoting “wired up communities” projects, to help overcomthe digital divide, promote local work opportunities in lesareas away from the urban centre, and encourage use of online services. In this measure, there is a strong overlap with land-use planning proposals, and the local authorities would take the inin conjunction with Enterprise Ireland
7.63. The virtual mobility measures are largely dependent on the activiorganisations outside the transport sector. It follows that the DTO and othdemand management stakeholders will need to encourage, advise, liaise anmonitor these activities. Organisations developing e-work, e-commerce aservices are likely to be doing so primarily in pursuit of non-transport Movements in these directions are likely to happen over time with or withoutintervention. Theremeasures set out the previous section of this report:
exteawareness programme is critical in two respects. Firstly, theidentified need to accelerate the rate of development of thphenomena. Secondly, it is vital that
unnecessary travel movements. This would be a task for the DTOconjunction with the Information Society Commission.
• Effective inter-agency and partnership working: the measures put forward cut across the traditional roles of a number of publicagencies, and involve working closely with the private sector in
77

GREATER DUBLIN TRAVEL DEMAND MANAGEMENT STUDY
sometimes unfamiliar areas. This would also require effecleadership from the Regional Authorities and the City and CounDevelopment Boards.
• Buy-in from employers: enthusiastic support from both private apublic sector employers in developing innovative solutions and cooperating with monitoring processes would be key to success. A
tive ty
nd
high-level mandate from government sector employers to move fast
ions ficant
ions
for the morning peak hour (8am – 9am) in the year 2008 using the DTO model. ll the measures included and their rate of take-up were considered practical and
achievable by that year. The assumptions associated with the application of each ble 7.5.
on e-work solutions would be particularly helpful.
• Acceleration of broadband roll-out: high-speed telecommunicatcosts and access to broadband connection remains a signiobstacle on all fronts. Working with the telecommunicatcompanies and gaining their support for these measures would bevery important. This would be led by the Department of Communications, Marine and Natural Resources
Transport Impact of a Combination of Measures that Promote TDM 7.64. A combination of measures that promote travel demand management were testedA
measure are given in Ta
Table 7.5 Example Combination of Measures to Promote TDM by 2008
Measure Assumptions Workplace travel plans 14%36 reduction in car use with each plan
5%37 of workers in the GDA covered by a plan School travel plans 20%38 reduction in car use with each plan
2%39 of school-goers covered by a plan Teleworking/ working from home
Increase in the proportion of teleworkers: Dublin City and County: from 4%40 to 8.3%41. Hinterland counties: from 4.5% to 9.2% Each teleworker would telework on average 1.5 days per week
Individual marketing programme
Targeted at workers within the City Council area 3.5% reduction in car trips to the City area
7.65. The outcome of the test was compared with the situation in 2008 with travel demand management is indicated in Table 7.6. It can be seen tcombined effect of all the travel plans would be to increase morning peaktravel speeds throughout the GDA. The overall impact would be to remove ove
no hat the
hour r
36 Average reduction in the UK, Sloman 2003 37Increase fro38
m negligible proportion at present Based on recent results of pilot schemes and UK experience
39 About 20 school travel plans fully operational by 2008 40 Current proportion of teleworkers provided in CSO Quarterly National Household survey, Q3, 2002 41 Assuming a 13% per annum increase in teleworking, based on UK experience 1997-2002 (UK Labour Force Survey)
78

GREATER DUBLIN TRAVEL DEMAND MANAGEMENT STUDY
100,000 veh eis both import
Tabl .
icl -km from the GDA road network between 8am and 9am alone, which ant and significant if the measures can be achieved.
e 7 6. Transport Impact of a Combination of Measures to Support TDM
Comparison with the base situation in 2008 of a combination of measures to promote TDM
All GDA Inside canals
Between canals and
M50 Outside M50
Vehicle-km in base
6,553,167 179,437 1,151,621 5,222,1
09
Vehicle-km with measures 6,451,400 175,464 1,131,508 5,144,428
% reduction in vehicle-km 2% 2% 2% 1%
Vehicle hours in base 248091 17,607 64,281
166,203
Vehicle hours with measures
239,713 16,988 61,855 160,87
0
% reduction in vehicle-hours 3% 4% 4% 3%
Average speed in base
26.4 10.2 17.9 31.4
Average speed with measures
26.9 10.3 18.9 32.0
% increase in speed 2% 1% 6% 2%
7.66. Taken alone, these measures to promote TDM do have the effect of reducintravel demand, although without car restraint measures, for example road ucharging, the benefits of the “soft” measures are liable to be eroded by induced traffic i.e. removing some trips from the netwo
g ser
rk will result in faster journey times blic aps and
which may encourage others to drive who may have previously used putransport or another mode, driven at another time or on another route, or perhnot travelled at all. Implemented in tandem with fiscal car restraint measures, with complementary traffic management measures and measures to assist non-car modes, measures to promote travel demand management become powerful. With the introduction of other measures, people will need travel plans to assist them in changing travel habits. On the other hand, without restrictions on car use, the incentive to adopt travel plans is lessened and actual take-up and consequent changein behaviour may be less significant.
79
GREATER DUBLIN TRAVEL DEMAND MANAGEMENT STUDY
8 Fiscal Measures to Manage Travel Demand
Fiscal Measures Considered 8.1. The potential impac
t of three distinct categories of fiscal measure capable of :
he
ongestion, environmental damage and accidents. Therefore ansport system efficiency would be improved by aligning charges more closely ith these costs.
port were also considered in the form of a
the indicated that this measure would increase public transport boarding
short to medium term (by the year 2008). In the m, fiscal demand management should still be considered to complement
e major infrastructure improvements planned for the year 2016 in the DTO’s ge. By then, there may be more proven methods ministration and enforcement of fiscal measures such as
Increased Taxes .5. Increased car purchase and ownership taxes were rejected as potential
(see Section 3) as these are already relatively high in e focused on the GDA.
n
would impact most strongly on the hinterland where journeys are longer but where
implementation in the GDA in the short to medium term (by 2008) were considered
• Road user charging (road pricing or congestion charging);
• Charges on free workplace parking; and
• Increased taxes associated with driving
8.2. The economic rationale for fiscal measures is that road users, particularly in tpeak periods, are not currently paying the full socio-economic costs associated with their trips including ctrw
8.3. Fiscal incentives to use public transfares rebate for trips that involve the use of more than one public transport service, so that the overall cost of the trip is reduced. Analysis of this scenario using DTO model and would be of particular benefit to those living in the outer parts of the Metropolitan Area and the Hinterland. However, fares policy issues are under moredetailed consideration by the Department of Transport’s Fare Policy Study and, in anycase, adjustments to fares and ticketing are more appropriately described as “Complementary Measures” rather than TDM measures (see Paragraph 9.14).
8.4. The assessment of potential fiscal measures focussed on those that were capable of implementation in thelonger terthstrategy A Platform for Chanavailable for the effective adroad user charging.
8measures early in the studyIreland and they could not b
8.6. It would also be difficult to focus on the GDA in terms of implementing an increase in fuel duty. However, as the cost of fuel is low by European standards, it was considered worthwhile testing the impact of an increase of around 25c per litre which would bring Irish fuel prices in line with the top end of the range of Europeaprices. The result of the test within the DTO model showed that increased fuel duty
80

GREATER DUBLIN TRAVEL DEMAND MANAGEMENT STUDY
public transport options are scarcer more than the metropolitan area and where congestion may not be an issue. For this primary reason, and because the market research and consultation indicated increased fuel duty to be more unpopular than
(fuel) taxes.
8.7. In the UK, the “fuel duty escalator” was fuel pr di more fuel-efficient vehicles. The initial escalator put fuel prices 3% above retail inflation. In late 1993 the escalator increased to 5%, and in 1997 to 6%. It was successful in meeting its aim. The fuel increases applied from 1996 to 1999 were expected to save 1-2.5 million tonnes of carbon a year by 2010. Some £1.6 billion was raised by 1999 due to the fuel tax increase which was to be used to finance roads and public transport. However, the fuel duty escalator became deeply unpopular with the public, culminating in a “motorist’s revolt” in 2000 which led to a national fuel crisis. The fuel duty escalator was then abandoned, although fuel duties are still reviewed at each budget. It is noteworthy that UK fuel prices at the time of the fuel protest were much higher (over 25c per litre higher) than were Irish fuel prices at the time.
Congestion Charging 8.8. The first form of road user charging or “congestion charging” was introduced in Singapore in 1974. It took the form of a paper licence which drivers bought when they wanted to drive in the central area during the morning peak hours. Over time, the scheme gradually became more extensive and more sophisticated, developing into a full Electronic Road Pricing (ERP) system by 1998. ERP now operates for the whole day, but at variable charges. The second development in road user charging came in the early 1990s when the Norwegian cities of Oslo, Bergen and Trondheim introduced a charge to drive into the City Centre. Unlike the Singapore scheme, which had a TDM aim, the Norwegian schemes had the purpose of raising revenue
jects. The next major step in the history of road user charging ame in 2003, when London’s “Congestion Charging” project began operation. This
ed by a small-scale charging scheme in 2002 when the English city of introduced a simple charge to enter the main street. Charging to certain
other fiscal measures42, this potential measure was not taken forward for detailed consideration. However, it is worth noting that, from a TDM perspective, there would be merit in reducing car ownership taxes and transferring them to use-related
introduced in 1993. It aimed to keep ices high to scourage car travel and encourage manufacturers to design
to fund transport procwas precedDurhamareas in Rome was introduced in 2001. Further details of these examples are provided in the Interim Report. Many cities are actively pursuing congestion charging projects at present, notably Stockholm where operation is planned to start in spring 2005, and Edinburgh in 2006.
8.9. City Centre congestion charging is generally considered in terms of two options:
42 70% of those surveyed said that they would prefer a road user charge or parking charges over increased fuel tax
81

GREATER DUBLIN TRAVEL DEMAND MANAGEMENT STUDY
• An area licence scheme, like that in London, where anyone drivinthe char
g in ging zone during the hours of operation must possess a daily
licence; or
• A cordon entry charge where drivers pay to enter a cordon around the City Centre. The charge would be in the inbound direction only and uld , although there
n any given period
8.10. Both of these options were tested for a range of levels of charge. The area l red to be ro ub sf d exa d ar . A drawback of the cordon entry c on would be that it ld ct upon drivers leaving the City Centre or driving wholly within the City Centre. As d 2 (see Table 2 forecast that these drivers will comprise a g and it es t
8.11. The possibility of regional distance-based road user charging throughout the G ered as a pt es a o
8.12. Options to charge for use of the M50 were considered. Very little reduction in car use was forecast at the lower level of charge (€5). At the higher levels (€10 and above), traffic was forecast to divert off the g i vehicle-km within the M50 as traffic would s ut ths not improve the ation and for this reason, charging on the M50 was not further pursued as a travel demand management measure that would be appropriate in the short to m th rmimproved rail services and orbital bus routes providing better travel choice, it may w tion, there m e sound tr managem reasons fintroducing tolls on the M50, if demand exceeds capacity and the M50 is in danger of f ien nn
8 as examined where drivers would be charged to enter the M
he radial trips at originate outside the M50, or the orbital trips that use the M50. Therefore some
rivers would have no choice but to pay (or not make the trip which is not a possible Secondly, it would result in increased
ongestion within the City Centre because trips that formerly used the M50 to move round Dublin would go through the suburbs and City Centre instead, to avoid the
drivers wo be charged each time they enteredcould be a cap on the number of times they have to pay i
There are variations on this option43 .
icence scheme appea thm
e more p mising for D li thia
n and was taken orward for more detaile ination as
harging optiescribed in P graph 8.18 – 8.81 below
not im wou pa
iscussed in Section .5), it isrowing demand by 2008 2016, which would be d irable to res rain.
DA was also consid long term o ion. This is d cribed in P ragraph 8.62f this report.
M50 resultin n ficane
signi t increases ineek other ro s through e city and
uburbs. This would situ
medium ter (to 2008). In e longer te , with
ell be feasible. In addi ay b affic ent or
ailing to operate in an effic t or safe ma er.
.13. An option w 50 area (i.e. a cordon placed just inside the M50). Two main effects were observed. Firstly, the overall impact was small because of the lack of a public transport alternative and/or an uncharged alternative route choice for many of tthdshort term response within the model). ca
3 For example, a two-way cordon where drivers pay in both the inbound and outbound directions resulting in a more
complex system. This is similar to the area licence system, except (i) those driving within the City Centre only do not have to pay, and (ii) those making multiple trips may have to pay more than once, although the total paid in a day could be capped.
4
82

GREATER DUBLIN TRAVEL DEMAND MANAGEMENT STUDY
charge. The result of this would be increased congestion which would delay buses ell as general traffic. In summary, in the short to medium term and Luas as w
ituation, a M50 cordon charge would be less effective than a central area licence sche to
ub c transport (e.g. improved radial bus and rail services), it may well
case of tolls on the M50 or within the M50, if such measures were to be only tolls or tolls that vary by time of
day, would be an option that would offer drivers with no other modes available the choice of making the trip at another time of day.
8.15. In the longer term, increased fuel duty, M50 charges and other measures which impact more upon hinterland drivers might influence individuals to move house, change jobs, change schools or move the location of their business in order to reduce travel costs.
Charges on Free Workplace Parking 8.16. Free workplace parking represents a significant incentive to drive to work. At present, some 75% of employees in the GDA do not pay for their workplace parking44.
8.17. With the introduction of a workplace parking levy, or other forms of tax/levy, this incentive could be removed and a change in behaviour produced. This is a onceptually attractive measure that has some level of public support. Tests showed at it could result in a reduction in car use throughout the GDA (a 5% reduction in
vehicle-km undertaken in the GDA during the morning peak hour (8am-9am)). onsequently it was considered worth taking forward as described in Paragraph .82 – 8.129 later in this section.
addressing the two proposed fiscal measures:
• Congestion Charging;
• Workplace Parking Levy
Congestion Charging 8.19. The proposed congestion charging area is the area within the North Circular Road and the South Circular Road/Grand Canal. It includes most of the area within the canals. It has a well defined boundary and the highest level of public transport provision in the GDA. Dublin City Council’s Outer Orbital Route (see Figure 8.1)
sm
improved pbe worth consideration.
e, even in the wider modelled area. In the longer term, with improvementsli
8.14. In the reconsidered in the longer term, peak period
cth
C8
Structure of this section 8.18. The remainder of this Section of the report is divided into two sub-sections
44 Based on household surveys undertaken for this study and on the DTO’s parking survey for the City Centre
83

GREATER DUBLIN TRAVEL DEMAND MANAGEMENT STUDY
would be outside the zone, providing diversion routes. The proposed Macken Street place by 2008, would also be outside the
zone.
8.20. All vehicles moving in the charging zone during the hours of operation would need to purchase a licence, which would allow unlimited trips during that period.
Figure 8.1 City Council Outer Orbital Route (shown in dark blue)
Bridge, which has been assumed to be in
Source: www.dublincity.ie
our 0. As shown in Table 8.1, the
impact would be greatest within the canals where the reduction in vehicle-km would e 12-20% and the reduction in vehicle-hours 19-30%. Such reductions are very ignificant and would improve conditions for pedestrians and cyclists as well as
the city. T as le-km and vehicle–
Impact 8.21. The impact of the congestion charging option scheme in the morning peak h(8am – 9am) was tested in the DTO model at �5 and €1
bsgreatly increasing speeds and reliability for buses and Luas as well as cars driving inthe charging area. Significant benefits would also occur on the radials approaching
he GDA a whole would enjoy a reduction in vehic
84

GREATER DUBLIN TRAVEL DEMAND MANAGEMENT STUDY
hours and an increase in average speeds, although these effects diminish further from the City Centre.
Table 8.1 Impact of Congestion Charging
in the Morning Peak Hour (8am-9am) in the Year 2008
Comparison with the uation in 2008 base sit
€5 congestion charge All GDA Inside canals
Between canals and
M50 Outside M50Vehicle-km in base 6,553,167 179,437 ,151,62 5,222,1 1 1 09 Vehicle-km with measures 6,518,860 158,120 5,240,31,120,417 23 % change in vehicle-km 1% 12% 3% 0% Vehicle hours in base 248,091 64,2 166 17,607 81 ,203 Vehicle hours with measures 241,038 14,185 166,364 60,488 % change in vehicle-hours 3% 19% 6% 0% Average speed in base 26.4 10.2 17. 3 9 1.4 Average speed with measures 27.0 11.1 18.5 31.5 % change in speed -2% -9% -3% 0%
€10 congestion charge All GDA Inside canals
B te ween canals and
M50 Outside M50Vehicle-km in base 6,553,16 179,4 , 7 37 1 151,621 5,222,109 Vehicle-km with measures 6,501,83 5,243,488 143,490 1,114,868 0 % change in vehicle-km 1% 20% 3% 0% Vehicle hours in base 248,091 17,607 64,281 166,203 Vehicle hours with measures 238,679 12,247 165,793 60,639 % change in vehicle-hours 4% 30% 6% 0% Average speed in base 26.4 10 .2 17.9 31.4 Average speed with measures 27.2 11.7 18. 3 4 1.6 % change in speed -3% -15% -3% - 1%
8.22. The €10 charge would have a substantially larger effect han the r s illustra Figure and 8
ts 8.2
€5 charge in .3. educing car use across the GDA, a ted in
85

GREATER DUBLIN TRAVEL DEMAND MANAGEMENT STUDY
Figure 8.2 Impact of Congestion Charging Options in Changing Vehicle-km in the Morning Peak Hour (8am-9am) across the GDA in the Year 2008
Change in Vehicle-km by comparison with base case for 2008 (i.e. no TDM) €5
Congestion Charge
€10 Congestion
Charge
86

GREATER DUBLIN TRAVEL DEMAND MANAGEMENT STUDY
Figure 8.3 Impact of Congestion Charging Options in Changing Vehicle-hourin the Morning Peak Hour (8am-9am) across the GDA in the Year 2008
s
Change in Vehicle-hours by comparison with base case for 2008 (i.e. no TDM) €5
Congestion Charge
€10 Congestion
Charge
If the congestion charge were implemented in conjunction with the described in the previous section, the
8.23.combination of measures to promote TDMimpact would increase slightly, as shown in Table 8.2.
87

GREATER DUBLIN TRAVEL DEMAND MANAGEMENT STUDY
Table 8.2 Impact of the Congestion Charge combined with Measures to Promote TDM
Comparison with the base situation in 2008
€5 charge + measures to promote TDM All GDA Inside canals
Between canals
and M50 Outside M50
Vehicle-km in base (see Table 2.3) 6,553,167 179,437 1,151,621 5,222,109
Vehicle-km with measures 6,434,458 156,790 1,108,185 5,169,483
% reduction in vehicle-km 2% 13% 4% 1%
Vehicle hours in base (see Table 2.3) 248091
17,607
64,281
166,203
Vehicle hours with measures 235,347 14,140 59,015 162,193
% reduction in vehicle-hours 5% 20% 8% 2%
Average speed 26.4 10.2 17.9 31.4 in base (see Table 2.3)
Average spe
ed with measures 27.3 11.1 18.8 31.9
% increase in sp 9% 5% 2%eed 4%
€10 charge + measures to promote TDM All GDA
Inside canals
Between canals
and M50 Outside M50
Vehicle-km in
,109 base (see Table 2.3)
6,553,167
179,437
1,151,621 5,222
Vehicle-km wi ht measures 6,414,318 142,565 1,100,998 5,170,756
% reduction v in ehicle-km 2% 21% 4% 1%
Vehicle hou
248,091
17,607
64,281
166,203 rs in base (see Table 2.3)
Vehicle hours with measures
232,877
12,144
59,224
161,509
% reduction v 3% in ehicle-hours 6% 31% 8%
Average speed in base (see Table 2.3) 26.4
10.2
17.9
31.4
Average speed with measures
27.5
11.7
18.6
32.0
% increase in speed 4% 15% 4% 2%
88

GREATER DUBLIN TRAVEL DEMAND MANAGEMENT STUDY
Who would pay the congestion charge? 8.24. The results of the analysis of the congestion charge in 2008, using the DTO Transportation Model, show that some 80% of car trips on the GDA road network in
e morning peak hour would be completely outside the proposed charging area and therefore would be unaffected by the charge.
es to the central area congestion
secondly on the proportion that have an alternative
le r, if
ld be
ell
sult of people further away transferring to public transport (which may be overcrowded by the time it reaches zones closer to the city).
8.29. In practice, other factors, such as people’s income or ability to pay will influence the decision to pay the licence.
th
8.25. For those that are affected, the possible responscharge within the transport model45 are either to:
• Pay the charge and continue to drive to, through or within the charging zone; or
• Divert around the charging zone to avoid paying the charge; or
• Transfer to public transport
8.26. Drivers choosing to change route or change mode can only do so if those choices are available. The proportion of people in any geographical area that would pay the charge depends firstly on the proportion that make a trip to, through or within the charging zone, and route or an alternative mode. Figure 8.4 shows the proportion of total car and public transport trips originating in each geographical sector that pays the charge.
8.27. All of the car trips originating in the charging area, equivalent to over 30% of all trips (car and public transport) originating in the charging area pay the charge. About half of these trips drive over the canals to destinations elsewhere in the GDAand about half are travelling to work within the charging area. Many of the peopforecast to drive within the charging area could choose to walk instead. Howeveresidents were to get a large discount and possibly an annual pass, there would be very little marginal cost on driving, and with improved traffic flow there woumore incentive to drive than before.
8.28. Within the sectors that are well served by public transport, a very small proportion (less than 5%) of originating trips by car and public transport pay the area licence. By comparison, some of the sectors outside the M50 that are less wserved by public transport have a larger proportion of originating trips that buy alicence. Some zones within the M50 show a higher proportion of people buying a licence than zones further out on Luas and rail corridors. This is probably because those people would benefit from improved road conditions that have occurred as a re
45 See Section 9 for discussion of responses that are not modelled
89

GREATER DUBLIN TRAVEL DEMAND MANAGEMENT STUDY
Figure 8.4 Proportion of Originating Trips by Car and Public Transport in thmorning
e peak hour in 2008 that would pay the City Centre Area Licence
Benefits to8.30. City Centre have a negative effec costs which are in turn passed to the c in the City Centre encourage businesses to look at alternative locations outside the City Centre in locations which are, for now, less congested. The effect of the proposed TDM package would be to
duce traffic flows in the City Centre and therefore improve speeds. Businesses entre
a, particularly on the radial
e
business visitors and employees to drive within the City Centre, although ose who chose to drive within the charging hours would need to buy a licence.
8.31. The benefits of reduced traffic flows would be far more significant in the City any of the suburban or other centres, simply because of the sheer
f
the City The slow traffic speeds which occur within thet on business efficiency, increasing operational onsumer. Increased costs of running a business
recould then make and receive deliveries more efficiently. Access to the City Cwould improve by all modes. Improved speeds would not only occur within the proposed charging zone, but also outside the areapproaches to the canals where queues would be reduced. All businesses within the canals have good public transport access which would improve due to faster, morreliable, bus and Luas speeds, and improved conditions for pedestrians walking to or from railway stations and bus and Luas stops. It would also be faster for customers,th
Centre than involume of people that are drawn to the City Centre’s unique offerings of employment, services, retail, history, culture and so on. The majority of these peopleare not car users and they would all benefit from reduced traffic flows in the form o
90

GREATER DUBLIN TRAVEL DEMAND MANAGEMENT STUDY
improved air quality, reduced accidents and a generally more pleasant environment.Making the city a more pleasant location could assist the renewal of the entire CitCentre, spreading more widely the regeneration benefits that have occurred in some locations over the last 15 years or so.
Diversionary Routes and Boundary Effects 8.32. The boundary of the proposed charging area essentially follows the City Council’s Outer Orbital Route (OOR), but modified to allow access to Macken StrBridge. The O
y
eet uter Orbital Route would therefore be the diversionary route.
8.33. As a complementary measure to congestion charging, traffic management on the OOR would need to be reviewed, including the banned turns and signal settings. Additional junction movements may need to be allowed at many junctions, but more priority need not necessarily be given to traffic circulating on the ORR. It may be more important than before to ensure that delays to buses and other non-car modes on the radial routes are minimised.
8.34. Adequate advance signage and public information would be needed to ensure that drivers should have plenty of advance warning about the charging zone. Most should have decided their response before getting to the boundary.
8.35. Experience in London is that there has been a reduction in congestion on the Orbital Route compared to pre-charging levels, reflecting better operational management.
8.36. The City Council would have an important role in this task of reviewing the junctions on the Outer Orbital Route. The initial purpose of the exercise would be to demonstrate to the City Council members and stakeholders/consultees (including businesses and residents) how the charging scheme would work in practice.
8.37. Complementary measures that might be considered in the boundary areas (i.e. those areas just outside the charging zone) include:
• traffic signs and road markings to identify the charging zone;
• traffic signal retiming, review of banned turns and lane operation on the Outer Orbital Route;
• on-street parking controls – additional controls, extended hours of operation, increased charges;
• traffic calming / traffic management to deter diversionary traffic rat-running in residential streets in the boundary areas;
• higher capacity, more frequent bus services on existing routes;
• new bus routes between and within the central area and the inner suburbs;
The Cordon and the Outer Orbital Route
91

GREATER DUBLIN TRAVEL DEMAND MANAGEMENT STUDY
• lower bus fares for people in the boundary areas to offset other impac
xtended bus priority;
r
• improved pedestrian and cycle
Ar Zo
expected to experience additional traffic flowsen
co
8.3tw te
Ho cstakeholder liaison process indicated
oulsh Lho 0am ) or an all day scheme (th
8.4 s arSh cesbe tothe
8.4 ounts are propold
ac ce
8.4many discounts and exemptions. These were n
r of drivers claiming disconsidered to be one of the reasons why the ou on are about 50% less than the forecast revenues. Residents’ discounts arein p on zone westwards ple with
is se greatly, reducing both revcomparison, there are virtually no exemptions in the Singapore scheme, and the LTA
ts, e.g. amended fare bands;
• e
• improved bus stop enviinformation, pedestrian cross
onment – seating, shelter, passenger ings, quality of footway etc; and
network – improved footways, improved and additional cropedestrian and/or cycle only
ssings, bridges over canals, additional routes.
ne
ea to the East of the Proposed Charging
8.38. The North Wall/East Wall/Ringsend/Irishtown area is the only sector that is as a result of the proposed congestion tary measures may need to be charging. Some or all of the above complem
nsidered.
9. The strategic arguments for excludingofold. Firstly, it provides an untolled rou
Macken Street Bridge from charging are to the east of the city. Secondly, it
provides an alternative if Eastlink Bridge w
urs of Operation, Exemptions and Dis
as raised.
unts o a strong preference for a “morning d target commuters without affecting ess favourable options include a “peak and 4pm to 7pm
8.40. The peak only” scheme (7am to 10am) which w
oppers, business visitors or other visitors.urs only” scheme (for example, 7am to 1
e scheme in London operates from 7am to 6:30pm). In all cases, it is assumed that charging would not apply on
1. The issue of exemptions and discountorter hours of operation imply fewer concause many more drivers have the choice charge.
2. No exemptions or disc
bank holidays and at weekends.
e related to the hours of operation. sions, if any, would be justified postpone their trip in order to avoid
sed at this stage. Stakeholder perception be required if the scheme were to be elsewhere.
is that some discounts and exemptions woucepted, so it is useful to examine experien
3. As originally envisaged, the London congestion charging scheme did not allow egotiated nearer to implementation.
The larger than expected numbe counts or exemptions is tturn net revenues in Lond
now a key issue lans to expand the Lond – the number of peo
d counts could ri enues and effectiveness. By
92

GREATER DUBLIN TRAVEL DEMAND MANAGEMENT STUDY
(L orsuccess of the scheme. Table 8.3 below shows the different approaches taken in London and Singapore. Interestingly, when the Singapore scheme was first introduced in 1974, exemptions were granted to many road users including high occupancy vehicles, goods vehicles, etc. These exemptions were found to be open to misuse and have gradually been phased out as the scheme has developed.
Table 8.3 Exemptions and Discounts in the London and Singapore Charging
Schemes
and Transp t Authority) in Singapore claims this as one of the reasons for the
London Singapore • Daily charge £5 • 90% discounts:
o Residents of zone • 100% discount
o Blue badge holders:100% o Alternative fuel vehicles o Breakdown vehicles o Emergency services o Vehicles with 9 or more seats registered as
buses o Certain vehicles used by local authorities and
other services • Exemptions, including:
o Taxis o Buses o Motorcycles o Any vehicles exempt from Vehicle Excise
Duty • A 100% reimbursement of the congestion charge applies
for certain journeys undertaken by fire-fighters, NHS staff and certain NHS patients:
o Vehicles used by fire-fighters for operational journeys between fire stations
o Vehicles used by NHS staff on certain operational journeys when carrying bulky, heavy or fragile equipment, confidential patient notes, controlled drugs, etc. or responding to emergencies when on call
o Vehicles used by certain patients when attending NHS appointments.
• The congestion charge would have to be paid for these vehicles by the individuals concerned and then claimed back from their employer or the relevant NHS body. TfL would then refund the charges incurred to these organisations.
• Graduated charge depending on level of congestion and distance travelled
• Charge varies by vehicle type in the following proportions:
o Cars (1) o Motorcycles (0.5) o Lorries and buses
(1.5) o Large vehicles (2)
• No exemptions
8.44. In summary, while it appears that discounts and exemptions should be avoided if possible, it is easier to gain acceptability for a congestion charging scheme if they can be offered, at least in the short term.
8.45. The financial implications of offering residents’ discounts, exemptions and reduced hours of operation are discussed in Section 10 of this report which deals
93

GREATER DUBLIN TRAVEL DEMAND MANAGEMENT STUDY
with the business case associated with the implementation of congestion charging in
a then entered in a database of valid licences for the day.
the
arious motorway tolling schemes throughout the world. Table of each system. Figures 8.5 and
8.6 show the equipment on the boundary of the London and Singapore schemes respectivel
8.47. If congestion charging were to be implemented in Dublin within the short to medium te London type scheme would be feasible. With a longer horizon, the choice of technologic o
the GDA.
Technology 8.46. There are currently two options for the collection and enforcement of the congestion charge. Firstly, there is the London model where the driver purchases daily licence and which isEnforcement is by automatic number plate recognition (APNR) which comparesnumber plates of cars driving in the charging zone with the database. Secondly, there is electronic charging using a prepaid smartcard which is debited using either satellite positioning systems (e.g. GPS) or DSRC (dedicated short range communications, i.e. microwave). ANPR systems are used in parallel to capture carswithout a valid smartcard (or “tag”). Electronic charging is in operation in Singapore and on v8.4 below provides a fuller comparative description
y.
rm timeframe set out for this study (i.e. by 2008), it is considered that the
al ptions could, and should, be left open.
94

GREATER DUBLIN TRAVEL DEMAND MANAGEMENT STUDY
Table 8.4 Comparison of Charging Systems London-type system Electronic charging system How it works Payment in adv etravel by telepho by post. Enforcemen(ANPR) and compalicence. Implementation Issues Technology: Th
application befosuccessful
Infrastructure: InfrastrANPR cameras cordon and hwould be necessa
Operation and Ahigh levels of c
Flexibility of Scheme:of implementationdeliver other seAlthough this masimplicity is therimplement.
Speed of introductionare minimal infrshould be short, approagreement to prdesign etc
Cost Issues Scale: The number o
the size of therequirements are ber of cameras, and
tition. The back office systems can be developed using open architecture applications, and are open to competitive out-sourcing. Infrastructure costs
s g
V stance charging scheme in Germany which has major
n e
e in
s ificant possibilities in varying the
GPS and DSRC have the
de its
for e a
shorter timescale as there is no roadside infrastructure
ger icle
units will also need to be fitted (current cost of unit with fitting in Singapore is S$150 (about €75 euro)). A GPS solution will require additional in-vehicle units at a cost of approx €150 euro each. A major decision would be whether the use of in-vehicle units is mandatory or optional.
n gantries relies
s have well
anc or up until (say) 10pm on the day of ne, online, text message, at retail outlets or
t by automatic number plate recognition rison against database of cars with
How it might work Prepaid smartcard, which is debited using either GPS (globalpositioning system, i.e. satellite) or DSRC (dedicated short rangecommunications, i.e. microwave) technology. ANPR camerastill required for enforcement i.e. to capture cars without valid ta(unless barriers used) Implementation Issues
e technology had not been used in this re, but introduction in London was
ucture requirements would be low. Only
Technology: The DSRC technology has been used elsewhere,and is proven. GPS systems are partially used for HGVtagging in Switzerland, are proposed for the planned HGdi
would be required at the edges of the wit in the zone. No in-vehicle equipment
ry.
difficulties in implementation. GPS systems for charging iurban areas are unlikely to be considered a maturtechnology in the short to medium term.
dministration: This type of system relies on ba k office processing.
The technology necessary for this type would not be capable of being used to rvices or provide for variable tariffs. y be seen as a disadvantage, it ensures efore more transparent and easier to
: As the technology is simple and there astructure requirements the timescale
x 24 months, once there is definite
Infrastructure: With both DSRC and GPS an in-vehicle unit is required. DSRC requires significant roadside infrastructurefor the communication system i.e. gantries which would bunacceptable in many sensitive city locations (rejected London).
Operation and Administration: Back office processing will beminimal as some functionality is contained within the in-vehicle units / roadside system.
Flexibility of Scheme: The technology allows for varied degreeof flexibility. GPS offers signtariff calculation and both
oceed, following consultation, scheme
f cameras required is directly related to charging zone. The back office
related to the num
capability of providing value added services. Speed of introduction: To implement DSRC, including roadsi
infrastructure and a complete roll out of in-vehicle unwould take over 24 months plus. Planning applicationsgantries can take a significant time. GPS would requir
also volume of traffic, and needs to be able to cope with peaks.
Technology: ANPR technology for enforcement is proven in operational situations and several suppliers are available to provide compe
needed, but is unproven. Cost Issues Scale: The size of the cordon determines the cost. The big
the cordon, the more gantries needed for DSRC. In-veh
would be minimal. If the scheme is not successful, any cameras are still useful for traffic management and therefore have a high residual value.
Standardisation: Standards for road pricing systems using this technology are not in place, although the EU White Paper on Interoperability requires it. However, due to its simplicity and lack of need for in-vehicle equipment interoperability should not be a problem.
Technology: DSRC requires significant investment iand in-vehicle units. GPS requires in-vehicle units andon the GSM network to transmit data, operational costs may be significant unless GPRS is used
Standardisation: DSRC Standards for road pricing systembeen developed. GPS system standards are not developed; but favoured by EU Interoperability initiative.
Summary Simple and proven, possible in short-term Low flexibility No in-vehicle equipment required Low infrastructure costs Unobtrusive roadside infrastructure High operating costs
Summary Choice of technology: DSRC or GPS Either represent a longer term solution Both offer flexibility Both offer potential cost effectiveness Both require an in-vehicle unit DSRC is proven, but requires gantries, etc. which are
obtrusive GPS not proven but no roadside infrastructure
95

GREATER DUBLIN TRAVEL DEMAND MANAGEMENT STUDY
Figure 8.5 Equipment at Boundary of Congestion Charging Zone in London
Cameras on black
pole
Figure 8.6 Roadside Equipment used to Support Singapore Electronic Road
Pricing
96

GREATER DUBLIN TRAVEL DEMAND MANAGEMENT STUDY
Costs 8.48. The London congestion charging scheme cost in the region of £60 million to establish and currently costs an estimated £97 million per annum to operate. It is expected that operating costs will be lower in future years, in the region £60-70 million per annum. This is a function of the relatively complex payments mechanismin place which involves payments to the operator based on the volume of transactions, the number of enquires to the call centre and the number of penalty charge
notices collected.
e various e
ost, fax, telephone call centre);
• Discount processing and finance processing (clearing house, banking etc.);
sites, 64 monitoring sites
heme 10,
would buy and display paper licence;
8.49. Due to commercial sensitivities, a detailed cost breakdown for the various elements of the London congestion charging scheme is not available, but thelements are listed below. It is worth noting that the system is very labour intensivand involves daily transmission of hundreds of thousands of analogue camera images via the telecommunications network, which is costly. Transport for London (TfL), the procurer, is currently exploring possibilities to automate the process which may reduce costs.
8.50. Operation of the London scheme comprises:
• Providing sales channels (retail outlets, websites, text messaging,p
• Image processing (from 203 enforcement and 10 mobile patrol units);
• Validation of images against database;
• Customer services (24 hours a day, 7 days a week, several languages);
• Issue of penalty charge notices and enforcement;
• On street enforcement; and
• Prosecution, bailiffs, etc
8.51. Details of the potential costs of the proposed congestion charging scwhich were assumed for the purpose of this assessment are provided in Section Table 10.4.
Lower Cost Alternatives
8.52. The simplest possible area licence system would be a paper licence with manual enforcement by the Gardaí. Some features of this option include:
• Driver
• Driver would need to go to a retail outlet in advance of driving intothe area because a physical licence would be needed;
97

GREATER DUBLIN TRAVEL DEMAND MANAGEMENT STUDY
• Garda would check that vehicles driving in the charging zone have a
• volve some stopping of vehicles, ent
• ce nt
• s could be required as a
€5-€15m for Dublin where the proposed charging zone is about two-thirds the size of the London zone), the running costs would be high (As stated above, the ROCOL studies estimated that some 400
s would be required for the London zone. This ,
rease hand-
to
. A further S$100 million was spent on the roadside infrastructure. Operating
costs, however, may be lower with an electronic system because camera generated images would only need to be processed for violators, not all users of the system. Also, the functionality of the roadside and in-vehicle infrastructure could reduce
valid licence (a change in legislation would be required if other enforcers were to be allowed stop moving vehicles);
Checking/enforcement would inwhich would be costly and disruptive in central Dublin. Permanstopping bays could be established to avoid queues building behindstopped vehicles, but suitable sites could be hard to identify;
At best, enforcement would be quite basic, with quite a small chanof detection (estimated at 1 in 5 for London with 400 enforcemeofficers and 150 stopping bays);
Given the difficulty of enforcement, large finedeterrent against non-compliance, and might be controversial;
• Although the set-up costs would be low (estimated at £5-£15m forCentral London in the ROCOL46 studies – this would equate to about
enforcement officermight equate to some 265 officers for a similar operation in Dublinwith costs in the region of €15-€20 million pa); and
• “Smart” paper licences may improve enforcement but would inccosts. Options include perforated paper which could be read by held camera, RFID encoded paper which could be read by an electronic device or bar coded paper which could be read by an infra-red device.
8.53. In summary, compliance with this option is likely to be difficult and costlyenforce, which is likely to result in lower effectiveness and lower revenues. Additionally, the requirement to stop vehicles to check for compliance is unlikely to be acceptable.
Lower Operating Cost, Higher Capital Cost
8.54. At the other end of the spectrum, a more sophisticated option than ANPR would be an electronic system. Electronic options would cost more in set up costs than an ANPR system because of the roadside and in-vehicle infrastructure required.In Singapore, the Government fitted some S$100 million (€50 million) worth of in-vehicle units in the 10 months before the scheme (now drivers must pay S$150 for aunit)
46 Studies commissioned by the Government Office for London to support the ROCOL (Review of Charging Options for
London) Working Group (Halcrow Fox et al, February 2002)
98

GREATER DUBLIN TRAVEL DEMAND MANAGEMENT STUDY
some of the back office processing requirements. Without specifying a system in some detail, costs would be difficult to estimate, but it is worth noting that the Singapore Electronic Road Pricing (ERP) system has very much lower operating costs than the London scheme – it costs about S$16 million (€8 million) per annum to
aintain and operate.
umber of factors why the Singapore situation is quite different to
gradual intnetwork compFigure 8.6). Fineffective deterrent to non-compliance and therefore reduce the need for enforcement.
Cordon Entry Charge Only
8.56. The distinction between an area licence and a cordon charge becomes blurred once the de l . What level of enforcemen , o residents pay the full charge? If not, what discount should be applied?, etc.
8.57. Features of a simple cordon entry charge scheme include:
• Al r the charging hours would pay to cr s
• Enforcement could be manual, electronic plus ANPR, or ANPR only;
• Enforcement need only take place on the cordon, and therefore might be s
• The c gs would be offset by a reduction in revenue because all trips starting within the area would not be charged and drivers could enter then drive around for
d ted
or during both peak periods; and
• Vehicles that make multiple entries across the cordon during the charging period would need special consideration. A simple system would charge them each time. A more sophisticated system, akin to
8.58. As discussed in Paragraphs 8.9 and 8.10, the main drawback of the cordon charging option is that it does not impact upon the growing demand for car use by two groups: those driving outbound from the City Centre (see Table 2.5) and those driving wholly within the City Centre during the morning peak hour. A two-way
m
8.55. There are a nthe Dublin situation (which is considered closer to the London situation). Firstly,Singapore has a history of some form of road pricing since 1974 leading to the
roduction of ERP in 1998. Secondly, Singapore possesses a modern road rising high capacity links which can accommodate large gantries (see ally, there is a tradition of extremely high fines which act as an
tai s of enforcement policy are developed, e.gt? Where should enforcement be concentrated? D
l t ips entering the area duringos the cordon;
a lightly less costly task by comparison with an area licence;
ost savin
the cordon before charging started andfree during the charging period;
• Trips starting within the area but with destinations outside coulpossibly be captured on the return trip if the cordon charge operaall day
the area licence, would only charge for the first entry.
99

GREATER DUBLIN TRAVEL DEMAND MANAGEMENT STUDY
cordon would tackle the first group but, is not, at a strategic level, significantly different to an area licence scheme (see Paragraph 8.10). The area licence schemtackle the second group, although this effect would be diluted by the introdconcessions for residents, as discussed earlier in this Section. In essence, the distinction between an area licence and a cordon charge becomes blurred once the necessary policies are developed, e.g. the level of enforcement, the type o
e will uction of
f enforcemenetc.
8.59. In Londo ertaken on the boundary of the charg gsignificantly hless revenue as less drivers would be eligible to pay. If the cordon charge applied in both direct s ossibly requiring u o for internal t a
8.60. A cordon y or which capp tional complexity an cordon charge
Future expansion of the congestion charging scheme 8.61. There are a number of ways in which the congestion charging scheme could be expanded in future. At its simplest, it could be extended to cover neighbouring areas with congestion, for example, Ballsbridge, Fairview, Ranelagh or Phibsborough. In the short to medium term, it would be difficult to make a case for congestion charging schemes for other centres within the GDA (e.g. Blanchardstown Swords) because access by alternative modes to those centres is currently relatively poor, and most lack a natural boundary within which to apply a charge.
8.62. In the longer term, distance-based road user charging might be considered throughout the GDA. This would be subject to availability of a suitable administration and enforcement technology. Satellite Positioning System (SPS) technology, using either GPS or the forthcoming Galileo system in Europe, currently appears to be the most likely candidate, but current trials suggest that no firm date can be established for when the technology is likely to be ready. (DSRC technology is not suitable for a regional scheme as it would not be practical or cost-effective to introduce roadside beacons/gantries on such a widespread scale). There are moves towards an SPS-based road user charging throughout Europe in future, with the intention that the charge would be offset by the removal of fuel duty and the abolition of road tax.
8.63. Future area-based systems envisage the ability to vary the charge, for example, by time of day, by level of congestion, by distance and/or by vehicle type.
8.64. There are some other factors regarding any area-wide road user charge:
t and where it is concentrated, the system of discounts and exemptions,
n, over 80% of the enforcement effort is undin zone. This suggests that a cordon only scheme may not be c eaper to operate than an area licence and certainly would generate
ion , it would also need to be enforced in both directions, pp t 80% more enforcement effort, but it still would not generate revenue
r ffic.
charge scheme which only charged for the first entry vehicle each daed the total charge payable for the day would have greater funcd therefore may have higher capital and operating costs than a simple.
100

GREATER DUBLIN TRAVEL DEMAND MANAGEMENT STUDY
• An in-vehicle device in each car would probably be mandatory;
u single n ke
chem
wark
easures. There is a presum
a similaki
charge
8.65. na s h en e borne in mind as a longer term measure. Europemon
Administration and Legislation 8.66. The proposed central area road user charging scheme falls entirely within the
ublin City Council area. It follows that the City Council would be a major player ion to proceed. Under current institutional arrangements, the City
e the authority responsible for implementation47.
nable the Council to
rm e
dary regulations to establish implement o
8.69. The net rthe City Councof Transport foa revenue alloctax.
• As a regional scheme woagency would need to beresponsibility for the s
• In the UK, legislation allo
ld cover several local authorities, aominated, or specially established, to tae; and
s local authorities to operate road user ing levies as travel demand management
ption against both measures being tion undertaken for this study suggests r presumption in the GDA. In that case ng levy would need to be abolished before was put in place.
l road user charge could be a flexible andt over the whole area. It should b
charging or workplace pmapplied together. Consultathat there would beany future workplace para regional road user
Despite these complexities, a regioop isticated tool for demand managem
itored. an initiatives in this regard should be
Din the decisCouncil would most likely bWhether the City could fund the capital costs through borrowing or a private financeinitiative or whether they would be funded centrally - as is the case for the London scheme and the proposed Stockholm scheme - would need to be determined.
8.67. Changes to primary legislation would be needed to echarge for the use of roads that were previously free of charge. Appropriate legislation could potentially be incorporated in the comprehensive regulatory refolegislation currently being considered by the Department of Transport, or within thforthcoming Finance Act 2005.
8.68. As the details of the scheme emerge, seconati n would be needed.
evenue generated by the charging scheme could be divided between il for expenditure on complementary measures and the Department r expenditure on public transport improvements. This would require ation agreement, possibly similar to existing arrangements for road
gements have been proposed in the “New Institutional Arrangements for Land Use an47 Alternative arran d Transport in
the Greater Dublin Area”, Department of the Environment and Local Government and Department of Public Enterprise, March 2001 but would not necessarily alter the above
101

GREATER DUBLIN TRAVEL DEMAND MANAGEMENT STUDY
8.70. For any system involving ANPR, the Vehicle Registration Department of theDepartment of Environment, Heritage and Local Government would need to be brought on board at an early stage in the scheme design.
Scheme Design 8.7 would be developed:
with stakeholder groups, backed up by extensive traffic flow data across the canal cordon by time of day and time of year – to refine proposals
logy;
ncement;
ent;
Amenity, e.g. improvements for pedestrians and cyclists;
aign to ensure City Centre retains its for retailing and other activities
8.72. Once the decision to proceed with congestion charging is agreed in principle, there would be no need to consult on the overall scheme; however, consultation on the loc t control elements of the scheme design would
imescale plemented within two years of the
firm political commitment, the
1. During the scheme design stage, the following issues
• Acceptability – through market research and consultation
for:
Level of charge;
Discounts and exemptions; and
Hours of operation;
• Payment administration and techno
• Enforcement administration and technology;
• Complementary measures:
Increased bus capacity;
Bus network enha
Traffic managem
Traffic calming;
Parking controls;
and/or
Other, e.g. marketing campposition
al raffic management and parking be advisable.
T8.73. In London, congestion charging was imdecision to proceed48. At that stage, there was
48 Congestion charging had been mooted in London since the 1960s. The decision to proceed was based on much research,
notably the London Congestion Charging Research Programme in the early 1990s and the ROCOL studies in the late 1990s.
102

GREATER DUBLIN TRAVEL DEMAND MANAGEMENT STUDY
enabling legislation was in place and the scheme was designed to a sufficient levedetail to give decision-makers confidence (e.g. the payment and enforcement technology, the location of the cordon, the level of charg
l of
e and much of the complementary measures package had been decided). A similar timescale should be chievable in Dublin following approval to proceed based on the scheme design. The
curement stage would include:
l
mplementary measures;
d
from
estion
akey items at the implementation and pro
• Information campaign – it would be important to start informingpeople early on that congestion charging is coming, where it wilapply, how much the charge will be, etc49;
• Detailed design of elements of the scheme and the co
• Implementation of the complementary measures; an
• Procurement: there is a range of potential procurement options traditional publicly funded public sector procurement to a full PPP solution. Table 8.5 describes the role of the contractor in the London congestion charging scheme and also outlines how the City of Edinburgh Council is proposing to procure its proposed congcharging scheme.
49 The information strategy would be purely factual with the aim of ensuring that the introduction of the charge goes
smoothly an l must do. It should not be confused with any general travel awareness campaigns, marketing strategies or consultation that would be required as part of the general travel demand management initiative.
d al concerned know what they
103

GREATER DUBLIN TRAVEL DEMAND MANAGEMENT STUDY
Table 8.5 Examples of procurement London Edinburgh Capita Business Services has been contracted In Edinburgh, a company called Transport
Initiatives Edinburgh (tie) was formed to deliver major transport projects for the City of Edinburgh
by Transport for London to provide core, retail and image management services (known collectively as co es) for the mbined servic Council (CEC). It is a private limited company, Congestion Charging Scheme. This includes: wholly owned by the CEC. The board includes
senior figures from the business community as well as three CEC councillors. The company is a non-profit making organisation which provides the procurement, project management and finance
• Management of the sales channels (i.e. retail ou stlet )
• Discount processing and finance processing, management capability to ensure that a number of major transport related projects are delivered inc
including all the back office functions
• Validation of driver details against images luding the West Edinburgh Bus System and the proposed tram lines. The company is also responsible for the further refinement of the
• Customer service and data storage, including operation of the contact centre
• The bulk of the enforcement, including the proposed congestion charging scheme which is expected to fund the transport projects. In procuring the proposed congestion charging, tie is proposing two pilot schemes, which would be let
technology to underpin enforcement operations and the Penalty Charge Notice (PCN) system
• Automatic Number Plate Recognition (ANPR) system, including the processing of images and storage of images for cross-checking/appeals
by competitive tender. The CEC wish to encourage innovation and the choice of technology will be up to bidders to decide. The outcome of the pilots would inform the decision on the payment and enforcement technology for the eventual scheme.
Risks to Implementation 8.74. The introduction of congestion charging in London shows that it is technicapossible to implement. Consultation and market rese
lly arch undertaken for this study
indicated some level of acceptability for congestion charging in the City Centre, onditional on provision of satisfactory public transport.
as been popular in
on
on of
the
• The Mayor’s Transport Strategy provides London with a coherent policy framework into which the congestion charging fits.
c
8.75. Transport for London report that congestion charging hLondon and most observers regard it to be reasonably successful. Nevertheless, congestion charging is a radical measure, and many lessons can be learnt from the London experience. Overall the indications for a scheme in Dublin are promising, but a few key issues need to be borne in mind:
• Almost 90% of commuters entering the charging zone in Londtravelled by public transport prior to congestion charging. Bycomparison, Census 2002 reported that in Dublin the public transport mode share is 37%, with 22% walking or cycling and 41% entering the proposed charging zone by car. Therefore a greater proportipeople would be negatively affected by the charge;
• The Mayor of London was elected with a mandate to implement charge, and with the regulatory back up; and
104

GREATER DUBLIN TRAVEL DEMAND MANAGEMENT STUDY
8.76. There will be “lessons to learn” from the proposals to introduce a charge in Edinburgh, where the City of Edinburgh Council is committed to holding a public referendum bef oceeding to implementation kholm is
e in 200 ore pr . More immediately, Stoc
proposing to introduce a schem 5, as described below.
Proposed Sto eme ckholm SchTrial scheme proposed from 12th June 20 05 until 31st July 2006
Referendum on whether to make the scheme permanent proposed for 17 September 2006
Objectives:
• To reduce traffic volume by 10-15% on the most heavily used routes
• To increase the average speed on roads
• To cut emissions of health damaging pollutants and carbon dioxide
• To improve the urban environment
• To provide more resources for public transport.
Charges will vary by time of day with a range SEK10 to SEK 20 (about € 1 to €2) up to a maximum of SEK60 (about €6) per day
Hours of operation: 6am – 6.30pm, Monday to nk holidays and the day before Friday except babank holidays
DSRC based advanced payment system
Exemptions being considered include:
• Emergency vehicles
• Vehicles with disability permits
• Certain vehicles whose owners are exempt from taxation in Sweden
• Buses al weight of at least 14 tons with a tot
• Low polluting cars
• Taxis
• Transport services for the disabled
• School buses
• Motorcycles
ther Risks to Implementation Programme O
8.77. Lack of political consensus or acceptance of the principles set out in this report and subsequent difficulties in adoption of appropriate legislation.
105

GREATER DUBLIN TRAVEL DEMAND MANAGEMENT STUDY
8.78. If, as an interim measure, a City Centre workplace parking levy were to be considered, provision may need to be made for that levy to be removed in the event of congestion chargin rod
lays or failure to impl
entral area measure w ceed, levy measure could be extended to cover the area within the
The resulting benefits for s and within t re y, would be lower than with the central area road user charge.
stion Charge
f congestion charging:
• A travel survey to provide information on trip frequency, modal
• A stated preference survey, to enable determination of elasticity of travel demand with respect to a congestion charge. It may be worth combining SP survey work and derivation of elasticities with the incorporation of these elasticities into the DTO model as one contract
• Qualitative surveys with selected groups to gauge the acceptability of a congestion charge and to inform design parameters (level of charge, precise boundary, exemptions, etc.);
• Definition of a scheme (e.g. area licence for within the canals at €10, as proposed in this report) to be worked up in further detail for illustrative purposes (it will help decision-makers if they can visualise a possible scheme) and to inform demand and cost modelling; and
• Meetings with Transport for London and Transport Initiatives Edinburgh and Stockholm City Council to discuss congestion charge scheme costs in these cities
8.81. The above tasks would enable details of the outline scheme proposed in this study to be considered, including:
• The precise charging boundary;
• Whether the charge should be cordon or area based;
• Appropriate technology (paper based or electronic);
• Appropriate enforcement/compliance strategy (related to technology);
• Levels of charge;
g being int uced at a later date.
Impact of de ement
8.79. If the proposed crkplace parking
congestion charging ere not to prothe wo canals. all within the canal he M50 mogenerall
Next Steps in Implementing a City Centre Conge8.80. The first step would be to undertake further investigative work to assist (political) decision-makers on the introduction o
share, trip purpose and trip length variations by time of day
106

GREATER DUBLIN TRAVEL DEMAND MANAGEMENT STUDY
• Times of operation;
• Impact of exemptions or discounts;
• Complementary measures (e.g. additional buses, traffic managmeasures);
• Capital and operating costs; and
ement
• Forecast revenues.
led design of any scheme would proceed only if a positive political decision to implement a scheme was made.
Charges on Rationale 8.83. A chamore effectiveshown in Sectirestraint on this growing demand could be achieved by tackling freparking. Feapproach is alsIn practice, as discussed in Section 3, measures which aim to significantly increase the cost of where non-carwithin the GD
Workplace a8.84. Free workplace parking could be tackled either by a workplace parking levy or “benefit in kinplace and then ith a taxation
er, is Its It
benefit in kind taxation does provide a dis ee, but the value of the benefit in kind would be hard to identify in many cases and the sums paid in taxation may not be sufficient to change behaviour. Nevertheless, benefit in kind taxation would be a good “second best” option, and much better than doing nothing.
8.82. The detai
Free Workplace Parking
rge on free workplace parking is proposed as a measure that would be across the entire GDA than the measures to promote TDM because, as on 2, demand is growing rapidly in non-central areas. Technically,
e workplace edback from consultation and market research suggested that this
o a relatively acceptable option in principle, as discussed in Section 4.
car use are generally only applicable in medium to large size centres travel options are available. Consequently, there would be areas A where the charge would not apply.
P rking Levy or “Benefit in Kind” Taxation?
d” taxation policy. With a levy, the employer would pay in the first choose whether or not to pass onto the employee. W
policy, the parking space would be declared by the employer and/or employee as abenefit in kind and paid by the employee. Both of these options have advantages and disadvantages, as shown in Table 8.6. The workplace parking levy, howevconsidered likely to have the greater impact and it therefore the preferred option. advantage is that it can be applied to a specific geographical area, at a chosen rate.also provides an incentive to the employer to reduce parking. By comparison,
incentive to an employ
107

GREATER DUBLIN TRAVEL DEMAND MANAGEMENT STUDY
Table 8.6 Comparison between workplace parking levy and benefit in kind taxation
Levy “Benefit in kind” taxation • lied to a
rea. • ull value of parki
• ugh the raommissioners.
• Employers must register spaces which is an incentive to reduce the number of
•ployee to
• Legislation would be required.
Ta ual em national the va
nefi loca uldresh the tionpplicable.
efit would likely be assessed by the Revenue Commissioners in terms of the income
s as a result of the employee having the pace. This ased on al value
ciated with the space or the rent paid by the mployer for e.
n the value of the benefit, so the sum paid will be less a levy based on market value, so is
ss lik ehavargets re directly y, a
s may financial com sation if they ave to pay the t
• Legislation would be required.
A single rate can be appgeographically specific a
Levy can be sspaces in the a
et at f ng It bethrea.
Options to implement thro tes asystem or the Revenue C
spaces. Option for employer to pay on
employee’s behalf, or for empay.
• •
x on the individwould be applied
ployee ly but lue of the
t would vary byold below which
tion. There co income valua
be a is not
• The ben
that accrues may be b the capit assoe the spac
• Tax is paid o
le ely to change b iour. • T employee mo than lev lthough
employee seekax
penh .
Outline of the Propose8.85. An outline Table 8.7.
Table 8.7 Outline of the Proposed Workplace Parking Levy
d Workplace Parking Levy of the proposed workplace parking levy is set out in
Feature Working Assumption Options Area Dublin City, except the congestion charging zone.
All Fingal, South Dublin and Dun Laoghaire-Rathdown Development Centres in Kildare, Wicklow and Meath
Expansion or reduction of the proposed area
Level of charge Determined locally to reflect rateable valuation and also the cost of publicly available parking in the area
Revenue Commissioners or local authorities take a view on an appropriate level of charge.
Administration Local Authority Revenue Commissioners Frequency of payment
Annually Daily, weekly, monthly
Responsibility for payment
Occupier of the building
Time Only spaces used Monday-Friday, working hours Spaces used at any time Enforcement Local Authority Valuation Office
Third Party Complementary measures
On-street parking restrictions and residents’ parking schemes required to prevent displacement of parking.
Improvements for buses, cycling, walking and/or other measures to improve acceptability or effectiveness
8.86. The price of the workplace parking levy would be set by the local authority.would be informed by the commercial value of the space, as determined by the
It
108

GREATER DUBLIN TRAVEL DEMAND MANAGEMENT STUDY
Valuation Office, and by the price of parking locally. Likely levels of charge, based on current parking costs, are set out in Table 8.8.
Table 8.8 Cost of Parking in the GDA Local Authority Approximate current cost
of parking Annual equivalent
Dublin City 60c – €2.50 per hour €1,000 - €4,500 SF
outh Dublin ingal
€2.50/day – €1.50/hour
€600 - €3,600
Dun Laoghaire Rathdown Kildare Meath Wicklow
350 - €900 €1.50/day – 50c hour €
Transport Impact of a Workplace Parking Levy 8 the likely be l rathierarchy of decisions, as set out in Figure 8.7.
rations ng t of ace y
.87. The assessment of impact on haviour invo ves conside ion of a
Figure 8.7 Conside in Assessi he Impact a Workpl Parking Lev
Is free space available to em
Policy will not affect this proportion of employees
ployee?
Would employer pay for the registered space?
Would employee pay the charge?
Would employer register the space?
Employee stops driving to ork w
Policy will not affect this proportion of employees
Policy will not affect this proportion of employees
yes no
Policy will not directly affect this proportion of employees,noyes but it may reduce parking supply
yesno
no yes
109

GREATER DUBLIN TRAVEL DEMAND MANAGEMENT STUDY
8.88. The forecast response to each of the questions raised in figure 8.7 was based on research undertaken in the UK50 which assumed a cost of levy in line with all day on-street parking or commercial off-street parking costs in the local area. That is, for the curworkp Table 8.8) in the same way that drivers in the UK stated that they would react to a
orkplace parking levy set at a price in line with existing parking prices in their
a d
• emented, the workplace parking
he canals.
d be ered spaces within the City
Centre would be paid for by the employer on the employee’s behalf. ed spaces would be paid for by the
well as the UK research which gave similar results.
8.90. Based on the above assumptions, the workplace parking levy may produce a 4% reducti entire GDA, as shown in Table 8.9 and Figure 8.8. This assumes that no other TDM measures would be in place, other than local parking controls to deter employees parking on-street to avoid the levy. The impact would be slightly less within the City Centre because a lower proportion of workers in that area drive to work.
rent study it was assumed that drivers in the GDA would respond to a lace parking levy set in line with current parking costs in their areas (see
warea.
8.89. Analysis of the proposed workplace parking levy was based on the following assumptions:
• Some 75% of people that drive to work regularly in the GDA havefree parking space, based on research undertaken for this study51 anthe DTO workplace parking survey 2003.
• The cost of the levy would be sufficiently high to change behaviour (in line with the current costs outlined in Table 8.8).
• The levy would not apply to the rural hinterland (i.e. the parts ofCounties Meath, Kildare and Wicklow that are outside the Metropolitan Area and the Hinterland Area Development Centres).
If congestion charging were impllevy would not apply within the proposed congestion charging zone, i.e. within t
• Some 75% of existing free workplace parking spaces woulregistered for the levy. Some 80% of regist
Elsewhere, 65% of registeremployer52.
• Of those employees that would have to decide whether to pay the levy from their “own pocket” or change behaviour, 35-40% were assumed to pay53, based on the research undertaken for this study as
on in vehicle-km and a 9% reduction in vehicle-hours across the
50 ROCOL Studies (Halcrow Fox et al, 2000) 51Greater Dublin Area Travel Demand Management Consultation Report, June 2003 52 ROCOL Studies (Halcrow Fox et al, 2000) 53 ROCOL and research undertaken for this study (as reported in the Consultation Working Paper, June 2003)
110

GREATER DUBLIN TRAVEL DEMAND MANAGEMENT STUDY
Table 8.9 Impact of a Workplace Parking Levy Comparison with the base situation (no TDM) in 2008
Workplace parking levy All GDA Inside canals
Between canals and
M50 Outside M50 Vehicle-km in base (see Table 2.3)
6,553,167 179,437 1,151,621 5,222,109
Vehicle-km with measures 6,277,139 171,788 1,098,143 5,007,208 % reduction in vehicle-km 4% 4% 5% 4%
Vehicle hours in base (Table 2.3)
248,091 17,607 64,281 166,203
Vehicle hours with measures
226,676 16,381 58,516 151,780 % reduction in vehicle-hours 9% 7% 9% 9% Average speed in base (Table 2.3) 26.4 10.2 17.9 31.4 Average speed with measures 27.7 10.5 18.8 33.0 % increase in speed 5% 3% 5% 5%
111

GREATER DUBLIN TRAVEL DEMAND MANAGEMENT STUDY
Figure 8.8 Change in Morning Peak Hour Vehicle-km and Vehicle-hours due to Workplace Parking Levy
Impact of a Workplace Parking Levy in the Morning Peak Hour (8am-9am) in the year 2008
Change in Vehicle-km
Change in Vehicle-hours
8.91. A workplace parking levy would preferably be implemented in conjunction with workplace travel plans. Consequently, it is useful to examine the potential impact of the levy with the combination of measures to promote TDM described in Section 7 (of which workplace travel plans are a key component). As shown in Table 8.10, the impact of the workplace parking levy would be greater if applied with the measures to promote TDM. The overall impact of the two strategies together would
112

GREATER DUBLIN TRAVEL DEMAND MANAGEMENT STUDY
be less than the theoretical sum of the individual strategies due to double-countiand also due to induced traffic (some people switch back to car from public transport for some trips to take advantage of improved car journey times due to fewer cars on th
ng54
e road).
Table 8.10 Impact of the Workplace Parking Levy in combination with
Measures to Promote TDM Comparison with the base situation (no TDM) in 2008
Workplace parking levy with measures to promote TDM All GDA Inside canals
Between canals and
M50 Outside M50 Vehicle-km in base (see Table 2.3) 6,553,167 179,437 1,151,621 5,222,109 Vehicle-km with measures 6,214,280 170,149 1,084,728 4,959,402 % reduction in vehicle-km 5% 5% 6% 5% Vehicle hours in base (Table 2.3) 248,091 17,607 64,281 166,203 Vehicle hours with measures 222,432 16,082 57,530 148,820 % reduction in vehicle-hours 10% 9% 11% 10% Average speed in base (Table 2.3) 26.4 10.2 17.9 31.4 Average speed with measures 27.9 10.6 18.9 33.3 % increase in speed 6% 4% 6% 6%
Who would pay the workplace parking levy?
8.92. The proposed workplace parking levy would apply to car trips to work area where a levy is proposed. The cost of the levy would vary depending on where the workplace is located. Zones where a high
in an
proportion of residents drive to work
10-20% for most of the area within M50, nd most of the development centres in the hinterland. In some of the outer parts of
Fingal and South Dublin, and parts of the hinterland, 20-30% would pay the levy.
would have the greatest proportion of people that pay the levy.
8.93. Figure 8.9 shows the proportion of originating trips in each zone that pay the levy. It is based on the scenario where there would be congestion charging and therefore no levy in the City Centre. In the City Centre, a lower proportion of originating trips are also by car. For these reasons, only 5-10% of trips originating in the City Centre pay the levy. This rises toa
54For example, some drivers that had changed behaviour as a result of the workplace travel plans or other measures to
promote TDM would no longer be affected by the workplace parking levy
113

GREATER DUBLIN TRAVEL DEMAND MANAGEMENT STUDY
Figure 8.9 Proportion of Originating Trips that pay the Parking Levy
Effect of a Lower Cost Levy
8.94. The analysis undertaken has been based on a levy of a comparable cost to local parking ch elikely impa ono effect in reducing traffic. Limited research in the UKmajority of employees or employers would simply pay the levy if it were set at a low rate (arounhave the follow
•
ture
hich could fund complementary
arg . In the absence of specific research, it is difficult to speculate on the ct f a low-cost levy, although the Australian levies appear to have had
55 suggested that the great
d £1000 per year in Central London). However, a low-cost levy could ing effects:
• Awareness would be raised amongst employers and employees;
Large employers, particularly in the public sectors, would review their parking provision and consider reducing the size of their car parks;
• There would be the potential to increase the level of charge in fuyears; and
• Revenue would be generated wmeasures such as additional bus services.
55 ROCOL Studies (Halcrow Fox et al, 2000)
114

GREATER DUBLIN TRAVEL DEMAND MANAGEMENT STUDY
Refining the Transport Impact Assessment
8.95. If the workplace parking levy proposal were to be progressed, further reseawith employers and with employees would be required to develop a more detailpicture of the likely response. Potential research topics are set out in Tables 8.11 and 8.12.
rch ed
Table 8.12 Research Topics with Employees, and likely Issues
Frequency of Payment 8.96. It has been assumed the levy would be paid annually, in line with business rates. This option would minimise administration. Also, payment of a large levy in one lump sum may be the most effective incentive to relinquish a parking space. A potential disadvantage is the possibility that once the levy is paid, there would be an incentive to use the car regularly.
Table 8.11 Research Topics with Employers, and likely Issues Research topics with employers Typical issues for employers
Number of spaces, way in which spaces are used, - Need to recover additional costs – potential to pass cost onto customers
- Maintaining staff terms and conditions - Pooled spaces, visitors spaces, spaces for people
with disabilities, spaces used by staff that need a vehicle to carry out their job
spaces to order to
al
Existing cost of car parking e.g. already paying for staff car parking through rent
- Level playing field with workplaces with paid on-site parking (e.g. new car park at St Vincent's hospital)
- Access to premises for registration and inspection -
- Benefits from scheme
pooling of spaces Inventory information
– Number of spaces e of spaces
employees behalf, influence of level of charge
– Usag– Pooling of spaces – Operational need for parking
Attitude towards registration of spaces – Likelihood of registering some or all of the
spaces – Influence of level of charge – Likelihood of paying for the charge on the
- Pressure to register a reduced number ofsupport polices to restrain car trips and inlimit expenditure (especially public sector employers)
- Exemptions for a certain level of parking essentifor the business– this could result in the need to agree a regional minimum functional level of parking for workplaces
-
Need for a period within which they could review their parking policy before deciding how many spaces they would register
– reduced congestion
Research topics with employees Typical issues for employees
Research with – Current all-day– Like o
would n– Influence of lev– Like
- Availabemployees ility of an acceptable public transport
ff Benefit from scheme - reduced congestion
complementary measures - Other incentives that may help to change behaviour
alternative - Need car for non-work purpose e.g. school pick-
up/drop-o-
travel patterns liho d of paying the levy if employer
ot pay el of charge on behaviour
ly response if not paying the charge - Benefit from
115

GREATER DUBLIN TRAVEL DEMAND MANAGEMENT STUDY
8.97. An alternative option would be to charge the levy on a daily basis, offering
to favour a pay-as-you-go
implementation that
llow rates to be charged on a daily basis, and to allow differential rates57. It
employees the opportunity to question their travel behaviour every day and to make changes when possible. Employers too may be more likely system rather than a once-off annual cost. Research and consultation with employers groups would be important in informing decisions on these issues.
International Experience 8.98. International experience with workplace parking levies is limited. Parking levies have existed since 1992 in various business districts in Sydney, Australia. They are of the order of €500 per annum and are used to fund non-car transport improvements. Although the stated aim of the levy in Sydney is to reduce traffic, there is a question over its effectiveness56. Perth, Western Australia has had “parking licence fees” for many years. They are currently of the order of €100 per annum. Nottingham City Council in England is proposing a City Centre levy of £150 pa rising to £350 pa. A public inquiry on the proposal prior to implementation is due to be held in Spring 2005.
8.99. Workplace parking levies were considered and rejected in London and Edinburgh. By comparison with congestion charging, they were predicted to be lesseffective in reducing congestion and to have more issues inwould take longer to resolve.
8.100. The lack of international experience from which the GDA could learn means that original research within the GDA will be essential to assess the likely response as well as the practical issues associated with implementation.
Administration and Legislation 8.101. Two mechanisms for implementing the levy were considered: through the local authority rates system or through the Revenue Commissioners.
Implementation through the Local Authority Rates System
8.102. It would be possible to “piggyback” on legislation to reform the rates system which is currently being prepared acting on foot of recommendations of the Working Group on the Review of Rating Law, in order to allow car parks to be valued separately, and to a
56
duced
transport. 57Without differential rates, workplace parking charges through the rates system would be a very nominal sum.
The levy is currently A$840-420 (€250-500), so it is not priced sufficiently high for significant impact. The cost of the levy has increased fourfold since it was introduced in 1992, and employers now feel that it has become a burden. Theyalso consider that it has failed to achieve its stated aim of traffic reduction as the number of spaces has not been reand traffic flows have not decreased, although no monitoring takes place. The levy has collected $$216 million since it was introduced, but only A$84 million has been spent. This has been on parking and ferry facilities but not on public
116

GREATER DUBLIN TRAVEL DEMAND MANAGEMENT STUDY
is recommended that the DTO make a formal submission the Working Group on thissue.
is
.103. If the necessary legislative changes are made, there would be advantages to the implementation of a workplace parking levy through the rates system. A system
e so there would be no need to create a nsive
ffice
y would have the ability to vary the levy in accordance with
her the Valuation Office or the local authorities. Estimated set-up and running costs are described in Table 10.4.
ommissioners. A minor disadvantage would be the need to establish a new unit it
8.107. on of a wo , in the regulatory reform legislation currently being drafted by the De rtDepart
8.108. be introdu
8.109. optRevensome Abus e lso tax a
ypothecation of Monies Raised through the Parking Levy Scheme
8.110. Whether the proposed workplace parking levy was collected through the rates system or the Revenue Commissioners, arrangements could be established for the
8
of inspection and valuation is already in placnew organisation. Indeed, the Valuation Office is due to undertake a comprehevaluation of all buildings in the State in the next few years. If the Valuation Owere mandated, it would be a relatively simple task for the Office to include an assessment of the value of a building’s parking spaces as a separate item. The Valuation Office would inform the local authority of the values, as it does now for business rates.
8.104. As with rates, the local authority would issue a bill to the property occupier, and the local authoritlocal circumstance (e.g. cost of public parking) and need, as with, for example, the Development Levies at present.
8.105. The proposed administrative system should not require significantly increased resources in eit
Implementation through the Revenue Commissioners
8.106. A workplace parking levy could also be introduced through the Revenue Cw hin the Revenue Commissioners to administer the levy.
The necessary changes to primary legislation to enable the introductirkplace parking levy is being examined for incorporation, among other changes
comprehensive pa ment of Transport. It is recommended that the DTO liaise with the
ment on the progress of this initiative.
Alternatively, primary legislation to enable the levy could possibly ced within the Financial Act 2005.
How a space would be valued, particularly with the benefit in kind taxationion is an issue, as outlined in Table 8.6. Alternatively, under either option, the
ue Commissioners could take a view on how much to charge. This occurs in ustralian cities where a levy on each workplace parking space in designated
in ss districts is charged to the employer, and where workplace parking is aed s a benefit in kind.
H
117

GREATER DUBLIN TRAVEL DEMAND MANAGEMENT STUDY
funds raised to be hypothecated to public transport improvements, via thDepartment of Transport. An example of successful hypothecation of taxation application o
e is the
f the plastic bag levy. This is collected by the Revenue Commissioners nd hypothecated to the Environment fund, which in turn is used to fund staff to
are currently under discussion, notably in the health sector. Some funds would also need to be allocated to the local authorities for measures to complement and support the workplace parking levy and the parallel workplace travel plan campaign.
Introduction of Residents’ Parking Schemes and Other Parking Controls 8.111. Before a workplace parking levy is introduced, the areas within which the levy will apply need to have parking controls put in place. Otherwise, commuters would simply park within walking distance in residential streets or in other spaces that would be better used by shoppers or other visitors. In other words, parking controls are an essential prerequisite without which a workplace parking levy cannot be introduced. These parking schemes may or may not generate revenue for the local authorities, depending on how much space is priced at commercial rates and how much is reserved for residents and other permit holders. For the purpose of this study, it has been assumed that any parking control schemes introduced to complement the workplace parking levy would be revenue-neutral.
8.112. Outside the City Council area, parking controls are only slowly being introduced at present. Within the indicative implementation programme (see Section 9 of this report), some four years have been allowed in the implementation programme for sufficient parking controls to be put in place. This is considered ambitious given the stages involved: scheme design; consultation; consideration of objections; scheme refinement, detailed design and amendment to traffic regulations; further consultation; implementation; and procurement of enforcement contractors.
Details to be resolved 8.113. Subject to approval and agreement on how the levy is implemented, issues to be resolved would include, amongst others:
• Whether employer registration will result in a good level of compliance, or whether an inventory/database will need to be developed;
• Enforcement system for ensuring the number of spaces registered is correct, which will entail gaining access to private property;
• Treatment of shared spaces and spaces for visitors, customers, deliveries, people with disabilities, pooled cars, company cars and cars/vans used for employers’ business;
• Possible exemption of small car parks, e.g. under 5 spaces; and
aenforce environmental legislation. Others
118

GREATER DUBLIN TRAVEL DEMAND MANAGEMENT STUDY
• Treatment of spaces on a daily basis (i.e. if not all spaces are used
Employer Notification and Review Period s of the impending levy would be a lengthy process
nd would probably need to be by individual letter. Employers would then need a in which to review their parking situation before determining how many
ssfully implement workplace travel plans would be
pay less in levies. The option of some additional “bonus” for employers with successful workplace travel plans could also be considered.
o years
.118. The main risks to the implementation of the workplace parking levy that have
rt and subsequent difficulties in adoption of appropriate
t the high levels envisaged
ion y is adopted; and
• Parking controls not fully in operation.
every day).
8.114. Notification to employeraperiod withspaces they would register for payment either by themselves or by their employees.
8.115. Employers would have many concerns regarding the introduction of a workplace parking levy (see Tables 8.11 and 8.12). It is important that these concerns are aired early on with employers’ groups as part of the general travel awareness process, and the process of putting in place workplace travel plans. During the employer review period, practical guidance and possibly other incentivesto establish workplace travel plans should be offered to all employers.
8.116. Employers who succeindirectly rewarded because they would require fewer parking spaces and consequently would
Timescale 8.117. The task of introducing parking controls is on the critical path for the implementation of the workplace parking levy. All other tasks associated with the proposed levy, including the drafting of legislation, could be achieved relatively quickly, given approval, but parking control schemes generally take about twto be put in place successfully, although experience varies from place to place.
Risks to the Implementation Programme 8been identified include:
• Lack of political consensus or acceptance of the principles set out in this repolegislation;
• Resistance to the introduction of a levy afor travel demand management;
• Potentially low levels of registration, especially if self-declaratwithout an inventor
119

GREATER DUBLIN TRAVEL DEMAND MANAGEMENT STUDY
Other Issues for Consideration before Implementation 8.119. The exemption of workplaces in the rural hinterland from the levy is practical and woul sencouragemeplanning effothe levy to ne orkplace above a certain size, or by stronger regional planning guidance.
8.120. Wh tworkplace pawhich can on concern that discourage emrelocate out oDevelopment Centres where there is a need to attract employment to balance recent
pid housing growth. Research with employers groups (see Table 8.11) would be hether the concern is well founded.
developer may have paid a once-off
rotests. While the proposed package described in Section 9 mostly avoids charging twice by excluding workplaces within the charging zone from the levy,
rging area with a workplace outside the charging area would be
he longer term, a presumption against having both a workplace parking vy and a road user charge would mean that, if the charging area were to be
xpanded in future, the levy would need to be abolished in the expanded area.
charging measure were not to proceed,
.126. Benefit in kind taxation is an alternative to a workplace parking levy which be less effective than a full cost levy, but
would still lead individuals to question their travel behaviour. It is also noted that
d a sist in gaining acceptability. However, it could be seen as financial nt to locate in rural areas which would undermine wider sustainable rts. This potential difficulty could possibly be overcome by applying w development in the rural areas, or a w
ile he strategic transport and socio-economic benefits of the proposed rking level have the focus of this study, there will be other effects ly be assessed by bottom-up consultation with those affected. There is athe existence of a workplace parking levy in a particular area may
ployers from locating in that area, or encourage existing employers to f the area. This concern is most prevalent in the hinterland
raadvisable to assess w
8.121. Under the Development Levy scheme, aparking levy and may therefore challenge an annual levy.
8.122. In the UK, legislation allows local authorities to operate road user charging or workplace parking levies as travel demand management measures. There is a presumption against both measures being applied together. It is sensible to assume that there would be a similar presumption in the GDA, particularly given the potency of the “double taxation” perception argument as shown in the “bin tax” pindividualsresidents of the chaliable to pay both the area licence charge and the levy. People working outside the city who drive into the city for business may also be liable for both charges.
8.123. In tlee
8.124. If the proposed central area congestion the workplace parking levy measure could be extended to cover the area within the canals.
8.125. If, as an interim measure, a City Centre workplace parking levy were to be considered, provision would need to be made for that levy to be removed in the event of congestion charging being introduced at a later date.
8should not be ruled out. It is likely to
120

GREATER DUBLIN TRAVEL DEMAND MANAGEMENT STUDY
workplace parking is taxed as a benefit in kind in Australia, even in parts of Perth
e less effective.
.128. If the levy is delayed, postponed or rejected, there could be less urgency to nt workplace travel plans and other “soft” measures to promote TDM.
e
agenda.
e Tables 8.11 and 8.12); • Information on all day travel behaviour, perhaps by commissioning travel
diary surveys; l demand with respect to workplace
g levies to
to better determine the degree to which a work
ners, or perhaps by some third party; and
and Sydney where workplace parking levies also apply.
Impact of Delays or Failure to Implement 8.127. If the workplace parking levy is not implemented at the level of charge and/or the coverage envisaged, the overall package would b
8implemeMost of the GDA outside the City Centre would then have to rely solely on trafficmanagement and public transport supply to deal with travel demand. Bus operations and passengers would suffer as a result of slower operating speeds andgreater unreliability.
8.129. Failure to implement the levy may give rise to objections that the introduction of a congestion charge in the City Centre is inequitable. On the other hand, thimplementation of congestion charging may be simpler if it were the only fiscal measure on the
Next Steps 8.130. Further investigative work is recommended to inform (political) decision-makers in relation to the introduction of workplace parking charges, as follows:
• Research into likely employer and employee reaction to parking levy or
benefit-in-kind taxation of parking space (se
• Research to determine elasticity of traveparking levy, perhaps by commissioning stated preference surveys;
• Data analysis and extensive DTO model work to enable the above information to be included in the model and for workplace parkinbe modelled;
• Analysis of model outputs place parking charge would contribute to TDM objectives and to define areas most likely to benefit from reduction in car travel and road congestion due to the charge;
• Further consideration of the mechanism for administering the charge – through the rates system (preferred option) or through the Revenue Commissio
• Refine scheme set-up and operating costs including enforcement costs.
121

GREATER DUBLIN TRAVEL DEMAND MANAGEMENT STUDY
8.131. recomm n economic impact assessment of the proposed charge is und t
If following this work a positive decision is made to proceed, it is ended that a
er aken.
122

GREATER DUBLIN TRAVEL DEMAND MANAGEMENT STUDY
123
9 Package of TDM Measures
Packaging o Principles 9.1. TDM meach other rath s, the need to promotivate and s asures will reinforce tthat which wo . It also recognises that one measure on its own will not be able to cover all travel
eeds and transport types.
eloping a package of TDM measures are
attempt to cover all seven aspects of
substantially lower than those which could have been achcar use need to be implemented in conjunction with measures to encourage alte asustain
Types Trip reduction – to reduce the need to travel and thereby reduce overall travel demand.
– to reduce the amount of single occupancy car trips, and increase car occupancy.Increase travel by alternative modes – this includes measures to encourage public tran oTrip reAlte ato le Reduc mployment, retail and other ser e
f Measures
easures are best implemented as 'packages' of measures that reinforce er than as individual measures. This recognises, among other factorvide both 'carrots' and 'sticks' (incentives and disincentives) to ustain travel behaviour change, and the fact that different mehe benefits of other measures thereby achieving a greater impact than uld be achieved if the measures had been implemented on their own
n
9.2. The main principles for devummarised below. s
Address all Travel Change Aspects
9.3. To be successful, a TDM package should travel change, as set out below. If only some of these travel change aspects are addressed, the results may be
ieved and may not be long lasting. For example, measures which aim to reduce
rn tive travel modes to ensure that any reductions in car use achieved are ed.
of Travel Change sought by TDM Programmes
Reduce vehicle use – in particular, to reduce the amount of car travel. Increase vehicle occupancy
sp rt use, walking and cycling in preference to car. timing – to encourage travel at less congested times.
rn tive destinations – to encourage travel to destinations that are closer, and that lead ss overall congestion.
tion in trip length – by planning for the provision of evic s closer to where people live.

GREATER DUBLIN TRAVEL DEMAND MANAGEMENT STUDY
Include a Mix of Integrated Measures
9.4. A properly integrated TDM package will carefully weigh the interactions between different TDM measures and will include measures which:
• Reinforce benefits - some TDM measures strengthen the effects omeasures thereby increasing the total benefit achieved; for examplfinancial incentives for car-poolers will reinforce the benefitscarpooling and ride-matching schemes.
• Mitigate adverse effects – it is possible to mitigate, to a certain extent, the adverse effects of certain TDM measures by implementing complementary measures. For example, a cordon road-pricing schemecould result in cars being parked just outside the cordon zone to
f other e,
of
avoid
n-
Co
9.5. that all TDM programmes which have bee s d a mix of incentives (ca t ve travel modes, and disincentives (sticks) to continue travelling by car. Generally, the 'carrot' and 'stick' must be used togaccompanying parking restraint with incentives to use public transport or to carpool.
Strate9.6.are a number of strategic issues which need to be addressed in designing a TDM
Geographical
9.7.
centres vary markedly. This means that TDM measures which may be applicable in cer nimplementation programme) will therefore need to take this geographical element
the road pricing charge. Instituting a parking restraint scheme (e.g. Controlled Parking Zone) could mitigate this effect by prohibiting noresidents from parking in that area
ntain a Mix of Incentives and Disincentives
International experience has shown n uccessful in changing travel behaviour have containerro s) to reduce car travel or change to alternati
ether to achieve a significant and lasting change. This would mean, for example,
gic Issues In addition to applying the TDM packaging principles identified above, there
package:
Although many transport issues apply throughout the GDA, the intensity of the problem differs between areas and centres. In addition, the characteristics of
tai areas and centres will not be applicable in others. The TDM package (and
into account.
124

GREATER DUBLIN TRAVEL DEMAND MANAGEMENT STUDY
Tem
9.8. ised that the characteristics of areas and centres, and
cas pace of population and employment growth ovewil eline wi
Staged
mo m. In addition, disincentives (sticks) sho d(carr tcar travel such as off-street parking chargwould ideally be implemented in tandem with, or just following, significant
r rail
y TDM package needs to be considered in term out eimpact rkets, for example, City Centre traders would typically be concerned that measures designed to reduce commuter
,
f major trip-intensive land uses in areas well served by public
nt, retail, leisure and other
poral
It also needs to be recognthe transport issues they are facing, will change over time. This is particularly the
e in the GDA at this time given the rapidr the last five years or so. The way in which a TDM package is applied
l n ed to allow for change over time, and include an ability to phase measures in th area/centre characteristics and issues being faced.
9.9. As indicated above, many TDM measures are complementary and will be st effective when implemented in tandeul not be introduced on their own, but rather in conjunction with incentives
o s). This is particularly the case for measures that directly increase the cost of es and road pricing. These latter measures
improvements to public transport services, for example, new light rail lines or majo upgrades.
Trip Market
9.10. The trip market being tackled by ans of purpose (work, school or recreation) and time of day (peak or off-peak). As
lin d in Section 3, tackling peak hour trips to work will result in the greatest . It may be less desirable to tackle other ma
traffic did not also discourage off-peak shoppers.
Measures Included in a Preferred Package 9.11. Based on the analysis discussed in Sections 6, 7 and 8 of this report, a Preferred Package of travel demand management measures that could be implemented in the short to medium term would include the following:
• Land use planning measures:
• Consolidation of residential population in existing built up areas in the GDAregion, where accessibility to work, leisure and other destinations by footcycle and public transport is generally better;
• Location otransport;
• Grouping of key trip destinations (employmeservices such as hospitals) in defined district or town or city centres (higher order Urban Centres);
125

GREATER DUBLIN TRAVEL DEMAND MANAGEMENT STUDY
• Relating the scale of district and town centres to their public traaccessibility;
nsport
new developments with walking, cycling and public transport in mind;
new developments to public transport accessibility, and proximity to nearest centre; and
um ic
place travel plans;
• av
• Individual marketing; and
• Virtual mobility.
• Fiscal measures:
• Workplace parking levy; and
• Central area road user charging
9.12. In addition, the existing strategies relating to bus priority, walking measures, cycling measures, traffic management measures and integration measures need to continue to progress in support of travel demand management.
Fitting together the Package 9.13. In fitting together the package, a few key points apply:
• Best practice in land use planning, as described in Section 6 of this report, underpins the strategy in the long term;
• Work-related measures are the most powerful of the measures to promote travel demand management, and the planning system can ensure these measures are put in place for future development;
• School travel plans are important, but have a smaller overall role;
• There is a direct synergy between the workplace travel plans (and other work-related measures) and the workplace parking levy. Workplace travel plans would make it easier for employees that have to pay a levy to give up driving;
• Workplace travel plans and school travel plans may assist thosewishing to change mode as a result of the congestion charge but are
• Providing a mix of local services within walking distance of their surrounding neighbourhood;
• Designing all
• Relating the density of
• Regional maximum parking standards, with further restrictions in maximpermitted parking provision for new developments, related to publtransport accessibility, and proximity to the nearest Urban Centre.
• Measures to promote TDM:
• Work
School tr el plans;
126

GREATER DUBLIN TRAVEL DEMAND MANAGEMENT STUDY
less important as the City Centre is already well served by public transport;
the
possible to totally rivers that have workplaces outside the o or from the City Centre during the
both
lemented together or independently. In
challenging
Complem n 9.14. “ComplTDM measure n which the TDMacceptable, and
9.15. Examplthe TDM meas
• City Centrjunctions on the Outer Ring Route are adjusted;
• F rkp ls will be required in all areas whe
• For school travel plans or w example, footpaths p es if
y pro r oor sta
9 ples of complementary me res whi ay be requi to make the TDM measures acceptable:
Traffic management measures in residential a eas (or other s sitive areas) toh traffic diversio esul gestion c g;
ing measures in areas on th ngestio arging zone undary to de“informal park and ride” or park and walk; and
in th rlan elopment s e.g. finort for a travel plan which ld off-set the workpla arking levy a
provide a level playing field with employers outside the workplace levy area 9.17. The above examples are all directly related to the proposed TDM measures, and probably would not take place otherwise. Other complementary measures are
• Including both the congestion charging and workplace parking in package achieves balance because all the urban areas would be subject to a fiscal measure. In the Preferred Package, there would be no workplace parking levy in the proposed charging zone to minimize double charges but it would not be eliminate double charging. Dcharging area but who travel thours of operation of the congestion charging scheme would paycharges. In theory, both the workplace parking levy and the congestion charge can be imppractice, introducing two fiscal measures simultaneously would be
e tary Measures
ementary measures” are measures that support TDM or that make s possible to introduce. They would provide some of the detail upo
measures will stand or fall, by making the TDM measures /or effective.
es of potential complementary measures that may be required to make ures effective:
e congestion charging will be more effective if traffic signals on the
or the wo lace parking l ve, on-street parking controevy to be effectire the levy is applied; and
orkplac l plans ective, investment e traveproach
to be effto the site mayin, for on the a be required
footpaths are not alread vided o are of a p ndard.
.16. Exam asu ch m red
• r en
deter throug n as a r t of con hargin• Park e co n ch bo ter
• Reward for employers e hinte d dev centre ancial supp wou ce p nd
127
GREATER DUBLIN TRAVEL DEMAND MANAGEMENT STUDY
perhaps less specific. As discussed in Section 4, the proportion of survey ed
missions, most required improved public transport, park and ride, walking and cycling
cilities. Many made a point that they would oppose congestion charging in se “supply-side” measures are ot specifically related to the
get for complementary measures would be required to bring
d not otherwise be implemented within e TDM programme, or which would not be covered by existing proposals.
udes candidate complementary measures which may
of
rom car;
• To make bus services more attractive; and
improve public transport.
Additional priority given to sals
us travel faster (although bus speeds would increase anyhow due kage); an
strate that monies raised f al measures would be used to transport;
Lower public transport fare
transport more attractiv
• To “give back” something in return for charging;
(in addition to any current commitments by local
e;
less of
the Department of Transport);
• Integrated fares, to avoid penalising for changing services; and
respondents who supported fiscal measures increased if the money raised was usto fund public transport improvements. Of those who made written sub
faadvance of improved public transport. Many of theincluded in A Platform for Change and are therefore nTDM measures. They may or may not proceed regardless of the introduction of travel demand management, and should not be budgeted for under the TDM initiative. However, it would be wise to assume that if demand management wereto be introduced, a budforward supply-side measures which woulth
9.18. The following list inclneed to be funded in order to implement the proposed TDM package:
• Additional buses (over and above those which Dublin Bus/DepartmentTransport intend to provide to deal with growing demand and improvingaccessibility):
• To carry the extra passengers transferred f
• To demonstrate that monies raised from fiscal measures would be used to
• buses (beyond current QBN propo ):
• To make bto the TDM pac d
• To demon rom fiscimprove public
• s:
• To make public e: and
• Park and Ride facilities authorities or other agencies):
• To improve access to public transport for people not within walking distanc
• Better integration of public transport :
• Integrated ticketing, so that no more than one ticket is required, regardthe number of service changes (as being developed by the RPA on behalf of
128

GREATER DUBLIN TRAVEL DEMAND MANAGEMENT STUDY
• Integrated travel information across all public transport, including real timepassenger information;
• Pedestrian improvements, or other a
menity (in addition to any current
ly d e
improvements to the pedestrian environment in the centre of Dublin;
cal road improvements (in addition to current
d th and South Circular Roads if an area licence
was r
• Parking n by the local authorities):
• May be needed around the edge of an or in
and cultural activities.
9.19. The assessment of the impact of the proposed measures discussed in Section 10 of this report does not includeadditional s not identified s may have positive or
egative transport impacts, in addition to the impacts of the preferred package ater in this Section of the report. The assessment does, however, include
ded in the 2008 DTO model (see Section 2), some of
t
the ll additional to any current commitments by
cal authorities:
• Pedestrian improvements, or other amenity;
• Traffic management and local road improvements; and
• Parking controls around the edge of an area in which road users are charged and in the areas in which workplace parking levies apply.
commitments by the local authorities):
• Space released as a result of less traffic demand can be reallocated to pedestrians. For example, Trafalgar Square in London was partialpedestrianised shortly after congestion charging was introduced. It is notethat City Centre organisations which were consulted would like to se
• Traffic management and locommitments by the local authorities):
• Junction improvements, traffic signal adjustment etc. to deal with changetraffic patterns, e.g. on the Nor
int oduced;
co trols (in addition to current commitments
area in which road users are charged, an area in which workplace parking levies apply;
• Off-setting reductions in other charges or taxes; and
• Non-transport measures, for example,
• A marketing initiative to ensure the City Centre remains a vital and vibrantcentre for shopping
specific complementary measures, such as bu services or traffic management measures, as specific measures were
during the study. The complementary measurendiscussed lall measures which are incluwhich will complement TDM, although not specifically proposed as such.
9.20. As complementary measures are integral to the proposed TDM package, thecost estimate described in Section 10 of this report (see Table 10.4) includes a budgefor complementary measures. In general terms, this budget is intended to cover following items from the above list, alo
129

GREATER DUBLIN TRAVEL DEMAND MANAGEMENT STUDY
9.21. The oth go ld be appropriate to finance
• easures, for examp ting es t the ntre for g and l act d
•
would
of
age
er two cate ries of complementary measures which wou from the TDM budget include:
Non-transport m le, marke initiativ o ensure iv n
City Ceremains a vital and vibrant centre shoppin cultura ities; a
Additional buses.
The Overall Programme 9.22. For the purpose of appraisal a possible annual programme for the implementation of a Preferred Package of TDM measures by the year 2008 was developed, which is shown in Figure 9.1. This is a work programme whichbe technically possible although other considerations might extend it. Issues of implementation for each category of measure are described in previous sections this report.
Figure 9.1 Possible Implementation Programme for a Preferred Pack2004 2005 2006 2007 2008
Approval for draft TDM strategy
Land use planning measuresTT
DM recommendation embedded in the Regional Planning GuidelinesDM recommendations reflected in development plans
"Soft" measureResourcing for iIncreased activity to establish school travel plansDevelop awareness within LA through the Corporate Strategy Plan processEstablish blueprint workplace travel plansIssue guidelines and training (DTO to lead)Workplace travel plan campaigns begin in blueprint areaOther local authorities establish Workplace travel plansOther local authorities establish workplace travel plan campaignsIndividual marketing exercise in City CentreOngoing roll-out of new plans and monitoring of existing
Workplace parking chargesNominate agency for administration and enforcementObtain changes to primary legislation including Regulatory Impact Assessment*Set-up inventory and inspection unitInventory of workplace parking provisionEstablishment of secondary legislation and regulationsEstablishment of on-street parking controlsEmployer review and registration periodCharging begins
City Centre Road User Area LicenceApproval in principleAwareness campaign Primary legislation including Regulatory Impact Assessment*Scheme design (inc. complementary measures)Scheme review (inc. consultation) and refinementApproval to proceedDetailed designProcurementInformation campaignComplementary measures implementationSystems implementation
TDM policies become practice
sncreased support from a central agency (eg DTO)
Charging begins* In accordance with Regulating Better: A Government White Paper setting out six principles of Better Regulation , Department of the Taoiseach, January 2004
130

GREATER DUBLIN TRAVEL DEMAND MANAGEMENT STUDY
Transport Impacts 9.23. Due to the introduction of Luas and improved suburban rail services, the
hour (8am – to increase from some 30,000 to over 47,000. Luas is forecast to carry almost 27,000 passengers during the morning peak hour in the year 2008
T act of the m re9 ws the impact Prefer ackage i ucing ov morning peak hour vehicle-hours in the year 2008 and the contribution of each of the individual components. It can be seen that:
• The congestion charge is the most powerful measure within the M50;
and the workplace parking levy have spread more consistently58; and
possibly some le will
public transport offering in 2008 will be very different to now. In the morning peak 9am), the number of peak rail boardings is forecast by the DTO model
.
he progressive imp easu s .24. Table 9.1 sho of the red P n red erall
• The measures to promote TDMa smaller effect, but it is
• The effect of the package is less than the sum of individual measures due to double counting effects (e.g. people who have already stoppedusing the car due to the levy and to measures to promote TDM would not be affected by the congestion charge), some induced car traffic (for some trips, car travel would become more attractive as travel speeds improve so people will switch back to car) andpeak hour contraction (due to improved travel times some peopnow be able to complete their journey with the 8am-9am period whereas previously their journeys were taking longer)
Table 9.1 Progressive Impact of Measures in the Morning Peak Hour
(8am –9am) 2008 Reduction in Vehicle Hours compared with base 2008
TDM Option All GDA Inside canals
Between canals and M50 Outside M50
Vehicle-hours in base (see Table 2.3) 248,091 17,607 64,281 166,203 Measures to pr 160,870 omote TDM 239,713 16,988 61,855 % reduction 3% 3% 4% 4% Congestion charge at €10 12 1,509 232,877 ,144 59,224 16% reduction 6% 31% 8% 3% Workplace parking levy 22 6,676 16 80 ,381 58,516 151,7% reduction 9% 7% 9% 9% Preferred package (all of above but no levy within canals) 218,302 11,704 55,586 151,012 % reduction 12% 34% 14% 9%
58 In common with most transport planning models, the DTO Model is more detailed in the central area and becomes less
detailed further from the centre, so that the areas outside the metropolitan area are modelled in outline only. The greater the level of detail, the greater the level of certainty regarding the model outputs.
131

GREATER DUBLIN TRAVEL DEMAND MANAGEMENT STUDY
9.25. In practice, the measures to promote TDM should ideally accompany the
troduction of either congestion charging or a workplace parking levy.
Reduction in the Growth Rate of Overall Travel 9.26. Without demand management measures, private car trips are forecast to grow at 2% per annum between 2001 and 200859. The introduction of the Preferred Package would be equivalent to a reduced rate of growth of 0.5% per annum over the seven-year period.
Transfer from Private Car 9.27. As shown in Table 9.2, the Preferred Package is expected to remove almost 25,000 private vehicle trips from the GDA road network in the morning peak hour, which is equivalent to around 10% of total private vehicle trips in the year 2008. Almost 25,000 car drivers and passengers would transfer to public transport as a result of the Preferred Package. Increased bus speeds would be a factor in attracting more passengers to public transport, as bus speeds are forecast to increase from 14.3kph to 16.5 kph with the Preferred Package.
Table 9.2: Effects of the Preferred Package on Mode Choice in the Morning Peak
Hour (8am-9am)
in
Comparison with base case in 2008 Private vehicle trips in AM peak hour % Reduction Preferred package 212,829 10% No demand management 236,972 Public transport trips in AM peak hour % Increase Preferred package 158,882 19% No demand management 134,054 Average AM peak hour bus speed (kph) % Increase Preferred package 16.5 15% No demand management 14.3
Public Transport Capacity 9.28. The effect of the TDM package is to increase public transport patronage throughout the GDA. Examination of the future public transport network in 2008 showed that some 50 bus routes, distributed throughout the network, would suffer from overloading in the morning peak hour in 2008, even with the rail improvements and the introduction of Luas. The impact of additional public transport passengers would worsen any forecast overcrowding, but no specific areas
59 From DTO model number of car trips
132

GREATER DUBLIN TRAVEL DEMAND MANAGEMENT STUDY
were identified that were forecast to suffer a significantly greater impact thas a result of the TDM package. In other words, overloading is forecast to
an others be spread
hortage of public transport supply in 2008 as a result of the TDM
ther Behavioural Responses 9.30. ansport planning models, not all potential behavioural responses to the congestion charge are included within the forecasting model
• Transfer to modes other than public transport such as cycling and
esult of
ses:
share);
itch to walking; and
Reduction in the number of trips made to the charging zone (either
Reduction in Congestion 9.32. The Preferred Package would remove some 30,000 vehicle-hours from the network in 2008, representing an overall 12% reduction in total vehicle-hours and
ure 9.2 show, the reduction, at 34%, would be greatest greatest, an le
around the network, with or without TDM.
.29. Any s9package could be resolved by increasing bus capacity throughout the network. Someincreased capacity required should arise as a result of increased bus speeds which should result in better fleet utilisation. This is also true for Luas, especially the Tallaght line, as the trams would also have faster speeds where they run on-street.
OIn common with most tr
60. The possible responses are:
• Trip retiming and trip suppression;
• Change of trip origin or destination; and
walking which are not modelled
9.31. These responses are discussed in detail in Appendix L. Briefly, it is estimated that, based on the London experience, the forecast reduction in traffic entering thecanals might be underestimated by some 15-25% (relative to total trips) as a rthe following respon
• Transfer to other forms of transport (motorcycle61, cycle or car
• Sw
•suppressed or diverted to other destinations).
resulting in very significant travel time savings. As Table 9.3 and Figin the City Centre, where congestion is
d ss in the outer areas.
60 They are imp t
and the measures61 Motorcycles do not pay the congestion charge in London. It is proposed that they are exempted from the forthcoming
charge in Stockholm. Motorcycles do not currently pay at the Eastlink toll bridge in Dublin.
lici ly included in the policy model which calculates the car trip reduction due to the workplace parking levy to promote TDM
133

GREATER DUBLIN TRAVEL DEMAND MANAGEMENT STUDY
Table 9.3 Total 2008 AM Peak Hour Vehicle-Hours Comparison with the base situation in 2008
Preferred Package All GDA Inside canals
Between canals
and M50 Outside
M50 Vehicle hours in able 2.3) 248,091 17,607 64,281 166,203 base ( see TVehicle hours with mea 2 11,704 55,586 151,012 sures 218,30% reduction v in ehicle-hours 12% 34% 14% 9%
9.33. Figure 9.2 shows that the reduction in vehicleCity Centre n t of the City Centre, due to traffic diverting onto Macken Street Bridge and Eastlink.
arts of the M50.
9.34. The t e reduction in the number of hvehicle flow na point when tConversely, a improvement in traffic speeds. Much of the GDA road network is over loaded in the morning pe from the netw
Figure 9.2 Cha
Yea
-hours would be greatest in the , a d the southeast. Vehicle-hours are forecast to increase to the Eas
Some increased vehicle-hours would also be expected on p
fac that the reduction in vehicle-hours is greater than thve icle trips is accounted for by the non-linear relationship between
a d speed. As traffic flows increase, speeds fall disproportionately until raffic flow becomes unstable and traffic may stop moving. small reduction in traffic flow may produce a relatively large
ak hour, with unstable flow conditions. Therefore, removal of some trips ork results in a disproportionate reduction in vehicle hours.
nge in Vehicle-hours in the Morning Peak Hour (8am-9am) in the r 2008 with a Package of TDM Measures
9.35. As Table 9.4 shows, average car speeds across the entire GDA would increase from 26.4 kph to 28.5 kph as a result of the Preferred Package, an improvement of
134

GREATER DUBLIN TRAVEL DEMAND MANAGEMENT STUDY
8%, which uaverage speed crease of 16%.
Table 9.4 Forecast Change in Car Speeds in the Morning Peak Hour (8am-9am)
in the Year 2008 with a Package of TDM Measures
wo ld result in shorter travel times for commuters. Within the canals, s would increase from 10.2 kph to 11.9 kph, an in
Comparison with the base situation in 2008
Preferred Package All
GDA Inside canals
Between canals and
M50 Outside M50 Average speed (see Table 2.3) 17.9 31.4
in base (kph) 26.4 10.2
Average spe(kph)
ed with measures 28.5 11.9 18.5 33.2
% increase in speed 8% 16% 3% 6% Reduction in Vehicle-km Travelled 9.36. As Table 9.5 and Figure 9.3 show, the Preferred Package would remove over 335,000 vehicle
r s
9.38. The overall reduction in vehicle-km is less than the overall reduction in vehicle trips or vehicle-hours. This is primarily because some of the traffic remaining on the road network will seek longer routes to avoid the congestion charge.
Table 9.5 Total Vehicle-km in the AM Peak Hour, 2008
-km from the road network in the morning peak hour in 2008; this isequivalent to a 5% reduction in overall vehicle-km. The reduction in vehicle-km within the canals would be 23%, and 8% within the M50. Outside the M50, a smallereduction in vehicle-km of 4% is forecast which should be regarded as indicative athe model is much less detailed in most of the area outside the M50.
9.37. Figure 9.3 shows the forecast reduction in vehicle-km across the GDA. Reductions are greatest within the M50 and in the rail corridors. Increased vehicle-km are expected in the area to the east of the City Centre as traffic would divert ontothe Macken Street Bridge and Eastlink.
Comparison with the base situation in 2008
Preferred Package All GDA Inside canals
Between canals
and M50 Outside
M50 Vehicle-km in base (see Table 2.3) 6,553,167 179,437 1,151,621 5,222,109 Vehicle-km with package 6,217,577 138,987 1,060,952 5,017,638 % reduction in vehicle-km 5% 23% 8% 4%
135

GREATER DUBLIN TRAVEL DEMAND MANAGEMENT STUDY
F of TDM
igure 9.3 Change in Vehicle-km in AM Peak Hour (8am-9am) in 2008 with a Package Measures
136

GREATER DUBLIN TRAVEL DEMAND MANAGEMENT STUDY
10 Appraisal of a Package of Measures
Overview
roach to appraisal of the TDM measures is detailed in Appendix M. cono anc d ben ated w
e have been identified and quantified. This package consists of a tion charge of €10 per day, a workplace parking levy and a set of
tr nd m t.
10.1. The appIn summary, the ePreferred Packag
mic and fin ial costs an efits associ ith a
City Centre congesmeasures to promote
avel dema anagemen
The Preferred Package • Land Use Planning Measures • Measures to Promote Travel Demand Management • A City Centre Congestion Charge of €10/day applicable within the canals • A workplace parking levy in the rest of the Metropolitan Area and the
Development Cen at market rates for park e localtres set ing in th area
10.2. An appraisal oundertaken (“Reducethe conge
f a package without the workplace parking levy has also been d P ”), an raisal of e with y and
stion charge set at €5 (Reduced Package 2”). Other variations have also will be discussed later in this section under the piece on
e economic and financial analysis results are presented separately.
mic and financial appraisal is based on a series of assumptions, w, relating to the following:
The transport and environmental benefits;
al and operating costs; and
Revenues.
ironmental costs and benefits include:
• A reduction in car operating costs associated with those trips diverted to public transport;
• A reduction in road traffic accidents due to a reduced volume of traffic (as measured by millions of vehicle kilometres on the road network);
• Environmental benefits from reductions in emissions and noise impacts from car traffic;
ackage 1 d an app a packag no lev
been examined andsensitivity analysis.
10.3. Th
Assumptions 10.4. The econowhich are set out belo
•
• Capit
•
0.5. The transport and env1
137

GREATER DUBLIN TRAVEL DEMAND MANAGEMENT STUDY
• Val b ssociated with a reduction in private car hours on the road network;
• Road decongestion benefits to non car users (pedestrians, cyclists and bus passengers) associated with reduction in traffic on a congested network;
• Increased public transport subvention associated with increased public transport trips; and
• Reductions in bus operating costs due to improved operational speeds on the network.
10.6. Cost parameters adopted for the appraisal include:
• Value of time (non-working time) €6.89 per hour62;
• Vehicle operating costs of €0.1825 per kilometre derived from analysis of AA Ireland and GDA car fleet sourced from Department of Environment & Local Government - Irish Bulletin of Vehicle and Driver Statistics 2002, (2003);
congestion benefits valued at 0.119 cents per kilometre K research undertaken by the Strategic Rail Authority;63
ssenger for rail and €0.38 per passenger for bus (based on
64
10.
erived from the canal cordon
Road traffic accident data and values derived from the accident rates reported by the NRA65 on the GDA national roads (N1, N2, N3, N6,
) of 7.3% fatal, 13.8% serious injury and 78.9% minor % serious injury and 73% minor
fatality), €180,473 (serious)
ue of time enefits to existing road users a
• Traffic debased on U
• Estimated levels of public transport subvention in the GDA of €1.29per paanalysis of Iarnród Éireann and Bus Átha Cliath data);
• Cost parameters adopted for the appraisal include:
7. Other assumptions include:
• Average car occupancy rate of 1.23 as dcounts (2001);
•
N7 and N11injury; on all roads 1.4% fatal, 25.6injury and accident costs of €1,453,871 (and €17,288 (minor);
Application Rules for Transport Infrastructure Projects”- Report to the TAP
aluator by DKM Ltd Economic Consultants Feb 1994. Updated to 2004 values ps in the modelled period are travel to work trips, 15% are travel to education and
a to apply the value of non-working time generally for the appraisal. Travel to work
63 D n on a congested network. These ar removed from the network (i.e. journey time
eb.
65 Road Accidents Facts Ireland 2002, NRA, November 2002.
62 Based on “CBA Parameter Values and Steering Committee by the External Evfor the current study. As 80% of tri5% re “other” trips, it is reasonable is conventionally regarded as non-working time. eco gestion benefits are those accruing to non-car road users as a result of reduction in traffic
e additional to the savings that apply as a result of vehicle-hourssavings).
64 Includes data from annual reports of the CIÉ subsidiary companies and data contained in the Strategic Rail Review (F2003).
138

GREATER DUBLIN TRAVEL DEMAND MANAGEMENT STUDY
• Road user congestion charge applies Monday to Friday oexcluding b
nly, ank holidays, i.e. 252 days per year;
• 2008 market shares in the GDA for rail and bus of 43% and 57% sed on DTO modelling analysis;66
• The congestion charging revenues collected in the 8am-9am period s collected during
r of 2.3 applied to the benefits because vehicles only need to
2.3 to represent benefits accrued during the rest of the morning peak 2003.
bPM peak
y assets associated with the Congestion Charge scheme have omic life of 12 ye eafter requiring complete renewal.
nd noise impacts are an area not well developed in Ireland vis-raisal. However, the een some work undertaken
oject67 which provides a useful resource. Specific research road transport in the Irish context to
s per vehicle kilom For this study, the value ofs obtained by multiplying the reduction in car kilometres on
reenhouse gases.
respectively ba
modelled, are factored by 2.2 to represent revenuethe rest of the operating period (7am-10am). This is slightly less thanthe factopay once, but can make multiple trips;
• The benefits accrued in the 8am-9am period modelled are factored by
period. This factor was derived from the canal cordon count for The ene esentfits are also factored by two to repr
period; and the return trip in the
• The kean econ
10.8. Air pollution a
ars, ther
à-vis transport app re has b for the Cork Suburban Rail prwas undertaken to assess emissions from develop emission ratepollution benefits wa
etre.68 air
the road network by the estimated values per tonne. The emission rates and values that have been adopted for this study are a mixture of “local” air pollutants and g
rail includes DART, Luas and suburban IÉ se66 Where rvices.
67 Cork Suburban Rail Feasibility Study – Final Report, Faber Maunsell, December 2002. 68 This i
Memcond metre and values were estimated based on a
terature review of undertaken by ECMT and conversion of these to Irish prices.
nvolved use of the COPERT III model developed by the European Environmental Agency as an aid to ber States in calculating emissions from road transport. Faber Maunsell calibrated the model to Irish itions and derived estimates of volumes per vehicle kilo
li
139

GREATER DUBLIN TRAVEL DEMAND MANAGEMENT STUDY
Ta ebl 10.1 Emission Rates from Road Vehicles and Emission Values (2004 prices) Emission Type Tonnes per Million Vehicle
Kilometres (2000) Value of Emissions in € per
Tonne (2004) Carbon Mon n.a. oxide (CO) 5.99 Oxides of n 6,827 itrogen (NO 0.81 X)Non methacompounds (NMVOC)
6,827 ne volatile organic 1.16
Methane (CH4) 0.07 n.a. Nitrous oxide (N20) 0.03 n.a. Free Ammonia (NH3) 0.06 n.a. Carbon Dioxide (CO2) 169.80 65 Sulphur dioxide (SO2) 1.16 1,092
10.9. Noise pollution impacts are a problematic area of assessment due to the differences between localized nature of many impacts and the influence of population dispersal. However, the approach adopted was to apply standard per vehicle kilometre values derived from ECMT research.69 A per million-vehicle kilometre noise ost
10 lling output data has been used in the estimation of costs and benefits is shown in Table 10.2, and graphically in Figure 10.1.
pollution c of €24,633 has been adopted.
.10. The mode
69 This research was sourced from the Cork Suburban Rail study cited earlier.
140

GREATER DUBLIN TRAVEL DEMAND MANAGEMENT STUDY
Table 10.2 Summary of Transport Impacts used in Estimation of Costs and Benefits Package 2001 AM 2008 AM Peak
Hour with no 2008 AM Peak Peak Hour Hour with TDM TDM
Change % Change
Vehicle-km Reduction Preferred Package €10 Congestion Charge, workplace 4.33 million 6.55 million 6.parking levy + TDM support measures
22 million 335,590 5.1%
Reduced Package 1 €10 Congestion Charge + TDM support 4.33 million 6.5
mea r
5 million 6.41 million 138,849 2.1%
su es Redu€5 C g+ T mea r
43 million 118,709 1.8%
ced Package 2 on estion Charge 4.33 million 6.55 million 6.DM support su es
Vehicle-hours Reduction Preferre€10 CoCha ,par sup t
1 218,302 29,789 12.0%
d Package ngestion
rge workplace king levy + TDM
146,433 248,09
por measures Red€10 n+ TD mea r
232,877 15,215 6.1%
uced Package 1 Co gestion Charge M support 146,433 248,091
su es Redu ckage 2 €5 C g
s 12,744 5.1%
ced Paon estion Charge 146,433 248,091 235,347 + TDM upport
measures Peak hour public transport trips Increase Preferred Package €10 Congestion Charge, workplace parking levy + TDM support measures
115,415 134,054 158,882 24,828 18.5%
Reduced Package 1 €10 Congestion Charge + TDM support measures
115,415 134,054 153,202 19,148 14.3%
Reduced Package 2 €5 Congestion Charge + TDM support measures
115,415 134,054 143,628 9,574 7.1%
141

GREATER DUBLIN TRAVEL DEMAND MANAGEMENT STUDY
Figure 10.1 Impacts in 2008 compared with Base
0
2
4
6
8
10
12
14
16
18
20
Cost Assumptions 10.11. The capital and recurrent cost streams have been estimated for the following:
Congestion Charge:
• Capital costs of establishment of the scheme – video cameras, street / roadside furniture, signage etc;
• Area-wide education / awareness programme; • Complementary traffic management measures; • Administrative costs; and • Scheme operation costs.
Work Place Parking Levy:
• Inventory and database development costs; • Education / marketing / awareness programme; • Scheme administration; and • Complementary traffic engineering works.
Measures to promote TDM:
• Establishment costs; • Scheme launch costs; • On-going and follow-up promotion and monitoring; and • Complementary traffic engineering works.
10.12. These costs include a number that would be ‘one-off’ costs and others that would be annually recurrent costs. Expenditure profiles have been estimated for
% c
hang
e
€5 CC + TDM support measures €10 CC + TDM support measures €10 CC + WPPL + TDM support measures
TDM Impacts in 2008 compared to 'without' TDM in 2008
Reduction in car kms Reduction in car hrs Increase in PT trips Reduction in private car trips Increase in bus speeds
142

GREATER DUBLIN TRAVEL DEMAND MANAGEMENT STUDY
some of the items as, for all measures, it would be necessary to incur some costs prior to im io
Revenue Assumptions 10.13. Revenues associated with the packages would come from:
• Congestion charge fees for travel across and within the zone bounded by the canals; and / or
• Graduated levies on employer provided car parking spaces across the GDA
10.14. Table 10.3 indicates the number of trips for which a congestion charge is paid.
Table 10.3 Trips for which the congestion charge is paid (year 2008)
plementat n.
Non-resident cars entering or passing through canals / cordon in peak hour*
Cars originating within the congestion charging zone*
Preferred Package €10 Congestion Charge, workplace parking levy + TDM support measures
25,968 16,949
Reduced Package 1 €10 Congestion Charge + TDM support measures
26,135 16,949
Reduced Package 2 €5 Congestion Charge + TDM support measures
28,578 18,738
*Based on the DTO model for the year 2008 which is projected from the 2001 DTO Model where figures for trips to work in the City are based on a DTO sample employment survey and estimate of number of workplaces
10.15. Workplace parking levy revenues were calculated as follows:
• The number of car work trip destinations in a levied zone in each local authority area in the year 2008 was identified from the DTO transportation
to
ered for the levy which would then be paid by either the employer or the employee (refer to Paragraphs 8.8 of this report); and
model as follows: o Dublin City Council: 38,120 o Dun Laoghaire – Rathdown: 19,062 o Fingal Co.Co.: 30,098 o South Dublin Co. Co.: 16,008 o Kildare Co. Co.: 8,305 o Meath Co. Co.: 1,008 o Wicklow Co.Co.: 6,121
• 75% of these trips were assumed to have free workplace parking (referParagraphs 8.8 of this report);
• 75% of the spaces that are currently free were assumed would be regist
143

GREATER DUBLIN TRAVEL DEMAND MANAGEMENT STUDY
• An average levy70 for each local authority was assumed as follows (see Table 8.8):
o Dublin City Council area: € 2,000 per annum o Dublin Counties € 1,000 per annum
Hinterland Counties71 € 500 per annum
o
conomic Appraisal
l
E Costs and Benefits associated with the Preferred Package 10.16. The estimates of costs associated with the Preferred Package for the first fulyear of implementation (2008) are set out in Table 10.4. Further background to the costing assumptions, including assumptions related to complementary measures, is given in Appendix N.
Costs Associated with Preferred Package Table 10.4
Item € million Capital Costs Congestion Charge System set-up – over 3 years 50 Complementary traffic management measures – over 2 years 44 Education / awareness programme – one-off 5 Work Place Parking Levy Inventory & database development – one-off 1 Complementary traffic management measures – over 3 years 25 Education / awareness programme – one-off 1 TDM Support Measures Establishment costs – one-off 2 Complementary traffic management measures – over 3 years 25 Launch costs - one-off 1.5 T otal Capital Costs (over 3 years) 154.5 Recu rrent Costs C ongestion Charge S cheme administration – recurrent 5 pa Scheme operations – recurrent 60-120 pa Work Place Parking Levy S 1.3 pa cheme administration – recurrent TDM Support Measures S cheme administration – recurrent 1.0 pa Total recurrent costs 67-127 pa
10.17. Establishment costs of the congestion charging scheme represent approximately two-thirds of the total capital expenditure associated with the Preferred Package (€99 million out of €155 million). Furthermore, the annual operating costs of the congestion charge far outweigh those associated with the other 70 The actual levy would be in line with the market value of parking in the local area 71Applies to development centres in the Hinterland only
144

GREATER DUBLIN TRAVEL DEMAND MANAGEMENT STUDY
measures combined and are likely to account for over 95% of the annual operating costs of the P k
10.18. The cost estimate assumes that the economic-life for the congestion charging equipment is 12 years thereafter renewal is required. Given the total recurrent cost range of €67 – 127 million per annum, we assumed a mid range estimate of €97million per annum for the purpose of the appraisal.
10.19. The annual operating cost (recurrent cost) of the scheme has been based on the scheme currently operating in London. The actual annual operating cost will be a function of various factors including:
• the number of cameras used;
• the number of entry points to the charging zone;
• the supporting roadside facilities and street furniture used;
• the peak volume of transactions and other data to be processed (a function of vehicle flows)
• the hours of operation;
• the administration and enforcement technology and level of automation;
10.20. The data currently available indicates a ‘best estimate’ of annual operating costs of evel of around €120 million. Extensiv erway in London and in mainland Europe to identify more efficient mecha r ucharges in urban areas, so it is possible that evolvin nolog er syapplication will lead to lower operating costs for n ch hemesGiven the level of uncertainty associated with operating costs, these have been s om d financ pects of a
10.21. major source of economic benefits a e der from tra e and t decongestion benefits for existing road users (cars, buses, cyclists and pedestrians) associated with an enhanced road network. Important positive externalities are also a i dents an uctions pollutioa
referred Pac age.
• the enforcement and penalty regime adopted;
• the customer interface system implemented; and
• the contractual mechanisms adopted for system operation.
€97.5 million with a ‘lower’ range of circa €60 million and an ‘upper’ le research efforts are und
nisms fog techngesti
collecting roady and widarging sc
ser stem . co o
ubjected to sensitivity analysis for both the econppraisal.
ic an ial as the
Table 10.5 and Figure 10.2 show that the thosssociated with the Preferred Package are ived vel tim raffic
ch eved via a reduction in road traffic acci d red in air ns nd noise impacts.
145

GREATER DUBLIN TRAVEL DEMAND MANAGEMENT STUDY
Table 10.5 Unpriced Benefits Associated with Preferred TDM Package (Annual) Item € million Benefits Vehicle operating cost savings (cars only) 53 Road traffic accident savings 47 Environmental benefits 20 Travel time savings & road user decongestion (car, bus, cycle and walk) 313 Increased public transport subvention -22
146

GREATER DUBLIN TRAVEL DEMAND MANAGEMENT STUDY
Fig e ure 10.2 Sources of Economic Benefits of the Preferred Packag
€ 0 € 50,000,000 € 100,000,000 € 150,000,000 € 200,000,0 ,000,000 € 300,000 € 250 00,000 € 350,000,000
Vehicle operating cost benefits
cident benefits
Road users
Sources of Ec nefits
0.22. Although the increased use of public transport is mainly a positive outcome,
e
, any reduction in perating costs or fleet sizes is not taken into account in the calculation of the
additional bus subvention required.
otential fleet size uld be
kph
ing operating costs are directly related to both peak hour patronage and to fleet size, the net effect of an 18.5% increase in peak hour patronage (see Table 10.2) and a 12% reduction in fleet size, would be a 4.3% increase in operating costs. A 4.3% increase in annual operating cost for Dublin Bus would be around €9 million, based on an annual operating cost of €207 million73. This cost increase is considerably less than the €22 million increase in subvention which has been allowed for in the appraisal, and it goes to show the
Road ac
Emissions benefits
Noise benefits
Value of Time & Decongestionbenefits -
onomic Be
1it will necessitate some additional funding for annual operations. This cost is reflected in the €22 million increase in public transport subvention indicated in Tabl10.5. The figure is calculated by applying current levels of subvention per passenger (see Paragraph 10.7) to the number of additional public transport passengers generated as a result of the TDM package. Increased bus speeds as a result of reduced congestion are taken into account in the model; howevero
10.23. It is possible to make an indicative assessment of the preduction. Previous studies 72 suggest that some 5.5% reduction in bus fleet coachieved for each for each 1kph increase in morning peak operating speeds. As the proposed TDM package is forecast to increase bus speeds from 14.3kph to 16.5(see Paragraph 9.27), it could be inferred that the total bus fleet required in 2008 withthe TDM package could be reduced by 12%. Assum
72 “Bus Strategy Network Appraisal for the Greater Dublin Area”, Scott Wilson Report, 1999 on behalf of CIE 73 Dublin Bus Annual Report 2003
147

GREATER DUBLIN TRAVEL DEMAND MANAGEMENT STUDY
imp l be presen
1 enues generated by additional bus rs a toin the economic appraisal as they are balanc sts to (i.e. the fare paid).
N ntal Benefits
1 tion of the packages would lead to significant reductions in environmental externa associated emissionp l air qual llutants). e would aaccrue significant societal benefits from a reduction in road traffic accidents (RTAs) each year in the GDA. Table 10.6 summarises the net environmental benefits.
efits asso with the red Packag
ortance of taking advantage of the opportunities for cost efficiencies which wilted by the TDM package.
0.24. Rev passengeed by the co
re not taken in the user
account
et Environme
0.25. It is estimated that the implementalities with s of
ollutants (greenhouse gases and loca ity po Ther lso
Table 10.6 Environmental Ben ciated Prefer e Potential no. of RTAs avoided 70 Potential no. of fatal or serious RTAs avoided 15Tonnes of local air pollution not produced 5 1,80Tonnes of CO2 not produced 33,027
iscounted Cash Flows
onger term economic and financial worth of the ackage, discounted cashflow analysis using a 5% real discount rate has
een undertaken. The discount rate and the twenty-five year evaluation period have
• Reduction in benefits associated with reduced vehicle kilometres and vehicle hours of 2% p.a. to reflect underlying traffic growth eroding benefits of TDM measures. This is a conservative assumption, but not unreasonable given the rapid growth in traffic generation in the GDA; and
• Revenue streams from Congestion Charges and Work Place Parking Levies held constant in real terms
10.27. As Figure 10.3 shows, the benefits associated with the Preferred Package would greatly outweigh the costs over the 25 year period.
D
10.26. In order to assess the lPreferred Pbbeen adopted in accordance with the general practice for transport projects in Ireland74. The following assumptions have been used in the extrapolation of 2008 data and forecasts forward twenty-five years:
• GDP growth of 3.5% p.a. 2004 to 2008, 2.5% p.a. thereafter and population growth of 1.9% p.a. (used in Value of Time calculations75);
74 CBA Parameter Values and Application Rules for Transport Infrastructure Projects, DKM Economic
Consultants, Report to the TAS Steering Committee, February 1994. Note that 5% is a relatively high discount rate. 75 Value of time is a per capita measures thus 'future' VoT, which is based on future GDP, must be adjusted by the
difference between GDP and population growth
148

GREATER DUBLIN TRAVEL DEMAND MANAGEMENT STUDY
Costs and Benefits Streams – Preferred Package Figure 10.3
Costs and Economic Benefits Streams - Preferred Package
€ 500,000,000
€ 0
€ 50,000,000
€ 100,000,000
€ 150,000,000
€ 200,000,000
000
20042005
20062007
20082009
20102011
20122013
20142015
20162017
20182019
20202021
20222023
20242025
2026202
2029
€ 250,000,
€ 300,000,000
€ 350,000,000
€ 400,000,000
€ 450,000,000
7 8202
Total Undiscounted Costs Total Undiscounted Benefits
10.28. The results of the economic appraisal discounted cashflow analysis are presented in Table 10.7. In order to test the sensitivity of results to changes in key assumptions a number of sensitivity tests have been undertaken on the Preferred Package and these are also presented in Table 10.7.
Table 10.7 Total Costs and Benefits Discounted over a 25 Year Period
for the Preferred Package Package Present
Value Costs
(€ billion)
Present Value Economic Benefits (€ billion)
Benefit Cost Ratio
Preferred Package €10 Congestion Charge, workplace parking levy + package of measures to promote TDM.
1.62 4.59 2.84
Sensitivity analysis 1. 30% less vehicle kilometres saved than forecast 1.62 4.12 2.55 2. 30% less vehicle hours saved than forecast 1.62 3.79 2.35 3. 30% more vehicle kilometres saved than
forecast;76 1.62 5.07 3.14
4. 30% more vehicle hours saved than forecast; 1.62 5.40 3.34 5. 50% increase in capital and operational costs 2.30 4.59 2.00 6. Congestion Charge annual operating cost at
‘lower’ end estimate; 1.27 4.59 3.63 7. Congestion Charge annual operating costs at
‘upper’ end estimate 1.95 4.59 2.36
76 One of the key findings to emerge from the London situation has been the underestimation of the quantum of transport
operational impacts / benefits.
149

GREATER DUBLIN TRAVEL DEMAND MANAGEMENT STUDY
10.2 d Package, even if the capital and operating costs were 50% more than forecast, or if the congestion charging scheme’s annual operating costs were at the higher end of the scheme.
Costs and Benefits Associated with Reduced Package 1 10.30. Reduced Package 1 differs from the Preferred Package in capital and operating cost terms in that the costs associated with the car parking space levy scheme are removed. The estimated benefits associated with the reduced packages for the first full year of implementation (2008) are set out in following sections.
10.31. Removal of the workplace parking levy would result in the removal of the associated capital and annual operational costs. It would also result in reduced benefits. These are shown in Table 10.8.
Table 10.8 Annual Unpriced Benefits associated with Reduced Package 1
(€10 Congestion Charge + Measures to Promote TDM)
9. The results of the analysis show a very robust economic case for the Preferre
Item Million €s Benefits Reduced package – €10 Congestion Charge + measures to promote TDM
Vehicle operating cost savings (cars only) 22 Road traffic accident savings 19 Environmental benefits 8 Travel time savings & road user decongestion 164 Increased public transport subvention -17
Net Environmental Benefits
1 than with the Preferred Package, the reduced package would lead to significant reductions in environmental externalities associated with emissions of pollutants (greenhouse gases and local air quality pollutants). There would also accrue significant societal benefits from a reduction in road traffic accidents (RTAs) each year in the under the o s, as showT
nefits as ed with the R d Packager annum 29
0.32. Although substantially less
GDA ption n in able 10.9.
Table 10.9 Environmental Be sociat educe 1 Potential no. of RTAs avoided pePotential no. of fatal or serious RTAs avoided pe um 6 r annTonnes local air pollution not produced per annu 747 m Tonnes of CO2 not produced per annum 13,665
D
1 raisal discounted cashflow analysis for Reduced Package 1 are presented in Table 10.10. In order to test the sensitivity of results to changes in key assumptions a number of sensitivity tests have been undertaken on Reduced Package 1 and these are also presented in Table 10.10.
iscounted Cash Flows
0.33. The results of the economic app
150

GREATER DUBLIN TRAVEL DEMAND MANAGEMENT STUDY
Table 10.10 Total Costs and Benefits Discounted over a 25 Year Period for
Reduced Package 1 (€ 10 Charge and Measures to Promote TDM) Package Present
Value Costs(€ billion)
Present Value Economic Benefits (€ billion)
Benefit Cost Ratio
Reduced Package 1 €10 Congestion Charge + measures to promote TDM
1.52 2.29 1.51
Sensitivity analysis 1. 30% less vehicle kilometres saved than
forecast 1.52 2.09 1.38
2. 30% less vehicle hours saved than forecast 1.52 1.88 1.24
3. 30% more vehicle kilometres saved than forecast;77 1.52 2.49 1.64
4. 30% more vehicle hours saved than forecast; 1.52 2.70 1.78
5. 50% increase in capital and operational costs 2.18 2.29 1.05
6. Congestion Charge annual operating co 96 st at ‘lower’ end estimate; 1.17 2.29 1.
7. Congestion Charge annual operating costs at ‘upper’ end estimate 1.85 2.29 1.24
1 oval of the Wor ce P te that the purelyeconomic case for this package is also robust. Even if the capital and operating costs were 50% greater than forecast, the benefit/cost ratio would still be margina
reater than one, indicating an economically worthwhile project
ased) is expected to reduce significantly in coming years.
0.34. Although the benefits reduction as a result of the rema
k a Plarking Levy is significant, the results of the analysis indic
lly g
Costs and Benefits Associated with Reduced Package 2 10.35. Analysis of Reduced Package 2 (€5 congestion charge and measures to promote TDM) also indicated a good economic case, as shown in Table 10.11, unlesscapital and operating costs were significantly greater than expected, which is unlikely given that the cost of the London scheme (upon which the costs are b
77 One of the key findings to emerge from the London situation has been the underestimation of the quantum of transport
operational impacts / benefits.
151

GREATER DUBLIN TRAVEL DEMAND MANAGEMENT STUDY
Table 10.11 Total Costs and Benefits Discounted over a 25 Year Period for Reduced Package 2 (€5 Charge and Measures to Promote TDM)
Package Present Value EcPresent onomic Value Costs Benefits (€ billion) (€ billion)
Benefit Cost Ratio
Reduced Package 2 + measures to 1.4278 1.89 1.33 €5 Congestion Charge
promote TDM Sensitivity analysis 1. 30% less ve ved than 1.42 1.71 1.21 hicle kilometres sa
forecast 2. 30% less vehicle hours saved than 1.42 1.54 1.09 forecast 3. 30% more vehicle kilometres saved than 1.42 2.05 1.44 forecast;79 4. 30% more vehicle hours saved than 1.42 2.23 forecast; 1.57
5. 50% increase in capital and operational costs 2.08 1.89 0.91
6. Congestion Charge annual operating cost at ‘lower’ end estimate; 1.07 1.89 1.76
7. Congestion Charge annual operating 1.76 1.89 1.08 costs at ‘upper’ end estimate
Summary
10.36. In summary, the Preferred Package is an economically desirable project. If the workp still economically robust. If the workplace parking levy was not included anc ble economic c operational costs
lace parking levy is not included, the resulting reduced package isd the
ongestion charge set at €5, the package would still represent a reasonaase – unless there were significant increases in capital and .
78 Present value costs of the €5 scheme are slightly less that the present value costs of the €10 scheme (Table 10.10) as the
public transport subvention required is slightly less. 79 One of the key findings to emerge from the London situation has been the underestimation of the quantum of transport
operational impacts / benefits.
152

GREATER DUBLIN TRAVEL DEMAND MANAGEMENT STUDY
Financial Appraisal The Preferred Package 10.37. The intro h enerate very significant revenu h the congestion charge would account for almost two-thi e fo nuare shown in Table 10.12. Figure 10.4 shows the forec enu vyears.
duction of t e Preferred Package has the potential to ges of approximately €319 million annually (of whic
rds). Thast rev
recast ane stream o
al costs er 25
Table 10.12 Annual Revenues Associated with Preferred Package Item € million Re enues (annualv ) 80 Congestion Charge fees paid by those crossings the canals 144 Congestion Charge fees paid by residents within the canals 94 Work Place Parking levies paid for spaces within the GDA 81 Total 319
Rincreased bus patronage, as under current arrangements these would not accrue to
s Revenues resulting from increased introduced to complement the workplace
unt as, if any revenues occur (they are intended be revenue neutral), these too would not accrue to the operator of the TDM
s
evenues taken into account in the financial appraisal do not include revenues from
e operator of the TDM charging scheme . threvenues from on-street parking controls parking levy are not taken into accotoschemes. Equally, any reduction in on-street parking revenues as a result of lespeople driving into the City Centre following the introduction of congestion charging has not been included.
80 For appraisal purposes a ‘ramp up’ profile for revenues has been adopted to ‘accommodate’ some initial reluctance by car
drivers (even those willing to pay the charge) and to help ensure that any optimism bias in the modelling is accounted for. The following profile has been adopted: 1st year 60%; 2nd Year 80%; 3rd Year 90% and Year 4 = 1st full year of modelled revenue streams.
153

GREATER DUBLIN TRAVEL DEMAND MANAGEMENT STUDY
Figure 10.4 Revenues Streams over a 25 Year Period with the Preferred Package
€ 0
€ 50,000,000
€ 100,000,000
€ 150,000,000
€ 200,000,000
€ 250,000,000
€ 300,000,000
200200
20020 20 20 20 20 20 20 20 2 20 20 201
201202
202202
202202
202202
2022028
20294 5 6 07 08 09 10 11 12 13 14 16 17 8 9 0 1 2 3 4 5 6 7015
Revenue streams
Parking Levy Revenue Area Charge Revenue
1 ashflow analysis are presented in Table 10.13. In order to test the sensitivity of results to changes in key a itivity teP
enues Associated with th erred Package unted
0.38. The results of the financial appraisal discounted c
ssumptions a number of sens sts have been undertaken on the Preferred ackage and these are also presented in Table 10.13.
Table 10.13 Total Costs and Rev e Pref Discoover a 25 Year Period
Package Present Value Costs
(€ billion)
Present Value Revenues (€ billion)
Ratio of Revenues & Costs
Preferred Package €10 Congestion Charge, workplparking levy + package of meas
ace ures to 1.62 3.58 .21
promote TDM.
2
Sensitivity analysis A. 50% increase in capital and operational costs 2.30 3.58 1.56
B. Congestion Charge annual imate 1.27 3.58 .82 operating cost at ‘lower’ end est 2
C. Congestion Charge annual operating costs at ‘upper’ end estimate 1.95 3.58 1.84
D. 30% reduction in revenue streams81 1.62 2.51 1.55 E. 30% reduction in revenue streams plus 30% increase in capital and operating costs
2.02 2.51 1.24
F. A doubling of revenue from the Congestion Charge (associated with ‘all day’ operation).82
1.62 6.28 3.89
81 Outturn net revenues in London in the first year of operations were €68 million compared to £130 million forecast. This
was largely due to the introduction of residents’ discounts and other discounts and exemptions. Other factors were a greater than expected impact in reducing car use and enforcement difficulties.
154

GREATER DUBLIN TRAVEL DEMAND MANAGEMENT STUDY
10.39. The results of the analysis indicate a robust financial case for the Preferred Package, even if the outturn revenue streams were 30% less than forecast. The results also indicate a robust financial case for the Preferred Package if the revenustreams were 30% less than forecast while the capital and operating costs were 30% greater than forecast. It is also noted that the scheme would have an even financial case if it were to operate all day, or for more of the day, instead of in the morning only (7am-10am).
10.40. A transparent mechanism would need to be established to ensure that revenues generated by the fiscal measures (after operating costs have been covered) would be used to fund long term public transport strategy, in addition to the potential complementary measures outlined in Section 9.
e
stronger
10.41. As shown in Table 10.14, the introduction of Reduced Package 1 (€10 ongestion Charge only with measures to support TDM) has the potential to
of approximately €239 million annually, albeit some with the Preferred Package.
Cgenerate significant revenues5% less than those associated2
Table 10.14 Annual Revenues Associated with Reduced Package 1 (Annual) Item Million €s Revenues – Reduced Package 1 (€10Congestion Charge + measures to promote TDM)
Congestion Charge fees paid by those crossing the canals 145 C d by residents within the canals 94 ongestion Charge fees pai Workplace parking levies paid for spaces within the GDA 0 Total 239
10.42. uced Pac ag evenues associated with the workplace parking levy does not substantially diminish the
he led
Table 10.15 shows the discounted cashflow analysis associated with Rede 1. The results of the analysis indicate that the loss of the significant rk
financial case for Reduced Package 1. However, the commercial success of tscheme may be impacted by a significant reduction in revenues, over 30%, coupwith higher capital and operating costs at 30% above estimates. Under these circumstances, the financial case for Reduced Package 1 would be marginal.
weekdays. 82 It is understood that the London scheme generates between 40% and 50% of its revenue in the 7am-10am period on
155

GREATER DUBLIN TRAVEL DEMAND MANAGEMENT STUDY
Table 10.15 Total Costs and Revenues Associated with Reduced Package 1 Discounted over a 25 Year Period
Package Present Value Costs
(€ billion)
Present Value
Revenues (€ billion)
Ratio of Revenues & Costs
Reduced Package 1 (€10 Congestion Charge + measures to promote TDM)
1.52 2.72 1.79
Sensitivity analysis A. 50% increase in capital and operational 2.18 2.72 1.25 costs B. Congestion Charge annual operating cost at ‘lower’ end estimate 1.17 2.72 2.32
C. Congestion Charge annual operating costs at ‘upper’ end estimate 1.85 2.72 1.47
D. 30% reduction in revenue streams83 1.52 1.90 1.25 E. 30% reduction in revenue streams plus 30%
sts 1.92 1.90 0.99 increase in capital and operating coF. A doubling of revenue from the Congestion Charge (associated with ‘all day’ operation).84 1.52 5.43 3.58
10.43. The implementation of Reduced Package 2 (€5 Congestion Charge only combined with measures to promote TDM) the potential to generate significant annual revenues of approximately €131 million annually, but these are less than a half of those associated with the Preferred Package. These are shown in Table 10.1
6.
Table 10.16 Annual Revenues Associated with Reduced Package 2 Item Million €s Revenues – Reduced package – €5 Congestion Charge + TDM Support Measures
Congestion Charge fees paid by those crossing the canals 79 Congestion Charge fees paid by residents within the canals 52 Work Place parking levies paid for spaces within the GDA 0 Total 131
10.44. The results of the financial appraisal discounted cashflow analysis for Reduced Package 2 (€5 congestion charge with measures to promote TDM) is shown
e
in Table 10.17. The results of the analysis indicate that the loss of the significant revenues associated with the workplace parking levy and the halving of the congestion charge substantially weakens the financial case for this option. Th
83 Outturn revenues in London some 50% of forecasts. This was largely due to the introduction of residents’ discounts and
other discounts and exemptions. Other factors were a greater than expected impact in reducing car use and enforcement difficulties.
It is understood that the London scheme generates between 40% and 50% of revenue in the 7am – 10am period on weekdays.
84
156

GREATER DUBLIN TRAVEL DEMAND MANAGEMENT STUDY
commercial success of this option is only likely to be achieved if the level of annual
n charge associated with all day operation.
operating costs associated with the Congestion Charge are at the lower end of expectations and/or from a doubling of revenue from the congestio
Table 10.17 Total Costs and Revenues Associated with
Reduced Package 2 Discounted over a 25 Year Period Package Present Present
Value Costs
(€ billion)
Value Revenues (€ billion)
Ratio of Revenues & Costs
Reduced Package 2 €5 Congestion Charge + measures to promote TDM 1.42 1.49 1.05
Sensitivity analysis A. 50% increase in capital and operational costs 2.08 1.49 0.72 B. Congestion Charge annual operating cost at ‘lower’ end estimate 1.07 1.49 1.39
C. Congestion Charge annual operating costs at ‘upper’ end estimate 1.76 1.49 0.85
D. 30% reduction in revenue streams85 1.42 1.04 0.73 E. 30% reduction in revenue streams plus 30% increase in capital and operating costs 1.82 1.04 0.57
F. A doubling of revenue from the Congestion Charge (associated with ‘all day’ operation).86 1.42 2.98 2.10
Discounts and Exemptions 10.45. The Preferred Package does not allow for any discounts or exemptions associated with the congestion charge, although the charge has been assumed to operate in the morning only (7am to 10am). This section sets out the financial implications of discounts and exemptions where:
• residents within the canals are given a 90% discount on the Congestion Charge; and
• 15% of those crossing the cordon are exempt (e.g. taxis, emergency services, buses) or allowed a 100% discount (e.g. registered drivers with disabilities).
10.46. This situation would be equivalent to that in London where residents have a 90% discount and numerous categories of drivers or vehicles are exempted or allowed a 100% discount. The difference with the London scheme is that it operates all day.
10.47. To allow like-for-like comparison with the London situation, all day operation of the congestion charging scheme was also considered in the analysis which is
85 Outturn revenues in London were some 50% of forecasts. This was largely due to the introduction of residents’
discounts and other discounts and exemptions. Other factors were a greater than expected impact in reducing car use and enforcement difficulties.
86 It is understood that the London scheme generates between 40% and 50% of revenue in the 7am-10am period on weekdays.
157

GREATER DUBLIN TRAVEL DEMAND MANAGEMENT STUDY
summarised in Table 10.18. This analysis assumes that the reapply to all those drivers that have an origin within the charg
sidents’ discount would ing area during the
that time (e.g. ips starting from the workplace). The results of the analysis clearly indicate that
d have a robust case. The case for Reduced Package 1 (€10 Congestion Charge (A uld be no financial case foall day wh ptions, there would be a strong financial case for the Preferred Package, for Reduced Package 1 (€10 congestion
t than
modelled period (8am-9am) and therefore overstates the number of “residents” slightly as some non-resident drivers may also be starting a trip attrintroduction of exemptions would significantly reduce the performance of all the options that include a morning only congestion charge, so that only the Preferred Package woul
M only) + TDM support measures) would be marginal and there wor Reduced Package 2. If the congestion charge were to apply
ile allowing the discounts and exem
charge with measures to promote TDM). Under the all day scenario, there would even be a financial case for Reduced Package 2, although it would be less robusfor the other packages.
Table10.18 Total Costs and Revenues Discounted over a 25 Year Period
Present Value Present Value Ratio of Revenues Costs Revenues & Costs Preferred package with €10 Congestion Charge in AM 90% discount to residen15% exempti
ts & ons for crossings 1.62 2.37 1.47
Preferred package with €10 Congestion Charge all day 90% discoun15% exempti 2.40 t to residents & 1.62 3.87 ons for crossings Reduced s Package 1: €10 Congestion Charge (AM only) + TDM support measure90% discoun15% exempti
t to residents & ons for crossings 1.52 1.51 1.00
€10 Congestion Charge (All day) + TDM support measures 90% discount to residents & 15% exemptions for crossings 1.52 3.01 1.98
Reduced Package 2: €5 Congestion Charge (AM only)+ TDM support measures 90% disc15% exempti
ount to residents & ons for crossings 1.42 0.82 0.58
€5 Congestio ort measures n Charge + TDM (All day) supp90% disc15% exempti
ount to residents & ons for crossings 1.42 1.65 1.16
10.48. In sum ts’ discounts and exemptions, and morning only operation. accommo tcase for the inscheme, but a exemptions exists
-
charging scheme operated for the morning only, the case for
mary, the financial case is sensitive to both residenThe Preferred Package could comfortably
da e both these concessions. Reduced Package 1 presents a break-even corporation of residents’ discounts and exemptions in a morning only reasonably robust case for residents discounts and
with all day congestion charging. Reduced Package 2 could only accommodate residents’ discounts and exemptions if the scheme were to operate all day (say 7am7pm) and even then, it would not be a strongly robust proposition. It is noted that ifthe congestion
158

GREATER DUBLIN TRAVEL DEMAND MANAGEMENT STUDY
extensive residents’ discounts and exemptions such as those in London is weak because residents and other candidates for discounts and exemptions could drive after 10am without paying the charge.
10.49. It is worth noting that the analysis in this study is based on the 2001 DTO Model, projected to 2008. The number of trips to work in the 2001 DTO Model are based on a sample employment survey and a best estimate of numbers of workplaces within the City. Census 2002 gives, for the first time, accurate data on the numbers of people working in the City Centre area, the trip origins of thostravelling to work in the City Centre and their mode of travel.
e It suggests that the
d
ated
reatly outweigh the costs. It presents both a solid economic and financial
2001 estimate of the number of city residents driving to work may need to be revisedownwards. Hence the issue of the impact of residents’ discounts will need to befurther examined when the Census data has been incorporated into a newly updmodel.
Summary of Appraisal 10.50. In summary, the Preferred Package is effective and presents an attractive business case. It would comprise a €10 road user area licence, a workplace parking levy and the measures to promote TDM. This would deliver overwhelming net benefits to the community as the economic benefits arising from the Preferred Package gproposition whilst meeting the broader transport objectives of this study.
The Preferred Package • Land Use Planning Measures • Measures to Promote Travel Demand Management • A City Centre Congestion Charge of €10/day applicable within the canals • A workplace parking levy in the rest of the Metropolitan Area and the
Development Centres set at market rates for parking in the local area
10.51. The revenue streams associated with the Preferred Package are very significant, as are the non-revenue benefits streams associated with travel time savings, vehicle operating costs savings and environmental benefits. These could beused to fund long term public transport improvements as well as complementarmeasures.
10.52. The robust financial case for the Preferred Package indicates that, even if the outturn revenue streams were 30% less than
y
forecast, the financial case would be
s
ng scheme has significant financial implications for the Preferred Package. An all day scheme would be stronger financially and give more scope to offer discounts and
strong. In London, outturn revenue was significantly less than forecast due to, amongst other factors, the introduction of residents’ discounts and many categorieof exemption. The incorporation of similar discounts and exemptions in the Preferred Package for the GDA would still allow a reasonably attractive financial proposition. The preference for morning only operation of the congestion chargi
159
GREATER DUBLIN TRAVEL DEMAND MANAGEMENT STUDY
exemptions and to fund complementary measures. Conversely, if congestion charging were to operate in the morning only, the need for exemptions and discounts is questionable.
10.53. The effectiveness and viability of the Preferred Package would also be eroded ted in its entirety, at the levels of charge envisaged. pact package that did not include a work place
e s revenues were
significan
10.54. Opting a work place parking levy and lower presents a marginal case. The commercial success of this option would be critically influenced y sts associated with the congestion charge and the hours of operation of the scheme.
Winners n Principal10.55. The ov
rom the
or
d ld accrue throughout the
DA, they would be greatest for people living and/or working in the central area.
rom faster journey times, and proved reliability as a result of reduced congestion. However, unless additional
ation. They would also benefit from increased
revenue
if the package were not implemenowever, opting for a reduced imH
parking levy (Reduced Package 1) would still deliver substantial net benefits. Such a reduced package would suffer from loss of revenues associated with the workplacparking levy but would still have a robust financial case unles
tly less than forecast.
for a reduced package that did not include ed the price of road user area licence from €10 to €5 (Reduced Package 2)
b the level of annual operating co
a d Losers
Beneficiaries erall community of the GDA would be the principal beneficiary.
10.56. Central and local government would benefit from the monies raised fcongestion charge and the workplace parking levy. Public transport users would benefit if these funds were invested in improved public transport.
10.57. All those that continue to travel by car, whether they have to pay chargesnot, would benefit from substantial time savings, and to a lesser extent, from reduced vehicle operating costs and accident savings. The value of these non-revenue benefits would exceed the total charges paid by drivers.
10.58. Non-car users would benefit from reduced traffic flows leading to more attractive conditions for walking and cycling, reduced road traffic accident rates anreduced noise and emissions. Although these benefits wouG
10.59. Bus and Luas passengers would benefit fimcapacity is provided, they may suffer from increased overcrowding.
10.60. Bus and Luas operators would benefit from faster operating speeds which would enable better fleet utilisrevenues due to increased patronage.
10.61. National Toll Roads, the operator of the Eastlink and Westlink bridges, wouldbenefit from increased traffic flows, as would the State through taxes on the generated.
160
GREATER DUBLIN TRAVEL DEMAND MANAGEMENT STUDY
Principal Losers 10.62. People who lose their workplace parking space as a result of the levy (i.e. their employer chooses not to register their space) would lose out.
10.63.fl
The area to the east of the charging zone would suffer from increased traffic ows as a result of drivers diverting to Macken Street Bridge and East-link. Some reas around the M50 may suffer from increased traffic flows as a result of more
people using the
0.64. Overall subvention to public transport would increase as a result of increased passengers, even though subvention per passenger carried may fall.
10.65. The City Council and other parking providers in the city may lose parking revenue as a result of less people driving to the city. However, this may be off-set by increased revenues accruing from additional parking controls established to complement the work place parking levy.
10.66. The exchequer would have reduced income as a result of lower indirect tax from fuel duty and VAT arising from less car use.
a M50.
1
161

GREATER DUBLIN TRAVEL DEMAND MANAGEMENT STUDY
11 Conclusions and Next Steps
A Viable D 11.1. A viable TDM package and programme have been prepared for the GDA for implementati ngs of measures:
•
•
• Fiscal Measures.
nderway which comprise bus priority measures, walking measures, cycling
e
entation through the planning system are
the
nsport
public
• Relating the density of new developments to public transport accessibility, and proximity to nearest centre; and
parking standards, and the relating of maximum permitted parking provision for new developments to public transport
f
T M Package and Programme for the GDA
on in the short term (by 2008). The package comprises three groupi
Measures that can be implemented through the planning system;
Measures to promote TDM; and
11.2. The TDM package would be complemented by other strategies already umeasures, traffic management measures and integration measures. In addition, specific complementary measures will be required in tandem with some of thproposed TDM measures.
11.3. The measures proposed for implemdiverse and wide ranging. They include:
• Consolidation of residential population in existing built up areas in GDA region, where accessibility to work, leisure and other destinations by foot, cycle and public transport is generally better;
• Location of major trip-intensive land uses in areas well served by public transport;
• Grouping of key trip destinations (employment, retail, leisure and other services such as hospitals) in defined district or town centres;
• Relating the scale of district and town centres to their public traaccessibility;
• Providing a mix of local services within walking distance of their surrounding neighbourhood;
• Designing all new developments with walking, cycling and transport in mind;
• Regional maximum
accessibility, and proximity to the nearest centre.
11.4. Some of the above recommendations have been proposed for inclusion in theRegional Planning Guidelines. Guidance at a regional level is required so that all authorities act in a consistent manner, providing a “level playing field” in terms oTDM policy.
162

GREATER DUBLIN TRAVEL DEMAND MANAGEMENT STUDY
11.5. The measures to promote travel demand management have been describedterms of workp
in lace travel plans (Mobility Management Plans), school travel plans,
wide g, es to
dy been
anage the public sector workforce within the coming years.
11.6. Two fiscal measu ce parking levy and City Centre congestion charging. In the Preferred Package, congestion charging would apply in the City Centre (between the canals) in the morning only (7am-10am) and the cost would be €10. The workplace parking levy would apply in the rest of the GDA, except the rural hinterland, and it would be set at a rate equivalent to the market price for parking in the local area.
11.7. The impact of the Preferred Package would be to reduce the number of car trips in the GDA by 10% during the morning peak hour (8am-9am). This would have a significant effect on congestion as the total number of vehicle-hours in the GDA would fall by some 30,000, a reduction of 12%. The total number of vehicle-km would be reduced by over 330,000, a 5% reduction. Within the City Centre a 34% reduction in vehicle-hours is predicted, and a 14% reduction between the Canals and the M50.
11.8. As a result of the substantial transport impact, the economic case for the Preferred Package is strong. The financial case is also robust, even when taking a 90% discount to residents and a 15% exemption for crossings into account. Substantial revenues would be generated from this package which could be used to finance public transport improvements. Were the congestion charge to be implemented on an all day basis, the financial and economic case would be further strengthened for the Preferred Package.
11.9. If the workplace parking levy was not implemented and instead there was a reduced package comprising the congestion charge and measures to promote TDM (Reduced Package 1), the result would be somewhat weakened but still positive from both an economic and financial perspective. A sensitivity analysis shows that even with a 30% reduction in revenue streams, the financial case would still be robust. It is not until a 30% increase in capital and operating costs is combined with a 30% reduction in revenue streams that the financial case ceases to achieve positive returns.
11.10. The package presenting a €5 Congestion Charge and measures to promote TDM (Reduced Package 2) also presents a viable economic case. However, if the capital and operational costs rise to 50% above expectations then this package fails to present a viable economic case. Similarly, from a financial perspective, Reduced Package 2 can only present a positive case with operating costs at the lower end
virtual mobility and individual marketing. The travel plans could draw on a range of possible individual TDM measures including car sharing, car poolinshuttle buses, alternative hours or staggered hours, flexible hours and measurassist walking and cycling. Guidance on implementing plans has alreaprepared by the DTO87. Large public and private sector employers are considered to be key to wider take up of plans. It is important that plans are put in place to m
res are under consideration: a workpla
87 “The Route to Sustainable Commuting”: An Employers Guide to Mobility Management Plans, DTO, 2001
163

GREATER DUBLIN TRAVEL DEMAND MANAGEMENT STUDY
estimate or with congestion charging operating on an all day basis. Howthe all day congestion charging presents a marginal case when a 90% di
ever, even scount to
tary Measures
nal buses, additional bus priority measures or additional bus routes;
roadspace;
ent and local junction improvements;
evies apply; and
11.12. allowaestima
11.13. particuimprovfares, t ct of TDM and
s role in long term transport strategy, for example, A Platform for Change and any
ns regarding Fiscal Measures
lar
11.15. By comparison, the workplace parking levy would be less costly to introduce and administer. However, a number of practical difficulties have been recognised. As a result there is less confidence that a workplace parking levy would be acceptable throughout the GDA, or even within designated centres in the GDA, or that it would be implemented in an effective manner. There is no example of a regional workplace parking levy elsewhere that can be used as a model.
residents and 15% exemption for crossings are taken into account.
Complemen 11.11. Specific complementary measures that may be required to ensure that the Preferred Package is workable and acceptable could include:
• Improved bus services, for example, additio
• Pedestrian improvements, or other amenity gained from reallocating
• Improved facilities for cyclists;
• Traffic managem
• Parking controls around the edge of an area in which road users are charged, or in an area in which workplace parking l
• Non-transport measures, for example, a marketing initiative to ensure the City Centre remains a vital and vibrant centre for shopping and cultural activities.
A budget for the cost of the above complementary measures, and an nce for increased public transport subvention, has been allowed for in the cost te for the preferred package.
Complementary measures are not confined to specific measures to aid a lar TDM measure. Within the wider context, integration initiatives to e public transport generally are also complementary, for example, integrated
icketing and provision of information. The complementary effeitfuture updates should also be emphasised, including the potential for any monies raised by TDM to fund future public transport proposals.
Decisio 11.14. Following the success of the London scheme, there is confidence that a simischeme could be implemented in Dublin. The one major concern is the estimated operating cost of the scheme.
164

GREATER DUBLIN TRAVEL DEMAND MANAGEMENT STUDY
11.16. Before moving ahead with either fiscal measure, a set of choices needs onsideration, as illustrated in Figure 11.1. The first question is whether it is
Centre that are well served by public transport).
crealistic, in the short term, to impose any fiscal measures outside the City(and possibly some other centres
Figure 11.1 Decisions Regarding Fiscal Measures
Should fiscal TDM measures be applied across the GDA?
Yes
Both Congestion Charging and Levy?
yes
Prer
me
oceed with d tailed plans fo each
asure
no
Proceed with a GDA-wide workplace parking levy
or
Plan for long term GDA road user charge
No, city centre only and perhaps some other centres
Proceed with congestion charging as the more effective option?
yes
Proceed
no
Develop city
maybe
Develop n lan
and workplace parking levy/tax
decision making
with detailed plans
centre workplace
congestiocharging p
parking levy (or benefit in kind taxation) as an alternative
plan in more detail to assist
Next Steps 11.17. The proposed measures that can be implemented through the planning
t ties and the City ing Guidelines and
es and possibly the TO can implement and monitor travel plans on a sufficiently large scale. An
ority and one Government Department which would act as a blueprint for other authorities. Government funding for travel plans and for local authority travel plan coordinators would be required initially. Over time, the fiscal measures would generate an income to fund these activities.
sys em should be taken on board by the Regional Planning Authorind County Councils, and incorporated into the Regional Planna
subsequently the City and County Development Plans.
11.18. The measures to promote TDM, incorporated in the Workplace Travel Plans (Mobility Management Plans), School Travel Plans and individual marketing proposals, require additional resourcing so that the local authoritiDimportant first step is the introduction of Plans within the public sector. It is recommended that a Travel Plan is first established in one local auth
165

GREATER DUBLIN TRAVEL DEMAND MANAGEMENT STUDY
11.19. The fiscal measures are more complex and require the following steps, some
rking levies. This could be done through one or more current opportunities, for example the Finance Act 2005,
orm or the Review of Rating Law.
e
r nsultation on Proposed Measures
y (or benefit in ind taxation) and the road user charge.
ocess, and that will now embrace travel emand management. The priority will be for internal stakeholder liaison to inform
s, public consultation is neither necessary nor appropriate; however, the h
ate regarding the fiscal measures would be desirable
f yer would need to be contacted to ensure
at they knew how to register their spaces and when it do it. Alternatively, if a
of which could help inform decisions on final approval:
• Legislation: primary legislation needs to be established for road user charging or workplace pa
Public Transport Regulatory Ref
• Institutional arrangements: the Vehicle Registration Department of thDepartment of Environment, Heritage and Local Government need involvement from the early stages for any automatic number plate recognition scheme associated with congestion charging.
Fu ther Market Research and Co 11.20. In considering the need for consultation, issues are clearer if fiscal and non-fiscal measures are separately considered. Non-fiscal measures comprise all measures in the Preferred Package except the workplace parking levk
11.21. The proposals to manage demand through the planning system will be reflected in the Regional Planning Guidelines and the Development Plans which have their own statutory consultation prdand support the local authorities.
11.22. In terms of workplace travel plans (mobility management plans) and school avel plantr
next big step in this direction is the establishment of MMP in the public sector whicwill require consultation within those organisations. Each site-specific plan will clearly need consultation with users and other stakeholders. A wider travel wareness campaign would support the mobility management initiative. a
11.23. Some level of public debto fine tune the proposals. Also, structured market research will be required as part of the scheme design in order to confirm appropriate charging levels. Many of the traffic management measures (parking controls, etc.) associated with the implementation of the fiscal measures would need to go through a local consultationprocess.
Communications Strategy 11.24. In the lead-up to the introduction of either fiscal measure, if the decision was taken to implement, major information campaigns would be needed. In the case othe workplace parking levy, each emplothbenefit in kind tax were to be introduced, both employers and employees would need to be given notification. In the case of the congestion charge, the public will
166

GREATER DUBLIN TRAVEL DEMAND MANAGEMENT STUDY
need to know how much the charge is, what area it covers, when it operates and how they pay.
11.25. At present there are two fiscal measures in the Preferred Package. To successfully communicate both simultaneously might be very challenging.
11.26. In summary, communications would be an integral part of the implementation process. For the fiscal measures it would be a major task. Table 11.1 brings together the different strands of any potential communications strategy.
Table 11.1 Communications Strategy
Press releases
Advertising
Explanation of what local authorities and other agencies need to do for implementation.
Clear and timely explanations when measures begin, how they will work and what is required of the public and employers will be needed.
Information
Can prova channel fpublic and
ide or
stakeholder participation
TDM Stakeholder Group required going forward including the planning and local authorities; Departments of Environment, Transport and Finance; public
community.
transport operators and representatives of the business
Statutory consultation on development plans will address TDM through the planning system
omplementary measures
Local consultation is desirable for local TDM and c
Referendum type consultation on fiscal measures is unlikely to be productive.
Participation in decision-making
Press releases
Feature articles
Appreciation of the benefits will come from the general awareness campaigns and also from participation in TDM Stakeholder Groups.
Travel Awareness CampaignsAdvocacy –explaining the
arketing TDMbenefits and m
MediaStakeholdersPublic
Press releases
gAdvertisin
Explanation of what local authorities and other agencies need to do for implementation.
Clear and timely explanations when measures begin, how they will work and what is required of the public and employers will be needed.
Information
Can prova channel fpublic and
ide or
stakeholder participation
TDM Stakeholder Group required going forward including the planning and local authorities; Departments of Environment, Transport and Finance; public
community.
transport operators and representatives of the business
Statutory consultation on development plans will address TDM through the planning system
omplementary measures
Local consultation is desirable for local TDM and c
Referendum type consultation on fiscal measures is unlikely to be productive.
Participation in decision-making
Press releases
Feature articles
Appreciation of the benefits will come from the general awareness campaigns and also from participation in TDM Stakeholder Groups.
Travel Awareness CampaignsAdvocacy –explaining the
arketing TDMbenefits and m
MediaStakeholdersPublic
167

GREATER DUBLIN TRAVEL DEMAND MANAGEMENT STUDY
Appendix A: Study Terms of Reference
Demand M
anagement – Consultants’ Terms of Reference
Introduction The blished 200 . ision of s baphased implementation programme to the end of 2016. Demand Management forms a key element of the strategy, and has the following obj
growth in rised modes of travel in the Greater Dublin Area.
urther modal tr car to public transport modes
ent measures de nge level of service on the road network for essential road users
odal split throughout Dublin Area (D icklow).
In the Metropolitan Area, as defined by the Strategic Planning Guidelines, to orning peak ho ys forecast for 2016 to
approximately 1997 levels (approximately 127,000 car journeys in the morning peak hour in the Metropolitan Area).
• In the Hinterland Area, measures should be designed to achieve sustainable modal split and trip distributions, for travel within the “development centres” identified in the Strategic Planning Guidelines, within other Hinterland Area towns, and in the rest of the Hinterland Area, at an early date.
The purpose of the study is to devise a package of effective and feasible demand management measures to meet the above objectives, and produce a programme for its implementation, as part of the transport strategy for the Greater Dublin Area up to 2016. The consultant should be aware that the National Spatial Strategy (NSS) could be published during the lifetime of the Study. The current Strategic Planning Guidelines and DTO Transport Strategy will be reviewed once the NSS is published.
DTO has recently pulatform for Change
the transport strategy for the Greater Dublin Area0 - 2016 A P This multi-modal strategy envisages the prov
n rail, LRT, metro and bus services and roads in a ignificantly enhanced subur
ectives • To reduce the overall travel by moto
• To effect f ansfer from privateover and above that achievable throenhancem
ugh the infrastructure and service scribed in A Platform for Cha
• To achieve a good To encourage more sustainable trip di• stributions and m
the Greater ublin, Meath, Kildare and W•
reduce m ur (08:00-09:00) car journe
168

GREATER DUBLIN TRAVEL DEMAND MANAGEMENT STUDY
Consultant Tasks Specifically, consultants will be required to deliver the following tasks:
ning al authorities, transport operators, professional bodies,
1. Carry out initial consultations
The consultant will consult appropriate government departments, strategic planbodies, loc and business
t of the Study.
f potential demand management measures
s h of the following categories and any other categories that may be relevant.
Land Use Policies: including advice relating to the location, scale and mix of
ment principles to facilitate sustainable travel
including charging for workplace parking.
asures, and re-organisation
ch of the potential measures, research experience in Greater Dublin Area and ve been
ness of the potential demand ted
istrative requirements, and any technological constraints, and in the light of
ntial demand
asure.
groups, as agreed by the Study steering committee in advance of the main part of the Study. The consultant will consider and report on the consultation responses, before proceeding to the main par
2. Research and development o The consultant will examine, and develop potential demand management measureunder eac •
development; parking standards; development densities and other key develop
• Economic/Fiscal Instruments: including vehicle and fuel charges and taxes; public transport fares – structure and levels; road pricing / congestion charging; parking charges,
• Management and control of public parking: on-street and public off-street parking control and management, park and ride
• Other traffic management measures. • Mobility Management Plans – including IT related me
of work practices. For eaother city-regions, where such demand management measures haimplemented, to help determine the likely effectivemanagement measures or packages of measures in meeting the objectives lisabove. 3. Determine feasibility and timescales for potential measures Identify any required legislative changes, statutory procedures, additionaladminthis analysis determine the feasibility and cost of introducing each potemanagement measure within the required time scale. For each measure deemed feasible, produce where appropriate a schedule indicating key milestones in any implementation programme for the me
169

GREATER DUBLIN TRAVEL DEMAND MANAGEMENT STUDY
4. Assess the potential contribution of feasible measures Assess the potential contribution of each feasible measure to the demand
s to, and acceptance of, feasible demand management measures or cal authorities
sion and
6. Evaluation of candidate measures
ent each mode, by modelling
d distribution of te package of
package of measures, against the ges of measures, in
the Hinterland Area.
rities and produce a programme for the implementation of the
programme should focus on those measures that should be put in place with of
2016. Indicative implementation dates only should be provided for any
It is anticipated that any strategic land use and transportation changes arising from the NSS may have a long term impact on the Greater Dublin Area, but will have less
management objectives set out above. 5. Public consultation for feasible measures Assess attitudepackage of measures by consulting and surveying transport users, loand other stakeholders. In advance of any consultation/survey exercise, produce a draft consultation method statement including questionnaire(s) for discusagreement with the Study Steering Committee
Taking into account the transport infrastructure that will be available in the forecast years, and the outcome of the consultation and research exercises, produce candidate packages of demand management measures for further evaluation. Assess the likely impact of the candidate packages of demand managemmeasures on 2006 and 2016 forecast demand for travel bybehavioural responses to the measures. Assess the potential trip distribution effects, locational effects animpact across different socio-economic groups for each candidameasures Demonstrate the performance of each candidate objectives of demand management listed above. Rank the packaorder of effectiveness, for both of the forecast years. 7. Recommended measures Based on the above, recommend a set of demand management measures for the Greater Dublin Area, which meet the objectives listed above, differentiating where appropriate between measures to be applied in the Metropolitan Area and those to be applied in Recommend priopackage. Any associated administrative requirements should be identified. The
immediate effect, and those which should be in place in each of the forecast years 2006 and measures to be introduced after 2006.
170

GREATER DUBLIN TRAVEL DEMAND MANAGEMENT STUDY
impact in the shorter term. For this reason, in advance of the publication ofNational Spatial Strategy, a detailed i
the mplementation programme should focus on
of the and produce an indicative cost-benefit
nalysis for the recommended economic/fiscal instruments (should such measures be recommended). Arising from the study recommendations, and implementation programme, produce recommendations for submission to relevant bodies charged with the production and review of relevant local and regional plans, policies and guidelines. 8. Reports and meetings Produce a draft final report and, following comments from the Study Steering Group, a final report detailing all assumptions, analyses, conclusions and recommendations, including a proposal for the phased implementation of those recommendations. Produce an executive summary of the proposed demand management strategy and the rationale for it. Attend progress meetings at the DTO offices, roughly on a monthly basis, with a Study Steering Group drawn from the DTO agencies to oversee the study. Attend other meetings with DTO executive staff as required. Provide short written progress reports for each progress meeting, and progress reports and technical notes to the Study Steering Group, the DTO Steering and Advisory Committees, Cabinet Sub-Committee for Infrastructure, and others, as required. 9. Study Period It is anticipated that the study will commence in September 2002, and take 16 months to complete.
measures for implementation in the short term (up to the end of 2006). Identify the broad capital and ongoing operating cost of implementing each element of the package of measures. Identify the likely revenue to be generated by eachrecommended economic/fiscal instruments, a
171

GREATER DUBLIN TRAVEL DEMAND MANAGEMENT STUDY
Appendix B: Demand Management Steering Group
Name Organisation Tom Ferris (Liam Daly y
p r isi initiall )
De
artment of rt Transpo (Public T ansport Div on)
John Devlineter y y)
artm f Env ent, Heritage and Local ern (Roads)
(Also P McEvo initiall
Dep ent o ironmGov ment
Derek Brad La e and Ry
Dun oghair athdown County Council
Muiris O’K th Cou nceeffe
Sou Dublin nty Cou il
Michael M ar f FincGrath Dep tment o ance Owen Keegan
Dublin City Council
Mary Darley
Regional Planning Authority
Sean O’Faircheallaigh
Fingal County Council
Mick MacAree
Dublin Transportation Office
Jeremy Ryan
Dublin Transportation Office
172

GREATER DUBLIN TRAVEL DEMAND MANAGEMENT STUDY
Appendix C: List of TDM References
ADONIS (1998) Analysis and development of new insight into substitution of short
:
n et al, Greater Dublin Area Travel Demand Management Study: onsultation Report, June 2003
CSO Quarter N leworking, Q3, 2002
Commission lic attitudes to Transport
DKM Ltd Economic Consultants (1994) eter Values and Application Rules for T nsport f TAP Steering Committee by the
or Transport UK (2002) Making Travel Plans Work
Department for Transport UK (2002) Soft Factors Report
Department for Transport UK (2002) Using the planning process to secure travel plans
Department of the Environment, Transport and the Regions (2000) DETR – Encou to Local Author
Dubli and Mid-East Regional Authority, RegionalGuide
Dublin Transportation Office (2001) The Route le Commut
Dublin Transportation Office, Transport Strategy 2000-2016: A Platform for Change, 2001
English Historic Towns Forum (1999) Transport Demand Management
ngl h Historic Towns Forum/Department of Transport and the Regions/WS tkins (2000) Bus based Park and Ride – A good practice guide
European Commission (1997) Pay as you Drive Car Sharing
uropean Commission (1999) LEAN Project – Urban Goods Transport
European Commission (2000) Restraining Private Vehicles in Town Centres – A andbook for those Considering Strategies
car trips by cycling and walking. Report under EU fourth framework programme.
Booz Allen Hamilton (2003) Strategic Rail Review, Report to the Department of Transport
Booz Allen Hamilton et al, Greater Dublin Area Travel Demand Management StudyInterim Report, May 2003
Booz Allen HamiltoC
Central Statistics Office (CSO), Census 2002, Volume 9, Travel to Work, School and College.
ly ational Household Survey, Module on Te
for Integrated Transport (2002) MORI Poll – Pub
CBA ParamIn rastructure Projects, Report to thera
External Evaluator
Department for Transport UK (2002) A Travel Plan Resource Pack for Employers.
Department f
raging Walking – Advice ities
n Regional Authority Plannign lines, 2004
to Sustainab ing
EA
is
E
H
173

GREATER DUBLIN TRAVEL DEMAND MANAGEMENT STUDY
European Commission (2001) IMPRINT – Barriers to Transport Pricing
European Commission (1999) AIUTO – Assessment of Innovative Urban Transport Options
How to enhance WALking and CycliNG des
i URE Environment
European Commi – I
European Commission (2000) AFFORD P Cost Pricing
European Commi rk 20 ork in the Knowledge Econ
Goodbody Economic Consultants (2000) Sustainable Travel Demand
Government Office for London (2000) Road Charging Options for London Vols I to 4
HMSO/MVA (199 ondon Conges
Imprint Europe (2002) Lessons from travelpolicy-making: thr tion to i
IMPRINT Europe o
Leeds City Council (2002) DIRECTS – Road Charging R
Mayor of London yo
City C elbournNRA (2002), Road Accidents Facts Irelan
OECD (2002) Implementing Sustainable Urban Travel Policies
ROCOL - Studies commissioned by the Gthe ROCOL (Review of Charging Option rking Group (Halcrow Fox et al, February
Schwanen, Tim; Dijst, Martin and Dielem Tr s
March 2004.
Scott Wilson (1999) y Networkon behalf of CIE
Scottish Executive Sharing Road Space – Drivers and Cyclists as equal road users
onsorti ) SESAME – Ldemand
Sloman, Lynn. (20 raffic Where can help cut traffic, Transport for Quality of Life. University of Westminster
European Commission (1998) WALCYNG – f shorter c nd to make thinstead o ar trips a ese safer mo
European Comm ssion (1999) CAPT – Cars to public transport in the Urban
ssion (1999) IACRO ncrease of Car Occupancy
oject – Marginal r
ssion (2002) , eWo 02 – Status Report on New Ways to Womy
5) The L tion Charging Research Programme Vols 1 to 3
planning and road user charging for mplementation ough imperfec
(2002) Parking is Man euvring
esearch
Office (2001) The Ma rs Transport Strategy
Melbourne ouncil (2003) M e’s Public Transport Strategy d 2002
overnment Office for London to support for London) Wos
2002)
an, Frans M Policies for Urban Form and their Impact on avel: The Netherland Experience, Urban Studies, Vol. 41, No. 3,
Bus Strateg Appraisal for the Greater Dublin Area, report
SESAME C um (1999 and Use, behaviour patterns and travel
03) Less T People Live: How local transport schemes
174

GREATER DUBLIN TRAVEL DEMAND MANAGEMENT STUDY
Sustainable Energy Authority for Victoria (2002) TRAVELSMART Communities – Sustainable Travel Choices
tment of tation (1993) l Demand Management Mea m
Victoria Transport Policy Institute (2003)(www.vtpi.org/tdm
program
US Depar Transpor Implementing Effective Travesures – Inventory of easures and synthesis of experience
– Various reports on TDM measures )
175

GREATER DUBLIN TRAVEL DEMAND MANAGEMENT STUDY
Appendix rson TriD: Pe ps to work by Mode to work desti th
nations in e GDA
Mode Local Authority Area DCC FCC SDCC DLRCC Meath Kildare Wicklow Total Walk 43,9 5 05024 5,194 6,670 ,381 2,801 4,728 4,352 73,Cycle 13,8 1 913 347 20,45452 1,160 1,851 ,955 377Bus/Coach 57,7 5 79,29204 6,396 7,204 ,057 602 1,277 1,050Train 26,264 840 267 2,796 49 275 460 30,950M/Cyc 5,6 3600 830 1,171 943 218 492 284 9,5Car (Driver) 139,0 34,945 17,041 28,925 16,035 323,42452 38,514 48,912Car (Pass) 12,7 2 31,47901 3,657 4,673 ,517 2,350 3,547 2,034Lorry/Van 5,147 1,0392,014 3,078 1,678 1,981 1,154 16,090Total 304,2 54 7443 58,605 73,825 ,632 25,116 42,138 25,715 584,2Source: DTO modelling nsus 2002 section, based on Ce
176

GREATER DUBLIN TRAVEL DEMAND MANAGEMENT STUDY
Appendix nsport E: Tra Model Network and s
The DTO transpor r the year 20 s of the proposed measures individually anmeasures were modelled directly in the treductions due to “soft” factors and the wseparate policy model, and the effects of assessed using the DTO model. The met detail in the assessment report.
e DTO transport model for the year 2008 includes committed improvements to the transport network that will be in place by then:
• Luas Line C and extension to Docklands; • Luas Line B and extension to Cherrywood; • DART upgrade and suburban rail enhancements; • Port Tunnel; and • South East motorway extension.
The service frequencies assumed on the rail and light rail systems are summarised below. Capacity improvements will come from longer trains as well as increased frequencies.
Assumed Service Frequencies for Rail and Light Rail in 2008
Service A sumptionst model fo 08 was used to assess the transport impact
d as a package. The congestion charging ransport model. The private vehicle trip orkplace parking levy were modelled in a
those reductions on the road network was hodology is described in more
Th
Services/hour and direction
Outbound
Luas Cherrywood-Stephens Green 6 inbound 6 outbound Sandyford-Stephens Green 14 inbound 14 outbound Heuston – Point Depot 10 inbound 10 outbound Tallaght – Connolly 10 inbound 10 outbound DART and suburban DART 7 southbound 6 northbound Maynooth – Wicklow lines 7 west to south 5 south to west Heuston lines 6 inbound 4 outbound Northern lines 5 inbound 4 outbound
177

GREATER DUBLIN TRAVEL DEMAND MANAGEMENT STUDY
Appendix F: Long List of TDM Measures
TABLE F LONG LIST OF TDM MEASURES Strategy Measure Description
Public transport fares ing by public transport is subsidisedsubsidy
Cost of travell .
Cycle subsidy Cost of bicycle pu
rch e ase and/or maintenanc is subsidised
Ridesharing allowance ance from oolinvanpooling costs/fare
s Direct assist employers for carp g or s
Public transport faschemes
res Can include off-peak nes fares and fare free zo
Cashing out parking Employees given the quivalent of parking subsidy
right to receive cash e
Indirect financial incentives Non-cash rewards for participating in TDM programmes
Financial Measures
iums f travel, and total ed rat a
Travel behaviour baseinsurance
d Insurance premdistance travell
based on actual time oher than on trends and verage costs
Car purchase ownership taxe
and s
d les Can be differentiate to favour smaller, fuel efficient vehic
Fuel taxes ts r ravel by caPrice of fuel affectransport
elative cost of t r and public
Treatment of car owneand parking
e em o n impact on this
practice
rship Taxing employees (provided cars and /
.g. ‘benefit-in-kind’) for r parking spaces has a
ployer
Taxation Measures
Tax deductible PT passes Give employers tax d ng PT passes
eductibility for subsidisi
Congestion Pricing Varying road-pricing raffic conditions, area and time of day e higher the congestion the higher
charges according to t (th
the charge).
Cordon Pricing ges levied for cr rdon, usually City arging can be one way or two way ential
charging by direction.
Char ossing a co around awith differCentre. Ch
Road Pricing
heme Charged for entry into zone, and use of vehicle within zone. Generally fixed fee for all travel within one time period.
Area Licence Sc
Staggered working hou nd finishing times spread out over a 1-3 rs Employee starting a
hour period
Flexible Hours Employees choose starting and finishing times within constraints
Alternative Hours
sed Working Weeks
Working hours compressed into less than 5 day week or 10 day fortnight
Compres
Carpooling Two or more peop
vehicle le rivat
on a regular b
travel together in a pasis
e passenger
Vanpooling Two or more people e-arranged basis in a vehicle designed fo
travel to work on a prr 5 or more people.
Ridesharing
Shuttle Buses Provide transport from transport or to the worksite to publicshops, etc.
178

GREATER DUBLIN TRAVEL DEMAND MANAGEMENT STUDY
TABLE F LONG LIST OF TDM MEASURES Strategy Measure Description
Travel Awareness Education programmes to inform public of the benefits of le OccupancCampaigns non-Sing
y Vehicle modes
Individualised Marketin
g A marketing apa dialogue with
proac which enters into 'intere s on non-car travel
h aimed at individualssted' potential user
modes
Education/
Assistance at household level to encourage people to reduce their car use – by blending travel modes, destinations, travel times.
Marketing
Travel Blending
Teleworking (e-work) allo rk at home, or close
rying us ns technology (at Arrangements to to home – valeast phone)
w employees to woe of telecommunicatio
Telework centres Centres designed for teleworking close to an employees home
Teleshopping (e commerce)
Shopping via the tele t vision, and the interne
Teleservices (e-service se of . gove ocal nline learn edicine, etc
s) Promoting the u online services e.ging, telem
rnment, lauthority, o
Information and Communication Technologies (ICT)
es co e able to access e-ervices
'Wired-up communiti ' Facilitate getting a commerce and e-s
mmunity 'online' to b
Worksite cycle/facilities
pedestr
ers of cycle facilities, changing rooms
ian Provision by employand showers
Cycle route network A complete network of cycle routes throughout the city/region
Improvemenpavements a
ts to nd crossin
ing and impro tpgs g asgs.
Upgradpedestrian crossinchoice.
vements to existing foo to encourage walkin
aths and a mode
Signal priority in fPedestrians inner city.
avour of and cyclists in
The establishment of des wi ans and cyclists at the top witpriority.
a hierarchy of mo of the pecking order
th pedestrih signal
Provision of maps and awareness campaigns.
The provision of maps and information regardinetwork and linkages to promote cycle and wa
involve prom ealtelati
ti
ng the cycle lking use. h benefits o(This could also
the modes and raisinthese modes in rela
otion of the hg awareness of the ron to the car in inner city
f ve speed of areas).
Provision of secure cyparking at public transtations & in shoppingcentres
csp
ered) cyc ties at pu t nd in shop
le ort
Secure (covstations, a
le parking faciliping centres
blic transpor
Pedestrian zones awalkways
nd Pedestrian only area ian links. (e.g. nebridge over the river
s and new pedestrLiffey).
w
Alternative Modes
Individuals join a 'car club' and have access to hire cars on an as-required basis from several 'car stations
Car Sharing '.
On-street: Parking charges A range of parking pricing measures which incof SOV travel
rease the cost
On-street: Reducespaces
parking Reduce parking spaces to make room for othee.g. cycle ways, pavement space, and bus sto
r measures, ps.
Parking Restraint
lled Management of parking in area to balance desupply
On-street: ControParking Zones
mand and
179

GREATER DUBLIN TRAVEL DEMAND MANAGEMENT STUDY
TABLE F LONG LIST OF TDM MEASURES Strategy Measure Description
Off-street: Long-stay vs. short-stay pricing
In public car parks – long-stay spaces at higher rate than short-stay spaces
Off-street: Parking Levy Levy of fixed amount per year on all business district car (i.e. incl Priva ntial spacespaces
te Non Reside s)
Off-street: CommutePaym
d ent Schemes
Developers pay Local Authority in-lieu of providing car parking spaces
Off-street: Maximum ards tied
PT accessibility
Maximum no of car park spaces – lower maximum where evel of seParking Stand to higher PT l rvice
Off-street: Parking Ceil
al ty Centre set ing Maximum no of tot spaces in Ci
Off-street: Ban parking spaces in new building
s bann dings in certain parts of s
Parking spacecity
ed in new buil
Off-street: HOV ca
r pa – spaces reserved for carprking In public car parks ools
Off-street: Park + Ride / Peripheral Pa
rking P+R facility on periphery of City Centre in conj with dedicated bus service, or with rail services
unction
Employer Travel Plans A package of TDM measures aimed at providi ve e c o
ng alternatitravel options to th
ar for employees at a w rksite Travel Plans
s ckage of TDM m vidi c en tra
School Travel Plan A pa easures aimed at proar for school childr
ng alternative velling to travel options to the
school.
TransportatiManagem
on ent Associati
at ementation b involving private busi atives, ge TDM measures in a c yment centre or in an area
ons Voluntary administr
(TMA’s)
ion and impl odies, usuallywhich mananesses or co-oper
ommercial/emplo
Administrative
Trip reduction ordinances Legal (planning) mechanisms requiring land users (owners, businesses, developers) to achieve trip reduction goals
Employment/Services Hierarchy of Employment centres focussed on the potential for growth.
High Residential Higher residential densities and lower parking provision at high accessibility locations.
High Commercial Higher density commercial development with lower parking provision at high accessibility locations.
TDAs at Existing Nodes Application of Transport Development Area (TDA)/ Urban design land approaches at existing and proposed areas.
Integrated Residential Neighbourhoods
Application of integrated development and transport approaches to new residential neighbourhoods.
Non / low Car Housing No and Low car housing schemes.
Land Use
Developer Contributions to non-car modes.
Development contributions to non-car modes (including public transport).
PT user real-time information
Providing real-time information to PT users about PT service timing e.g. time next bus will arrive
Intelligent Transport Systems (ITS)
Internet transport information
Providing access to traveller information (both timetable & real-time) on the internet
180

GREATER DUBLIN TRAVEL DEMAND MANAGEMENT STUDY
TABLE F LONG LIST OF TDM MEASURES Strategy Measure Description
Public Transport Priority Measures which give public transport vehicles priority over other traffic: Bus Lanes, Traffic Signal Priority, other Traffic Control measures.
Traffic Management
HOV Lanes Generallyessible
involve the provision of a section of roadway only by buses ld
ber of passengers. accnum
or vehicles carrying a thresho
Traffic Calming Physical infrastructure m
ticula lar area u o
easures aimed at either slowing r streets or in a particudown traffic on par
(speed control), or redon particular streets (v
cing the number of vehicles travellinglume control).
181

GREATER DUBLIN TRAVEL DEMAND MANAGEMENT STUDY
Appendix ter l PracticMeasures
G: In nationa e with TDM
TABLE G INTERNATIONAL PR RES ACTICE WITH TDM MEASUTDM Strategy Area
UK European US Other
Financial Measures
Public transport ussubsidies includedsome Employer Travel Plans Norwich Union Insurance trialling ‘Pay as You Drive’ insurance scheme which is based on how often, when awhere you use youvehicle.
cies to deter people Extensive use of subsidies for non-car modes in employer trip reduction plans Trialling of travel behaviour based insurance premiums
ng out parking.
Limited Singapore: policies to deter people from buying a car.
e in
Similar to UK Poli
nd r
Cashi
from buying a car.
Taxation Measures
Commuting expensnot tax-deductible Car ownership tax.Motor fuel tax.
re tax exempt (e.g. France, Germany). In the Netherlands only public transport users and cyclists commuting expenses now exempt. Company car usage levy.
Special measures to support employer travel plans: employer public transport benefits tax deductible to employer & tax free to employee. Specific tax on larger cars, ‘gas guzzler’ tax. Provision of tax deductible benefits to the employee by the employer is allowed.
Car purchase taxes. Car park spaces provided by employers taxed in Australia.
es
In several European countries commuting expenses a
Road Pricing Durham – toll charge on a City Centre street London congestion charging scheme commenced 17 February 2002. .
Toll rings in Norway: Bergen, Oslo & Trondheim Trial in Stuttgart
Tolling on high occupancy lanes on freeways
Singapore–full electronic road pricing scheme Hong Kong – ERP trialled
Alternative Hours Flexible work hours common in public sector, less in private sector Staggered work hours and compressed workweek less common.
Similar to UK Specified time allowance (e.g. 15 minutes) work time rescheduling allowed.
Similar to UK Similar to UK
Ridesharing Carpool schemes being included in Employer Travel Plans.
Carpool schemes being included in Employer Travel Plans.
Area-wide carpooling schemes trialled in 1970s. Carpooling & vanpooling used at worksites in 1980s & 1990s Use of shuttle buses.
Formal ridesharing not common.
Information and Communications
Telework included in some Employer
European Commission is supporting research &
Federal government has promoted
Limited
182

GREATER DUBLIN TRAVEL DEMAND MANAGEMENT STUDY
TABLE G INTERNATIONAL PRACTICE WITH TDM MEASURES TDM Strategy Area
UK European US Other
Technologies (ICT)
Travel Plans Telework actively promoted by government for travel reduction 2.2 million teleworkers in the UK - about 7.4% of the workforce
awareness on teleworking E-workers are 5% of European workforce Levels higher- Scandinavian countries
teleworking for many years. However, still only around 4% of workers telework regularly.
Travel Plans The UK Government is promoting Employer and School travel plans. Around 4% of employers have travel plans nationwide (less in London).
Most common in the Netherlands which has strongly promoted employer travel plans (8-15% of employers have plans).
Employer 'Trip Reduction Plans' introduced in 1990s to meet air quality targets.
Limited.
Alternative Modes Walking and cycling facilities improved as part of travel plan process Cycling infrastructure measures being implemented e.g. Safer Routes to Schools Limited Carsharing– several trials.
Walking and cycling facilities improved as part of travel plan process Some cities have extensive cycling friendly facilities e.g. Amsterdam (cycle ways, Cycle Club) Car Sharing schemes are in place in several countries.
Walking and cycling facilities improved as part of travel plan process Limited Carsharing
Similar to US and UK Limited Carsharing
Parking Restraint Maximum parking standards for development, controlled parking zones Provision for local authorities to introduce workplace charging.
Maximum parking standards for development, residents parking zones, area-wide parking zones.
Some cities have set parking ceilings (e.g. Portland, Boston). Parking taxes on public car parks in some cities (e.g. Baltimore, Chicago, New York) Parking maximums
Office parking levy in CBD and major business areas in Sydney, Australia. Parking levy on all central city parking in Perth, Australia.
Land Use UK Government has established planning guidelines to foster land use development that supports public transport, walking and cycling, i.e. high density, mixed use, located on public transport corridors ‘No and Low Car’ housing schemes. Development contributions to non car modes and public transport. Construction of the Light railway and, later, the Jubilee Line Extension were integrated into the development of the London Docklands.
Many European cities also fostering sustainable land use development Netherlands ABC Location Policy.
Movement towards promoting sustainable land use development. However, very varied application of these principles. Transit Oriented Development.
Sustainable land use planning popular in Australasia. Land Use Clustering, Canada. Hong Kong is a leading example of transport led development where large scale commercial and residential developments were incorporated into the design of each station on the mass
183

GREATER DUBLIN TRAVEL DEMAND MANAGEMENT STUDY
TABLE G INTERNATIONAL PRACTICE WITH TDM MEASURES TDM Strategy Area
UK European US Other
transit system.
Intelligent Transport Systems (ITS)
Real time information systems for PT being installed in many places
Similar to UK Similar to UK Similar to UK
Administrative Limited. The Netherlands Government has supported establishment of Transport Management Associations (TMAs).
Regulatory approach to TDM (Trip Reduction Ordinances) mostly abandoned. TMAs widespread.
Limited.
Education/ Marketing
Demonstration projects have been run with Travel Blending & Individualised Marketing.
Substantial trials of Individualised Marketing
Limited Major Individualised Marketing and Travel Blending programmes in Australia.
Traffic Management
Public Transport priority relatively widely implemented Bus lanes Traffic calming widely practiced Traffic signal measures. High Occupancy Vehicle lanes.
Public Transport priority very common. Bus Lanes Traffic calming originated in the Netherlands. Traffic signal measures. High Occupancy Vehicle lanes.
HOV Vehicle facilities widely implemented; Traffic calming now being introduced. Bus Lanes Traffic signal measures. High Occupancy Vehicle lanes.
Being implemented in other parts of the world as well. Bus lanes Traffic signal measures. High Occupancy Vehicle lanes.
184

GREATER DUBLIN TRAVEL DEMAND MANAGEMENT STUDY
Appendix pl and EffeTDM Measures
H: Ap ication ctiveness of
TABLE H APPLICATION AND EFFECTIVENESS Strategy Measure Application Effectiveness Factors
Public transport fares subsidy Cycle subsidy Ridesharing allowances Public transport fares schemes Cashing out parking Indirect financial incentives
Main application is the journey to work trip.
Most appropriate in areas with significant road congestion and/or parking problems, and adequate public transport provision.
Most effective when implemented in conjunction with disincentives such as parking restraint.
In addition, should be implemented in tandem with improvements to alternative modes.
Financial Measures
Travel behaviour based insurance
At trial stage: could potentially apply to all motorists.
At trial stage.
Car purchase and ownership taxes Treatment of car ownership and parking Tax deductible PT passes
Taxation Measures
Fuel Taxes
Applicable in any jurisdiction, but particularly where the level of car usage is high and its adverse effects are a significant problem. With respect to car ownership and parking, for example, this could be by way of ‘benefit-in-kind’ taxation on employees but may be problematic to implement and administer.
Commuter travel taxation measures need to provide definite tax advantages for alternative modes, and not treat all modes equally.
Congestion Pricing Cordon Pricing
Road Pricing
Time Based Pricing
Road pricing schemes have been introduced to either (i) address significant road traffic congestion problems; or, (ii) to finance new road building schemes.
Road pricing could be applicable where it would have a significant effect on traffic congestion and the surrounding road network and/or the public transport network could cope with diverted traffic.
Road pricing should be implemented as part of a package of measures aimed at demand management.
To achieve modal shift to public transport improvements to the public transport system are required in conjunction with the road-pricing scheme.
Ensure alternative routes are available for traffic, which wishes to bypass the pricing zone.
Staggered working hours Flexible Hours
Alternative Hours
Compressed Working Weeks
Many different types of work can be organised on a staggered or compressed basis. The main issues arising are management and team process related.
The impact of alternative work hours schemes will depend on: the absolute amount of employee participation, the degree to which peaking is present in the present work schedule, - the degree to which the new work schedules are spread, and, the type of variable work hour programme initiated.
Carpooling Ridesharing Vanpooling
Cost incentives through provision The employer has promoted and co-
185

GREATER DUBLIN TRAVEL DEMAND MANAGEMENT STUDY
TABLE H APPLICATION AND EFFECTIVENESS Strategy Measure Application Effectiveness Factors
Shuttle Buses of direct payments, indirect payments (subsidised fares, provision of van), provision of free parking, exemption from tolls;
Time and convenience incentives, i.e. providing preferential parking sites, heavy occupancy vehicle lanes, guaranteed ride home scheme;
One way distances involved are relatively long;
Work schedules are largely fixed and regular;
The number of employees involved is relatively large, i.e. to provide enough participants from residential areas to fill a car or van;
Public transport is inadequate;
Some parking or congestion problems exist.
ordinated the ridesharing programme. Employer run programmes have been much more successful than those organised by local authorities or other public organisations;
Within employer schemes, the extent to which management promotes and supports the scheme has a significant impact on the participation rate;
Transportation allowance as fringe benefit remuneration designed to balance parking costs.
Teleworking (e-work)
Applies to most organisations – administrative and other knowledge-based functions. Greatest opportunity amongst larger organisations, in particular government bodies
Some opportunities for SMEs but likely to be less impact
Effectiveness of awareness-raising campaign
Willingness of employers to change ways of working
Adequacy of ICT infrastructure, especially affordable broadband
Adequacy of housing
Penetration (people who can or will telework) and levels of uptake (how regularly) are key factors
Telework centres
Solution for larger organisations who can afford investment
Particular opportunities for govt bodies, for facilities exchange, more intensive use of local properties
As for teleworking
Availability of funding to support more rapid deployment of local telecentres
Teleshopping (e commerce)
Opportunities to develop high-tech approach to market for most vendors of products and services
Affordable broadband will increase effectiveness and rate of uptake
Information and Communications Technologies (ICT)
Teleservices (e-services)
Applies primarily but mot exclusively to public sector
Affordable broadband will increase effectiveness and rate of uptake
186

GREATER DUBLIN TRAVEL DEMAND MANAGEMENT STUDY
TABLE H APPLICATION AND EFFECTIVENESS Strategy Measure Application Effectiveness Factors
'Wired-up communities'
Applies to developers, social housing providers, planning authorities and telecoms companies, in looking at new settlement and regeneration opportunities
High level of integration/coordination needed between public and private sector interests
Worksite cycle/pedestrian facilities
Employment sites Worksite needs to be within reasonable distance of the workforce/employees home
Access to the workplace is suitable for cycling
Facilities must be clean and adequate to meet demand
Cycle route network
Area wide Proper design and tailoring to local conditions and needs.
Comprehensive and continuous across the network
Needs to be direct and off good quality
Regular maintenance is required
Must be off road if adjacent traffic exceeds 40 km/h
Improvements to pavements and crossings
Area wide Crossings must adequately cater for the number of pedestrians
Improvements must be tailored to suit local conditions.
Signal priority in favour of Pedestrians and cyclists in inner city
Area wide
Provision of maps and awareness campaigns
Area wide or concentrated on specific areas identified by surveys
The information must be clear and concise
Awareness campaigns could target schools
Alternative Modes
Provision of secure cycle parking at public transport stations & in shopping centres
Public transport station and interchanges, City Centre and shopping areas.
Facilities must have adequate lighting and if possible security cameras or supervision
The parking facilities must be sheltered and secure
The facilities must be located at a direct access point to the station/shops
187

GREATER DUBLIN TRAVEL DEMAND MANAGEMENT STUDY
TABLE H APPLICATION AND EFFECTIVENESS Strategy Measure Application Effectiveness Factors
Pedestrian zones and walkways
Inner city/shopping areas/town centres
Shelter should be provided if possible
Street furniture and obstacles must be kept to a minimum.
The zones must be car free and be enhanced to encourage pedestrian use.
Alternative Modes Car Sharing
It appears that carsharing would have the most potential in a limited number of inner city neighbourhoods with low car ownership.
Swiss experience indicates that up to 8% of population potential members of car clubs.
On-street: Parking charges On-street: Controlled Parking Zones Off-street: Long-stay vs short-stay pricing Off-street: Parking Levy Off-street: Commuted Payment Schemes Off-street: Maximum Parking Standards tied to PT accessibility Off-street: Parking Ceiling Off-street: Ban parking spaces in new buildings Off-street: HOV car parking
Parking Restraint
Off-street: Park + Ride / Peripheral Parking
Generally applied in areas where a degree of traffic congestion is occurring, e.g. City Centres.
Centre needs to be of a certain size and 'critical mass' to avoid any displacement of activities. Key features of centre are: amenity, character and ambience; and, depth and spread of business activities.
Control of parking stock – generally, the greater the proportion of parking spaces under public control the greater the effectiveness of parking measures.
Employer Parking Subsidies – extent of employer subsidisation of employee parking costs affects the impact of parking pricing measures.
Public transport provision – quality and level of PT will affect degree of modal switching achieved.
Through-route traffic – parking measures only affect destination traffic, not through-route traffic.
Compliance and Enforcement – adequate enforcement required to ensure compliance with parking regulations.
Constrained parking in adjoining areas is also necessary; otherwise drivers merely park in the adjoining areas.
Education/ Marketing
Travel Awareness Campaigns
Alternative viable transport options are available.
An impetus exists for people to change travel behaviour, e.g. lack of car parking, bad congestion.
They are linked to other initiatives such as health and exercise.
188

GREATER DUBLIN TRAVEL DEMAND MANAGEMENT STUDY
TABLE H APPLICATION AND EFFECTIVENESS Strategy Measure Application Effectiveness Factors
Individualised Marketing
Areas where PT service better than general perception of it; or, where PT service improvements being made.
Areas with a relatively high quality public transport service, and which are readily amenable for walking and/or cycling for many trips
Travel Blending Most areas, but may be best suited
to better-educated areas. Areas where adequate resources are available to service programme.
Employer Travel Plans
Mainly implemented where businesses have a travel related problem, e.g. parking shortage, planning requirement, travel options for staff.
The most effective ETPs usually address parking as well as providing positive incentives for modal change, i.e. a mix of carrots and sticks.
Small scale, single mode initiatives can be effective. This can occur by organisations playing to their strengths (e.g. a nearby public transport station).
Travel plans need an overall strategy for encouraging progressive change based on reducing the attractiveness of car use and increasing the attractiveness of alternative modes.
Successful travel plans alter the financial balance of different commuting options (e.g. by introducing parking charges or introducing cheaper public transport fares)
Travel Plans
School Travel Plans
More suited to urban areas than rural areas (pupils travel longer distances to school in the latter, and opportunities for walking and cycling are lower).
Depends on the attitude of parents to allowing their children to walk and/or cycle to school, and the degree of support from the local authority in terms of implementing measures to improve the safety of the walk/cycle to school
PT user real-time information
All public transport routes, although not generally required on very high frequency routes.
Most popular on lower frequency routes.
Intelligent Transport Systems (ITS)
Internet transport information
Particularly useful where users have high access to the internet.
Internet information is likely to become an important source of information regarding transport options as access to the internet grows.
Administrative Transportation
Management Associations (TMAs)
Particularly applicable where group of businesses with common interest or geographical dimension (e.g. Business Park).
Private sector participation is vital to long-term success.
189

GREATER DUBLIN TRAVEL DEMAND MANAGEMENT STUDY
TABLE H APPLICATION AND EFFECTIVENESS Strategy Measure Application Effectiveness Factors
Employment/ Services (Improved balance between local population and local employment – mixed use).
Intended to transfer employment/ service development to centres closer to residential areas, particularly growth centres in hinterland. Aim is to balance residents, jobs and other activities.
Centres will be selected for actual or potential public transport accessibility. Requires coherent spatial planning strategy to implement.
High Residential Objective is to encourage higher density residential development accessible to public transport, i.e., around existing or proposed PT nodes.
Will be based around actual or potential public transport nodes or corridors, or in future as transport-led development.
High Commercial
Objective is to maximise numbers of jobs close to public transport routes/nodes.
Will be based around actual public transport nodes or potential as transport led development. Requires control and management of on-street and off-street public parking.
TDAs at Existing Nodes
Principles as for first three measures.
Requires existing high accessibility node with substantial redevelopment opportunities.
Integrated Residential Neighbourhoods
Objective is to create new housing areas, which maximise the potential for public transport and other non-car modes. Applicable to large Greenfield and estate renewal sites.
Probably requires minimum site area of 20ha but principles can apply to smaller schemes.
Non + low Car Housing
Could, at present, only be around 5 to 10% of all new housing.
Only applicable in City Centres and other centres with high public transport accessibility and excellent local services and jobs.
Developer Contributions to non-car modes.
Contribution scales to vary by geographic area, extent of on-site provision being made and the need for off-site provision.
Appropriate Development Contributions Schemes under the Act need to be made.
Land Use
Planning conditions to ensure delivery of MMP’s and other TDM measures.
Larger developments particularly business parks, etc.
Ongoing monitoring and enforcement.
Public Transport Priority
Areas with traffic congestion and with inadequate bus flow.
HOV Lanes Similar to bus lanes. Generally: major urban areas with large employment centres, heavy congestion and supportive TDM policies.
Extent to which the priority measure allows PT and HOVs to bypass congested road sections. Degree of enforcement has significant impact on effectiveness.
Traffic Management
Traffic Calming Areas with cut-through traffic and high traffic speeds with certain minimum traffic volumes.
The geometrics and spacing of traffic calming measures, the availability of alternative routes, and treatment of other streets in area wide applications.
190

GREATER DUBLIN TRAVEL DEMAND MANAGEMENT STUDY
TABLE H APPLICATION AND EFFECTIVENESS Strategy Measure Application Effectiveness Factors
Pedestrian Only Streets
Specific streets or areas with high pedestrian demand.
Total priority given to pedestrians and minimal access granted to traffic. Enforcement.
Reallocation of road space
Areas where traffic reduction is desirable. Areas where the increased use of alternative modes is sought/required.
Comprehensive design and implementation. Enforcement. Monitoring and post implementation revisions.
191

GREATER DUBLIN TRAVEL DEMAND MANAGEMENT STUDY
Appendix I: TDM Stakeholders Consulted
Organisation Name Title Dublin Chamber of Commerce Maurice Pratt
Dublin Chamber of Commerce Declan Martin Director Policy, Campaigning & Lobbying
Dublin Docklands Development Authority
Peter Coyne Chief Executive
Dublin City Centre Business Association
Tom Coffey Chief Executive
IBEC John Dunne IBEC Reg McCabe Automobile Association Conor
Faughnan
Road Hauliers Association Sheila Mc Cabe Dublin Port Enda Connellan Rail Procurement Agency Frank Allen Chief Executive CIÉ Michael Reidy Dublin Bus Alan Westwell Managing Director
Iarnród Éireann Joe Meagher Managing Director Iarnród Éireann Michael
Murphy Suburban Rail Manager.
Bus Éireann Bill Lilley Managing Director Bus Éireann Tim Hayes Private bus operators PAMBO Mike Goodliffe FOTO Frank King
National Taxi Drivers Union Tommy Gorman
Dublin Cycling Campaign Eammon Ryan Taxi Company Owners Association Derek
Dalrymple
Garda Traffic Bureau. Tony Hickey Assistant Commissioner National Disability Authority Donie O'Shea National Roads Authority Eugene
O'Connor Head of Project Management
National Roads Authority Michael Tobin
Wicklow County Council Michael Looby Director of Transport Services Department of Finance Adrian
Finneran
Department of the Environment and Local Government
Mary Moylan
Department of the Environment and Local Government
John Martin
192

GREATER DUBLIN TRAVEL DEMAND MANAGEMENT STUDY
Organisation Name Title Department of the Environment and Local Government
Kevin Ring
Department of the Environment and Local Government
Martin Condon
Department of Transport Tom Ferris Head of Public Transport Planning Division
Strategic Planning Guidelines Mary Darley Technical Director Dublin City Council John Fitzgerald City Manager Dublin City Council Owen Keegan Director of Traffic Dublin City Council Michael Phillips City Engineer
Dublin City Council Pat Mc Donnell City Planner
Dun Laoghaire Rathdown County Council
Derek Brady County Manager
Dun Laoghaire Rathdown County Council
Michael Gough Director of Planning services
Dun Laoghaire Rathdown County Council
Eamon O'Hare Director of Transport services
Fingal County Council Willie Soffe County Manager Fingal County Council Mark Walsh Director of Planning Services Fingal County Council Michael
Lorigan Director of Transport Services
South Dublin County Council Joe Horan County Managers South Dublin County Council Ciaran
Kennedy Director of Planning Services
South Dublin County Council Frank Coffey Director of Transport Services Kildare County Council Niall Bradley County Manager
Kildare County Council Tommy Skehan Director of Planning Services Kildare County Council Jimmy Lynch Director of Services, Transportation
and Environment Meath County Council Tom Dowling County Manager
Meath County Council Joe Crockett Director of Planning Services Meath County Council Oliver Perkin Director of Transport Services Wicklow County Council Eddie Sheehy County Manager Wicklow County Council Brian Doyle Director of Planning and Economic
Development Irish Homebuilders Association Ciaran Ryan
The Irish Parking Association Paul Flynn Chairman Fire Brigade Mike Walsh Chief Fire Officer IDA Ireland Conor Agnew Manager East Region
193

GREATER DUBLIN TRAVEL DEMAND MANAGEMENT STUDY
Appendix J: Register of Submissions Organisation or Name of Individual
1 Public Transport Operators and Business Seminar 2 Directors of Transportation and Planning Seminar 3 Dublin City Centre Business Association 4 Garda Traffic Bureau 5 Meath County Council Transportation and Planning SPCs 6 Kildare County Council Transportation SPC 7 Fingal County Council Planning SPC 8 South Dublin County Council Infrastructure Mgt Team 9 Dublin City Council Transportation SPC
10 Dun Laoghaire Rathdown Transportation and Planning SPCs11 Wicklow County Council Transportation and Planning SPCs12 Rail Procurement Agency 13 Dublin Chamber of Commerce 14 South Dublin Chamber of Commerce 15 Greater Blanchardstown Chamber of Commerce 16 Dublin Cycling Campaign 17 Wicklow County Development Board 18 Finnstown Input Group 19 National Council on Ageing and Older People 20 Irish Senior Citizens Parliament 21 Chartered Institute of Logistics and Transport 22 Killiney Ballybrack Renewal Group 23 Barbara O'Leary 24 Cabra Community School 25 Michael Keefe 26 Robert O'Brien 27 Steven Paul 28 Alan Cowap 29 St Johns Drive Residents Association 30 Sheelagh Collins 31 Gary Kearns 32 Combined Ashbourne Residents' Associations 33 Distance Education International Ltd, Desmond Keegan 34 Gabrielle Farrelly 35 Michael Boyle 36 Angela O'Brien 37 James M.G. Hogan 38 John Mc Gill 39 Paul Daly 40 Shane O'Mearain 41 Paul Cullen 42 Ann Fogarty 43 R O'Connor
194

GREATER DUBLIN TRAVEL DEMAND MANAGEMENT STUDY
Organisation or Name of Individual 44 Deirdre Purcell 45 DTA Marketing 46 Jason Duggan 47 David Mooney 48 Patrick Devine 49 Pieter van Velzen 50 Richard Bowden 51 Johnny Gordon 52 Kathleen Forde 53 Declan McGuire 54 Richard Barrett 55 Eileen Gavin 56 Sean Giblin 57 Redbullsuzuki 58 Blackrock Resident 59 David Trevitt 60 Joseph Neville P.C. 61 David Mc Namara 62 Jean Acheson 63 Stephen Dolan
195

GREATER DUBLIN TRAVEL DEMAND MANAGEMENT STUDY
Appendix K: Planning Data and Future Scenarios
"Base" Scenario Scenario to Redress DeclineRail Luas Metro Other Rail Luas Metro Other
Dublin City 30,030 12,694 -606 -1,422 41,882 15,730 1,087 -1,040Fingal 56,500 0 22,713 13,190 56,503 0 16,063 10,209South Dublin 29,666 -2,171 -7,272 8,335 31,325 -627 -2,733 6,356Dun Laoghaire Rathdown -7,760 -1,328 24,580 9,293 -3,401 -815 17,606 6,831Meath 22,836 0 0 18,724 22,836 0 0 13,367Kildare 19,198 0 0 682 18,442 0 0 -167Wicklow 26,095 0 0 6,375 26,257 0 0 4,643Total 176,564 9,195 39,415 55,178 193,844 14,288 32,022 40,198
"Base" Scenario Scenario to Intensify Development in Rail Luas Metro Other Rail Luas Metro Other
Dublin City 30,030 12,694 -606 -1,422 52,166 12,694 -606 -1,422Fingal 56,500 0 22,713 13,190 59,750 0 22,713 6,362South Dublin 29,666 -2,171 -7,272 8,335 39,273 -2,171 -7,272 2,213
Dun Laoghaire Rathdown -7,760 -1,328 24,580 9,293 -6,451 -1,328 24,580 1,004Meath 22,836 0 0 18,724 25,974 0 0 8,043Kildare 19,198 0 0 682 19,897 0 0 27Wicklow 26,095 0 0 6,375 23,763 0 0 1,143Total 176,564 9,195 39,415 55,178 214,372 9,195 39,415 17,370
"Base" Scenario Scenario to Intensify Development in Rail Luas Metro Other Rail Luas Metro Other
Dublin City 22,708 4,174 694 155 27,698 4,174 694 155 Fingal 7,064 0 31,343 9,594 6,871 - 31,343 6,829 South Dublin 11,751 0 9,492 452 12,983 - 9,492 194
Dun Laoghaire Rathdown 2,101 81 7,335 513 2,489 81 7,335 354 Meath 6,037 0 0 3,054 7,104 - - 1,420 Kildare 477 0 0 5,930 3,722 - - 2,082 Wicklow 9,141 0 0 1,478 7,913 - - 643 Total 59,280 4,256 48,864 21,177 68,780 4,256 48,864 11,676
Population Growth Projected to 2016 in Public Transport Corridors
Population Growth Projected to 2016 in Public Transport Corridors
Employment Growth Projected to 2016 in Public Transport Corridors
196

GREATER DUBLIN TRAVEL DEMAND MANAGEMENT STUDY
Appendix L: Other Behavioural Responses Three potential behavioural responses to the congestion charge which are not addressed by the forecasting model are discussed below:
• Trip retiming and trip suppr• Change of trip origin or destination • Transfer to modes other than public transport
Trip retiming and trip suppression
It is not envisaged that workplace parking levies would be related to time of day, and therefore trip retiming would not be a possible response to this measure. Trip suppression may be a possible occasional response if the levy is applied on a daily basis and the employee is able to work from home or work flexibly (i.e. 4 day week or 9 day fortnight). Trip retiming and/or suppression are implicitly included as responses in the assessment of the measures to promote TDM, as is transfer to walk, cycle, car share and public transport. With regard to road user charging, a review of international research indicated that there is no conclusive evidence that this measure would lead to trip retiming. Some drivers might change time to avoid the charge. Some might be willing pay the charge in order to have a shorter trip – market research undertaken for this study showed that 25% of those that drove to work regularly would be very or fairly happy to pay a charge in order to avoid congestion. The hours of operation of the congestion charging scheme could be set to avoid trip retiming being a problem. During the morning peak hour, most trips are to work (80%) or school (15%), and most people do not have a great deal of flexibility in timing these trips. For example, with the envisaged all-day charge (say 7am to 7pm), it seems unlikely that people would arrive at work before 7am and stay until after 7pm, effectively working an extra 4 hours, just to avoid paying 5 or 10 euro. If a morning peak only charge was proposed (7am to 10am), some people may drive to work before 7am or after 10am as they could travel home when they liked in the evening without paying the charge. The proportion of City Centre workers with this level of flexibility in work start times on a regular basis is probably small, but if it were an issue such that congestion was likely to arise after 10am, the hours of operation could be set at 7am to 11am. Market research undertaken for this study indicated that, of the full time workers interviewed, only 16% were very likely to change their travel plans in order to avoid a peak hour only charge. Similarly, research for the ROCOL studies in London
ession
197

GREATER DUBLIN TRAVEL DEMAND MANAGEMENT STUDY showed that only a small proportion of those travelling to work, school or on business would be able to travel less often or to change the day of the trip88. Observations from London89 show that up to 10% of the reduction in car movements to the charging area represents the effect of car journeys to the charging zone being diverted to other destinations, made less frequently or not made at all. The effect of congestion charging on discretionary, off-peak trips such as shopping and social or leisure trips has not been modelled. The market research undertaken for this study indicated that if there were a toll to enter Dublin City Centre, the response for shoppers would be as follows:
• Pay the charge: 31% • Use bus or trains: 27% • Reduce number of trips to central Dublin: 14% • Stop shopping in central Dublin: 12% • Walk/cycle/car share/other: 5%
The research did not specify the days or hours of operation of the charge and people may have assumed it would apply on a Saturday which would be highly unlikely.
Change of trip origin or destination Change of origin or destination would not be a significant short-term response for work, school and employers business trips in the AM peak, and is not modelled. The effect on discretionary, off-peak trips would be greater - the research quoted above indicated that 12% of shoppers might stop shopping in central Dublin if there was a charge to enter the city.
Transfer to modes other than public transport In common with most transport models, the DTO model does not include car sharing, walking or cycling as alternative modes. Consequently the impact of TDM in transferring drivers to these modes not included, and this represents a potential under-estimation of the effect of TDM in reducing car use. Data collected by Transport for London90 since the introduction of the London congestion charging scheme can inform the possible extent of this under-estimation, as shown in the table below.
88 Proportions of drivers that said they could reduce the frequency of their trips: travel to work: 15%; travel to education:
11%; and travel on employer’s business: 11% as against 55% of shopping, 55% of visiting friends and family; 46% of leisure and 42% of personal business trips. Proportion of drivers that said they could have changed the day they made the trip: 12% travel to work, 7% of travel to education as against 81% of shopping, 70% of visiting friends and family, 48% of personal business, 43% of leisure and 22% of employer’s business trips.
89 Congestion Charging: Six Months On, Transport for London, October 2003 90 Congestion Charging: Six Months On, Transport for London, October 2003
198

GREATER DUBLIN TRAVEL DEMAND MANAGEMENT STUDY In London, the reduction in car trips to or through the charging zone is around 60,000 per charging day. Of these: 20-30% Previously drove through the charging zone but now divert around it or
travel less often 50-60% Transferred to public transport 15-25% Switched to other forms of transport (motorcycle, cycle, car sharing)
Switched to walking Are making fewer car journey to the zone, or being diverted to other destinations (up to 10%)
Observations in London91 show 10 -15% of former car drivers transferred to walk, cycle or motorcycle, and there is a general sense that walking and cycling is now more attractive with less traffic, although exceptionally good weather in 2003 was also a factor. Car occupancy has increased by 10% in London since congestion charging was introduced, suggesting a small proportion of former drivers are now passengers/car sharers. It could be assumed, based on the London experience, that the forecast reduction in traffic entering the canals as a result of the congestion charge may be underestimated by some 15-25%.
91 Congestion Charging: Six Months On, Transport for London, October 2003
199

GREATER DUBLIN TRAVEL DEMAND MANAGEMENT STUDY
Appendix M: Approach to Economic and Financial Appraisal The appraisal of the preferred TDM package has been conducted within a cost benefit analysis framework consistent with standard guidance documents such as Guidelines for the Appraisal and Management of Public Capital Projects (Department of Finance, 1994), CBA Parameter Values and Application Rules for Transport Infrastructure Projects (DKM, 1994) and Proposed Working Rules for Cost-Benefit Analysis (CSF Evaluation Unit, June 1999). Furthermore, guidance was also taken from the UK and the EU such as:
• Guide to cost benefit analysis of investment projects, European Commission DG Regional Policy 2002;
• Transport Economics Note, UK Department for Transport; • Highways Economics Notes No. 1, 2002, UK Department for
Transport; • The Green Book, Appraisal and Evaluation in Central Government,
HM Treasury, 2003; and • The Northern Ireland Practical Guide to The Green Book, NI
Department for Regional Development, 2003
In order to avoid confusion, the differentiation between financial and economic evaluation that has been adopted for this project, namely that of varying perspectives, is set out in the Table below:
Differentiation between Financial and Economic Evaluation ECONOMIC FINANCIAL Perspective Economy
Sponsoring agency (typically a Govt. Dept. or Semi-State enterprise
Objective Using the community's resources efficiently
Using the sponsoring agency’s resources efficiently
Pricing Opportunity costs / market prices
Market prices
Income distributional effects
Excluded
Excluded
Externalities Included
Excluded
The economic and financial evaluations are separate but related exercises – in essence the financial evaluation is a sub-set of the broader economic evaluation.
200

GREATER DUBLIN TRAVEL DEMAND MANAGEMENT STUDY
201
The steps in the analyses are the same but content and perspective differ. Both methods utilise a cost benefit analysis framework. The steps undertaken for this appraisal are summarised below. An illustration of the process is also provided. The major data sources for the analyses have been:
• Transportation model outputs ‘with’ and ‘without’ the TDM package implemented by 2008 such as:
o changes in peak period vehicle kilometres; o changes in peak period vehicle hours; o changes in peak period private car journeys and o changes in peak period public transport journeys;
• Parameter values for elements such as vehicle operating costs
(VoCs), vehicle accident costs (VACs) and value of travel time savings (VoTs) sourced from the published guides and / or derived using data from the, inter alia, Central Statistics Office (CSO), An Garda Síochána, National Roads Authority, Environmental Protection Agency and AA Ireland;
• Other data sourced from UK sources including the UK’s Strategic
Rail Authority; and
• Capital and operating costs estimates from recent / current Irish experience and from other locations / jurisdictions (including
Economic Impact Analysis : jobs, incomes effects etc
Economic Evaluation
Financial Evaluation
Community Perspective
Agency / company Perspective
Economic Evaluation
Financial Evaluation
Community Perspective
Agency / enterprise Perspective

GRE
202
Step 6:
Step 7:
information sourced from Transport for London in relation to the London Congestion Charging scheme).
Booz Allen Hamilton
Step 1:
Step 4:
Step 2:
Step 3:
Step 5:
The Cost Benefit Analysis Process
Define objectives & scope of project
Identify options
Identify quantified costs & benefits
Identify unquantifiedcosts & benefits
Identify external costs & benefits
Calculate NPVs, IRRs etc
Sensitivity tests
Identify preferredoption
Reporting
ATER DUBLIN TRAVEL DEMAND MANAGEMENT STUDY

GREATER DUBLIN TRAVEL DEMAND MANAGEMENT STUDY
Appendix N: Further Details of Cost Assumptions
Table N Costs Associated with Preferred Package Item € million Basis for cost Capital Costs Congestion Charge System set-up – over 3 years 50 2/3 of London Congestion Charge capital cost estimate
of £50 million. (ROCOL estimated £33-50 million, outturn £58.2 Capital Expenditure on Tolling Facilities, TfL Annual Report 2002/03)
Complementary measures – over 2 years
44 In London significant funds were allocated by TfL initially (£13.3m in 2002/03) and subsequently £30.6 m in 2003/04 TfL for traffic management schemes etc. Measures for the GDA would be identified during the scheme design stage (see Section 8 of the report). For illustrative purposes, Table A includes a possible “menu” of measures which could be implemented for the proposed budget.
Education / awareness programme – one-off
5 Indicative budget based on costs of similar programmes e.g. recent government allowances: e-voting awareness and education campaign, €5 million; suicide awareness €4.5 million; speed limits €2 million). National campaign likely to be required. Note that TfL’s communications and marketing strategy for the congestion charge scheme was £12 million (LTT , 12th June 2003).
Work Place Parking Levy Inventory & database development – one-off
1 Requirements would be established through detailed design, assuming inventory is required (self-declaration may be considered to be sufficient). Budget allows for team of around 15 staff working for year, plus allowance for hardware and software. Cost of €65k per FTE pa assumed.
Complementary traffic management measures – over 3 years
25 Measures required would be identified as part of the scheme design. They would be predominantly parking control schemes, but also schemes to assist walking, cycling and bus use. See Table B for a possible menu of measures achievable for the proposed budget.
Education / awareness programme – one-off
1 Based on Government National Pensions awareness/PRSA campaign which allowed €1.5 pa spread over 3 years (€500,000 pa) and was similarly targeted at employers, but this would include GDA only.
TDM Support Measures Establishment costs – one-off 2 Allowance for each local authority to establish in-house
travel plans Complementary traffic management measures – over 3 years
25 Measures would be identified on a bottom-up basis as work place travel plans, school travel plans and other initiatives develop. Table C provides possible menu of measures for the proposed budget.
Launch costs - one-off 1.5 Allowance for a general GDA travel awareness campaign or individual campaigns in each local authority.
Total Capital Costs (over 3 years)
154.5
Recurrent Costs Congestion Charge Scheme administration – recurrent 5 pa Based on scheme approx. 2/3 size of London's - which
was estimated at £5m p.a. for 2003/04 source: Congestion Charging 6 months on, Major of London /
203

GREATER DUBLIN TRAVEL DEMAND MANAGEMENT STUDY
204
TfL, 23 Oct 2003 Scheme operations – recurrent 60-120 pa See note above for Admin - same 'rules' applied except
that Scheme Ops cost derived from TfL 2003/04 Budget. This initial assumption was refined to provide a broader range of costs – see memo from Derval Cummins to Jeremy Ryan dated 5P
thP April 2004.
Work Place Parking Levy Scheme administration – recurrent 1.3 pa WPPL recurrent costs based on a team of 20 FTE
across the 7 local authorities to undertake admin., inspections, enforcement, monitoring etc. FTE cost of €65k pa allowed
TDM Support Measures Scheme administration – recurrent 1.0 pa TDM support measures based on a team of 16 staff - 2
in each local authority and 2 more in DCC for oversight / admin / management. Cost of FTE based on LTT Feb 2004 adverts for workplace & school travel co-ordinators etc £26-32k salary
Total recurrent costs 67-127 pa

GREATER DUBLIN TRAVEL DEMAND MANAGEMENT STUDY
205
UTable A: Complementary Measures for Congestion ChargingU Junction treatments (signal modifications, crossings, signing, pedestrian and cycle facilities) Cost per junction (source: typical costs for GDA local authorities where work contracted) € 250,000
No. junctions on Outer Ring Road 39
No. junctions on Inner Ring Road 42
No. junctions elsewhere (allow) 4
Total junction work € 21,250,000 Parking Controls around ORR
No. FTE per year for design and negotiation 6
Cost per FTE € 65,000
number of years to implement 2
Cost of parking control design € 780,000 Signing and lining (allow) € 500,000 total parking work € 1,280,000 Traffic calming in residential areas near ORR Traffic calming work near ORR (allow) € 5,000,000 QBN treatment Average rate per km with no widening (QBN office) € 375,000 Average rate per km with widening (QBN office) € 850,000
km with no widening required (allow) 20
km with widening -
Cost of QBN treatment € 7,500,000 Workplace-based individual marketing € 2,400,000 Other measures negotiated by City groups (allow) € 1,000,000 Total € 38,430,000 contingency 15% € 5,764,500 Total € 44,194,500 London Congestion charging related traffic management
2002/03 19,950,000
2003/04 45,450,000
Total 65,400,000
Assume 67% of this is appropriate for Dublin 43,818,000

GREATER DUBLIN TRAVEL DEMAND MANAGEMENT STUDY
206
UTable B Complementary Measures associated with Workplace Parking LevyU
No. FTEs to design/negotiate parking control schemes in Dublin Counties 8
No Dublin counties 3
No FTEs to design/negotiate schemes in City 2
No FTEs to design/negotiate schemes in hinterland counties 3
No. hinterland counties 3
Total FTE required 35
Number of years to implement 3
Cost of FTEs 6,825,000
Other costs (e.g. mapping, leaflets, advertising, procurement of parking contractors) 2,000,000
Cost of signing and lining
Allow per county for Dublin Counties 1,000,000
Allow per county for hinterland 500,000
Allow for City 200,000
Total signing and lining 4,700,000
Total 13,525,000
Allow for measures to encourage cycling, walking, bus use e.g. crossings
Dublin Counties 2,000,000
City and Hinterland counties 500,000
Total 8,000,000
total parking and other measures 21,525,000
contingency 15% 3,228,750
Total cost of workplace parking levy complementary measures 24,753,750

GREATER DUBLIN TRAVEL DEMAND MANAGEMENT STUDY
207
Table C: Cost of TDM Support Measures Complementary Measures
Number of junction improvements in each Dublin County
11
Number of junction improvements in each Hinterland County
7
Number of junction improvements in City
6
Total junction improvements
60
Cost of junction improvements
15,000,000
Total km of corridor improvements (assume QBN cost, no widening)
20
Cost of corridor improvements
7,500,000
Total traffic management improvements
22,500,000
contingency 15%
3,375,000
Total cost of TDM Support Measures complementary measures
25,875,000