Greater China embraces strong IPO activityupload.silkroad.news.cn/2017/0801/1501555084574.pdf ·...
34
Page0 Global IPO Market Study Report Greater China embraces strong IPO activity HSI reached record high, Hong Kong surged in the number of IPOs Continued destocking, normalized IPOs in A-share market 26 June 2017 Global IPO Market Study Report
Transcript of Greater China embraces strong IPO activityupload.silkroad.news.cn/2017/0801/1501555084574.pdf ·...

Page0Global IPO Market Study Report
Greater China embracesstrong IPO activityHSI reached record high, Hong Kongsurged in the number of IPOsContinued destocking, normalized IPOsin A-share market
26 June 2017Global IPO Market Study Report

Page1 Global IPO Market Study Report
Global IPO market review in 1H 2017

Page2Global IPO Market Study Report
NYSE ranked first by funds raised,Greater China led by number of IPOs
*Data is based on the places at which the stock exchanges locate without considering the places at which the listed companies locate. Pan-European Stock Exchange includes stock exchanges in Amsterdam,Paris, Brussels and Lisbon; Shenzhen Stock Exchange includes SME and ChiNext.Sources: Dealogic, EY statistics *Data in 2017 is based on priced IPOs as of 17 June 2017 and expected IPOs by the end of June.
1H 20161H 2017 Total funds raised(USDbillion)**
Number ofIPOs**
250
36
38
44
44
45
69
120
126
Others
NASDAQ
Tokyo, MOTHERS and…
NASDAQ OMX
New York (NYSE)
Australia (ASX)
Hong Kong (HKEx) and GEM
Shanghai (SSE)
Shenzhen (SZSE and…
$25.1
$3.1
$3.2
$3.9
$4.2
$6.9
$7.1
$11.0
$18.9
Others
NASDAQ
London Main Market and…
Bolsade Madrid and MAB
Korea (KRX) and KOSDAQ
Hong Kong (HKEx) and GEM
Shenzhen (SZSE and…
Shanghai (SSE)
New York (NYSE)
$14.7
$2.3
$2.4
$2.5
$3.2
$3.8
$4.2
$5.3
$5.6
Others
Tokyo, MOTHERS and JASDAQ
Shenzhen (SZSE and Chinext)
NASDAQ
Euronext + Alternext
London Main Market and AIM
New York (NYSE)
NASDAQ OMX
Hong Kong (HKEx) and GEM
177
30
32
33
33
35
35
38
41
Others
NASDAQ
NASDAQ OMX
London Main Market and AIM
Bombay (BSE) and SME
Shenzhen (SZSE and Chinext)
Australia (ASX)
Hong Kong (HKEx) and GEM
Tokyo, MOTHERS and JASDAQ
Globally, there were 772 IPOs raising USD83.4 billion in 1H 2017. In terms of the number of IPOs, the stock exchanges in mainland Chinaand Hong Kong have secured the top three positions, with 246 and 69 IPOs respectively. New York was the top IPO fundraising exchange in1H 2017. Snap Inc, a social media company, went public at the NYSE, raising USD3.91 billion and became the world’s largest IPO in 1H2017.
Ranking of main stock exchanges around the world (1H 2017 vs 1H 2016)*

Page3 Global IPO Market Study Report
Greater China’s IPO activities reviewin 1H 2017

Page4Global IPO Market Study Report
Sources: EY statistics, Wind Information
IPOs on HKEX gained strength, A-shareendured volatility
Trends of major Hong Kong and A-shareindices in 1H 2017
► Hong Kong stocks embraced a wave ofgrowth, led by the strong US stocks and theincreased inflow of capital from mainlandChina through the Shanghai-Hong Kongand Shenzhen-Hong Kong Stock Connectprograms. The “depressed price” of HongKong stocks has led to an increase ofcapital inflows which became the driver ofthe growth momentum
► As the Fed’s interest rate hike inMarch was widely expected, therewere no significant effects on thestock markets
► In 1Q, as China’s economic growth raterebounded, mainland China and HongKong stock markets rose steadily
► Mainland China’s economic growth rate has sloweddown since April and the “one bank and threecommissions” have strengthened their financialregulations. The A-share market was affected by thetightened liquidity resulting from financial deleveraging.However, Hong Kong stock market remained strongsince 1Q ► Financial liquidity in the capital market
was under pressure since the Fed’sinterest rate hike in June. But as IPOsslowed down and its approval becamemore stringent after CSRC tightened therules on stock sales for listed companies,A-share index rebounded slightly
Jan-17 Feb-17 Mar-17 Apr-17 May-17 Jun-17
Shanghai Composite Index Shenzhen Component Index GEM Index Hang Seng Index

Page5Global IPO Market Study Report
246 companies are expected to go public on the A-share market in 1H2017, raising RMB125.6 billion, increasing 303% and 336% year-on-year by number and funds raised respectively.► In 1H 2017, IPOs accelerated widely and destocking stepped up. The number
of companies to go public, which have been approved by CSRC, has reducedto 585, down 20% from the end of last year.
A-share: IPOs for inventory reduction
1H 2016 vs 1H 2017
Sources: EY Statistics, eastmoney.com*Data after 25 June 2017 is estimated based on the prospectuses and public data
26
120
15
44
20
82
1H 2016
1H 2017
No. of IPOs
SSE SME ChiNext
13.4
76.6
8.3
20.5
7.1
28.5
1H 2016
1H 2017
Total funds raised
SSE SME ChiNext
RMB billion

Page6Global IPO Market Study Report
► In 2Q 2017, the capital market moved downward and IPOs slowed downslightly, down 20% from 1Q by funds raised
►The overall approval time for IPOs was shortened and more predictable
Sources: EY statistics, CSRC *Data as of 25 June 2017
A-share: regulate the speed of IPOs andstabilize market confidence
Number of monthly approval documents for IPOs and trend ofShanghai Composite Index in 1H 2017
Average interval between IPO approved by listingcommittee and approval for companies in 1H 2017
34 34
5040 37
24
54
3347
38 38 36
Jan Feb Mar Apr May June
Number of approved companies for IPOs
Number of companies for IPOs
SCI
25
36
19
14 14
22
Jan Feb Mar Apr May June

Page7Global IPO Market Study Report
► In the first half of 2017, IPO approvals became more stringent and therejection rate of IPOs increased to 14% from 7% last year.
Sources: EY statistics, CSRC *Data as of 25 June 2017
A-share: rejection rate of IPOs increasedand approval remained strict
Result of IPO approval meeting
93%
86%
7%
14%
2016 1H 2017Pass Reject

Page8Global IPO Market Study Report
Sources: EY statistics, Wind Information *Data as of 25 June 2017 GMT+8, average return rate is calculatedbased on closing price on 23 June
A-share: IPO returns decreased year-on-yearbut led other markets
► In 1H 2017, the first-day return of all IPOs reached the highest growth rate of 44%.► With the normalization and acceleration of IPO issuance, IPOs are no longer in scarce
supply. The average number of days that new shares hit their price ceilings has decreased.► On 23 June 2017, the average return rate of A-share IPOs reached 153%, leading other
markets significantly.
Average return of three markets in 1H 2017Average return of A-share in 1H 2016 and 1H 2017
Average number of days that IPOs hit theirprice ceilings
285%
548%
332%
165%203%
137%
SME ChiNext SSE Main Board
1H2016 1H2017
153%
17% 14%
A-Share Hong Kong US
1013 12
9 86
Jan,2017 Feb,2017 Mar,2017 Apr,2017 May,2017 June,2017

Page9Global IPO Market Study Report
Sources: EY statistics, Wind Information *Data as of 25 June 2017 GMT+8
A-share: “back door” listings decreased►The regulators’ strict control to curb “speculation” and the implementation of
measures to reduce the number of IPO applications have reduced thenumber of “back door” listings in the A-share IPO market. In 1H 2017, thenumber of “back door” listings was only four, compared to 12 in the sameperiod last year.
Number of backdoor listings 2013-1H2017
32,704
103,674
281,057
198,498
58,061
14
26
39
25
4
2013 2014 2015 2016 1H 2017
Total funds raised (million) Number of deals

Page10Global IPO Market Study Report
Sources: EY statistics, eastmoney.com, Wind Information *Data after 25 June 2017 was estimated based onprospectus and public data
A-share: funds raised from the top 10 IPOsdecreased due to the lack of large bank IPOs► Funds raised from the top 10 IPOs totaled
RMB22.8 billion, down 53% as compared withthose of the top 10 IPOs in the previous year.Funds raised in each IPO were all no more thanRMB5 billion.
► There have been no large bank IPOs during 1H2017; the top 10 IPOs were all from the securitiesindustry.
► Consumer products & retail industry saw moreIPOs this year, funds raised accounting for 27%of the total funds raised of the top 10 IPOs.
43%
27%
7%
7%
17%
Top 10 IPOs in 1H 2017 by industry
Financials
Consumer products andservicesTransportations
TMT
Materials
1,552
1,600
1,655
1,720
2,062
2,079
2,423
2,800
2,817
4,086
Qingdao LiqunDepartment Store Group
Guangzhou Port
Yealink NetworkTechnology
Zhejiang Jihua
Xinfengming
Oppein Home
Jiangsu ProvincialAgricultural Reclamation
and Development
Central China Securities
Zheshang Securities
China Galaxy Securities
1H 2017 A-share top 10 IPOsRMB million
Page11Global IPO Market Study Report
Sources: EY statistics, eastmoney.com*Data after 25 June 2017 is estimated based on the prospectuses and public data
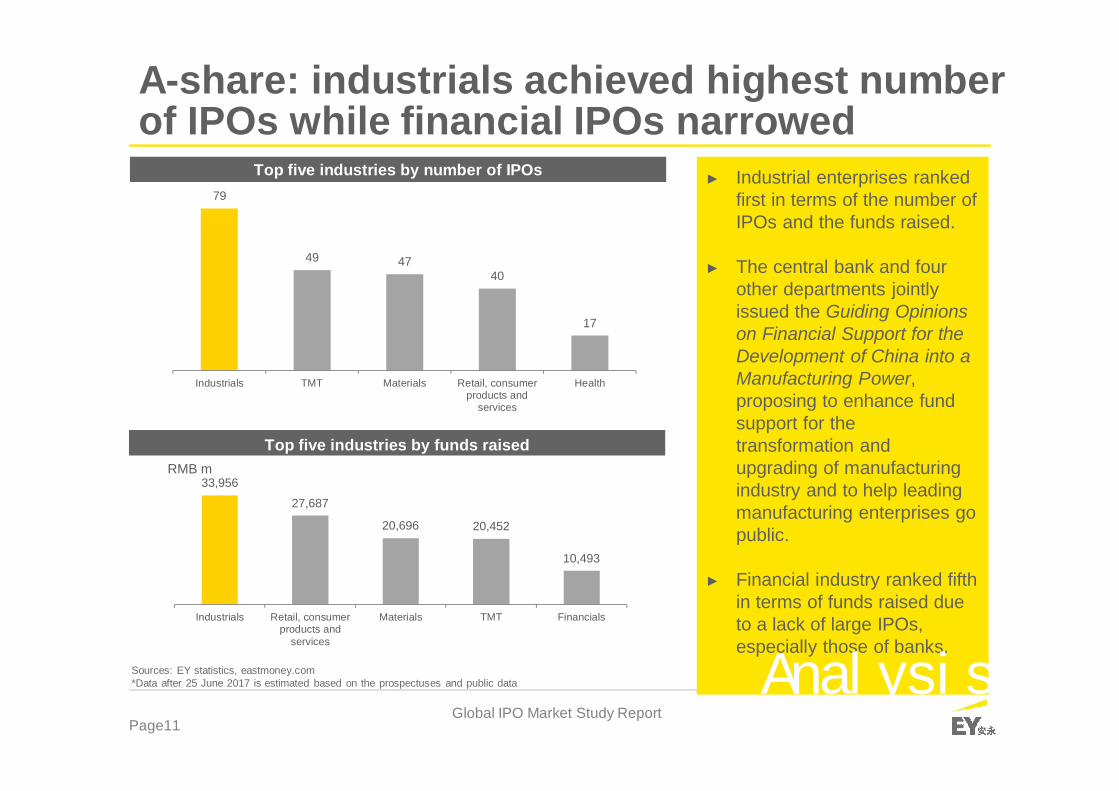
A-share: industrials achieved highest numberof IPOs while financial IPOs narrowed
► Industrial enterprises rankedfirst in terms of the number ofIPOs and the funds raised.
► The central bank and fourother departments jointlyissued the Guiding Opinionson Financial Support for theDevelopment of China into aManufacturing Power,proposing to enhance fundsupport for thetransformation andupgrading of manufacturingindustry and to help leadingmanufacturing enterprises gopublic.
► Financial industry ranked fifthin terms of funds raised dueto a lack of large IPOs,especially those of banks.
Analysis
Top five industries by number of IPOs
Top five industries by funds raised
79
49 4740
17
Industrials TMT Materials Retail, consumerproducts and
services
Health
33,956
27,687
20,696 20,452
10,493
Industrials Retail, consumerproducts and
services
Materials TMT Financials
RMB m

Page12Global IPO Market Study Report
A-share: gradual adjustments to promotecapital market reform
Regulate the refinancingof listed companies andthe stock selling ofmajor shareholders
Registration systemwas not addressed inthe second reading of
Securities Law.
Strengthen cashdividend supervisionand impose heavypenalties for third-partyviolations of rules
Revise and improvethe administration ofthe withdrawal of IPOapprovers fromperforming duties
The IPO has been normalizedand rigorously reviewed toensure that high-qualitycompanies are supported bythe capital market.

Page 13Global IPO Market Study Report
42.4
51.2
1.1
2.6
1H 2016
1H 2017
Total funds raised
Mainboard GEM
HKD billion
► Hong Kong market saw 69 IPOs in 1H 2017, raising a total of HKD53.8 billion.The number of IPOs and funds raised increased by 82% and 24% respectivelyyear-on-year.
► In 1H 2017, the Hang Seng Index repeatedly hit new highs, openingwindows for new shares.
Sources: EY statistics, HKEX *Data after 25 June 2017 is estimated based on the prospectuses and public data
Hong Kong: IPO activity supported by bullmarket
1H 2016 vs 1H 2017
23
34
15
35
1H 2016
1H 2017
Number of IPOs
Mainboard GEM

Page 14Global IPO Market Study Report
Hong Kong: lead global stock market
SZSEComponent
Index
ShanghaiComposite
Index
Nikkei225
FTSE100
Dow JonesIndustrialAverage
S&P500
DAXIndex
NASDAQindex
HangSengIndex
► Hong Kong stock market grew about 17% since the beginning of 2017, ranked first among the majormarkets around the world.
► The recovering fundamentals of emerging economies, low valuation of stocks in the HongKong market and the increased capital inflows from mainland China through the Shanghai-Hong Kong and Shenzhen-Hong Kong Stock Connect programs have driven growth in theHong Kong market.
Growth of the world’s major markets since the beginning of 2017
1.86%1.75%
5.33%3.94%
8.26% 8.91%10.91%
16.39%16.68%
Sources: EY statistics, Wind Information *Data as of 25 June 2017 GMT+8, average return rate is calculated based on closing price on 23 June

Page 15Global IPO Market Study Report
► In 1H 2017, GEM listing activities remained active with the number of IPOs exceeding that of the Main Boardfor the first time since 2003.
► In January 2017, 10 companies were listed on GEM, while in early February, the number dropped as theSFC tightened GEM listing.
► The top three GEM IPO industries were consumer products & retail, TMT and construction & infrastructure;86% of the companies listed on GEM were local companies.
Sources: EY statistics, HKEX *Data after 25 June 2017 is estimated based on the prospectuses and public data
Hong Kong: GEM IPOs exceeded Main Board IPOs innumber for the first time since 2003
Proportions of GEM IPOs and Main Board IPOs 1H 2017 GEM IPO monthly analysis
1H 2017 IPO geographic analysis1H 2017 IPO industry analysis
40%31%16%10% 3% 7% 8% 7% 16% 20%24% 17% 28%38% 51%
60%69%84%90% 98% 93%92% 93%84% 80%76% 83% 72%62% 49%
2003 2004 2005 2006 2007 2008 2009 2010 2011 2012 2013 2014 2015 2016 1H2017
GEM Mainboard
637 291 396 440 533 257
10
3
6 75 4
January February March April May June
Total funds raised (HK$ m) No. of IPOs
MainlandChina, 11%
Hong Kong,86%
Other, 3%Construction
17%
Retail andconsumerproducts
29%TMT20%
Other34%

Page 16Global IPO Market Study Report
► After 10 years of downturn, the Hong Kong GEM has been on the rise since 2015.
► Small and medium-sized enterprises, especially innovative SMEs, are playing an increasingly important rolein Hong Kong and Mainland economies. GEM IPO activity has been extremely active as SMEs listingsincreased.
► HKEX are planning to tighten restrictions on GEM listings, which will become as strict as for Main Boardlistings; some unprofitable start-ups (e.g., MeiTu) can, through market capitalization and income testing, belisted on the Main Board directly.
Sources: EY statistics, HKEX *Data after 25 June 2017 is estimated based on the prospectuses and public data
Hong Kong: increased SME listings increased, the reform of GEMis coming
Number of IPOs on Hong Kong Main Board and GEM Number of A-share IPOs on Shanghai and ShenzhenStock Exchanges
4657 57
26 2110 6 2 2 5 7 13 12
23 1934
4535
41
31
55
3946
54 53
78
27
60
87
68
48
74
90 87
72
34
2000 2001 2002 2003 2004 2005 2006 2007 2008 2009 2010 2011 2012 2013 2014 2015 2016 1H2017
GEM Mainboard
26 38 25 4389 103 120
321
243
129
82
130 124 126
2010 2011 2012 2014 2015 2016 1H 2017
Shanghai Stock Exchange Shenzhen Stock Exchange

Page 17Global IPO Market Study Report
$1.5 $1.4
$3.1
$2.3
$4.4
$6.5
$3.3$3.9
$2.6
$1.2 $1.5
$4.4
$1.9
$6.0
$5.1
$1.8
$1.0
$2.0 $1.9 $1.7 $1.9$2.3
$2.9
$1.8$1.1
$1.9
$0.8
Sources: EY statistics, HKEX *Data after 25 June 2017 is estimated according to the prospectus and public information
Hong Kong: small and medium-sized IPOs play a leadingrole, causing further decrease in average funds raised
► In 1H 2017, the proportion of small and medium-sized IPOs continued to increase,and the average funds raised fell to HKD1 billion, striking the bottom since 2004
► 87% of funds raised of IPOs were less than HKD1 billion
Semi-annual analysis for average IPO funds raised during 2004-1H 2017
HKD billion

Page 18Global IPO Market Study Report
Hong Kong: stock market rose, resulting inhigher issue prices of IPOs► In 1H 2017, the outstanding performance of the Hong Kong stock market has pushed up
the issue price of IPOs. For about 40% of IPOs, the issue price is higher than the middlerate, reaching an increase of 3% compared with the same period of 2016.
► Smaller GEMs are more favored by investors. For 42% of IPOs, the issue price is higherthan the average rate, higher than that of the Main Board (38%).
Sources: EY statistics, HKEX *The statistics is based on data of pricing before 25 June 2017
Percentage of IPOs with an issue price higher than the middle rate (1H 2016 vs1H 2017)
35%40% 37%38%
42% 40%
Mainboard GEM All
1H 2016 1H 2017

Page 19Global IPO Market Study Report
Sources: EY statistics, SEHK*Based on the shares oversubscribed by public investors ofHong Kong’s Main Board**Data as of 25 June 2017 GMT+8
►In 1H 2017, 97% of IPOs inHong Kong were oversubscribed,
exceeding78% of the sameperiod in 2016.
►Of the top 10 oversubscribedIPOs, half was from theinfrastructure sector.
►The first IPO of elderly homecare enterprise was attractiveto the market.
Hong Kong: 97% shares of Main Board achievedoversubscription led by optimistic investor sentiment
No.3大仓控股
(Technology, media andtelecommunications)
1077x
Above 700x
Analysis of top 10 oversubscribed IPOs in 1H 2017
No.3大仓控股
(科技、传媒和电信)
1077x
No.1ISDN Holdings
(Industrials)1,891x
No.2Microware
(TMT)1,117x
No.3Okura Holdings
(TMT)1,077x
No.4SH Group
(Construction andinfrastructure)
799x
No.5Pine Care Group
(Healthcare)796x
No.6G & M Holdings
(Construction andinfrastructure)
741x
No.8Sanroc
International(Industry)
356x
No.7Milestone Builder(Construction and
infrastructure)587x
No. 10Lai Si EnterpriseHolding Limited
(Construction andinfrastructure)
187x
No.9Royal Deluxe
Holdings(Construction and
infrastructure)349x

第20页 全球首次公开募股 (IPO) 市场调研报告
Source: EY Statistics, HKEx* The statistics is based on data of pricing before25 June 2017
Hong Kong: number of listed overseas companiesincreased
► In 1H 2017, there was an increase in thenumber of overseas enterprises, especiallyAsian enterprises, which went to public inHong Kong. Five overseas enterprises werelisted in Hong Kong in 1H 2017, of which fourwere from Asia.
► The market was enthusiastic about overseascompanies, with two overseas companiesranking among the top three foroversubscription (ISDN Holdings and OkuraHoldings).
► Overseas listed companies were from theTMT, industrials, energy, construction andinfrastructure and other industries
Companyname Country Industry Funds raised
(HKD million)
PerstaResources Canada Energy and power 220
SHIS Singapore Construction andinfrastructure 201
OkuraHoldings Japan TMT 150
NexionTechnologies
Singapore TMT 72
ISDN Holdings Singapore Industrials 50
2012-2017年海外企业上市数量半年分析Semi-annual analysis on the number ofoverseas listed companies 2012-2017
21
0
4
0
2 2 21
8
5
1H12 2H12 1H13 2H13 1H14 2H14 1H15 2H15 1H16 2H16 1H17

Page 21Global IPO Market Study Report
Sources: EY statistics, SEHK *Data after 25 June 2017 is estimated according to the prospectus and public information
Hong Kong: education enterprises IPOs becamefavorable
► In 1H 2017, two education enterprises were ranked amongstthe top 10 IPOs in Hong Kong, while a total of five educationenterprises went public in Hong Kong. The Law of thePeople’s Republic of China on Promotion of Privately-runSchools to be implemented will favor private educationenterprises and promote the capital market transaction of theeducation sector.
► Four financial institutions contribute nearly 70% of the fundsraised of the top 10 IPOs
Distribution of top 10 IPO industries by funds raised in1H 2017
Top 10 IPOs of Hong Kong in 1H 2017
Financials70%
Education7%
Others23%
957
1,329
1,404
1,768
1,968
3,381
3,461
4,572
8,073
17,249
New Century Healthcare
Kunming Dianchi WaterTreatment
Minsheng EducationGroup
China YuHua Education
Bocom International
China EverbrightGreentech
Jilin Jiutai RuralCommercial Bank
WUXI BIOLOGICS
Guangzhou RuralCommercial Bank
Guotai Junan SecuritiesHKD million

Page 22Global IPO Market Study Report
Sources: EY statistics, SEHK *Data after 25 June 2017 is estimated according to theprospectus and public information
► In terms of funds raised fromIPOs, the financial sector rankedfirst, hitting 58% of funds raisedin 1H 2017, down from 74% overthe same period in 2016
► The number of IPOs in theconstruction and infrastructuresector increased rapidly and tiedfor the first place, which wasinextricably linked with theHKEX’s strong promotion ofHong Kong as an investmentand financing center under theBelt and Road Initiative whichfurther promoted IPOs ofinfrastructure-related companies.
► IPOs of education enterprisespushed the number ofconsumer products & retail ofIPOs up. The Mainland ChinaLaw on Promotion of Privately-run Schools to be implementedand the second-child policy willpromote IPOs of educationinstitutions.
Top five industries by amount of funds raised
Hong Kong: funds raised in financial sectorstayed ahead
15 15
109
7
Construction Retail, consumerproducts and
services
TMT Financials Industrials
$31,303
$6,225 $5,914 $5,552$2,234
Financials Health Retail, consumerproducts and
services
Energy and power Construction
HKD$m
Top five industries by number of IPOs
Top five industries by funds raised

Page 23Global IPO Market Study Report
US: IPO activity remained subdued but futureis promising
1H 2016 vs 1H 2017
Sources: EY statistics, American Stock Exchange
► In 1H 2017, a total of four Chinese companies were listed in the US and raised USD274 million. The number of IPOs wereequal to the same period of last year and the funds raised decreased 39% year-on-year.
► The majority of companies that were listed in the US were from the education, fintech and health care industries, which arehot industries for IPO listings in the US
► The much anticipated implementation of the Law of the People s Republic of China on Promotion of Privately-run Schools,the second-child policy and a higher valuation of the US market were the main drivers for Mainland's education enterprises togo public in the US
► Since 2H 2015, mainland China’s fintech industry has undergone a period of consolidation. Domestic back door listings orIPOs were faced with challenges. As fintech companies enjoyed favorable prospects in the US market, Mainland’s fintechcompanies were attracted to go public in the US.
► Mainland companies still have a strong interest in listing in the US, focusing on fintech, health care, education, life science andtechnology and other industries
► The liquidity and attractive valuation of the US capital market and the US investors' enthusiasm on high-growth and promisingcompanies have made the US market an attractive place for China's private high-tech companies and enterprises in the neweconomies industries.
1
2
3
2
1H 2015
1H 2016
No. of IPOs
NYSE NASDAQ
52
218
394
56
1H 2015
1H 2016
Total funds raised
NYSE NASDAQ
US$ m
Page 24Global IPO Market Study Report
Sources: EY statistics, public data compilation
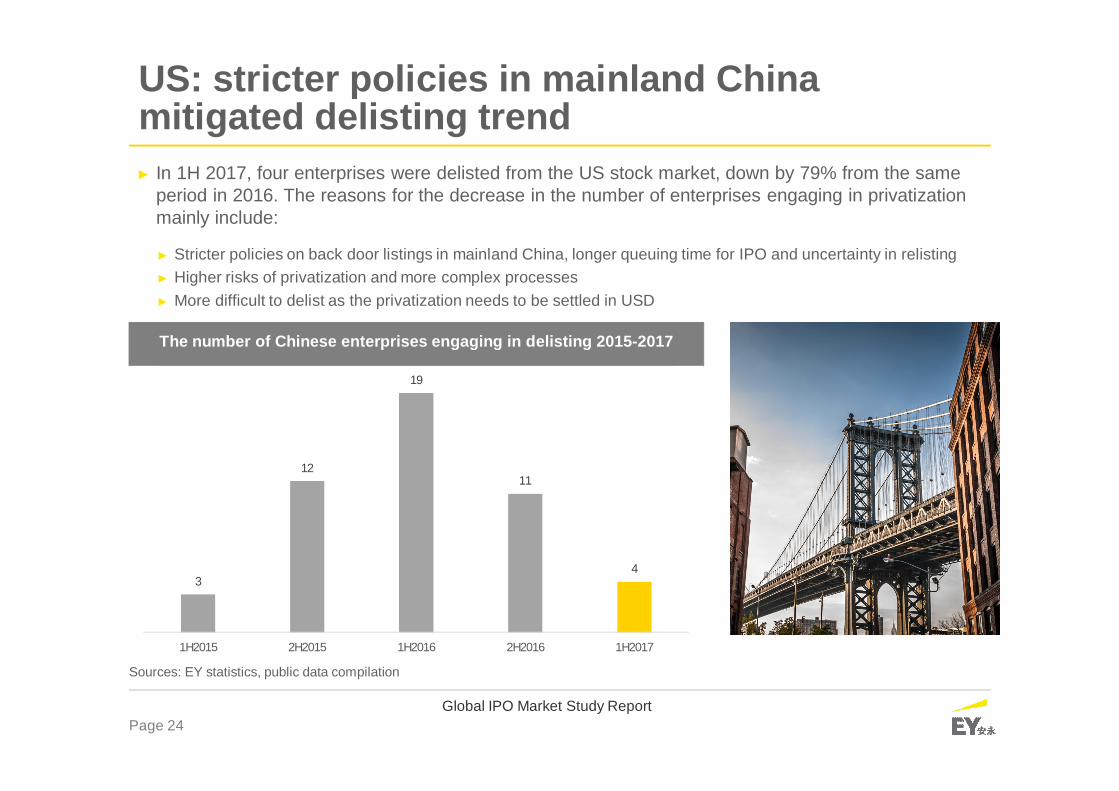
US: stricter policies in mainland Chinamitigated delisting trend► In 1H 2017, four enterprises were delisted from the US stock market, down by 79% from the same
period in 2016. The reasons for the decrease in the number of enterprises engaging in privatizationmainly include:
► Stricter policies on back door listings in mainland China, longer queuing time for IPO and uncertainty in relisting► Higher risks of privatization and more complex processes► More difficult to delist as the privatization needs to be settled in USD
The number of Chinese enterprises engaging in delisting 2015-2017
3
12
19
11
4
1H2015 2H2015 1H2016 2H2016 1H2017

Page25 Global IPO Market Study Report
2H 2017 Greater China’s IPO Market Outlook

Page26Global IPO Market Study Report
A-share: moderate adjustment on issuancespeed and steady reform of the capital market
Decrease in thescale of IPOs andincrease in small-andmedium-sized newshares
New layer is added tothe New Third Boardand a “Layer ofChoice” is expected tobe launched in future
Further strengthening ofmarket supervision andleveraging of big data todevelop smart monitoringmodel
More enterprises listingstransfer from the New ThirdBoard to A-share
The inclusion of China A-shares in the MSCIemerging markets indexwill attract moreinternational capital flows
Moderateadjustment on IPOissuance and theaim to destockingremains
1 2
34
5 6

Page27Global IPO Market Study Report
A-share: TMT, industrials and materials werethe top three industries in IPOs
► IPO approvals have accelerated to clearheavy backlog in the A-share market.According to data as of 22 June, therewere 585 enterprises in the IPO queuelist of CRSC, down by 20% from the endof 2016.
► Although the approval process for IPOshas slowed down due to the sluggishmarket, the speed was expected toremain at stable rate.
► In the IPO pipeline, TMT, industrials andmaterials were the top three industries.
► There were still more than 10 cities andrural commercial banks queuing forIPOs.
► The Mainland China Law on Promotionof Privately-run Schools will be effectivein September 2017, and more educationenterprises are expected to consider A-share IPOs in future .
*Data released by CSRC as of 22 June 2017
Industries of enterprises in IPO pipelineby the IPO number*
Industrials22%
TMT22%
Materials15%
Health11%
Retail,consumer
products andservices
9%
Financials5%
Others16%

Page 28Global IPO Market Study Report
Positive factors:► The recovery in global economic environment and the sound performance of
emerging market will benefit capital market in 2017.► The deepening of connectivity between mainland China and Hong Kong, the low
valuation, high growth and high dividend yields of the Hong Kong stock market andother factors will attract more domestic and foreign investments in Hong Kong.
► Hong Kong is expected to play a key role in the Belt and Road Initiative. The SFCand the HKEX are positive on the IPOs of enterprises relating to the Initiative.
► The urban agglomeration development plan for the “Greater Bay Area” ofGuangdong-Hong Kong-Macau is expected to invigorate Hong Kong’s economicdevelopment.
► The HKEX is actively attracting high-quality enterprises to list in Hong Kong bydiversified means, such as introducing the New Board.
► The strong interest in listing in Hong Kong underpins a high number of enterprises togo public on the HKEX.
Negative factors:► Rising global protectionism and high uncertainty in economic and political policies
pose challenges to the global economy.► Fed’s decisions to lift interest rate and shrink balance sheet have a negative impact on
the market liquidity in Hong Kong.► Financial deleveraging means that China's interest rate will shift from easy to neutral.► As the A-share IPO process accelerates, some enterprises may choose to go for A-
share IPOs
Hong Kong: number of IPOs is expected to bedriven by SMEs
It is expected that IPOs will raise about HKD200 billion in 2017, the same levelas in 2016. Driven by the increase in the number of SME listings, especially on theGEM, the number of IPOs is expected to increase.

Page29Global IPO Market Study Report
Hong Kong: improve issuance system and establish amulti-layer capital market► The HKEX is committed to improving IPO system and establishing multi-layer capital market to attract more high-
quality and high-growth enterprises to list in Hong Kong in future.
► The planned New Board will offer more options for innovative company listings, attracting more innovativeenterprises to go public in Hong Kong. It will be even more attractive if the Stock Connect programs welcome theNew Board enterprises.
► Whether the New Board can increase the amount of transactions in a short term depends on whether it can attract“giant” enterprises like Alibaba to seek secondary listing in Hong Kong
Main Board
The SFC and the HKEX areanalyzing the consultationfeedback for the JointConsultation Paper onProposed Enhancements toThe Stock Exchange of HongKong Limited’s Decision-Making and GovernanceStructure for ListingRegulation
GEM
Consultation on issues relating toGEM has been launched. Issuesinclude improving the requirementsfor IPO application and transfer oflisting from GEM to Main Board;abolishing the full allotment listingmechanism; extending the post-IPOlock-up requirements on controllingshareholders. The publicconsultation period lasts for twomonths
New Board
The HKEX has proposed toestablish a New Board. The NewBoard will be divided into NewBoard PREMIUM and NewBoard PRO for differentinvestors, enabling enterpriseswith same share but differentrights to go listing. It alsofeatures an accelerated delistingmechanism. The consultationperiod lasts for two months
Page30Global IPO Market Study Report
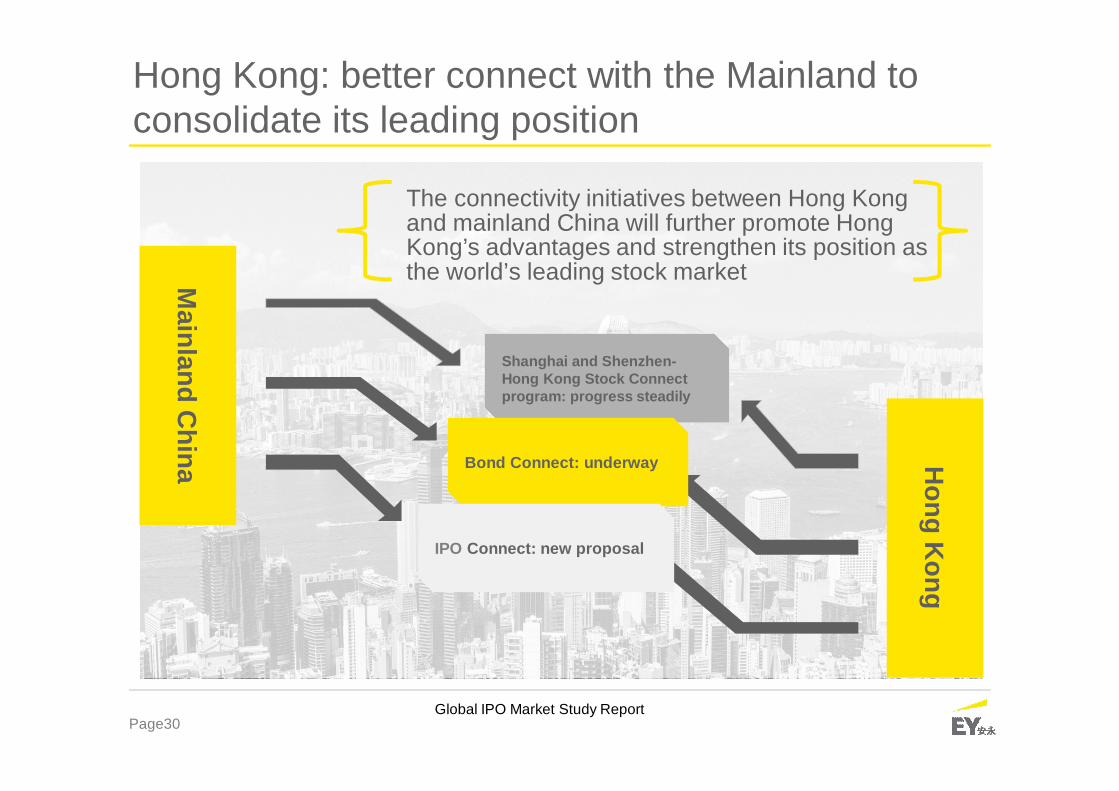
The connectivity initiatives between Hong Kongand mainland China will further promote HongKong’s advantages and strengthen its position asthe world’s leading stock market
Shanghai and Shenzhen-Hong Kong Stock Connectprogram: progress steadily
Bond Connect: underway
IPO Connect: new proposal
Mainland
China H
ongK
ong
Hong Kong: better connect with the Mainland toconsolidate its leading position
Page 31Global IPO Market Study Report
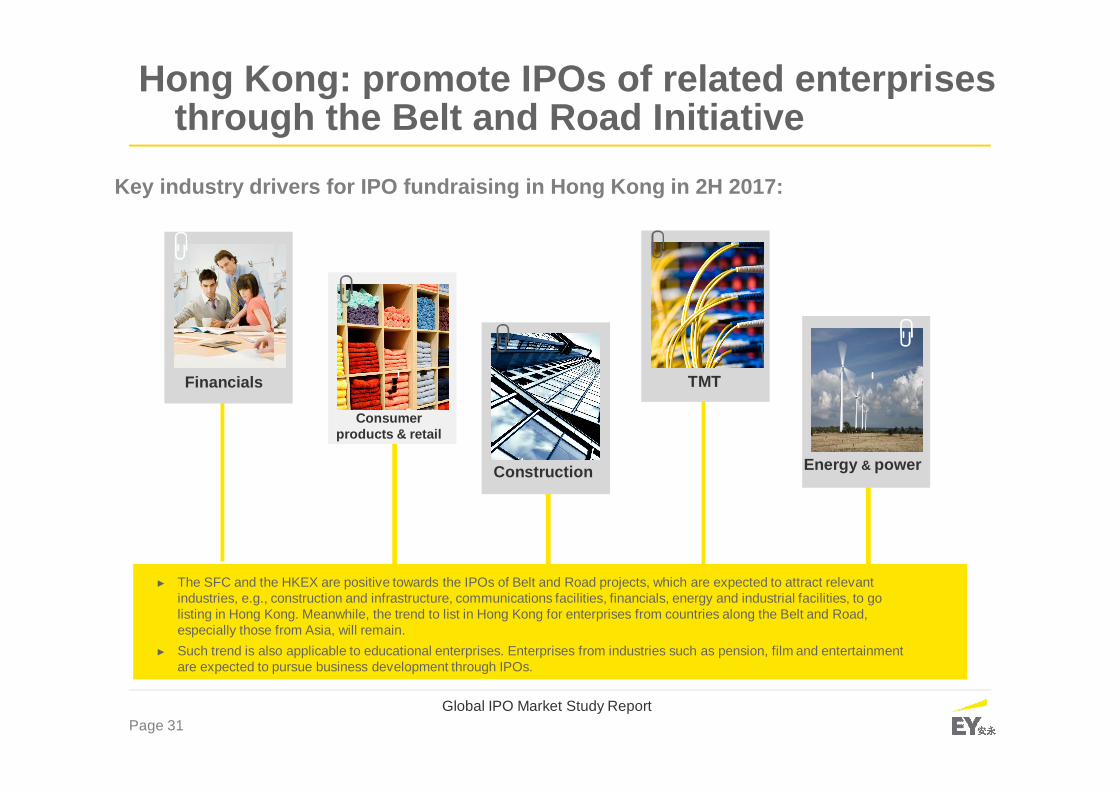
Key industry drivers for IPO fundraising in Hong Kong in 2H 2017:
Financials
Consumerproducts & retail
Construction
TMT
Energy & power
► The SFC and the HKEX are positive towards the IPOs of Belt and Road projects, which are expected to attract relevantindustries, e.g., construction and infrastructure, communications facilities, financials, energy and industrial facilities, to golisting in Hong Kong. Meanwhile, the trend to list in Hong Kong for enterprises from countries along the Belt and Road,especially those from Asia, will remain.
► Such trend is also applicable to educational enterprises. Enterprises from industries such as pension, film and entertainmentare expected to pursue business development through IPOs.
Hong Kong: promote IPOs of related enterprisesthrough the Belt and Road Initiative
Page 32Global IPO Market Study Report
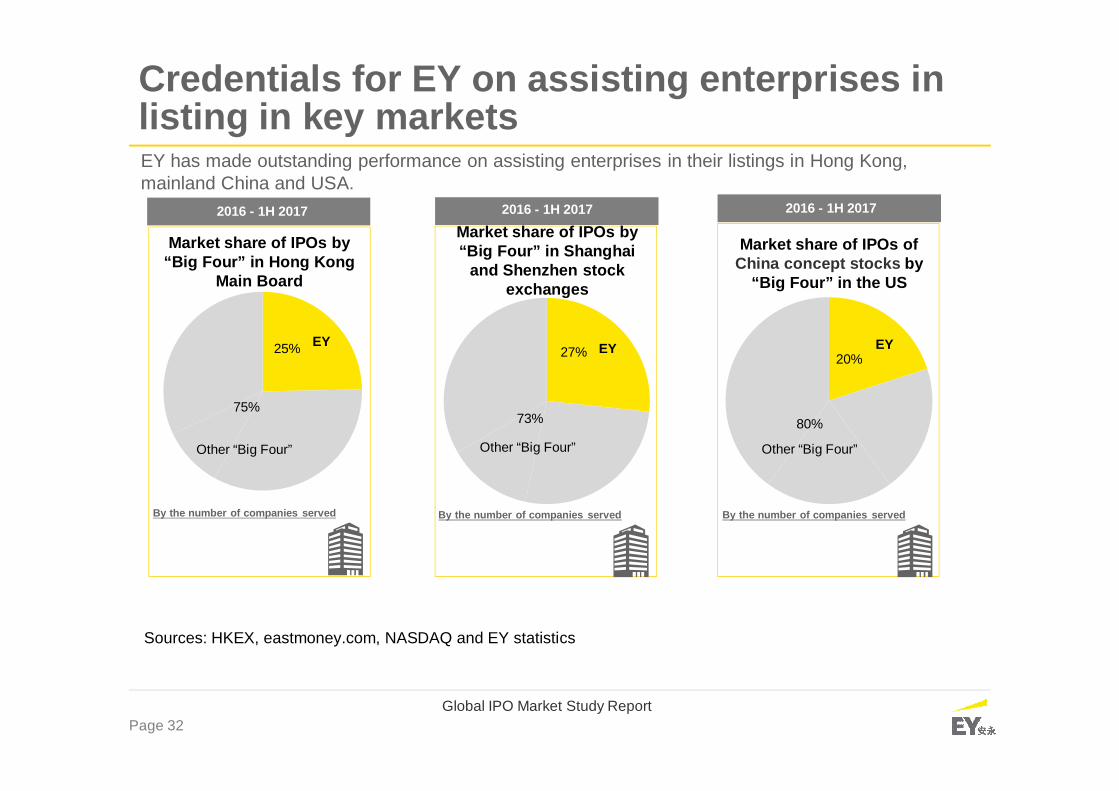
EY has made outstanding performance on assisting enterprises in their listings in Hong Kong,mainland China and USA.
Credentials for EY on assisting enterprises inlisting in key markets
75%
25%
Sources: HKEX, eastmoney.com, NASDAQ and EY statistics
Market share of IPOs by“Big Four” in Hong Kong
Main Board
EY
Other “Big Four”
2016 - 1H 2017
73%
27%
Market share of IPOs by“Big Four” in Shanghai
and Shenzhen stockexchanges
EY
Other “Big Four”
2016 - 1H 2017
80%
20%
Market share of IPOs ofChina concept stocks by
“Big Four” in the US
EY
Other “Big Four”
2016 - 1H 2017
By the number of companies served By the number of companies served By the number of companies served

Page 33Global IPO Market Study Report
About EY
EY is a global leader in assurance, tax, transaction and advisory services.The insights and quality services we deliver help build trust and confidencein the capital markets and in economies the world over. We developoutstanding leaders who team to deliver on our promises to all of ourstakeholders. In so doing, we play a critical role in building a better workingworld for our people, for our clients and for our communities.
EY refers to the global organization, and may refer to one or more, of themember firms of Ernst & Young Global Limited, each of which is a separatelegal entity. Ernst & Young Global Limited, a UK company limited byguarantee, does not provide services to clients. For more information aboutour organization, please visit ey.com.
© 2017 Ernst & Young, ChinaAll Rights Reserved.
APAC no. 03004922ED None
This material has been prepared for general informational purposes only and is not intended tobe relied upon as accounting, tax or other professional advice. Please refer to your advisors forspecific advice.
ey.com/china
EY | Assurance | Tax | Transactions | Advisory