Great Britain Tourism Survey May 2015. 2 Headlines MAY 2015 There were almost 12 million domestic...
14
1 Great Britain Tourism Survey May 2015
-
Upload
brianne-garrison -
Category
Documents
-
view
214 -
download
1
Transcript of Great Britain Tourism Survey May 2015. 2 Headlines MAY 2015 There were almost 12 million domestic...

Great Britain
Tourism SurveyMay 2015

2
HeadlinesMAY 2015
• There were almost 12 million domestic overnight trips in GB in May 2015, up +6% to May 2014 when there were 11.3 million trips.
• Expenditure increased further by +16% to £2.4 billion, while nights increased by +13% to 35.7 million.
• There were 9.9 million domestic overnight trips to England in May 2015, up by +9% on the same month last year when there were 9.1 million.
• Spend increased by +15% to £1.9 billion and bednights increased by +13% to 27.8 million.
YEAR-TO-DATE
• In the year to May 2015, GB trips were up +14% to 46.5 million, compared to 40.9 million in the same period in 2014. This is the highest volume of trips and the highest expenditure recorded (in real terms) for this period since the survey began in 2006.
• Nights and expenditure were also up for the year to date, +16% and +19% respectively
• In the year to May 2015, trips to England were up +16% to 38.6 million from 33.4 million in 2014. Nights and spend were both up by +17%.
• As for GB trips, this is the highest volume of trips and the highest expenditure recorded (in real terms) for this period since the survey began in 2006.
Context
• Temperatures in May were around average, with above average rainfall.• The early May bank holiday fell on May 4th and the Spring bank holiday on May 25th
Summary of Results GB And England
Trips Nights
+6% +13% +16%
Spend
+9% +13% +15%
+14% +16% +19%
GBTS May 2015 Published 25th August 2015
Weather
+16% +17% +17%
3
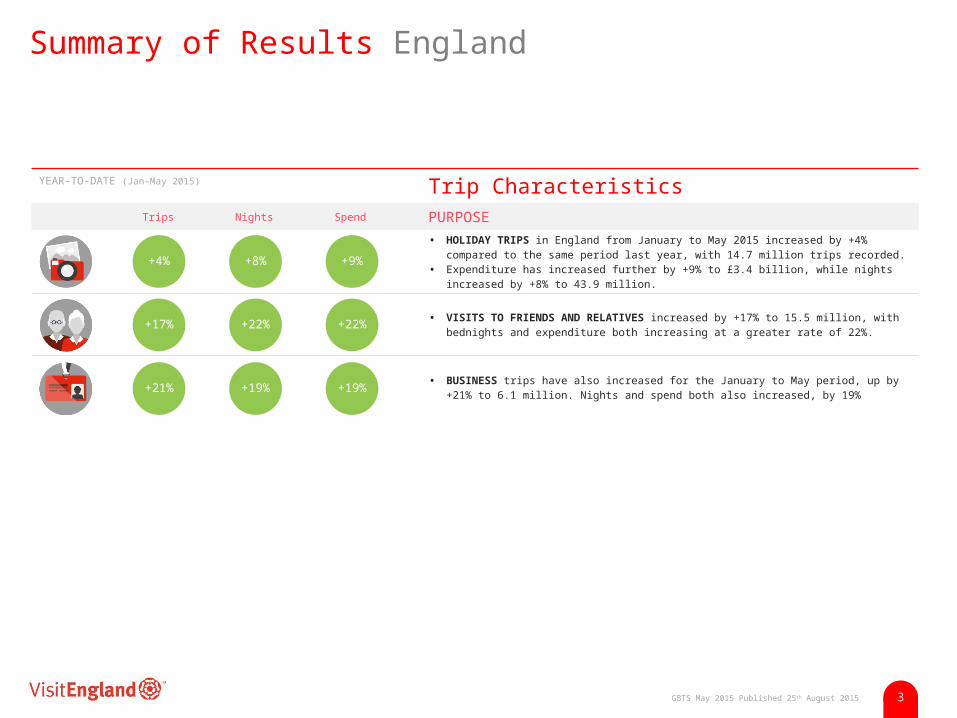
YEAR-TO-DATE (Jan–May 2015) Trip Characteristics Trips Nights Spend PURPOSE
• HOLIDAY TRIPS in England from January to May 2015 increased by +4% compared to the same period last year, with 14.7 million trips recorded.
• Expenditure has increased further by +9% to £3.4 billion, while nights increased by +8% to 43.9 million.
• VISITS TO FRIENDS AND RELATIVES increased by +17% to 15.5 million, with bednights and expenditure both increasing at a greater rate of 22%.
• BUSINESS trips have also increased for the January to May period, up by +21% to 6.1 million. Nights and spend both also increased, by 19%
Summary of Results England
+4% +8% +9%
+17% +22% +22%
+21% +19% +19%
GBTS May 2015 Published 25th August 2015

4
Overseas Travel by UK ResidentsInternational Passenger SurveyMAY 2015 JAN - MAY 2015
Trip Spend Trip Spend
• In May, trips and the expenditure on those trips by Brits overseas increased by +8%• In the year to date, trips were up by +9%. Expenditure increased but not at the same rate,
+5%.
Other Tourism Surveys
MAY 15 Room Bedspace OCCUPANCY
• Room occupancy in England in May remained flat compared to 2014 at 72%, while bedspace occupancy fell slightly by -1% to 55%
MAR-MAY 15 Volume Spend DAY VISITS
• The number of tourism day visits in England in the period March to May 2015 decreased slightly by -1% compared to 2014, to 332 million
• The value of those visits decreased more significantly, by -5% to £11 billion
JUNE 15 Attractions Accomodation TOURISM BUSINESS MONITOR
• Attractions and accommodation businesses reported an increase in visitors for the period from January until the end of May
Context Other Surveys
+8% +5%+8% +9%
0% +1%
-1% -5%
GBTS May 2015 Published 25th August 2015

5
Headline Data GB and EnglandVolume and spend (2014 vs 2015)
£6,871
£4,781
£1,883
£5,887
£4,080
£1,645
Spend (£m)
Year to Date
Past 3 months
May '15
38.6
26.0
9.9
33.4
22.8
9.1
Trip Volume (millions)
+9%
+14%
+16%
Year to Date
Past 3 months
May '15
46.5
31.8
12.0
40.9
28.4
11.3
Trip Volume (millions)
+6%
+12%
+14%
+15%
+17%
+17%
£8,775
£6,215
£2,426
£7,367
£5,238
£2,100
Spend (£m)
+16%
+19%
+19%
England aa
2014
2015
GB aa
2014
2015
% change vs 2014
GBTS May 2015 Published 25th August 2015

6
Trips EnglandVolume of trips (millions) (2014 vs 2015)
May '15 Past 3 months Year to Date
9.1
22.8
33.4
9.9
26.0
38.6
4.5
10.5
14.2
4.4
10.8
14.7
1.23.3
5.1
1.2
4.26.1
3.1
8.5
13.3
3.5
9.6
15.5
+9% -2% +4% +12% +14% +3% +30% +13% +16% +4% +21% +17%
All trips
a a
2014 2015
Holiday trips
a a
2014 2015
Business trips
a a
2014 2015
VFR trips
a a
2014 2015
% change vs 2014
GBTS May 2015 Published 25th August 2015

7
May '15 Past 3 months Year to Date
24.6
61.1
86.8
27.8
72.7
101.8
14.0
31.5
40.5
14.8
34.5
43.9
2.57.1
10.9
2.68.6
12.97.6
21.5
32.3
8.8
26.0
39.5
+13% +6% +3% +16% +19% +10% +22% +21% +17% +8% +22% +21%
Nights EnglandVolume of nights (millions) (2014 vs 2015)
All trips
a a
2014 2015
Holiday trips
a a
2014 2015
Business trips
a a
2014 2015
VFR trips
a a
2014 2015
% change vs 2014
GBTS May 2015 Published 25th August 2015

8
May '15 Past 3 months Year to Date
£1
,64
5
£4
,08
0
£5
,88
7
£1
,88
3
£4
,78
1
£6
,87
1
£9
70
£2
,29
9 £3
,10
1
£1
,09
2
£2
,51
6 £3
,37
7
£2
84 £7
37 £1
,19
2
£2
85 £
93
8 £1
,42
0
£3
26 £
92
9 £1
,39
1
£3
99 £
1,1
11
£1
,69
7
+15% +13% 0% +22% +17% +9% +27% +20% +17% +9% +19% +22%
Spend EnglandExpenditure (£m) (2014 vs 2015)
All trips
a a
2014 2015
Holiday trips
a a
2014 2015
Business trips
a a
2014 2015
VFR trips
a a
2014 2015
% change vs 2014
GBTS May 2015 Published 25th August 2015

9
Jan Feb Mar Apr May Jun Jul Aug Sep Oct Nov Dec
VOLUME by Month (2006-2015)
2006 2007 2008 2009 2010 2011 2012 2013 2014 2015
10.30510.906
11.78112.535
11.84410.821
10.22611.178 11.269
11.965
VOLUME – May (2006-2015)
Long Term Trends by Month GB2006-2015 (millions)
GBTS May 2015 Published 25th August 2015

10
Jan
-Ma
y '0
8
Jan
-Ma
y '0
9
Jan
-Ma
y '1
0
Jan
-Ma
yr '1
1
Jan
-Ma
y'1
2
Jan
-Ma
y'1
3
Jan
-Ma
y '1
4
Jan
-Ma
y '1
5
£6,003 £5,890 £5,647
£6,023 £6,221 £6,175
£5,887
£6,871
£2,815 £3,003
£2,862 £3,129 £3,145
£2,938 £3,101
£3,377
£1,565 £1,372 £1,332 £1,373
£1,562 £1,556
£1,192 £1,420 £1,436 £1,395 £1,286 £1,354 £1,311 £1,436
£1,391 £1,697
Spend (£m)
Jan
-Ma
y '0
8
Jan
-Ma
y '0
9
Jan
-Ma
y '1
0
Jan
-Ma
yr '1
1
Jan
-Ma
y'1
2
Jan
-Ma
y'1
3
Jan
-Ma
y '1
4
Jan
-Ma
y '1
5
36.43 37.00 36.67 37.1835.87
34.9833.38
38.59
13.81
15.9315.01 15.48
14.69 14.21 14.18
14.74
6.50 5.91 5.98 6.03 6.46 6.225.06
6.11
14.76
14.18 14.55 14.4213.23 13.04 13.27
15.46
Trip Volume (millions)
Long Term Trends, Year-to-Year England
Holiday TripsAll Trips Business Trips VFR Trips
GBTS May 2015 Published 25th August 2015

11
UK Outbound Travel (International Passenger Survey)Total volume (millions) and spend (£bn)
May '15 Past 3 Months Year to Date
5.66
14.19
21.29
6.11
15.89
23.22
3.05
8.06
12.50
3.31
8.76
13.11
Trips
a a
2014 2015
Spend
a a
2014 2015
+8% +8% +12% +9% +9% +5%
% change vs 2014
GBTS May 2015 Published 25th August 2015

12
All Tourism Holidays Business VFR
2010 2011 2012 2013 2014 2015 2010 2011 2012 2013 2014 2015 2010 2011 2012 2013 2014 2015 2010 2011 2012 2013 2014 2015
TripLength
2.63 2.74 2.60 2.59 2.60 2.64 3.03 3.07 2.87 2.88 2.86 2.98 2.05 2.13 2.24 2.16 2.15 2.12 2.47 2.55 2.53 2.50 2.44 2.55
SpendPer
Night£59 £59 £67 £68 £68 £67 £63 £66 £75 £72 £77 £77 £106 £106 £110 £111 £107 £109 £36 £37 £39 £44 £43 £43
SpendPer Trip
£154 £162 £173 £177 £176 £178 £191 £202 £214 £207 £219 £229 £223 £228 £242 £250 £236 £233 £88 £94 £99 £110 £105 £110
Appendix: Domestic Tourism EnglandYear to date trip length, spend/night, spend/trip
GBTS May 2015 Published 25th August 2015

13
Note about these results: The GB Tourism Survey is a survey of British residents, in which 2000 respondents are interviewed each week, making a total of 100,000 each year. Any respondent having taken one or more overnight trips in the previous 4 week period is asked to describe the details of trips taken. Each year, data from around 17,000 trips is collected, and this is subsequently grossed up to provide population estimates. Full details of the survey methodology can be found at: https://www.visitengland.com/sites/default/files/banner-images/gbts_2013_-_methods_performance_report_v2.pdf On an annual basis, the survey is extremely robust, with a confidence level for England data at +/- 3% at the 95% level for the number of trips and nights measured, and +/- 4% for the expenditure figure. For shorter time periods and for other subsets of the data such as region or trip purpose, the margin of error is wider – guidance on confidence intervals at national and regional level for annual and quarterly data is provided on the next page. For any questions about data interpretation, please contact [email protected] No part of this publication may be reproduced for commercial purposes without the permission of VisitEngland. Extracts may be quoted if the source is acknowledged. Users wishing to include results from this survey within a press release should contact Angelah Sparg in the VisitEngland Press Office [email protected] for review prior to external release.

14
GB Domestic Tourism: Confidence Limits at the 95% level
TRIPS (millions) BEDNIGHTS (millions) EXPENDITURE (£ millions)
Destination: Single Quarter Annual Single Quarter Annual Single Quarter Annual
GB Total 4.8% 2.5% 5.5% 3.0% 6.8 3.6%
England Total 5.2% 2.8% 6.0% 3.2% 7.5% 4.0%
East 14.5% 7.7% 18.9% 9.4% 20.1% 11.6%
East Midlands 15.7% 8.3% 17.0% 9.4% 19.2% 10.6%
London 15.7% 7.2% 17.0% 9.1% 19.2% 11.0%
North East 20.4% 11.0% 25.9% 14.3% 49.0% 20.6%
North West 11.6% 6.2% 13.8% 7.4% 16.2% 8.0%
South East 10.5% 5.7% 11.8% 7.5% 13.3% 9.1%
South West 10.5% 5.4% 13.5% 6.3% 20.5% 9.2%
West Midlands 15.6% 8.1% 18.4% 10.0% 19.8% 11.6%
Yorks & Humb 13.2% 6.9% 16.3% 10.1% 19.5% 12.0%
Based on Quarter 2