Great Basin Unified Air Pollution Control District · Great Basin Unified Air Pollution Control...
90
Great Basin Unified Air Pollution Control District DRAFT 2010 Ambient Air Monitoring Network Plan April 16, 2010 Prepared by Christopher Lanane Air Monitoring Specialist Great Basin Unified Air Pollution Control District 157 Short Street Bishop, California 93514 (760) 872-8211 (760) 872-6109 Fax www.gbuapcd.org
-
Upload
duongduong -
Category
Documents
-
view
217 -
download
2
Transcript of Great Basin Unified Air Pollution Control District · Great Basin Unified Air Pollution Control...

Great Basin Unified Air Pollution Control District
DRAFT
2010
Ambient Air Monitoring Network Plan
April 16, 2010
Prepared by Christopher Lanane
Air Monitoring Specialist
Great Basin Unified Air Pollution Control District 157 Short Street
Bishop, California 93514 (760) 872-8211
(760) 872-6109 Fax www.gbuapcd.org

ii
Table of Contents 1.0 Introduction…………………………………………………………………………… 1
2.0 Public Comments……………………………………………………………………… 1
3.0 Network Design……………………………………………………………………… 1
Definition of Terms…………………………………………………………… 9
4.0 Special Programs………………………………………………………………………15
5.0 Recent or Proposed Modifications to Network……………………………………… 15
6.0 Minimum Monitoring Requirements………………………………………………… 17
Appendix A. Site Information ……………………………………………………………… 18
Appendix B. NCORE Monitoring Plan ……………………………………………………… 21
Appendix C. Site Reports…………………………………………………………………… 35
Tables and Figures
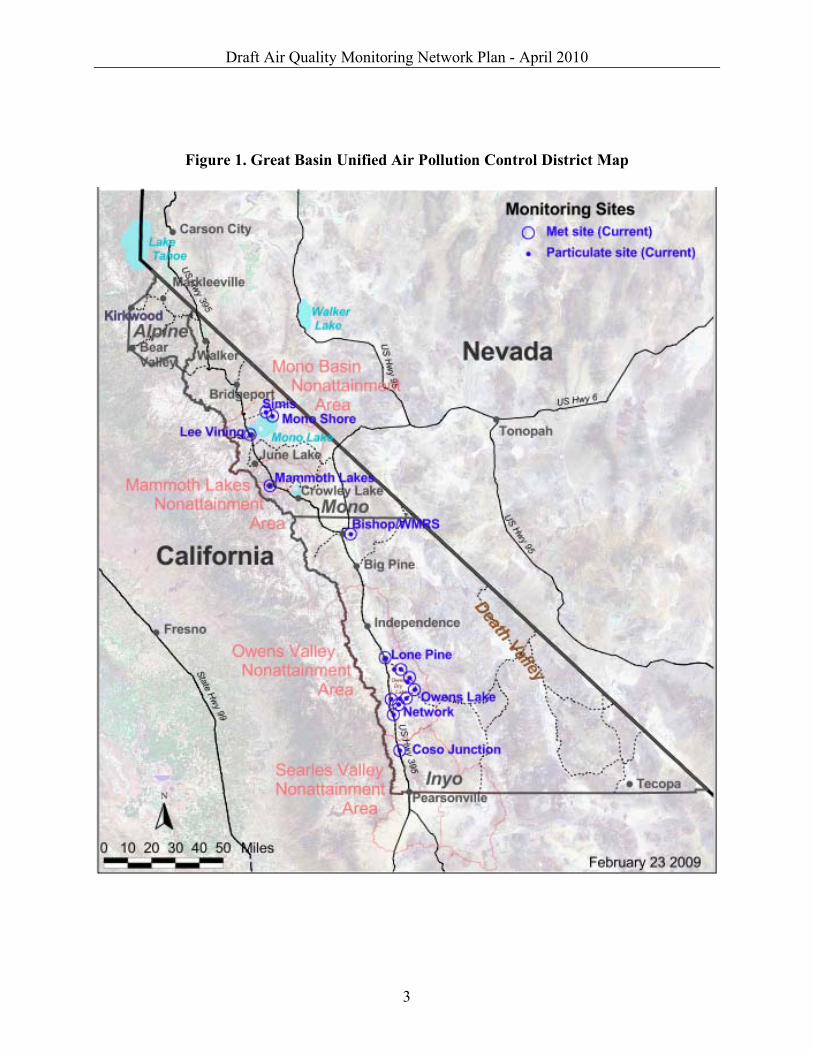
Figure 1. Great Basin Unified Air Pollution Control District map…………………………… 3
Figure 2. Great Basin Unified Air Pollution Control District map, Owens Lake Detail……… 4
Figure 3. Great Basin Unified Air Pollution Control District map, Mono Lake Detail ……… 5
Table 1. List of Monitoring Sites and Variables Monitored…………………………………… 6
Table 2. Criteria Pollutant Monitoring Objectives and Spatial Scales………………………… 7
Table 3. Criteria Pollutant Monitoring Purposes……………………………………………… 8
Figure 4. Owens Lake Map: Dust Identification Program Detail …………………………… 13
Figure 5. Mono Lake Map: Dust Identification Program Detail …………………………… 14

Draft Air Quality Monitoring Network Plan - April 2010
1
1.0 Introduction An annual review of all national air quality monitoring networks is required by Federal regulations as a means to identify needs for addition, relocation, or termination of monitoring stations or instrumentation. The annual Air Quality Monitoring Network Plan prepared by the California Air Resources Board (CARB) in the past has included the area within the Great Basin Unified Air Pollution Control District (District). However, over the past year the District has begun the process of becoming a primary quality assurance organization separate from the CARB and is, therefore, required to prepare its own plan and submit it to the U.S. Environmental Protection Agency (EPA). This report describes the network of ambient air quality monitors to be operated by the District during the 2010 calendar year. It includes a review of actions taken in the monitoring network during the 2009-2010 fiscal year and plans for actions in the years ahead. This draft plan addresses the requirements for an annual network plan as listed in the Code of Federal Regulations, Title 40, Part 58, Section 10 (40 CFR 58.10). These regulations require that the report be submitted to the EPA by July 1 of each year after a 30-day public comment period. The District staff, along with the CARB and EPA Region IX conducted a review of the air monitoring stations throughout the District in 2007. State and Local Air Monitoring Station (SLAMS) designations, monitoring objectives, and spatial scales of representativeness were assigned to the criteria pollutants monitored by site. Each year, District staff conducts an annual review of the air monitoring network to evaluate whether the current monitoring strategies are meeting the needs of the District, to determine compliance with all current Federal and State regulations, and to aid in the development of future monitoring strategies. When monitoring station additions or relocations are warranted, site reports are written and/or updated in the EPA’s Air Quality System (AQS) database to document compliance with established monitoring criteria. 2.0 Public Comments Pursuant to Federal regulations, this draft plan is to be made available for public inspection and comment for at least 30 days prior to submission to the EPA. Notice of availability of the document was published in local newspapers and the document was posted to the District's website (www.gbuapcd.org) on April 16, 2010, under the link, “Current Events.” The draft document was also made available to the EPA during the review period. The public review period provides an opportunity for the public, the EPA, and any other interested parties to provide comments on the plan. Comments received will be included in the plan. Following the review period ending May 17, 2010, the plan will be submitted to EPA for approval of any SLAMS network changes. 3.0 Network Design The District operates eighteen (18) air quality monitoring stations in four planning areas and in the general environs of the District’s three counties: Alpine, Inyo, and Mono. The planning areas in the District are: Searles Valley, Southern Owens Valley, Mono Basin, and Mammoth Lakes. Figures 1 - 3 present maps of the entire District indicating the planning areas, all of which are PM10 nonattainment areas, the monitoring stations currently in operation, and those stations
Draft Air Quality Monitoring Network Plan - April 2010
2
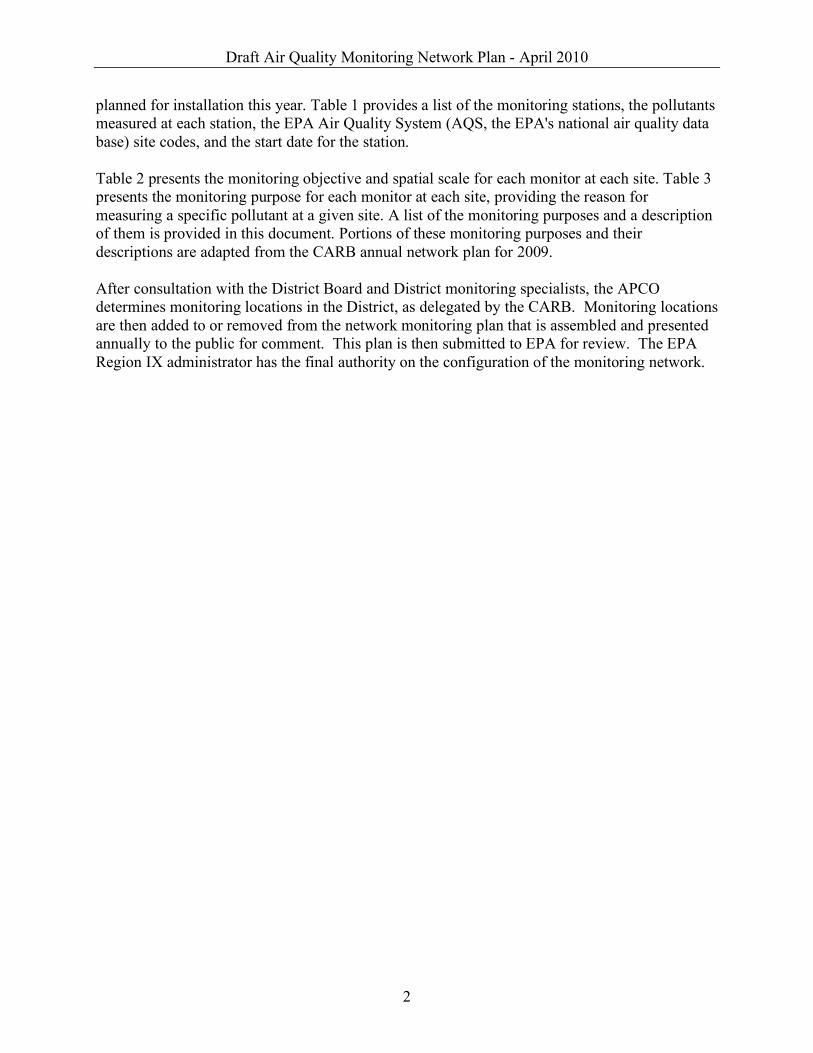
planned for installation this year. Table 1 provides a list of the monitoring stations, the pollutants measured at each station, the EPA Air Quality System (AQS, the EPA's national air quality data base) site codes, and the start date for the station. Table 2 presents the monitoring objective and spatial scale for each monitor at each site. Table 3 presents the monitoring purpose for each monitor at each site, providing the reason for measuring a specific pollutant at a given site. A list of the monitoring purposes and a description of them is provided in this document. Portions of these monitoring purposes and their descriptions are adapted from the CARB annual network plan for 2009. After consultation with the District Board and District monitoring specialists, the APCO determines monitoring locations in the District, as delegated by the CARB. Monitoring locations are then added to or removed from the network monitoring plan that is assembled and presented annually to the public for comment. This plan is then submitted to EPA for review. The EPA Region IX administrator has the final authority on the configuration of the monitoring network.
Draft Air Quality Monitoring Network Plan - April 2010
3
Figure 1. Great Basin Unified Air Pollution Control District Map

Draft Air Quality Monitoring Network Plan - April 2010
4
Figure 2. Great Basin Unified Air Pollution Control District Map, Owens Lake detail

Draft Air Quality Monitoring Network Plan - April 2010
5
Figure 3. Great Basin Unified Air Pollution Control District Map, Mono Lake detail

Draft Air Quality Monitoring Network Plan - April 2010
6
Table 1. List of Monitoring Sites and Variables Monitored
* PM10 monitoring ended August 2008. Station is currently used for meteorological monitoring only. ** District's Portable Monitoring Station berth. *** Portable Monitoring Station returned to berth June 2008, after a one-year monitoring project in Tecopa, California.
Site Name Network AQS Number Pollutants Monitored Start Date
Dirty Socks Owens Lake 06-027-0022 PM10 Jun-99Shell Cut Owens Lake 06-027-0025 PM10 Jan-01Flat Rock Owens Lake 06-027-0024 PM10 Jan-01Bill Stanley Owens Lake 06-027-0026 PM10 Mar-02Olancha Owens Lake 06-027-0021 PM10 Aug-95Lone Pine Owens Lake 06-027-0004 PM10 Jan-80North Beach Owens Lake 06-027-0029 PM10 Nov-08Lizard Tail Owens Lake 06-027-0028 PM10 Feb-08Keeler Owens Lake 06-027-1003 PM10, PM2.5 Jul-94T-8 Owens Lake N/A PM10 Apr-08T-25 Owens Lake N/A PM10 Apr-08Coso Junction Owens Lake 06-027-1001 PM10 Mar-79
Mammoth Lakes Mammoth Lakes 06-051-0001 PM10 Apr-84
Lee Vining Mono Basin 06-051-0005 PM10 Jan-81Simis Residence Mono Basin 06-027-0007 *Mono Shore Mono Basin 06-027-0011 PM10 Jan-00
White Mountain** District 06-027-0002 PM10 4/1/2006***NCORE District TBD CO, SO2, NOy TBD

Draft Air Quality Monitoring Network Plan - April 2010
7
Table 2. Criteria Pollutant Monitoring Objective and Spatial Scales
MONITORING OBJECTIVE SPATIAL SCALE HC - High Concentration MI - Microscale RC - Representative Concentration MS - Middle Scale IM - Impact NS - Neighborhood Scale BL - Background Level US - Urban Scale
* PM10 monitoring ended August 2008. Station is currently used for
meteorological monitoring only.
Site Name Network PM10 PM2.5
Dirty Socks Owens Lake RC/NSShell Cut Owens Lake RC/NSFlat Rock Owens Lake RC/NSBill Stanley Owens Lake RC/NSOlancha Owens Lake RC/NSLone Pine Owens Lake RC/NSNorth Beach Owens Lake RC/NSLizard Tail Owens Lake RC/NSKeeler Owens Lake RC/NS RC/NST-8 Owens Lake HC/NST-25 Owens Lake HC/NSCoso Junction Owens Lake RC/NS
Mammoth Lakes Mammoth Lakes RC/NS
Lee Vining Mono Basin RC/NSSimis Residence Mono Basin *Mono Shore Mono Basin HC/NS
White Mountain District RC/NSNCORE District RC/RS

Draft Air Quality Monitoring Network Plan - April 2010
8
Table 3. Criteria Pollutant Monitoring Purposes
MONITORING PURPOSE
BK - Background Level RC - Representative Concentration HC - High Concentration SO - Source Impact TP - Pollutant Transport TR - Trend Analysis EX - Population Exposure CP - Site Comparison SPM - Special Purpose Monitor
* PM10 monitoring ended August 2008. Station is currently used for
meteorological monitoring only.
Site Name Network PM10 PM2.5
Dirty Socks Owens Lake RC/SOShell Cut Owens Lake RC/SOFlat Rock Owens Lake RC/SOBill Stanley Owens Lake RC/SOOlancha Owens Lake RC/EXLone Pine Owens Lake RC/EXNorth Beach Owens Lake RC/SOLizard Tail Owens Lake RC/SOKeeler Owens Lake RC/EX RC/EXT-8 Owens Lake HC/SPMT-25 Owens Lake HC/SPMCoso Junction Owens Lake RC/TP
Mammoth Lakes Mammoth Lakes RC/EX
Lee Vining Mono Basin RC/EXSimis Residence Mono Basin *Mono Shore Mono Basin HC/SO
White Mountain District RC/EXNCORE District RC/BK

Draft Air Quality Monitoring Network Plan - April 2010
9
Definitions Background Level monitoring is used to determine general background levels of air pollutants. Core-based Statistical Area (CBSA) is defined by the U.S. Office of Management and Budget as a statistical geographic entity consisting of the county or counties associated with at least one urbanized area/urban cluster of at least 10,000 population, plus adjacent counties having a high degree of social and economic integration. The two categories of CBSAs are metropolitan statistical areas and micropolitan statistical areas. High Concentration monitoring is conducted at sites to find the highest concentration of an air pollutant in an area within a given monitoring network. A monitoring network may have multiple high concentration sites as a result of varying meteorology, source area variability, etc. Metropolitan Statistical Area (MSA) is defined by the EPA and by the U.S. Office of Management and Budget as areas having at least one urbanized area of 50,000 or more population, plus adjacent territory that has a high degree of social and economic integration with the core as measured by commuting ties. Micropolitan Statistical Area (MiSA) is defined by the U.S. Census Bureau and the U. S. Office of Management and Budget as an area heaving one urbanized area or urban cluster of between 10,000 and 50,000 population. Monitoring Objectives are the measures for determining the level of pollutant impacts from particular sources at particular sites, i.e., to determine the high concentrations (HC) affecting specific places from sources, the representative concentrations (RC) or overall affect of sources in a given area, the impact (IM) caused by maximum concentration affecting specific places, and background level (BL) concentrations measured upwind of a specific sources. Monitoring Planning Area (MPA) is defined by the EPA as a contiguous geographic area with established, well-defined boundaries, such as a metropolitan statistical area, county, or State, having a common area that is used for planning monitoring locations for PM2.5. MPAs may cross political boundaries, e.g., State, County, etc. MPAs are generally oriented toward areas with populations greater than 200,000. Monitoring Purpose is the reason for conducting monitoring at a particular location. There is some crossover with monitoring objectives, however, they relate specifically to the pollutant, whereas monitoring purposes relate to the effects of the pollutants on populations or resources. Monitoring purposes include: background level (BK), high concentration (HC), representative concentration (RC), and source impact (SO), all of which are defined similarly to the named objectives above. Additional monitoring purposes include: pollutant transport (TP) where pollution from one region or district is carried to another by the winds; population exposure (EX) where a site is located specifically for determining the pollutant exposure level of a particular population;
Draft Air Quality Monitoring Network Plan - April 2010
10
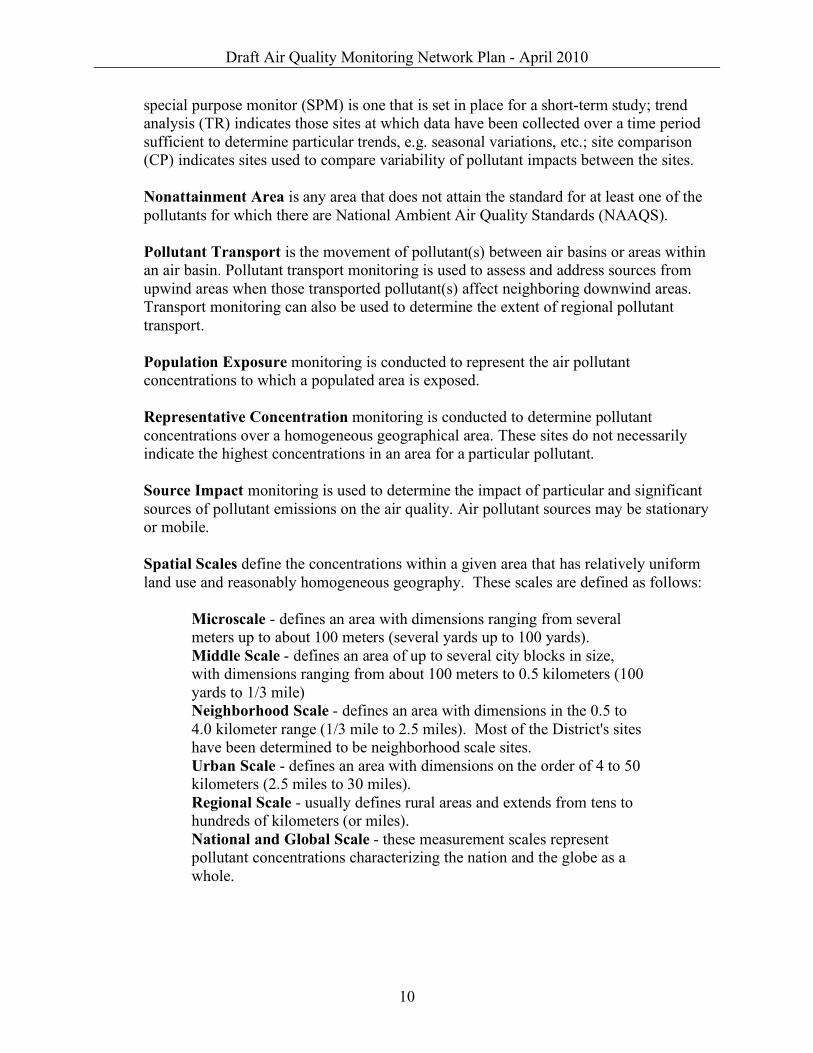
special purpose monitor (SPM) is one that is set in place for a short-term study; trend analysis (TR) indicates those sites at which data have been collected over a time period sufficient to determine particular trends, e.g. seasonal variations, etc.; site comparison (CP) indicates sites used to compare variability of pollutant impacts between the sites. Nonattainment Area is any area that does not attain the standard for at least one of the pollutants for which there are National Ambient Air Quality Standards (NAAQS). Pollutant Transport is the movement of pollutant(s) between air basins or areas within an air basin. Pollutant transport monitoring is used to assess and address sources from upwind areas when those transported pollutant(s) affect neighboring downwind areas. Transport monitoring can also be used to determine the extent of regional pollutant transport. Population Exposure monitoring is conducted to represent the air pollutant concentrations to which a populated area is exposed. Representative Concentration monitoring is conducted to determine pollutant concentrations over a homogeneous geographical area. These sites do not necessarily indicate the highest concentrations in an area for a particular pollutant. Source Impact monitoring is used to determine the impact of particular and significant sources of pollutant emissions on the air quality. Air pollutant sources may be stationary or mobile. Spatial Scales define the concentrations within a given area that has relatively uniform land use and reasonably homogeneous geography. These scales are defined as follows:
Microscale - defines an area with dimensions ranging from several meters up to about 100 meters (several yards up to 100 yards). Middle Scale - defines an area of up to several city blocks in size, with dimensions ranging from about 100 meters to 0.5 kilometers (100 yards to 1/3 mile) Neighborhood Scale - defines an area with dimensions in the 0.5 to 4.0 kilometer range (1/3 mile to 2.5 miles). Most of the District's sites have been determined to be neighborhood scale sites. Urban Scale - defines an area with dimensions on the order of 4 to 50 kilometers (2.5 miles to 30 miles). Regional Scale - usually defines rural areas and extends from tens to hundreds of kilometers (or miles). National and Global Scale - these measurement scales represent pollutant concentrations characterizing the nation and the globe as a whole.

Draft Air Quality Monitoring Network Plan - April 2010
11
Trend Analysis monitoring is useful for comparing and analyzing air pollution concentrations over time. Trend analysis can show the progress or lack thereof in improving the air quality for a given area over a period of many years. Site Comparison monitoring is used to assess the effect of moving a monitoring location a short distance (approximately 2 miles or less) on measured pollutant levels. Some monitoring stations become unusable due to development, change of lease terms, eviction, etc. In these cases, attempts are made to conduct concurrent monitoring at both the old and new monitoring locations for a period of time in order to compare pollutant concentrations at both.
Multiple purposes for monitoring a pollutant at a particular site are possible. There is some overlap between monitoring objectives as defined by EPA, presented in Table 2, and the monitoring purposes presented in Table 3. A brief description of the network for each criteria pollutant monitored is provided here. Further site-specific information is presented in Appendix A. PM10 Medium-volume size selective inlet filter-based PM10 monitors (Rupprecht & Patashnick Partisol Plus 2025) are operated at three (3) sites. Monitoring at the sites is conducted on either the Federal one-in-three-day schedule or on a daily schedule. Filter-based monitors typically measure integrated 24-hour-average PM10 concentrations. Continuous PM10 monitors (Rupprecht & Patashnick TEOM 1400a AB and/or Thermo TEOM 1405DF monitors) are operated in conjunction with filter-based monitors at two of the three filter-based sites. Continuous PM10 monitors alone are operated at an additional 13 sites. The advantage of continuous PM10 monitors is that they are capable of measuring hourly pollutant concentrations. These continuous PM10 monitors are concentrated in areas of high PM10 impact: e.g. around the shoreline of Owens Lake, in the Town of Mammoth Lakes, at the site of maximum impact on the north shore of Mono Lake. Hourly resolution of PM10 concentrations enables the District to more accurately determine the source of the emissions, especially in short-term wind-event driven emissive areas like Owens and Mono Lakes. PM2.5 The District operates one collocated PM2.5 monitoring station at the Keeler monitoring site. The monitors are medium volume filter-based Federal Equivalent Method samplers (Rupprecht & Patashnick Partisol Plus 2025 with a very sharp-cut cyclone (VSCC) for PM2.5). The primary monitor operates on the Federal 1-in-3-day schedule and the collocated monitor operates on the Federal 1-in-12-day schedule. Meteorology The District operates meteorological sensors at nearly all permanent monitoring stations. Meteorological variables measured include wind speed, wind direction and ambient temperature. In addition, at some locations relative humidity, barometric pressure and precipitation are also measured.
Draft Air Quality Monitoring Network Plan - April 2010
12
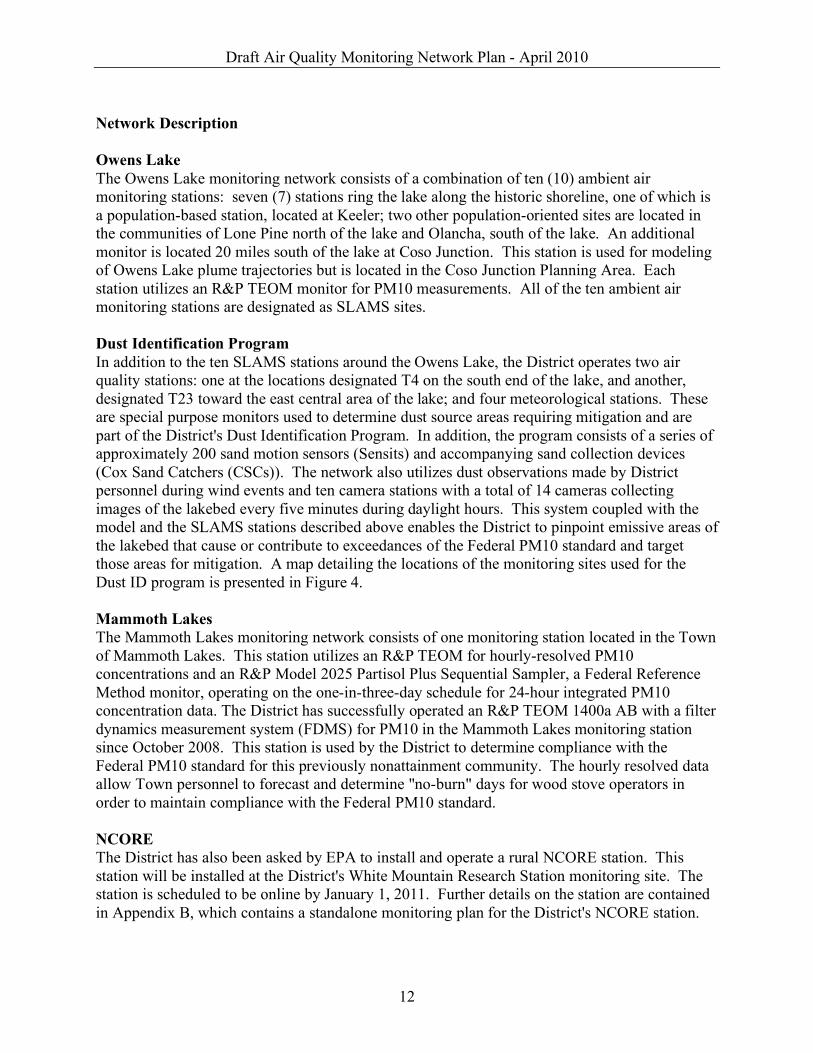
Network Description Owens Lake The Owens Lake monitoring network consists of a combination of ten (10) ambient air monitoring stations: seven (7) stations ring the lake along the historic shoreline, one of which is a population-based station, located at Keeler; two other population-oriented sites are located in the communities of Lone Pine north of the lake and Olancha, south of the lake. An additional monitor is located 20 miles south of the lake at Coso Junction. This station is used for modeling of Owens Lake plume trajectories but is located in the Coso Junction Planning Area. Each station utilizes an R&P TEOM monitor for PM10 measurements. All of the ten ambient air monitoring stations are designated as SLAMS sites. Dust Identification Program In addition to the ten SLAMS stations around the Owens Lake, the District operates two air quality stations: one at the locations designated T4 on the south end of the lake, and another, designated T23 toward the east central area of the lake; and four meteorological stations. These are special purpose monitors used to determine dust source areas requiring mitigation and are part of the District's Dust Identification Program. In addition, the program consists of a series of approximately 200 sand motion sensors (Sensits) and accompanying sand collection devices (Cox Sand Catchers (CSCs)). The network also utilizes dust observations made by District personnel during wind events and ten camera stations with a total of 14 cameras collecting images of the lakebed every five minutes during daylight hours. This system coupled with the model and the SLAMS stations described above enables the District to pinpoint emissive areas of the lakebed that cause or contribute to exceedances of the Federal PM10 standard and target those areas for mitigation. A map detailing the locations of the monitoring sites used for the Dust ID program is presented in Figure 4. Mammoth Lakes The Mammoth Lakes monitoring network consists of one monitoring station located in the Town of Mammoth Lakes. This station utilizes an R&P TEOM for hourly-resolved PM10 concentrations and an R&P Model 2025 Partisol Plus Sequential Sampler, a Federal Reference Method monitor, operating on the one-in-three-day schedule for 24-hour integrated PM10 concentration data. The District has successfully operated an R&P TEOM 1400a AB with a filter dynamics measurement system (FDMS) for PM10 in the Mammoth Lakes monitoring station since October 2008. This station is used by the District to determine compliance with the Federal PM10 standard for this previously nonattainment community. The hourly resolved data allow Town personnel to forecast and determine "no-burn" days for wood stove operators in order to maintain compliance with the Federal PM10 standard. NCORE The District has also been asked by EPA to install and operate a rural NCORE station. This station will be installed at the District's White Mountain Research Station monitoring site. The station is scheduled to be online by January 1, 2011. Further details on the station are contained in Appendix B, which contains a standalone monitoring plan for the District's NCORE station.

Draft Air Quality Monitoring Network Plan - April 2010
13
Figure 4. Owens Lake Map: Dust Identification Program Detail

Draft Air Quality Monitoring Network Plan - April 2010
14
Figure 5. Mono Lake Map: Dust Identification Program Detail
Mono Lake The District has operated monitoring stations in the Mono Basin area for approximately 19 years. The Mono Lake monitoring network currently consists of three monitoring stations: Lee Vining, Simis Ranch, and Mono Shore. Through August of 2008, PM10 concentrations were collected using filter-based BGI PQ200 monitors, collecting 24-hour integrated samples, located at Simis Ranch and Mono Shore, two lakeshore perimeter sites. PM10 concentrations at Lee Vining, a population-based site, were and are collected using a filter-based R&P 2025 Partisol Plus Sequential Sampler operating on the one-in-three-day schedule. The BGI monitors at Simis Ranch were removed and not replaced due to the fact that no exceedances had been measured there since August 31, 1996, and a point-of-maximum-impact site, Mono Shore, being outfitted with a PM10 monitor in 1999. The BGI monitors at Mono Shore were replaced in 2008 with an off-the-grid solar-powered R&P TEOM monitor. The TEOM provides hourly-resolved PM10 concentrations and has provided the District with the opportunity to develop a Dust ID program at Mono Lake. This Dust ID network consists of twelve (12) Sensits and 25 CSCs. This network is used to provide information on what portion(s) of the exposed shoreline are emissive and to what extent during a given dust storm. The Mono Lake Dust ID network is presented in Figure 5.

Draft Air Quality Monitoring Network Plan - April 2010
15
The North Shore site is off the power grid and consists of a large solar power array and battery system. In order to minimize power consumption, the TEOM is housed in a custom-designed Zomeworks Cool Cell. The Cool Cell regulates the temperature of the Cell housing the TEOM passively using a water radiator and reservoir system to regulate the Cell temperature. The continuous monitor and the seasonally (non-winter) operating filter-based medium volume PM10 monitors (BGI PQ200) were operated side-by-side from May through August 2008 in order to provide comparison data between the two different monitoring methods. After that comparison period, the filter-based monitors were shut down and removed from service, leaving the continuous PM10 monitor as the primary monitor for that station. 4.0 Special Programs The District periodically conducts special monitoring programs for rule compliance and pollutant level assessment. The data gathered are for informational purposes initially and may lead to designation of special purpose monitors, as defined under Title 40 CFR 58.20, or to permanent monitoring locations in the District’s network, or to nothing beyond the initial purpose of information gathering. During the 2010 monitoring year, the District will be conducting the special programs listed below.
On-Lake PM10 Monitor Intercomparison Study The District conducted a study from February through June in the southern portion of Owens Lake, at the T-8 station, in order to compare several different types of PM10 monitors. These monitors included: one TEOM 1400ab, one BGI PQ200, three Met One eSamplers, and three TSI DustTraks. The purpose of the study was to determine the viability of utilizing smaller, more portable PM10 monitors for episodic monitoring of PM10 on and around the lakebed in order to more accurately and cost-effectively ascertain emissive area locations and their impacts. Staff determined that the portable monitors were not sufficiently accurate for District PM10 monitoring. A full report will be drafted after the data are analyzed. Portable PM10 Monitoring Staff determined there was a need for small portable TEOM monitors that could be transported to monitoring locations and set up for short-term episode PM10 monitoring. Staff constructed one portable TEOM station that utilizes a propane-fired generator for power. The station can operate for more than three days on two small tanks of propane. The station has been successfully operated during several episodes on Owens Lake from February through April 2010. Staff is in the process of constructing an additional portable TEOM monitor that will also be used for episode monitoring.
5.0 Recent or Proposed Modifications to Network
Owens Lake The District completed installation the North Beach station, near the Owens River delta area on the north end of the lake in November 2008. Variables monitored at the North Beach station

Draft Air Quality Monitoring Network Plan - April 2010
16
include continuous PM10 monitored with an R&P TEOM 1400ab. Meteorological variables, including wind speed, wind direction and ambient temperature, are measured at the Delta meteorological monitoring station approximately 2 miles south of the North Beach station. There are no obstructions between the North Beach station and the Delta meteorological monitoring station. The North Beach station is a permanent addition to the Owens Lake network, as agreed between the District and the City of Los Angeles Department of Water & Power. Two on-lake PM10 monitoring stations, designated T8 and T25, were removed from the network February/March 2010. Two new on-lake PM10 monitoring stations, designated T4 and T23, were installed in the Owens Lake Network in March 2010. Each of these stations consists of one TEOM 1400ab continuous PM10 monitor in a temperature-controlled shelter. The purpose of these monitors is to measure PM10 emissions near the remaining source areas on the lakebed and to further refine the Districts Dust Identification Program model. The new special purpose monitors will be operated through February 2012. Data from the Coso Junction PM10 monitoring station have been invalidated for the first two quarters of 2010. Monitored violations that seemed suspicious to District staff warranted investigation. The results of the investigation were that: 1) the vegetation that had been in place for several years in the area immediately around the station had died off, exposing friable soils that could be easily lofted by the wind, and 2) since January 2010 a contractor had been onsite who had installed an equipment trailer near the monitoring station and had been driving along the site access road and beyond it into the undisturbed soils area several times each day in order to collect equipment from the trailer. The increased travel on the station access road from 1 – 2 vehicles per week to 10 to 20 per day damaged the graveled road and the previously crusted surface of the soil. The vegetation die-off occurred due to the office near the station being abandoned and the irrigation of the area stopped. A meeting with the operators of the station, Coso Operating Company, took place and a mitigation plan discussed. Coso Operating Company will document the plan and will begin the mitigation of the problem areas by July 1, 2010. The goal is to begin to collect valid data again beginning with the third quarter of 2010. Mono Lake Changes planned for the Mono Lake network for 2010 include the installation of a continuous TEOM PM10 monitor in the community of Lee Vining. The District has operated a filter-based PM10 monitor in Lee Vining, located on the southwest side of Mono Lake, for over 15 years. Plans to install a continuous TEOM PM10 monitor at the Lee Vining station in 2008 were delayed. The District plans to complete the installation of the continuous TEOM PM10 monitor and remove the filter-based PM10 monitor from service during 2010. National Core Multipollutant Monitoring Station (NCORE) The District was chosen by EPA Region IX staff to install and operate one of the EPA NCORE monitoring stations. The NCORE network consists of 75 monitoring stations around the nation that will be used by EPA for determining national monitoring and regulatory strategies. Seven monitoring stations are to be placed in California and the District has been chosen to operate one of them: a rural NCORE site. These sites will be funded by EPA for capital equipment and operation and maintenance.

Draft Air Quality Monitoring Network Plan - April 2010
17
The first phase of funding began with the 2008 calendar year. Funds have been received for the procurement of the prescribed monitoring equipment which includes: a low-level carbon monoxide monitor (CO), a low-level sulfur dioxide monitor (SO2), a low-level oxides of nitrogen monitor (NOy), and a calibration system for the monitors. The EPA Region IX staff has also provided the District with a monitoring station enclosure on long-term loan to the District in which to house the NCORE monitoring equipment. The District has proposed the NCORE site be located at the White Mountain Research Station, east of Bishop, near the current berth of the District's Portable Monitoring Station. Final approval of the site by EPA headquarters will be given by mid-2009. Installation of the station and procurement and installation of the equipment are scheduled for mid-2009.

Draft Air Quality Monitoring Network Plan - April 2010
18
6.0 Minimum Monitoring Requirements The District’s jurisdictional boundaries encompass no Metropolitan Statistical Areas (MSA) as defined by the U.S. Office of Management and Budget and the U. S. Census Bureau (population greater than 50,000). The District does, however, contain Monitoring Planning Areas defined as “areas determined to be (potentially) in violation of the PM2.5 NAAQS.” The District is also required to operate at least one monitor in each of the four (4) PM10 nonattainment areas. The District exceeds the minimum monitoring requirements for criteria pollutants as detailed below. PM10 Min. No. No. of Nonattainment Monitors Monitors Area Monitors Required Active
Searles Valley 1 1
Owens Lake 1 11
Mammoth Lakes 1 2
Mono Basin 1 2
PM2.5 Min. No. No. of Monitors Monitors MPA Required Active
Keeler 1 1+1 collo.

Draft Air Quality Monitoring Network Plan - April 2010
19
APPENDIX A
Site Information Summaries Site Reports

Draft Air Quality Monitoring Network Plan - April 2010
20
** District's Portable Monitoring Station berth. Located in Tecopa through June 2008.
Great Basin Unified Air Pollution Control DistrictSite Specifie Information
Site Name Network AQS Number Pollutants Monitored Start Date
Dirty Socks Owens Lake 06-027-0022 PM10, Met. Jun-99Shell Cut Owens Lake 06-027-0025 PM10, Met. Jan-01Flat Rock Owens Lake 06-027-0024 PM10, Met. Jan-01Bill Stanley Owens Lake 06-027-0026 PM10, Met. Mar-02Olancha Owens Lake 06-027-0021 PM10, Met. Aug-95Lone Pine Owens Lake 06-027-0004 PM10, Met. Jan-80North Beach Owens Lake 06-027-0029 PM10, Met. Nov-08Lizard Tail Owens Lake 06-027-0028 PM10, Met. Feb-08Keeler Owens Lake 06-027-1003 PM10, PM2.5, Met. Jul-94T-8 Owens Lake NA PM10 Apr-08T-25 Owens Lake NA PM10 Apr-08Coso Junction Owens Lake 06-027-1001 PM10, Met. Mar-79
Mammoth Lakes Mammoth Lakes 06-051-0001 PM10, Met. Apr-84
Lee Vining Mono Basin 06-051-0005 PM10, Met. Jan-81Simis Residence* Mono Basin 06-027-0007 Met. Nov-81Mono Shore Mono Basin 06-027-0011 PM10, Met. Jan-00
White Mountain** District 06-027-0002 PM10, Met. Apr-06NCORE District TBD CO, SO2, NOy TBD
* PM10 monitoring discontinued August 2008.

Draft Air Quality Monitoring Network Plan - April 2010
21
Great Basin Unified Air Pollution Control DistrictSite Specifie Information
Site Name Monitoring Pollutants MonitoredFrequency R&P BGI PQ200 R&P R&P R&P North West
Partisol 2025 Single Fltr TEOM Partisol 2025 TEOM Latitude LongitudeSequential Continuous Sequential ContinuousPM10/POC PM10/POC PM10/POC PM2.5/POC PM2.5/POC
Dirty Socks Daily 1/2 36-19-33 117-57-19Shell Cut Daily 1/2 36-21-59 117-53-52Flat Rock Daily 1/2 36-25-12 117-50-12Bill Stanley Daily 1 36-21-43 118-00-39Olancha Daily 1/2 36-16-03 117-59-35Lone Pine Daily 1/4 36-36-30 118-03-15North Beach Daily 1/1 36-32-34 117-59-28Lizard Tail Daily 1/1 36-32-33 117-56-28Keeler Daily 1/6 1/4; 2/4,8*** 2/1,2 1*** 36-29-16 117-52-14Coso Junction Daily 1/4 36-02-40 117-56-44
Mammoth Lakes Daily 1/5 1 37-38-53 118-59-24
Lee Vining 1-in-3 1/3 38-05-29 119-06-52Simis Residence 1-in-3 4/3** 38-05-29 118-59-52Mono Shore Daily 12/2** 1** 38-04-15 118-56-88
White Mountain* Daily 1 1 37-22-00 118-21-00NCORE Daily 37-21-38 118-19-46
* District's Portable Monitoring Station berth. Located in Tecopa through June 2008. ** Continuous PM10 monitor at Mono Shore started May 2008. Filter-based PM10 monitor discontinued at Mono Shore and Simis Residence August 2008.*** To be installed third quarter 2009.
Draft Air Quality Monitoring Network Plan - April 2010
22
APPENDIX B
NCORE Station Monitoring Plan

Draft Air Quality Monitoring Network Plan - April 2010
23
Great Basin Unified Air Pollution Control District
2010 Ambient Air Monitoring Network Plan
For National Core (NCORE) Monitoring Station
located at
White Mountain Research Station Bishop, California
April 16, 2010
Great Basin Unified Air Pollution Control District 157 Short Street
Bishop, California 93514

Draft Air Quality Monitoring Network Plan - April 2010
24
National Core (NCore) Multi-pollutant Monitoring Stations: In October 2006 the United States Environmental Protection Agency (EPA) issued final amendments to the ambient air monitoring regulations for criteria pollutants. These amendments are codified in 40 CFR parts 53 and 58. The purpose of the amendments was to enhance ambient air quality monitoring to better serve current and future air quality needs. One of the most significant changes in the regulations was the requirement to establish National Core (NCore) multi-pollutant monitoring stations. These stations will provide data on several pollutants at lower detection limits and replace the National Air Monitoring Station (NAMS) networks that have existed for several years. The final network plan must be submitted to EPA by July 1, 2010 and the stations must be operational by January 1, 2011.
The NCore Network addresses the following monitoring objectives:
• timely reporting of data to the public through AIRNow, air quality forecasting, and other public reporting mechanisms
• support development of emission strategies through air quality model evaluation and other observational methods
• accountability of emission strategy progress through tracking long-term trends of criteria and non-criteria pollutants and their precursors
• support long-term health assessments that contribute to ongoing reviews of the National Ambient Air Quality Standards (NAAQS)
• compliance through establishing nonattainment/attainment areas by comparison with the NAAQS
• support multiple disciplines of scientific research, including; public health, atmospheric and ecological
In 2007 and 2010, EPA provided funding to the Great Basin Unified Air Pollution Control District (the District) to begin the process of establishing an NCore station in the Eastern Sierra region of California. After evaluating the existing network, historical data, meteorology, and topography the District recommends the following changes to its air monitoring network to become effective July 1, 2009, and implemented by January 1, 2010:
1) Establish an NCore multi-pollutant monitoring station in the Eastern Sierra region at the White Mountain Research Station (WMRS), 3000 East Line Street, Bishop, California. The location meets the objective for a rural NCore site and meets regional scale criteria for PM2.5, PM10, ozone (O3), total reactive nitrogen (NOy), and carbon monoxide (CO).
2) For the near-term, collocate the NCore station with the District's existing Portable
monitoring station, which collects data for PM10 (continuous), wind speed, wind direction, ambient temperature, and relative humidity.
Draft Air Quality Monitoring Network Plan - April 2010
25
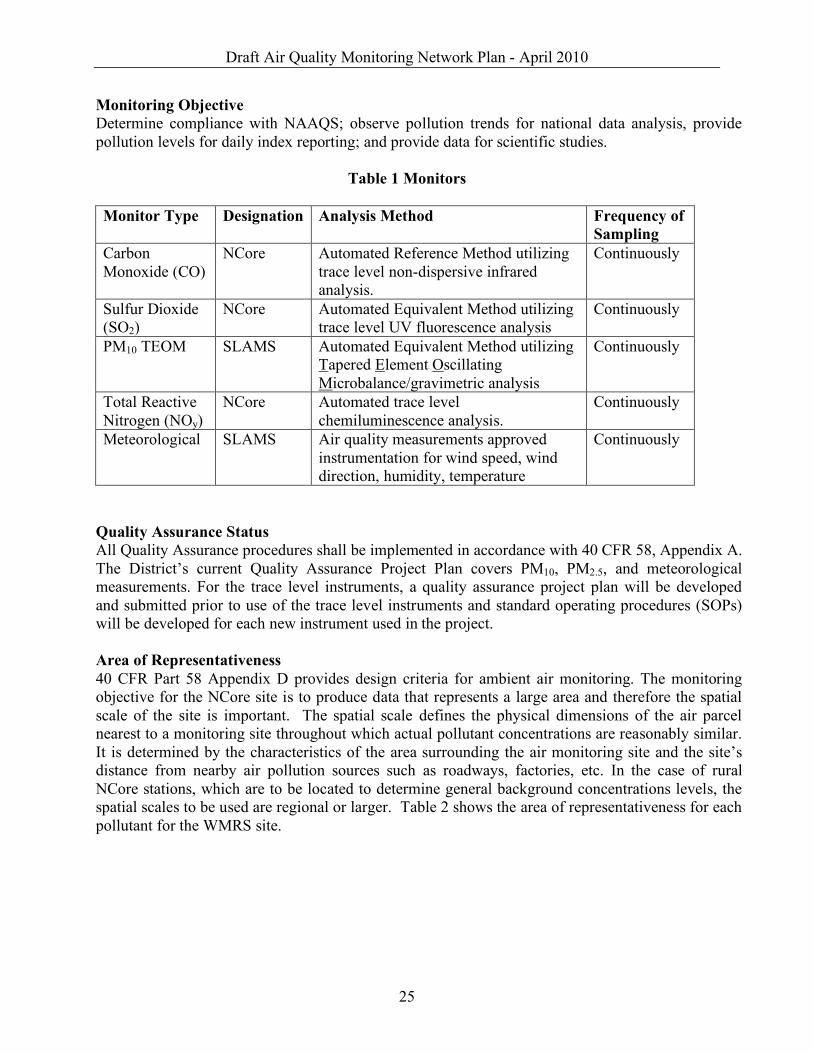
Monitoring Objective Determine compliance with NAAQS; observe pollution trends for national data analysis, provide pollution levels for daily index reporting; and provide data for scientific studies.
Table 1 Monitors Monitor Type Designation Analysis Method Frequency of
Sampling Carbon Monoxide (CO)
NCore Automated Reference Method utilizing trace level non-dispersive infrared analysis.
Continuously
Sulfur Dioxide (SO2)
NCore Automated Equivalent Method utilizing trace level UV fluorescence analysis
Continuously
PM10 TEOM SLAMS Automated Equivalent Method utilizing Tapered Element Oscillating Microbalance/gravimetric analysis
Continuously
Total Reactive Nitrogen (NOy)
NCore Automated trace level chemiluminescence analysis.
Continuously
Meteorological SLAMS Air quality measurements approved instrumentation for wind speed, wind direction, humidity, temperature
Continuously
Quality Assurance Status All Quality Assurance procedures shall be implemented in accordance with 40 CFR 58, Appendix A. The District’s current Quality Assurance Project Plan covers PM10, PM2.5, and meteorological measurements. For the trace level instruments, a quality assurance project plan will be developed and submitted prior to use of the trace level instruments and standard operating procedures (SOPs) will be developed for each new instrument used in the project. Area of Representativeness 40 CFR Part 58 Appendix D provides design criteria for ambient air monitoring. The monitoring objective for the NCore site is to produce data that represents a large area and therefore the spatial scale of the site is important. The spatial scale defines the physical dimensions of the air parcel nearest to a monitoring site throughout which actual pollutant concentrations are reasonably similar. It is determined by the characteristics of the area surrounding the air monitoring site and the site’s distance from nearby air pollution sources such as roadways, factories, etc. In the case of rural NCore stations, which are to be located to determine general background concentrations levels, the spatial scales to be used are regional or larger. Table 2 shows the area of representativeness for each pollutant for the WMRS site.

Draft Air Quality Monitoring Network Plan - April 2010
26
Table 2: Spatial Scales for Each Pollutant
Pollutant Spatial Scale Comments NOy Regional Scale Same scale as used for O3 CO > Middle Scale No Regional scale for CO SO2 > Neighborhood Scale No Regional scale for SO2 PM10 > Neighborhood Scale No Regional scale for PM10
For regional scale the area covered is tens of kilometers to hundreds of kilometers. There are no MSAs within the District's current monitoring network due to the sparse population in this high desert setting, approximately 2 people per square mile. On a 10 km scale the land use varies from riparian areas along the Owens River 1.5 kilometers west of the site to light industry, small commercial, and residential in the City of Bishop (population 4,000) 6 kilometers west of the site. The topography of the area varies from high desert to mountain peaks.

Draft Air Quality Monitoring Network Plan - April 2010
27
The White Mountain Research Station, where the NCore monitoring station is to be located, is in the Owens Valley, a high-desert valley, the floor of which is at an average elevation of 4,000 feet above mean sea level. The valley is open north to south and is bordered on the east by the White Mountains that rise from the valley floor to an elevation of 10,000 feet, with peaks up to 14,000 feet. The valley is bordered on the west by the Sierra Nevada range, which rises in elevation up to 14,000 feet. As can be seen from the District map and the area-wide view below, the proposed NCore site is located East of the City of Bishop and of the developed area around the City. The wind rose above indicates the prevailing wind directions of north and south, up and down the Owens Valley. The placement of the NCore site east of Bishop provides an excellent location for measuring background pollutant concentrations as there are no major pollution sources, other than particulate matter, for 100km.
White Mountain Research Station
Regional Pollutant Scale 50 and 100 km radii

Draft Air Quality Monitoring Network Plan - April 2010
28
The Owens Valley, Mono Basin, and Mammoth Lakes Nonattainment areas have been designated as such due to PM10 concentrations that exceed the Federal standard of 150µg/m3. The sources of these concentrations are wind-blown dust from the exposed lakebeds of the Owens and Mono lakes and wintertime wood smoke and road cinders, in the case of Mammoth Lakes. The PM10 influence around Mono Lake is largely restricted to the immediate basin by the topography. The influence around Owens Lake is mostly caused by north winds driving the dust south. Occasional south wind storms will drive the dust northward, but the impacts generally reach only to the community of Independence, 20 miles north of Owens Lake and 40 miles south of the station at the White Mountain Research Station.
White Mountain Research Station Topographic Regional Map (90 km radius shown)

Draft Air Quality Monitoring Network Plan - April 2010
29
Site Description and Spacing: Site Name: White Mountain Research Station AQS ID: 06-027-0002 Location: 3000 East Line Street County: Inyo GPS Coordinates: 37°21'38" North Latitude, 118°19'50" West Longitude Date Established: April 7, 2006 Inspection Date: August 20, 2009 Inspection By: Catherine Brown, EPA IX Site Approval Status: Approved ___________________________________________________________________________
White Mountain Research Station Compound
Draft Air Quality Monitoring Network Plan - April 2010
30
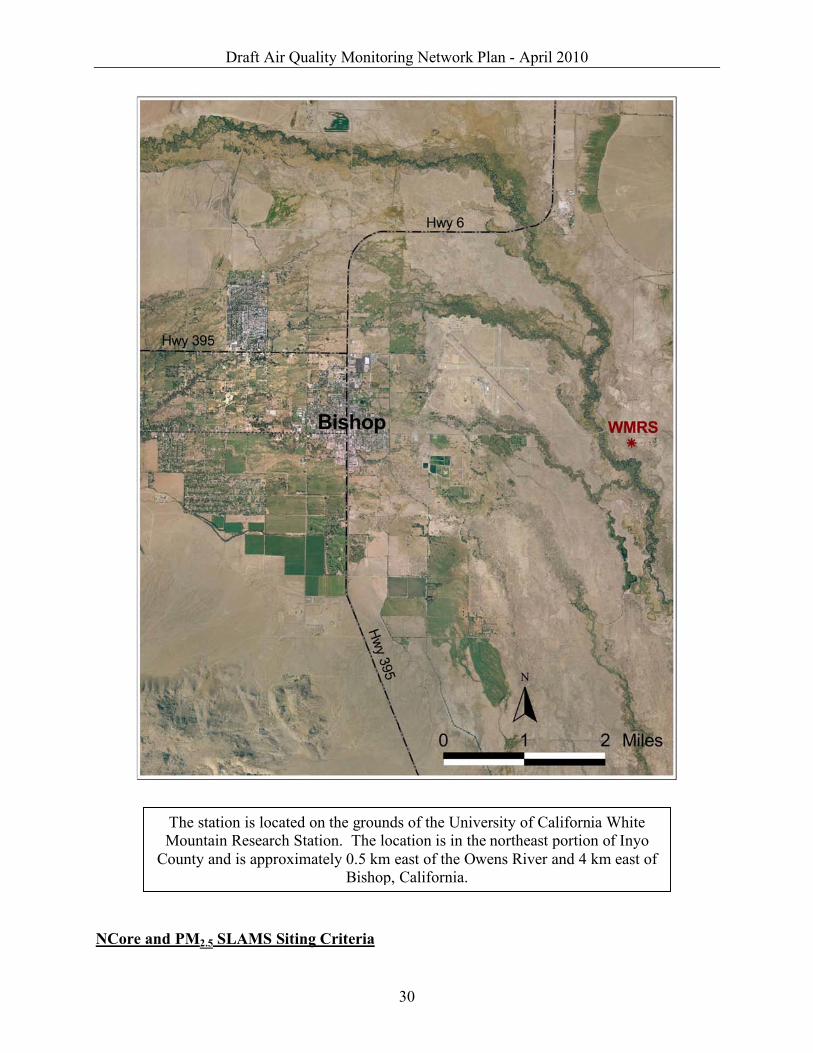
NCore and PM2.5 SLAMS Siting Criteria
The station is located on the grounds of the University of California White Mountain Research Station. The location is in the northeast portion of Inyo
County and is approximately 0.5 km east of the Owens River and 4 km east of Bishop, California.

Draft Air Quality Monitoring Network Plan - April 2010
31
Appendix E to 40 CFR Part 58-Probe and Monitoring Path Siting Criteria for Ambient Air Quality Monitoring contains specific location criteria applicable to NCore and SLAMS siting. The following measurements and data were obtained for evaluation of compliance with the criteria. 1. Horizontal Placement of Sampling Probes:
The gaseous instruments will be placed in a 10’w x 16’ l x 8’h air monitoring shelter to be located in an open area. The nearest building is the WMRS maintenance building approximately 150 meters east of the station. The sample probe inlets will be installed approximately 4 meters above the ground. The Districts Portable monitoring station will be placed next to the air monitoring shelter and will included a 10-meter “nested” meteorological tower. Any manual particulate samplers to be used for the NCore program will be placed on the roof of the monitoring shelter, on the roof of the District's Portable monitoring station adjacent to the NCore shelter, or on a metal platform behind the NCore shelter. The height of the inlets of the particulate samplers will vary between 3-4 meters. The inlet for the continuous PM10 monitor in the Portable station is approximately 1.5 meters above the roof and approximately 4.25 meters above the ground. Inlets for the continuous particulate samplers in the NCore station will be placed on the roof of the air monitoring shelter with the sample inlets 1.5 to 2 meters above the roof (4 meters above ground). The control units will be located inside the temperature controlled shelter.
2. Spacing from Obstructions: There are no obstructions to air flow around the site. The WMRS maintenance building is located 150 meters east of the proposed NCore station location and is 4 meters in height. This potential obstruction is 37 times the height of the obstruction away from the station and is not in a quadrant where it would affect the prevailing wind direction.
3. Spacing from Roadways:
Tables E-1, E-2, and Figure E-1 of 40 CFR Part 58 Appendix E list the minimum distances from roadways a monitoring probe needs to be based on the average daily traffic (ADT) counts. Table 3 summarizes the findings and includes the minimum separation distance from roadways for each pollutant. ADT counts were obtained from traffic count data from the California Department of Transportation's (CalTrans) website, at http://www.dot.ca.gov/hq/traffops/saferesr/trafdata/2005all

Draft Air Quality Monitoring Network Plan - April 2010
32
Table 3
Spacing from Roadways Analysis
Minimum Distance Required (meters)
Roadway ADT Distance from site (meters)
Ozone Table E-1
NO/NOy Table E-
1
CO Table E-2
PM Figure
E-1 US Highway 395 14,000 (2005) 4,000 40 30 45 80 East Line Street <1000 (estimated) 85 40 30 45 80
4. Spacing from Minor Sources:
The closest source to the site is the community of Bishop, California, 4 kilometers east of the site. The greater Bishop area has a population of approximately 6,100. Pollutant sources are limited to small businesses, residential home heating, vehicular traffic (14,000 per day) along US Highway 395. There are three permitted sources approximately 3 kilometers east of the site. These sources are listed below (Table 4) along with their emission rates. The first two are concrete batch plants and the last one is a hot mix asphalt plant. These plants' operating schedules are limited to 5 or 6 days per week and to a certain number of weeks per year, usually in the summer months.
Table 4 Minor Source Emissions
Emissions Rates
Source Emissions Type Hours of Operation Per day
Pounds Per Hr. For Op
Pounds per hour 24hrs/day
7/11 Materials particulate 14 5.7 0.26 Hiatt particulate 12 3 1.13 SNC Particulate 10 18.2 0.53

Draft Air Quality Monitoring Network Plan - April 2010
33
N W E S
Direction Description Distance from Site North Power line along Line Street/Laws-Poleta Road 85 meters
North East White Mountains 10 kilometers East WMRS Maintenance Building (maintenance and repair shop) 150 meters
South East Owens Valley, open land South Owens Valley, open land
South west Owens Valley, open land West Bench above Owens River 600 meters
North West Owens Valley, open land

Draft Air Quality Monitoring Network Plan - April 2010
34
Site Details: This Google Earthtm image indicates where the air monitoring shelter will be located on the White Mountain Research Station compound. The shelter will be 8’ w x 16’l x 8’ h. The roof of the shelter is flat to support the sample inlets for the continuous particulate samplers and has additional room for other samplers if the need arises. The 10-meter meteorological tower and the District's Portable monitoring station will be placed next to the NCore shelter. The meteorological tower is a “nested” type that provides for easy servicing and calibration of the meteorological instruments. The shelter will be wired for 200 amp service and have internet and cellular telephone connections. The shelter will have a heating and air conditioning system that will maintain indoor temperatures between 20-30 º C.

Draft Air Quality Monitoring Network Plan - April 2010
35
APPENDIX C
Site Reports
Great!Basin!Unified!Air!Pollution!Control!District157!Short!Street
Bishop,!CA!!93514760.872.8211!/!http://www.gbuapcd.org
GBUAPCD!Site!Report
Site!Name: A!Tower
Location: North"central!Owens!Lake
Address: Owens!Lake,!CA
Distance!to!Road: 2.2!km!north!to!Hwy!136.
Traffic!Count: TBD
Groundcover: Course!sands
Representative!Area: North"central!Owens!Lake
Pollutant: N/A
Monitor!Objective: Local!meteorology
Spatial!Scale: Neighborhood!Scale
Sampling!Method: N/A
Analysis!Method: N/A
Start!Date: 3/1/2000
Operation!Schedule: 5!minute
Sampling!Season: Year"round
Probe!Height: 10!meters
Distance!to!Supporting!Structure: N/A
Distance!from!Obstructions!on!Roof: N/A
Distance!from!Obstructions!Not!on!Roof: N/A
Distance!From!Trees: N/A
Distance!to!Furnace!or!Incinerator: N/A
Distance!Between!Collocated!Monitors: N/A
Unrestricted!Airflow: 360
Probe!Material: N/A
Residence!Time: N/A
Will!there!be!a!change!in!18!months?: No
Site!Number: 1001
Current: Yes
County: Inyo
FIPS!Code: 06"027
AIRS!Number:
Met!Installed?: Yes
TEOM!Installed?: No
Site!Operator: Sondra!Grimm
Collecting!Agency: GBUAPCD
TEOM!Type: N/A
UTM!X: 416353
UTM!Y: 4041390
Suitable!comparison!against!annual!PM2.5?: N/A
Frequency!of!flow!rate!verification!for!manual!PM!sampler!audit:
N/A
Frequency!of!flow!rate!verification!for!automated!PM!analyzers!audit:
N/A
Frequency!of!one"point!QC!check!(gaseous): N/A
Variable:!Wind!Speed
Variable:!Wind!Direction
Variable:!Relative!Humidity
Variable:!Temperature
Variable:!Barometric!Pressure
Variable:!Precipitation
Meteorological!Variables:
Print!Timestamp:!4/26/2010,!4:13:53!PM

Great!Basin!Unified!Air!Pollution!Control!District157!Short!Street
Bishop,!CA!!93514760.872.8211!/!http://www.gbuapcd.org
GBUAPCD!Site!Report
Site!Name: B!Tower
Location: Southeast!Owens!Lake
Address: Owens!Lake,!CA
Distance!to!Road: 3!km!SE!to!Hwy!190
Traffic!Count: TBD
Groundcover: Course!sands
Representative!Area: South"eastern!Owens!Lake
Pollutant: N/A
Monitor!Objective: Local!Meteorology
Spatial!Scale: Neigborhood!Scale
Sampling!Method: N/A
Analysis!Method: N/A
Start!Date: 3/2/2010
Operation!Schedule: 5!minute
Sampling!Season: Year"round
Probe!Height: 10!meters
Distance!to!Supporting!Structure: N/A
Distance!from!Obstructions!on!Roof: N/A
Distance!from!Obstructions!Not!on!Roof: N/A
Distance!From!Trees: N/A
Distance!to!Furnace!or!Incinerator: N/A
Distance!Between!Collocated!Monitors: N/A
Unrestricted!Airflow: 360
Probe!Material: N/A
Residence!Time: N/A
Will!there!be!a!change!in!18!months?: No
Site!Number: 1018
Current: Yes
County: Inyo
FIPS!Code: 06"027
AIRS!Number:
Met!Installed?: Yes
TEOM!Installed?: No
Site!Operator: Sondra!Grimm
Collecting!Agency: GBUAPCD
TEOM!Type: N/A
UTM!X:
UTM!Y:
Suitable!comparison!against!annual!PM2.5?: N/A
Frequency!of!flow!rate!verification!for!manual!PM!sampler!audit:
N/A
Frequency!of!flow!rate!verification!for!automated!PM!analyzers!audit:
N/A
Frequency!of!one"point!QC!check!(gaseous): N/A
Variable:!Wind!Speed
Variable:!Wind!Direction
Variable:!Relative!Humidity
Variable:!Temperature
Variable:!Barometric!Pressure
Variable:!Precipitation
Meteorological!Variables:
Print!Timestamp:!4/26/2010,!4:13:54!PM
Great!Basin!Unified!Air!Pollution!Control!District157!Short!Street
Bishop,!CA!!93514760.872.8211!/!http://www.gbuapcd.org
GBUAPCD!Site!Report
Site!Name: Coso"Junction"TEOM
Location: Hwy!395!at!Gill!Station!"!Coso!Road
Address: 3!Gill!Station!Rd,!Olancha,!CA!!93549
Distance!to!Road: 0.2!km!to!Gill!Station!Road
Traffic!Count: TBD
Groundcover: Dirt,!gravel,!brush
Representative!Area: Regional
Pollutant: PM"10
Monitor!Objective: Representative!Concentration
Spatial!Scale: Neighborhood!Scale
Sampling!Method: PM"10!Impactor
Analysis!Method: Gravimetry
Start!Date: 5/10/2006
Operation!Schedule: 1:1
Sampling!Season: Year"round
Probe!Height: 4.5!meters
Distance!to!Supporting!Structure: N/A
Distance!from!Obstructions!on!Roof: None
Distance!from!Obstructions!Not!on!Roof: 20!meters!to!tower
Distance!From!Trees: 0.5!km
Distance!to!Furnace!or!Incinerator: None
Distance!Between!Collocated!Monitors: N/A
Unrestricted!Airflow: 360
Probe!Material: N/A
Residence!Time: N/A
Will!there!be!a!change!in!18!months?: N/A
Site!Number: 696
Current: Yes
County: Inyo
FIPS!Code: 06"027
AIRS!Number: 1001
Met!Installed?: Yes
TEOM!Installed?: Yes
Site!Operator: Dan!Johnson
Collecting!Agency: GBUAPCD
TEOM!Type: TEOM
UTM!X: 414978
UTM!Y: 3989840
Suitable!comparison!against!annual!PM2.5?: N/A
Frequency!of!flow!rate!verification!for!manual!PM!sampler!audit:
N/A
Frequency!of!flow!rate!verification!for!automated!PM!analyzers!audit:
Bi"weekly
Frequency!of!one"point!QC!check!(gaseous): N/A
Variable:!Wind!Speed
Variable:!Wind!Direction
Variable:!Relative!Humidity
Variable:!Temperature
Variable:!Barometric!Pressure
Variable:!Precipitation
Meteorological!Variables:
Print!Timestamp:!4/26/2010,!4:13:54!PM

Great!Basin!Unified!Air!Pollution!Control!District157!Short!Street
Bishop,!CA!!93514760.872.8211!/!http://www.gbuapcd.org
GBUAPCD!Site!Report
Site!Name: Coso"Junction"TEOM
Site!Photo:
North"facing!photo:
East"facing!photo:
South"facing!photo:
West"facing!photo:
Print!Timestamp:!4/26/2010,!4:13:54!PM

Great!Basin!Unified!Air!Pollution!Control!District157!Short!Street
Bishop,!CA!!93514760.872.8211!/!http://www.gbuapcd.org
GBUAPCD!Site!Report
Site!Name: Cottonwood
Location: South"central!Owens!Lake
Address: Owens!Lake,!CA
Distance!to!Road: 3!km!to!Hwy!395!(west)
Traffic!Count: TBD
Groundcover: Course!sand
Representative!Area: Central!Owens!Lake
Pollutant: N/A
Monitor!Objective: Local!Meteorology
Spatial!Scale: Neighborhood!Scale
Sampling!Method: N/A
Analysis!Method: N/A
Start!Date: 5/17/2001
Operation!Schedule: 5!minute
Sampling!Season: Year"round
Probe!Height: 10!meters
Distance!to!Supporting!Structure: N/A
Distance!from!Obstructions!on!Roof: N/A
Distance!from!Obstructions!Not!on!Roof: N/A
Distance!From!Trees: None
Distance!to!Furnace!or!Incinerator: None
Distance!Between!Collocated!Monitors: N/A
Unrestricted!Airflow: 360
Probe!Material: N/A
Residence!Time: N/A
Will!there!be!a!change!in!18!months?: No
Site!Number: 7491
Current: Yes
County: Inyo
FIPS!Code: 06"027
AIRS!Number:
Met!Installed?: Yes
TEOM!Installed?: No
Site!Operator: Sondra!Grimm
Collecting!Agency: GBUAPCD
TEOM!Type: N/A
UTM!X: 411799
UTM!Y: 4028440
Suitable!comparison!against!annual!PM2.5?: N/AN/A
Frequency!of!flow!rate!verification!for!manual!PM!sampler!audit:
N/A
Frequency!of!flow!rate!verification!for!automated!PM!analyzers!audit:
N/A
Frequency!of!one"point!QC!check!(gaseous): N/A
Variable:!Wind!Speed
Variable:!Wind!Direction
Variable:!Relative!Humidity
Variable:!Temperature
Variable:!Barometric!Pressure
Variable:!Precipitation
Meteorological!Variables:
Print!Timestamp:!4/26/2010,!4:13:54!PM

Great!Basin!Unified!Air!Pollution!Control!District157!Short!Street
Bishop,!CA!!93514760.872.8211!/!http://www.gbuapcd.org
GBUAPCD!Site!Report
Site!Name: Delta
Location: Owens!River!delta!area!on!Owens!Lake
Address: Owens!Lake,!CA
Distance!to!Road: 3.2!km!west!to!Hwy!395
Traffic!Count: TBD
Groundcover: Salt!crust!barren!lakebed
Representative!Area: Delta!area
Pollutant: N/A
Monitor!Objective: Local!Meteorology
Spatial!Scale: Neighborhood!scale
Sampling!Method: N/A
Analysis!Method: N/A
Start!Date: 6/19/2000
Operation!Schedule: 5!minute
Sampling!Season: Year"round
Probe!Height: 10!meters
Distance!to!Supporting!Structure: N/A
Distance!from!Obstructions!on!Roof: N/A
Distance!from!Obstructions!Not!on!Roof: N/A
Distance!From!Trees: N/A
Distance!to!Furnace!or!Incinerator: N/A
Distance!Between!Collocated!Monitors: N/A
Unrestricted!Airflow: 360
Probe!Material: N/A
Residence!Time: N/A
Will!there!be!a!change!in!18!months?: No
Site!Number: 7191
Current: Yes
County: Inyo
FIPS!Code: 06"027
AIRS!Number:
Met!Installed?: Yes
TEOM!Installed?: No
Site!Operator: Sondra!Grimm
Collecting!Agency: GBUAPCD
TEOM!Type: N/A
UTM!X: 410497
UTM!Y: 4041460
Suitable!comparison!against!annual!PM2.5?: N/A
Frequency!of!flow!rate!verification!for!manual!PM!sampler!audit:
N/A
Frequency!of!flow!rate!verification!for!automated!PM!analyzers!audit:
N/A
Frequency!of!one"point!QC!check!(gaseous): N/A
Variable:!Wind!Speed
Variable:!Wind!Direction
Variable:!Relative!Humidity
Variable:!Temperature
Variable:!Barometric!Pressure
Variable:!Precipitation
Meteorological!Variables:
Print!Timestamp:!4/26/2010,!4:13:54!PM

Great!Basin!Unified!Air!Pollution!Control!District157!Short!Street
Bishop,!CA!!93514760.872.8211!/!http://www.gbuapcd.org
GBUAPCD!Site!Report
Site!Name: Dirty"Socks"TEOM
Location: South!shore,!Owens!Lake
Address: DIRTY!SOX!HOT!SPRING!"!HWY!190,!Owens!Lake,!CA
Distance!to!Road: 402!meters!to!Hwy!190
Traffic!Count: TBD
Groundcover: Gravel,!sand,!water,!small!shrubs
Representative!Area: South!shore,!Owens!Lake
Pollutant: PM10
Monitor!Objective: Representative!Concentration
Spatial!Scale: Neighborhood!Scale
Sampling!Method: PM"10!Impactor
Analysis!Method: Gravimetry
Start!Date: 6/23/1999
Operation!Schedule: hourly
Sampling!Season: Year"round
Probe!Height: 4.2!meters
Distance!to!Supporting!Structure: N/A
Distance!from!Obstructions!on!Roof: N/A
Distance!from!Obstructions!Not!on!Roof: 10.0!(Met)!"!14.6!meters!(powerline)
Distance!From!Trees: N/A
Distance!to!Furnace!or!Incinerator: N/A
Distance!Between!Collocated!Monitors: N/A
Unrestricted!Airflow: 360
Probe!Material: N/A
Residence!Time: N/A
Will!there!be!a!change!in!18!months?: N/A
Site!Number: 1010
Current: Yes
County: Inyo
FIPS!Code: 06"027
AIRS!Number: 0022
Met!Installed?: Yes
TEOM!Installed?: Yes
Site!Operator: Steve!Mobley
Collecting!Agency: GBUAPCD
TEOM!Type: TEOM
UTM!X: 414272
UTM!Y: 4020550
Suitable!comparison!against!annual!PM2.5?: N/A
Frequency!of!flow!rate!verification!for!manual!PM!sampler!audit:
N/A
Frequency!of!flow!rate!verification!for!automated!PM!analyzers!audit:
Bi"weekly
Frequency!of!one"point!QC!check!(gaseous): N/A
Variable:!Wind!Speed
Variable:!Wind!Direction
Variable:!Relative!Humidity
Variable:!Temperature
Variable:!Barometric!Pressure
Variable:!Precipitation
Meteorological!Variables:
Print!Timestamp:!4/26/2010,!4:13:54!PM

Great!Basin!Unified!Air!Pollution!Control!District157!Short!Street
Bishop,!CA!!93514760.872.8211!/!http://www.gbuapcd.org
GBUAPCD!Site!Report
Site!Name: Dirty"Socks"TEOM
Site!Photo:
North"facing!photo:
East"facing!photo:
South"facing!photo:
West"facing!photo:
Print!Timestamp:!4/26/2010,!4:13:55!PM

Great!Basin!Unified!Air!Pollution!Control!District157!Short!Street
Bishop,!CA!!93514760.872.8211!/!http://www.gbuapcd.org
GBUAPCD!Site!Report
Site!Name: Flat"Rock"TEOM
Location: Eastern!shore,!Owens!Lake
Address: FLAT!ROCK!"!HIGHWAY!190!"!1!MILE!W!OF!HWY!136!JUNCTION,!Owens!Lake,!CA
Distance!to!Road: 54.8!meters!to!Hwy!190
Traffic!Count: TBD
Groundcover: Sand,!rocks,!shrubs
Representative!Area: East!shore,!Owens!Lake
Pollutant: PM"10
Monitor!Objective: Representative!Concentration
Spatial!Scale: Neighborhood!Scale
Sampling!Method: PM"10!Impactor
Analysis!Method: Gravimetry
Start!Date: 12/14/2000
Operation!Schedule: hourly
Sampling!Season: Year"round
Probe!Height: 4.2!meters
Distance!to!Supporting!Structure: 0
Distance!from!Obstructions!on!Roof: 0
Distance!from!Obstructions!Not!on!Roof: 2.4!m!(MET);!3.8!meters!(powerline)
Distance!From!Trees: No!trees
Distance!to!Furnace!or!Incinerator: 0
Distance!Between!Collocated!Monitors: 0
Unrestricted!Airflow: 360
Probe!Material: N/A
Residence!Time: N/A
Will!there!be!a!change!in!18!months?: No
Site!Number: 1011
Current: Yes
County: Inyo
FIPS!Code: 06"027
AIRS!Number: 0024
Met!Installed?: Yes
TEOM!Installed?: Yes
Site!Operator: Steve!Mobley
Collecting!Agency: GBUAPCD
TEOM!Type: TEOM
UTM!X: 424989
UTM!Y: 4030860
Suitable!comparison!against!annual!PM2.5?: No
Frequency!of!flow!rate!verification!for!manual!PM!sampler!audit:
N/A
Frequency!of!flow!rate!verification!for!automated!PM!analyzers!audit:
Bi"weekly
Frequency!of!one"point!QC!check!(gaseous): N/A
Variable:!Wind!Speed
Variable:!Wind!Direction
Variable:!Relative!Humidity
Variable:!Temperature
Variable:!Barometric!Pressure
Variable:!Precipitation
Meteorological!Variables:
Print!Timestamp:!4/26/2010,!4:13:55!PM

Great!Basin!Unified!Air!Pollution!Control!District157!Short!Street
Bishop,!CA!!93514760.872.8211!/!http://www.gbuapcd.org
GBUAPCD!Site!Report
Site!Name: Flat"Rock"TEOM
Site!Photo:
North"facing!photo:
East"facing!photo:
South"facing!photo:
West"facing!photo:
Print!Timestamp:!4/26/2010,!4:13:56!PM

Great!Basin!Unified!Air!Pollution!Control!District157!Short!Street
Bishop,!CA!!93514760.872.8211!/!http://www.gbuapcd.org
GBUAPCD!Site!Report
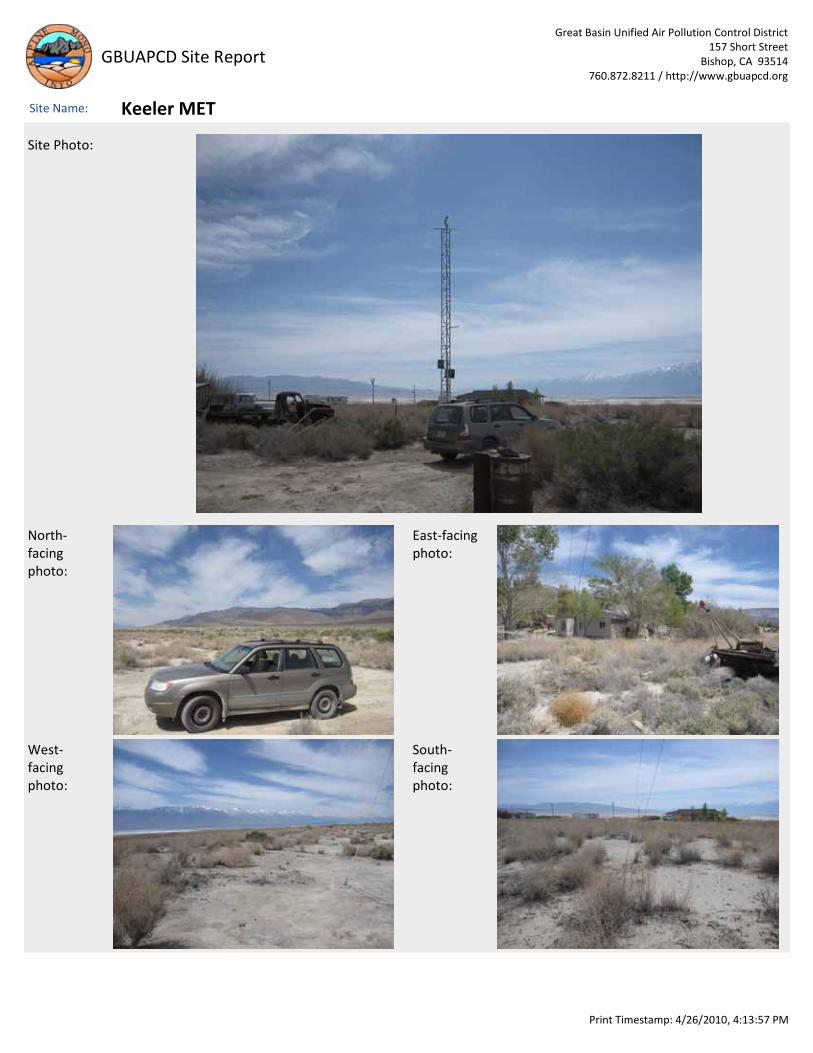
Site!Name: Keeler"MET
Location: Northeast!of!Keeler,!CA
Address: Keeler,!CA
Distance!to!Road: 75!meters
Traffic!Count: 3/day
Groundcover: sand/brush
Representative!Area: Community!of!Keeler
Pollutant: N/A
Monitor!Objective: Local!Meteorology
Spatial!Scale: Neighborhood!Scale
Sampling!Method: N/A
Analysis!Method: N/A
Start!Date: 3/14/1985
Operation!Schedule: 5!minute
Sampling!Season: Year"round
Probe!Height: 10!meters
Distance!to!Supporting!Structure: N/A
Distance!from!Obstructions!on!Roof: N/A
Distance!from!Obstructions!Not!on!Roof: 20!meters!to!trees
Distance!From!Trees: 20!meters
Distance!to!Furnace!or!Incinerator: N/A
Distance!Between!Collocated!Monitors: N/A
Unrestricted!Airflow: N/A
Probe!Material: N/A
Residence!Time: N/A
Will!there!be!a!change!in!18!months?: No
Site!Number: 697
Current: Yes
County: Inyo
FIPS!Code: 06"027
AIRS!Number: 1002
Met!Installed?: Yes
TEOM!Installed?: No
Site!Operator: Scott!Weaver
Collecting!Agency: GBUAPCD
TEOM!Type: N/A
UTM!X: 421739
UTM!Y: 4038590
Suitable!comparison!against!annual!PM2.5?: N/A
Frequency!of!flow!rate!verification!for!manual!PM!sampler!audit:
N/A
Frequency!of!flow!rate!verification!for!automated!PM!analyzers!audit:
N/A
Frequency!of!one"point!QC!check!(gaseous): N/A
Variable:!Wind!Speed
Variable:!Wind!Direction
Variable:!Relative!Humidity
Variable:!Temperature
Variable:!Barometric!Pressure
Variable:!Precipitation
Meteorological!Variables:
Print!Timestamp:!4/26/2010,!4:13:57!PM
Great!Basin!Unified!Air!Pollution!Control!District157!Short!Street
Bishop,!CA!!93514760.872.8211!/!http://www.gbuapcd.org
GBUAPCD!Site!Report
Site!Name: Keeler"MET
Site!Photo:
North"facing!photo:
East"facing!photo:
South"facing!photo:
West"facing!photo:
Print!Timestamp:!4/26/2010,!4:13:57!PM

Great!Basin!Unified!Air!Pollution!Control!District157!Short!Street
Bishop,!CA!!93514760.872.8211!/!http://www.gbuapcd.org
GBUAPCD!Site!Report
Site!Name: Keeler#1"PM2.5"FDMS
Location: Located!on!top!of!metal!storage!unit!and!monitoring!shelter.
Address: 190!CERRO!GORDO!ROAD,!KEELER,!CA
Distance!to!Road: 20!meters
Traffic!Count: TBD
Groundcover: Pavement
Representative!Area: Community!of!Keeler
Pollutant: PM"2.5
Monitor!Objective: Representative!Concentration
Spatial!Scale: Neighborhood
Sampling!Method: PM"10!Impactor!and!VSCC
Analysis!Method: Gravimetry
Start!Date: 6/15/2009
Operation!Schedule: hourly
Sampling!Season: Year"round
Probe!Height: 4!meters
Distance!to!Supporting!Structure:
Distance!from!Obstructions!on!Roof: None
Distance!from!Obstructions!Not!on!Roof: 10!meters!to!antennae
Distance!From!Trees: 75!meters
Distance!to!Furnace!or!Incinerator: N/A
Distance!Between!Collocated!Monitors: 1.7!!meters!to!2.5!pri!partisol
Unrestricted!Airflow: 360
Probe!Material: N/A
Residence!Time: N/A
Will!there!be!a!change!in!18!months?: No
Site!Number: 728
Current: Yes
County: Inyo
FIPS!Code: 06"027
AIRS!Number: 1003
Met!Installed?: No
TEOM!Installed?: Yes
Site!Operator: Scott!Weaver
Collecting!Agency: GBUAPCD
TEOM!Type: TEOM
UTM!X: 421982
UTM!Y: 4038410
Suitable!comparison!against!annual!PM2.5?: Yes
Frequency!of!flow!rate!verification!for!manual!PM!sampler!audit:
N/A
Frequency!of!flow!rate!verification!for!automated!PM!analyzers!audit:
Bi"weekly
Frequency!of!one"point!QC!check!(gaseous): N/A
Variable:!Wind!Speed
Variable:!Wind!Direction
Variable:!Relative!Humidity
Variable:!Temperature
Variable:!Barometric!Pressure
Variable:!Precipitation
Meteorological!Variables:
Print!Timestamp:!4/26/2010,!4:13:57!PM

Great!Basin!Unified!Air!Pollution!Control!District157!Short!Street
Bishop,!CA!!93514760.872.8211!/!http://www.gbuapcd.org
GBUAPCD!Site!Report
Site!Name: Keeler#1"PM2.5"FDMS
Site!Photo:
North"facing!photo:
East"facing!photo:
South"facing!photo:
West"facing!photo:
Print!Timestamp:!4/26/2010,!4:13:57!PM

Great!Basin!Unified!Air!Pollution!Control!District157!Short!Street
Bishop,!CA!!93514760.872.8211!/!http://www.gbuapcd.org
GBUAPCD!Site!Report
Site!Name: Keeler#2"PM10"1°"TEOM
Location: Located!on!top!of!metal!storage!unit!and!monitoring!shelter.
Address: 190!CERRO!GORDO!ROAD,!KEELER,!CA
Distance!to!Road: 19!meters
Traffic!Count: TBD
Groundcover: Pavement
Representative!Area: Community!of!Keeler
Pollutant: PM"10
Monitor!Objective: Representative!Concentration
Spatial!Scale: Neighborhood
Sampling!Method: PM"10!Impactor
Analysis!Method: Gravimetry
Start!Date: 6/15/2009
Operation!Schedule: hourly
Sampling!Season: Year"round
Probe!Height: 4!meters
Distance!to!Supporting!Structure: None
Distance!from!Obstructions!on!Roof: None
Distance!from!Obstructions!Not!on!Roof: 9!meters!to!antennae
Distance!From!Trees: 75!meters
Distance!to!Furnace!or!Incinerator: N/A
Distance!Between!Collocated!Monitors: 1.7!meters!to!colocated!TEOM!(#3);!1.17!m!to!10pri!Partisol
Unrestricted!Airflow: 360
Probe!Material: N/A
Residence!Time: N/A
Will!there!be!a!change!in!18!months?: No
Site!Number: 728
Current: Yes
County: Inyo
FIPS!Code: 06"027
AIRS!Number: 1003
Met!Installed?: No
TEOM!Installed?: Yes
Site!Operator: Scott!Weaver
Collecting!Agency: GBUAPCD
TEOM!Type: TEOM
UTM!X: 421982
UTM!Y: 4038410
Suitable!comparison!against!annual!PM2.5?: No
Frequency!of!flow!rate!verification!for!manual!PM!sampler!audit:
N/A
Frequency!of!flow!rate!verification!for!automated!PM!analyzers!audit:
Bi"weekly
Frequency!of!one"point!QC!check!(gaseous): N/A
Variable:!Wind!Speed
Variable:!Wind!Direction
Variable:!Relative!Humidity
Variable:!Temperature
Variable:!Barometric!Pressure
Variable:!Precipitation
Meteorological!Variables:
Print!Timestamp:!4/26/2010,!4:13:57!PM

Great!Basin!Unified!Air!Pollution!Control!District157!Short!Street
Bishop,!CA!!93514760.872.8211!/!http://www.gbuapcd.org
GBUAPCD!Site!Report
Site!Name: Keeler#2"PM10"1°"TEOM
Site!Photo:
North"facing!photo:
East"facing!photo:
South"facing!photo:
West"facing!photo:
Print!Timestamp:!4/26/2010,!4:13:57!PM

Great!Basin!Unified!Air!Pollution!Control!District157!Short!Street
Bishop,!CA!!93514760.872.8211!/!http://www.gbuapcd.org
GBUAPCD!Site!Report
Site!Name: Keeler#3"PM10"2°"TEOM
Location: Located!on!top!of!metal!storage!unit!and!monitoring!shelter.
Address: 190!CERRO!GORDO!ROAD,!KEELER,!CA
Distance!to!Road: 18!meters
Traffic!Count: TBD
Groundcover: pavement
Representative!Area: Community!of!Keeler
Pollutant: PM"10
Monitor!Objective: Representative!Concentration
Spatial!Scale: Neighborhood
Sampling!Method: PM"10!Impactor
Analysis!Method: Gravimetry
Start!Date: 6/15/2009
Operation!Schedule: hourly
Sampling!Season: Year"round
Probe!Height: 4!meters
Distance!to!Supporting!Structure: None
Distance!from!Obstructions!on!Roof: None
Distance!from!Obstructions!Not!on!Roof: 10!meters!to!antennae
Distance!From!Trees: 75!meters
Distance!to!Furnace!or!Incinerator: N/A
Distance!Between!Collocated!Monitors: 1.14!m!to!primary!TEOM!(#2);!1.14!m!!to!10pri!Partisol
Unrestricted!Airflow: 360
Probe!Material: N/A
Residence!Time: N/A
Will!there!be!a!change!in!18!months?: No
Site!Number: 728
Current: Yes
County: Inyo
FIPS!Code: 06"027
AIRS!Number: 1003
Met!Installed?: No
TEOM!Installed?: Yes
Site!Operator: Scott!Weaver
Collecting!Agency: GBUAPCD
TEOM!Type: TEOM
UTM!X: 421982
UTM!Y: 4038410
Suitable!comparison!against!annual!PM2.5?: yes
Frequency!of!flow!rate!verification!for!manual!PM!sampler!audit:
N/A
Frequency!of!flow!rate!verification!for!automated!PM!analyzers!audit:
Bi"weekly
Frequency!of!one"point!QC!check!(gaseous): N/A
Variable:!Wind!Speed
Variable:!Wind!Direction
Variable:!Relative!Humidity
Variable:!Temperature
Variable:!Barometric!Pressure
Variable:!Precipitation
Meteorological!Variables:
Print!Timestamp:!4/26/2010,!4:13:58!PM

Great!Basin!Unified!Air!Pollution!Control!District157!Short!Street
Bishop,!CA!!93514760.872.8211!/!http://www.gbuapcd.org
GBUAPCD!Site!Report
Site!Name: Keeler#3"PM10"2°"TEOM
Site!Photo:
North"facing!photo:
East"facing!photo:
South"facing!photo:
West"facing!photo:
Print!Timestamp:!4/26/2010,!4:13:58!PM
Great!Basin!Unified!Air!Pollution!Control!District157!Short!Street
Bishop,!CA!!93514760.872.8211!/!http://www.gbuapcd.org
GBUAPCD!Site!Report
Site!Name: Lee"Vining
Location: Community!of!Lee!Vining,!CA
Address: HWY!395,!LEE!VINING
Distance!to!Road: 84!m!to!Hwy!395;!179!m!to!Matty!Ave.
Traffic!Count: TBD
Groundcover: Lawn!(north);!Gravel!(south)
Representative!Area: Lee!Vining,!CA
Pollutant: PM"10
Monitor!Objective: Representative!Concnetration
Spatial!Scale: Neighborhood!Scale
Sampling!Method: PM"10!Impactor
Analysis!Method: Gravimetry
Start!Date: 1/1/1981
Operation!Schedule: 1:3
Sampling!Season: Year"round
Probe!Height: 3!meters!AGL
Distance!to!Supporting!Structure: N/A
Distance!from!Obstructions!on!Roof: N/A
Distance!from!Obstructions!Not!on!Roof: N/A
Distance!From!Trees: 19.8!m
Distance!to!Furnace!or!Incinerator: N/A
Distance!Between!Collocated!Monitors: N/A
Unrestricted!Airflow: 360
Probe!Material: N/A
Residence!Time: N/A
Will!there!be!a!change!in!18!months?: Yes
Site!Number: 779
Current: No
County: Mono
FIPS!Code: 06"051
AIRS!Number: 0005
Met!Installed?: No
TEOM!Installed?: No
Site!Operator: Guy!Davis
Collecting!Agency: GBUAPCD
TEOM!Type: N/A
UTM!X: 314232
UTM!Y: 4202840
Suitable!comparison!against!annual!PM2.5?: No
Frequency!of!flow!rate!verification!for!manual!PM!sampler!audit:
Monthly
Frequency!of!flow!rate!verification!for!automated!PM!analyzers!audit:
N/A
Frequency!of!one"point!QC!check!(gaseous): N/A
Variable:!Wind!Speed
Variable:!Wind!Direction
Variable:!Relative!Humidity
Variable:!Temperature
Variable:!Barometric!Pressure
Variable:!Precipitation
Meteorological!Variables:
Print!Timestamp:!4/26/2010,!4:13:58!PM

Great!Basin!Unified!Air!Pollution!Control!District157!Short!Street
Bishop,!CA!!93514760.872.8211!/!http://www.gbuapcd.org
GBUAPCD!Site!Report
Site!Name: Lee"Vining
Site!Photo:
North"facing!photo:
East"facing!photo:
South"facing!photo:
West"facing!photo:
Print!Timestamp:!4/26/2010,!4:14:00!PM

Great!Basin!Unified!Air!Pollution!Control!District157!Short!Street
Bishop,!CA!!93514760.872.8211!/!http://www.gbuapcd.org
GBUAPCD!Site!Report
Site!Name: Lizard"Tail"TEOM
Location: Owens!Lake!NE!Shoreline
Address: Lizard!Tail!"!NE!Shoreline!Owens!Lake,!CA
Distance!to!Road: 275!meters
Traffic!Count: TBD
Groundcover: Sand!and!shrubs
Representative!Area: 4!km!area
Pollutant: PM"10
Monitor!Objective: Representative!Concentration
Spatial!Scale: Neighborhood!Scale
Sampling!Method: PM"10!Impactor
Analysis!Method: Gravimetry
Start!Date: 1/16/2008
Operation!Schedule: hourly
Sampling!Season: Year"round
Probe!Height: 2!meters!above!roof;!4.6!meters!AGL.
Distance!to!Supporting!Structure: N/A
Distance!from!Obstructions!on!Roof: None
Distance!from!Obstructions!Not!on!Roof: Met!tower:!4.6!meters;!power!pole!9.1!meters
Distance!From!Trees: N/A;!no!trees
Distance!to!Furnace!or!Incinerator: N/A
Distance!Between!Collocated!Monitors: N/A
Unrestricted!Airflow: 360
Probe!Material: N/A
Residence!Time: N/A
Will!there!be!a!change!in!18!months?: N/A
Site!Number: 1016
Current: Yes
County: Inyo
FIPS!Code: 06"027
AIRS!Number: 0028
Met!Installed?: Yes
TEOM!Installed?: Yes
Site!Operator: Scott!Weaver
Collecting!Agency: GBUAPCD
TEOM!Type: TEOM
UTM!X: 415701
UTM!Y: 4044610
Suitable!comparison!against!annual!PM2.5?: No
Frequency!of!flow!rate!verification!for!manual!PM!sampler!audit:
N/A
Frequency!of!flow!rate!verification!for!automated!PM!analyzers!audit:
Bi"weekly
Frequency!of!one"point!QC!check!(gaseous): N/A
Variable:!Wind!Speed
Variable:!Wind!Direction
Variable:!Relative!Humidity
Variable:!Temperature
Variable:!Barometric!Pressure
Variable:!Precipitation
Meteorological!Variables:
Print!Timestamp:!4/26/2010,!4:14:03!PM

Great!Basin!Unified!Air!Pollution!Control!District157!Short!Street
Bishop,!CA!!93514760.872.8211!/!http://www.gbuapcd.org
GBUAPCD!Site!Report
Site!Name: Lizard"Tail"TEOM
Site!Photo:
North"facing!photo:
East"facing!photo:
South"facing!photo:
West"facing!photo:
Print!Timestamp:!4/26/2010,!4:14:03!PM

Great!Basin!Unified!Air!Pollution!Control!District157!Short!Street
Bishop,!CA!!93514760.872.8211!/!http://www.gbuapcd.org
GBUAPCD!Site!Report
Site!Name: Lone"Pine"FDMS
Location: Southern!Inyo!Hospital
Address: 501!East!Locust!Rd,!Lone!Pine,!CA
Distance!to!Road: 65!meters
Traffic!Count: TBD
Groundcover: rooftop,!asphalt!roofing
Representative!Area: Community!of!Lone!Pine
Pollutant: PM"10
Monitor!Objective: Representative!Concentration
Spatial!Scale: Neighborhood!Scale
Sampling!Method: PM"10!Impactor
Analysis!Method: Gravimetry
Start!Date: 4/17/2008
Operation!Schedule: hourly
Sampling!Season: Year"round
Probe!Height: 2.6!meters!above!roof;!6.5!m!AGL
Distance!to!Supporting!Structure: N/A
Distance!from!Obstructions!on!Roof: 30!meters
Distance!from!Obstructions!Not!on!Roof: 29!meters
Distance!From!Trees: 29!meters
Distance!to!Furnace!or!Incinerator: 65!meters
Distance!Between!Collocated!Monitors: N/A
Unrestricted!Airflow: 360
Probe!Material: N/A
Residence!Time: N/A
Will!there!be!a!change!in!18!months?: No
Site!Number: 699
Current: Yes
County: Inyo
FIPS!Code: 06"027
AIRS!Number: 0004
Met!Installed?: No
TEOM!Installed?: Yes
Site!Operator: Scott!Weaver
Collecting!Agency: GBUAPCD
TEOM!Type: FDMS!TEOM
UTM!X: 405400
UTM!Y: 4052020
Suitable!comparison!against!annual!PM2.5?: No
Frequency!of!flow!rate!verification!for!manual!PM!sampler!audit:
!N/A
Frequency!of!flow!rate!verification!for!automated!PM!analyzers!audit:
Bi"weekly
Frequency!of!one"point!QC!check!(gaseous): N/A
Variable:!Wind!Speed
Variable:!Wind!Direction
Variable:!Relative!Humidity
Variable:!Temperature
Variable:!Barometric!Pressure
Variable:!Precipitation
Meteorological!Variables:
Print!Timestamp:!4/26/2010,!4:14:03!PM

Great!Basin!Unified!Air!Pollution!Control!District157!Short!Street
Bishop,!CA!!93514760.872.8211!/!http://www.gbuapcd.org
GBUAPCD!Site!Report
Site!Name: Lone"Pine"FDMS
Site!Photo:
North"facing!photo:
East"facing!photo:
South"facing!photo:
West"facing!photo:
Print!Timestamp:!4/26/2010,!4:14:04!PM

Great!Basin!Unified!Air!Pollution!Control!District157!Short!Street
Bishop,!CA!!93514760.872.8211!/!http://www.gbuapcd.org
GBUAPCD!Site!Report
Site!Name: Lone"Pine"MET
Location: Lone!Pine!Wastewater!Treatment!Plant
Address: OUT!AT!THE!SEWER!PONDS!ONE!MILE!E!OF!LOCUST!ST
Distance!to!Road: 30!meters
Traffic!Count: 1!per!week
Groundcover: dirt!and!grass
Representative!Area: rural!area!east!of!Lone!Pine
Pollutant: N/A
Monitor!Objective: Local!Meteorology
Spatial!Scale: Neighborhood!Scale
Sampling!Method: N/A
Analysis!Method: N/A
Start!Date: 5/14/1986
Operation!Schedule: 5!minutes
Sampling!Season: Year"round
Probe!Height: 10!meters
Distance!to!Supporting!Structure: N/A
Distance!from!Obstructions!on!Roof: N/A
Distance!from!Obstructions!Not!on!Roof: 40!meters!to!phone!pole
Distance!From!Trees: 100!meters
Distance!to!Furnace!or!Incinerator: N/A
Distance!Between!Collocated!Monitors: N/A
Unrestricted!Airflow: 360
Probe!Material: N/A
Residence!Time: N/A
Will!there!be!a!change!in!18!months?: No
Site!Number: 711
Current: Yes
County: Inyo
FIPS!Code: 06"027
AIRS!Number: 0019
Met!Installed?: Yes
TEOM!Installed?: No
Site!Operator: Scott!Weaver
Collecting!Agency: GBUAPCD
TEOM!Type: N/A
UTM!X: 406300
UTM!Y: 4051850
Suitable!comparison!against!annual!PM2.5?: N/A
Frequency!of!flow!rate!verification!for!manual!PM!sampler!audit:
N/A
Frequency!of!flow!rate!verification!for!automated!PM!analyzers!audit:
N/A
Frequency!of!one"point!QC!check!(gaseous): N/A
Variable:!Wind!Speed
Variable:!Wind!Direction
Variable:!Relative!Humidity
Variable:!Temperature
Variable:!Barometric!Pressure
Variable:!Precipitation
Meteorological!Variables:
Print!Timestamp:!4/26/2010,!4:14:04!PM

Great!Basin!Unified!Air!Pollution!Control!District157!Short!Street
Bishop,!CA!!93514760.872.8211!/!http://www.gbuapcd.org
GBUAPCD!Site!Report
Site!Name: Lone"Pine"MET
Site!Photo:
North"facing!photo:
East"facing!photo:
South"facing!photo:
West"facing!photo:
Print!Timestamp:!4/26/2010,!4:14:04!PM

Great!Basin!Unified!Air!Pollution!Control!District157!Short!Street
Bishop,!CA!!93514760.872.8211!/!http://www.gbuapcd.org
GBUAPCD!Site!Report
Site!Name: Mammoth"FDMS
Location: Town!of!Mammoth!Lakes,!CA
Address: Gateway!Home!Center,!Mammoth!Lakes,!CA
Distance!to!Road: 30.5!meters
Traffic!Count: TBD
Groundcover: Urban;!asphalt!composite!roof!and!pavement
Representative!Area: Town!of!Mammoth!Lakes
Pollutant: PM10
Monitor!Objective: Representative!Concentration
Spatial!Scale: Neighborhood!Scale
Sampling!Method: PM"10!Impactor
Analysis!Method: Gravimetry
Start!Date: 1/1/2006
Operation!Schedule: hourly
Sampling!Season: Year"round
Probe!Height: FDMS:!4!meters!above!roof;!Partisol:!3!meters!above!roof;!(roof!at!~10m)
Distance!to!Supporting!Structure: N/A
Distance!from!Obstructions!on!Roof: N/A
Distance!from!Obstructions!Not!on!Roof: 30.5!meters!(at!55!degrees!and!180!degrees)
Distance!From!Trees: 40!meters
Distance!to!Furnace!or!Incinerator: N/A
Distance!Between!Collocated!Monitors: N/A
Unrestricted!Airflow: 360
Probe!Material: N/A
Residence!Time: N/A
Will!there!be!a!change!in!18!months?: N/A
Site!Number: 785
Current: Yes
County: Mono
FIPS!Code: 06"051
AIRS!Number: 0001
Met!Installed?: Yes
TEOM!Installed?: Yes
Site!Operator: Guy!Davis
Collecting!Agency: GBUAPCD
TEOM!Type: FDMS!TEOM
UTM!X: 325914
UTM!Y: 4168600
Suitable!comparison!against!annual!PM2.5?: N/A
Frequency!of!flow!rate!verification!for!manual!PM!sampler!audit:
monthly!"!partisol
Frequency!of!flow!rate!verification!for!automated!PM!analyzers!audit:
bi"weekly!"!FDMS
Frequency!of!one"point!QC!check!(gaseous): N/A
Variable:!Wind!Speed
Variable:!Wind!Direction
Variable:!Relative!Humidity
Variable:!Temperature
Variable:!Barometric!Pressure
Variable:!Precipitation
Meteorological!Variables:
Print!Timestamp:!4/26/2010,!4:14:04!PM

Great!Basin!Unified!Air!Pollution!Control!District157!Short!Street
Bishop,!CA!!93514760.872.8211!/!http://www.gbuapcd.org
GBUAPCD!Site!Report
Site!Name: Mammoth"FDMS
Site!Photo:
North"facing!photo:
East"facing!photo:
South"facing!photo:
West"facing!photo:
Print!Timestamp:!4/26/2010,!4:14:06!PM

Great!Basin!Unified!Air!Pollution!Control!District157!Short!Street
Bishop,!CA!!93514760.872.8211!/!http://www.gbuapcd.org
GBUAPCD!Site!Report
Site!Name: Mill
Location: 2!miles!south!of!Keeler
Address: East!shore!Owens!Lake,!CA
Distance!to!Road: 0.4!km!to!Hwy!190.
Traffic!Count: TBD
Groundcover: Gravel
Representative!Area: Regional
Pollutant: N/A
Monitor!Objective: Local!Meteorology
Spatial!Scale: Neighborhood!Scale
Sampling!Method: N/A
Analysis!Method: N/A
Start!Date: 11/14/2001
Operation!Schedule: 5!minute
Sampling!Season: Year"round
Probe!Height: 10!meters
Distance!to!Supporting!Structure: N/A
Distance!from!Obstructions!on!Roof: N/A
Distance!from!Obstructions!Not!on!Roof: None
Distance!From!Trees: None
Distance!to!Furnace!or!Incinerator: None
Distance!Between!Collocated!Monitors: N/A
Unrestricted!Airflow: 360
Probe!Material: N/A
Residence!Time: N/A
Will!there!be!a!change!in!18!months?: No
Site!Number: 1013
Current: Yes
County: Inyo
FIPS!Code: 06"027
AIRS!Number:
Met!Installed?: Yes
TEOM!Installed?: No
Site!Operator: Dan!Johnson
Collecting!Agency: GBUAPCD
TEOM!Type: N/A
UTM!X: 423666
UTM!Y: 4035140
Suitable!comparison!against!annual!PM2.5?: N/A
Frequency!of!flow!rate!verification!for!manual!PM!sampler!audit:
N/A
Frequency!of!flow!rate!verification!for!automated!PM!analyzers!audit:
N/A
Frequency!of!one"point!QC!check!(gaseous): N/A
Variable:!Wind!Speed
Variable:!Wind!Direction
Variable:!Relative!Humidity
Variable:!Temperature
Variable:!Barometric!Pressure
Variable:!Precipitation
Meteorological!Variables:
Print!Timestamp:!4/26/2010,!4:14:09!PM

Great!Basin!Unified!Air!Pollution!Control!District157!Short!Street
Bishop,!CA!!93514760.872.8211!/!http://www.gbuapcd.org
GBUAPCD!Site!Report
Site!Name: Mill
Site!Photo:
North"facing!photo:
East"facing!photo:
South"facing!photo:
West"facing!photo:
Print!Timestamp:!4/26/2010,!4:14:09!PM

Great!Basin!Unified!Air!Pollution!Control!District157!Short!Street
Bishop,!CA!!93514760.872.8211!/!http://www.gbuapcd.org
GBUAPCD!Site!Report
Site!Name: Mono"Shore"TEOM
Location: Northeast!shore!of!Mono!Lake
Address: Mono!Lake,!CA
Distance!to!Road: 4.4!km
Traffic!Count: TBD
Groundcover: Course!sand
Representative!Area: Beach!area,!Mono!Lake,!CA
Pollutant: PM"10
Monitor!Objective: High!Concentration
Spatial!Scale: Neighborhood!Scale
Sampling!Method: PM"10!Impactor
Analysis!Method: Gravimetry
Start!Date: 6/2/2008
Operation!Schedule: hourly
Sampling!Season: Year"round
Probe!Height: 10.0!m!(MET);!2.5m!TEOM
Distance!to!Supporting!Structure: N/A
Distance!from!Obstructions!on!Roof: N/A
Distance!from!Obstructions!Not!on!Roof: N/A
Distance!From!Trees: 50!meters!to!dune!shrubs
Distance!to!Furnace!or!Incinerator: N/A
Distance!Between!Collocated!Monitors: N/A
Unrestricted!Airflow: 360
Probe!Material: N/A
Residence!Time: N/A
Will!there!be!a!change!in!18!months?: No
Site!Number: 901
Current: Yes
County: Mono
FIPS!Code: 06"051
AIRS!Number: 0011
Met!Installed?: Yes
TEOM!Installed?: Yes
Site!Operator: Guy!Davis
Collecting!Agency: GBUAPCD
TEOM!Type: TEOM
UTM!X: 329153
UTM!Y: 4215350
Suitable!comparison!against!annual!PM2.5?: No
Frequency!of!flow!rate!verification!for!manual!PM!sampler!audit:
N/A
Frequency!of!flow!rate!verification!for!automated!PM!analyzers!audit:
Bi"weekly
Frequency!of!one"point!QC!check!(gaseous): N/A
Variable:!Wind!Speed
Variable:!Wind!Direction
Variable:!Relative!Humidity
Variable:!Temperature
Variable:!Barometric!Pressure
Variable:!Precipitation
Meteorological!Variables:
Print!Timestamp:!4/26/2010,!4:14:09!PM

Great!Basin!Unified!Air!Pollution!Control!District157!Short!Street
Bishop,!CA!!93514760.872.8211!/!http://www.gbuapcd.org
GBUAPCD!Site!Report
Site!Name: Mono"Shore"TEOM
Site!Photo:
North"facing!photo:
East"facing!photo:
South"facing!photo:
West"facing!photo:
Print!Timestamp:!4/26/2010,!4:14:12!PM

Great!Basin!Unified!Air!Pollution!Control!District157!Short!Street
Bishop,!CA!!93514760.872.8211!/!http://www.gbuapcd.org
GBUAPCD!Site!Report
Site!Name: North"Beach"TEOM
Location: North!shore,!Owens!Lake
Address: Owens!Lake,!CA
Distance!to!Road: 30!meters
Traffic!Count: TBD
Groundcover: gravel
Representative!Area: North!shore,!Owens!Lake
Pollutant: PM"10
Monitor!Objective: Representative!Concentrations
Spatial!Scale: Neighborhood!Scale
Sampling!Method: PM"10!Impactor
Analysis!Method: Gravimetry
Start!Date: 11/20/2008
Operation!Schedule: hourly
Sampling!Season: Year"round
Probe!Height: 2!meters!above!roof;!4.4!meters!AGL
Distance!to!Supporting!Structure: N/A
Distance!from!Obstructions!on!Roof: None
Distance!from!Obstructions!Not!on!Roof: 30!meters!to!power!pole
Distance!From!Trees: No!trees
Distance!to!Furnace!or!Incinerator: N/A
Distance!Between!Collocated!Monitors: N/A
Unrestricted!Airflow: 360
Probe!Material: N/A
Residence!Time: N/A
Will!there!be!a!change!in!18!months?: N/A
Site!Number: 1017
Current: Yes
County: Inyo
FIPS!Code: 06"027
AIRS!Number: 0029
Met!Installed?: No
TEOM!Installed?: Yes
Site!Operator: Scott!Weaver
Collecting!Agency: GBUAPCD
TEOM!Type: TEOM
UTM!X: 411283
UTM!Y: 4044610
Suitable!comparison!against!annual!PM2.5?: No
Frequency!of!flow!rate!verification!for!manual!PM!sampler!audit:
N/A
Frequency!of!flow!rate!verification!for!automated!PM!analyzers!audit:
Bi"weekly
Frequency!of!one"point!QC!check!(gaseous): N/A
Variable:!Wind!Speed
Variable:!Wind!Direction
Variable:!Relative!Humidity
Variable:!Temperature
Variable:!Barometric!Pressure
Variable:!Precipitation
Meteorological!Variables:
Print!Timestamp:!4/26/2010,!4:14:14!PM

Great!Basin!Unified!Air!Pollution!Control!District157!Short!Street
Bishop,!CA!!93514760.872.8211!/!http://www.gbuapcd.org
GBUAPCD!Site!Report
Site!Name: North"Beach"TEOM
Site!Photo:
North"facing!photo:
East"facing!photo:
South"facing!photo:
West"facing!photo:
Print!Timestamp:!4/26/2010,!4:14:14!PM

Great!Basin!Unified!Air!Pollution!Control!District157!Short!Street
Bishop,!CA!!93514760.872.8211!/!http://www.gbuapcd.org
GBUAPCD!Site!Report
Site!Name: Olancha"3"TEOM
Location: Community!of!Olancha,!CA
Address: 131!WALKER!CREEK!RD.,!Olancha,!CA!!93549
Distance!to!Road: 0.5!KM!to!Hwy!395
Traffic!Count: TBD
Groundcover: Sand,!gravel,!brush
Representative!Area: Community!of!Olancha
Pollutant: PM"10
Monitor!Objective: Representative!Concentration
Spatial!Scale: Neighborhood!Scale
Sampling!Method: Gravimetry
Analysis!Method: PM10!Impactor
Start!Date: 12/20/1995
Operation!Schedule: hourly
Sampling!Season: Year"round
Probe!Height: 4.5!meters
Distance!to!Supporting!Structure: N/A
Distance!from!Obstructions!on!Roof: None
Distance!from!Obstructions!Not!on!Roof: 10!meters!to!tower
Distance!From!Trees: 0.5!km
Distance!to!Furnace!or!Incinerator: None
Distance!Between!Collocated!Monitors: N/A
Unrestricted!Airflow: 360
Probe!Material: N/A
Residence!Time: N/A
Will!there!be!a!change!in!18!months?: No
Site!Number: 729
Current: Yes
County: Inyo
FIPS!Code: 06"027
AIRS!Number: 0021
Met!Installed?: Yes
TEOM!Installed?: Yes
Site!Operator: Dan!Johnson
Collecting!Agency: GBUAPCD
TEOM!Type: TEOM
UTM!X: 410806
UTM!Y: 4014080
Suitable!comparison!against!annual!PM2.5?: No
Frequency!of!flow!rate!verification!for!manual!PM!sampler!audit:
Frequency!of!flow!rate!verification!for!automated!PM!analyzers!audit:
Bi"weekly
Frequency!of!one"point!QC!check!(gaseous): N/A
Variable:!Wind!Speed
Variable:!Wind!Direction
Variable:!Relative!Humidity
Variable:!Temperature
Variable:!Barometric!Pressure
Variable:!Precipitation
Meteorological!Variables:
Print!Timestamp:!4/26/2010,!4:14:15!PM

Great!Basin!Unified!Air!Pollution!Control!District157!Short!Street
Bishop,!CA!!93514760.872.8211!/!http://www.gbuapcd.org
GBUAPCD!Site!Report
Site!Name: Olancha"3"TEOM
Site!Photo:
North"facing!photo:
East"facing!photo:
South"facing!photo:
West"facing!photo:
Print!Timestamp:!4/26/2010,!4:14:15!PM

Great!Basin!Unified!Air!Pollution!Control!District157!Short!Street
Bishop,!CA!!93514760.872.8211!/!http://www.gbuapcd.org
GBUAPCD!Site!Report
Site!Name: Portable!2"TEOM
Location: Variable,!short!(3"day!periods)!monitoring!of!source!areas!on!Owens!Lake
Address: Owens!Lake,!CA
Distance!to!Road: Variable
Traffic!Count: N/A
Groundcover: Sandy!crusts
Representative!Area: Owens!Lake
Pollutant: PM"10
Monitor!Objective: High!concentration
Spatial!Scale: Neighborhood!scale
Sampling!Method: PM"10!Impactor
Analysis!Method: Gravimetry
Start!Date:
Operation!Schedule: hourly
Sampling!Season: Year"round
Probe!Height: 2.4!meters
Distance!to!Supporting!Structure: N/A
Distance!from!Obstructions!on!Roof: None
Distance!from!Obstructions!Not!on!Roof: None
Distance!From!Trees: None
Distance!to!Furnace!or!Incinerator: None
Distance!Between!Collocated!Monitors: N/A
Unrestricted!Airflow: 360
Probe!Material: N/A
Residence!Time: N/A
Will!there!be!a!change!in!18!months?: Yes
Site!Number:
Current: Yes
County: Inyo
FIPS!Code: 06"027
AIRS!Number:
Met!Installed?: Yes
TEOM!Installed?: Yes
Site!Operator: Dan!Johnson
Collecting!Agency: GBUAPCD
TEOM!Type: TEOM
UTM!X:
UTM!Y:
Suitable!comparison!against!annual!PM2.5?: N/A
Frequency!of!flow!rate!verification!for!manual!PM!sampler!audit:
N/A
Frequency!of!flow!rate!verification!for!automated!PM!analyzers!audit:
Upon!installation!and!removal
Frequency!of!one"point!QC!check!(gaseous): N/A
Variable:!Wind!Speed
Variable:!Wind!Direction
Variable:!Relative!Humidity
Variable:!Temperature
Variable:!Barometric!Pressure
Variable:!Precipitation
Meteorological!Variables:
Print!Timestamp:!4/26/2010,!4:14:15!PM

Great!Basin!Unified!Air!Pollution!Control!District157!Short!Street
Bishop,!CA!!93514760.872.8211!/!http://www.gbuapcd.org
GBUAPCD!Site!Report
Site!Name: Shell"Cut"TEOM
Location: South"east!shore,!Owens!Lake
Address: SHELL!CUT!"!HIGHWAY!190!"!MIDWAY!BETWEEN!DIRTY!SOX!AND!FLAT!ROCK,!Owens!Lake,!CA
Distance!to!Road: 164.5!meters!to!Hwy!190
Traffic!Count: TBD
Groundcover: Dirt,!sand,!gravel,!shrubs
Representative!Area: South"east!shore!Owens!Lake
Pollutant: PM"10
Monitor!Objective: Representative!Concentration
Spatial!Scale: Neighborhood!Scale
Sampling!Method: PM"10!Impactor
Analysis!Method: Gravimetry
Start!Date: 12/13/2000
Operation!Schedule: hourly
Sampling!Season: Year"round
Probe!Height: 4.2!meters
Distance!to!Supporting!Structure: 0
Distance!from!Obstructions!on!Roof: 0
Distance!from!Obstructions!Not!on!Roof: 2.6!meters!(Met);!4.2!(powerline)
Distance!From!Trees: No!trees
Distance!to!Furnace!or!Incinerator: 0
Distance!Between!Collocated!Monitors: 0
Unrestricted!Airflow: 360
Probe!Material: N/A
Residence!Time: N/A
Will!there!be!a!change!in!18!months?: No
Site!Number: 1012
Current: Yes
County: Inyo
FIPS!Code: 06"027
AIRS!Number: 0025
Met!Installed?: Yes
TEOM!Installed?: Yes
Site!Operator: Steve!Mobley
Collecting!Agency: GBUAPCD
TEOM!Type: TEOM
UTM!X: 419478
UTM!Y: 4024950
Suitable!comparison!against!annual!PM2.5?: No
Frequency!of!flow!rate!verification!for!manual!PM!sampler!audit:
N/A
Frequency!of!flow!rate!verification!for!automated!PM!analyzers!audit:
Bi"weekly
Frequency!of!one"point!QC!check!(gaseous): N/A
Variable:!Wind!Speed
Variable:!Wind!Direction
Variable:!Relative!Humidity
Variable:!Temperature
Variable:!Barometric!Pressure
Variable:!Precipitation
Meteorological!Variables:
Print!Timestamp:!4/26/2010,!4:14:15!PM

Great!Basin!Unified!Air!Pollution!Control!District157!Short!Street
Bishop,!CA!!93514760.872.8211!/!http://www.gbuapcd.org
GBUAPCD!Site!Report
Site!Name: Shell"Cut"TEOM
Site!Photo:
North"facing!photo:
East"facing!photo:
South"facing!photo:
West"facing!photo:
Print!Timestamp:!4/26/2010,!4:14:16!PM

Great!Basin!Unified!Air!Pollution!Control!District157!Short!Street
Bishop,!CA!!93514760.872.8211!/!http://www.gbuapcd.org
GBUAPCD!Site!Report
Site!Name: Simis
Location: 1.8!km!north!of!Mono!Lake
Address: SIMIS!RES"HIWY!167,!MONO!LAKE,!CA
Distance!to!Road: 475!meters!to!CA!167
Traffic!Count: TBD
Groundcover: Sagebrush/Rabbitbrush!Scrub
Representative!Area: High!Desert
Pollutant: N/A
Monitor!Objective: Local!Meteorology
Spatial!Scale: Neighborhood
Sampling!Method: N/A
Analysis!Method: N/A
Start!Date: 5/21/1982
Operation!Schedule: hourly
Sampling!Season: Year"round
Probe!Height: 10!meters!AGL
Distance!to!Supporting!Structure: N/A
Distance!from!Obstructions!on!Roof: N/A
Distance!from!Obstructions!Not!on!Roof: N/A
Distance!From!Trees: 38!meters
Distance!to!Furnace!or!Incinerator: N/A
Distance!Between!Collocated!Monitors: N/A
Unrestricted!Airflow: 360
Probe!Material: N/A
Residence!Time: N/A
Will!there!be!a!change!in!18!months?: No
Site!Number: 782
Current: Yes
County: Mono
FIPS!Code: 06"051
AIRS!Number: 0007
Met!Installed?: Yes
TEOM!Installed?: No
Site!Operator: Guy!Davis
Collecting!Agency: GBUAPCD
TEOM!Type: N/A
UTM!X: 324798
UTM!Y: 4217850
Suitable!comparison!against!annual!PM2.5?: N/A
Frequency!of!flow!rate!verification!for!manual!PM!sampler!audit:
N/A
Frequency!of!flow!rate!verification!for!automated!PM!analyzers!audit:
N/A
Frequency!of!one"point!QC!check!(gaseous): N/A
Variable:!Wind!Speed
Variable:!Wind!Direction
Variable:!Relative!Humidity
Variable:!Temperature
Variable:!Barometric!Pressure
Variable:!Precipitation
Meteorological!Variables:
Print!Timestamp:!4/26/2010,!4:14:16!PM

Great!Basin!Unified!Air!Pollution!Control!District157!Short!Street
Bishop,!CA!!93514760.872.8211!/!http://www.gbuapcd.org
GBUAPCD!Site!Report
Site!Name: Simis
Site!Photo:
North"facing!photo:
East"facing!photo:
South"facing!photo:
West"facing!photo:
Print!Timestamp:!4/26/2010,!4:14:19!PM

Great!Basin!Unified!Air!Pollution!Control!District157!Short!Street
Bishop,!CA!!93514760.872.8211!/!http://www.gbuapcd.org
GBUAPCD!Site!Report
Site!Name: Stanley"TEOM
Location: Ash!Point;!West!side!Owens!Lake,!CA
Address: BILL!STANLEY!SITE!"!OWENS!LAKE,!CA
Distance!to!Road: 85!meters
Traffic!Count: TBD
Groundcover: sand!and!shrubs
Representative!Area: Southwestern!shoreline!of!Owens!Lake
Pollutant: PM"10
Monitor!Objective: Representative!Concentration
Spatial!Scale: Neighborhood!Scale
Sampling!Method: PM"10!Impactor
Analysis!Method: Gravimetry
Start!Date: 3/4/2002
Operation!Schedule: hourly
Sampling!Season: Year"round
Probe!Height: 19.8!meters!above!roof;!4.4!m!AGL
Distance!to!Supporting!Structure: N/A
Distance!from!Obstructions!on!Roof: 2.1!m!to!tower!(attached!to!shelter)
Distance!from!Obstructions!Not!on!Roof: 7.6!meters!to!power!pole
Distance!From!Trees: N/A!"!no!trees
Distance!to!Furnace!or!Incinerator: N/A
Distance!Between!Collocated!Monitors: N/A
Unrestricted!Airflow: 360
Probe!Material: N/A
Residence!Time: N/A
Will!there!be!a!change!in!18!months?: No
Site!Number: 1014
Current: Yes
County: Inyo
FIPS!Code: 06"027
AIRS!Number: 0026
Met!Installed?: Yes
TEOM!Installed?: Yes
Site!Operator: Scott!Weaver
Collecting!Agency: GBUAPCD
TEOM!Type: TEOM
UTM!X: 409315
UTM!Y: 4024570
Suitable!comparison!against!annual!PM2.5?: No
Frequency!of!flow!rate!verification!for!manual!PM!sampler!audit:
N/A
Frequency!of!flow!rate!verification!for!automated!PM!analyzers!audit:
Bi"weekly
Frequency!of!one"point!QC!check!(gaseous): N/A
Variable:!Wind!Speed
Variable:!Wind!Direction
Variable:!Relative!Humidity
Variable:!Temperature
Variable:!Barometric!Pressure
Variable:!Precipitation
Meteorological!Variables:
Print!Timestamp:!4/26/2010,!4:14:21!PM

Great!Basin!Unified!Air!Pollution!Control!District157!Short!Street
Bishop,!CA!!93514760.872.8211!/!http://www.gbuapcd.org
GBUAPCD!Site!Report
Site!Name: Stanley"TEOM
Site!Photo:
North"facing!photo:
East"facing!photo:
South"facing!photo:
West"facing!photo:
Print!Timestamp:!4/26/2010,!4:14:21!PM

Great!Basin!Unified!Air!Pollution!Control!District157!Short!Street
Bishop,!CA!!93514760.872.8211!/!http://www.gbuapcd.org
GBUAPCD!Site!Report
Site!Name: T!23"TEOM
Location: Eastern!Owens!Lake!Shallow!Flood!Area
Address: Owens!Lake,!CA
Distance!to!Road: 2.4!meters!to!berm
Traffic!Count: N/A
Groundcover: Dirt,!gravel,!water
Representative!Area:
Pollutant: PM"10
Monitor!Objective: High!concentration,!special!purpose!monitor
Spatial!Scale: Neighborhood!Scale
Sampling!Method: PM"10!Impactor
Analysis!Method: Gravimetry
Start!Date: 3/8/2010
Operation!Schedule: hourly
Sampling!Season: Year"round
Probe!Height: 4.1!meters
Distance!to!Supporting!Structure: N/A
Distance!from!Obstructions!on!Roof: None
Distance!from!Obstructions!Not!on!Roof: None
Distance!From!Trees: None
Distance!to!Furnace!or!Incinerator: None
Distance!Between!Collocated!Monitors: N/A
Unrestricted!Airflow: 360
Probe!Material: N/A
Residence!Time: N/A
Will!there!be!a!change!in!18!months?: No
Site!Number: 1044
Current: Yes
County: Inyo
FIPS!Code: 06"027
AIRS!Number:
Met!Installed?: No
TEOM!Installed?: Yes
Site!Operator: Steve!Mobley
Collecting!Agency: GBUAPCD
TEOM!Type: TEOM
UTM!X: 420143
UTM!Y: 4035210
Suitable!comparison!against!annual!PM2.5?: N/A
Frequency!of!flow!rate!verification!for!manual!PM!sampler!audit:
Frequency!of!flow!rate!verification!for!automated!PM!analyzers!audit:
Bi"weekly
Frequency!of!one"point!QC!check!(gaseous): N/A
Variable:!Wind!Speed
Variable:!Wind!Direction
Variable:!Relative!Humidity
Variable:!Temperature
Variable:!Barometric!Pressure
Variable:!Precipitation
Meteorological!Variables:
Print!Timestamp:!4/26/2010,!4:14:22!PM

Great!Basin!Unified!Air!Pollution!Control!District157!Short!Street
Bishop,!CA!!93514760.872.8211!/!http://www.gbuapcd.org
GBUAPCD!Site!Report
Site!Name: T!23"TEOM
Site!Photo:
North"facing!photo:
East"facing!photo:
South"facing!photo:
West"facing!photo:
Print!Timestamp:!4/26/2010,!4:14:22!PM

Great!Basin!Unified!Air!Pollution!Control!District157!Short!Street
Bishop,!CA!!93514760.872.8211!/!http://www.gbuapcd.org
GBUAPCD!Site!Report
Site!Name: T!25"TEOM"!"Shut"down"Mar"2010
Location: East"central!Owens!Lake
Address: Owens!Lake,!CA
Distance!to!Road: 2.4!meters!to!berm
Traffic!Count: TBD
Groundcover: Dirt,!gravel,!water
Representative!Area: Central!Owens!Lake!special!purpose!monitor
Pollutant: PM"10
Monitor!Objective: High!concentration
Spatial!Scale: Neighborhood!scale
Sampling!Method: PM"10!Impactor
Analysis!Method: Gravimetry
Start!Date: 4/1/2008
Operation!Schedule: hourly
Sampling!Season: Year"round
Probe!Height: 4.1!meters
Distance!to!Supporting!Structure: 0
Distance!from!Obstructions!on!Roof: 0
Distance!from!Obstructions!Not!on!Roof: 26.0!meters!(Met/DWP)
Distance!From!Trees: 0
Distance!to!Furnace!or!Incinerator: 0
Distance!Between!Collocated!Monitors: 0
Unrestricted!Airflow: 360
Probe!Material: N/A
Residence!Time: N/A
Will!there!be!a!change!in!18!months?: N/A
Site!Number: 1041
Current: Yes
County: Inyo
FIPS!Code: 06"027
AIRS!Number:
Met!Installed?: No
TEOM!Installed?: Yes
Site!Operator: Steve!Mobley
Collecting!Agency: GBUAPCD
TEOM!Type: TEOM
UTM!X: 420186
UTM!Y: 4036040
Suitable!comparison!against!annual!PM2.5?: N/A
Frequency!of!flow!rate!verification!for!manual!PM!sampler!audit:
Frequency!of!flow!rate!verification!for!automated!PM!analyzers!audit:
Bi"weekly
Frequency!of!one"point!QC!check!(gaseous): N/A
Variable:!Wind!Speed
Variable:!Wind!Direction
Variable:!Relative!Humidity
Variable:!Temperature
Variable:!Barometric!Pressure
Variable:!Precipitation
Meteorological!Variables:
Print!Timestamp:!4/26/2010,!4:14:23!PM

Great!Basin!Unified!Air!Pollution!Control!District157!Short!Street
Bishop,!CA!!93514760.872.8211!/!http://www.gbuapcd.org
GBUAPCD!Site!Report
Site!Name: T!25"TEOM"!"Shut"down"Mar"2010
Site!Photo:
North"facing!photo:
East"facing!photo:
South"facing!photo:
West"facing!photo:
Print!Timestamp:!4/26/2010,!4:14:23!PM

Great!Basin!Unified!Air!Pollution!Control!District157!Short!Street
Bishop,!CA!!93514760.872.8211!/!http://www.gbuapcd.org
GBUAPCD!Site!Report
Site!Name: T!4"TEOM
Location: On"lake!monitor,!southern!portion!Owens!Lake
Address: Owens!Lake,!CA
Distance!to!Road: 4.7!meters
Traffic!Count: TBD
Groundcover: Veg,!sand,!large!gravel,!water
Representative!Area: Southern!Owens!Lke
Pollutant: PM"10
Monitor!Objective: High!concentration,!special!purpose!monitor
Spatial!Scale: Neighborhood!scale
Sampling!Method: PM"10!Impactor
Analysis!Method: Gravimetry
Start!Date: 2/25/2010
Operation!Schedule: hourly
Sampling!Season: Year"round
Probe!Height: 4.7!meters
Distance!to!Supporting!Structure: 0
Distance!from!Obstructions!on!Roof: 0
Distance!from!Obstructions!Not!on!Roof: 0
Distance!From!Trees: No!trees
Distance!to!Furnace!or!Incinerator: N/A
Distance!Between!Collocated!Monitors: N/A
Unrestricted!Airflow: 360
Probe!Material: N/A
Residence!Time: N/A
Will!there!be!a!change!in!18!months?: No
Site!Number: 1043
Current: Yes
County: Inyo
FIPS!Code: 06"027
AIRS!Number:
Met!Installed?: No
TEOM!Installed?: Yes
Site!Operator: Steve!Mobley
Collecting!Agency: GBUAPCD
TEOM!Type: TEOM
UTM!X: 413927
UTM!Y: 4022240
Suitable!comparison!against!annual!PM2.5?: No
Frequency!of!flow!rate!verification!for!manual!PM!sampler!audit:
Frequency!of!flow!rate!verification!for!automated!PM!analyzers!audit:
Bi"weekly
Frequency!of!one"point!QC!check!(gaseous): N/A
Variable:!Wind!Speed
Variable:!Wind!Direction
Variable:!Relative!Humidity
Variable:!Temperature
Variable:!Barometric!Pressure
Variable:!Precipitation
Meteorological!Variables:
Print!Timestamp:!4/26/2010,!4:14:24!PM
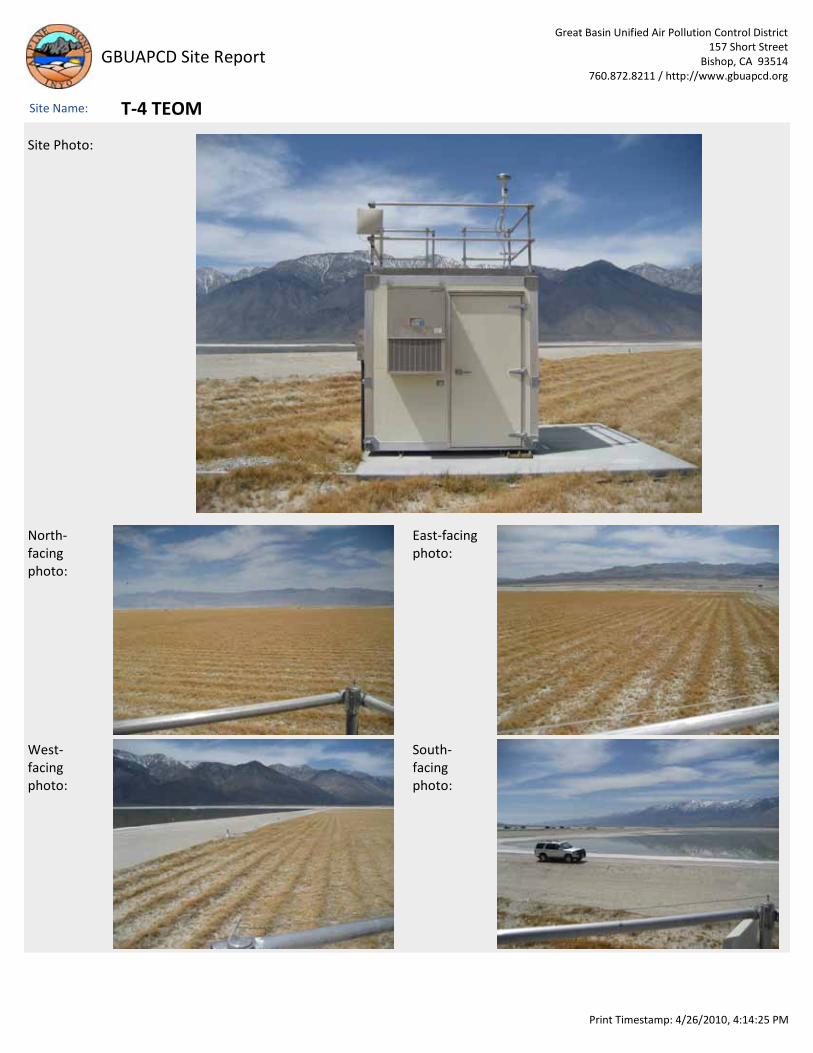
Great!Basin!Unified!Air!Pollution!Control!District157!Short!Street
Bishop,!CA!!93514760.872.8211!/!http://www.gbuapcd.org
GBUAPCD!Site!Report
Site!Name: T!4"TEOM
Site!Photo:
North"facing!photo:
East"facing!photo:
South"facing!photo:
West"facing!photo:
Print!Timestamp:!4/26/2010,!4:14:25!PM

Great!Basin!Unified!Air!Pollution!Control!District157!Short!Street
Bishop,!CA!!93514760.872.8211!/!http://www.gbuapcd.org
GBUAPCD!Site!Report
Site!Name: T!8"TEOM"!"Shut"down"Feb"2010
Location: South"central!Owens!Lake
Address: Owens!Lake,!CA
Distance!to!Road: 19.2!meters!(berm)
Traffic!Count: TBD
Groundcover: Veg,!sand,!large!gravel
Representative!Area: Southern!Owens!Lake!special!purpose!monitor
Pollutant: PM"10
Monitor!Objective: High!Concentration
Spatial!Scale: Neighborhood!scale
Sampling!Method: PM"10!Impactor
Analysis!Method: Gravimetry
Start!Date: 4/24/2008
Operation!Schedule: hourly
Sampling!Season: Year"round
Probe!Height: 4.4.!meters
Distance!to!Supporting!Structure: 0
Distance!from!Obstructions!on!Roof: 0
Distance!from!Obstructions!Not!on!Roof: 0
Distance!From!Trees: No!trees
Distance!to!Furnace!or!Incinerator: 0
Distance!Between!Collocated!Monitors: 0
Unrestricted!Airflow: 360
Probe!Material: N/A
Residence!Time: N/A
Will!there!be!a!change!in!18!months?: N/A
Site!Number: 1040
Current: No
County: Inyo
FIPS!Code: 06"027
AIRS!Number:
Met!Installed?: No
TEOM!Installed?: Yes
Site!Operator: Steve!Mobley
Collecting!Agency: GBUAPCD
TEOM!Type: TEOM
UTM!X: 414928
UTM!Y: 4024930
Suitable!comparison!against!annual!PM2.5?: N/A
Frequency!of!flow!rate!verification!for!manual!PM!sampler!audit:
N/A
Frequency!of!flow!rate!verification!for!automated!PM!analyzers!audit:
Bi"weekly
Frequency!of!one"point!QC!check!(gaseous): N/A
Variable:!Wind!Speed
Variable:!Wind!Direction
Variable:!Relative!Humidity
Variable:!Temperature
Variable:!Barometric!Pressure
Variable:!Precipitation
Meteorological!Variables:
Print!Timestamp:!4/26/2010,!4:14:25!PM

Great!Basin!Unified!Air!Pollution!Control!District157!Short!Street
Bishop,!CA!!93514760.872.8211!/!http://www.gbuapcd.org
GBUAPCD!Site!Report
Site!Name: T!8"TEOM"!"Shut"down"Feb"2010
Site!Photo:
North"facing!photo:
East"facing!photo:
South"facing!photo:
West"facing!photo:
Print!Timestamp:!4/26/2010,!4:14:26!PM

Great!Basin!Unified!Air!Pollution!Control!District157!Short!Street
Bishop,!CA!!93514760.872.8211!/!http://www.gbuapcd.org
GBUAPCD!Site!Report
Site!Name: WMRS!OVL"FDMS
Location:
Address: 3000!E.!LINE!ST.,!BISHOP,!CA.!93514
Distance!to!Road: 150!m
Traffic!Count: TBD
Groundcover: Decomposed!granite
Representative!Area: Owens!Valley
Pollutant: PM10
Monitor!Objective: Background!local
Spatial!Scale: Regional
Sampling!Method: PM"10!Impactor
Analysis!Method: Gravimetry
Start!Date: 4/7/2006
Operation!Schedule: hourly
Sampling!Season: h
Probe!Height: 10m!(met);!5m!(inlet)
Distance!to!Supporting!Structure: N/A
Distance!from!Obstructions!on!Roof: N/A
Distance!from!Obstructions!Not!on!Roof: 3!meters!to!met!tower
Distance!From!Trees: N/A
Distance!to!Furnace!or!Incinerator: N/A
Distance!Between!Collocated!Monitors: N/A
Unrestricted!Airflow: 360
Probe!Material: N/A
Residence!Time: N/A
Will!there!be!a!change!in!18!months?: Yes
Site!Number: 695
Current: No
County: Inyo
FIPS!Code: 06"027
AIRS!Number: 0002
Met!Installed?: Yes
TEOM!Installed?: Yes
Site!Operator: Valerie!Thorp
Collecting!Agency: GBUAPCD
TEOM!Type: FDMS!TEOM
UTM!X:
UTM!Y:
Suitable!comparison!against!annual!PM2.5?: No
Frequency!of!flow!rate!verification!for!manual!PM!sampler!audit:
Frequency!of!flow!rate!verification!for!automated!PM!analyzers!audit:
Bi"weekly
Frequency!of!one"point!QC!check!(gaseous): N/A
Variable:!Wind!Speed
Variable:!Wind!Direction
Variable:!Relative!Humidity
Variable:!Temperature
Variable:!Barometric!Pressure
Variable:!Precipitation
Meteorological!Variables:
Print!Timestamp:!4/26/2010,!4:14:26!PM

Great!Basin!Unified!Air!Pollution!Control!District157!Short!Street
Bishop,!CA!!93514760.872.8211!/!http://www.gbuapcd.org
GBUAPCD!Site!Report
Site!Name: WMRS!OVL"FDMS
Site!Photo:
North"facing!photo:
East"facing!photo:
South"facing!photo:
West"facing!photo:
Print!Timestamp:!4/26/2010,!4:14:29!PM