GRE Piping Systems The Greener Choice - TS&M … Piping Systems...GRE Piping Systems - The Greener...
14
GRE Piping Systems The Greener Choice A Comparison Study by Allen Chiu 1 , Rocky Friedrich 2
Transcript of GRE Piping Systems The Greener Choice - TS&M … Piping Systems...GRE Piping Systems - The Greener...

GRE Piping Systems The Greener ChoiceA Comparison Study byAllen Chiu1, Rocky Friedrich2

Glass Reinforced Epoxy (GRE) piping systems can challenge metallic piping systems in today’s ecoenvironment due to the lower energy requirements needed for manufacturing and the lower energy use throughout the pipes’ service life.
In the face of “Climate Change”, the use of GRE piping systems, relative to carbon steel pipe, produces less carbon dioxide in the atmosphere and thus makes it an attractive piping choice.
Climate change affects our competitive landscape in many different ways. Businesses are competing in a warming world while also facing higher raw material prices, rising energy costs, and increasing awareness by consumers about manufacturers’ and suppliers’ environmental records when making purchasing decisions. Companies that manage and mitigate their exposure to climate change risks can have a competitive advantage over rivals in a carbon-constraint future as well as being able to sustain their operations in an environmentally sensitive time.
1 Allen Chiu is the Vice President of Operations - Eastern Hemisphere for Fiber Glass Systems.2 Rocky Friedrick is the Sr. VP Technology, and heads Ameron Corporate Research & Engineering,
Ameron International.
Carbon DioxideBurning of carbon-based fuels since the industrial revolution has rapidly increased its concentration in the atmosphere, leading to climate change.
[email protected] nov.com/fgs
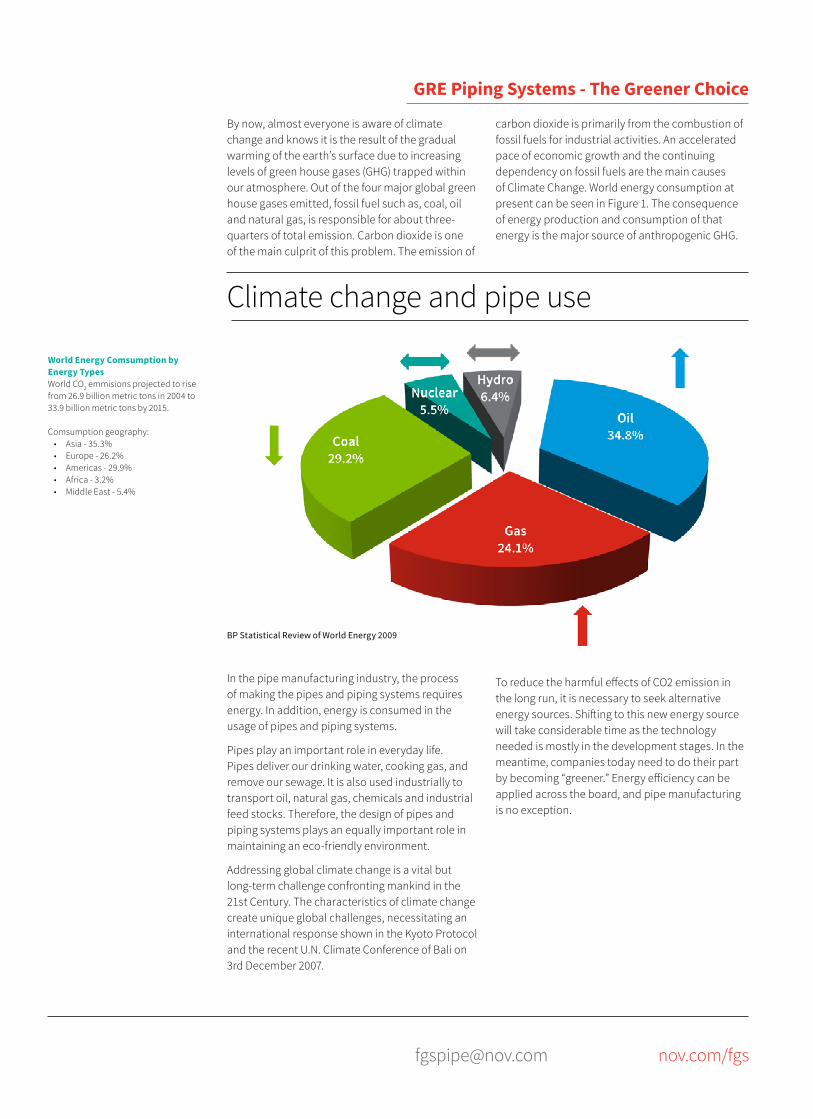
BP Statistical Review of World Energy 2009
GRE Piping Systems - The Greener Choice
Climate change and pipe use
By now, almost everyone is aware of climate change and knows it is the result of the gradual warming of the earth’s surface due to increasing levels of green house gases (GHG) trapped within our atmosphere. Out of the four major global green house gases emitted, fossil fuel such as, coal, oil and natural gas, is responsible for about three-quarters of total emission. Carbon dioxide is one of the main culprit of this problem. The emission of
In the pipe manufacturing industry, the process of making the pipes and piping systems requires energy. In addition, energy is consumed in the usage of pipes and piping systems.
Pipes play an important role in everyday life. Pipes deliver our drinking water, cooking gas, and remove our sewage. It is also used industrially to transport oil, natural gas, chemicals and industrial feed stocks. Therefore, the design of pipes and piping systems plays an equally important role in maintaining an eco-friendly environment.
Addressing global climate change is a vital but long-term challenge confronting mankind in the 21st Century. The characteristics of climate change create unique global challenges, necessitating an international response shown in the Kyoto Protocol and the recent U.N. Climate Conference of Bali on 3rd December 2007.
World Energy Comsumption by Energy TypesWorld CO2 emmisions projected to rise from 26.9 billion metric tons in 2004 to 33.9 billion metric tons by 2015.
Comsumption geography:• Asia - 35.3%• Europe - 26.2%• Americas - 29.9%• Africa - 3.2%• Middle East - 5.4%
carbon dioxide is primarily from the combustion of fossil fuels for industrial activities. An accelerated pace of economic growth and the continuing dependency on fossil fuels are the main causes of Climate Change. World energy consumption at present can be seen in Figure 1. The consequence of energy production and consumption of that energy is the major source of anthropogenic GHG.
To reduce the harmful effects of CO2 emission in the long run, it is necessary to seek alternative energy sources. Shifting to this new energy source will take considerable time as the technology needed is mostly in the development stages. In the meantime, companies today need to do their part by becoming “greener.” Energy efficiency can be applied across the board, and pipe manufacturing is no exception.

Energy Requirements for Glass Reinforced Epoxy vs. Carbon Steel Pipe
The manufacturing processes for Composite Pipe and Metallic Pipe are complex. Both processes consume and emit different levels of energy and CO2. Raw material requirements, specifications, and manufacturing processes need to be taken into account when comparing GRE with Carbon Steel (CS) pipes.
To begin with, majority of pipe production is Carbon Steel, and it is very energy intensive to produce. Carbon Steel pipes, as the name suggest, are produced by forming and welding steel plates or sheets, or by piercing a billet and rolling to the final dimension resulting in a seamless pipe. The complex pathway to produce steel, as it is needed for the production of CS pipes, is shown in Figure 2.
Today, there are two main routes to make steel. One is the “conventional route”, which uses blast furnace and basic oxygen furnace (BOF). The second is the “modern route”, which uses an electric arc furnace (EAF) and recycled steel. Both processes yield molten steel. In a series of subsequent steps, the molten steel is poured and solidified in a continuous caster where liquid steel is cast into shapes (slabs, billets or blooms). These semi-finished products are then transformed, or “rolled” into finished products. Some

Material GJ/t
Glass Fiber 18.4
Resin 6.9
3 Source: Steel data are based on Berkeley Lab (World Best Practice Energy Intensity Values for Selected Industrial Sectors).
4 Source: Internal Paper by Emerson Foo5 Except of the resin (EPK 827), the reinforcement and the curing agent (DL 50), GRE also contains a
number of other minor constituents, which are not outlined.
Table 1Primary energy requirements for supporting material (GJ/t)
MaterialGJ/t
Continuous CastingGJ/t
Thin Slab Casting(1)
Blast Furnance - BOF 20.6 16.3
Scrap - Electric Arc Furnace 8 6(1) Thin Slab Casting eliminating the need for a separate hot rolling mill
Scrap
Coal
Ore
EAF
Secondarysteelmaking
Continuouscasting
Rolling
Blast furnace BOFProducts
GRE Piping Systems - The Greener Choice
of these semi-finished products undergo a heat treatment, known as “hot rolling”. More than half the hot-rolled sheets are subsequently rolled again at ambient temperatures (“cold rolling”). In contrast, GRE piping systems are essentially made from glassfiber rovings in an epoxy resin matrix around a rotating mandrel. The glassfibers, oriented to provide the mechanical strength in the intended orientation, while the thermosetting resin provides the physical and chemical barrier of the finished product.4 After building the GRE pipe layer by layer, the pipe is cured for a few hours at temperatures between ambient and 200°C.5
Table 1 shows the raw material energy requirements for both, GRE and CS pipes. The energy required for GRE raw materials per ton of pipe, based on 70% glass and 30% resin is 15.0 GJ/t, which compares favorably with thin slat cast new steel at 16.3 GJ/t, but not thin slat cast recycled steel at 6 GJ/t. It is significantly lower than for BOF- Route new steel but more than recycled steel. This is based on the upper bound values for GRE and the best practice values taken for steel.
Figure 2Steel ProductionProcess3

GRE 2420 GJ/t GJ/Pipe
Raw Material Energy 15 3.2
Glass (70%) 12.9 2.7
Resin (30%) 2.1 0.4
Total Power Consumption 5.1 1.1
Total Energy Consumption 20 4.3
Table 2Primary Energy Requirements and Specifications for GRE vs. Carbon Steel Pipe Production
CSP Schedule 40 GJ/t GJ/Pipe GJ/t GJ/Pipe
Iron Ore to Steel Continuous Casting Thin Slab Casting
Blast Furnance - BOF Route 20.6 19.5 16.3 15.4
100% Scrap - Electric Arc Furnace 8.0 7.6 6.0 5.7
Steel Pipe Forming Energy* 3.8 3.6 3.6 3.6
Total (Blast Furnace - BOF Route) 24.4 23.1 20.1 19.0
Total (Electric - Arc - Furnace Route) 11.8 11.2 9.8 9.3
GRE CS Pipe
Pipe Size (inch) 12 12Pressure Rating (bar) 20 20O.D. (mm) 328.6 323.9I.D. (mm) 313.9 303.2Wall Thickness (mm) 6.8 10.3Length (m) 11.89 11.89Weight (kg) 213.3 946.9Weight (kg/m) 17.9 79.6
6 Numerical values are based on adequate standards of comparison.7 This number is based on the BOF-Route. Denoted blast furnace and BOF are presently the most
commonly used method (51% of the world steel production) and hence, taken as benchmark.
GRE Piping Systems - The Greener Choice
Energy Input of Pipe ProductionThe different processes and inputs used in transforming raw or intermediate materials into final products require different energy usages. Table 26 shows the material and energy flows that are needed for the production of one ton of pipes as well as for a single GRE and CS pipe.
Typically we would compare the GRE 2420 pipe, which is a 12 inch twenty bar rated pipe to a CS Pipe with equivalent usable design stress. The GRE piping system would have an OD of 323.5mm, an ID of 313.7mm, and wall thickness of 4.9mm. The CS piping system would have an OD of 323.9mm, an ID of 321.3mm, and wall thickness of 1.3mm. We are assuming the application of these pipes are for oilfields and we need to take into account extra pipe thickness for CS Pipes. The CS pipe’s wall thickness difference between a standard Schedule 40 and twenty bar equivalent CS pipe is about what is needed for corrosion allowance for a reasonable service life. Therefore, we will use Schedule 40 to compare throughout the paper.
On a weight basis, the primary energy needed for GRE 12 inch twenty bar rated pipe is approximately 20 GJ/t whereas CSP 12 inch Schedule 40 (produced with BOF-Steel) needs estimated 24.4 GJ/t. 7This leads to a 22% energy-saving advantage for GRE. Compared to CSP, using EAF-Steel (11.8 GJ/t), GRE requires 40% more energy.
However, because of the difference in density between steel and GRE and specific strength, on the basis of one length of pipe, GRE performs more than 5 times better than CSP (4.3 GJ vs. 23.1 GJ) resulting in 80% of energy savings. Compared to CSP using EAF-Steel the advantage is almost 60%.
Table 2 compare pipes that are of functional equivalent, i.e. 12 inch diameter, twenty bar rated GRE piping system takes 4.5 GJ/pipe while 12 inch schedule 40 pipe using new steel takes 19 GJ/pipe and recycled steel takes 9.3 GJ/pipe.
In all cases, a GRE piping system has a substantial advantage in terms of energy consumption because it helps companies reduce their carbon footprint where as CSP does not.
[email protected] nov.com/fgs
GRE 2420CS Pipe
Schedule 40
Service Life Energy X
Installation Costs
Material purchase X
Support requirements X
Joint makeup time X
Rigging requirements (light weight) X
Operation Costs
Energy Cost X
Maintenance Requirement(corrosion, repairs, replacement ...) X
Hydraulics (i.e. smoothness) X
Table 3GRE vs CS Pipe Considerations
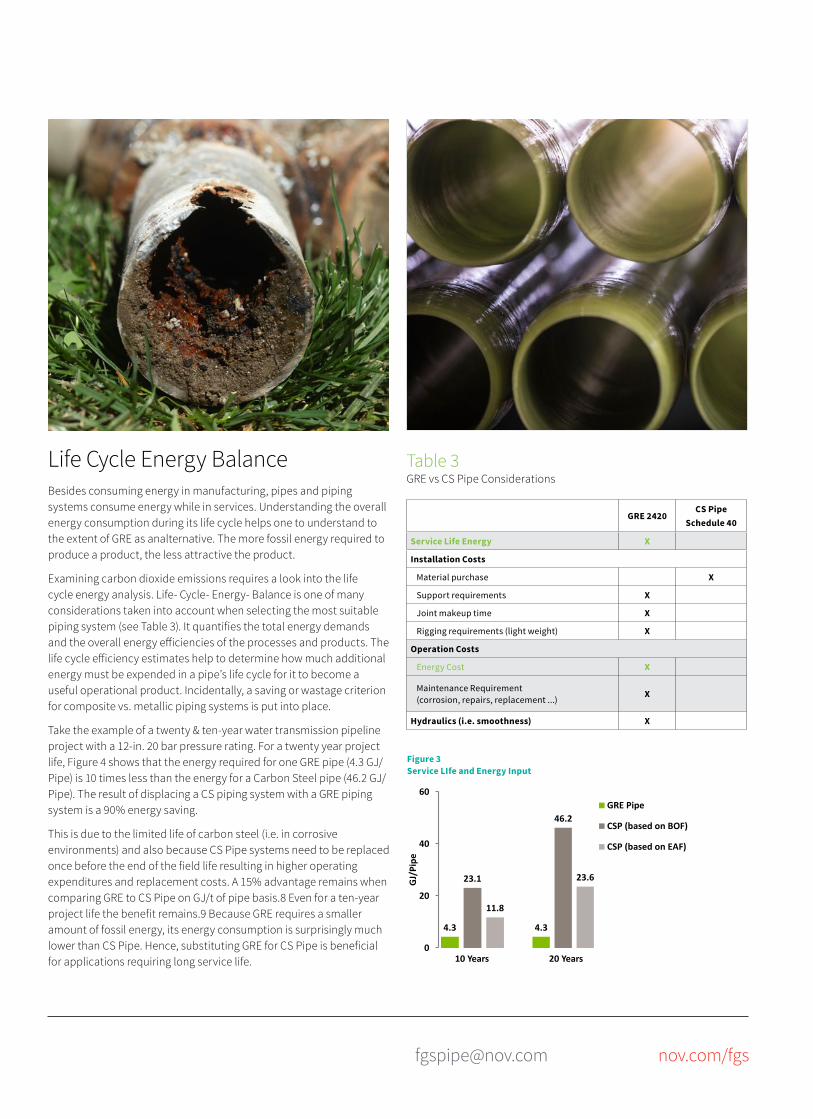
4.3
23.1
11.8
0
20
40
60
GJ/P
ipe
10 Years
4.3
46.2
23.6
20 Years
GRE Pipe
CSP (based on BOF)
CSP (based on EAF)
Life Cycle Energy BalanceBesides consuming energy in manufacturing, pipes and piping systems consume energy while in services. Understanding the overall energy consumption during its life cycle helps one to understand to the extent of GRE as analternative. The more fossil energy required to produce a product, the less attractive the product.
Examining carbon dioxide emissions requires a look into the life cycle energy analysis. Life- Cycle- Energy- Balance is one of many considerations taken into account when selecting the most suitable piping system (see Table 3). It quantifies the total energy demands and the overall energy efficiencies of the processes and products. The life cycle efficiency estimates help to determine how much additional energy must be expended in a pipe’s life cycle for it to become a useful operational product. Incidentally, a saving or wastage criterion for composite vs. metallic piping systems is put into place.
Take the example of a twenty & ten-year water transmission pipeline project with a 12-in. 20 bar pressure rating. For a twenty year project life, Figure 4 shows that the energy required for one GRE pipe (4.3 GJ/Pipe) is 10 times less than the energy for a Carbon Steel pipe (46.2 GJ/Pipe). The result of displacing a CS piping system with a GRE piping system is a 90% energy saving.
This is due to the limited life of carbon steel (i.e. in corrosive environments) and also because CS Pipe systems need to be replaced once before the end of the field life resulting in higher operating expenditures and replacement costs. A 15% advantage remains when comparing GRE to CS Pipe on GJ/t of pipe basis.8 Even for a ten-year project life the benefit remains.9 Because GRE requires a smaller amount of fossil energy, its energy consumption is surprisingly much lower than CS Pipe. Hence, substituting GRE for CS Pipe is beneficial for applications requiring long service life.
Figure 3Service LIfe and Energy Input
10 Based on internal paper: Bonstrand Marine Design Manual FP707A.11 Assuming one pipe replacement cycle in the 20 year service life for CS pipe is used for oilfield
applications.
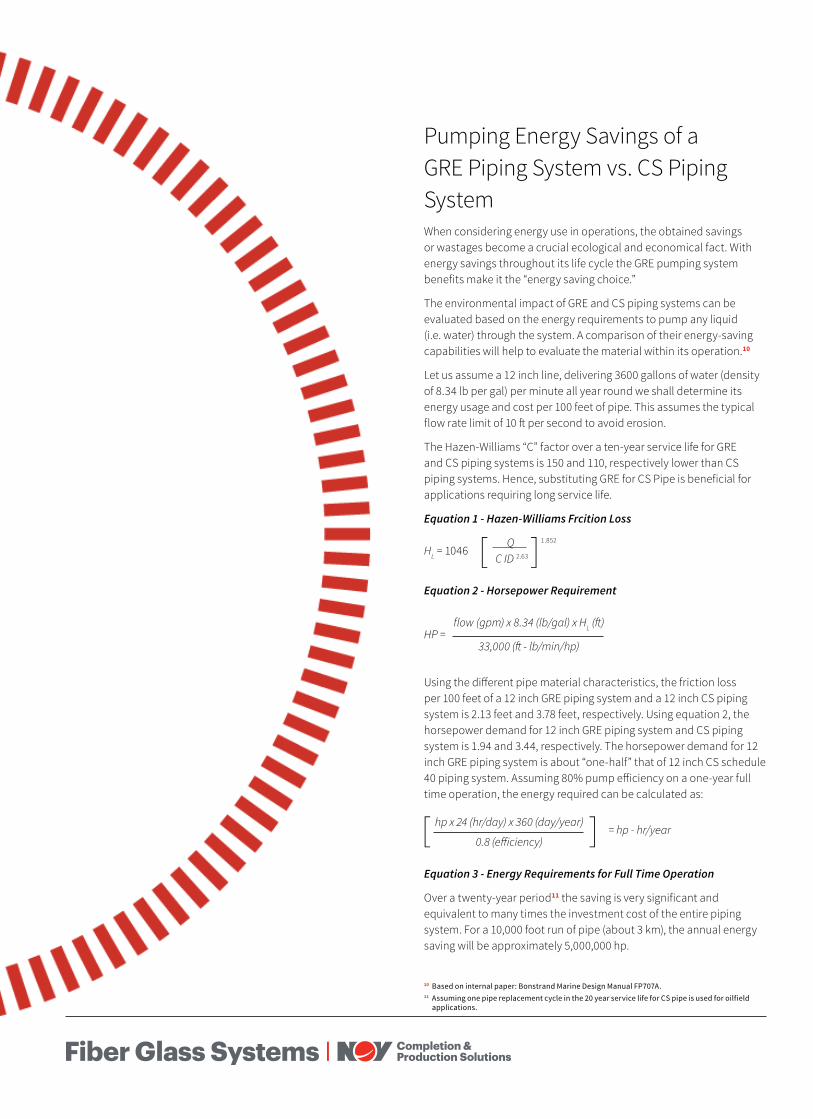
Pumping Energy Savings of aGRE Piping System vs. CS PipingSystemWhen considering energy use in operations, the obtained savings or wastages become a crucial ecological and economical fact. With energy savings throughout its life cycle the GRE pumping system benefits make it the “energy saving choice.”
The environmental impact of GRE and CS piping systems can be evaluated based on the energy requirements to pump any liquid (i.e. water) through the system. A comparison of their energy-saving capabilities will help to evaluate the material within its operation.10
Let us assume a 12 inch line, delivering 3600 gallons of water (density of 8.34 lb per gal) per minute all year round we shall determine its energy usage and cost per 100 feet of pipe. This assumes the typical flow rate limit of 10 ft per second to avoid erosion.
The Hazen-Williams “C” factor over a ten-year service life for GRE and CS piping systems is 150 and 110, respectively lower than CS piping systems. Hence, substituting GRE for CS Pipe is beneficial for applications requiring long service life.
Equation 1 - Hazen-Williams Frcition Loss
HL = 1046 [ Q C ID 2.63]1.852
Equation 2 - Horsepower Requirement
HP =flow (gpm) x 8.34 (lb/gal) x HL (ft)
33,000 (ft - lb/min/hp)
Using the different pipe material characteristics, the friction loss per 100 feet of a 12 inch GRE piping system and a 12 inch CS piping system is 2.13 feet and 3.78 feet, respectively. Using equation 2, the horsepower demand for 12 inch GRE piping system and CS piping system is 1.94 and 3.44, respectively. The horsepower demand for 12 inch GRE piping system is about “one-half” that of 12 inch CS schedule 40 piping system. Assuming 80% pump efficiency on a one-year full time operation, the energy required can be calculated as:
[ ]hp x 24 (hr/day) x 360 (day/year)
0.8 (efficiency)= hp - hr/year
Equation 3 - Energy Requirements for Full Time Operation
Over a twenty-year period11 the saving is very significant and equivalent to many times the investment cost of the entire piping system. For a 10,000 foot run of pipe (about 3 km), the annual energy saving will be approximately 5,000,000 hp.

[email protected] nov.com/fgs
GRE (Pipe)
Length 11.89
Weight (kg) 213
Carbon (%) 22%
Carbon/Pipe 47 (kg)
Beech (Hardwood Tree)
Height 35
dbh1(cm) 50
Weight (kg) 1900
Carbon (%) 50%
Carbon/Tree 950 (kg)
Pipe / Tree
20
12 http://svc237.bne113v.server-web.com.13 Source: Dr. Kaendler, FVA Freiburg.14 The term “Sink” is commonly used to describe the carbon taken from the atmosphere by plants
(oceans, soils, fossil fuels) and stored in living and dead organic matter above and below ground. This process is part of the carbon cycle and is known as sequestration. Source: http://svc237.bne113v.serverweb.com/crc/ecarbon/faqs.htm.
15 It should be noted that GRE Fiberglass pipes are free from corrosion and they do not release CO2 as trees do when decomposing.
1 Diameter breast height taken at 1.3 m.
Table 4Carbon content of GRE vs. tree
Carbon Sink EffectCarbon sink is a repository of organic carbon in the environment. The increase in anthropogenic carbon, caused by the higher demand of fossil energy, is so extensive that the natural “carbon cycle” becomes imbalanced. The terrestrial ecosystem (i.e. forests, oceans, soils), known as the natural carbon repository, stores carbon instead of allowing it to be present in the atmosphere as a green house gas, CO2.
In the natural ecological carbon-cycle, trees are a means to help reduce atmospheric carbon by removing it from the atmosphere and storing the carbon in its tissue.12 Despite numerous parameters (i.e. species, tree dimension, age, location) the carbon content of a tree can be presumed to be 50% of its dry substance (not including roots).13 This sequestration gives trees a status of “carbon sink”.14
With its specific composition of material, GRE piping systems are made of 70% glass and 30% resin. Because resin is made from carbon, only 74% of resin is made from carbon content (by mole weight). This means GRE piping systems contain approximately 22% (30% times 74%) carbon content. Hence, GRE piping systems allow us to return carbon into the ground when used to nullify the carbon effect by storing the carbon in the finished product during its service life.
On the other hand, CS pipes only add more carbon to the atmosphere when oil is burned to make steel. Since pipes are essential needs in an industrial society, it is best to have a carbon neutral product than a carbon positive one. “In short, the GRE piping systems function is partly like a tree in the context of carbon storage.” Thus making GRE piping systems a candidate material to meet “carbon sink” function.
Although, this does not make GRE piping systems production a technical sequestration method because trees continue to convert atmosphere carbon to carbon in the tree body, GRE does lock up the carbon and prevents it from entering the atmosphere. If the fossil fuel related emission through the pipe production were 100 kg CO2-eq
it would mean that a GRE piping systems reduces its own emission by almost 50 % (carbon content of 47 kg per pipe). “When producing GRE piping systems, carbon remains stored in the Table 4 Carbon Content of GRE vs. Tree resulting value-added product.” GRE causes carbon emission but provides storage of carbon due to its material properties.15
GRE Piping Systems - The Greener Choice

GRE Piping Systems - The Greener Choice

[email protected] nov.com/fgs
ConclusionAs mentioned earlier, burning fossil fuel is the main cause of climate change. But, in the wake of industrialization, the use of fossil fuel has become a necessity especially when there is not a viable alternative. While popular belief in greener manufacturing means finding more energy-efficient ways to produce goods, many people are unaware of the fact that energy efficiency also needs to be considered in the use of the product. A good example would be the production of a refrigerator. One refrigerator might be “greener” to produce, but it may require more energy to run on a day-to-day basis. The inefficiencies from the use of the refrigerator may actually cause more harm to the environment. Likewise, when we talk about pipe manufacturing there is a distinct difference between energy-efficient pipes made fromGRE and not energy-efficient pipes made from steel.
This paper highlighted three advantages of GRE piping systems over steel piping systems with regards tolimiting “Climate Change”. They were:
1. Energy use in manufacturingOn a per pipe length basis, GRE piping systems requires 80% less energy to produce than that made from new steel, and 50% less energy to make than that of recycled steel.
2. Energy use in operationGRE can produce 90% energy savings throughout a twenty-year life cycle. This isdue to a smoother inner pipe surface which halves the pumping energy required ascompared to carbon steel pipe.
3. Carbon Sink EffectThe carbon-stored in GRE piping systems prevents the same carbon from entering theatmosphere and causing the green house effect.
Interestingly, one might think that an industrial man-made product produced from a naturalmaterial like iron should be more eco-friendly. On the contrary, it is a proven fact that steelpiping systems create more harm to the earth and have a shorter life span than GRE piping systems. Hence, GRE is an effective alternative to reduce the environmental impact of industrialization.
GRE Piping Systems - The Greener Choice

GRE GJ/t
Material Glass Fiber 18.4
Resin/Epoxy 6.9
CSP (World Best Practice Energy Intensity) GJ/t GJ/t
Material Blast Furnace-BOF2
Scrap-Electric Arc Furnace3
Material Preparation Sintering 2.2
Coking 1.1
Iron making Blast Furnace 12.4
Steel making Basic Oxygen Furnace -0.3 5.5
Refining 0.4
Casting4 and Rolling Continuous Casting 0.1 0.1
Hot Rolling (-Bars)5 2.4 2.4
Sub-Total 18.3 8
Cold Rolling and Finishing Cold Rolling6 0.9
Finishing7 1.4
Total (Continuous Casting) 20.6 8
Casting and Rolling(Alternative)8
Replace C-Casting, Hot Rolling, Cold Rolling and Finishing with Thin Slab Casting
0.5 0.5
Total (Thin Slab Casting) 16.3 6
Source: Steel data are based on Berkeley Lab (World Best Practice Energy Intensity Values for Selected Industrial Sectors).1 Primary Energy is defined as the energy used at the production facility as well as the energy
used to produce the electricity consumed at the facility. Energy required to extract and refine raw materials are not included.
2 In the Blast Furnace-BOF Route the reduction of iron is the largest energy-consuming process in the production of primary steel. The BOF process needs no net input of energy and can even be a net energy exporter in the form of BOF-gas and steam. In the best practice BOF gas and sensible heat are recovered.
3 In the EAF- steelmaking the coke production, pig iron production, and steel production steps are omitted, resulting in much lower energy consumption. The best practice energy consumption values for EAF is state-ofthe- art facility using 100% high quality scrap.
Table 3Primary Energy Requirements for Supporting Material
4 Casting can be either continuous casting or thin slab casting. Thin slab casting (as alternative) is a more advanced casting technique which reduces the need for hot rolling because products are initially cast closer to their final shape using a simplified rolling stand positioned behind the caster’s reheating tunnel furnace, eliminating the need for a separate hot rolling mill.
5 Hot rolling and Total data are based on rolling- bars (others are strip and wire).6 Hot rolled sheets may be further reduced in thickness by cold rolling, thus cold rolling energy
intensity is included in the total sum.7 Finishing as the final production step, include different processes such as annealing and surface
treatment. Continuous annealing is considered state-of-the-art, and therefore assumed to be best practice technology.
8 Alternative is provided for thin slab (near net shape) casting.
56.0
56.5
57.0
57.5
58.0
1880 1980 1900 1910 1920 1930 1940 1950 1960 1970 1980 1990 2000 2010
Appendix1. Earth Greenhouse Effect
2. Global mean temperature over land and ocean
Tem
p (F
)
Year
Global Avg. Temp1880-2007
AVG TEMP (F)Linear (AVG TEMP (F))
Data source: NOAA
r2=0.67
Incomingradiationenergy
Reflected energy Outgoing radiation energy
Energy trapped by greenhouse gases

[email protected] nov.com/fgs
GRE 2420 GJ/t GJ/Pipe
Raw Material Energy 15 3.2
Glass (70%) 12.9 2.7
Resin (30%) 2.1 0.4
Hardener2 - -
Total Power Consumption 5.1 1.1
Electricity (minus 10% secondary energy) 1 0.2
Gas 4.1 0.9
Total Energy Consumption 20 4.3
Table 4Primary Energy Requirements and Specifications for GRE vs. Carbon Steel Pipe Production
CSP Schedule 40 GJ/t GJ/Pipe GJ/t GJ/Pipe
Iron Ore to Steel Continuous Casting Thin Slab Casting
Blast Furnance - BOF Route 20.6 19.5 16.3 15.4
100% Scrap - Electric Arc Furnace 8.0 7.6 6.0 5.7
Steel Pipe Forming Energy*8 3.8 3.6 3.6 3.6
Hot Rolling 2.4 2.3 2.4 2.3
Mechanical Energy - - - -
Cold Rolling 0.9 0.9 0.9 0.9
Finishing 1.4 1.3 1.4 1.9
Total (Blast Furnace - BOF Route)1 24.4 23.1 20.1 19.0
Total (Electric - Arc - Furnace Route)1 11.8 11.2 9.8 9.3
* Based on hot rolling
GRE CS Pipe5
Pipe Size (inch) 12 12Pressure Rating (bar) 20 20O.D. (mm) 328.6 323.9I.D. (mm) 313.9 303.2Wall Thickness (mm) 6.8 10.3Length (m) 11.89 11.89Weight (kg)4 213.3 946.9Weight (kg/m) 17.9 79.6
Source: For GRE based on own calculations. For Carbon Steel the data are based on Berkeley Lab.1 Total number for CS Pipe is based on hot rolling bar and Pipe Forming.2 The energy input data for GRE hardener are not included due to the small contribution.3 Waste is assumed to be between 8 & 12 % for fiberglass pipe and zero for CS Pipe due to
recycling.4 GRE pipe weight is based on latest bill of material (BOM) including scrap.5 CS Pipe specifications given by www.engineertoolbox.com/steel-pipes-dimensions-d_43html
and www.tubenet.org.uk/psched.html.
7 The energy data to roll steel are based on hot rolling process.8 Pipe forming energy is assumed to be the same as for steel.9 The reasonable upper bound energy consumption based on glass composition and melting
(1.84x10^7kj/ton) is given by Redfern Tanya ([email protected]) and confirmed by Paul Westbrok from PPG.
10 Data for energy consumption based on Resin are provided by Stephen Hoyles and Allan Quinn from DOW.
GRE Piping Systems - The Greener Choice
5. Head Loss Calculation
HL = 1046 [ Q C ID 2.63]1.852
Where:HL = head loss (feet per 100 feet of pipe)Q = discharge (gallons per minute), (U.S. gallon)C = Hazen-Williams FactorID = inside diameter of pipe (inches)Hp = Factor is (33000 HP = 1 ft-lbs/in)
Horsepower Requirements for Pipe Operation
HP =flow (gpm) x 8.34 (lb/gal) x HL (ft)
33,000 (ft - lb/min/hp)
Equation 1 Horsepower Requirement
5000 gpm x 8.34 lb of water/gal x 3.33 ft
33,000 ft-lb/mm/hp
For GRE
= 4.21 hp
5000 gpm x 8.34 lb of water/gal x 6.98 ft
33,000 ft-lb/mm/hp
For CSP
= 8.82 hp
Energy Requirements for Full Time Operation
[ ]hp x 24 (hr/day) x 360 (day/year)
0.8 (efficiency)= hp - hr/year

[email protected] nov.com/fgs
Fiber Glass Systems17115 San Pedro Ave, Ste 200 San Antonio, Texas 78232 USA
National Oilwell Varco has produced this brochure for general information only, and it is not intended for design purposes. Although every effort has been made to maintain the accuracy and reliability of its contents, National Oilwell Varco in no way assumes responsibility for liability for any loss, damage or injury resulting from the use of information and data herein. All applications for the material described are at the user’s risk and are the user’s responsibility.
© 2016 National Oilwell Varco | All Rights Reserved
GEN1080ENG August 2016


![greatbarringtonpolice.com · 2021. 1. 12. · Initiated - PATROL CHECK [GRE] MONUMENT VALLEY RD Radio [ GRE Phone [GRE] Phone [GRE] Phone CHOU] - AMB TRANSPORT LEWIS AVE - MOTOR VEHICLE](https://static.fdocuments.in/doc/165x107/60a850ebeab7de55b5543264/g-2021-1-12-initiated-patrol-check-gre-monument-valley-rd-radio-gre-phone.jpg)