Grazing Yak Solar Project El Paso County, Colorado...SOUND LEVEL ASSESSMENT REPORT Grazing Yak Solar...
24
SOUND LEVEL ASSESSMENT REPORT Grazing Yak Solar Project El Paso County, Colorado Prepared for: Grazing Yak Solar, LLC 700 Universe Boulevard Juno Beach, Florida 33408 Prepared by: Epsilon Associates, Inc. 3 Mill & Main Place, Suite 250 Maynard, MA 01754 October 19, 2018
Transcript of Grazing Yak Solar Project El Paso County, Colorado...SOUND LEVEL ASSESSMENT REPORT Grazing Yak Solar...
SOUND LEVEL ASSESSMENT REPORT
Grazing Yak Solar Project El Paso County, Colorado
Prepared for:
Grazing Yak Solar, LLC 700 Universe Boulevard
Juno Beach, Florida 33408
Prepared by:
Epsilon Associates, Inc. 3 Mill & Main Place, Suite 250
Maynard, MA 01754
October 19, 2018
5268 Grazing_Yak-SoundReport_20181019.docx i Table of Contents Epsilon Associates, Inc.
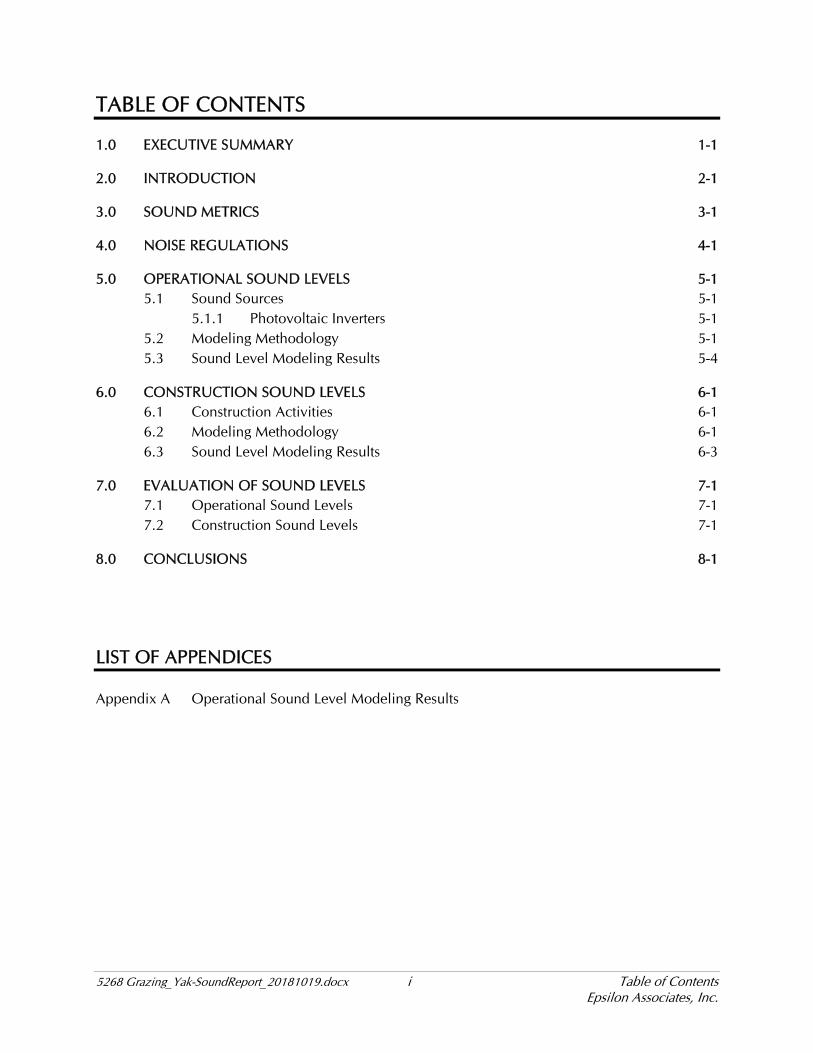
TABLE OF CONTENTS
1.0 EXECUTIVE SUMMARY 1-1
2.0 INTRODUCTION 2-1
3.0 SOUND METRICS 3-1
4.0 NOISE REGULATIONS 4-1
5.0 OPERATIONAL SOUND LEVELS 5-1 5.1 Sound Sources 5-1
5.1.1 Photovoltaic Inverters 5-1 5.2 Modeling Methodology 5-1 5.3 Sound Level Modeling Results 5-4
6.0 CONSTRUCTION SOUND LEVELS 6-1 6.1 Construction Activities 6-1 6.2 Modeling Methodology 6-1 6.3 Sound Level Modeling Results 6-3
7.0 EVALUATION OF SOUND LEVELS 7-1 7.1 Operational Sound Levels 7-1 7.2 Construction Sound Levels 7-1
8.0 CONCLUSIONS 8-1
LIST OF APPENDICES
Appendix A Operational Sound Level Modeling Results

5268 Grazing_Yak-SoundReport_20181019.docx ii Table of Contents Epsilon Associates, Inc.
LIST OF FIGURES
Figure 2-1 Aerial Locus 2-2 Figure 3-1 Common Indoor and Outdoor Sound Levels 3-3 Figure 5-1 Modeling Receptors 5-3 Figure 5-2 Operational Sound Level Modeling Results 5-5 Figure 6-1 Closest Receptors to Construction Activity 6-2
LIST OF TABLES
Table 6-1 Sound Level During Phase 1 (Site Grading) 6-3 Table 6-2 Sound Level During Phase 2 (Pile Driving) 6-3 Table 6-3 Sound Level During Phase 3 (Panel Erection) 6-4
5268 Grazing_Yak-SoundReport_20181019.docx 1-1 Executive Summary Epsilon Associates, Inc.
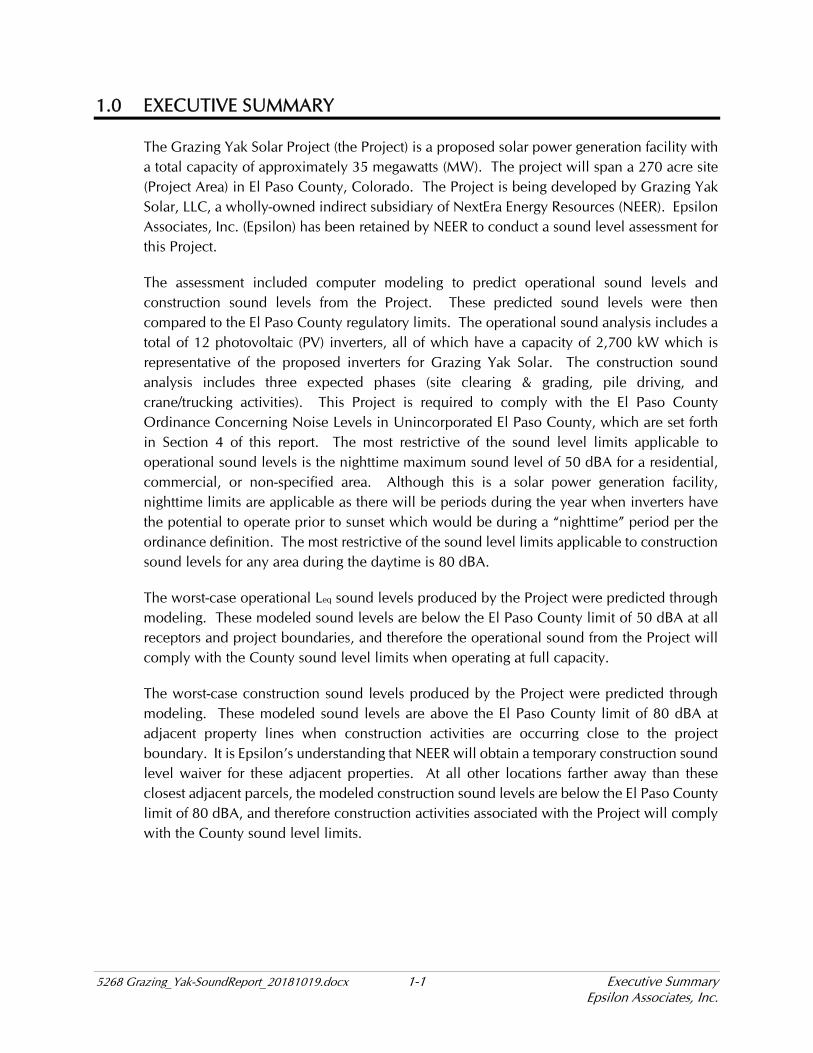
1.0 EXECUTIVE SUMMARY
The Grazing Yak Solar Project (the Project) is a proposed solar power generation facility with a total capacity of approximately 35 megawatts (MW). The project will span a 270 acre site (Project Area) in El Paso County, Colorado. The Project is being developed by Grazing Yak Solar, LLC, a wholly-owned indirect subsidiary of NextEra Energy Resources (NEER). Epsilon Associates, Inc. (Epsilon) has been retained by NEER to conduct a sound level assessment for this Project.
The assessment included computer modeling to predict operational sound levels and construction sound levels from the Project. These predicted sound levels were then compared to the El Paso County regulatory limits. The operational sound analysis includes a total of 12 photovoltaic (PV) inverters, all of which have a capacity of 2,700 kW which is representative of the proposed inverters for Grazing Yak Solar. The construction sound analysis includes three expected phases (site clearing & grading, pile driving, and crane/trucking activities). This Project is required to comply with the El Paso County Ordinance Concerning Noise Levels in Unincorporated El Paso County, which are set forth in Section 4 of this report. The most restrictive of the sound level limits applicable to operational sound levels is the nighttime maximum sound level of 50 dBA for a residential, commercial, or non-specified area. Although this is a solar power generation facility, nighttime limits are applicable as there will be periods during the year when inverters have the potential to operate prior to sunset which would be during a “nighttime” period per the ordinance definition. The most restrictive of the sound level limits applicable to construction sound levels for any area during the daytime is 80 dBA.
The worst-case operational Leq sound levels produced by the Project were predicted through modeling. These modeled sound levels are below the El Paso County limit of 50 dBA at all receptors and project boundaries, and therefore the operational sound from the Project will comply with the County sound level limits when operating at full capacity.
The worst-case construction sound levels produced by the Project were predicted through modeling. These modeled sound levels are above the El Paso County limit of 80 dBA at adjacent property lines when construction activities are occurring close to the project boundary. It is Epsilon’s understanding that NEER will obtain a temporary construction sound level waiver for these adjacent properties. At all other locations farther away than these closest adjacent parcels, the modeled construction sound levels are below the El Paso County limit of 80 dBA, and therefore construction activities associated with the Project will comply with the County sound level limits.

5268 Grazing_Yak-SoundReport_20181019.docx 2-1 Introduction Epsilon Associates, Inc.
2.0 INTRODUCTION
The proposed Project to be located in El Paso County, Colorado will consist of twelve (12) 2,700 kW PV inverters and a solar panel array on a parcel approximately 270 acres in size. This parcel is located within the Golden West Wind Energy Center. The Project will be tied into an existing collector substation several miles north of the proposed array, and therefore the substation was not included in this analysis. Figure 2-1 shows the locations of the 12 proposed inverters, the solar panel array, and the project boundary over aerial imagery in El Paso County.
Ground-mounted solar array PV inverters and transformers produce a humming sound during time periods when sunlight is shining onto the panels, when the array generates electricity. At night, or when there is no sunlight shining on the panels, the project equipment does not produce any operational sound.
This report presents the findings of a sound level modeling analysis for the Project. The operational sound of the PV inverters was modeled in Cadna/A using sound data from measurements of a similar PV inverter unit provided by NEER. The construction activities associated with the Project were modeled using the Federal Highway Administration’s (FHWA) Roadway Construction Noise Model (RCNM) using empirical data and standard sound levels of construction equipment. The results of this analysis are found within this report.
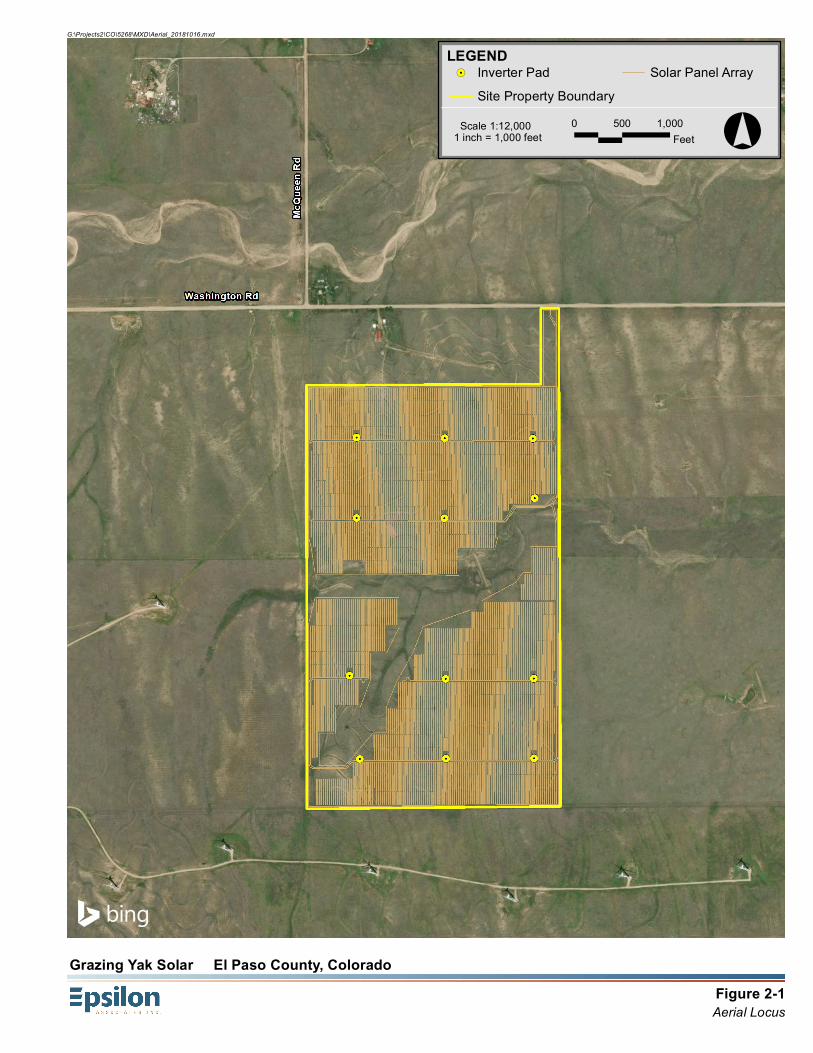
Figure 2-1Aerial Locus
Grazing Yak Solar El Paso County, Colorado
G:\Projects2\CO\5268\MXD\Aerial_20181016.mxd
LEGEND
°0 500 1,000Feet1 inch = 1,000 feet
Scale 1:12,000
!. Inverter PadSite Property Boundary
Solar Panel Array

5268 Grazing_Yak-SoundReport_20181019.docx 3-1 Sound Metrics Epsilon Associates, Inc.
3.0 SOUND METRICS
There are several ways in which sound levels are measured and quantified. All of them use the logarithmic decibel (dB) scale. The following information defines the sound level terminology used in this analysis.
The decibel scale is logarithmic to accommodate the wide range of sound intensities found in the environment. A property of the decibel scale is that the sound pressure levels of two or more separate sounds are not directly additive. For example, if a sound of 50 dB is added to another sound of 50 dB, the total is only a 3-decibel increase (53 dB), which is equal to doubling in sound energy but not equal to a doubling in decibel quantity (100 dB). Thus, every 3-dB change in sound level represents a doubling or halving of sound energy. Relative to this characteristic, a change in sound levels of less than 3 dB is imperceptible to the human ear.
Another mathematical property of decibels is that if one source of sound is at least 10 dB louder than another source, then the total sound level is simply the sound level of the higher-level source. For example, a sound source at 60 dB plus another sound source at 47 dB is equal to 60 dB.
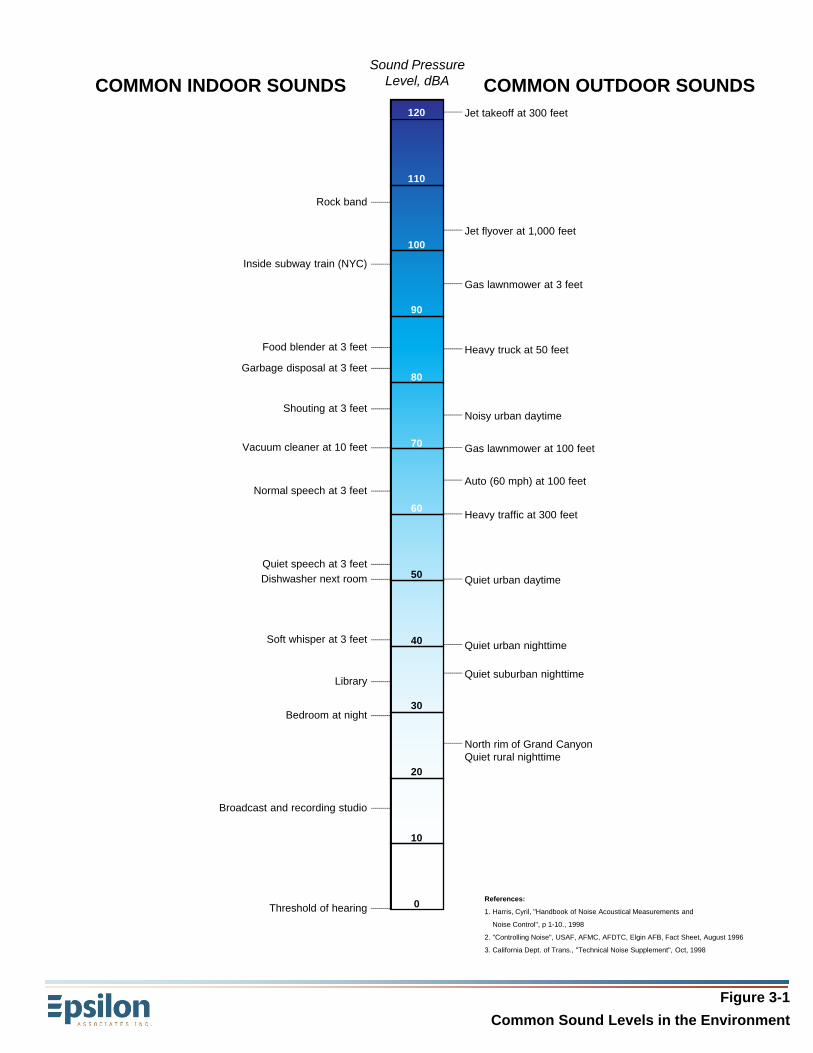
A sound level meter (SLM) that is used to measure sound is a standardized instrument.1 It contains “weighting networks” (e.g., A-, C-, Z-weightings) to adjust the frequency response of the instrument. Frequencies, reported in Hertz (Hz), are detailed characterizations of sounds, often addressed in musical terms as “pitch” or “tone”. The most commonly used weighting network is the A-weighting because it most closely approximates how the human ear responds to sound at various frequencies. The A-weighting network is the accepted scale used for community sound level measurements; therefore, sounds are frequently reported as detected with a sound level meter using this weighting. A-weighted sound levels emphasize middle frequency sounds (i.e., middle pitched – around 1,000 Hz), and de-emphasize low and high frequency sounds. These sound levels are reported in decibels designated as “dBA”. Z-weighted sound levels are measured sound levels without any weighting curve and are otherwise referred to as “unweighted”. Sound pressure levels for some common indoor and outdoor environments are shown in Figure 3-1.
Because the sounds in our environment vary with time they cannot simply be described with a single number. Two methods are used for describing variable sounds. These are exceedance levels and the equivalent level, both of which are derived from a large number of moment-to-moment A-weighted sound level measurements. Exceedance levels are values
1 American National Standard Specification for Sound Level Meters, ANSI S1.4-1983 (R2006), published by the Standards Secretariat of the Acoustical Society of America, Melville, NY.

5268 Grazing_Yak-SoundReport_20181019.docx 3-2 Sound Metrics Epsilon Associates, Inc.
from the cumulative amplitude distribution of all of the sound levels observed during a measurement period. Exceedance levels are designated Ln, where n can have a value between 0 and 100 in terms of percentage. Several sound level metrics that are reported in community sound monitoring are described below.
L10 is the sound level exceeded only 10 percent of the time. It is close to the maximum level observed during the measurement period. The L10 is sometimes called the intrusive sound level because it is caused by occasional louder sounds like those from passing motor vehicles.
L50 is the sound level exceeded 50 percent of the time. It is the median level observed during the measurement period. The L50 is affected by occasional louder sounds like those from passing motor vehicles; however, it is often found comparable to the equivalent sound level under relatively steady sound level conditions.
L90 is the sound level exceeded 90 percent of the time during the measurement period. The L90 is close to the lowest sound level observed. It is essentially the same as the residual sound level, which is the sound level observed when there are no obvious nearby intermittent sound sources.
Leq, the equivalent level, is the level of a hypothetical steady sound that would have the same energy (i.e., the same time-averaged mean square sound pressure) as the actual fluctuating sound observed. The equivalent level is designated Leq and is typically A-weighted. The equivalent level represents the time average of the fluctuating sound pressure, but because sound is represented on a logarithmic scale and the averaging is done with linear mean square sound pressure values, the Leq is mostly determined by loud sounds if there are fluctuating sound levels.
Lmax, the maximum level, is the highest instantaneous sound pressure level (root mean squared) of a given time period. The Lmax is typically A-weighted and can be based on either a fast or slow time constant.
120
110
100
90
80
70
60
50
40
30
20
10
0
Figure 3-1
Common Sound Levels in the Environment
References:
1. Harris, Cyril, "Handbook of Noise Acoustical Measurements and
Noise Control", p 1-10., 1998
2. "Controlling Noise", USAF, AFMC, AFDTC, Elgin AFB, Fact Sheet, August 1996
3. California Dept. of Trans., "Technical Noise Supplement", Oct, 1998
COMMON INDOOR SOUNDS COMMON OUTDOOR SOUNDSSound Pressure
Level, dBA
Jet takeoff at 300 feet
Jet flyover at 1,000 feet
Gas lawnmower at 3 feet
Heavy truck at 50 feet
Noisy urban daytime
Gas lawnmower at 100 feet
Auto (60 mph) at 100 feet
Heavy traffic at 300 feet
Quiet urban daytime
Quiet urban nighttime
Quiet suburban nighttime
North rim of Grand CanyonQuiet rural nighttime
Rock band
Inside subway train (NYC)
Food blender at 3 feet
Garbage disposal at 3 feet
Shouting at 3 feet
Vacuum cleaner at 10 feet
Normal speech at 3 feet
Quiet speech at 3 feet
Dishwasher next room
Soft whisper at 3 feet
Library
Bedroom at night
Broadcast and recording studio
Threshold of hearing

5268 Grazing_Yak-SoundReport_20181019.docx 4-1 Noise Regulations Epsilon Associates, Inc.
4.0 NOISE REGULATIONS
The proposed Grazing Yak Solar Project within El Paso County, CO is required to comply with Section 5 of the Ordinance Concerning Noise Levels in Unincorporated El Paso County (Ordinance NO. 02-1) which states:
Section 5. Maximum Permissible Noise Levels:
(a) Sound levels shall be measured in dB(A) as provided for in Section 6 of this Ordinance
(b) During the time periods indicated below, and on the types of property indicated below, the sound levels permitted by this Ordinance shall be observed:
Land Uses
Maximum Noise [dB(A)] 7:00 a.m. – 7:00 p.m.
Maximum Noise [dB(A)] 7:00 p.m. – 7:00 a.m.
Residential property or
Commercial area 55 dB(A) 50 dB(A)
Industrial area or
Construction Activities
80 dB(A)
75 dB(A)
Non-specified areas
55 dB(A)
50 dB(A)
(c) In the hours between 7:00 a.m. and 7:00 p.m., the noise levels permitted by this section may be exceeded by ten (10) dBA for a period not to exceed fifteen (15) minutes in any one (1) hour period.
Therefore, operational sound levels at the closest property lines were conservatively evaluated against the most stringent 50 dBA limit, and daytime construction sound levels were evaluated against the 80 dBA limit.

5268 Grazing_Yak-SoundReport_20181019.docx 5-1 Operational Sound Levels Epsilon Associates, Inc.
5.0 OPERATIONAL SOUND LEVELS
5.1 Sound Sources
5.1.1 Photovoltaic Inverters
The operational sound level analysis for the Project conservatively includes 12 photovoltaic (PV) inverters operating at full load. All 12 of the units have a capacity of 2,700 kW and will be mounted on individual concrete pads. The pads will be approximately four feet in height, and the PV units will be approximately six feet in height. Measured sound levels of a similar sized PV inverter from a technical report2 were provided by NEER. The report presented measured broadband sound pressure levels at distances close to an inverter unit operating at full load. The data from this report were used to calculate a sound power level which was then entered into the acoustic model. The resulting broadband sound power level of the unit used for acoustic modeling was 79 dBA.
5.2 Modeling Methodology
The sound impacts associated with the proposed solar project were predicted using the Cadna/A sound level calculation software developed by DataKustik GmbH. This software uses the ISO 9613-2 international standard for sound propagation (Acoustics - Attenuation of sound during propagation outdoors - Part 2: General method of calculation). The benefits of this software are a more refined set of computations due to the inclusion of topography, ground attenuation, multiple building reflections (if applicable), drop-off with distance, and atmospheric absorption. The Cadna/A software allows for calculation of sound from multiple sources as well as computation of diffraction.
Inputs and significant parameters employed in the model are described below:
Project Layout: An AutoCAD plan of the Project layout was provided by NEER via email on September 21, 2018. The 12 proposed PV inverters were input into the model. The proposed PV inverters, panel locations, and project boundary are identified in Figure 5-1.
Modeling Receptor Locations: A dataset containing receptors within 1-mile of the solar array was provided by NEER on September 21, 2018. Included in the dataset was the occupancy status for each receptor. All of the 80 provided receptors were input into the Cadna/A model. These modeling receptors were modeled as discrete
2 Two Creeks Solar Project Appendix A. Acoustic Noise Specifications – Inverters. August 16, 2018.

5268 Grazing_Yak-SoundReport_20181019.docx 5-2 Operational Sound Levels Epsilon Associates, Inc.
points at a height of 1.5 meters above ground level to mimic the ears of a typical standing person. All modeling receptors are identified in Figure 5-1 and are distinguished as either occupied or unoccupied.
A modeling grid with 10-meter spacing was calculated for the entire Project Area. The grid was modeled at a height of 1.5 meters above ground level (AGL) for consistency with the discrete modeling points. This modeling grid allowed for the creation of sound level isolines.
Terrain Elevation: Elevation contours for the modeling domain were directly imported into Cadna/A which allowed for consideration of terrain shielding where appropriate. The terrain height contour elevations for the modeling domain were generated from elevation information derived from the National Elevation Dataset (NED) developed by the U.S. Geological Survey.
Source Sound Levels: Maximum broadband sound power levels for the PV inverters provided in a technical report for a similar unit was input to the model. These sound levels represent “worst-case” operational sound level emissions.
Meteorological Conditions: A temperature of 10ºC (50ºF) and a relative humidity of 70% was assumed in the model.
Ground Attenuation: Spectral ground absorption was calculated using a G-factor of 0 for the inverter pad areas which corresponds to a hard ground surface (concrete). All other areas of the modeling domain used a G-factor of 0.5 which corresponds to “mixed ground” consisting of both hard and porous ground cover. This method yields more conservative results (i.e., higher sound levels) as the vast majority of the area is actually agricultural.
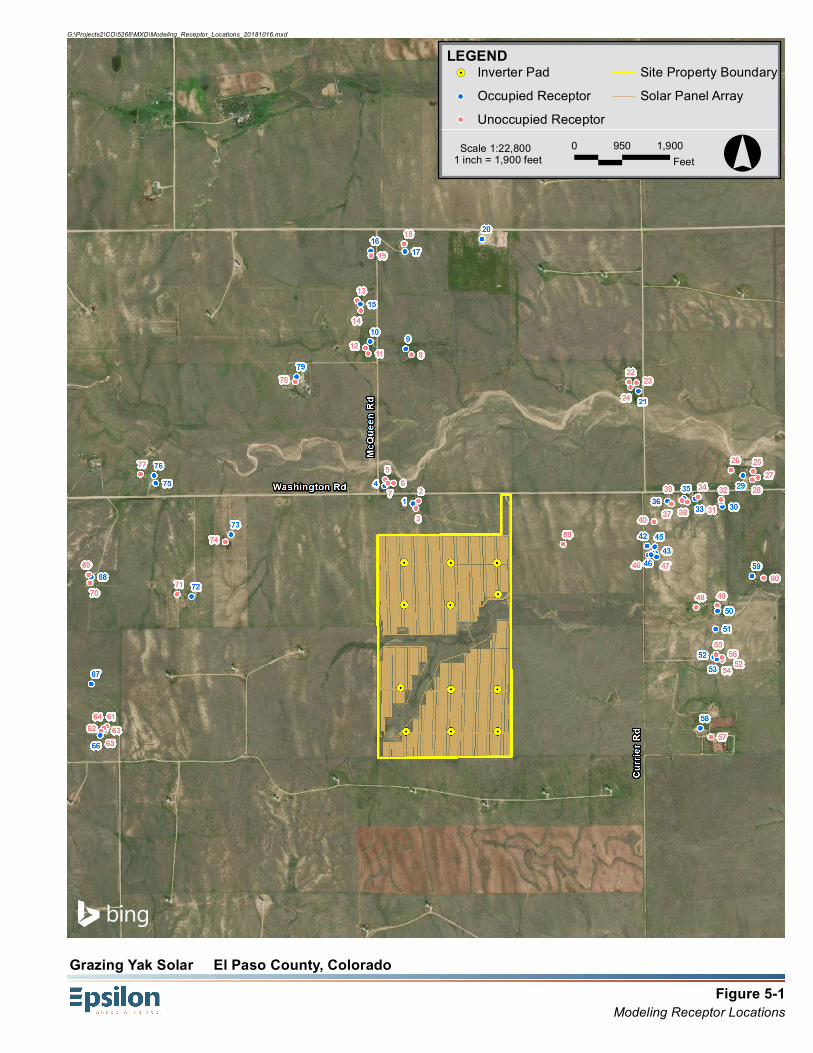
Figure 5-1Modeling Receptor Locations
Grazing Yak Solar El Paso County, Colorado
G:\Projects2\CO\5268\MXD\Modeling_Receptor_Locations_20181016.mxd
LEGEND
°0 950 1,900Feet1 inch = 1,900 feet
Scale 1:22,800
!. Inverter PadOccupied ReceptorUnoccupied Receptor
Site Property BoundarySolar Panel Array
5268 Grazing_Yak-SoundReport_20181019.docx 5-4 Operational Sound Levels Epsilon Associates, Inc.
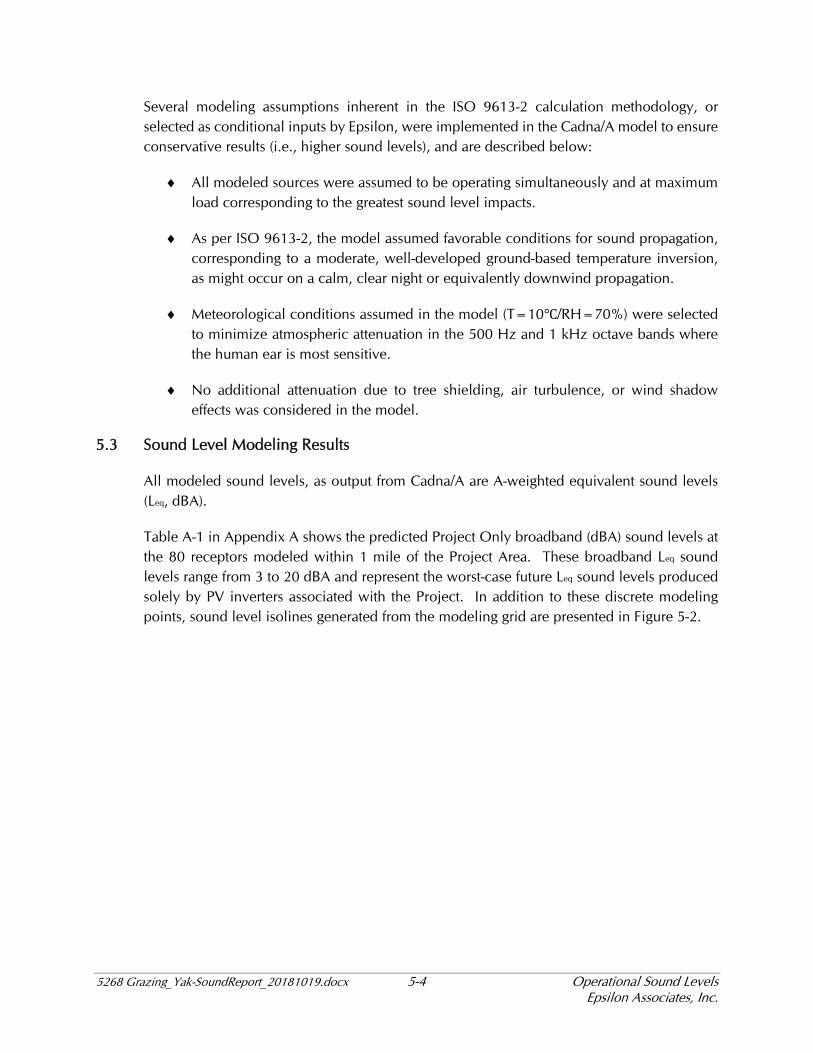
Several modeling assumptions inherent in the ISO 9613-2 calculation methodology, or selected as conditional inputs by Epsilon, were implemented in the Cadna/A model to ensure conservative results (i.e., higher sound levels), and are described below:
All modeled sources were assumed to be operating simultaneously and at maximum load corresponding to the greatest sound level impacts.
As per ISO 9613-2, the model assumed favorable conditions for sound propagation, corresponding to a moderate, well-developed ground-based temperature inversion, as might occur on a calm, clear night or equivalently downwind propagation.
Meteorological conditions assumed in the model (T=10 /RH=70%) were selected to minimize atmospheric attenuation in the 500 Hz and 1 kHz octave bands where the human ear is most sensitive.
No additional attenuation due to tree shielding, air turbulence, or wind shadow effects was considered in the model.
5.3 Sound Level Modeling Results
All modeled sound levels, as output from Cadna/A are A-weighted equivalent sound levels (Leq, dBA).
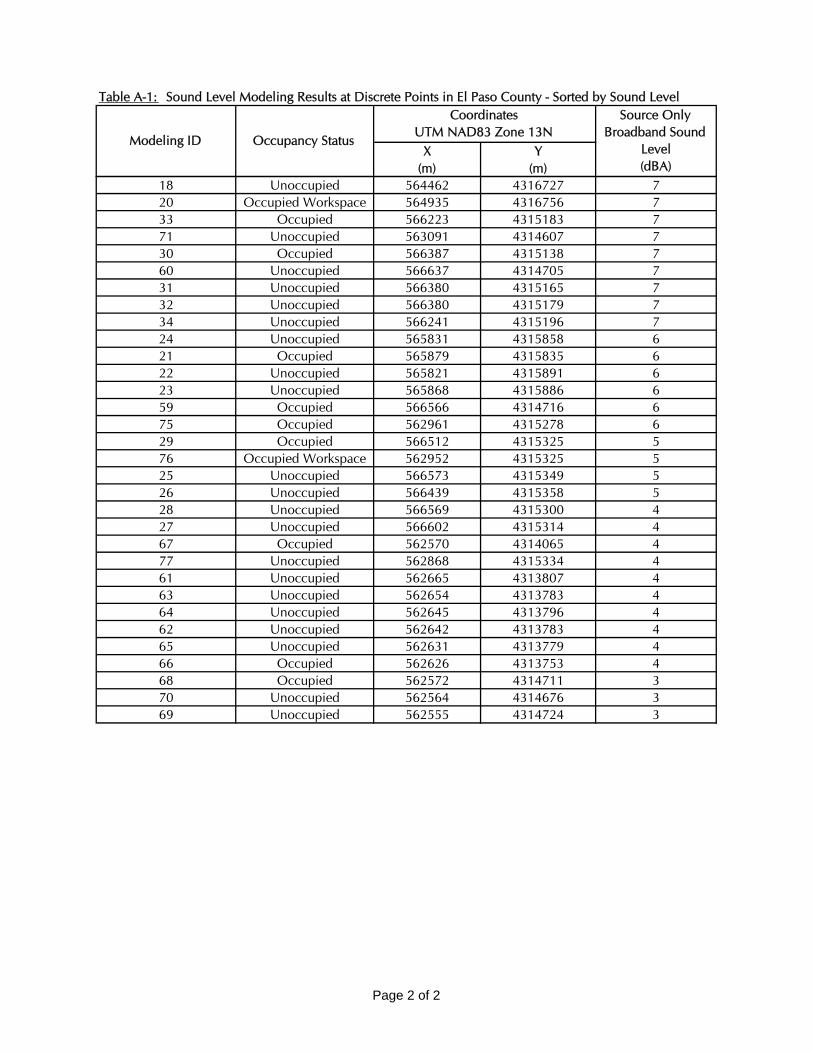
Table A-1 in Appendix A shows the predicted Project Only broadband (dBA) sound levels at the 80 receptors modeled within 1 mile of the Project Area. These broadband Leq sound levels range from 3 to 20 dBA and represent the worst-case future Leq sound levels produced solely by PV inverters associated with the Project. In addition to these discrete modeling points, sound level isolines generated from the modeling grid are presented in Figure 5-2.
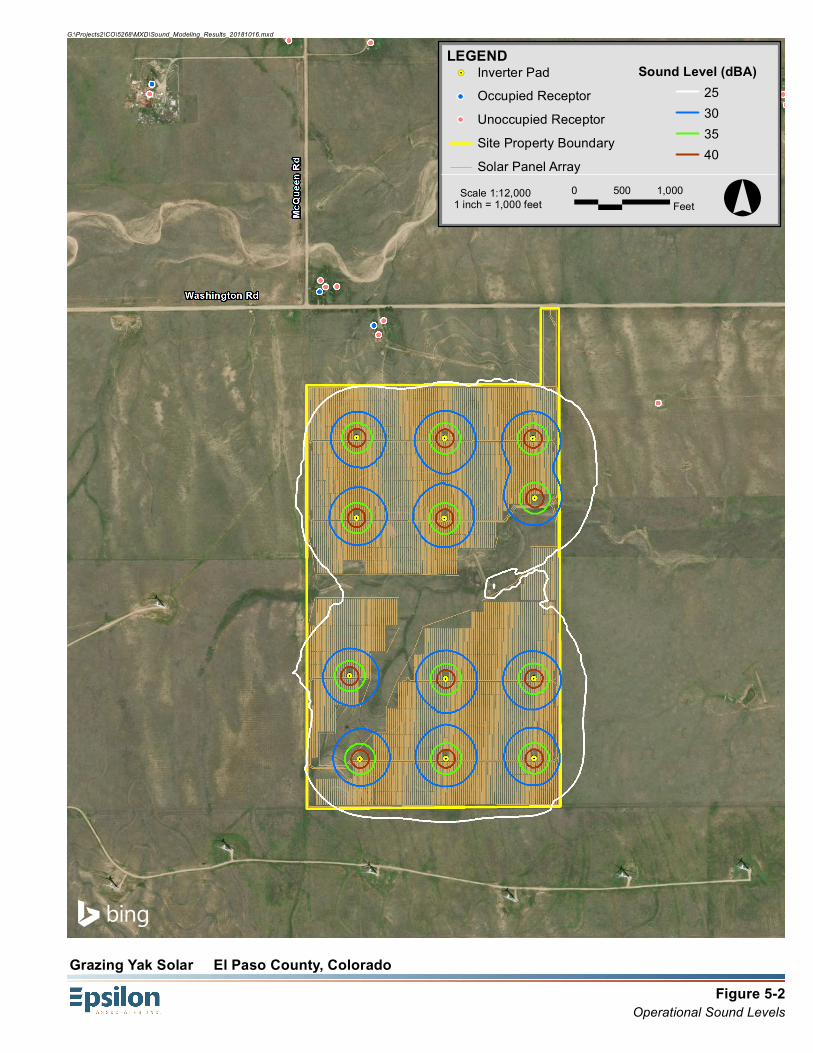
Figure 5-2Operational Sound Levels
Grazing Yak Solar El Paso County, Colorado
G:\Projects2\CO\5268\MXD\Sound_Modeling_Results_20181016.mxd
LEGEND
°0 500 1,000Feet1 inch = 1,000 feet
Scale 1:12,000
!. Inverter PadOccupied ReceptorUnoccupied ReceptorSite Property BoundarySolar Panel Array
25303540
Sound Level (dBA)

5268 Grazing_Yak-SoundReport_20181019.docx 6-1 Construction Sound Levels Epsilon Associates, Inc.
6.0 CONSTRUCTION SOUND LEVELS
6.1 Construction Activities
Construction activities related to the installation of the solar array will generally consist of three principal phases, including:
Site clearing and grading
Pile driving, and
Erection (solar panel array installation)
The primary noise-producing equipment for the first phase of construction includes a backhoe, bulldozer, and dump truck. The primary equipment for the second phase is an impact pile driver. During the third phase, construction equipment will include operation of a crane and a flatbed truck. Construction of the Project is expected to last approximately five months.
6.2 Modeling Methodology
The sound impacts associated with construction of the Project were predicted using the Roadway Construction Noise Model3 (RCNM) sound level calculation software developed by the Federal Highway Administration (FHWA). This software predicts noise from construction operations based on a compilation of empirical data and the application of acoustical propagation formulas.
For each phase of construction, sound levels produced by the equipment group associated with that phase were predicted assuming the equipment was located at two different locations: Area 1 and Area 2. Area 1 represents a location 25 feet from the site property line, which is the shortest distance to an adjacent parcel that construction could occur. Area 2 is a second representative location where construction activity is expected to occur and is conservatively located at the closest inverter pad to a structure. Sound levels from each phase of construction were predicted at five different distances representing the closest property lines and structures to Area 1 and Area 2. The distances evaluated for construction noise impacts are: 1) 25 feet, 2) 850 feet, 3) 1,100 feet, 4) 1,190 feet, and 5) 1,440 feet. Figure 6-1 shows the assumed locations of construction activity and distances between those areas and the closest receptors.
3 Federal Highway Administration’s Roadway Construction Noise Model (RCNM) Software Version 1.1, 12/08/2008. US Department of Transportation Research and Innovative Technology Administration.

Figure 6-1Closest Receptors to Construction Activity
Grazing Yak Solar El Paso County, Colorado
G:\Projects2\CO\5268\MXD\Receptors_to_Construction_Activity_20181018.mxd
LEGEND
°0 500 1,000Feet1 inch = 1,000 feet
Scale 1:12,000
!. Receptor!. Inverter Pad
Site Property BoundarySolar Panel Array
Area 2
Closest Occupied Structure1,190 feet
Closest Unoccupied Structure1,100 feet
Closest Property Line25 feet
Washington Rd
McQu
een
Rd
Area 1!.
!.
Second Closest Occupied Structure1,440 feet
!.
Second Closest Property Line850 feet

5268 Grazing_Yak-SoundReport_20181019.docx 6-3 Construction Sound Levels Epsilon Associates, Inc.
At times when construction activity is occurring further away from property boundaries and receptors, sound levels will be less than those predicted in this analysis.
6.3 Sound Level Modeling Results
All modeled sound levels, as output from RCNM are presented as both A-weighted equivalent sound levels (Leq, dBA) and A-weighted maximum sound levels (Lmax, dBA).
Tables 6-1 through 6-3 below show the predicted sound levels at the four receptors for each phase of construction. The broadband Leq sound levels range from 45 to 100 dBA. The broadband Lmax sound levels range from 51 to 107 dBA and represent the worst-case sound levels produced during construction activity associated with the project. Although sound levels at the closest property line is predicted to exceed the construction sound level limits, it is Epsilon’s understanding that NEER will seek noise waivers from these closest adjacent properties.
Table 6-1 Sound Level During Phase 1 (Site Grading)
Receptor Distance from Activity
to Receptor
Lmax Leq
(dBA) (dBA)
Closest Property Line 25 ft 88 86
2nd Closest Property Line 850 ft 57 55
Closest Occupied Structure 1,190 ft 54 52
Closest Unoccupied Structure 1,100 ft 55 53
2nd Closest Occupied Structure 1,440 ft 53 51 Table 6-2 Sound Level During Phase 2 (Pile Driving)
Receptor Distance from Activity
to Receptor
Lmax Leq
(dBA) (dBA)
Closest Property Line 25 ft 107 100
2nd Closest Property Line 850 ft 77 70
Closest Occupied Structure 1,190 ft 74 67
Closest Unoccupied Structure 1,100 ft 74 67
2nd Closest Occupied Structure 1,440 ft 72 65
5268 Grazing_Yak-SoundReport_20181019.docx 6-4 Construction Sound Levels Epsilon Associates, Inc.
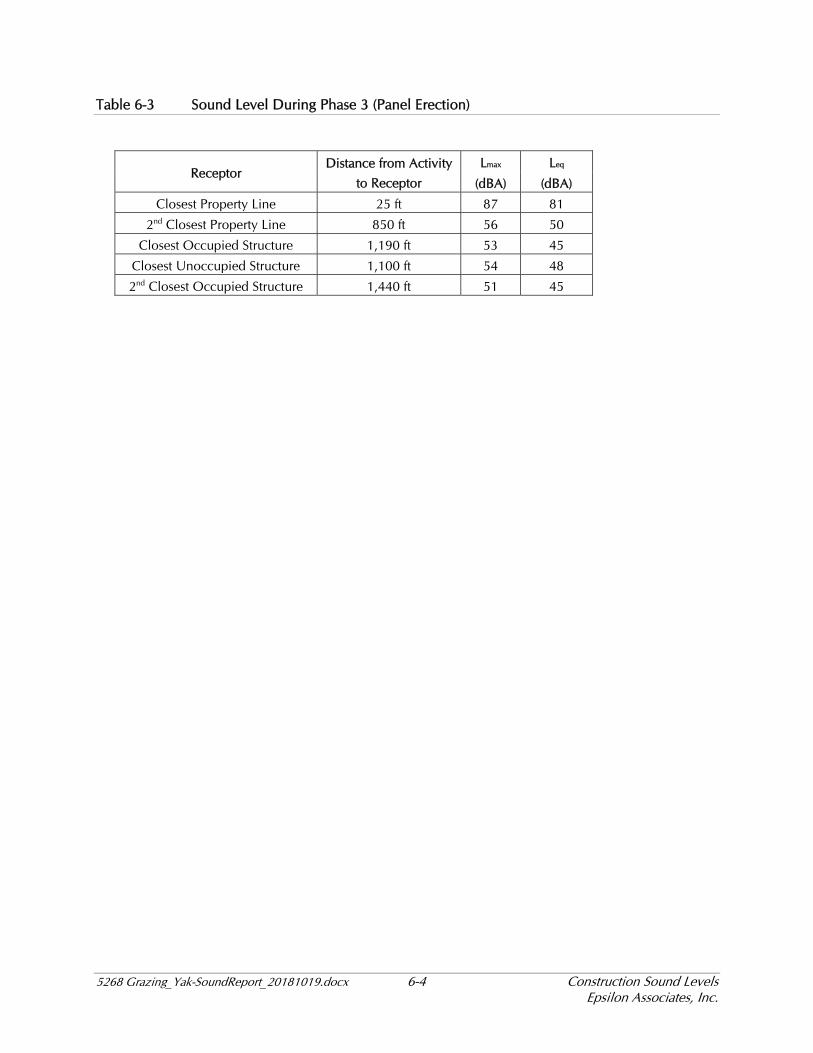
Table 6-3 Sound Level During Phase 3 (Panel Erection)
Receptor Distance from Activity
to Receptor
Lmax Leq
(dBA) (dBA)
Closest Property Line 25 ft 87 81
2nd Closest Property Line 850 ft 56 50
Closest Occupied Structure 1,190 ft 53 45
Closest Unoccupied Structure 1,100 ft 54 48
2nd Closest Occupied Structure 1,440 ft 51 45
5268 Grazing_Yak-SoundReport_20181019.docx 7-1 Evaluation of Sound Levels Epsilon Associates, Inc.
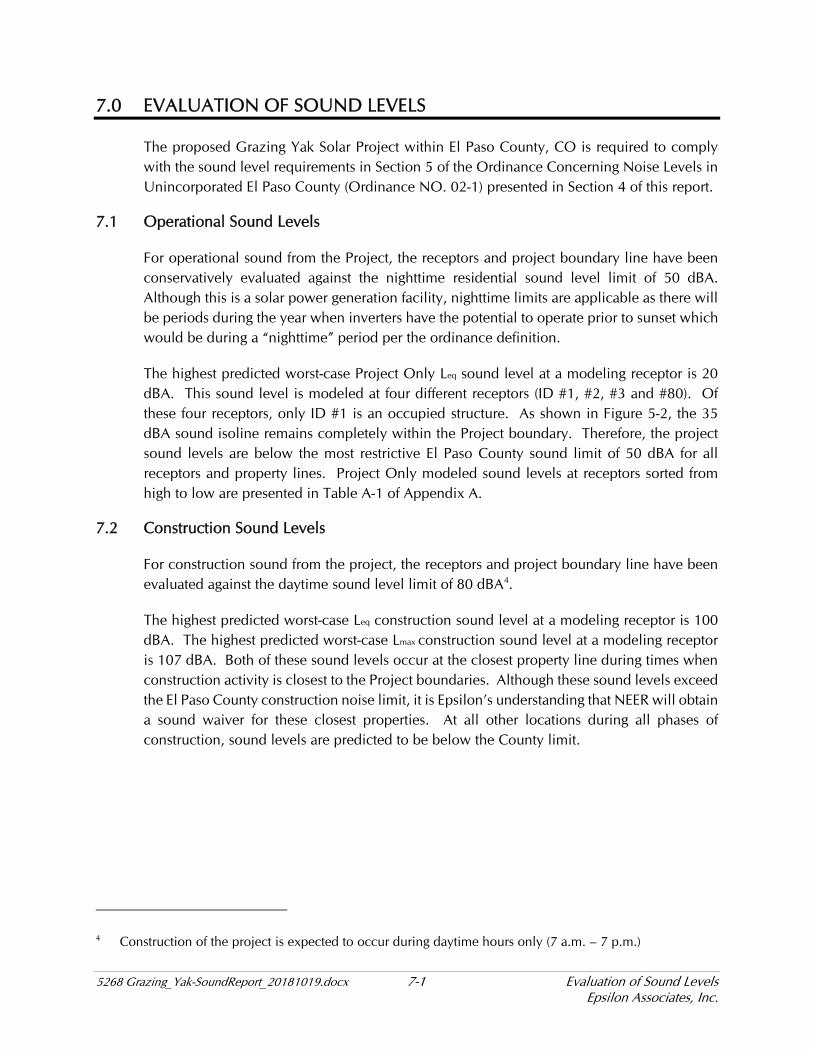
7.0 EVALUATION OF SOUND LEVELS
The proposed Grazing Yak Solar Project within El Paso County, CO is required to comply with the sound level requirements in Section 5 of the Ordinance Concerning Noise Levels in Unincorporated El Paso County (Ordinance NO. 02-1) presented in Section 4 of this report.
7.1 Operational Sound Levels
For operational sound from the Project, the receptors and project boundary line have been conservatively evaluated against the nighttime residential sound level limit of 50 dBA. Although this is a solar power generation facility, nighttime limits are applicable as there will be periods during the year when inverters have the potential to operate prior to sunset which would be during a “nighttime” period per the ordinance definition.
The highest predicted worst-case Project Only Leq sound level at a modeling receptor is 20 dBA. This sound level is modeled at four different receptors (ID #1, #2, #3 and #80). Of these four receptors, only ID #1 is an occupied structure. As shown in Figure 5-2, the 35 dBA sound isoline remains completely within the Project boundary. Therefore, the project sound levels are below the most restrictive El Paso County sound limit of 50 dBA for all receptors and property lines. Project Only modeled sound levels at receptors sorted from high to low are presented in Table A-1 of Appendix A.
7.2 Construction Sound Levels
For construction sound from the project, the receptors and project boundary line have been evaluated against the daytime sound level limit of 80 dBA4.
The highest predicted worst-case Leq construction sound level at a modeling receptor is 100 dBA. The highest predicted worst-case Lmax construction sound level at a modeling receptor is 107 dBA. Both of these sound levels occur at the closest property line during times when construction activity is closest to the Project boundaries. Although these sound levels exceed the El Paso County construction noise limit, it is Epsilon’s understanding that NEER will obtain a sound waiver for these closest properties. At all other locations during all phases of construction, sound levels are predicted to be below the County limit.
4 Construction of the project is expected to occur during daytime hours only (7 a.m. – 7 p.m.)
5268 Grazing_Yak-SoundReport_20181019.docx 8-1 Conclusions Epsilon Associates, Inc.
8.0 CONCLUSIONS
A sound level modeling assessment was conducted for the Grazing Yak Solar Project in El Paso County, Colorado.
The highest predicted worst-case Project Only operational sound levels at a project boundary and at discrete point modeling receptors were all below the most restrictive El Paso County sound limit of 50 dBA. The highest predicted construction sound levels at an adjacent property boundary were above the El Paso County sound limit of 80 dBA. It is Epsilon’s understanding that NEER will seek a sound waiver at these closest adjacent properties for construction noise. At all other structures farther away than the closest adjacent properties, construction sound levels all predicted to be below the El Paso County sound limit of 80 dBA.
Appendix A Operational Sound Level Modeling Results

X(m)
Y(m)
3 Unoccupied 564533 4315126 2080 Unoccupied 565424 4314909 201 Occupied 564518 4315155 202 Unoccupied 564550 4315171 204 Occupied 564345 4315264 187 Unoccupied 564365 4315278 185 Unoccupied 564349 4315299 176 Unoccupied 564400 4315279 17
45 Occupied 565978 4314895 1341 Occupied 565940 4314844 1346 Occupied 565963 4314856 1247 Occupied 565957 4314847 1342 Occupied 565932 4314898 1243 Occupied 565983 4314856 1244 Occupied 565989 4314832 1248 Unoccupied 566230 4314527 1258 Occupied 566255 4313796 1151 Occupied 566347 4314397 1152 Occupied 566335 4314227 1150 Occupied 566359 4314507 1153 Occupied 566356 4314215 1155 Unoccupied 566349 4314243 1154 Unoccupied 566387 4314208 1156 Unoccupied 566385 4314224 1157 Unoccupied 566318 4313744 1149 Unoccupied 566357 4314538 1140 Unoccupied 565975 4315044 119 Occupied 564472 4316092 10
78 Unoccupied 563805 4315892 108 Unoccupied 564508 4316056 10
11 Unoccupied 564248 4316063 1079 Occupied 563812 4315923 1012 Unoccupied 564229 4316098 1074 Unoccupied 563382 4314924 914 Unoccupied 564201 4316323 915 Occupied 564198 4316361 973 Occupied 563417 4314968 813 Unoccupied 564180 4316384 836 Occupied 566056 4315170 837 Unoccupied 566078 4315153 838 Unoccupied 566175 4315165 839 Unoccupied 566143 4315175 772 Occupied 563176 4314593 717 Occupied 564468 4316680 719 Unoccupied 564261 4316655 735 Occupied 566156 4315186 716 Occupied 564260 4316683 7
Table A-1: Sound Level Modeling Results at Discrete Points in El Paso County - Sorted by Sound Level
Modeling ID
CoordinatesUTM NAD83 Zone 13N
Source Only Broadband Sound
Level(dBA)
Occupancy Status
Page 1 of 2
X(m)
Y(m)
Table A-1: Sound Level Modeling Results at Discrete Points in El Paso County - Sorted by Sound Level
Modeling ID
CoordinatesUTM NAD83 Zone 13N
Source Only Broadband Sound
Level(dBA)
Occupancy Status
18 Unoccupied 564462 4316727 720 Occupied Workspace 564935 4316756 733 Occupied 566223 4315183 771 Unoccupied 563091 4314607 730 Occupied 566387 4315138 760 Unoccupied 566637 4314705 731 Unoccupied 566380 4315165 732 Unoccupied 566380 4315179 734 Unoccupied 566241 4315196 724 Unoccupied 565831 4315858 621 Occupied 565879 4315835 622 Unoccupied 565821 4315891 623 Unoccupied 565868 4315886 659 Occupied 566566 4314716 675 Occupied 562961 4315278 629 Occupied 566512 4315325 576 Occupied Workspace 562952 4315325 525 Unoccupied 566573 4315349 526 Unoccupied 566439 4315358 528 Unoccupied 566569 4315300 427 Unoccupied 566602 4315314 467 Occupied 562570 4314065 477 Unoccupied 562868 4315334 461 Unoccupied 562665 4313807 463 Unoccupied 562654 4313783 464 Unoccupied 562645 4313796 462 Unoccupied 562642 4313783 465 Unoccupied 562631 4313779 466 Occupied 562626 4313753 468 Occupied 562572 4314711 370 Unoccupied 562564 4314676 369 Unoccupied 562555 4314724 3
Page 2 of 2