Gray Notebook for the quarter ending December 31, 2003
73
Washington State Department of T ransportation Measures, Markers and Mileposts The Gray Notebook for the quarter ending December 31, 2003 WSDOT’s quarterly report to the Washington State Transportation Commission on transportation programs and department management Douglas B. MacDonald Secretary of Transportation MP 12
Transcript of Gray Notebook for the quarter ending December 31, 2003

WWashington Stateashington StateDepartment of TTrransportationDepartment of ansportation
Measures Markers and Mileposts The Gray Notebook for the quarter ending December 31 2003
WSDOTrsquos quarterly report to the Washington State Transportation Commission on transportation programs and department management
Douglas B MacDonald Secretary of Transportation
MP
12
Measures Markers and Mileposts The Gray Notebook for the quarter ending December 31 2003
12th EditionPublished February 19 2004
ldquoWhat gets measured gets managedrdquoThis periodic report is prepared by WSDOT staff to track a variety of performance and
accountability measures for routine review by the Transportation Commission and others The content and format of this report is expected to develop as time passes Information is reported on a preliminary basis as appropriate and available for internal management use
and is subject to correction and clarification
Contributors Project Delivery Reporting (Beige Pages)
Project Control and Reporting Office Linda Anderson Kevin Dayton Doyle Dilley Kevin Jeffers
Claudia Lindahl Regional Program ManagersPatty Lynch Carol Lee Roalkvam
Nancy Thompson
Worker Safety Rex Swartz
Workforce Levels and Employee Training Dave Acree Adrienne Sanders David Supensky
Highway Construction Program Project Control and Reporting Office
Lloyd Brown Kevin Dayton Gaius Sanoy
Highway Safety Mike Bernard Kimberly Colburn Dan Davis
Roger Horton Brian Limotti Pat Morin Sandra Pedigo Marshall John Milton Paula Reeves
Brian Walsh Anna Yamada
Asset Management Tom Baker Aaron Butters Pat Morin
Sivaneswaran NadaraLinda Pierce
Highway Maintenance Rico Baroga Chris Christopher
Nicole Ribreau Ray Willard
Incident Response Diane McGuerty Anna Yamada
Environmental Programs Scott Carey Bob Thomas Richard Tveten Anthony Warfield
Travel Information Jeremy Bertrand Anna Yamada
Options to Drive Alone Commuting Kathy Johnston Brian Lagerberg
Washington State Ferries Bill Greene John Bernhard
Rail Kirk Fredrickson Carolyn Simmonds
Highlights Ann Briggs
Editing and Production Team
Daniela Bremmer Keith Cotton Megan Davis Brooke Hamilton Robin Hartsell Paul Motoyoshi
Graphics Zoe Estus Steve Riddle
For information contact Daniela Bremmer WSDOT Strategic Assessment 310 Maple Park Avenue SE PO Box 47374 Olympia WA 98504-7374
Phone 360-705-7953 E-mail bremmedwsdotwagov
The Gray Notebook is published quarterly in February May August and November For an online version of this or a previous edition of the Gray Notebook visit wwwwsdotwagovaccountability
Cover photos left to right the ferry Wenatchee approaches Pier 52 in Seattle incident response truck Amtrak Cascades US 395 in Stevens County
Measures Markers and Mileposts The Gray Notebook for the quarter ending December 31 2003
12th EditionPublished February 19 2004
Contents
Project Reporting on the 2003 Transportation Funding Package 1Project Reporting1Current Project Highlights and Accomplishments3Contract Advertising and Awards3Project Completions and Other Highlights 5Project Delivery8Proposed Adjustments to Delivery Planning8Opportunities and Options for Legislative Consideration 11ldquoWatch Listrdquo12Financial Information 18Revenue Forecasts18Bond Sales 19Financial Plans for Accounts19Program Management Information 22Management Information Systems and Needs22Right of Way Acquisition22Utilities Relocation23Environmental Documentation Review Permitting and Compliance23Consultant Utilization 24Construction Employment Information 25Construction Safety Information25
Worker Safety Quarterly Update 27Injury rates for WSDOTrsquos highway engineering highway maintenance and ferry vessel workers
Workforce Levels and Employee Training Quarterly Update 28The size of WSDOTrsquos permanent full-time workforce and employee training needs
Highway Construction Program Quarterly Update 29Construction program delivery examples of deferred and advertised projects cash flow safety improvement program delivery and WSDOTrsquos third annual construction project evaluations
Tacoma Narrows Bridge Project Update 33Hood Canal Bridge Project Update 34Highway Safety Quarterly Update 35Before and after collision data for safety improvement projects collision reduction from cable median barrier installation alcohol-related fatality rate Safe Routes to Schools and collision reduction from installation of a roundabout in Port Orchard
Asset Management Pavement Assessment Annual Update 39Pavement condition trends extent and use of various pavement types rating pavement conditions and 2002 state pavement smoothness comparison
Highway Maintenance Annual Update 42Biennial Maintenance Targets (MAP)42Percentage of legislatively funded targets achieved from 1998 to 2003 Integrated Vegetation Management (IVM) 43Herbicide use trends the Clallam County IVM Plan IVM plan implementation schedule and the US District Court January 2004 ruling
Environmental Programs Annual Update 45Environmental Management System (EMS)45Environmental Compliance Assurance 46Non-compliance events and resulting actual notices IVM non-compliance events Monitoring Replacement Wetlands47Total acreage of wetland replacement projects by type sites meeting success standards in 2003 success rate for wetlands that have completed monitoring Stormwater Treatment Facilities 48Monitoring Water Quality 48State water clarity standards compliance Golden Harvest Creek culvert replacement case study Erosion Control Preparedness49Fall erosion and sediment control assessment results
Incident Response Quarterly Update 50Number and types of responses average clearance times incidents with clearance times over 90 minutes and service actions taken
Travel Information Quarterly Update 52Number of calls to 1-800-695-ROAD and 511 and Web site usage
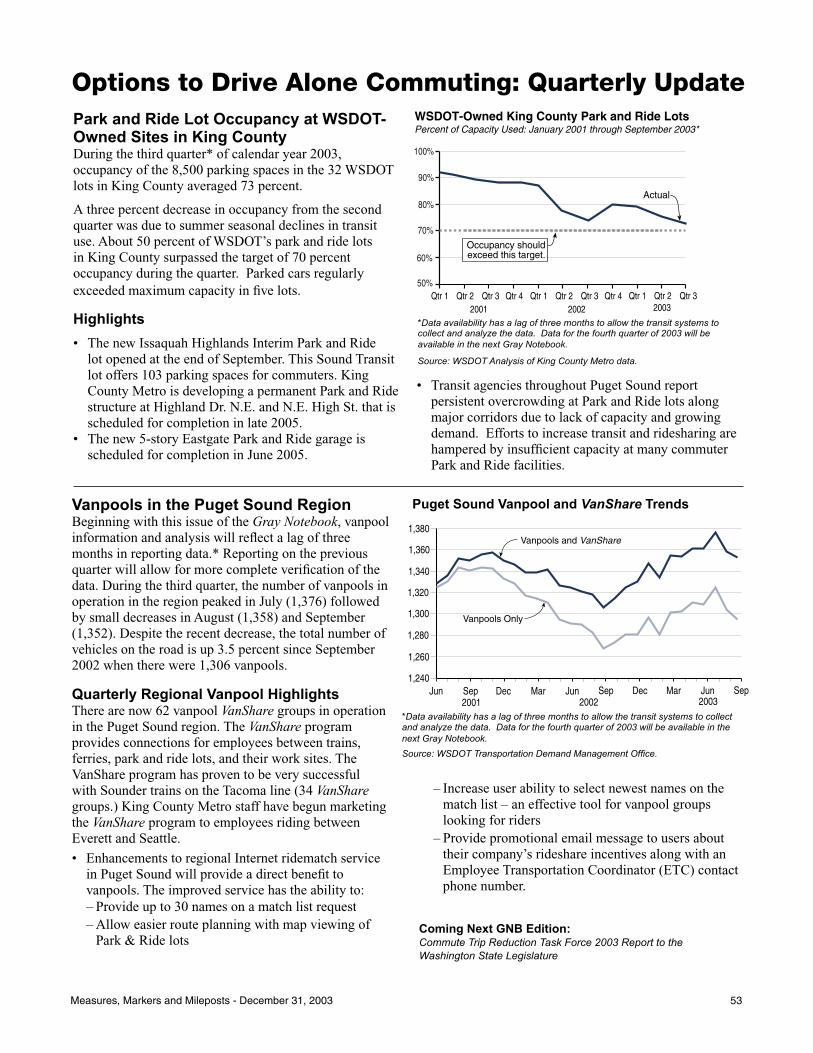
Options to Drive Alone Commuting Quarterly Update 53Puget Sound vanpool use and park and ride lot occupancy trends
Measures Markers and Mileposts - December 31 2003 27
Contents (continued)
Washington State Ferries Quarterly Update 54Customer comments on-time performance trip reliability capital expenditure performance life cycle preservation performance ridership and farebox revenues and annual farebox recovery rates
State-Supported Amtrak Cascades Service Quarterly Update 58Monthly and annual ridership on-time performance farebox recovery and a King Street Station update Washington Grain Train Update 59Grain Train carloads
Special Features 60Organic Recycling Earns Award for WSDOT 60WSDOT Receives Federal PerformanceReport Card 60Global Positioning at WSDOT 60
Highlights of Program Activities 61A snapshot of WSDOTrsquos activities during the quarter including project starts completions and updates savings and efficiencies rail public transportation and commute trip reduction awards and recognition and celebrations and events
Gray Notebook Subject Index 64Where to find every performance measure ever published in the Gray Notebook via electronic access
Project Reporting on the 2003 Transportation Funding Package
Introduction
WSDOT is preparing extensive information for legislators state and local officials interested citizens and the press on the progress of the program funded by the 2003 Transportation Funding Package Much of the detailed information is regularly presented and maintained on-line on the WSDOT website The Gray Notebook in these special pages known as the Beige Pages highlights each quarterrsquos progress and reports on financial and other program management topics as well as detailed information on key projects
The Beige Pages for this quarter are organized in the following manner
Project Reporting Current Project Highlights and Accomplishments Project Delivery Financial Information Program Management Information
This quarterly report represents a work in progress that will be expanded and refined as more and more projects approach or enter into construction We welcome suggestions and inquiries that can help us strengthen this project delivery and accountability reporting
Project Reporting Project reporting uses several different tools including the Gray Notebook web-based Project Pages and Quarterly Project Reports (QPR) A Project Page will be created for all major WSDOT projects whereas the QPRs will be created for Nickel funded projects of the 2003 funding package (See also Financial Information)
Navigation to the Home Page and the Project Pages
WSDOTrsquos home page can be found at wwwwsdotwagov
The Home Page (shown at right) has several links that allow access to the individual Project Pages through the Accountability navigation bar which provides access to ldquohot linksrdquo found in the on-line version of the Gray Notebook and the Projects navigation bar (which accesses a list of all WSDOT projects)
Project Pages for several of the largest projects are directly linked to the Home Page under the Projects navigation bar Project pages can also be accessed from any WSDOT web page by clicking on the ldquoprojectsrdquo tab at the top of every page
Beige Pages - Measures Markers and Mileposts - December 31 2003 1
Beige Pages - Measures Markers and Mileposts - December 31 2003 3
Roadmap to On-line Project Information The diagram below is a roadmap to the information found on-line The on-line version of the Gray Notebook as well as the Home Page will have ldquohot linksrdquo to the individual Project Pages
Gray Notebook
Home Page
Project Information Roadmap
Project Page Project Pages will report on all WSDOT 2003 Transportation Fund projects Project Pages provide detailed information that is updated regularly
bull Overall Project Vision bull Financial Table bull Funding Components bull Roll-up Milestones bull Roll-up Cash Flow bull Contact Information bull Maps and Links
bull Highlights bull Milestones bull Status Description bull Problem Statement bull Risk Challenges bull Project CostsCash Flow bull Contact Information
QPR Quarterly Project Reports will summarize quarterly activities
Project Pages
Project Pages contain information on all aspects of a specific project An existing Project Page is shown at right
Project Pages provide details on overall project vision funding components financial tables milestones status description problem discussions risk challenges forecasting maps photos links and more
WSDOT has approximately 140 Project Pages that are currently providing on-line updates
A summary of the information found on a Project Page will be provided in a Quarterly Project Report (QPR) that WSDOT anticipates will be accessible through a link on the Project Page
Project pages are to the best of WSDOTrsquos ability regularly updated
Project pages can be found at wwwwsdotwagovprojects
Beige Pages - Measures Markers and Mileposts - December 31 2003 2
2 Beige Pages - Measures Markers and Mileposts - December 31 2003
Current Project Highlights and Accomplishments This is WSDOTrsquos third report of quarterly developments in the delivery of the program of projects under the 2003 Transportation Funding Package
The following project information is gathered from a variety of sources within WSDOT and is principally the responsibility of the various regional administrators and their project teams As a regular part of its project management and accountability strategy for the legislaturersquos 2003 Transportation Funding Package a team of senior WSDOT managers from Olympia meets in each region each quarter to perform due diligence on progress and status for each project and to offer assistance support and coordination of issues or problems arising with any project This process also facilitates the ability of headquarters staff to discuss project status with members and staff of the House and Senate and to report from first hand knowledge about the projects to the Transportation Commission
Contract Advertising and Awards
2003 Transportation Funding Package (ldquoNickel Fundsrdquo) Nine projects were planned to be advertised this quarter Seven of these projects were advertised as planned One project was advanced for advertisement Two projects were deferred for later advertisement
Projects Advertised as Planned
SR 9SR 528 Intersection ndash Signal
This project went to ad October 20 2003 The construction is now starting and the project is expected to proceed on schedule
SR 16 HOV Improvements between Olympic View Drive and Union Ave
This project consists of three construction phases The first contract 6th AvenuePearl Street (SR 16) to Jackson Avenue was advertised to bidders on schedule in mid-November 2003 with this first phase construction to be awarded in mid-January 2004 This construction phase will widen SR 16 to prepare for HOV lanes provide a new trail for bikes and pedestrians and rehabilitate the pavement on SR 16 mainline to accommodate traffic switches needed for phase 2 of the project The contractor will begin grading work in Spring 2004 and is expected to complete its work in Winter 2004
US 97A Entiat Park Entrance - Turn Lanes
This project was advertised on schedule and was awarded on December 15 2003 This project was combined with a ldquonon-nickelrdquo funded roadway preservation project US 97AWenatchee North - Paving Combining this project resulted in a cost savings of $80000 The contractor will begin construction in April 2004 and is expected to be completed in July 2004
SR 124 East Jct SR 12 ndash Reconstruction
This project improves safety on SR 124 east of Pasco by realigning a horizontal curve and widening the lanes and shoulders The contract was advertised for bids on December 8 2003 meeting the schedule to proceed to bid opening on January 14 2004 The improvements are scheduled be open to traffic by summer 2004
SR 161 234th Street to 204th Street E
This project consists of two construction phases The first contract 234th Street East to 204th Street East was advertised to bidders in early November 2003 and awarded to the low bid contractor on December 22 2003 This construction phase will widen SR 161 from one lane to two lanes in each direction The contractor will begin grading work on the new highway in Spring 2004 and this phase is expected to be completed in July 2006
Beige Pages - Measures Markers and Mileposts - December 31 2003 3
Beige Pages - Measures Markers and Mileposts - December 31 2003 5
SR 203 NE 124thNovelty Rd Vic
The project was advertised on schedule However the total project cost has increased by approximately $900000 due to additional right of way and preliminary engineering costs to accommodate King Countyrsquos strict flood plain ordinance This project is funded with pre-existing funds the 2003 Transportation Funding Package and King County and Developer contributions $254000 of the cost increase will have to be accommodated from the 2003 Transportation Funding Package
US 395 Kennewick Variable Message Sign
This project improves safety on US 395 by installing a variable message sign camera and traffic sensor north of the Blue Bridge to warn southbound traffic of congestion and accidents ahead The contract was advertised for bids on schedule on December 1 2003 The bid opening is scheduled for January 14 2004 and the improvements should be placed in use for traffic by summer 2004
Project Advanced for Advertisement
SR 527 132nd SE to 112TH SE (Additional Lanes)
The advertisement date was advanced from March 2005 to December 2003 to coordinate with the availability of funds planned for the project from other sources avoid redesign for changes in stormwater treatment requirements and meet a commitment to Boeing The contract award date is February 25 2004
Projects Deferred for Later Advertisement
SR7SR 507 to SR 512 ndash Safety
The December 2003 contract advertisement date for this project has been delayed until obstacles in right of way acquisition can be cleared WSDOT believed that right of way would be obtained from property owners for a December ad date However the department has received 18 requests for adjudicative hearings from property owners adjacent to the project Additional time will be required to prepare detailed surveys title searches and coordinate scheduling with the Attorney Generalrsquos Office for each of the hearings WSDOT is focused on completing negotiations with the property owners and anticipates advertising the project in spring 2004 with construction starting no later than the summer of 2004
SR 522I-5 to SR 405 Multi-Modal Project
To take advantage of coordinating work with Lake Forest Park in conjunction with the needs of WSDOT the advertisement date would slip from winter 2003 to spring 2006 The 2003 Transportation Funding Package provided the entire project funding in the construction phase The changes will result in shifting $2 million in expenditures from the 03-05 to 05-07 biennium This project is part of an integrated program of corridor improvements where WSDOT will coordinate portions of this project with other improvements which will be funded and constructed by local municipalities such as Seattle Kenmore Lake Forest Park and Bothell
Beige Pages - Measures Markers and Mileposts - December 31 2003 4
4 Beige Pages - Measures Markers and Mileposts - December 31 2003
Project Completions and Other Highlights
Construction Highlights
Several of the highway and rail projects funded by the Nickel Account are now in construction More details can be found in the respective on-line Project Pages at wwwwsdotwagovprojects
Highway Construction Program
I-5 Widen Each Direction From Salmon Creek to I-205
The contractor is currently constructing retaining walls necessary for the widening of the southbound lanes Work is continuing on the temporary widening using a detour bridge in preparation for a traffic shift that will allow construction of the northbound lanes The traffic shift is expected to occur in May 2004 The construction schedule identifies the first weekend closure to demolish the existing NE 129th St structure on the weekend of January 31 2004 The new NE 129th St structure is scheduled to be completed in five months
I-90 Build Lanes from Argonne to Sullivan Road
The contractor met the November 1 2003 milestone to have the temporary westbound lanes constructed and open to traffic Although the project was suspended October 31 2003 for the winter work is continuing on minor items such as drainage ponds Road work will restart as soon as weather conditions permit
I-90 Highline Canal to Elk Heights ndash Truck Passing Lanes
This project constructs a truck climbingpassing lane on eastbound I-90 east of the Indian John Hill Rest Area Work on the project was suspended for the winter on November 20 2003 due to snow and cold temperatures Prior to suspending work the contractor had completed clearing the land in preparation for the widening of the roadway Ninety percent of the embankment excavation and drainage has been completed The left side bridge rail replacement on the Highline Canal bridge is complete To date project completion status is at about 30 Work will resume as weather conditions permit
I-90 Ryegrass Summit to Vantage ndash Truck Passing Lanes
This project constructs a truck climbingpassing lane on westbound I-90 from Vantage to the top of Ryegrass Summit Due to winter conditions work by the contractor was suspended on November 14 2003 Nearly one mile of the additional lane and modifications to the Ryegrass Rest Area ramps are completed and already open to traffic WSDOT survey crews will continue to work preparing for the next construction season as weather permits It is anticipated that the contractor will resume work in March 2004
SR 500 NE 112th Avenue Interchange
This project constructs a new interchange on SR500 at NE 112th AvenueGher Road All utility relocations are now complete and traffic was shifted to temporary lanes during a weekend closure on November 2 2003 (one day ahead of schedule) The bridge footings and columns have been constructed as planned for the eastbound ldquofly-overrdquo bridge with girder placement expected to occur in a three night sequence in mid January 2004 The placement of the noise barrier along the I-205 ramp has started with a scheduled completion of April 2004
Beige Pages - Measures Markers and Mileposts - December 31 2003 5
Beige Pages - Measures Markers and Mileposts - December 31 2003 7
Other Capital Programs
Purchase Oregon Train Set
A purchase agreement to complete this important rail rolling stock acquisition project in the 2003 Transportation Funding Package was executed between WSDOT and Talgo Inc on November 26 2003 Talgo will now paint the outside of the cars to match those already in the fleet The purchase will allow for additional rail passenger service between Seattle and Portland upon completion of track improvements
Tacoma RMDRR Morton Line Repairs ndash Phase 2
This project will complete the necessary repairs to the rail line between Frederickson and Morton to restore rail service interrupted by the 1996 flood Construction of a portion of this project for immediately needed repairs began in July 2003 and was completed in mid-December 2003 The remainder of the construction project will be accomplished under separate agreement with the City of Tacoma (owner) scheduled to begin in early 2004 It is anticipated that the entire project will be completed before the end of the current biennium
Highlights of Projects Ready for Advertisement for 2004 Construction Season
Five of the highway projects in the 2003 Transportation Funding Package are scheduled for advertisement in the two quarters for January 1 2004 to June 30 2004 (the 3rd and 4th quarter of the 03-05 biennium) More details can be found in the respective on-line Project Pages at wsdotwagovprojects The status of these projects is described below Two projects that were scheduled for advertisement during this time frame were deferred to future quarters (the status of these projects are described below)
I-5 2nd Street Bridge (ad date 452004)
The current proposal is to assist traffic flow by reducing construction from two seasons to one No change in total project cost is anticipated The project is expected to be advertised as scheduled
SR7SR 507 to SR 512 ndash Safety (ad date 532004)
The ad date for this project in December 2003 was not met because of complications that arose in the right of way taking May 2004 is the rescheduled ad date that WSDOT hopes to meet if negotiations with property owners can be completed in time
I-90 Cle Elum River Bridge (ad date 31504)
Environmental documentation is complete and approximately 80 of the design is finished The scheduled advertisement date is expected to be met and pre-construction start date is expected to be May 2004
SR 304SR 3 to Bremerton Ferry Terminal (ad date 21704)
This project reconstructs and widens the existing roadway It will add HOV lanes to increase traffic movement The City of Bremerton is the lead agency for this project
WSDOTrsquos role is primarily to assure the administration of the funding provided for in the 2003 Transportation Funding Package WSDOTrsquos expectation is that the City of Bremerton will advance the projectrsquos scheduled advertisement date The estimated construction completion date is June 2006
SR 509 Design amp Critical Right-of Way (ad date 672004)
Construction funds are being transferred to the City of SeaTac which is the lead agency on this phase of the project Environmental permitting and stormwater designs are being developed by WSDOT and are on track to support the scheduled ad date and budget WSDOT expects that the City of SeaTac will meet the scheduled ad date The project is on schedule and within the established budget
Beige Pages - Measures Markers and Mileposts - December 31 2003 6
6 Beige Pages - Measures Markers and Mileposts - December 31 2003
SR 9 Nooksack Road to Cherry Street (ad date 604)
This project was originally scheduled for advertisement in June 2004 but that date has had to be adjusted (is now set for October 2005) because of new geotechnical information requiring design revisions that in turn have led to a larger-than-originally-expected right of way acquisition program Construction cost savings however are also expected to result
SR 161 204th Street to 176th Street (ad date 2904)
The project was originally scheduled for advertisement in February 2004 but that ad date has had to be adjusted (is now set for November 2004) due to real estate acquisitions that have taken longer than expected and to avoid work zone traffic control issues by constructing the entire four miles at the same time WSDOT is coordinating access revision with local developers along the corridor and is currently nearing completion of the design and real estate acquisition phase
Beige Pages - Measures Markers and Mileposts - December 31 2003 7
Beige Pages - Measures Markers and Mileposts - December 31 2003 9
Project Delivery
Proposed Adjustments to Delivery Planning
Meeting schedule budget and scope expectations are important elements in WSDOTrsquos delivery of the projects in the 2003 Transportation Funding Package Planning and design activities for specific projects sometimes identify the need to make adjustments to construction delivery spending schedules Some of these adjustments will have no impact on critical start or completion dates Others may require adjustments to critical dates
The information in this report describes changes that WSDOT has concluded as desirable based on assessments made in the quarter under review ending December 31 2003
Highway Construction Program
US 2 Peshastin East Interchange
The spending plan for this project should be revised based on the Value Engineering Study done in August 2003 and the Cost Risk Assessment done in July 2003 The spending plan for this project has been reduced $88 million to a total of $165 million This is a cost savings of 35 from the budget amount WSDOT also has a plan to reduce the construction phase of the project by two years from three years to one year while maintaining the planned advertisement date of September 4 2009
I-5SR 502 Interchange and Corridor Widening
WSDOT has the opportunity to make advance purchases of Right of Way from property owners that have expressed interest in selling now Purchasing Right of Way at this time benefits both the sellers and the WSDOT in that sellers will be able to know what affect the project will have on them and be fairly compensated and early acquisition lessens the risk of land development increasing land value In order to accelerate this preliminary design and RW work WSDOT is requesting to advance $1000000 for RW and $200000 for Preliminary Engineering into the 0305 biennium The advancement of funds will not increase the total project cost
I-5 Noise Wall
This project was removed from the September 30 2003 Watch List The project is in Seattle near the end of SR 520 and Roanoke Street Previously WSDOT reported that cost and schedule for this project were being reviewed to allow for completion of the design and may result in an ad delay With the review complete and design underway the project will be advertised in early summer 2004 with a construction start in late summer
I-5SR 526 TO US 2 (Marine View Dr) HOV Lanes
WSDOT proposes to advance the advertisement date from March 2008 to October 2007 to ensure that work begins in the spring of 2008 to take full advantage of the 2008 construction season In addition WSDOT is proposing to advance $4 million into the 2003-2005 biennium in order to accelerate design work This acceleration would put WSDOT in a position to further accelerate this project for the benefit of the 2010 Olympics if the Legislature should decide to advance funding for construction (see Opportunities and Options for Legislative Consideration section of this report)
SR 7SR 507 to SR 512 ndash Safety
The December 2003 contract advertisement date for this project has been delayed until right of way access issues can be resolved WSDOT believed that right of way would be cleared with property owners for a December ad date However the Department has received 18 requests for adjudicative hearings from property owners adjacent to the project Additional time will be required to prepare detailed surveys title
Beige Pages - Measures Markers and Mileposts - December 31 2003 8
8 Beige Pages - Measures Markers and Mileposts - December 31 2003
searches and coordinate scheduling with the Attorney Generalrsquos Office for each of the hearings WSDOT is focused on completing negotiations with the property owners and anticipates advertising the project in spring 2004 with construction starting no later than the summer of 2004
SR 9 Nooksack Road to Cherry Street
This project will have an ad date shift from June 2004 to October 2005 to account for an increase in the number of right of way parcels that must be acquired The total cost of the project remains the same as the construction estimate has decreased
SR 16 HOV Improvements ndash Olympic View Drive to Union Avenue
The third construction phase of this project 36th Street to Olympic Drive NW would be advanced two or three quarters to allow more flexibility for planning and implementing traffic switches needed to accommodate the opening the new Second Tacoma Narrows Bridge This third and final construction phase will complete continuous HOV lanes on either side of the Tacoma Narrows from the Sprague Avenue Interchange in Tacoma to the Olympic Drive Interchange in Gig Harbor by spring 2007 Moving the construction start date of this phase from spring 2005 to fall 2004 will not affect the overall cost of the project
SR 20 Quiet Cove Road Vic to SR 20 Spur
In the September 30 2003 Gray Notebook this project was listed on the Watch List At that time WSDOT reported the advertisement date for this project may be delayed to provide time for right of way acquisition and to resolve environmental mitigation issues Currently the advertisement date would slip by nine months from February 2006 to November 2006 which will result in shifting $3 million in projected Nickel Fund expenditure from the 05-07 to 07-09 biennium
I-90 Two-Way Transit and HOV
This Seattle to Mercer Island project is currently funded for design by Sound Transit FHWA and WSDOT and is dependent on Regional Transportation Investment District (RTID) and other sources of funding for construction Should RTID funding become available WSDOT proposes the advertisement date be delayed thirteen months from December 2004 to January 2006 to allow time for the issuance of the draft Environmental Impact Statement This will allow the design to be completed in October 2005 There is no change in the expected project cost However $1 million in projected Nickel Fund expenditures would need to be shifted from the 03-05 biennium to the 05-07 biennium
SR 99 S 284th to S 272nd St HOV Lanes
This project will include a HOV lane and 2 general-purpose lanes in each direction a median sidewalk and planter strip The updated cost estimate for right-of-way acquisition is $51 million this is an increase from the previous estimate of $3 million to account for the potential of higher cost of condemnation The advertisement date would be delayed from December 2005 to April 2006 to correct the record of survey which identify property ownership WSDOT is currently working with the City of Federal Way to minimize the right-of-way cost by eliminating some of the proposed landscaping areas
SR 161 Corridor Improvements ndash 204th Street E to 176th Street
There are multiple stages to this project Stage 1 (234th to 204th) was advertised in November 2003 The proposal is to adjust cash flow and delay the advertisement date of Stage 2 (204th to 176th) from November 2003 to November 2004 This action will reduce traffic impacts and help right of way acquisition These changes should not change the total project cost
Beige Pages - Measures Markers and Mileposts - December 31 2003 9
Beige Pages - Measures Markers and Mileposts - December 31 2003 11
SR 203 NE 124thNovelty Rd Vic
The project was advertised on schedule However the total project cost has increased by approximately $900000 due to additional right of way and preliminary engineering to accommodate King Countyrsquos strict flood plain ordinance This project is funded with pre-existing funds the 2003 Transportation Funding Package and King County and Developer contributions About $250000 of the expected cost increase will come from the 2003 Transportation Funding Package
SR 520 W Lake Sammamish Parkway to SR 202 (Additional Lanes)
Cash flow adjustment to match actual design right of way and construction schedules No change in advertisement date of October 2008
SR 522I-5 to SR 405 ndash Multi-Modal Project (Nickel)
To take advantage of coordinating work with Lake Forest Park in conjunction with the needs of WSDOT partners the advertisement date would slip from winter 2003 to spring 2006 to take advantage of coordinating work with Lake Forest Park The 2003 Transportation Funding Package provided the entire project funding in the construction phase The changes will result in shifting $2 million in expenditures from the 03-05 to 05-07 biennium This project is part of an integrated program of corridor improvements where WSDOT will coordinate portions of this project with other improvements which will be funded and constructed by local municipalities such as Seattle Kenmore Lake Forest Park and Bothell
For financial information on the Proposed Adjustments to Delivery Planning ndash Highway projects please refer to the table on page 16
Other Capital Programs The following six proposed project changes have interrelated funding and impact one another
Palouse River and Coulee City Railroad Acquisition
Depending on a finding of cost effectiveness that the Legislature instructed be made by the Transportation Commission WSDOT would purchase 302 miles of the Palouse River and Coulee City Railroad preserving the statersquos largest short-line railroad that carries 20 percent of the statersquos grain crop The original proposed budget has been reduced by $322000 after further cost estimate review If the conclusion of WSDOTrsquos review of the proposed purchase of this railroad is favorable the purchase will be completed with this decrease in the adjusted budget
Port of Columbia Railroad Improvements (New Project Title)
After further engineering review and scope refinement the following three projects are combined and overall reduced in scope to reflect actual improvements needed to maintain railroad service on this section of track
The original project Port of Columbia Railroad Improvements ndash funds general railroad improvements on the 39-mile line Based on further engineering reviews the original scope for this project has been reduced from a full rebuild of the line to a less expensive rehabilitation of the line that will still provide an adequate level of service to the rail line customers The proposed change will be combined with two additional projects listed in the 2003 Funding Package (the Blue Mountain Railroad Upgrade project which rebuilds 30 miles of track from Wallula to Walla Walla and the Port of Columbia Co Dayton Upgrades project which funds improvements to port rail facilities) into a single project with a total budget of $53 million as compared to the originally combined project budgets of $13 million
Beige Pages - Measures Markers and Mileposts - December 31 2003 10
10 Beige Pages - Measures Markers and Mileposts - December 31 2003
Port of Columbia Dayton Upgrades and Blue Mountain Railroad Upgrade
These projects fund improvements to port rail facilities and rebuilding 30 miles of track from Wallula to Walla Walla It is proposed that these projects be combined with Port of Columbia Railroad Improvements project as described above The original intent of both projects will still be accomplished at a reduced cost
Palouse River and Coulee City Cheney-Coulee-Pullman Upgrade (New Project Title)
After further engineering review and scope refinement two projects (Palouse River and Coulee City Cheney to Coulee Upgrades and Rural Elevator Track Expansion) are combined Also engineering analysis suggests the need for scope change to include upgrades of PRampCC lines in Whitman County
The original project (Palouse River and Coulee City Cheney to Coulee Upgrades) would have funded repairs to numerous railroad bridges in Grant and Lincoln Counties and upgrade track to accommodate 286000-pound freight cars It would also improve the rail line between Coulee City and Cheney The proposed change will combine these upgrades with projects in Whitman Co that were identified by WSDOT in the summer of 2003 Further the scope of the work from the Rural Elevator Track Expansion project (additional track at rural elevators and shortline mainline connections) will also be combined into this expanded scope The proposed scope will be completed within the overall total of $21089000 specified for the projects in aggregate
For financial information on the Proposed Adjustments to Delivery Planning - Rail projects please refer to the table on page 17
Opportunities and Options for Legislative Consideration
The following projects were reported as requiring legislative guidance in June 2003 and continue to be offered for legislative consideration Details on the projects are found in the Gray Notebook for June 30 2003
I-5SR 526 TO US 2 (Marine View Dr) HOV Lanes
The question remains on whether the construction schedule for this project should be advanced so that the project can be completed prior to the 2010 Winter Olympic Games
WSDOT has developed two accelerated schedule options for legislative consideration Option one is to accelerate the project schedule and advertise it for construction bids in March 2006 using the common ldquoDesign-Bid-Buildrdquo practice This option will result in an open to traffic date of 2010 Option two is to accelerate the project schedule and advertise by July 2005 using the ldquoDesign-Buildrdquo method This option will result in an open to traffic date of 2009 and is WSDOTrsquos preferred option The expenditure plan reflects the ldquoDesign-Buildrdquo option
SR 99 Alaskan Way Viaduct
The project replaces the seismically vulnerable Alaskan Way Viaduct and seawall in downtown Seattle The Gray Notebook for September 2003 identified the need to begin design in the summer 2004 as essential to remain on schedule to meet the proposed 2008 start of construction The project has moved money from one phase to another in 2003-2005 with zero dollar change to the bottom line By making this adjustment restoring right of way and increasing PE in the 05-07 biennium The project remains on the accelerated pace that will allow construction to begin in 2008 but not unless funding issues can be resolved
Beige Pages - Measures Markers and Mileposts - December 31 2003 11
Beige Pages - Measures Markers and Mileposts - December 31 2003 13
I-405 Congestion Relief and Bus Rapid Transit Projects
WSDOT proposes revising the I-405 Nickel project sequence to be Kirkland Stage 1 Renton Bellevue and Kirkland Stage 2 The Kirkland Stage 1 project addresses a known congestion hot spot that has a very high benefitcost ratio with work that can be incorporated into future RTID projects This schedule revision allows a project to be constructed and opened to traffic earlier than the original sequence The revision also allows the Renton project the opportunity to combine Nickel funds with Regional Transportation Improvement District (RTID) funds in a larger more cost-effective project should RTID funds become available
SR 522 Bothell ndash UW Campus Access
Should WSDOT use the Nickel expenditure authority for this project since the funding from the lead funding partners did not materialize and WSDOTrsquos budget for the project is insufficient to construct the project This was identified in the September 30 2003 Gray Notebook
SR539I-5 AccessImprovements Ten Mile Road to International Boarder
The question remains on whether the construction schedule for this project should be advanced so that the project can be completed prior to the 2010 Winter Olympic Games
Widening the remaining section of the ldquoTen Mile Roadrdquo will require the project be funded in a future budget appropriation The Nickel funding will provide for preliminary engineering environmental analysis and selection of a project plan for a new connection between I-5 and SR 539 Completing the final design right of way and construction of the project will however require new funding
D Street Grade Separation
The question remains whether the cash flow of this project be advanced into the 03-05 biennium from the 05-07 biennium to enable construction to be accomplished with other stages of this project
The Gray Notebook for September 30 2003 suggests that the 03-05 Supplemental Budget include a $35 million increase in the Program Z appropriation within the Multimodal Account
For financial information on the Opportunities and Options for Legislative Consideration please refer to the table on page 17
ldquoWatch Listrdquo Projects Cost and Schedule Concerns Watch List WSDOT is watching some projects closely for warning that changes in cost schedule or scope may be at risk due to developments and discoveries during the project delivery process in some cases these changes are outside the control of WSDOT Currently the information regarding the changes for these projects are in the early stages and making a conclusion based on this information may not
Watch List
achieve the desired result
Projects Removed from the September 30 2003 Gray Notebook Watch List
SR 3 to SR 303 Interchange Waaga Way
Removed from the Watch List Concerns had been raised that several issues in the design concepts developed in 1995 now necessitating coordination with Kitsap County might require delay of the scheduled ad date in Spring 2005 These issues have now been successfully addressed ndash reducing the
Beige Pages - Measures Markers and Mileposts - December 31 2003 12
12 Beige Pages - Measures Markers and Mileposts - December 31 2003
number of traffic signals reducing the volume of pavement increasing traffic volume capacity and minimizing impacts on local adjacent ball fields Project progress now supports both the originally scheduled ad date and the project budget
I-5 Noise Wall
See Proposed Adjustments in delivery planning Removed from the Watch List Previously WSDOT reported that the need to prepare design for the project would lead to delay in the schedule originally set by the legislature With the review complete and design underway the project has now been scheduled to advertise in early summer 2004 with construction work to begin during the summer
SR 20 Quiet Cove Road Vic to SR 20 Spur
See Proposed Adjustments in delivery planning Removed from the Watch List This project has moved to Proposed Adjustments in the Gray Notebook WSDOT reported the need to delay the advertisement date for this project might be delayed to provide additional time to acquire environmental approvals necessary for right of way acquisition The current plan is to slip the advertisement date by nine months from February 2006 to November 2006 in order to provide adequate time to resolve environmental mitigation issues and acquisition right of way This delay will result in shifting $3 million in Nickel funding expenditure from the 05-07 to 07-09 biennium
SR 99 S 284th to S 272nd St HOV Lanes
This project has moved to proposed adjustments in the Gray Notebook Removed from the Watch List The updated cost estimate for right-of-way acquisition is $51 million This is an increase from the previous estimate of $3 million and has been factored in to the project to account for the potential higher cost of condemnation Advertisement date will be delayed from December 2005 to April 2006 in order to correct the record of survey to identify property ownership
SR 161 Jovita Blvd to S 360th St
Removed from Watch List In the September 30 2003 Gray Notebook this project was on the Watch List for potential design changes from increased costs and delayed construction due to environmental and air quality provisions that have become more stringent while waiting for funding to be approved The air quality analysis has now been completed and there will be no impact to the project as a result The NEPA re-evaluation is still in progress and WSDOT anticipates the report to be finalized in January 2004 and approved shortly thereafter
SR 203 NE 124thNovelty Rd Vic
See Proposed Adjustments to Project Delivery and Contract Advertising amp Awards Removed from Watch List Previously WSDOT reported that arriving at a new floodplain mitigation site might have implications for cost and schedule The project was advertised on schedule but the project costs for additional engineering and right of way acquisition increased by a total of $900000
US 395 North Spokane Corridor (Francis Avenue to Farwell Road)
Removed from Watch List This was a ldquoWatch Listrdquo project in the last quarterrsquos report because of concerns over obstacles in the acquisition of a single indispensable right-of-way parcel With the assistance of mediation the acquisition was completed in November 2003 The contract advertisement was set for January 2004 with bid opening in March 2004 The project is expected to be delivered within approved funding and with little delay to the opening date
SR 522I-5 to SR 405 ndash Multi-Modal Project (Nickel)
Removed from Watch List See Proposed Adjustments to Project Delivery In the September 30 2003 Gray Notebook WSDOT reported it was considering delaying the advertisement date to coordinate with the City
Beige Pages - Measures Markers and Mileposts - December 31 2003 13
Beige Pages - Measures Markers and Mileposts - December 31 2003 15
of Lake Forest Park To coincide with the needs of WSDOT partners the advertisement date will slip from winter 2003 to spring 2006 to take advantage of coordinating work with the City of Lake Forest Park The Nickel Funding Package provided the entire project funding in the construction phase These changes will result in shifting $2 million in expenditure from the 03-05 to 05-07 biennium
SR 543I-5 to Canadian Border - Additional Lanes for Freight
Removed from Watch List In the September 30 2003 Gray Notebook WSDOT reported the department was working to resolve structural design issues as a result of poor soil conditions The initial engineering solution was to design retaining walls that would be expensive and cause the project to exceed the budget A slope redesign was therefore developed as an alternative It has resulted in making one wall unnecessary and reducing the necessary height of several walls This affordable design is more cost-effective and should bring the project back within the anticipated budget
Update on Projects Noted in the ldquoWatch Listrdquo in the Gray Notebook ending September 30 2003
I-5 From Rush Road to 13th Street
The Watch List for the September 30 2003 Gray Notebook described the review by FHWA of this project to add one lane in each direction on I-5 between the interchanges at Rush Road (exit 72) and 13th Street (exit 76) including construction of a new interchange at the current LaBree Road under-crossing At the time of publication FHWA approved the added access with conditions
SR 9SR 522 to 212th St SE (Stages 1b amp 2)
The Watch List for the September 30 2003 Gray Notebook described the need to make design changes (raised center line barrier) with two-way-left-turn-lane based on current traffic data The design change may result in a delay of the advertisement date WSDOT continues to coordinate design and construction planning with King County regarding the Countyrsquos development of the Brightwater Wastewater Treatment Plant adjacent to the project There is continuing discussion of a revised advertisement and construction schedule
SR 167 15th St SW to 15th St NW ndash HOV
In the last Gray Notebook Watch List WSDOT reported that the project cost increased by $44 million and that the advertisement date could be delayed The advertisement date will be moved to February 2005 to accommodate redesign of the project to meet current stormwater standards WSDOT staff worked with permitting agency representatives on the Multi-Agency Permitting Team (MAPT) and determined that the original drainage design would not meet current water quality regulations The MAP Team has determined that additional stormwater detention and treatment will indeed be required Local agencies have also stated that additional wetland and stream buffer mitigation will be required As a result additional funds will be required for the design and construction of ecology embankments additional detention ponds and buffer mitigation The additional work will delay the advertisement date to the first quarter 2005 WSDOT staff is investigating designs in order to minimize the amount of these cost increases and will report next quarter
SR 270 Pullman to Idaho State Line - Additional Lanes
In the September 30 2003 Gray Notebook it was reported that there was a possibility of a project cost increase due to rock and soil conditions and the need for bridge design modifications Drilling and soil testing began in mid December 2003 with planned completion of testing in February 2004 Due to the unknown rock depth in excavation areas and bridge design considerations for two bridges it is anticipated that that a project cost increase ranging from $2 million to $5 million may be required The project cost estimate is expected to be completed by July 2004 As the project design is further refined WSDOT is investigating methods to reduce or offset these cost increases The project is on schedule for advertisement in January 2005
Beige Pages - Measures Markers and Mileposts - December 31 2003 14
14 Beige Pages - Measures Markers and Mileposts - December 31 2003
SR 410 214th Ave E to 234th - Widening
WSDOT reported in the Watch List of the September 30 2003 Gray Notebook that costs for this project could increase $16 million or more to purchase land that will be needed for stormwater treatment and detention was re-zoned for commercial and light industrial during the project development phase Engineering work is underway to develop an updated cost estimate for right-of-way acquisition based on the zoning changes by the end of February 2004 This project will address sections of the roadway where accidents occur by controlling access to the highway building new signal systems at major intersections and reducing congestion by providing an additional lane in each direction
Projects added to the ldquoWatch Listrdquo
Bellingham-GP Area Upgrades
This project would upgrade the existing track through Bellinghamrsquos Georgia Pacific (GP) Plant to allow for slightly higher speeds for Amtrak Cascades intercity trains resulting in a travel time reduction of about 11frasl2 minutes Due to unanticipated freight business at the mostly closed GP plant since the project scope was developed the project scope is now inadequate The implications for cost and schedule are being reviewed
Beige Pages - Measures Markers and Mileposts - December 31 2003 15
Beige P
ages - Measures M
arkers and Mileposts - D
ecember 31 2003
17
Beige P
ages - Measures M
arkers and Mileposts - D
ecember 31 2003
The following table summarizes the various changes and adjustments described on pages 8-10 for the quarter ending December 2003
Highway Projects Proposed Adjustments to Project Delivery Quarter Ending December 31 2003 Dollars in Thousands
03-05 05-07 07-09 09-11 11-13 Ten Year Total
Adjusted Net Adjusted Net Adjusted Net Adjusted Net Adjusted Net Adjusted Net SR Project Budget Budget Change Budget Budget Change Budget Budget Change Budget Budget Change Budget Budget Change Budget Budget Change 002 US297 Peshastin East - 2100 2100 0 1870 2700 830 7600 11750 4150 13780 0 -13780 0 0 0 25350 16550 -8800
Interchange 005 I-5SR502 Interchange 1321 2521 1200 8679 7479 -1200 0 0 0 0 0 0 0 0 0 10000 10000 0
005 I-5 Noise Wall 3500 3500 0 0 0 0 0 0 0 0 0 0 0 0 0 3500 3500 0
005 I-5SR526 to US 2 (Marine View 11000 15000 4000 6300 11300 5000 54780 52277 -2503 121900 117005 -4895 44680 36474 -8206 238660 232056 -6604 Drive)
007 SR7SR507 to SR512-Safety 9300 9300 0 0 0 0 0 0 0 0 0 0 0 0 0 0 0 0
009 SR 9 Nooksasck Road to Cherry 6320 1548 -4772 8800 12730 3930 0 927 927 0 0 0 0 0 0 15120 15205 85 St
016 SR 16 HOV Improvements 49623 51483 1860 40902 39042 -1860 0 0 0 0 0 0 0 0 0 90525 90525 0 between Olympic Drive and Union Ave
020 SR 20Quiet Cove Rd Vic to SR 0 0 0 3790 766 -3024 3270 6294 3024 0 0 0 0 0 0 7060 7060 0 20 Spur
024 SR24I82 to Keys Road 840 840 0 22000 22000 0 9000 9000 0 0 0 0 0 0 0 31840 31840 0
031 SR 31Metaline Falls 4900 2400 -2500 11000 13500 2500 0 0 0 0 0 0 0 0 0 15900 15900 0 To Canadian Border
090 I-90 Two-way Transit and HOV 4000 3000 -1000 11000 12000 1000 0 0 0 0 0 0 0 0 0 15000 15000 0
099 SR 99s 284th to S 272nd St 3780 3656 -124 6323 8519 2196 2600 2621 21 0 0 0 0 0 0 12703 14796 2093 - HOV Lanes
161 SR 161Corridor Improvements 12100 6641 -5459 7300 12709 5409 15 27 12 0 38 38 0 0 0 19415 19415 0 -176th to 234th
203 SR 203NE 124thNovelty Rd Vic 1200 2084 884 0 163 163 0 0 0 0 0 0 0 0 0 1200 2247 1047
520 SR 520w Lake Sammamish 3400 3368 -32 4900 6700 1800 24500 16225 -8275 38720 60515 21795 30800 15493 -15307 102320 102301 -19 Pkwy to SR 202
522 SR 522I-5 To SR 405 Multi- 3600 1497 -2103 1500 3568 2068 0 0 0 0 0 0 0 0 0 5100 5065 -35 modal Project
Total of Projects Above 116984 108938 8046 134364 153176 18812 101765 99121 -2644 174400 177558 3158 75480 51967 -23513 593693 581460 -12233
Project Adjustments from Quarter 1 229284 210820 -18464 374159 375781 1622 323393 333343 9950 229295 263815 34520 142025 107237 -34788 1298156 1290997 -7159
Total of Projects from Quarter 2 221033 238273 17240 283976 265815 18161 312730 310414 -2316 307339 307064 -275 318918 348876 -42 1483296 1479741 -3555
Total for All Projects 567301 558031 -9270 792499 794772 2273 737888 742878 4990 711034 748437 37403 566423 508080 -58343 3375145 3352198 -22947
16
16Beige P
ages - Measures M
arkers and Mileposts - D
ecember 31 2003
Beige P
ages - Measures M
arkers and Mileposts - D
ecember 31 2003
The following table summarizes the various changes and adjustments described on pages 10-11 for the quarter ending December 2003
Rail Projects Proposed Adjustments to Project Delivery Quarter Ending December 31 2003 Dollars in Thousands
03-05 05-07 07-09 09-11 11-13 Ten Year Total Adjusted Net Adjusted Net Adjusted Net Adjusted Net Adjusted Net Adjusted Net
Project Budget Budget Change Budget Budget Change Budget Budget Change Budget Budget Change Budget Budget Change Budget Budget Change
Palouse Riv amp Coulee City RR 5820 5820 - 1530 1208 (322) - - - - - - - 7350 7028 (322) Acquistion Port of Columbia Railroad - - - - 11500 252 (11248) 1904 1904 - 3157 3157 11500 5313 (6187) Improvements Port of Columbia Co Dayton - - - - 320 - (320) - - - - - 320 - (320) Upgrades Blue Mtn RR Wallula-Walla Walla - - 1260 - (1260) - - - - - - - 1260 - (1260) Upgrade Rural Elevator Track Expansion - - - - - - 1140 - (1140) 3860 - (3860) 5000 - (5000)
PRampCC Cheney-Coulee 286K - - 1582 1582 11568 11568 8000 7236 (764) - 703 703 8000 21089 13089 Upgrade
Total Rail Projects 5820 5820 - 2790 2790 - 11820 11820 - 9140 9140 - 3860 3860 - 33430 33430 0
The following table summarizes the various opportunities and options described on pages 11-12
Highway Projects Opportunities and Options for Legislative Consideration Quarter Ending December 31 2003 Dollars in Thousands
03-05 05-07 07-09 09-11 11-13 Ten Year Total Adjusted Net Adjusted Net Adjusted Net Adjusted Net Adjusted Net Adjusted Net
SR Project Budget Budget Change Budget Budget Change Budget Budget Change Budget Budget Change Budget Budget Change Budget Budget Change
005 I-5 SR 526 (Marine View 11000 16000 5000 6300 110000 103700 54780 88000 33220 121900 - (121900) 44680 - (44680) 238660 214000 (24660) Drive)
099 SR 99 Alaskan Way Viaduct 45000 45000 - 12000 40000 28000 40000 40000 - 40000 40000 - 40000 12000 (28000) 177000 177000 -
405 I-405 Congestion Relief 46000 46000 - 99840 114840 15000 139020 199020 60000 160195 125195 (35000) 40000 - (40000) 485055 485055 -Projects
522 SR 522 Bothell-UW Campus 8000 - (8000) - 8000 8000 - - - - - - - - - 8000 8000 -Access
539 SR 539 I-5 Improvements 4850 4800 (50) 5500 8300 2800 5200 62800 57600 31500 8000 (23500) 42000 - (42000) 89050 83900 (5150) Ten-Mile Road to Intrsquol Border
Total Projects 114850 111800 (3050) 123640 281140 157500 239000 389820 150820 353595 173195 (180400) 166680 997765 967955 (29810)12000 (154680)
17
Beige Pages - Measures Markers and Mileposts - December 31 2003 19
Financial Information
2003 Transportation Funding Package ndash Paying for the Projects The first edition of the Beige Pages (June 2003) included an in-depth discussion of the Legislaturersquos 2003 Transportation Funding Package The revenue forecast has now undergone several updates since the Legislature enacted the budget The following information reflects the November 2003 forecast changes as well as the impact from the recent Supreme Court decision on Initiative 776 Further refinements to debt service estimates have also been made
Revenue Forecasts The 2003 Transportation Funding Package enacted by the Legislature included tax and fee increases The gas tax was increased by 5cent per gallon and gross weight fees on trucks increased by 15 An additional sales tax on new and used vehicles of 03 and a license plate number retention fee were both established The first two sources are to be deposited to a new account called the Transportation 2003 (Nickel) Account The latter two are to be deposited to the Multimodal Transportation Account that was established several years ago
The following charts show the current projected revenues over the next ten years (for the new funding sources) as forecasted in November 2003 by the Transportation Revenue Forecast Council compared to the legislaturersquos assumed lsquobaselinersquo projections used in the budget-making process in March 2003 Cumulative ten-year totals and individual biennial amounts are both shown
Transportation 2003 (Nickel) Account Revenue Forecast Forecast comparisons include actual March 2003 Legislative Biennial Baseline Compared to
November 2003 Transportation Revenue Forecast Council revenue collection data to date as well Millions of Dollars
as updated projections based on new and revised economic variables The November 2003 forecast includes several months of actual revenue receipt information Gas tax receipts include four months of actual collections and licenses permits and fees include three months of receipts In the Transportation 2003 (Nickel) Account revenue projections for the ten-year period for gas tax receipts were increased over the September 2003 forecast (+105) and licenses permits and fees were forecast to be slightly higher (+05) before taking into account the impact of Initiative 776 However when including the I-776 impact forecasted revenues for licenses permits and fees are down ten percent for the ten-year period In the Multimodal Account licenses permits and fees projected revenue for the ten-year period remained unchanged from the September 2003 forecast Initiative 776 did not impact the Multimodal account
$2000
$1800
$1600
$1400
$1200
$1000
$800
$600
$400
$200
$0
$19240m Baseline Total
November 2003 Forecast Total $18506m
Licenses Permits and Fees 5cent Gax Tax um
ulative
C
$3262 $3186 $3701 $3632 $3912 $3767 $4120 $3907 $4244 $4013
July 1 Baseline Nov 03 Baseline Nov 03 Baseline Nov 03 Baseline Nov 03 Baseline Nov 03 2003 Forecast Forecast Forecast Forecast Forecast
Biennium Ending Biennium Ending Biennium Ending Biennium Ending Biennium Ending June 2005 June 2007 June 2009 June 2011 June 2013
New Sources - Multimodal Account Revenue Forecast March 2003 Legislative Biennial Baseline Compared to November 2003 Transportation Revenue Forecast Council Cumulative and Biennial Totals Millions of Dollars
$600
$400
$200
$0
$3831m Baseline Total
Licenses Permits and Fees 03 Vehicle Sales Tax
Cumulative
November 2003 Forecast Total
$730 667$622 $592 $777 $709 $814 $752 $888 $817 $3537m
July 1 Baseline Nov 03 Baseline Nov 03 Baseline Nov 03 Baseline Nov 03 Baseline Nov 03 2003 Forecast Forecast Forecast Forecast Forecast
Biennium Ending Biennium Ending Biennium Ending Biennium Ending Biennium Ending June 2005 June 2007 June 2009 June 2011 June 2013
Beige Pages - Measures Markers and Mileposts - December 31 2003 18
18 Beige Pages - Measures Markers and Mileposts - December 31 2003
Bond Sales Plan for New Authorizations Provided by the 2003 Transportation Funding Package The 2003 Transportation Funding Package contained two new bond authorizations
bull a gas tax authorization of $26 billion
bull a state General Obligation Bonds (GO) authorization of $3495 million The proceeds from the new gas tax bonds will be used to fund highway projects The debt service will be paid by the revenues from the nickel increase in the gas tax The proceeds from the new state GO bonds will be used to fund rail and ferry projects Debt service for these bonds will be paid from the Multimodal Account Receipts from the new 03 sales tax on new and used vehicles will be deposited to the Multimodal Account and will augment rental car tax receipts and other fees already directed to this account
2003-2005 Biennium
For the 2003-2005 biennium the Legislature appropriated $280 million in proceeds from the new gas tax bonds and $477 million from the state GO bonds To date in this biennium $80 million of gas tax bonds have been sold No new bond sales occurred in this reporting period However in February 2004 (the next scheduled state bond sale) $25 million in gas tax bonds is planned to be sold for the 2003 Transportation (Nickel) Account and $20 million in GO Bonds for the Multimodal Account
The bond sales plan has not changed from the initial report The combined affect of the revenue forecasts bond sales assumptions and project expenditure assumptions is presented in the next section
Financial Plans for Accounts Supporting the 2003 Funding Package Transportation 2003 (Nickel) Account The Transportation 2003 (Nickel) Account was established in the state treasury to be the repository of the new nickel gas tax and the increases in various vehicle licenses permits and fees Bond proceeds from the $26 billion authorization will also to be deposited to this account Uses of the account include cash funding of highway and
Transportation 2003 (Nickel) Account 2003-2005 Budget and Ten-Year Financial Plan dollars in millions
Balance Forward from Previous Biennium Sources Gas Tax Revenues (new 5cent) Licenses Permits and Fees Revenues I-776 Impact (loss of revenue) Interest Earnings Bond Proceeds Federal Funds Local Funds
03-05 $00
2980 231 (26) 43
2800 10 34
05-07 $44
3419 241 (27) 43
5680 97 24
07-09 $171
3533 262 (28) 43
6700 00 09
09-11 $362
3652 284 (29) 43
6430 00 02
11-13 $672
3751 292 (29) 43
4390 00 34
Ten-Year Total
17335 1310 (139)215
26000 107 103
Total Sources of Funds Uses
$6072 $9477 $10519 $10382 $8481 $44930
Cost of Bond Issuance 07 13 17 16 12 65 Bond Sale Underwriters Discount 21 40 50 48 36 195 Debt Service 225 906 1890 2622 3378 9021
Highway Improvements 5697 7943 7338 6909 4628 32515 Highway Preservation 20 103 50 203 1070 1446 Washington State Ferry Construction 57 345 983 274 39 1699 Total Uses of Funds Biennium Ending Balance
$6028 $44
$9350 $171
$10328 $362
$10072 $672
$9163 ($10)
$44940 ($10)
This plan represents the current budget and ten-year financial plan as adopted by the 2003 Legislature and does not contain any proposed adjustments to project delivery
Beige Pages - Measures Markers and Mileposts - December 31 2003 19
Beige Pages - Measures Markers and Mileposts - December 31 2003 21
ferry projects identified by the Legislature and the payment of debt service and other associated costs for bonds sold to provide debt financing for highway projects Since gas tax receipts are deposited to this new account the uses of the account are restricted to highway purposes as required by the 18th Amendment to Washingtonrsquos Constitution The financial plan below brings together all of the projected Sources (tax revenue bond proceeds interest earnings) and Uses (2003-2005 appropriations 10-year projected program expenditures and debt service) of the new account
Changes to projected Sources and Uses of funds have been updated to reflect the most current forecasts As changes either positive or negative are incorporated into the plans the ending balances in the outer biennia are affected The current pro forma which incorporates actual tax collections and current forecast projections predicts a small negative ending balance of approximately $10 million by the end of the 2011-13 biennium The September 2003 pro forma predicted that there might be a negative $165 million shortfall This change is primarily due to a refinement to debt service calculations and the increased gas tax revenue forecast
As mentioned earlier for the ten-year period gas tax receipts were up slightly from the September 2003 forecast ($185 million) and licenses permits and fees were up slightly ($06 million) before the I-776 impact Key economic variables tax receipts and interest rates will continue to change over time Future updates to forecasts as well as inclusion of more actual receipts will further impact the projected final ending balance Additionally actual and revised assumptions pertaining to bond sales and debt service will continue to be incorporated and likewise will impact the outlook for the final ending balance
Impacts of Initiative 776 The 2003 Transportation (Nickel) Account was affected by Initiative 776 the application of which was ruled upon in October 2003 by the State Supreme Court (other affected accounts include the Motor Vehicle Account the Puget Sound Ferry Operations Account and the Washington State Patrol Account) This table shows the projected impact of Initiative 776 to all affected accounts in millions of dollars The 2003 Transportation Account will be negatively impacted over the ten-year period by $139 million
I-776 ImpactsLoss of Revenue by Account dollars in millions
Ten-Year 03-05 05-07 07-09 09-11 11-13 Total
Motor Vehicle Account $307 $272 $280 $289 $297 $1445 Transportation 2003 (Nickel) Account 26 27 28 29 29 139 Puget Sound Ferry Operations Account 06 05 05 06 06 28 Washington State Patrol Account 94 82 84 87 89 436 Biennial Total $433 $386 $397 $411 $421 $2048
Multimodal Transportation Account The Multimodal Transportation Account was established several years ago as the repository for tax revenues and operating and capital expenditures not restricted by the 18th Amendment The 2003 Transportation Funding Package directs receipts to this account from the additional 03 sales tax on new and used vehicles and the license plate number retention fee The most significant pre-existing tax deposited to this account is the rental car tax The 2003 Funding Package also directs bond proceeds from the $3495 million State GO authorization to this account
Beige Pages - Measures Markers and Mileposts - December 31 2003 20
20 Beige Pages - Measures Markers and Mileposts - December 31 2003
Multimodal Account 2003-2005 Budget and Ten-Year Financial Plan (dollars in millions)
03-05 05-07 07-09 09-11 11-13 Ten-Year Total
Balance Forward from Previous Biennium $141 $107 $202 $330 $491 Sources Licenses Permits Fees Distribution 247 270 282 290 302 1391 Rental car tax 453 503 567 627 689 2839 Sales Tax on New amp Used Car Sales 588 648 685 729 792 3442 Miscellaneous Income 15 15 15 15 15 75 Bond Proceeds 478 437 1287 896 398 3495 Federal Revenue 141 54 55 1016 1877 3142 Local Revenue 27 02 02 02 02 33 Total Sources of Funds $1948 $1928 $2893 $3575 $4074 $14417 Operating Uses Cost of Bond Issuance 01 01 03 02 01 09 Bond Sale Underwriters Discount 04 03 10 07 03 26 Debt service 22 93 195 325 439 1073 Transfers to Other Accounts 99 45 45 45 45 279
WSDOT Program Support amp Planning 54 45 46 47 48 240 Public Transportation 493 521 584 627 661 2886 WSF Maintenance and Operations 51 53 54 55 56 268 Rail 376 403 410 418 426 2033 Total WSDOT Operating Uses of Funds $1099 $1163 $1347 $1526 $1679 $6814 Capital Uses Hwy Preservation P0C 17 200 100 00 00 317 WSF Construction W0C 134 82 607 473 00 1296 Rail Y0C 440 327 711 1415 2250 5143
Local Programs Z0C 292 60 00 00 00 352 Total Capital Uses of Funds $883 $669 $1419 $1887 $2250 $7108
Biennium Ending Balance $107 $202 $330 $491 $636 $636
New funding source from the 2003 Legislative Package
Projects funded primarily by New Bonding Authority and Augmented Federal Funds for Rail
New Bond Authorization from the 2003 Legislative Package
Anticipated Federal Funds
The Multimodal Account includes changes to projected sources of funds based on three months of actual receipts and current forecast data As stated above projected revenues from licenses permits and fees for the ten-year period remained unchanged from the September 2003 forecast
Beige Pages - Measures Markers and Mileposts - December 31 2003 21
Beige Pages - Measures Markers and Mileposts - December 31 2003 23
Program Management Information
Management Information Systems and Needs
A key lesson learned from WSDOTrsquos nationwide assessment of project delivery information systems was that successful transportation programs were supported by integrated management information systems Currently WSDOTrsquos hardware and software capabilities in this area pieced together over a period of more than twenty years fall far short of delivering what is necessary to support todayrsquos higher expected levels of oversight and accountability This presents significant challenges
WSDOT managers are required to access project financial plans expenditure plans actual expenditure levels project milestones and project work load estimates from several different management systems Reporting from the various systems while partially automated requires a significant degree of manual intervention and support systems (databases spreadsheets etc)
The 2003 Legislature supported WSDOTrsquos request for a systems modernization assessment study A Legislative Transportation Committee (LTC) workgroup was formed to provide oversight for this project Members include four senators and four representatives charged with recommending actions to the full LTC The workgroup met in September 2003 to initiate review of the project Statement of Work If the statement of work is approved the assessment effort is expected to produce an integration strategy and a project plan for presentation to the transportation committees of the legislature by December 2004
While developing the long-term plan there are pressing short-term needs that are required to shore up the existing systems WSDOT has completed the following activities
bull Added information to the data marts used for reporting program management information (CPMS) and project accounting information (TRAINS) This will provide added support for project and program tracking and will increase reporting options and flexibility of information retrieval
bull Developed a web-based Quarterly Project Report for the Gray Notebookrsquos Beige Pages Trained staff to feed information to the Quarterly Project Report manually and developed a plan to implement electronic data feeds (to be implemented in early 2004)
bull Completed an assessment of the number of projects by project type and by region that have been loaded into the agencyrsquos Project Scheduling Information System (PDIS)
bull Developed a preliminary plan to build a PDIS Data Mart that will make project schedule and status information more readily available for reporting Completion of the data mart is tentatively scheduled for mid-2004
bull Developed a preliminary designbuild work breakdown structure for use in scheduling the mega projects This structure will allow for scheduling and reporting status at a detailed level and assessing the earned value of work done to-date as the mega projects proceed
bull Started development of data marts to provide flexible reporting of the roadway inventory information that supports project scoping and development activities (to be implemented in mid-2004)
Right of Way Acquisition Delays and cost increases in right of way acquisition have affected the delivery of several 2003 Transportation Funding Package projects For example advertisement for the SR 7SR 507 to SR 512 ndash Safety project has been delayed due to 18 adjudicatory hearing requests from property owners adjacent to the project WSDOT expects to complete negotiations with property owners by the end of spring 2004 For details see page 4
The tight delivery schedule for the 2003 Transportation Funding Package presents unique challenges for right of way acquisition In order to minimize future right of way acquisition problems the WSDOT Real Estate Services office (RES) and the Access Management office are analyzing the next two biennia to pick out projects requiring immediate action to assure that right of way is delivered in time for advertisement WSDOTrsquos right of way access and real estate experts have also formed a plan to look for total parcel acquisitions and parcels where access control is already in place thereby avoiding access hearings whenever possible Acquisition plans will be developed as soon as possible and RES will be able to begin to acquire the necessary properties
Beige Pages - Measures Markers and Mileposts - December 31 2003 22
22 Beige Pages - Measures Markers and Mileposts - December 31 2003
Appraisers title examiners and real estate agents in the private sector continue to enjoy a high volume of business due to the low interest rate environment As a result recruitment of experienced real estate professionals to replace retiring right of way staff at WSDOT is proving challenging WSDOT continues to seek qualified professionals to join its staff and will also begin a training program to develop sufficient staff experience to support the large program it needs to deliver over the next decade
Utilities Relocation
As of December 31 no utility relocation issue has caused a project to go on ldquoWatch Listrdquo status
One of the keys to avoiding obstacles to project delivery from utilities relocation is to give utility companies as much notice as possible of WSDOT project impacts to their facilities This allows the utilities adequate time for design budgeting and scheduling of the utility relocation Below is an example of WSDOTrsquos coordination efforts with the goal of minimizing utility relocation risks to our project schedules
bull Widen I-5 Each Direction from Salmon Creek to I-205
NW Natural had concerns that the pressure in its natural gas lines would not adequately serve the neighborhood to the west of Interstate 5 once the NE 129th Street over crossing was demolished WSDOT and NW Natural changed the original plan to run the gas line across the new bridge at 129th The new plan utilized horizontal directional boring equipment to place the line under Interstate 5 allowing the utility to navigate around proposed drainage drilled shafts for the new bridge and retaining walls
Comcast also voiced concern regarding running a temporary line during the reconstruction of the bridge WSDOT worked to provide a new freeway crossing at the 134th Street interchange rather than at 129th Street
bull SR 270 Pullman to Idaho State Line ndash Additional Lanes
An initial meeting has taken place with Avista Utilities for gas line relocation along the SR 270 corridor This allows approximately one year to complete design and relocation prior to the start of the contract
bull SR 31 ndash Metaline Falls to the Canadian Border ndash Reconstruction
A new fiber optic line was recently installed at the north end of the project to enhance communications to the Metaline Falls Border Crossing After coordination with WSDOT the Pend Oreille Telephone Company placed the line so that it would not impact roadway construction
bull US 395 North Spokane Corridor - Gerlach to Wandermere
An agreement has been made with Bonneville Power Administration to initiate design work on tower relocation and reconstruction The design work is to be completed by April 2004 Construction is scheduled to begin in November 2004
WSDOT is also coordinating with the PUD and local communications companies in Pacific County on US 101 in the vicinity of South Bend to make design adjustments so that underground utility lines can be placed at the time WSDOT raises the grade of the road for the SR 105 Mitigation ndash Willapa River Estuarine project This will not impede the traffic staging of the project and will decrease the risk of any utility relocation delays to the contractor
Environmental Documentation Review Permitting and Compliance WSDOT is overseeing a statewide transportation improvement program that creates new opportunities for aligning citizensrsquo goals for the environment and for transportation systems We are working to change the way we communicate these objectives and the interrelated nature of the complex issues in both protecting and improving the environment from the delivery of transportation projects
Beige Pages - Measures Markers and Mileposts - December 31 2003 23
Beige Pages - Measures Markers and Mileposts - December 31 2003 25
Environmental Documentation and Review
Compliance with the Endangered Species Act
About forty Nickel projects remain to be advertised for construction in this biennium according to WSDOTrsquos delivery plan Twenty-three of these projects have completed their required consultations under Section 7 of the Endangered Species Act Transportation projects that do not use federal funds are not required to obtain Section 7 consultation from the Endangered Species Act Two projects will not require Section 7 consultation because no federal funding will be allotted for project Eleven projects in the preliminary stages of design cannot seek the consultation process at this time until the Biological Assessments are completed Consultation on these projects should begin in 2004
There are two projects currently undergoing consultation with NOAA Fisheries and the US Fish and Wildlife Service (USFWS) The SR 31 Metaline Falls to Canadian Border Reconstruction project is undergoing formal consultation with the USFWS to address Canada Lynx concerns The I-90 Two Way Transit amp HOV project is undergoing consultation with NOAA Fisheries and USFWS
Three local projects funded with Nickel Funds revenues will be lead through the consultation process by local governments (City of Shoreline the City of Bremerton and the Hood Canal Coordinating Council) Two projects for WSDOT to deliver statewide (Statewide Bridge Rail Retrofit and Statewide Guardrail Retrofit) will be taken through consultation by the regional offices acting on a regional basis Two regions have already completed the consultation process for these projects
A team of three experienced WSDOT biologists was deployed to the Western Washington Office of the USFWS to address the approximately 20 projects stalled in review This staff assignment accomplished the completion of consultations for 15 projects including the SR 9 ndash SR 522 to 176th St project A new backlog is beginning to build due to the need to reinitiate consultation on a number of projects including the Hood Canal Bridge Replacement In addition the backlog is compounded with the extensive amount of time that seems to be required to be spent in consultation on some of the more complex projects The Federal Highway Administration WSDOT and USFWS are continuing discussions on how to address this problem
Program Delivery Tracking Sheet for ESA Section 7 Consultation WSDOT Projects rsquo03 -rsquo05 Biennium
NOAA Fisheries USFWS
Project Biological Assessment
Consultation Status
Biological Assessment
Consultation Status
NEPA Type
NEPA Complete
Proposed Ad Date
SR 31 Metaline Falls to Inttrsquol Border NA NA 81003 Waiting EA 120503 41004
I-90 Two Way Transit and HOV 11212003 Waiting 122103 Waiting FEIS 033004 106
Consultant Utilization
There are two main areas where consultants are expected to be utilized on 2003 Transportation Funding Package projects The first is to augment WSDOTrsquos workforce so WSDOT can minimize the inefficiencies associated with short-term workforce expansions and contractions The second is to fill needs for specialized expertise that may not be available ldquoin-houserdquo
When WSDOT established the Urban Corridors Office in 2003 contracting efforts were directed at having a sufficiently large pool of qualified talent to draw from quickly and efficiently without time delays With that goal currently being met the emphasis has shifted slightly to identifying the ldquoBest of the Bestrdquo in a variety of specialized areas allowing WSDOT to draw upon top expertise at national and international levels
Regional Transportation Improvement District (RTID) Projects The 2003-2005 Transportation Budget requires the Regional Transportation Improvement District (RTID) to conduct an independent review of all project scopes and budgets prior to placing projects on the ballot WSDOT management is assisting RTID by identifying and assembling a ldquoPanel of Expertsrdquo to review CEVPreg and Cost Risk Assessment projects National or international experts with experience in a wide range of engineering disciplines and in cost risk assessment will be sought The panel selection should be complete early next quarter
Beige Pages - Measures Markers and Mileposts - December 31 2003 24
24 Beige Pages - Measures Markers and Mileposts - December 31 2003
On-Call Services WSDOT currently has over 200 different consulting firms committed to providing services to the State on short notice through ldquoOn-Callrdquo contracts Many of these firms which range from single person consultants to large multi-tiered organizations have internationally recognized experts on staff Currently twelve prime contractors plus their sub-consultants are under contract to provide project specific services across the state
2003 Transportation Funding Package - Consultant Utilization to Date For the quarter ending December 31 2003 WSDOT paid $2556500 to firms providing services on 2003 Transportation Funding Projects Over 300 people were working directly on a full or part time basis on these projects Over $5000000 was authorized as new work in the quarter
Construction Employment Information
Contractor Employment
The 2003 Transportation Funding Package supports transportation projects that make important and long-term contributions to the statersquos economy and the productivity and economic well-being of its citizens Far from the only or even the largest of these impacts is the direct and indirect economic benefits of the construction activity itself one aspect of which is the creation of jobs to built the projects
The direct and indirect benefits of construction employment have been extensively examined by labor economists A useful guide is Associated General Contractors of Washington Economic Impact of the Construction Industry on the State of Washington 2002 Update (prepared by the University of Washington)
How many people are at work on the 2003 Transportation Funding Package projects
The precise number for obvious reasons is impossible to state The jobs are not just at the job site but include designers and project engineers (many of whom divide their efforts among many projects) suppliers and their employees and many others Even for the contractors employment supported by these projects includes home office as well as job site staff And at the job site the employment count varies from day to day depending on subcontractor activity the sequencing of job activities and even the weather We have asked contractors on the Nickel Fund projects in construction to provide the WSDOT construction office with a ldquosnapshotrdquo number what is your best estimate of the ldquoaveragerdquo direct job site employment on your job over the course of the quarter The following table captures the prime contractorsrsquo responses for their own work and their on-site subcontractors on the Nickel Fund projects that have already gone into construction
ProjectContractor
Average project employment for Oct-Dec 2003
I-5 Widening Each Direction from Salmon Creek to I-205 Hamilton Construction and its 24 subcontractors
24 employees
SR 500 New Interchange and Additional Lanes Tapani Underground Inc and its 18 subcontractors
21 employees
I-90 Build Lanes from Argonne Road to Sullivan Rd Scarsella Brothers Inc and its 13 subcontractors
19 employees
I-90 Rye Grass Summit to Vantage Superior Paving Company and its 10 subcontractors
14 employees
I-90 Highline Canal to Elk Heights Scarsella Brothers Inc and its 12 subcontractors
17 employees
I-182US 395 Interchange ndash Roadside Safety Transtate Paving Company and its 2 subcontractors
6 employees
Construction Safety Information WSDOT and the AGC are currently finalizing the details of a method to jointly report safety data for the nickel projects The expected outcome will be a combined safety rating for the contractor and WSDOT staff on each of the Nickel Fund projects
Beige Pages - Measures Markers and Mileposts - December 31 2003 25
Beige Pages - Measures Markers and Mileposts - December 31 2003 26
Worker Safety Quarterly Update Continuing updates on Gray Notebook safety topics ndash data is shown for calendar year (CY) 2000 CY 2001 fiscal year (FY) 2002 FY 2003 and FY 2004 by quarter
WSDOT Highway Maintenance WorkersRecordable Injuries per 100 Workers per Fiscal Year
CY 2000
CY 2001
FY 2002
FY 2003
Qrtr 1 Qrtr 2 YTD 2004
0
5
10
15
20
FY 2004
Highway and Street Construction Benchmark 82
The second quarter recordable injury rate for maintenance workers was 62 injuries per 100 maintenance workers There were 22 recordable injuries during the second quarter of which 9 were lost workday cases accounting for 202 lost workdays This is a 24 decrease in injuries and a 17 reduction in lost workdays from the first quarter The three most frequent types of injuries for the second quarter were dislocation (27) occupational illness (23) and sprainstrain (23) The three most frequent causes of injuries for the quarter were struck by an object (23) overexertion (18) and falls from the same level (14) The three most frequent injuries to the body were back (32) ear (14) and hand (9)
Accident Prevention Activities Second Quarter FY 2004 bull The South Central Regionrsquos Maintenance division is identifying
targets and strategies to decrease personal injuries within work groups Four of five sections reduced their yearly injury average Accountability and awareness has increased substantially and the numbers reflect significant improvement
bull The Eastern Region is revising its Accident Review Board process to make it more accountable for overall safety
bull WSDOT completed a successful West Nile Virus campaign during the second quarter Between May and October 2003 WSDOT spent about $92000 for the West Nile Virus program This included obtaining materials training people monitoring sites and application of pesticides under the direction of the Department of Health (DOH) DOH reported that no human or animal cases were confirmed in Washington in 2003 However nationally in 2003 there were 7718 human cases with 166 deaths In 2002 there were 4156 cases and 284 deaths
Reading the ChartsldquoRecordable Injuries and Illnessesrdquo is a standard measure that includes all work related deaths and work related illnesses and injuries which result in loss of consciousness restriction of work or motion transfer to another job or require medical treatment beyond first aid The US Bureau of Labor Statistics provides the selected 2000 national average benchmarks After discussion with the National Bureau of Labor Statistics the following benchmarks were selected to provide a more relevant and consistent benchmark Maintenance ldquoHighway and Street Constructionrdquo Standard Industry Classification (SIC) 161 (rate 82) Engineering ldquoEngineering and Architect Servicesrdquo SIC 871 (rate 17) Ferry Vessel Workers ldquoWater Transportationrdquo SIC 44 (rate 70) One worker equals 2000 hours per year
WSDOT Ferry Vessel WorkersRecordable Injuries per 100 Workers per Fiscal Year
0
5
10
15
20
CY 2000
CY 2001
FY 2002 FY 2004
Qtr 1 YTD 2004
FY 2003
Qrtr 2
Water Transportation Benchmark 70
The second quarter recordable injury rate for ferry vessel workers was 98 injuries per 100 ferry vessel workers There were 23 recordable injuries during the second quarter of which 21 were lost workday cases accounting for 268 lost workdays This is a 4 decrease in the number of recordable accidents and a 36 reduction in the number of lost time days from the first quarter There are less worker hours this quarter causing a slight increase in the recordable accident rate even though the actual number of accidents dropped slightly The three most frequent types of injuries were sprainstrain (52) chemical exposure (13) and aggravation of a previous injury (13)The three most frequent injuries to the body were the back (13) circulatory system (13) and multiple (13)
Source for all charts WSDOT Safety Office
WSDOT Highway Engineer WorkersRecordable Injuries per 100 Workers per Fiscal Year
CY 2000
CY 2001
FY 2002
FY 2003
Qrtr 1 Qrtr 2 YTD 2004
0
5
10
15
20
FY 2004
Engineering and Architect Services Benchmark 17
The second quarter recordable injury rate for engineer workers was 16 injuries per 100 engineer workers There were 8 recordable injuries during the second quarter of which 7 were lost workday cases accounting for 56 lost workdays There are less worker hours this quarter causing a slightly higher accident rate even though the number of injuries remained the same The three most frequent types of injuries for the quarter were sprain strain (38) occupational illness (25) and lacerations (25) The three most frequent causes of injuries were overexertion (25) falls from the same level (25) and noise (25) The three most frequent injuries to the body were the back (25) ear (25) and knee (13)
Measures Markers and Mileposts - December 31 2003 27
Measures Markers and Mileposts - December 31 2003 29
0
5000
6000
7000
June Dec June Dec June Dec June Dec June Dec June Dec June 1997 1997 1998 1998 1999 1999 2000 2000 2001 2001 2002 2002 2003
Number of Permanent Full-Time Employees at WSDOT
Initiative 695 passed by voters
Referendum 49 passed by voters
5617 5671 6017 5960 5992 6181 6322 6366
Referendum 51 defeated by voters
6325 6171 6258
Dec 2003
WSDOT Workforce Levels One indicator of the agencyrsquos workforce size is the current number of permanent full-time employees on staff The accompanying chart shows that number at various points since the end of 1996 (The number of ldquoFTEsrdquo [full-time equivalents] will generally exceed the number of full-time employees since seasonal and part-time work force must also be funded from ldquoFTErdquo allotments)
Source WSDOT Office of Human Resources
Training for WSDOT Highway Maintenance Employees WSDOT continues progress toward achieving training goals for maintenance employees A total of 24 safety and maintenance courses are required by law andor regulation The chart shows status of training completed for 6 of the 13 required safety courses and 5 of the 11 maintenance courses
Maintenance Total Current Workers Maintenance Maintenance Maintenance Compliance Change
Requiring Workers Workers Workers to Date Since Training Trained to Date Trained 1st Trained 2nd Target = Last Dec 03 Dec 03 Quarter FY04 Quarter FY04 90 Quarter
Safety CoursesBlood Borne Pathogens 1243 1064 13 46 86 +2First Aid 1480 1383 6 0 93 -2Hearing Conservation 1363 1255 0 0 92 -3Personal Protective Equipment 1361 894 216 0 66 +1Fall Protection 750 403 19 0 54 +2Flagging amp Traffic Control 1149 1109 1 0 97 -1
Maintenance Courses Drug Free Workplace 326 287 0 0 88 +1Forklift 1173 1036 37 28 88 +0Hazardous Materials Awareness 986 671 85 90 68 +8Manlift Operations 523 307 0 8 59 -3Excavation Trenching and Shoring 438 302 45 93 69 +13
Training for All WSDOT Employees The following table reflects continued progress on important workforce training courses that help shape WSDOTrsquos workplace These courses are for all permanent full-time part-time and temporary employees The goal is to have 90 of our workforce trained as promptly as resources allow
Number of Number Employees Number Number Compliance Change
Requiring Trained to Date Trained 1st Trained 2nd to Date Since LastTraining Dec 03 Quarter FY04 Quarter FY04 Target = 90 Quarter
Training CoursesDisability Awareness 7295 2567 116 131 35 +1Ethical Standards 7295 7050 82 82 97 0Security Awareness - all employees 7295 5711 17 0 78 +4Security Awareness - supervisors 2884 1474 0 0 53 +1Sexual HarassmentDiscrimination 7295 4880 71 149 67 +14Valuing Diversity 7295 3200 129 142 44 +2Violence that Affects the Workplace 7295 5910 6 7 81 +6
In past quarters non-supervisory employees were incorrectly credited by WSF for attendance at Security Awareness for Supervisors training This has now been corrected
Source WSDOT Office of Human Resources Staff Development
Measures Markers and Mileposts - December 31 2003 28
28 Measures Markers and Mileposts - December 31 2003
Highway Construction Program Quarterly Update Meeting WSDOTrsquos Scheduled Advertisement Dates The Highway Construction Program is the largest capital program in the Transportation Budget Planned expenditures for the 2003-2005 biennium are approximately $23 billion Overall delivery of the Highway Construction Program is tracked and monitored against schedule projections for ad dates and for project cash flow The first is ldquoMeeting WSDOTrsquos Scheduled Advertisement datesrdquo The second is ldquoCash Flowrdquo Funding for the 2003-2005 Highway Construction Program includes a variety of fund sources including pre-existing transportation funds 2003 Transportation Funding Package (ldquoNickelrdquo funds) and Tacoma Narrows Bridge funds The program includes 345 construction projects for advertisement during the current biennium of which 46 are ldquoNickelrdquo projects and 299 are funded with pre-existing funds Overall including preconstruction activities on construction projects to be advertised in future biennia more than 1000 projects will be underway during the 2003-2005 Biennium In the 2003 Transportation Funding Package there were 20 projects originally planned for advertisement in the biennium through the end of the second quarter Of the planned total 15 have been advertised four have been rescheduled for later in the biennium and one has been deferred to the 2005-2007 biennium There were 70 pre-existing fund projects planned for advertisement by the end of the second quarter 42 have been advertised as planned 26 have been rescheduled for later in the biennium and two have been deferred to the 2005-2007 biennium In addition three projects were advanced from quarters later in this biennium and were advertised in the first quarter for a total of 45 projects that have been advertised to date
Ad Date 2003 Transportation Funding Package (ldquoNickel Fundsrdquo) Of the nine projects planned to be advertised in this quarter seven projects were advertised as planned one project was delayed for advertisement to later in the biennium and one will be deferred to the 2005-2007 biennium (for more detail see the Beige Pages) One project was advanced from the eighth quarter for a total of eight advertised projects
bull Seven projects were advertised as plannedSR 9SR 528 Intersection ndash SignalSR 16 HOV Improvements between Olympic
View Drive and Union Ave US 97A Entiat Park Entrance ndash Turn Lanes SR 124 East Jct SR 12 - Reconstruction
Highway Construction Program Delivery Planned vs Actual Number of Projects Advertised 2003-2005 Biennium Quarter 2 Ending December 31 2003
350
300
250
200
150
100
50
0 Qtr 1 Qtr 2 Qtr 3 Qtr 4 Qtr 5 Qtr 6 Qtr 7 Qtr 8
Planned Pre-Existing Funds Ads
Actual Pre-Existing Funds Ads
Transportation Funding Package Planned Ads
Transportation Funding Package Actual Ads
Source WSDOT Project Control and Reporting Office
SR 161234th Street to 204th Street ESR 203NE 124thNovelty Rd VicinityUS 395Kennewick Variable Message Sign
bullOne project was advanced SR 527132nd St SE to 112th St SE
bullOne project was delayed to a future quarter in 2003-2005 SR7SR 507 to SR 512 ndash Safety
bullOne project was deferred to 2005-2007 SR 522I-5 to SR 405 Multi-Modal Project
Ad Date Pre-Existing Funding Of the 58 projects scheduled for advertisement with pre-existing funds in the second quarter 34 projects were advertised as scheduled 22 have been delayed slightly to later in the 2003-2005 biennium two were deferred to beyond the 2003-2005 biennium and two projects were advertised in response to emergencies bull The following are six examples of pre-existing projects advertised as planned US 101 Olympic National Park to Indian Creek ndash This project overlays approximately three miles of existing roadway pavement between Olympic National Park and Indian Creek I-5 Stewart - South Bound off Ramp ndash The existing signal system will be replaced with a signals using poles and mast arms WSDOT will be conducting a feasibility assessment of connecting the new signal system to the City of Seattlersquos centralized system SR 11 Whatcom County Line to Bellingham ndash This project will resurface approximately four miles existing roadway and restore safety features between the Whatcom County Line and the City of Bellingham
Measures Markers and Mileposts - December 31 2003 29
Measures Markers and Mileposts - December 31 2003 31
SR 26 Union Flat Creek-Improve Drainage On SR 26 west of Colfax the design of this project will stabilize the roadway structure by reconstructing approximately 1200 linear feet of creek channel away from the roadway There will also be check dams to slow the flow of the creek and protect the roadway from erosion
SR 127 Central Ferry to Church Hill Road At Central Ferry and extending eight miles north on SR 127 the project preserves the pavement and extends the service life by paving with Asphalt Concrete Pavement mixture and will restore the basic safety features of the highway US 97 Blewett Pass South ndash Paving From the junction with SR 970 to the north of the summit the project is to resurface existing roadway pavement to maintain the integrity of the roadway
bull The following are two examples of delayed projects SR 20 Troxell Road to Deception Pass ndash Current design issues could not be resolved and will require additional engineering changes to meet environmental requirements This will delay the project until February 2005 US 395 Deadman Creek Fish Barrier Retrofit ndashAfter a project costbenefit analysis was conducted in conjunction with the Department of Fish and Wildlife both WSDOT and WDF believe that funds for this project could be used for similar projects that would gain better results
bull Two projects were added in response to emergencies SR 20 Rockslide ndash On Sunday November 9 2003 at 6 am a rockslide estimated at two to three million cubic yards occurred above State Route 20 at milepost 1215 The rockslide left the hillside extremely unstable damaged two sections of the highway and left the small town of Diablo cut off Currently monitoring equipment and minor highway repairs give Diablo residents Seattle City Light personnel National Parks Service and WSDOT personnel limited access to the highway The highway is open between 8 am and 4 pm when flaggers are in place In early February 2004 contractors will turn in a report to WSDOT with proposals for long-term solutions that will reopen the highway permanently US 101 Hoh River Erosion ndash In response to storm-related erosion WSDOT replaced washed out armoring and stream barbs with huge boulders along the Hoh river bank in an effort to keep the river from washing out sections of SR 101 Placement of the boulders is a temporary solution A permanent solution to this problem is being reviewed To meet permitting requirements of the Washington State Department of Fish and Wildlife WSDOT completed a Reach Analysis for this section of river in 2002 The Federal Highway Administration reviewed WSDOTrsquos approach to fixing the problem and has agreed to fund a permanent solution with federal funds WSDOT is now completing a conceptual design in accordance with the Reach Analysis and will have a cost estimate completed by the end of February 2004
Cash Flow on Highway Construction ProjectsHighway Construction Program Cash Flow2003 Transportation Funding Package Highway Construction Program Cash FlowPlanned vs Actual Expenditures (ldquoNickel Fundsrdquo) Planned vs Actual Expenditures 2003-2005 Biennium Quarter 2 ending December 31 20032003-2005 Biennium Quarter 2 Ending December 31 2003Dollars in BillionsExpenditures for highway projects through the quarter Dollars in Billions
ending December 31 2003 were $442 million This $12
represents 8 percent of the budgeted cash flow for the biennium At this point expenditures using the 2003 Transportation Funding Package are within one percent of meeting the plan The expenditure rate will increase as more projects are awarded or moved from a pre-existing project and added to the nickel list of projects The expected pattern of 2003 Transportation Funding Package spending is illustrated by the fact that expenditures in the 8th quarter of 2003-2005 are expected to be 28 percent of the entire bienniumrsquos budgeted cash flow
Qtr 1 Qtr 2 Qtr 3 Qtr 4 Qtr 5 Qtr 6 Qtr 7 Qtr 8
Source WSDOT Project Control and Reporting Office Pre-Existing Funding For the first two quarters of the biennium WSDOT submitted an expenditure plan to the legislature for approximately $328 million As of December 31 2003 expenditures totaled $265 million This leaves a variance of approximately $64 million or 192 percent from the plan WSDOT is currenlty seeking legislative direction on projects with programmatic variance
$0
$02
$04
$06
$08
$10
Planned Pre-Existing Funds
Actual Pre-Existing Funds Planned
Transportation Funding Package
Actual Transportation
Funding Package
Measures Markers and Mileposts - December 31 2003 30
30 Measures Markers and Mileposts - December 31 2003
Special Safety Improvements Quarterly Update
Meeting WSDOTrsquos Scheduled Advertisement Dates for the Safety Improvement Subprogram While elements that improve safety are a part of almost every highway construction project a special program sub-category established by the legislature covers the projects that are designed to address issues in ldquohigh accident corridorsrdquo and ldquohigh accident locationsrdquo These projects are identified by WSDOT based on information about the history of accident frequency and severity While these projects account for only a small portion of the overall benefits to safety from highway improvements WSDOT tracks the advertisement of these projects just as with other projects in the program in order to provide a picture of program delivery on issues that are of great importance on particular locales around the state that have been selected for this program treatment bullOf the 14 projects planned for ad these six projects were advertised as scheduled for this quarter
I-5Ramps at Michigan ndash CorsonAlbroSwift SR 9SR 528 Intersection ndash Signal I-90Moses Lake West Safety Improvements SR 124East Jct SR 12 ndash Reconstruction SR 203NE 124thNovelty Rd Vicinity US 395Kennewick Variable Message Sign
Safety Improvement Program Delivery Planned vs Actual Number of Projects Advertised 2003-2005 Biennium Quarter 2 Ending December 31 2003
90
80
70
60
50
40
30
20
10
0
Actual
Planned
Qtr 1 Qtr 2 Qtr 3 Qtr 4 Qtr 5 Qtr 6 Qtr 7 Qtr 8
Source WSDOT Project Control and Reporting Office
bull Eight projects were deferred for advertisement later in the biennium
SR7SR 507 to SR 512 ndash Safety SR 20Oak Harbor NCL to Frostad Road SR 20Monkey Hill Rd to Troxell Rd SR 20Sapp Rd to Reed St ndash Rechannelize SR 20Troxell Rd to Deception Pass Vic SR 20Frostad Road Vicinity ndash Guardrail SR 24South Wahluke Slope ndash Guardrail SR 290Helena Street ndash Add Turn Lane
Measures Markers and Mileposts - December 31 2003 31
Measures Markers and Mileposts - December 31 2003 33
End-of-2003 Season Highway Construction Project EvaluationsThird Annual Report The annual Construction Highlights report is an end-of-the-year synopsis of construction projects that were completed or nearly completed during the previous construction season Each regionrsquos project office evaluates how well its projects were carried out This is WSDOTrsquos third year publishing this report
This yearrsquos report is an assessment of 23 projects statewide representing a variety of construction types and settings Each project is rated in four elements of construction ndash design construction management schedule and cost and each element is assigned a one-to-five star rating (one is the lowest ranking while five is the highest) Contractorrsquos names are listed for identification but the detailed report shows that the strength or weaknesses of a particular project are often as much WSDOTrsquos responsbility as the contractorrsquos (guiding of design for example) and the best projects seem always to be built on strong teamwork for the entire project team The complete report can be found at wwwwsdotwagov projects2003highlights
Highway Construction Project Rating for 2003 Season Construction
Project Design Management Schedule Cost Contractor SR 504 Castle Rock laquolaquolaquolaquolaquo laquolaquolaquolaquolaquo laquolaquolaquolaquolaquo laquolaquolaquolaquolaquo Lakeside Ind SR 28 Rock Island laquolaquolaquolaquolaquo laquolaquolaquolaquolaquo laquolaquolaquolaquolaquo laquolaquolaquolaquolaquo Scarsella Bros US 395 Hillsboro laquolaquolaquolaquo laquolaquolaquolaquo laquolaquolaquolaquolaquo laquolaquolaquolaquolaquo M A DeAtleySR 26 Vantage laquolaquolaquolaquo laquolaquolaquolaquolaquo laquolaquolaquolaquolaquo laquolaquolaquolaquolaquo Central WA AsphaltSR 8 McCleary laquolaquolaquolaquo laquolaquolaquolaquolaquo laquolaquolaquolaquolaquo laquolaquolaquolaquo Scarsella BrosUS 12 Brady - Malone laquolaquolaquolaquo laquolaquolaquolaquolaquo laquolaquolaquolaquolaquo laquolaquolaquo Lakeside IndI-90 Sunset laquolaquo laquolaquolaquolaquo laquolaquolaquolaquolaquo laquo Kiewit ConstI-405SR 167 IC laquo laquolaquolaquo laquolaquo laquo Max J KuneySR 520 10th to Midspan laquolaquolaquolaquo laquolaquolaquolaquo laquolaquolaquo laquolaquolaquolaquolaquo Colvico IncI-90 Eastgate laquolaquolaquolaquo laquolaquolaquolaquo laquolaquolaquolaquo laquolaquolaquolaquolaquo Lakeside IndI-405 Cole Creek Parkway laquolaquolaquo laquolaquolaquolaquo laquolaquolaquolaquo laquolaquo Tri-State ConstructionSR 141 Klickitat Co Paver laquolaquolaquolaquo laquolaquolaquolaquolaquo laquolaquolaquolaquolaquo laquolaquolaquolaquolaquo Mid-Columbia PavingSR 20 Methow River Bridge laquolaquolaquolaquo laquolaquolaquolaquolaquo laquolaquolaquolaquo laquolaquolaquolaquolaquo One Way ConstructionSR 167 N Meridian to King laquolaquolaquolaquolaquo laquolaquolaquolaquolaquo laquolaquolaquolaquolaquo laquolaquolaquolaquolaquo ICON MaterialsI-5 Puyallup River Bridge laquolaquolaquolaquolaquo laquolaquolaquolaquolaquo laquolaquolaquolaquolaquo laquolaquolaquolaquolaquo CBI IncSR 161 Clear Lake Rd laquolaquolaquolaquolaquo laquolaquolaquolaquolaquo laquolaquolaquolaquolaquo laquolaquolaquolaquolaquo Tucci and SonsSR 525 SR 99 to SR 526 laquolaquolaquolaquo laquolaquolaquolaquo laquolaquolaquolaquolaquo laquolaquolaquolaquo KLB ConstructionUS 2 Barclay Creek Bridge laquolaquolaquolaquo laquolaquolaquolaquolaquo laquolaquolaquolaquolaquo laquolaquolaquolaquolaquo Wilder ConstructionSR 290 Trent Ave Bridge laquolaquolaquo laquolaquolaquo laquo laquolaquolaquolaquo Ross BrosI-90 Sullivan Rd laquolaquolaquolaquolaquo laquolaquolaquolaquolaquo laquolaquolaquolaquolaquo laquolaquolaquolaquolaquo Inland Asphalt CoSR 510 I-5 Pacific laquolaquolaquolaquo laquolaquolaquolaquo laquolaquolaquolaquo laquolaquolaquolaquo Scarcella BrosSR 125 Military Road laquolaquolaquolaquo laquolaquolaquolaquo laquolaquolaquolaquolaquo laquolaquolaquo Transtate PavingI-5 Samish Way laquolaquolaquolaquo laquolaquolaquolaquo laquolaquolaquolaquolaquo laquolaquolaquo Wilder ConstructionFour other projects of interest were included in the report but not evaluated SR 16 Tacoma Narrows Bridge SR 104 Hood Canal Bridge SR 433 Lewis and Clark Bridge and the Moses Lake Wetland Mitigation Bank Five star rating system one represents the lowest rating five represents the highest
WSDOT Asks the Publicrsquos Opinion Included for the first time in this annual Construction Highlights report is a public opinion questionnaire evaluating one project in each of WSDOTrsquos six regions Motorists who traveled through state highway construction projects over the past summer have an opportunity to tell WSDOT what they did or did not like what worked or did not work by visiting wwwwsdotwagovprojects2003highlights
WSDOT will use the public comments to improve the way projects are managed and communicated in the future Results of the public evaluation will be posted for each of the six projects Projects included are I-90 Sunset Interchange in King County I-5 Puyallup River Bridge in Pierce County State Route (SR) 141 Klickitat County Paver US 395 Hillsboro Street Interchange in Franklin County I-90 Sullivan Road to Idaho State Line Paving in Spokane County and SR 28 Rock Island Rock Slopes in Douglas County
Measures Markers and Mileposts - December 31 2003 32
32 Measures Markers and Mileposts - December 31 2003
Gig Harbor Tacoma
For scale The ferry Tacoma
Tacoma Narrows Bridge Project Update Designbuilder Tacoma Narrows Constructors (TNC) now stands at 263 construction completion of the new State Route 16 Tacoma Narrows Bridge project In December 2003 TNC reached another significant milestone ndash that of ldquotouching downrdquo the Gig Harbor (west) caisson onto the 133-foot-deep Narrows seabed In January TNC expects to touch down the Tacoma (east) caisson on the seabed at an even lower depth of 149 feet Following touchdown crews will continue placing reinforced concrete to build caisson internal and external walls while they dredge soil from the 15 hollow cells in each caisson Dredging will allow the caissons to sink another approximately 60 feet into the Narrows seabed At that point crews will start building the towers above water Other bridge work continues as well including anchorage construction and the overseas fabrication of the suspension cable wire Excavation work on both the Tacoma and Gig Harbor anchorages is finished The Tacoma anchorage has already had four massive concrete pours and crews are preparing to begin placing concrete on the Gig Harbor anchorage Roadwork also continues to move at a rapid pace Crews plan to complete the new eastbound on ramp and exit at 36th Street NW along with 22nd Street construction and open all to traffic in March Construction continues on several large retaining walls erosion control measures are in place for the winter season and landscaping along SR 16 is underway On February 2 the state Department of Ecology (DOE) fined WSDOT and TNC jointly $10000 for inadequate treatment of construction storm water During several rain events between October and January discharges of cloudy stormwater from the project site in the Narrows exceeded permit limits Since October project staff have worked hard to improve environmental compliance by implementing DOE environmental recommedations including implementing best-management-practice
Measures Markers and Mileposts - December 31 2003
Landscaping at 36th St on-ramp
Tacoma anchorage concrete pour Tacoma caisson concrete pour
Tacoma caisson construction
Tacoma Narrows Bridge Project Progress to Date Percent Complete
995Design
263Construction
314Total(1)
0 10 20 30 40 50 60 70 80 90 100
(1) Weighted 7 Design progress and 93 Construction progress
Source WSDOT Engineering and Regional Operations Division
stormwater treament controls increasing water monitoring and testing and monitoring stormwater detention ponds steps For more information on WSDOTrsquos environmental commitments see page 45 of this Gray Notebook For additional information including financial information project schedule traffic information photo library and more please visit wwwtacomanarrowsbridgecom
33
Measures Markers and Mileposts - December 31 2003 35
104 Hood Canal Bridge Project Update
Graving Dock Progress on the project remains almost at a standstill as efforts continue among WSDOT the Lower Elwha Klallam Tribe the State Office of Historic Preservation FHWA and the Army Corps of Engineers to resolve issues presented by the discovery in August 2003 of a significant archaeological find The process must establish compliance with the requirements of Section 106 of the National Historical Preservation Act in order for construction work to resume at the site probably following a period of intensive archaeological activity Meanwhile despite the lack of physical construction at the graving dock site the contractor completed a restoration project at Ediz Beach Close to 1500 feet of shoreline was cleared contoured and reseeded For many years the Ediz Beach area was unsafe and inaccessible due to logs pilings and other debris WSDOT removed these articles at low tide to avoid disturbing the harbor waters This restoration provides a healthy natural environment for native plants and animals and may also encourage the spawning of sand lance (a small fish) a significant portion of juvenile salmonrsquos diet It was completed on time and in accordance with a Hydraulic Project Approval (HPA) issued by the Department of Fish and Wildlife as mitigation for
Project Progress to Date Percent Complete
Total 88
0 10 20 30 40 50 60 70 80 90 100
(Percent completion based on contract dollars)
Source WSDOT Engineering and Regional Operations Division
Before
After
use of shoreline access to the graving dock The mitigation project had to be completed before October 15 2003 to minimize disturbance of the sand lance during its spawning period
Bridge Site Construction continued at the bridge site with the contractor Kiewit-General of Poulsbo building a temporary work trestle at the bridgersquos east end The work trestle eventually will support the new east-half transition span Plans are to roll the existing span onto a second temporary work trestle and roll the new transition span into place A long weekend closure is expected sometime in 2005 or 2006
For more information please visit wwwwsdotwagovprojectssr104hoodcanalbridgeeast
Measures Markers and Mileposts - December 31 2003 34
34 Measures Markers and Mileposts - December 31 2003
Highway Safety Improvement Projects Quarterly Update
Many of the highway safety improvement projects installed or constructed by WSDOT seek to improve safety in an area identified by unusually high frequencies of accidents Do these safety improvement projects in fact lead to safer conditions WSDOT reports below on a very encouraging review of before-and-after accident statistics in relation to 21 such projects from locales around the state Also featured this quarter are results from a study on
bull Cable Median Barrier - Across the Median Protection a project intended to benefit longer stretches of highway
bull Impacts of the 08 DUI law assessed over a six year period
bull Safe Routes to School program and
bull A roundabout project in the City of Port Orchard
Safety Projects ndash Before and After Results Each year WSDOT completes a variety of safety improvement Combined Average for 21 Safety Projects projects throughout the state highway system ranging from Collisions Per Year adding turn lanes and signals to installing median barrier and
Propertyrumble strips To begin to determine their effect on reducing the All Types Damage Only InjuryFatalnumber and severity of traffic collisions a preliminary before-
Before 155 88 67and-after study has been conducted for 21 such projects Projects After 97 55 42were chosen that permitted at least 18 months of collision data
to be analyzed in the before period and at least 12 months in the Source WSDOT Transportation Data Office
after period The data was then normalized (12 month average) to make a fair comparison
Preliminary results indicate that for this 21 project sample the average number of collisions per year for all projects combined was reduced by 37 percent Likewise the average number of fatal and injury collisions per year also declined by 37 percent As additional data becomes available this safety project analysis will be updated and expanded
To provide examples of the various types of highway improvements that were indicated in the study additional details about three different projects are provided below and on the next page
I-90 Gold Creek to Easton Hill Vicinity Kittitas County Screens were installed in the median at these two locations to reduce the night time headlight glare from on-coming traffic Prior to installation of the screens these two sections of I-90 had a combined average of 194 night time collisions per year After the installation this figure dropped to 137 a 29 percent decrease In addition for collisions that involved only damage to property the decline in the after period was even greater from 152 to 6 or a 60 percent reduction
Glare screen installed on median barrier along I-90
I-90 Ritzville to Tokio This project involved flattening side slopes installing rumble strips upgrading illumination and repaving Before the project started there was an average of 39 collisions per year in this 13-mile section of I-90 Since the project was completed this dropped to 21 collisions per year a 46 percent decrease The percentage decrease in fatal and injury collisions was nearly as large dropping by 34 percent In looking at specific categories of collisions additional reductions are shown a 9 percent decrease in non-daylight collisions a 31 percent decline in collisions on wet pavement surfaces and an 8 percent drop in overturns
Slope flattening and new pavement on I-90 near Ritzville
Measures Markers and Mileposts - December 31 2003 35
Measures Markers and Mileposts - December 31 2003 37
SR 99 Battery Street Tunnel Seattle In order to reduce the number of collisions occurring on wet pavement surfaces the concrete roadway was ground to increase friction Before the project this section of SR 99 experienced an average of 775 collisions per year 475 of which were on wet pavement After the project was completed total collisions decreased to 305 per year while wet surface collisions declined to 102 per year a reduction of 61 percent and 79 percent respectively If only injury collisions are considered the decrease after the project was completed is nearly as dramatic from 295 per year down to 148 or a 50 percent drop
Concrete pavement grinding to increase friction on SR 99 at theThe summary of all 21 safety projects so far included in the study Battery Street Tunnel in Seattlethat are being analyzed is presented in the table below For a complete table of findings please visit the following web site wwwwsdotwagovmapsdatatdoPDF_and_ZIP_Filessafety_projectpdf
Highway Safety Projects - Before and After Study Collision Data Comparison
Collisions Per Year Property
Available Data DamageProject Title and Location Description of Work (in months) All Types Only InjuryFatal US 2 Sultan-Startup Road Widened SR 2 to provide an EB left turn lane 18 Before 07 00 07Startup Vicinity and a WB left turn pocket 14 After 09 00 09SR 99 Battery Street Tunnel - Safety Constructed roadway surface improvements - 26 Before 775 480 295Seattle pavement grinding 13 After 305 157 148SR 522 NE 145th St Vicinity To NE 155th St Constructed raised median island in place of 18 Before 633 380 253Shoreline existing two way left turn lane Improved visibility 16 After 405 263 143US 2 Applets Way To Vicinity Red Apple Installed median barrier to reduce crossover 23 Before 21 05 16Road Cashmere collisions 12 After 00 00 00SR 1726 Othello - Grade Separation New interchange and illumination 21 Before 74 29 46Othello 12 After 20 10 10SR 24 Hatton Road Ltl Widened and provide left turn channelization 20 Before 12 06 06Othello and improve turning radius 13 After 18 18 00SR 26 Constructed left turn lanes 23 Before 68 37 31Royal City Vicinity 12 After 00 00 00SR 28282 Ephrata - Signal Widened roadway constructed left turn lanes 23 Before 57 57 00Ephrata and installed signal 13 After 37 37 00US 97 Orondo North Realingment and construction of left turn lane 25 Before 05 00 05Orondo Vicinity 12 After 00 00 00US 97 Alt Lakeside Vicinity Constructed two-way left turn lane 21 Before 51 40 11Chelan 16 After 08 08 00SR 150 Chelan West - Turn Lanes Widened and constructed left turn channelization 22 Before 11 05 05Manson 17 After 07 07 00SR 105SR 105 Spur Constructed channelization for right and left turns 29 Before 33 12 21Westport Upgraded illumination 12 After 30 20 10SR 162 Bowman Hilton Rd E to Vicinity Upgraded signal and illumination realignments 19 Before 499 215 284149th Alderton installed signal guardrail and flattened slopes 18 After 467 233 233I-5SR6 Sb Ramp - Signal Signal and illumination installation 25 Before 29 14 14Chehalis 15 After 08 00 08I-5 Chamber Way - Signal Installed signal at NB off-ramp realignments 25 Before 38 29 10Chehalis resurfacing and illumination 15 After 24 24 00US 101 Fowler Street- Signal Installed signal reconfigured with curbs and raised 25 Before 24 19 05Raymond islands 15 After 40 24 16SR 24 Birchfield Road Intersection Installed signalization upgraded illumination 24 Before 55 20 35Yakima Vicinity signing and pavement markings 12 After 50 30 20I-90 West Ersquoburg IC To South Ersquoburg IC Lengthen acceleration lane and tapers Updated 25 Before 149 115 34Ellensburg Vicinity illumination and guardrail Roadway rehab and overlay 12 After 160 130 30I-90 Gold Creek To Easton Hill Installed glare screen along median barrier 26 Before 194 152 42Snoqualmie Pass Vicinity 14 After 137 60 77SR 241 Alexander Road To Factory Rd Constructed two-way left turn lane Channelization 25 Before 120 34 86Sunnyside Vicinity Upgraded signals widened shoulders 4-way stop 21 After 103 63 40I-90 Ritzville To Tokio-safety Matrix Flattened slopes installed rumble strips 28 Before 390 193 197Ritzville Vicinity illumination upgrades and ACP overlay 12 After 210 80 130In addition to the projects shown the I-82Union Gap to Oregon State Line project was analyzed Initial results indicate an increase in collision frequency which is not readily identifiable because of the length of the project weather variation and increased traffic in different locations throughout the project Additional review is underway to identify probable causes for the collisions This information will be presented at a future date Source WSDOT Transportation Data Office
Measures Markers and Mileposts - December 31 2003 36
36 Measures Markers and Mileposts - December 31 2003
The Cable Median Barrier Protection From lsquoAcross the Medianrsquo Collisions
2003-2005 Median Crossover Protection ProjectsErrant vehicles that cross the median into opposing lanes State Lengthof traffic typically cause severe and often fatal collisions Route Project Title (miles) Ad Date
A study of across the median crashes on Washingtonrsquos I-5 Puyallup River To Fife Interchange 19 Aug-03 multilane divided state highways with full access control I-90 Argonne Rd to Pines Rd - Widen 206 Nov-03
I-90 Pines Rd to Sullivan Rd-Widen 211 Nov-03was conducted to evaluate median barrier guidelines and I-90 Moses Lake West-Safety Improvements 1135 Dec-03identify specific highway sections where installation I-5 County Line to Prairie Creek Bridge 245 Jan-04
of a barrier would be appropriate The program I-90 Sullivan Rd to State Line 699 Apr-04adopted after the study is to install cable barriers as I-90 Geiger Road to US-2 237 Oct-04 part of improvement projects when the median width I-5 Pierce Co Line to Tukwila IC HOV- 53 Oct-04 is 50 feet or less Installation of barriers in medians I-90 George Vicinity East - Safety 1582 Oct-04 over 50 feet in width will be weighed against other Source WSDOT Engineering and Regional Operations Division improvements on a case-by-case basis
Cable barriers have been used on the nationrsquos highways since the 1930s or before The modern system which uses three cables supported by weak steel posts was developed in the 1960s and is now in widespread use in several states
Reductions in Severe Collisions Severe Collisions While total collisions in the study areas I-5 in Before and After Cable Median Barrier Installation
Annual Fatal and Disabling Collisions and Median Collision Type Everett Vancouver and Fife nearly doubled (from 7
45 to 100 including collisions with property damage 6only) the number of severe collisions (fatal and
disabling) decreased significantly This resulted in a 5
societal benefit of cable median barriers calculated 4 to be $420000 per mile annually A breakout of the
3 types of severe collisions are shown in the graph to
2the right (graph does not include ldquoproperty damage onlyrdquo collisions) 1
0 The data on the right was normalized and represents 12 months before and 12 months after the project All Median Fixed Object Roll Over Cross Median
Source WSDOT Engineering and Regional Operations Division
Fatal Accidents Disabling Accidents
Before After Before After Before After Before After
Before After
Washington State and Alcohol-Related Fatalities From 1998 to 2002 alcohol-related deaths per 100 million
Washington State Alcohol-Related Fatalities miles driven dropped 11 percent overall from 060 to 054 per Per 100 Million VMT100 million miles driven in Washington A package of anti-1998 to 2002drunk-driving laws enacted in 1998 lowered the blood alcohol
intoxication threshold from 010 to 008 percent and provided 065
for automatic loss of license for drunk driving These legislative steps together with increased State Patrol emphasis on stopping 06
drunk drivers are credited with the decrease Other measures in Washington include increased use of ignition interlock devices 055
(a device attached to the carrsquos ignition system that requires the driver to blow into the device before starting the car ndash if alcohol 05
is detected the car wonrsquot start) and a crackdown on deferred prosecutions 045
DUI 08 Law Enacted
1998 1999 2000 2001 2002
Washington DUI Facts amp TrendsSource ldquoResearch Noterdquo DOT HS 809 680 US Department ofBetween 1983 and 1991 an average of 391 drinking- Transportation National Highway Traffic Safety Administration
driver-involved (DDI) deaths occurred each year Between December 2003 1992 and 2002 an average of 285 DDI deaths occurred each year This improvement means that about 1166 lives have been saved in Washington during the 1990s
Measures Markers and Mileposts - December 31 2003 37
Measures Markers and Mileposts - December 31 2003 39
Safe Routes to Schools Since 1999 WSDOT has administered a five million dollar per biennium grant program appropriated by the legislature called Traffic Safety Near Schools This program has funded more than 70 projects across the state to improve bicyclist and pedestrian safety near schools This program was not however extended to new projects in the 2003-2005 budget In addition the Washington State Traffic Safety Commission currently administers a $2 million annual School Zone Safety grant program that pays for safety education and small traffic safety improvements The program is funded by fines from school zone traffic violations
The Washington State Department of Health (DOH) recently received $800000 in grant funds to promote active community environments a program that will include safe walkride to school routes DOH is currently working with regional county and city governments in areas meeting specific public health criteria across Washington
Safe Routes to Schools mdash Elementary School Locations
Half of the elementary schools in Washington are located on or very near state routes State law requires elementary schools to produce walk route plans
Seattle
Tacoma Olympia
Spokane
Elementary schools on or within 12 mile of a State Route Elementary schools near accident sites (accidents involving elementary agevictims 1995-2001)
Safety in a Roundabout WayPort Orchard Roundabout Safety Improvement During the late 1980s and early 1990s traffic growth in the city of Port Orchard in southern Kitsap County overwhelmed the intersection of Bethel Avenue and Mile Hill Drive (SR 166) eventually generating enough injury and property collisions to classify the intersection as a High Accident Location (HAL) Vehicle speeds exceeding the posted speed limit and the intersection configuration contributed to the collision problem In the mid-1990s after approval of the design by WSDOT the City of Port Orchard built a ldquomodernrdquo roundabout the first of its kind on the state highway system and the second to be built in Washington
After the construction of the single-lane roundabout crash data supports how well a roundabout can work when applied to a site-specific intersection safety problem There are now 48 roundabouts in Washington
Port Orchard -Bethel Ave and Mile Hill Drive Intersection
Number of Collisions and Injuries Before and After Roundabout Comparison 40
30
20
10
0 3 Years Before 3 Years After Roundabout Roundabout
Collisions
Injuries
Source WSDOT Engineering and Regional Operations Division
Measures Markers and Mileposts - December 31 2003 38
38 Measures Markers and Mileposts - December 31 2003
Asset Management Pavement Assessment Annual Update WSDOT maintains approximately 19200 lane miles (including ramps) of pavement surfaces The three major pavement types are chip seal hot mix asphalt pavement and portland cement concrete (PCC) pavement Each of these pavement types has an associated pavement life rehabilitation treatment and rehabilitation cost This report is an annual update of information last presented in the Gray Notebook for the quarter ending December 31 2002
Pavement Condition Update 2002 Results Pavement Condition Trends According to the 2002 pavement condition survey the Percent of Pavements percent of WSDOT pavements in ldquopoorrdquo condition increased slightly in 2002 to 93 percent up from 89 percent as
100
reported in the 2001 pavement survey The rating continues 80
to be dramatically better however than the situation in 1971 when the Washington State Pavement Management System 60
was first put in place 40
Programming Pavements for Rehabilitation 20 The table below shows some important facts about the extent and use of the various pavement types and the success that 0
the state seems to be achieving in directing investment to 1998 2002
areas of need Source WSDOT Materials Lab
Over the last biennium about nine percent of pavement rehabilitation spending has been for chip seal resurfacing These roads the cheapest to Lowest Life Cycle Cost resurface constitute about 23 percent of the lane miles but carry only about five percent (LLCC) Program for of the traffic Pavement Management
The basic principles behind LLCCEighty-eight percent of the spending has been for preservation of hot mix asphalt are rather simple mdash if rehabilitation pavements These roads are 64 percent of the lane miles and carry 71 percent of the traffic is done too early pavement life is
wasted if rehabilitation is done too late very costly repair work may beThe PCC pavements are 13 percent of the lane miles yet carry 23 percent of the required especially if the underlying
traffic PCC pavements have longer lives than other pavements but are very costly to structure is compromised WSDOT rehabilitate not only in terms of construction money but also in traveler inconvenience continually looks for ways to best
strike a balance between these twofrom traffic restrictions when pavement work is performed especially on the major high- basic principles while implementingtraffic corridors Forthcoming replacement of these pavements will bring big challenges the practical aspects of pavement
rehabilitation programsinvolving funding engineering and traffic management during construction (see the discussion on PCC pavements later in this section) The state is fast approaching the need to reckon with this looming financial and traffic crisis in pavement management a story that is not fully revealed by the generally positive picture conveyed by the recent annual surveys of ldquopoorrdquo condition pavements for the entire highway system
1973 1981 1986 1990 1994
Good Condition
Slight increase in percentage of pavement in poor condition 2001 to 2002
Long-term trend declining percentage of pavement in Poor Condition
Pavement Type Lane Miles
Lane Miles
Annual Vehicle Miles Traveled ndash 2002 (in billions)
03-05 Dollars
Programmed (in millions)
05-07 Dollars
Programmed (in millions)
Miles $ $
Chip Seal Pavements A chip seal is a durable surface that provides six to eight years of performance life and has an approximate cost of $12000 per lane mile
4490 234 17 53 $195 9 $182 9
Hot Mix Asphalt Pavements Hot mix asphalt pavement surface life between rehabilitation treatments can range from six to 18 years (based on actual pavement performance) and has a cost of $123000 (due miles) per lane mile and $156000 (past due miles) per lane mile
12284 640 225 715 $1819 84 $1845 91
Portland Cement Concrete (PCC) Pavements WSDOT has experienced PCC pavement lives ranging from 25 to 45 years and has an approximate cost of $330000 for dowel bar retrofit per lane mile and $1 million for full replacement per lane mile
2410 126 73 233 $142 7 $0 0
Source WSDOT Systems Analysis and Program Development Office WSDOT Materials Lab
Measures Markers and Mileposts - December 31 2003 39
Measures Markers and Mileposts - December 31 2003 41
Chip Seals For chip seals asphalt is sprayed on the existing surface and then covered with a layer of rock chips The oil becomes solid as it cools Chip seals are appropriate for low volume roads (less than 2000 vehicles per day and less than approximately 200 trucks per day) Since the roadways that receive this type of treatment are typically on rural routes WSDOT has found that pavement rehabilitation dollars seem to be best spent with efficiency of scale when a stretch of rural road mileage is taken together for resurfacing in a single ldquopaverrdquo contract even when the contract includes aging segments not yet ldquoduerdquo together with ldquopast duerdquo segments
Hot Mix Asphalt On average western Washington hot mix asphalt pavement life is 165 years eastern Washington life is 113 years (due to severe winter cold and extreme summer heat) and the statewide average is 147 years Hot mix asphalt is appropriate for a broad range of roadways from lower volume routes (more than 2000 vehicles per day and more than 200 trucks per day) to interstates with heavy traffic volumes
These pavements are where the greatest benefits of LLCC pavement management can be realized In past biennia there has been some tendency to allocate a share of pavement preservation dollars on a traditional basis by region in addition to dollars programmed strictly by reference to ldquopast duerdquo needs This has resulted in some distortion away from ideal LLCC results As of the 2003-05 biennium this has been corrected by making all regional allocations based on pavement condition and LLCC analysis
Portland Cement Concrete (PCC) Existing PCC pavement life ranges from 25 to 45 years PCC pavement is typically placed on heavily traveled interstate principal arterial and intersection locations Most of the PCC pavements historically installed on Washington highways require dowel bar retrofit and diamond grinding (to smooth the pavement surface) 20 to 25 years after construction (due to lack of reinforcing steel at the transverse joints to prevent settlement) It is estimated that a newly constructed PCC pavement will have a pavement life of 50 years and only require diamond grinding in its 25th year due to studded tire wear
Efficiency Gains for Hot Mix Asphalt Pavements Hot mix asphalt surface life has improved by 14 percent (statewide) over the last six years while over the same time period the vehicle miles traveled on asphalt paved roadways has increased by approximately 10 percent Management of asphalt pavements is an area where WSDOT has succeeded in delivering dramatically improved ldquobang for the buckrdquo to Washington state taxpayers How have WSDOT and its asphalt paving industry contractors achieved this significant efficiency gain in asphalt on state freeways and highways The keys lie chiefly in the following areas bull Provision on the paving specification for use of performance-grade binders selected for expected climate and traffic conditions
bull Use of Superpave mix designs keyed to temperature and traffic expectations
bull Improved asphalt pavement repair and asphalt placement techniques
bull Better attention to construction details and inspection and bull Increased experience with LLCC rehabilitation programming
WSDOT is also focusing pavement management efforts on programming more lane miles at a single location resulting in lower bid prices The amount of asphalt used for pre-leveling (filling in minor ruts and depressions prior to paving) has also been reduced on WSDOT paving jobs generally from 600 tons per lane mile to 300 tons per lane mile resulting in a substantial cost savings The effect of these efficiency gains taken together is that a tax dollar invested in pavement rehabilitation today buys much more than it did just a few years ago
2004 Concrete Lane Miles
Current Age (Construction or Reconstruction)
Total Lane Miles
Lane Miles Rehabiliated to Date by Dowel Bar Retrofit
0-10 1471 00 11-20 2740 00 21-30 5668 350 31-40 6420 3224 41-50 2791 581 51-60 50 02 61 or more 661 00 Total 19800 4157
A matter of concern in the 2002 pavement condition survey is that an additional six miles of PCC pavement were found to have fallen into the ldquopoorrdquo category raising the PCC ldquopoorrdquo total to 170 lane miles However the greatest concern is the potential for a dramatic increase in the poor category as a result of the PCC performance reevaluation in 2004
The table at left illustrates the number of PCC pavement lane miles currently owned and maintained by WSDOT Sixty miles of PCC replacement would cost on the order of approximately $60 million before taking into account the project costs associated with roadway safety upgrades and stormwater runoff control retrofits
Does not include 321 lane miles of bridge Traffic disruptions associated with rehabilitation or replacement of these pavements is sections and 112 lane miles of ramps another difficult feature of this looming problem
40 Measures Markers and Mileposts - December 31 2003
40 Measures Markers and Mileposts - December 31 2003
Rating Pavement Conditions WSDOT continues to use a three-part examination system to rate pavement condition
Pavement Structural Condition (PSC) A pavement will develop structural deficiencies for two reasons truck traffic and cold weather The PSC is a measure based on distress such as cracking and patching which are related to the pavementrsquos ability to carry loads PSC ranges from 100 (best condition) to 0 (worst condition) A roadway should be considered for rehabilitation when it falls within the PSC range of 40 to 60 Rutting Rutting is caused by heavy truck traffic or studded tire wear Ruts deeper than 12 inch have the potential to hold water increasing the risk of hydroplaning for high-speed traffic A roadway should be rehabilitated when the rut depth is greater than 13 inch
Roughness The International Roughness Index (IRI) is a procedure to measure pavement ride A full-sized van with a laser-measuring device mounted on the front bumper measures the roughness of the pavement A roadway should be rehabilitated when the IRI value is between 170 and 220 inches per mile
Determining When Pavements are ldquoDuerdquo The Pavement Condition Rating process using the van pictured on the right analyzes and predicts the pavement rehabilitation due period (see the Gray Notebook for the quarter ending June 30 2001 for details) A regional validation process reviews the results and calibrates the ratings if needed The number of disputed segments varies between 5-10 Each of the segments in question is then reviewed and any discrepancies are resolved WSDOT considers the pavement rehabilitation due year in the Pavement Management System to be approaching 100 accuracy Pavement Condition Data Collection Vehicle
2002 Pavement Smoothness by StateHow Do Washingtonrsquos Pavements Conditions Centerline Miles in PercentCompare with National Experience Miles Poor in Poor
FHWArsquos annual Highway Statistics report includes Rank State Reported Condition Condition information on pavement condition reported by each 1 Georgia 11301 34 03
2 Wyoming 4414 22 05of the 50 states and the District of Columbia (based on 3 Alabama 7643 41 05roughness only) To the right is a snapshot of the 2002 4 North Dakota 6180 53 09 results that shows the number of miles by state in 5 Minnesota 11658 108 09
6 Nevada 2959 33 11poor condition according to smoothness The total miles 7 Kentucky 5192 76 15reported includes the interstate system and principal 8 Florida 10898 160 15
9 Kansas 8851 183 21arterials owned by the state cities and counties and a 10 Arizona 4065 86 21sampling of other functional classes Washington state 11 Idaho 3860 93 24ranked 16th in smooth roads in 2002 (Washington was 12 Maine 2391 60 25
13 Montana 6927 179 26ranked 17th in 2001) 14 Utah 3676 120 33 15 Alaska 1800 62 34 16 Washington 5396 194 36The FHWA publication can be viewed at wwwfhwadotgovpolicy
ohimhs02indexhtm 17 South Carolina 6791 260 38 18 New Hampshire 1375 54 39
49 California 20634 5437 263 50 Massachusetts 3290 1182 359
Source Highway Statistics 2002 US Department of Transportation
Measures Markers and Mileposts - December 31 2003 41
Measures Markers and Mileposts - December 31 2003 43
Highway Maintenance Annual Update Biennial Maintenance Targets The Maintenance Accountability Process (MAP) targets measures and communicates the outcomes of 34 distinct highway maintenance activities Maintenance results are measured using field condition surveys and are reported as Level of Service (LOS) ratings LOS targets are defined in terms of the condition of various highway features (for example the percent of guardrail on a highway system segment that is damaged) LOS targets are also keyed to the level of funding provided by the Legislature The following table shows a list of maintenance activities (in prioritized order) for which LOS targets have been set in the 2003-05 biennium During 2003 targets for all activities were achieved
WSDOT Maintenance TargetsAchieved for 2003 Maintenance Activity Achieved Pavement Patching and Repair uuml
Snow and Ice Control Operations uuml
Traffic Signal Systems uuml
Movable and Floating Bridge Operations uuml
Urban Tunnel Systems uuml
Keller Ferry Operations uuml
Guardrail Maintenance uuml
Noxious Weed Control uuml
Structural Bridge Repair uuml
Intelligent Traffic Systems uuml
Control of Vegetation Obstructions uuml
PermitsFranchises uuml
Maintain Culverts uuml
Regulatory Sign Maintenance uuml
Slope Repairs uuml
Crack Sealing uuml
Bridge Deck Repair uuml
Safety Patrol uuml
Rest Area Operations uuml
Highway Lighting Systems Operations uuml
Pavement Striping Maintenance uuml
Maintain Catch Basins and Inlets uuml
RaisedDepressed Pavement Markers uuml
Sweeping and Cleaning uuml
Nuisance Vegetation Control uuml
Maintain Ditches uuml
Shoulder Maintenance uuml
DetentionRetention Basins uuml
Litter Pickup uuml
Guide Sign Maintenance uuml
Landscape Maintenance uuml
Guidepost Maintenance uuml
Bridge Cleaning uuml
Pavement Marking Maintenance uuml
2003 Perfect Score ndash Percentage of Legislatively Funded Targets Achieved 1998-2003 In September 2001 the first Gray Notebook quarterly report on MAP WSDOT achieved 26 out of the 34 MAP targets Three years later a perfect score has been achieved The positive trend can be attributed to bull What gets measured gets managed WSDOT
maintenance managers and field workers are gaining experience with how to manage work in ways that help to attain the service level targets
bull Strong maintenance results across-the-board have been assisted by mild or average winter conditions
bull Stable funding for maintenance for several years has lessened ldquocrisis moderdquo management and produced better across-the-board results
bull Improved accuracy in measuring MAP results ndash based on a six-month review and field verification of MAP measures and their assessment technique
Starting in March 2004 WSDOT maintenance staff will be documenting greater levels of detail such as units of work completed (for example ldquolinear feet of guardrail repairedrdquo) This will provide information that can be used to develop cost per unit and units per day or week measures to supplement the outcome measures provided by MAP Look for more on this in future Gray Notebook maintenance pages
Percentage of Legislatively Funded Targets Achieved for 1998-2003
100
80
60
40
20
0 2002 20031998 1999 2000 2001
Source WSDOT Maintenance Office
Measures Markers and Mileposts - December 31 2003 42
42 Measures Markers and Mileposts - December 31 2003
Integrated Vegetation Management Integrated Vegetation Management (IVM) involves creating and supporting roadside plant communities that minimize short and long-term maintenance needs Roadside vegetation maintenance requirements often depend on how well roadsides are designed and constructed When soil is conserved and improved vegetation is restored during highway construction roadside maintenance requirements can be relatively low However if roadsides are not well restored at the time of construction the expense of roadside maintenance grows because noxious and nuisance weeds tend to establish themselves and thrive in poor soils with sparse vegetation
2003 Herbicide Use Trends ndash Results In terms of pounds of active ingredient WSDOTrsquos statewide annual use of herbicides for roadsides increased by 3300 pounds (121105 pounds in 2002 to 124426 pounds in 2003) On closer review of the data most areas in western Washington were either down or about the same in their overall herbicide use compared to 2002 In fact Clallam County the first area in which WSDOT has implemented an IVM plan saw a 50 percent reduction in herbicide use on the roadsides In eastern Washington two areas in particular experienced significantly increased herbicide use The cause was a localized ongoing weed infestation problems for which herbicide applications were needed Had it not been for the significant application in these two areas WSDOTrsquos herbicide use in 2003 would have been less than in 2002
Clallam County IVM Plan In the past year WSDOT has finally begun to make progress implementing its long-promised IVM program Working with communities and a number of interest groups on the Olympic Peninsula WSDOT developed an IVM plan for state highway maintenance in Clallam County that reduced the amount of herbicide used and responded to citizen concerns Highlights and results include
bull No vegetation-free area adjacent to pavement within 60 feet of salmon streams Hand-treatment only of invasive plants growing next to the pavement edge in this area
bull No summer application of herbicides for controlling trees and brush
bull Hand application of noxious weed control herbicide (as opposed to truck applications) and close coordination with the Clallam County Noxious Weed Control Board
bull Experimentation with alternative brush control methods such as planting desirable plant species (ie salal) hydro seeding and biological controls
bull Total herbicide use decreased more than 50 percent
At a February 5 2004 open-house meeting to discuss continued aspects of the IVM program in Clallam County concerned citizen Josey Paul commended WSDOT employees saying ldquoThank you for your good efforts managing vegetation along SR 112 this past yearrdquo
With an effective IVM program common weeds such as kochia in eastern Washington can be managed with reduced herbicide use over time
Vegetation-Free Area Approximately 60 percent of herbicides used by WSDOT are used to prevent vegetation from growing at the pavementrsquos edge WSDOT is reviewing this practice including a study of other statesrsquo use of chemicals in vegetation-free zones alongside the roadway The challenge in determining the best approach comes from needing to balance the potential herbicide impacts with hazards to motorists associated with an abundance of roadside vegetation to highway workers from mechanical control technologies and to pavements for vegetation incursions to the pavement By the end of the year WSDOT will develop and implement updated policies on vegetation-free areas
The vegetation-free zone next to the roadway
Measures Markers and Mileposts - December 31 2003 43
Measures Markers and Mileposts - December 31 2003 45
IVM Future Practices Integrated Vegetation Management Plan Schedule Because of the success of the Clallam County I-5 North (lsquo04)IVM plan WSDOT created a statewide schedule for Roadside Vegetation Management plans The timetable implements all plans by the end of 2007 WSDOT also identified new performance measures to track future roadside vegetation management trends The measurements include
bull The IVM plan development schedule
bull Adherence to sensitive buffers upon orders by the US District Court (see below)
bull Number of WSDOT application violations
bull Maintenance Accountability Process (MAP) conditions measures for nuisance weeds I-5 South (lsquo03)noxious weeds vegetation obstructions and landscape maintenance WSDOTrsquos Integrated Vegetation Management Plan implementation
is scheduled by year and by maintenance area as shown in thebull Documentation of area-specific IVM plan above map Area by area production of the plans will continue until
elements completed each year statewide coverage is achieved
Seattle Spokane
5
rsquo03 rsquo04
rsquo06
rsquo05
rsquo05
rsquo06 rsquo05
rsquo04
rsquo07
rsquo07
rsquo07
5
Tacoma Olympia 90
Whidbey Island Plan Coming The department will hold a public meeting on a Roadside Vegetation Management Plan for Whidbey Island in March 2004 WSDOT expects to develop and implement a plan that meets the concerns of citizens with varying viewpoints on herbicide use and can be achieved at reasonable cost The draft plan identifies a number of key areas test sites roadside features and treatment practices Other IVM plan details for Whidbey Island are expected to include
bull Restoration of roadsides in coordination with future construction projects on State Route 20
bull Restoration of native roadside vegetation on half of an acre a year as part of the regular maintenance program
bull No vegetation-free area adjacent to pavement within 60 feet of the waterline at Penn Cove and Keystone Spit
bull Establishment of the vegetation-free area pilot projects
US District Court January 2004 Ruling The United States District Court in Seattle entered an injunction in January 2004 prohibiting the use of certain herbicides within sixty feet of salmon streams pending EPArsquos completion of a review whether such use is consistent with protections afforded by the Endangered Species Act
WSDOTrsquos herbicide practices included in the 2003 IVM plan for Clallam County and generally followed in many other areas of Western Washington are already matched to the injunctionrsquos requirements To ensure adherence to the terms of the injunction WSDOT maintenance crews will identify affected areas on the highways mark buffer zones and receive additional training on vegetation management practices including limitations on herbicide use
WSDOT ndash Proactive in Risk Assessment As part of its vegetation management efforts in 2003 WSDOT contracted with a consultant Intertox Inc to update a 1993 WSDOT hazard assessment study This included integration of new research in herbicide usage The hazard assessments aim through review of scientific literature to inform WSDOTrsquos understanding of potential risks to humans wildlife and aquatic organisms The hazard assessment update generally found the potential risks of specific products to be negligible or low in WSDOTrsquos patterns of use The assessment suggested however that moderate potential risks might be presented by two products MCPA and Diuron WSDOT discontinued further use of MCPA in 2003 and has taken steps to reduce the use of Diuron by limiting its application only to certain areas in eastern Washington
Measures Markers and Mileposts - December 31 2003 44
44 Measures Markers and Mileposts - December 31 2003
Environmental Programs Environmental Management System (EMS) Update WSDOT is continuing to develop its Environmental Management System (EMS) to help support the departmentrsquos environmental efforts and integrate those efforts into everyday operations training programs and regular performance reports Currently several important activities described below are building WSDOTrsquos capacity to improve track and report on environmental compliance
Construction Services Program Pilot To address projects funded by the 2003 Transportation Funding Package WSDOT is piloting a construction services program modeled on a prototype used by its regional office in Yakima The program is being evaluated for statewide implementation Its goal is to ensure that environmental commitments attached to a project are clearly communicated and implemented throughout design construction and facility operation The programrsquos three major components are (1) pre-construction and pre-activity meetings between WSDOT and the contractor (2) tools to aid construction and maintenance staff in maintaining
Seven Core Elements to WSDOTrsquos Environmental Management System bull Legal and other requirements clearly outline all
environmental laws regulations and agreements that apply to operations
bull Written procedures instruct staff and contractors how to conduct work activities in compliance with requirements
bull Training ensures those that conduct certain activities know how to do the work in a compliant manner
bull Roles and duties ensure WSDOT staff and contractors know what they are to do under the EMS
bull Inspection monitoring and corrective action ensure a process is in place to check WSDOTrsquos work for compliance and correct any problems
bull Documentation allows WSDOT to evaluate the operation of the EMS and communicate results to the public and within the department
bull Performance measurement compares WSDOTrsquos performance against pre-determined targets with results reviewed by management and reported to the public
compliance on the project site including an environmental inspection checklist for use by construction inspectors and (3) environmental compliance procedures issued by WSDOT for all construction and maintenance activities
Enhanced Commitment Tracking WSDOT is working to better track formal commitments made during the project development process By the end of 2004 WSDOT will track all formal commitments from inception (usually during planning or project design phase) through construction to completion or handoff to its Maintenance and Operations Department This new system will make clear assignments of roles and duties to show who manages performs and monitors the implementation of each commitment
Examples of Environmental Commitments on WSDOT Projects Some environmental commitments are Other commitments are agreements Some commitments are made during the terms and conditions outlined in environ- made during the Endangered Species Act National Environmental Policy Act (NEPA) mental permits These may require process These commitments or ldquoconser- environmental review process to minimize WSDOT to maintain a certain water quality vation measuresrdquo are designed to protect or offset overall environmental impact of a level during construction use certain endangered species Examples include the project Commitments under NEPA may affect Best Management Practices (BMPs) and requirement for WSDOT to place woody a roadwayrsquos alignment or physical design conduct environmental monitoring debris in a river or avoid working at certain The concrete box culverts shown belowtimes to protect migratory speciesFor example straw blankets and silt were agreed upon during the NEPA process fences are required to be used to protect In addition to habitat protection WSDOT and are designed to promote floodplain a small stream along Highway 18 during uses engineered log jams root wads and connectivitymdashallowing water to pass under rainstorms until permanent erosion control other bio-engineering techniques to protect the roadway during high water rather than grasses are established stream banks near roads and bridges over it or on to adjacent property
Measures Markers and Mileposts - December 31 2003 45
Measures Markers and Mileposts - December 31 2003 47
Environmental Compliance Assurance Annual Update WSDOT self-monitors for ldquonon-compliance eventsrdquo whether or not such events are taken up as formal ldquoviolationsrdquo by regulatory agencies or officials
Compliance History The Gray Notebook for March 31 2003 reported on WSDOTrsquos initial effort to track non-compliance events Data for 2001 and 2002 was obtained by interviewing project managers in December 2002 to gather an after-the-fact best estimate of the number and types of non-compliance events Since then WSDOT has systematically tracked non-compliance events for highway construction and maintenance programs and for operations of the Washington State Ferries (WSF)
How Are We Doing In 2003 WSDOT recorded 41 non-compliance events with 13 leading Non-Compliance Events to issuance by a regulatory agency of a formal Notice of Violation 2001-2003 (NOV) 45
40 In 2003 32 of 41 non-compliance events involved water quality 35
regulations as shown in the chart at right For 2003 the ldquootherrdquo category 30
includes three events associated with underground storage tank rules and 25
one event associated with an air quality violation 20
15
The increase in recorded highway program and WSF non-compliance 10
events from 2001 to 2003 is partially explained by an increased 5
0 emphasis on identifying non-compliance events Because 2003 is the 2001 2002
Fish Habitat OtherWetlands Water Quality first year that WSDOT has systematically tracked non-compliance events apples-to-apples comparison with previous years is not possible For more information about WSDOTrsquos Environmental
Compliance Assurance Procedure please see the The baseline data for 2003 of the number and type of events taking Gray Notebook for the quarter ending March 31 2003
place will help WSDOT staff develop compliance tools for the agency page 18
Source WSDOT Environmental Services OfficeUsing Non-Compliance Data WSF began systematizing data collection on petroleum product spills three years ago The data illustrated ongoing minor problems from hydraulic systems on transfer spans at WSF terminals Last winter WSF Terminal Maintenance began a program to improve inspection of transfer spans and quickly correct any problems This new emphasis includes training for terminal attendants to identify potential leaks in the bridge operation and to report potential leaks to Terminal Maintenance
For the three years since 2001 WSF terminals have had seven four and five hydraulic spills respectively The prevention actions instituted by Terminal Maintenance means that now more WSF employees are aware of and watching for potential problems
2003
Total Resulting Actual Notices
Total
Total
Resulting Actual Notices
Resulting Actual Notices
Beginning of Maintenance and Construction ECAP (Environmental Compliance Assurance Procedure)
Hydraulics system at the Anacortes Ferry Terminal
Integrated Vegetation Management Results
Please see Highway Maintenance IVM report on page 43 of this Gray Notebook
WSDOT also tracks compliance with herbicide and Non-Compliance Eventspesticide application laws covering the products and procedures used to maintain roadside and wetland 2001 2002 2003 mitigation sites The number of product applications in Number of WSDA 8 6 4 2003 went up 17 and the pounds of active ingredient Investigationswent up by 35 from the previous year The number of findings of fault notices from the Washington State Department of Agriculture (WSDA) remained steady at
Number of WSDA Findings of Fault
5 4 2
four Two notices involved overspray leaving the road right Number of Product 2271 3399 4091 of way and two were found not to have merit and dropped Applicationsby WSDA In 2003 WSDA issued two warning letters to WSDOT regarding the alleged injury to two privately owned conifer trees in the town of Loon Lake near Colville The
Total Pounds of Active Ingredient Applied
67156 120171 124290
trees tested positive for diuron that may have come from an earlier WSDOT roadside application of herbicides for total quantity of chemicals used
Measures Markers and Mileposts - December 31 2003 46
46 Measures Markers and Mileposts - December 31 2003
Monitoring Replacement Wetlands Annual UpdateTypes of Mitigation Two WSDOT mitigation bank sites currently provide advance compensation for unavoidable wetlands losses The Moses Lake Mitigation Bank provides five acres of enhanced wetland and about two acres of restored wetland The North Fork Newaukum Mitigation Bank provides 91 acres of enhanced wetland and one acre of restored wetland Since 2002 15 new replacement wetland sites (199 acres) have been added to the overall inventory of wetlands replacement acreage
Meeting Standards in 2003 In 2003 biologists monitored a total of 63 active replacement wetlands ranging from one to eight years in age Of these sites 21 had targets (success standards) to be met in 2003 Monitoring was conducted for 87 individual standards
Of the two sites that did not meet any standards due in 2003 one is in the middle of its planned monitoring period and had poor plant survival and too many weeds The site has been re-planted and because it is close to a river biological weed control is planned The second site is at the end of its planned monitoring period but has not developed into a wetland because it is too dry WSDOT staff are considering appropriate alternatives to achieve this environmental commitment
Completed Replacement Wetlands Successful sites have achieved reasonable ecological success and no longer need monitoring Unsuccessful sites have not met requirements and are ecologically unsuccessful
Reasonable ecological success was achieved on six more sites in 2003 bringing the total of completed sites since 1988 to 53 The total of sites judged successful in this group is 49 (267 acres) The four unsuccessful sites failed due to unpredicted or changed hydrology the most important parameter of wetland success WSDOT is considering options to meet the environmental commitments for these projects
For additional detail on monitoring replacement wetlands and pictures of the different types of projects see the Gray Notebook subject index at wwwwsdotwagovaccountabilitygraybookindexhtm environment and click on ldquoWetland Mitigation and Monitoringrdquo WSDOT has been mitigating for unavoidable wetlands loss with replacement wetlands for 15 years to address the statersquos Executive Order 89-10 which mandates that the actions of state agencies result in no net loss of wetlands Advance mitigation means building replacement wetlands before unavoidable impacts take place Monitoring and reporting on the status of replacement wetlands is critical to the success of the program as seen through the eyes of both the public and the resource protection agencies with whom agreement on these projects must be reached
WSDOT Replacement Wetlands 1988-2003
WSDOT Replacement Wetlands 1988-2003 Total Acreage of Wetland Projects 116 Sites 675 Acres
Olympia Tacoma
Seattle Spokane
Actively Monitoring
Monitoring Complete
Buffer An upland area Enhancement Improvements that protects a wetland from to an existing degraded wetland
126 Acres 119
Acres
189 Acres
181 Acres
60 Acres
adverse impacts (181 Acres to increase or augment wetland increased by 90 acres since function (189 Acres increased 2002) by 100 acres since 2002)
Restoration Re-establishes a wetland area andor function where wetlands previously existed but are no
Creation The establishment longer present (60 Acres of wetland area and functions increased by 3 acres since where none existed (126 Acres 2002) increased by 4 acres since 2002)
Preservation Protecting wetlands from future development ensures that valuable wetland functions continue to provide benefits (119 Acres increased by 2 acres since 2002)
Replacement Wetlands Success in 2003 Total Number of Sites 21
Meeting All WSDOT reported onStandards
22 Acres11
Acres
8 Acres
the status of sites5 Sites with standards to be
achieved in 2003 on a site-by-site
Meeting basis in the 2003Some Annual MonitoringStandards report For detailed14 Sites monitoring results visitMeeting No wwwwsdotwagov Standards environmentwetmon
2 Sites defaulthtm
Success Rate for Replacement Wetlands Success Rates for Replacement Wetlands with Completed MonitoringMonitoring Complete 100 Includes acreage
not yet designated 95 for mitigation credit
90
85 Source for all charts WSDOT Environmental
1988-2001 1988-2002 1988-2003 Services Office 80
Includes acreage not yet designated for mitigation credit Source WSDOT Environmental Services Office
Measures Markers and Mileposts - December 31 2003 47
Measures Markers and Mileposts - December 31 2003 49
Stormwater Treatment Facilities WSDOT routinely builds stormwater treatment facilities to Department of Ecology standard as a part of highway construction Stormwater treatment facilities reduce stormwater flows that cause flooding and harm fish habitat These treatment facilities also remove sediment metals nutrients and other pollutants from highway runoff
In response to municipal stormwater permit requirements WSDOT has tracked the number of new stormwater treatment facilities built in King Pierce Snohomish and Clark counties where about 40 percent of statewide highway construction has occurred since 1996 In the past seven years 300 treatment facilities (an average of 43 per year) have been built in those counties
Out of 1140 miles of highway within the four counties an estimated one percent of state highways have new stormwater treatment facilities constructed each year These treatment facilities help to mitigate and manage the impacts of stormwater runoff from our state highways
In addition to removing pollutants and reducing flooding this pond near I-5 milepost 96 protected a nearby wetland by trapping a 140-gallon accident-related diesel spill from the adjacent freeway
Ponds that infiltrate treated runoff reduce flooding in the winter and help maintain stream flows in the summer
Monitoring Water Quality Impacts for Construction Sites Annual Update In 2003 WSDOT completed its first year of construction site water quality sampling under a new statewide monitoring policy The policy requires sampling on at least 20 percent of all projects with substantial potential for water quality impacts The chart at right summarizes sampling results that compare water quality upstream and downstream from 12 projects Ninety-five percent of the samples met water quality standards for clarity
Of the 200 samples taken nine failed to meet standards The water became muddy on five of the projects because work had to be done in the water or very near the shore The other four projects experienced heavy rainfall ranging from 3frasl4 to 3 inches which overwhelmed the mandated design capacities of approved treatment facilities In all cases monitoring results prompted immediate corrective actions to regain compliance with water quality standards
Case Study Golden Harvest Creek Culvert ReplacementThe Golden Harvest Creek culvert replacement project on SR 21 near the town of Republic in eastern Washington illustrates the challenges associated with keeping sediment out of water when replacing culverts Diverting water around work areas is very effective but the installation and removal of diversions can briefly muddy a stream While removing an old culvert that blocked fish migration some dirt fell into the creek After the new culvert was in place the creek was re-directed into the new channel stranding some fish in the temporary bypass Workers entered the water and carefully moved the fish back into the creek The state standard for clarity of water was exceeded twice during construction but returned to normal within minutes each time
State Water Clarity Standards Compliance Number of Samples for 2003
45 Out of compliance In compliance
30
15
0 Apr May Jun Jul Aug Sep Oct Nov
Water Clarity Monitoring Golden Harvest Creek August 2003
64
25
20
15
10
5
0 5th 5th 6th 7th 12th 13th 14th 15th 18th 19th 20th 25th
Upstream Downstream
State Standard
Water was briefly muddied as workers moved fish back into the stream
Water was temporarily muddied as an old culvert was removed
Source for both charts WSDOT Environmental Services Office
Measures Markers and Mileposts - December 31 2003 48
48 Measures Markers and Mileposts - December 31 2003
Erosion Control Preparedness ndash Annual Update Erosion control is an important component of WSDOTrsquos program to protect the environment In addition to education careful planning and stringent contract requirements WSDOT routinely performs construction site inspections to verify the effectiveness of erosion control measures and makes improvements as needed In the fall of 2003 moderate and high-risk projects (20 in all) were inspected to determine how well they were prepared for the wet season and whether or not erosion led to any water quality violations site damage or delays
The October 2003 storm (see the September 30 2003 Gray Notebook Special Features) for example overwhelmed the treatment measures planned for the runoff from existing pavement An inspection revealed that dirty water was entering Taylor Creek
WSDOTrsquos Environmental Compliance Assurance Procedures were initiated and crews immediately addressed the situation the discharge of dirty water stopped and the incident was promptly reported to the Department of Ecology
Fall Assessment Results This table outlines how
Erosion control measures on SR 18 in the Maple Valley area
well prepared WSDOT was during fall 2003 compared to its level of preparation in 2002
Last year WSDOT identified areas where improvements in erosion control preparedness were needed One area in particular included ensuring that erosion control plans are always on site and up to date with current project conditions (a condition of environmental permitting) Specific actions were taken at statewide meetings and training sessions that
Erosion and Sediment Control Assessment Results 2002 2003 Status
Excellent Clearing limitssensitive area boundaries identified and respected by contractor
Utility trenches excavated in manner to reduce erosion risk Remove temporary erosion and sediment control measures when not needed
100 100 81
100 stable 100 stable 100 improved
Good
Contractor trained in proper use of erosionsediment control measures Sediment trapping measures installed prior to soil disturbing activities Control offsite erosion prevented by controlling flows Protect storm drains from sediment
100 90 87 74
95 decreased 90 stable 84 decreased 82 improved
Fair
If a storm hit at time of site visit water would meet state water quality standards If a storm hit at time of site visit adjacent property would be protected Effectiveness of measures installed to trap sediment Erosion control plans are on site and up to date for all WSDOT projects
86 83 96 56
80 decreased 80 decreased 78 decreased 75 improved
Poor
Manage construction site water in manner reducing sediment deposition risk Perform maintenance on temporary erosion and sediment control measures Construction access routes stabilized to prevent tracking of mud onto streets Effectiveness of measures installed to prevent erosion Temporary stormwater conveyance channels stabilized Protect cut and fill slopes from concentrated runoff Amount of disturbed soil actually covered with erosion control measures
100 70 98 91 90 67 65
71 decreased 70 stable 69 decreased 67 decreased 64 decreased 50 decreased 45 decreased
resulted in an improvement Source WSDOT Environmental Services Office of 19 percent
In 2003 the overall assessment increased in three areas while it remained the same or had little change in seven others WSDOTrsquos preparedness in the remaining eight areas decreased substantially creating an elevated risk to increased erosion when compared to last year The decrease in the bottom five areas in the ldquoPoorrdquo category are directly attributed to one or both of the following reasons (1) the extremely dry weather this fall extended large earthwork activities into the ldquowet seasonrdquo delaying soil cover practices and (2) drought conditions reduced effectiveness of late spring and early fall seeding applications
Summary and Next Steps An analysis of the 20 projects documents that 12 had no problems preventing erosion Projects experiencing minor problems increased by 16 percent from 2002 for a total of seven The minor problems were promptly corrected without regulatory agency involvement or high repair costs One project experienced major problems that involved one Notice of Violation The plan to improve performance on issues in the ldquoPoorrdquo to ldquoFairrdquo ranges includes increased technical assistance improved contract enforcement and increased emphasis in training
Measures Markers and Mileposts - December 31 2003 49
Measures Markers and Mileposts - December 31 2003 51
Incident Response Quarterly Update Program Totals WSDOT Incident Response Program provides roving service to clear roads and help drivers on Washingtonrsquos heavily traveled freeways Along with the WSDOT roving units non-WSDOT units provide contracted roving services These units include the Washington State Patrol (WSP) Cadets Registered Tow Truck Operators (RTTO) and a Motorist Assist Van (MAV)
Incident Reasons and Clearance Times Washington Statersquos target is to clear all incidents within 90 minutes During the fourth quarter 71 percent of major incidents were due to motor vehicle collisions Major incidents are however only two percent of all incidents on state roadways The most frequently occurring incidents which are likely to cause slowdowns during daily commutes are disabledabandoned vehicles or debris blocking traffic (82 percent of all incidents) During the fourth quarter 85 percent of incidents were cleared within 30 minutes and 47 percent were cleared in less than 10 minutes
Detection and Response by Roving Notification and Call-out The roving Incident Response Program is an effective means to keep traffic moving on freeways because the responders quickly detect incidents on the roadways During the fourth quarter 70 percent
Abandoned Vehicles (6)
Hazardous Materials and Fatal Collisions were less than 1 percent each
Incidents Lasting90+ Minutes Fatality
Disabled Vehicles Collisions (15)(9)Haz Mat Abandoned
(5) Vehicles Fire (2) (2) Debris
(4)
Incidents Lasting LessThan 15 Minutes
Non-Injury Other Collisions (4) (4)
Debris (10)
Abandoned Vehicles (27)
Disabled Vehicles 55
Injury Collisions Fatal Collisions Fire and Hazardous Materials were less than 1 percent each
Incidents Lasting 15 to 90Minutes Injury Collisions Fire(7) (1)Other (2)
Non-Injury (20)
Debris (5)
Disabled Vehicles 58
of all incidents were detected by roving units Roving units were notified of the remaining 30 percent of incidents Call-out units respond to severe incidents that occur Other
(2)
Non-Injury (32)
Injury Collisions (30)
outside roving zones or during non-roving hours There were 129 call-out responses during the fourth quarter which amounted to one percent of all the incidents responded by the IR program
Blocking versus Non-Blocking Locations The location and duration of an incident can impact traffic greatly Overall 67 percent of all incidents were on the shoulders and medians of roadways and did not block travel lanes Seventy percent of the incidents that were cleared in less than 30 minutes occurred within shouldersmedians and did not block travel lanes Of the major incidents lasting 90 minutes or more 80 percent were blocking travel lanes
Source for all charts WSDOT Traffic Office
Total Number of Responses by Month July 2002 to December 2003
5000
4500
4000
3500
3000
2500
2000
1500
1000
500
0
WSDOT IRT 2003 Contracted IRT Units 2003
2002
Jul Aug Sep Oct Nov Dec Jan Feb Mar Apr May Jun Jul
Average Clearance Time (in Minutes) January 2003 to December 2003
35
30
25
20
15
10
5
0
For All Incidents
For Incidents Lasting 15-90 Minutes
Jan Feb Mar Apr May Jun Jul Aug Sep Oct Nov Dec
Average Clearance Time for Incidents Lasting Over 90 Minutes 3-Year Comparison July 2001 to December 2003
300
250
200
150
100
50
0
July 2001 to June 2002
July 2002July to to June 2003December 2003
Jul Aug Sep Oct Nov Dec Jan Feb Mar Apr May Jun
Number of Incidents by Location and Clearance Time October 2003 to December 2003
Travel Lanes
ShoulderMedian
6000
5000
4000
3000
2000
1000
0 Less 10- 20- 30- 40- 50- 60- Over than lt20 lt30 lt40 lt50 lt60 lt90 90 10 min
Measures Markers and Mileposts - December 31 2003 50
50 Measures Markers and Mileposts - December 31 2003
Over 90 Minute Incidents There were 243 incidents lasting 90 minutes or longer during the fourth quarter of 2003 Incidents are located by dots on the map All incident records collected into the WSDOT Incident Tracking System (WITS) are being mapped for exact locations by state route and milepost for further analysis
Examples of Incidents Over 90 Minutes The following five incidents had the longest clearance times for the period between October 1 2003 and December 31 2003
bull October 1 ndash A fuel tanker truck overturned on I-5 in King County A single northbound lane was intermittently closed as multiple tow trucks responded to the scene to try and right the truck After multiple attempts the fuel was pumped from the truck so that it could be righted WSDOT Incident Response set up traffic control until recovery was complete 104 hours was required for Incident Response to clear the scene
bull October 8 ndash A semi truck traveling from westbound I-90 to northbound I-5 in Seattle drove off the elevated ramp falling approximately 30 feet and landing on the roadway below The tractor-trailer and cargo were demolished on impact necessitating a lengthy and technical clean up WSDOT Incident Response responded to the scene for traffic control and clean up 82 hours were required to clear the scene
bull October 12 ndash A loaded fuel tanker lost control on SR 9 just north of Wickersham in Whatcom County causing the rear trailer to roll on its side leaking fuel onto the shoulder and into the drainage system A detour route was set-up and a private contractor was called in to clean up the fuel spill WSDOT Incident Response assisted with traffic control and helped to clear debris from the roadway 164 hours were required to clear the scene
bull November 22 ndash A collision on US 97 near Goldendale involving a semi truck resulted in multiple lane closures as the scene was cleared WSDOT Incident Response set up traffic control and assisted other agencies Responders were able to keep traffic flowing throughout most of the incident 85 hours were required to clear the scene
bull December 9 ndash On SR 9 near the city of Sumas in Whatcom County a semi truck lost control and drove off of the roadway overturned spilling its load of lumber A detour was set-up for both northbound and southbound traffic WSDOT Incident Response performed traffic control and cleared debris 80 hours were required to clear the scene
Over 90 Minute Incidents for Quarter Four 2003
Seattle
Tacoma Olympia
Spokane
Vancouver
Everett
Service Actions The Incident Response roving program provides various services to motorists Traffic control is the most common service provided On an average day during the fourth quarter incident response personnel (all units) provided fuel to 14 vehicles cleared 12 pieces of debris changed 12 flat tires pushed 8 vehicles and performed 6 minor car repairs
Response Types October to December 2003
Total Incident Responses = 12341 bull 1717 Collisions (14) bull 10624 Non-Collisions (86)
Oct Nov Dec Fatality Collisions 6 11 10 Injury Collisions 147 147 134 Non-injury Collisions 377 417 468 Disabled Vehicles 2435 2120 2320 Abandoned Vehicles 787 705 784 Debris 420 330 290 Fire 24 17 27 Hazardous Materials 15 5 4 Other 132 139 149 Some non-collisions fall into more than one of the above categories
Service Actions Taken for Non-Collision Responses October to December 2003
Oct Nov Dec Traffic Control 425 370 429 Provided Fuel 324 286 269 Changed Flat Tire 323 255 220 Minor Repair 281 203 260 Pushed Vehicle 145 178 190 Towed Vehicle 160 115 144 Cleared Debris 90 84 84
Source WSDOT Traffic Office
Measures Markers and Mileposts - December 31 2003 51
Measures Markers and Mileposts - December 31 2003 53
Travel Information Quarterly Update
Since the launch of 5-1-1 Travel Information Service in July 2003 calls have increased by 74 percent (from 30478 to 52903) during the first six
month period
5-1-1 is a three-digit travel information number designated by the Federal Communications Commission (FCC) to provide around the clock traffic and road condition information
The 5-1-1 system lets the commuter check real-time traffic conditions using a cell phone and voice commands Although some users have experienced difficulty at times with the voice recognition aspect of this system it will continue to be enhanced as technology improves WSDOT is currently developing a plan to address these issues and make the 511 system more user-friendly
1-800-695-ROAD In December 2003 the total number of calls to 1-800-695-ROAD slightly decreased from the level in December 2002 However the total number of calls to Travel Information combining 1-800-695-ROAD and 5-1-1 calls together increased It is likely that 5-1-1 is replacing some of the calls to 1-800-695-ROAD
During the fourth quarter of 2003 the total number of calls to 1-800-695-ROAD and 5-1-1 increased by 786 percent with 481706 calls in 2003 versus 269675 calls in 2002
Travel Information Service Calls to 1-800 Road and 5-1-1 Calendar Year 2002-2003
250000
200000
150000
100000
50000
0 Jan Feb Mar Apr May Jun July Aug Sep Oct Nov Dec
2003 1-800-ROAD 2002 1-800-ROAD
Current Quarter 2003 5-1-1
On the Web Page views to Traveler information continue to increase They are up an average of 93 over the same quarter last year
Traveler Website Daily Usage Daily Average Page Views per Month (in millions)
Jan Feb Mar Apr May Jun Jul Aug Sep Oct Nov Dec 00
05
10
15
20
25
30
Current Quarter 2003 2002
Daily Average Page Views per Month Quarter 2002 and 2003 (in millions)
2002 2003 increase
October 08 17 113 November 13 30 131 December 21 29 38
In comparison to last yearrsquos numbers October saw an increase of 113 percent and November saw a 131 percent increase in daily page views
Highest One Day Total On November 19 2003 WSDOTrsquos web site received 68 million page views
bull 97 went to Traffic and Travel Information
bull 87 of those views originated from the WSDOT site ndash the remaining were from WSDOT through news and other sites such as KIRO KING and KOMO who used WSDOTrsquos cameras and flowmaps
WSDOT is also responding to the increasing number of requests for traffic and travel information to display on mobile devices Developments will be reported as they occur
Source WSDOT Communications Office
Source WSDOT Traffic Office
Measures Markers and Mileposts - December 31 2003 52
52 Measures Markers and Mileposts - December 31 2003
Options to Drive Alone Commuting Quarterly Update Park and Ride Lot Occupancy at WSDOT-Owned Sites in King County During the third quarter of calendar year 2003 occupancy of the 8500 parking spaces in the 32 WSDOT lots in King County averaged 73 percent
A three percent decrease in occupancy from the second quarter was due to summer seasonal declines in transit use About 50 percent of WSDOTrsquos park and ride lots in King County surpassed the target of 70 percent occupancy during the quarter Parked cars regularly exceeded maximum capacity in five lots
Highlights bull The new Issaquah Highlands Interim Park and Ride lot opened at the end of September This Sound Transit lot offers 103 parking spaces for commuters King County Metro is developing a permanent Park and Ride structure at Highland Dr NE and NE High St that is scheduled for completion in late 2005
bull The new 5-story Eastgate Park and Ride garage is scheduled for completion in June 2005
WSDOT-Owned King County Park and Ride Lots Percent of Capacity Used January 2001 through September 2003
100
90
80
70
60
50
Actual
Occupancy should exceed this target
Qtr 1 Qtr 2 Qtr 3 Qtr 4 Qtr 1 Qtr 2 Qtr 3 Qtr 4 Qtr 1 Qtr 2 Qtr 3 2001 2002 2003
Data availability has a lag of three months to allow the transit systems to collect and analyze the data Data for the fourth quarter of 2003 will be available in the next Gray Notebook
Source WSDOT Analysis of King County Metro data
bull Transit agencies throughout Puget Sound report persistent overcrowding at Park and Ride lots along major corridors due to lack of capacity and growing demand Efforts to increase transit and ridesharing are hampered by insufficient capacity at many commuter Park and Ride facilities
Vanpools in the Puget Sound Region Beginning with this issue of the Gray Notebook vanpool information and analysis will reflect a lag of three months in reporting data Reporting on the previous quarter will allow for more complete verification of the data During the third quarter the number of vanpools in operation in the region peaked in July (1376) followed by small decreases in August (1358) and September (1352) Despite the recent decrease the total number of vehicles on the road is up 35 percent since September 2002 when there were 1306 vanpools
Quarterly Regional Vanpool Highlights There are now 62 vanpool VanShare groups in operation in the Puget Sound region The VanShare program provides connections for employees between trains ferries park and ride lots and their work sites The VanShare program has proven to be very successful with Sounder trains on the Tacoma line (34 VanShare groups) King County Metro staff have begun marketing the VanShare program to employees riding between Everett and Seattle
bull Enhancements to regional Internet ridematch service in Puget Sound will provide a direct benefit to vanpools The improved service has the ability to ndash Provide up to 30 names on a match list request ndash Allow easier route planning with map viewing of Park amp Ride lots
Puget Sound Vanpool and VanShare Trends
1380
1360
1340
1320
1300
1280
1260
1240
Vanpools and VanShare
Vanpools Only
Jun Sep Dec Mar Jun Sep Dec Mar Jun Sep 2001 2002 2003
Data availability has a lag of three months to allow the transit systems to collect and analyze the data Data for the fourth quarter of 2003 will be available in the next Gray Notebook Source WSDOT Transportation Demand Management Office
ndash Increase user ability to select newest names on the match list ndash an effective tool for vanpool groups looking for riders ndash Provide promotional email message to users about their companyrsquos rideshare incentives along with an Employee Transportation Coordinator (ETC) contact phone number
Coming Next GNB Edition Commute Trip Reduction Task Force 2003 Report to the Washington State Legislature
Measures Markers and Mileposts - December 31 2003 53
Measures Markers and Mileposts - December 31 2003 55
Customer Feedback Washington State Ferries (WSF) collects customer complaints compliments comments and suggestions This information is recorded in the Automated Operating Support System (AOSS) database for measurement and action based on database cross tabulation and analysis
The charts show trends in the data for the last four fiscal years and the first two quarters of fiscal year 2004 (July 1 ndash December 31 2003)
Customer complaints were up 12 percent from the preceding quarter Complaints have increased for three consecutive quarters
WSF received 53 food service related complaints during the quarter This is only the second quarter in two and one-half years that food service has been in the top four comment types A total of 46 food complaints were received on the Edmonds-Kingston route during a two-week period in November when the MV Quinault was in service on this route The MV Quinault did not have galley service and is a much smaller vessel than the Jumbo Class ferry she was replacing
Washington State Ferries Quarterly Update
Vanpools exiting ferry on Bainbridge Island
N
20
305
16
160
3
525
104
104
104
20
20
525
3
101
1
Tacoma
Everett
Mt Vernon
Victoria
Bellingham
Port Angeles
Shelton
Seattle
5
5
5
5
90
405
Sidney
Shaw
Orcas
Keystone
Port Townsend
Clinton
Mukilteo
Kingston
FauntleroySouthworth
Vashon
Tahlequah
Point Defiance
Bainbridge Island
Edmonds
Anacortes
Bremerton
Friday Harbor
Lopez
2
101
AutoPassenger
Passenger-Only
Washington State Ferries Route Map
Total Customer Complaints Most Common Customer Comments Complaints per 100000 Customers Top Four Comment Types per 100000 Customers
15 12
10
10 08
06
5 04
02
0 0
Food Service
Loading Unloading
Compliments
On time performance
FY FY FY FY Qtr 1 Qtr 2 FY FY FY FY Qtr 1 Qtr 2 2000 2001 2002 2003 2004 2000 2001 2002 2003 2004
Does not include compliments or suggestions
Source for all charts WSDOT Ferries
Measures Markers and Mileposts - December 31 2003 54
54 Measures Markers and Mileposts - December 31 2003
On-Time Performance WSF has been collecting on-time performance data since June 2001 The table below compares WSF on-time performance across the system for the second quarters of fiscal year 2003 and 2004
Delays in the San Juan Islands are due primarily to construction activity at Shaw Island (see ldquoTrip Reliabilityrdquo comments below)
Improved on-time performance was experienced on WSFrsquos busiest route the FauntleroyndashVashonndashSouthworth route Approximately one quarter of all trips by WSF are made on this triangular route structure Fall schedule changes were developed with the Ferry Advisory Committees at Vashon and Southworth resulting in a schedule that increased on-time performance and allowed much needed late night maintenance on the three vessels serving this route
On-Time Trip Delivery Second Quarter Fiscal Year 2003 Second Quarter Fiscal Year 2004
All Trips All Trips A trip is considered toPercent of Average Percent of Average be on time if it departsTrips Within Delay From Trips Within Delay From
within ten minutes of theNumber 10 minutes Scheduled Number 10 Minutes Scheduled of Trips of Schedule Sailing Time of Trips of Schedule Sailing Time published scheduled
San Juan Domestic 5591 85 46 minutes sailing time Missed trips International Route
6443 94 27 minutes
EdmondsKingston 4564 94 31 minutes 4499 93 35 minutes1564 95 28 minutes
Passenger-Only SeattleVashon 1041 94 24 minutes 1003 98 22 minutes9534 91 43 minutes
KeystonePort Townsend 1852 96 24 minutes 1826 93 32 minutes6178 98 20 minutes
Point DefianceTahlequah 2708 93 40 minutes 2782 95 31 minutes4031 96 28 minutes
SeattleBremerton 2563 98 27 minutes 2451 97 31 minutes
152 85 48 minutes are not reported using this measure They
Passenger-Only SeattleBremerton
176 84 37 minutes
Service discontinued are included in the Trip Reliability measure
FauntleroyVashonSouthworth 9602 93 32 minutes
MukilteoClinton 6335 99 20 minutes
SeattleBainbridge Island 3901 98 26 minutes
Total 40654 94 30 minutes 38142 94 31 minutes
Trip Reliability WSF scheduled a total of 41678 trips during the 2nd quarter of fiscal year 2004 Of these trips 486 were missed Sixty-one percent (296) of the missed trips resulted from closures of the Shaw Island terminal during work on a $65 million preservation contract (see details on below) The chart below shows a system-wide average reliability index Assuming that a commuter worked 200 days per year and made 400 trips on WSF the statistical likelihood is that 47 ferry trips would be cancelled This rating represents a 178 decline in the reliability rating from the preceding quarter and a 140 decline in performance over the same period last year
Most Common Trip Cancellation CausesTrip Reliability Index Second Quarter Fiscal Year 2004Trip Reliability Index
rips per 400 SailingsMissed TMissed Trips per 400 Sailings
50
45
40
35
30
25
20 Other (7)15
Terminals (63)
Electrical (50)
Related Propulsion and Steering (43) Other (7)
Vessel
(19)
TidesWeather 10 (11) 5 WSF is undertaking a $65 million preservation contract at the Shaw Island
terminal this biennium Extensive pile driving and ldquoover waterrdquo work was accomplished this quarter to optimize environmental construction windows and seasonal traffic lulls WSF worked closely with the community on Shaw Island and throughout the San Juans to craft mitigation strategies
Cancelled Trips (Average Annual aimed at minimizing disruptions Trip Reliability Index Number = X 400
0
Total Scheduled Number of Because Shaw is a single slip facility closures were necessary duringTrips Commute Trips) regular service hours There was no service to Shaw Island during midday
from September 22 through November 7 One weekend closure was necessary September 27 and 28 Finally WSF completely shut down service from November 8 to November 11 All closures were coordinated
Source for all charts WSDOT Ferries with the community
Qtr 2Qtr 1 2004
FY FY FY FY FY 1999 2000 2001 2002 2003
Measures Markers and Mileposts - December 31 2003 55
Measures Markers and Mileposts - December 31 2003 57
WSF Construction Program ExpendituresCapital Expenditure Performance 2003-2005 Biennium 2nd Quarter Cumulative Dollars in Millions
WSDOT makes capital investments in the Ferry System Authorized vs Actual
through the Washington State Ferries Construction Program The program preserves existing and builds new ferry terminals and vessels supporting the Ferry System the capability to deliver responsible and reliable services WSF planned to spend $595 million over the period July-December 2003 Actual expenditures were $326 million bull Terminal Construction activities are under-spending
by $201 million The Port Townsend Preservation and Improvement projects are $63 million under the plan because project scopes have been revised and work deferred to later biennia Spending for property acquisition and design of the Edmonds Multimodal Terminal is $40 million behind due to a cautious approach to environmental issues and to negotiations with tribes System-wide projects are behind in spending by $25 million particularly in system planning activities and technical support to construction The Eagle Harbor Preservation project is $17 million behind in spending The Anacortes Multimodal Terminal project is $14 million behind in spending Both projects are experiencing slow starts The Shaw Terminal Preservation project is under-spending through December by $15 million and is expected to be completed under budget The Mukilteo Multimodal Terminal is underutilizing new law funds by $10 million This reflects WSFrsquos use of current law federal grants first before expending new law funds and a time lag between
Life Cycle Preservation Performance WSF terminals and vessels consist of several thousand components divided into Category 1 and Category 2 systems and structures Category 1 systems and structures are vital to the protection of people the environment and infrastructure All other terminal and vessel components are designated Category 2 Each component should be refurbished or replaced at the end of its life cycle to assure that WSF can provide responsible and reliable service
WSF has a work plan based on legislative funding to address the backlog of systems and structures that are past due as well as those constituting on-going deterioration of terminal and vessel components This biennium WSF plans to replace or refurbish 133 Category 1 systems and structures and 54 Category 2 components Twenty-three Category 1 systems and structures and two Category 2 items were completed through the second quarter
WSF uses life cycle ratings to measure the impact of its preservation activities The life cycle rating for Category 1 terminal and vessel components is projected to increase from 77 percent at the beginning of the biennium to 81 percent at the end of the biennium The life cycle rating for Category 2 components is projected to decline from 58 percent to 54 percent
Source for all charts WSDOT Ferries
$ 200
$ 150
$ 100
$ 50
$0
Authorized
Actual
Qtr 1 Qtr 2 Qtr 3 Qtr 4 Qtr 5 Qtr 6 Qtr 7 Qtr 8
consultant work and billings The Kingston Sewer Outfall project was paid for in the prior biennium freeing $08 million budgeted in the current biennium for other projects
bull Vessel Construction activities are under-spending by $62 million Variances include The MV Spokane is $55 million behind planned expenditures due to slower than expected billings for equipment procurement The MV Klahowya is $23 million behind because work is deferred to later in the biennium The MV Cathlamet is $17 million over plan because of unanticipated carry forward costs from the prior biennium
bull Emergency Repair activities are under-spending the plan by $06 million
Category 1 Terminal amp Vessel Systems amp Structures Preserved Cumulative Systems Preserved Planned vs Actual 2003-2005 Biennium Quarter 2 Ending December 31 2003
150
100
50
0 Qtr 1 Qtr 2 Qtr 3 Qtr 4 Qtr 5 Qtr 6 Qtr 7 Qtr 8
Planned
Actual
Category 2 Terminal amp Vessel Systems amp Structures Preserved Cumulative Systems Preserved Planned vs Actual 2003-2005 Biennium Quarter 2 Ending December 31 2003
60
50
40
30
20
10
0
Actual
Planned
Qtr 1 Qtr 2 Qtr 3 Qtr 4 Qtr 5 Qtr 6 Qtr 7 Qtr 8
Measures Markers and Mileposts - December 31 2003 56
56 Measures Markers and Mileposts - December 31 2003
Ridership and Revenues The Legislaturersquos Joint Task Force on Ferries (JTFF) comprised of legislators citizens ferry management and ferry workers was formed in 2000 The Task Force reviewed the workings of the WSF system and made recommendations including tariff increases designed to raise the farebox recovery rate to 80 percent of operating costs over six years The Transportation Commission instituted this recommendation and approved tariff increases of 20 percent in June 2001 and 125 percent in May 2002
In the fall of 2003 WSF management developed a new strategic plan aimed at balancing revenue generation necessary to capitalize the aging fleet The new plan reduced the size of the tariff increases for fiscal years 2003-2004 In the spring of 2003 the Transportation Commission adopted fare increases of five percent in May 2003 and an additional five percent in May 2004
As a result of the lower tariff increases ridership is not projected to fall as rapidly as anticipated in the original plan Repeating the pattern from fiscal year 2003 through the second quarter of fiscal year 2004 WSF has experienced slightly higher than projected ridership and revenues
Fiscal year to date ridership has exceeded the plan by four percent or 488000 riders Farebox revenues exceeded the plan by three percent or $2 million (Plan is based on June 2003 forecast)
Ferries Ridership by Month in Millions
3
2
1
0
FY 2004 Actuals
FY 2003 Actuals
FY 2004 Planned
Jul Aug Sept Oct Nov Dec Jan Feb Mar Apr May Jun
Ferries Farebox Revenues by Month Dollars in Millions
$15
$10
$5
$0
FY 2004 Planned
FY 2004 Actuals
FY 2003 Actuals
Jul Aug Sept Oct Nov Dec Jan Feb Mar Apr May Jun
Source for all charts WSDOT Ferries
Farebox Recovery Rate WSFWSF Annual Farebox Recovery RatesAnnual Farebox Recovery RatesFarebox recovery is the percent of annual operating and
maintenance costs recovered through tariffs and other non-tax 100revenues In line with WSFrsquos strategic plan farebox recovery
rates for fiscal year (FY) 2003 were up 54 percent from FY 2002 This is largely due to the May 2002 tariff increase 80
combined with cost saving initiatives A complex blend of cost increases also affected farebox recovery rates For example 60 total operating maintenance and support costs increased $44 million fuel costs increased $45 million insurance increased 40 $13 million and self insurance premiums and tort claims were up $16 million 20 Top performing individual routes in FY 2003 were Edmonds ndash Kingston (121 percent) Bainbridge ndash Seattle (110 percent) 0 and Mukilteo ndash Clinton (95 percent) On average auto routes 1998 recovered 76 percent of operating costs through the farebox while passenger only routes recovered 27 percent WSF also Source WSDOT Ferries
views each routersquos farebox recovery performance over several years as the trend is more important than a snapshot Extraordinary maintenance costs service interruptions or even route closures for terminal construction and many other isolated activities can dramatically effect farebox recovery during a one year period
1999 2000 2001 2002 2003
Measures Markers and Mileposts - December 31 2003 57
Measures Markers and Mileposts - December 31 2003 59
0
10000
20000
State-Supported Amtrak Cascades Service Quarterly Update
Ridership Ridership on state-supported Amtrak Cascades trains was 90664 in the fourth quarter of 2003 This was nearly identical to the fourth quarter of 2002 Trains that showed slight ridership increases during the quarter include the morning Seattle-Portland train both midday trains between these cities and the two Seattle-Bellingham trains The Seattle-Vancouver BC trains experienced the largest ridership decreases during the final quarter of 2003 contributing to a decline of over 8000 riders for the entire year on this route Factors that led to this decline include an increase in the number of cruise ship passengers departing from Seattle rather than Vancouver BC the overall effect of tourism and a lower exchange rate for the US dollar in Canada
For the entire year ridership was 385585 on state-supported trains also a slight increase over 2002 For all trains in the Amtrak Cascades system including those financially supported by the state of Oregon and Amtrak ridership was 589743 This represents the ninth consecutive year of ridership increases
Customer Satisfaction Amtrakrsquos Customer Satisfaction Index (CSI) is based on surveys of riders using the service The scores represent three-month rolling averages The CSI goal for Amtrak Cascades is 91 (out of 100) or better In the most recent survey period the overall score for Amtrak Cascades was 90 This score continues to be one of the highest in Amtrakrsquos national system and is nine points higher than the national average for routes of similar distance Survey responses showed high customer satisfaction with access to trip information prior to boarding the train the smooth and comfortable ride and the friendliness and helpfulness of train conductors Survey questions that produced lower scores include the quality and variety of food available on the trains and on-time performance
On-Time Performance On-time performance for state-supported Amtrak Cascades trains averaged 672 percent for the last three months of 2003 This was nearly eight points below the performance for the same period in 2002 and well below the goal of 80 percent set by WSDOT and Amtrak The primary cause of delays during the fourth quarter of 2003 was rail freight traffic congestion throughout the corridor and speed restrictions imposed by the railroad where rail line maintenance was taking place For the entire year on-time performance for Amtrak Cascades trains averaged 719 percent up slightly from 2002
Photo by Jeffrey T Schultz
State-Supported Amtrak Cascades Monthly Ridership Number of Passengers
50000
40000
30000
20000
10000
0
2003
2002
Jan Feb Mar Apr May Jun Jul Aug Sep Oct Nov Dec
Amtrak Cascades Annual Ridership 1994-2003
700000
600000
500000
400000
300000
200000
100000
0
Source for all charts Amtrak and WSDOT Rail Office
WashingtonAmtrak Trains
OregonAmtrak Trains
1994 1995 1996 1997 1998 1999 2000 2001 2002 2003
2003 data
50000
40000
30000
Measures Markers and Mileposts - December 31 2003 58
58 Measures Markers and Mileposts - December 31 2003
State-Supported Amtrak Cascades On-Time Performance 2003 vs 2002 Percent On-Time 2002 Average 708 2003 Average 719
Farebox Recovery The farebox recovery per train measures the percentage of total annual operating costs generated through ticket fares The average farebox recovery rate for the eight Amtrak Cascades trains financially supported by WSDOT was 399 percent in federal fiscal year (FFY) 2003 which was three points lower than in FFY 2002 This rate decline was driven by slightly lower revenues in FFY 2003 (-15 percent) when compared to the preceding year and a six percent increase in total operating expenses Costs that grew in FFY 2003 included diesel fuel and equipment insurance WSDOT and Amtrak hope that economic recovery in the Pacific Northwest will support higher revenue yields and improved farebox performance for Amtrak Cascades in 2004
King Street Station Update The renovation of King Street Station in downtown Seattle continued in the last quarter of 2003 Projects included final installation work on the temporary restrooms on the east side of the building construction work on replacement restrooms and removal of some interior walls on the first floor of the facility The elimination of these walls has exposed portions of the original interior walls and ceilings much of which has not been seen by visitors to the station in over 40 years The newly exposed sections inside the station will eventually become part of an enlarged passenger waiting area by Summer 2004
Washington Grain Train Update The Washington Grain Train carried 301 carloads of grain in the last quarter of 2003 This was 77 percent higher that in the final quarter of 2002 Quarterly growth was driven by slight increases in grain car usage by cooperatives near Moses Lake and Walla Walla and by the new grain train operating between Marshall and Pullman In 2003 the Washington Grain Train carried 1058 carloads a 21 percent increase over the total of 874 for 2002 The 2003 traffic increase was largely attributable to the third Washington Grain Train that began service in April 2003
The Washington Grain Train is a financially self-sustaining transportation program that supports the statersquos agricultural community while helping short line railroads maintain a sufficient customer base for long-term financial viability The 94-car fleet is jointly owned by WSDOT (76 cars) and the Port of Walla Walla (18 cars) The ports of Walla Walla Moses Lake and Whitman County share fleet management responsibilities
100
75
50
25
0
Jan Feb
Goal 80
2002
2003
Mar Apr May Jun Jul Aug Sep Oct Nov Dec
The on-time performance goal for Amtrak Cascades is 80 or better A train is considered on-time if it arrives at its final destination within 10 minutes or less of the scheduled arrival time
State Supported Amtrak Cascades Farebox Recovery Per Train
100
80
60
40
20
0
FFY 2002
FFY 2001
FFY 2003
Train 501 506 507 508 510 513 516 517 Number SEA PORT SEA PORT SEA BELL SEA VAN
to to to to to to to to PORT SEA PORT SEA VAN SEA BELL SEA
Source for above charts Amtrak and WSDOT Rail Office
Washington Grain Train Carloads Carloads Per Month 2002 vs 2003
2003 1058 carloads 140
120
100
80
60
40
20
0 Jan Feb Mar Apr May Jun Jul Aug Sep Oct Nov Dec
2002 874 carloads for 12 months
for 12 months
Source WSDOT Rail Office
Measures Markers and Mileposts - December 31 2003 59
Measures Markers and Mileposts - December 31 2003 61
Special Features Organic Recycling Earns Award for WSDOT The Washington Organic Recycling Council (WORC) presented WSDOT with an award December 11th for ldquofulfilling the vision of innovative application and specification of compost in Washington State roadside developmentrdquo Everyone benefits when organic materials are recycled into products of value These products improve the quality of landscape materials They have a positive impact in our environment by improving soil and plant health conserving water reducing erosion and reducing the use of fertilizers and pesticides They also replace other sources of wood for paper and fuel production
The award recognized in particular the work of the Roadside and Site Development Unit
WORC credits WSDOT with the use of one-third of the compost produced in the state For more information on good composting practices visit wwwcompostwashingtonorg
WSDOT Receives 2003 Federal Performance Letter ldquoReport Cardrdquo from FHWA Each year the Washington Division of the Federal Highway Administration (FHWA) audits WSDOTrsquos compliance with federal rules and regulations In summarizing this yearrsquos overall results the 2003 Performance Letter signed by FHWA Division Administrator Daniel M Mathis stated ldquoBased on the inspections reviews program evaluations and audits conducted in FY 2003 it is my finding that WSDOT has complied with federal laws and regulations in expending federal-aid highway funds allocated to the State of Washingtonrdquo
The performance letter evaluates WSDOTrsquos performance in 21 project and program areas such as bridge inspection standards financial billing environmental commitments and program efficiencies The letter called out a positive example of WSDOTrsquos work ldquoconstruction costs reported in the Gray Notebook are accurate and track closely with the data we have compiledrdquo In addition FHWA noted some areas for improvement such as ensuring all bridge inspections are completed within the 24 month frequency requirement using the pavement smoothness standard more consistently and establishing a tracking database to assure that environmental commitments are not affected by project changes
Mathis concluded the letter by commending WSDOT ldquofor continuing to strengthen your performance management initiatives such as the Gray Notebook your continued efforts in enhancing these tools provides further evidence that WSDOT is focused on being accountable for state and federal transportation fundingrdquo The 2003 Performance Letter can be found on-line at wwwwsdotwagovaccountabilityFHWA_FY2003_performancereportpdf
Global Positioning at WSDOT Surveyors have been using Global Positioning Systems (GPS) for years Most people are acquainted with non-survey level GPS technology as a navigational aid in their vehicles for wayfinding on a hike and even for keeping tabs on a child or family pet
WSDOT is using GPS to inventory the locations of roadway features such as signs guardrails pavement conditions trees utility devices drainage systems bridges traffic devices light poles etc It can accurately record the location of maintenance procedures such as mowing spraying or striping GPS is also being used for wetland delineation
In future editions of the Gray Notebook WSDOT will be presenting more detailed information on how GPS is being utilized
Measures Markers and Mileposts - December 31 2003 60
60 Measures Markers and Mileposts - December 31 2003
Highlights of Program Activities Quarter Ending December 31 2003
Project Starts Completions Updates bull WSDOT began on Dec 17 charging its contractor penalties of about $3000 per weekday for every day that opening of the State Route (SR) 290 Trent Avenue Bridge in Spokane was delayed Working days were re-negotiated and added to the projectrsquos contracted schedule in May 2003 when some unanticipated construction conditions were discovered At that time WSDOT approved a new schedule submitted by the contractor Ross Bros amp Co of Salem Oregon for a mid-December completion In late November it became apparent that Ross Bros was not going to be able to meet that schedule Penalties will be withheld from the final payment of the $89 million contract
bull The SR 519 (South Royal Brougham Way) project near the Seattle waterfront Safeco Field and Seahawk Stadium cleared a major hurdle when the old ramp from Fourth Avenue South to eastbound Interstate 90 was demolished The demolition contractors RW Rhine finished the task in 10 days This allowed WSDOT crews to re-open the vital I-5 and I-90 exits to Fourth Avenue South along with several major streets and intersections in the area The new structure created by this project separates vehicle pedestrian and rail traffic and provides a greater margin of safety for all
bull A series of late October storms dumped record setting rain severely damaging SR 20 in several locations causing the earliest closure of the North Cascades Highway ever Some of the worst damage occurred at Pyramid Creek (MP 126) and Ketchum Creek (MP 124) where large sections of roadway disappeared guardrail was left hanging and torrential rain rocks and dirt rendered large culverts useless WSDOTrsquos contractor Pacific Road and Bridge made progress stabilizing and rebuilding the roadway portions damaged by water and a primitive but passable road is now in place Crews will return next spring to lay down the final layer of asphalt However on November 9 a huge rockslide thundered down the mountainside just east of Newhalem slamming into Highway 20 taking out portions of roadway and cutting off access to the town of Diablo in Whatcom County URS Corporation the contractor monitoring and surveying the hillside has placed monitoring equipment on the unstable slope The instruments will indicate if the hillside is moving where it is moving and by how much This information is critical to keeping crews safe as they move in and out of the area
bull Crews installed several large steel girders across I-5 in Lynnwood in late November in association with the construction of Sound Transitrsquos Lynnwood Park amp Ride Direct Access Project The steel girders formed the skeleton of a new ramp over I-5 south of 44th Ave W which will provide direct access to and from the I-5 high-occupancy vehicle lanes for buses carpools and vanpools The project is currently on time and on budget with completion scheduled for fall 2005
bull SR 11 better known as Chuckanut Drive near Bellingham was closed after a large rockslide blocked the highway on Oct 29 Up to 60 tons of rock and debris came loose from the hillside above the roadway and crashed onto the highway blocking both lanes of traffic just south of Larrabee Park and north of Oyster Creek Crews worked seven days a week to stabilize the hillside to reopen the road to traffic on Nov 14
bull Crews on the SR 162 Voights Creek Bridge Replacement project near Orting are using some of the latest technology to protect the environment Because of the bridgersquos close proximity to a fish hatchery workers are using an oscillator to excavate the bridge shafts The oscillator twists as it presses the casing down into the ground minimizing disturbance to the surrounding environment In addition three 134-foot lsquosupergirdersrsquo will used to support the bridge deck In past bridge projects five to eight girders are typically used This new technology means less intrusion on water habitat and fewer maintenance requirements The $21 million replaces an aging wooden structure with a concrete bridge and realigns SR 162 to eliminate a high accident location Work is scheduled for spring 2004 completion
bull Three options to replace the SR 520 Floating Bridge are being explored They include a four-lane structure with shoulders wider lanes and a pedestrianbicycle lane a six-lane option that also adds a high-occupancy
SR 290 Trent Avenue Bridge as it appeared on Dec 4 The bridge had been slated for opening on Dec 16
Measures Markers and Mileposts - December 31 2003 61
Measures Markers and Mileposts - December 31 2003 63
vehicle lane in each direction and an eight-lane option that adds the elements of the six-lane and a general-purpose lane in each direction This fall WSDOT worked with divers to better identify objects on the floor of Lake Washington that could potentially affect the construction of a new bridge With at least $2 billion 15 years and a main connection across Lake Washington on the line WSDOT wanted to know all the impacts every step of the way to assure that time and taxpayer money are not wasted Preliminary side-scan sonar images showed three objects in the water some 1000 feet north of the current SR 520 Bridge Two objects appear to be barges The third object is a large boat estimated at 150 feet in length
bull WSDOTrsquos Aviation Division is participating in a project to install an irrigation system to support new turf growth at the Stehekin Airport near Lake Chelan Non-native plants growing on the airport runway have been the targets of a spray program paid for by the Aviation Division for years The National Park Service provided funding that allows the division to reseed the airport with a dense native grass to choke out the weeds About 20 pilot organizations volunteered to install the irrigation system The airportrsquos new turf will be ready for use next year and pilots will be able to operate from a smooth runway free of dust and gravel
bull Workers finished seismic retrofit work at the SR 20 Deception and Canoe Pass Bridges by installing 10000 bolts into the underside of the bridge decks The bolts connect the bridge decks to their supporting steel structures creating a connection that makes both bridges safer and more stable in the event of an earthquake Both bridges now meet current seismic codes
bull Just prior to the deluge of fall rains crews completed a $17 million paving project on SR 112 between the Makah Reservation and Hoko River Bridge in Clallam County Start of the job was delayed until August after young eagle fledglings near the project left their nest SR 112 was designated as a scenic highway in 2002 The highway terminates at Neah Bay on the northwest tip of the Olympic Peninsula and provides motorists access to one of the most remote areas of our state
Savings and Efficiencies bull A pilot project to compare the use of salt to the use of other anti-icing chemicals for improving winter driving conditions is being repeated An unusually mild winter weather in 2002-03 limited the amount of data collected and the initial study results did not show a clear-cut advantage to using one anti-icing product over another in all cases WSDOT is evaluating the use of rock salt and salt brine in comparison to other anti-icing chemicals to determine the effect on driving conditions corrosiveness to various types of metals impacts to the roadside environment and cost of snow and ice control This yearrsquos results will be combined with last yearrsquos for a complete report and made available to those who are interested
bull The National Association of State Aviation Officials (NASAO) named the WSDOTrsquos Aviation Division the ldquoMost Innovative Staterdquo of 2003 for developing an ldquoOn-line Pilot Registrationrdquo program The On-line Pilot Registration program began in January 2003 to improve customer service and streamline administrative processing WSDOT found that the improved service increased the number of pilots mechanics and aircraft owners who registered with the WSDOT Since the implementation of online registration revenues that support air search and rescue have increased more than $100000 Additionally over 4000 aviators have subscribed to the Aviation News Service which has improved communication between WSDOT Aviation and its customers
Rail bull The Federal Railroad Administration recently awarded $1 million to WSDOT for highway-rail grade crossing improvements The funds are designated for crossing improvements on the Pacific Northwest Rail Corridor in Cowlitz County and at several crossings between Marysville and Bellingham in Snohomish and Whatcom counties Washington is one of only ten states receiving funds The Pacific Northwest Rail Corridor extends 466 miles from Eugene Oregon via Portland and Seattle to Vancouver British Columbia
Materials for the airport project are barged across Lake Chelan
Measures Markers and Mileposts - December 31 2003 62
62 Measures Markers and Mileposts - December 31 2003
Public Transportation and Commute Trip Reduction bull WSDOT teamed up with local jurisdictions transit agencies and private companies to launch this yearrsquos Rideshare Weeks (Oct 13 ndash 24) an annual campaign encouraging commuters to incorporate carpooling vanpooling transit cycling and walking in their travel to work Flexing work hours and working from home or an alternate location also helped meet the campaignrsquos two major goals exposing commuters to their choices in transportation while saving space on the roads Rideshare Weeks was being featured in public service announcements donated by the Seattle Post-Intelligencer in radio spots in Puget Sound and Spokane and at worksites participating in the statersquos Commute Trip Reduction program WSDOT has coordinated with 16 public agencies to develop promotions and shared messaging For more information see wwwwsdotwagov partnerswsrorideshare bull On Tuesday October 21 WSDOT joined transportation providers at the Omak Senior Center to highlight new bus service in Okanogan County made possible through $460748 in state and federal public transportation grants WSDOT presented giant symbolic checks and a key for a new minibus to Colville Confederated Tribes Northwestern Trailways and Okanogan County Transportation
Awards and Recognition bull Linda Pierce of WSDOT Materials Lab and Steve Muench and Joe P Mahoney of the University of Washington have been awarded the national Premier Award sponsored by National Engineering Education Delivery System (NEEDS) for the new WSDOT Pavement Guide ndash Interactive The WSDOT Pavement Guide Interactive is now the official textbook for the primary pavement-oriented course in the UW Department of Civil and Environmental Engineering
bull WSDOT received the prestigious national leadership award from the Association for Commuter Transportation (ACT) for creating balanced transportation solutions that integrate commute options into highway planning projects in the Puget Sound region of Washington state WSDOT Transportation Demand Management (TDM) Resource Center has been heavily involved in research to determine ways to improve travel choices ndash such as vanpools carpools and bicycles ndash in transportation projects planning TDM focuses on reducing drive-alone auto trips by making other choices more available and attractive The ACT award recognizes that WSDOT is leading the way to incorporate alternatives to driving alone into new plans for transportation corridors such as State Route 520 and Interstate 405
bull WSDOT and the Department of General Administration received Governor Lockersquos Governorrsquos Award for Organizational Learning and Growth for the Deschutes Parkway Reconstruction Project The project was completed in October 2002 18 months after the Nisqually Earthquake destroyed major portions of Deschutes Parkway which surrounds Capitol Lake and links Tumwater to downtown Olympia RCI Construction Inc the project contractor contributed to an accelerated repair schedule and the project was completed many months earlier than first estimated and two months ahead of the contract schedule The completed project cost $698000 (16) less than the original engineerrsquos estimates Taxpayers saved an additional $525000 when a previously planned utility upgrade was completed at the same time as the road repairs instead of later This project changed the ways GA and WSDOT collaborate which is already saving money on other projects
Celebrations and Events bull Washington State Ferries (WSF) employees volunteered their time and skills to assist on the annual Special Peoples Holiday Cruise for the Puget Sound regionrsquos children and adults with special needs The event took place aboard the MV Puyallup and is sponsored by the Active Ferry Employees Charitable Trust (AFECT) The afternoon outing has been hosted by AFECT for almost 20 years No state funds are used The annual event is supported by donations of time and money including the Marine Corps Toys for Tots program Chevron Oil and Sodexho Corporation Many other local groups provide entertainment and support
bull WSDOT maintenance crews closed SR 410Chinook Pass on Monday Nov 17 and SR 123Cayuse Pass on Tuesday Nov 18 for the season due to heavy snowfall and snow slide danger Cayuse Pass connects Chinook Pass and White Pass at the east end of Mount Rainier National Park Cayuse and Chinook passes typically close for the season in November and reopen in April
bull Studded tires became legal in Washington on Saturday Nov 1 Studded tires are restricted in Washington due to the amount of wear and roadway damage they cause to state highways estimated at $10 million per year The tires are legal between November 1 and March 31 WSDOT is requesting legislative action to ban studded tires because of the damage and ruts they cause to highways and due to safety considerations Research shows that cars with studded tires take longer to stop than cars with other tires under most situations
Measures Markers and Mileposts - December 31 2003 63
Measures Markers and Mileposts - December 31 2003 65
Gray Notebook Subject Index
Edition Key 1 = Quarter 1 2001 2 = Quarter 2 2001 3 = Quarter 3 2001 4 = Quarter 4 2001 5 = Quarter 1 2002 6 = Quarter 2 2002 7 = Quarter 3 2002 8 = Quarter 4 2002 9 = Quarter 1 2003 10 = Quarter 2 2003 11 = Quarter 3 2003 12 = Quarter 4 2003
All editions can be accessed at wwwwsdotwagovaccountability
Topic Edition
Aviation Fuel Taxable Gallons 6Registrations of Pilots and Aircraft 6 10Training of Pilots and Mechanics 6
Benchmarks (RCW 4701012) Administrative Efficiency 9Transit Efficiency 9VMT per Capita 9
Bridge Conditions on State Highways Age of WSDOT Bridges 4Bridge Ratings (FHWA) Structurally Deficient and Functionally Obsolete 4Bridge Condition Ratings State Comparison 8Bridge Structural Condition Ratings 11Deck Protection Program Overview 4 5 8 11Deck Protection Program Planned vs Actual Projects 4 5 8 11Hood Canal Bridge Update 11Inspection Program 4 11Inventory of WSDOT Bridges 4 5 8 11Preservation Program Results 11Rehabilitation and Replacement Project Schedule 4 11Scour Mitigation 4 11Seismic Retrofit Program 1990-2020 Status 4Seismic Retrofit Program Planned vs Actual Projects 4 5 8 11Seismic Retrofit Program Top 10 Priority Bridges 4 8Steel Bridge Painting Planned vs Actual Projects 4 5 8 11Tacoma Narrows Bridge Update 8 9 10 11
Commute Trip Reduction Award for the Commute Trip Reduction Program 6 11Commute Mode Share in Washington State 1990 and 2000 7Commuting Trends at CTR Work Sites and Work Sites in General 4ldquoDrive Alonerdquo Commuting Rates State Comparison 6 7Eastgate Park and Ride Expansion 9Effectiveness of CTR Program (Biennial Results) 4Employer Participation Investment and Benefits 2Gasoline Consumption Per Capita (from Northwest Environment Watch) 7Park and Ride Lot Occupancy Rates Central Puget Sound 4Park and Ride Lot Occupancy Rates King County 3 5 6 7 8 9 10 11 12Park and Ride Lot Security 5Park and Ride Lot Puget Sound System 8Vanpool Operation in the Puget Sound Region 2 3 4 5 6 7 8 9 10 11 12Vanpooling Share of Daily Puget Sound Area VMT 2VanShare Trends 8 9 11 12
Congestion on State Highways Accidents on Interstate 405 2001 and 2002 9Benchmark Policy Goals for Congestion Analysis 5Congestion Measurement Principles 5 6Daily Vehicle Hours of Delay per Mile Sample Commutes Measured
by Delay Time of Day Distribution of Delay and Travel Rate Index 2 5Distribution of Traffic Between Freeways and Arterials 1999 to 2003 9Employment Puget Sound Region 9
Measures Markers and Mileposts - December 31 2003 64
64 Measures Markers and Mileposts - December 31 2003
Edition Key 1 = Quarter 1 2001 2 = Quarter 2 2001 3 = Quarter 3 2001 4 = Quarter 4 2001 5 = Quarter 1 2002 6 = Quarter 2 2002 7 = Quarter 3 2002 8 = Quarter 4 2002 9 = Quarter 1 2003 10 = Quarter 2 2003 11 = Quarter 3 2003 12 = Quarter 4 2003
All editions can be accessed at wwwwsdotwagovaccountability
Topic Edition Congestion on State Highways (continued)
Highway Improvements Can Improve Congestion 9Induction Loop Detectors 5Intelligent Transportation Systems in Washington State 5
2000 and 2003 9Traffic Speeds and Volumes on SR 520Traffic Volumes at Seven Locations in March 2000 to 2003 Average 9Traffic Volumes on Nine Puget Sound Region Corridors 5Travel Time Reliability 6 9Travel Time to Work Comparison State and County Rankings 5Travel Times on 11 Puget Sound Region Corridors 5 9Travel Times With and Without Incidents 6Typical Freeway Traffic Volume Trend 1993 to 2002 9
Construction Program for State Highways Advertisements by Subprogram Planned Actual amp Deferred 4 5CIPP Value of Advertised amp Deferred Projects by Subprogram 4 5Construction Program Cash Flow Planned vs Actual Expenditures 4 5 6 7 8 9 10 11 12Construction Program Delivery Planned vs Actual Advertisements 1 2 3 4 5 6 7 8 9 10 11 12Contracts Awarded Engineerrsquos Estimate to Award Amount 6 10Contracts Completed Final Cost to Award Amount 6 10Contracts Completed Final Cost to Engineerrsquos Estimate 6 10End-of-Season Highway Construction Project Evaluations 12FHWA Federal Performance Report Card 12Hood Canal Bridge Update 11 12Hot Mix Asphalt Pavement Delivery 3 5 7 9 11Lane Miles Added to State Highway System 1996-2001 2Safety Construction Program Planned vs Actual Advertisements 3 6 8 9 10 11 12Tacoma Narrows Bridge Update 8 9 10 11 12
Design Value Engineering 6 10
Environmental Stewardship Compost Use 7Construction Site Erosion and Runoff Protection 4 6 9 12ldquoEcology Embankmentrdquo Pollutant Removal 8Environmental Impact Statement (EIS) Tracking 9Environmental Compliance Assurance Tracking Violations 9 12Fish Passage Barriers 4Herbicide Usage Trends 5 8 12Organic Recycling Award for WSDOT 12Recycling Aluminum Signs 7Wetland Mitigation and Monitoring 5 9 12
Ferries (WSF) Capital Expenditure Performance Planned vs Actual 4 5 6 7 8 9 10 11 12Customer Comments 3 4 5 6 7 8 9 10 11 12Fare Comparison WSF to Other Auto Ferries 4Farebox Recovery Rate 5 12Farebox Recovery Comparison WSF to Other Auto Ferries and Transit 5Farebox Revenues by Month 3 4 5 6 7 8 9 10 11 12Life Cycle Preservation Performance Planned vs Actual 12On-Time Performance 3 4 5 6 7 8 9 10 11 12Operating Costs Comparison WSF to Other Ferry Systems 3Ridership by Month 3 4 5 6 7 8 9 10 11 12Trip Reliability Index and Trip Cancellation Causes 3 4 5 6 7 8 9 10 11 12
Measures Markers and Mileposts - December 31 2003 65
Measures Markers and Mileposts - December 31 2003 67
Edition Key 1 = Quarter 1 2001 2 = Quarter 2 2001 3 = Quarter 3 2001 4 = Quarter 4 2001 5 = Quarter 1 2002 6 = Quarter 2 2002 7 = Quarter 3 2002 8 = Quarter 4 2002 9 = Quarter 1 2003 10 = Quarter 2 2003 11 = Quarter 3 2003 12 = Quarter 4 2003
All editions can be accessed at wwwwsdotwagovaccountability
Topic Edition Maintenance of State Highways
Achievement of Biennial Maintenance Targets (MAP) 3 4 8 12Anti-Litter Campaign Update 5 11Costs of State Highway Maintenance 4Customer Satisfaction with WSDOT Highway Maintenance Activities 3Debris Pusher Maintenance Attachment 6Guidepost Driver 11Herbicide Usage Trends 5 8 12Highway Sign Bridges Planned vs Actual Repairs 3 4 6 8Highway Signs Number of Maintenance Actions 6 8Integrated Vegetation Management Update 5 12Litter Removal from State Highways 5 6 8 11Living Snow Fence on SR 25 9Mountain Pass Highway Closures 7 9Pavement Striping How Do They Paint the Stripes So Straight 6Pavement Striping Planned vs Actual Miles Painted 3 4 6 8Road Kill on State Highways 5Safety Rest Area Locations and Amenities 9Salt Pilot Project 7 10Snow and Ice Control Operations 4 7Survey on Pass Travel Conditions and Anti-Icer Use 2Survey on Safety Rest Areas 9Traffic Signals Annual Energy Costs and Incandescent Bulb Conversion 3Winter Overtime Hours and Snowfall Amount 7 9Winter Roadway Condition Level of Service and Anti-Icer Chemicals 9Winter Severity and Snow and Ice Operations Costs 9Vortex Generators 5
Pavement Conditions on State Highways ldquoDuerdquo Pavement Rehabilitation Needs 4 8Concrete Pavement Lane Miles by Age and Dowel Bar Retrofit Status 12Pavement Condition Trends 4 8 12Pavement Condition by Type 2Pavement Lane Miles Annual Vehicle Miles Traveled and Programmed Dollars 12Smoothness Rankings by State 4 8 12
Rail Freight Grain Train Carloads 5 6 7 8 9 11 12Grain Train Route Map 5 9Washington Fruit Express Car Loadings Per Week 5 8
Rail State-Supported Amtrak Cascades Service Amtrakrsquos Future 5 6 7 9Budget Update 10Capital Improvement Program and WSDOT Service Goals 2Customer Satisfaction 2 3 4 7 9 12 Farebox Recovery Percentage by Train 4 8 12Internet Reservations and Automated Ticketing 6Investment in Intercity Rail Comparison 5On-Time Performance 2 3 4 5 6 7 8 9 10 11 12Operating Costs 4Passenger Trips by Station 6Ridership by Month 2 3 4 5 6 7 8 9 10 11 12Ridership by Year Long-Term Trends 2 4 8Ridership Patterns by Segment (Seats Sold) 3Route Map Amtrak in Washington 6Station Update 11Vehicles Diverted Annually from Interstate 5 by Cascades 2
Measures Markers and Mileposts - December 31 2003 66
66 Measures Markers and Mileposts - December 31 2003
Edition Key 1 = Quarter 1 2001 2 = Quarter 2 2001 3 = Quarter 3 2001 4 = Quarter 4 2001 5 = Quarter 1 2002 6 = Quarter 2 2002 7 = Quarter 3 2002 8 = Quarter 4 2002 9 = Quarter 1 2003 10 = Quarter 2 2003 11 = Quarter 3 2003 12 = Quarter 4 2003
All editions can be accessed at wwwwsdotwagovaccountability
Topic Edition Safety on State Highways
Alcohol-Related Fatality Rate 12Before and After Collision Data for Highway Safety Improvement Projects 12Bicycle and Pedestrian Safety Federal Benchmark 9Bicyclist Fatality Rates State Comparison 9Cable Median Barrier Installation Before and After Collision Data 12Corridor Safety Program Results 8Driving Speeds on State Highways 4Fatal and Disabling Collisions Circumstances and Type 8Fatal and Disabling Collisions at Intersections Types of Collisions 9Fatal and Disabling Crashes and VMT percent change 3 7 11Fatalities Involving High Blood Alcohol Concentration State Comparison 7Fatality Rates State Highways All State Public Roads amp US 3 7 11Guardrail Retrofit Program 11High Accident Corridors and Locations by Region 4 High Accident Corridors and Locations Statewide 3Low Cost Safety Enhancement Program Planned vs Actual Projects 3 4 5Low Cost Safety Enhancement Program Sample Projects 4 6Pedestrian Fatality Rates State Comparison 8Pedestrian Factors in VehiclePedestrian Collisions 8Port Orchard Roundabout Before and After Collision and Injury Data 12Safety Construction Program Planned vs Actual Project Advertisements 3 6 7 8 9 10 11 12Safety Laws Booster Seats and Mandatory Seat Belts 5Safety Projects Completed This Quarter 7Seatbelt Use State Comparison 7 11Safe Routes to Schools 9 12
Traffic Operations on State Highways FHWA Self-Assessment 9Incident Response Calls Responded to by Region 2Incident Response Clearance Time Distribution 11 12Incident Response Clearance Times 2 3 4 5 8 9 10 11 12Incident Response Customer Comments 8Incident Response Economic Analysis 10Incident Response Non-Collision Response Types 8 9 10 11 12Incident Response Program Types of Responses Program Total 9 10 11 12Incident Response Program Types of Responses 15 to 90 Minute Incidents 9 10 11 12Incident Response Program Types of Responses Over 90 Minute Incidents 9 10 11 12Incident Response Service Actions Taken 7 10 11 12Incident Response Teams Go to the Olympics 5Incident Response Teams Location and Type 7Incident Response Timeline 6Incident Response Times 2 3 4 5Incident Response Total Number of Responses by Month 7 8 9 10 11 12Incidents with Clearance Times Over 90 Minutes 6 7 8 9 10 11 12Intelligent Transportation Systems in Washington State 5Joint Operations Policy Statement between WSDOT
and Washington State Patrol 5Service Patrol Contacts 3 4Spokane Interstate 90 Peak Hour Roving Service Patrol Pilot 5
Traveler Information Award for Traveler Information Web Site 11Calls to 1-800-695-ROAD and 5-1-1 8 9 10 11 12Camera Views 8Evaluation Survey 10Web Site Feedback 8 9Web Site Usage 7 8 9 10 11 12
Measures Markers and Mileposts - December 31 2003 67
Edition Key 1 = Quarter 1 2001 2 = Quarter 2 2001 3 = Quarter 3 2001 4 = Quarter 4 2001 5 = Quarter 1 2002 6 = Quarter 2 2002 7 = Quarter 3 2002 8 = Quarter 4 2002 9 = Quarter 1 2003 10 = Quarter 2 2003 11 = Quarter 3 2003 12 = Quarter 4 2003
All editions can be accessed at wwwwsdotwagovaccountability
Topic Edition Truck Freight
Cross Border Truck Volumes 6 10Freight Routes and Border Crossings in Washington 6 10Freight Shipments To From and Within Washington 10Impediments to Truck Shipping Bridges with Posted Weight Restrictions 6Improvement Projects with Freight Benefits 10Intelligent Transportation Systems Use for Trucks 6 10Managing Over-Sized Truck Loads 6OsoyoosOroville Border Facts 10Overdimensional Trucking Permits 6Revenue Prorated to Washington for Trucks in Interstate Use 6 10Truck Registrations in Washington 6Truck Share of Total Daily Vehicle Volumes 6
Workforce Accident Prevention Activities 3 4 5 6 7 8 9 10 11 12Ferry Vessel Workers Recordable Injuries 2 3 4 5 6 7 8 9 10 11 12Highway Engineer Workers Recordable Injuries 2 3 4 6 7 8 9 10 11 12Highway Maintenance Workers Recordable Injuries 1 2 3 4 5 6 7 8 9 10 11 12Highway Maintenance Workers Safety Training 5 6 7 8 9 10 11 12Human Resources Training for all WSDOT Employees 7 8 9 10 11 12North American Association of Transportation Safety and Health Officials Meeting 3Workforce Levels 5 6 7 8 9 10 11 12
Measures Markers and Mileposts - December 31 2003 68
68 Measures Markers and Mileposts - December 31 2003
Americans with Disabilities Act (ADA) InformationPersons with disabilities may request this information be prepared and
supplied in alternate formats by calling the Washington State Department of Transportation ADA Accommodation Hotline collect (206) 389-2839
Persons with hearing impairments may access Washington State Telecommunications Relay Service
at TTY 1-800-833-6388 Tele-Braille 1-800-833-6385 Voice 1-800-833-6384 and ask to be connected to (360) 705-7097
Civil Rights Act of 1964 Title VI Statement to Public Washington State Department of Transportation (WSDOT) hereby
gives public notice that it is the policy of the department to assure full compliance with Title VI of the Civil Rights Act of 1964 the Civil Rights
Restoration Act of 1987 and related statutes and regulations in all programs and activities Persons wishing information may call the WSDOT
Office of Equal Opportunity at (360) 705-7098
Other WSDOT Information Available The Washington State Department of Transportation has a vast amount
of traveler information available (including Puget Sound area traffic mountain pass reports highway closures ferry schedules and more)
Call the WSDOT statewide toll-free number 1-800-695-ROADIn the Seattle area (206) DOT-HIWY [368-4499]
For additional information about highway traffic flow and cameras ferry routes and schedules Amtrak Cascades rail and other transportation
operations as well as WSDOT programs and projects visitwwwwsdotwagov
For this or a previous edition of the Gray Notebook visit wwwwsdotwagovaccountability
0401-0004
- Cover
- Credits
- Table of Contents
- Beige Pages
-
- Project Reporting on the 2003 Transportation Funding Package
- Current Project Highlights and Accomplishments
- Project Delivery
- Financial Information
- Program Management Information
-
- Worker Safety Quarterly Update
- Workforce Levels and Employee Training Quarterly Update
- Highway Construction Program Quarterly Update
- Tacoma Narrows Bridge Project Update
- Hood Canal Bridge Project Update
- Highway Safety Improvement Projects Quarterly Update
- Asset Management Pavement Assessment Annual Update
- Highway Maintenance Annual Update
- Environmental Programs
- Incident Response Quarterly Update
- Traveler Information Quarterly Update
- Options to Drive Alone Commuting Quarterly Update
- Washington State Ferries Quarterly Update
- State-Supported Amtrak Cascades Service Quarterly Update
- Special Features
- Highlights of Program Activities
- Gray Notebook Subject Index
-

Measures Markers and Mileposts The Gray Notebook for the quarter ending December 31 2003
12th EditionPublished February 19 2004
ldquoWhat gets measured gets managedrdquoThis periodic report is prepared by WSDOT staff to track a variety of performance and
accountability measures for routine review by the Transportation Commission and others The content and format of this report is expected to develop as time passes Information is reported on a preliminary basis as appropriate and available for internal management use
and is subject to correction and clarification
Contributors Project Delivery Reporting (Beige Pages)
Project Control and Reporting Office Linda Anderson Kevin Dayton Doyle Dilley Kevin Jeffers
Claudia Lindahl Regional Program ManagersPatty Lynch Carol Lee Roalkvam
Nancy Thompson
Worker Safety Rex Swartz
Workforce Levels and Employee Training Dave Acree Adrienne Sanders David Supensky
Highway Construction Program Project Control and Reporting Office
Lloyd Brown Kevin Dayton Gaius Sanoy
Highway Safety Mike Bernard Kimberly Colburn Dan Davis
Roger Horton Brian Limotti Pat Morin Sandra Pedigo Marshall John Milton Paula Reeves
Brian Walsh Anna Yamada
Asset Management Tom Baker Aaron Butters Pat Morin
Sivaneswaran NadaraLinda Pierce
Highway Maintenance Rico Baroga Chris Christopher
Nicole Ribreau Ray Willard
Incident Response Diane McGuerty Anna Yamada
Environmental Programs Scott Carey Bob Thomas Richard Tveten Anthony Warfield
Travel Information Jeremy Bertrand Anna Yamada
Options to Drive Alone Commuting Kathy Johnston Brian Lagerberg
Washington State Ferries Bill Greene John Bernhard
Rail Kirk Fredrickson Carolyn Simmonds
Highlights Ann Briggs
Editing and Production Team
Daniela Bremmer Keith Cotton Megan Davis Brooke Hamilton Robin Hartsell Paul Motoyoshi
Graphics Zoe Estus Steve Riddle
For information contact Daniela Bremmer WSDOT Strategic Assessment 310 Maple Park Avenue SE PO Box 47374 Olympia WA 98504-7374
Phone 360-705-7953 E-mail bremmedwsdotwagov
The Gray Notebook is published quarterly in February May August and November For an online version of this or a previous edition of the Gray Notebook visit wwwwsdotwagovaccountability
Cover photos left to right the ferry Wenatchee approaches Pier 52 in Seattle incident response truck Amtrak Cascades US 395 in Stevens County
Measures Markers and Mileposts The Gray Notebook for the quarter ending December 31 2003
12th EditionPublished February 19 2004
Contents
Project Reporting on the 2003 Transportation Funding Package 1Project Reporting1Current Project Highlights and Accomplishments3Contract Advertising and Awards3Project Completions and Other Highlights 5Project Delivery8Proposed Adjustments to Delivery Planning8Opportunities and Options for Legislative Consideration 11ldquoWatch Listrdquo12Financial Information 18Revenue Forecasts18Bond Sales 19Financial Plans for Accounts19Program Management Information 22Management Information Systems and Needs22Right of Way Acquisition22Utilities Relocation23Environmental Documentation Review Permitting and Compliance23Consultant Utilization 24Construction Employment Information 25Construction Safety Information25
Worker Safety Quarterly Update 27Injury rates for WSDOTrsquos highway engineering highway maintenance and ferry vessel workers
Workforce Levels and Employee Training Quarterly Update 28The size of WSDOTrsquos permanent full-time workforce and employee training needs
Highway Construction Program Quarterly Update 29Construction program delivery examples of deferred and advertised projects cash flow safety improvement program delivery and WSDOTrsquos third annual construction project evaluations
Tacoma Narrows Bridge Project Update 33Hood Canal Bridge Project Update 34Highway Safety Quarterly Update 35Before and after collision data for safety improvement projects collision reduction from cable median barrier installation alcohol-related fatality rate Safe Routes to Schools and collision reduction from installation of a roundabout in Port Orchard
Asset Management Pavement Assessment Annual Update 39Pavement condition trends extent and use of various pavement types rating pavement conditions and 2002 state pavement smoothness comparison
Highway Maintenance Annual Update 42Biennial Maintenance Targets (MAP)42Percentage of legislatively funded targets achieved from 1998 to 2003 Integrated Vegetation Management (IVM) 43Herbicide use trends the Clallam County IVM Plan IVM plan implementation schedule and the US District Court January 2004 ruling
Environmental Programs Annual Update 45Environmental Management System (EMS)45Environmental Compliance Assurance 46Non-compliance events and resulting actual notices IVM non-compliance events Monitoring Replacement Wetlands47Total acreage of wetland replacement projects by type sites meeting success standards in 2003 success rate for wetlands that have completed monitoring Stormwater Treatment Facilities 48Monitoring Water Quality 48State water clarity standards compliance Golden Harvest Creek culvert replacement case study Erosion Control Preparedness49Fall erosion and sediment control assessment results
Incident Response Quarterly Update 50Number and types of responses average clearance times incidents with clearance times over 90 minutes and service actions taken
Travel Information Quarterly Update 52Number of calls to 1-800-695-ROAD and 511 and Web site usage
Options to Drive Alone Commuting Quarterly Update 53Puget Sound vanpool use and park and ride lot occupancy trends
Measures Markers and Mileposts - December 31 2003 27
Contents (continued)
Washington State Ferries Quarterly Update 54Customer comments on-time performance trip reliability capital expenditure performance life cycle preservation performance ridership and farebox revenues and annual farebox recovery rates
State-Supported Amtrak Cascades Service Quarterly Update 58Monthly and annual ridership on-time performance farebox recovery and a King Street Station update Washington Grain Train Update 59Grain Train carloads
Special Features 60Organic Recycling Earns Award for WSDOT 60WSDOT Receives Federal PerformanceReport Card 60Global Positioning at WSDOT 60
Highlights of Program Activities 61A snapshot of WSDOTrsquos activities during the quarter including project starts completions and updates savings and efficiencies rail public transportation and commute trip reduction awards and recognition and celebrations and events
Gray Notebook Subject Index 64Where to find every performance measure ever published in the Gray Notebook via electronic access
Project Reporting on the 2003 Transportation Funding Package
Introduction
WSDOT is preparing extensive information for legislators state and local officials interested citizens and the press on the progress of the program funded by the 2003 Transportation Funding Package Much of the detailed information is regularly presented and maintained on-line on the WSDOT website The Gray Notebook in these special pages known as the Beige Pages highlights each quarterrsquos progress and reports on financial and other program management topics as well as detailed information on key projects
The Beige Pages for this quarter are organized in the following manner
Project Reporting Current Project Highlights and Accomplishments Project Delivery Financial Information Program Management Information
This quarterly report represents a work in progress that will be expanded and refined as more and more projects approach or enter into construction We welcome suggestions and inquiries that can help us strengthen this project delivery and accountability reporting
Project Reporting Project reporting uses several different tools including the Gray Notebook web-based Project Pages and Quarterly Project Reports (QPR) A Project Page will be created for all major WSDOT projects whereas the QPRs will be created for Nickel funded projects of the 2003 funding package (See also Financial Information)
Navigation to the Home Page and the Project Pages
WSDOTrsquos home page can be found at wwwwsdotwagov
The Home Page (shown at right) has several links that allow access to the individual Project Pages through the Accountability navigation bar which provides access to ldquohot linksrdquo found in the on-line version of the Gray Notebook and the Projects navigation bar (which accesses a list of all WSDOT projects)
Project Pages for several of the largest projects are directly linked to the Home Page under the Projects navigation bar Project pages can also be accessed from any WSDOT web page by clicking on the ldquoprojectsrdquo tab at the top of every page
Beige Pages - Measures Markers and Mileposts - December 31 2003 1
Beige Pages - Measures Markers and Mileposts - December 31 2003 3
Roadmap to On-line Project Information The diagram below is a roadmap to the information found on-line The on-line version of the Gray Notebook as well as the Home Page will have ldquohot linksrdquo to the individual Project Pages
Gray Notebook
Home Page
Project Information Roadmap
Project Page Project Pages will report on all WSDOT 2003 Transportation Fund projects Project Pages provide detailed information that is updated regularly
bull Overall Project Vision bull Financial Table bull Funding Components bull Roll-up Milestones bull Roll-up Cash Flow bull Contact Information bull Maps and Links
bull Highlights bull Milestones bull Status Description bull Problem Statement bull Risk Challenges bull Project CostsCash Flow bull Contact Information
QPR Quarterly Project Reports will summarize quarterly activities
Project Pages
Project Pages contain information on all aspects of a specific project An existing Project Page is shown at right
Project Pages provide details on overall project vision funding components financial tables milestones status description problem discussions risk challenges forecasting maps photos links and more
WSDOT has approximately 140 Project Pages that are currently providing on-line updates
A summary of the information found on a Project Page will be provided in a Quarterly Project Report (QPR) that WSDOT anticipates will be accessible through a link on the Project Page
Project pages are to the best of WSDOTrsquos ability regularly updated
Project pages can be found at wwwwsdotwagovprojects
Beige Pages - Measures Markers and Mileposts - December 31 2003 2
2 Beige Pages - Measures Markers and Mileposts - December 31 2003
Current Project Highlights and Accomplishments This is WSDOTrsquos third report of quarterly developments in the delivery of the program of projects under the 2003 Transportation Funding Package
The following project information is gathered from a variety of sources within WSDOT and is principally the responsibility of the various regional administrators and their project teams As a regular part of its project management and accountability strategy for the legislaturersquos 2003 Transportation Funding Package a team of senior WSDOT managers from Olympia meets in each region each quarter to perform due diligence on progress and status for each project and to offer assistance support and coordination of issues or problems arising with any project This process also facilitates the ability of headquarters staff to discuss project status with members and staff of the House and Senate and to report from first hand knowledge about the projects to the Transportation Commission
Contract Advertising and Awards
2003 Transportation Funding Package (ldquoNickel Fundsrdquo) Nine projects were planned to be advertised this quarter Seven of these projects were advertised as planned One project was advanced for advertisement Two projects were deferred for later advertisement
Projects Advertised as Planned
SR 9SR 528 Intersection ndash Signal
This project went to ad October 20 2003 The construction is now starting and the project is expected to proceed on schedule
SR 16 HOV Improvements between Olympic View Drive and Union Ave
This project consists of three construction phases The first contract 6th AvenuePearl Street (SR 16) to Jackson Avenue was advertised to bidders on schedule in mid-November 2003 with this first phase construction to be awarded in mid-January 2004 This construction phase will widen SR 16 to prepare for HOV lanes provide a new trail for bikes and pedestrians and rehabilitate the pavement on SR 16 mainline to accommodate traffic switches needed for phase 2 of the project The contractor will begin grading work in Spring 2004 and is expected to complete its work in Winter 2004
US 97A Entiat Park Entrance - Turn Lanes
This project was advertised on schedule and was awarded on December 15 2003 This project was combined with a ldquonon-nickelrdquo funded roadway preservation project US 97AWenatchee North - Paving Combining this project resulted in a cost savings of $80000 The contractor will begin construction in April 2004 and is expected to be completed in July 2004
SR 124 East Jct SR 12 ndash Reconstruction
This project improves safety on SR 124 east of Pasco by realigning a horizontal curve and widening the lanes and shoulders The contract was advertised for bids on December 8 2003 meeting the schedule to proceed to bid opening on January 14 2004 The improvements are scheduled be open to traffic by summer 2004
SR 161 234th Street to 204th Street E
This project consists of two construction phases The first contract 234th Street East to 204th Street East was advertised to bidders in early November 2003 and awarded to the low bid contractor on December 22 2003 This construction phase will widen SR 161 from one lane to two lanes in each direction The contractor will begin grading work on the new highway in Spring 2004 and this phase is expected to be completed in July 2006
Beige Pages - Measures Markers and Mileposts - December 31 2003 3
Beige Pages - Measures Markers and Mileposts - December 31 2003 5
SR 203 NE 124thNovelty Rd Vic
The project was advertised on schedule However the total project cost has increased by approximately $900000 due to additional right of way and preliminary engineering costs to accommodate King Countyrsquos strict flood plain ordinance This project is funded with pre-existing funds the 2003 Transportation Funding Package and King County and Developer contributions $254000 of the cost increase will have to be accommodated from the 2003 Transportation Funding Package
US 395 Kennewick Variable Message Sign
This project improves safety on US 395 by installing a variable message sign camera and traffic sensor north of the Blue Bridge to warn southbound traffic of congestion and accidents ahead The contract was advertised for bids on schedule on December 1 2003 The bid opening is scheduled for January 14 2004 and the improvements should be placed in use for traffic by summer 2004
Project Advanced for Advertisement
SR 527 132nd SE to 112TH SE (Additional Lanes)
The advertisement date was advanced from March 2005 to December 2003 to coordinate with the availability of funds planned for the project from other sources avoid redesign for changes in stormwater treatment requirements and meet a commitment to Boeing The contract award date is February 25 2004
Projects Deferred for Later Advertisement
SR7SR 507 to SR 512 ndash Safety
The December 2003 contract advertisement date for this project has been delayed until obstacles in right of way acquisition can be cleared WSDOT believed that right of way would be obtained from property owners for a December ad date However the department has received 18 requests for adjudicative hearings from property owners adjacent to the project Additional time will be required to prepare detailed surveys title searches and coordinate scheduling with the Attorney Generalrsquos Office for each of the hearings WSDOT is focused on completing negotiations with the property owners and anticipates advertising the project in spring 2004 with construction starting no later than the summer of 2004
SR 522I-5 to SR 405 Multi-Modal Project
To take advantage of coordinating work with Lake Forest Park in conjunction with the needs of WSDOT the advertisement date would slip from winter 2003 to spring 2006 The 2003 Transportation Funding Package provided the entire project funding in the construction phase The changes will result in shifting $2 million in expenditures from the 03-05 to 05-07 biennium This project is part of an integrated program of corridor improvements where WSDOT will coordinate portions of this project with other improvements which will be funded and constructed by local municipalities such as Seattle Kenmore Lake Forest Park and Bothell
Beige Pages - Measures Markers and Mileposts - December 31 2003 4
4 Beige Pages - Measures Markers and Mileposts - December 31 2003
Project Completions and Other Highlights
Construction Highlights
Several of the highway and rail projects funded by the Nickel Account are now in construction More details can be found in the respective on-line Project Pages at wwwwsdotwagovprojects
Highway Construction Program
I-5 Widen Each Direction From Salmon Creek to I-205
The contractor is currently constructing retaining walls necessary for the widening of the southbound lanes Work is continuing on the temporary widening using a detour bridge in preparation for a traffic shift that will allow construction of the northbound lanes The traffic shift is expected to occur in May 2004 The construction schedule identifies the first weekend closure to demolish the existing NE 129th St structure on the weekend of January 31 2004 The new NE 129th St structure is scheduled to be completed in five months
I-90 Build Lanes from Argonne to Sullivan Road
The contractor met the November 1 2003 milestone to have the temporary westbound lanes constructed and open to traffic Although the project was suspended October 31 2003 for the winter work is continuing on minor items such as drainage ponds Road work will restart as soon as weather conditions permit
I-90 Highline Canal to Elk Heights ndash Truck Passing Lanes
This project constructs a truck climbingpassing lane on eastbound I-90 east of the Indian John Hill Rest Area Work on the project was suspended for the winter on November 20 2003 due to snow and cold temperatures Prior to suspending work the contractor had completed clearing the land in preparation for the widening of the roadway Ninety percent of the embankment excavation and drainage has been completed The left side bridge rail replacement on the Highline Canal bridge is complete To date project completion status is at about 30 Work will resume as weather conditions permit
I-90 Ryegrass Summit to Vantage ndash Truck Passing Lanes
This project constructs a truck climbingpassing lane on westbound I-90 from Vantage to the top of Ryegrass Summit Due to winter conditions work by the contractor was suspended on November 14 2003 Nearly one mile of the additional lane and modifications to the Ryegrass Rest Area ramps are completed and already open to traffic WSDOT survey crews will continue to work preparing for the next construction season as weather permits It is anticipated that the contractor will resume work in March 2004
SR 500 NE 112th Avenue Interchange
This project constructs a new interchange on SR500 at NE 112th AvenueGher Road All utility relocations are now complete and traffic was shifted to temporary lanes during a weekend closure on November 2 2003 (one day ahead of schedule) The bridge footings and columns have been constructed as planned for the eastbound ldquofly-overrdquo bridge with girder placement expected to occur in a three night sequence in mid January 2004 The placement of the noise barrier along the I-205 ramp has started with a scheduled completion of April 2004
Beige Pages - Measures Markers and Mileposts - December 31 2003 5
Beige Pages - Measures Markers and Mileposts - December 31 2003 7
Other Capital Programs
Purchase Oregon Train Set
A purchase agreement to complete this important rail rolling stock acquisition project in the 2003 Transportation Funding Package was executed between WSDOT and Talgo Inc on November 26 2003 Talgo will now paint the outside of the cars to match those already in the fleet The purchase will allow for additional rail passenger service between Seattle and Portland upon completion of track improvements
Tacoma RMDRR Morton Line Repairs ndash Phase 2
This project will complete the necessary repairs to the rail line between Frederickson and Morton to restore rail service interrupted by the 1996 flood Construction of a portion of this project for immediately needed repairs began in July 2003 and was completed in mid-December 2003 The remainder of the construction project will be accomplished under separate agreement with the City of Tacoma (owner) scheduled to begin in early 2004 It is anticipated that the entire project will be completed before the end of the current biennium
Highlights of Projects Ready for Advertisement for 2004 Construction Season
Five of the highway projects in the 2003 Transportation Funding Package are scheduled for advertisement in the two quarters for January 1 2004 to June 30 2004 (the 3rd and 4th quarter of the 03-05 biennium) More details can be found in the respective on-line Project Pages at wsdotwagovprojects The status of these projects is described below Two projects that were scheduled for advertisement during this time frame were deferred to future quarters (the status of these projects are described below)
I-5 2nd Street Bridge (ad date 452004)
The current proposal is to assist traffic flow by reducing construction from two seasons to one No change in total project cost is anticipated The project is expected to be advertised as scheduled
SR7SR 507 to SR 512 ndash Safety (ad date 532004)
The ad date for this project in December 2003 was not met because of complications that arose in the right of way taking May 2004 is the rescheduled ad date that WSDOT hopes to meet if negotiations with property owners can be completed in time
I-90 Cle Elum River Bridge (ad date 31504)
Environmental documentation is complete and approximately 80 of the design is finished The scheduled advertisement date is expected to be met and pre-construction start date is expected to be May 2004
SR 304SR 3 to Bremerton Ferry Terminal (ad date 21704)
This project reconstructs and widens the existing roadway It will add HOV lanes to increase traffic movement The City of Bremerton is the lead agency for this project
WSDOTrsquos role is primarily to assure the administration of the funding provided for in the 2003 Transportation Funding Package WSDOTrsquos expectation is that the City of Bremerton will advance the projectrsquos scheduled advertisement date The estimated construction completion date is June 2006
SR 509 Design amp Critical Right-of Way (ad date 672004)
Construction funds are being transferred to the City of SeaTac which is the lead agency on this phase of the project Environmental permitting and stormwater designs are being developed by WSDOT and are on track to support the scheduled ad date and budget WSDOT expects that the City of SeaTac will meet the scheduled ad date The project is on schedule and within the established budget
Beige Pages - Measures Markers and Mileposts - December 31 2003 6
6 Beige Pages - Measures Markers and Mileposts - December 31 2003
SR 9 Nooksack Road to Cherry Street (ad date 604)
This project was originally scheduled for advertisement in June 2004 but that date has had to be adjusted (is now set for October 2005) because of new geotechnical information requiring design revisions that in turn have led to a larger-than-originally-expected right of way acquisition program Construction cost savings however are also expected to result
SR 161 204th Street to 176th Street (ad date 2904)
The project was originally scheduled for advertisement in February 2004 but that ad date has had to be adjusted (is now set for November 2004) due to real estate acquisitions that have taken longer than expected and to avoid work zone traffic control issues by constructing the entire four miles at the same time WSDOT is coordinating access revision with local developers along the corridor and is currently nearing completion of the design and real estate acquisition phase
Beige Pages - Measures Markers and Mileposts - December 31 2003 7
Beige Pages - Measures Markers and Mileposts - December 31 2003 9
Project Delivery
Proposed Adjustments to Delivery Planning
Meeting schedule budget and scope expectations are important elements in WSDOTrsquos delivery of the projects in the 2003 Transportation Funding Package Planning and design activities for specific projects sometimes identify the need to make adjustments to construction delivery spending schedules Some of these adjustments will have no impact on critical start or completion dates Others may require adjustments to critical dates
The information in this report describes changes that WSDOT has concluded as desirable based on assessments made in the quarter under review ending December 31 2003
Highway Construction Program
US 2 Peshastin East Interchange
The spending plan for this project should be revised based on the Value Engineering Study done in August 2003 and the Cost Risk Assessment done in July 2003 The spending plan for this project has been reduced $88 million to a total of $165 million This is a cost savings of 35 from the budget amount WSDOT also has a plan to reduce the construction phase of the project by two years from three years to one year while maintaining the planned advertisement date of September 4 2009
I-5SR 502 Interchange and Corridor Widening
WSDOT has the opportunity to make advance purchases of Right of Way from property owners that have expressed interest in selling now Purchasing Right of Way at this time benefits both the sellers and the WSDOT in that sellers will be able to know what affect the project will have on them and be fairly compensated and early acquisition lessens the risk of land development increasing land value In order to accelerate this preliminary design and RW work WSDOT is requesting to advance $1000000 for RW and $200000 for Preliminary Engineering into the 0305 biennium The advancement of funds will not increase the total project cost
I-5 Noise Wall
This project was removed from the September 30 2003 Watch List The project is in Seattle near the end of SR 520 and Roanoke Street Previously WSDOT reported that cost and schedule for this project were being reviewed to allow for completion of the design and may result in an ad delay With the review complete and design underway the project will be advertised in early summer 2004 with a construction start in late summer
I-5SR 526 TO US 2 (Marine View Dr) HOV Lanes
WSDOT proposes to advance the advertisement date from March 2008 to October 2007 to ensure that work begins in the spring of 2008 to take full advantage of the 2008 construction season In addition WSDOT is proposing to advance $4 million into the 2003-2005 biennium in order to accelerate design work This acceleration would put WSDOT in a position to further accelerate this project for the benefit of the 2010 Olympics if the Legislature should decide to advance funding for construction (see Opportunities and Options for Legislative Consideration section of this report)
SR 7SR 507 to SR 512 ndash Safety
The December 2003 contract advertisement date for this project has been delayed until right of way access issues can be resolved WSDOT believed that right of way would be cleared with property owners for a December ad date However the Department has received 18 requests for adjudicative hearings from property owners adjacent to the project Additional time will be required to prepare detailed surveys title
Beige Pages - Measures Markers and Mileposts - December 31 2003 8
8 Beige Pages - Measures Markers and Mileposts - December 31 2003
searches and coordinate scheduling with the Attorney Generalrsquos Office for each of the hearings WSDOT is focused on completing negotiations with the property owners and anticipates advertising the project in spring 2004 with construction starting no later than the summer of 2004
SR 9 Nooksack Road to Cherry Street
This project will have an ad date shift from June 2004 to October 2005 to account for an increase in the number of right of way parcels that must be acquired The total cost of the project remains the same as the construction estimate has decreased
SR 16 HOV Improvements ndash Olympic View Drive to Union Avenue
The third construction phase of this project 36th Street to Olympic Drive NW would be advanced two or three quarters to allow more flexibility for planning and implementing traffic switches needed to accommodate the opening the new Second Tacoma Narrows Bridge This third and final construction phase will complete continuous HOV lanes on either side of the Tacoma Narrows from the Sprague Avenue Interchange in Tacoma to the Olympic Drive Interchange in Gig Harbor by spring 2007 Moving the construction start date of this phase from spring 2005 to fall 2004 will not affect the overall cost of the project
SR 20 Quiet Cove Road Vic to SR 20 Spur
In the September 30 2003 Gray Notebook this project was listed on the Watch List At that time WSDOT reported the advertisement date for this project may be delayed to provide time for right of way acquisition and to resolve environmental mitigation issues Currently the advertisement date would slip by nine months from February 2006 to November 2006 which will result in shifting $3 million in projected Nickel Fund expenditure from the 05-07 to 07-09 biennium
I-90 Two-Way Transit and HOV
This Seattle to Mercer Island project is currently funded for design by Sound Transit FHWA and WSDOT and is dependent on Regional Transportation Investment District (RTID) and other sources of funding for construction Should RTID funding become available WSDOT proposes the advertisement date be delayed thirteen months from December 2004 to January 2006 to allow time for the issuance of the draft Environmental Impact Statement This will allow the design to be completed in October 2005 There is no change in the expected project cost However $1 million in projected Nickel Fund expenditures would need to be shifted from the 03-05 biennium to the 05-07 biennium
SR 99 S 284th to S 272nd St HOV Lanes
This project will include a HOV lane and 2 general-purpose lanes in each direction a median sidewalk and planter strip The updated cost estimate for right-of-way acquisition is $51 million this is an increase from the previous estimate of $3 million to account for the potential of higher cost of condemnation The advertisement date would be delayed from December 2005 to April 2006 to correct the record of survey which identify property ownership WSDOT is currently working with the City of Federal Way to minimize the right-of-way cost by eliminating some of the proposed landscaping areas
SR 161 Corridor Improvements ndash 204th Street E to 176th Street
There are multiple stages to this project Stage 1 (234th to 204th) was advertised in November 2003 The proposal is to adjust cash flow and delay the advertisement date of Stage 2 (204th to 176th) from November 2003 to November 2004 This action will reduce traffic impacts and help right of way acquisition These changes should not change the total project cost
Beige Pages - Measures Markers and Mileposts - December 31 2003 9
Beige Pages - Measures Markers and Mileposts - December 31 2003 11
SR 203 NE 124thNovelty Rd Vic
The project was advertised on schedule However the total project cost has increased by approximately $900000 due to additional right of way and preliminary engineering to accommodate King Countyrsquos strict flood plain ordinance This project is funded with pre-existing funds the 2003 Transportation Funding Package and King County and Developer contributions About $250000 of the expected cost increase will come from the 2003 Transportation Funding Package
SR 520 W Lake Sammamish Parkway to SR 202 (Additional Lanes)
Cash flow adjustment to match actual design right of way and construction schedules No change in advertisement date of October 2008
SR 522I-5 to SR 405 ndash Multi-Modal Project (Nickel)
To take advantage of coordinating work with Lake Forest Park in conjunction with the needs of WSDOT partners the advertisement date would slip from winter 2003 to spring 2006 to take advantage of coordinating work with Lake Forest Park The 2003 Transportation Funding Package provided the entire project funding in the construction phase The changes will result in shifting $2 million in expenditures from the 03-05 to 05-07 biennium This project is part of an integrated program of corridor improvements where WSDOT will coordinate portions of this project with other improvements which will be funded and constructed by local municipalities such as Seattle Kenmore Lake Forest Park and Bothell
For financial information on the Proposed Adjustments to Delivery Planning ndash Highway projects please refer to the table on page 16
Other Capital Programs The following six proposed project changes have interrelated funding and impact one another
Palouse River and Coulee City Railroad Acquisition
Depending on a finding of cost effectiveness that the Legislature instructed be made by the Transportation Commission WSDOT would purchase 302 miles of the Palouse River and Coulee City Railroad preserving the statersquos largest short-line railroad that carries 20 percent of the statersquos grain crop The original proposed budget has been reduced by $322000 after further cost estimate review If the conclusion of WSDOTrsquos review of the proposed purchase of this railroad is favorable the purchase will be completed with this decrease in the adjusted budget
Port of Columbia Railroad Improvements (New Project Title)
After further engineering review and scope refinement the following three projects are combined and overall reduced in scope to reflect actual improvements needed to maintain railroad service on this section of track
The original project Port of Columbia Railroad Improvements ndash funds general railroad improvements on the 39-mile line Based on further engineering reviews the original scope for this project has been reduced from a full rebuild of the line to a less expensive rehabilitation of the line that will still provide an adequate level of service to the rail line customers The proposed change will be combined with two additional projects listed in the 2003 Funding Package (the Blue Mountain Railroad Upgrade project which rebuilds 30 miles of track from Wallula to Walla Walla and the Port of Columbia Co Dayton Upgrades project which funds improvements to port rail facilities) into a single project with a total budget of $53 million as compared to the originally combined project budgets of $13 million
Beige Pages - Measures Markers and Mileposts - December 31 2003 10
10 Beige Pages - Measures Markers and Mileposts - December 31 2003
Port of Columbia Dayton Upgrades and Blue Mountain Railroad Upgrade
These projects fund improvements to port rail facilities and rebuilding 30 miles of track from Wallula to Walla Walla It is proposed that these projects be combined with Port of Columbia Railroad Improvements project as described above The original intent of both projects will still be accomplished at a reduced cost
Palouse River and Coulee City Cheney-Coulee-Pullman Upgrade (New Project Title)
After further engineering review and scope refinement two projects (Palouse River and Coulee City Cheney to Coulee Upgrades and Rural Elevator Track Expansion) are combined Also engineering analysis suggests the need for scope change to include upgrades of PRampCC lines in Whitman County
The original project (Palouse River and Coulee City Cheney to Coulee Upgrades) would have funded repairs to numerous railroad bridges in Grant and Lincoln Counties and upgrade track to accommodate 286000-pound freight cars It would also improve the rail line between Coulee City and Cheney The proposed change will combine these upgrades with projects in Whitman Co that were identified by WSDOT in the summer of 2003 Further the scope of the work from the Rural Elevator Track Expansion project (additional track at rural elevators and shortline mainline connections) will also be combined into this expanded scope The proposed scope will be completed within the overall total of $21089000 specified for the projects in aggregate
For financial information on the Proposed Adjustments to Delivery Planning - Rail projects please refer to the table on page 17
Opportunities and Options for Legislative Consideration
The following projects were reported as requiring legislative guidance in June 2003 and continue to be offered for legislative consideration Details on the projects are found in the Gray Notebook for June 30 2003
I-5SR 526 TO US 2 (Marine View Dr) HOV Lanes
The question remains on whether the construction schedule for this project should be advanced so that the project can be completed prior to the 2010 Winter Olympic Games
WSDOT has developed two accelerated schedule options for legislative consideration Option one is to accelerate the project schedule and advertise it for construction bids in March 2006 using the common ldquoDesign-Bid-Buildrdquo practice This option will result in an open to traffic date of 2010 Option two is to accelerate the project schedule and advertise by July 2005 using the ldquoDesign-Buildrdquo method This option will result in an open to traffic date of 2009 and is WSDOTrsquos preferred option The expenditure plan reflects the ldquoDesign-Buildrdquo option
SR 99 Alaskan Way Viaduct
The project replaces the seismically vulnerable Alaskan Way Viaduct and seawall in downtown Seattle The Gray Notebook for September 2003 identified the need to begin design in the summer 2004 as essential to remain on schedule to meet the proposed 2008 start of construction The project has moved money from one phase to another in 2003-2005 with zero dollar change to the bottom line By making this adjustment restoring right of way and increasing PE in the 05-07 biennium The project remains on the accelerated pace that will allow construction to begin in 2008 but not unless funding issues can be resolved
Beige Pages - Measures Markers and Mileposts - December 31 2003 11
Beige Pages - Measures Markers and Mileposts - December 31 2003 13
I-405 Congestion Relief and Bus Rapid Transit Projects
WSDOT proposes revising the I-405 Nickel project sequence to be Kirkland Stage 1 Renton Bellevue and Kirkland Stage 2 The Kirkland Stage 1 project addresses a known congestion hot spot that has a very high benefitcost ratio with work that can be incorporated into future RTID projects This schedule revision allows a project to be constructed and opened to traffic earlier than the original sequence The revision also allows the Renton project the opportunity to combine Nickel funds with Regional Transportation Improvement District (RTID) funds in a larger more cost-effective project should RTID funds become available
SR 522 Bothell ndash UW Campus Access
Should WSDOT use the Nickel expenditure authority for this project since the funding from the lead funding partners did not materialize and WSDOTrsquos budget for the project is insufficient to construct the project This was identified in the September 30 2003 Gray Notebook
SR539I-5 AccessImprovements Ten Mile Road to International Boarder
The question remains on whether the construction schedule for this project should be advanced so that the project can be completed prior to the 2010 Winter Olympic Games
Widening the remaining section of the ldquoTen Mile Roadrdquo will require the project be funded in a future budget appropriation The Nickel funding will provide for preliminary engineering environmental analysis and selection of a project plan for a new connection between I-5 and SR 539 Completing the final design right of way and construction of the project will however require new funding
D Street Grade Separation
The question remains whether the cash flow of this project be advanced into the 03-05 biennium from the 05-07 biennium to enable construction to be accomplished with other stages of this project
The Gray Notebook for September 30 2003 suggests that the 03-05 Supplemental Budget include a $35 million increase in the Program Z appropriation within the Multimodal Account
For financial information on the Opportunities and Options for Legislative Consideration please refer to the table on page 17
ldquoWatch Listrdquo Projects Cost and Schedule Concerns Watch List WSDOT is watching some projects closely for warning that changes in cost schedule or scope may be at risk due to developments and discoveries during the project delivery process in some cases these changes are outside the control of WSDOT Currently the information regarding the changes for these projects are in the early stages and making a conclusion based on this information may not
Watch List
achieve the desired result
Projects Removed from the September 30 2003 Gray Notebook Watch List
SR 3 to SR 303 Interchange Waaga Way
Removed from the Watch List Concerns had been raised that several issues in the design concepts developed in 1995 now necessitating coordination with Kitsap County might require delay of the scheduled ad date in Spring 2005 These issues have now been successfully addressed ndash reducing the
Beige Pages - Measures Markers and Mileposts - December 31 2003 12
12 Beige Pages - Measures Markers and Mileposts - December 31 2003
number of traffic signals reducing the volume of pavement increasing traffic volume capacity and minimizing impacts on local adjacent ball fields Project progress now supports both the originally scheduled ad date and the project budget
I-5 Noise Wall
See Proposed Adjustments in delivery planning Removed from the Watch List Previously WSDOT reported that the need to prepare design for the project would lead to delay in the schedule originally set by the legislature With the review complete and design underway the project has now been scheduled to advertise in early summer 2004 with construction work to begin during the summer
SR 20 Quiet Cove Road Vic to SR 20 Spur
See Proposed Adjustments in delivery planning Removed from the Watch List This project has moved to Proposed Adjustments in the Gray Notebook WSDOT reported the need to delay the advertisement date for this project might be delayed to provide additional time to acquire environmental approvals necessary for right of way acquisition The current plan is to slip the advertisement date by nine months from February 2006 to November 2006 in order to provide adequate time to resolve environmental mitigation issues and acquisition right of way This delay will result in shifting $3 million in Nickel funding expenditure from the 05-07 to 07-09 biennium
SR 99 S 284th to S 272nd St HOV Lanes
This project has moved to proposed adjustments in the Gray Notebook Removed from the Watch List The updated cost estimate for right-of-way acquisition is $51 million This is an increase from the previous estimate of $3 million and has been factored in to the project to account for the potential higher cost of condemnation Advertisement date will be delayed from December 2005 to April 2006 in order to correct the record of survey to identify property ownership
SR 161 Jovita Blvd to S 360th St
Removed from Watch List In the September 30 2003 Gray Notebook this project was on the Watch List for potential design changes from increased costs and delayed construction due to environmental and air quality provisions that have become more stringent while waiting for funding to be approved The air quality analysis has now been completed and there will be no impact to the project as a result The NEPA re-evaluation is still in progress and WSDOT anticipates the report to be finalized in January 2004 and approved shortly thereafter
SR 203 NE 124thNovelty Rd Vic
See Proposed Adjustments to Project Delivery and Contract Advertising amp Awards Removed from Watch List Previously WSDOT reported that arriving at a new floodplain mitigation site might have implications for cost and schedule The project was advertised on schedule but the project costs for additional engineering and right of way acquisition increased by a total of $900000
US 395 North Spokane Corridor (Francis Avenue to Farwell Road)
Removed from Watch List This was a ldquoWatch Listrdquo project in the last quarterrsquos report because of concerns over obstacles in the acquisition of a single indispensable right-of-way parcel With the assistance of mediation the acquisition was completed in November 2003 The contract advertisement was set for January 2004 with bid opening in March 2004 The project is expected to be delivered within approved funding and with little delay to the opening date
SR 522I-5 to SR 405 ndash Multi-Modal Project (Nickel)
Removed from Watch List See Proposed Adjustments to Project Delivery In the September 30 2003 Gray Notebook WSDOT reported it was considering delaying the advertisement date to coordinate with the City
Beige Pages - Measures Markers and Mileposts - December 31 2003 13
Beige Pages - Measures Markers and Mileposts - December 31 2003 15
of Lake Forest Park To coincide with the needs of WSDOT partners the advertisement date will slip from winter 2003 to spring 2006 to take advantage of coordinating work with the City of Lake Forest Park The Nickel Funding Package provided the entire project funding in the construction phase These changes will result in shifting $2 million in expenditure from the 03-05 to 05-07 biennium
SR 543I-5 to Canadian Border - Additional Lanes for Freight
Removed from Watch List In the September 30 2003 Gray Notebook WSDOT reported the department was working to resolve structural design issues as a result of poor soil conditions The initial engineering solution was to design retaining walls that would be expensive and cause the project to exceed the budget A slope redesign was therefore developed as an alternative It has resulted in making one wall unnecessary and reducing the necessary height of several walls This affordable design is more cost-effective and should bring the project back within the anticipated budget
Update on Projects Noted in the ldquoWatch Listrdquo in the Gray Notebook ending September 30 2003
I-5 From Rush Road to 13th Street
The Watch List for the September 30 2003 Gray Notebook described the review by FHWA of this project to add one lane in each direction on I-5 between the interchanges at Rush Road (exit 72) and 13th Street (exit 76) including construction of a new interchange at the current LaBree Road under-crossing At the time of publication FHWA approved the added access with conditions
SR 9SR 522 to 212th St SE (Stages 1b amp 2)
The Watch List for the September 30 2003 Gray Notebook described the need to make design changes (raised center line barrier) with two-way-left-turn-lane based on current traffic data The design change may result in a delay of the advertisement date WSDOT continues to coordinate design and construction planning with King County regarding the Countyrsquos development of the Brightwater Wastewater Treatment Plant adjacent to the project There is continuing discussion of a revised advertisement and construction schedule
SR 167 15th St SW to 15th St NW ndash HOV
In the last Gray Notebook Watch List WSDOT reported that the project cost increased by $44 million and that the advertisement date could be delayed The advertisement date will be moved to February 2005 to accommodate redesign of the project to meet current stormwater standards WSDOT staff worked with permitting agency representatives on the Multi-Agency Permitting Team (MAPT) and determined that the original drainage design would not meet current water quality regulations The MAP Team has determined that additional stormwater detention and treatment will indeed be required Local agencies have also stated that additional wetland and stream buffer mitigation will be required As a result additional funds will be required for the design and construction of ecology embankments additional detention ponds and buffer mitigation The additional work will delay the advertisement date to the first quarter 2005 WSDOT staff is investigating designs in order to minimize the amount of these cost increases and will report next quarter
SR 270 Pullman to Idaho State Line - Additional Lanes
In the September 30 2003 Gray Notebook it was reported that there was a possibility of a project cost increase due to rock and soil conditions and the need for bridge design modifications Drilling and soil testing began in mid December 2003 with planned completion of testing in February 2004 Due to the unknown rock depth in excavation areas and bridge design considerations for two bridges it is anticipated that that a project cost increase ranging from $2 million to $5 million may be required The project cost estimate is expected to be completed by July 2004 As the project design is further refined WSDOT is investigating methods to reduce or offset these cost increases The project is on schedule for advertisement in January 2005
Beige Pages - Measures Markers and Mileposts - December 31 2003 14
14 Beige Pages - Measures Markers and Mileposts - December 31 2003
SR 410 214th Ave E to 234th - Widening
WSDOT reported in the Watch List of the September 30 2003 Gray Notebook that costs for this project could increase $16 million or more to purchase land that will be needed for stormwater treatment and detention was re-zoned for commercial and light industrial during the project development phase Engineering work is underway to develop an updated cost estimate for right-of-way acquisition based on the zoning changes by the end of February 2004 This project will address sections of the roadway where accidents occur by controlling access to the highway building new signal systems at major intersections and reducing congestion by providing an additional lane in each direction
Projects added to the ldquoWatch Listrdquo
Bellingham-GP Area Upgrades
This project would upgrade the existing track through Bellinghamrsquos Georgia Pacific (GP) Plant to allow for slightly higher speeds for Amtrak Cascades intercity trains resulting in a travel time reduction of about 11frasl2 minutes Due to unanticipated freight business at the mostly closed GP plant since the project scope was developed the project scope is now inadequate The implications for cost and schedule are being reviewed
Beige Pages - Measures Markers and Mileposts - December 31 2003 15
Beige P
ages - Measures M
arkers and Mileposts - D
ecember 31 2003
17
Beige P
ages - Measures M
arkers and Mileposts - D
ecember 31 2003
The following table summarizes the various changes and adjustments described on pages 8-10 for the quarter ending December 2003
Highway Projects Proposed Adjustments to Project Delivery Quarter Ending December 31 2003 Dollars in Thousands
03-05 05-07 07-09 09-11 11-13 Ten Year Total
Adjusted Net Adjusted Net Adjusted Net Adjusted Net Adjusted Net Adjusted Net SR Project Budget Budget Change Budget Budget Change Budget Budget Change Budget Budget Change Budget Budget Change Budget Budget Change 002 US297 Peshastin East - 2100 2100 0 1870 2700 830 7600 11750 4150 13780 0 -13780 0 0 0 25350 16550 -8800
Interchange 005 I-5SR502 Interchange 1321 2521 1200 8679 7479 -1200 0 0 0 0 0 0 0 0 0 10000 10000 0
005 I-5 Noise Wall 3500 3500 0 0 0 0 0 0 0 0 0 0 0 0 0 3500 3500 0
005 I-5SR526 to US 2 (Marine View 11000 15000 4000 6300 11300 5000 54780 52277 -2503 121900 117005 -4895 44680 36474 -8206 238660 232056 -6604 Drive)
007 SR7SR507 to SR512-Safety 9300 9300 0 0 0 0 0 0 0 0 0 0 0 0 0 0 0 0
009 SR 9 Nooksasck Road to Cherry 6320 1548 -4772 8800 12730 3930 0 927 927 0 0 0 0 0 0 15120 15205 85 St
016 SR 16 HOV Improvements 49623 51483 1860 40902 39042 -1860 0 0 0 0 0 0 0 0 0 90525 90525 0 between Olympic Drive and Union Ave
020 SR 20Quiet Cove Rd Vic to SR 0 0 0 3790 766 -3024 3270 6294 3024 0 0 0 0 0 0 7060 7060 0 20 Spur
024 SR24I82 to Keys Road 840 840 0 22000 22000 0 9000 9000 0 0 0 0 0 0 0 31840 31840 0
031 SR 31Metaline Falls 4900 2400 -2500 11000 13500 2500 0 0 0 0 0 0 0 0 0 15900 15900 0 To Canadian Border
090 I-90 Two-way Transit and HOV 4000 3000 -1000 11000 12000 1000 0 0 0 0 0 0 0 0 0 15000 15000 0
099 SR 99s 284th to S 272nd St 3780 3656 -124 6323 8519 2196 2600 2621 21 0 0 0 0 0 0 12703 14796 2093 - HOV Lanes
161 SR 161Corridor Improvements 12100 6641 -5459 7300 12709 5409 15 27 12 0 38 38 0 0 0 19415 19415 0 -176th to 234th
203 SR 203NE 124thNovelty Rd Vic 1200 2084 884 0 163 163 0 0 0 0 0 0 0 0 0 1200 2247 1047
520 SR 520w Lake Sammamish 3400 3368 -32 4900 6700 1800 24500 16225 -8275 38720 60515 21795 30800 15493 -15307 102320 102301 -19 Pkwy to SR 202
522 SR 522I-5 To SR 405 Multi- 3600 1497 -2103 1500 3568 2068 0 0 0 0 0 0 0 0 0 5100 5065 -35 modal Project
Total of Projects Above 116984 108938 8046 134364 153176 18812 101765 99121 -2644 174400 177558 3158 75480 51967 -23513 593693 581460 -12233
Project Adjustments from Quarter 1 229284 210820 -18464 374159 375781 1622 323393 333343 9950 229295 263815 34520 142025 107237 -34788 1298156 1290997 -7159
Total of Projects from Quarter 2 221033 238273 17240 283976 265815 18161 312730 310414 -2316 307339 307064 -275 318918 348876 -42 1483296 1479741 -3555
Total for All Projects 567301 558031 -9270 792499 794772 2273 737888 742878 4990 711034 748437 37403 566423 508080 -58343 3375145 3352198 -22947
16
16Beige P
ages - Measures M
arkers and Mileposts - D
ecember 31 2003
Beige P
ages - Measures M
arkers and Mileposts - D
ecember 31 2003
The following table summarizes the various changes and adjustments described on pages 10-11 for the quarter ending December 2003
Rail Projects Proposed Adjustments to Project Delivery Quarter Ending December 31 2003 Dollars in Thousands
03-05 05-07 07-09 09-11 11-13 Ten Year Total Adjusted Net Adjusted Net Adjusted Net Adjusted Net Adjusted Net Adjusted Net
Project Budget Budget Change Budget Budget Change Budget Budget Change Budget Budget Change Budget Budget Change Budget Budget Change
Palouse Riv amp Coulee City RR 5820 5820 - 1530 1208 (322) - - - - - - - 7350 7028 (322) Acquistion Port of Columbia Railroad - - - - 11500 252 (11248) 1904 1904 - 3157 3157 11500 5313 (6187) Improvements Port of Columbia Co Dayton - - - - 320 - (320) - - - - - 320 - (320) Upgrades Blue Mtn RR Wallula-Walla Walla - - 1260 - (1260) - - - - - - - 1260 - (1260) Upgrade Rural Elevator Track Expansion - - - - - - 1140 - (1140) 3860 - (3860) 5000 - (5000)
PRampCC Cheney-Coulee 286K - - 1582 1582 11568 11568 8000 7236 (764) - 703 703 8000 21089 13089 Upgrade
Total Rail Projects 5820 5820 - 2790 2790 - 11820 11820 - 9140 9140 - 3860 3860 - 33430 33430 0
The following table summarizes the various opportunities and options described on pages 11-12
Highway Projects Opportunities and Options for Legislative Consideration Quarter Ending December 31 2003 Dollars in Thousands
03-05 05-07 07-09 09-11 11-13 Ten Year Total Adjusted Net Adjusted Net Adjusted Net Adjusted Net Adjusted Net Adjusted Net
SR Project Budget Budget Change Budget Budget Change Budget Budget Change Budget Budget Change Budget Budget Change Budget Budget Change
005 I-5 SR 526 (Marine View 11000 16000 5000 6300 110000 103700 54780 88000 33220 121900 - (121900) 44680 - (44680) 238660 214000 (24660) Drive)
099 SR 99 Alaskan Way Viaduct 45000 45000 - 12000 40000 28000 40000 40000 - 40000 40000 - 40000 12000 (28000) 177000 177000 -
405 I-405 Congestion Relief 46000 46000 - 99840 114840 15000 139020 199020 60000 160195 125195 (35000) 40000 - (40000) 485055 485055 -Projects
522 SR 522 Bothell-UW Campus 8000 - (8000) - 8000 8000 - - - - - - - - - 8000 8000 -Access
539 SR 539 I-5 Improvements 4850 4800 (50) 5500 8300 2800 5200 62800 57600 31500 8000 (23500) 42000 - (42000) 89050 83900 (5150) Ten-Mile Road to Intrsquol Border
Total Projects 114850 111800 (3050) 123640 281140 157500 239000 389820 150820 353595 173195 (180400) 166680 997765 967955 (29810)12000 (154680)
17
Beige Pages - Measures Markers and Mileposts - December 31 2003 19
Financial Information
2003 Transportation Funding Package ndash Paying for the Projects The first edition of the Beige Pages (June 2003) included an in-depth discussion of the Legislaturersquos 2003 Transportation Funding Package The revenue forecast has now undergone several updates since the Legislature enacted the budget The following information reflects the November 2003 forecast changes as well as the impact from the recent Supreme Court decision on Initiative 776 Further refinements to debt service estimates have also been made
Revenue Forecasts The 2003 Transportation Funding Package enacted by the Legislature included tax and fee increases The gas tax was increased by 5cent per gallon and gross weight fees on trucks increased by 15 An additional sales tax on new and used vehicles of 03 and a license plate number retention fee were both established The first two sources are to be deposited to a new account called the Transportation 2003 (Nickel) Account The latter two are to be deposited to the Multimodal Transportation Account that was established several years ago
The following charts show the current projected revenues over the next ten years (for the new funding sources) as forecasted in November 2003 by the Transportation Revenue Forecast Council compared to the legislaturersquos assumed lsquobaselinersquo projections used in the budget-making process in March 2003 Cumulative ten-year totals and individual biennial amounts are both shown
Transportation 2003 (Nickel) Account Revenue Forecast Forecast comparisons include actual March 2003 Legislative Biennial Baseline Compared to
November 2003 Transportation Revenue Forecast Council revenue collection data to date as well Millions of Dollars
as updated projections based on new and revised economic variables The November 2003 forecast includes several months of actual revenue receipt information Gas tax receipts include four months of actual collections and licenses permits and fees include three months of receipts In the Transportation 2003 (Nickel) Account revenue projections for the ten-year period for gas tax receipts were increased over the September 2003 forecast (+105) and licenses permits and fees were forecast to be slightly higher (+05) before taking into account the impact of Initiative 776 However when including the I-776 impact forecasted revenues for licenses permits and fees are down ten percent for the ten-year period In the Multimodal Account licenses permits and fees projected revenue for the ten-year period remained unchanged from the September 2003 forecast Initiative 776 did not impact the Multimodal account
$2000
$1800
$1600
$1400
$1200
$1000
$800
$600
$400
$200
$0
$19240m Baseline Total
November 2003 Forecast Total $18506m
Licenses Permits and Fees 5cent Gax Tax um
ulative
C
$3262 $3186 $3701 $3632 $3912 $3767 $4120 $3907 $4244 $4013
July 1 Baseline Nov 03 Baseline Nov 03 Baseline Nov 03 Baseline Nov 03 Baseline Nov 03 2003 Forecast Forecast Forecast Forecast Forecast
Biennium Ending Biennium Ending Biennium Ending Biennium Ending Biennium Ending June 2005 June 2007 June 2009 June 2011 June 2013
New Sources - Multimodal Account Revenue Forecast March 2003 Legislative Biennial Baseline Compared to November 2003 Transportation Revenue Forecast Council Cumulative and Biennial Totals Millions of Dollars
$600
$400
$200
$0
$3831m Baseline Total
Licenses Permits and Fees 03 Vehicle Sales Tax
Cumulative
November 2003 Forecast Total
$730 667$622 $592 $777 $709 $814 $752 $888 $817 $3537m
July 1 Baseline Nov 03 Baseline Nov 03 Baseline Nov 03 Baseline Nov 03 Baseline Nov 03 2003 Forecast Forecast Forecast Forecast Forecast
Biennium Ending Biennium Ending Biennium Ending Biennium Ending Biennium Ending June 2005 June 2007 June 2009 June 2011 June 2013
Beige Pages - Measures Markers and Mileposts - December 31 2003 18
18 Beige Pages - Measures Markers and Mileposts - December 31 2003
Bond Sales Plan for New Authorizations Provided by the 2003 Transportation Funding Package The 2003 Transportation Funding Package contained two new bond authorizations
bull a gas tax authorization of $26 billion
bull a state General Obligation Bonds (GO) authorization of $3495 million The proceeds from the new gas tax bonds will be used to fund highway projects The debt service will be paid by the revenues from the nickel increase in the gas tax The proceeds from the new state GO bonds will be used to fund rail and ferry projects Debt service for these bonds will be paid from the Multimodal Account Receipts from the new 03 sales tax on new and used vehicles will be deposited to the Multimodal Account and will augment rental car tax receipts and other fees already directed to this account
2003-2005 Biennium
For the 2003-2005 biennium the Legislature appropriated $280 million in proceeds from the new gas tax bonds and $477 million from the state GO bonds To date in this biennium $80 million of gas tax bonds have been sold No new bond sales occurred in this reporting period However in February 2004 (the next scheduled state bond sale) $25 million in gas tax bonds is planned to be sold for the 2003 Transportation (Nickel) Account and $20 million in GO Bonds for the Multimodal Account
The bond sales plan has not changed from the initial report The combined affect of the revenue forecasts bond sales assumptions and project expenditure assumptions is presented in the next section
Financial Plans for Accounts Supporting the 2003 Funding Package Transportation 2003 (Nickel) Account The Transportation 2003 (Nickel) Account was established in the state treasury to be the repository of the new nickel gas tax and the increases in various vehicle licenses permits and fees Bond proceeds from the $26 billion authorization will also to be deposited to this account Uses of the account include cash funding of highway and
Transportation 2003 (Nickel) Account 2003-2005 Budget and Ten-Year Financial Plan dollars in millions
Balance Forward from Previous Biennium Sources Gas Tax Revenues (new 5cent) Licenses Permits and Fees Revenues I-776 Impact (loss of revenue) Interest Earnings Bond Proceeds Federal Funds Local Funds
03-05 $00
2980 231 (26) 43
2800 10 34
05-07 $44
3419 241 (27) 43
5680 97 24
07-09 $171
3533 262 (28) 43
6700 00 09
09-11 $362
3652 284 (29) 43
6430 00 02
11-13 $672
3751 292 (29) 43
4390 00 34
Ten-Year Total
17335 1310 (139)215
26000 107 103
Total Sources of Funds Uses
$6072 $9477 $10519 $10382 $8481 $44930
Cost of Bond Issuance 07 13 17 16 12 65 Bond Sale Underwriters Discount 21 40 50 48 36 195 Debt Service 225 906 1890 2622 3378 9021
Highway Improvements 5697 7943 7338 6909 4628 32515 Highway Preservation 20 103 50 203 1070 1446 Washington State Ferry Construction 57 345 983 274 39 1699 Total Uses of Funds Biennium Ending Balance
$6028 $44
$9350 $171
$10328 $362
$10072 $672
$9163 ($10)
$44940 ($10)
This plan represents the current budget and ten-year financial plan as adopted by the 2003 Legislature and does not contain any proposed adjustments to project delivery
Beige Pages - Measures Markers and Mileposts - December 31 2003 19
Beige Pages - Measures Markers and Mileposts - December 31 2003 21
ferry projects identified by the Legislature and the payment of debt service and other associated costs for bonds sold to provide debt financing for highway projects Since gas tax receipts are deposited to this new account the uses of the account are restricted to highway purposes as required by the 18th Amendment to Washingtonrsquos Constitution The financial plan below brings together all of the projected Sources (tax revenue bond proceeds interest earnings) and Uses (2003-2005 appropriations 10-year projected program expenditures and debt service) of the new account
Changes to projected Sources and Uses of funds have been updated to reflect the most current forecasts As changes either positive or negative are incorporated into the plans the ending balances in the outer biennia are affected The current pro forma which incorporates actual tax collections and current forecast projections predicts a small negative ending balance of approximately $10 million by the end of the 2011-13 biennium The September 2003 pro forma predicted that there might be a negative $165 million shortfall This change is primarily due to a refinement to debt service calculations and the increased gas tax revenue forecast
As mentioned earlier for the ten-year period gas tax receipts were up slightly from the September 2003 forecast ($185 million) and licenses permits and fees were up slightly ($06 million) before the I-776 impact Key economic variables tax receipts and interest rates will continue to change over time Future updates to forecasts as well as inclusion of more actual receipts will further impact the projected final ending balance Additionally actual and revised assumptions pertaining to bond sales and debt service will continue to be incorporated and likewise will impact the outlook for the final ending balance
Impacts of Initiative 776 The 2003 Transportation (Nickel) Account was affected by Initiative 776 the application of which was ruled upon in October 2003 by the State Supreme Court (other affected accounts include the Motor Vehicle Account the Puget Sound Ferry Operations Account and the Washington State Patrol Account) This table shows the projected impact of Initiative 776 to all affected accounts in millions of dollars The 2003 Transportation Account will be negatively impacted over the ten-year period by $139 million
I-776 ImpactsLoss of Revenue by Account dollars in millions
Ten-Year 03-05 05-07 07-09 09-11 11-13 Total
Motor Vehicle Account $307 $272 $280 $289 $297 $1445 Transportation 2003 (Nickel) Account 26 27 28 29 29 139 Puget Sound Ferry Operations Account 06 05 05 06 06 28 Washington State Patrol Account 94 82 84 87 89 436 Biennial Total $433 $386 $397 $411 $421 $2048
Multimodal Transportation Account The Multimodal Transportation Account was established several years ago as the repository for tax revenues and operating and capital expenditures not restricted by the 18th Amendment The 2003 Transportation Funding Package directs receipts to this account from the additional 03 sales tax on new and used vehicles and the license plate number retention fee The most significant pre-existing tax deposited to this account is the rental car tax The 2003 Funding Package also directs bond proceeds from the $3495 million State GO authorization to this account
Beige Pages - Measures Markers and Mileposts - December 31 2003 20
20 Beige Pages - Measures Markers and Mileposts - December 31 2003
Multimodal Account 2003-2005 Budget and Ten-Year Financial Plan (dollars in millions)
03-05 05-07 07-09 09-11 11-13 Ten-Year Total
Balance Forward from Previous Biennium $141 $107 $202 $330 $491 Sources Licenses Permits Fees Distribution 247 270 282 290 302 1391 Rental car tax 453 503 567 627 689 2839 Sales Tax on New amp Used Car Sales 588 648 685 729 792 3442 Miscellaneous Income 15 15 15 15 15 75 Bond Proceeds 478 437 1287 896 398 3495 Federal Revenue 141 54 55 1016 1877 3142 Local Revenue 27 02 02 02 02 33 Total Sources of Funds $1948 $1928 $2893 $3575 $4074 $14417 Operating Uses Cost of Bond Issuance 01 01 03 02 01 09 Bond Sale Underwriters Discount 04 03 10 07 03 26 Debt service 22 93 195 325 439 1073 Transfers to Other Accounts 99 45 45 45 45 279
WSDOT Program Support amp Planning 54 45 46 47 48 240 Public Transportation 493 521 584 627 661 2886 WSF Maintenance and Operations 51 53 54 55 56 268 Rail 376 403 410 418 426 2033 Total WSDOT Operating Uses of Funds $1099 $1163 $1347 $1526 $1679 $6814 Capital Uses Hwy Preservation P0C 17 200 100 00 00 317 WSF Construction W0C 134 82 607 473 00 1296 Rail Y0C 440 327 711 1415 2250 5143
Local Programs Z0C 292 60 00 00 00 352 Total Capital Uses of Funds $883 $669 $1419 $1887 $2250 $7108
Biennium Ending Balance $107 $202 $330 $491 $636 $636
New funding source from the 2003 Legislative Package
Projects funded primarily by New Bonding Authority and Augmented Federal Funds for Rail
New Bond Authorization from the 2003 Legislative Package
Anticipated Federal Funds
The Multimodal Account includes changes to projected sources of funds based on three months of actual receipts and current forecast data As stated above projected revenues from licenses permits and fees for the ten-year period remained unchanged from the September 2003 forecast
Beige Pages - Measures Markers and Mileposts - December 31 2003 21
Beige Pages - Measures Markers and Mileposts - December 31 2003 23
Program Management Information
Management Information Systems and Needs
A key lesson learned from WSDOTrsquos nationwide assessment of project delivery information systems was that successful transportation programs were supported by integrated management information systems Currently WSDOTrsquos hardware and software capabilities in this area pieced together over a period of more than twenty years fall far short of delivering what is necessary to support todayrsquos higher expected levels of oversight and accountability This presents significant challenges
WSDOT managers are required to access project financial plans expenditure plans actual expenditure levels project milestones and project work load estimates from several different management systems Reporting from the various systems while partially automated requires a significant degree of manual intervention and support systems (databases spreadsheets etc)
The 2003 Legislature supported WSDOTrsquos request for a systems modernization assessment study A Legislative Transportation Committee (LTC) workgroup was formed to provide oversight for this project Members include four senators and four representatives charged with recommending actions to the full LTC The workgroup met in September 2003 to initiate review of the project Statement of Work If the statement of work is approved the assessment effort is expected to produce an integration strategy and a project plan for presentation to the transportation committees of the legislature by December 2004
While developing the long-term plan there are pressing short-term needs that are required to shore up the existing systems WSDOT has completed the following activities
bull Added information to the data marts used for reporting program management information (CPMS) and project accounting information (TRAINS) This will provide added support for project and program tracking and will increase reporting options and flexibility of information retrieval
bull Developed a web-based Quarterly Project Report for the Gray Notebookrsquos Beige Pages Trained staff to feed information to the Quarterly Project Report manually and developed a plan to implement electronic data feeds (to be implemented in early 2004)
bull Completed an assessment of the number of projects by project type and by region that have been loaded into the agencyrsquos Project Scheduling Information System (PDIS)
bull Developed a preliminary plan to build a PDIS Data Mart that will make project schedule and status information more readily available for reporting Completion of the data mart is tentatively scheduled for mid-2004
bull Developed a preliminary designbuild work breakdown structure for use in scheduling the mega projects This structure will allow for scheduling and reporting status at a detailed level and assessing the earned value of work done to-date as the mega projects proceed
bull Started development of data marts to provide flexible reporting of the roadway inventory information that supports project scoping and development activities (to be implemented in mid-2004)
Right of Way Acquisition Delays and cost increases in right of way acquisition have affected the delivery of several 2003 Transportation Funding Package projects For example advertisement for the SR 7SR 507 to SR 512 ndash Safety project has been delayed due to 18 adjudicatory hearing requests from property owners adjacent to the project WSDOT expects to complete negotiations with property owners by the end of spring 2004 For details see page 4
The tight delivery schedule for the 2003 Transportation Funding Package presents unique challenges for right of way acquisition In order to minimize future right of way acquisition problems the WSDOT Real Estate Services office (RES) and the Access Management office are analyzing the next two biennia to pick out projects requiring immediate action to assure that right of way is delivered in time for advertisement WSDOTrsquos right of way access and real estate experts have also formed a plan to look for total parcel acquisitions and parcels where access control is already in place thereby avoiding access hearings whenever possible Acquisition plans will be developed as soon as possible and RES will be able to begin to acquire the necessary properties
Beige Pages - Measures Markers and Mileposts - December 31 2003 22
22 Beige Pages - Measures Markers and Mileposts - December 31 2003
Appraisers title examiners and real estate agents in the private sector continue to enjoy a high volume of business due to the low interest rate environment As a result recruitment of experienced real estate professionals to replace retiring right of way staff at WSDOT is proving challenging WSDOT continues to seek qualified professionals to join its staff and will also begin a training program to develop sufficient staff experience to support the large program it needs to deliver over the next decade
Utilities Relocation
As of December 31 no utility relocation issue has caused a project to go on ldquoWatch Listrdquo status
One of the keys to avoiding obstacles to project delivery from utilities relocation is to give utility companies as much notice as possible of WSDOT project impacts to their facilities This allows the utilities adequate time for design budgeting and scheduling of the utility relocation Below is an example of WSDOTrsquos coordination efforts with the goal of minimizing utility relocation risks to our project schedules
bull Widen I-5 Each Direction from Salmon Creek to I-205
NW Natural had concerns that the pressure in its natural gas lines would not adequately serve the neighborhood to the west of Interstate 5 once the NE 129th Street over crossing was demolished WSDOT and NW Natural changed the original plan to run the gas line across the new bridge at 129th The new plan utilized horizontal directional boring equipment to place the line under Interstate 5 allowing the utility to navigate around proposed drainage drilled shafts for the new bridge and retaining walls
Comcast also voiced concern regarding running a temporary line during the reconstruction of the bridge WSDOT worked to provide a new freeway crossing at the 134th Street interchange rather than at 129th Street
bull SR 270 Pullman to Idaho State Line ndash Additional Lanes
An initial meeting has taken place with Avista Utilities for gas line relocation along the SR 270 corridor This allows approximately one year to complete design and relocation prior to the start of the contract
bull SR 31 ndash Metaline Falls to the Canadian Border ndash Reconstruction
A new fiber optic line was recently installed at the north end of the project to enhance communications to the Metaline Falls Border Crossing After coordination with WSDOT the Pend Oreille Telephone Company placed the line so that it would not impact roadway construction
bull US 395 North Spokane Corridor - Gerlach to Wandermere
An agreement has been made with Bonneville Power Administration to initiate design work on tower relocation and reconstruction The design work is to be completed by April 2004 Construction is scheduled to begin in November 2004
WSDOT is also coordinating with the PUD and local communications companies in Pacific County on US 101 in the vicinity of South Bend to make design adjustments so that underground utility lines can be placed at the time WSDOT raises the grade of the road for the SR 105 Mitigation ndash Willapa River Estuarine project This will not impede the traffic staging of the project and will decrease the risk of any utility relocation delays to the contractor
Environmental Documentation Review Permitting and Compliance WSDOT is overseeing a statewide transportation improvement program that creates new opportunities for aligning citizensrsquo goals for the environment and for transportation systems We are working to change the way we communicate these objectives and the interrelated nature of the complex issues in both protecting and improving the environment from the delivery of transportation projects
Beige Pages - Measures Markers and Mileposts - December 31 2003 23
Beige Pages - Measures Markers and Mileposts - December 31 2003 25
Environmental Documentation and Review
Compliance with the Endangered Species Act
About forty Nickel projects remain to be advertised for construction in this biennium according to WSDOTrsquos delivery plan Twenty-three of these projects have completed their required consultations under Section 7 of the Endangered Species Act Transportation projects that do not use federal funds are not required to obtain Section 7 consultation from the Endangered Species Act Two projects will not require Section 7 consultation because no federal funding will be allotted for project Eleven projects in the preliminary stages of design cannot seek the consultation process at this time until the Biological Assessments are completed Consultation on these projects should begin in 2004
There are two projects currently undergoing consultation with NOAA Fisheries and the US Fish and Wildlife Service (USFWS) The SR 31 Metaline Falls to Canadian Border Reconstruction project is undergoing formal consultation with the USFWS to address Canada Lynx concerns The I-90 Two Way Transit amp HOV project is undergoing consultation with NOAA Fisheries and USFWS
Three local projects funded with Nickel Funds revenues will be lead through the consultation process by local governments (City of Shoreline the City of Bremerton and the Hood Canal Coordinating Council) Two projects for WSDOT to deliver statewide (Statewide Bridge Rail Retrofit and Statewide Guardrail Retrofit) will be taken through consultation by the regional offices acting on a regional basis Two regions have already completed the consultation process for these projects
A team of three experienced WSDOT biologists was deployed to the Western Washington Office of the USFWS to address the approximately 20 projects stalled in review This staff assignment accomplished the completion of consultations for 15 projects including the SR 9 ndash SR 522 to 176th St project A new backlog is beginning to build due to the need to reinitiate consultation on a number of projects including the Hood Canal Bridge Replacement In addition the backlog is compounded with the extensive amount of time that seems to be required to be spent in consultation on some of the more complex projects The Federal Highway Administration WSDOT and USFWS are continuing discussions on how to address this problem
Program Delivery Tracking Sheet for ESA Section 7 Consultation WSDOT Projects rsquo03 -rsquo05 Biennium
NOAA Fisheries USFWS
Project Biological Assessment
Consultation Status
Biological Assessment
Consultation Status
NEPA Type
NEPA Complete
Proposed Ad Date
SR 31 Metaline Falls to Inttrsquol Border NA NA 81003 Waiting EA 120503 41004
I-90 Two Way Transit and HOV 11212003 Waiting 122103 Waiting FEIS 033004 106
Consultant Utilization
There are two main areas where consultants are expected to be utilized on 2003 Transportation Funding Package projects The first is to augment WSDOTrsquos workforce so WSDOT can minimize the inefficiencies associated with short-term workforce expansions and contractions The second is to fill needs for specialized expertise that may not be available ldquoin-houserdquo
When WSDOT established the Urban Corridors Office in 2003 contracting efforts were directed at having a sufficiently large pool of qualified talent to draw from quickly and efficiently without time delays With that goal currently being met the emphasis has shifted slightly to identifying the ldquoBest of the Bestrdquo in a variety of specialized areas allowing WSDOT to draw upon top expertise at national and international levels
Regional Transportation Improvement District (RTID) Projects The 2003-2005 Transportation Budget requires the Regional Transportation Improvement District (RTID) to conduct an independent review of all project scopes and budgets prior to placing projects on the ballot WSDOT management is assisting RTID by identifying and assembling a ldquoPanel of Expertsrdquo to review CEVPreg and Cost Risk Assessment projects National or international experts with experience in a wide range of engineering disciplines and in cost risk assessment will be sought The panel selection should be complete early next quarter
Beige Pages - Measures Markers and Mileposts - December 31 2003 24
24 Beige Pages - Measures Markers and Mileposts - December 31 2003
On-Call Services WSDOT currently has over 200 different consulting firms committed to providing services to the State on short notice through ldquoOn-Callrdquo contracts Many of these firms which range from single person consultants to large multi-tiered organizations have internationally recognized experts on staff Currently twelve prime contractors plus their sub-consultants are under contract to provide project specific services across the state
2003 Transportation Funding Package - Consultant Utilization to Date For the quarter ending December 31 2003 WSDOT paid $2556500 to firms providing services on 2003 Transportation Funding Projects Over 300 people were working directly on a full or part time basis on these projects Over $5000000 was authorized as new work in the quarter
Construction Employment Information
Contractor Employment
The 2003 Transportation Funding Package supports transportation projects that make important and long-term contributions to the statersquos economy and the productivity and economic well-being of its citizens Far from the only or even the largest of these impacts is the direct and indirect economic benefits of the construction activity itself one aspect of which is the creation of jobs to built the projects
The direct and indirect benefits of construction employment have been extensively examined by labor economists A useful guide is Associated General Contractors of Washington Economic Impact of the Construction Industry on the State of Washington 2002 Update (prepared by the University of Washington)
How many people are at work on the 2003 Transportation Funding Package projects
The precise number for obvious reasons is impossible to state The jobs are not just at the job site but include designers and project engineers (many of whom divide their efforts among many projects) suppliers and their employees and many others Even for the contractors employment supported by these projects includes home office as well as job site staff And at the job site the employment count varies from day to day depending on subcontractor activity the sequencing of job activities and even the weather We have asked contractors on the Nickel Fund projects in construction to provide the WSDOT construction office with a ldquosnapshotrdquo number what is your best estimate of the ldquoaveragerdquo direct job site employment on your job over the course of the quarter The following table captures the prime contractorsrsquo responses for their own work and their on-site subcontractors on the Nickel Fund projects that have already gone into construction
ProjectContractor
Average project employment for Oct-Dec 2003
I-5 Widening Each Direction from Salmon Creek to I-205 Hamilton Construction and its 24 subcontractors
24 employees
SR 500 New Interchange and Additional Lanes Tapani Underground Inc and its 18 subcontractors
21 employees
I-90 Build Lanes from Argonne Road to Sullivan Rd Scarsella Brothers Inc and its 13 subcontractors
19 employees
I-90 Rye Grass Summit to Vantage Superior Paving Company and its 10 subcontractors
14 employees
I-90 Highline Canal to Elk Heights Scarsella Brothers Inc and its 12 subcontractors
17 employees
I-182US 395 Interchange ndash Roadside Safety Transtate Paving Company and its 2 subcontractors
6 employees
Construction Safety Information WSDOT and the AGC are currently finalizing the details of a method to jointly report safety data for the nickel projects The expected outcome will be a combined safety rating for the contractor and WSDOT staff on each of the Nickel Fund projects
Beige Pages - Measures Markers and Mileposts - December 31 2003 25
Beige Pages - Measures Markers and Mileposts - December 31 2003 26
Worker Safety Quarterly Update Continuing updates on Gray Notebook safety topics ndash data is shown for calendar year (CY) 2000 CY 2001 fiscal year (FY) 2002 FY 2003 and FY 2004 by quarter
WSDOT Highway Maintenance WorkersRecordable Injuries per 100 Workers per Fiscal Year
CY 2000
CY 2001
FY 2002
FY 2003
Qrtr 1 Qrtr 2 YTD 2004
0
5
10
15
20
FY 2004
Highway and Street Construction Benchmark 82
The second quarter recordable injury rate for maintenance workers was 62 injuries per 100 maintenance workers There were 22 recordable injuries during the second quarter of which 9 were lost workday cases accounting for 202 lost workdays This is a 24 decrease in injuries and a 17 reduction in lost workdays from the first quarter The three most frequent types of injuries for the second quarter were dislocation (27) occupational illness (23) and sprainstrain (23) The three most frequent causes of injuries for the quarter were struck by an object (23) overexertion (18) and falls from the same level (14) The three most frequent injuries to the body were back (32) ear (14) and hand (9)
Accident Prevention Activities Second Quarter FY 2004 bull The South Central Regionrsquos Maintenance division is identifying
targets and strategies to decrease personal injuries within work groups Four of five sections reduced their yearly injury average Accountability and awareness has increased substantially and the numbers reflect significant improvement
bull The Eastern Region is revising its Accident Review Board process to make it more accountable for overall safety
bull WSDOT completed a successful West Nile Virus campaign during the second quarter Between May and October 2003 WSDOT spent about $92000 for the West Nile Virus program This included obtaining materials training people monitoring sites and application of pesticides under the direction of the Department of Health (DOH) DOH reported that no human or animal cases were confirmed in Washington in 2003 However nationally in 2003 there were 7718 human cases with 166 deaths In 2002 there were 4156 cases and 284 deaths
Reading the ChartsldquoRecordable Injuries and Illnessesrdquo is a standard measure that includes all work related deaths and work related illnesses and injuries which result in loss of consciousness restriction of work or motion transfer to another job or require medical treatment beyond first aid The US Bureau of Labor Statistics provides the selected 2000 national average benchmarks After discussion with the National Bureau of Labor Statistics the following benchmarks were selected to provide a more relevant and consistent benchmark Maintenance ldquoHighway and Street Constructionrdquo Standard Industry Classification (SIC) 161 (rate 82) Engineering ldquoEngineering and Architect Servicesrdquo SIC 871 (rate 17) Ferry Vessel Workers ldquoWater Transportationrdquo SIC 44 (rate 70) One worker equals 2000 hours per year
WSDOT Ferry Vessel WorkersRecordable Injuries per 100 Workers per Fiscal Year
0
5
10
15
20
CY 2000
CY 2001
FY 2002 FY 2004
Qtr 1 YTD 2004
FY 2003
Qrtr 2
Water Transportation Benchmark 70
The second quarter recordable injury rate for ferry vessel workers was 98 injuries per 100 ferry vessel workers There were 23 recordable injuries during the second quarter of which 21 were lost workday cases accounting for 268 lost workdays This is a 4 decrease in the number of recordable accidents and a 36 reduction in the number of lost time days from the first quarter There are less worker hours this quarter causing a slight increase in the recordable accident rate even though the actual number of accidents dropped slightly The three most frequent types of injuries were sprainstrain (52) chemical exposure (13) and aggravation of a previous injury (13)The three most frequent injuries to the body were the back (13) circulatory system (13) and multiple (13)
Source for all charts WSDOT Safety Office
WSDOT Highway Engineer WorkersRecordable Injuries per 100 Workers per Fiscal Year
CY 2000
CY 2001
FY 2002
FY 2003
Qrtr 1 Qrtr 2 YTD 2004
0
5
10
15
20
FY 2004
Engineering and Architect Services Benchmark 17
The second quarter recordable injury rate for engineer workers was 16 injuries per 100 engineer workers There were 8 recordable injuries during the second quarter of which 7 were lost workday cases accounting for 56 lost workdays There are less worker hours this quarter causing a slightly higher accident rate even though the number of injuries remained the same The three most frequent types of injuries for the quarter were sprain strain (38) occupational illness (25) and lacerations (25) The three most frequent causes of injuries were overexertion (25) falls from the same level (25) and noise (25) The three most frequent injuries to the body were the back (25) ear (25) and knee (13)
Measures Markers and Mileposts - December 31 2003 27
Measures Markers and Mileposts - December 31 2003 29
0
5000
6000
7000
June Dec June Dec June Dec June Dec June Dec June Dec June 1997 1997 1998 1998 1999 1999 2000 2000 2001 2001 2002 2002 2003
Number of Permanent Full-Time Employees at WSDOT
Initiative 695 passed by voters
Referendum 49 passed by voters
5617 5671 6017 5960 5992 6181 6322 6366
Referendum 51 defeated by voters
6325 6171 6258
Dec 2003
WSDOT Workforce Levels One indicator of the agencyrsquos workforce size is the current number of permanent full-time employees on staff The accompanying chart shows that number at various points since the end of 1996 (The number of ldquoFTEsrdquo [full-time equivalents] will generally exceed the number of full-time employees since seasonal and part-time work force must also be funded from ldquoFTErdquo allotments)
Source WSDOT Office of Human Resources
Training for WSDOT Highway Maintenance Employees WSDOT continues progress toward achieving training goals for maintenance employees A total of 24 safety and maintenance courses are required by law andor regulation The chart shows status of training completed for 6 of the 13 required safety courses and 5 of the 11 maintenance courses
Maintenance Total Current Workers Maintenance Maintenance Maintenance Compliance Change
Requiring Workers Workers Workers to Date Since Training Trained to Date Trained 1st Trained 2nd Target = Last Dec 03 Dec 03 Quarter FY04 Quarter FY04 90 Quarter
Safety CoursesBlood Borne Pathogens 1243 1064 13 46 86 +2First Aid 1480 1383 6 0 93 -2Hearing Conservation 1363 1255 0 0 92 -3Personal Protective Equipment 1361 894 216 0 66 +1Fall Protection 750 403 19 0 54 +2Flagging amp Traffic Control 1149 1109 1 0 97 -1
Maintenance Courses Drug Free Workplace 326 287 0 0 88 +1Forklift 1173 1036 37 28 88 +0Hazardous Materials Awareness 986 671 85 90 68 +8Manlift Operations 523 307 0 8 59 -3Excavation Trenching and Shoring 438 302 45 93 69 +13
Training for All WSDOT Employees The following table reflects continued progress on important workforce training courses that help shape WSDOTrsquos workplace These courses are for all permanent full-time part-time and temporary employees The goal is to have 90 of our workforce trained as promptly as resources allow
Number of Number Employees Number Number Compliance Change
Requiring Trained to Date Trained 1st Trained 2nd to Date Since LastTraining Dec 03 Quarter FY04 Quarter FY04 Target = 90 Quarter
Training CoursesDisability Awareness 7295 2567 116 131 35 +1Ethical Standards 7295 7050 82 82 97 0Security Awareness - all employees 7295 5711 17 0 78 +4Security Awareness - supervisors 2884 1474 0 0 53 +1Sexual HarassmentDiscrimination 7295 4880 71 149 67 +14Valuing Diversity 7295 3200 129 142 44 +2Violence that Affects the Workplace 7295 5910 6 7 81 +6
In past quarters non-supervisory employees were incorrectly credited by WSF for attendance at Security Awareness for Supervisors training This has now been corrected
Source WSDOT Office of Human Resources Staff Development
Measures Markers and Mileposts - December 31 2003 28
28 Measures Markers and Mileposts - December 31 2003
Highway Construction Program Quarterly Update Meeting WSDOTrsquos Scheduled Advertisement Dates The Highway Construction Program is the largest capital program in the Transportation Budget Planned expenditures for the 2003-2005 biennium are approximately $23 billion Overall delivery of the Highway Construction Program is tracked and monitored against schedule projections for ad dates and for project cash flow The first is ldquoMeeting WSDOTrsquos Scheduled Advertisement datesrdquo The second is ldquoCash Flowrdquo Funding for the 2003-2005 Highway Construction Program includes a variety of fund sources including pre-existing transportation funds 2003 Transportation Funding Package (ldquoNickelrdquo funds) and Tacoma Narrows Bridge funds The program includes 345 construction projects for advertisement during the current biennium of which 46 are ldquoNickelrdquo projects and 299 are funded with pre-existing funds Overall including preconstruction activities on construction projects to be advertised in future biennia more than 1000 projects will be underway during the 2003-2005 Biennium In the 2003 Transportation Funding Package there were 20 projects originally planned for advertisement in the biennium through the end of the second quarter Of the planned total 15 have been advertised four have been rescheduled for later in the biennium and one has been deferred to the 2005-2007 biennium There were 70 pre-existing fund projects planned for advertisement by the end of the second quarter 42 have been advertised as planned 26 have been rescheduled for later in the biennium and two have been deferred to the 2005-2007 biennium In addition three projects were advanced from quarters later in this biennium and were advertised in the first quarter for a total of 45 projects that have been advertised to date
Ad Date 2003 Transportation Funding Package (ldquoNickel Fundsrdquo) Of the nine projects planned to be advertised in this quarter seven projects were advertised as planned one project was delayed for advertisement to later in the biennium and one will be deferred to the 2005-2007 biennium (for more detail see the Beige Pages) One project was advanced from the eighth quarter for a total of eight advertised projects
bull Seven projects were advertised as plannedSR 9SR 528 Intersection ndash SignalSR 16 HOV Improvements between Olympic
View Drive and Union Ave US 97A Entiat Park Entrance ndash Turn Lanes SR 124 East Jct SR 12 - Reconstruction
Highway Construction Program Delivery Planned vs Actual Number of Projects Advertised 2003-2005 Biennium Quarter 2 Ending December 31 2003
350
300
250
200
150
100
50
0 Qtr 1 Qtr 2 Qtr 3 Qtr 4 Qtr 5 Qtr 6 Qtr 7 Qtr 8
Planned Pre-Existing Funds Ads
Actual Pre-Existing Funds Ads
Transportation Funding Package Planned Ads
Transportation Funding Package Actual Ads
Source WSDOT Project Control and Reporting Office
SR 161234th Street to 204th Street ESR 203NE 124thNovelty Rd VicinityUS 395Kennewick Variable Message Sign
bullOne project was advanced SR 527132nd St SE to 112th St SE
bullOne project was delayed to a future quarter in 2003-2005 SR7SR 507 to SR 512 ndash Safety
bullOne project was deferred to 2005-2007 SR 522I-5 to SR 405 Multi-Modal Project
Ad Date Pre-Existing Funding Of the 58 projects scheduled for advertisement with pre-existing funds in the second quarter 34 projects were advertised as scheduled 22 have been delayed slightly to later in the 2003-2005 biennium two were deferred to beyond the 2003-2005 biennium and two projects were advertised in response to emergencies bull The following are six examples of pre-existing projects advertised as planned US 101 Olympic National Park to Indian Creek ndash This project overlays approximately three miles of existing roadway pavement between Olympic National Park and Indian Creek I-5 Stewart - South Bound off Ramp ndash The existing signal system will be replaced with a signals using poles and mast arms WSDOT will be conducting a feasibility assessment of connecting the new signal system to the City of Seattlersquos centralized system SR 11 Whatcom County Line to Bellingham ndash This project will resurface approximately four miles existing roadway and restore safety features between the Whatcom County Line and the City of Bellingham
Measures Markers and Mileposts - December 31 2003 29
Measures Markers and Mileposts - December 31 2003 31
SR 26 Union Flat Creek-Improve Drainage On SR 26 west of Colfax the design of this project will stabilize the roadway structure by reconstructing approximately 1200 linear feet of creek channel away from the roadway There will also be check dams to slow the flow of the creek and protect the roadway from erosion
SR 127 Central Ferry to Church Hill Road At Central Ferry and extending eight miles north on SR 127 the project preserves the pavement and extends the service life by paving with Asphalt Concrete Pavement mixture and will restore the basic safety features of the highway US 97 Blewett Pass South ndash Paving From the junction with SR 970 to the north of the summit the project is to resurface existing roadway pavement to maintain the integrity of the roadway
bull The following are two examples of delayed projects SR 20 Troxell Road to Deception Pass ndash Current design issues could not be resolved and will require additional engineering changes to meet environmental requirements This will delay the project until February 2005 US 395 Deadman Creek Fish Barrier Retrofit ndashAfter a project costbenefit analysis was conducted in conjunction with the Department of Fish and Wildlife both WSDOT and WDF believe that funds for this project could be used for similar projects that would gain better results
bull Two projects were added in response to emergencies SR 20 Rockslide ndash On Sunday November 9 2003 at 6 am a rockslide estimated at two to three million cubic yards occurred above State Route 20 at milepost 1215 The rockslide left the hillside extremely unstable damaged two sections of the highway and left the small town of Diablo cut off Currently monitoring equipment and minor highway repairs give Diablo residents Seattle City Light personnel National Parks Service and WSDOT personnel limited access to the highway The highway is open between 8 am and 4 pm when flaggers are in place In early February 2004 contractors will turn in a report to WSDOT with proposals for long-term solutions that will reopen the highway permanently US 101 Hoh River Erosion ndash In response to storm-related erosion WSDOT replaced washed out armoring and stream barbs with huge boulders along the Hoh river bank in an effort to keep the river from washing out sections of SR 101 Placement of the boulders is a temporary solution A permanent solution to this problem is being reviewed To meet permitting requirements of the Washington State Department of Fish and Wildlife WSDOT completed a Reach Analysis for this section of river in 2002 The Federal Highway Administration reviewed WSDOTrsquos approach to fixing the problem and has agreed to fund a permanent solution with federal funds WSDOT is now completing a conceptual design in accordance with the Reach Analysis and will have a cost estimate completed by the end of February 2004
Cash Flow on Highway Construction ProjectsHighway Construction Program Cash Flow2003 Transportation Funding Package Highway Construction Program Cash FlowPlanned vs Actual Expenditures (ldquoNickel Fundsrdquo) Planned vs Actual Expenditures 2003-2005 Biennium Quarter 2 ending December 31 20032003-2005 Biennium Quarter 2 Ending December 31 2003Dollars in BillionsExpenditures for highway projects through the quarter Dollars in Billions
ending December 31 2003 were $442 million This $12
represents 8 percent of the budgeted cash flow for the biennium At this point expenditures using the 2003 Transportation Funding Package are within one percent of meeting the plan The expenditure rate will increase as more projects are awarded or moved from a pre-existing project and added to the nickel list of projects The expected pattern of 2003 Transportation Funding Package spending is illustrated by the fact that expenditures in the 8th quarter of 2003-2005 are expected to be 28 percent of the entire bienniumrsquos budgeted cash flow
Qtr 1 Qtr 2 Qtr 3 Qtr 4 Qtr 5 Qtr 6 Qtr 7 Qtr 8
Source WSDOT Project Control and Reporting Office Pre-Existing Funding For the first two quarters of the biennium WSDOT submitted an expenditure plan to the legislature for approximately $328 million As of December 31 2003 expenditures totaled $265 million This leaves a variance of approximately $64 million or 192 percent from the plan WSDOT is currenlty seeking legislative direction on projects with programmatic variance
$0
$02
$04
$06
$08
$10
Planned Pre-Existing Funds
Actual Pre-Existing Funds Planned
Transportation Funding Package
Actual Transportation
Funding Package
Measures Markers and Mileposts - December 31 2003 30
30 Measures Markers and Mileposts - December 31 2003
Special Safety Improvements Quarterly Update
Meeting WSDOTrsquos Scheduled Advertisement Dates for the Safety Improvement Subprogram While elements that improve safety are a part of almost every highway construction project a special program sub-category established by the legislature covers the projects that are designed to address issues in ldquohigh accident corridorsrdquo and ldquohigh accident locationsrdquo These projects are identified by WSDOT based on information about the history of accident frequency and severity While these projects account for only a small portion of the overall benefits to safety from highway improvements WSDOT tracks the advertisement of these projects just as with other projects in the program in order to provide a picture of program delivery on issues that are of great importance on particular locales around the state that have been selected for this program treatment bullOf the 14 projects planned for ad these six projects were advertised as scheduled for this quarter
I-5Ramps at Michigan ndash CorsonAlbroSwift SR 9SR 528 Intersection ndash Signal I-90Moses Lake West Safety Improvements SR 124East Jct SR 12 ndash Reconstruction SR 203NE 124thNovelty Rd Vicinity US 395Kennewick Variable Message Sign
Safety Improvement Program Delivery Planned vs Actual Number of Projects Advertised 2003-2005 Biennium Quarter 2 Ending December 31 2003
90
80
70
60
50
40
30
20
10
0
Actual
Planned
Qtr 1 Qtr 2 Qtr 3 Qtr 4 Qtr 5 Qtr 6 Qtr 7 Qtr 8
Source WSDOT Project Control and Reporting Office
bull Eight projects were deferred for advertisement later in the biennium
SR7SR 507 to SR 512 ndash Safety SR 20Oak Harbor NCL to Frostad Road SR 20Monkey Hill Rd to Troxell Rd SR 20Sapp Rd to Reed St ndash Rechannelize SR 20Troxell Rd to Deception Pass Vic SR 20Frostad Road Vicinity ndash Guardrail SR 24South Wahluke Slope ndash Guardrail SR 290Helena Street ndash Add Turn Lane
Measures Markers and Mileposts - December 31 2003 31
Measures Markers and Mileposts - December 31 2003 33
End-of-2003 Season Highway Construction Project EvaluationsThird Annual Report The annual Construction Highlights report is an end-of-the-year synopsis of construction projects that were completed or nearly completed during the previous construction season Each regionrsquos project office evaluates how well its projects were carried out This is WSDOTrsquos third year publishing this report
This yearrsquos report is an assessment of 23 projects statewide representing a variety of construction types and settings Each project is rated in four elements of construction ndash design construction management schedule and cost and each element is assigned a one-to-five star rating (one is the lowest ranking while five is the highest) Contractorrsquos names are listed for identification but the detailed report shows that the strength or weaknesses of a particular project are often as much WSDOTrsquos responsbility as the contractorrsquos (guiding of design for example) and the best projects seem always to be built on strong teamwork for the entire project team The complete report can be found at wwwwsdotwagov projects2003highlights
Highway Construction Project Rating for 2003 Season Construction
Project Design Management Schedule Cost Contractor SR 504 Castle Rock laquolaquolaquolaquolaquo laquolaquolaquolaquolaquo laquolaquolaquolaquolaquo laquolaquolaquolaquolaquo Lakeside Ind SR 28 Rock Island laquolaquolaquolaquolaquo laquolaquolaquolaquolaquo laquolaquolaquolaquolaquo laquolaquolaquolaquolaquo Scarsella Bros US 395 Hillsboro laquolaquolaquolaquo laquolaquolaquolaquo laquolaquolaquolaquolaquo laquolaquolaquolaquolaquo M A DeAtleySR 26 Vantage laquolaquolaquolaquo laquolaquolaquolaquolaquo laquolaquolaquolaquolaquo laquolaquolaquolaquolaquo Central WA AsphaltSR 8 McCleary laquolaquolaquolaquo laquolaquolaquolaquolaquo laquolaquolaquolaquolaquo laquolaquolaquolaquo Scarsella BrosUS 12 Brady - Malone laquolaquolaquolaquo laquolaquolaquolaquolaquo laquolaquolaquolaquolaquo laquolaquolaquo Lakeside IndI-90 Sunset laquolaquo laquolaquolaquolaquo laquolaquolaquolaquolaquo laquo Kiewit ConstI-405SR 167 IC laquo laquolaquolaquo laquolaquo laquo Max J KuneySR 520 10th to Midspan laquolaquolaquolaquo laquolaquolaquolaquo laquolaquolaquo laquolaquolaquolaquolaquo Colvico IncI-90 Eastgate laquolaquolaquolaquo laquolaquolaquolaquo laquolaquolaquolaquo laquolaquolaquolaquolaquo Lakeside IndI-405 Cole Creek Parkway laquolaquolaquo laquolaquolaquolaquo laquolaquolaquolaquo laquolaquo Tri-State ConstructionSR 141 Klickitat Co Paver laquolaquolaquolaquo laquolaquolaquolaquolaquo laquolaquolaquolaquolaquo laquolaquolaquolaquolaquo Mid-Columbia PavingSR 20 Methow River Bridge laquolaquolaquolaquo laquolaquolaquolaquolaquo laquolaquolaquolaquo laquolaquolaquolaquolaquo One Way ConstructionSR 167 N Meridian to King laquolaquolaquolaquolaquo laquolaquolaquolaquolaquo laquolaquolaquolaquolaquo laquolaquolaquolaquolaquo ICON MaterialsI-5 Puyallup River Bridge laquolaquolaquolaquolaquo laquolaquolaquolaquolaquo laquolaquolaquolaquolaquo laquolaquolaquolaquolaquo CBI IncSR 161 Clear Lake Rd laquolaquolaquolaquolaquo laquolaquolaquolaquolaquo laquolaquolaquolaquolaquo laquolaquolaquolaquolaquo Tucci and SonsSR 525 SR 99 to SR 526 laquolaquolaquolaquo laquolaquolaquolaquo laquolaquolaquolaquolaquo laquolaquolaquolaquo KLB ConstructionUS 2 Barclay Creek Bridge laquolaquolaquolaquo laquolaquolaquolaquolaquo laquolaquolaquolaquolaquo laquolaquolaquolaquolaquo Wilder ConstructionSR 290 Trent Ave Bridge laquolaquolaquo laquolaquolaquo laquo laquolaquolaquolaquo Ross BrosI-90 Sullivan Rd laquolaquolaquolaquolaquo laquolaquolaquolaquolaquo laquolaquolaquolaquolaquo laquolaquolaquolaquolaquo Inland Asphalt CoSR 510 I-5 Pacific laquolaquolaquolaquo laquolaquolaquolaquo laquolaquolaquolaquo laquolaquolaquolaquo Scarcella BrosSR 125 Military Road laquolaquolaquolaquo laquolaquolaquolaquo laquolaquolaquolaquolaquo laquolaquolaquo Transtate PavingI-5 Samish Way laquolaquolaquolaquo laquolaquolaquolaquo laquolaquolaquolaquolaquo laquolaquolaquo Wilder ConstructionFour other projects of interest were included in the report but not evaluated SR 16 Tacoma Narrows Bridge SR 104 Hood Canal Bridge SR 433 Lewis and Clark Bridge and the Moses Lake Wetland Mitigation Bank Five star rating system one represents the lowest rating five represents the highest
WSDOT Asks the Publicrsquos Opinion Included for the first time in this annual Construction Highlights report is a public opinion questionnaire evaluating one project in each of WSDOTrsquos six regions Motorists who traveled through state highway construction projects over the past summer have an opportunity to tell WSDOT what they did or did not like what worked or did not work by visiting wwwwsdotwagovprojects2003highlights
WSDOT will use the public comments to improve the way projects are managed and communicated in the future Results of the public evaluation will be posted for each of the six projects Projects included are I-90 Sunset Interchange in King County I-5 Puyallup River Bridge in Pierce County State Route (SR) 141 Klickitat County Paver US 395 Hillsboro Street Interchange in Franklin County I-90 Sullivan Road to Idaho State Line Paving in Spokane County and SR 28 Rock Island Rock Slopes in Douglas County
Measures Markers and Mileposts - December 31 2003 32
32 Measures Markers and Mileposts - December 31 2003
Gig Harbor Tacoma
For scale The ferry Tacoma
Tacoma Narrows Bridge Project Update Designbuilder Tacoma Narrows Constructors (TNC) now stands at 263 construction completion of the new State Route 16 Tacoma Narrows Bridge project In December 2003 TNC reached another significant milestone ndash that of ldquotouching downrdquo the Gig Harbor (west) caisson onto the 133-foot-deep Narrows seabed In January TNC expects to touch down the Tacoma (east) caisson on the seabed at an even lower depth of 149 feet Following touchdown crews will continue placing reinforced concrete to build caisson internal and external walls while they dredge soil from the 15 hollow cells in each caisson Dredging will allow the caissons to sink another approximately 60 feet into the Narrows seabed At that point crews will start building the towers above water Other bridge work continues as well including anchorage construction and the overseas fabrication of the suspension cable wire Excavation work on both the Tacoma and Gig Harbor anchorages is finished The Tacoma anchorage has already had four massive concrete pours and crews are preparing to begin placing concrete on the Gig Harbor anchorage Roadwork also continues to move at a rapid pace Crews plan to complete the new eastbound on ramp and exit at 36th Street NW along with 22nd Street construction and open all to traffic in March Construction continues on several large retaining walls erosion control measures are in place for the winter season and landscaping along SR 16 is underway On February 2 the state Department of Ecology (DOE) fined WSDOT and TNC jointly $10000 for inadequate treatment of construction storm water During several rain events between October and January discharges of cloudy stormwater from the project site in the Narrows exceeded permit limits Since October project staff have worked hard to improve environmental compliance by implementing DOE environmental recommedations including implementing best-management-practice
Measures Markers and Mileposts - December 31 2003
Landscaping at 36th St on-ramp
Tacoma anchorage concrete pour Tacoma caisson concrete pour
Tacoma caisson construction
Tacoma Narrows Bridge Project Progress to Date Percent Complete
995Design
263Construction
314Total(1)
0 10 20 30 40 50 60 70 80 90 100
(1) Weighted 7 Design progress and 93 Construction progress
Source WSDOT Engineering and Regional Operations Division
stormwater treament controls increasing water monitoring and testing and monitoring stormwater detention ponds steps For more information on WSDOTrsquos environmental commitments see page 45 of this Gray Notebook For additional information including financial information project schedule traffic information photo library and more please visit wwwtacomanarrowsbridgecom
33
Measures Markers and Mileposts - December 31 2003 35
104 Hood Canal Bridge Project Update
Graving Dock Progress on the project remains almost at a standstill as efforts continue among WSDOT the Lower Elwha Klallam Tribe the State Office of Historic Preservation FHWA and the Army Corps of Engineers to resolve issues presented by the discovery in August 2003 of a significant archaeological find The process must establish compliance with the requirements of Section 106 of the National Historical Preservation Act in order for construction work to resume at the site probably following a period of intensive archaeological activity Meanwhile despite the lack of physical construction at the graving dock site the contractor completed a restoration project at Ediz Beach Close to 1500 feet of shoreline was cleared contoured and reseeded For many years the Ediz Beach area was unsafe and inaccessible due to logs pilings and other debris WSDOT removed these articles at low tide to avoid disturbing the harbor waters This restoration provides a healthy natural environment for native plants and animals and may also encourage the spawning of sand lance (a small fish) a significant portion of juvenile salmonrsquos diet It was completed on time and in accordance with a Hydraulic Project Approval (HPA) issued by the Department of Fish and Wildlife as mitigation for
Project Progress to Date Percent Complete
Total 88
0 10 20 30 40 50 60 70 80 90 100
(Percent completion based on contract dollars)
Source WSDOT Engineering and Regional Operations Division
Before
After
use of shoreline access to the graving dock The mitigation project had to be completed before October 15 2003 to minimize disturbance of the sand lance during its spawning period
Bridge Site Construction continued at the bridge site with the contractor Kiewit-General of Poulsbo building a temporary work trestle at the bridgersquos east end The work trestle eventually will support the new east-half transition span Plans are to roll the existing span onto a second temporary work trestle and roll the new transition span into place A long weekend closure is expected sometime in 2005 or 2006
For more information please visit wwwwsdotwagovprojectssr104hoodcanalbridgeeast
Measures Markers and Mileposts - December 31 2003 34
34 Measures Markers and Mileposts - December 31 2003
Highway Safety Improvement Projects Quarterly Update
Many of the highway safety improvement projects installed or constructed by WSDOT seek to improve safety in an area identified by unusually high frequencies of accidents Do these safety improvement projects in fact lead to safer conditions WSDOT reports below on a very encouraging review of before-and-after accident statistics in relation to 21 such projects from locales around the state Also featured this quarter are results from a study on
bull Cable Median Barrier - Across the Median Protection a project intended to benefit longer stretches of highway
bull Impacts of the 08 DUI law assessed over a six year period
bull Safe Routes to School program and
bull A roundabout project in the City of Port Orchard
Safety Projects ndash Before and After Results Each year WSDOT completes a variety of safety improvement Combined Average for 21 Safety Projects projects throughout the state highway system ranging from Collisions Per Year adding turn lanes and signals to installing median barrier and
Propertyrumble strips To begin to determine their effect on reducing the All Types Damage Only InjuryFatalnumber and severity of traffic collisions a preliminary before-
Before 155 88 67and-after study has been conducted for 21 such projects Projects After 97 55 42were chosen that permitted at least 18 months of collision data
to be analyzed in the before period and at least 12 months in the Source WSDOT Transportation Data Office
after period The data was then normalized (12 month average) to make a fair comparison
Preliminary results indicate that for this 21 project sample the average number of collisions per year for all projects combined was reduced by 37 percent Likewise the average number of fatal and injury collisions per year also declined by 37 percent As additional data becomes available this safety project analysis will be updated and expanded
To provide examples of the various types of highway improvements that were indicated in the study additional details about three different projects are provided below and on the next page
I-90 Gold Creek to Easton Hill Vicinity Kittitas County Screens were installed in the median at these two locations to reduce the night time headlight glare from on-coming traffic Prior to installation of the screens these two sections of I-90 had a combined average of 194 night time collisions per year After the installation this figure dropped to 137 a 29 percent decrease In addition for collisions that involved only damage to property the decline in the after period was even greater from 152 to 6 or a 60 percent reduction
Glare screen installed on median barrier along I-90
I-90 Ritzville to Tokio This project involved flattening side slopes installing rumble strips upgrading illumination and repaving Before the project started there was an average of 39 collisions per year in this 13-mile section of I-90 Since the project was completed this dropped to 21 collisions per year a 46 percent decrease The percentage decrease in fatal and injury collisions was nearly as large dropping by 34 percent In looking at specific categories of collisions additional reductions are shown a 9 percent decrease in non-daylight collisions a 31 percent decline in collisions on wet pavement surfaces and an 8 percent drop in overturns
Slope flattening and new pavement on I-90 near Ritzville
Measures Markers and Mileposts - December 31 2003 35
Measures Markers and Mileposts - December 31 2003 37
SR 99 Battery Street Tunnel Seattle In order to reduce the number of collisions occurring on wet pavement surfaces the concrete roadway was ground to increase friction Before the project this section of SR 99 experienced an average of 775 collisions per year 475 of which were on wet pavement After the project was completed total collisions decreased to 305 per year while wet surface collisions declined to 102 per year a reduction of 61 percent and 79 percent respectively If only injury collisions are considered the decrease after the project was completed is nearly as dramatic from 295 per year down to 148 or a 50 percent drop
Concrete pavement grinding to increase friction on SR 99 at theThe summary of all 21 safety projects so far included in the study Battery Street Tunnel in Seattlethat are being analyzed is presented in the table below For a complete table of findings please visit the following web site wwwwsdotwagovmapsdatatdoPDF_and_ZIP_Filessafety_projectpdf
Highway Safety Projects - Before and After Study Collision Data Comparison
Collisions Per Year Property
Available Data DamageProject Title and Location Description of Work (in months) All Types Only InjuryFatal US 2 Sultan-Startup Road Widened SR 2 to provide an EB left turn lane 18 Before 07 00 07Startup Vicinity and a WB left turn pocket 14 After 09 00 09SR 99 Battery Street Tunnel - Safety Constructed roadway surface improvements - 26 Before 775 480 295Seattle pavement grinding 13 After 305 157 148SR 522 NE 145th St Vicinity To NE 155th St Constructed raised median island in place of 18 Before 633 380 253Shoreline existing two way left turn lane Improved visibility 16 After 405 263 143US 2 Applets Way To Vicinity Red Apple Installed median barrier to reduce crossover 23 Before 21 05 16Road Cashmere collisions 12 After 00 00 00SR 1726 Othello - Grade Separation New interchange and illumination 21 Before 74 29 46Othello 12 After 20 10 10SR 24 Hatton Road Ltl Widened and provide left turn channelization 20 Before 12 06 06Othello and improve turning radius 13 After 18 18 00SR 26 Constructed left turn lanes 23 Before 68 37 31Royal City Vicinity 12 After 00 00 00SR 28282 Ephrata - Signal Widened roadway constructed left turn lanes 23 Before 57 57 00Ephrata and installed signal 13 After 37 37 00US 97 Orondo North Realingment and construction of left turn lane 25 Before 05 00 05Orondo Vicinity 12 After 00 00 00US 97 Alt Lakeside Vicinity Constructed two-way left turn lane 21 Before 51 40 11Chelan 16 After 08 08 00SR 150 Chelan West - Turn Lanes Widened and constructed left turn channelization 22 Before 11 05 05Manson 17 After 07 07 00SR 105SR 105 Spur Constructed channelization for right and left turns 29 Before 33 12 21Westport Upgraded illumination 12 After 30 20 10SR 162 Bowman Hilton Rd E to Vicinity Upgraded signal and illumination realignments 19 Before 499 215 284149th Alderton installed signal guardrail and flattened slopes 18 After 467 233 233I-5SR6 Sb Ramp - Signal Signal and illumination installation 25 Before 29 14 14Chehalis 15 After 08 00 08I-5 Chamber Way - Signal Installed signal at NB off-ramp realignments 25 Before 38 29 10Chehalis resurfacing and illumination 15 After 24 24 00US 101 Fowler Street- Signal Installed signal reconfigured with curbs and raised 25 Before 24 19 05Raymond islands 15 After 40 24 16SR 24 Birchfield Road Intersection Installed signalization upgraded illumination 24 Before 55 20 35Yakima Vicinity signing and pavement markings 12 After 50 30 20I-90 West Ersquoburg IC To South Ersquoburg IC Lengthen acceleration lane and tapers Updated 25 Before 149 115 34Ellensburg Vicinity illumination and guardrail Roadway rehab and overlay 12 After 160 130 30I-90 Gold Creek To Easton Hill Installed glare screen along median barrier 26 Before 194 152 42Snoqualmie Pass Vicinity 14 After 137 60 77SR 241 Alexander Road To Factory Rd Constructed two-way left turn lane Channelization 25 Before 120 34 86Sunnyside Vicinity Upgraded signals widened shoulders 4-way stop 21 After 103 63 40I-90 Ritzville To Tokio-safety Matrix Flattened slopes installed rumble strips 28 Before 390 193 197Ritzville Vicinity illumination upgrades and ACP overlay 12 After 210 80 130In addition to the projects shown the I-82Union Gap to Oregon State Line project was analyzed Initial results indicate an increase in collision frequency which is not readily identifiable because of the length of the project weather variation and increased traffic in different locations throughout the project Additional review is underway to identify probable causes for the collisions This information will be presented at a future date Source WSDOT Transportation Data Office
Measures Markers and Mileposts - December 31 2003 36
36 Measures Markers and Mileposts - December 31 2003
The Cable Median Barrier Protection From lsquoAcross the Medianrsquo Collisions
2003-2005 Median Crossover Protection ProjectsErrant vehicles that cross the median into opposing lanes State Lengthof traffic typically cause severe and often fatal collisions Route Project Title (miles) Ad Date
A study of across the median crashes on Washingtonrsquos I-5 Puyallup River To Fife Interchange 19 Aug-03 multilane divided state highways with full access control I-90 Argonne Rd to Pines Rd - Widen 206 Nov-03
I-90 Pines Rd to Sullivan Rd-Widen 211 Nov-03was conducted to evaluate median barrier guidelines and I-90 Moses Lake West-Safety Improvements 1135 Dec-03identify specific highway sections where installation I-5 County Line to Prairie Creek Bridge 245 Jan-04
of a barrier would be appropriate The program I-90 Sullivan Rd to State Line 699 Apr-04adopted after the study is to install cable barriers as I-90 Geiger Road to US-2 237 Oct-04 part of improvement projects when the median width I-5 Pierce Co Line to Tukwila IC HOV- 53 Oct-04 is 50 feet or less Installation of barriers in medians I-90 George Vicinity East - Safety 1582 Oct-04 over 50 feet in width will be weighed against other Source WSDOT Engineering and Regional Operations Division improvements on a case-by-case basis
Cable barriers have been used on the nationrsquos highways since the 1930s or before The modern system which uses three cables supported by weak steel posts was developed in the 1960s and is now in widespread use in several states
Reductions in Severe Collisions Severe Collisions While total collisions in the study areas I-5 in Before and After Cable Median Barrier Installation
Annual Fatal and Disabling Collisions and Median Collision Type Everett Vancouver and Fife nearly doubled (from 7
45 to 100 including collisions with property damage 6only) the number of severe collisions (fatal and
disabling) decreased significantly This resulted in a 5
societal benefit of cable median barriers calculated 4 to be $420000 per mile annually A breakout of the
3 types of severe collisions are shown in the graph to
2the right (graph does not include ldquoproperty damage onlyrdquo collisions) 1
0 The data on the right was normalized and represents 12 months before and 12 months after the project All Median Fixed Object Roll Over Cross Median
Source WSDOT Engineering and Regional Operations Division
Fatal Accidents Disabling Accidents
Before After Before After Before After Before After
Before After
Washington State and Alcohol-Related Fatalities From 1998 to 2002 alcohol-related deaths per 100 million
Washington State Alcohol-Related Fatalities miles driven dropped 11 percent overall from 060 to 054 per Per 100 Million VMT100 million miles driven in Washington A package of anti-1998 to 2002drunk-driving laws enacted in 1998 lowered the blood alcohol
intoxication threshold from 010 to 008 percent and provided 065
for automatic loss of license for drunk driving These legislative steps together with increased State Patrol emphasis on stopping 06
drunk drivers are credited with the decrease Other measures in Washington include increased use of ignition interlock devices 055
(a device attached to the carrsquos ignition system that requires the driver to blow into the device before starting the car ndash if alcohol 05
is detected the car wonrsquot start) and a crackdown on deferred prosecutions 045
DUI 08 Law Enacted
1998 1999 2000 2001 2002
Washington DUI Facts amp TrendsSource ldquoResearch Noterdquo DOT HS 809 680 US Department ofBetween 1983 and 1991 an average of 391 drinking- Transportation National Highway Traffic Safety Administration
driver-involved (DDI) deaths occurred each year Between December 2003 1992 and 2002 an average of 285 DDI deaths occurred each year This improvement means that about 1166 lives have been saved in Washington during the 1990s
Measures Markers and Mileposts - December 31 2003 37
Measures Markers and Mileposts - December 31 2003 39
Safe Routes to Schools Since 1999 WSDOT has administered a five million dollar per biennium grant program appropriated by the legislature called Traffic Safety Near Schools This program has funded more than 70 projects across the state to improve bicyclist and pedestrian safety near schools This program was not however extended to new projects in the 2003-2005 budget In addition the Washington State Traffic Safety Commission currently administers a $2 million annual School Zone Safety grant program that pays for safety education and small traffic safety improvements The program is funded by fines from school zone traffic violations
The Washington State Department of Health (DOH) recently received $800000 in grant funds to promote active community environments a program that will include safe walkride to school routes DOH is currently working with regional county and city governments in areas meeting specific public health criteria across Washington
Safe Routes to Schools mdash Elementary School Locations
Half of the elementary schools in Washington are located on or very near state routes State law requires elementary schools to produce walk route plans
Seattle
Tacoma Olympia
Spokane
Elementary schools on or within 12 mile of a State Route Elementary schools near accident sites (accidents involving elementary agevictims 1995-2001)
Safety in a Roundabout WayPort Orchard Roundabout Safety Improvement During the late 1980s and early 1990s traffic growth in the city of Port Orchard in southern Kitsap County overwhelmed the intersection of Bethel Avenue and Mile Hill Drive (SR 166) eventually generating enough injury and property collisions to classify the intersection as a High Accident Location (HAL) Vehicle speeds exceeding the posted speed limit and the intersection configuration contributed to the collision problem In the mid-1990s after approval of the design by WSDOT the City of Port Orchard built a ldquomodernrdquo roundabout the first of its kind on the state highway system and the second to be built in Washington
After the construction of the single-lane roundabout crash data supports how well a roundabout can work when applied to a site-specific intersection safety problem There are now 48 roundabouts in Washington
Port Orchard -Bethel Ave and Mile Hill Drive Intersection
Number of Collisions and Injuries Before and After Roundabout Comparison 40
30
20
10
0 3 Years Before 3 Years After Roundabout Roundabout
Collisions
Injuries
Source WSDOT Engineering and Regional Operations Division
Measures Markers and Mileposts - December 31 2003 38
38 Measures Markers and Mileposts - December 31 2003
Asset Management Pavement Assessment Annual Update WSDOT maintains approximately 19200 lane miles (including ramps) of pavement surfaces The three major pavement types are chip seal hot mix asphalt pavement and portland cement concrete (PCC) pavement Each of these pavement types has an associated pavement life rehabilitation treatment and rehabilitation cost This report is an annual update of information last presented in the Gray Notebook for the quarter ending December 31 2002
Pavement Condition Update 2002 Results Pavement Condition Trends According to the 2002 pavement condition survey the Percent of Pavements percent of WSDOT pavements in ldquopoorrdquo condition increased slightly in 2002 to 93 percent up from 89 percent as
100
reported in the 2001 pavement survey The rating continues 80
to be dramatically better however than the situation in 1971 when the Washington State Pavement Management System 60
was first put in place 40
Programming Pavements for Rehabilitation 20 The table below shows some important facts about the extent and use of the various pavement types and the success that 0
the state seems to be achieving in directing investment to 1998 2002
areas of need Source WSDOT Materials Lab
Over the last biennium about nine percent of pavement rehabilitation spending has been for chip seal resurfacing These roads the cheapest to Lowest Life Cycle Cost resurface constitute about 23 percent of the lane miles but carry only about five percent (LLCC) Program for of the traffic Pavement Management
The basic principles behind LLCCEighty-eight percent of the spending has been for preservation of hot mix asphalt are rather simple mdash if rehabilitation pavements These roads are 64 percent of the lane miles and carry 71 percent of the traffic is done too early pavement life is
wasted if rehabilitation is done too late very costly repair work may beThe PCC pavements are 13 percent of the lane miles yet carry 23 percent of the required especially if the underlying
traffic PCC pavements have longer lives than other pavements but are very costly to structure is compromised WSDOT rehabilitate not only in terms of construction money but also in traveler inconvenience continually looks for ways to best
strike a balance between these twofrom traffic restrictions when pavement work is performed especially on the major high- basic principles while implementingtraffic corridors Forthcoming replacement of these pavements will bring big challenges the practical aspects of pavement
rehabilitation programsinvolving funding engineering and traffic management during construction (see the discussion on PCC pavements later in this section) The state is fast approaching the need to reckon with this looming financial and traffic crisis in pavement management a story that is not fully revealed by the generally positive picture conveyed by the recent annual surveys of ldquopoorrdquo condition pavements for the entire highway system
1973 1981 1986 1990 1994
Good Condition
Slight increase in percentage of pavement in poor condition 2001 to 2002
Long-term trend declining percentage of pavement in Poor Condition
Pavement Type Lane Miles
Lane Miles
Annual Vehicle Miles Traveled ndash 2002 (in billions)
03-05 Dollars
Programmed (in millions)
05-07 Dollars
Programmed (in millions)
Miles $ $
Chip Seal Pavements A chip seal is a durable surface that provides six to eight years of performance life and has an approximate cost of $12000 per lane mile
4490 234 17 53 $195 9 $182 9
Hot Mix Asphalt Pavements Hot mix asphalt pavement surface life between rehabilitation treatments can range from six to 18 years (based on actual pavement performance) and has a cost of $123000 (due miles) per lane mile and $156000 (past due miles) per lane mile
12284 640 225 715 $1819 84 $1845 91
Portland Cement Concrete (PCC) Pavements WSDOT has experienced PCC pavement lives ranging from 25 to 45 years and has an approximate cost of $330000 for dowel bar retrofit per lane mile and $1 million for full replacement per lane mile
2410 126 73 233 $142 7 $0 0
Source WSDOT Systems Analysis and Program Development Office WSDOT Materials Lab
Measures Markers and Mileposts - December 31 2003 39
Measures Markers and Mileposts - December 31 2003 41
Chip Seals For chip seals asphalt is sprayed on the existing surface and then covered with a layer of rock chips The oil becomes solid as it cools Chip seals are appropriate for low volume roads (less than 2000 vehicles per day and less than approximately 200 trucks per day) Since the roadways that receive this type of treatment are typically on rural routes WSDOT has found that pavement rehabilitation dollars seem to be best spent with efficiency of scale when a stretch of rural road mileage is taken together for resurfacing in a single ldquopaverrdquo contract even when the contract includes aging segments not yet ldquoduerdquo together with ldquopast duerdquo segments
Hot Mix Asphalt On average western Washington hot mix asphalt pavement life is 165 years eastern Washington life is 113 years (due to severe winter cold and extreme summer heat) and the statewide average is 147 years Hot mix asphalt is appropriate for a broad range of roadways from lower volume routes (more than 2000 vehicles per day and more than 200 trucks per day) to interstates with heavy traffic volumes
These pavements are where the greatest benefits of LLCC pavement management can be realized In past biennia there has been some tendency to allocate a share of pavement preservation dollars on a traditional basis by region in addition to dollars programmed strictly by reference to ldquopast duerdquo needs This has resulted in some distortion away from ideal LLCC results As of the 2003-05 biennium this has been corrected by making all regional allocations based on pavement condition and LLCC analysis
Portland Cement Concrete (PCC) Existing PCC pavement life ranges from 25 to 45 years PCC pavement is typically placed on heavily traveled interstate principal arterial and intersection locations Most of the PCC pavements historically installed on Washington highways require dowel bar retrofit and diamond grinding (to smooth the pavement surface) 20 to 25 years after construction (due to lack of reinforcing steel at the transverse joints to prevent settlement) It is estimated that a newly constructed PCC pavement will have a pavement life of 50 years and only require diamond grinding in its 25th year due to studded tire wear
Efficiency Gains for Hot Mix Asphalt Pavements Hot mix asphalt surface life has improved by 14 percent (statewide) over the last six years while over the same time period the vehicle miles traveled on asphalt paved roadways has increased by approximately 10 percent Management of asphalt pavements is an area where WSDOT has succeeded in delivering dramatically improved ldquobang for the buckrdquo to Washington state taxpayers How have WSDOT and its asphalt paving industry contractors achieved this significant efficiency gain in asphalt on state freeways and highways The keys lie chiefly in the following areas bull Provision on the paving specification for use of performance-grade binders selected for expected climate and traffic conditions
bull Use of Superpave mix designs keyed to temperature and traffic expectations
bull Improved asphalt pavement repair and asphalt placement techniques
bull Better attention to construction details and inspection and bull Increased experience with LLCC rehabilitation programming
WSDOT is also focusing pavement management efforts on programming more lane miles at a single location resulting in lower bid prices The amount of asphalt used for pre-leveling (filling in minor ruts and depressions prior to paving) has also been reduced on WSDOT paving jobs generally from 600 tons per lane mile to 300 tons per lane mile resulting in a substantial cost savings The effect of these efficiency gains taken together is that a tax dollar invested in pavement rehabilitation today buys much more than it did just a few years ago
2004 Concrete Lane Miles
Current Age (Construction or Reconstruction)
Total Lane Miles
Lane Miles Rehabiliated to Date by Dowel Bar Retrofit
0-10 1471 00 11-20 2740 00 21-30 5668 350 31-40 6420 3224 41-50 2791 581 51-60 50 02 61 or more 661 00 Total 19800 4157
A matter of concern in the 2002 pavement condition survey is that an additional six miles of PCC pavement were found to have fallen into the ldquopoorrdquo category raising the PCC ldquopoorrdquo total to 170 lane miles However the greatest concern is the potential for a dramatic increase in the poor category as a result of the PCC performance reevaluation in 2004
The table at left illustrates the number of PCC pavement lane miles currently owned and maintained by WSDOT Sixty miles of PCC replacement would cost on the order of approximately $60 million before taking into account the project costs associated with roadway safety upgrades and stormwater runoff control retrofits
Does not include 321 lane miles of bridge Traffic disruptions associated with rehabilitation or replacement of these pavements is sections and 112 lane miles of ramps another difficult feature of this looming problem
40 Measures Markers and Mileposts - December 31 2003
40 Measures Markers and Mileposts - December 31 2003
Rating Pavement Conditions WSDOT continues to use a three-part examination system to rate pavement condition
Pavement Structural Condition (PSC) A pavement will develop structural deficiencies for two reasons truck traffic and cold weather The PSC is a measure based on distress such as cracking and patching which are related to the pavementrsquos ability to carry loads PSC ranges from 100 (best condition) to 0 (worst condition) A roadway should be considered for rehabilitation when it falls within the PSC range of 40 to 60 Rutting Rutting is caused by heavy truck traffic or studded tire wear Ruts deeper than 12 inch have the potential to hold water increasing the risk of hydroplaning for high-speed traffic A roadway should be rehabilitated when the rut depth is greater than 13 inch
Roughness The International Roughness Index (IRI) is a procedure to measure pavement ride A full-sized van with a laser-measuring device mounted on the front bumper measures the roughness of the pavement A roadway should be rehabilitated when the IRI value is between 170 and 220 inches per mile
Determining When Pavements are ldquoDuerdquo The Pavement Condition Rating process using the van pictured on the right analyzes and predicts the pavement rehabilitation due period (see the Gray Notebook for the quarter ending June 30 2001 for details) A regional validation process reviews the results and calibrates the ratings if needed The number of disputed segments varies between 5-10 Each of the segments in question is then reviewed and any discrepancies are resolved WSDOT considers the pavement rehabilitation due year in the Pavement Management System to be approaching 100 accuracy Pavement Condition Data Collection Vehicle
2002 Pavement Smoothness by StateHow Do Washingtonrsquos Pavements Conditions Centerline Miles in PercentCompare with National Experience Miles Poor in Poor
FHWArsquos annual Highway Statistics report includes Rank State Reported Condition Condition information on pavement condition reported by each 1 Georgia 11301 34 03
2 Wyoming 4414 22 05of the 50 states and the District of Columbia (based on 3 Alabama 7643 41 05roughness only) To the right is a snapshot of the 2002 4 North Dakota 6180 53 09 results that shows the number of miles by state in 5 Minnesota 11658 108 09
6 Nevada 2959 33 11poor condition according to smoothness The total miles 7 Kentucky 5192 76 15reported includes the interstate system and principal 8 Florida 10898 160 15
9 Kansas 8851 183 21arterials owned by the state cities and counties and a 10 Arizona 4065 86 21sampling of other functional classes Washington state 11 Idaho 3860 93 24ranked 16th in smooth roads in 2002 (Washington was 12 Maine 2391 60 25
13 Montana 6927 179 26ranked 17th in 2001) 14 Utah 3676 120 33 15 Alaska 1800 62 34 16 Washington 5396 194 36The FHWA publication can be viewed at wwwfhwadotgovpolicy
ohimhs02indexhtm 17 South Carolina 6791 260 38 18 New Hampshire 1375 54 39
49 California 20634 5437 263 50 Massachusetts 3290 1182 359
Source Highway Statistics 2002 US Department of Transportation
Measures Markers and Mileposts - December 31 2003 41
Measures Markers and Mileposts - December 31 2003 43
Highway Maintenance Annual Update Biennial Maintenance Targets The Maintenance Accountability Process (MAP) targets measures and communicates the outcomes of 34 distinct highway maintenance activities Maintenance results are measured using field condition surveys and are reported as Level of Service (LOS) ratings LOS targets are defined in terms of the condition of various highway features (for example the percent of guardrail on a highway system segment that is damaged) LOS targets are also keyed to the level of funding provided by the Legislature The following table shows a list of maintenance activities (in prioritized order) for which LOS targets have been set in the 2003-05 biennium During 2003 targets for all activities were achieved
WSDOT Maintenance TargetsAchieved for 2003 Maintenance Activity Achieved Pavement Patching and Repair uuml
Snow and Ice Control Operations uuml
Traffic Signal Systems uuml
Movable and Floating Bridge Operations uuml
Urban Tunnel Systems uuml
Keller Ferry Operations uuml
Guardrail Maintenance uuml
Noxious Weed Control uuml
Structural Bridge Repair uuml
Intelligent Traffic Systems uuml
Control of Vegetation Obstructions uuml
PermitsFranchises uuml
Maintain Culverts uuml
Regulatory Sign Maintenance uuml
Slope Repairs uuml
Crack Sealing uuml
Bridge Deck Repair uuml
Safety Patrol uuml
Rest Area Operations uuml
Highway Lighting Systems Operations uuml
Pavement Striping Maintenance uuml
Maintain Catch Basins and Inlets uuml
RaisedDepressed Pavement Markers uuml
Sweeping and Cleaning uuml
Nuisance Vegetation Control uuml
Maintain Ditches uuml
Shoulder Maintenance uuml
DetentionRetention Basins uuml
Litter Pickup uuml
Guide Sign Maintenance uuml
Landscape Maintenance uuml
Guidepost Maintenance uuml
Bridge Cleaning uuml
Pavement Marking Maintenance uuml
2003 Perfect Score ndash Percentage of Legislatively Funded Targets Achieved 1998-2003 In September 2001 the first Gray Notebook quarterly report on MAP WSDOT achieved 26 out of the 34 MAP targets Three years later a perfect score has been achieved The positive trend can be attributed to bull What gets measured gets managed WSDOT
maintenance managers and field workers are gaining experience with how to manage work in ways that help to attain the service level targets
bull Strong maintenance results across-the-board have been assisted by mild or average winter conditions
bull Stable funding for maintenance for several years has lessened ldquocrisis moderdquo management and produced better across-the-board results
bull Improved accuracy in measuring MAP results ndash based on a six-month review and field verification of MAP measures and their assessment technique
Starting in March 2004 WSDOT maintenance staff will be documenting greater levels of detail such as units of work completed (for example ldquolinear feet of guardrail repairedrdquo) This will provide information that can be used to develop cost per unit and units per day or week measures to supplement the outcome measures provided by MAP Look for more on this in future Gray Notebook maintenance pages
Percentage of Legislatively Funded Targets Achieved for 1998-2003
100
80
60
40
20
0 2002 20031998 1999 2000 2001
Source WSDOT Maintenance Office
Measures Markers and Mileposts - December 31 2003 42
42 Measures Markers and Mileposts - December 31 2003
Integrated Vegetation Management Integrated Vegetation Management (IVM) involves creating and supporting roadside plant communities that minimize short and long-term maintenance needs Roadside vegetation maintenance requirements often depend on how well roadsides are designed and constructed When soil is conserved and improved vegetation is restored during highway construction roadside maintenance requirements can be relatively low However if roadsides are not well restored at the time of construction the expense of roadside maintenance grows because noxious and nuisance weeds tend to establish themselves and thrive in poor soils with sparse vegetation
2003 Herbicide Use Trends ndash Results In terms of pounds of active ingredient WSDOTrsquos statewide annual use of herbicides for roadsides increased by 3300 pounds (121105 pounds in 2002 to 124426 pounds in 2003) On closer review of the data most areas in western Washington were either down or about the same in their overall herbicide use compared to 2002 In fact Clallam County the first area in which WSDOT has implemented an IVM plan saw a 50 percent reduction in herbicide use on the roadsides In eastern Washington two areas in particular experienced significantly increased herbicide use The cause was a localized ongoing weed infestation problems for which herbicide applications were needed Had it not been for the significant application in these two areas WSDOTrsquos herbicide use in 2003 would have been less than in 2002
Clallam County IVM Plan In the past year WSDOT has finally begun to make progress implementing its long-promised IVM program Working with communities and a number of interest groups on the Olympic Peninsula WSDOT developed an IVM plan for state highway maintenance in Clallam County that reduced the amount of herbicide used and responded to citizen concerns Highlights and results include
bull No vegetation-free area adjacent to pavement within 60 feet of salmon streams Hand-treatment only of invasive plants growing next to the pavement edge in this area
bull No summer application of herbicides for controlling trees and brush
bull Hand application of noxious weed control herbicide (as opposed to truck applications) and close coordination with the Clallam County Noxious Weed Control Board
bull Experimentation with alternative brush control methods such as planting desirable plant species (ie salal) hydro seeding and biological controls
bull Total herbicide use decreased more than 50 percent
At a February 5 2004 open-house meeting to discuss continued aspects of the IVM program in Clallam County concerned citizen Josey Paul commended WSDOT employees saying ldquoThank you for your good efforts managing vegetation along SR 112 this past yearrdquo
With an effective IVM program common weeds such as kochia in eastern Washington can be managed with reduced herbicide use over time
Vegetation-Free Area Approximately 60 percent of herbicides used by WSDOT are used to prevent vegetation from growing at the pavementrsquos edge WSDOT is reviewing this practice including a study of other statesrsquo use of chemicals in vegetation-free zones alongside the roadway The challenge in determining the best approach comes from needing to balance the potential herbicide impacts with hazards to motorists associated with an abundance of roadside vegetation to highway workers from mechanical control technologies and to pavements for vegetation incursions to the pavement By the end of the year WSDOT will develop and implement updated policies on vegetation-free areas
The vegetation-free zone next to the roadway
Measures Markers and Mileposts - December 31 2003 43
Measures Markers and Mileposts - December 31 2003 45
IVM Future Practices Integrated Vegetation Management Plan Schedule Because of the success of the Clallam County I-5 North (lsquo04)IVM plan WSDOT created a statewide schedule for Roadside Vegetation Management plans The timetable implements all plans by the end of 2007 WSDOT also identified new performance measures to track future roadside vegetation management trends The measurements include
bull The IVM plan development schedule
bull Adherence to sensitive buffers upon orders by the US District Court (see below)
bull Number of WSDOT application violations
bull Maintenance Accountability Process (MAP) conditions measures for nuisance weeds I-5 South (lsquo03)noxious weeds vegetation obstructions and landscape maintenance WSDOTrsquos Integrated Vegetation Management Plan implementation
is scheduled by year and by maintenance area as shown in thebull Documentation of area-specific IVM plan above map Area by area production of the plans will continue until
elements completed each year statewide coverage is achieved
Seattle Spokane
5
rsquo03 rsquo04
rsquo06
rsquo05
rsquo05
rsquo06 rsquo05
rsquo04
rsquo07
rsquo07
rsquo07
5
Tacoma Olympia 90
Whidbey Island Plan Coming The department will hold a public meeting on a Roadside Vegetation Management Plan for Whidbey Island in March 2004 WSDOT expects to develop and implement a plan that meets the concerns of citizens with varying viewpoints on herbicide use and can be achieved at reasonable cost The draft plan identifies a number of key areas test sites roadside features and treatment practices Other IVM plan details for Whidbey Island are expected to include
bull Restoration of roadsides in coordination with future construction projects on State Route 20
bull Restoration of native roadside vegetation on half of an acre a year as part of the regular maintenance program
bull No vegetation-free area adjacent to pavement within 60 feet of the waterline at Penn Cove and Keystone Spit
bull Establishment of the vegetation-free area pilot projects
US District Court January 2004 Ruling The United States District Court in Seattle entered an injunction in January 2004 prohibiting the use of certain herbicides within sixty feet of salmon streams pending EPArsquos completion of a review whether such use is consistent with protections afforded by the Endangered Species Act
WSDOTrsquos herbicide practices included in the 2003 IVM plan for Clallam County and generally followed in many other areas of Western Washington are already matched to the injunctionrsquos requirements To ensure adherence to the terms of the injunction WSDOT maintenance crews will identify affected areas on the highways mark buffer zones and receive additional training on vegetation management practices including limitations on herbicide use
WSDOT ndash Proactive in Risk Assessment As part of its vegetation management efforts in 2003 WSDOT contracted with a consultant Intertox Inc to update a 1993 WSDOT hazard assessment study This included integration of new research in herbicide usage The hazard assessments aim through review of scientific literature to inform WSDOTrsquos understanding of potential risks to humans wildlife and aquatic organisms The hazard assessment update generally found the potential risks of specific products to be negligible or low in WSDOTrsquos patterns of use The assessment suggested however that moderate potential risks might be presented by two products MCPA and Diuron WSDOT discontinued further use of MCPA in 2003 and has taken steps to reduce the use of Diuron by limiting its application only to certain areas in eastern Washington
Measures Markers and Mileposts - December 31 2003 44
44 Measures Markers and Mileposts - December 31 2003
Environmental Programs Environmental Management System (EMS) Update WSDOT is continuing to develop its Environmental Management System (EMS) to help support the departmentrsquos environmental efforts and integrate those efforts into everyday operations training programs and regular performance reports Currently several important activities described below are building WSDOTrsquos capacity to improve track and report on environmental compliance
Construction Services Program Pilot To address projects funded by the 2003 Transportation Funding Package WSDOT is piloting a construction services program modeled on a prototype used by its regional office in Yakima The program is being evaluated for statewide implementation Its goal is to ensure that environmental commitments attached to a project are clearly communicated and implemented throughout design construction and facility operation The programrsquos three major components are (1) pre-construction and pre-activity meetings between WSDOT and the contractor (2) tools to aid construction and maintenance staff in maintaining
Seven Core Elements to WSDOTrsquos Environmental Management System bull Legal and other requirements clearly outline all
environmental laws regulations and agreements that apply to operations
bull Written procedures instruct staff and contractors how to conduct work activities in compliance with requirements
bull Training ensures those that conduct certain activities know how to do the work in a compliant manner
bull Roles and duties ensure WSDOT staff and contractors know what they are to do under the EMS
bull Inspection monitoring and corrective action ensure a process is in place to check WSDOTrsquos work for compliance and correct any problems
bull Documentation allows WSDOT to evaluate the operation of the EMS and communicate results to the public and within the department
bull Performance measurement compares WSDOTrsquos performance against pre-determined targets with results reviewed by management and reported to the public
compliance on the project site including an environmental inspection checklist for use by construction inspectors and (3) environmental compliance procedures issued by WSDOT for all construction and maintenance activities
Enhanced Commitment Tracking WSDOT is working to better track formal commitments made during the project development process By the end of 2004 WSDOT will track all formal commitments from inception (usually during planning or project design phase) through construction to completion or handoff to its Maintenance and Operations Department This new system will make clear assignments of roles and duties to show who manages performs and monitors the implementation of each commitment
Examples of Environmental Commitments on WSDOT Projects Some environmental commitments are Other commitments are agreements Some commitments are made during the terms and conditions outlined in environ- made during the Endangered Species Act National Environmental Policy Act (NEPA) mental permits These may require process These commitments or ldquoconser- environmental review process to minimize WSDOT to maintain a certain water quality vation measuresrdquo are designed to protect or offset overall environmental impact of a level during construction use certain endangered species Examples include the project Commitments under NEPA may affect Best Management Practices (BMPs) and requirement for WSDOT to place woody a roadwayrsquos alignment or physical design conduct environmental monitoring debris in a river or avoid working at certain The concrete box culverts shown belowtimes to protect migratory speciesFor example straw blankets and silt were agreed upon during the NEPA process fences are required to be used to protect In addition to habitat protection WSDOT and are designed to promote floodplain a small stream along Highway 18 during uses engineered log jams root wads and connectivitymdashallowing water to pass under rainstorms until permanent erosion control other bio-engineering techniques to protect the roadway during high water rather than grasses are established stream banks near roads and bridges over it or on to adjacent property
Measures Markers and Mileposts - December 31 2003 45
Measures Markers and Mileposts - December 31 2003 47
Environmental Compliance Assurance Annual Update WSDOT self-monitors for ldquonon-compliance eventsrdquo whether or not such events are taken up as formal ldquoviolationsrdquo by regulatory agencies or officials
Compliance History The Gray Notebook for March 31 2003 reported on WSDOTrsquos initial effort to track non-compliance events Data for 2001 and 2002 was obtained by interviewing project managers in December 2002 to gather an after-the-fact best estimate of the number and types of non-compliance events Since then WSDOT has systematically tracked non-compliance events for highway construction and maintenance programs and for operations of the Washington State Ferries (WSF)
How Are We Doing In 2003 WSDOT recorded 41 non-compliance events with 13 leading Non-Compliance Events to issuance by a regulatory agency of a formal Notice of Violation 2001-2003 (NOV) 45
40 In 2003 32 of 41 non-compliance events involved water quality 35
regulations as shown in the chart at right For 2003 the ldquootherrdquo category 30
includes three events associated with underground storage tank rules and 25
one event associated with an air quality violation 20
15
The increase in recorded highway program and WSF non-compliance 10
events from 2001 to 2003 is partially explained by an increased 5
0 emphasis on identifying non-compliance events Because 2003 is the 2001 2002
Fish Habitat OtherWetlands Water Quality first year that WSDOT has systematically tracked non-compliance events apples-to-apples comparison with previous years is not possible For more information about WSDOTrsquos Environmental
Compliance Assurance Procedure please see the The baseline data for 2003 of the number and type of events taking Gray Notebook for the quarter ending March 31 2003
place will help WSDOT staff develop compliance tools for the agency page 18
Source WSDOT Environmental Services OfficeUsing Non-Compliance Data WSF began systematizing data collection on petroleum product spills three years ago The data illustrated ongoing minor problems from hydraulic systems on transfer spans at WSF terminals Last winter WSF Terminal Maintenance began a program to improve inspection of transfer spans and quickly correct any problems This new emphasis includes training for terminal attendants to identify potential leaks in the bridge operation and to report potential leaks to Terminal Maintenance
For the three years since 2001 WSF terminals have had seven four and five hydraulic spills respectively The prevention actions instituted by Terminal Maintenance means that now more WSF employees are aware of and watching for potential problems
2003
Total Resulting Actual Notices
Total
Total
Resulting Actual Notices
Resulting Actual Notices
Beginning of Maintenance and Construction ECAP (Environmental Compliance Assurance Procedure)
Hydraulics system at the Anacortes Ferry Terminal
Integrated Vegetation Management Results
Please see Highway Maintenance IVM report on page 43 of this Gray Notebook
WSDOT also tracks compliance with herbicide and Non-Compliance Eventspesticide application laws covering the products and procedures used to maintain roadside and wetland 2001 2002 2003 mitigation sites The number of product applications in Number of WSDA 8 6 4 2003 went up 17 and the pounds of active ingredient Investigationswent up by 35 from the previous year The number of findings of fault notices from the Washington State Department of Agriculture (WSDA) remained steady at
Number of WSDA Findings of Fault
5 4 2
four Two notices involved overspray leaving the road right Number of Product 2271 3399 4091 of way and two were found not to have merit and dropped Applicationsby WSDA In 2003 WSDA issued two warning letters to WSDOT regarding the alleged injury to two privately owned conifer trees in the town of Loon Lake near Colville The
Total Pounds of Active Ingredient Applied
67156 120171 124290
trees tested positive for diuron that may have come from an earlier WSDOT roadside application of herbicides for total quantity of chemicals used
Measures Markers and Mileposts - December 31 2003 46
46 Measures Markers and Mileposts - December 31 2003
Monitoring Replacement Wetlands Annual UpdateTypes of Mitigation Two WSDOT mitigation bank sites currently provide advance compensation for unavoidable wetlands losses The Moses Lake Mitigation Bank provides five acres of enhanced wetland and about two acres of restored wetland The North Fork Newaukum Mitigation Bank provides 91 acres of enhanced wetland and one acre of restored wetland Since 2002 15 new replacement wetland sites (199 acres) have been added to the overall inventory of wetlands replacement acreage
Meeting Standards in 2003 In 2003 biologists monitored a total of 63 active replacement wetlands ranging from one to eight years in age Of these sites 21 had targets (success standards) to be met in 2003 Monitoring was conducted for 87 individual standards
Of the two sites that did not meet any standards due in 2003 one is in the middle of its planned monitoring period and had poor plant survival and too many weeds The site has been re-planted and because it is close to a river biological weed control is planned The second site is at the end of its planned monitoring period but has not developed into a wetland because it is too dry WSDOT staff are considering appropriate alternatives to achieve this environmental commitment
Completed Replacement Wetlands Successful sites have achieved reasonable ecological success and no longer need monitoring Unsuccessful sites have not met requirements and are ecologically unsuccessful
Reasonable ecological success was achieved on six more sites in 2003 bringing the total of completed sites since 1988 to 53 The total of sites judged successful in this group is 49 (267 acres) The four unsuccessful sites failed due to unpredicted or changed hydrology the most important parameter of wetland success WSDOT is considering options to meet the environmental commitments for these projects
For additional detail on monitoring replacement wetlands and pictures of the different types of projects see the Gray Notebook subject index at wwwwsdotwagovaccountabilitygraybookindexhtm environment and click on ldquoWetland Mitigation and Monitoringrdquo WSDOT has been mitigating for unavoidable wetlands loss with replacement wetlands for 15 years to address the statersquos Executive Order 89-10 which mandates that the actions of state agencies result in no net loss of wetlands Advance mitigation means building replacement wetlands before unavoidable impacts take place Monitoring and reporting on the status of replacement wetlands is critical to the success of the program as seen through the eyes of both the public and the resource protection agencies with whom agreement on these projects must be reached
WSDOT Replacement Wetlands 1988-2003
WSDOT Replacement Wetlands 1988-2003 Total Acreage of Wetland Projects 116 Sites 675 Acres
Olympia Tacoma
Seattle Spokane
Actively Monitoring
Monitoring Complete
Buffer An upland area Enhancement Improvements that protects a wetland from to an existing degraded wetland
126 Acres 119
Acres
189 Acres
181 Acres
60 Acres
adverse impacts (181 Acres to increase or augment wetland increased by 90 acres since function (189 Acres increased 2002) by 100 acres since 2002)
Restoration Re-establishes a wetland area andor function where wetlands previously existed but are no
Creation The establishment longer present (60 Acres of wetland area and functions increased by 3 acres since where none existed (126 Acres 2002) increased by 4 acres since 2002)
Preservation Protecting wetlands from future development ensures that valuable wetland functions continue to provide benefits (119 Acres increased by 2 acres since 2002)
Replacement Wetlands Success in 2003 Total Number of Sites 21
Meeting All WSDOT reported onStandards
22 Acres11
Acres
8 Acres
the status of sites5 Sites with standards to be
achieved in 2003 on a site-by-site
Meeting basis in the 2003Some Annual MonitoringStandards report For detailed14 Sites monitoring results visitMeeting No wwwwsdotwagov Standards environmentwetmon
2 Sites defaulthtm
Success Rate for Replacement Wetlands Success Rates for Replacement Wetlands with Completed MonitoringMonitoring Complete 100 Includes acreage
not yet designated 95 for mitigation credit
90
85 Source for all charts WSDOT Environmental
1988-2001 1988-2002 1988-2003 Services Office 80
Includes acreage not yet designated for mitigation credit Source WSDOT Environmental Services Office
Measures Markers and Mileposts - December 31 2003 47
Measures Markers and Mileposts - December 31 2003 49
Stormwater Treatment Facilities WSDOT routinely builds stormwater treatment facilities to Department of Ecology standard as a part of highway construction Stormwater treatment facilities reduce stormwater flows that cause flooding and harm fish habitat These treatment facilities also remove sediment metals nutrients and other pollutants from highway runoff
In response to municipal stormwater permit requirements WSDOT has tracked the number of new stormwater treatment facilities built in King Pierce Snohomish and Clark counties where about 40 percent of statewide highway construction has occurred since 1996 In the past seven years 300 treatment facilities (an average of 43 per year) have been built in those counties
Out of 1140 miles of highway within the four counties an estimated one percent of state highways have new stormwater treatment facilities constructed each year These treatment facilities help to mitigate and manage the impacts of stormwater runoff from our state highways
In addition to removing pollutants and reducing flooding this pond near I-5 milepost 96 protected a nearby wetland by trapping a 140-gallon accident-related diesel spill from the adjacent freeway
Ponds that infiltrate treated runoff reduce flooding in the winter and help maintain stream flows in the summer
Monitoring Water Quality Impacts for Construction Sites Annual Update In 2003 WSDOT completed its first year of construction site water quality sampling under a new statewide monitoring policy The policy requires sampling on at least 20 percent of all projects with substantial potential for water quality impacts The chart at right summarizes sampling results that compare water quality upstream and downstream from 12 projects Ninety-five percent of the samples met water quality standards for clarity
Of the 200 samples taken nine failed to meet standards The water became muddy on five of the projects because work had to be done in the water or very near the shore The other four projects experienced heavy rainfall ranging from 3frasl4 to 3 inches which overwhelmed the mandated design capacities of approved treatment facilities In all cases monitoring results prompted immediate corrective actions to regain compliance with water quality standards
Case Study Golden Harvest Creek Culvert ReplacementThe Golden Harvest Creek culvert replacement project on SR 21 near the town of Republic in eastern Washington illustrates the challenges associated with keeping sediment out of water when replacing culverts Diverting water around work areas is very effective but the installation and removal of diversions can briefly muddy a stream While removing an old culvert that blocked fish migration some dirt fell into the creek After the new culvert was in place the creek was re-directed into the new channel stranding some fish in the temporary bypass Workers entered the water and carefully moved the fish back into the creek The state standard for clarity of water was exceeded twice during construction but returned to normal within minutes each time
State Water Clarity Standards Compliance Number of Samples for 2003
45 Out of compliance In compliance
30
15
0 Apr May Jun Jul Aug Sep Oct Nov
Water Clarity Monitoring Golden Harvest Creek August 2003
64
25
20
15
10
5
0 5th 5th 6th 7th 12th 13th 14th 15th 18th 19th 20th 25th
Upstream Downstream
State Standard
Water was briefly muddied as workers moved fish back into the stream
Water was temporarily muddied as an old culvert was removed
Source for both charts WSDOT Environmental Services Office
Measures Markers and Mileposts - December 31 2003 48
48 Measures Markers and Mileposts - December 31 2003
Erosion Control Preparedness ndash Annual Update Erosion control is an important component of WSDOTrsquos program to protect the environment In addition to education careful planning and stringent contract requirements WSDOT routinely performs construction site inspections to verify the effectiveness of erosion control measures and makes improvements as needed In the fall of 2003 moderate and high-risk projects (20 in all) were inspected to determine how well they were prepared for the wet season and whether or not erosion led to any water quality violations site damage or delays
The October 2003 storm (see the September 30 2003 Gray Notebook Special Features) for example overwhelmed the treatment measures planned for the runoff from existing pavement An inspection revealed that dirty water was entering Taylor Creek
WSDOTrsquos Environmental Compliance Assurance Procedures were initiated and crews immediately addressed the situation the discharge of dirty water stopped and the incident was promptly reported to the Department of Ecology
Fall Assessment Results This table outlines how
Erosion control measures on SR 18 in the Maple Valley area
well prepared WSDOT was during fall 2003 compared to its level of preparation in 2002
Last year WSDOT identified areas where improvements in erosion control preparedness were needed One area in particular included ensuring that erosion control plans are always on site and up to date with current project conditions (a condition of environmental permitting) Specific actions were taken at statewide meetings and training sessions that
Erosion and Sediment Control Assessment Results 2002 2003 Status
Excellent Clearing limitssensitive area boundaries identified and respected by contractor
Utility trenches excavated in manner to reduce erosion risk Remove temporary erosion and sediment control measures when not needed
100 100 81
100 stable 100 stable 100 improved
Good
Contractor trained in proper use of erosionsediment control measures Sediment trapping measures installed prior to soil disturbing activities Control offsite erosion prevented by controlling flows Protect storm drains from sediment
100 90 87 74
95 decreased 90 stable 84 decreased 82 improved
Fair
If a storm hit at time of site visit water would meet state water quality standards If a storm hit at time of site visit adjacent property would be protected Effectiveness of measures installed to trap sediment Erosion control plans are on site and up to date for all WSDOT projects
86 83 96 56
80 decreased 80 decreased 78 decreased 75 improved
Poor
Manage construction site water in manner reducing sediment deposition risk Perform maintenance on temporary erosion and sediment control measures Construction access routes stabilized to prevent tracking of mud onto streets Effectiveness of measures installed to prevent erosion Temporary stormwater conveyance channels stabilized Protect cut and fill slopes from concentrated runoff Amount of disturbed soil actually covered with erosion control measures
100 70 98 91 90 67 65
71 decreased 70 stable 69 decreased 67 decreased 64 decreased 50 decreased 45 decreased
resulted in an improvement Source WSDOT Environmental Services Office of 19 percent
In 2003 the overall assessment increased in three areas while it remained the same or had little change in seven others WSDOTrsquos preparedness in the remaining eight areas decreased substantially creating an elevated risk to increased erosion when compared to last year The decrease in the bottom five areas in the ldquoPoorrdquo category are directly attributed to one or both of the following reasons (1) the extremely dry weather this fall extended large earthwork activities into the ldquowet seasonrdquo delaying soil cover practices and (2) drought conditions reduced effectiveness of late spring and early fall seeding applications
Summary and Next Steps An analysis of the 20 projects documents that 12 had no problems preventing erosion Projects experiencing minor problems increased by 16 percent from 2002 for a total of seven The minor problems were promptly corrected without regulatory agency involvement or high repair costs One project experienced major problems that involved one Notice of Violation The plan to improve performance on issues in the ldquoPoorrdquo to ldquoFairrdquo ranges includes increased technical assistance improved contract enforcement and increased emphasis in training
Measures Markers and Mileposts - December 31 2003 49
Measures Markers and Mileposts - December 31 2003 51
Incident Response Quarterly Update Program Totals WSDOT Incident Response Program provides roving service to clear roads and help drivers on Washingtonrsquos heavily traveled freeways Along with the WSDOT roving units non-WSDOT units provide contracted roving services These units include the Washington State Patrol (WSP) Cadets Registered Tow Truck Operators (RTTO) and a Motorist Assist Van (MAV)
Incident Reasons and Clearance Times Washington Statersquos target is to clear all incidents within 90 minutes During the fourth quarter 71 percent of major incidents were due to motor vehicle collisions Major incidents are however only two percent of all incidents on state roadways The most frequently occurring incidents which are likely to cause slowdowns during daily commutes are disabledabandoned vehicles or debris blocking traffic (82 percent of all incidents) During the fourth quarter 85 percent of incidents were cleared within 30 minutes and 47 percent were cleared in less than 10 minutes
Detection and Response by Roving Notification and Call-out The roving Incident Response Program is an effective means to keep traffic moving on freeways because the responders quickly detect incidents on the roadways During the fourth quarter 70 percent
Abandoned Vehicles (6)
Hazardous Materials and Fatal Collisions were less than 1 percent each
Incidents Lasting90+ Minutes Fatality
Disabled Vehicles Collisions (15)(9)Haz Mat Abandoned
(5) Vehicles Fire (2) (2) Debris
(4)
Incidents Lasting LessThan 15 Minutes
Non-Injury Other Collisions (4) (4)
Debris (10)
Abandoned Vehicles (27)
Disabled Vehicles 55
Injury Collisions Fatal Collisions Fire and Hazardous Materials were less than 1 percent each
Incidents Lasting 15 to 90Minutes Injury Collisions Fire(7) (1)Other (2)
Non-Injury (20)
Debris (5)
Disabled Vehicles 58
of all incidents were detected by roving units Roving units were notified of the remaining 30 percent of incidents Call-out units respond to severe incidents that occur Other
(2)
Non-Injury (32)
Injury Collisions (30)
outside roving zones or during non-roving hours There were 129 call-out responses during the fourth quarter which amounted to one percent of all the incidents responded by the IR program
Blocking versus Non-Blocking Locations The location and duration of an incident can impact traffic greatly Overall 67 percent of all incidents were on the shoulders and medians of roadways and did not block travel lanes Seventy percent of the incidents that were cleared in less than 30 minutes occurred within shouldersmedians and did not block travel lanes Of the major incidents lasting 90 minutes or more 80 percent were blocking travel lanes
Source for all charts WSDOT Traffic Office
Total Number of Responses by Month July 2002 to December 2003
5000
4500
4000
3500
3000
2500
2000
1500
1000
500
0
WSDOT IRT 2003 Contracted IRT Units 2003
2002
Jul Aug Sep Oct Nov Dec Jan Feb Mar Apr May Jun Jul
Average Clearance Time (in Minutes) January 2003 to December 2003
35
30
25
20
15
10
5
0
For All Incidents
For Incidents Lasting 15-90 Minutes
Jan Feb Mar Apr May Jun Jul Aug Sep Oct Nov Dec
Average Clearance Time for Incidents Lasting Over 90 Minutes 3-Year Comparison July 2001 to December 2003
300
250
200
150
100
50
0
July 2001 to June 2002
July 2002July to to June 2003December 2003
Jul Aug Sep Oct Nov Dec Jan Feb Mar Apr May Jun
Number of Incidents by Location and Clearance Time October 2003 to December 2003
Travel Lanes
ShoulderMedian
6000
5000
4000
3000
2000
1000
0 Less 10- 20- 30- 40- 50- 60- Over than lt20 lt30 lt40 lt50 lt60 lt90 90 10 min
Measures Markers and Mileposts - December 31 2003 50
50 Measures Markers and Mileposts - December 31 2003
Over 90 Minute Incidents There were 243 incidents lasting 90 minutes or longer during the fourth quarter of 2003 Incidents are located by dots on the map All incident records collected into the WSDOT Incident Tracking System (WITS) are being mapped for exact locations by state route and milepost for further analysis
Examples of Incidents Over 90 Minutes The following five incidents had the longest clearance times for the period between October 1 2003 and December 31 2003
bull October 1 ndash A fuel tanker truck overturned on I-5 in King County A single northbound lane was intermittently closed as multiple tow trucks responded to the scene to try and right the truck After multiple attempts the fuel was pumped from the truck so that it could be righted WSDOT Incident Response set up traffic control until recovery was complete 104 hours was required for Incident Response to clear the scene
bull October 8 ndash A semi truck traveling from westbound I-90 to northbound I-5 in Seattle drove off the elevated ramp falling approximately 30 feet and landing on the roadway below The tractor-trailer and cargo were demolished on impact necessitating a lengthy and technical clean up WSDOT Incident Response responded to the scene for traffic control and clean up 82 hours were required to clear the scene
bull October 12 ndash A loaded fuel tanker lost control on SR 9 just north of Wickersham in Whatcom County causing the rear trailer to roll on its side leaking fuel onto the shoulder and into the drainage system A detour route was set-up and a private contractor was called in to clean up the fuel spill WSDOT Incident Response assisted with traffic control and helped to clear debris from the roadway 164 hours were required to clear the scene
bull November 22 ndash A collision on US 97 near Goldendale involving a semi truck resulted in multiple lane closures as the scene was cleared WSDOT Incident Response set up traffic control and assisted other agencies Responders were able to keep traffic flowing throughout most of the incident 85 hours were required to clear the scene
bull December 9 ndash On SR 9 near the city of Sumas in Whatcom County a semi truck lost control and drove off of the roadway overturned spilling its load of lumber A detour was set-up for both northbound and southbound traffic WSDOT Incident Response performed traffic control and cleared debris 80 hours were required to clear the scene
Over 90 Minute Incidents for Quarter Four 2003
Seattle
Tacoma Olympia
Spokane
Vancouver
Everett
Service Actions The Incident Response roving program provides various services to motorists Traffic control is the most common service provided On an average day during the fourth quarter incident response personnel (all units) provided fuel to 14 vehicles cleared 12 pieces of debris changed 12 flat tires pushed 8 vehicles and performed 6 minor car repairs
Response Types October to December 2003
Total Incident Responses = 12341 bull 1717 Collisions (14) bull 10624 Non-Collisions (86)
Oct Nov Dec Fatality Collisions 6 11 10 Injury Collisions 147 147 134 Non-injury Collisions 377 417 468 Disabled Vehicles 2435 2120 2320 Abandoned Vehicles 787 705 784 Debris 420 330 290 Fire 24 17 27 Hazardous Materials 15 5 4 Other 132 139 149 Some non-collisions fall into more than one of the above categories
Service Actions Taken for Non-Collision Responses October to December 2003
Oct Nov Dec Traffic Control 425 370 429 Provided Fuel 324 286 269 Changed Flat Tire 323 255 220 Minor Repair 281 203 260 Pushed Vehicle 145 178 190 Towed Vehicle 160 115 144 Cleared Debris 90 84 84
Source WSDOT Traffic Office
Measures Markers and Mileposts - December 31 2003 51
Measures Markers and Mileposts - December 31 2003 53
Travel Information Quarterly Update
Since the launch of 5-1-1 Travel Information Service in July 2003 calls have increased by 74 percent (from 30478 to 52903) during the first six
month period
5-1-1 is a three-digit travel information number designated by the Federal Communications Commission (FCC) to provide around the clock traffic and road condition information
The 5-1-1 system lets the commuter check real-time traffic conditions using a cell phone and voice commands Although some users have experienced difficulty at times with the voice recognition aspect of this system it will continue to be enhanced as technology improves WSDOT is currently developing a plan to address these issues and make the 511 system more user-friendly
1-800-695-ROAD In December 2003 the total number of calls to 1-800-695-ROAD slightly decreased from the level in December 2002 However the total number of calls to Travel Information combining 1-800-695-ROAD and 5-1-1 calls together increased It is likely that 5-1-1 is replacing some of the calls to 1-800-695-ROAD
During the fourth quarter of 2003 the total number of calls to 1-800-695-ROAD and 5-1-1 increased by 786 percent with 481706 calls in 2003 versus 269675 calls in 2002
Travel Information Service Calls to 1-800 Road and 5-1-1 Calendar Year 2002-2003
250000
200000
150000
100000
50000
0 Jan Feb Mar Apr May Jun July Aug Sep Oct Nov Dec
2003 1-800-ROAD 2002 1-800-ROAD
Current Quarter 2003 5-1-1
On the Web Page views to Traveler information continue to increase They are up an average of 93 over the same quarter last year
Traveler Website Daily Usage Daily Average Page Views per Month (in millions)
Jan Feb Mar Apr May Jun Jul Aug Sep Oct Nov Dec 00
05
10
15
20
25
30
Current Quarter 2003 2002
Daily Average Page Views per Month Quarter 2002 and 2003 (in millions)
2002 2003 increase
October 08 17 113 November 13 30 131 December 21 29 38
In comparison to last yearrsquos numbers October saw an increase of 113 percent and November saw a 131 percent increase in daily page views
Highest One Day Total On November 19 2003 WSDOTrsquos web site received 68 million page views
bull 97 went to Traffic and Travel Information
bull 87 of those views originated from the WSDOT site ndash the remaining were from WSDOT through news and other sites such as KIRO KING and KOMO who used WSDOTrsquos cameras and flowmaps
WSDOT is also responding to the increasing number of requests for traffic and travel information to display on mobile devices Developments will be reported as they occur
Source WSDOT Communications Office
Source WSDOT Traffic Office
Measures Markers and Mileposts - December 31 2003 52
52 Measures Markers and Mileposts - December 31 2003
Options to Drive Alone Commuting Quarterly Update Park and Ride Lot Occupancy at WSDOT-Owned Sites in King County During the third quarter of calendar year 2003 occupancy of the 8500 parking spaces in the 32 WSDOT lots in King County averaged 73 percent
A three percent decrease in occupancy from the second quarter was due to summer seasonal declines in transit use About 50 percent of WSDOTrsquos park and ride lots in King County surpassed the target of 70 percent occupancy during the quarter Parked cars regularly exceeded maximum capacity in five lots
Highlights bull The new Issaquah Highlands Interim Park and Ride lot opened at the end of September This Sound Transit lot offers 103 parking spaces for commuters King County Metro is developing a permanent Park and Ride structure at Highland Dr NE and NE High St that is scheduled for completion in late 2005
bull The new 5-story Eastgate Park and Ride garage is scheduled for completion in June 2005
WSDOT-Owned King County Park and Ride Lots Percent of Capacity Used January 2001 through September 2003
100
90
80
70
60
50
Actual
Occupancy should exceed this target
Qtr 1 Qtr 2 Qtr 3 Qtr 4 Qtr 1 Qtr 2 Qtr 3 Qtr 4 Qtr 1 Qtr 2 Qtr 3 2001 2002 2003
Data availability has a lag of three months to allow the transit systems to collect and analyze the data Data for the fourth quarter of 2003 will be available in the next Gray Notebook
Source WSDOT Analysis of King County Metro data
bull Transit agencies throughout Puget Sound report persistent overcrowding at Park and Ride lots along major corridors due to lack of capacity and growing demand Efforts to increase transit and ridesharing are hampered by insufficient capacity at many commuter Park and Ride facilities
Vanpools in the Puget Sound Region Beginning with this issue of the Gray Notebook vanpool information and analysis will reflect a lag of three months in reporting data Reporting on the previous quarter will allow for more complete verification of the data During the third quarter the number of vanpools in operation in the region peaked in July (1376) followed by small decreases in August (1358) and September (1352) Despite the recent decrease the total number of vehicles on the road is up 35 percent since September 2002 when there were 1306 vanpools
Quarterly Regional Vanpool Highlights There are now 62 vanpool VanShare groups in operation in the Puget Sound region The VanShare program provides connections for employees between trains ferries park and ride lots and their work sites The VanShare program has proven to be very successful with Sounder trains on the Tacoma line (34 VanShare groups) King County Metro staff have begun marketing the VanShare program to employees riding between Everett and Seattle
bull Enhancements to regional Internet ridematch service in Puget Sound will provide a direct benefit to vanpools The improved service has the ability to ndash Provide up to 30 names on a match list request ndash Allow easier route planning with map viewing of Park amp Ride lots
Puget Sound Vanpool and VanShare Trends
1380
1360
1340
1320
1300
1280
1260
1240
Vanpools and VanShare
Vanpools Only
Jun Sep Dec Mar Jun Sep Dec Mar Jun Sep 2001 2002 2003
Data availability has a lag of three months to allow the transit systems to collect and analyze the data Data for the fourth quarter of 2003 will be available in the next Gray Notebook Source WSDOT Transportation Demand Management Office
ndash Increase user ability to select newest names on the match list ndash an effective tool for vanpool groups looking for riders ndash Provide promotional email message to users about their companyrsquos rideshare incentives along with an Employee Transportation Coordinator (ETC) contact phone number
Coming Next GNB Edition Commute Trip Reduction Task Force 2003 Report to the Washington State Legislature
Measures Markers and Mileposts - December 31 2003 53
Measures Markers and Mileposts - December 31 2003 55
Customer Feedback Washington State Ferries (WSF) collects customer complaints compliments comments and suggestions This information is recorded in the Automated Operating Support System (AOSS) database for measurement and action based on database cross tabulation and analysis
The charts show trends in the data for the last four fiscal years and the first two quarters of fiscal year 2004 (July 1 ndash December 31 2003)
Customer complaints were up 12 percent from the preceding quarter Complaints have increased for three consecutive quarters
WSF received 53 food service related complaints during the quarter This is only the second quarter in two and one-half years that food service has been in the top four comment types A total of 46 food complaints were received on the Edmonds-Kingston route during a two-week period in November when the MV Quinault was in service on this route The MV Quinault did not have galley service and is a much smaller vessel than the Jumbo Class ferry she was replacing
Washington State Ferries Quarterly Update
Vanpools exiting ferry on Bainbridge Island
N
20
305
16
160
3
525
104
104
104
20
20
525
3
101
1
Tacoma
Everett
Mt Vernon
Victoria
Bellingham
Port Angeles
Shelton
Seattle
5
5
5
5
90
405
Sidney
Shaw
Orcas
Keystone
Port Townsend
Clinton
Mukilteo
Kingston
FauntleroySouthworth
Vashon
Tahlequah
Point Defiance
Bainbridge Island
Edmonds
Anacortes
Bremerton
Friday Harbor
Lopez
2
101
AutoPassenger
Passenger-Only
Washington State Ferries Route Map
Total Customer Complaints Most Common Customer Comments Complaints per 100000 Customers Top Four Comment Types per 100000 Customers
15 12
10
10 08
06
5 04
02
0 0
Food Service
Loading Unloading
Compliments
On time performance
FY FY FY FY Qtr 1 Qtr 2 FY FY FY FY Qtr 1 Qtr 2 2000 2001 2002 2003 2004 2000 2001 2002 2003 2004
Does not include compliments or suggestions
Source for all charts WSDOT Ferries
Measures Markers and Mileposts - December 31 2003 54
54 Measures Markers and Mileposts - December 31 2003
On-Time Performance WSF has been collecting on-time performance data since June 2001 The table below compares WSF on-time performance across the system for the second quarters of fiscal year 2003 and 2004
Delays in the San Juan Islands are due primarily to construction activity at Shaw Island (see ldquoTrip Reliabilityrdquo comments below)
Improved on-time performance was experienced on WSFrsquos busiest route the FauntleroyndashVashonndashSouthworth route Approximately one quarter of all trips by WSF are made on this triangular route structure Fall schedule changes were developed with the Ferry Advisory Committees at Vashon and Southworth resulting in a schedule that increased on-time performance and allowed much needed late night maintenance on the three vessels serving this route
On-Time Trip Delivery Second Quarter Fiscal Year 2003 Second Quarter Fiscal Year 2004
All Trips All Trips A trip is considered toPercent of Average Percent of Average be on time if it departsTrips Within Delay From Trips Within Delay From
within ten minutes of theNumber 10 minutes Scheduled Number 10 Minutes Scheduled of Trips of Schedule Sailing Time of Trips of Schedule Sailing Time published scheduled
San Juan Domestic 5591 85 46 minutes sailing time Missed trips International Route
6443 94 27 minutes
EdmondsKingston 4564 94 31 minutes 4499 93 35 minutes1564 95 28 minutes
Passenger-Only SeattleVashon 1041 94 24 minutes 1003 98 22 minutes9534 91 43 minutes
KeystonePort Townsend 1852 96 24 minutes 1826 93 32 minutes6178 98 20 minutes
Point DefianceTahlequah 2708 93 40 minutes 2782 95 31 minutes4031 96 28 minutes
SeattleBremerton 2563 98 27 minutes 2451 97 31 minutes
152 85 48 minutes are not reported using this measure They
Passenger-Only SeattleBremerton
176 84 37 minutes
Service discontinued are included in the Trip Reliability measure
FauntleroyVashonSouthworth 9602 93 32 minutes
MukilteoClinton 6335 99 20 minutes
SeattleBainbridge Island 3901 98 26 minutes
Total 40654 94 30 minutes 38142 94 31 minutes
Trip Reliability WSF scheduled a total of 41678 trips during the 2nd quarter of fiscal year 2004 Of these trips 486 were missed Sixty-one percent (296) of the missed trips resulted from closures of the Shaw Island terminal during work on a $65 million preservation contract (see details on below) The chart below shows a system-wide average reliability index Assuming that a commuter worked 200 days per year and made 400 trips on WSF the statistical likelihood is that 47 ferry trips would be cancelled This rating represents a 178 decline in the reliability rating from the preceding quarter and a 140 decline in performance over the same period last year
Most Common Trip Cancellation CausesTrip Reliability Index Second Quarter Fiscal Year 2004Trip Reliability Index
rips per 400 SailingsMissed TMissed Trips per 400 Sailings
50
45
40
35
30
25
20 Other (7)15
Terminals (63)
Electrical (50)
Related Propulsion and Steering (43) Other (7)
Vessel
(19)
TidesWeather 10 (11) 5 WSF is undertaking a $65 million preservation contract at the Shaw Island
terminal this biennium Extensive pile driving and ldquoover waterrdquo work was accomplished this quarter to optimize environmental construction windows and seasonal traffic lulls WSF worked closely with the community on Shaw Island and throughout the San Juans to craft mitigation strategies
Cancelled Trips (Average Annual aimed at minimizing disruptions Trip Reliability Index Number = X 400
0
Total Scheduled Number of Because Shaw is a single slip facility closures were necessary duringTrips Commute Trips) regular service hours There was no service to Shaw Island during midday
from September 22 through November 7 One weekend closure was necessary September 27 and 28 Finally WSF completely shut down service from November 8 to November 11 All closures were coordinated
Source for all charts WSDOT Ferries with the community
Qtr 2Qtr 1 2004
FY FY FY FY FY 1999 2000 2001 2002 2003
Measures Markers and Mileposts - December 31 2003 55
Measures Markers and Mileposts - December 31 2003 57
WSF Construction Program ExpendituresCapital Expenditure Performance 2003-2005 Biennium 2nd Quarter Cumulative Dollars in Millions
WSDOT makes capital investments in the Ferry System Authorized vs Actual
through the Washington State Ferries Construction Program The program preserves existing and builds new ferry terminals and vessels supporting the Ferry System the capability to deliver responsible and reliable services WSF planned to spend $595 million over the period July-December 2003 Actual expenditures were $326 million bull Terminal Construction activities are under-spending
by $201 million The Port Townsend Preservation and Improvement projects are $63 million under the plan because project scopes have been revised and work deferred to later biennia Spending for property acquisition and design of the Edmonds Multimodal Terminal is $40 million behind due to a cautious approach to environmental issues and to negotiations with tribes System-wide projects are behind in spending by $25 million particularly in system planning activities and technical support to construction The Eagle Harbor Preservation project is $17 million behind in spending The Anacortes Multimodal Terminal project is $14 million behind in spending Both projects are experiencing slow starts The Shaw Terminal Preservation project is under-spending through December by $15 million and is expected to be completed under budget The Mukilteo Multimodal Terminal is underutilizing new law funds by $10 million This reflects WSFrsquos use of current law federal grants first before expending new law funds and a time lag between
Life Cycle Preservation Performance WSF terminals and vessels consist of several thousand components divided into Category 1 and Category 2 systems and structures Category 1 systems and structures are vital to the protection of people the environment and infrastructure All other terminal and vessel components are designated Category 2 Each component should be refurbished or replaced at the end of its life cycle to assure that WSF can provide responsible and reliable service
WSF has a work plan based on legislative funding to address the backlog of systems and structures that are past due as well as those constituting on-going deterioration of terminal and vessel components This biennium WSF plans to replace or refurbish 133 Category 1 systems and structures and 54 Category 2 components Twenty-three Category 1 systems and structures and two Category 2 items were completed through the second quarter
WSF uses life cycle ratings to measure the impact of its preservation activities The life cycle rating for Category 1 terminal and vessel components is projected to increase from 77 percent at the beginning of the biennium to 81 percent at the end of the biennium The life cycle rating for Category 2 components is projected to decline from 58 percent to 54 percent
Source for all charts WSDOT Ferries
$ 200
$ 150
$ 100
$ 50
$0
Authorized
Actual
Qtr 1 Qtr 2 Qtr 3 Qtr 4 Qtr 5 Qtr 6 Qtr 7 Qtr 8
consultant work and billings The Kingston Sewer Outfall project was paid for in the prior biennium freeing $08 million budgeted in the current biennium for other projects
bull Vessel Construction activities are under-spending by $62 million Variances include The MV Spokane is $55 million behind planned expenditures due to slower than expected billings for equipment procurement The MV Klahowya is $23 million behind because work is deferred to later in the biennium The MV Cathlamet is $17 million over plan because of unanticipated carry forward costs from the prior biennium
bull Emergency Repair activities are under-spending the plan by $06 million
Category 1 Terminal amp Vessel Systems amp Structures Preserved Cumulative Systems Preserved Planned vs Actual 2003-2005 Biennium Quarter 2 Ending December 31 2003
150
100
50
0 Qtr 1 Qtr 2 Qtr 3 Qtr 4 Qtr 5 Qtr 6 Qtr 7 Qtr 8
Planned
Actual
Category 2 Terminal amp Vessel Systems amp Structures Preserved Cumulative Systems Preserved Planned vs Actual 2003-2005 Biennium Quarter 2 Ending December 31 2003
60
50
40
30
20
10
0
Actual
Planned
Qtr 1 Qtr 2 Qtr 3 Qtr 4 Qtr 5 Qtr 6 Qtr 7 Qtr 8
Measures Markers and Mileposts - December 31 2003 56
56 Measures Markers and Mileposts - December 31 2003
Ridership and Revenues The Legislaturersquos Joint Task Force on Ferries (JTFF) comprised of legislators citizens ferry management and ferry workers was formed in 2000 The Task Force reviewed the workings of the WSF system and made recommendations including tariff increases designed to raise the farebox recovery rate to 80 percent of operating costs over six years The Transportation Commission instituted this recommendation and approved tariff increases of 20 percent in June 2001 and 125 percent in May 2002
In the fall of 2003 WSF management developed a new strategic plan aimed at balancing revenue generation necessary to capitalize the aging fleet The new plan reduced the size of the tariff increases for fiscal years 2003-2004 In the spring of 2003 the Transportation Commission adopted fare increases of five percent in May 2003 and an additional five percent in May 2004
As a result of the lower tariff increases ridership is not projected to fall as rapidly as anticipated in the original plan Repeating the pattern from fiscal year 2003 through the second quarter of fiscal year 2004 WSF has experienced slightly higher than projected ridership and revenues
Fiscal year to date ridership has exceeded the plan by four percent or 488000 riders Farebox revenues exceeded the plan by three percent or $2 million (Plan is based on June 2003 forecast)
Ferries Ridership by Month in Millions
3
2
1
0
FY 2004 Actuals
FY 2003 Actuals
FY 2004 Planned
Jul Aug Sept Oct Nov Dec Jan Feb Mar Apr May Jun
Ferries Farebox Revenues by Month Dollars in Millions
$15
$10
$5
$0
FY 2004 Planned
FY 2004 Actuals
FY 2003 Actuals
Jul Aug Sept Oct Nov Dec Jan Feb Mar Apr May Jun
Source for all charts WSDOT Ferries
Farebox Recovery Rate WSFWSF Annual Farebox Recovery RatesAnnual Farebox Recovery RatesFarebox recovery is the percent of annual operating and
maintenance costs recovered through tariffs and other non-tax 100revenues In line with WSFrsquos strategic plan farebox recovery
rates for fiscal year (FY) 2003 were up 54 percent from FY 2002 This is largely due to the May 2002 tariff increase 80
combined with cost saving initiatives A complex blend of cost increases also affected farebox recovery rates For example 60 total operating maintenance and support costs increased $44 million fuel costs increased $45 million insurance increased 40 $13 million and self insurance premiums and tort claims were up $16 million 20 Top performing individual routes in FY 2003 were Edmonds ndash Kingston (121 percent) Bainbridge ndash Seattle (110 percent) 0 and Mukilteo ndash Clinton (95 percent) On average auto routes 1998 recovered 76 percent of operating costs through the farebox while passenger only routes recovered 27 percent WSF also Source WSDOT Ferries
views each routersquos farebox recovery performance over several years as the trend is more important than a snapshot Extraordinary maintenance costs service interruptions or even route closures for terminal construction and many other isolated activities can dramatically effect farebox recovery during a one year period
1999 2000 2001 2002 2003
Measures Markers and Mileposts - December 31 2003 57
Measures Markers and Mileposts - December 31 2003 59
0
10000
20000
State-Supported Amtrak Cascades Service Quarterly Update
Ridership Ridership on state-supported Amtrak Cascades trains was 90664 in the fourth quarter of 2003 This was nearly identical to the fourth quarter of 2002 Trains that showed slight ridership increases during the quarter include the morning Seattle-Portland train both midday trains between these cities and the two Seattle-Bellingham trains The Seattle-Vancouver BC trains experienced the largest ridership decreases during the final quarter of 2003 contributing to a decline of over 8000 riders for the entire year on this route Factors that led to this decline include an increase in the number of cruise ship passengers departing from Seattle rather than Vancouver BC the overall effect of tourism and a lower exchange rate for the US dollar in Canada
For the entire year ridership was 385585 on state-supported trains also a slight increase over 2002 For all trains in the Amtrak Cascades system including those financially supported by the state of Oregon and Amtrak ridership was 589743 This represents the ninth consecutive year of ridership increases
Customer Satisfaction Amtrakrsquos Customer Satisfaction Index (CSI) is based on surveys of riders using the service The scores represent three-month rolling averages The CSI goal for Amtrak Cascades is 91 (out of 100) or better In the most recent survey period the overall score for Amtrak Cascades was 90 This score continues to be one of the highest in Amtrakrsquos national system and is nine points higher than the national average for routes of similar distance Survey responses showed high customer satisfaction with access to trip information prior to boarding the train the smooth and comfortable ride and the friendliness and helpfulness of train conductors Survey questions that produced lower scores include the quality and variety of food available on the trains and on-time performance
On-Time Performance On-time performance for state-supported Amtrak Cascades trains averaged 672 percent for the last three months of 2003 This was nearly eight points below the performance for the same period in 2002 and well below the goal of 80 percent set by WSDOT and Amtrak The primary cause of delays during the fourth quarter of 2003 was rail freight traffic congestion throughout the corridor and speed restrictions imposed by the railroad where rail line maintenance was taking place For the entire year on-time performance for Amtrak Cascades trains averaged 719 percent up slightly from 2002
Photo by Jeffrey T Schultz
State-Supported Amtrak Cascades Monthly Ridership Number of Passengers
50000
40000
30000
20000
10000
0
2003
2002
Jan Feb Mar Apr May Jun Jul Aug Sep Oct Nov Dec
Amtrak Cascades Annual Ridership 1994-2003
700000
600000
500000
400000
300000
200000
100000
0
Source for all charts Amtrak and WSDOT Rail Office
WashingtonAmtrak Trains
OregonAmtrak Trains
1994 1995 1996 1997 1998 1999 2000 2001 2002 2003
2003 data
50000
40000
30000
Measures Markers and Mileposts - December 31 2003 58
58 Measures Markers and Mileposts - December 31 2003
State-Supported Amtrak Cascades On-Time Performance 2003 vs 2002 Percent On-Time 2002 Average 708 2003 Average 719
Farebox Recovery The farebox recovery per train measures the percentage of total annual operating costs generated through ticket fares The average farebox recovery rate for the eight Amtrak Cascades trains financially supported by WSDOT was 399 percent in federal fiscal year (FFY) 2003 which was three points lower than in FFY 2002 This rate decline was driven by slightly lower revenues in FFY 2003 (-15 percent) when compared to the preceding year and a six percent increase in total operating expenses Costs that grew in FFY 2003 included diesel fuel and equipment insurance WSDOT and Amtrak hope that economic recovery in the Pacific Northwest will support higher revenue yields and improved farebox performance for Amtrak Cascades in 2004
King Street Station Update The renovation of King Street Station in downtown Seattle continued in the last quarter of 2003 Projects included final installation work on the temporary restrooms on the east side of the building construction work on replacement restrooms and removal of some interior walls on the first floor of the facility The elimination of these walls has exposed portions of the original interior walls and ceilings much of which has not been seen by visitors to the station in over 40 years The newly exposed sections inside the station will eventually become part of an enlarged passenger waiting area by Summer 2004
Washington Grain Train Update The Washington Grain Train carried 301 carloads of grain in the last quarter of 2003 This was 77 percent higher that in the final quarter of 2002 Quarterly growth was driven by slight increases in grain car usage by cooperatives near Moses Lake and Walla Walla and by the new grain train operating between Marshall and Pullman In 2003 the Washington Grain Train carried 1058 carloads a 21 percent increase over the total of 874 for 2002 The 2003 traffic increase was largely attributable to the third Washington Grain Train that began service in April 2003
The Washington Grain Train is a financially self-sustaining transportation program that supports the statersquos agricultural community while helping short line railroads maintain a sufficient customer base for long-term financial viability The 94-car fleet is jointly owned by WSDOT (76 cars) and the Port of Walla Walla (18 cars) The ports of Walla Walla Moses Lake and Whitman County share fleet management responsibilities
100
75
50
25
0
Jan Feb
Goal 80
2002
2003
Mar Apr May Jun Jul Aug Sep Oct Nov Dec
The on-time performance goal for Amtrak Cascades is 80 or better A train is considered on-time if it arrives at its final destination within 10 minutes or less of the scheduled arrival time
State Supported Amtrak Cascades Farebox Recovery Per Train
100
80
60
40
20
0
FFY 2002
FFY 2001
FFY 2003
Train 501 506 507 508 510 513 516 517 Number SEA PORT SEA PORT SEA BELL SEA VAN
to to to to to to to to PORT SEA PORT SEA VAN SEA BELL SEA
Source for above charts Amtrak and WSDOT Rail Office
Washington Grain Train Carloads Carloads Per Month 2002 vs 2003
2003 1058 carloads 140
120
100
80
60
40
20
0 Jan Feb Mar Apr May Jun Jul Aug Sep Oct Nov Dec
2002 874 carloads for 12 months
for 12 months
Source WSDOT Rail Office
Measures Markers and Mileposts - December 31 2003 59
Measures Markers and Mileposts - December 31 2003 61
Special Features Organic Recycling Earns Award for WSDOT The Washington Organic Recycling Council (WORC) presented WSDOT with an award December 11th for ldquofulfilling the vision of innovative application and specification of compost in Washington State roadside developmentrdquo Everyone benefits when organic materials are recycled into products of value These products improve the quality of landscape materials They have a positive impact in our environment by improving soil and plant health conserving water reducing erosion and reducing the use of fertilizers and pesticides They also replace other sources of wood for paper and fuel production
The award recognized in particular the work of the Roadside and Site Development Unit
WORC credits WSDOT with the use of one-third of the compost produced in the state For more information on good composting practices visit wwwcompostwashingtonorg
WSDOT Receives 2003 Federal Performance Letter ldquoReport Cardrdquo from FHWA Each year the Washington Division of the Federal Highway Administration (FHWA) audits WSDOTrsquos compliance with federal rules and regulations In summarizing this yearrsquos overall results the 2003 Performance Letter signed by FHWA Division Administrator Daniel M Mathis stated ldquoBased on the inspections reviews program evaluations and audits conducted in FY 2003 it is my finding that WSDOT has complied with federal laws and regulations in expending federal-aid highway funds allocated to the State of Washingtonrdquo
The performance letter evaluates WSDOTrsquos performance in 21 project and program areas such as bridge inspection standards financial billing environmental commitments and program efficiencies The letter called out a positive example of WSDOTrsquos work ldquoconstruction costs reported in the Gray Notebook are accurate and track closely with the data we have compiledrdquo In addition FHWA noted some areas for improvement such as ensuring all bridge inspections are completed within the 24 month frequency requirement using the pavement smoothness standard more consistently and establishing a tracking database to assure that environmental commitments are not affected by project changes
Mathis concluded the letter by commending WSDOT ldquofor continuing to strengthen your performance management initiatives such as the Gray Notebook your continued efforts in enhancing these tools provides further evidence that WSDOT is focused on being accountable for state and federal transportation fundingrdquo The 2003 Performance Letter can be found on-line at wwwwsdotwagovaccountabilityFHWA_FY2003_performancereportpdf
Global Positioning at WSDOT Surveyors have been using Global Positioning Systems (GPS) for years Most people are acquainted with non-survey level GPS technology as a navigational aid in their vehicles for wayfinding on a hike and even for keeping tabs on a child or family pet
WSDOT is using GPS to inventory the locations of roadway features such as signs guardrails pavement conditions trees utility devices drainage systems bridges traffic devices light poles etc It can accurately record the location of maintenance procedures such as mowing spraying or striping GPS is also being used for wetland delineation
In future editions of the Gray Notebook WSDOT will be presenting more detailed information on how GPS is being utilized
Measures Markers and Mileposts - December 31 2003 60
60 Measures Markers and Mileposts - December 31 2003
Highlights of Program Activities Quarter Ending December 31 2003
Project Starts Completions Updates bull WSDOT began on Dec 17 charging its contractor penalties of about $3000 per weekday for every day that opening of the State Route (SR) 290 Trent Avenue Bridge in Spokane was delayed Working days were re-negotiated and added to the projectrsquos contracted schedule in May 2003 when some unanticipated construction conditions were discovered At that time WSDOT approved a new schedule submitted by the contractor Ross Bros amp Co of Salem Oregon for a mid-December completion In late November it became apparent that Ross Bros was not going to be able to meet that schedule Penalties will be withheld from the final payment of the $89 million contract
bull The SR 519 (South Royal Brougham Way) project near the Seattle waterfront Safeco Field and Seahawk Stadium cleared a major hurdle when the old ramp from Fourth Avenue South to eastbound Interstate 90 was demolished The demolition contractors RW Rhine finished the task in 10 days This allowed WSDOT crews to re-open the vital I-5 and I-90 exits to Fourth Avenue South along with several major streets and intersections in the area The new structure created by this project separates vehicle pedestrian and rail traffic and provides a greater margin of safety for all
bull A series of late October storms dumped record setting rain severely damaging SR 20 in several locations causing the earliest closure of the North Cascades Highway ever Some of the worst damage occurred at Pyramid Creek (MP 126) and Ketchum Creek (MP 124) where large sections of roadway disappeared guardrail was left hanging and torrential rain rocks and dirt rendered large culverts useless WSDOTrsquos contractor Pacific Road and Bridge made progress stabilizing and rebuilding the roadway portions damaged by water and a primitive but passable road is now in place Crews will return next spring to lay down the final layer of asphalt However on November 9 a huge rockslide thundered down the mountainside just east of Newhalem slamming into Highway 20 taking out portions of roadway and cutting off access to the town of Diablo in Whatcom County URS Corporation the contractor monitoring and surveying the hillside has placed monitoring equipment on the unstable slope The instruments will indicate if the hillside is moving where it is moving and by how much This information is critical to keeping crews safe as they move in and out of the area
bull Crews installed several large steel girders across I-5 in Lynnwood in late November in association with the construction of Sound Transitrsquos Lynnwood Park amp Ride Direct Access Project The steel girders formed the skeleton of a new ramp over I-5 south of 44th Ave W which will provide direct access to and from the I-5 high-occupancy vehicle lanes for buses carpools and vanpools The project is currently on time and on budget with completion scheduled for fall 2005
bull SR 11 better known as Chuckanut Drive near Bellingham was closed after a large rockslide blocked the highway on Oct 29 Up to 60 tons of rock and debris came loose from the hillside above the roadway and crashed onto the highway blocking both lanes of traffic just south of Larrabee Park and north of Oyster Creek Crews worked seven days a week to stabilize the hillside to reopen the road to traffic on Nov 14
bull Crews on the SR 162 Voights Creek Bridge Replacement project near Orting are using some of the latest technology to protect the environment Because of the bridgersquos close proximity to a fish hatchery workers are using an oscillator to excavate the bridge shafts The oscillator twists as it presses the casing down into the ground minimizing disturbance to the surrounding environment In addition three 134-foot lsquosupergirdersrsquo will used to support the bridge deck In past bridge projects five to eight girders are typically used This new technology means less intrusion on water habitat and fewer maintenance requirements The $21 million replaces an aging wooden structure with a concrete bridge and realigns SR 162 to eliminate a high accident location Work is scheduled for spring 2004 completion
bull Three options to replace the SR 520 Floating Bridge are being explored They include a four-lane structure with shoulders wider lanes and a pedestrianbicycle lane a six-lane option that also adds a high-occupancy
SR 290 Trent Avenue Bridge as it appeared on Dec 4 The bridge had been slated for opening on Dec 16
Measures Markers and Mileposts - December 31 2003 61
Measures Markers and Mileposts - December 31 2003 63
vehicle lane in each direction and an eight-lane option that adds the elements of the six-lane and a general-purpose lane in each direction This fall WSDOT worked with divers to better identify objects on the floor of Lake Washington that could potentially affect the construction of a new bridge With at least $2 billion 15 years and a main connection across Lake Washington on the line WSDOT wanted to know all the impacts every step of the way to assure that time and taxpayer money are not wasted Preliminary side-scan sonar images showed three objects in the water some 1000 feet north of the current SR 520 Bridge Two objects appear to be barges The third object is a large boat estimated at 150 feet in length
bull WSDOTrsquos Aviation Division is participating in a project to install an irrigation system to support new turf growth at the Stehekin Airport near Lake Chelan Non-native plants growing on the airport runway have been the targets of a spray program paid for by the Aviation Division for years The National Park Service provided funding that allows the division to reseed the airport with a dense native grass to choke out the weeds About 20 pilot organizations volunteered to install the irrigation system The airportrsquos new turf will be ready for use next year and pilots will be able to operate from a smooth runway free of dust and gravel
bull Workers finished seismic retrofit work at the SR 20 Deception and Canoe Pass Bridges by installing 10000 bolts into the underside of the bridge decks The bolts connect the bridge decks to their supporting steel structures creating a connection that makes both bridges safer and more stable in the event of an earthquake Both bridges now meet current seismic codes
bull Just prior to the deluge of fall rains crews completed a $17 million paving project on SR 112 between the Makah Reservation and Hoko River Bridge in Clallam County Start of the job was delayed until August after young eagle fledglings near the project left their nest SR 112 was designated as a scenic highway in 2002 The highway terminates at Neah Bay on the northwest tip of the Olympic Peninsula and provides motorists access to one of the most remote areas of our state
Savings and Efficiencies bull A pilot project to compare the use of salt to the use of other anti-icing chemicals for improving winter driving conditions is being repeated An unusually mild winter weather in 2002-03 limited the amount of data collected and the initial study results did not show a clear-cut advantage to using one anti-icing product over another in all cases WSDOT is evaluating the use of rock salt and salt brine in comparison to other anti-icing chemicals to determine the effect on driving conditions corrosiveness to various types of metals impacts to the roadside environment and cost of snow and ice control This yearrsquos results will be combined with last yearrsquos for a complete report and made available to those who are interested
bull The National Association of State Aviation Officials (NASAO) named the WSDOTrsquos Aviation Division the ldquoMost Innovative Staterdquo of 2003 for developing an ldquoOn-line Pilot Registrationrdquo program The On-line Pilot Registration program began in January 2003 to improve customer service and streamline administrative processing WSDOT found that the improved service increased the number of pilots mechanics and aircraft owners who registered with the WSDOT Since the implementation of online registration revenues that support air search and rescue have increased more than $100000 Additionally over 4000 aviators have subscribed to the Aviation News Service which has improved communication between WSDOT Aviation and its customers
Rail bull The Federal Railroad Administration recently awarded $1 million to WSDOT for highway-rail grade crossing improvements The funds are designated for crossing improvements on the Pacific Northwest Rail Corridor in Cowlitz County and at several crossings between Marysville and Bellingham in Snohomish and Whatcom counties Washington is one of only ten states receiving funds The Pacific Northwest Rail Corridor extends 466 miles from Eugene Oregon via Portland and Seattle to Vancouver British Columbia
Materials for the airport project are barged across Lake Chelan
Measures Markers and Mileposts - December 31 2003 62
62 Measures Markers and Mileposts - December 31 2003
Public Transportation and Commute Trip Reduction bull WSDOT teamed up with local jurisdictions transit agencies and private companies to launch this yearrsquos Rideshare Weeks (Oct 13 ndash 24) an annual campaign encouraging commuters to incorporate carpooling vanpooling transit cycling and walking in their travel to work Flexing work hours and working from home or an alternate location also helped meet the campaignrsquos two major goals exposing commuters to their choices in transportation while saving space on the roads Rideshare Weeks was being featured in public service announcements donated by the Seattle Post-Intelligencer in radio spots in Puget Sound and Spokane and at worksites participating in the statersquos Commute Trip Reduction program WSDOT has coordinated with 16 public agencies to develop promotions and shared messaging For more information see wwwwsdotwagov partnerswsrorideshare bull On Tuesday October 21 WSDOT joined transportation providers at the Omak Senior Center to highlight new bus service in Okanogan County made possible through $460748 in state and federal public transportation grants WSDOT presented giant symbolic checks and a key for a new minibus to Colville Confederated Tribes Northwestern Trailways and Okanogan County Transportation
Awards and Recognition bull Linda Pierce of WSDOT Materials Lab and Steve Muench and Joe P Mahoney of the University of Washington have been awarded the national Premier Award sponsored by National Engineering Education Delivery System (NEEDS) for the new WSDOT Pavement Guide ndash Interactive The WSDOT Pavement Guide Interactive is now the official textbook for the primary pavement-oriented course in the UW Department of Civil and Environmental Engineering
bull WSDOT received the prestigious national leadership award from the Association for Commuter Transportation (ACT) for creating balanced transportation solutions that integrate commute options into highway planning projects in the Puget Sound region of Washington state WSDOT Transportation Demand Management (TDM) Resource Center has been heavily involved in research to determine ways to improve travel choices ndash such as vanpools carpools and bicycles ndash in transportation projects planning TDM focuses on reducing drive-alone auto trips by making other choices more available and attractive The ACT award recognizes that WSDOT is leading the way to incorporate alternatives to driving alone into new plans for transportation corridors such as State Route 520 and Interstate 405
bull WSDOT and the Department of General Administration received Governor Lockersquos Governorrsquos Award for Organizational Learning and Growth for the Deschutes Parkway Reconstruction Project The project was completed in October 2002 18 months after the Nisqually Earthquake destroyed major portions of Deschutes Parkway which surrounds Capitol Lake and links Tumwater to downtown Olympia RCI Construction Inc the project contractor contributed to an accelerated repair schedule and the project was completed many months earlier than first estimated and two months ahead of the contract schedule The completed project cost $698000 (16) less than the original engineerrsquos estimates Taxpayers saved an additional $525000 when a previously planned utility upgrade was completed at the same time as the road repairs instead of later This project changed the ways GA and WSDOT collaborate which is already saving money on other projects
Celebrations and Events bull Washington State Ferries (WSF) employees volunteered their time and skills to assist on the annual Special Peoples Holiday Cruise for the Puget Sound regionrsquos children and adults with special needs The event took place aboard the MV Puyallup and is sponsored by the Active Ferry Employees Charitable Trust (AFECT) The afternoon outing has been hosted by AFECT for almost 20 years No state funds are used The annual event is supported by donations of time and money including the Marine Corps Toys for Tots program Chevron Oil and Sodexho Corporation Many other local groups provide entertainment and support
bull WSDOT maintenance crews closed SR 410Chinook Pass on Monday Nov 17 and SR 123Cayuse Pass on Tuesday Nov 18 for the season due to heavy snowfall and snow slide danger Cayuse Pass connects Chinook Pass and White Pass at the east end of Mount Rainier National Park Cayuse and Chinook passes typically close for the season in November and reopen in April
bull Studded tires became legal in Washington on Saturday Nov 1 Studded tires are restricted in Washington due to the amount of wear and roadway damage they cause to state highways estimated at $10 million per year The tires are legal between November 1 and March 31 WSDOT is requesting legislative action to ban studded tires because of the damage and ruts they cause to highways and due to safety considerations Research shows that cars with studded tires take longer to stop than cars with other tires under most situations
Measures Markers and Mileposts - December 31 2003 63
Measures Markers and Mileposts - December 31 2003 65
Gray Notebook Subject Index
Edition Key 1 = Quarter 1 2001 2 = Quarter 2 2001 3 = Quarter 3 2001 4 = Quarter 4 2001 5 = Quarter 1 2002 6 = Quarter 2 2002 7 = Quarter 3 2002 8 = Quarter 4 2002 9 = Quarter 1 2003 10 = Quarter 2 2003 11 = Quarter 3 2003 12 = Quarter 4 2003
All editions can be accessed at wwwwsdotwagovaccountability
Topic Edition
Aviation Fuel Taxable Gallons 6Registrations of Pilots and Aircraft 6 10Training of Pilots and Mechanics 6
Benchmarks (RCW 4701012) Administrative Efficiency 9Transit Efficiency 9VMT per Capita 9
Bridge Conditions on State Highways Age of WSDOT Bridges 4Bridge Ratings (FHWA) Structurally Deficient and Functionally Obsolete 4Bridge Condition Ratings State Comparison 8Bridge Structural Condition Ratings 11Deck Protection Program Overview 4 5 8 11Deck Protection Program Planned vs Actual Projects 4 5 8 11Hood Canal Bridge Update 11Inspection Program 4 11Inventory of WSDOT Bridges 4 5 8 11Preservation Program Results 11Rehabilitation and Replacement Project Schedule 4 11Scour Mitigation 4 11Seismic Retrofit Program 1990-2020 Status 4Seismic Retrofit Program Planned vs Actual Projects 4 5 8 11Seismic Retrofit Program Top 10 Priority Bridges 4 8Steel Bridge Painting Planned vs Actual Projects 4 5 8 11Tacoma Narrows Bridge Update 8 9 10 11
Commute Trip Reduction Award for the Commute Trip Reduction Program 6 11Commute Mode Share in Washington State 1990 and 2000 7Commuting Trends at CTR Work Sites and Work Sites in General 4ldquoDrive Alonerdquo Commuting Rates State Comparison 6 7Eastgate Park and Ride Expansion 9Effectiveness of CTR Program (Biennial Results) 4Employer Participation Investment and Benefits 2Gasoline Consumption Per Capita (from Northwest Environment Watch) 7Park and Ride Lot Occupancy Rates Central Puget Sound 4Park and Ride Lot Occupancy Rates King County 3 5 6 7 8 9 10 11 12Park and Ride Lot Security 5Park and Ride Lot Puget Sound System 8Vanpool Operation in the Puget Sound Region 2 3 4 5 6 7 8 9 10 11 12Vanpooling Share of Daily Puget Sound Area VMT 2VanShare Trends 8 9 11 12
Congestion on State Highways Accidents on Interstate 405 2001 and 2002 9Benchmark Policy Goals for Congestion Analysis 5Congestion Measurement Principles 5 6Daily Vehicle Hours of Delay per Mile Sample Commutes Measured
by Delay Time of Day Distribution of Delay and Travel Rate Index 2 5Distribution of Traffic Between Freeways and Arterials 1999 to 2003 9Employment Puget Sound Region 9
Measures Markers and Mileposts - December 31 2003 64
64 Measures Markers and Mileposts - December 31 2003
Edition Key 1 = Quarter 1 2001 2 = Quarter 2 2001 3 = Quarter 3 2001 4 = Quarter 4 2001 5 = Quarter 1 2002 6 = Quarter 2 2002 7 = Quarter 3 2002 8 = Quarter 4 2002 9 = Quarter 1 2003 10 = Quarter 2 2003 11 = Quarter 3 2003 12 = Quarter 4 2003
All editions can be accessed at wwwwsdotwagovaccountability
Topic Edition Congestion on State Highways (continued)
Highway Improvements Can Improve Congestion 9Induction Loop Detectors 5Intelligent Transportation Systems in Washington State 5
2000 and 2003 9Traffic Speeds and Volumes on SR 520Traffic Volumes at Seven Locations in March 2000 to 2003 Average 9Traffic Volumes on Nine Puget Sound Region Corridors 5Travel Time Reliability 6 9Travel Time to Work Comparison State and County Rankings 5Travel Times on 11 Puget Sound Region Corridors 5 9Travel Times With and Without Incidents 6Typical Freeway Traffic Volume Trend 1993 to 2002 9
Construction Program for State Highways Advertisements by Subprogram Planned Actual amp Deferred 4 5CIPP Value of Advertised amp Deferred Projects by Subprogram 4 5Construction Program Cash Flow Planned vs Actual Expenditures 4 5 6 7 8 9 10 11 12Construction Program Delivery Planned vs Actual Advertisements 1 2 3 4 5 6 7 8 9 10 11 12Contracts Awarded Engineerrsquos Estimate to Award Amount 6 10Contracts Completed Final Cost to Award Amount 6 10Contracts Completed Final Cost to Engineerrsquos Estimate 6 10End-of-Season Highway Construction Project Evaluations 12FHWA Federal Performance Report Card 12Hood Canal Bridge Update 11 12Hot Mix Asphalt Pavement Delivery 3 5 7 9 11Lane Miles Added to State Highway System 1996-2001 2Safety Construction Program Planned vs Actual Advertisements 3 6 8 9 10 11 12Tacoma Narrows Bridge Update 8 9 10 11 12
Design Value Engineering 6 10
Environmental Stewardship Compost Use 7Construction Site Erosion and Runoff Protection 4 6 9 12ldquoEcology Embankmentrdquo Pollutant Removal 8Environmental Impact Statement (EIS) Tracking 9Environmental Compliance Assurance Tracking Violations 9 12Fish Passage Barriers 4Herbicide Usage Trends 5 8 12Organic Recycling Award for WSDOT 12Recycling Aluminum Signs 7Wetland Mitigation and Monitoring 5 9 12
Ferries (WSF) Capital Expenditure Performance Planned vs Actual 4 5 6 7 8 9 10 11 12Customer Comments 3 4 5 6 7 8 9 10 11 12Fare Comparison WSF to Other Auto Ferries 4Farebox Recovery Rate 5 12Farebox Recovery Comparison WSF to Other Auto Ferries and Transit 5Farebox Revenues by Month 3 4 5 6 7 8 9 10 11 12Life Cycle Preservation Performance Planned vs Actual 12On-Time Performance 3 4 5 6 7 8 9 10 11 12Operating Costs Comparison WSF to Other Ferry Systems 3Ridership by Month 3 4 5 6 7 8 9 10 11 12Trip Reliability Index and Trip Cancellation Causes 3 4 5 6 7 8 9 10 11 12
Measures Markers and Mileposts - December 31 2003 65
Measures Markers and Mileposts - December 31 2003 67
Edition Key 1 = Quarter 1 2001 2 = Quarter 2 2001 3 = Quarter 3 2001 4 = Quarter 4 2001 5 = Quarter 1 2002 6 = Quarter 2 2002 7 = Quarter 3 2002 8 = Quarter 4 2002 9 = Quarter 1 2003 10 = Quarter 2 2003 11 = Quarter 3 2003 12 = Quarter 4 2003
All editions can be accessed at wwwwsdotwagovaccountability
Topic Edition Maintenance of State Highways
Achievement of Biennial Maintenance Targets (MAP) 3 4 8 12Anti-Litter Campaign Update 5 11Costs of State Highway Maintenance 4Customer Satisfaction with WSDOT Highway Maintenance Activities 3Debris Pusher Maintenance Attachment 6Guidepost Driver 11Herbicide Usage Trends 5 8 12Highway Sign Bridges Planned vs Actual Repairs 3 4 6 8Highway Signs Number of Maintenance Actions 6 8Integrated Vegetation Management Update 5 12Litter Removal from State Highways 5 6 8 11Living Snow Fence on SR 25 9Mountain Pass Highway Closures 7 9Pavement Striping How Do They Paint the Stripes So Straight 6Pavement Striping Planned vs Actual Miles Painted 3 4 6 8Road Kill on State Highways 5Safety Rest Area Locations and Amenities 9Salt Pilot Project 7 10Snow and Ice Control Operations 4 7Survey on Pass Travel Conditions and Anti-Icer Use 2Survey on Safety Rest Areas 9Traffic Signals Annual Energy Costs and Incandescent Bulb Conversion 3Winter Overtime Hours and Snowfall Amount 7 9Winter Roadway Condition Level of Service and Anti-Icer Chemicals 9Winter Severity and Snow and Ice Operations Costs 9Vortex Generators 5
Pavement Conditions on State Highways ldquoDuerdquo Pavement Rehabilitation Needs 4 8Concrete Pavement Lane Miles by Age and Dowel Bar Retrofit Status 12Pavement Condition Trends 4 8 12Pavement Condition by Type 2Pavement Lane Miles Annual Vehicle Miles Traveled and Programmed Dollars 12Smoothness Rankings by State 4 8 12
Rail Freight Grain Train Carloads 5 6 7 8 9 11 12Grain Train Route Map 5 9Washington Fruit Express Car Loadings Per Week 5 8
Rail State-Supported Amtrak Cascades Service Amtrakrsquos Future 5 6 7 9Budget Update 10Capital Improvement Program and WSDOT Service Goals 2Customer Satisfaction 2 3 4 7 9 12 Farebox Recovery Percentage by Train 4 8 12Internet Reservations and Automated Ticketing 6Investment in Intercity Rail Comparison 5On-Time Performance 2 3 4 5 6 7 8 9 10 11 12Operating Costs 4Passenger Trips by Station 6Ridership by Month 2 3 4 5 6 7 8 9 10 11 12Ridership by Year Long-Term Trends 2 4 8Ridership Patterns by Segment (Seats Sold) 3Route Map Amtrak in Washington 6Station Update 11Vehicles Diverted Annually from Interstate 5 by Cascades 2
Measures Markers and Mileposts - December 31 2003 66
66 Measures Markers and Mileposts - December 31 2003
Edition Key 1 = Quarter 1 2001 2 = Quarter 2 2001 3 = Quarter 3 2001 4 = Quarter 4 2001 5 = Quarter 1 2002 6 = Quarter 2 2002 7 = Quarter 3 2002 8 = Quarter 4 2002 9 = Quarter 1 2003 10 = Quarter 2 2003 11 = Quarter 3 2003 12 = Quarter 4 2003
All editions can be accessed at wwwwsdotwagovaccountability
Topic Edition Safety on State Highways
Alcohol-Related Fatality Rate 12Before and After Collision Data for Highway Safety Improvement Projects 12Bicycle and Pedestrian Safety Federal Benchmark 9Bicyclist Fatality Rates State Comparison 9Cable Median Barrier Installation Before and After Collision Data 12Corridor Safety Program Results 8Driving Speeds on State Highways 4Fatal and Disabling Collisions Circumstances and Type 8Fatal and Disabling Collisions at Intersections Types of Collisions 9Fatal and Disabling Crashes and VMT percent change 3 7 11Fatalities Involving High Blood Alcohol Concentration State Comparison 7Fatality Rates State Highways All State Public Roads amp US 3 7 11Guardrail Retrofit Program 11High Accident Corridors and Locations by Region 4 High Accident Corridors and Locations Statewide 3Low Cost Safety Enhancement Program Planned vs Actual Projects 3 4 5Low Cost Safety Enhancement Program Sample Projects 4 6Pedestrian Fatality Rates State Comparison 8Pedestrian Factors in VehiclePedestrian Collisions 8Port Orchard Roundabout Before and After Collision and Injury Data 12Safety Construction Program Planned vs Actual Project Advertisements 3 6 7 8 9 10 11 12Safety Laws Booster Seats and Mandatory Seat Belts 5Safety Projects Completed This Quarter 7Seatbelt Use State Comparison 7 11Safe Routes to Schools 9 12
Traffic Operations on State Highways FHWA Self-Assessment 9Incident Response Calls Responded to by Region 2Incident Response Clearance Time Distribution 11 12Incident Response Clearance Times 2 3 4 5 8 9 10 11 12Incident Response Customer Comments 8Incident Response Economic Analysis 10Incident Response Non-Collision Response Types 8 9 10 11 12Incident Response Program Types of Responses Program Total 9 10 11 12Incident Response Program Types of Responses 15 to 90 Minute Incidents 9 10 11 12Incident Response Program Types of Responses Over 90 Minute Incidents 9 10 11 12Incident Response Service Actions Taken 7 10 11 12Incident Response Teams Go to the Olympics 5Incident Response Teams Location and Type 7Incident Response Timeline 6Incident Response Times 2 3 4 5Incident Response Total Number of Responses by Month 7 8 9 10 11 12Incidents with Clearance Times Over 90 Minutes 6 7 8 9 10 11 12Intelligent Transportation Systems in Washington State 5Joint Operations Policy Statement between WSDOT
and Washington State Patrol 5Service Patrol Contacts 3 4Spokane Interstate 90 Peak Hour Roving Service Patrol Pilot 5
Traveler Information Award for Traveler Information Web Site 11Calls to 1-800-695-ROAD and 5-1-1 8 9 10 11 12Camera Views 8Evaluation Survey 10Web Site Feedback 8 9Web Site Usage 7 8 9 10 11 12
Measures Markers and Mileposts - December 31 2003 67
Edition Key 1 = Quarter 1 2001 2 = Quarter 2 2001 3 = Quarter 3 2001 4 = Quarter 4 2001 5 = Quarter 1 2002 6 = Quarter 2 2002 7 = Quarter 3 2002 8 = Quarter 4 2002 9 = Quarter 1 2003 10 = Quarter 2 2003 11 = Quarter 3 2003 12 = Quarter 4 2003
All editions can be accessed at wwwwsdotwagovaccountability
Topic Edition Truck Freight
Cross Border Truck Volumes 6 10Freight Routes and Border Crossings in Washington 6 10Freight Shipments To From and Within Washington 10Impediments to Truck Shipping Bridges with Posted Weight Restrictions 6Improvement Projects with Freight Benefits 10Intelligent Transportation Systems Use for Trucks 6 10Managing Over-Sized Truck Loads 6OsoyoosOroville Border Facts 10Overdimensional Trucking Permits 6Revenue Prorated to Washington for Trucks in Interstate Use 6 10Truck Registrations in Washington 6Truck Share of Total Daily Vehicle Volumes 6
Workforce Accident Prevention Activities 3 4 5 6 7 8 9 10 11 12Ferry Vessel Workers Recordable Injuries 2 3 4 5 6 7 8 9 10 11 12Highway Engineer Workers Recordable Injuries 2 3 4 6 7 8 9 10 11 12Highway Maintenance Workers Recordable Injuries 1 2 3 4 5 6 7 8 9 10 11 12Highway Maintenance Workers Safety Training 5 6 7 8 9 10 11 12Human Resources Training for all WSDOT Employees 7 8 9 10 11 12North American Association of Transportation Safety and Health Officials Meeting 3Workforce Levels 5 6 7 8 9 10 11 12
Measures Markers and Mileposts - December 31 2003 68
68 Measures Markers and Mileposts - December 31 2003
Americans with Disabilities Act (ADA) InformationPersons with disabilities may request this information be prepared and
supplied in alternate formats by calling the Washington State Department of Transportation ADA Accommodation Hotline collect (206) 389-2839
Persons with hearing impairments may access Washington State Telecommunications Relay Service
at TTY 1-800-833-6388 Tele-Braille 1-800-833-6385 Voice 1-800-833-6384 and ask to be connected to (360) 705-7097
Civil Rights Act of 1964 Title VI Statement to Public Washington State Department of Transportation (WSDOT) hereby
gives public notice that it is the policy of the department to assure full compliance with Title VI of the Civil Rights Act of 1964 the Civil Rights
Restoration Act of 1987 and related statutes and regulations in all programs and activities Persons wishing information may call the WSDOT
Office of Equal Opportunity at (360) 705-7098
Other WSDOT Information Available The Washington State Department of Transportation has a vast amount
of traveler information available (including Puget Sound area traffic mountain pass reports highway closures ferry schedules and more)
Call the WSDOT statewide toll-free number 1-800-695-ROADIn the Seattle area (206) DOT-HIWY [368-4499]
For additional information about highway traffic flow and cameras ferry routes and schedules Amtrak Cascades rail and other transportation
operations as well as WSDOT programs and projects visitwwwwsdotwagov
For this or a previous edition of the Gray Notebook visit wwwwsdotwagovaccountability
0401-0004
- Cover
- Credits
- Table of Contents
- Beige Pages
-
- Project Reporting on the 2003 Transportation Funding Package
- Current Project Highlights and Accomplishments
- Project Delivery
- Financial Information
- Program Management Information
-
- Worker Safety Quarterly Update
- Workforce Levels and Employee Training Quarterly Update
- Highway Construction Program Quarterly Update
- Tacoma Narrows Bridge Project Update
- Hood Canal Bridge Project Update
- Highway Safety Improvement Projects Quarterly Update
- Asset Management Pavement Assessment Annual Update
- Highway Maintenance Annual Update
- Environmental Programs
- Incident Response Quarterly Update
- Traveler Information Quarterly Update
- Options to Drive Alone Commuting Quarterly Update
- Washington State Ferries Quarterly Update
- State-Supported Amtrak Cascades Service Quarterly Update
- Special Features
- Highlights of Program Activities
- Gray Notebook Subject Index
-

Measures Markers and Mileposts The Gray Notebook for the quarter ending December 31 2003
12th EditionPublished February 19 2004
Contents
Project Reporting on the 2003 Transportation Funding Package 1Project Reporting1Current Project Highlights and Accomplishments3Contract Advertising and Awards3Project Completions and Other Highlights 5Project Delivery8Proposed Adjustments to Delivery Planning8Opportunities and Options for Legislative Consideration 11ldquoWatch Listrdquo12Financial Information 18Revenue Forecasts18Bond Sales 19Financial Plans for Accounts19Program Management Information 22Management Information Systems and Needs22Right of Way Acquisition22Utilities Relocation23Environmental Documentation Review Permitting and Compliance23Consultant Utilization 24Construction Employment Information 25Construction Safety Information25
Worker Safety Quarterly Update 27Injury rates for WSDOTrsquos highway engineering highway maintenance and ferry vessel workers
Workforce Levels and Employee Training Quarterly Update 28The size of WSDOTrsquos permanent full-time workforce and employee training needs
Highway Construction Program Quarterly Update 29Construction program delivery examples of deferred and advertised projects cash flow safety improvement program delivery and WSDOTrsquos third annual construction project evaluations
Tacoma Narrows Bridge Project Update 33Hood Canal Bridge Project Update 34Highway Safety Quarterly Update 35Before and after collision data for safety improvement projects collision reduction from cable median barrier installation alcohol-related fatality rate Safe Routes to Schools and collision reduction from installation of a roundabout in Port Orchard
Asset Management Pavement Assessment Annual Update 39Pavement condition trends extent and use of various pavement types rating pavement conditions and 2002 state pavement smoothness comparison
Highway Maintenance Annual Update 42Biennial Maintenance Targets (MAP)42Percentage of legislatively funded targets achieved from 1998 to 2003 Integrated Vegetation Management (IVM) 43Herbicide use trends the Clallam County IVM Plan IVM plan implementation schedule and the US District Court January 2004 ruling
Environmental Programs Annual Update 45Environmental Management System (EMS)45Environmental Compliance Assurance 46Non-compliance events and resulting actual notices IVM non-compliance events Monitoring Replacement Wetlands47Total acreage of wetland replacement projects by type sites meeting success standards in 2003 success rate for wetlands that have completed monitoring Stormwater Treatment Facilities 48Monitoring Water Quality 48State water clarity standards compliance Golden Harvest Creek culvert replacement case study Erosion Control Preparedness49Fall erosion and sediment control assessment results
Incident Response Quarterly Update 50Number and types of responses average clearance times incidents with clearance times over 90 minutes and service actions taken
Travel Information Quarterly Update 52Number of calls to 1-800-695-ROAD and 511 and Web site usage
Options to Drive Alone Commuting Quarterly Update 53Puget Sound vanpool use and park and ride lot occupancy trends
Measures Markers and Mileposts - December 31 2003 27
Contents (continued)
Washington State Ferries Quarterly Update 54Customer comments on-time performance trip reliability capital expenditure performance life cycle preservation performance ridership and farebox revenues and annual farebox recovery rates
State-Supported Amtrak Cascades Service Quarterly Update 58Monthly and annual ridership on-time performance farebox recovery and a King Street Station update Washington Grain Train Update 59Grain Train carloads
Special Features 60Organic Recycling Earns Award for WSDOT 60WSDOT Receives Federal PerformanceReport Card 60Global Positioning at WSDOT 60
Highlights of Program Activities 61A snapshot of WSDOTrsquos activities during the quarter including project starts completions and updates savings and efficiencies rail public transportation and commute trip reduction awards and recognition and celebrations and events
Gray Notebook Subject Index 64Where to find every performance measure ever published in the Gray Notebook via electronic access
Project Reporting on the 2003 Transportation Funding Package
Introduction
WSDOT is preparing extensive information for legislators state and local officials interested citizens and the press on the progress of the program funded by the 2003 Transportation Funding Package Much of the detailed information is regularly presented and maintained on-line on the WSDOT website The Gray Notebook in these special pages known as the Beige Pages highlights each quarterrsquos progress and reports on financial and other program management topics as well as detailed information on key projects
The Beige Pages for this quarter are organized in the following manner
Project Reporting Current Project Highlights and Accomplishments Project Delivery Financial Information Program Management Information
This quarterly report represents a work in progress that will be expanded and refined as more and more projects approach or enter into construction We welcome suggestions and inquiries that can help us strengthen this project delivery and accountability reporting
Project Reporting Project reporting uses several different tools including the Gray Notebook web-based Project Pages and Quarterly Project Reports (QPR) A Project Page will be created for all major WSDOT projects whereas the QPRs will be created for Nickel funded projects of the 2003 funding package (See also Financial Information)
Navigation to the Home Page and the Project Pages
WSDOTrsquos home page can be found at wwwwsdotwagov
The Home Page (shown at right) has several links that allow access to the individual Project Pages through the Accountability navigation bar which provides access to ldquohot linksrdquo found in the on-line version of the Gray Notebook and the Projects navigation bar (which accesses a list of all WSDOT projects)
Project Pages for several of the largest projects are directly linked to the Home Page under the Projects navigation bar Project pages can also be accessed from any WSDOT web page by clicking on the ldquoprojectsrdquo tab at the top of every page
Beige Pages - Measures Markers and Mileposts - December 31 2003 1
Beige Pages - Measures Markers and Mileposts - December 31 2003 3
Roadmap to On-line Project Information The diagram below is a roadmap to the information found on-line The on-line version of the Gray Notebook as well as the Home Page will have ldquohot linksrdquo to the individual Project Pages
Gray Notebook
Home Page
Project Information Roadmap
Project Page Project Pages will report on all WSDOT 2003 Transportation Fund projects Project Pages provide detailed information that is updated regularly
bull Overall Project Vision bull Financial Table bull Funding Components bull Roll-up Milestones bull Roll-up Cash Flow bull Contact Information bull Maps and Links
bull Highlights bull Milestones bull Status Description bull Problem Statement bull Risk Challenges bull Project CostsCash Flow bull Contact Information
QPR Quarterly Project Reports will summarize quarterly activities
Project Pages
Project Pages contain information on all aspects of a specific project An existing Project Page is shown at right
Project Pages provide details on overall project vision funding components financial tables milestones status description problem discussions risk challenges forecasting maps photos links and more
WSDOT has approximately 140 Project Pages that are currently providing on-line updates
A summary of the information found on a Project Page will be provided in a Quarterly Project Report (QPR) that WSDOT anticipates will be accessible through a link on the Project Page
Project pages are to the best of WSDOTrsquos ability regularly updated
Project pages can be found at wwwwsdotwagovprojects
Beige Pages - Measures Markers and Mileposts - December 31 2003 2
2 Beige Pages - Measures Markers and Mileposts - December 31 2003
Current Project Highlights and Accomplishments This is WSDOTrsquos third report of quarterly developments in the delivery of the program of projects under the 2003 Transportation Funding Package
The following project information is gathered from a variety of sources within WSDOT and is principally the responsibility of the various regional administrators and their project teams As a regular part of its project management and accountability strategy for the legislaturersquos 2003 Transportation Funding Package a team of senior WSDOT managers from Olympia meets in each region each quarter to perform due diligence on progress and status for each project and to offer assistance support and coordination of issues or problems arising with any project This process also facilitates the ability of headquarters staff to discuss project status with members and staff of the House and Senate and to report from first hand knowledge about the projects to the Transportation Commission
Contract Advertising and Awards
2003 Transportation Funding Package (ldquoNickel Fundsrdquo) Nine projects were planned to be advertised this quarter Seven of these projects were advertised as planned One project was advanced for advertisement Two projects were deferred for later advertisement
Projects Advertised as Planned
SR 9SR 528 Intersection ndash Signal
This project went to ad October 20 2003 The construction is now starting and the project is expected to proceed on schedule
SR 16 HOV Improvements between Olympic View Drive and Union Ave
This project consists of three construction phases The first contract 6th AvenuePearl Street (SR 16) to Jackson Avenue was advertised to bidders on schedule in mid-November 2003 with this first phase construction to be awarded in mid-January 2004 This construction phase will widen SR 16 to prepare for HOV lanes provide a new trail for bikes and pedestrians and rehabilitate the pavement on SR 16 mainline to accommodate traffic switches needed for phase 2 of the project The contractor will begin grading work in Spring 2004 and is expected to complete its work in Winter 2004
US 97A Entiat Park Entrance - Turn Lanes
This project was advertised on schedule and was awarded on December 15 2003 This project was combined with a ldquonon-nickelrdquo funded roadway preservation project US 97AWenatchee North - Paving Combining this project resulted in a cost savings of $80000 The contractor will begin construction in April 2004 and is expected to be completed in July 2004
SR 124 East Jct SR 12 ndash Reconstruction
This project improves safety on SR 124 east of Pasco by realigning a horizontal curve and widening the lanes and shoulders The contract was advertised for bids on December 8 2003 meeting the schedule to proceed to bid opening on January 14 2004 The improvements are scheduled be open to traffic by summer 2004
SR 161 234th Street to 204th Street E
This project consists of two construction phases The first contract 234th Street East to 204th Street East was advertised to bidders in early November 2003 and awarded to the low bid contractor on December 22 2003 This construction phase will widen SR 161 from one lane to two lanes in each direction The contractor will begin grading work on the new highway in Spring 2004 and this phase is expected to be completed in July 2006
Beige Pages - Measures Markers and Mileposts - December 31 2003 3
Beige Pages - Measures Markers and Mileposts - December 31 2003 5
SR 203 NE 124thNovelty Rd Vic
The project was advertised on schedule However the total project cost has increased by approximately $900000 due to additional right of way and preliminary engineering costs to accommodate King Countyrsquos strict flood plain ordinance This project is funded with pre-existing funds the 2003 Transportation Funding Package and King County and Developer contributions $254000 of the cost increase will have to be accommodated from the 2003 Transportation Funding Package
US 395 Kennewick Variable Message Sign
This project improves safety on US 395 by installing a variable message sign camera and traffic sensor north of the Blue Bridge to warn southbound traffic of congestion and accidents ahead The contract was advertised for bids on schedule on December 1 2003 The bid opening is scheduled for January 14 2004 and the improvements should be placed in use for traffic by summer 2004
Project Advanced for Advertisement
SR 527 132nd SE to 112TH SE (Additional Lanes)
The advertisement date was advanced from March 2005 to December 2003 to coordinate with the availability of funds planned for the project from other sources avoid redesign for changes in stormwater treatment requirements and meet a commitment to Boeing The contract award date is February 25 2004
Projects Deferred for Later Advertisement
SR7SR 507 to SR 512 ndash Safety
The December 2003 contract advertisement date for this project has been delayed until obstacles in right of way acquisition can be cleared WSDOT believed that right of way would be obtained from property owners for a December ad date However the department has received 18 requests for adjudicative hearings from property owners adjacent to the project Additional time will be required to prepare detailed surveys title searches and coordinate scheduling with the Attorney Generalrsquos Office for each of the hearings WSDOT is focused on completing negotiations with the property owners and anticipates advertising the project in spring 2004 with construction starting no later than the summer of 2004
SR 522I-5 to SR 405 Multi-Modal Project
To take advantage of coordinating work with Lake Forest Park in conjunction with the needs of WSDOT the advertisement date would slip from winter 2003 to spring 2006 The 2003 Transportation Funding Package provided the entire project funding in the construction phase The changes will result in shifting $2 million in expenditures from the 03-05 to 05-07 biennium This project is part of an integrated program of corridor improvements where WSDOT will coordinate portions of this project with other improvements which will be funded and constructed by local municipalities such as Seattle Kenmore Lake Forest Park and Bothell
Beige Pages - Measures Markers and Mileposts - December 31 2003 4
4 Beige Pages - Measures Markers and Mileposts - December 31 2003
Project Completions and Other Highlights
Construction Highlights
Several of the highway and rail projects funded by the Nickel Account are now in construction More details can be found in the respective on-line Project Pages at wwwwsdotwagovprojects
Highway Construction Program
I-5 Widen Each Direction From Salmon Creek to I-205
The contractor is currently constructing retaining walls necessary for the widening of the southbound lanes Work is continuing on the temporary widening using a detour bridge in preparation for a traffic shift that will allow construction of the northbound lanes The traffic shift is expected to occur in May 2004 The construction schedule identifies the first weekend closure to demolish the existing NE 129th St structure on the weekend of January 31 2004 The new NE 129th St structure is scheduled to be completed in five months
I-90 Build Lanes from Argonne to Sullivan Road
The contractor met the November 1 2003 milestone to have the temporary westbound lanes constructed and open to traffic Although the project was suspended October 31 2003 for the winter work is continuing on minor items such as drainage ponds Road work will restart as soon as weather conditions permit
I-90 Highline Canal to Elk Heights ndash Truck Passing Lanes
This project constructs a truck climbingpassing lane on eastbound I-90 east of the Indian John Hill Rest Area Work on the project was suspended for the winter on November 20 2003 due to snow and cold temperatures Prior to suspending work the contractor had completed clearing the land in preparation for the widening of the roadway Ninety percent of the embankment excavation and drainage has been completed The left side bridge rail replacement on the Highline Canal bridge is complete To date project completion status is at about 30 Work will resume as weather conditions permit
I-90 Ryegrass Summit to Vantage ndash Truck Passing Lanes
This project constructs a truck climbingpassing lane on westbound I-90 from Vantage to the top of Ryegrass Summit Due to winter conditions work by the contractor was suspended on November 14 2003 Nearly one mile of the additional lane and modifications to the Ryegrass Rest Area ramps are completed and already open to traffic WSDOT survey crews will continue to work preparing for the next construction season as weather permits It is anticipated that the contractor will resume work in March 2004
SR 500 NE 112th Avenue Interchange
This project constructs a new interchange on SR500 at NE 112th AvenueGher Road All utility relocations are now complete and traffic was shifted to temporary lanes during a weekend closure on November 2 2003 (one day ahead of schedule) The bridge footings and columns have been constructed as planned for the eastbound ldquofly-overrdquo bridge with girder placement expected to occur in a three night sequence in mid January 2004 The placement of the noise barrier along the I-205 ramp has started with a scheduled completion of April 2004
Beige Pages - Measures Markers and Mileposts - December 31 2003 5
Beige Pages - Measures Markers and Mileposts - December 31 2003 7
Other Capital Programs
Purchase Oregon Train Set
A purchase agreement to complete this important rail rolling stock acquisition project in the 2003 Transportation Funding Package was executed between WSDOT and Talgo Inc on November 26 2003 Talgo will now paint the outside of the cars to match those already in the fleet The purchase will allow for additional rail passenger service between Seattle and Portland upon completion of track improvements
Tacoma RMDRR Morton Line Repairs ndash Phase 2
This project will complete the necessary repairs to the rail line between Frederickson and Morton to restore rail service interrupted by the 1996 flood Construction of a portion of this project for immediately needed repairs began in July 2003 and was completed in mid-December 2003 The remainder of the construction project will be accomplished under separate agreement with the City of Tacoma (owner) scheduled to begin in early 2004 It is anticipated that the entire project will be completed before the end of the current biennium
Highlights of Projects Ready for Advertisement for 2004 Construction Season
Five of the highway projects in the 2003 Transportation Funding Package are scheduled for advertisement in the two quarters for January 1 2004 to June 30 2004 (the 3rd and 4th quarter of the 03-05 biennium) More details can be found in the respective on-line Project Pages at wsdotwagovprojects The status of these projects is described below Two projects that were scheduled for advertisement during this time frame were deferred to future quarters (the status of these projects are described below)
I-5 2nd Street Bridge (ad date 452004)
The current proposal is to assist traffic flow by reducing construction from two seasons to one No change in total project cost is anticipated The project is expected to be advertised as scheduled
SR7SR 507 to SR 512 ndash Safety (ad date 532004)
The ad date for this project in December 2003 was not met because of complications that arose in the right of way taking May 2004 is the rescheduled ad date that WSDOT hopes to meet if negotiations with property owners can be completed in time
I-90 Cle Elum River Bridge (ad date 31504)
Environmental documentation is complete and approximately 80 of the design is finished The scheduled advertisement date is expected to be met and pre-construction start date is expected to be May 2004
SR 304SR 3 to Bremerton Ferry Terminal (ad date 21704)
This project reconstructs and widens the existing roadway It will add HOV lanes to increase traffic movement The City of Bremerton is the lead agency for this project
WSDOTrsquos role is primarily to assure the administration of the funding provided for in the 2003 Transportation Funding Package WSDOTrsquos expectation is that the City of Bremerton will advance the projectrsquos scheduled advertisement date The estimated construction completion date is June 2006
SR 509 Design amp Critical Right-of Way (ad date 672004)
Construction funds are being transferred to the City of SeaTac which is the lead agency on this phase of the project Environmental permitting and stormwater designs are being developed by WSDOT and are on track to support the scheduled ad date and budget WSDOT expects that the City of SeaTac will meet the scheduled ad date The project is on schedule and within the established budget
Beige Pages - Measures Markers and Mileposts - December 31 2003 6
6 Beige Pages - Measures Markers and Mileposts - December 31 2003
SR 9 Nooksack Road to Cherry Street (ad date 604)
This project was originally scheduled for advertisement in June 2004 but that date has had to be adjusted (is now set for October 2005) because of new geotechnical information requiring design revisions that in turn have led to a larger-than-originally-expected right of way acquisition program Construction cost savings however are also expected to result
SR 161 204th Street to 176th Street (ad date 2904)
The project was originally scheduled for advertisement in February 2004 but that ad date has had to be adjusted (is now set for November 2004) due to real estate acquisitions that have taken longer than expected and to avoid work zone traffic control issues by constructing the entire four miles at the same time WSDOT is coordinating access revision with local developers along the corridor and is currently nearing completion of the design and real estate acquisition phase
Beige Pages - Measures Markers and Mileposts - December 31 2003 7
Beige Pages - Measures Markers and Mileposts - December 31 2003 9
Project Delivery
Proposed Adjustments to Delivery Planning
Meeting schedule budget and scope expectations are important elements in WSDOTrsquos delivery of the projects in the 2003 Transportation Funding Package Planning and design activities for specific projects sometimes identify the need to make adjustments to construction delivery spending schedules Some of these adjustments will have no impact on critical start or completion dates Others may require adjustments to critical dates
The information in this report describes changes that WSDOT has concluded as desirable based on assessments made in the quarter under review ending December 31 2003
Highway Construction Program
US 2 Peshastin East Interchange
The spending plan for this project should be revised based on the Value Engineering Study done in August 2003 and the Cost Risk Assessment done in July 2003 The spending plan for this project has been reduced $88 million to a total of $165 million This is a cost savings of 35 from the budget amount WSDOT also has a plan to reduce the construction phase of the project by two years from three years to one year while maintaining the planned advertisement date of September 4 2009
I-5SR 502 Interchange and Corridor Widening
WSDOT has the opportunity to make advance purchases of Right of Way from property owners that have expressed interest in selling now Purchasing Right of Way at this time benefits both the sellers and the WSDOT in that sellers will be able to know what affect the project will have on them and be fairly compensated and early acquisition lessens the risk of land development increasing land value In order to accelerate this preliminary design and RW work WSDOT is requesting to advance $1000000 for RW and $200000 for Preliminary Engineering into the 0305 biennium The advancement of funds will not increase the total project cost
I-5 Noise Wall
This project was removed from the September 30 2003 Watch List The project is in Seattle near the end of SR 520 and Roanoke Street Previously WSDOT reported that cost and schedule for this project were being reviewed to allow for completion of the design and may result in an ad delay With the review complete and design underway the project will be advertised in early summer 2004 with a construction start in late summer
I-5SR 526 TO US 2 (Marine View Dr) HOV Lanes
WSDOT proposes to advance the advertisement date from March 2008 to October 2007 to ensure that work begins in the spring of 2008 to take full advantage of the 2008 construction season In addition WSDOT is proposing to advance $4 million into the 2003-2005 biennium in order to accelerate design work This acceleration would put WSDOT in a position to further accelerate this project for the benefit of the 2010 Olympics if the Legislature should decide to advance funding for construction (see Opportunities and Options for Legislative Consideration section of this report)
SR 7SR 507 to SR 512 ndash Safety
The December 2003 contract advertisement date for this project has been delayed until right of way access issues can be resolved WSDOT believed that right of way would be cleared with property owners for a December ad date However the Department has received 18 requests for adjudicative hearings from property owners adjacent to the project Additional time will be required to prepare detailed surveys title
Beige Pages - Measures Markers and Mileposts - December 31 2003 8
8 Beige Pages - Measures Markers and Mileposts - December 31 2003
searches and coordinate scheduling with the Attorney Generalrsquos Office for each of the hearings WSDOT is focused on completing negotiations with the property owners and anticipates advertising the project in spring 2004 with construction starting no later than the summer of 2004
SR 9 Nooksack Road to Cherry Street
This project will have an ad date shift from June 2004 to October 2005 to account for an increase in the number of right of way parcels that must be acquired The total cost of the project remains the same as the construction estimate has decreased
SR 16 HOV Improvements ndash Olympic View Drive to Union Avenue
The third construction phase of this project 36th Street to Olympic Drive NW would be advanced two or three quarters to allow more flexibility for planning and implementing traffic switches needed to accommodate the opening the new Second Tacoma Narrows Bridge This third and final construction phase will complete continuous HOV lanes on either side of the Tacoma Narrows from the Sprague Avenue Interchange in Tacoma to the Olympic Drive Interchange in Gig Harbor by spring 2007 Moving the construction start date of this phase from spring 2005 to fall 2004 will not affect the overall cost of the project
SR 20 Quiet Cove Road Vic to SR 20 Spur
In the September 30 2003 Gray Notebook this project was listed on the Watch List At that time WSDOT reported the advertisement date for this project may be delayed to provide time for right of way acquisition and to resolve environmental mitigation issues Currently the advertisement date would slip by nine months from February 2006 to November 2006 which will result in shifting $3 million in projected Nickel Fund expenditure from the 05-07 to 07-09 biennium
I-90 Two-Way Transit and HOV
This Seattle to Mercer Island project is currently funded for design by Sound Transit FHWA and WSDOT and is dependent on Regional Transportation Investment District (RTID) and other sources of funding for construction Should RTID funding become available WSDOT proposes the advertisement date be delayed thirteen months from December 2004 to January 2006 to allow time for the issuance of the draft Environmental Impact Statement This will allow the design to be completed in October 2005 There is no change in the expected project cost However $1 million in projected Nickel Fund expenditures would need to be shifted from the 03-05 biennium to the 05-07 biennium
SR 99 S 284th to S 272nd St HOV Lanes
This project will include a HOV lane and 2 general-purpose lanes in each direction a median sidewalk and planter strip The updated cost estimate for right-of-way acquisition is $51 million this is an increase from the previous estimate of $3 million to account for the potential of higher cost of condemnation The advertisement date would be delayed from December 2005 to April 2006 to correct the record of survey which identify property ownership WSDOT is currently working with the City of Federal Way to minimize the right-of-way cost by eliminating some of the proposed landscaping areas
SR 161 Corridor Improvements ndash 204th Street E to 176th Street
There are multiple stages to this project Stage 1 (234th to 204th) was advertised in November 2003 The proposal is to adjust cash flow and delay the advertisement date of Stage 2 (204th to 176th) from November 2003 to November 2004 This action will reduce traffic impacts and help right of way acquisition These changes should not change the total project cost
Beige Pages - Measures Markers and Mileposts - December 31 2003 9
Beige Pages - Measures Markers and Mileposts - December 31 2003 11
SR 203 NE 124thNovelty Rd Vic
The project was advertised on schedule However the total project cost has increased by approximately $900000 due to additional right of way and preliminary engineering to accommodate King Countyrsquos strict flood plain ordinance This project is funded with pre-existing funds the 2003 Transportation Funding Package and King County and Developer contributions About $250000 of the expected cost increase will come from the 2003 Transportation Funding Package
SR 520 W Lake Sammamish Parkway to SR 202 (Additional Lanes)
Cash flow adjustment to match actual design right of way and construction schedules No change in advertisement date of October 2008
SR 522I-5 to SR 405 ndash Multi-Modal Project (Nickel)
To take advantage of coordinating work with Lake Forest Park in conjunction with the needs of WSDOT partners the advertisement date would slip from winter 2003 to spring 2006 to take advantage of coordinating work with Lake Forest Park The 2003 Transportation Funding Package provided the entire project funding in the construction phase The changes will result in shifting $2 million in expenditures from the 03-05 to 05-07 biennium This project is part of an integrated program of corridor improvements where WSDOT will coordinate portions of this project with other improvements which will be funded and constructed by local municipalities such as Seattle Kenmore Lake Forest Park and Bothell
For financial information on the Proposed Adjustments to Delivery Planning ndash Highway projects please refer to the table on page 16
Other Capital Programs The following six proposed project changes have interrelated funding and impact one another
Palouse River and Coulee City Railroad Acquisition
Depending on a finding of cost effectiveness that the Legislature instructed be made by the Transportation Commission WSDOT would purchase 302 miles of the Palouse River and Coulee City Railroad preserving the statersquos largest short-line railroad that carries 20 percent of the statersquos grain crop The original proposed budget has been reduced by $322000 after further cost estimate review If the conclusion of WSDOTrsquos review of the proposed purchase of this railroad is favorable the purchase will be completed with this decrease in the adjusted budget
Port of Columbia Railroad Improvements (New Project Title)
After further engineering review and scope refinement the following three projects are combined and overall reduced in scope to reflect actual improvements needed to maintain railroad service on this section of track
The original project Port of Columbia Railroad Improvements ndash funds general railroad improvements on the 39-mile line Based on further engineering reviews the original scope for this project has been reduced from a full rebuild of the line to a less expensive rehabilitation of the line that will still provide an adequate level of service to the rail line customers The proposed change will be combined with two additional projects listed in the 2003 Funding Package (the Blue Mountain Railroad Upgrade project which rebuilds 30 miles of track from Wallula to Walla Walla and the Port of Columbia Co Dayton Upgrades project which funds improvements to port rail facilities) into a single project with a total budget of $53 million as compared to the originally combined project budgets of $13 million
Beige Pages - Measures Markers and Mileposts - December 31 2003 10
10 Beige Pages - Measures Markers and Mileposts - December 31 2003
Port of Columbia Dayton Upgrades and Blue Mountain Railroad Upgrade
These projects fund improvements to port rail facilities and rebuilding 30 miles of track from Wallula to Walla Walla It is proposed that these projects be combined with Port of Columbia Railroad Improvements project as described above The original intent of both projects will still be accomplished at a reduced cost
Palouse River and Coulee City Cheney-Coulee-Pullman Upgrade (New Project Title)
After further engineering review and scope refinement two projects (Palouse River and Coulee City Cheney to Coulee Upgrades and Rural Elevator Track Expansion) are combined Also engineering analysis suggests the need for scope change to include upgrades of PRampCC lines in Whitman County
The original project (Palouse River and Coulee City Cheney to Coulee Upgrades) would have funded repairs to numerous railroad bridges in Grant and Lincoln Counties and upgrade track to accommodate 286000-pound freight cars It would also improve the rail line between Coulee City and Cheney The proposed change will combine these upgrades with projects in Whitman Co that were identified by WSDOT in the summer of 2003 Further the scope of the work from the Rural Elevator Track Expansion project (additional track at rural elevators and shortline mainline connections) will also be combined into this expanded scope The proposed scope will be completed within the overall total of $21089000 specified for the projects in aggregate
For financial information on the Proposed Adjustments to Delivery Planning - Rail projects please refer to the table on page 17
Opportunities and Options for Legislative Consideration
The following projects were reported as requiring legislative guidance in June 2003 and continue to be offered for legislative consideration Details on the projects are found in the Gray Notebook for June 30 2003
I-5SR 526 TO US 2 (Marine View Dr) HOV Lanes
The question remains on whether the construction schedule for this project should be advanced so that the project can be completed prior to the 2010 Winter Olympic Games
WSDOT has developed two accelerated schedule options for legislative consideration Option one is to accelerate the project schedule and advertise it for construction bids in March 2006 using the common ldquoDesign-Bid-Buildrdquo practice This option will result in an open to traffic date of 2010 Option two is to accelerate the project schedule and advertise by July 2005 using the ldquoDesign-Buildrdquo method This option will result in an open to traffic date of 2009 and is WSDOTrsquos preferred option The expenditure plan reflects the ldquoDesign-Buildrdquo option
SR 99 Alaskan Way Viaduct
The project replaces the seismically vulnerable Alaskan Way Viaduct and seawall in downtown Seattle The Gray Notebook for September 2003 identified the need to begin design in the summer 2004 as essential to remain on schedule to meet the proposed 2008 start of construction The project has moved money from one phase to another in 2003-2005 with zero dollar change to the bottom line By making this adjustment restoring right of way and increasing PE in the 05-07 biennium The project remains on the accelerated pace that will allow construction to begin in 2008 but not unless funding issues can be resolved
Beige Pages - Measures Markers and Mileposts - December 31 2003 11
Beige Pages - Measures Markers and Mileposts - December 31 2003 13
I-405 Congestion Relief and Bus Rapid Transit Projects
WSDOT proposes revising the I-405 Nickel project sequence to be Kirkland Stage 1 Renton Bellevue and Kirkland Stage 2 The Kirkland Stage 1 project addresses a known congestion hot spot that has a very high benefitcost ratio with work that can be incorporated into future RTID projects This schedule revision allows a project to be constructed and opened to traffic earlier than the original sequence The revision also allows the Renton project the opportunity to combine Nickel funds with Regional Transportation Improvement District (RTID) funds in a larger more cost-effective project should RTID funds become available
SR 522 Bothell ndash UW Campus Access
Should WSDOT use the Nickel expenditure authority for this project since the funding from the lead funding partners did not materialize and WSDOTrsquos budget for the project is insufficient to construct the project This was identified in the September 30 2003 Gray Notebook
SR539I-5 AccessImprovements Ten Mile Road to International Boarder
The question remains on whether the construction schedule for this project should be advanced so that the project can be completed prior to the 2010 Winter Olympic Games
Widening the remaining section of the ldquoTen Mile Roadrdquo will require the project be funded in a future budget appropriation The Nickel funding will provide for preliminary engineering environmental analysis and selection of a project plan for a new connection between I-5 and SR 539 Completing the final design right of way and construction of the project will however require new funding
D Street Grade Separation
The question remains whether the cash flow of this project be advanced into the 03-05 biennium from the 05-07 biennium to enable construction to be accomplished with other stages of this project
The Gray Notebook for September 30 2003 suggests that the 03-05 Supplemental Budget include a $35 million increase in the Program Z appropriation within the Multimodal Account
For financial information on the Opportunities and Options for Legislative Consideration please refer to the table on page 17
ldquoWatch Listrdquo Projects Cost and Schedule Concerns Watch List WSDOT is watching some projects closely for warning that changes in cost schedule or scope may be at risk due to developments and discoveries during the project delivery process in some cases these changes are outside the control of WSDOT Currently the information regarding the changes for these projects are in the early stages and making a conclusion based on this information may not
Watch List
achieve the desired result
Projects Removed from the September 30 2003 Gray Notebook Watch List
SR 3 to SR 303 Interchange Waaga Way
Removed from the Watch List Concerns had been raised that several issues in the design concepts developed in 1995 now necessitating coordination with Kitsap County might require delay of the scheduled ad date in Spring 2005 These issues have now been successfully addressed ndash reducing the
Beige Pages - Measures Markers and Mileposts - December 31 2003 12
12 Beige Pages - Measures Markers and Mileposts - December 31 2003
number of traffic signals reducing the volume of pavement increasing traffic volume capacity and minimizing impacts on local adjacent ball fields Project progress now supports both the originally scheduled ad date and the project budget
I-5 Noise Wall
See Proposed Adjustments in delivery planning Removed from the Watch List Previously WSDOT reported that the need to prepare design for the project would lead to delay in the schedule originally set by the legislature With the review complete and design underway the project has now been scheduled to advertise in early summer 2004 with construction work to begin during the summer
SR 20 Quiet Cove Road Vic to SR 20 Spur
See Proposed Adjustments in delivery planning Removed from the Watch List This project has moved to Proposed Adjustments in the Gray Notebook WSDOT reported the need to delay the advertisement date for this project might be delayed to provide additional time to acquire environmental approvals necessary for right of way acquisition The current plan is to slip the advertisement date by nine months from February 2006 to November 2006 in order to provide adequate time to resolve environmental mitigation issues and acquisition right of way This delay will result in shifting $3 million in Nickel funding expenditure from the 05-07 to 07-09 biennium
SR 99 S 284th to S 272nd St HOV Lanes
This project has moved to proposed adjustments in the Gray Notebook Removed from the Watch List The updated cost estimate for right-of-way acquisition is $51 million This is an increase from the previous estimate of $3 million and has been factored in to the project to account for the potential higher cost of condemnation Advertisement date will be delayed from December 2005 to April 2006 in order to correct the record of survey to identify property ownership
SR 161 Jovita Blvd to S 360th St
Removed from Watch List In the September 30 2003 Gray Notebook this project was on the Watch List for potential design changes from increased costs and delayed construction due to environmental and air quality provisions that have become more stringent while waiting for funding to be approved The air quality analysis has now been completed and there will be no impact to the project as a result The NEPA re-evaluation is still in progress and WSDOT anticipates the report to be finalized in January 2004 and approved shortly thereafter
SR 203 NE 124thNovelty Rd Vic
See Proposed Adjustments to Project Delivery and Contract Advertising amp Awards Removed from Watch List Previously WSDOT reported that arriving at a new floodplain mitigation site might have implications for cost and schedule The project was advertised on schedule but the project costs for additional engineering and right of way acquisition increased by a total of $900000
US 395 North Spokane Corridor (Francis Avenue to Farwell Road)
Removed from Watch List This was a ldquoWatch Listrdquo project in the last quarterrsquos report because of concerns over obstacles in the acquisition of a single indispensable right-of-way parcel With the assistance of mediation the acquisition was completed in November 2003 The contract advertisement was set for January 2004 with bid opening in March 2004 The project is expected to be delivered within approved funding and with little delay to the opening date
SR 522I-5 to SR 405 ndash Multi-Modal Project (Nickel)
Removed from Watch List See Proposed Adjustments to Project Delivery In the September 30 2003 Gray Notebook WSDOT reported it was considering delaying the advertisement date to coordinate with the City
Beige Pages - Measures Markers and Mileposts - December 31 2003 13
Beige Pages - Measures Markers and Mileposts - December 31 2003 15
of Lake Forest Park To coincide with the needs of WSDOT partners the advertisement date will slip from winter 2003 to spring 2006 to take advantage of coordinating work with the City of Lake Forest Park The Nickel Funding Package provided the entire project funding in the construction phase These changes will result in shifting $2 million in expenditure from the 03-05 to 05-07 biennium
SR 543I-5 to Canadian Border - Additional Lanes for Freight
Removed from Watch List In the September 30 2003 Gray Notebook WSDOT reported the department was working to resolve structural design issues as a result of poor soil conditions The initial engineering solution was to design retaining walls that would be expensive and cause the project to exceed the budget A slope redesign was therefore developed as an alternative It has resulted in making one wall unnecessary and reducing the necessary height of several walls This affordable design is more cost-effective and should bring the project back within the anticipated budget
Update on Projects Noted in the ldquoWatch Listrdquo in the Gray Notebook ending September 30 2003
I-5 From Rush Road to 13th Street
The Watch List for the September 30 2003 Gray Notebook described the review by FHWA of this project to add one lane in each direction on I-5 between the interchanges at Rush Road (exit 72) and 13th Street (exit 76) including construction of a new interchange at the current LaBree Road under-crossing At the time of publication FHWA approved the added access with conditions
SR 9SR 522 to 212th St SE (Stages 1b amp 2)
The Watch List for the September 30 2003 Gray Notebook described the need to make design changes (raised center line barrier) with two-way-left-turn-lane based on current traffic data The design change may result in a delay of the advertisement date WSDOT continues to coordinate design and construction planning with King County regarding the Countyrsquos development of the Brightwater Wastewater Treatment Plant adjacent to the project There is continuing discussion of a revised advertisement and construction schedule
SR 167 15th St SW to 15th St NW ndash HOV
In the last Gray Notebook Watch List WSDOT reported that the project cost increased by $44 million and that the advertisement date could be delayed The advertisement date will be moved to February 2005 to accommodate redesign of the project to meet current stormwater standards WSDOT staff worked with permitting agency representatives on the Multi-Agency Permitting Team (MAPT) and determined that the original drainage design would not meet current water quality regulations The MAP Team has determined that additional stormwater detention and treatment will indeed be required Local agencies have also stated that additional wetland and stream buffer mitigation will be required As a result additional funds will be required for the design and construction of ecology embankments additional detention ponds and buffer mitigation The additional work will delay the advertisement date to the first quarter 2005 WSDOT staff is investigating designs in order to minimize the amount of these cost increases and will report next quarter
SR 270 Pullman to Idaho State Line - Additional Lanes
In the September 30 2003 Gray Notebook it was reported that there was a possibility of a project cost increase due to rock and soil conditions and the need for bridge design modifications Drilling and soil testing began in mid December 2003 with planned completion of testing in February 2004 Due to the unknown rock depth in excavation areas and bridge design considerations for two bridges it is anticipated that that a project cost increase ranging from $2 million to $5 million may be required The project cost estimate is expected to be completed by July 2004 As the project design is further refined WSDOT is investigating methods to reduce or offset these cost increases The project is on schedule for advertisement in January 2005
Beige Pages - Measures Markers and Mileposts - December 31 2003 14
14 Beige Pages - Measures Markers and Mileposts - December 31 2003
SR 410 214th Ave E to 234th - Widening
WSDOT reported in the Watch List of the September 30 2003 Gray Notebook that costs for this project could increase $16 million or more to purchase land that will be needed for stormwater treatment and detention was re-zoned for commercial and light industrial during the project development phase Engineering work is underway to develop an updated cost estimate for right-of-way acquisition based on the zoning changes by the end of February 2004 This project will address sections of the roadway where accidents occur by controlling access to the highway building new signal systems at major intersections and reducing congestion by providing an additional lane in each direction
Projects added to the ldquoWatch Listrdquo
Bellingham-GP Area Upgrades
This project would upgrade the existing track through Bellinghamrsquos Georgia Pacific (GP) Plant to allow for slightly higher speeds for Amtrak Cascades intercity trains resulting in a travel time reduction of about 11frasl2 minutes Due to unanticipated freight business at the mostly closed GP plant since the project scope was developed the project scope is now inadequate The implications for cost and schedule are being reviewed
Beige Pages - Measures Markers and Mileposts - December 31 2003 15
Beige P
ages - Measures M
arkers and Mileposts - D
ecember 31 2003
17
Beige P
ages - Measures M
arkers and Mileposts - D
ecember 31 2003
The following table summarizes the various changes and adjustments described on pages 8-10 for the quarter ending December 2003
Highway Projects Proposed Adjustments to Project Delivery Quarter Ending December 31 2003 Dollars in Thousands
03-05 05-07 07-09 09-11 11-13 Ten Year Total
Adjusted Net Adjusted Net Adjusted Net Adjusted Net Adjusted Net Adjusted Net SR Project Budget Budget Change Budget Budget Change Budget Budget Change Budget Budget Change Budget Budget Change Budget Budget Change 002 US297 Peshastin East - 2100 2100 0 1870 2700 830 7600 11750 4150 13780 0 -13780 0 0 0 25350 16550 -8800
Interchange 005 I-5SR502 Interchange 1321 2521 1200 8679 7479 -1200 0 0 0 0 0 0 0 0 0 10000 10000 0
005 I-5 Noise Wall 3500 3500 0 0 0 0 0 0 0 0 0 0 0 0 0 3500 3500 0
005 I-5SR526 to US 2 (Marine View 11000 15000 4000 6300 11300 5000 54780 52277 -2503 121900 117005 -4895 44680 36474 -8206 238660 232056 -6604 Drive)
007 SR7SR507 to SR512-Safety 9300 9300 0 0 0 0 0 0 0 0 0 0 0 0 0 0 0 0
009 SR 9 Nooksasck Road to Cherry 6320 1548 -4772 8800 12730 3930 0 927 927 0 0 0 0 0 0 15120 15205 85 St
016 SR 16 HOV Improvements 49623 51483 1860 40902 39042 -1860 0 0 0 0 0 0 0 0 0 90525 90525 0 between Olympic Drive and Union Ave
020 SR 20Quiet Cove Rd Vic to SR 0 0 0 3790 766 -3024 3270 6294 3024 0 0 0 0 0 0 7060 7060 0 20 Spur
024 SR24I82 to Keys Road 840 840 0 22000 22000 0 9000 9000 0 0 0 0 0 0 0 31840 31840 0
031 SR 31Metaline Falls 4900 2400 -2500 11000 13500 2500 0 0 0 0 0 0 0 0 0 15900 15900 0 To Canadian Border
090 I-90 Two-way Transit and HOV 4000 3000 -1000 11000 12000 1000 0 0 0 0 0 0 0 0 0 15000 15000 0
099 SR 99s 284th to S 272nd St 3780 3656 -124 6323 8519 2196 2600 2621 21 0 0 0 0 0 0 12703 14796 2093 - HOV Lanes
161 SR 161Corridor Improvements 12100 6641 -5459 7300 12709 5409 15 27 12 0 38 38 0 0 0 19415 19415 0 -176th to 234th
203 SR 203NE 124thNovelty Rd Vic 1200 2084 884 0 163 163 0 0 0 0 0 0 0 0 0 1200 2247 1047
520 SR 520w Lake Sammamish 3400 3368 -32 4900 6700 1800 24500 16225 -8275 38720 60515 21795 30800 15493 -15307 102320 102301 -19 Pkwy to SR 202
522 SR 522I-5 To SR 405 Multi- 3600 1497 -2103 1500 3568 2068 0 0 0 0 0 0 0 0 0 5100 5065 -35 modal Project
Total of Projects Above 116984 108938 8046 134364 153176 18812 101765 99121 -2644 174400 177558 3158 75480 51967 -23513 593693 581460 -12233
Project Adjustments from Quarter 1 229284 210820 -18464 374159 375781 1622 323393 333343 9950 229295 263815 34520 142025 107237 -34788 1298156 1290997 -7159
Total of Projects from Quarter 2 221033 238273 17240 283976 265815 18161 312730 310414 -2316 307339 307064 -275 318918 348876 -42 1483296 1479741 -3555
Total for All Projects 567301 558031 -9270 792499 794772 2273 737888 742878 4990 711034 748437 37403 566423 508080 -58343 3375145 3352198 -22947
16
16Beige P
ages - Measures M
arkers and Mileposts - D
ecember 31 2003
Beige P
ages - Measures M
arkers and Mileposts - D
ecember 31 2003
The following table summarizes the various changes and adjustments described on pages 10-11 for the quarter ending December 2003
Rail Projects Proposed Adjustments to Project Delivery Quarter Ending December 31 2003 Dollars in Thousands
03-05 05-07 07-09 09-11 11-13 Ten Year Total Adjusted Net Adjusted Net Adjusted Net Adjusted Net Adjusted Net Adjusted Net
Project Budget Budget Change Budget Budget Change Budget Budget Change Budget Budget Change Budget Budget Change Budget Budget Change
Palouse Riv amp Coulee City RR 5820 5820 - 1530 1208 (322) - - - - - - - 7350 7028 (322) Acquistion Port of Columbia Railroad - - - - 11500 252 (11248) 1904 1904 - 3157 3157 11500 5313 (6187) Improvements Port of Columbia Co Dayton - - - - 320 - (320) - - - - - 320 - (320) Upgrades Blue Mtn RR Wallula-Walla Walla - - 1260 - (1260) - - - - - - - 1260 - (1260) Upgrade Rural Elevator Track Expansion - - - - - - 1140 - (1140) 3860 - (3860) 5000 - (5000)
PRampCC Cheney-Coulee 286K - - 1582 1582 11568 11568 8000 7236 (764) - 703 703 8000 21089 13089 Upgrade
Total Rail Projects 5820 5820 - 2790 2790 - 11820 11820 - 9140 9140 - 3860 3860 - 33430 33430 0
The following table summarizes the various opportunities and options described on pages 11-12
Highway Projects Opportunities and Options for Legislative Consideration Quarter Ending December 31 2003 Dollars in Thousands
03-05 05-07 07-09 09-11 11-13 Ten Year Total Adjusted Net Adjusted Net Adjusted Net Adjusted Net Adjusted Net Adjusted Net
SR Project Budget Budget Change Budget Budget Change Budget Budget Change Budget Budget Change Budget Budget Change Budget Budget Change
005 I-5 SR 526 (Marine View 11000 16000 5000 6300 110000 103700 54780 88000 33220 121900 - (121900) 44680 - (44680) 238660 214000 (24660) Drive)
099 SR 99 Alaskan Way Viaduct 45000 45000 - 12000 40000 28000 40000 40000 - 40000 40000 - 40000 12000 (28000) 177000 177000 -
405 I-405 Congestion Relief 46000 46000 - 99840 114840 15000 139020 199020 60000 160195 125195 (35000) 40000 - (40000) 485055 485055 -Projects
522 SR 522 Bothell-UW Campus 8000 - (8000) - 8000 8000 - - - - - - - - - 8000 8000 -Access
539 SR 539 I-5 Improvements 4850 4800 (50) 5500 8300 2800 5200 62800 57600 31500 8000 (23500) 42000 - (42000) 89050 83900 (5150) Ten-Mile Road to Intrsquol Border
Total Projects 114850 111800 (3050) 123640 281140 157500 239000 389820 150820 353595 173195 (180400) 166680 997765 967955 (29810)12000 (154680)
17
Beige Pages - Measures Markers and Mileposts - December 31 2003 19
Financial Information
2003 Transportation Funding Package ndash Paying for the Projects The first edition of the Beige Pages (June 2003) included an in-depth discussion of the Legislaturersquos 2003 Transportation Funding Package The revenue forecast has now undergone several updates since the Legislature enacted the budget The following information reflects the November 2003 forecast changes as well as the impact from the recent Supreme Court decision on Initiative 776 Further refinements to debt service estimates have also been made
Revenue Forecasts The 2003 Transportation Funding Package enacted by the Legislature included tax and fee increases The gas tax was increased by 5cent per gallon and gross weight fees on trucks increased by 15 An additional sales tax on new and used vehicles of 03 and a license plate number retention fee were both established The first two sources are to be deposited to a new account called the Transportation 2003 (Nickel) Account The latter two are to be deposited to the Multimodal Transportation Account that was established several years ago
The following charts show the current projected revenues over the next ten years (for the new funding sources) as forecasted in November 2003 by the Transportation Revenue Forecast Council compared to the legislaturersquos assumed lsquobaselinersquo projections used in the budget-making process in March 2003 Cumulative ten-year totals and individual biennial amounts are both shown
Transportation 2003 (Nickel) Account Revenue Forecast Forecast comparisons include actual March 2003 Legislative Biennial Baseline Compared to
November 2003 Transportation Revenue Forecast Council revenue collection data to date as well Millions of Dollars
as updated projections based on new and revised economic variables The November 2003 forecast includes several months of actual revenue receipt information Gas tax receipts include four months of actual collections and licenses permits and fees include three months of receipts In the Transportation 2003 (Nickel) Account revenue projections for the ten-year period for gas tax receipts were increased over the September 2003 forecast (+105) and licenses permits and fees were forecast to be slightly higher (+05) before taking into account the impact of Initiative 776 However when including the I-776 impact forecasted revenues for licenses permits and fees are down ten percent for the ten-year period In the Multimodal Account licenses permits and fees projected revenue for the ten-year period remained unchanged from the September 2003 forecast Initiative 776 did not impact the Multimodal account
$2000
$1800
$1600
$1400
$1200
$1000
$800
$600
$400
$200
$0
$19240m Baseline Total
November 2003 Forecast Total $18506m
Licenses Permits and Fees 5cent Gax Tax um
ulative
C
$3262 $3186 $3701 $3632 $3912 $3767 $4120 $3907 $4244 $4013
July 1 Baseline Nov 03 Baseline Nov 03 Baseline Nov 03 Baseline Nov 03 Baseline Nov 03 2003 Forecast Forecast Forecast Forecast Forecast
Biennium Ending Biennium Ending Biennium Ending Biennium Ending Biennium Ending June 2005 June 2007 June 2009 June 2011 June 2013
New Sources - Multimodal Account Revenue Forecast March 2003 Legislative Biennial Baseline Compared to November 2003 Transportation Revenue Forecast Council Cumulative and Biennial Totals Millions of Dollars
$600
$400
$200
$0
$3831m Baseline Total
Licenses Permits and Fees 03 Vehicle Sales Tax
Cumulative
November 2003 Forecast Total
$730 667$622 $592 $777 $709 $814 $752 $888 $817 $3537m
July 1 Baseline Nov 03 Baseline Nov 03 Baseline Nov 03 Baseline Nov 03 Baseline Nov 03 2003 Forecast Forecast Forecast Forecast Forecast
Biennium Ending Biennium Ending Biennium Ending Biennium Ending Biennium Ending June 2005 June 2007 June 2009 June 2011 June 2013
Beige Pages - Measures Markers and Mileposts - December 31 2003 18
18 Beige Pages - Measures Markers and Mileposts - December 31 2003
Bond Sales Plan for New Authorizations Provided by the 2003 Transportation Funding Package The 2003 Transportation Funding Package contained two new bond authorizations
bull a gas tax authorization of $26 billion
bull a state General Obligation Bonds (GO) authorization of $3495 million The proceeds from the new gas tax bonds will be used to fund highway projects The debt service will be paid by the revenues from the nickel increase in the gas tax The proceeds from the new state GO bonds will be used to fund rail and ferry projects Debt service for these bonds will be paid from the Multimodal Account Receipts from the new 03 sales tax on new and used vehicles will be deposited to the Multimodal Account and will augment rental car tax receipts and other fees already directed to this account
2003-2005 Biennium
For the 2003-2005 biennium the Legislature appropriated $280 million in proceeds from the new gas tax bonds and $477 million from the state GO bonds To date in this biennium $80 million of gas tax bonds have been sold No new bond sales occurred in this reporting period However in February 2004 (the next scheduled state bond sale) $25 million in gas tax bonds is planned to be sold for the 2003 Transportation (Nickel) Account and $20 million in GO Bonds for the Multimodal Account
The bond sales plan has not changed from the initial report The combined affect of the revenue forecasts bond sales assumptions and project expenditure assumptions is presented in the next section
Financial Plans for Accounts Supporting the 2003 Funding Package Transportation 2003 (Nickel) Account The Transportation 2003 (Nickel) Account was established in the state treasury to be the repository of the new nickel gas tax and the increases in various vehicle licenses permits and fees Bond proceeds from the $26 billion authorization will also to be deposited to this account Uses of the account include cash funding of highway and
Transportation 2003 (Nickel) Account 2003-2005 Budget and Ten-Year Financial Plan dollars in millions
Balance Forward from Previous Biennium Sources Gas Tax Revenues (new 5cent) Licenses Permits and Fees Revenues I-776 Impact (loss of revenue) Interest Earnings Bond Proceeds Federal Funds Local Funds
03-05 $00
2980 231 (26) 43
2800 10 34
05-07 $44
3419 241 (27) 43
5680 97 24
07-09 $171
3533 262 (28) 43
6700 00 09
09-11 $362
3652 284 (29) 43
6430 00 02
11-13 $672
3751 292 (29) 43
4390 00 34
Ten-Year Total
17335 1310 (139)215
26000 107 103
Total Sources of Funds Uses
$6072 $9477 $10519 $10382 $8481 $44930
Cost of Bond Issuance 07 13 17 16 12 65 Bond Sale Underwriters Discount 21 40 50 48 36 195 Debt Service 225 906 1890 2622 3378 9021
Highway Improvements 5697 7943 7338 6909 4628 32515 Highway Preservation 20 103 50 203 1070 1446 Washington State Ferry Construction 57 345 983 274 39 1699 Total Uses of Funds Biennium Ending Balance
$6028 $44
$9350 $171
$10328 $362
$10072 $672
$9163 ($10)
$44940 ($10)
This plan represents the current budget and ten-year financial plan as adopted by the 2003 Legislature and does not contain any proposed adjustments to project delivery
Beige Pages - Measures Markers and Mileposts - December 31 2003 19
Beige Pages - Measures Markers and Mileposts - December 31 2003 21
ferry projects identified by the Legislature and the payment of debt service and other associated costs for bonds sold to provide debt financing for highway projects Since gas tax receipts are deposited to this new account the uses of the account are restricted to highway purposes as required by the 18th Amendment to Washingtonrsquos Constitution The financial plan below brings together all of the projected Sources (tax revenue bond proceeds interest earnings) and Uses (2003-2005 appropriations 10-year projected program expenditures and debt service) of the new account
Changes to projected Sources and Uses of funds have been updated to reflect the most current forecasts As changes either positive or negative are incorporated into the plans the ending balances in the outer biennia are affected The current pro forma which incorporates actual tax collections and current forecast projections predicts a small negative ending balance of approximately $10 million by the end of the 2011-13 biennium The September 2003 pro forma predicted that there might be a negative $165 million shortfall This change is primarily due to a refinement to debt service calculations and the increased gas tax revenue forecast
As mentioned earlier for the ten-year period gas tax receipts were up slightly from the September 2003 forecast ($185 million) and licenses permits and fees were up slightly ($06 million) before the I-776 impact Key economic variables tax receipts and interest rates will continue to change over time Future updates to forecasts as well as inclusion of more actual receipts will further impact the projected final ending balance Additionally actual and revised assumptions pertaining to bond sales and debt service will continue to be incorporated and likewise will impact the outlook for the final ending balance
Impacts of Initiative 776 The 2003 Transportation (Nickel) Account was affected by Initiative 776 the application of which was ruled upon in October 2003 by the State Supreme Court (other affected accounts include the Motor Vehicle Account the Puget Sound Ferry Operations Account and the Washington State Patrol Account) This table shows the projected impact of Initiative 776 to all affected accounts in millions of dollars The 2003 Transportation Account will be negatively impacted over the ten-year period by $139 million
I-776 ImpactsLoss of Revenue by Account dollars in millions
Ten-Year 03-05 05-07 07-09 09-11 11-13 Total
Motor Vehicle Account $307 $272 $280 $289 $297 $1445 Transportation 2003 (Nickel) Account 26 27 28 29 29 139 Puget Sound Ferry Operations Account 06 05 05 06 06 28 Washington State Patrol Account 94 82 84 87 89 436 Biennial Total $433 $386 $397 $411 $421 $2048
Multimodal Transportation Account The Multimodal Transportation Account was established several years ago as the repository for tax revenues and operating and capital expenditures not restricted by the 18th Amendment The 2003 Transportation Funding Package directs receipts to this account from the additional 03 sales tax on new and used vehicles and the license plate number retention fee The most significant pre-existing tax deposited to this account is the rental car tax The 2003 Funding Package also directs bond proceeds from the $3495 million State GO authorization to this account
Beige Pages - Measures Markers and Mileposts - December 31 2003 20
20 Beige Pages - Measures Markers and Mileposts - December 31 2003
Multimodal Account 2003-2005 Budget and Ten-Year Financial Plan (dollars in millions)
03-05 05-07 07-09 09-11 11-13 Ten-Year Total
Balance Forward from Previous Biennium $141 $107 $202 $330 $491 Sources Licenses Permits Fees Distribution 247 270 282 290 302 1391 Rental car tax 453 503 567 627 689 2839 Sales Tax on New amp Used Car Sales 588 648 685 729 792 3442 Miscellaneous Income 15 15 15 15 15 75 Bond Proceeds 478 437 1287 896 398 3495 Federal Revenue 141 54 55 1016 1877 3142 Local Revenue 27 02 02 02 02 33 Total Sources of Funds $1948 $1928 $2893 $3575 $4074 $14417 Operating Uses Cost of Bond Issuance 01 01 03 02 01 09 Bond Sale Underwriters Discount 04 03 10 07 03 26 Debt service 22 93 195 325 439 1073 Transfers to Other Accounts 99 45 45 45 45 279
WSDOT Program Support amp Planning 54 45 46 47 48 240 Public Transportation 493 521 584 627 661 2886 WSF Maintenance and Operations 51 53 54 55 56 268 Rail 376 403 410 418 426 2033 Total WSDOT Operating Uses of Funds $1099 $1163 $1347 $1526 $1679 $6814 Capital Uses Hwy Preservation P0C 17 200 100 00 00 317 WSF Construction W0C 134 82 607 473 00 1296 Rail Y0C 440 327 711 1415 2250 5143
Local Programs Z0C 292 60 00 00 00 352 Total Capital Uses of Funds $883 $669 $1419 $1887 $2250 $7108
Biennium Ending Balance $107 $202 $330 $491 $636 $636
New funding source from the 2003 Legislative Package
Projects funded primarily by New Bonding Authority and Augmented Federal Funds for Rail
New Bond Authorization from the 2003 Legislative Package
Anticipated Federal Funds
The Multimodal Account includes changes to projected sources of funds based on three months of actual receipts and current forecast data As stated above projected revenues from licenses permits and fees for the ten-year period remained unchanged from the September 2003 forecast
Beige Pages - Measures Markers and Mileposts - December 31 2003 21
Beige Pages - Measures Markers and Mileposts - December 31 2003 23
Program Management Information
Management Information Systems and Needs
A key lesson learned from WSDOTrsquos nationwide assessment of project delivery information systems was that successful transportation programs were supported by integrated management information systems Currently WSDOTrsquos hardware and software capabilities in this area pieced together over a period of more than twenty years fall far short of delivering what is necessary to support todayrsquos higher expected levels of oversight and accountability This presents significant challenges
WSDOT managers are required to access project financial plans expenditure plans actual expenditure levels project milestones and project work load estimates from several different management systems Reporting from the various systems while partially automated requires a significant degree of manual intervention and support systems (databases spreadsheets etc)
The 2003 Legislature supported WSDOTrsquos request for a systems modernization assessment study A Legislative Transportation Committee (LTC) workgroup was formed to provide oversight for this project Members include four senators and four representatives charged with recommending actions to the full LTC The workgroup met in September 2003 to initiate review of the project Statement of Work If the statement of work is approved the assessment effort is expected to produce an integration strategy and a project plan for presentation to the transportation committees of the legislature by December 2004
While developing the long-term plan there are pressing short-term needs that are required to shore up the existing systems WSDOT has completed the following activities
bull Added information to the data marts used for reporting program management information (CPMS) and project accounting information (TRAINS) This will provide added support for project and program tracking and will increase reporting options and flexibility of information retrieval
bull Developed a web-based Quarterly Project Report for the Gray Notebookrsquos Beige Pages Trained staff to feed information to the Quarterly Project Report manually and developed a plan to implement electronic data feeds (to be implemented in early 2004)
bull Completed an assessment of the number of projects by project type and by region that have been loaded into the agencyrsquos Project Scheduling Information System (PDIS)
bull Developed a preliminary plan to build a PDIS Data Mart that will make project schedule and status information more readily available for reporting Completion of the data mart is tentatively scheduled for mid-2004
bull Developed a preliminary designbuild work breakdown structure for use in scheduling the mega projects This structure will allow for scheduling and reporting status at a detailed level and assessing the earned value of work done to-date as the mega projects proceed
bull Started development of data marts to provide flexible reporting of the roadway inventory information that supports project scoping and development activities (to be implemented in mid-2004)
Right of Way Acquisition Delays and cost increases in right of way acquisition have affected the delivery of several 2003 Transportation Funding Package projects For example advertisement for the SR 7SR 507 to SR 512 ndash Safety project has been delayed due to 18 adjudicatory hearing requests from property owners adjacent to the project WSDOT expects to complete negotiations with property owners by the end of spring 2004 For details see page 4
The tight delivery schedule for the 2003 Transportation Funding Package presents unique challenges for right of way acquisition In order to minimize future right of way acquisition problems the WSDOT Real Estate Services office (RES) and the Access Management office are analyzing the next two biennia to pick out projects requiring immediate action to assure that right of way is delivered in time for advertisement WSDOTrsquos right of way access and real estate experts have also formed a plan to look for total parcel acquisitions and parcels where access control is already in place thereby avoiding access hearings whenever possible Acquisition plans will be developed as soon as possible and RES will be able to begin to acquire the necessary properties
Beige Pages - Measures Markers and Mileposts - December 31 2003 22
22 Beige Pages - Measures Markers and Mileposts - December 31 2003
Appraisers title examiners and real estate agents in the private sector continue to enjoy a high volume of business due to the low interest rate environment As a result recruitment of experienced real estate professionals to replace retiring right of way staff at WSDOT is proving challenging WSDOT continues to seek qualified professionals to join its staff and will also begin a training program to develop sufficient staff experience to support the large program it needs to deliver over the next decade
Utilities Relocation
As of December 31 no utility relocation issue has caused a project to go on ldquoWatch Listrdquo status
One of the keys to avoiding obstacles to project delivery from utilities relocation is to give utility companies as much notice as possible of WSDOT project impacts to their facilities This allows the utilities adequate time for design budgeting and scheduling of the utility relocation Below is an example of WSDOTrsquos coordination efforts with the goal of minimizing utility relocation risks to our project schedules
bull Widen I-5 Each Direction from Salmon Creek to I-205
NW Natural had concerns that the pressure in its natural gas lines would not adequately serve the neighborhood to the west of Interstate 5 once the NE 129th Street over crossing was demolished WSDOT and NW Natural changed the original plan to run the gas line across the new bridge at 129th The new plan utilized horizontal directional boring equipment to place the line under Interstate 5 allowing the utility to navigate around proposed drainage drilled shafts for the new bridge and retaining walls
Comcast also voiced concern regarding running a temporary line during the reconstruction of the bridge WSDOT worked to provide a new freeway crossing at the 134th Street interchange rather than at 129th Street
bull SR 270 Pullman to Idaho State Line ndash Additional Lanes
An initial meeting has taken place with Avista Utilities for gas line relocation along the SR 270 corridor This allows approximately one year to complete design and relocation prior to the start of the contract
bull SR 31 ndash Metaline Falls to the Canadian Border ndash Reconstruction
A new fiber optic line was recently installed at the north end of the project to enhance communications to the Metaline Falls Border Crossing After coordination with WSDOT the Pend Oreille Telephone Company placed the line so that it would not impact roadway construction
bull US 395 North Spokane Corridor - Gerlach to Wandermere
An agreement has been made with Bonneville Power Administration to initiate design work on tower relocation and reconstruction The design work is to be completed by April 2004 Construction is scheduled to begin in November 2004
WSDOT is also coordinating with the PUD and local communications companies in Pacific County on US 101 in the vicinity of South Bend to make design adjustments so that underground utility lines can be placed at the time WSDOT raises the grade of the road for the SR 105 Mitigation ndash Willapa River Estuarine project This will not impede the traffic staging of the project and will decrease the risk of any utility relocation delays to the contractor
Environmental Documentation Review Permitting and Compliance WSDOT is overseeing a statewide transportation improvement program that creates new opportunities for aligning citizensrsquo goals for the environment and for transportation systems We are working to change the way we communicate these objectives and the interrelated nature of the complex issues in both protecting and improving the environment from the delivery of transportation projects
Beige Pages - Measures Markers and Mileposts - December 31 2003 23
Beige Pages - Measures Markers and Mileposts - December 31 2003 25
Environmental Documentation and Review
Compliance with the Endangered Species Act
About forty Nickel projects remain to be advertised for construction in this biennium according to WSDOTrsquos delivery plan Twenty-three of these projects have completed their required consultations under Section 7 of the Endangered Species Act Transportation projects that do not use federal funds are not required to obtain Section 7 consultation from the Endangered Species Act Two projects will not require Section 7 consultation because no federal funding will be allotted for project Eleven projects in the preliminary stages of design cannot seek the consultation process at this time until the Biological Assessments are completed Consultation on these projects should begin in 2004
There are two projects currently undergoing consultation with NOAA Fisheries and the US Fish and Wildlife Service (USFWS) The SR 31 Metaline Falls to Canadian Border Reconstruction project is undergoing formal consultation with the USFWS to address Canada Lynx concerns The I-90 Two Way Transit amp HOV project is undergoing consultation with NOAA Fisheries and USFWS
Three local projects funded with Nickel Funds revenues will be lead through the consultation process by local governments (City of Shoreline the City of Bremerton and the Hood Canal Coordinating Council) Two projects for WSDOT to deliver statewide (Statewide Bridge Rail Retrofit and Statewide Guardrail Retrofit) will be taken through consultation by the regional offices acting on a regional basis Two regions have already completed the consultation process for these projects
A team of three experienced WSDOT biologists was deployed to the Western Washington Office of the USFWS to address the approximately 20 projects stalled in review This staff assignment accomplished the completion of consultations for 15 projects including the SR 9 ndash SR 522 to 176th St project A new backlog is beginning to build due to the need to reinitiate consultation on a number of projects including the Hood Canal Bridge Replacement In addition the backlog is compounded with the extensive amount of time that seems to be required to be spent in consultation on some of the more complex projects The Federal Highway Administration WSDOT and USFWS are continuing discussions on how to address this problem
Program Delivery Tracking Sheet for ESA Section 7 Consultation WSDOT Projects rsquo03 -rsquo05 Biennium
NOAA Fisheries USFWS
Project Biological Assessment
Consultation Status
Biological Assessment
Consultation Status
NEPA Type
NEPA Complete
Proposed Ad Date
SR 31 Metaline Falls to Inttrsquol Border NA NA 81003 Waiting EA 120503 41004
I-90 Two Way Transit and HOV 11212003 Waiting 122103 Waiting FEIS 033004 106
Consultant Utilization
There are two main areas where consultants are expected to be utilized on 2003 Transportation Funding Package projects The first is to augment WSDOTrsquos workforce so WSDOT can minimize the inefficiencies associated with short-term workforce expansions and contractions The second is to fill needs for specialized expertise that may not be available ldquoin-houserdquo
When WSDOT established the Urban Corridors Office in 2003 contracting efforts were directed at having a sufficiently large pool of qualified talent to draw from quickly and efficiently without time delays With that goal currently being met the emphasis has shifted slightly to identifying the ldquoBest of the Bestrdquo in a variety of specialized areas allowing WSDOT to draw upon top expertise at national and international levels
Regional Transportation Improvement District (RTID) Projects The 2003-2005 Transportation Budget requires the Regional Transportation Improvement District (RTID) to conduct an independent review of all project scopes and budgets prior to placing projects on the ballot WSDOT management is assisting RTID by identifying and assembling a ldquoPanel of Expertsrdquo to review CEVPreg and Cost Risk Assessment projects National or international experts with experience in a wide range of engineering disciplines and in cost risk assessment will be sought The panel selection should be complete early next quarter
Beige Pages - Measures Markers and Mileposts - December 31 2003 24
24 Beige Pages - Measures Markers and Mileposts - December 31 2003
On-Call Services WSDOT currently has over 200 different consulting firms committed to providing services to the State on short notice through ldquoOn-Callrdquo contracts Many of these firms which range from single person consultants to large multi-tiered organizations have internationally recognized experts on staff Currently twelve prime contractors plus their sub-consultants are under contract to provide project specific services across the state
2003 Transportation Funding Package - Consultant Utilization to Date For the quarter ending December 31 2003 WSDOT paid $2556500 to firms providing services on 2003 Transportation Funding Projects Over 300 people were working directly on a full or part time basis on these projects Over $5000000 was authorized as new work in the quarter
Construction Employment Information
Contractor Employment
The 2003 Transportation Funding Package supports transportation projects that make important and long-term contributions to the statersquos economy and the productivity and economic well-being of its citizens Far from the only or even the largest of these impacts is the direct and indirect economic benefits of the construction activity itself one aspect of which is the creation of jobs to built the projects
The direct and indirect benefits of construction employment have been extensively examined by labor economists A useful guide is Associated General Contractors of Washington Economic Impact of the Construction Industry on the State of Washington 2002 Update (prepared by the University of Washington)
How many people are at work on the 2003 Transportation Funding Package projects
The precise number for obvious reasons is impossible to state The jobs are not just at the job site but include designers and project engineers (many of whom divide their efforts among many projects) suppliers and their employees and many others Even for the contractors employment supported by these projects includes home office as well as job site staff And at the job site the employment count varies from day to day depending on subcontractor activity the sequencing of job activities and even the weather We have asked contractors on the Nickel Fund projects in construction to provide the WSDOT construction office with a ldquosnapshotrdquo number what is your best estimate of the ldquoaveragerdquo direct job site employment on your job over the course of the quarter The following table captures the prime contractorsrsquo responses for their own work and their on-site subcontractors on the Nickel Fund projects that have already gone into construction
ProjectContractor
Average project employment for Oct-Dec 2003
I-5 Widening Each Direction from Salmon Creek to I-205 Hamilton Construction and its 24 subcontractors
24 employees
SR 500 New Interchange and Additional Lanes Tapani Underground Inc and its 18 subcontractors
21 employees
I-90 Build Lanes from Argonne Road to Sullivan Rd Scarsella Brothers Inc and its 13 subcontractors
19 employees
I-90 Rye Grass Summit to Vantage Superior Paving Company and its 10 subcontractors
14 employees
I-90 Highline Canal to Elk Heights Scarsella Brothers Inc and its 12 subcontractors
17 employees
I-182US 395 Interchange ndash Roadside Safety Transtate Paving Company and its 2 subcontractors
6 employees
Construction Safety Information WSDOT and the AGC are currently finalizing the details of a method to jointly report safety data for the nickel projects The expected outcome will be a combined safety rating for the contractor and WSDOT staff on each of the Nickel Fund projects
Beige Pages - Measures Markers and Mileposts - December 31 2003 25
Beige Pages - Measures Markers and Mileposts - December 31 2003 26
Worker Safety Quarterly Update Continuing updates on Gray Notebook safety topics ndash data is shown for calendar year (CY) 2000 CY 2001 fiscal year (FY) 2002 FY 2003 and FY 2004 by quarter
WSDOT Highway Maintenance WorkersRecordable Injuries per 100 Workers per Fiscal Year
CY 2000
CY 2001
FY 2002
FY 2003
Qrtr 1 Qrtr 2 YTD 2004
0
5
10
15
20
FY 2004
Highway and Street Construction Benchmark 82
The second quarter recordable injury rate for maintenance workers was 62 injuries per 100 maintenance workers There were 22 recordable injuries during the second quarter of which 9 were lost workday cases accounting for 202 lost workdays This is a 24 decrease in injuries and a 17 reduction in lost workdays from the first quarter The three most frequent types of injuries for the second quarter were dislocation (27) occupational illness (23) and sprainstrain (23) The three most frequent causes of injuries for the quarter were struck by an object (23) overexertion (18) and falls from the same level (14) The three most frequent injuries to the body were back (32) ear (14) and hand (9)
Accident Prevention Activities Second Quarter FY 2004 bull The South Central Regionrsquos Maintenance division is identifying
targets and strategies to decrease personal injuries within work groups Four of five sections reduced their yearly injury average Accountability and awareness has increased substantially and the numbers reflect significant improvement
bull The Eastern Region is revising its Accident Review Board process to make it more accountable for overall safety
bull WSDOT completed a successful West Nile Virus campaign during the second quarter Between May and October 2003 WSDOT spent about $92000 for the West Nile Virus program This included obtaining materials training people monitoring sites and application of pesticides under the direction of the Department of Health (DOH) DOH reported that no human or animal cases were confirmed in Washington in 2003 However nationally in 2003 there were 7718 human cases with 166 deaths In 2002 there were 4156 cases and 284 deaths
Reading the ChartsldquoRecordable Injuries and Illnessesrdquo is a standard measure that includes all work related deaths and work related illnesses and injuries which result in loss of consciousness restriction of work or motion transfer to another job or require medical treatment beyond first aid The US Bureau of Labor Statistics provides the selected 2000 national average benchmarks After discussion with the National Bureau of Labor Statistics the following benchmarks were selected to provide a more relevant and consistent benchmark Maintenance ldquoHighway and Street Constructionrdquo Standard Industry Classification (SIC) 161 (rate 82) Engineering ldquoEngineering and Architect Servicesrdquo SIC 871 (rate 17) Ferry Vessel Workers ldquoWater Transportationrdquo SIC 44 (rate 70) One worker equals 2000 hours per year
WSDOT Ferry Vessel WorkersRecordable Injuries per 100 Workers per Fiscal Year
0
5
10
15
20
CY 2000
CY 2001
FY 2002 FY 2004
Qtr 1 YTD 2004
FY 2003
Qrtr 2
Water Transportation Benchmark 70
The second quarter recordable injury rate for ferry vessel workers was 98 injuries per 100 ferry vessel workers There were 23 recordable injuries during the second quarter of which 21 were lost workday cases accounting for 268 lost workdays This is a 4 decrease in the number of recordable accidents and a 36 reduction in the number of lost time days from the first quarter There are less worker hours this quarter causing a slight increase in the recordable accident rate even though the actual number of accidents dropped slightly The three most frequent types of injuries were sprainstrain (52) chemical exposure (13) and aggravation of a previous injury (13)The three most frequent injuries to the body were the back (13) circulatory system (13) and multiple (13)
Source for all charts WSDOT Safety Office
WSDOT Highway Engineer WorkersRecordable Injuries per 100 Workers per Fiscal Year
CY 2000
CY 2001
FY 2002
FY 2003
Qrtr 1 Qrtr 2 YTD 2004
0
5
10
15
20
FY 2004
Engineering and Architect Services Benchmark 17
The second quarter recordable injury rate for engineer workers was 16 injuries per 100 engineer workers There were 8 recordable injuries during the second quarter of which 7 were lost workday cases accounting for 56 lost workdays There are less worker hours this quarter causing a slightly higher accident rate even though the number of injuries remained the same The three most frequent types of injuries for the quarter were sprain strain (38) occupational illness (25) and lacerations (25) The three most frequent causes of injuries were overexertion (25) falls from the same level (25) and noise (25) The three most frequent injuries to the body were the back (25) ear (25) and knee (13)
Measures Markers and Mileposts - December 31 2003 27
Measures Markers and Mileposts - December 31 2003 29
0
5000
6000
7000
June Dec June Dec June Dec June Dec June Dec June Dec June 1997 1997 1998 1998 1999 1999 2000 2000 2001 2001 2002 2002 2003
Number of Permanent Full-Time Employees at WSDOT
Initiative 695 passed by voters
Referendum 49 passed by voters
5617 5671 6017 5960 5992 6181 6322 6366
Referendum 51 defeated by voters
6325 6171 6258
Dec 2003
WSDOT Workforce Levels One indicator of the agencyrsquos workforce size is the current number of permanent full-time employees on staff The accompanying chart shows that number at various points since the end of 1996 (The number of ldquoFTEsrdquo [full-time equivalents] will generally exceed the number of full-time employees since seasonal and part-time work force must also be funded from ldquoFTErdquo allotments)
Source WSDOT Office of Human Resources
Training for WSDOT Highway Maintenance Employees WSDOT continues progress toward achieving training goals for maintenance employees A total of 24 safety and maintenance courses are required by law andor regulation The chart shows status of training completed for 6 of the 13 required safety courses and 5 of the 11 maintenance courses
Maintenance Total Current Workers Maintenance Maintenance Maintenance Compliance Change
Requiring Workers Workers Workers to Date Since Training Trained to Date Trained 1st Trained 2nd Target = Last Dec 03 Dec 03 Quarter FY04 Quarter FY04 90 Quarter
Safety CoursesBlood Borne Pathogens 1243 1064 13 46 86 +2First Aid 1480 1383 6 0 93 -2Hearing Conservation 1363 1255 0 0 92 -3Personal Protective Equipment 1361 894 216 0 66 +1Fall Protection 750 403 19 0 54 +2Flagging amp Traffic Control 1149 1109 1 0 97 -1
Maintenance Courses Drug Free Workplace 326 287 0 0 88 +1Forklift 1173 1036 37 28 88 +0Hazardous Materials Awareness 986 671 85 90 68 +8Manlift Operations 523 307 0 8 59 -3Excavation Trenching and Shoring 438 302 45 93 69 +13
Training for All WSDOT Employees The following table reflects continued progress on important workforce training courses that help shape WSDOTrsquos workplace These courses are for all permanent full-time part-time and temporary employees The goal is to have 90 of our workforce trained as promptly as resources allow
Number of Number Employees Number Number Compliance Change
Requiring Trained to Date Trained 1st Trained 2nd to Date Since LastTraining Dec 03 Quarter FY04 Quarter FY04 Target = 90 Quarter
Training CoursesDisability Awareness 7295 2567 116 131 35 +1Ethical Standards 7295 7050 82 82 97 0Security Awareness - all employees 7295 5711 17 0 78 +4Security Awareness - supervisors 2884 1474 0 0 53 +1Sexual HarassmentDiscrimination 7295 4880 71 149 67 +14Valuing Diversity 7295 3200 129 142 44 +2Violence that Affects the Workplace 7295 5910 6 7 81 +6
In past quarters non-supervisory employees were incorrectly credited by WSF for attendance at Security Awareness for Supervisors training This has now been corrected
Source WSDOT Office of Human Resources Staff Development
Measures Markers and Mileposts - December 31 2003 28
28 Measures Markers and Mileposts - December 31 2003
Highway Construction Program Quarterly Update Meeting WSDOTrsquos Scheduled Advertisement Dates The Highway Construction Program is the largest capital program in the Transportation Budget Planned expenditures for the 2003-2005 biennium are approximately $23 billion Overall delivery of the Highway Construction Program is tracked and monitored against schedule projections for ad dates and for project cash flow The first is ldquoMeeting WSDOTrsquos Scheduled Advertisement datesrdquo The second is ldquoCash Flowrdquo Funding for the 2003-2005 Highway Construction Program includes a variety of fund sources including pre-existing transportation funds 2003 Transportation Funding Package (ldquoNickelrdquo funds) and Tacoma Narrows Bridge funds The program includes 345 construction projects for advertisement during the current biennium of which 46 are ldquoNickelrdquo projects and 299 are funded with pre-existing funds Overall including preconstruction activities on construction projects to be advertised in future biennia more than 1000 projects will be underway during the 2003-2005 Biennium In the 2003 Transportation Funding Package there were 20 projects originally planned for advertisement in the biennium through the end of the second quarter Of the planned total 15 have been advertised four have been rescheduled for later in the biennium and one has been deferred to the 2005-2007 biennium There were 70 pre-existing fund projects planned for advertisement by the end of the second quarter 42 have been advertised as planned 26 have been rescheduled for later in the biennium and two have been deferred to the 2005-2007 biennium In addition three projects were advanced from quarters later in this biennium and were advertised in the first quarter for a total of 45 projects that have been advertised to date
Ad Date 2003 Transportation Funding Package (ldquoNickel Fundsrdquo) Of the nine projects planned to be advertised in this quarter seven projects were advertised as planned one project was delayed for advertisement to later in the biennium and one will be deferred to the 2005-2007 biennium (for more detail see the Beige Pages) One project was advanced from the eighth quarter for a total of eight advertised projects
bull Seven projects were advertised as plannedSR 9SR 528 Intersection ndash SignalSR 16 HOV Improvements between Olympic
View Drive and Union Ave US 97A Entiat Park Entrance ndash Turn Lanes SR 124 East Jct SR 12 - Reconstruction
Highway Construction Program Delivery Planned vs Actual Number of Projects Advertised 2003-2005 Biennium Quarter 2 Ending December 31 2003
350
300
250
200
150
100
50
0 Qtr 1 Qtr 2 Qtr 3 Qtr 4 Qtr 5 Qtr 6 Qtr 7 Qtr 8
Planned Pre-Existing Funds Ads
Actual Pre-Existing Funds Ads
Transportation Funding Package Planned Ads
Transportation Funding Package Actual Ads
Source WSDOT Project Control and Reporting Office
SR 161234th Street to 204th Street ESR 203NE 124thNovelty Rd VicinityUS 395Kennewick Variable Message Sign
bullOne project was advanced SR 527132nd St SE to 112th St SE
bullOne project was delayed to a future quarter in 2003-2005 SR7SR 507 to SR 512 ndash Safety
bullOne project was deferred to 2005-2007 SR 522I-5 to SR 405 Multi-Modal Project
Ad Date Pre-Existing Funding Of the 58 projects scheduled for advertisement with pre-existing funds in the second quarter 34 projects were advertised as scheduled 22 have been delayed slightly to later in the 2003-2005 biennium two were deferred to beyond the 2003-2005 biennium and two projects were advertised in response to emergencies bull The following are six examples of pre-existing projects advertised as planned US 101 Olympic National Park to Indian Creek ndash This project overlays approximately three miles of existing roadway pavement between Olympic National Park and Indian Creek I-5 Stewart - South Bound off Ramp ndash The existing signal system will be replaced with a signals using poles and mast arms WSDOT will be conducting a feasibility assessment of connecting the new signal system to the City of Seattlersquos centralized system SR 11 Whatcom County Line to Bellingham ndash This project will resurface approximately four miles existing roadway and restore safety features between the Whatcom County Line and the City of Bellingham
Measures Markers and Mileposts - December 31 2003 29
Measures Markers and Mileposts - December 31 2003 31
SR 26 Union Flat Creek-Improve Drainage On SR 26 west of Colfax the design of this project will stabilize the roadway structure by reconstructing approximately 1200 linear feet of creek channel away from the roadway There will also be check dams to slow the flow of the creek and protect the roadway from erosion
SR 127 Central Ferry to Church Hill Road At Central Ferry and extending eight miles north on SR 127 the project preserves the pavement and extends the service life by paving with Asphalt Concrete Pavement mixture and will restore the basic safety features of the highway US 97 Blewett Pass South ndash Paving From the junction with SR 970 to the north of the summit the project is to resurface existing roadway pavement to maintain the integrity of the roadway
bull The following are two examples of delayed projects SR 20 Troxell Road to Deception Pass ndash Current design issues could not be resolved and will require additional engineering changes to meet environmental requirements This will delay the project until February 2005 US 395 Deadman Creek Fish Barrier Retrofit ndashAfter a project costbenefit analysis was conducted in conjunction with the Department of Fish and Wildlife both WSDOT and WDF believe that funds for this project could be used for similar projects that would gain better results
bull Two projects were added in response to emergencies SR 20 Rockslide ndash On Sunday November 9 2003 at 6 am a rockslide estimated at two to three million cubic yards occurred above State Route 20 at milepost 1215 The rockslide left the hillside extremely unstable damaged two sections of the highway and left the small town of Diablo cut off Currently monitoring equipment and minor highway repairs give Diablo residents Seattle City Light personnel National Parks Service and WSDOT personnel limited access to the highway The highway is open between 8 am and 4 pm when flaggers are in place In early February 2004 contractors will turn in a report to WSDOT with proposals for long-term solutions that will reopen the highway permanently US 101 Hoh River Erosion ndash In response to storm-related erosion WSDOT replaced washed out armoring and stream barbs with huge boulders along the Hoh river bank in an effort to keep the river from washing out sections of SR 101 Placement of the boulders is a temporary solution A permanent solution to this problem is being reviewed To meet permitting requirements of the Washington State Department of Fish and Wildlife WSDOT completed a Reach Analysis for this section of river in 2002 The Federal Highway Administration reviewed WSDOTrsquos approach to fixing the problem and has agreed to fund a permanent solution with federal funds WSDOT is now completing a conceptual design in accordance with the Reach Analysis and will have a cost estimate completed by the end of February 2004
Cash Flow on Highway Construction ProjectsHighway Construction Program Cash Flow2003 Transportation Funding Package Highway Construction Program Cash FlowPlanned vs Actual Expenditures (ldquoNickel Fundsrdquo) Planned vs Actual Expenditures 2003-2005 Biennium Quarter 2 ending December 31 20032003-2005 Biennium Quarter 2 Ending December 31 2003Dollars in BillionsExpenditures for highway projects through the quarter Dollars in Billions
ending December 31 2003 were $442 million This $12
represents 8 percent of the budgeted cash flow for the biennium At this point expenditures using the 2003 Transportation Funding Package are within one percent of meeting the plan The expenditure rate will increase as more projects are awarded or moved from a pre-existing project and added to the nickel list of projects The expected pattern of 2003 Transportation Funding Package spending is illustrated by the fact that expenditures in the 8th quarter of 2003-2005 are expected to be 28 percent of the entire bienniumrsquos budgeted cash flow
Qtr 1 Qtr 2 Qtr 3 Qtr 4 Qtr 5 Qtr 6 Qtr 7 Qtr 8
Source WSDOT Project Control and Reporting Office Pre-Existing Funding For the first two quarters of the biennium WSDOT submitted an expenditure plan to the legislature for approximately $328 million As of December 31 2003 expenditures totaled $265 million This leaves a variance of approximately $64 million or 192 percent from the plan WSDOT is currenlty seeking legislative direction on projects with programmatic variance
$0
$02
$04
$06
$08
$10
Planned Pre-Existing Funds
Actual Pre-Existing Funds Planned
Transportation Funding Package
Actual Transportation
Funding Package
Measures Markers and Mileposts - December 31 2003 30
30 Measures Markers and Mileposts - December 31 2003
Special Safety Improvements Quarterly Update
Meeting WSDOTrsquos Scheduled Advertisement Dates for the Safety Improvement Subprogram While elements that improve safety are a part of almost every highway construction project a special program sub-category established by the legislature covers the projects that are designed to address issues in ldquohigh accident corridorsrdquo and ldquohigh accident locationsrdquo These projects are identified by WSDOT based on information about the history of accident frequency and severity While these projects account for only a small portion of the overall benefits to safety from highway improvements WSDOT tracks the advertisement of these projects just as with other projects in the program in order to provide a picture of program delivery on issues that are of great importance on particular locales around the state that have been selected for this program treatment bullOf the 14 projects planned for ad these six projects were advertised as scheduled for this quarter
I-5Ramps at Michigan ndash CorsonAlbroSwift SR 9SR 528 Intersection ndash Signal I-90Moses Lake West Safety Improvements SR 124East Jct SR 12 ndash Reconstruction SR 203NE 124thNovelty Rd Vicinity US 395Kennewick Variable Message Sign
Safety Improvement Program Delivery Planned vs Actual Number of Projects Advertised 2003-2005 Biennium Quarter 2 Ending December 31 2003
90
80
70
60
50
40
30
20
10
0
Actual
Planned
Qtr 1 Qtr 2 Qtr 3 Qtr 4 Qtr 5 Qtr 6 Qtr 7 Qtr 8
Source WSDOT Project Control and Reporting Office
bull Eight projects were deferred for advertisement later in the biennium
SR7SR 507 to SR 512 ndash Safety SR 20Oak Harbor NCL to Frostad Road SR 20Monkey Hill Rd to Troxell Rd SR 20Sapp Rd to Reed St ndash Rechannelize SR 20Troxell Rd to Deception Pass Vic SR 20Frostad Road Vicinity ndash Guardrail SR 24South Wahluke Slope ndash Guardrail SR 290Helena Street ndash Add Turn Lane
Measures Markers and Mileposts - December 31 2003 31
Measures Markers and Mileposts - December 31 2003 33
End-of-2003 Season Highway Construction Project EvaluationsThird Annual Report The annual Construction Highlights report is an end-of-the-year synopsis of construction projects that were completed or nearly completed during the previous construction season Each regionrsquos project office evaluates how well its projects were carried out This is WSDOTrsquos third year publishing this report
This yearrsquos report is an assessment of 23 projects statewide representing a variety of construction types and settings Each project is rated in four elements of construction ndash design construction management schedule and cost and each element is assigned a one-to-five star rating (one is the lowest ranking while five is the highest) Contractorrsquos names are listed for identification but the detailed report shows that the strength or weaknesses of a particular project are often as much WSDOTrsquos responsbility as the contractorrsquos (guiding of design for example) and the best projects seem always to be built on strong teamwork for the entire project team The complete report can be found at wwwwsdotwagov projects2003highlights
Highway Construction Project Rating for 2003 Season Construction
Project Design Management Schedule Cost Contractor SR 504 Castle Rock laquolaquolaquolaquolaquo laquolaquolaquolaquolaquo laquolaquolaquolaquolaquo laquolaquolaquolaquolaquo Lakeside Ind SR 28 Rock Island laquolaquolaquolaquolaquo laquolaquolaquolaquolaquo laquolaquolaquolaquolaquo laquolaquolaquolaquolaquo Scarsella Bros US 395 Hillsboro laquolaquolaquolaquo laquolaquolaquolaquo laquolaquolaquolaquolaquo laquolaquolaquolaquolaquo M A DeAtleySR 26 Vantage laquolaquolaquolaquo laquolaquolaquolaquolaquo laquolaquolaquolaquolaquo laquolaquolaquolaquolaquo Central WA AsphaltSR 8 McCleary laquolaquolaquolaquo laquolaquolaquolaquolaquo laquolaquolaquolaquolaquo laquolaquolaquolaquo Scarsella BrosUS 12 Brady - Malone laquolaquolaquolaquo laquolaquolaquolaquolaquo laquolaquolaquolaquolaquo laquolaquolaquo Lakeside IndI-90 Sunset laquolaquo laquolaquolaquolaquo laquolaquolaquolaquolaquo laquo Kiewit ConstI-405SR 167 IC laquo laquolaquolaquo laquolaquo laquo Max J KuneySR 520 10th to Midspan laquolaquolaquolaquo laquolaquolaquolaquo laquolaquolaquo laquolaquolaquolaquolaquo Colvico IncI-90 Eastgate laquolaquolaquolaquo laquolaquolaquolaquo laquolaquolaquolaquo laquolaquolaquolaquolaquo Lakeside IndI-405 Cole Creek Parkway laquolaquolaquo laquolaquolaquolaquo laquolaquolaquolaquo laquolaquo Tri-State ConstructionSR 141 Klickitat Co Paver laquolaquolaquolaquo laquolaquolaquolaquolaquo laquolaquolaquolaquolaquo laquolaquolaquolaquolaquo Mid-Columbia PavingSR 20 Methow River Bridge laquolaquolaquolaquo laquolaquolaquolaquolaquo laquolaquolaquolaquo laquolaquolaquolaquolaquo One Way ConstructionSR 167 N Meridian to King laquolaquolaquolaquolaquo laquolaquolaquolaquolaquo laquolaquolaquolaquolaquo laquolaquolaquolaquolaquo ICON MaterialsI-5 Puyallup River Bridge laquolaquolaquolaquolaquo laquolaquolaquolaquolaquo laquolaquolaquolaquolaquo laquolaquolaquolaquolaquo CBI IncSR 161 Clear Lake Rd laquolaquolaquolaquolaquo laquolaquolaquolaquolaquo laquolaquolaquolaquolaquo laquolaquolaquolaquolaquo Tucci and SonsSR 525 SR 99 to SR 526 laquolaquolaquolaquo laquolaquolaquolaquo laquolaquolaquolaquolaquo laquolaquolaquolaquo KLB ConstructionUS 2 Barclay Creek Bridge laquolaquolaquolaquo laquolaquolaquolaquolaquo laquolaquolaquolaquolaquo laquolaquolaquolaquolaquo Wilder ConstructionSR 290 Trent Ave Bridge laquolaquolaquo laquolaquolaquo laquo laquolaquolaquolaquo Ross BrosI-90 Sullivan Rd laquolaquolaquolaquolaquo laquolaquolaquolaquolaquo laquolaquolaquolaquolaquo laquolaquolaquolaquolaquo Inland Asphalt CoSR 510 I-5 Pacific laquolaquolaquolaquo laquolaquolaquolaquo laquolaquolaquolaquo laquolaquolaquolaquo Scarcella BrosSR 125 Military Road laquolaquolaquolaquo laquolaquolaquolaquo laquolaquolaquolaquolaquo laquolaquolaquo Transtate PavingI-5 Samish Way laquolaquolaquolaquo laquolaquolaquolaquo laquolaquolaquolaquolaquo laquolaquolaquo Wilder ConstructionFour other projects of interest were included in the report but not evaluated SR 16 Tacoma Narrows Bridge SR 104 Hood Canal Bridge SR 433 Lewis and Clark Bridge and the Moses Lake Wetland Mitigation Bank Five star rating system one represents the lowest rating five represents the highest
WSDOT Asks the Publicrsquos Opinion Included for the first time in this annual Construction Highlights report is a public opinion questionnaire evaluating one project in each of WSDOTrsquos six regions Motorists who traveled through state highway construction projects over the past summer have an opportunity to tell WSDOT what they did or did not like what worked or did not work by visiting wwwwsdotwagovprojects2003highlights
WSDOT will use the public comments to improve the way projects are managed and communicated in the future Results of the public evaluation will be posted for each of the six projects Projects included are I-90 Sunset Interchange in King County I-5 Puyallup River Bridge in Pierce County State Route (SR) 141 Klickitat County Paver US 395 Hillsboro Street Interchange in Franklin County I-90 Sullivan Road to Idaho State Line Paving in Spokane County and SR 28 Rock Island Rock Slopes in Douglas County
Measures Markers and Mileposts - December 31 2003 32
32 Measures Markers and Mileposts - December 31 2003
Gig Harbor Tacoma
For scale The ferry Tacoma
Tacoma Narrows Bridge Project Update Designbuilder Tacoma Narrows Constructors (TNC) now stands at 263 construction completion of the new State Route 16 Tacoma Narrows Bridge project In December 2003 TNC reached another significant milestone ndash that of ldquotouching downrdquo the Gig Harbor (west) caisson onto the 133-foot-deep Narrows seabed In January TNC expects to touch down the Tacoma (east) caisson on the seabed at an even lower depth of 149 feet Following touchdown crews will continue placing reinforced concrete to build caisson internal and external walls while they dredge soil from the 15 hollow cells in each caisson Dredging will allow the caissons to sink another approximately 60 feet into the Narrows seabed At that point crews will start building the towers above water Other bridge work continues as well including anchorage construction and the overseas fabrication of the suspension cable wire Excavation work on both the Tacoma and Gig Harbor anchorages is finished The Tacoma anchorage has already had four massive concrete pours and crews are preparing to begin placing concrete on the Gig Harbor anchorage Roadwork also continues to move at a rapid pace Crews plan to complete the new eastbound on ramp and exit at 36th Street NW along with 22nd Street construction and open all to traffic in March Construction continues on several large retaining walls erosion control measures are in place for the winter season and landscaping along SR 16 is underway On February 2 the state Department of Ecology (DOE) fined WSDOT and TNC jointly $10000 for inadequate treatment of construction storm water During several rain events between October and January discharges of cloudy stormwater from the project site in the Narrows exceeded permit limits Since October project staff have worked hard to improve environmental compliance by implementing DOE environmental recommedations including implementing best-management-practice
Measures Markers and Mileposts - December 31 2003
Landscaping at 36th St on-ramp
Tacoma anchorage concrete pour Tacoma caisson concrete pour
Tacoma caisson construction
Tacoma Narrows Bridge Project Progress to Date Percent Complete
995Design
263Construction
314Total(1)
0 10 20 30 40 50 60 70 80 90 100
(1) Weighted 7 Design progress and 93 Construction progress
Source WSDOT Engineering and Regional Operations Division
stormwater treament controls increasing water monitoring and testing and monitoring stormwater detention ponds steps For more information on WSDOTrsquos environmental commitments see page 45 of this Gray Notebook For additional information including financial information project schedule traffic information photo library and more please visit wwwtacomanarrowsbridgecom
33
Measures Markers and Mileposts - December 31 2003 35
104 Hood Canal Bridge Project Update
Graving Dock Progress on the project remains almost at a standstill as efforts continue among WSDOT the Lower Elwha Klallam Tribe the State Office of Historic Preservation FHWA and the Army Corps of Engineers to resolve issues presented by the discovery in August 2003 of a significant archaeological find The process must establish compliance with the requirements of Section 106 of the National Historical Preservation Act in order for construction work to resume at the site probably following a period of intensive archaeological activity Meanwhile despite the lack of physical construction at the graving dock site the contractor completed a restoration project at Ediz Beach Close to 1500 feet of shoreline was cleared contoured and reseeded For many years the Ediz Beach area was unsafe and inaccessible due to logs pilings and other debris WSDOT removed these articles at low tide to avoid disturbing the harbor waters This restoration provides a healthy natural environment for native plants and animals and may also encourage the spawning of sand lance (a small fish) a significant portion of juvenile salmonrsquos diet It was completed on time and in accordance with a Hydraulic Project Approval (HPA) issued by the Department of Fish and Wildlife as mitigation for
Project Progress to Date Percent Complete
Total 88
0 10 20 30 40 50 60 70 80 90 100
(Percent completion based on contract dollars)
Source WSDOT Engineering and Regional Operations Division
Before
After
use of shoreline access to the graving dock The mitigation project had to be completed before October 15 2003 to minimize disturbance of the sand lance during its spawning period
Bridge Site Construction continued at the bridge site with the contractor Kiewit-General of Poulsbo building a temporary work trestle at the bridgersquos east end The work trestle eventually will support the new east-half transition span Plans are to roll the existing span onto a second temporary work trestle and roll the new transition span into place A long weekend closure is expected sometime in 2005 or 2006
For more information please visit wwwwsdotwagovprojectssr104hoodcanalbridgeeast
Measures Markers and Mileposts - December 31 2003 34
34 Measures Markers and Mileposts - December 31 2003
Highway Safety Improvement Projects Quarterly Update
Many of the highway safety improvement projects installed or constructed by WSDOT seek to improve safety in an area identified by unusually high frequencies of accidents Do these safety improvement projects in fact lead to safer conditions WSDOT reports below on a very encouraging review of before-and-after accident statistics in relation to 21 such projects from locales around the state Also featured this quarter are results from a study on
bull Cable Median Barrier - Across the Median Protection a project intended to benefit longer stretches of highway
bull Impacts of the 08 DUI law assessed over a six year period
bull Safe Routes to School program and
bull A roundabout project in the City of Port Orchard
Safety Projects ndash Before and After Results Each year WSDOT completes a variety of safety improvement Combined Average for 21 Safety Projects projects throughout the state highway system ranging from Collisions Per Year adding turn lanes and signals to installing median barrier and
Propertyrumble strips To begin to determine their effect on reducing the All Types Damage Only InjuryFatalnumber and severity of traffic collisions a preliminary before-
Before 155 88 67and-after study has been conducted for 21 such projects Projects After 97 55 42were chosen that permitted at least 18 months of collision data
to be analyzed in the before period and at least 12 months in the Source WSDOT Transportation Data Office
after period The data was then normalized (12 month average) to make a fair comparison
Preliminary results indicate that for this 21 project sample the average number of collisions per year for all projects combined was reduced by 37 percent Likewise the average number of fatal and injury collisions per year also declined by 37 percent As additional data becomes available this safety project analysis will be updated and expanded
To provide examples of the various types of highway improvements that were indicated in the study additional details about three different projects are provided below and on the next page
I-90 Gold Creek to Easton Hill Vicinity Kittitas County Screens were installed in the median at these two locations to reduce the night time headlight glare from on-coming traffic Prior to installation of the screens these two sections of I-90 had a combined average of 194 night time collisions per year After the installation this figure dropped to 137 a 29 percent decrease In addition for collisions that involved only damage to property the decline in the after period was even greater from 152 to 6 or a 60 percent reduction
Glare screen installed on median barrier along I-90
I-90 Ritzville to Tokio This project involved flattening side slopes installing rumble strips upgrading illumination and repaving Before the project started there was an average of 39 collisions per year in this 13-mile section of I-90 Since the project was completed this dropped to 21 collisions per year a 46 percent decrease The percentage decrease in fatal and injury collisions was nearly as large dropping by 34 percent In looking at specific categories of collisions additional reductions are shown a 9 percent decrease in non-daylight collisions a 31 percent decline in collisions on wet pavement surfaces and an 8 percent drop in overturns
Slope flattening and new pavement on I-90 near Ritzville
Measures Markers and Mileposts - December 31 2003 35
Measures Markers and Mileposts - December 31 2003 37
SR 99 Battery Street Tunnel Seattle In order to reduce the number of collisions occurring on wet pavement surfaces the concrete roadway was ground to increase friction Before the project this section of SR 99 experienced an average of 775 collisions per year 475 of which were on wet pavement After the project was completed total collisions decreased to 305 per year while wet surface collisions declined to 102 per year a reduction of 61 percent and 79 percent respectively If only injury collisions are considered the decrease after the project was completed is nearly as dramatic from 295 per year down to 148 or a 50 percent drop
Concrete pavement grinding to increase friction on SR 99 at theThe summary of all 21 safety projects so far included in the study Battery Street Tunnel in Seattlethat are being analyzed is presented in the table below For a complete table of findings please visit the following web site wwwwsdotwagovmapsdatatdoPDF_and_ZIP_Filessafety_projectpdf
Highway Safety Projects - Before and After Study Collision Data Comparison
Collisions Per Year Property
Available Data DamageProject Title and Location Description of Work (in months) All Types Only InjuryFatal US 2 Sultan-Startup Road Widened SR 2 to provide an EB left turn lane 18 Before 07 00 07Startup Vicinity and a WB left turn pocket 14 After 09 00 09SR 99 Battery Street Tunnel - Safety Constructed roadway surface improvements - 26 Before 775 480 295Seattle pavement grinding 13 After 305 157 148SR 522 NE 145th St Vicinity To NE 155th St Constructed raised median island in place of 18 Before 633 380 253Shoreline existing two way left turn lane Improved visibility 16 After 405 263 143US 2 Applets Way To Vicinity Red Apple Installed median barrier to reduce crossover 23 Before 21 05 16Road Cashmere collisions 12 After 00 00 00SR 1726 Othello - Grade Separation New interchange and illumination 21 Before 74 29 46Othello 12 After 20 10 10SR 24 Hatton Road Ltl Widened and provide left turn channelization 20 Before 12 06 06Othello and improve turning radius 13 After 18 18 00SR 26 Constructed left turn lanes 23 Before 68 37 31Royal City Vicinity 12 After 00 00 00SR 28282 Ephrata - Signal Widened roadway constructed left turn lanes 23 Before 57 57 00Ephrata and installed signal 13 After 37 37 00US 97 Orondo North Realingment and construction of left turn lane 25 Before 05 00 05Orondo Vicinity 12 After 00 00 00US 97 Alt Lakeside Vicinity Constructed two-way left turn lane 21 Before 51 40 11Chelan 16 After 08 08 00SR 150 Chelan West - Turn Lanes Widened and constructed left turn channelization 22 Before 11 05 05Manson 17 After 07 07 00SR 105SR 105 Spur Constructed channelization for right and left turns 29 Before 33 12 21Westport Upgraded illumination 12 After 30 20 10SR 162 Bowman Hilton Rd E to Vicinity Upgraded signal and illumination realignments 19 Before 499 215 284149th Alderton installed signal guardrail and flattened slopes 18 After 467 233 233I-5SR6 Sb Ramp - Signal Signal and illumination installation 25 Before 29 14 14Chehalis 15 After 08 00 08I-5 Chamber Way - Signal Installed signal at NB off-ramp realignments 25 Before 38 29 10Chehalis resurfacing and illumination 15 After 24 24 00US 101 Fowler Street- Signal Installed signal reconfigured with curbs and raised 25 Before 24 19 05Raymond islands 15 After 40 24 16SR 24 Birchfield Road Intersection Installed signalization upgraded illumination 24 Before 55 20 35Yakima Vicinity signing and pavement markings 12 After 50 30 20I-90 West Ersquoburg IC To South Ersquoburg IC Lengthen acceleration lane and tapers Updated 25 Before 149 115 34Ellensburg Vicinity illumination and guardrail Roadway rehab and overlay 12 After 160 130 30I-90 Gold Creek To Easton Hill Installed glare screen along median barrier 26 Before 194 152 42Snoqualmie Pass Vicinity 14 After 137 60 77SR 241 Alexander Road To Factory Rd Constructed two-way left turn lane Channelization 25 Before 120 34 86Sunnyside Vicinity Upgraded signals widened shoulders 4-way stop 21 After 103 63 40I-90 Ritzville To Tokio-safety Matrix Flattened slopes installed rumble strips 28 Before 390 193 197Ritzville Vicinity illumination upgrades and ACP overlay 12 After 210 80 130In addition to the projects shown the I-82Union Gap to Oregon State Line project was analyzed Initial results indicate an increase in collision frequency which is not readily identifiable because of the length of the project weather variation and increased traffic in different locations throughout the project Additional review is underway to identify probable causes for the collisions This information will be presented at a future date Source WSDOT Transportation Data Office
Measures Markers and Mileposts - December 31 2003 36
36 Measures Markers and Mileposts - December 31 2003
The Cable Median Barrier Protection From lsquoAcross the Medianrsquo Collisions
2003-2005 Median Crossover Protection ProjectsErrant vehicles that cross the median into opposing lanes State Lengthof traffic typically cause severe and often fatal collisions Route Project Title (miles) Ad Date
A study of across the median crashes on Washingtonrsquos I-5 Puyallup River To Fife Interchange 19 Aug-03 multilane divided state highways with full access control I-90 Argonne Rd to Pines Rd - Widen 206 Nov-03
I-90 Pines Rd to Sullivan Rd-Widen 211 Nov-03was conducted to evaluate median barrier guidelines and I-90 Moses Lake West-Safety Improvements 1135 Dec-03identify specific highway sections where installation I-5 County Line to Prairie Creek Bridge 245 Jan-04
of a barrier would be appropriate The program I-90 Sullivan Rd to State Line 699 Apr-04adopted after the study is to install cable barriers as I-90 Geiger Road to US-2 237 Oct-04 part of improvement projects when the median width I-5 Pierce Co Line to Tukwila IC HOV- 53 Oct-04 is 50 feet or less Installation of barriers in medians I-90 George Vicinity East - Safety 1582 Oct-04 over 50 feet in width will be weighed against other Source WSDOT Engineering and Regional Operations Division improvements on a case-by-case basis
Cable barriers have been used on the nationrsquos highways since the 1930s or before The modern system which uses three cables supported by weak steel posts was developed in the 1960s and is now in widespread use in several states
Reductions in Severe Collisions Severe Collisions While total collisions in the study areas I-5 in Before and After Cable Median Barrier Installation
Annual Fatal and Disabling Collisions and Median Collision Type Everett Vancouver and Fife nearly doubled (from 7
45 to 100 including collisions with property damage 6only) the number of severe collisions (fatal and
disabling) decreased significantly This resulted in a 5
societal benefit of cable median barriers calculated 4 to be $420000 per mile annually A breakout of the
3 types of severe collisions are shown in the graph to
2the right (graph does not include ldquoproperty damage onlyrdquo collisions) 1
0 The data on the right was normalized and represents 12 months before and 12 months after the project All Median Fixed Object Roll Over Cross Median
Source WSDOT Engineering and Regional Operations Division
Fatal Accidents Disabling Accidents
Before After Before After Before After Before After
Before After
Washington State and Alcohol-Related Fatalities From 1998 to 2002 alcohol-related deaths per 100 million
Washington State Alcohol-Related Fatalities miles driven dropped 11 percent overall from 060 to 054 per Per 100 Million VMT100 million miles driven in Washington A package of anti-1998 to 2002drunk-driving laws enacted in 1998 lowered the blood alcohol
intoxication threshold from 010 to 008 percent and provided 065
for automatic loss of license for drunk driving These legislative steps together with increased State Patrol emphasis on stopping 06
drunk drivers are credited with the decrease Other measures in Washington include increased use of ignition interlock devices 055
(a device attached to the carrsquos ignition system that requires the driver to blow into the device before starting the car ndash if alcohol 05
is detected the car wonrsquot start) and a crackdown on deferred prosecutions 045
DUI 08 Law Enacted
1998 1999 2000 2001 2002
Washington DUI Facts amp TrendsSource ldquoResearch Noterdquo DOT HS 809 680 US Department ofBetween 1983 and 1991 an average of 391 drinking- Transportation National Highway Traffic Safety Administration
driver-involved (DDI) deaths occurred each year Between December 2003 1992 and 2002 an average of 285 DDI deaths occurred each year This improvement means that about 1166 lives have been saved in Washington during the 1990s
Measures Markers and Mileposts - December 31 2003 37
Measures Markers and Mileposts - December 31 2003 39
Safe Routes to Schools Since 1999 WSDOT has administered a five million dollar per biennium grant program appropriated by the legislature called Traffic Safety Near Schools This program has funded more than 70 projects across the state to improve bicyclist and pedestrian safety near schools This program was not however extended to new projects in the 2003-2005 budget In addition the Washington State Traffic Safety Commission currently administers a $2 million annual School Zone Safety grant program that pays for safety education and small traffic safety improvements The program is funded by fines from school zone traffic violations
The Washington State Department of Health (DOH) recently received $800000 in grant funds to promote active community environments a program that will include safe walkride to school routes DOH is currently working with regional county and city governments in areas meeting specific public health criteria across Washington
Safe Routes to Schools mdash Elementary School Locations
Half of the elementary schools in Washington are located on or very near state routes State law requires elementary schools to produce walk route plans
Seattle
Tacoma Olympia
Spokane
Elementary schools on or within 12 mile of a State Route Elementary schools near accident sites (accidents involving elementary agevictims 1995-2001)
Safety in a Roundabout WayPort Orchard Roundabout Safety Improvement During the late 1980s and early 1990s traffic growth in the city of Port Orchard in southern Kitsap County overwhelmed the intersection of Bethel Avenue and Mile Hill Drive (SR 166) eventually generating enough injury and property collisions to classify the intersection as a High Accident Location (HAL) Vehicle speeds exceeding the posted speed limit and the intersection configuration contributed to the collision problem In the mid-1990s after approval of the design by WSDOT the City of Port Orchard built a ldquomodernrdquo roundabout the first of its kind on the state highway system and the second to be built in Washington
After the construction of the single-lane roundabout crash data supports how well a roundabout can work when applied to a site-specific intersection safety problem There are now 48 roundabouts in Washington
Port Orchard -Bethel Ave and Mile Hill Drive Intersection
Number of Collisions and Injuries Before and After Roundabout Comparison 40
30
20
10
0 3 Years Before 3 Years After Roundabout Roundabout
Collisions
Injuries
Source WSDOT Engineering and Regional Operations Division
Measures Markers and Mileposts - December 31 2003 38
38 Measures Markers and Mileposts - December 31 2003
Asset Management Pavement Assessment Annual Update WSDOT maintains approximately 19200 lane miles (including ramps) of pavement surfaces The three major pavement types are chip seal hot mix asphalt pavement and portland cement concrete (PCC) pavement Each of these pavement types has an associated pavement life rehabilitation treatment and rehabilitation cost This report is an annual update of information last presented in the Gray Notebook for the quarter ending December 31 2002
Pavement Condition Update 2002 Results Pavement Condition Trends According to the 2002 pavement condition survey the Percent of Pavements percent of WSDOT pavements in ldquopoorrdquo condition increased slightly in 2002 to 93 percent up from 89 percent as
100
reported in the 2001 pavement survey The rating continues 80
to be dramatically better however than the situation in 1971 when the Washington State Pavement Management System 60
was first put in place 40
Programming Pavements for Rehabilitation 20 The table below shows some important facts about the extent and use of the various pavement types and the success that 0
the state seems to be achieving in directing investment to 1998 2002
areas of need Source WSDOT Materials Lab
Over the last biennium about nine percent of pavement rehabilitation spending has been for chip seal resurfacing These roads the cheapest to Lowest Life Cycle Cost resurface constitute about 23 percent of the lane miles but carry only about five percent (LLCC) Program for of the traffic Pavement Management
The basic principles behind LLCCEighty-eight percent of the spending has been for preservation of hot mix asphalt are rather simple mdash if rehabilitation pavements These roads are 64 percent of the lane miles and carry 71 percent of the traffic is done too early pavement life is
wasted if rehabilitation is done too late very costly repair work may beThe PCC pavements are 13 percent of the lane miles yet carry 23 percent of the required especially if the underlying
traffic PCC pavements have longer lives than other pavements but are very costly to structure is compromised WSDOT rehabilitate not only in terms of construction money but also in traveler inconvenience continually looks for ways to best
strike a balance between these twofrom traffic restrictions when pavement work is performed especially on the major high- basic principles while implementingtraffic corridors Forthcoming replacement of these pavements will bring big challenges the practical aspects of pavement
rehabilitation programsinvolving funding engineering and traffic management during construction (see the discussion on PCC pavements later in this section) The state is fast approaching the need to reckon with this looming financial and traffic crisis in pavement management a story that is not fully revealed by the generally positive picture conveyed by the recent annual surveys of ldquopoorrdquo condition pavements for the entire highway system
1973 1981 1986 1990 1994
Good Condition
Slight increase in percentage of pavement in poor condition 2001 to 2002
Long-term trend declining percentage of pavement in Poor Condition
Pavement Type Lane Miles
Lane Miles
Annual Vehicle Miles Traveled ndash 2002 (in billions)
03-05 Dollars
Programmed (in millions)
05-07 Dollars
Programmed (in millions)
Miles $ $
Chip Seal Pavements A chip seal is a durable surface that provides six to eight years of performance life and has an approximate cost of $12000 per lane mile
4490 234 17 53 $195 9 $182 9
Hot Mix Asphalt Pavements Hot mix asphalt pavement surface life between rehabilitation treatments can range from six to 18 years (based on actual pavement performance) and has a cost of $123000 (due miles) per lane mile and $156000 (past due miles) per lane mile
12284 640 225 715 $1819 84 $1845 91
Portland Cement Concrete (PCC) Pavements WSDOT has experienced PCC pavement lives ranging from 25 to 45 years and has an approximate cost of $330000 for dowel bar retrofit per lane mile and $1 million for full replacement per lane mile
2410 126 73 233 $142 7 $0 0
Source WSDOT Systems Analysis and Program Development Office WSDOT Materials Lab
Measures Markers and Mileposts - December 31 2003 39
Measures Markers and Mileposts - December 31 2003 41
Chip Seals For chip seals asphalt is sprayed on the existing surface and then covered with a layer of rock chips The oil becomes solid as it cools Chip seals are appropriate for low volume roads (less than 2000 vehicles per day and less than approximately 200 trucks per day) Since the roadways that receive this type of treatment are typically on rural routes WSDOT has found that pavement rehabilitation dollars seem to be best spent with efficiency of scale when a stretch of rural road mileage is taken together for resurfacing in a single ldquopaverrdquo contract even when the contract includes aging segments not yet ldquoduerdquo together with ldquopast duerdquo segments
Hot Mix Asphalt On average western Washington hot mix asphalt pavement life is 165 years eastern Washington life is 113 years (due to severe winter cold and extreme summer heat) and the statewide average is 147 years Hot mix asphalt is appropriate for a broad range of roadways from lower volume routes (more than 2000 vehicles per day and more than 200 trucks per day) to interstates with heavy traffic volumes
These pavements are where the greatest benefits of LLCC pavement management can be realized In past biennia there has been some tendency to allocate a share of pavement preservation dollars on a traditional basis by region in addition to dollars programmed strictly by reference to ldquopast duerdquo needs This has resulted in some distortion away from ideal LLCC results As of the 2003-05 biennium this has been corrected by making all regional allocations based on pavement condition and LLCC analysis
Portland Cement Concrete (PCC) Existing PCC pavement life ranges from 25 to 45 years PCC pavement is typically placed on heavily traveled interstate principal arterial and intersection locations Most of the PCC pavements historically installed on Washington highways require dowel bar retrofit and diamond grinding (to smooth the pavement surface) 20 to 25 years after construction (due to lack of reinforcing steel at the transverse joints to prevent settlement) It is estimated that a newly constructed PCC pavement will have a pavement life of 50 years and only require diamond grinding in its 25th year due to studded tire wear
Efficiency Gains for Hot Mix Asphalt Pavements Hot mix asphalt surface life has improved by 14 percent (statewide) over the last six years while over the same time period the vehicle miles traveled on asphalt paved roadways has increased by approximately 10 percent Management of asphalt pavements is an area where WSDOT has succeeded in delivering dramatically improved ldquobang for the buckrdquo to Washington state taxpayers How have WSDOT and its asphalt paving industry contractors achieved this significant efficiency gain in asphalt on state freeways and highways The keys lie chiefly in the following areas bull Provision on the paving specification for use of performance-grade binders selected for expected climate and traffic conditions
bull Use of Superpave mix designs keyed to temperature and traffic expectations
bull Improved asphalt pavement repair and asphalt placement techniques
bull Better attention to construction details and inspection and bull Increased experience with LLCC rehabilitation programming
WSDOT is also focusing pavement management efforts on programming more lane miles at a single location resulting in lower bid prices The amount of asphalt used for pre-leveling (filling in minor ruts and depressions prior to paving) has also been reduced on WSDOT paving jobs generally from 600 tons per lane mile to 300 tons per lane mile resulting in a substantial cost savings The effect of these efficiency gains taken together is that a tax dollar invested in pavement rehabilitation today buys much more than it did just a few years ago
2004 Concrete Lane Miles
Current Age (Construction or Reconstruction)
Total Lane Miles
Lane Miles Rehabiliated to Date by Dowel Bar Retrofit
0-10 1471 00 11-20 2740 00 21-30 5668 350 31-40 6420 3224 41-50 2791 581 51-60 50 02 61 or more 661 00 Total 19800 4157
A matter of concern in the 2002 pavement condition survey is that an additional six miles of PCC pavement were found to have fallen into the ldquopoorrdquo category raising the PCC ldquopoorrdquo total to 170 lane miles However the greatest concern is the potential for a dramatic increase in the poor category as a result of the PCC performance reevaluation in 2004
The table at left illustrates the number of PCC pavement lane miles currently owned and maintained by WSDOT Sixty miles of PCC replacement would cost on the order of approximately $60 million before taking into account the project costs associated with roadway safety upgrades and stormwater runoff control retrofits
Does not include 321 lane miles of bridge Traffic disruptions associated with rehabilitation or replacement of these pavements is sections and 112 lane miles of ramps another difficult feature of this looming problem
40 Measures Markers and Mileposts - December 31 2003
40 Measures Markers and Mileposts - December 31 2003
Rating Pavement Conditions WSDOT continues to use a three-part examination system to rate pavement condition
Pavement Structural Condition (PSC) A pavement will develop structural deficiencies for two reasons truck traffic and cold weather The PSC is a measure based on distress such as cracking and patching which are related to the pavementrsquos ability to carry loads PSC ranges from 100 (best condition) to 0 (worst condition) A roadway should be considered for rehabilitation when it falls within the PSC range of 40 to 60 Rutting Rutting is caused by heavy truck traffic or studded tire wear Ruts deeper than 12 inch have the potential to hold water increasing the risk of hydroplaning for high-speed traffic A roadway should be rehabilitated when the rut depth is greater than 13 inch
Roughness The International Roughness Index (IRI) is a procedure to measure pavement ride A full-sized van with a laser-measuring device mounted on the front bumper measures the roughness of the pavement A roadway should be rehabilitated when the IRI value is between 170 and 220 inches per mile
Determining When Pavements are ldquoDuerdquo The Pavement Condition Rating process using the van pictured on the right analyzes and predicts the pavement rehabilitation due period (see the Gray Notebook for the quarter ending June 30 2001 for details) A regional validation process reviews the results and calibrates the ratings if needed The number of disputed segments varies between 5-10 Each of the segments in question is then reviewed and any discrepancies are resolved WSDOT considers the pavement rehabilitation due year in the Pavement Management System to be approaching 100 accuracy Pavement Condition Data Collection Vehicle
2002 Pavement Smoothness by StateHow Do Washingtonrsquos Pavements Conditions Centerline Miles in PercentCompare with National Experience Miles Poor in Poor
FHWArsquos annual Highway Statistics report includes Rank State Reported Condition Condition information on pavement condition reported by each 1 Georgia 11301 34 03
2 Wyoming 4414 22 05of the 50 states and the District of Columbia (based on 3 Alabama 7643 41 05roughness only) To the right is a snapshot of the 2002 4 North Dakota 6180 53 09 results that shows the number of miles by state in 5 Minnesota 11658 108 09
6 Nevada 2959 33 11poor condition according to smoothness The total miles 7 Kentucky 5192 76 15reported includes the interstate system and principal 8 Florida 10898 160 15
9 Kansas 8851 183 21arterials owned by the state cities and counties and a 10 Arizona 4065 86 21sampling of other functional classes Washington state 11 Idaho 3860 93 24ranked 16th in smooth roads in 2002 (Washington was 12 Maine 2391 60 25
13 Montana 6927 179 26ranked 17th in 2001) 14 Utah 3676 120 33 15 Alaska 1800 62 34 16 Washington 5396 194 36The FHWA publication can be viewed at wwwfhwadotgovpolicy
ohimhs02indexhtm 17 South Carolina 6791 260 38 18 New Hampshire 1375 54 39
49 California 20634 5437 263 50 Massachusetts 3290 1182 359
Source Highway Statistics 2002 US Department of Transportation
Measures Markers and Mileposts - December 31 2003 41
Measures Markers and Mileposts - December 31 2003 43
Highway Maintenance Annual Update Biennial Maintenance Targets The Maintenance Accountability Process (MAP) targets measures and communicates the outcomes of 34 distinct highway maintenance activities Maintenance results are measured using field condition surveys and are reported as Level of Service (LOS) ratings LOS targets are defined in terms of the condition of various highway features (for example the percent of guardrail on a highway system segment that is damaged) LOS targets are also keyed to the level of funding provided by the Legislature The following table shows a list of maintenance activities (in prioritized order) for which LOS targets have been set in the 2003-05 biennium During 2003 targets for all activities were achieved
WSDOT Maintenance TargetsAchieved for 2003 Maintenance Activity Achieved Pavement Patching and Repair uuml
Snow and Ice Control Operations uuml
Traffic Signal Systems uuml
Movable and Floating Bridge Operations uuml
Urban Tunnel Systems uuml
Keller Ferry Operations uuml
Guardrail Maintenance uuml
Noxious Weed Control uuml
Structural Bridge Repair uuml
Intelligent Traffic Systems uuml
Control of Vegetation Obstructions uuml
PermitsFranchises uuml
Maintain Culverts uuml
Regulatory Sign Maintenance uuml
Slope Repairs uuml
Crack Sealing uuml
Bridge Deck Repair uuml
Safety Patrol uuml
Rest Area Operations uuml
Highway Lighting Systems Operations uuml
Pavement Striping Maintenance uuml
Maintain Catch Basins and Inlets uuml
RaisedDepressed Pavement Markers uuml
Sweeping and Cleaning uuml
Nuisance Vegetation Control uuml
Maintain Ditches uuml
Shoulder Maintenance uuml
DetentionRetention Basins uuml
Litter Pickup uuml
Guide Sign Maintenance uuml
Landscape Maintenance uuml
Guidepost Maintenance uuml
Bridge Cleaning uuml
Pavement Marking Maintenance uuml
2003 Perfect Score ndash Percentage of Legislatively Funded Targets Achieved 1998-2003 In September 2001 the first Gray Notebook quarterly report on MAP WSDOT achieved 26 out of the 34 MAP targets Three years later a perfect score has been achieved The positive trend can be attributed to bull What gets measured gets managed WSDOT
maintenance managers and field workers are gaining experience with how to manage work in ways that help to attain the service level targets
bull Strong maintenance results across-the-board have been assisted by mild or average winter conditions
bull Stable funding for maintenance for several years has lessened ldquocrisis moderdquo management and produced better across-the-board results
bull Improved accuracy in measuring MAP results ndash based on a six-month review and field verification of MAP measures and their assessment technique
Starting in March 2004 WSDOT maintenance staff will be documenting greater levels of detail such as units of work completed (for example ldquolinear feet of guardrail repairedrdquo) This will provide information that can be used to develop cost per unit and units per day or week measures to supplement the outcome measures provided by MAP Look for more on this in future Gray Notebook maintenance pages
Percentage of Legislatively Funded Targets Achieved for 1998-2003
100
80
60
40
20
0 2002 20031998 1999 2000 2001
Source WSDOT Maintenance Office
Measures Markers and Mileposts - December 31 2003 42
42 Measures Markers and Mileposts - December 31 2003
Integrated Vegetation Management Integrated Vegetation Management (IVM) involves creating and supporting roadside plant communities that minimize short and long-term maintenance needs Roadside vegetation maintenance requirements often depend on how well roadsides are designed and constructed When soil is conserved and improved vegetation is restored during highway construction roadside maintenance requirements can be relatively low However if roadsides are not well restored at the time of construction the expense of roadside maintenance grows because noxious and nuisance weeds tend to establish themselves and thrive in poor soils with sparse vegetation
2003 Herbicide Use Trends ndash Results In terms of pounds of active ingredient WSDOTrsquos statewide annual use of herbicides for roadsides increased by 3300 pounds (121105 pounds in 2002 to 124426 pounds in 2003) On closer review of the data most areas in western Washington were either down or about the same in their overall herbicide use compared to 2002 In fact Clallam County the first area in which WSDOT has implemented an IVM plan saw a 50 percent reduction in herbicide use on the roadsides In eastern Washington two areas in particular experienced significantly increased herbicide use The cause was a localized ongoing weed infestation problems for which herbicide applications were needed Had it not been for the significant application in these two areas WSDOTrsquos herbicide use in 2003 would have been less than in 2002
Clallam County IVM Plan In the past year WSDOT has finally begun to make progress implementing its long-promised IVM program Working with communities and a number of interest groups on the Olympic Peninsula WSDOT developed an IVM plan for state highway maintenance in Clallam County that reduced the amount of herbicide used and responded to citizen concerns Highlights and results include
bull No vegetation-free area adjacent to pavement within 60 feet of salmon streams Hand-treatment only of invasive plants growing next to the pavement edge in this area
bull No summer application of herbicides for controlling trees and brush
bull Hand application of noxious weed control herbicide (as opposed to truck applications) and close coordination with the Clallam County Noxious Weed Control Board
bull Experimentation with alternative brush control methods such as planting desirable plant species (ie salal) hydro seeding and biological controls
bull Total herbicide use decreased more than 50 percent
At a February 5 2004 open-house meeting to discuss continued aspects of the IVM program in Clallam County concerned citizen Josey Paul commended WSDOT employees saying ldquoThank you for your good efforts managing vegetation along SR 112 this past yearrdquo
With an effective IVM program common weeds such as kochia in eastern Washington can be managed with reduced herbicide use over time
Vegetation-Free Area Approximately 60 percent of herbicides used by WSDOT are used to prevent vegetation from growing at the pavementrsquos edge WSDOT is reviewing this practice including a study of other statesrsquo use of chemicals in vegetation-free zones alongside the roadway The challenge in determining the best approach comes from needing to balance the potential herbicide impacts with hazards to motorists associated with an abundance of roadside vegetation to highway workers from mechanical control technologies and to pavements for vegetation incursions to the pavement By the end of the year WSDOT will develop and implement updated policies on vegetation-free areas
The vegetation-free zone next to the roadway
Measures Markers and Mileposts - December 31 2003 43
Measures Markers and Mileposts - December 31 2003 45
IVM Future Practices Integrated Vegetation Management Plan Schedule Because of the success of the Clallam County I-5 North (lsquo04)IVM plan WSDOT created a statewide schedule for Roadside Vegetation Management plans The timetable implements all plans by the end of 2007 WSDOT also identified new performance measures to track future roadside vegetation management trends The measurements include
bull The IVM plan development schedule
bull Adherence to sensitive buffers upon orders by the US District Court (see below)
bull Number of WSDOT application violations
bull Maintenance Accountability Process (MAP) conditions measures for nuisance weeds I-5 South (lsquo03)noxious weeds vegetation obstructions and landscape maintenance WSDOTrsquos Integrated Vegetation Management Plan implementation
is scheduled by year and by maintenance area as shown in thebull Documentation of area-specific IVM plan above map Area by area production of the plans will continue until
elements completed each year statewide coverage is achieved
Seattle Spokane
5
rsquo03 rsquo04
rsquo06
rsquo05
rsquo05
rsquo06 rsquo05
rsquo04
rsquo07
rsquo07
rsquo07
5
Tacoma Olympia 90
Whidbey Island Plan Coming The department will hold a public meeting on a Roadside Vegetation Management Plan for Whidbey Island in March 2004 WSDOT expects to develop and implement a plan that meets the concerns of citizens with varying viewpoints on herbicide use and can be achieved at reasonable cost The draft plan identifies a number of key areas test sites roadside features and treatment practices Other IVM plan details for Whidbey Island are expected to include
bull Restoration of roadsides in coordination with future construction projects on State Route 20
bull Restoration of native roadside vegetation on half of an acre a year as part of the regular maintenance program
bull No vegetation-free area adjacent to pavement within 60 feet of the waterline at Penn Cove and Keystone Spit
bull Establishment of the vegetation-free area pilot projects
US District Court January 2004 Ruling The United States District Court in Seattle entered an injunction in January 2004 prohibiting the use of certain herbicides within sixty feet of salmon streams pending EPArsquos completion of a review whether such use is consistent with protections afforded by the Endangered Species Act
WSDOTrsquos herbicide practices included in the 2003 IVM plan for Clallam County and generally followed in many other areas of Western Washington are already matched to the injunctionrsquos requirements To ensure adherence to the terms of the injunction WSDOT maintenance crews will identify affected areas on the highways mark buffer zones and receive additional training on vegetation management practices including limitations on herbicide use
WSDOT ndash Proactive in Risk Assessment As part of its vegetation management efforts in 2003 WSDOT contracted with a consultant Intertox Inc to update a 1993 WSDOT hazard assessment study This included integration of new research in herbicide usage The hazard assessments aim through review of scientific literature to inform WSDOTrsquos understanding of potential risks to humans wildlife and aquatic organisms The hazard assessment update generally found the potential risks of specific products to be negligible or low in WSDOTrsquos patterns of use The assessment suggested however that moderate potential risks might be presented by two products MCPA and Diuron WSDOT discontinued further use of MCPA in 2003 and has taken steps to reduce the use of Diuron by limiting its application only to certain areas in eastern Washington
Measures Markers and Mileposts - December 31 2003 44
44 Measures Markers and Mileposts - December 31 2003
Environmental Programs Environmental Management System (EMS) Update WSDOT is continuing to develop its Environmental Management System (EMS) to help support the departmentrsquos environmental efforts and integrate those efforts into everyday operations training programs and regular performance reports Currently several important activities described below are building WSDOTrsquos capacity to improve track and report on environmental compliance
Construction Services Program Pilot To address projects funded by the 2003 Transportation Funding Package WSDOT is piloting a construction services program modeled on a prototype used by its regional office in Yakima The program is being evaluated for statewide implementation Its goal is to ensure that environmental commitments attached to a project are clearly communicated and implemented throughout design construction and facility operation The programrsquos three major components are (1) pre-construction and pre-activity meetings between WSDOT and the contractor (2) tools to aid construction and maintenance staff in maintaining
Seven Core Elements to WSDOTrsquos Environmental Management System bull Legal and other requirements clearly outline all
environmental laws regulations and agreements that apply to operations
bull Written procedures instruct staff and contractors how to conduct work activities in compliance with requirements
bull Training ensures those that conduct certain activities know how to do the work in a compliant manner
bull Roles and duties ensure WSDOT staff and contractors know what they are to do under the EMS
bull Inspection monitoring and corrective action ensure a process is in place to check WSDOTrsquos work for compliance and correct any problems
bull Documentation allows WSDOT to evaluate the operation of the EMS and communicate results to the public and within the department
bull Performance measurement compares WSDOTrsquos performance against pre-determined targets with results reviewed by management and reported to the public
compliance on the project site including an environmental inspection checklist for use by construction inspectors and (3) environmental compliance procedures issued by WSDOT for all construction and maintenance activities
Enhanced Commitment Tracking WSDOT is working to better track formal commitments made during the project development process By the end of 2004 WSDOT will track all formal commitments from inception (usually during planning or project design phase) through construction to completion or handoff to its Maintenance and Operations Department This new system will make clear assignments of roles and duties to show who manages performs and monitors the implementation of each commitment
Examples of Environmental Commitments on WSDOT Projects Some environmental commitments are Other commitments are agreements Some commitments are made during the terms and conditions outlined in environ- made during the Endangered Species Act National Environmental Policy Act (NEPA) mental permits These may require process These commitments or ldquoconser- environmental review process to minimize WSDOT to maintain a certain water quality vation measuresrdquo are designed to protect or offset overall environmental impact of a level during construction use certain endangered species Examples include the project Commitments under NEPA may affect Best Management Practices (BMPs) and requirement for WSDOT to place woody a roadwayrsquos alignment or physical design conduct environmental monitoring debris in a river or avoid working at certain The concrete box culverts shown belowtimes to protect migratory speciesFor example straw blankets and silt were agreed upon during the NEPA process fences are required to be used to protect In addition to habitat protection WSDOT and are designed to promote floodplain a small stream along Highway 18 during uses engineered log jams root wads and connectivitymdashallowing water to pass under rainstorms until permanent erosion control other bio-engineering techniques to protect the roadway during high water rather than grasses are established stream banks near roads and bridges over it or on to adjacent property
Measures Markers and Mileposts - December 31 2003 45
Measures Markers and Mileposts - December 31 2003 47
Environmental Compliance Assurance Annual Update WSDOT self-monitors for ldquonon-compliance eventsrdquo whether or not such events are taken up as formal ldquoviolationsrdquo by regulatory agencies or officials
Compliance History The Gray Notebook for March 31 2003 reported on WSDOTrsquos initial effort to track non-compliance events Data for 2001 and 2002 was obtained by interviewing project managers in December 2002 to gather an after-the-fact best estimate of the number and types of non-compliance events Since then WSDOT has systematically tracked non-compliance events for highway construction and maintenance programs and for operations of the Washington State Ferries (WSF)
How Are We Doing In 2003 WSDOT recorded 41 non-compliance events with 13 leading Non-Compliance Events to issuance by a regulatory agency of a formal Notice of Violation 2001-2003 (NOV) 45
40 In 2003 32 of 41 non-compliance events involved water quality 35
regulations as shown in the chart at right For 2003 the ldquootherrdquo category 30
includes three events associated with underground storage tank rules and 25
one event associated with an air quality violation 20
15
The increase in recorded highway program and WSF non-compliance 10
events from 2001 to 2003 is partially explained by an increased 5
0 emphasis on identifying non-compliance events Because 2003 is the 2001 2002
Fish Habitat OtherWetlands Water Quality first year that WSDOT has systematically tracked non-compliance events apples-to-apples comparison with previous years is not possible For more information about WSDOTrsquos Environmental
Compliance Assurance Procedure please see the The baseline data for 2003 of the number and type of events taking Gray Notebook for the quarter ending March 31 2003
place will help WSDOT staff develop compliance tools for the agency page 18
Source WSDOT Environmental Services OfficeUsing Non-Compliance Data WSF began systematizing data collection on petroleum product spills three years ago The data illustrated ongoing minor problems from hydraulic systems on transfer spans at WSF terminals Last winter WSF Terminal Maintenance began a program to improve inspection of transfer spans and quickly correct any problems This new emphasis includes training for terminal attendants to identify potential leaks in the bridge operation and to report potential leaks to Terminal Maintenance
For the three years since 2001 WSF terminals have had seven four and five hydraulic spills respectively The prevention actions instituted by Terminal Maintenance means that now more WSF employees are aware of and watching for potential problems
2003
Total Resulting Actual Notices
Total
Total
Resulting Actual Notices
Resulting Actual Notices
Beginning of Maintenance and Construction ECAP (Environmental Compliance Assurance Procedure)
Hydraulics system at the Anacortes Ferry Terminal
Integrated Vegetation Management Results
Please see Highway Maintenance IVM report on page 43 of this Gray Notebook
WSDOT also tracks compliance with herbicide and Non-Compliance Eventspesticide application laws covering the products and procedures used to maintain roadside and wetland 2001 2002 2003 mitigation sites The number of product applications in Number of WSDA 8 6 4 2003 went up 17 and the pounds of active ingredient Investigationswent up by 35 from the previous year The number of findings of fault notices from the Washington State Department of Agriculture (WSDA) remained steady at
Number of WSDA Findings of Fault
5 4 2
four Two notices involved overspray leaving the road right Number of Product 2271 3399 4091 of way and two were found not to have merit and dropped Applicationsby WSDA In 2003 WSDA issued two warning letters to WSDOT regarding the alleged injury to two privately owned conifer trees in the town of Loon Lake near Colville The
Total Pounds of Active Ingredient Applied
67156 120171 124290
trees tested positive for diuron that may have come from an earlier WSDOT roadside application of herbicides for total quantity of chemicals used
Measures Markers and Mileposts - December 31 2003 46
46 Measures Markers and Mileposts - December 31 2003
Monitoring Replacement Wetlands Annual UpdateTypes of Mitigation Two WSDOT mitigation bank sites currently provide advance compensation for unavoidable wetlands losses The Moses Lake Mitigation Bank provides five acres of enhanced wetland and about two acres of restored wetland The North Fork Newaukum Mitigation Bank provides 91 acres of enhanced wetland and one acre of restored wetland Since 2002 15 new replacement wetland sites (199 acres) have been added to the overall inventory of wetlands replacement acreage
Meeting Standards in 2003 In 2003 biologists monitored a total of 63 active replacement wetlands ranging from one to eight years in age Of these sites 21 had targets (success standards) to be met in 2003 Monitoring was conducted for 87 individual standards
Of the two sites that did not meet any standards due in 2003 one is in the middle of its planned monitoring period and had poor plant survival and too many weeds The site has been re-planted and because it is close to a river biological weed control is planned The second site is at the end of its planned monitoring period but has not developed into a wetland because it is too dry WSDOT staff are considering appropriate alternatives to achieve this environmental commitment
Completed Replacement Wetlands Successful sites have achieved reasonable ecological success and no longer need monitoring Unsuccessful sites have not met requirements and are ecologically unsuccessful
Reasonable ecological success was achieved on six more sites in 2003 bringing the total of completed sites since 1988 to 53 The total of sites judged successful in this group is 49 (267 acres) The four unsuccessful sites failed due to unpredicted or changed hydrology the most important parameter of wetland success WSDOT is considering options to meet the environmental commitments for these projects
For additional detail on monitoring replacement wetlands and pictures of the different types of projects see the Gray Notebook subject index at wwwwsdotwagovaccountabilitygraybookindexhtm environment and click on ldquoWetland Mitigation and Monitoringrdquo WSDOT has been mitigating for unavoidable wetlands loss with replacement wetlands for 15 years to address the statersquos Executive Order 89-10 which mandates that the actions of state agencies result in no net loss of wetlands Advance mitigation means building replacement wetlands before unavoidable impacts take place Monitoring and reporting on the status of replacement wetlands is critical to the success of the program as seen through the eyes of both the public and the resource protection agencies with whom agreement on these projects must be reached
WSDOT Replacement Wetlands 1988-2003
WSDOT Replacement Wetlands 1988-2003 Total Acreage of Wetland Projects 116 Sites 675 Acres
Olympia Tacoma
Seattle Spokane
Actively Monitoring
Monitoring Complete
Buffer An upland area Enhancement Improvements that protects a wetland from to an existing degraded wetland
126 Acres 119
Acres
189 Acres
181 Acres
60 Acres
adverse impacts (181 Acres to increase or augment wetland increased by 90 acres since function (189 Acres increased 2002) by 100 acres since 2002)
Restoration Re-establishes a wetland area andor function where wetlands previously existed but are no
Creation The establishment longer present (60 Acres of wetland area and functions increased by 3 acres since where none existed (126 Acres 2002) increased by 4 acres since 2002)
Preservation Protecting wetlands from future development ensures that valuable wetland functions continue to provide benefits (119 Acres increased by 2 acres since 2002)
Replacement Wetlands Success in 2003 Total Number of Sites 21
Meeting All WSDOT reported onStandards
22 Acres11
Acres
8 Acres
the status of sites5 Sites with standards to be
achieved in 2003 on a site-by-site
Meeting basis in the 2003Some Annual MonitoringStandards report For detailed14 Sites monitoring results visitMeeting No wwwwsdotwagov Standards environmentwetmon
2 Sites defaulthtm
Success Rate for Replacement Wetlands Success Rates for Replacement Wetlands with Completed MonitoringMonitoring Complete 100 Includes acreage
not yet designated 95 for mitigation credit
90
85 Source for all charts WSDOT Environmental
1988-2001 1988-2002 1988-2003 Services Office 80
Includes acreage not yet designated for mitigation credit Source WSDOT Environmental Services Office
Measures Markers and Mileposts - December 31 2003 47
Measures Markers and Mileposts - December 31 2003 49
Stormwater Treatment Facilities WSDOT routinely builds stormwater treatment facilities to Department of Ecology standard as a part of highway construction Stormwater treatment facilities reduce stormwater flows that cause flooding and harm fish habitat These treatment facilities also remove sediment metals nutrients and other pollutants from highway runoff
In response to municipal stormwater permit requirements WSDOT has tracked the number of new stormwater treatment facilities built in King Pierce Snohomish and Clark counties where about 40 percent of statewide highway construction has occurred since 1996 In the past seven years 300 treatment facilities (an average of 43 per year) have been built in those counties
Out of 1140 miles of highway within the four counties an estimated one percent of state highways have new stormwater treatment facilities constructed each year These treatment facilities help to mitigate and manage the impacts of stormwater runoff from our state highways
In addition to removing pollutants and reducing flooding this pond near I-5 milepost 96 protected a nearby wetland by trapping a 140-gallon accident-related diesel spill from the adjacent freeway
Ponds that infiltrate treated runoff reduce flooding in the winter and help maintain stream flows in the summer
Monitoring Water Quality Impacts for Construction Sites Annual Update In 2003 WSDOT completed its first year of construction site water quality sampling under a new statewide monitoring policy The policy requires sampling on at least 20 percent of all projects with substantial potential for water quality impacts The chart at right summarizes sampling results that compare water quality upstream and downstream from 12 projects Ninety-five percent of the samples met water quality standards for clarity
Of the 200 samples taken nine failed to meet standards The water became muddy on five of the projects because work had to be done in the water or very near the shore The other four projects experienced heavy rainfall ranging from 3frasl4 to 3 inches which overwhelmed the mandated design capacities of approved treatment facilities In all cases monitoring results prompted immediate corrective actions to regain compliance with water quality standards
Case Study Golden Harvest Creek Culvert ReplacementThe Golden Harvest Creek culvert replacement project on SR 21 near the town of Republic in eastern Washington illustrates the challenges associated with keeping sediment out of water when replacing culverts Diverting water around work areas is very effective but the installation and removal of diversions can briefly muddy a stream While removing an old culvert that blocked fish migration some dirt fell into the creek After the new culvert was in place the creek was re-directed into the new channel stranding some fish in the temporary bypass Workers entered the water and carefully moved the fish back into the creek The state standard for clarity of water was exceeded twice during construction but returned to normal within minutes each time
State Water Clarity Standards Compliance Number of Samples for 2003
45 Out of compliance In compliance
30
15
0 Apr May Jun Jul Aug Sep Oct Nov
Water Clarity Monitoring Golden Harvest Creek August 2003
64
25
20
15
10
5
0 5th 5th 6th 7th 12th 13th 14th 15th 18th 19th 20th 25th
Upstream Downstream
State Standard
Water was briefly muddied as workers moved fish back into the stream
Water was temporarily muddied as an old culvert was removed
Source for both charts WSDOT Environmental Services Office
Measures Markers and Mileposts - December 31 2003 48
48 Measures Markers and Mileposts - December 31 2003
Erosion Control Preparedness ndash Annual Update Erosion control is an important component of WSDOTrsquos program to protect the environment In addition to education careful planning and stringent contract requirements WSDOT routinely performs construction site inspections to verify the effectiveness of erosion control measures and makes improvements as needed In the fall of 2003 moderate and high-risk projects (20 in all) were inspected to determine how well they were prepared for the wet season and whether or not erosion led to any water quality violations site damage or delays
The October 2003 storm (see the September 30 2003 Gray Notebook Special Features) for example overwhelmed the treatment measures planned for the runoff from existing pavement An inspection revealed that dirty water was entering Taylor Creek
WSDOTrsquos Environmental Compliance Assurance Procedures were initiated and crews immediately addressed the situation the discharge of dirty water stopped and the incident was promptly reported to the Department of Ecology
Fall Assessment Results This table outlines how
Erosion control measures on SR 18 in the Maple Valley area
well prepared WSDOT was during fall 2003 compared to its level of preparation in 2002
Last year WSDOT identified areas where improvements in erosion control preparedness were needed One area in particular included ensuring that erosion control plans are always on site and up to date with current project conditions (a condition of environmental permitting) Specific actions were taken at statewide meetings and training sessions that
Erosion and Sediment Control Assessment Results 2002 2003 Status
Excellent Clearing limitssensitive area boundaries identified and respected by contractor
Utility trenches excavated in manner to reduce erosion risk Remove temporary erosion and sediment control measures when not needed
100 100 81
100 stable 100 stable 100 improved
Good
Contractor trained in proper use of erosionsediment control measures Sediment trapping measures installed prior to soil disturbing activities Control offsite erosion prevented by controlling flows Protect storm drains from sediment
100 90 87 74
95 decreased 90 stable 84 decreased 82 improved
Fair
If a storm hit at time of site visit water would meet state water quality standards If a storm hit at time of site visit adjacent property would be protected Effectiveness of measures installed to trap sediment Erosion control plans are on site and up to date for all WSDOT projects
86 83 96 56
80 decreased 80 decreased 78 decreased 75 improved
Poor
Manage construction site water in manner reducing sediment deposition risk Perform maintenance on temporary erosion and sediment control measures Construction access routes stabilized to prevent tracking of mud onto streets Effectiveness of measures installed to prevent erosion Temporary stormwater conveyance channels stabilized Protect cut and fill slopes from concentrated runoff Amount of disturbed soil actually covered with erosion control measures
100 70 98 91 90 67 65
71 decreased 70 stable 69 decreased 67 decreased 64 decreased 50 decreased 45 decreased
resulted in an improvement Source WSDOT Environmental Services Office of 19 percent
In 2003 the overall assessment increased in three areas while it remained the same or had little change in seven others WSDOTrsquos preparedness in the remaining eight areas decreased substantially creating an elevated risk to increased erosion when compared to last year The decrease in the bottom five areas in the ldquoPoorrdquo category are directly attributed to one or both of the following reasons (1) the extremely dry weather this fall extended large earthwork activities into the ldquowet seasonrdquo delaying soil cover practices and (2) drought conditions reduced effectiveness of late spring and early fall seeding applications
Summary and Next Steps An analysis of the 20 projects documents that 12 had no problems preventing erosion Projects experiencing minor problems increased by 16 percent from 2002 for a total of seven The minor problems were promptly corrected without regulatory agency involvement or high repair costs One project experienced major problems that involved one Notice of Violation The plan to improve performance on issues in the ldquoPoorrdquo to ldquoFairrdquo ranges includes increased technical assistance improved contract enforcement and increased emphasis in training
Measures Markers and Mileposts - December 31 2003 49
Measures Markers and Mileposts - December 31 2003 51
Incident Response Quarterly Update Program Totals WSDOT Incident Response Program provides roving service to clear roads and help drivers on Washingtonrsquos heavily traveled freeways Along with the WSDOT roving units non-WSDOT units provide contracted roving services These units include the Washington State Patrol (WSP) Cadets Registered Tow Truck Operators (RTTO) and a Motorist Assist Van (MAV)
Incident Reasons and Clearance Times Washington Statersquos target is to clear all incidents within 90 minutes During the fourth quarter 71 percent of major incidents were due to motor vehicle collisions Major incidents are however only two percent of all incidents on state roadways The most frequently occurring incidents which are likely to cause slowdowns during daily commutes are disabledabandoned vehicles or debris blocking traffic (82 percent of all incidents) During the fourth quarter 85 percent of incidents were cleared within 30 minutes and 47 percent were cleared in less than 10 minutes
Detection and Response by Roving Notification and Call-out The roving Incident Response Program is an effective means to keep traffic moving on freeways because the responders quickly detect incidents on the roadways During the fourth quarter 70 percent
Abandoned Vehicles (6)
Hazardous Materials and Fatal Collisions were less than 1 percent each
Incidents Lasting90+ Minutes Fatality
Disabled Vehicles Collisions (15)(9)Haz Mat Abandoned
(5) Vehicles Fire (2) (2) Debris
(4)
Incidents Lasting LessThan 15 Minutes
Non-Injury Other Collisions (4) (4)
Debris (10)
Abandoned Vehicles (27)
Disabled Vehicles 55
Injury Collisions Fatal Collisions Fire and Hazardous Materials were less than 1 percent each
Incidents Lasting 15 to 90Minutes Injury Collisions Fire(7) (1)Other (2)
Non-Injury (20)
Debris (5)
Disabled Vehicles 58
of all incidents were detected by roving units Roving units were notified of the remaining 30 percent of incidents Call-out units respond to severe incidents that occur Other
(2)
Non-Injury (32)
Injury Collisions (30)
outside roving zones or during non-roving hours There were 129 call-out responses during the fourth quarter which amounted to one percent of all the incidents responded by the IR program
Blocking versus Non-Blocking Locations The location and duration of an incident can impact traffic greatly Overall 67 percent of all incidents were on the shoulders and medians of roadways and did not block travel lanes Seventy percent of the incidents that were cleared in less than 30 minutes occurred within shouldersmedians and did not block travel lanes Of the major incidents lasting 90 minutes or more 80 percent were blocking travel lanes
Source for all charts WSDOT Traffic Office
Total Number of Responses by Month July 2002 to December 2003
5000
4500
4000
3500
3000
2500
2000
1500
1000
500
0
WSDOT IRT 2003 Contracted IRT Units 2003
2002
Jul Aug Sep Oct Nov Dec Jan Feb Mar Apr May Jun Jul
Average Clearance Time (in Minutes) January 2003 to December 2003
35
30
25
20
15
10
5
0
For All Incidents
For Incidents Lasting 15-90 Minutes
Jan Feb Mar Apr May Jun Jul Aug Sep Oct Nov Dec
Average Clearance Time for Incidents Lasting Over 90 Minutes 3-Year Comparison July 2001 to December 2003
300
250
200
150
100
50
0
July 2001 to June 2002
July 2002July to to June 2003December 2003
Jul Aug Sep Oct Nov Dec Jan Feb Mar Apr May Jun
Number of Incidents by Location and Clearance Time October 2003 to December 2003
Travel Lanes
ShoulderMedian
6000
5000
4000
3000
2000
1000
0 Less 10- 20- 30- 40- 50- 60- Over than lt20 lt30 lt40 lt50 lt60 lt90 90 10 min
Measures Markers and Mileposts - December 31 2003 50
50 Measures Markers and Mileposts - December 31 2003
Over 90 Minute Incidents There were 243 incidents lasting 90 minutes or longer during the fourth quarter of 2003 Incidents are located by dots on the map All incident records collected into the WSDOT Incident Tracking System (WITS) are being mapped for exact locations by state route and milepost for further analysis
Examples of Incidents Over 90 Minutes The following five incidents had the longest clearance times for the period between October 1 2003 and December 31 2003
bull October 1 ndash A fuel tanker truck overturned on I-5 in King County A single northbound lane was intermittently closed as multiple tow trucks responded to the scene to try and right the truck After multiple attempts the fuel was pumped from the truck so that it could be righted WSDOT Incident Response set up traffic control until recovery was complete 104 hours was required for Incident Response to clear the scene
bull October 8 ndash A semi truck traveling from westbound I-90 to northbound I-5 in Seattle drove off the elevated ramp falling approximately 30 feet and landing on the roadway below The tractor-trailer and cargo were demolished on impact necessitating a lengthy and technical clean up WSDOT Incident Response responded to the scene for traffic control and clean up 82 hours were required to clear the scene
bull October 12 ndash A loaded fuel tanker lost control on SR 9 just north of Wickersham in Whatcom County causing the rear trailer to roll on its side leaking fuel onto the shoulder and into the drainage system A detour route was set-up and a private contractor was called in to clean up the fuel spill WSDOT Incident Response assisted with traffic control and helped to clear debris from the roadway 164 hours were required to clear the scene
bull November 22 ndash A collision on US 97 near Goldendale involving a semi truck resulted in multiple lane closures as the scene was cleared WSDOT Incident Response set up traffic control and assisted other agencies Responders were able to keep traffic flowing throughout most of the incident 85 hours were required to clear the scene
bull December 9 ndash On SR 9 near the city of Sumas in Whatcom County a semi truck lost control and drove off of the roadway overturned spilling its load of lumber A detour was set-up for both northbound and southbound traffic WSDOT Incident Response performed traffic control and cleared debris 80 hours were required to clear the scene
Over 90 Minute Incidents for Quarter Four 2003
Seattle
Tacoma Olympia
Spokane
Vancouver
Everett
Service Actions The Incident Response roving program provides various services to motorists Traffic control is the most common service provided On an average day during the fourth quarter incident response personnel (all units) provided fuel to 14 vehicles cleared 12 pieces of debris changed 12 flat tires pushed 8 vehicles and performed 6 minor car repairs
Response Types October to December 2003
Total Incident Responses = 12341 bull 1717 Collisions (14) bull 10624 Non-Collisions (86)
Oct Nov Dec Fatality Collisions 6 11 10 Injury Collisions 147 147 134 Non-injury Collisions 377 417 468 Disabled Vehicles 2435 2120 2320 Abandoned Vehicles 787 705 784 Debris 420 330 290 Fire 24 17 27 Hazardous Materials 15 5 4 Other 132 139 149 Some non-collisions fall into more than one of the above categories
Service Actions Taken for Non-Collision Responses October to December 2003
Oct Nov Dec Traffic Control 425 370 429 Provided Fuel 324 286 269 Changed Flat Tire 323 255 220 Minor Repair 281 203 260 Pushed Vehicle 145 178 190 Towed Vehicle 160 115 144 Cleared Debris 90 84 84
Source WSDOT Traffic Office
Measures Markers and Mileposts - December 31 2003 51
Measures Markers and Mileposts - December 31 2003 53
Travel Information Quarterly Update
Since the launch of 5-1-1 Travel Information Service in July 2003 calls have increased by 74 percent (from 30478 to 52903) during the first six
month period
5-1-1 is a three-digit travel information number designated by the Federal Communications Commission (FCC) to provide around the clock traffic and road condition information
The 5-1-1 system lets the commuter check real-time traffic conditions using a cell phone and voice commands Although some users have experienced difficulty at times with the voice recognition aspect of this system it will continue to be enhanced as technology improves WSDOT is currently developing a plan to address these issues and make the 511 system more user-friendly
1-800-695-ROAD In December 2003 the total number of calls to 1-800-695-ROAD slightly decreased from the level in December 2002 However the total number of calls to Travel Information combining 1-800-695-ROAD and 5-1-1 calls together increased It is likely that 5-1-1 is replacing some of the calls to 1-800-695-ROAD
During the fourth quarter of 2003 the total number of calls to 1-800-695-ROAD and 5-1-1 increased by 786 percent with 481706 calls in 2003 versus 269675 calls in 2002
Travel Information Service Calls to 1-800 Road and 5-1-1 Calendar Year 2002-2003
250000
200000
150000
100000
50000
0 Jan Feb Mar Apr May Jun July Aug Sep Oct Nov Dec
2003 1-800-ROAD 2002 1-800-ROAD
Current Quarter 2003 5-1-1
On the Web Page views to Traveler information continue to increase They are up an average of 93 over the same quarter last year
Traveler Website Daily Usage Daily Average Page Views per Month (in millions)
Jan Feb Mar Apr May Jun Jul Aug Sep Oct Nov Dec 00
05
10
15
20
25
30
Current Quarter 2003 2002
Daily Average Page Views per Month Quarter 2002 and 2003 (in millions)
2002 2003 increase
October 08 17 113 November 13 30 131 December 21 29 38
In comparison to last yearrsquos numbers October saw an increase of 113 percent and November saw a 131 percent increase in daily page views
Highest One Day Total On November 19 2003 WSDOTrsquos web site received 68 million page views
bull 97 went to Traffic and Travel Information
bull 87 of those views originated from the WSDOT site ndash the remaining were from WSDOT through news and other sites such as KIRO KING and KOMO who used WSDOTrsquos cameras and flowmaps
WSDOT is also responding to the increasing number of requests for traffic and travel information to display on mobile devices Developments will be reported as they occur
Source WSDOT Communications Office
Source WSDOT Traffic Office
Measures Markers and Mileposts - December 31 2003 52
52 Measures Markers and Mileposts - December 31 2003
Options to Drive Alone Commuting Quarterly Update Park and Ride Lot Occupancy at WSDOT-Owned Sites in King County During the third quarter of calendar year 2003 occupancy of the 8500 parking spaces in the 32 WSDOT lots in King County averaged 73 percent
A three percent decrease in occupancy from the second quarter was due to summer seasonal declines in transit use About 50 percent of WSDOTrsquos park and ride lots in King County surpassed the target of 70 percent occupancy during the quarter Parked cars regularly exceeded maximum capacity in five lots
Highlights bull The new Issaquah Highlands Interim Park and Ride lot opened at the end of September This Sound Transit lot offers 103 parking spaces for commuters King County Metro is developing a permanent Park and Ride structure at Highland Dr NE and NE High St that is scheduled for completion in late 2005
bull The new 5-story Eastgate Park and Ride garage is scheduled for completion in June 2005
WSDOT-Owned King County Park and Ride Lots Percent of Capacity Used January 2001 through September 2003
100
90
80
70
60
50
Actual
Occupancy should exceed this target
Qtr 1 Qtr 2 Qtr 3 Qtr 4 Qtr 1 Qtr 2 Qtr 3 Qtr 4 Qtr 1 Qtr 2 Qtr 3 2001 2002 2003
Data availability has a lag of three months to allow the transit systems to collect and analyze the data Data for the fourth quarter of 2003 will be available in the next Gray Notebook
Source WSDOT Analysis of King County Metro data
bull Transit agencies throughout Puget Sound report persistent overcrowding at Park and Ride lots along major corridors due to lack of capacity and growing demand Efforts to increase transit and ridesharing are hampered by insufficient capacity at many commuter Park and Ride facilities
Vanpools in the Puget Sound Region Beginning with this issue of the Gray Notebook vanpool information and analysis will reflect a lag of three months in reporting data Reporting on the previous quarter will allow for more complete verification of the data During the third quarter the number of vanpools in operation in the region peaked in July (1376) followed by small decreases in August (1358) and September (1352) Despite the recent decrease the total number of vehicles on the road is up 35 percent since September 2002 when there were 1306 vanpools
Quarterly Regional Vanpool Highlights There are now 62 vanpool VanShare groups in operation in the Puget Sound region The VanShare program provides connections for employees between trains ferries park and ride lots and their work sites The VanShare program has proven to be very successful with Sounder trains on the Tacoma line (34 VanShare groups) King County Metro staff have begun marketing the VanShare program to employees riding between Everett and Seattle
bull Enhancements to regional Internet ridematch service in Puget Sound will provide a direct benefit to vanpools The improved service has the ability to ndash Provide up to 30 names on a match list request ndash Allow easier route planning with map viewing of Park amp Ride lots
Puget Sound Vanpool and VanShare Trends
1380
1360
1340
1320
1300
1280
1260
1240
Vanpools and VanShare
Vanpools Only
Jun Sep Dec Mar Jun Sep Dec Mar Jun Sep 2001 2002 2003
Data availability has a lag of three months to allow the transit systems to collect and analyze the data Data for the fourth quarter of 2003 will be available in the next Gray Notebook Source WSDOT Transportation Demand Management Office
ndash Increase user ability to select newest names on the match list ndash an effective tool for vanpool groups looking for riders ndash Provide promotional email message to users about their companyrsquos rideshare incentives along with an Employee Transportation Coordinator (ETC) contact phone number
Coming Next GNB Edition Commute Trip Reduction Task Force 2003 Report to the Washington State Legislature
Measures Markers and Mileposts - December 31 2003 53
Measures Markers and Mileposts - December 31 2003 55
Customer Feedback Washington State Ferries (WSF) collects customer complaints compliments comments and suggestions This information is recorded in the Automated Operating Support System (AOSS) database for measurement and action based on database cross tabulation and analysis
The charts show trends in the data for the last four fiscal years and the first two quarters of fiscal year 2004 (July 1 ndash December 31 2003)
Customer complaints were up 12 percent from the preceding quarter Complaints have increased for three consecutive quarters
WSF received 53 food service related complaints during the quarter This is only the second quarter in two and one-half years that food service has been in the top four comment types A total of 46 food complaints were received on the Edmonds-Kingston route during a two-week period in November when the MV Quinault was in service on this route The MV Quinault did not have galley service and is a much smaller vessel than the Jumbo Class ferry she was replacing
Washington State Ferries Quarterly Update
Vanpools exiting ferry on Bainbridge Island
N
20
305
16
160
3
525
104
104
104
20
20
525
3
101
1
Tacoma
Everett
Mt Vernon
Victoria
Bellingham
Port Angeles
Shelton
Seattle
5
5
5
5
90
405
Sidney
Shaw
Orcas
Keystone
Port Townsend
Clinton
Mukilteo
Kingston
FauntleroySouthworth
Vashon
Tahlequah
Point Defiance
Bainbridge Island
Edmonds
Anacortes
Bremerton
Friday Harbor
Lopez
2
101
AutoPassenger
Passenger-Only
Washington State Ferries Route Map
Total Customer Complaints Most Common Customer Comments Complaints per 100000 Customers Top Four Comment Types per 100000 Customers
15 12
10
10 08
06
5 04
02
0 0
Food Service
Loading Unloading
Compliments
On time performance
FY FY FY FY Qtr 1 Qtr 2 FY FY FY FY Qtr 1 Qtr 2 2000 2001 2002 2003 2004 2000 2001 2002 2003 2004
Does not include compliments or suggestions
Source for all charts WSDOT Ferries
Measures Markers and Mileposts - December 31 2003 54
54 Measures Markers and Mileposts - December 31 2003
On-Time Performance WSF has been collecting on-time performance data since June 2001 The table below compares WSF on-time performance across the system for the second quarters of fiscal year 2003 and 2004
Delays in the San Juan Islands are due primarily to construction activity at Shaw Island (see ldquoTrip Reliabilityrdquo comments below)
Improved on-time performance was experienced on WSFrsquos busiest route the FauntleroyndashVashonndashSouthworth route Approximately one quarter of all trips by WSF are made on this triangular route structure Fall schedule changes were developed with the Ferry Advisory Committees at Vashon and Southworth resulting in a schedule that increased on-time performance and allowed much needed late night maintenance on the three vessels serving this route
On-Time Trip Delivery Second Quarter Fiscal Year 2003 Second Quarter Fiscal Year 2004
All Trips All Trips A trip is considered toPercent of Average Percent of Average be on time if it departsTrips Within Delay From Trips Within Delay From
within ten minutes of theNumber 10 minutes Scheduled Number 10 Minutes Scheduled of Trips of Schedule Sailing Time of Trips of Schedule Sailing Time published scheduled
San Juan Domestic 5591 85 46 minutes sailing time Missed trips International Route
6443 94 27 minutes
EdmondsKingston 4564 94 31 minutes 4499 93 35 minutes1564 95 28 minutes
Passenger-Only SeattleVashon 1041 94 24 minutes 1003 98 22 minutes9534 91 43 minutes
KeystonePort Townsend 1852 96 24 minutes 1826 93 32 minutes6178 98 20 minutes
Point DefianceTahlequah 2708 93 40 minutes 2782 95 31 minutes4031 96 28 minutes
SeattleBremerton 2563 98 27 minutes 2451 97 31 minutes
152 85 48 minutes are not reported using this measure They
Passenger-Only SeattleBremerton
176 84 37 minutes
Service discontinued are included in the Trip Reliability measure
FauntleroyVashonSouthworth 9602 93 32 minutes
MukilteoClinton 6335 99 20 minutes
SeattleBainbridge Island 3901 98 26 minutes
Total 40654 94 30 minutes 38142 94 31 minutes
Trip Reliability WSF scheduled a total of 41678 trips during the 2nd quarter of fiscal year 2004 Of these trips 486 were missed Sixty-one percent (296) of the missed trips resulted from closures of the Shaw Island terminal during work on a $65 million preservation contract (see details on below) The chart below shows a system-wide average reliability index Assuming that a commuter worked 200 days per year and made 400 trips on WSF the statistical likelihood is that 47 ferry trips would be cancelled This rating represents a 178 decline in the reliability rating from the preceding quarter and a 140 decline in performance over the same period last year
Most Common Trip Cancellation CausesTrip Reliability Index Second Quarter Fiscal Year 2004Trip Reliability Index
rips per 400 SailingsMissed TMissed Trips per 400 Sailings
50
45
40
35
30
25
20 Other (7)15
Terminals (63)
Electrical (50)
Related Propulsion and Steering (43) Other (7)
Vessel
(19)
TidesWeather 10 (11) 5 WSF is undertaking a $65 million preservation contract at the Shaw Island
terminal this biennium Extensive pile driving and ldquoover waterrdquo work was accomplished this quarter to optimize environmental construction windows and seasonal traffic lulls WSF worked closely with the community on Shaw Island and throughout the San Juans to craft mitigation strategies
Cancelled Trips (Average Annual aimed at minimizing disruptions Trip Reliability Index Number = X 400
0
Total Scheduled Number of Because Shaw is a single slip facility closures were necessary duringTrips Commute Trips) regular service hours There was no service to Shaw Island during midday
from September 22 through November 7 One weekend closure was necessary September 27 and 28 Finally WSF completely shut down service from November 8 to November 11 All closures were coordinated
Source for all charts WSDOT Ferries with the community
Qtr 2Qtr 1 2004
FY FY FY FY FY 1999 2000 2001 2002 2003
Measures Markers and Mileposts - December 31 2003 55
Measures Markers and Mileposts - December 31 2003 57
WSF Construction Program ExpendituresCapital Expenditure Performance 2003-2005 Biennium 2nd Quarter Cumulative Dollars in Millions
WSDOT makes capital investments in the Ferry System Authorized vs Actual
through the Washington State Ferries Construction Program The program preserves existing and builds new ferry terminals and vessels supporting the Ferry System the capability to deliver responsible and reliable services WSF planned to spend $595 million over the period July-December 2003 Actual expenditures were $326 million bull Terminal Construction activities are under-spending
by $201 million The Port Townsend Preservation and Improvement projects are $63 million under the plan because project scopes have been revised and work deferred to later biennia Spending for property acquisition and design of the Edmonds Multimodal Terminal is $40 million behind due to a cautious approach to environmental issues and to negotiations with tribes System-wide projects are behind in spending by $25 million particularly in system planning activities and technical support to construction The Eagle Harbor Preservation project is $17 million behind in spending The Anacortes Multimodal Terminal project is $14 million behind in spending Both projects are experiencing slow starts The Shaw Terminal Preservation project is under-spending through December by $15 million and is expected to be completed under budget The Mukilteo Multimodal Terminal is underutilizing new law funds by $10 million This reflects WSFrsquos use of current law federal grants first before expending new law funds and a time lag between
Life Cycle Preservation Performance WSF terminals and vessels consist of several thousand components divided into Category 1 and Category 2 systems and structures Category 1 systems and structures are vital to the protection of people the environment and infrastructure All other terminal and vessel components are designated Category 2 Each component should be refurbished or replaced at the end of its life cycle to assure that WSF can provide responsible and reliable service
WSF has a work plan based on legislative funding to address the backlog of systems and structures that are past due as well as those constituting on-going deterioration of terminal and vessel components This biennium WSF plans to replace or refurbish 133 Category 1 systems and structures and 54 Category 2 components Twenty-three Category 1 systems and structures and two Category 2 items were completed through the second quarter
WSF uses life cycle ratings to measure the impact of its preservation activities The life cycle rating for Category 1 terminal and vessel components is projected to increase from 77 percent at the beginning of the biennium to 81 percent at the end of the biennium The life cycle rating for Category 2 components is projected to decline from 58 percent to 54 percent
Source for all charts WSDOT Ferries
$ 200
$ 150
$ 100
$ 50
$0
Authorized
Actual
Qtr 1 Qtr 2 Qtr 3 Qtr 4 Qtr 5 Qtr 6 Qtr 7 Qtr 8
consultant work and billings The Kingston Sewer Outfall project was paid for in the prior biennium freeing $08 million budgeted in the current biennium for other projects
bull Vessel Construction activities are under-spending by $62 million Variances include The MV Spokane is $55 million behind planned expenditures due to slower than expected billings for equipment procurement The MV Klahowya is $23 million behind because work is deferred to later in the biennium The MV Cathlamet is $17 million over plan because of unanticipated carry forward costs from the prior biennium
bull Emergency Repair activities are under-spending the plan by $06 million
Category 1 Terminal amp Vessel Systems amp Structures Preserved Cumulative Systems Preserved Planned vs Actual 2003-2005 Biennium Quarter 2 Ending December 31 2003
150
100
50
0 Qtr 1 Qtr 2 Qtr 3 Qtr 4 Qtr 5 Qtr 6 Qtr 7 Qtr 8
Planned
Actual
Category 2 Terminal amp Vessel Systems amp Structures Preserved Cumulative Systems Preserved Planned vs Actual 2003-2005 Biennium Quarter 2 Ending December 31 2003
60
50
40
30
20
10
0
Actual
Planned
Qtr 1 Qtr 2 Qtr 3 Qtr 4 Qtr 5 Qtr 6 Qtr 7 Qtr 8
Measures Markers and Mileposts - December 31 2003 56
56 Measures Markers and Mileposts - December 31 2003
Ridership and Revenues The Legislaturersquos Joint Task Force on Ferries (JTFF) comprised of legislators citizens ferry management and ferry workers was formed in 2000 The Task Force reviewed the workings of the WSF system and made recommendations including tariff increases designed to raise the farebox recovery rate to 80 percent of operating costs over six years The Transportation Commission instituted this recommendation and approved tariff increases of 20 percent in June 2001 and 125 percent in May 2002
In the fall of 2003 WSF management developed a new strategic plan aimed at balancing revenue generation necessary to capitalize the aging fleet The new plan reduced the size of the tariff increases for fiscal years 2003-2004 In the spring of 2003 the Transportation Commission adopted fare increases of five percent in May 2003 and an additional five percent in May 2004
As a result of the lower tariff increases ridership is not projected to fall as rapidly as anticipated in the original plan Repeating the pattern from fiscal year 2003 through the second quarter of fiscal year 2004 WSF has experienced slightly higher than projected ridership and revenues
Fiscal year to date ridership has exceeded the plan by four percent or 488000 riders Farebox revenues exceeded the plan by three percent or $2 million (Plan is based on June 2003 forecast)
Ferries Ridership by Month in Millions
3
2
1
0
FY 2004 Actuals
FY 2003 Actuals
FY 2004 Planned
Jul Aug Sept Oct Nov Dec Jan Feb Mar Apr May Jun
Ferries Farebox Revenues by Month Dollars in Millions
$15
$10
$5
$0
FY 2004 Planned
FY 2004 Actuals
FY 2003 Actuals
Jul Aug Sept Oct Nov Dec Jan Feb Mar Apr May Jun
Source for all charts WSDOT Ferries
Farebox Recovery Rate WSFWSF Annual Farebox Recovery RatesAnnual Farebox Recovery RatesFarebox recovery is the percent of annual operating and
maintenance costs recovered through tariffs and other non-tax 100revenues In line with WSFrsquos strategic plan farebox recovery
rates for fiscal year (FY) 2003 were up 54 percent from FY 2002 This is largely due to the May 2002 tariff increase 80
combined with cost saving initiatives A complex blend of cost increases also affected farebox recovery rates For example 60 total operating maintenance and support costs increased $44 million fuel costs increased $45 million insurance increased 40 $13 million and self insurance premiums and tort claims were up $16 million 20 Top performing individual routes in FY 2003 were Edmonds ndash Kingston (121 percent) Bainbridge ndash Seattle (110 percent) 0 and Mukilteo ndash Clinton (95 percent) On average auto routes 1998 recovered 76 percent of operating costs through the farebox while passenger only routes recovered 27 percent WSF also Source WSDOT Ferries
views each routersquos farebox recovery performance over several years as the trend is more important than a snapshot Extraordinary maintenance costs service interruptions or even route closures for terminal construction and many other isolated activities can dramatically effect farebox recovery during a one year period
1999 2000 2001 2002 2003
Measures Markers and Mileposts - December 31 2003 57
Measures Markers and Mileposts - December 31 2003 59
0
10000
20000
State-Supported Amtrak Cascades Service Quarterly Update
Ridership Ridership on state-supported Amtrak Cascades trains was 90664 in the fourth quarter of 2003 This was nearly identical to the fourth quarter of 2002 Trains that showed slight ridership increases during the quarter include the morning Seattle-Portland train both midday trains between these cities and the two Seattle-Bellingham trains The Seattle-Vancouver BC trains experienced the largest ridership decreases during the final quarter of 2003 contributing to a decline of over 8000 riders for the entire year on this route Factors that led to this decline include an increase in the number of cruise ship passengers departing from Seattle rather than Vancouver BC the overall effect of tourism and a lower exchange rate for the US dollar in Canada
For the entire year ridership was 385585 on state-supported trains also a slight increase over 2002 For all trains in the Amtrak Cascades system including those financially supported by the state of Oregon and Amtrak ridership was 589743 This represents the ninth consecutive year of ridership increases
Customer Satisfaction Amtrakrsquos Customer Satisfaction Index (CSI) is based on surveys of riders using the service The scores represent three-month rolling averages The CSI goal for Amtrak Cascades is 91 (out of 100) or better In the most recent survey period the overall score for Amtrak Cascades was 90 This score continues to be one of the highest in Amtrakrsquos national system and is nine points higher than the national average for routes of similar distance Survey responses showed high customer satisfaction with access to trip information prior to boarding the train the smooth and comfortable ride and the friendliness and helpfulness of train conductors Survey questions that produced lower scores include the quality and variety of food available on the trains and on-time performance
On-Time Performance On-time performance for state-supported Amtrak Cascades trains averaged 672 percent for the last three months of 2003 This was nearly eight points below the performance for the same period in 2002 and well below the goal of 80 percent set by WSDOT and Amtrak The primary cause of delays during the fourth quarter of 2003 was rail freight traffic congestion throughout the corridor and speed restrictions imposed by the railroad where rail line maintenance was taking place For the entire year on-time performance for Amtrak Cascades trains averaged 719 percent up slightly from 2002
Photo by Jeffrey T Schultz
State-Supported Amtrak Cascades Monthly Ridership Number of Passengers
50000
40000
30000
20000
10000
0
2003
2002
Jan Feb Mar Apr May Jun Jul Aug Sep Oct Nov Dec
Amtrak Cascades Annual Ridership 1994-2003
700000
600000
500000
400000
300000
200000
100000
0
Source for all charts Amtrak and WSDOT Rail Office
WashingtonAmtrak Trains
OregonAmtrak Trains
1994 1995 1996 1997 1998 1999 2000 2001 2002 2003
2003 data
50000
40000
30000
Measures Markers and Mileposts - December 31 2003 58
58 Measures Markers and Mileposts - December 31 2003
State-Supported Amtrak Cascades On-Time Performance 2003 vs 2002 Percent On-Time 2002 Average 708 2003 Average 719
Farebox Recovery The farebox recovery per train measures the percentage of total annual operating costs generated through ticket fares The average farebox recovery rate for the eight Amtrak Cascades trains financially supported by WSDOT was 399 percent in federal fiscal year (FFY) 2003 which was three points lower than in FFY 2002 This rate decline was driven by slightly lower revenues in FFY 2003 (-15 percent) when compared to the preceding year and a six percent increase in total operating expenses Costs that grew in FFY 2003 included diesel fuel and equipment insurance WSDOT and Amtrak hope that economic recovery in the Pacific Northwest will support higher revenue yields and improved farebox performance for Amtrak Cascades in 2004
King Street Station Update The renovation of King Street Station in downtown Seattle continued in the last quarter of 2003 Projects included final installation work on the temporary restrooms on the east side of the building construction work on replacement restrooms and removal of some interior walls on the first floor of the facility The elimination of these walls has exposed portions of the original interior walls and ceilings much of which has not been seen by visitors to the station in over 40 years The newly exposed sections inside the station will eventually become part of an enlarged passenger waiting area by Summer 2004
Washington Grain Train Update The Washington Grain Train carried 301 carloads of grain in the last quarter of 2003 This was 77 percent higher that in the final quarter of 2002 Quarterly growth was driven by slight increases in grain car usage by cooperatives near Moses Lake and Walla Walla and by the new grain train operating between Marshall and Pullman In 2003 the Washington Grain Train carried 1058 carloads a 21 percent increase over the total of 874 for 2002 The 2003 traffic increase was largely attributable to the third Washington Grain Train that began service in April 2003
The Washington Grain Train is a financially self-sustaining transportation program that supports the statersquos agricultural community while helping short line railroads maintain a sufficient customer base for long-term financial viability The 94-car fleet is jointly owned by WSDOT (76 cars) and the Port of Walla Walla (18 cars) The ports of Walla Walla Moses Lake and Whitman County share fleet management responsibilities
100
75
50
25
0
Jan Feb
Goal 80
2002
2003
Mar Apr May Jun Jul Aug Sep Oct Nov Dec
The on-time performance goal for Amtrak Cascades is 80 or better A train is considered on-time if it arrives at its final destination within 10 minutes or less of the scheduled arrival time
State Supported Amtrak Cascades Farebox Recovery Per Train
100
80
60
40
20
0
FFY 2002
FFY 2001
FFY 2003
Train 501 506 507 508 510 513 516 517 Number SEA PORT SEA PORT SEA BELL SEA VAN
to to to to to to to to PORT SEA PORT SEA VAN SEA BELL SEA
Source for above charts Amtrak and WSDOT Rail Office
Washington Grain Train Carloads Carloads Per Month 2002 vs 2003
2003 1058 carloads 140
120
100
80
60
40
20
0 Jan Feb Mar Apr May Jun Jul Aug Sep Oct Nov Dec
2002 874 carloads for 12 months
for 12 months
Source WSDOT Rail Office
Measures Markers and Mileposts - December 31 2003 59
Measures Markers and Mileposts - December 31 2003 61
Special Features Organic Recycling Earns Award for WSDOT The Washington Organic Recycling Council (WORC) presented WSDOT with an award December 11th for ldquofulfilling the vision of innovative application and specification of compost in Washington State roadside developmentrdquo Everyone benefits when organic materials are recycled into products of value These products improve the quality of landscape materials They have a positive impact in our environment by improving soil and plant health conserving water reducing erosion and reducing the use of fertilizers and pesticides They also replace other sources of wood for paper and fuel production
The award recognized in particular the work of the Roadside and Site Development Unit
WORC credits WSDOT with the use of one-third of the compost produced in the state For more information on good composting practices visit wwwcompostwashingtonorg
WSDOT Receives 2003 Federal Performance Letter ldquoReport Cardrdquo from FHWA Each year the Washington Division of the Federal Highway Administration (FHWA) audits WSDOTrsquos compliance with federal rules and regulations In summarizing this yearrsquos overall results the 2003 Performance Letter signed by FHWA Division Administrator Daniel M Mathis stated ldquoBased on the inspections reviews program evaluations and audits conducted in FY 2003 it is my finding that WSDOT has complied with federal laws and regulations in expending federal-aid highway funds allocated to the State of Washingtonrdquo
The performance letter evaluates WSDOTrsquos performance in 21 project and program areas such as bridge inspection standards financial billing environmental commitments and program efficiencies The letter called out a positive example of WSDOTrsquos work ldquoconstruction costs reported in the Gray Notebook are accurate and track closely with the data we have compiledrdquo In addition FHWA noted some areas for improvement such as ensuring all bridge inspections are completed within the 24 month frequency requirement using the pavement smoothness standard more consistently and establishing a tracking database to assure that environmental commitments are not affected by project changes
Mathis concluded the letter by commending WSDOT ldquofor continuing to strengthen your performance management initiatives such as the Gray Notebook your continued efforts in enhancing these tools provides further evidence that WSDOT is focused on being accountable for state and federal transportation fundingrdquo The 2003 Performance Letter can be found on-line at wwwwsdotwagovaccountabilityFHWA_FY2003_performancereportpdf
Global Positioning at WSDOT Surveyors have been using Global Positioning Systems (GPS) for years Most people are acquainted with non-survey level GPS technology as a navigational aid in their vehicles for wayfinding on a hike and even for keeping tabs on a child or family pet
WSDOT is using GPS to inventory the locations of roadway features such as signs guardrails pavement conditions trees utility devices drainage systems bridges traffic devices light poles etc It can accurately record the location of maintenance procedures such as mowing spraying or striping GPS is also being used for wetland delineation
In future editions of the Gray Notebook WSDOT will be presenting more detailed information on how GPS is being utilized
Measures Markers and Mileposts - December 31 2003 60
60 Measures Markers and Mileposts - December 31 2003
Highlights of Program Activities Quarter Ending December 31 2003
Project Starts Completions Updates bull WSDOT began on Dec 17 charging its contractor penalties of about $3000 per weekday for every day that opening of the State Route (SR) 290 Trent Avenue Bridge in Spokane was delayed Working days were re-negotiated and added to the projectrsquos contracted schedule in May 2003 when some unanticipated construction conditions were discovered At that time WSDOT approved a new schedule submitted by the contractor Ross Bros amp Co of Salem Oregon for a mid-December completion In late November it became apparent that Ross Bros was not going to be able to meet that schedule Penalties will be withheld from the final payment of the $89 million contract
bull The SR 519 (South Royal Brougham Way) project near the Seattle waterfront Safeco Field and Seahawk Stadium cleared a major hurdle when the old ramp from Fourth Avenue South to eastbound Interstate 90 was demolished The demolition contractors RW Rhine finished the task in 10 days This allowed WSDOT crews to re-open the vital I-5 and I-90 exits to Fourth Avenue South along with several major streets and intersections in the area The new structure created by this project separates vehicle pedestrian and rail traffic and provides a greater margin of safety for all
bull A series of late October storms dumped record setting rain severely damaging SR 20 in several locations causing the earliest closure of the North Cascades Highway ever Some of the worst damage occurred at Pyramid Creek (MP 126) and Ketchum Creek (MP 124) where large sections of roadway disappeared guardrail was left hanging and torrential rain rocks and dirt rendered large culverts useless WSDOTrsquos contractor Pacific Road and Bridge made progress stabilizing and rebuilding the roadway portions damaged by water and a primitive but passable road is now in place Crews will return next spring to lay down the final layer of asphalt However on November 9 a huge rockslide thundered down the mountainside just east of Newhalem slamming into Highway 20 taking out portions of roadway and cutting off access to the town of Diablo in Whatcom County URS Corporation the contractor monitoring and surveying the hillside has placed monitoring equipment on the unstable slope The instruments will indicate if the hillside is moving where it is moving and by how much This information is critical to keeping crews safe as they move in and out of the area
bull Crews installed several large steel girders across I-5 in Lynnwood in late November in association with the construction of Sound Transitrsquos Lynnwood Park amp Ride Direct Access Project The steel girders formed the skeleton of a new ramp over I-5 south of 44th Ave W which will provide direct access to and from the I-5 high-occupancy vehicle lanes for buses carpools and vanpools The project is currently on time and on budget with completion scheduled for fall 2005
bull SR 11 better known as Chuckanut Drive near Bellingham was closed after a large rockslide blocked the highway on Oct 29 Up to 60 tons of rock and debris came loose from the hillside above the roadway and crashed onto the highway blocking both lanes of traffic just south of Larrabee Park and north of Oyster Creek Crews worked seven days a week to stabilize the hillside to reopen the road to traffic on Nov 14
bull Crews on the SR 162 Voights Creek Bridge Replacement project near Orting are using some of the latest technology to protect the environment Because of the bridgersquos close proximity to a fish hatchery workers are using an oscillator to excavate the bridge shafts The oscillator twists as it presses the casing down into the ground minimizing disturbance to the surrounding environment In addition three 134-foot lsquosupergirdersrsquo will used to support the bridge deck In past bridge projects five to eight girders are typically used This new technology means less intrusion on water habitat and fewer maintenance requirements The $21 million replaces an aging wooden structure with a concrete bridge and realigns SR 162 to eliminate a high accident location Work is scheduled for spring 2004 completion
bull Three options to replace the SR 520 Floating Bridge are being explored They include a four-lane structure with shoulders wider lanes and a pedestrianbicycle lane a six-lane option that also adds a high-occupancy
SR 290 Trent Avenue Bridge as it appeared on Dec 4 The bridge had been slated for opening on Dec 16
Measures Markers and Mileposts - December 31 2003 61
Measures Markers and Mileposts - December 31 2003 63
vehicle lane in each direction and an eight-lane option that adds the elements of the six-lane and a general-purpose lane in each direction This fall WSDOT worked with divers to better identify objects on the floor of Lake Washington that could potentially affect the construction of a new bridge With at least $2 billion 15 years and a main connection across Lake Washington on the line WSDOT wanted to know all the impacts every step of the way to assure that time and taxpayer money are not wasted Preliminary side-scan sonar images showed three objects in the water some 1000 feet north of the current SR 520 Bridge Two objects appear to be barges The third object is a large boat estimated at 150 feet in length
bull WSDOTrsquos Aviation Division is participating in a project to install an irrigation system to support new turf growth at the Stehekin Airport near Lake Chelan Non-native plants growing on the airport runway have been the targets of a spray program paid for by the Aviation Division for years The National Park Service provided funding that allows the division to reseed the airport with a dense native grass to choke out the weeds About 20 pilot organizations volunteered to install the irrigation system The airportrsquos new turf will be ready for use next year and pilots will be able to operate from a smooth runway free of dust and gravel
bull Workers finished seismic retrofit work at the SR 20 Deception and Canoe Pass Bridges by installing 10000 bolts into the underside of the bridge decks The bolts connect the bridge decks to their supporting steel structures creating a connection that makes both bridges safer and more stable in the event of an earthquake Both bridges now meet current seismic codes
bull Just prior to the deluge of fall rains crews completed a $17 million paving project on SR 112 between the Makah Reservation and Hoko River Bridge in Clallam County Start of the job was delayed until August after young eagle fledglings near the project left their nest SR 112 was designated as a scenic highway in 2002 The highway terminates at Neah Bay on the northwest tip of the Olympic Peninsula and provides motorists access to one of the most remote areas of our state
Savings and Efficiencies bull A pilot project to compare the use of salt to the use of other anti-icing chemicals for improving winter driving conditions is being repeated An unusually mild winter weather in 2002-03 limited the amount of data collected and the initial study results did not show a clear-cut advantage to using one anti-icing product over another in all cases WSDOT is evaluating the use of rock salt and salt brine in comparison to other anti-icing chemicals to determine the effect on driving conditions corrosiveness to various types of metals impacts to the roadside environment and cost of snow and ice control This yearrsquos results will be combined with last yearrsquos for a complete report and made available to those who are interested
bull The National Association of State Aviation Officials (NASAO) named the WSDOTrsquos Aviation Division the ldquoMost Innovative Staterdquo of 2003 for developing an ldquoOn-line Pilot Registrationrdquo program The On-line Pilot Registration program began in January 2003 to improve customer service and streamline administrative processing WSDOT found that the improved service increased the number of pilots mechanics and aircraft owners who registered with the WSDOT Since the implementation of online registration revenues that support air search and rescue have increased more than $100000 Additionally over 4000 aviators have subscribed to the Aviation News Service which has improved communication between WSDOT Aviation and its customers
Rail bull The Federal Railroad Administration recently awarded $1 million to WSDOT for highway-rail grade crossing improvements The funds are designated for crossing improvements on the Pacific Northwest Rail Corridor in Cowlitz County and at several crossings between Marysville and Bellingham in Snohomish and Whatcom counties Washington is one of only ten states receiving funds The Pacific Northwest Rail Corridor extends 466 miles from Eugene Oregon via Portland and Seattle to Vancouver British Columbia
Materials for the airport project are barged across Lake Chelan
Measures Markers and Mileposts - December 31 2003 62
62 Measures Markers and Mileposts - December 31 2003
Public Transportation and Commute Trip Reduction bull WSDOT teamed up with local jurisdictions transit agencies and private companies to launch this yearrsquos Rideshare Weeks (Oct 13 ndash 24) an annual campaign encouraging commuters to incorporate carpooling vanpooling transit cycling and walking in their travel to work Flexing work hours and working from home or an alternate location also helped meet the campaignrsquos two major goals exposing commuters to their choices in transportation while saving space on the roads Rideshare Weeks was being featured in public service announcements donated by the Seattle Post-Intelligencer in radio spots in Puget Sound and Spokane and at worksites participating in the statersquos Commute Trip Reduction program WSDOT has coordinated with 16 public agencies to develop promotions and shared messaging For more information see wwwwsdotwagov partnerswsrorideshare bull On Tuesday October 21 WSDOT joined transportation providers at the Omak Senior Center to highlight new bus service in Okanogan County made possible through $460748 in state and federal public transportation grants WSDOT presented giant symbolic checks and a key for a new minibus to Colville Confederated Tribes Northwestern Trailways and Okanogan County Transportation
Awards and Recognition bull Linda Pierce of WSDOT Materials Lab and Steve Muench and Joe P Mahoney of the University of Washington have been awarded the national Premier Award sponsored by National Engineering Education Delivery System (NEEDS) for the new WSDOT Pavement Guide ndash Interactive The WSDOT Pavement Guide Interactive is now the official textbook for the primary pavement-oriented course in the UW Department of Civil and Environmental Engineering
bull WSDOT received the prestigious national leadership award from the Association for Commuter Transportation (ACT) for creating balanced transportation solutions that integrate commute options into highway planning projects in the Puget Sound region of Washington state WSDOT Transportation Demand Management (TDM) Resource Center has been heavily involved in research to determine ways to improve travel choices ndash such as vanpools carpools and bicycles ndash in transportation projects planning TDM focuses on reducing drive-alone auto trips by making other choices more available and attractive The ACT award recognizes that WSDOT is leading the way to incorporate alternatives to driving alone into new plans for transportation corridors such as State Route 520 and Interstate 405
bull WSDOT and the Department of General Administration received Governor Lockersquos Governorrsquos Award for Organizational Learning and Growth for the Deschutes Parkway Reconstruction Project The project was completed in October 2002 18 months after the Nisqually Earthquake destroyed major portions of Deschutes Parkway which surrounds Capitol Lake and links Tumwater to downtown Olympia RCI Construction Inc the project contractor contributed to an accelerated repair schedule and the project was completed many months earlier than first estimated and two months ahead of the contract schedule The completed project cost $698000 (16) less than the original engineerrsquos estimates Taxpayers saved an additional $525000 when a previously planned utility upgrade was completed at the same time as the road repairs instead of later This project changed the ways GA and WSDOT collaborate which is already saving money on other projects
Celebrations and Events bull Washington State Ferries (WSF) employees volunteered their time and skills to assist on the annual Special Peoples Holiday Cruise for the Puget Sound regionrsquos children and adults with special needs The event took place aboard the MV Puyallup and is sponsored by the Active Ferry Employees Charitable Trust (AFECT) The afternoon outing has been hosted by AFECT for almost 20 years No state funds are used The annual event is supported by donations of time and money including the Marine Corps Toys for Tots program Chevron Oil and Sodexho Corporation Many other local groups provide entertainment and support
bull WSDOT maintenance crews closed SR 410Chinook Pass on Monday Nov 17 and SR 123Cayuse Pass on Tuesday Nov 18 for the season due to heavy snowfall and snow slide danger Cayuse Pass connects Chinook Pass and White Pass at the east end of Mount Rainier National Park Cayuse and Chinook passes typically close for the season in November and reopen in April
bull Studded tires became legal in Washington on Saturday Nov 1 Studded tires are restricted in Washington due to the amount of wear and roadway damage they cause to state highways estimated at $10 million per year The tires are legal between November 1 and March 31 WSDOT is requesting legislative action to ban studded tires because of the damage and ruts they cause to highways and due to safety considerations Research shows that cars with studded tires take longer to stop than cars with other tires under most situations
Measures Markers and Mileposts - December 31 2003 63
Measures Markers and Mileposts - December 31 2003 65
Gray Notebook Subject Index
Edition Key 1 = Quarter 1 2001 2 = Quarter 2 2001 3 = Quarter 3 2001 4 = Quarter 4 2001 5 = Quarter 1 2002 6 = Quarter 2 2002 7 = Quarter 3 2002 8 = Quarter 4 2002 9 = Quarter 1 2003 10 = Quarter 2 2003 11 = Quarter 3 2003 12 = Quarter 4 2003
All editions can be accessed at wwwwsdotwagovaccountability
Topic Edition
Aviation Fuel Taxable Gallons 6Registrations of Pilots and Aircraft 6 10Training of Pilots and Mechanics 6
Benchmarks (RCW 4701012) Administrative Efficiency 9Transit Efficiency 9VMT per Capita 9
Bridge Conditions on State Highways Age of WSDOT Bridges 4Bridge Ratings (FHWA) Structurally Deficient and Functionally Obsolete 4Bridge Condition Ratings State Comparison 8Bridge Structural Condition Ratings 11Deck Protection Program Overview 4 5 8 11Deck Protection Program Planned vs Actual Projects 4 5 8 11Hood Canal Bridge Update 11Inspection Program 4 11Inventory of WSDOT Bridges 4 5 8 11Preservation Program Results 11Rehabilitation and Replacement Project Schedule 4 11Scour Mitigation 4 11Seismic Retrofit Program 1990-2020 Status 4Seismic Retrofit Program Planned vs Actual Projects 4 5 8 11Seismic Retrofit Program Top 10 Priority Bridges 4 8Steel Bridge Painting Planned vs Actual Projects 4 5 8 11Tacoma Narrows Bridge Update 8 9 10 11
Commute Trip Reduction Award for the Commute Trip Reduction Program 6 11Commute Mode Share in Washington State 1990 and 2000 7Commuting Trends at CTR Work Sites and Work Sites in General 4ldquoDrive Alonerdquo Commuting Rates State Comparison 6 7Eastgate Park and Ride Expansion 9Effectiveness of CTR Program (Biennial Results) 4Employer Participation Investment and Benefits 2Gasoline Consumption Per Capita (from Northwest Environment Watch) 7Park and Ride Lot Occupancy Rates Central Puget Sound 4Park and Ride Lot Occupancy Rates King County 3 5 6 7 8 9 10 11 12Park and Ride Lot Security 5Park and Ride Lot Puget Sound System 8Vanpool Operation in the Puget Sound Region 2 3 4 5 6 7 8 9 10 11 12Vanpooling Share of Daily Puget Sound Area VMT 2VanShare Trends 8 9 11 12
Congestion on State Highways Accidents on Interstate 405 2001 and 2002 9Benchmark Policy Goals for Congestion Analysis 5Congestion Measurement Principles 5 6Daily Vehicle Hours of Delay per Mile Sample Commutes Measured
by Delay Time of Day Distribution of Delay and Travel Rate Index 2 5Distribution of Traffic Between Freeways and Arterials 1999 to 2003 9Employment Puget Sound Region 9
Measures Markers and Mileposts - December 31 2003 64
64 Measures Markers and Mileposts - December 31 2003
Edition Key 1 = Quarter 1 2001 2 = Quarter 2 2001 3 = Quarter 3 2001 4 = Quarter 4 2001 5 = Quarter 1 2002 6 = Quarter 2 2002 7 = Quarter 3 2002 8 = Quarter 4 2002 9 = Quarter 1 2003 10 = Quarter 2 2003 11 = Quarter 3 2003 12 = Quarter 4 2003
All editions can be accessed at wwwwsdotwagovaccountability
Topic Edition Congestion on State Highways (continued)
Highway Improvements Can Improve Congestion 9Induction Loop Detectors 5Intelligent Transportation Systems in Washington State 5
2000 and 2003 9Traffic Speeds and Volumes on SR 520Traffic Volumes at Seven Locations in March 2000 to 2003 Average 9Traffic Volumes on Nine Puget Sound Region Corridors 5Travel Time Reliability 6 9Travel Time to Work Comparison State and County Rankings 5Travel Times on 11 Puget Sound Region Corridors 5 9Travel Times With and Without Incidents 6Typical Freeway Traffic Volume Trend 1993 to 2002 9
Construction Program for State Highways Advertisements by Subprogram Planned Actual amp Deferred 4 5CIPP Value of Advertised amp Deferred Projects by Subprogram 4 5Construction Program Cash Flow Planned vs Actual Expenditures 4 5 6 7 8 9 10 11 12Construction Program Delivery Planned vs Actual Advertisements 1 2 3 4 5 6 7 8 9 10 11 12Contracts Awarded Engineerrsquos Estimate to Award Amount 6 10Contracts Completed Final Cost to Award Amount 6 10Contracts Completed Final Cost to Engineerrsquos Estimate 6 10End-of-Season Highway Construction Project Evaluations 12FHWA Federal Performance Report Card 12Hood Canal Bridge Update 11 12Hot Mix Asphalt Pavement Delivery 3 5 7 9 11Lane Miles Added to State Highway System 1996-2001 2Safety Construction Program Planned vs Actual Advertisements 3 6 8 9 10 11 12Tacoma Narrows Bridge Update 8 9 10 11 12
Design Value Engineering 6 10
Environmental Stewardship Compost Use 7Construction Site Erosion and Runoff Protection 4 6 9 12ldquoEcology Embankmentrdquo Pollutant Removal 8Environmental Impact Statement (EIS) Tracking 9Environmental Compliance Assurance Tracking Violations 9 12Fish Passage Barriers 4Herbicide Usage Trends 5 8 12Organic Recycling Award for WSDOT 12Recycling Aluminum Signs 7Wetland Mitigation and Monitoring 5 9 12
Ferries (WSF) Capital Expenditure Performance Planned vs Actual 4 5 6 7 8 9 10 11 12Customer Comments 3 4 5 6 7 8 9 10 11 12Fare Comparison WSF to Other Auto Ferries 4Farebox Recovery Rate 5 12Farebox Recovery Comparison WSF to Other Auto Ferries and Transit 5Farebox Revenues by Month 3 4 5 6 7 8 9 10 11 12Life Cycle Preservation Performance Planned vs Actual 12On-Time Performance 3 4 5 6 7 8 9 10 11 12Operating Costs Comparison WSF to Other Ferry Systems 3Ridership by Month 3 4 5 6 7 8 9 10 11 12Trip Reliability Index and Trip Cancellation Causes 3 4 5 6 7 8 9 10 11 12
Measures Markers and Mileposts - December 31 2003 65
Measures Markers and Mileposts - December 31 2003 67
Edition Key 1 = Quarter 1 2001 2 = Quarter 2 2001 3 = Quarter 3 2001 4 = Quarter 4 2001 5 = Quarter 1 2002 6 = Quarter 2 2002 7 = Quarter 3 2002 8 = Quarter 4 2002 9 = Quarter 1 2003 10 = Quarter 2 2003 11 = Quarter 3 2003 12 = Quarter 4 2003
All editions can be accessed at wwwwsdotwagovaccountability
Topic Edition Maintenance of State Highways
Achievement of Biennial Maintenance Targets (MAP) 3 4 8 12Anti-Litter Campaign Update 5 11Costs of State Highway Maintenance 4Customer Satisfaction with WSDOT Highway Maintenance Activities 3Debris Pusher Maintenance Attachment 6Guidepost Driver 11Herbicide Usage Trends 5 8 12Highway Sign Bridges Planned vs Actual Repairs 3 4 6 8Highway Signs Number of Maintenance Actions 6 8Integrated Vegetation Management Update 5 12Litter Removal from State Highways 5 6 8 11Living Snow Fence on SR 25 9Mountain Pass Highway Closures 7 9Pavement Striping How Do They Paint the Stripes So Straight 6Pavement Striping Planned vs Actual Miles Painted 3 4 6 8Road Kill on State Highways 5Safety Rest Area Locations and Amenities 9Salt Pilot Project 7 10Snow and Ice Control Operations 4 7Survey on Pass Travel Conditions and Anti-Icer Use 2Survey on Safety Rest Areas 9Traffic Signals Annual Energy Costs and Incandescent Bulb Conversion 3Winter Overtime Hours and Snowfall Amount 7 9Winter Roadway Condition Level of Service and Anti-Icer Chemicals 9Winter Severity and Snow and Ice Operations Costs 9Vortex Generators 5
Pavement Conditions on State Highways ldquoDuerdquo Pavement Rehabilitation Needs 4 8Concrete Pavement Lane Miles by Age and Dowel Bar Retrofit Status 12Pavement Condition Trends 4 8 12Pavement Condition by Type 2Pavement Lane Miles Annual Vehicle Miles Traveled and Programmed Dollars 12Smoothness Rankings by State 4 8 12
Rail Freight Grain Train Carloads 5 6 7 8 9 11 12Grain Train Route Map 5 9Washington Fruit Express Car Loadings Per Week 5 8
Rail State-Supported Amtrak Cascades Service Amtrakrsquos Future 5 6 7 9Budget Update 10Capital Improvement Program and WSDOT Service Goals 2Customer Satisfaction 2 3 4 7 9 12 Farebox Recovery Percentage by Train 4 8 12Internet Reservations and Automated Ticketing 6Investment in Intercity Rail Comparison 5On-Time Performance 2 3 4 5 6 7 8 9 10 11 12Operating Costs 4Passenger Trips by Station 6Ridership by Month 2 3 4 5 6 7 8 9 10 11 12Ridership by Year Long-Term Trends 2 4 8Ridership Patterns by Segment (Seats Sold) 3Route Map Amtrak in Washington 6Station Update 11Vehicles Diverted Annually from Interstate 5 by Cascades 2
Measures Markers and Mileposts - December 31 2003 66
66 Measures Markers and Mileposts - December 31 2003
Edition Key 1 = Quarter 1 2001 2 = Quarter 2 2001 3 = Quarter 3 2001 4 = Quarter 4 2001 5 = Quarter 1 2002 6 = Quarter 2 2002 7 = Quarter 3 2002 8 = Quarter 4 2002 9 = Quarter 1 2003 10 = Quarter 2 2003 11 = Quarter 3 2003 12 = Quarter 4 2003
All editions can be accessed at wwwwsdotwagovaccountability
Topic Edition Safety on State Highways
Alcohol-Related Fatality Rate 12Before and After Collision Data for Highway Safety Improvement Projects 12Bicycle and Pedestrian Safety Federal Benchmark 9Bicyclist Fatality Rates State Comparison 9Cable Median Barrier Installation Before and After Collision Data 12Corridor Safety Program Results 8Driving Speeds on State Highways 4Fatal and Disabling Collisions Circumstances and Type 8Fatal and Disabling Collisions at Intersections Types of Collisions 9Fatal and Disabling Crashes and VMT percent change 3 7 11Fatalities Involving High Blood Alcohol Concentration State Comparison 7Fatality Rates State Highways All State Public Roads amp US 3 7 11Guardrail Retrofit Program 11High Accident Corridors and Locations by Region 4 High Accident Corridors and Locations Statewide 3Low Cost Safety Enhancement Program Planned vs Actual Projects 3 4 5Low Cost Safety Enhancement Program Sample Projects 4 6Pedestrian Fatality Rates State Comparison 8Pedestrian Factors in VehiclePedestrian Collisions 8Port Orchard Roundabout Before and After Collision and Injury Data 12Safety Construction Program Planned vs Actual Project Advertisements 3 6 7 8 9 10 11 12Safety Laws Booster Seats and Mandatory Seat Belts 5Safety Projects Completed This Quarter 7Seatbelt Use State Comparison 7 11Safe Routes to Schools 9 12
Traffic Operations on State Highways FHWA Self-Assessment 9Incident Response Calls Responded to by Region 2Incident Response Clearance Time Distribution 11 12Incident Response Clearance Times 2 3 4 5 8 9 10 11 12Incident Response Customer Comments 8Incident Response Economic Analysis 10Incident Response Non-Collision Response Types 8 9 10 11 12Incident Response Program Types of Responses Program Total 9 10 11 12Incident Response Program Types of Responses 15 to 90 Minute Incidents 9 10 11 12Incident Response Program Types of Responses Over 90 Minute Incidents 9 10 11 12Incident Response Service Actions Taken 7 10 11 12Incident Response Teams Go to the Olympics 5Incident Response Teams Location and Type 7Incident Response Timeline 6Incident Response Times 2 3 4 5Incident Response Total Number of Responses by Month 7 8 9 10 11 12Incidents with Clearance Times Over 90 Minutes 6 7 8 9 10 11 12Intelligent Transportation Systems in Washington State 5Joint Operations Policy Statement between WSDOT
and Washington State Patrol 5Service Patrol Contacts 3 4Spokane Interstate 90 Peak Hour Roving Service Patrol Pilot 5
Traveler Information Award for Traveler Information Web Site 11Calls to 1-800-695-ROAD and 5-1-1 8 9 10 11 12Camera Views 8Evaluation Survey 10Web Site Feedback 8 9Web Site Usage 7 8 9 10 11 12
Measures Markers and Mileposts - December 31 2003 67
Edition Key 1 = Quarter 1 2001 2 = Quarter 2 2001 3 = Quarter 3 2001 4 = Quarter 4 2001 5 = Quarter 1 2002 6 = Quarter 2 2002 7 = Quarter 3 2002 8 = Quarter 4 2002 9 = Quarter 1 2003 10 = Quarter 2 2003 11 = Quarter 3 2003 12 = Quarter 4 2003
All editions can be accessed at wwwwsdotwagovaccountability
Topic Edition Truck Freight
Cross Border Truck Volumes 6 10Freight Routes and Border Crossings in Washington 6 10Freight Shipments To From and Within Washington 10Impediments to Truck Shipping Bridges with Posted Weight Restrictions 6Improvement Projects with Freight Benefits 10Intelligent Transportation Systems Use for Trucks 6 10Managing Over-Sized Truck Loads 6OsoyoosOroville Border Facts 10Overdimensional Trucking Permits 6Revenue Prorated to Washington for Trucks in Interstate Use 6 10Truck Registrations in Washington 6Truck Share of Total Daily Vehicle Volumes 6
Workforce Accident Prevention Activities 3 4 5 6 7 8 9 10 11 12Ferry Vessel Workers Recordable Injuries 2 3 4 5 6 7 8 9 10 11 12Highway Engineer Workers Recordable Injuries 2 3 4 6 7 8 9 10 11 12Highway Maintenance Workers Recordable Injuries 1 2 3 4 5 6 7 8 9 10 11 12Highway Maintenance Workers Safety Training 5 6 7 8 9 10 11 12Human Resources Training for all WSDOT Employees 7 8 9 10 11 12North American Association of Transportation Safety and Health Officials Meeting 3Workforce Levels 5 6 7 8 9 10 11 12
Measures Markers and Mileposts - December 31 2003 68
68 Measures Markers and Mileposts - December 31 2003
Americans with Disabilities Act (ADA) InformationPersons with disabilities may request this information be prepared and
supplied in alternate formats by calling the Washington State Department of Transportation ADA Accommodation Hotline collect (206) 389-2839
Persons with hearing impairments may access Washington State Telecommunications Relay Service
at TTY 1-800-833-6388 Tele-Braille 1-800-833-6385 Voice 1-800-833-6384 and ask to be connected to (360) 705-7097
Civil Rights Act of 1964 Title VI Statement to Public Washington State Department of Transportation (WSDOT) hereby
gives public notice that it is the policy of the department to assure full compliance with Title VI of the Civil Rights Act of 1964 the Civil Rights
Restoration Act of 1987 and related statutes and regulations in all programs and activities Persons wishing information may call the WSDOT
Office of Equal Opportunity at (360) 705-7098
Other WSDOT Information Available The Washington State Department of Transportation has a vast amount
of traveler information available (including Puget Sound area traffic mountain pass reports highway closures ferry schedules and more)
Call the WSDOT statewide toll-free number 1-800-695-ROADIn the Seattle area (206) DOT-HIWY [368-4499]
For additional information about highway traffic flow and cameras ferry routes and schedules Amtrak Cascades rail and other transportation
operations as well as WSDOT programs and projects visitwwwwsdotwagov
For this or a previous edition of the Gray Notebook visit wwwwsdotwagovaccountability
0401-0004
- Cover
- Credits
- Table of Contents
- Beige Pages
-
- Project Reporting on the 2003 Transportation Funding Package
- Current Project Highlights and Accomplishments
- Project Delivery
- Financial Information
- Program Management Information
-
- Worker Safety Quarterly Update
- Workforce Levels and Employee Training Quarterly Update
- Highway Construction Program Quarterly Update
- Tacoma Narrows Bridge Project Update
- Hood Canal Bridge Project Update
- Highway Safety Improvement Projects Quarterly Update
- Asset Management Pavement Assessment Annual Update
- Highway Maintenance Annual Update
- Environmental Programs
- Incident Response Quarterly Update
- Traveler Information Quarterly Update
- Options to Drive Alone Commuting Quarterly Update
- Washington State Ferries Quarterly Update
- State-Supported Amtrak Cascades Service Quarterly Update
- Special Features
- Highlights of Program Activities
- Gray Notebook Subject Index
-

Measures Markers and Mileposts - December 31 2003 27
Contents (continued)
Washington State Ferries Quarterly Update 54Customer comments on-time performance trip reliability capital expenditure performance life cycle preservation performance ridership and farebox revenues and annual farebox recovery rates
State-Supported Amtrak Cascades Service Quarterly Update 58Monthly and annual ridership on-time performance farebox recovery and a King Street Station update Washington Grain Train Update 59Grain Train carloads
Special Features 60Organic Recycling Earns Award for WSDOT 60WSDOT Receives Federal PerformanceReport Card 60Global Positioning at WSDOT 60
Highlights of Program Activities 61A snapshot of WSDOTrsquos activities during the quarter including project starts completions and updates savings and efficiencies rail public transportation and commute trip reduction awards and recognition and celebrations and events
Gray Notebook Subject Index 64Where to find every performance measure ever published in the Gray Notebook via electronic access
Project Reporting on the 2003 Transportation Funding Package
Introduction
WSDOT is preparing extensive information for legislators state and local officials interested citizens and the press on the progress of the program funded by the 2003 Transportation Funding Package Much of the detailed information is regularly presented and maintained on-line on the WSDOT website The Gray Notebook in these special pages known as the Beige Pages highlights each quarterrsquos progress and reports on financial and other program management topics as well as detailed information on key projects
The Beige Pages for this quarter are organized in the following manner
Project Reporting Current Project Highlights and Accomplishments Project Delivery Financial Information Program Management Information
This quarterly report represents a work in progress that will be expanded and refined as more and more projects approach or enter into construction We welcome suggestions and inquiries that can help us strengthen this project delivery and accountability reporting
Project Reporting Project reporting uses several different tools including the Gray Notebook web-based Project Pages and Quarterly Project Reports (QPR) A Project Page will be created for all major WSDOT projects whereas the QPRs will be created for Nickel funded projects of the 2003 funding package (See also Financial Information)
Navigation to the Home Page and the Project Pages
WSDOTrsquos home page can be found at wwwwsdotwagov
The Home Page (shown at right) has several links that allow access to the individual Project Pages through the Accountability navigation bar which provides access to ldquohot linksrdquo found in the on-line version of the Gray Notebook and the Projects navigation bar (which accesses a list of all WSDOT projects)
Project Pages for several of the largest projects are directly linked to the Home Page under the Projects navigation bar Project pages can also be accessed from any WSDOT web page by clicking on the ldquoprojectsrdquo tab at the top of every page
Beige Pages - Measures Markers and Mileposts - December 31 2003 1
Beige Pages - Measures Markers and Mileposts - December 31 2003 3
Roadmap to On-line Project Information The diagram below is a roadmap to the information found on-line The on-line version of the Gray Notebook as well as the Home Page will have ldquohot linksrdquo to the individual Project Pages
Gray Notebook
Home Page
Project Information Roadmap
Project Page Project Pages will report on all WSDOT 2003 Transportation Fund projects Project Pages provide detailed information that is updated regularly
bull Overall Project Vision bull Financial Table bull Funding Components bull Roll-up Milestones bull Roll-up Cash Flow bull Contact Information bull Maps and Links
bull Highlights bull Milestones bull Status Description bull Problem Statement bull Risk Challenges bull Project CostsCash Flow bull Contact Information
QPR Quarterly Project Reports will summarize quarterly activities
Project Pages
Project Pages contain information on all aspects of a specific project An existing Project Page is shown at right
Project Pages provide details on overall project vision funding components financial tables milestones status description problem discussions risk challenges forecasting maps photos links and more
WSDOT has approximately 140 Project Pages that are currently providing on-line updates
A summary of the information found on a Project Page will be provided in a Quarterly Project Report (QPR) that WSDOT anticipates will be accessible through a link on the Project Page
Project pages are to the best of WSDOTrsquos ability regularly updated
Project pages can be found at wwwwsdotwagovprojects
Beige Pages - Measures Markers and Mileposts - December 31 2003 2
2 Beige Pages - Measures Markers and Mileposts - December 31 2003
Current Project Highlights and Accomplishments This is WSDOTrsquos third report of quarterly developments in the delivery of the program of projects under the 2003 Transportation Funding Package
The following project information is gathered from a variety of sources within WSDOT and is principally the responsibility of the various regional administrators and their project teams As a regular part of its project management and accountability strategy for the legislaturersquos 2003 Transportation Funding Package a team of senior WSDOT managers from Olympia meets in each region each quarter to perform due diligence on progress and status for each project and to offer assistance support and coordination of issues or problems arising with any project This process also facilitates the ability of headquarters staff to discuss project status with members and staff of the House and Senate and to report from first hand knowledge about the projects to the Transportation Commission
Contract Advertising and Awards
2003 Transportation Funding Package (ldquoNickel Fundsrdquo) Nine projects were planned to be advertised this quarter Seven of these projects were advertised as planned One project was advanced for advertisement Two projects were deferred for later advertisement
Projects Advertised as Planned
SR 9SR 528 Intersection ndash Signal
This project went to ad October 20 2003 The construction is now starting and the project is expected to proceed on schedule
SR 16 HOV Improvements between Olympic View Drive and Union Ave
This project consists of three construction phases The first contract 6th AvenuePearl Street (SR 16) to Jackson Avenue was advertised to bidders on schedule in mid-November 2003 with this first phase construction to be awarded in mid-January 2004 This construction phase will widen SR 16 to prepare for HOV lanes provide a new trail for bikes and pedestrians and rehabilitate the pavement on SR 16 mainline to accommodate traffic switches needed for phase 2 of the project The contractor will begin grading work in Spring 2004 and is expected to complete its work in Winter 2004
US 97A Entiat Park Entrance - Turn Lanes
This project was advertised on schedule and was awarded on December 15 2003 This project was combined with a ldquonon-nickelrdquo funded roadway preservation project US 97AWenatchee North - Paving Combining this project resulted in a cost savings of $80000 The contractor will begin construction in April 2004 and is expected to be completed in July 2004
SR 124 East Jct SR 12 ndash Reconstruction
This project improves safety on SR 124 east of Pasco by realigning a horizontal curve and widening the lanes and shoulders The contract was advertised for bids on December 8 2003 meeting the schedule to proceed to bid opening on January 14 2004 The improvements are scheduled be open to traffic by summer 2004
SR 161 234th Street to 204th Street E
This project consists of two construction phases The first contract 234th Street East to 204th Street East was advertised to bidders in early November 2003 and awarded to the low bid contractor on December 22 2003 This construction phase will widen SR 161 from one lane to two lanes in each direction The contractor will begin grading work on the new highway in Spring 2004 and this phase is expected to be completed in July 2006
Beige Pages - Measures Markers and Mileposts - December 31 2003 3
Beige Pages - Measures Markers and Mileposts - December 31 2003 5
SR 203 NE 124thNovelty Rd Vic
The project was advertised on schedule However the total project cost has increased by approximately $900000 due to additional right of way and preliminary engineering costs to accommodate King Countyrsquos strict flood plain ordinance This project is funded with pre-existing funds the 2003 Transportation Funding Package and King County and Developer contributions $254000 of the cost increase will have to be accommodated from the 2003 Transportation Funding Package
US 395 Kennewick Variable Message Sign
This project improves safety on US 395 by installing a variable message sign camera and traffic sensor north of the Blue Bridge to warn southbound traffic of congestion and accidents ahead The contract was advertised for bids on schedule on December 1 2003 The bid opening is scheduled for January 14 2004 and the improvements should be placed in use for traffic by summer 2004
Project Advanced for Advertisement
SR 527 132nd SE to 112TH SE (Additional Lanes)
The advertisement date was advanced from March 2005 to December 2003 to coordinate with the availability of funds planned for the project from other sources avoid redesign for changes in stormwater treatment requirements and meet a commitment to Boeing The contract award date is February 25 2004
Projects Deferred for Later Advertisement
SR7SR 507 to SR 512 ndash Safety
The December 2003 contract advertisement date for this project has been delayed until obstacles in right of way acquisition can be cleared WSDOT believed that right of way would be obtained from property owners for a December ad date However the department has received 18 requests for adjudicative hearings from property owners adjacent to the project Additional time will be required to prepare detailed surveys title searches and coordinate scheduling with the Attorney Generalrsquos Office for each of the hearings WSDOT is focused on completing negotiations with the property owners and anticipates advertising the project in spring 2004 with construction starting no later than the summer of 2004
SR 522I-5 to SR 405 Multi-Modal Project
To take advantage of coordinating work with Lake Forest Park in conjunction with the needs of WSDOT the advertisement date would slip from winter 2003 to spring 2006 The 2003 Transportation Funding Package provided the entire project funding in the construction phase The changes will result in shifting $2 million in expenditures from the 03-05 to 05-07 biennium This project is part of an integrated program of corridor improvements where WSDOT will coordinate portions of this project with other improvements which will be funded and constructed by local municipalities such as Seattle Kenmore Lake Forest Park and Bothell
Beige Pages - Measures Markers and Mileposts - December 31 2003 4
4 Beige Pages - Measures Markers and Mileposts - December 31 2003
Project Completions and Other Highlights
Construction Highlights
Several of the highway and rail projects funded by the Nickel Account are now in construction More details can be found in the respective on-line Project Pages at wwwwsdotwagovprojects
Highway Construction Program
I-5 Widen Each Direction From Salmon Creek to I-205
The contractor is currently constructing retaining walls necessary for the widening of the southbound lanes Work is continuing on the temporary widening using a detour bridge in preparation for a traffic shift that will allow construction of the northbound lanes The traffic shift is expected to occur in May 2004 The construction schedule identifies the first weekend closure to demolish the existing NE 129th St structure on the weekend of January 31 2004 The new NE 129th St structure is scheduled to be completed in five months
I-90 Build Lanes from Argonne to Sullivan Road
The contractor met the November 1 2003 milestone to have the temporary westbound lanes constructed and open to traffic Although the project was suspended October 31 2003 for the winter work is continuing on minor items such as drainage ponds Road work will restart as soon as weather conditions permit
I-90 Highline Canal to Elk Heights ndash Truck Passing Lanes
This project constructs a truck climbingpassing lane on eastbound I-90 east of the Indian John Hill Rest Area Work on the project was suspended for the winter on November 20 2003 due to snow and cold temperatures Prior to suspending work the contractor had completed clearing the land in preparation for the widening of the roadway Ninety percent of the embankment excavation and drainage has been completed The left side bridge rail replacement on the Highline Canal bridge is complete To date project completion status is at about 30 Work will resume as weather conditions permit
I-90 Ryegrass Summit to Vantage ndash Truck Passing Lanes
This project constructs a truck climbingpassing lane on westbound I-90 from Vantage to the top of Ryegrass Summit Due to winter conditions work by the contractor was suspended on November 14 2003 Nearly one mile of the additional lane and modifications to the Ryegrass Rest Area ramps are completed and already open to traffic WSDOT survey crews will continue to work preparing for the next construction season as weather permits It is anticipated that the contractor will resume work in March 2004
SR 500 NE 112th Avenue Interchange
This project constructs a new interchange on SR500 at NE 112th AvenueGher Road All utility relocations are now complete and traffic was shifted to temporary lanes during a weekend closure on November 2 2003 (one day ahead of schedule) The bridge footings and columns have been constructed as planned for the eastbound ldquofly-overrdquo bridge with girder placement expected to occur in a three night sequence in mid January 2004 The placement of the noise barrier along the I-205 ramp has started with a scheduled completion of April 2004
Beige Pages - Measures Markers and Mileposts - December 31 2003 5
Beige Pages - Measures Markers and Mileposts - December 31 2003 7
Other Capital Programs
Purchase Oregon Train Set
A purchase agreement to complete this important rail rolling stock acquisition project in the 2003 Transportation Funding Package was executed between WSDOT and Talgo Inc on November 26 2003 Talgo will now paint the outside of the cars to match those already in the fleet The purchase will allow for additional rail passenger service between Seattle and Portland upon completion of track improvements
Tacoma RMDRR Morton Line Repairs ndash Phase 2
This project will complete the necessary repairs to the rail line between Frederickson and Morton to restore rail service interrupted by the 1996 flood Construction of a portion of this project for immediately needed repairs began in July 2003 and was completed in mid-December 2003 The remainder of the construction project will be accomplished under separate agreement with the City of Tacoma (owner) scheduled to begin in early 2004 It is anticipated that the entire project will be completed before the end of the current biennium
Highlights of Projects Ready for Advertisement for 2004 Construction Season
Five of the highway projects in the 2003 Transportation Funding Package are scheduled for advertisement in the two quarters for January 1 2004 to June 30 2004 (the 3rd and 4th quarter of the 03-05 biennium) More details can be found in the respective on-line Project Pages at wsdotwagovprojects The status of these projects is described below Two projects that were scheduled for advertisement during this time frame were deferred to future quarters (the status of these projects are described below)
I-5 2nd Street Bridge (ad date 452004)
The current proposal is to assist traffic flow by reducing construction from two seasons to one No change in total project cost is anticipated The project is expected to be advertised as scheduled
SR7SR 507 to SR 512 ndash Safety (ad date 532004)
The ad date for this project in December 2003 was not met because of complications that arose in the right of way taking May 2004 is the rescheduled ad date that WSDOT hopes to meet if negotiations with property owners can be completed in time
I-90 Cle Elum River Bridge (ad date 31504)
Environmental documentation is complete and approximately 80 of the design is finished The scheduled advertisement date is expected to be met and pre-construction start date is expected to be May 2004
SR 304SR 3 to Bremerton Ferry Terminal (ad date 21704)
This project reconstructs and widens the existing roadway It will add HOV lanes to increase traffic movement The City of Bremerton is the lead agency for this project
WSDOTrsquos role is primarily to assure the administration of the funding provided for in the 2003 Transportation Funding Package WSDOTrsquos expectation is that the City of Bremerton will advance the projectrsquos scheduled advertisement date The estimated construction completion date is June 2006
SR 509 Design amp Critical Right-of Way (ad date 672004)
Construction funds are being transferred to the City of SeaTac which is the lead agency on this phase of the project Environmental permitting and stormwater designs are being developed by WSDOT and are on track to support the scheduled ad date and budget WSDOT expects that the City of SeaTac will meet the scheduled ad date The project is on schedule and within the established budget
Beige Pages - Measures Markers and Mileposts - December 31 2003 6
6 Beige Pages - Measures Markers and Mileposts - December 31 2003
SR 9 Nooksack Road to Cherry Street (ad date 604)
This project was originally scheduled for advertisement in June 2004 but that date has had to be adjusted (is now set for October 2005) because of new geotechnical information requiring design revisions that in turn have led to a larger-than-originally-expected right of way acquisition program Construction cost savings however are also expected to result
SR 161 204th Street to 176th Street (ad date 2904)
The project was originally scheduled for advertisement in February 2004 but that ad date has had to be adjusted (is now set for November 2004) due to real estate acquisitions that have taken longer than expected and to avoid work zone traffic control issues by constructing the entire four miles at the same time WSDOT is coordinating access revision with local developers along the corridor and is currently nearing completion of the design and real estate acquisition phase
Beige Pages - Measures Markers and Mileposts - December 31 2003 7
Beige Pages - Measures Markers and Mileposts - December 31 2003 9
Project Delivery
Proposed Adjustments to Delivery Planning
Meeting schedule budget and scope expectations are important elements in WSDOTrsquos delivery of the projects in the 2003 Transportation Funding Package Planning and design activities for specific projects sometimes identify the need to make adjustments to construction delivery spending schedules Some of these adjustments will have no impact on critical start or completion dates Others may require adjustments to critical dates
The information in this report describes changes that WSDOT has concluded as desirable based on assessments made in the quarter under review ending December 31 2003
Highway Construction Program
US 2 Peshastin East Interchange
The spending plan for this project should be revised based on the Value Engineering Study done in August 2003 and the Cost Risk Assessment done in July 2003 The spending plan for this project has been reduced $88 million to a total of $165 million This is a cost savings of 35 from the budget amount WSDOT also has a plan to reduce the construction phase of the project by two years from three years to one year while maintaining the planned advertisement date of September 4 2009
I-5SR 502 Interchange and Corridor Widening
WSDOT has the opportunity to make advance purchases of Right of Way from property owners that have expressed interest in selling now Purchasing Right of Way at this time benefits both the sellers and the WSDOT in that sellers will be able to know what affect the project will have on them and be fairly compensated and early acquisition lessens the risk of land development increasing land value In order to accelerate this preliminary design and RW work WSDOT is requesting to advance $1000000 for RW and $200000 for Preliminary Engineering into the 0305 biennium The advancement of funds will not increase the total project cost
I-5 Noise Wall
This project was removed from the September 30 2003 Watch List The project is in Seattle near the end of SR 520 and Roanoke Street Previously WSDOT reported that cost and schedule for this project were being reviewed to allow for completion of the design and may result in an ad delay With the review complete and design underway the project will be advertised in early summer 2004 with a construction start in late summer
I-5SR 526 TO US 2 (Marine View Dr) HOV Lanes
WSDOT proposes to advance the advertisement date from March 2008 to October 2007 to ensure that work begins in the spring of 2008 to take full advantage of the 2008 construction season In addition WSDOT is proposing to advance $4 million into the 2003-2005 biennium in order to accelerate design work This acceleration would put WSDOT in a position to further accelerate this project for the benefit of the 2010 Olympics if the Legislature should decide to advance funding for construction (see Opportunities and Options for Legislative Consideration section of this report)
SR 7SR 507 to SR 512 ndash Safety
The December 2003 contract advertisement date for this project has been delayed until right of way access issues can be resolved WSDOT believed that right of way would be cleared with property owners for a December ad date However the Department has received 18 requests for adjudicative hearings from property owners adjacent to the project Additional time will be required to prepare detailed surveys title
Beige Pages - Measures Markers and Mileposts - December 31 2003 8
8 Beige Pages - Measures Markers and Mileposts - December 31 2003
searches and coordinate scheduling with the Attorney Generalrsquos Office for each of the hearings WSDOT is focused on completing negotiations with the property owners and anticipates advertising the project in spring 2004 with construction starting no later than the summer of 2004
SR 9 Nooksack Road to Cherry Street
This project will have an ad date shift from June 2004 to October 2005 to account for an increase in the number of right of way parcels that must be acquired The total cost of the project remains the same as the construction estimate has decreased
SR 16 HOV Improvements ndash Olympic View Drive to Union Avenue
The third construction phase of this project 36th Street to Olympic Drive NW would be advanced two or three quarters to allow more flexibility for planning and implementing traffic switches needed to accommodate the opening the new Second Tacoma Narrows Bridge This third and final construction phase will complete continuous HOV lanes on either side of the Tacoma Narrows from the Sprague Avenue Interchange in Tacoma to the Olympic Drive Interchange in Gig Harbor by spring 2007 Moving the construction start date of this phase from spring 2005 to fall 2004 will not affect the overall cost of the project
SR 20 Quiet Cove Road Vic to SR 20 Spur
In the September 30 2003 Gray Notebook this project was listed on the Watch List At that time WSDOT reported the advertisement date for this project may be delayed to provide time for right of way acquisition and to resolve environmental mitigation issues Currently the advertisement date would slip by nine months from February 2006 to November 2006 which will result in shifting $3 million in projected Nickel Fund expenditure from the 05-07 to 07-09 biennium
I-90 Two-Way Transit and HOV
This Seattle to Mercer Island project is currently funded for design by Sound Transit FHWA and WSDOT and is dependent on Regional Transportation Investment District (RTID) and other sources of funding for construction Should RTID funding become available WSDOT proposes the advertisement date be delayed thirteen months from December 2004 to January 2006 to allow time for the issuance of the draft Environmental Impact Statement This will allow the design to be completed in October 2005 There is no change in the expected project cost However $1 million in projected Nickel Fund expenditures would need to be shifted from the 03-05 biennium to the 05-07 biennium
SR 99 S 284th to S 272nd St HOV Lanes
This project will include a HOV lane and 2 general-purpose lanes in each direction a median sidewalk and planter strip The updated cost estimate for right-of-way acquisition is $51 million this is an increase from the previous estimate of $3 million to account for the potential of higher cost of condemnation The advertisement date would be delayed from December 2005 to April 2006 to correct the record of survey which identify property ownership WSDOT is currently working with the City of Federal Way to minimize the right-of-way cost by eliminating some of the proposed landscaping areas
SR 161 Corridor Improvements ndash 204th Street E to 176th Street
There are multiple stages to this project Stage 1 (234th to 204th) was advertised in November 2003 The proposal is to adjust cash flow and delay the advertisement date of Stage 2 (204th to 176th) from November 2003 to November 2004 This action will reduce traffic impacts and help right of way acquisition These changes should not change the total project cost
Beige Pages - Measures Markers and Mileposts - December 31 2003 9
Beige Pages - Measures Markers and Mileposts - December 31 2003 11
SR 203 NE 124thNovelty Rd Vic
The project was advertised on schedule However the total project cost has increased by approximately $900000 due to additional right of way and preliminary engineering to accommodate King Countyrsquos strict flood plain ordinance This project is funded with pre-existing funds the 2003 Transportation Funding Package and King County and Developer contributions About $250000 of the expected cost increase will come from the 2003 Transportation Funding Package
SR 520 W Lake Sammamish Parkway to SR 202 (Additional Lanes)
Cash flow adjustment to match actual design right of way and construction schedules No change in advertisement date of October 2008
SR 522I-5 to SR 405 ndash Multi-Modal Project (Nickel)
To take advantage of coordinating work with Lake Forest Park in conjunction with the needs of WSDOT partners the advertisement date would slip from winter 2003 to spring 2006 to take advantage of coordinating work with Lake Forest Park The 2003 Transportation Funding Package provided the entire project funding in the construction phase The changes will result in shifting $2 million in expenditures from the 03-05 to 05-07 biennium This project is part of an integrated program of corridor improvements where WSDOT will coordinate portions of this project with other improvements which will be funded and constructed by local municipalities such as Seattle Kenmore Lake Forest Park and Bothell
For financial information on the Proposed Adjustments to Delivery Planning ndash Highway projects please refer to the table on page 16
Other Capital Programs The following six proposed project changes have interrelated funding and impact one another
Palouse River and Coulee City Railroad Acquisition
Depending on a finding of cost effectiveness that the Legislature instructed be made by the Transportation Commission WSDOT would purchase 302 miles of the Palouse River and Coulee City Railroad preserving the statersquos largest short-line railroad that carries 20 percent of the statersquos grain crop The original proposed budget has been reduced by $322000 after further cost estimate review If the conclusion of WSDOTrsquos review of the proposed purchase of this railroad is favorable the purchase will be completed with this decrease in the adjusted budget
Port of Columbia Railroad Improvements (New Project Title)
After further engineering review and scope refinement the following three projects are combined and overall reduced in scope to reflect actual improvements needed to maintain railroad service on this section of track
The original project Port of Columbia Railroad Improvements ndash funds general railroad improvements on the 39-mile line Based on further engineering reviews the original scope for this project has been reduced from a full rebuild of the line to a less expensive rehabilitation of the line that will still provide an adequate level of service to the rail line customers The proposed change will be combined with two additional projects listed in the 2003 Funding Package (the Blue Mountain Railroad Upgrade project which rebuilds 30 miles of track from Wallula to Walla Walla and the Port of Columbia Co Dayton Upgrades project which funds improvements to port rail facilities) into a single project with a total budget of $53 million as compared to the originally combined project budgets of $13 million
Beige Pages - Measures Markers and Mileposts - December 31 2003 10
10 Beige Pages - Measures Markers and Mileposts - December 31 2003
Port of Columbia Dayton Upgrades and Blue Mountain Railroad Upgrade
These projects fund improvements to port rail facilities and rebuilding 30 miles of track from Wallula to Walla Walla It is proposed that these projects be combined with Port of Columbia Railroad Improvements project as described above The original intent of both projects will still be accomplished at a reduced cost
Palouse River and Coulee City Cheney-Coulee-Pullman Upgrade (New Project Title)
After further engineering review and scope refinement two projects (Palouse River and Coulee City Cheney to Coulee Upgrades and Rural Elevator Track Expansion) are combined Also engineering analysis suggests the need for scope change to include upgrades of PRampCC lines in Whitman County
The original project (Palouse River and Coulee City Cheney to Coulee Upgrades) would have funded repairs to numerous railroad bridges in Grant and Lincoln Counties and upgrade track to accommodate 286000-pound freight cars It would also improve the rail line between Coulee City and Cheney The proposed change will combine these upgrades with projects in Whitman Co that were identified by WSDOT in the summer of 2003 Further the scope of the work from the Rural Elevator Track Expansion project (additional track at rural elevators and shortline mainline connections) will also be combined into this expanded scope The proposed scope will be completed within the overall total of $21089000 specified for the projects in aggregate
For financial information on the Proposed Adjustments to Delivery Planning - Rail projects please refer to the table on page 17
Opportunities and Options for Legislative Consideration
The following projects were reported as requiring legislative guidance in June 2003 and continue to be offered for legislative consideration Details on the projects are found in the Gray Notebook for June 30 2003
I-5SR 526 TO US 2 (Marine View Dr) HOV Lanes
The question remains on whether the construction schedule for this project should be advanced so that the project can be completed prior to the 2010 Winter Olympic Games
WSDOT has developed two accelerated schedule options for legislative consideration Option one is to accelerate the project schedule and advertise it for construction bids in March 2006 using the common ldquoDesign-Bid-Buildrdquo practice This option will result in an open to traffic date of 2010 Option two is to accelerate the project schedule and advertise by July 2005 using the ldquoDesign-Buildrdquo method This option will result in an open to traffic date of 2009 and is WSDOTrsquos preferred option The expenditure plan reflects the ldquoDesign-Buildrdquo option
SR 99 Alaskan Way Viaduct
The project replaces the seismically vulnerable Alaskan Way Viaduct and seawall in downtown Seattle The Gray Notebook for September 2003 identified the need to begin design in the summer 2004 as essential to remain on schedule to meet the proposed 2008 start of construction The project has moved money from one phase to another in 2003-2005 with zero dollar change to the bottom line By making this adjustment restoring right of way and increasing PE in the 05-07 biennium The project remains on the accelerated pace that will allow construction to begin in 2008 but not unless funding issues can be resolved
Beige Pages - Measures Markers and Mileposts - December 31 2003 11
Beige Pages - Measures Markers and Mileposts - December 31 2003 13
I-405 Congestion Relief and Bus Rapid Transit Projects
WSDOT proposes revising the I-405 Nickel project sequence to be Kirkland Stage 1 Renton Bellevue and Kirkland Stage 2 The Kirkland Stage 1 project addresses a known congestion hot spot that has a very high benefitcost ratio with work that can be incorporated into future RTID projects This schedule revision allows a project to be constructed and opened to traffic earlier than the original sequence The revision also allows the Renton project the opportunity to combine Nickel funds with Regional Transportation Improvement District (RTID) funds in a larger more cost-effective project should RTID funds become available
SR 522 Bothell ndash UW Campus Access
Should WSDOT use the Nickel expenditure authority for this project since the funding from the lead funding partners did not materialize and WSDOTrsquos budget for the project is insufficient to construct the project This was identified in the September 30 2003 Gray Notebook
SR539I-5 AccessImprovements Ten Mile Road to International Boarder
The question remains on whether the construction schedule for this project should be advanced so that the project can be completed prior to the 2010 Winter Olympic Games
Widening the remaining section of the ldquoTen Mile Roadrdquo will require the project be funded in a future budget appropriation The Nickel funding will provide for preliminary engineering environmental analysis and selection of a project plan for a new connection between I-5 and SR 539 Completing the final design right of way and construction of the project will however require new funding
D Street Grade Separation
The question remains whether the cash flow of this project be advanced into the 03-05 biennium from the 05-07 biennium to enable construction to be accomplished with other stages of this project
The Gray Notebook for September 30 2003 suggests that the 03-05 Supplemental Budget include a $35 million increase in the Program Z appropriation within the Multimodal Account
For financial information on the Opportunities and Options for Legislative Consideration please refer to the table on page 17
ldquoWatch Listrdquo Projects Cost and Schedule Concerns Watch List WSDOT is watching some projects closely for warning that changes in cost schedule or scope may be at risk due to developments and discoveries during the project delivery process in some cases these changes are outside the control of WSDOT Currently the information regarding the changes for these projects are in the early stages and making a conclusion based on this information may not
Watch List
achieve the desired result
Projects Removed from the September 30 2003 Gray Notebook Watch List
SR 3 to SR 303 Interchange Waaga Way
Removed from the Watch List Concerns had been raised that several issues in the design concepts developed in 1995 now necessitating coordination with Kitsap County might require delay of the scheduled ad date in Spring 2005 These issues have now been successfully addressed ndash reducing the
Beige Pages - Measures Markers and Mileposts - December 31 2003 12
12 Beige Pages - Measures Markers and Mileposts - December 31 2003
number of traffic signals reducing the volume of pavement increasing traffic volume capacity and minimizing impacts on local adjacent ball fields Project progress now supports both the originally scheduled ad date and the project budget
I-5 Noise Wall
See Proposed Adjustments in delivery planning Removed from the Watch List Previously WSDOT reported that the need to prepare design for the project would lead to delay in the schedule originally set by the legislature With the review complete and design underway the project has now been scheduled to advertise in early summer 2004 with construction work to begin during the summer
SR 20 Quiet Cove Road Vic to SR 20 Spur
See Proposed Adjustments in delivery planning Removed from the Watch List This project has moved to Proposed Adjustments in the Gray Notebook WSDOT reported the need to delay the advertisement date for this project might be delayed to provide additional time to acquire environmental approvals necessary for right of way acquisition The current plan is to slip the advertisement date by nine months from February 2006 to November 2006 in order to provide adequate time to resolve environmental mitigation issues and acquisition right of way This delay will result in shifting $3 million in Nickel funding expenditure from the 05-07 to 07-09 biennium
SR 99 S 284th to S 272nd St HOV Lanes
This project has moved to proposed adjustments in the Gray Notebook Removed from the Watch List The updated cost estimate for right-of-way acquisition is $51 million This is an increase from the previous estimate of $3 million and has been factored in to the project to account for the potential higher cost of condemnation Advertisement date will be delayed from December 2005 to April 2006 in order to correct the record of survey to identify property ownership
SR 161 Jovita Blvd to S 360th St
Removed from Watch List In the September 30 2003 Gray Notebook this project was on the Watch List for potential design changes from increased costs and delayed construction due to environmental and air quality provisions that have become more stringent while waiting for funding to be approved The air quality analysis has now been completed and there will be no impact to the project as a result The NEPA re-evaluation is still in progress and WSDOT anticipates the report to be finalized in January 2004 and approved shortly thereafter
SR 203 NE 124thNovelty Rd Vic
See Proposed Adjustments to Project Delivery and Contract Advertising amp Awards Removed from Watch List Previously WSDOT reported that arriving at a new floodplain mitigation site might have implications for cost and schedule The project was advertised on schedule but the project costs for additional engineering and right of way acquisition increased by a total of $900000
US 395 North Spokane Corridor (Francis Avenue to Farwell Road)
Removed from Watch List This was a ldquoWatch Listrdquo project in the last quarterrsquos report because of concerns over obstacles in the acquisition of a single indispensable right-of-way parcel With the assistance of mediation the acquisition was completed in November 2003 The contract advertisement was set for January 2004 with bid opening in March 2004 The project is expected to be delivered within approved funding and with little delay to the opening date
SR 522I-5 to SR 405 ndash Multi-Modal Project (Nickel)
Removed from Watch List See Proposed Adjustments to Project Delivery In the September 30 2003 Gray Notebook WSDOT reported it was considering delaying the advertisement date to coordinate with the City
Beige Pages - Measures Markers and Mileposts - December 31 2003 13
Beige Pages - Measures Markers and Mileposts - December 31 2003 15
of Lake Forest Park To coincide with the needs of WSDOT partners the advertisement date will slip from winter 2003 to spring 2006 to take advantage of coordinating work with the City of Lake Forest Park The Nickel Funding Package provided the entire project funding in the construction phase These changes will result in shifting $2 million in expenditure from the 03-05 to 05-07 biennium
SR 543I-5 to Canadian Border - Additional Lanes for Freight
Removed from Watch List In the September 30 2003 Gray Notebook WSDOT reported the department was working to resolve structural design issues as a result of poor soil conditions The initial engineering solution was to design retaining walls that would be expensive and cause the project to exceed the budget A slope redesign was therefore developed as an alternative It has resulted in making one wall unnecessary and reducing the necessary height of several walls This affordable design is more cost-effective and should bring the project back within the anticipated budget
Update on Projects Noted in the ldquoWatch Listrdquo in the Gray Notebook ending September 30 2003
I-5 From Rush Road to 13th Street
The Watch List for the September 30 2003 Gray Notebook described the review by FHWA of this project to add one lane in each direction on I-5 between the interchanges at Rush Road (exit 72) and 13th Street (exit 76) including construction of a new interchange at the current LaBree Road under-crossing At the time of publication FHWA approved the added access with conditions
SR 9SR 522 to 212th St SE (Stages 1b amp 2)
The Watch List for the September 30 2003 Gray Notebook described the need to make design changes (raised center line barrier) with two-way-left-turn-lane based on current traffic data The design change may result in a delay of the advertisement date WSDOT continues to coordinate design and construction planning with King County regarding the Countyrsquos development of the Brightwater Wastewater Treatment Plant adjacent to the project There is continuing discussion of a revised advertisement and construction schedule
SR 167 15th St SW to 15th St NW ndash HOV
In the last Gray Notebook Watch List WSDOT reported that the project cost increased by $44 million and that the advertisement date could be delayed The advertisement date will be moved to February 2005 to accommodate redesign of the project to meet current stormwater standards WSDOT staff worked with permitting agency representatives on the Multi-Agency Permitting Team (MAPT) and determined that the original drainage design would not meet current water quality regulations The MAP Team has determined that additional stormwater detention and treatment will indeed be required Local agencies have also stated that additional wetland and stream buffer mitigation will be required As a result additional funds will be required for the design and construction of ecology embankments additional detention ponds and buffer mitigation The additional work will delay the advertisement date to the first quarter 2005 WSDOT staff is investigating designs in order to minimize the amount of these cost increases and will report next quarter
SR 270 Pullman to Idaho State Line - Additional Lanes
In the September 30 2003 Gray Notebook it was reported that there was a possibility of a project cost increase due to rock and soil conditions and the need for bridge design modifications Drilling and soil testing began in mid December 2003 with planned completion of testing in February 2004 Due to the unknown rock depth in excavation areas and bridge design considerations for two bridges it is anticipated that that a project cost increase ranging from $2 million to $5 million may be required The project cost estimate is expected to be completed by July 2004 As the project design is further refined WSDOT is investigating methods to reduce or offset these cost increases The project is on schedule for advertisement in January 2005
Beige Pages - Measures Markers and Mileposts - December 31 2003 14
14 Beige Pages - Measures Markers and Mileposts - December 31 2003
SR 410 214th Ave E to 234th - Widening
WSDOT reported in the Watch List of the September 30 2003 Gray Notebook that costs for this project could increase $16 million or more to purchase land that will be needed for stormwater treatment and detention was re-zoned for commercial and light industrial during the project development phase Engineering work is underway to develop an updated cost estimate for right-of-way acquisition based on the zoning changes by the end of February 2004 This project will address sections of the roadway where accidents occur by controlling access to the highway building new signal systems at major intersections and reducing congestion by providing an additional lane in each direction
Projects added to the ldquoWatch Listrdquo
Bellingham-GP Area Upgrades
This project would upgrade the existing track through Bellinghamrsquos Georgia Pacific (GP) Plant to allow for slightly higher speeds for Amtrak Cascades intercity trains resulting in a travel time reduction of about 11frasl2 minutes Due to unanticipated freight business at the mostly closed GP plant since the project scope was developed the project scope is now inadequate The implications for cost and schedule are being reviewed
Beige Pages - Measures Markers and Mileposts - December 31 2003 15
Beige P
ages - Measures M
arkers and Mileposts - D
ecember 31 2003
17
Beige P
ages - Measures M
arkers and Mileposts - D
ecember 31 2003
The following table summarizes the various changes and adjustments described on pages 8-10 for the quarter ending December 2003
Highway Projects Proposed Adjustments to Project Delivery Quarter Ending December 31 2003 Dollars in Thousands
03-05 05-07 07-09 09-11 11-13 Ten Year Total
Adjusted Net Adjusted Net Adjusted Net Adjusted Net Adjusted Net Adjusted Net SR Project Budget Budget Change Budget Budget Change Budget Budget Change Budget Budget Change Budget Budget Change Budget Budget Change 002 US297 Peshastin East - 2100 2100 0 1870 2700 830 7600 11750 4150 13780 0 -13780 0 0 0 25350 16550 -8800
Interchange 005 I-5SR502 Interchange 1321 2521 1200 8679 7479 -1200 0 0 0 0 0 0 0 0 0 10000 10000 0
005 I-5 Noise Wall 3500 3500 0 0 0 0 0 0 0 0 0 0 0 0 0 3500 3500 0
005 I-5SR526 to US 2 (Marine View 11000 15000 4000 6300 11300 5000 54780 52277 -2503 121900 117005 -4895 44680 36474 -8206 238660 232056 -6604 Drive)
007 SR7SR507 to SR512-Safety 9300 9300 0 0 0 0 0 0 0 0 0 0 0 0 0 0 0 0
009 SR 9 Nooksasck Road to Cherry 6320 1548 -4772 8800 12730 3930 0 927 927 0 0 0 0 0 0 15120 15205 85 St
016 SR 16 HOV Improvements 49623 51483 1860 40902 39042 -1860 0 0 0 0 0 0 0 0 0 90525 90525 0 between Olympic Drive and Union Ave
020 SR 20Quiet Cove Rd Vic to SR 0 0 0 3790 766 -3024 3270 6294 3024 0 0 0 0 0 0 7060 7060 0 20 Spur
024 SR24I82 to Keys Road 840 840 0 22000 22000 0 9000 9000 0 0 0 0 0 0 0 31840 31840 0
031 SR 31Metaline Falls 4900 2400 -2500 11000 13500 2500 0 0 0 0 0 0 0 0 0 15900 15900 0 To Canadian Border
090 I-90 Two-way Transit and HOV 4000 3000 -1000 11000 12000 1000 0 0 0 0 0 0 0 0 0 15000 15000 0
099 SR 99s 284th to S 272nd St 3780 3656 -124 6323 8519 2196 2600 2621 21 0 0 0 0 0 0 12703 14796 2093 - HOV Lanes
161 SR 161Corridor Improvements 12100 6641 -5459 7300 12709 5409 15 27 12 0 38 38 0 0 0 19415 19415 0 -176th to 234th
203 SR 203NE 124thNovelty Rd Vic 1200 2084 884 0 163 163 0 0 0 0 0 0 0 0 0 1200 2247 1047
520 SR 520w Lake Sammamish 3400 3368 -32 4900 6700 1800 24500 16225 -8275 38720 60515 21795 30800 15493 -15307 102320 102301 -19 Pkwy to SR 202
522 SR 522I-5 To SR 405 Multi- 3600 1497 -2103 1500 3568 2068 0 0 0 0 0 0 0 0 0 5100 5065 -35 modal Project
Total of Projects Above 116984 108938 8046 134364 153176 18812 101765 99121 -2644 174400 177558 3158 75480 51967 -23513 593693 581460 -12233
Project Adjustments from Quarter 1 229284 210820 -18464 374159 375781 1622 323393 333343 9950 229295 263815 34520 142025 107237 -34788 1298156 1290997 -7159
Total of Projects from Quarter 2 221033 238273 17240 283976 265815 18161 312730 310414 -2316 307339 307064 -275 318918 348876 -42 1483296 1479741 -3555
Total for All Projects 567301 558031 -9270 792499 794772 2273 737888 742878 4990 711034 748437 37403 566423 508080 -58343 3375145 3352198 -22947
16
16Beige P
ages - Measures M
arkers and Mileposts - D
ecember 31 2003
Beige P
ages - Measures M
arkers and Mileposts - D
ecember 31 2003
The following table summarizes the various changes and adjustments described on pages 10-11 for the quarter ending December 2003
Rail Projects Proposed Adjustments to Project Delivery Quarter Ending December 31 2003 Dollars in Thousands
03-05 05-07 07-09 09-11 11-13 Ten Year Total Adjusted Net Adjusted Net Adjusted Net Adjusted Net Adjusted Net Adjusted Net
Project Budget Budget Change Budget Budget Change Budget Budget Change Budget Budget Change Budget Budget Change Budget Budget Change
Palouse Riv amp Coulee City RR 5820 5820 - 1530 1208 (322) - - - - - - - 7350 7028 (322) Acquistion Port of Columbia Railroad - - - - 11500 252 (11248) 1904 1904 - 3157 3157 11500 5313 (6187) Improvements Port of Columbia Co Dayton - - - - 320 - (320) - - - - - 320 - (320) Upgrades Blue Mtn RR Wallula-Walla Walla - - 1260 - (1260) - - - - - - - 1260 - (1260) Upgrade Rural Elevator Track Expansion - - - - - - 1140 - (1140) 3860 - (3860) 5000 - (5000)
PRampCC Cheney-Coulee 286K - - 1582 1582 11568 11568 8000 7236 (764) - 703 703 8000 21089 13089 Upgrade
Total Rail Projects 5820 5820 - 2790 2790 - 11820 11820 - 9140 9140 - 3860 3860 - 33430 33430 0
The following table summarizes the various opportunities and options described on pages 11-12
Highway Projects Opportunities and Options for Legislative Consideration Quarter Ending December 31 2003 Dollars in Thousands
03-05 05-07 07-09 09-11 11-13 Ten Year Total Adjusted Net Adjusted Net Adjusted Net Adjusted Net Adjusted Net Adjusted Net
SR Project Budget Budget Change Budget Budget Change Budget Budget Change Budget Budget Change Budget Budget Change Budget Budget Change
005 I-5 SR 526 (Marine View 11000 16000 5000 6300 110000 103700 54780 88000 33220 121900 - (121900) 44680 - (44680) 238660 214000 (24660) Drive)
099 SR 99 Alaskan Way Viaduct 45000 45000 - 12000 40000 28000 40000 40000 - 40000 40000 - 40000 12000 (28000) 177000 177000 -
405 I-405 Congestion Relief 46000 46000 - 99840 114840 15000 139020 199020 60000 160195 125195 (35000) 40000 - (40000) 485055 485055 -Projects
522 SR 522 Bothell-UW Campus 8000 - (8000) - 8000 8000 - - - - - - - - - 8000 8000 -Access
539 SR 539 I-5 Improvements 4850 4800 (50) 5500 8300 2800 5200 62800 57600 31500 8000 (23500) 42000 - (42000) 89050 83900 (5150) Ten-Mile Road to Intrsquol Border
Total Projects 114850 111800 (3050) 123640 281140 157500 239000 389820 150820 353595 173195 (180400) 166680 997765 967955 (29810)12000 (154680)
17
Beige Pages - Measures Markers and Mileposts - December 31 2003 19
Financial Information
2003 Transportation Funding Package ndash Paying for the Projects The first edition of the Beige Pages (June 2003) included an in-depth discussion of the Legislaturersquos 2003 Transportation Funding Package The revenue forecast has now undergone several updates since the Legislature enacted the budget The following information reflects the November 2003 forecast changes as well as the impact from the recent Supreme Court decision on Initiative 776 Further refinements to debt service estimates have also been made
Revenue Forecasts The 2003 Transportation Funding Package enacted by the Legislature included tax and fee increases The gas tax was increased by 5cent per gallon and gross weight fees on trucks increased by 15 An additional sales tax on new and used vehicles of 03 and a license plate number retention fee were both established The first two sources are to be deposited to a new account called the Transportation 2003 (Nickel) Account The latter two are to be deposited to the Multimodal Transportation Account that was established several years ago
The following charts show the current projected revenues over the next ten years (for the new funding sources) as forecasted in November 2003 by the Transportation Revenue Forecast Council compared to the legislaturersquos assumed lsquobaselinersquo projections used in the budget-making process in March 2003 Cumulative ten-year totals and individual biennial amounts are both shown
Transportation 2003 (Nickel) Account Revenue Forecast Forecast comparisons include actual March 2003 Legislative Biennial Baseline Compared to
November 2003 Transportation Revenue Forecast Council revenue collection data to date as well Millions of Dollars
as updated projections based on new and revised economic variables The November 2003 forecast includes several months of actual revenue receipt information Gas tax receipts include four months of actual collections and licenses permits and fees include three months of receipts In the Transportation 2003 (Nickel) Account revenue projections for the ten-year period for gas tax receipts were increased over the September 2003 forecast (+105) and licenses permits and fees were forecast to be slightly higher (+05) before taking into account the impact of Initiative 776 However when including the I-776 impact forecasted revenues for licenses permits and fees are down ten percent for the ten-year period In the Multimodal Account licenses permits and fees projected revenue for the ten-year period remained unchanged from the September 2003 forecast Initiative 776 did not impact the Multimodal account
$2000
$1800
$1600
$1400
$1200
$1000
$800
$600
$400
$200
$0
$19240m Baseline Total
November 2003 Forecast Total $18506m
Licenses Permits and Fees 5cent Gax Tax um
ulative
C
$3262 $3186 $3701 $3632 $3912 $3767 $4120 $3907 $4244 $4013
July 1 Baseline Nov 03 Baseline Nov 03 Baseline Nov 03 Baseline Nov 03 Baseline Nov 03 2003 Forecast Forecast Forecast Forecast Forecast
Biennium Ending Biennium Ending Biennium Ending Biennium Ending Biennium Ending June 2005 June 2007 June 2009 June 2011 June 2013
New Sources - Multimodal Account Revenue Forecast March 2003 Legislative Biennial Baseline Compared to November 2003 Transportation Revenue Forecast Council Cumulative and Biennial Totals Millions of Dollars
$600
$400
$200
$0
$3831m Baseline Total
Licenses Permits and Fees 03 Vehicle Sales Tax
Cumulative
November 2003 Forecast Total
$730 667$622 $592 $777 $709 $814 $752 $888 $817 $3537m
July 1 Baseline Nov 03 Baseline Nov 03 Baseline Nov 03 Baseline Nov 03 Baseline Nov 03 2003 Forecast Forecast Forecast Forecast Forecast
Biennium Ending Biennium Ending Biennium Ending Biennium Ending Biennium Ending June 2005 June 2007 June 2009 June 2011 June 2013
Beige Pages - Measures Markers and Mileposts - December 31 2003 18
18 Beige Pages - Measures Markers and Mileposts - December 31 2003
Bond Sales Plan for New Authorizations Provided by the 2003 Transportation Funding Package The 2003 Transportation Funding Package contained two new bond authorizations
bull a gas tax authorization of $26 billion
bull a state General Obligation Bonds (GO) authorization of $3495 million The proceeds from the new gas tax bonds will be used to fund highway projects The debt service will be paid by the revenues from the nickel increase in the gas tax The proceeds from the new state GO bonds will be used to fund rail and ferry projects Debt service for these bonds will be paid from the Multimodal Account Receipts from the new 03 sales tax on new and used vehicles will be deposited to the Multimodal Account and will augment rental car tax receipts and other fees already directed to this account
2003-2005 Biennium
For the 2003-2005 biennium the Legislature appropriated $280 million in proceeds from the new gas tax bonds and $477 million from the state GO bonds To date in this biennium $80 million of gas tax bonds have been sold No new bond sales occurred in this reporting period However in February 2004 (the next scheduled state bond sale) $25 million in gas tax bonds is planned to be sold for the 2003 Transportation (Nickel) Account and $20 million in GO Bonds for the Multimodal Account
The bond sales plan has not changed from the initial report The combined affect of the revenue forecasts bond sales assumptions and project expenditure assumptions is presented in the next section
Financial Plans for Accounts Supporting the 2003 Funding Package Transportation 2003 (Nickel) Account The Transportation 2003 (Nickel) Account was established in the state treasury to be the repository of the new nickel gas tax and the increases in various vehicle licenses permits and fees Bond proceeds from the $26 billion authorization will also to be deposited to this account Uses of the account include cash funding of highway and
Transportation 2003 (Nickel) Account 2003-2005 Budget and Ten-Year Financial Plan dollars in millions
Balance Forward from Previous Biennium Sources Gas Tax Revenues (new 5cent) Licenses Permits and Fees Revenues I-776 Impact (loss of revenue) Interest Earnings Bond Proceeds Federal Funds Local Funds
03-05 $00
2980 231 (26) 43
2800 10 34
05-07 $44
3419 241 (27) 43
5680 97 24
07-09 $171
3533 262 (28) 43
6700 00 09
09-11 $362
3652 284 (29) 43
6430 00 02
11-13 $672
3751 292 (29) 43
4390 00 34
Ten-Year Total
17335 1310 (139)215
26000 107 103
Total Sources of Funds Uses
$6072 $9477 $10519 $10382 $8481 $44930
Cost of Bond Issuance 07 13 17 16 12 65 Bond Sale Underwriters Discount 21 40 50 48 36 195 Debt Service 225 906 1890 2622 3378 9021
Highway Improvements 5697 7943 7338 6909 4628 32515 Highway Preservation 20 103 50 203 1070 1446 Washington State Ferry Construction 57 345 983 274 39 1699 Total Uses of Funds Biennium Ending Balance
$6028 $44
$9350 $171
$10328 $362
$10072 $672
$9163 ($10)
$44940 ($10)
This plan represents the current budget and ten-year financial plan as adopted by the 2003 Legislature and does not contain any proposed adjustments to project delivery
Beige Pages - Measures Markers and Mileposts - December 31 2003 19
Beige Pages - Measures Markers and Mileposts - December 31 2003 21
ferry projects identified by the Legislature and the payment of debt service and other associated costs for bonds sold to provide debt financing for highway projects Since gas tax receipts are deposited to this new account the uses of the account are restricted to highway purposes as required by the 18th Amendment to Washingtonrsquos Constitution The financial plan below brings together all of the projected Sources (tax revenue bond proceeds interest earnings) and Uses (2003-2005 appropriations 10-year projected program expenditures and debt service) of the new account
Changes to projected Sources and Uses of funds have been updated to reflect the most current forecasts As changes either positive or negative are incorporated into the plans the ending balances in the outer biennia are affected The current pro forma which incorporates actual tax collections and current forecast projections predicts a small negative ending balance of approximately $10 million by the end of the 2011-13 biennium The September 2003 pro forma predicted that there might be a negative $165 million shortfall This change is primarily due to a refinement to debt service calculations and the increased gas tax revenue forecast
As mentioned earlier for the ten-year period gas tax receipts were up slightly from the September 2003 forecast ($185 million) and licenses permits and fees were up slightly ($06 million) before the I-776 impact Key economic variables tax receipts and interest rates will continue to change over time Future updates to forecasts as well as inclusion of more actual receipts will further impact the projected final ending balance Additionally actual and revised assumptions pertaining to bond sales and debt service will continue to be incorporated and likewise will impact the outlook for the final ending balance
Impacts of Initiative 776 The 2003 Transportation (Nickel) Account was affected by Initiative 776 the application of which was ruled upon in October 2003 by the State Supreme Court (other affected accounts include the Motor Vehicle Account the Puget Sound Ferry Operations Account and the Washington State Patrol Account) This table shows the projected impact of Initiative 776 to all affected accounts in millions of dollars The 2003 Transportation Account will be negatively impacted over the ten-year period by $139 million
I-776 ImpactsLoss of Revenue by Account dollars in millions
Ten-Year 03-05 05-07 07-09 09-11 11-13 Total
Motor Vehicle Account $307 $272 $280 $289 $297 $1445 Transportation 2003 (Nickel) Account 26 27 28 29 29 139 Puget Sound Ferry Operations Account 06 05 05 06 06 28 Washington State Patrol Account 94 82 84 87 89 436 Biennial Total $433 $386 $397 $411 $421 $2048
Multimodal Transportation Account The Multimodal Transportation Account was established several years ago as the repository for tax revenues and operating and capital expenditures not restricted by the 18th Amendment The 2003 Transportation Funding Package directs receipts to this account from the additional 03 sales tax on new and used vehicles and the license plate number retention fee The most significant pre-existing tax deposited to this account is the rental car tax The 2003 Funding Package also directs bond proceeds from the $3495 million State GO authorization to this account
Beige Pages - Measures Markers and Mileposts - December 31 2003 20
20 Beige Pages - Measures Markers and Mileposts - December 31 2003
Multimodal Account 2003-2005 Budget and Ten-Year Financial Plan (dollars in millions)
03-05 05-07 07-09 09-11 11-13 Ten-Year Total
Balance Forward from Previous Biennium $141 $107 $202 $330 $491 Sources Licenses Permits Fees Distribution 247 270 282 290 302 1391 Rental car tax 453 503 567 627 689 2839 Sales Tax on New amp Used Car Sales 588 648 685 729 792 3442 Miscellaneous Income 15 15 15 15 15 75 Bond Proceeds 478 437 1287 896 398 3495 Federal Revenue 141 54 55 1016 1877 3142 Local Revenue 27 02 02 02 02 33 Total Sources of Funds $1948 $1928 $2893 $3575 $4074 $14417 Operating Uses Cost of Bond Issuance 01 01 03 02 01 09 Bond Sale Underwriters Discount 04 03 10 07 03 26 Debt service 22 93 195 325 439 1073 Transfers to Other Accounts 99 45 45 45 45 279
WSDOT Program Support amp Planning 54 45 46 47 48 240 Public Transportation 493 521 584 627 661 2886 WSF Maintenance and Operations 51 53 54 55 56 268 Rail 376 403 410 418 426 2033 Total WSDOT Operating Uses of Funds $1099 $1163 $1347 $1526 $1679 $6814 Capital Uses Hwy Preservation P0C 17 200 100 00 00 317 WSF Construction W0C 134 82 607 473 00 1296 Rail Y0C 440 327 711 1415 2250 5143
Local Programs Z0C 292 60 00 00 00 352 Total Capital Uses of Funds $883 $669 $1419 $1887 $2250 $7108
Biennium Ending Balance $107 $202 $330 $491 $636 $636
New funding source from the 2003 Legislative Package
Projects funded primarily by New Bonding Authority and Augmented Federal Funds for Rail
New Bond Authorization from the 2003 Legislative Package
Anticipated Federal Funds
The Multimodal Account includes changes to projected sources of funds based on three months of actual receipts and current forecast data As stated above projected revenues from licenses permits and fees for the ten-year period remained unchanged from the September 2003 forecast
Beige Pages - Measures Markers and Mileposts - December 31 2003 21
Beige Pages - Measures Markers and Mileposts - December 31 2003 23
Program Management Information
Management Information Systems and Needs
A key lesson learned from WSDOTrsquos nationwide assessment of project delivery information systems was that successful transportation programs were supported by integrated management information systems Currently WSDOTrsquos hardware and software capabilities in this area pieced together over a period of more than twenty years fall far short of delivering what is necessary to support todayrsquos higher expected levels of oversight and accountability This presents significant challenges
WSDOT managers are required to access project financial plans expenditure plans actual expenditure levels project milestones and project work load estimates from several different management systems Reporting from the various systems while partially automated requires a significant degree of manual intervention and support systems (databases spreadsheets etc)
The 2003 Legislature supported WSDOTrsquos request for a systems modernization assessment study A Legislative Transportation Committee (LTC) workgroup was formed to provide oversight for this project Members include four senators and four representatives charged with recommending actions to the full LTC The workgroup met in September 2003 to initiate review of the project Statement of Work If the statement of work is approved the assessment effort is expected to produce an integration strategy and a project plan for presentation to the transportation committees of the legislature by December 2004
While developing the long-term plan there are pressing short-term needs that are required to shore up the existing systems WSDOT has completed the following activities
bull Added information to the data marts used for reporting program management information (CPMS) and project accounting information (TRAINS) This will provide added support for project and program tracking and will increase reporting options and flexibility of information retrieval
bull Developed a web-based Quarterly Project Report for the Gray Notebookrsquos Beige Pages Trained staff to feed information to the Quarterly Project Report manually and developed a plan to implement electronic data feeds (to be implemented in early 2004)
bull Completed an assessment of the number of projects by project type and by region that have been loaded into the agencyrsquos Project Scheduling Information System (PDIS)
bull Developed a preliminary plan to build a PDIS Data Mart that will make project schedule and status information more readily available for reporting Completion of the data mart is tentatively scheduled for mid-2004
bull Developed a preliminary designbuild work breakdown structure for use in scheduling the mega projects This structure will allow for scheduling and reporting status at a detailed level and assessing the earned value of work done to-date as the mega projects proceed
bull Started development of data marts to provide flexible reporting of the roadway inventory information that supports project scoping and development activities (to be implemented in mid-2004)
Right of Way Acquisition Delays and cost increases in right of way acquisition have affected the delivery of several 2003 Transportation Funding Package projects For example advertisement for the SR 7SR 507 to SR 512 ndash Safety project has been delayed due to 18 adjudicatory hearing requests from property owners adjacent to the project WSDOT expects to complete negotiations with property owners by the end of spring 2004 For details see page 4
The tight delivery schedule for the 2003 Transportation Funding Package presents unique challenges for right of way acquisition In order to minimize future right of way acquisition problems the WSDOT Real Estate Services office (RES) and the Access Management office are analyzing the next two biennia to pick out projects requiring immediate action to assure that right of way is delivered in time for advertisement WSDOTrsquos right of way access and real estate experts have also formed a plan to look for total parcel acquisitions and parcels where access control is already in place thereby avoiding access hearings whenever possible Acquisition plans will be developed as soon as possible and RES will be able to begin to acquire the necessary properties
Beige Pages - Measures Markers and Mileposts - December 31 2003 22
22 Beige Pages - Measures Markers and Mileposts - December 31 2003
Appraisers title examiners and real estate agents in the private sector continue to enjoy a high volume of business due to the low interest rate environment As a result recruitment of experienced real estate professionals to replace retiring right of way staff at WSDOT is proving challenging WSDOT continues to seek qualified professionals to join its staff and will also begin a training program to develop sufficient staff experience to support the large program it needs to deliver over the next decade
Utilities Relocation
As of December 31 no utility relocation issue has caused a project to go on ldquoWatch Listrdquo status
One of the keys to avoiding obstacles to project delivery from utilities relocation is to give utility companies as much notice as possible of WSDOT project impacts to their facilities This allows the utilities adequate time for design budgeting and scheduling of the utility relocation Below is an example of WSDOTrsquos coordination efforts with the goal of minimizing utility relocation risks to our project schedules
bull Widen I-5 Each Direction from Salmon Creek to I-205
NW Natural had concerns that the pressure in its natural gas lines would not adequately serve the neighborhood to the west of Interstate 5 once the NE 129th Street over crossing was demolished WSDOT and NW Natural changed the original plan to run the gas line across the new bridge at 129th The new plan utilized horizontal directional boring equipment to place the line under Interstate 5 allowing the utility to navigate around proposed drainage drilled shafts for the new bridge and retaining walls
Comcast also voiced concern regarding running a temporary line during the reconstruction of the bridge WSDOT worked to provide a new freeway crossing at the 134th Street interchange rather than at 129th Street
bull SR 270 Pullman to Idaho State Line ndash Additional Lanes
An initial meeting has taken place with Avista Utilities for gas line relocation along the SR 270 corridor This allows approximately one year to complete design and relocation prior to the start of the contract
bull SR 31 ndash Metaline Falls to the Canadian Border ndash Reconstruction
A new fiber optic line was recently installed at the north end of the project to enhance communications to the Metaline Falls Border Crossing After coordination with WSDOT the Pend Oreille Telephone Company placed the line so that it would not impact roadway construction
bull US 395 North Spokane Corridor - Gerlach to Wandermere
An agreement has been made with Bonneville Power Administration to initiate design work on tower relocation and reconstruction The design work is to be completed by April 2004 Construction is scheduled to begin in November 2004
WSDOT is also coordinating with the PUD and local communications companies in Pacific County on US 101 in the vicinity of South Bend to make design adjustments so that underground utility lines can be placed at the time WSDOT raises the grade of the road for the SR 105 Mitigation ndash Willapa River Estuarine project This will not impede the traffic staging of the project and will decrease the risk of any utility relocation delays to the contractor
Environmental Documentation Review Permitting and Compliance WSDOT is overseeing a statewide transportation improvement program that creates new opportunities for aligning citizensrsquo goals for the environment and for transportation systems We are working to change the way we communicate these objectives and the interrelated nature of the complex issues in both protecting and improving the environment from the delivery of transportation projects
Beige Pages - Measures Markers and Mileposts - December 31 2003 23
Beige Pages - Measures Markers and Mileposts - December 31 2003 25
Environmental Documentation and Review
Compliance with the Endangered Species Act
About forty Nickel projects remain to be advertised for construction in this biennium according to WSDOTrsquos delivery plan Twenty-three of these projects have completed their required consultations under Section 7 of the Endangered Species Act Transportation projects that do not use federal funds are not required to obtain Section 7 consultation from the Endangered Species Act Two projects will not require Section 7 consultation because no federal funding will be allotted for project Eleven projects in the preliminary stages of design cannot seek the consultation process at this time until the Biological Assessments are completed Consultation on these projects should begin in 2004
There are two projects currently undergoing consultation with NOAA Fisheries and the US Fish and Wildlife Service (USFWS) The SR 31 Metaline Falls to Canadian Border Reconstruction project is undergoing formal consultation with the USFWS to address Canada Lynx concerns The I-90 Two Way Transit amp HOV project is undergoing consultation with NOAA Fisheries and USFWS
Three local projects funded with Nickel Funds revenues will be lead through the consultation process by local governments (City of Shoreline the City of Bremerton and the Hood Canal Coordinating Council) Two projects for WSDOT to deliver statewide (Statewide Bridge Rail Retrofit and Statewide Guardrail Retrofit) will be taken through consultation by the regional offices acting on a regional basis Two regions have already completed the consultation process for these projects
A team of three experienced WSDOT biologists was deployed to the Western Washington Office of the USFWS to address the approximately 20 projects stalled in review This staff assignment accomplished the completion of consultations for 15 projects including the SR 9 ndash SR 522 to 176th St project A new backlog is beginning to build due to the need to reinitiate consultation on a number of projects including the Hood Canal Bridge Replacement In addition the backlog is compounded with the extensive amount of time that seems to be required to be spent in consultation on some of the more complex projects The Federal Highway Administration WSDOT and USFWS are continuing discussions on how to address this problem
Program Delivery Tracking Sheet for ESA Section 7 Consultation WSDOT Projects rsquo03 -rsquo05 Biennium
NOAA Fisheries USFWS
Project Biological Assessment
Consultation Status
Biological Assessment
Consultation Status
NEPA Type
NEPA Complete
Proposed Ad Date
SR 31 Metaline Falls to Inttrsquol Border NA NA 81003 Waiting EA 120503 41004
I-90 Two Way Transit and HOV 11212003 Waiting 122103 Waiting FEIS 033004 106
Consultant Utilization
There are two main areas where consultants are expected to be utilized on 2003 Transportation Funding Package projects The first is to augment WSDOTrsquos workforce so WSDOT can minimize the inefficiencies associated with short-term workforce expansions and contractions The second is to fill needs for specialized expertise that may not be available ldquoin-houserdquo
When WSDOT established the Urban Corridors Office in 2003 contracting efforts were directed at having a sufficiently large pool of qualified talent to draw from quickly and efficiently without time delays With that goal currently being met the emphasis has shifted slightly to identifying the ldquoBest of the Bestrdquo in a variety of specialized areas allowing WSDOT to draw upon top expertise at national and international levels
Regional Transportation Improvement District (RTID) Projects The 2003-2005 Transportation Budget requires the Regional Transportation Improvement District (RTID) to conduct an independent review of all project scopes and budgets prior to placing projects on the ballot WSDOT management is assisting RTID by identifying and assembling a ldquoPanel of Expertsrdquo to review CEVPreg and Cost Risk Assessment projects National or international experts with experience in a wide range of engineering disciplines and in cost risk assessment will be sought The panel selection should be complete early next quarter
Beige Pages - Measures Markers and Mileposts - December 31 2003 24
24 Beige Pages - Measures Markers and Mileposts - December 31 2003
On-Call Services WSDOT currently has over 200 different consulting firms committed to providing services to the State on short notice through ldquoOn-Callrdquo contracts Many of these firms which range from single person consultants to large multi-tiered organizations have internationally recognized experts on staff Currently twelve prime contractors plus their sub-consultants are under contract to provide project specific services across the state
2003 Transportation Funding Package - Consultant Utilization to Date For the quarter ending December 31 2003 WSDOT paid $2556500 to firms providing services on 2003 Transportation Funding Projects Over 300 people were working directly on a full or part time basis on these projects Over $5000000 was authorized as new work in the quarter
Construction Employment Information
Contractor Employment
The 2003 Transportation Funding Package supports transportation projects that make important and long-term contributions to the statersquos economy and the productivity and economic well-being of its citizens Far from the only or even the largest of these impacts is the direct and indirect economic benefits of the construction activity itself one aspect of which is the creation of jobs to built the projects
The direct and indirect benefits of construction employment have been extensively examined by labor economists A useful guide is Associated General Contractors of Washington Economic Impact of the Construction Industry on the State of Washington 2002 Update (prepared by the University of Washington)
How many people are at work on the 2003 Transportation Funding Package projects
The precise number for obvious reasons is impossible to state The jobs are not just at the job site but include designers and project engineers (many of whom divide their efforts among many projects) suppliers and their employees and many others Even for the contractors employment supported by these projects includes home office as well as job site staff And at the job site the employment count varies from day to day depending on subcontractor activity the sequencing of job activities and even the weather We have asked contractors on the Nickel Fund projects in construction to provide the WSDOT construction office with a ldquosnapshotrdquo number what is your best estimate of the ldquoaveragerdquo direct job site employment on your job over the course of the quarter The following table captures the prime contractorsrsquo responses for their own work and their on-site subcontractors on the Nickel Fund projects that have already gone into construction
ProjectContractor
Average project employment for Oct-Dec 2003
I-5 Widening Each Direction from Salmon Creek to I-205 Hamilton Construction and its 24 subcontractors
24 employees
SR 500 New Interchange and Additional Lanes Tapani Underground Inc and its 18 subcontractors
21 employees
I-90 Build Lanes from Argonne Road to Sullivan Rd Scarsella Brothers Inc and its 13 subcontractors
19 employees
I-90 Rye Grass Summit to Vantage Superior Paving Company and its 10 subcontractors
14 employees
I-90 Highline Canal to Elk Heights Scarsella Brothers Inc and its 12 subcontractors
17 employees
I-182US 395 Interchange ndash Roadside Safety Transtate Paving Company and its 2 subcontractors
6 employees
Construction Safety Information WSDOT and the AGC are currently finalizing the details of a method to jointly report safety data for the nickel projects The expected outcome will be a combined safety rating for the contractor and WSDOT staff on each of the Nickel Fund projects
Beige Pages - Measures Markers and Mileposts - December 31 2003 25
Beige Pages - Measures Markers and Mileposts - December 31 2003 26
Worker Safety Quarterly Update Continuing updates on Gray Notebook safety topics ndash data is shown for calendar year (CY) 2000 CY 2001 fiscal year (FY) 2002 FY 2003 and FY 2004 by quarter
WSDOT Highway Maintenance WorkersRecordable Injuries per 100 Workers per Fiscal Year
CY 2000
CY 2001
FY 2002
FY 2003
Qrtr 1 Qrtr 2 YTD 2004
0
5
10
15
20
FY 2004
Highway and Street Construction Benchmark 82
The second quarter recordable injury rate for maintenance workers was 62 injuries per 100 maintenance workers There were 22 recordable injuries during the second quarter of which 9 were lost workday cases accounting for 202 lost workdays This is a 24 decrease in injuries and a 17 reduction in lost workdays from the first quarter The three most frequent types of injuries for the second quarter were dislocation (27) occupational illness (23) and sprainstrain (23) The three most frequent causes of injuries for the quarter were struck by an object (23) overexertion (18) and falls from the same level (14) The three most frequent injuries to the body were back (32) ear (14) and hand (9)
Accident Prevention Activities Second Quarter FY 2004 bull The South Central Regionrsquos Maintenance division is identifying
targets and strategies to decrease personal injuries within work groups Four of five sections reduced their yearly injury average Accountability and awareness has increased substantially and the numbers reflect significant improvement
bull The Eastern Region is revising its Accident Review Board process to make it more accountable for overall safety
bull WSDOT completed a successful West Nile Virus campaign during the second quarter Between May and October 2003 WSDOT spent about $92000 for the West Nile Virus program This included obtaining materials training people monitoring sites and application of pesticides under the direction of the Department of Health (DOH) DOH reported that no human or animal cases were confirmed in Washington in 2003 However nationally in 2003 there were 7718 human cases with 166 deaths In 2002 there were 4156 cases and 284 deaths
Reading the ChartsldquoRecordable Injuries and Illnessesrdquo is a standard measure that includes all work related deaths and work related illnesses and injuries which result in loss of consciousness restriction of work or motion transfer to another job or require medical treatment beyond first aid The US Bureau of Labor Statistics provides the selected 2000 national average benchmarks After discussion with the National Bureau of Labor Statistics the following benchmarks were selected to provide a more relevant and consistent benchmark Maintenance ldquoHighway and Street Constructionrdquo Standard Industry Classification (SIC) 161 (rate 82) Engineering ldquoEngineering and Architect Servicesrdquo SIC 871 (rate 17) Ferry Vessel Workers ldquoWater Transportationrdquo SIC 44 (rate 70) One worker equals 2000 hours per year
WSDOT Ferry Vessel WorkersRecordable Injuries per 100 Workers per Fiscal Year
0
5
10
15
20
CY 2000
CY 2001
FY 2002 FY 2004
Qtr 1 YTD 2004
FY 2003
Qrtr 2
Water Transportation Benchmark 70
The second quarter recordable injury rate for ferry vessel workers was 98 injuries per 100 ferry vessel workers There were 23 recordable injuries during the second quarter of which 21 were lost workday cases accounting for 268 lost workdays This is a 4 decrease in the number of recordable accidents and a 36 reduction in the number of lost time days from the first quarter There are less worker hours this quarter causing a slight increase in the recordable accident rate even though the actual number of accidents dropped slightly The three most frequent types of injuries were sprainstrain (52) chemical exposure (13) and aggravation of a previous injury (13)The three most frequent injuries to the body were the back (13) circulatory system (13) and multiple (13)
Source for all charts WSDOT Safety Office
WSDOT Highway Engineer WorkersRecordable Injuries per 100 Workers per Fiscal Year
CY 2000
CY 2001
FY 2002
FY 2003
Qrtr 1 Qrtr 2 YTD 2004
0
5
10
15
20
FY 2004
Engineering and Architect Services Benchmark 17
The second quarter recordable injury rate for engineer workers was 16 injuries per 100 engineer workers There were 8 recordable injuries during the second quarter of which 7 were lost workday cases accounting for 56 lost workdays There are less worker hours this quarter causing a slightly higher accident rate even though the number of injuries remained the same The three most frequent types of injuries for the quarter were sprain strain (38) occupational illness (25) and lacerations (25) The three most frequent causes of injuries were overexertion (25) falls from the same level (25) and noise (25) The three most frequent injuries to the body were the back (25) ear (25) and knee (13)
Measures Markers and Mileposts - December 31 2003 27
Measures Markers and Mileposts - December 31 2003 29
0
5000
6000
7000
June Dec June Dec June Dec June Dec June Dec June Dec June 1997 1997 1998 1998 1999 1999 2000 2000 2001 2001 2002 2002 2003
Number of Permanent Full-Time Employees at WSDOT
Initiative 695 passed by voters
Referendum 49 passed by voters
5617 5671 6017 5960 5992 6181 6322 6366
Referendum 51 defeated by voters
6325 6171 6258
Dec 2003
WSDOT Workforce Levels One indicator of the agencyrsquos workforce size is the current number of permanent full-time employees on staff The accompanying chart shows that number at various points since the end of 1996 (The number of ldquoFTEsrdquo [full-time equivalents] will generally exceed the number of full-time employees since seasonal and part-time work force must also be funded from ldquoFTErdquo allotments)
Source WSDOT Office of Human Resources
Training for WSDOT Highway Maintenance Employees WSDOT continues progress toward achieving training goals for maintenance employees A total of 24 safety and maintenance courses are required by law andor regulation The chart shows status of training completed for 6 of the 13 required safety courses and 5 of the 11 maintenance courses
Maintenance Total Current Workers Maintenance Maintenance Maintenance Compliance Change
Requiring Workers Workers Workers to Date Since Training Trained to Date Trained 1st Trained 2nd Target = Last Dec 03 Dec 03 Quarter FY04 Quarter FY04 90 Quarter
Safety CoursesBlood Borne Pathogens 1243 1064 13 46 86 +2First Aid 1480 1383 6 0 93 -2Hearing Conservation 1363 1255 0 0 92 -3Personal Protective Equipment 1361 894 216 0 66 +1Fall Protection 750 403 19 0 54 +2Flagging amp Traffic Control 1149 1109 1 0 97 -1
Maintenance Courses Drug Free Workplace 326 287 0 0 88 +1Forklift 1173 1036 37 28 88 +0Hazardous Materials Awareness 986 671 85 90 68 +8Manlift Operations 523 307 0 8 59 -3Excavation Trenching and Shoring 438 302 45 93 69 +13
Training for All WSDOT Employees The following table reflects continued progress on important workforce training courses that help shape WSDOTrsquos workplace These courses are for all permanent full-time part-time and temporary employees The goal is to have 90 of our workforce trained as promptly as resources allow
Number of Number Employees Number Number Compliance Change
Requiring Trained to Date Trained 1st Trained 2nd to Date Since LastTraining Dec 03 Quarter FY04 Quarter FY04 Target = 90 Quarter
Training CoursesDisability Awareness 7295 2567 116 131 35 +1Ethical Standards 7295 7050 82 82 97 0Security Awareness - all employees 7295 5711 17 0 78 +4Security Awareness - supervisors 2884 1474 0 0 53 +1Sexual HarassmentDiscrimination 7295 4880 71 149 67 +14Valuing Diversity 7295 3200 129 142 44 +2Violence that Affects the Workplace 7295 5910 6 7 81 +6
In past quarters non-supervisory employees were incorrectly credited by WSF for attendance at Security Awareness for Supervisors training This has now been corrected
Source WSDOT Office of Human Resources Staff Development
Measures Markers and Mileposts - December 31 2003 28
28 Measures Markers and Mileposts - December 31 2003
Highway Construction Program Quarterly Update Meeting WSDOTrsquos Scheduled Advertisement Dates The Highway Construction Program is the largest capital program in the Transportation Budget Planned expenditures for the 2003-2005 biennium are approximately $23 billion Overall delivery of the Highway Construction Program is tracked and monitored against schedule projections for ad dates and for project cash flow The first is ldquoMeeting WSDOTrsquos Scheduled Advertisement datesrdquo The second is ldquoCash Flowrdquo Funding for the 2003-2005 Highway Construction Program includes a variety of fund sources including pre-existing transportation funds 2003 Transportation Funding Package (ldquoNickelrdquo funds) and Tacoma Narrows Bridge funds The program includes 345 construction projects for advertisement during the current biennium of which 46 are ldquoNickelrdquo projects and 299 are funded with pre-existing funds Overall including preconstruction activities on construction projects to be advertised in future biennia more than 1000 projects will be underway during the 2003-2005 Biennium In the 2003 Transportation Funding Package there were 20 projects originally planned for advertisement in the biennium through the end of the second quarter Of the planned total 15 have been advertised four have been rescheduled for later in the biennium and one has been deferred to the 2005-2007 biennium There were 70 pre-existing fund projects planned for advertisement by the end of the second quarter 42 have been advertised as planned 26 have been rescheduled for later in the biennium and two have been deferred to the 2005-2007 biennium In addition three projects were advanced from quarters later in this biennium and were advertised in the first quarter for a total of 45 projects that have been advertised to date
Ad Date 2003 Transportation Funding Package (ldquoNickel Fundsrdquo) Of the nine projects planned to be advertised in this quarter seven projects were advertised as planned one project was delayed for advertisement to later in the biennium and one will be deferred to the 2005-2007 biennium (for more detail see the Beige Pages) One project was advanced from the eighth quarter for a total of eight advertised projects
bull Seven projects were advertised as plannedSR 9SR 528 Intersection ndash SignalSR 16 HOV Improvements between Olympic
View Drive and Union Ave US 97A Entiat Park Entrance ndash Turn Lanes SR 124 East Jct SR 12 - Reconstruction
Highway Construction Program Delivery Planned vs Actual Number of Projects Advertised 2003-2005 Biennium Quarter 2 Ending December 31 2003
350
300
250
200
150
100
50
0 Qtr 1 Qtr 2 Qtr 3 Qtr 4 Qtr 5 Qtr 6 Qtr 7 Qtr 8
Planned Pre-Existing Funds Ads
Actual Pre-Existing Funds Ads
Transportation Funding Package Planned Ads
Transportation Funding Package Actual Ads
Source WSDOT Project Control and Reporting Office
SR 161234th Street to 204th Street ESR 203NE 124thNovelty Rd VicinityUS 395Kennewick Variable Message Sign
bullOne project was advanced SR 527132nd St SE to 112th St SE
bullOne project was delayed to a future quarter in 2003-2005 SR7SR 507 to SR 512 ndash Safety
bullOne project was deferred to 2005-2007 SR 522I-5 to SR 405 Multi-Modal Project
Ad Date Pre-Existing Funding Of the 58 projects scheduled for advertisement with pre-existing funds in the second quarter 34 projects were advertised as scheduled 22 have been delayed slightly to later in the 2003-2005 biennium two were deferred to beyond the 2003-2005 biennium and two projects were advertised in response to emergencies bull The following are six examples of pre-existing projects advertised as planned US 101 Olympic National Park to Indian Creek ndash This project overlays approximately three miles of existing roadway pavement between Olympic National Park and Indian Creek I-5 Stewart - South Bound off Ramp ndash The existing signal system will be replaced with a signals using poles and mast arms WSDOT will be conducting a feasibility assessment of connecting the new signal system to the City of Seattlersquos centralized system SR 11 Whatcom County Line to Bellingham ndash This project will resurface approximately four miles existing roadway and restore safety features between the Whatcom County Line and the City of Bellingham
Measures Markers and Mileposts - December 31 2003 29
Measures Markers and Mileposts - December 31 2003 31
SR 26 Union Flat Creek-Improve Drainage On SR 26 west of Colfax the design of this project will stabilize the roadway structure by reconstructing approximately 1200 linear feet of creek channel away from the roadway There will also be check dams to slow the flow of the creek and protect the roadway from erosion
SR 127 Central Ferry to Church Hill Road At Central Ferry and extending eight miles north on SR 127 the project preserves the pavement and extends the service life by paving with Asphalt Concrete Pavement mixture and will restore the basic safety features of the highway US 97 Blewett Pass South ndash Paving From the junction with SR 970 to the north of the summit the project is to resurface existing roadway pavement to maintain the integrity of the roadway
bull The following are two examples of delayed projects SR 20 Troxell Road to Deception Pass ndash Current design issues could not be resolved and will require additional engineering changes to meet environmental requirements This will delay the project until February 2005 US 395 Deadman Creek Fish Barrier Retrofit ndashAfter a project costbenefit analysis was conducted in conjunction with the Department of Fish and Wildlife both WSDOT and WDF believe that funds for this project could be used for similar projects that would gain better results
bull Two projects were added in response to emergencies SR 20 Rockslide ndash On Sunday November 9 2003 at 6 am a rockslide estimated at two to three million cubic yards occurred above State Route 20 at milepost 1215 The rockslide left the hillside extremely unstable damaged two sections of the highway and left the small town of Diablo cut off Currently monitoring equipment and minor highway repairs give Diablo residents Seattle City Light personnel National Parks Service and WSDOT personnel limited access to the highway The highway is open between 8 am and 4 pm when flaggers are in place In early February 2004 contractors will turn in a report to WSDOT with proposals for long-term solutions that will reopen the highway permanently US 101 Hoh River Erosion ndash In response to storm-related erosion WSDOT replaced washed out armoring and stream barbs with huge boulders along the Hoh river bank in an effort to keep the river from washing out sections of SR 101 Placement of the boulders is a temporary solution A permanent solution to this problem is being reviewed To meet permitting requirements of the Washington State Department of Fish and Wildlife WSDOT completed a Reach Analysis for this section of river in 2002 The Federal Highway Administration reviewed WSDOTrsquos approach to fixing the problem and has agreed to fund a permanent solution with federal funds WSDOT is now completing a conceptual design in accordance with the Reach Analysis and will have a cost estimate completed by the end of February 2004
Cash Flow on Highway Construction ProjectsHighway Construction Program Cash Flow2003 Transportation Funding Package Highway Construction Program Cash FlowPlanned vs Actual Expenditures (ldquoNickel Fundsrdquo) Planned vs Actual Expenditures 2003-2005 Biennium Quarter 2 ending December 31 20032003-2005 Biennium Quarter 2 Ending December 31 2003Dollars in BillionsExpenditures for highway projects through the quarter Dollars in Billions
ending December 31 2003 were $442 million This $12
represents 8 percent of the budgeted cash flow for the biennium At this point expenditures using the 2003 Transportation Funding Package are within one percent of meeting the plan The expenditure rate will increase as more projects are awarded or moved from a pre-existing project and added to the nickel list of projects The expected pattern of 2003 Transportation Funding Package spending is illustrated by the fact that expenditures in the 8th quarter of 2003-2005 are expected to be 28 percent of the entire bienniumrsquos budgeted cash flow
Qtr 1 Qtr 2 Qtr 3 Qtr 4 Qtr 5 Qtr 6 Qtr 7 Qtr 8
Source WSDOT Project Control and Reporting Office Pre-Existing Funding For the first two quarters of the biennium WSDOT submitted an expenditure plan to the legislature for approximately $328 million As of December 31 2003 expenditures totaled $265 million This leaves a variance of approximately $64 million or 192 percent from the plan WSDOT is currenlty seeking legislative direction on projects with programmatic variance
$0
$02
$04
$06
$08
$10
Planned Pre-Existing Funds
Actual Pre-Existing Funds Planned
Transportation Funding Package
Actual Transportation
Funding Package
Measures Markers and Mileposts - December 31 2003 30
30 Measures Markers and Mileposts - December 31 2003
Special Safety Improvements Quarterly Update
Meeting WSDOTrsquos Scheduled Advertisement Dates for the Safety Improvement Subprogram While elements that improve safety are a part of almost every highway construction project a special program sub-category established by the legislature covers the projects that are designed to address issues in ldquohigh accident corridorsrdquo and ldquohigh accident locationsrdquo These projects are identified by WSDOT based on information about the history of accident frequency and severity While these projects account for only a small portion of the overall benefits to safety from highway improvements WSDOT tracks the advertisement of these projects just as with other projects in the program in order to provide a picture of program delivery on issues that are of great importance on particular locales around the state that have been selected for this program treatment bullOf the 14 projects planned for ad these six projects were advertised as scheduled for this quarter
I-5Ramps at Michigan ndash CorsonAlbroSwift SR 9SR 528 Intersection ndash Signal I-90Moses Lake West Safety Improvements SR 124East Jct SR 12 ndash Reconstruction SR 203NE 124thNovelty Rd Vicinity US 395Kennewick Variable Message Sign
Safety Improvement Program Delivery Planned vs Actual Number of Projects Advertised 2003-2005 Biennium Quarter 2 Ending December 31 2003
90
80
70
60
50
40
30
20
10
0
Actual
Planned
Qtr 1 Qtr 2 Qtr 3 Qtr 4 Qtr 5 Qtr 6 Qtr 7 Qtr 8
Source WSDOT Project Control and Reporting Office
bull Eight projects were deferred for advertisement later in the biennium
SR7SR 507 to SR 512 ndash Safety SR 20Oak Harbor NCL to Frostad Road SR 20Monkey Hill Rd to Troxell Rd SR 20Sapp Rd to Reed St ndash Rechannelize SR 20Troxell Rd to Deception Pass Vic SR 20Frostad Road Vicinity ndash Guardrail SR 24South Wahluke Slope ndash Guardrail SR 290Helena Street ndash Add Turn Lane
Measures Markers and Mileposts - December 31 2003 31
Measures Markers and Mileposts - December 31 2003 33
End-of-2003 Season Highway Construction Project EvaluationsThird Annual Report The annual Construction Highlights report is an end-of-the-year synopsis of construction projects that were completed or nearly completed during the previous construction season Each regionrsquos project office evaluates how well its projects were carried out This is WSDOTrsquos third year publishing this report
This yearrsquos report is an assessment of 23 projects statewide representing a variety of construction types and settings Each project is rated in four elements of construction ndash design construction management schedule and cost and each element is assigned a one-to-five star rating (one is the lowest ranking while five is the highest) Contractorrsquos names are listed for identification but the detailed report shows that the strength or weaknesses of a particular project are often as much WSDOTrsquos responsbility as the contractorrsquos (guiding of design for example) and the best projects seem always to be built on strong teamwork for the entire project team The complete report can be found at wwwwsdotwagov projects2003highlights
Highway Construction Project Rating for 2003 Season Construction
Project Design Management Schedule Cost Contractor SR 504 Castle Rock laquolaquolaquolaquolaquo laquolaquolaquolaquolaquo laquolaquolaquolaquolaquo laquolaquolaquolaquolaquo Lakeside Ind SR 28 Rock Island laquolaquolaquolaquolaquo laquolaquolaquolaquolaquo laquolaquolaquolaquolaquo laquolaquolaquolaquolaquo Scarsella Bros US 395 Hillsboro laquolaquolaquolaquo laquolaquolaquolaquo laquolaquolaquolaquolaquo laquolaquolaquolaquolaquo M A DeAtleySR 26 Vantage laquolaquolaquolaquo laquolaquolaquolaquolaquo laquolaquolaquolaquolaquo laquolaquolaquolaquolaquo Central WA AsphaltSR 8 McCleary laquolaquolaquolaquo laquolaquolaquolaquolaquo laquolaquolaquolaquolaquo laquolaquolaquolaquo Scarsella BrosUS 12 Brady - Malone laquolaquolaquolaquo laquolaquolaquolaquolaquo laquolaquolaquolaquolaquo laquolaquolaquo Lakeside IndI-90 Sunset laquolaquo laquolaquolaquolaquo laquolaquolaquolaquolaquo laquo Kiewit ConstI-405SR 167 IC laquo laquolaquolaquo laquolaquo laquo Max J KuneySR 520 10th to Midspan laquolaquolaquolaquo laquolaquolaquolaquo laquolaquolaquo laquolaquolaquolaquolaquo Colvico IncI-90 Eastgate laquolaquolaquolaquo laquolaquolaquolaquo laquolaquolaquolaquo laquolaquolaquolaquolaquo Lakeside IndI-405 Cole Creek Parkway laquolaquolaquo laquolaquolaquolaquo laquolaquolaquolaquo laquolaquo Tri-State ConstructionSR 141 Klickitat Co Paver laquolaquolaquolaquo laquolaquolaquolaquolaquo laquolaquolaquolaquolaquo laquolaquolaquolaquolaquo Mid-Columbia PavingSR 20 Methow River Bridge laquolaquolaquolaquo laquolaquolaquolaquolaquo laquolaquolaquolaquo laquolaquolaquolaquolaquo One Way ConstructionSR 167 N Meridian to King laquolaquolaquolaquolaquo laquolaquolaquolaquolaquo laquolaquolaquolaquolaquo laquolaquolaquolaquolaquo ICON MaterialsI-5 Puyallup River Bridge laquolaquolaquolaquolaquo laquolaquolaquolaquolaquo laquolaquolaquolaquolaquo laquolaquolaquolaquolaquo CBI IncSR 161 Clear Lake Rd laquolaquolaquolaquolaquo laquolaquolaquolaquolaquo laquolaquolaquolaquolaquo laquolaquolaquolaquolaquo Tucci and SonsSR 525 SR 99 to SR 526 laquolaquolaquolaquo laquolaquolaquolaquo laquolaquolaquolaquolaquo laquolaquolaquolaquo KLB ConstructionUS 2 Barclay Creek Bridge laquolaquolaquolaquo laquolaquolaquolaquolaquo laquolaquolaquolaquolaquo laquolaquolaquolaquolaquo Wilder ConstructionSR 290 Trent Ave Bridge laquolaquolaquo laquolaquolaquo laquo laquolaquolaquolaquo Ross BrosI-90 Sullivan Rd laquolaquolaquolaquolaquo laquolaquolaquolaquolaquo laquolaquolaquolaquolaquo laquolaquolaquolaquolaquo Inland Asphalt CoSR 510 I-5 Pacific laquolaquolaquolaquo laquolaquolaquolaquo laquolaquolaquolaquo laquolaquolaquolaquo Scarcella BrosSR 125 Military Road laquolaquolaquolaquo laquolaquolaquolaquo laquolaquolaquolaquolaquo laquolaquolaquo Transtate PavingI-5 Samish Way laquolaquolaquolaquo laquolaquolaquolaquo laquolaquolaquolaquolaquo laquolaquolaquo Wilder ConstructionFour other projects of interest were included in the report but not evaluated SR 16 Tacoma Narrows Bridge SR 104 Hood Canal Bridge SR 433 Lewis and Clark Bridge and the Moses Lake Wetland Mitigation Bank Five star rating system one represents the lowest rating five represents the highest
WSDOT Asks the Publicrsquos Opinion Included for the first time in this annual Construction Highlights report is a public opinion questionnaire evaluating one project in each of WSDOTrsquos six regions Motorists who traveled through state highway construction projects over the past summer have an opportunity to tell WSDOT what they did or did not like what worked or did not work by visiting wwwwsdotwagovprojects2003highlights
WSDOT will use the public comments to improve the way projects are managed and communicated in the future Results of the public evaluation will be posted for each of the six projects Projects included are I-90 Sunset Interchange in King County I-5 Puyallup River Bridge in Pierce County State Route (SR) 141 Klickitat County Paver US 395 Hillsboro Street Interchange in Franklin County I-90 Sullivan Road to Idaho State Line Paving in Spokane County and SR 28 Rock Island Rock Slopes in Douglas County
Measures Markers and Mileposts - December 31 2003 32
32 Measures Markers and Mileposts - December 31 2003
Gig Harbor Tacoma
For scale The ferry Tacoma
Tacoma Narrows Bridge Project Update Designbuilder Tacoma Narrows Constructors (TNC) now stands at 263 construction completion of the new State Route 16 Tacoma Narrows Bridge project In December 2003 TNC reached another significant milestone ndash that of ldquotouching downrdquo the Gig Harbor (west) caisson onto the 133-foot-deep Narrows seabed In January TNC expects to touch down the Tacoma (east) caisson on the seabed at an even lower depth of 149 feet Following touchdown crews will continue placing reinforced concrete to build caisson internal and external walls while they dredge soil from the 15 hollow cells in each caisson Dredging will allow the caissons to sink another approximately 60 feet into the Narrows seabed At that point crews will start building the towers above water Other bridge work continues as well including anchorage construction and the overseas fabrication of the suspension cable wire Excavation work on both the Tacoma and Gig Harbor anchorages is finished The Tacoma anchorage has already had four massive concrete pours and crews are preparing to begin placing concrete on the Gig Harbor anchorage Roadwork also continues to move at a rapid pace Crews plan to complete the new eastbound on ramp and exit at 36th Street NW along with 22nd Street construction and open all to traffic in March Construction continues on several large retaining walls erosion control measures are in place for the winter season and landscaping along SR 16 is underway On February 2 the state Department of Ecology (DOE) fined WSDOT and TNC jointly $10000 for inadequate treatment of construction storm water During several rain events between October and January discharges of cloudy stormwater from the project site in the Narrows exceeded permit limits Since October project staff have worked hard to improve environmental compliance by implementing DOE environmental recommedations including implementing best-management-practice
Measures Markers and Mileposts - December 31 2003
Landscaping at 36th St on-ramp
Tacoma anchorage concrete pour Tacoma caisson concrete pour
Tacoma caisson construction
Tacoma Narrows Bridge Project Progress to Date Percent Complete
995Design
263Construction
314Total(1)
0 10 20 30 40 50 60 70 80 90 100
(1) Weighted 7 Design progress and 93 Construction progress
Source WSDOT Engineering and Regional Operations Division
stormwater treament controls increasing water monitoring and testing and monitoring stormwater detention ponds steps For more information on WSDOTrsquos environmental commitments see page 45 of this Gray Notebook For additional information including financial information project schedule traffic information photo library and more please visit wwwtacomanarrowsbridgecom
33
Measures Markers and Mileposts - December 31 2003 35
104 Hood Canal Bridge Project Update
Graving Dock Progress on the project remains almost at a standstill as efforts continue among WSDOT the Lower Elwha Klallam Tribe the State Office of Historic Preservation FHWA and the Army Corps of Engineers to resolve issues presented by the discovery in August 2003 of a significant archaeological find The process must establish compliance with the requirements of Section 106 of the National Historical Preservation Act in order for construction work to resume at the site probably following a period of intensive archaeological activity Meanwhile despite the lack of physical construction at the graving dock site the contractor completed a restoration project at Ediz Beach Close to 1500 feet of shoreline was cleared contoured and reseeded For many years the Ediz Beach area was unsafe and inaccessible due to logs pilings and other debris WSDOT removed these articles at low tide to avoid disturbing the harbor waters This restoration provides a healthy natural environment for native plants and animals and may also encourage the spawning of sand lance (a small fish) a significant portion of juvenile salmonrsquos diet It was completed on time and in accordance with a Hydraulic Project Approval (HPA) issued by the Department of Fish and Wildlife as mitigation for
Project Progress to Date Percent Complete
Total 88
0 10 20 30 40 50 60 70 80 90 100
(Percent completion based on contract dollars)
Source WSDOT Engineering and Regional Operations Division
Before
After
use of shoreline access to the graving dock The mitigation project had to be completed before October 15 2003 to minimize disturbance of the sand lance during its spawning period
Bridge Site Construction continued at the bridge site with the contractor Kiewit-General of Poulsbo building a temporary work trestle at the bridgersquos east end The work trestle eventually will support the new east-half transition span Plans are to roll the existing span onto a second temporary work trestle and roll the new transition span into place A long weekend closure is expected sometime in 2005 or 2006
For more information please visit wwwwsdotwagovprojectssr104hoodcanalbridgeeast
Measures Markers and Mileposts - December 31 2003 34
34 Measures Markers and Mileposts - December 31 2003
Highway Safety Improvement Projects Quarterly Update
Many of the highway safety improvement projects installed or constructed by WSDOT seek to improve safety in an area identified by unusually high frequencies of accidents Do these safety improvement projects in fact lead to safer conditions WSDOT reports below on a very encouraging review of before-and-after accident statistics in relation to 21 such projects from locales around the state Also featured this quarter are results from a study on
bull Cable Median Barrier - Across the Median Protection a project intended to benefit longer stretches of highway
bull Impacts of the 08 DUI law assessed over a six year period
bull Safe Routes to School program and
bull A roundabout project in the City of Port Orchard
Safety Projects ndash Before and After Results Each year WSDOT completes a variety of safety improvement Combined Average for 21 Safety Projects projects throughout the state highway system ranging from Collisions Per Year adding turn lanes and signals to installing median barrier and
Propertyrumble strips To begin to determine their effect on reducing the All Types Damage Only InjuryFatalnumber and severity of traffic collisions a preliminary before-
Before 155 88 67and-after study has been conducted for 21 such projects Projects After 97 55 42were chosen that permitted at least 18 months of collision data
to be analyzed in the before period and at least 12 months in the Source WSDOT Transportation Data Office
after period The data was then normalized (12 month average) to make a fair comparison
Preliminary results indicate that for this 21 project sample the average number of collisions per year for all projects combined was reduced by 37 percent Likewise the average number of fatal and injury collisions per year also declined by 37 percent As additional data becomes available this safety project analysis will be updated and expanded
To provide examples of the various types of highway improvements that were indicated in the study additional details about three different projects are provided below and on the next page
I-90 Gold Creek to Easton Hill Vicinity Kittitas County Screens were installed in the median at these two locations to reduce the night time headlight glare from on-coming traffic Prior to installation of the screens these two sections of I-90 had a combined average of 194 night time collisions per year After the installation this figure dropped to 137 a 29 percent decrease In addition for collisions that involved only damage to property the decline in the after period was even greater from 152 to 6 or a 60 percent reduction
Glare screen installed on median barrier along I-90
I-90 Ritzville to Tokio This project involved flattening side slopes installing rumble strips upgrading illumination and repaving Before the project started there was an average of 39 collisions per year in this 13-mile section of I-90 Since the project was completed this dropped to 21 collisions per year a 46 percent decrease The percentage decrease in fatal and injury collisions was nearly as large dropping by 34 percent In looking at specific categories of collisions additional reductions are shown a 9 percent decrease in non-daylight collisions a 31 percent decline in collisions on wet pavement surfaces and an 8 percent drop in overturns
Slope flattening and new pavement on I-90 near Ritzville
Measures Markers and Mileposts - December 31 2003 35
Measures Markers and Mileposts - December 31 2003 37
SR 99 Battery Street Tunnel Seattle In order to reduce the number of collisions occurring on wet pavement surfaces the concrete roadway was ground to increase friction Before the project this section of SR 99 experienced an average of 775 collisions per year 475 of which were on wet pavement After the project was completed total collisions decreased to 305 per year while wet surface collisions declined to 102 per year a reduction of 61 percent and 79 percent respectively If only injury collisions are considered the decrease after the project was completed is nearly as dramatic from 295 per year down to 148 or a 50 percent drop
Concrete pavement grinding to increase friction on SR 99 at theThe summary of all 21 safety projects so far included in the study Battery Street Tunnel in Seattlethat are being analyzed is presented in the table below For a complete table of findings please visit the following web site wwwwsdotwagovmapsdatatdoPDF_and_ZIP_Filessafety_projectpdf
Highway Safety Projects - Before and After Study Collision Data Comparison
Collisions Per Year Property
Available Data DamageProject Title and Location Description of Work (in months) All Types Only InjuryFatal US 2 Sultan-Startup Road Widened SR 2 to provide an EB left turn lane 18 Before 07 00 07Startup Vicinity and a WB left turn pocket 14 After 09 00 09SR 99 Battery Street Tunnel - Safety Constructed roadway surface improvements - 26 Before 775 480 295Seattle pavement grinding 13 After 305 157 148SR 522 NE 145th St Vicinity To NE 155th St Constructed raised median island in place of 18 Before 633 380 253Shoreline existing two way left turn lane Improved visibility 16 After 405 263 143US 2 Applets Way To Vicinity Red Apple Installed median barrier to reduce crossover 23 Before 21 05 16Road Cashmere collisions 12 After 00 00 00SR 1726 Othello - Grade Separation New interchange and illumination 21 Before 74 29 46Othello 12 After 20 10 10SR 24 Hatton Road Ltl Widened and provide left turn channelization 20 Before 12 06 06Othello and improve turning radius 13 After 18 18 00SR 26 Constructed left turn lanes 23 Before 68 37 31Royal City Vicinity 12 After 00 00 00SR 28282 Ephrata - Signal Widened roadway constructed left turn lanes 23 Before 57 57 00Ephrata and installed signal 13 After 37 37 00US 97 Orondo North Realingment and construction of left turn lane 25 Before 05 00 05Orondo Vicinity 12 After 00 00 00US 97 Alt Lakeside Vicinity Constructed two-way left turn lane 21 Before 51 40 11Chelan 16 After 08 08 00SR 150 Chelan West - Turn Lanes Widened and constructed left turn channelization 22 Before 11 05 05Manson 17 After 07 07 00SR 105SR 105 Spur Constructed channelization for right and left turns 29 Before 33 12 21Westport Upgraded illumination 12 After 30 20 10SR 162 Bowman Hilton Rd E to Vicinity Upgraded signal and illumination realignments 19 Before 499 215 284149th Alderton installed signal guardrail and flattened slopes 18 After 467 233 233I-5SR6 Sb Ramp - Signal Signal and illumination installation 25 Before 29 14 14Chehalis 15 After 08 00 08I-5 Chamber Way - Signal Installed signal at NB off-ramp realignments 25 Before 38 29 10Chehalis resurfacing and illumination 15 After 24 24 00US 101 Fowler Street- Signal Installed signal reconfigured with curbs and raised 25 Before 24 19 05Raymond islands 15 After 40 24 16SR 24 Birchfield Road Intersection Installed signalization upgraded illumination 24 Before 55 20 35Yakima Vicinity signing and pavement markings 12 After 50 30 20I-90 West Ersquoburg IC To South Ersquoburg IC Lengthen acceleration lane and tapers Updated 25 Before 149 115 34Ellensburg Vicinity illumination and guardrail Roadway rehab and overlay 12 After 160 130 30I-90 Gold Creek To Easton Hill Installed glare screen along median barrier 26 Before 194 152 42Snoqualmie Pass Vicinity 14 After 137 60 77SR 241 Alexander Road To Factory Rd Constructed two-way left turn lane Channelization 25 Before 120 34 86Sunnyside Vicinity Upgraded signals widened shoulders 4-way stop 21 After 103 63 40I-90 Ritzville To Tokio-safety Matrix Flattened slopes installed rumble strips 28 Before 390 193 197Ritzville Vicinity illumination upgrades and ACP overlay 12 After 210 80 130In addition to the projects shown the I-82Union Gap to Oregon State Line project was analyzed Initial results indicate an increase in collision frequency which is not readily identifiable because of the length of the project weather variation and increased traffic in different locations throughout the project Additional review is underway to identify probable causes for the collisions This information will be presented at a future date Source WSDOT Transportation Data Office
Measures Markers and Mileposts - December 31 2003 36
36 Measures Markers and Mileposts - December 31 2003
The Cable Median Barrier Protection From lsquoAcross the Medianrsquo Collisions
2003-2005 Median Crossover Protection ProjectsErrant vehicles that cross the median into opposing lanes State Lengthof traffic typically cause severe and often fatal collisions Route Project Title (miles) Ad Date
A study of across the median crashes on Washingtonrsquos I-5 Puyallup River To Fife Interchange 19 Aug-03 multilane divided state highways with full access control I-90 Argonne Rd to Pines Rd - Widen 206 Nov-03
I-90 Pines Rd to Sullivan Rd-Widen 211 Nov-03was conducted to evaluate median barrier guidelines and I-90 Moses Lake West-Safety Improvements 1135 Dec-03identify specific highway sections where installation I-5 County Line to Prairie Creek Bridge 245 Jan-04
of a barrier would be appropriate The program I-90 Sullivan Rd to State Line 699 Apr-04adopted after the study is to install cable barriers as I-90 Geiger Road to US-2 237 Oct-04 part of improvement projects when the median width I-5 Pierce Co Line to Tukwila IC HOV- 53 Oct-04 is 50 feet or less Installation of barriers in medians I-90 George Vicinity East - Safety 1582 Oct-04 over 50 feet in width will be weighed against other Source WSDOT Engineering and Regional Operations Division improvements on a case-by-case basis
Cable barriers have been used on the nationrsquos highways since the 1930s or before The modern system which uses three cables supported by weak steel posts was developed in the 1960s and is now in widespread use in several states
Reductions in Severe Collisions Severe Collisions While total collisions in the study areas I-5 in Before and After Cable Median Barrier Installation
Annual Fatal and Disabling Collisions and Median Collision Type Everett Vancouver and Fife nearly doubled (from 7
45 to 100 including collisions with property damage 6only) the number of severe collisions (fatal and
disabling) decreased significantly This resulted in a 5
societal benefit of cable median barriers calculated 4 to be $420000 per mile annually A breakout of the
3 types of severe collisions are shown in the graph to
2the right (graph does not include ldquoproperty damage onlyrdquo collisions) 1
0 The data on the right was normalized and represents 12 months before and 12 months after the project All Median Fixed Object Roll Over Cross Median
Source WSDOT Engineering and Regional Operations Division
Fatal Accidents Disabling Accidents
Before After Before After Before After Before After
Before After
Washington State and Alcohol-Related Fatalities From 1998 to 2002 alcohol-related deaths per 100 million
Washington State Alcohol-Related Fatalities miles driven dropped 11 percent overall from 060 to 054 per Per 100 Million VMT100 million miles driven in Washington A package of anti-1998 to 2002drunk-driving laws enacted in 1998 lowered the blood alcohol
intoxication threshold from 010 to 008 percent and provided 065
for automatic loss of license for drunk driving These legislative steps together with increased State Patrol emphasis on stopping 06
drunk drivers are credited with the decrease Other measures in Washington include increased use of ignition interlock devices 055
(a device attached to the carrsquos ignition system that requires the driver to blow into the device before starting the car ndash if alcohol 05
is detected the car wonrsquot start) and a crackdown on deferred prosecutions 045
DUI 08 Law Enacted
1998 1999 2000 2001 2002
Washington DUI Facts amp TrendsSource ldquoResearch Noterdquo DOT HS 809 680 US Department ofBetween 1983 and 1991 an average of 391 drinking- Transportation National Highway Traffic Safety Administration
driver-involved (DDI) deaths occurred each year Between December 2003 1992 and 2002 an average of 285 DDI deaths occurred each year This improvement means that about 1166 lives have been saved in Washington during the 1990s
Measures Markers and Mileposts - December 31 2003 37
Measures Markers and Mileposts - December 31 2003 39
Safe Routes to Schools Since 1999 WSDOT has administered a five million dollar per biennium grant program appropriated by the legislature called Traffic Safety Near Schools This program has funded more than 70 projects across the state to improve bicyclist and pedestrian safety near schools This program was not however extended to new projects in the 2003-2005 budget In addition the Washington State Traffic Safety Commission currently administers a $2 million annual School Zone Safety grant program that pays for safety education and small traffic safety improvements The program is funded by fines from school zone traffic violations
The Washington State Department of Health (DOH) recently received $800000 in grant funds to promote active community environments a program that will include safe walkride to school routes DOH is currently working with regional county and city governments in areas meeting specific public health criteria across Washington
Safe Routes to Schools mdash Elementary School Locations
Half of the elementary schools in Washington are located on or very near state routes State law requires elementary schools to produce walk route plans
Seattle
Tacoma Olympia
Spokane
Elementary schools on or within 12 mile of a State Route Elementary schools near accident sites (accidents involving elementary agevictims 1995-2001)
Safety in a Roundabout WayPort Orchard Roundabout Safety Improvement During the late 1980s and early 1990s traffic growth in the city of Port Orchard in southern Kitsap County overwhelmed the intersection of Bethel Avenue and Mile Hill Drive (SR 166) eventually generating enough injury and property collisions to classify the intersection as a High Accident Location (HAL) Vehicle speeds exceeding the posted speed limit and the intersection configuration contributed to the collision problem In the mid-1990s after approval of the design by WSDOT the City of Port Orchard built a ldquomodernrdquo roundabout the first of its kind on the state highway system and the second to be built in Washington
After the construction of the single-lane roundabout crash data supports how well a roundabout can work when applied to a site-specific intersection safety problem There are now 48 roundabouts in Washington
Port Orchard -Bethel Ave and Mile Hill Drive Intersection
Number of Collisions and Injuries Before and After Roundabout Comparison 40
30
20
10
0 3 Years Before 3 Years After Roundabout Roundabout
Collisions
Injuries
Source WSDOT Engineering and Regional Operations Division
Measures Markers and Mileposts - December 31 2003 38
38 Measures Markers and Mileposts - December 31 2003
Asset Management Pavement Assessment Annual Update WSDOT maintains approximately 19200 lane miles (including ramps) of pavement surfaces The three major pavement types are chip seal hot mix asphalt pavement and portland cement concrete (PCC) pavement Each of these pavement types has an associated pavement life rehabilitation treatment and rehabilitation cost This report is an annual update of information last presented in the Gray Notebook for the quarter ending December 31 2002
Pavement Condition Update 2002 Results Pavement Condition Trends According to the 2002 pavement condition survey the Percent of Pavements percent of WSDOT pavements in ldquopoorrdquo condition increased slightly in 2002 to 93 percent up from 89 percent as
100
reported in the 2001 pavement survey The rating continues 80
to be dramatically better however than the situation in 1971 when the Washington State Pavement Management System 60
was first put in place 40
Programming Pavements for Rehabilitation 20 The table below shows some important facts about the extent and use of the various pavement types and the success that 0
the state seems to be achieving in directing investment to 1998 2002
areas of need Source WSDOT Materials Lab
Over the last biennium about nine percent of pavement rehabilitation spending has been for chip seal resurfacing These roads the cheapest to Lowest Life Cycle Cost resurface constitute about 23 percent of the lane miles but carry only about five percent (LLCC) Program for of the traffic Pavement Management
The basic principles behind LLCCEighty-eight percent of the spending has been for preservation of hot mix asphalt are rather simple mdash if rehabilitation pavements These roads are 64 percent of the lane miles and carry 71 percent of the traffic is done too early pavement life is
wasted if rehabilitation is done too late very costly repair work may beThe PCC pavements are 13 percent of the lane miles yet carry 23 percent of the required especially if the underlying
traffic PCC pavements have longer lives than other pavements but are very costly to structure is compromised WSDOT rehabilitate not only in terms of construction money but also in traveler inconvenience continually looks for ways to best
strike a balance between these twofrom traffic restrictions when pavement work is performed especially on the major high- basic principles while implementingtraffic corridors Forthcoming replacement of these pavements will bring big challenges the practical aspects of pavement
rehabilitation programsinvolving funding engineering and traffic management during construction (see the discussion on PCC pavements later in this section) The state is fast approaching the need to reckon with this looming financial and traffic crisis in pavement management a story that is not fully revealed by the generally positive picture conveyed by the recent annual surveys of ldquopoorrdquo condition pavements for the entire highway system
1973 1981 1986 1990 1994
Good Condition
Slight increase in percentage of pavement in poor condition 2001 to 2002
Long-term trend declining percentage of pavement in Poor Condition
Pavement Type Lane Miles
Lane Miles
Annual Vehicle Miles Traveled ndash 2002 (in billions)
03-05 Dollars
Programmed (in millions)
05-07 Dollars
Programmed (in millions)
Miles $ $
Chip Seal Pavements A chip seal is a durable surface that provides six to eight years of performance life and has an approximate cost of $12000 per lane mile
4490 234 17 53 $195 9 $182 9
Hot Mix Asphalt Pavements Hot mix asphalt pavement surface life between rehabilitation treatments can range from six to 18 years (based on actual pavement performance) and has a cost of $123000 (due miles) per lane mile and $156000 (past due miles) per lane mile
12284 640 225 715 $1819 84 $1845 91
Portland Cement Concrete (PCC) Pavements WSDOT has experienced PCC pavement lives ranging from 25 to 45 years and has an approximate cost of $330000 for dowel bar retrofit per lane mile and $1 million for full replacement per lane mile
2410 126 73 233 $142 7 $0 0
Source WSDOT Systems Analysis and Program Development Office WSDOT Materials Lab
Measures Markers and Mileposts - December 31 2003 39
Measures Markers and Mileposts - December 31 2003 41
Chip Seals For chip seals asphalt is sprayed on the existing surface and then covered with a layer of rock chips The oil becomes solid as it cools Chip seals are appropriate for low volume roads (less than 2000 vehicles per day and less than approximately 200 trucks per day) Since the roadways that receive this type of treatment are typically on rural routes WSDOT has found that pavement rehabilitation dollars seem to be best spent with efficiency of scale when a stretch of rural road mileage is taken together for resurfacing in a single ldquopaverrdquo contract even when the contract includes aging segments not yet ldquoduerdquo together with ldquopast duerdquo segments
Hot Mix Asphalt On average western Washington hot mix asphalt pavement life is 165 years eastern Washington life is 113 years (due to severe winter cold and extreme summer heat) and the statewide average is 147 years Hot mix asphalt is appropriate for a broad range of roadways from lower volume routes (more than 2000 vehicles per day and more than 200 trucks per day) to interstates with heavy traffic volumes
These pavements are where the greatest benefits of LLCC pavement management can be realized In past biennia there has been some tendency to allocate a share of pavement preservation dollars on a traditional basis by region in addition to dollars programmed strictly by reference to ldquopast duerdquo needs This has resulted in some distortion away from ideal LLCC results As of the 2003-05 biennium this has been corrected by making all regional allocations based on pavement condition and LLCC analysis
Portland Cement Concrete (PCC) Existing PCC pavement life ranges from 25 to 45 years PCC pavement is typically placed on heavily traveled interstate principal arterial and intersection locations Most of the PCC pavements historically installed on Washington highways require dowel bar retrofit and diamond grinding (to smooth the pavement surface) 20 to 25 years after construction (due to lack of reinforcing steel at the transverse joints to prevent settlement) It is estimated that a newly constructed PCC pavement will have a pavement life of 50 years and only require diamond grinding in its 25th year due to studded tire wear
Efficiency Gains for Hot Mix Asphalt Pavements Hot mix asphalt surface life has improved by 14 percent (statewide) over the last six years while over the same time period the vehicle miles traveled on asphalt paved roadways has increased by approximately 10 percent Management of asphalt pavements is an area where WSDOT has succeeded in delivering dramatically improved ldquobang for the buckrdquo to Washington state taxpayers How have WSDOT and its asphalt paving industry contractors achieved this significant efficiency gain in asphalt on state freeways and highways The keys lie chiefly in the following areas bull Provision on the paving specification for use of performance-grade binders selected for expected climate and traffic conditions
bull Use of Superpave mix designs keyed to temperature and traffic expectations
bull Improved asphalt pavement repair and asphalt placement techniques
bull Better attention to construction details and inspection and bull Increased experience with LLCC rehabilitation programming
WSDOT is also focusing pavement management efforts on programming more lane miles at a single location resulting in lower bid prices The amount of asphalt used for pre-leveling (filling in minor ruts and depressions prior to paving) has also been reduced on WSDOT paving jobs generally from 600 tons per lane mile to 300 tons per lane mile resulting in a substantial cost savings The effect of these efficiency gains taken together is that a tax dollar invested in pavement rehabilitation today buys much more than it did just a few years ago
2004 Concrete Lane Miles
Current Age (Construction or Reconstruction)
Total Lane Miles
Lane Miles Rehabiliated to Date by Dowel Bar Retrofit
0-10 1471 00 11-20 2740 00 21-30 5668 350 31-40 6420 3224 41-50 2791 581 51-60 50 02 61 or more 661 00 Total 19800 4157
A matter of concern in the 2002 pavement condition survey is that an additional six miles of PCC pavement were found to have fallen into the ldquopoorrdquo category raising the PCC ldquopoorrdquo total to 170 lane miles However the greatest concern is the potential for a dramatic increase in the poor category as a result of the PCC performance reevaluation in 2004
The table at left illustrates the number of PCC pavement lane miles currently owned and maintained by WSDOT Sixty miles of PCC replacement would cost on the order of approximately $60 million before taking into account the project costs associated with roadway safety upgrades and stormwater runoff control retrofits
Does not include 321 lane miles of bridge Traffic disruptions associated with rehabilitation or replacement of these pavements is sections and 112 lane miles of ramps another difficult feature of this looming problem
40 Measures Markers and Mileposts - December 31 2003
40 Measures Markers and Mileposts - December 31 2003
Rating Pavement Conditions WSDOT continues to use a three-part examination system to rate pavement condition
Pavement Structural Condition (PSC) A pavement will develop structural deficiencies for two reasons truck traffic and cold weather The PSC is a measure based on distress such as cracking and patching which are related to the pavementrsquos ability to carry loads PSC ranges from 100 (best condition) to 0 (worst condition) A roadway should be considered for rehabilitation when it falls within the PSC range of 40 to 60 Rutting Rutting is caused by heavy truck traffic or studded tire wear Ruts deeper than 12 inch have the potential to hold water increasing the risk of hydroplaning for high-speed traffic A roadway should be rehabilitated when the rut depth is greater than 13 inch
Roughness The International Roughness Index (IRI) is a procedure to measure pavement ride A full-sized van with a laser-measuring device mounted on the front bumper measures the roughness of the pavement A roadway should be rehabilitated when the IRI value is between 170 and 220 inches per mile
Determining When Pavements are ldquoDuerdquo The Pavement Condition Rating process using the van pictured on the right analyzes and predicts the pavement rehabilitation due period (see the Gray Notebook for the quarter ending June 30 2001 for details) A regional validation process reviews the results and calibrates the ratings if needed The number of disputed segments varies between 5-10 Each of the segments in question is then reviewed and any discrepancies are resolved WSDOT considers the pavement rehabilitation due year in the Pavement Management System to be approaching 100 accuracy Pavement Condition Data Collection Vehicle
2002 Pavement Smoothness by StateHow Do Washingtonrsquos Pavements Conditions Centerline Miles in PercentCompare with National Experience Miles Poor in Poor
FHWArsquos annual Highway Statistics report includes Rank State Reported Condition Condition information on pavement condition reported by each 1 Georgia 11301 34 03
2 Wyoming 4414 22 05of the 50 states and the District of Columbia (based on 3 Alabama 7643 41 05roughness only) To the right is a snapshot of the 2002 4 North Dakota 6180 53 09 results that shows the number of miles by state in 5 Minnesota 11658 108 09
6 Nevada 2959 33 11poor condition according to smoothness The total miles 7 Kentucky 5192 76 15reported includes the interstate system and principal 8 Florida 10898 160 15
9 Kansas 8851 183 21arterials owned by the state cities and counties and a 10 Arizona 4065 86 21sampling of other functional classes Washington state 11 Idaho 3860 93 24ranked 16th in smooth roads in 2002 (Washington was 12 Maine 2391 60 25
13 Montana 6927 179 26ranked 17th in 2001) 14 Utah 3676 120 33 15 Alaska 1800 62 34 16 Washington 5396 194 36The FHWA publication can be viewed at wwwfhwadotgovpolicy
ohimhs02indexhtm 17 South Carolina 6791 260 38 18 New Hampshire 1375 54 39
49 California 20634 5437 263 50 Massachusetts 3290 1182 359
Source Highway Statistics 2002 US Department of Transportation
Measures Markers and Mileposts - December 31 2003 41
Measures Markers and Mileposts - December 31 2003 43
Highway Maintenance Annual Update Biennial Maintenance Targets The Maintenance Accountability Process (MAP) targets measures and communicates the outcomes of 34 distinct highway maintenance activities Maintenance results are measured using field condition surveys and are reported as Level of Service (LOS) ratings LOS targets are defined in terms of the condition of various highway features (for example the percent of guardrail on a highway system segment that is damaged) LOS targets are also keyed to the level of funding provided by the Legislature The following table shows a list of maintenance activities (in prioritized order) for which LOS targets have been set in the 2003-05 biennium During 2003 targets for all activities were achieved
WSDOT Maintenance TargetsAchieved for 2003 Maintenance Activity Achieved Pavement Patching and Repair uuml
Snow and Ice Control Operations uuml
Traffic Signal Systems uuml
Movable and Floating Bridge Operations uuml
Urban Tunnel Systems uuml
Keller Ferry Operations uuml
Guardrail Maintenance uuml
Noxious Weed Control uuml
Structural Bridge Repair uuml
Intelligent Traffic Systems uuml
Control of Vegetation Obstructions uuml
PermitsFranchises uuml
Maintain Culverts uuml
Regulatory Sign Maintenance uuml
Slope Repairs uuml
Crack Sealing uuml
Bridge Deck Repair uuml
Safety Patrol uuml
Rest Area Operations uuml
Highway Lighting Systems Operations uuml
Pavement Striping Maintenance uuml
Maintain Catch Basins and Inlets uuml
RaisedDepressed Pavement Markers uuml
Sweeping and Cleaning uuml
Nuisance Vegetation Control uuml
Maintain Ditches uuml
Shoulder Maintenance uuml
DetentionRetention Basins uuml
Litter Pickup uuml
Guide Sign Maintenance uuml
Landscape Maintenance uuml
Guidepost Maintenance uuml
Bridge Cleaning uuml
Pavement Marking Maintenance uuml
2003 Perfect Score ndash Percentage of Legislatively Funded Targets Achieved 1998-2003 In September 2001 the first Gray Notebook quarterly report on MAP WSDOT achieved 26 out of the 34 MAP targets Three years later a perfect score has been achieved The positive trend can be attributed to bull What gets measured gets managed WSDOT
maintenance managers and field workers are gaining experience with how to manage work in ways that help to attain the service level targets
bull Strong maintenance results across-the-board have been assisted by mild or average winter conditions
bull Stable funding for maintenance for several years has lessened ldquocrisis moderdquo management and produced better across-the-board results
bull Improved accuracy in measuring MAP results ndash based on a six-month review and field verification of MAP measures and their assessment technique
Starting in March 2004 WSDOT maintenance staff will be documenting greater levels of detail such as units of work completed (for example ldquolinear feet of guardrail repairedrdquo) This will provide information that can be used to develop cost per unit and units per day or week measures to supplement the outcome measures provided by MAP Look for more on this in future Gray Notebook maintenance pages
Percentage of Legislatively Funded Targets Achieved for 1998-2003
100
80
60
40
20
0 2002 20031998 1999 2000 2001
Source WSDOT Maintenance Office
Measures Markers and Mileposts - December 31 2003 42
42 Measures Markers and Mileposts - December 31 2003
Integrated Vegetation Management Integrated Vegetation Management (IVM) involves creating and supporting roadside plant communities that minimize short and long-term maintenance needs Roadside vegetation maintenance requirements often depend on how well roadsides are designed and constructed When soil is conserved and improved vegetation is restored during highway construction roadside maintenance requirements can be relatively low However if roadsides are not well restored at the time of construction the expense of roadside maintenance grows because noxious and nuisance weeds tend to establish themselves and thrive in poor soils with sparse vegetation
2003 Herbicide Use Trends ndash Results In terms of pounds of active ingredient WSDOTrsquos statewide annual use of herbicides for roadsides increased by 3300 pounds (121105 pounds in 2002 to 124426 pounds in 2003) On closer review of the data most areas in western Washington were either down or about the same in their overall herbicide use compared to 2002 In fact Clallam County the first area in which WSDOT has implemented an IVM plan saw a 50 percent reduction in herbicide use on the roadsides In eastern Washington two areas in particular experienced significantly increased herbicide use The cause was a localized ongoing weed infestation problems for which herbicide applications were needed Had it not been for the significant application in these two areas WSDOTrsquos herbicide use in 2003 would have been less than in 2002
Clallam County IVM Plan In the past year WSDOT has finally begun to make progress implementing its long-promised IVM program Working with communities and a number of interest groups on the Olympic Peninsula WSDOT developed an IVM plan for state highway maintenance in Clallam County that reduced the amount of herbicide used and responded to citizen concerns Highlights and results include
bull No vegetation-free area adjacent to pavement within 60 feet of salmon streams Hand-treatment only of invasive plants growing next to the pavement edge in this area
bull No summer application of herbicides for controlling trees and brush
bull Hand application of noxious weed control herbicide (as opposed to truck applications) and close coordination with the Clallam County Noxious Weed Control Board
bull Experimentation with alternative brush control methods such as planting desirable plant species (ie salal) hydro seeding and biological controls
bull Total herbicide use decreased more than 50 percent
At a February 5 2004 open-house meeting to discuss continued aspects of the IVM program in Clallam County concerned citizen Josey Paul commended WSDOT employees saying ldquoThank you for your good efforts managing vegetation along SR 112 this past yearrdquo
With an effective IVM program common weeds such as kochia in eastern Washington can be managed with reduced herbicide use over time
Vegetation-Free Area Approximately 60 percent of herbicides used by WSDOT are used to prevent vegetation from growing at the pavementrsquos edge WSDOT is reviewing this practice including a study of other statesrsquo use of chemicals in vegetation-free zones alongside the roadway The challenge in determining the best approach comes from needing to balance the potential herbicide impacts with hazards to motorists associated with an abundance of roadside vegetation to highway workers from mechanical control technologies and to pavements for vegetation incursions to the pavement By the end of the year WSDOT will develop and implement updated policies on vegetation-free areas
The vegetation-free zone next to the roadway
Measures Markers and Mileposts - December 31 2003 43
Measures Markers and Mileposts - December 31 2003 45
IVM Future Practices Integrated Vegetation Management Plan Schedule Because of the success of the Clallam County I-5 North (lsquo04)IVM plan WSDOT created a statewide schedule for Roadside Vegetation Management plans The timetable implements all plans by the end of 2007 WSDOT also identified new performance measures to track future roadside vegetation management trends The measurements include
bull The IVM plan development schedule
bull Adherence to sensitive buffers upon orders by the US District Court (see below)
bull Number of WSDOT application violations
bull Maintenance Accountability Process (MAP) conditions measures for nuisance weeds I-5 South (lsquo03)noxious weeds vegetation obstructions and landscape maintenance WSDOTrsquos Integrated Vegetation Management Plan implementation
is scheduled by year and by maintenance area as shown in thebull Documentation of area-specific IVM plan above map Area by area production of the plans will continue until
elements completed each year statewide coverage is achieved
Seattle Spokane
5
rsquo03 rsquo04
rsquo06
rsquo05
rsquo05
rsquo06 rsquo05
rsquo04
rsquo07
rsquo07
rsquo07
5
Tacoma Olympia 90
Whidbey Island Plan Coming The department will hold a public meeting on a Roadside Vegetation Management Plan for Whidbey Island in March 2004 WSDOT expects to develop and implement a plan that meets the concerns of citizens with varying viewpoints on herbicide use and can be achieved at reasonable cost The draft plan identifies a number of key areas test sites roadside features and treatment practices Other IVM plan details for Whidbey Island are expected to include
bull Restoration of roadsides in coordination with future construction projects on State Route 20
bull Restoration of native roadside vegetation on half of an acre a year as part of the regular maintenance program
bull No vegetation-free area adjacent to pavement within 60 feet of the waterline at Penn Cove and Keystone Spit
bull Establishment of the vegetation-free area pilot projects
US District Court January 2004 Ruling The United States District Court in Seattle entered an injunction in January 2004 prohibiting the use of certain herbicides within sixty feet of salmon streams pending EPArsquos completion of a review whether such use is consistent with protections afforded by the Endangered Species Act
WSDOTrsquos herbicide practices included in the 2003 IVM plan for Clallam County and generally followed in many other areas of Western Washington are already matched to the injunctionrsquos requirements To ensure adherence to the terms of the injunction WSDOT maintenance crews will identify affected areas on the highways mark buffer zones and receive additional training on vegetation management practices including limitations on herbicide use
WSDOT ndash Proactive in Risk Assessment As part of its vegetation management efforts in 2003 WSDOT contracted with a consultant Intertox Inc to update a 1993 WSDOT hazard assessment study This included integration of new research in herbicide usage The hazard assessments aim through review of scientific literature to inform WSDOTrsquos understanding of potential risks to humans wildlife and aquatic organisms The hazard assessment update generally found the potential risks of specific products to be negligible or low in WSDOTrsquos patterns of use The assessment suggested however that moderate potential risks might be presented by two products MCPA and Diuron WSDOT discontinued further use of MCPA in 2003 and has taken steps to reduce the use of Diuron by limiting its application only to certain areas in eastern Washington
Measures Markers and Mileposts - December 31 2003 44
44 Measures Markers and Mileposts - December 31 2003
Environmental Programs Environmental Management System (EMS) Update WSDOT is continuing to develop its Environmental Management System (EMS) to help support the departmentrsquos environmental efforts and integrate those efforts into everyday operations training programs and regular performance reports Currently several important activities described below are building WSDOTrsquos capacity to improve track and report on environmental compliance
Construction Services Program Pilot To address projects funded by the 2003 Transportation Funding Package WSDOT is piloting a construction services program modeled on a prototype used by its regional office in Yakima The program is being evaluated for statewide implementation Its goal is to ensure that environmental commitments attached to a project are clearly communicated and implemented throughout design construction and facility operation The programrsquos three major components are (1) pre-construction and pre-activity meetings between WSDOT and the contractor (2) tools to aid construction and maintenance staff in maintaining
Seven Core Elements to WSDOTrsquos Environmental Management System bull Legal and other requirements clearly outline all
environmental laws regulations and agreements that apply to operations
bull Written procedures instruct staff and contractors how to conduct work activities in compliance with requirements
bull Training ensures those that conduct certain activities know how to do the work in a compliant manner
bull Roles and duties ensure WSDOT staff and contractors know what they are to do under the EMS
bull Inspection monitoring and corrective action ensure a process is in place to check WSDOTrsquos work for compliance and correct any problems
bull Documentation allows WSDOT to evaluate the operation of the EMS and communicate results to the public and within the department
bull Performance measurement compares WSDOTrsquos performance against pre-determined targets with results reviewed by management and reported to the public
compliance on the project site including an environmental inspection checklist for use by construction inspectors and (3) environmental compliance procedures issued by WSDOT for all construction and maintenance activities
Enhanced Commitment Tracking WSDOT is working to better track formal commitments made during the project development process By the end of 2004 WSDOT will track all formal commitments from inception (usually during planning or project design phase) through construction to completion or handoff to its Maintenance and Operations Department This new system will make clear assignments of roles and duties to show who manages performs and monitors the implementation of each commitment
Examples of Environmental Commitments on WSDOT Projects Some environmental commitments are Other commitments are agreements Some commitments are made during the terms and conditions outlined in environ- made during the Endangered Species Act National Environmental Policy Act (NEPA) mental permits These may require process These commitments or ldquoconser- environmental review process to minimize WSDOT to maintain a certain water quality vation measuresrdquo are designed to protect or offset overall environmental impact of a level during construction use certain endangered species Examples include the project Commitments under NEPA may affect Best Management Practices (BMPs) and requirement for WSDOT to place woody a roadwayrsquos alignment or physical design conduct environmental monitoring debris in a river or avoid working at certain The concrete box culverts shown belowtimes to protect migratory speciesFor example straw blankets and silt were agreed upon during the NEPA process fences are required to be used to protect In addition to habitat protection WSDOT and are designed to promote floodplain a small stream along Highway 18 during uses engineered log jams root wads and connectivitymdashallowing water to pass under rainstorms until permanent erosion control other bio-engineering techniques to protect the roadway during high water rather than grasses are established stream banks near roads and bridges over it or on to adjacent property
Measures Markers and Mileposts - December 31 2003 45
Measures Markers and Mileposts - December 31 2003 47
Environmental Compliance Assurance Annual Update WSDOT self-monitors for ldquonon-compliance eventsrdquo whether or not such events are taken up as formal ldquoviolationsrdquo by regulatory agencies or officials
Compliance History The Gray Notebook for March 31 2003 reported on WSDOTrsquos initial effort to track non-compliance events Data for 2001 and 2002 was obtained by interviewing project managers in December 2002 to gather an after-the-fact best estimate of the number and types of non-compliance events Since then WSDOT has systematically tracked non-compliance events for highway construction and maintenance programs and for operations of the Washington State Ferries (WSF)
How Are We Doing In 2003 WSDOT recorded 41 non-compliance events with 13 leading Non-Compliance Events to issuance by a regulatory agency of a formal Notice of Violation 2001-2003 (NOV) 45
40 In 2003 32 of 41 non-compliance events involved water quality 35
regulations as shown in the chart at right For 2003 the ldquootherrdquo category 30
includes three events associated with underground storage tank rules and 25
one event associated with an air quality violation 20
15
The increase in recorded highway program and WSF non-compliance 10
events from 2001 to 2003 is partially explained by an increased 5
0 emphasis on identifying non-compliance events Because 2003 is the 2001 2002
Fish Habitat OtherWetlands Water Quality first year that WSDOT has systematically tracked non-compliance events apples-to-apples comparison with previous years is not possible For more information about WSDOTrsquos Environmental
Compliance Assurance Procedure please see the The baseline data for 2003 of the number and type of events taking Gray Notebook for the quarter ending March 31 2003
place will help WSDOT staff develop compliance tools for the agency page 18
Source WSDOT Environmental Services OfficeUsing Non-Compliance Data WSF began systematizing data collection on petroleum product spills three years ago The data illustrated ongoing minor problems from hydraulic systems on transfer spans at WSF terminals Last winter WSF Terminal Maintenance began a program to improve inspection of transfer spans and quickly correct any problems This new emphasis includes training for terminal attendants to identify potential leaks in the bridge operation and to report potential leaks to Terminal Maintenance
For the three years since 2001 WSF terminals have had seven four and five hydraulic spills respectively The prevention actions instituted by Terminal Maintenance means that now more WSF employees are aware of and watching for potential problems
2003
Total Resulting Actual Notices
Total
Total
Resulting Actual Notices
Resulting Actual Notices
Beginning of Maintenance and Construction ECAP (Environmental Compliance Assurance Procedure)
Hydraulics system at the Anacortes Ferry Terminal
Integrated Vegetation Management Results
Please see Highway Maintenance IVM report on page 43 of this Gray Notebook
WSDOT also tracks compliance with herbicide and Non-Compliance Eventspesticide application laws covering the products and procedures used to maintain roadside and wetland 2001 2002 2003 mitigation sites The number of product applications in Number of WSDA 8 6 4 2003 went up 17 and the pounds of active ingredient Investigationswent up by 35 from the previous year The number of findings of fault notices from the Washington State Department of Agriculture (WSDA) remained steady at
Number of WSDA Findings of Fault
5 4 2
four Two notices involved overspray leaving the road right Number of Product 2271 3399 4091 of way and two were found not to have merit and dropped Applicationsby WSDA In 2003 WSDA issued two warning letters to WSDOT regarding the alleged injury to two privately owned conifer trees in the town of Loon Lake near Colville The
Total Pounds of Active Ingredient Applied
67156 120171 124290
trees tested positive for diuron that may have come from an earlier WSDOT roadside application of herbicides for total quantity of chemicals used
Measures Markers and Mileposts - December 31 2003 46
46 Measures Markers and Mileposts - December 31 2003
Monitoring Replacement Wetlands Annual UpdateTypes of Mitigation Two WSDOT mitigation bank sites currently provide advance compensation for unavoidable wetlands losses The Moses Lake Mitigation Bank provides five acres of enhanced wetland and about two acres of restored wetland The North Fork Newaukum Mitigation Bank provides 91 acres of enhanced wetland and one acre of restored wetland Since 2002 15 new replacement wetland sites (199 acres) have been added to the overall inventory of wetlands replacement acreage
Meeting Standards in 2003 In 2003 biologists monitored a total of 63 active replacement wetlands ranging from one to eight years in age Of these sites 21 had targets (success standards) to be met in 2003 Monitoring was conducted for 87 individual standards
Of the two sites that did not meet any standards due in 2003 one is in the middle of its planned monitoring period and had poor plant survival and too many weeds The site has been re-planted and because it is close to a river biological weed control is planned The second site is at the end of its planned monitoring period but has not developed into a wetland because it is too dry WSDOT staff are considering appropriate alternatives to achieve this environmental commitment
Completed Replacement Wetlands Successful sites have achieved reasonable ecological success and no longer need monitoring Unsuccessful sites have not met requirements and are ecologically unsuccessful
Reasonable ecological success was achieved on six more sites in 2003 bringing the total of completed sites since 1988 to 53 The total of sites judged successful in this group is 49 (267 acres) The four unsuccessful sites failed due to unpredicted or changed hydrology the most important parameter of wetland success WSDOT is considering options to meet the environmental commitments for these projects
For additional detail on monitoring replacement wetlands and pictures of the different types of projects see the Gray Notebook subject index at wwwwsdotwagovaccountabilitygraybookindexhtm environment and click on ldquoWetland Mitigation and Monitoringrdquo WSDOT has been mitigating for unavoidable wetlands loss with replacement wetlands for 15 years to address the statersquos Executive Order 89-10 which mandates that the actions of state agencies result in no net loss of wetlands Advance mitigation means building replacement wetlands before unavoidable impacts take place Monitoring and reporting on the status of replacement wetlands is critical to the success of the program as seen through the eyes of both the public and the resource protection agencies with whom agreement on these projects must be reached
WSDOT Replacement Wetlands 1988-2003
WSDOT Replacement Wetlands 1988-2003 Total Acreage of Wetland Projects 116 Sites 675 Acres
Olympia Tacoma
Seattle Spokane
Actively Monitoring
Monitoring Complete
Buffer An upland area Enhancement Improvements that protects a wetland from to an existing degraded wetland
126 Acres 119
Acres
189 Acres
181 Acres
60 Acres
adverse impacts (181 Acres to increase or augment wetland increased by 90 acres since function (189 Acres increased 2002) by 100 acres since 2002)
Restoration Re-establishes a wetland area andor function where wetlands previously existed but are no
Creation The establishment longer present (60 Acres of wetland area and functions increased by 3 acres since where none existed (126 Acres 2002) increased by 4 acres since 2002)
Preservation Protecting wetlands from future development ensures that valuable wetland functions continue to provide benefits (119 Acres increased by 2 acres since 2002)
Replacement Wetlands Success in 2003 Total Number of Sites 21
Meeting All WSDOT reported onStandards
22 Acres11
Acres
8 Acres
the status of sites5 Sites with standards to be
achieved in 2003 on a site-by-site
Meeting basis in the 2003Some Annual MonitoringStandards report For detailed14 Sites monitoring results visitMeeting No wwwwsdotwagov Standards environmentwetmon
2 Sites defaulthtm
Success Rate for Replacement Wetlands Success Rates for Replacement Wetlands with Completed MonitoringMonitoring Complete 100 Includes acreage
not yet designated 95 for mitigation credit
90
85 Source for all charts WSDOT Environmental
1988-2001 1988-2002 1988-2003 Services Office 80
Includes acreage not yet designated for mitigation credit Source WSDOT Environmental Services Office
Measures Markers and Mileposts - December 31 2003 47
Measures Markers and Mileposts - December 31 2003 49
Stormwater Treatment Facilities WSDOT routinely builds stormwater treatment facilities to Department of Ecology standard as a part of highway construction Stormwater treatment facilities reduce stormwater flows that cause flooding and harm fish habitat These treatment facilities also remove sediment metals nutrients and other pollutants from highway runoff
In response to municipal stormwater permit requirements WSDOT has tracked the number of new stormwater treatment facilities built in King Pierce Snohomish and Clark counties where about 40 percent of statewide highway construction has occurred since 1996 In the past seven years 300 treatment facilities (an average of 43 per year) have been built in those counties
Out of 1140 miles of highway within the four counties an estimated one percent of state highways have new stormwater treatment facilities constructed each year These treatment facilities help to mitigate and manage the impacts of stormwater runoff from our state highways
In addition to removing pollutants and reducing flooding this pond near I-5 milepost 96 protected a nearby wetland by trapping a 140-gallon accident-related diesel spill from the adjacent freeway
Ponds that infiltrate treated runoff reduce flooding in the winter and help maintain stream flows in the summer
Monitoring Water Quality Impacts for Construction Sites Annual Update In 2003 WSDOT completed its first year of construction site water quality sampling under a new statewide monitoring policy The policy requires sampling on at least 20 percent of all projects with substantial potential for water quality impacts The chart at right summarizes sampling results that compare water quality upstream and downstream from 12 projects Ninety-five percent of the samples met water quality standards for clarity
Of the 200 samples taken nine failed to meet standards The water became muddy on five of the projects because work had to be done in the water or very near the shore The other four projects experienced heavy rainfall ranging from 3frasl4 to 3 inches which overwhelmed the mandated design capacities of approved treatment facilities In all cases monitoring results prompted immediate corrective actions to regain compliance with water quality standards
Case Study Golden Harvest Creek Culvert ReplacementThe Golden Harvest Creek culvert replacement project on SR 21 near the town of Republic in eastern Washington illustrates the challenges associated with keeping sediment out of water when replacing culverts Diverting water around work areas is very effective but the installation and removal of diversions can briefly muddy a stream While removing an old culvert that blocked fish migration some dirt fell into the creek After the new culvert was in place the creek was re-directed into the new channel stranding some fish in the temporary bypass Workers entered the water and carefully moved the fish back into the creek The state standard for clarity of water was exceeded twice during construction but returned to normal within minutes each time
State Water Clarity Standards Compliance Number of Samples for 2003
45 Out of compliance In compliance
30
15
0 Apr May Jun Jul Aug Sep Oct Nov
Water Clarity Monitoring Golden Harvest Creek August 2003
64
25
20
15
10
5
0 5th 5th 6th 7th 12th 13th 14th 15th 18th 19th 20th 25th
Upstream Downstream
State Standard
Water was briefly muddied as workers moved fish back into the stream
Water was temporarily muddied as an old culvert was removed
Source for both charts WSDOT Environmental Services Office
Measures Markers and Mileposts - December 31 2003 48
48 Measures Markers and Mileposts - December 31 2003
Erosion Control Preparedness ndash Annual Update Erosion control is an important component of WSDOTrsquos program to protect the environment In addition to education careful planning and stringent contract requirements WSDOT routinely performs construction site inspections to verify the effectiveness of erosion control measures and makes improvements as needed In the fall of 2003 moderate and high-risk projects (20 in all) were inspected to determine how well they were prepared for the wet season and whether or not erosion led to any water quality violations site damage or delays
The October 2003 storm (see the September 30 2003 Gray Notebook Special Features) for example overwhelmed the treatment measures planned for the runoff from existing pavement An inspection revealed that dirty water was entering Taylor Creek
WSDOTrsquos Environmental Compliance Assurance Procedures were initiated and crews immediately addressed the situation the discharge of dirty water stopped and the incident was promptly reported to the Department of Ecology
Fall Assessment Results This table outlines how
Erosion control measures on SR 18 in the Maple Valley area
well prepared WSDOT was during fall 2003 compared to its level of preparation in 2002
Last year WSDOT identified areas where improvements in erosion control preparedness were needed One area in particular included ensuring that erosion control plans are always on site and up to date with current project conditions (a condition of environmental permitting) Specific actions were taken at statewide meetings and training sessions that
Erosion and Sediment Control Assessment Results 2002 2003 Status
Excellent Clearing limitssensitive area boundaries identified and respected by contractor
Utility trenches excavated in manner to reduce erosion risk Remove temporary erosion and sediment control measures when not needed
100 100 81
100 stable 100 stable 100 improved
Good
Contractor trained in proper use of erosionsediment control measures Sediment trapping measures installed prior to soil disturbing activities Control offsite erosion prevented by controlling flows Protect storm drains from sediment
100 90 87 74
95 decreased 90 stable 84 decreased 82 improved
Fair
If a storm hit at time of site visit water would meet state water quality standards If a storm hit at time of site visit adjacent property would be protected Effectiveness of measures installed to trap sediment Erosion control plans are on site and up to date for all WSDOT projects
86 83 96 56
80 decreased 80 decreased 78 decreased 75 improved
Poor
Manage construction site water in manner reducing sediment deposition risk Perform maintenance on temporary erosion and sediment control measures Construction access routes stabilized to prevent tracking of mud onto streets Effectiveness of measures installed to prevent erosion Temporary stormwater conveyance channels stabilized Protect cut and fill slopes from concentrated runoff Amount of disturbed soil actually covered with erosion control measures
100 70 98 91 90 67 65
71 decreased 70 stable 69 decreased 67 decreased 64 decreased 50 decreased 45 decreased
resulted in an improvement Source WSDOT Environmental Services Office of 19 percent
In 2003 the overall assessment increased in three areas while it remained the same or had little change in seven others WSDOTrsquos preparedness in the remaining eight areas decreased substantially creating an elevated risk to increased erosion when compared to last year The decrease in the bottom five areas in the ldquoPoorrdquo category are directly attributed to one or both of the following reasons (1) the extremely dry weather this fall extended large earthwork activities into the ldquowet seasonrdquo delaying soil cover practices and (2) drought conditions reduced effectiveness of late spring and early fall seeding applications
Summary and Next Steps An analysis of the 20 projects documents that 12 had no problems preventing erosion Projects experiencing minor problems increased by 16 percent from 2002 for a total of seven The minor problems were promptly corrected without regulatory agency involvement or high repair costs One project experienced major problems that involved one Notice of Violation The plan to improve performance on issues in the ldquoPoorrdquo to ldquoFairrdquo ranges includes increased technical assistance improved contract enforcement and increased emphasis in training
Measures Markers and Mileposts - December 31 2003 49
Measures Markers and Mileposts - December 31 2003 51
Incident Response Quarterly Update Program Totals WSDOT Incident Response Program provides roving service to clear roads and help drivers on Washingtonrsquos heavily traveled freeways Along with the WSDOT roving units non-WSDOT units provide contracted roving services These units include the Washington State Patrol (WSP) Cadets Registered Tow Truck Operators (RTTO) and a Motorist Assist Van (MAV)
Incident Reasons and Clearance Times Washington Statersquos target is to clear all incidents within 90 minutes During the fourth quarter 71 percent of major incidents were due to motor vehicle collisions Major incidents are however only two percent of all incidents on state roadways The most frequently occurring incidents which are likely to cause slowdowns during daily commutes are disabledabandoned vehicles or debris blocking traffic (82 percent of all incidents) During the fourth quarter 85 percent of incidents were cleared within 30 minutes and 47 percent were cleared in less than 10 minutes
Detection and Response by Roving Notification and Call-out The roving Incident Response Program is an effective means to keep traffic moving on freeways because the responders quickly detect incidents on the roadways During the fourth quarter 70 percent
Abandoned Vehicles (6)
Hazardous Materials and Fatal Collisions were less than 1 percent each
Incidents Lasting90+ Minutes Fatality
Disabled Vehicles Collisions (15)(9)Haz Mat Abandoned
(5) Vehicles Fire (2) (2) Debris
(4)
Incidents Lasting LessThan 15 Minutes
Non-Injury Other Collisions (4) (4)
Debris (10)
Abandoned Vehicles (27)
Disabled Vehicles 55
Injury Collisions Fatal Collisions Fire and Hazardous Materials were less than 1 percent each
Incidents Lasting 15 to 90Minutes Injury Collisions Fire(7) (1)Other (2)
Non-Injury (20)
Debris (5)
Disabled Vehicles 58
of all incidents were detected by roving units Roving units were notified of the remaining 30 percent of incidents Call-out units respond to severe incidents that occur Other
(2)
Non-Injury (32)
Injury Collisions (30)
outside roving zones or during non-roving hours There were 129 call-out responses during the fourth quarter which amounted to one percent of all the incidents responded by the IR program
Blocking versus Non-Blocking Locations The location and duration of an incident can impact traffic greatly Overall 67 percent of all incidents were on the shoulders and medians of roadways and did not block travel lanes Seventy percent of the incidents that were cleared in less than 30 minutes occurred within shouldersmedians and did not block travel lanes Of the major incidents lasting 90 minutes or more 80 percent were blocking travel lanes
Source for all charts WSDOT Traffic Office
Total Number of Responses by Month July 2002 to December 2003
5000
4500
4000
3500
3000
2500
2000
1500
1000
500
0
WSDOT IRT 2003 Contracted IRT Units 2003
2002
Jul Aug Sep Oct Nov Dec Jan Feb Mar Apr May Jun Jul
Average Clearance Time (in Minutes) January 2003 to December 2003
35
30
25
20
15
10
5
0
For All Incidents
For Incidents Lasting 15-90 Minutes
Jan Feb Mar Apr May Jun Jul Aug Sep Oct Nov Dec
Average Clearance Time for Incidents Lasting Over 90 Minutes 3-Year Comparison July 2001 to December 2003
300
250
200
150
100
50
0
July 2001 to June 2002
July 2002July to to June 2003December 2003
Jul Aug Sep Oct Nov Dec Jan Feb Mar Apr May Jun
Number of Incidents by Location and Clearance Time October 2003 to December 2003
Travel Lanes
ShoulderMedian
6000
5000
4000
3000
2000
1000
0 Less 10- 20- 30- 40- 50- 60- Over than lt20 lt30 lt40 lt50 lt60 lt90 90 10 min
Measures Markers and Mileposts - December 31 2003 50
50 Measures Markers and Mileposts - December 31 2003
Over 90 Minute Incidents There were 243 incidents lasting 90 minutes or longer during the fourth quarter of 2003 Incidents are located by dots on the map All incident records collected into the WSDOT Incident Tracking System (WITS) are being mapped for exact locations by state route and milepost for further analysis
Examples of Incidents Over 90 Minutes The following five incidents had the longest clearance times for the period between October 1 2003 and December 31 2003
bull October 1 ndash A fuel tanker truck overturned on I-5 in King County A single northbound lane was intermittently closed as multiple tow trucks responded to the scene to try and right the truck After multiple attempts the fuel was pumped from the truck so that it could be righted WSDOT Incident Response set up traffic control until recovery was complete 104 hours was required for Incident Response to clear the scene
bull October 8 ndash A semi truck traveling from westbound I-90 to northbound I-5 in Seattle drove off the elevated ramp falling approximately 30 feet and landing on the roadway below The tractor-trailer and cargo were demolished on impact necessitating a lengthy and technical clean up WSDOT Incident Response responded to the scene for traffic control and clean up 82 hours were required to clear the scene
bull October 12 ndash A loaded fuel tanker lost control on SR 9 just north of Wickersham in Whatcom County causing the rear trailer to roll on its side leaking fuel onto the shoulder and into the drainage system A detour route was set-up and a private contractor was called in to clean up the fuel spill WSDOT Incident Response assisted with traffic control and helped to clear debris from the roadway 164 hours were required to clear the scene
bull November 22 ndash A collision on US 97 near Goldendale involving a semi truck resulted in multiple lane closures as the scene was cleared WSDOT Incident Response set up traffic control and assisted other agencies Responders were able to keep traffic flowing throughout most of the incident 85 hours were required to clear the scene
bull December 9 ndash On SR 9 near the city of Sumas in Whatcom County a semi truck lost control and drove off of the roadway overturned spilling its load of lumber A detour was set-up for both northbound and southbound traffic WSDOT Incident Response performed traffic control and cleared debris 80 hours were required to clear the scene
Over 90 Minute Incidents for Quarter Four 2003
Seattle
Tacoma Olympia
Spokane
Vancouver
Everett
Service Actions The Incident Response roving program provides various services to motorists Traffic control is the most common service provided On an average day during the fourth quarter incident response personnel (all units) provided fuel to 14 vehicles cleared 12 pieces of debris changed 12 flat tires pushed 8 vehicles and performed 6 minor car repairs
Response Types October to December 2003
Total Incident Responses = 12341 bull 1717 Collisions (14) bull 10624 Non-Collisions (86)
Oct Nov Dec Fatality Collisions 6 11 10 Injury Collisions 147 147 134 Non-injury Collisions 377 417 468 Disabled Vehicles 2435 2120 2320 Abandoned Vehicles 787 705 784 Debris 420 330 290 Fire 24 17 27 Hazardous Materials 15 5 4 Other 132 139 149 Some non-collisions fall into more than one of the above categories
Service Actions Taken for Non-Collision Responses October to December 2003
Oct Nov Dec Traffic Control 425 370 429 Provided Fuel 324 286 269 Changed Flat Tire 323 255 220 Minor Repair 281 203 260 Pushed Vehicle 145 178 190 Towed Vehicle 160 115 144 Cleared Debris 90 84 84
Source WSDOT Traffic Office
Measures Markers and Mileposts - December 31 2003 51
Measures Markers and Mileposts - December 31 2003 53
Travel Information Quarterly Update
Since the launch of 5-1-1 Travel Information Service in July 2003 calls have increased by 74 percent (from 30478 to 52903) during the first six
month period
5-1-1 is a three-digit travel information number designated by the Federal Communications Commission (FCC) to provide around the clock traffic and road condition information
The 5-1-1 system lets the commuter check real-time traffic conditions using a cell phone and voice commands Although some users have experienced difficulty at times with the voice recognition aspect of this system it will continue to be enhanced as technology improves WSDOT is currently developing a plan to address these issues and make the 511 system more user-friendly
1-800-695-ROAD In December 2003 the total number of calls to 1-800-695-ROAD slightly decreased from the level in December 2002 However the total number of calls to Travel Information combining 1-800-695-ROAD and 5-1-1 calls together increased It is likely that 5-1-1 is replacing some of the calls to 1-800-695-ROAD
During the fourth quarter of 2003 the total number of calls to 1-800-695-ROAD and 5-1-1 increased by 786 percent with 481706 calls in 2003 versus 269675 calls in 2002
Travel Information Service Calls to 1-800 Road and 5-1-1 Calendar Year 2002-2003
250000
200000
150000
100000
50000
0 Jan Feb Mar Apr May Jun July Aug Sep Oct Nov Dec
2003 1-800-ROAD 2002 1-800-ROAD
Current Quarter 2003 5-1-1
On the Web Page views to Traveler information continue to increase They are up an average of 93 over the same quarter last year
Traveler Website Daily Usage Daily Average Page Views per Month (in millions)
Jan Feb Mar Apr May Jun Jul Aug Sep Oct Nov Dec 00
05
10
15
20
25
30
Current Quarter 2003 2002
Daily Average Page Views per Month Quarter 2002 and 2003 (in millions)
2002 2003 increase
October 08 17 113 November 13 30 131 December 21 29 38
In comparison to last yearrsquos numbers October saw an increase of 113 percent and November saw a 131 percent increase in daily page views
Highest One Day Total On November 19 2003 WSDOTrsquos web site received 68 million page views
bull 97 went to Traffic and Travel Information
bull 87 of those views originated from the WSDOT site ndash the remaining were from WSDOT through news and other sites such as KIRO KING and KOMO who used WSDOTrsquos cameras and flowmaps
WSDOT is also responding to the increasing number of requests for traffic and travel information to display on mobile devices Developments will be reported as they occur
Source WSDOT Communications Office
Source WSDOT Traffic Office
Measures Markers and Mileposts - December 31 2003 52
52 Measures Markers and Mileposts - December 31 2003
Options to Drive Alone Commuting Quarterly Update Park and Ride Lot Occupancy at WSDOT-Owned Sites in King County During the third quarter of calendar year 2003 occupancy of the 8500 parking spaces in the 32 WSDOT lots in King County averaged 73 percent
A three percent decrease in occupancy from the second quarter was due to summer seasonal declines in transit use About 50 percent of WSDOTrsquos park and ride lots in King County surpassed the target of 70 percent occupancy during the quarter Parked cars regularly exceeded maximum capacity in five lots
Highlights bull The new Issaquah Highlands Interim Park and Ride lot opened at the end of September This Sound Transit lot offers 103 parking spaces for commuters King County Metro is developing a permanent Park and Ride structure at Highland Dr NE and NE High St that is scheduled for completion in late 2005
bull The new 5-story Eastgate Park and Ride garage is scheduled for completion in June 2005
WSDOT-Owned King County Park and Ride Lots Percent of Capacity Used January 2001 through September 2003
100
90
80
70
60
50
Actual
Occupancy should exceed this target
Qtr 1 Qtr 2 Qtr 3 Qtr 4 Qtr 1 Qtr 2 Qtr 3 Qtr 4 Qtr 1 Qtr 2 Qtr 3 2001 2002 2003
Data availability has a lag of three months to allow the transit systems to collect and analyze the data Data for the fourth quarter of 2003 will be available in the next Gray Notebook
Source WSDOT Analysis of King County Metro data
bull Transit agencies throughout Puget Sound report persistent overcrowding at Park and Ride lots along major corridors due to lack of capacity and growing demand Efforts to increase transit and ridesharing are hampered by insufficient capacity at many commuter Park and Ride facilities
Vanpools in the Puget Sound Region Beginning with this issue of the Gray Notebook vanpool information and analysis will reflect a lag of three months in reporting data Reporting on the previous quarter will allow for more complete verification of the data During the third quarter the number of vanpools in operation in the region peaked in July (1376) followed by small decreases in August (1358) and September (1352) Despite the recent decrease the total number of vehicles on the road is up 35 percent since September 2002 when there were 1306 vanpools
Quarterly Regional Vanpool Highlights There are now 62 vanpool VanShare groups in operation in the Puget Sound region The VanShare program provides connections for employees between trains ferries park and ride lots and their work sites The VanShare program has proven to be very successful with Sounder trains on the Tacoma line (34 VanShare groups) King County Metro staff have begun marketing the VanShare program to employees riding between Everett and Seattle
bull Enhancements to regional Internet ridematch service in Puget Sound will provide a direct benefit to vanpools The improved service has the ability to ndash Provide up to 30 names on a match list request ndash Allow easier route planning with map viewing of Park amp Ride lots
Puget Sound Vanpool and VanShare Trends
1380
1360
1340
1320
1300
1280
1260
1240
Vanpools and VanShare
Vanpools Only
Jun Sep Dec Mar Jun Sep Dec Mar Jun Sep 2001 2002 2003
Data availability has a lag of three months to allow the transit systems to collect and analyze the data Data for the fourth quarter of 2003 will be available in the next Gray Notebook Source WSDOT Transportation Demand Management Office
ndash Increase user ability to select newest names on the match list ndash an effective tool for vanpool groups looking for riders ndash Provide promotional email message to users about their companyrsquos rideshare incentives along with an Employee Transportation Coordinator (ETC) contact phone number
Coming Next GNB Edition Commute Trip Reduction Task Force 2003 Report to the Washington State Legislature
Measures Markers and Mileposts - December 31 2003 53
Measures Markers and Mileposts - December 31 2003 55
Customer Feedback Washington State Ferries (WSF) collects customer complaints compliments comments and suggestions This information is recorded in the Automated Operating Support System (AOSS) database for measurement and action based on database cross tabulation and analysis
The charts show trends in the data for the last four fiscal years and the first two quarters of fiscal year 2004 (July 1 ndash December 31 2003)
Customer complaints were up 12 percent from the preceding quarter Complaints have increased for three consecutive quarters
WSF received 53 food service related complaints during the quarter This is only the second quarter in two and one-half years that food service has been in the top four comment types A total of 46 food complaints were received on the Edmonds-Kingston route during a two-week period in November when the MV Quinault was in service on this route The MV Quinault did not have galley service and is a much smaller vessel than the Jumbo Class ferry she was replacing
Washington State Ferries Quarterly Update
Vanpools exiting ferry on Bainbridge Island
N
20
305
16
160
3
525
104
104
104
20
20
525
3
101
1
Tacoma
Everett
Mt Vernon
Victoria
Bellingham
Port Angeles
Shelton
Seattle
5
5
5
5
90
405
Sidney
Shaw
Orcas
Keystone
Port Townsend
Clinton
Mukilteo
Kingston
FauntleroySouthworth
Vashon
Tahlequah
Point Defiance
Bainbridge Island
Edmonds
Anacortes
Bremerton
Friday Harbor
Lopez
2
101
AutoPassenger
Passenger-Only
Washington State Ferries Route Map
Total Customer Complaints Most Common Customer Comments Complaints per 100000 Customers Top Four Comment Types per 100000 Customers
15 12
10
10 08
06
5 04
02
0 0
Food Service
Loading Unloading
Compliments
On time performance
FY FY FY FY Qtr 1 Qtr 2 FY FY FY FY Qtr 1 Qtr 2 2000 2001 2002 2003 2004 2000 2001 2002 2003 2004
Does not include compliments or suggestions
Source for all charts WSDOT Ferries
Measures Markers and Mileposts - December 31 2003 54
54 Measures Markers and Mileposts - December 31 2003
On-Time Performance WSF has been collecting on-time performance data since June 2001 The table below compares WSF on-time performance across the system for the second quarters of fiscal year 2003 and 2004
Delays in the San Juan Islands are due primarily to construction activity at Shaw Island (see ldquoTrip Reliabilityrdquo comments below)
Improved on-time performance was experienced on WSFrsquos busiest route the FauntleroyndashVashonndashSouthworth route Approximately one quarter of all trips by WSF are made on this triangular route structure Fall schedule changes were developed with the Ferry Advisory Committees at Vashon and Southworth resulting in a schedule that increased on-time performance and allowed much needed late night maintenance on the three vessels serving this route
On-Time Trip Delivery Second Quarter Fiscal Year 2003 Second Quarter Fiscal Year 2004
All Trips All Trips A trip is considered toPercent of Average Percent of Average be on time if it departsTrips Within Delay From Trips Within Delay From
within ten minutes of theNumber 10 minutes Scheduled Number 10 Minutes Scheduled of Trips of Schedule Sailing Time of Trips of Schedule Sailing Time published scheduled
San Juan Domestic 5591 85 46 minutes sailing time Missed trips International Route
6443 94 27 minutes
EdmondsKingston 4564 94 31 minutes 4499 93 35 minutes1564 95 28 minutes
Passenger-Only SeattleVashon 1041 94 24 minutes 1003 98 22 minutes9534 91 43 minutes
KeystonePort Townsend 1852 96 24 minutes 1826 93 32 minutes6178 98 20 minutes
Point DefianceTahlequah 2708 93 40 minutes 2782 95 31 minutes4031 96 28 minutes
SeattleBremerton 2563 98 27 minutes 2451 97 31 minutes
152 85 48 minutes are not reported using this measure They
Passenger-Only SeattleBremerton
176 84 37 minutes
Service discontinued are included in the Trip Reliability measure
FauntleroyVashonSouthworth 9602 93 32 minutes
MukilteoClinton 6335 99 20 minutes
SeattleBainbridge Island 3901 98 26 minutes
Total 40654 94 30 minutes 38142 94 31 minutes
Trip Reliability WSF scheduled a total of 41678 trips during the 2nd quarter of fiscal year 2004 Of these trips 486 were missed Sixty-one percent (296) of the missed trips resulted from closures of the Shaw Island terminal during work on a $65 million preservation contract (see details on below) The chart below shows a system-wide average reliability index Assuming that a commuter worked 200 days per year and made 400 trips on WSF the statistical likelihood is that 47 ferry trips would be cancelled This rating represents a 178 decline in the reliability rating from the preceding quarter and a 140 decline in performance over the same period last year
Most Common Trip Cancellation CausesTrip Reliability Index Second Quarter Fiscal Year 2004Trip Reliability Index
rips per 400 SailingsMissed TMissed Trips per 400 Sailings
50
45
40
35
30
25
20 Other (7)15
Terminals (63)
Electrical (50)
Related Propulsion and Steering (43) Other (7)
Vessel
(19)
TidesWeather 10 (11) 5 WSF is undertaking a $65 million preservation contract at the Shaw Island
terminal this biennium Extensive pile driving and ldquoover waterrdquo work was accomplished this quarter to optimize environmental construction windows and seasonal traffic lulls WSF worked closely with the community on Shaw Island and throughout the San Juans to craft mitigation strategies
Cancelled Trips (Average Annual aimed at minimizing disruptions Trip Reliability Index Number = X 400
0
Total Scheduled Number of Because Shaw is a single slip facility closures were necessary duringTrips Commute Trips) regular service hours There was no service to Shaw Island during midday
from September 22 through November 7 One weekend closure was necessary September 27 and 28 Finally WSF completely shut down service from November 8 to November 11 All closures were coordinated
Source for all charts WSDOT Ferries with the community
Qtr 2Qtr 1 2004
FY FY FY FY FY 1999 2000 2001 2002 2003
Measures Markers and Mileposts - December 31 2003 55
Measures Markers and Mileposts - December 31 2003 57
WSF Construction Program ExpendituresCapital Expenditure Performance 2003-2005 Biennium 2nd Quarter Cumulative Dollars in Millions
WSDOT makes capital investments in the Ferry System Authorized vs Actual
through the Washington State Ferries Construction Program The program preserves existing and builds new ferry terminals and vessels supporting the Ferry System the capability to deliver responsible and reliable services WSF planned to spend $595 million over the period July-December 2003 Actual expenditures were $326 million bull Terminal Construction activities are under-spending
by $201 million The Port Townsend Preservation and Improvement projects are $63 million under the plan because project scopes have been revised and work deferred to later biennia Spending for property acquisition and design of the Edmonds Multimodal Terminal is $40 million behind due to a cautious approach to environmental issues and to negotiations with tribes System-wide projects are behind in spending by $25 million particularly in system planning activities and technical support to construction The Eagle Harbor Preservation project is $17 million behind in spending The Anacortes Multimodal Terminal project is $14 million behind in spending Both projects are experiencing slow starts The Shaw Terminal Preservation project is under-spending through December by $15 million and is expected to be completed under budget The Mukilteo Multimodal Terminal is underutilizing new law funds by $10 million This reflects WSFrsquos use of current law federal grants first before expending new law funds and a time lag between
Life Cycle Preservation Performance WSF terminals and vessels consist of several thousand components divided into Category 1 and Category 2 systems and structures Category 1 systems and structures are vital to the protection of people the environment and infrastructure All other terminal and vessel components are designated Category 2 Each component should be refurbished or replaced at the end of its life cycle to assure that WSF can provide responsible and reliable service
WSF has a work plan based on legislative funding to address the backlog of systems and structures that are past due as well as those constituting on-going deterioration of terminal and vessel components This biennium WSF plans to replace or refurbish 133 Category 1 systems and structures and 54 Category 2 components Twenty-three Category 1 systems and structures and two Category 2 items were completed through the second quarter
WSF uses life cycle ratings to measure the impact of its preservation activities The life cycle rating for Category 1 terminal and vessel components is projected to increase from 77 percent at the beginning of the biennium to 81 percent at the end of the biennium The life cycle rating for Category 2 components is projected to decline from 58 percent to 54 percent
Source for all charts WSDOT Ferries
$ 200
$ 150
$ 100
$ 50
$0
Authorized
Actual
Qtr 1 Qtr 2 Qtr 3 Qtr 4 Qtr 5 Qtr 6 Qtr 7 Qtr 8
consultant work and billings The Kingston Sewer Outfall project was paid for in the prior biennium freeing $08 million budgeted in the current biennium for other projects
bull Vessel Construction activities are under-spending by $62 million Variances include The MV Spokane is $55 million behind planned expenditures due to slower than expected billings for equipment procurement The MV Klahowya is $23 million behind because work is deferred to later in the biennium The MV Cathlamet is $17 million over plan because of unanticipated carry forward costs from the prior biennium
bull Emergency Repair activities are under-spending the plan by $06 million
Category 1 Terminal amp Vessel Systems amp Structures Preserved Cumulative Systems Preserved Planned vs Actual 2003-2005 Biennium Quarter 2 Ending December 31 2003
150
100
50
0 Qtr 1 Qtr 2 Qtr 3 Qtr 4 Qtr 5 Qtr 6 Qtr 7 Qtr 8
Planned
Actual
Category 2 Terminal amp Vessel Systems amp Structures Preserved Cumulative Systems Preserved Planned vs Actual 2003-2005 Biennium Quarter 2 Ending December 31 2003
60
50
40
30
20
10
0
Actual
Planned
Qtr 1 Qtr 2 Qtr 3 Qtr 4 Qtr 5 Qtr 6 Qtr 7 Qtr 8
Measures Markers and Mileposts - December 31 2003 56
56 Measures Markers and Mileposts - December 31 2003
Ridership and Revenues The Legislaturersquos Joint Task Force on Ferries (JTFF) comprised of legislators citizens ferry management and ferry workers was formed in 2000 The Task Force reviewed the workings of the WSF system and made recommendations including tariff increases designed to raise the farebox recovery rate to 80 percent of operating costs over six years The Transportation Commission instituted this recommendation and approved tariff increases of 20 percent in June 2001 and 125 percent in May 2002
In the fall of 2003 WSF management developed a new strategic plan aimed at balancing revenue generation necessary to capitalize the aging fleet The new plan reduced the size of the tariff increases for fiscal years 2003-2004 In the spring of 2003 the Transportation Commission adopted fare increases of five percent in May 2003 and an additional five percent in May 2004
As a result of the lower tariff increases ridership is not projected to fall as rapidly as anticipated in the original plan Repeating the pattern from fiscal year 2003 through the second quarter of fiscal year 2004 WSF has experienced slightly higher than projected ridership and revenues
Fiscal year to date ridership has exceeded the plan by four percent or 488000 riders Farebox revenues exceeded the plan by three percent or $2 million (Plan is based on June 2003 forecast)
Ferries Ridership by Month in Millions
3
2
1
0
FY 2004 Actuals
FY 2003 Actuals
FY 2004 Planned
Jul Aug Sept Oct Nov Dec Jan Feb Mar Apr May Jun
Ferries Farebox Revenues by Month Dollars in Millions
$15
$10
$5
$0
FY 2004 Planned
FY 2004 Actuals
FY 2003 Actuals
Jul Aug Sept Oct Nov Dec Jan Feb Mar Apr May Jun
Source for all charts WSDOT Ferries
Farebox Recovery Rate WSFWSF Annual Farebox Recovery RatesAnnual Farebox Recovery RatesFarebox recovery is the percent of annual operating and
maintenance costs recovered through tariffs and other non-tax 100revenues In line with WSFrsquos strategic plan farebox recovery
rates for fiscal year (FY) 2003 were up 54 percent from FY 2002 This is largely due to the May 2002 tariff increase 80
combined with cost saving initiatives A complex blend of cost increases also affected farebox recovery rates For example 60 total operating maintenance and support costs increased $44 million fuel costs increased $45 million insurance increased 40 $13 million and self insurance premiums and tort claims were up $16 million 20 Top performing individual routes in FY 2003 were Edmonds ndash Kingston (121 percent) Bainbridge ndash Seattle (110 percent) 0 and Mukilteo ndash Clinton (95 percent) On average auto routes 1998 recovered 76 percent of operating costs through the farebox while passenger only routes recovered 27 percent WSF also Source WSDOT Ferries
views each routersquos farebox recovery performance over several years as the trend is more important than a snapshot Extraordinary maintenance costs service interruptions or even route closures for terminal construction and many other isolated activities can dramatically effect farebox recovery during a one year period
1999 2000 2001 2002 2003
Measures Markers and Mileposts - December 31 2003 57
Measures Markers and Mileposts - December 31 2003 59
0
10000
20000
State-Supported Amtrak Cascades Service Quarterly Update
Ridership Ridership on state-supported Amtrak Cascades trains was 90664 in the fourth quarter of 2003 This was nearly identical to the fourth quarter of 2002 Trains that showed slight ridership increases during the quarter include the morning Seattle-Portland train both midday trains between these cities and the two Seattle-Bellingham trains The Seattle-Vancouver BC trains experienced the largest ridership decreases during the final quarter of 2003 contributing to a decline of over 8000 riders for the entire year on this route Factors that led to this decline include an increase in the number of cruise ship passengers departing from Seattle rather than Vancouver BC the overall effect of tourism and a lower exchange rate for the US dollar in Canada
For the entire year ridership was 385585 on state-supported trains also a slight increase over 2002 For all trains in the Amtrak Cascades system including those financially supported by the state of Oregon and Amtrak ridership was 589743 This represents the ninth consecutive year of ridership increases
Customer Satisfaction Amtrakrsquos Customer Satisfaction Index (CSI) is based on surveys of riders using the service The scores represent three-month rolling averages The CSI goal for Amtrak Cascades is 91 (out of 100) or better In the most recent survey period the overall score for Amtrak Cascades was 90 This score continues to be one of the highest in Amtrakrsquos national system and is nine points higher than the national average for routes of similar distance Survey responses showed high customer satisfaction with access to trip information prior to boarding the train the smooth and comfortable ride and the friendliness and helpfulness of train conductors Survey questions that produced lower scores include the quality and variety of food available on the trains and on-time performance
On-Time Performance On-time performance for state-supported Amtrak Cascades trains averaged 672 percent for the last three months of 2003 This was nearly eight points below the performance for the same period in 2002 and well below the goal of 80 percent set by WSDOT and Amtrak The primary cause of delays during the fourth quarter of 2003 was rail freight traffic congestion throughout the corridor and speed restrictions imposed by the railroad where rail line maintenance was taking place For the entire year on-time performance for Amtrak Cascades trains averaged 719 percent up slightly from 2002
Photo by Jeffrey T Schultz
State-Supported Amtrak Cascades Monthly Ridership Number of Passengers
50000
40000
30000
20000
10000
0
2003
2002
Jan Feb Mar Apr May Jun Jul Aug Sep Oct Nov Dec
Amtrak Cascades Annual Ridership 1994-2003
700000
600000
500000
400000
300000
200000
100000
0
Source for all charts Amtrak and WSDOT Rail Office
WashingtonAmtrak Trains
OregonAmtrak Trains
1994 1995 1996 1997 1998 1999 2000 2001 2002 2003
2003 data
50000
40000
30000
Measures Markers and Mileposts - December 31 2003 58
58 Measures Markers and Mileposts - December 31 2003
State-Supported Amtrak Cascades On-Time Performance 2003 vs 2002 Percent On-Time 2002 Average 708 2003 Average 719
Farebox Recovery The farebox recovery per train measures the percentage of total annual operating costs generated through ticket fares The average farebox recovery rate for the eight Amtrak Cascades trains financially supported by WSDOT was 399 percent in federal fiscal year (FFY) 2003 which was three points lower than in FFY 2002 This rate decline was driven by slightly lower revenues in FFY 2003 (-15 percent) when compared to the preceding year and a six percent increase in total operating expenses Costs that grew in FFY 2003 included diesel fuel and equipment insurance WSDOT and Amtrak hope that economic recovery in the Pacific Northwest will support higher revenue yields and improved farebox performance for Amtrak Cascades in 2004
King Street Station Update The renovation of King Street Station in downtown Seattle continued in the last quarter of 2003 Projects included final installation work on the temporary restrooms on the east side of the building construction work on replacement restrooms and removal of some interior walls on the first floor of the facility The elimination of these walls has exposed portions of the original interior walls and ceilings much of which has not been seen by visitors to the station in over 40 years The newly exposed sections inside the station will eventually become part of an enlarged passenger waiting area by Summer 2004
Washington Grain Train Update The Washington Grain Train carried 301 carloads of grain in the last quarter of 2003 This was 77 percent higher that in the final quarter of 2002 Quarterly growth was driven by slight increases in grain car usage by cooperatives near Moses Lake and Walla Walla and by the new grain train operating between Marshall and Pullman In 2003 the Washington Grain Train carried 1058 carloads a 21 percent increase over the total of 874 for 2002 The 2003 traffic increase was largely attributable to the third Washington Grain Train that began service in April 2003
The Washington Grain Train is a financially self-sustaining transportation program that supports the statersquos agricultural community while helping short line railroads maintain a sufficient customer base for long-term financial viability The 94-car fleet is jointly owned by WSDOT (76 cars) and the Port of Walla Walla (18 cars) The ports of Walla Walla Moses Lake and Whitman County share fleet management responsibilities
100
75
50
25
0
Jan Feb
Goal 80
2002
2003
Mar Apr May Jun Jul Aug Sep Oct Nov Dec
The on-time performance goal for Amtrak Cascades is 80 or better A train is considered on-time if it arrives at its final destination within 10 minutes or less of the scheduled arrival time
State Supported Amtrak Cascades Farebox Recovery Per Train
100
80
60
40
20
0
FFY 2002
FFY 2001
FFY 2003
Train 501 506 507 508 510 513 516 517 Number SEA PORT SEA PORT SEA BELL SEA VAN
to to to to to to to to PORT SEA PORT SEA VAN SEA BELL SEA
Source for above charts Amtrak and WSDOT Rail Office
Washington Grain Train Carloads Carloads Per Month 2002 vs 2003
2003 1058 carloads 140
120
100
80
60
40
20
0 Jan Feb Mar Apr May Jun Jul Aug Sep Oct Nov Dec
2002 874 carloads for 12 months
for 12 months
Source WSDOT Rail Office
Measures Markers and Mileposts - December 31 2003 59
Measures Markers and Mileposts - December 31 2003 61
Special Features Organic Recycling Earns Award for WSDOT The Washington Organic Recycling Council (WORC) presented WSDOT with an award December 11th for ldquofulfilling the vision of innovative application and specification of compost in Washington State roadside developmentrdquo Everyone benefits when organic materials are recycled into products of value These products improve the quality of landscape materials They have a positive impact in our environment by improving soil and plant health conserving water reducing erosion and reducing the use of fertilizers and pesticides They also replace other sources of wood for paper and fuel production
The award recognized in particular the work of the Roadside and Site Development Unit
WORC credits WSDOT with the use of one-third of the compost produced in the state For more information on good composting practices visit wwwcompostwashingtonorg
WSDOT Receives 2003 Federal Performance Letter ldquoReport Cardrdquo from FHWA Each year the Washington Division of the Federal Highway Administration (FHWA) audits WSDOTrsquos compliance with federal rules and regulations In summarizing this yearrsquos overall results the 2003 Performance Letter signed by FHWA Division Administrator Daniel M Mathis stated ldquoBased on the inspections reviews program evaluations and audits conducted in FY 2003 it is my finding that WSDOT has complied with federal laws and regulations in expending federal-aid highway funds allocated to the State of Washingtonrdquo
The performance letter evaluates WSDOTrsquos performance in 21 project and program areas such as bridge inspection standards financial billing environmental commitments and program efficiencies The letter called out a positive example of WSDOTrsquos work ldquoconstruction costs reported in the Gray Notebook are accurate and track closely with the data we have compiledrdquo In addition FHWA noted some areas for improvement such as ensuring all bridge inspections are completed within the 24 month frequency requirement using the pavement smoothness standard more consistently and establishing a tracking database to assure that environmental commitments are not affected by project changes
Mathis concluded the letter by commending WSDOT ldquofor continuing to strengthen your performance management initiatives such as the Gray Notebook your continued efforts in enhancing these tools provides further evidence that WSDOT is focused on being accountable for state and federal transportation fundingrdquo The 2003 Performance Letter can be found on-line at wwwwsdotwagovaccountabilityFHWA_FY2003_performancereportpdf
Global Positioning at WSDOT Surveyors have been using Global Positioning Systems (GPS) for years Most people are acquainted with non-survey level GPS technology as a navigational aid in their vehicles for wayfinding on a hike and even for keeping tabs on a child or family pet
WSDOT is using GPS to inventory the locations of roadway features such as signs guardrails pavement conditions trees utility devices drainage systems bridges traffic devices light poles etc It can accurately record the location of maintenance procedures such as mowing spraying or striping GPS is also being used for wetland delineation
In future editions of the Gray Notebook WSDOT will be presenting more detailed information on how GPS is being utilized
Measures Markers and Mileposts - December 31 2003 60
60 Measures Markers and Mileposts - December 31 2003
Highlights of Program Activities Quarter Ending December 31 2003
Project Starts Completions Updates bull WSDOT began on Dec 17 charging its contractor penalties of about $3000 per weekday for every day that opening of the State Route (SR) 290 Trent Avenue Bridge in Spokane was delayed Working days were re-negotiated and added to the projectrsquos contracted schedule in May 2003 when some unanticipated construction conditions were discovered At that time WSDOT approved a new schedule submitted by the contractor Ross Bros amp Co of Salem Oregon for a mid-December completion In late November it became apparent that Ross Bros was not going to be able to meet that schedule Penalties will be withheld from the final payment of the $89 million contract
bull The SR 519 (South Royal Brougham Way) project near the Seattle waterfront Safeco Field and Seahawk Stadium cleared a major hurdle when the old ramp from Fourth Avenue South to eastbound Interstate 90 was demolished The demolition contractors RW Rhine finished the task in 10 days This allowed WSDOT crews to re-open the vital I-5 and I-90 exits to Fourth Avenue South along with several major streets and intersections in the area The new structure created by this project separates vehicle pedestrian and rail traffic and provides a greater margin of safety for all
bull A series of late October storms dumped record setting rain severely damaging SR 20 in several locations causing the earliest closure of the North Cascades Highway ever Some of the worst damage occurred at Pyramid Creek (MP 126) and Ketchum Creek (MP 124) where large sections of roadway disappeared guardrail was left hanging and torrential rain rocks and dirt rendered large culverts useless WSDOTrsquos contractor Pacific Road and Bridge made progress stabilizing and rebuilding the roadway portions damaged by water and a primitive but passable road is now in place Crews will return next spring to lay down the final layer of asphalt However on November 9 a huge rockslide thundered down the mountainside just east of Newhalem slamming into Highway 20 taking out portions of roadway and cutting off access to the town of Diablo in Whatcom County URS Corporation the contractor monitoring and surveying the hillside has placed monitoring equipment on the unstable slope The instruments will indicate if the hillside is moving where it is moving and by how much This information is critical to keeping crews safe as they move in and out of the area
bull Crews installed several large steel girders across I-5 in Lynnwood in late November in association with the construction of Sound Transitrsquos Lynnwood Park amp Ride Direct Access Project The steel girders formed the skeleton of a new ramp over I-5 south of 44th Ave W which will provide direct access to and from the I-5 high-occupancy vehicle lanes for buses carpools and vanpools The project is currently on time and on budget with completion scheduled for fall 2005
bull SR 11 better known as Chuckanut Drive near Bellingham was closed after a large rockslide blocked the highway on Oct 29 Up to 60 tons of rock and debris came loose from the hillside above the roadway and crashed onto the highway blocking both lanes of traffic just south of Larrabee Park and north of Oyster Creek Crews worked seven days a week to stabilize the hillside to reopen the road to traffic on Nov 14
bull Crews on the SR 162 Voights Creek Bridge Replacement project near Orting are using some of the latest technology to protect the environment Because of the bridgersquos close proximity to a fish hatchery workers are using an oscillator to excavate the bridge shafts The oscillator twists as it presses the casing down into the ground minimizing disturbance to the surrounding environment In addition three 134-foot lsquosupergirdersrsquo will used to support the bridge deck In past bridge projects five to eight girders are typically used This new technology means less intrusion on water habitat and fewer maintenance requirements The $21 million replaces an aging wooden structure with a concrete bridge and realigns SR 162 to eliminate a high accident location Work is scheduled for spring 2004 completion
bull Three options to replace the SR 520 Floating Bridge are being explored They include a four-lane structure with shoulders wider lanes and a pedestrianbicycle lane a six-lane option that also adds a high-occupancy
SR 290 Trent Avenue Bridge as it appeared on Dec 4 The bridge had been slated for opening on Dec 16
Measures Markers and Mileposts - December 31 2003 61
Measures Markers and Mileposts - December 31 2003 63
vehicle lane in each direction and an eight-lane option that adds the elements of the six-lane and a general-purpose lane in each direction This fall WSDOT worked with divers to better identify objects on the floor of Lake Washington that could potentially affect the construction of a new bridge With at least $2 billion 15 years and a main connection across Lake Washington on the line WSDOT wanted to know all the impacts every step of the way to assure that time and taxpayer money are not wasted Preliminary side-scan sonar images showed three objects in the water some 1000 feet north of the current SR 520 Bridge Two objects appear to be barges The third object is a large boat estimated at 150 feet in length
bull WSDOTrsquos Aviation Division is participating in a project to install an irrigation system to support new turf growth at the Stehekin Airport near Lake Chelan Non-native plants growing on the airport runway have been the targets of a spray program paid for by the Aviation Division for years The National Park Service provided funding that allows the division to reseed the airport with a dense native grass to choke out the weeds About 20 pilot organizations volunteered to install the irrigation system The airportrsquos new turf will be ready for use next year and pilots will be able to operate from a smooth runway free of dust and gravel
bull Workers finished seismic retrofit work at the SR 20 Deception and Canoe Pass Bridges by installing 10000 bolts into the underside of the bridge decks The bolts connect the bridge decks to their supporting steel structures creating a connection that makes both bridges safer and more stable in the event of an earthquake Both bridges now meet current seismic codes
bull Just prior to the deluge of fall rains crews completed a $17 million paving project on SR 112 between the Makah Reservation and Hoko River Bridge in Clallam County Start of the job was delayed until August after young eagle fledglings near the project left their nest SR 112 was designated as a scenic highway in 2002 The highway terminates at Neah Bay on the northwest tip of the Olympic Peninsula and provides motorists access to one of the most remote areas of our state
Savings and Efficiencies bull A pilot project to compare the use of salt to the use of other anti-icing chemicals for improving winter driving conditions is being repeated An unusually mild winter weather in 2002-03 limited the amount of data collected and the initial study results did not show a clear-cut advantage to using one anti-icing product over another in all cases WSDOT is evaluating the use of rock salt and salt brine in comparison to other anti-icing chemicals to determine the effect on driving conditions corrosiveness to various types of metals impacts to the roadside environment and cost of snow and ice control This yearrsquos results will be combined with last yearrsquos for a complete report and made available to those who are interested
bull The National Association of State Aviation Officials (NASAO) named the WSDOTrsquos Aviation Division the ldquoMost Innovative Staterdquo of 2003 for developing an ldquoOn-line Pilot Registrationrdquo program The On-line Pilot Registration program began in January 2003 to improve customer service and streamline administrative processing WSDOT found that the improved service increased the number of pilots mechanics and aircraft owners who registered with the WSDOT Since the implementation of online registration revenues that support air search and rescue have increased more than $100000 Additionally over 4000 aviators have subscribed to the Aviation News Service which has improved communication between WSDOT Aviation and its customers
Rail bull The Federal Railroad Administration recently awarded $1 million to WSDOT for highway-rail grade crossing improvements The funds are designated for crossing improvements on the Pacific Northwest Rail Corridor in Cowlitz County and at several crossings between Marysville and Bellingham in Snohomish and Whatcom counties Washington is one of only ten states receiving funds The Pacific Northwest Rail Corridor extends 466 miles from Eugene Oregon via Portland and Seattle to Vancouver British Columbia
Materials for the airport project are barged across Lake Chelan
Measures Markers and Mileposts - December 31 2003 62
62 Measures Markers and Mileposts - December 31 2003
Public Transportation and Commute Trip Reduction bull WSDOT teamed up with local jurisdictions transit agencies and private companies to launch this yearrsquos Rideshare Weeks (Oct 13 ndash 24) an annual campaign encouraging commuters to incorporate carpooling vanpooling transit cycling and walking in their travel to work Flexing work hours and working from home or an alternate location also helped meet the campaignrsquos two major goals exposing commuters to their choices in transportation while saving space on the roads Rideshare Weeks was being featured in public service announcements donated by the Seattle Post-Intelligencer in radio spots in Puget Sound and Spokane and at worksites participating in the statersquos Commute Trip Reduction program WSDOT has coordinated with 16 public agencies to develop promotions and shared messaging For more information see wwwwsdotwagov partnerswsrorideshare bull On Tuesday October 21 WSDOT joined transportation providers at the Omak Senior Center to highlight new bus service in Okanogan County made possible through $460748 in state and federal public transportation grants WSDOT presented giant symbolic checks and a key for a new minibus to Colville Confederated Tribes Northwestern Trailways and Okanogan County Transportation
Awards and Recognition bull Linda Pierce of WSDOT Materials Lab and Steve Muench and Joe P Mahoney of the University of Washington have been awarded the national Premier Award sponsored by National Engineering Education Delivery System (NEEDS) for the new WSDOT Pavement Guide ndash Interactive The WSDOT Pavement Guide Interactive is now the official textbook for the primary pavement-oriented course in the UW Department of Civil and Environmental Engineering
bull WSDOT received the prestigious national leadership award from the Association for Commuter Transportation (ACT) for creating balanced transportation solutions that integrate commute options into highway planning projects in the Puget Sound region of Washington state WSDOT Transportation Demand Management (TDM) Resource Center has been heavily involved in research to determine ways to improve travel choices ndash such as vanpools carpools and bicycles ndash in transportation projects planning TDM focuses on reducing drive-alone auto trips by making other choices more available and attractive The ACT award recognizes that WSDOT is leading the way to incorporate alternatives to driving alone into new plans for transportation corridors such as State Route 520 and Interstate 405
bull WSDOT and the Department of General Administration received Governor Lockersquos Governorrsquos Award for Organizational Learning and Growth for the Deschutes Parkway Reconstruction Project The project was completed in October 2002 18 months after the Nisqually Earthquake destroyed major portions of Deschutes Parkway which surrounds Capitol Lake and links Tumwater to downtown Olympia RCI Construction Inc the project contractor contributed to an accelerated repair schedule and the project was completed many months earlier than first estimated and two months ahead of the contract schedule The completed project cost $698000 (16) less than the original engineerrsquos estimates Taxpayers saved an additional $525000 when a previously planned utility upgrade was completed at the same time as the road repairs instead of later This project changed the ways GA and WSDOT collaborate which is already saving money on other projects
Celebrations and Events bull Washington State Ferries (WSF) employees volunteered their time and skills to assist on the annual Special Peoples Holiday Cruise for the Puget Sound regionrsquos children and adults with special needs The event took place aboard the MV Puyallup and is sponsored by the Active Ferry Employees Charitable Trust (AFECT) The afternoon outing has been hosted by AFECT for almost 20 years No state funds are used The annual event is supported by donations of time and money including the Marine Corps Toys for Tots program Chevron Oil and Sodexho Corporation Many other local groups provide entertainment and support
bull WSDOT maintenance crews closed SR 410Chinook Pass on Monday Nov 17 and SR 123Cayuse Pass on Tuesday Nov 18 for the season due to heavy snowfall and snow slide danger Cayuse Pass connects Chinook Pass and White Pass at the east end of Mount Rainier National Park Cayuse and Chinook passes typically close for the season in November and reopen in April
bull Studded tires became legal in Washington on Saturday Nov 1 Studded tires are restricted in Washington due to the amount of wear and roadway damage they cause to state highways estimated at $10 million per year The tires are legal between November 1 and March 31 WSDOT is requesting legislative action to ban studded tires because of the damage and ruts they cause to highways and due to safety considerations Research shows that cars with studded tires take longer to stop than cars with other tires under most situations
Measures Markers and Mileposts - December 31 2003 63
Measures Markers and Mileposts - December 31 2003 65
Gray Notebook Subject Index
Edition Key 1 = Quarter 1 2001 2 = Quarter 2 2001 3 = Quarter 3 2001 4 = Quarter 4 2001 5 = Quarter 1 2002 6 = Quarter 2 2002 7 = Quarter 3 2002 8 = Quarter 4 2002 9 = Quarter 1 2003 10 = Quarter 2 2003 11 = Quarter 3 2003 12 = Quarter 4 2003
All editions can be accessed at wwwwsdotwagovaccountability
Topic Edition
Aviation Fuel Taxable Gallons 6Registrations of Pilots and Aircraft 6 10Training of Pilots and Mechanics 6
Benchmarks (RCW 4701012) Administrative Efficiency 9Transit Efficiency 9VMT per Capita 9
Bridge Conditions on State Highways Age of WSDOT Bridges 4Bridge Ratings (FHWA) Structurally Deficient and Functionally Obsolete 4Bridge Condition Ratings State Comparison 8Bridge Structural Condition Ratings 11Deck Protection Program Overview 4 5 8 11Deck Protection Program Planned vs Actual Projects 4 5 8 11Hood Canal Bridge Update 11Inspection Program 4 11Inventory of WSDOT Bridges 4 5 8 11Preservation Program Results 11Rehabilitation and Replacement Project Schedule 4 11Scour Mitigation 4 11Seismic Retrofit Program 1990-2020 Status 4Seismic Retrofit Program Planned vs Actual Projects 4 5 8 11Seismic Retrofit Program Top 10 Priority Bridges 4 8Steel Bridge Painting Planned vs Actual Projects 4 5 8 11Tacoma Narrows Bridge Update 8 9 10 11
Commute Trip Reduction Award for the Commute Trip Reduction Program 6 11Commute Mode Share in Washington State 1990 and 2000 7Commuting Trends at CTR Work Sites and Work Sites in General 4ldquoDrive Alonerdquo Commuting Rates State Comparison 6 7Eastgate Park and Ride Expansion 9Effectiveness of CTR Program (Biennial Results) 4Employer Participation Investment and Benefits 2Gasoline Consumption Per Capita (from Northwest Environment Watch) 7Park and Ride Lot Occupancy Rates Central Puget Sound 4Park and Ride Lot Occupancy Rates King County 3 5 6 7 8 9 10 11 12Park and Ride Lot Security 5Park and Ride Lot Puget Sound System 8Vanpool Operation in the Puget Sound Region 2 3 4 5 6 7 8 9 10 11 12Vanpooling Share of Daily Puget Sound Area VMT 2VanShare Trends 8 9 11 12
Congestion on State Highways Accidents on Interstate 405 2001 and 2002 9Benchmark Policy Goals for Congestion Analysis 5Congestion Measurement Principles 5 6Daily Vehicle Hours of Delay per Mile Sample Commutes Measured
by Delay Time of Day Distribution of Delay and Travel Rate Index 2 5Distribution of Traffic Between Freeways and Arterials 1999 to 2003 9Employment Puget Sound Region 9
Measures Markers and Mileposts - December 31 2003 64
64 Measures Markers and Mileposts - December 31 2003
Edition Key 1 = Quarter 1 2001 2 = Quarter 2 2001 3 = Quarter 3 2001 4 = Quarter 4 2001 5 = Quarter 1 2002 6 = Quarter 2 2002 7 = Quarter 3 2002 8 = Quarter 4 2002 9 = Quarter 1 2003 10 = Quarter 2 2003 11 = Quarter 3 2003 12 = Quarter 4 2003
All editions can be accessed at wwwwsdotwagovaccountability
Topic Edition Congestion on State Highways (continued)
Highway Improvements Can Improve Congestion 9Induction Loop Detectors 5Intelligent Transportation Systems in Washington State 5
2000 and 2003 9Traffic Speeds and Volumes on SR 520Traffic Volumes at Seven Locations in March 2000 to 2003 Average 9Traffic Volumes on Nine Puget Sound Region Corridors 5Travel Time Reliability 6 9Travel Time to Work Comparison State and County Rankings 5Travel Times on 11 Puget Sound Region Corridors 5 9Travel Times With and Without Incidents 6Typical Freeway Traffic Volume Trend 1993 to 2002 9
Construction Program for State Highways Advertisements by Subprogram Planned Actual amp Deferred 4 5CIPP Value of Advertised amp Deferred Projects by Subprogram 4 5Construction Program Cash Flow Planned vs Actual Expenditures 4 5 6 7 8 9 10 11 12Construction Program Delivery Planned vs Actual Advertisements 1 2 3 4 5 6 7 8 9 10 11 12Contracts Awarded Engineerrsquos Estimate to Award Amount 6 10Contracts Completed Final Cost to Award Amount 6 10Contracts Completed Final Cost to Engineerrsquos Estimate 6 10End-of-Season Highway Construction Project Evaluations 12FHWA Federal Performance Report Card 12Hood Canal Bridge Update 11 12Hot Mix Asphalt Pavement Delivery 3 5 7 9 11Lane Miles Added to State Highway System 1996-2001 2Safety Construction Program Planned vs Actual Advertisements 3 6 8 9 10 11 12Tacoma Narrows Bridge Update 8 9 10 11 12
Design Value Engineering 6 10
Environmental Stewardship Compost Use 7Construction Site Erosion and Runoff Protection 4 6 9 12ldquoEcology Embankmentrdquo Pollutant Removal 8Environmental Impact Statement (EIS) Tracking 9Environmental Compliance Assurance Tracking Violations 9 12Fish Passage Barriers 4Herbicide Usage Trends 5 8 12Organic Recycling Award for WSDOT 12Recycling Aluminum Signs 7Wetland Mitigation and Monitoring 5 9 12
Ferries (WSF) Capital Expenditure Performance Planned vs Actual 4 5 6 7 8 9 10 11 12Customer Comments 3 4 5 6 7 8 9 10 11 12Fare Comparison WSF to Other Auto Ferries 4Farebox Recovery Rate 5 12Farebox Recovery Comparison WSF to Other Auto Ferries and Transit 5Farebox Revenues by Month 3 4 5 6 7 8 9 10 11 12Life Cycle Preservation Performance Planned vs Actual 12On-Time Performance 3 4 5 6 7 8 9 10 11 12Operating Costs Comparison WSF to Other Ferry Systems 3Ridership by Month 3 4 5 6 7 8 9 10 11 12Trip Reliability Index and Trip Cancellation Causes 3 4 5 6 7 8 9 10 11 12
Measures Markers and Mileposts - December 31 2003 65
Measures Markers and Mileposts - December 31 2003 67
Edition Key 1 = Quarter 1 2001 2 = Quarter 2 2001 3 = Quarter 3 2001 4 = Quarter 4 2001 5 = Quarter 1 2002 6 = Quarter 2 2002 7 = Quarter 3 2002 8 = Quarter 4 2002 9 = Quarter 1 2003 10 = Quarter 2 2003 11 = Quarter 3 2003 12 = Quarter 4 2003
All editions can be accessed at wwwwsdotwagovaccountability
Topic Edition Maintenance of State Highways
Achievement of Biennial Maintenance Targets (MAP) 3 4 8 12Anti-Litter Campaign Update 5 11Costs of State Highway Maintenance 4Customer Satisfaction with WSDOT Highway Maintenance Activities 3Debris Pusher Maintenance Attachment 6Guidepost Driver 11Herbicide Usage Trends 5 8 12Highway Sign Bridges Planned vs Actual Repairs 3 4 6 8Highway Signs Number of Maintenance Actions 6 8Integrated Vegetation Management Update 5 12Litter Removal from State Highways 5 6 8 11Living Snow Fence on SR 25 9Mountain Pass Highway Closures 7 9Pavement Striping How Do They Paint the Stripes So Straight 6Pavement Striping Planned vs Actual Miles Painted 3 4 6 8Road Kill on State Highways 5Safety Rest Area Locations and Amenities 9Salt Pilot Project 7 10Snow and Ice Control Operations 4 7Survey on Pass Travel Conditions and Anti-Icer Use 2Survey on Safety Rest Areas 9Traffic Signals Annual Energy Costs and Incandescent Bulb Conversion 3Winter Overtime Hours and Snowfall Amount 7 9Winter Roadway Condition Level of Service and Anti-Icer Chemicals 9Winter Severity and Snow and Ice Operations Costs 9Vortex Generators 5
Pavement Conditions on State Highways ldquoDuerdquo Pavement Rehabilitation Needs 4 8Concrete Pavement Lane Miles by Age and Dowel Bar Retrofit Status 12Pavement Condition Trends 4 8 12Pavement Condition by Type 2Pavement Lane Miles Annual Vehicle Miles Traveled and Programmed Dollars 12Smoothness Rankings by State 4 8 12
Rail Freight Grain Train Carloads 5 6 7 8 9 11 12Grain Train Route Map 5 9Washington Fruit Express Car Loadings Per Week 5 8
Rail State-Supported Amtrak Cascades Service Amtrakrsquos Future 5 6 7 9Budget Update 10Capital Improvement Program and WSDOT Service Goals 2Customer Satisfaction 2 3 4 7 9 12 Farebox Recovery Percentage by Train 4 8 12Internet Reservations and Automated Ticketing 6Investment in Intercity Rail Comparison 5On-Time Performance 2 3 4 5 6 7 8 9 10 11 12Operating Costs 4Passenger Trips by Station 6Ridership by Month 2 3 4 5 6 7 8 9 10 11 12Ridership by Year Long-Term Trends 2 4 8Ridership Patterns by Segment (Seats Sold) 3Route Map Amtrak in Washington 6Station Update 11Vehicles Diverted Annually from Interstate 5 by Cascades 2
Measures Markers and Mileposts - December 31 2003 66
66 Measures Markers and Mileposts - December 31 2003
Edition Key 1 = Quarter 1 2001 2 = Quarter 2 2001 3 = Quarter 3 2001 4 = Quarter 4 2001 5 = Quarter 1 2002 6 = Quarter 2 2002 7 = Quarter 3 2002 8 = Quarter 4 2002 9 = Quarter 1 2003 10 = Quarter 2 2003 11 = Quarter 3 2003 12 = Quarter 4 2003
All editions can be accessed at wwwwsdotwagovaccountability
Topic Edition Safety on State Highways
Alcohol-Related Fatality Rate 12Before and After Collision Data for Highway Safety Improvement Projects 12Bicycle and Pedestrian Safety Federal Benchmark 9Bicyclist Fatality Rates State Comparison 9Cable Median Barrier Installation Before and After Collision Data 12Corridor Safety Program Results 8Driving Speeds on State Highways 4Fatal and Disabling Collisions Circumstances and Type 8Fatal and Disabling Collisions at Intersections Types of Collisions 9Fatal and Disabling Crashes and VMT percent change 3 7 11Fatalities Involving High Blood Alcohol Concentration State Comparison 7Fatality Rates State Highways All State Public Roads amp US 3 7 11Guardrail Retrofit Program 11High Accident Corridors and Locations by Region 4 High Accident Corridors and Locations Statewide 3Low Cost Safety Enhancement Program Planned vs Actual Projects 3 4 5Low Cost Safety Enhancement Program Sample Projects 4 6Pedestrian Fatality Rates State Comparison 8Pedestrian Factors in VehiclePedestrian Collisions 8Port Orchard Roundabout Before and After Collision and Injury Data 12Safety Construction Program Planned vs Actual Project Advertisements 3 6 7 8 9 10 11 12Safety Laws Booster Seats and Mandatory Seat Belts 5Safety Projects Completed This Quarter 7Seatbelt Use State Comparison 7 11Safe Routes to Schools 9 12
Traffic Operations on State Highways FHWA Self-Assessment 9Incident Response Calls Responded to by Region 2Incident Response Clearance Time Distribution 11 12Incident Response Clearance Times 2 3 4 5 8 9 10 11 12Incident Response Customer Comments 8Incident Response Economic Analysis 10Incident Response Non-Collision Response Types 8 9 10 11 12Incident Response Program Types of Responses Program Total 9 10 11 12Incident Response Program Types of Responses 15 to 90 Minute Incidents 9 10 11 12Incident Response Program Types of Responses Over 90 Minute Incidents 9 10 11 12Incident Response Service Actions Taken 7 10 11 12Incident Response Teams Go to the Olympics 5Incident Response Teams Location and Type 7Incident Response Timeline 6Incident Response Times 2 3 4 5Incident Response Total Number of Responses by Month 7 8 9 10 11 12Incidents with Clearance Times Over 90 Minutes 6 7 8 9 10 11 12Intelligent Transportation Systems in Washington State 5Joint Operations Policy Statement between WSDOT
and Washington State Patrol 5Service Patrol Contacts 3 4Spokane Interstate 90 Peak Hour Roving Service Patrol Pilot 5
Traveler Information Award for Traveler Information Web Site 11Calls to 1-800-695-ROAD and 5-1-1 8 9 10 11 12Camera Views 8Evaluation Survey 10Web Site Feedback 8 9Web Site Usage 7 8 9 10 11 12
Measures Markers and Mileposts - December 31 2003 67
Edition Key 1 = Quarter 1 2001 2 = Quarter 2 2001 3 = Quarter 3 2001 4 = Quarter 4 2001 5 = Quarter 1 2002 6 = Quarter 2 2002 7 = Quarter 3 2002 8 = Quarter 4 2002 9 = Quarter 1 2003 10 = Quarter 2 2003 11 = Quarter 3 2003 12 = Quarter 4 2003
All editions can be accessed at wwwwsdotwagovaccountability
Topic Edition Truck Freight
Cross Border Truck Volumes 6 10Freight Routes and Border Crossings in Washington 6 10Freight Shipments To From and Within Washington 10Impediments to Truck Shipping Bridges with Posted Weight Restrictions 6Improvement Projects with Freight Benefits 10Intelligent Transportation Systems Use for Trucks 6 10Managing Over-Sized Truck Loads 6OsoyoosOroville Border Facts 10Overdimensional Trucking Permits 6Revenue Prorated to Washington for Trucks in Interstate Use 6 10Truck Registrations in Washington 6Truck Share of Total Daily Vehicle Volumes 6
Workforce Accident Prevention Activities 3 4 5 6 7 8 9 10 11 12Ferry Vessel Workers Recordable Injuries 2 3 4 5 6 7 8 9 10 11 12Highway Engineer Workers Recordable Injuries 2 3 4 6 7 8 9 10 11 12Highway Maintenance Workers Recordable Injuries 1 2 3 4 5 6 7 8 9 10 11 12Highway Maintenance Workers Safety Training 5 6 7 8 9 10 11 12Human Resources Training for all WSDOT Employees 7 8 9 10 11 12North American Association of Transportation Safety and Health Officials Meeting 3Workforce Levels 5 6 7 8 9 10 11 12
Measures Markers and Mileposts - December 31 2003 68
68 Measures Markers and Mileposts - December 31 2003
Americans with Disabilities Act (ADA) InformationPersons with disabilities may request this information be prepared and
supplied in alternate formats by calling the Washington State Department of Transportation ADA Accommodation Hotline collect (206) 389-2839
Persons with hearing impairments may access Washington State Telecommunications Relay Service
at TTY 1-800-833-6388 Tele-Braille 1-800-833-6385 Voice 1-800-833-6384 and ask to be connected to (360) 705-7097
Civil Rights Act of 1964 Title VI Statement to Public Washington State Department of Transportation (WSDOT) hereby
gives public notice that it is the policy of the department to assure full compliance with Title VI of the Civil Rights Act of 1964 the Civil Rights
Restoration Act of 1987 and related statutes and regulations in all programs and activities Persons wishing information may call the WSDOT
Office of Equal Opportunity at (360) 705-7098
Other WSDOT Information Available The Washington State Department of Transportation has a vast amount
of traveler information available (including Puget Sound area traffic mountain pass reports highway closures ferry schedules and more)
Call the WSDOT statewide toll-free number 1-800-695-ROADIn the Seattle area (206) DOT-HIWY [368-4499]
For additional information about highway traffic flow and cameras ferry routes and schedules Amtrak Cascades rail and other transportation
operations as well as WSDOT programs and projects visitwwwwsdotwagov
For this or a previous edition of the Gray Notebook visit wwwwsdotwagovaccountability
0401-0004
- Cover
- Credits
- Table of Contents
- Beige Pages
-
- Project Reporting on the 2003 Transportation Funding Package
- Current Project Highlights and Accomplishments
- Project Delivery
- Financial Information
- Program Management Information
-
- Worker Safety Quarterly Update
- Workforce Levels and Employee Training Quarterly Update
- Highway Construction Program Quarterly Update
- Tacoma Narrows Bridge Project Update
- Hood Canal Bridge Project Update
- Highway Safety Improvement Projects Quarterly Update
- Asset Management Pavement Assessment Annual Update
- Highway Maintenance Annual Update
- Environmental Programs
- Incident Response Quarterly Update
- Traveler Information Quarterly Update
- Options to Drive Alone Commuting Quarterly Update
- Washington State Ferries Quarterly Update
- State-Supported Amtrak Cascades Service Quarterly Update
- Special Features
- Highlights of Program Activities
- Gray Notebook Subject Index
-

Beige Pages - Measures Markers and Mileposts - December 31 2003 3
Roadmap to On-line Project Information The diagram below is a roadmap to the information found on-line The on-line version of the Gray Notebook as well as the Home Page will have ldquohot linksrdquo to the individual Project Pages
Gray Notebook
Home Page
Project Information Roadmap
Project Page Project Pages will report on all WSDOT 2003 Transportation Fund projects Project Pages provide detailed information that is updated regularly
bull Overall Project Vision bull Financial Table bull Funding Components bull Roll-up Milestones bull Roll-up Cash Flow bull Contact Information bull Maps and Links
bull Highlights bull Milestones bull Status Description bull Problem Statement bull Risk Challenges bull Project CostsCash Flow bull Contact Information
QPR Quarterly Project Reports will summarize quarterly activities
Project Pages
Project Pages contain information on all aspects of a specific project An existing Project Page is shown at right
Project Pages provide details on overall project vision funding components financial tables milestones status description problem discussions risk challenges forecasting maps photos links and more
WSDOT has approximately 140 Project Pages that are currently providing on-line updates
A summary of the information found on a Project Page will be provided in a Quarterly Project Report (QPR) that WSDOT anticipates will be accessible through a link on the Project Page
Project pages are to the best of WSDOTrsquos ability regularly updated
Project pages can be found at wwwwsdotwagovprojects
Beige Pages - Measures Markers and Mileposts - December 31 2003 2
2 Beige Pages - Measures Markers and Mileposts - December 31 2003
Current Project Highlights and Accomplishments This is WSDOTrsquos third report of quarterly developments in the delivery of the program of projects under the 2003 Transportation Funding Package
The following project information is gathered from a variety of sources within WSDOT and is principally the responsibility of the various regional administrators and their project teams As a regular part of its project management and accountability strategy for the legislaturersquos 2003 Transportation Funding Package a team of senior WSDOT managers from Olympia meets in each region each quarter to perform due diligence on progress and status for each project and to offer assistance support and coordination of issues or problems arising with any project This process also facilitates the ability of headquarters staff to discuss project status with members and staff of the House and Senate and to report from first hand knowledge about the projects to the Transportation Commission
Contract Advertising and Awards
2003 Transportation Funding Package (ldquoNickel Fundsrdquo) Nine projects were planned to be advertised this quarter Seven of these projects were advertised as planned One project was advanced for advertisement Two projects were deferred for later advertisement
Projects Advertised as Planned
SR 9SR 528 Intersection ndash Signal
This project went to ad October 20 2003 The construction is now starting and the project is expected to proceed on schedule
SR 16 HOV Improvements between Olympic View Drive and Union Ave
This project consists of three construction phases The first contract 6th AvenuePearl Street (SR 16) to Jackson Avenue was advertised to bidders on schedule in mid-November 2003 with this first phase construction to be awarded in mid-January 2004 This construction phase will widen SR 16 to prepare for HOV lanes provide a new trail for bikes and pedestrians and rehabilitate the pavement on SR 16 mainline to accommodate traffic switches needed for phase 2 of the project The contractor will begin grading work in Spring 2004 and is expected to complete its work in Winter 2004
US 97A Entiat Park Entrance - Turn Lanes
This project was advertised on schedule and was awarded on December 15 2003 This project was combined with a ldquonon-nickelrdquo funded roadway preservation project US 97AWenatchee North - Paving Combining this project resulted in a cost savings of $80000 The contractor will begin construction in April 2004 and is expected to be completed in July 2004
SR 124 East Jct SR 12 ndash Reconstruction
This project improves safety on SR 124 east of Pasco by realigning a horizontal curve and widening the lanes and shoulders The contract was advertised for bids on December 8 2003 meeting the schedule to proceed to bid opening on January 14 2004 The improvements are scheduled be open to traffic by summer 2004
SR 161 234th Street to 204th Street E
This project consists of two construction phases The first contract 234th Street East to 204th Street East was advertised to bidders in early November 2003 and awarded to the low bid contractor on December 22 2003 This construction phase will widen SR 161 from one lane to two lanes in each direction The contractor will begin grading work on the new highway in Spring 2004 and this phase is expected to be completed in July 2006
Beige Pages - Measures Markers and Mileposts - December 31 2003 3
Beige Pages - Measures Markers and Mileposts - December 31 2003 5
SR 203 NE 124thNovelty Rd Vic
The project was advertised on schedule However the total project cost has increased by approximately $900000 due to additional right of way and preliminary engineering costs to accommodate King Countyrsquos strict flood plain ordinance This project is funded with pre-existing funds the 2003 Transportation Funding Package and King County and Developer contributions $254000 of the cost increase will have to be accommodated from the 2003 Transportation Funding Package
US 395 Kennewick Variable Message Sign
This project improves safety on US 395 by installing a variable message sign camera and traffic sensor north of the Blue Bridge to warn southbound traffic of congestion and accidents ahead The contract was advertised for bids on schedule on December 1 2003 The bid opening is scheduled for January 14 2004 and the improvements should be placed in use for traffic by summer 2004
Project Advanced for Advertisement
SR 527 132nd SE to 112TH SE (Additional Lanes)
The advertisement date was advanced from March 2005 to December 2003 to coordinate with the availability of funds planned for the project from other sources avoid redesign for changes in stormwater treatment requirements and meet a commitment to Boeing The contract award date is February 25 2004
Projects Deferred for Later Advertisement
SR7SR 507 to SR 512 ndash Safety
The December 2003 contract advertisement date for this project has been delayed until obstacles in right of way acquisition can be cleared WSDOT believed that right of way would be obtained from property owners for a December ad date However the department has received 18 requests for adjudicative hearings from property owners adjacent to the project Additional time will be required to prepare detailed surveys title searches and coordinate scheduling with the Attorney Generalrsquos Office for each of the hearings WSDOT is focused on completing negotiations with the property owners and anticipates advertising the project in spring 2004 with construction starting no later than the summer of 2004
SR 522I-5 to SR 405 Multi-Modal Project
To take advantage of coordinating work with Lake Forest Park in conjunction with the needs of WSDOT the advertisement date would slip from winter 2003 to spring 2006 The 2003 Transportation Funding Package provided the entire project funding in the construction phase The changes will result in shifting $2 million in expenditures from the 03-05 to 05-07 biennium This project is part of an integrated program of corridor improvements where WSDOT will coordinate portions of this project with other improvements which will be funded and constructed by local municipalities such as Seattle Kenmore Lake Forest Park and Bothell
Beige Pages - Measures Markers and Mileposts - December 31 2003 4
4 Beige Pages - Measures Markers and Mileposts - December 31 2003
Project Completions and Other Highlights
Construction Highlights
Several of the highway and rail projects funded by the Nickel Account are now in construction More details can be found in the respective on-line Project Pages at wwwwsdotwagovprojects
Highway Construction Program
I-5 Widen Each Direction From Salmon Creek to I-205
The contractor is currently constructing retaining walls necessary for the widening of the southbound lanes Work is continuing on the temporary widening using a detour bridge in preparation for a traffic shift that will allow construction of the northbound lanes The traffic shift is expected to occur in May 2004 The construction schedule identifies the first weekend closure to demolish the existing NE 129th St structure on the weekend of January 31 2004 The new NE 129th St structure is scheduled to be completed in five months
I-90 Build Lanes from Argonne to Sullivan Road
The contractor met the November 1 2003 milestone to have the temporary westbound lanes constructed and open to traffic Although the project was suspended October 31 2003 for the winter work is continuing on minor items such as drainage ponds Road work will restart as soon as weather conditions permit
I-90 Highline Canal to Elk Heights ndash Truck Passing Lanes
This project constructs a truck climbingpassing lane on eastbound I-90 east of the Indian John Hill Rest Area Work on the project was suspended for the winter on November 20 2003 due to snow and cold temperatures Prior to suspending work the contractor had completed clearing the land in preparation for the widening of the roadway Ninety percent of the embankment excavation and drainage has been completed The left side bridge rail replacement on the Highline Canal bridge is complete To date project completion status is at about 30 Work will resume as weather conditions permit
I-90 Ryegrass Summit to Vantage ndash Truck Passing Lanes
This project constructs a truck climbingpassing lane on westbound I-90 from Vantage to the top of Ryegrass Summit Due to winter conditions work by the contractor was suspended on November 14 2003 Nearly one mile of the additional lane and modifications to the Ryegrass Rest Area ramps are completed and already open to traffic WSDOT survey crews will continue to work preparing for the next construction season as weather permits It is anticipated that the contractor will resume work in March 2004
SR 500 NE 112th Avenue Interchange
This project constructs a new interchange on SR500 at NE 112th AvenueGher Road All utility relocations are now complete and traffic was shifted to temporary lanes during a weekend closure on November 2 2003 (one day ahead of schedule) The bridge footings and columns have been constructed as planned for the eastbound ldquofly-overrdquo bridge with girder placement expected to occur in a three night sequence in mid January 2004 The placement of the noise barrier along the I-205 ramp has started with a scheduled completion of April 2004
Beige Pages - Measures Markers and Mileposts - December 31 2003 5
Beige Pages - Measures Markers and Mileposts - December 31 2003 7
Other Capital Programs
Purchase Oregon Train Set
A purchase agreement to complete this important rail rolling stock acquisition project in the 2003 Transportation Funding Package was executed between WSDOT and Talgo Inc on November 26 2003 Talgo will now paint the outside of the cars to match those already in the fleet The purchase will allow for additional rail passenger service between Seattle and Portland upon completion of track improvements
Tacoma RMDRR Morton Line Repairs ndash Phase 2
This project will complete the necessary repairs to the rail line between Frederickson and Morton to restore rail service interrupted by the 1996 flood Construction of a portion of this project for immediately needed repairs began in July 2003 and was completed in mid-December 2003 The remainder of the construction project will be accomplished under separate agreement with the City of Tacoma (owner) scheduled to begin in early 2004 It is anticipated that the entire project will be completed before the end of the current biennium
Highlights of Projects Ready for Advertisement for 2004 Construction Season
Five of the highway projects in the 2003 Transportation Funding Package are scheduled for advertisement in the two quarters for January 1 2004 to June 30 2004 (the 3rd and 4th quarter of the 03-05 biennium) More details can be found in the respective on-line Project Pages at wsdotwagovprojects The status of these projects is described below Two projects that were scheduled for advertisement during this time frame were deferred to future quarters (the status of these projects are described below)
I-5 2nd Street Bridge (ad date 452004)
The current proposal is to assist traffic flow by reducing construction from two seasons to one No change in total project cost is anticipated The project is expected to be advertised as scheduled
SR7SR 507 to SR 512 ndash Safety (ad date 532004)
The ad date for this project in December 2003 was not met because of complications that arose in the right of way taking May 2004 is the rescheduled ad date that WSDOT hopes to meet if negotiations with property owners can be completed in time
I-90 Cle Elum River Bridge (ad date 31504)
Environmental documentation is complete and approximately 80 of the design is finished The scheduled advertisement date is expected to be met and pre-construction start date is expected to be May 2004
SR 304SR 3 to Bremerton Ferry Terminal (ad date 21704)
This project reconstructs and widens the existing roadway It will add HOV lanes to increase traffic movement The City of Bremerton is the lead agency for this project
WSDOTrsquos role is primarily to assure the administration of the funding provided for in the 2003 Transportation Funding Package WSDOTrsquos expectation is that the City of Bremerton will advance the projectrsquos scheduled advertisement date The estimated construction completion date is June 2006
SR 509 Design amp Critical Right-of Way (ad date 672004)
Construction funds are being transferred to the City of SeaTac which is the lead agency on this phase of the project Environmental permitting and stormwater designs are being developed by WSDOT and are on track to support the scheduled ad date and budget WSDOT expects that the City of SeaTac will meet the scheduled ad date The project is on schedule and within the established budget
Beige Pages - Measures Markers and Mileposts - December 31 2003 6
6 Beige Pages - Measures Markers and Mileposts - December 31 2003
SR 9 Nooksack Road to Cherry Street (ad date 604)
This project was originally scheduled for advertisement in June 2004 but that date has had to be adjusted (is now set for October 2005) because of new geotechnical information requiring design revisions that in turn have led to a larger-than-originally-expected right of way acquisition program Construction cost savings however are also expected to result
SR 161 204th Street to 176th Street (ad date 2904)
The project was originally scheduled for advertisement in February 2004 but that ad date has had to be adjusted (is now set for November 2004) due to real estate acquisitions that have taken longer than expected and to avoid work zone traffic control issues by constructing the entire four miles at the same time WSDOT is coordinating access revision with local developers along the corridor and is currently nearing completion of the design and real estate acquisition phase
Beige Pages - Measures Markers and Mileposts - December 31 2003 7
Beige Pages - Measures Markers and Mileposts - December 31 2003 9
Project Delivery
Proposed Adjustments to Delivery Planning
Meeting schedule budget and scope expectations are important elements in WSDOTrsquos delivery of the projects in the 2003 Transportation Funding Package Planning and design activities for specific projects sometimes identify the need to make adjustments to construction delivery spending schedules Some of these adjustments will have no impact on critical start or completion dates Others may require adjustments to critical dates
The information in this report describes changes that WSDOT has concluded as desirable based on assessments made in the quarter under review ending December 31 2003
Highway Construction Program
US 2 Peshastin East Interchange
The spending plan for this project should be revised based on the Value Engineering Study done in August 2003 and the Cost Risk Assessment done in July 2003 The spending plan for this project has been reduced $88 million to a total of $165 million This is a cost savings of 35 from the budget amount WSDOT also has a plan to reduce the construction phase of the project by two years from three years to one year while maintaining the planned advertisement date of September 4 2009
I-5SR 502 Interchange and Corridor Widening
WSDOT has the opportunity to make advance purchases of Right of Way from property owners that have expressed interest in selling now Purchasing Right of Way at this time benefits both the sellers and the WSDOT in that sellers will be able to know what affect the project will have on them and be fairly compensated and early acquisition lessens the risk of land development increasing land value In order to accelerate this preliminary design and RW work WSDOT is requesting to advance $1000000 for RW and $200000 for Preliminary Engineering into the 0305 biennium The advancement of funds will not increase the total project cost
I-5 Noise Wall
This project was removed from the September 30 2003 Watch List The project is in Seattle near the end of SR 520 and Roanoke Street Previously WSDOT reported that cost and schedule for this project were being reviewed to allow for completion of the design and may result in an ad delay With the review complete and design underway the project will be advertised in early summer 2004 with a construction start in late summer
I-5SR 526 TO US 2 (Marine View Dr) HOV Lanes
WSDOT proposes to advance the advertisement date from March 2008 to October 2007 to ensure that work begins in the spring of 2008 to take full advantage of the 2008 construction season In addition WSDOT is proposing to advance $4 million into the 2003-2005 biennium in order to accelerate design work This acceleration would put WSDOT in a position to further accelerate this project for the benefit of the 2010 Olympics if the Legislature should decide to advance funding for construction (see Opportunities and Options for Legislative Consideration section of this report)
SR 7SR 507 to SR 512 ndash Safety
The December 2003 contract advertisement date for this project has been delayed until right of way access issues can be resolved WSDOT believed that right of way would be cleared with property owners for a December ad date However the Department has received 18 requests for adjudicative hearings from property owners adjacent to the project Additional time will be required to prepare detailed surveys title
Beige Pages - Measures Markers and Mileposts - December 31 2003 8
8 Beige Pages - Measures Markers and Mileposts - December 31 2003
searches and coordinate scheduling with the Attorney Generalrsquos Office for each of the hearings WSDOT is focused on completing negotiations with the property owners and anticipates advertising the project in spring 2004 with construction starting no later than the summer of 2004
SR 9 Nooksack Road to Cherry Street
This project will have an ad date shift from June 2004 to October 2005 to account for an increase in the number of right of way parcels that must be acquired The total cost of the project remains the same as the construction estimate has decreased
SR 16 HOV Improvements ndash Olympic View Drive to Union Avenue
The third construction phase of this project 36th Street to Olympic Drive NW would be advanced two or three quarters to allow more flexibility for planning and implementing traffic switches needed to accommodate the opening the new Second Tacoma Narrows Bridge This third and final construction phase will complete continuous HOV lanes on either side of the Tacoma Narrows from the Sprague Avenue Interchange in Tacoma to the Olympic Drive Interchange in Gig Harbor by spring 2007 Moving the construction start date of this phase from spring 2005 to fall 2004 will not affect the overall cost of the project
SR 20 Quiet Cove Road Vic to SR 20 Spur
In the September 30 2003 Gray Notebook this project was listed on the Watch List At that time WSDOT reported the advertisement date for this project may be delayed to provide time for right of way acquisition and to resolve environmental mitigation issues Currently the advertisement date would slip by nine months from February 2006 to November 2006 which will result in shifting $3 million in projected Nickel Fund expenditure from the 05-07 to 07-09 biennium
I-90 Two-Way Transit and HOV
This Seattle to Mercer Island project is currently funded for design by Sound Transit FHWA and WSDOT and is dependent on Regional Transportation Investment District (RTID) and other sources of funding for construction Should RTID funding become available WSDOT proposes the advertisement date be delayed thirteen months from December 2004 to January 2006 to allow time for the issuance of the draft Environmental Impact Statement This will allow the design to be completed in October 2005 There is no change in the expected project cost However $1 million in projected Nickel Fund expenditures would need to be shifted from the 03-05 biennium to the 05-07 biennium
SR 99 S 284th to S 272nd St HOV Lanes
This project will include a HOV lane and 2 general-purpose lanes in each direction a median sidewalk and planter strip The updated cost estimate for right-of-way acquisition is $51 million this is an increase from the previous estimate of $3 million to account for the potential of higher cost of condemnation The advertisement date would be delayed from December 2005 to April 2006 to correct the record of survey which identify property ownership WSDOT is currently working with the City of Federal Way to minimize the right-of-way cost by eliminating some of the proposed landscaping areas
SR 161 Corridor Improvements ndash 204th Street E to 176th Street
There are multiple stages to this project Stage 1 (234th to 204th) was advertised in November 2003 The proposal is to adjust cash flow and delay the advertisement date of Stage 2 (204th to 176th) from November 2003 to November 2004 This action will reduce traffic impacts and help right of way acquisition These changes should not change the total project cost
Beige Pages - Measures Markers and Mileposts - December 31 2003 9
Beige Pages - Measures Markers and Mileposts - December 31 2003 11
SR 203 NE 124thNovelty Rd Vic
The project was advertised on schedule However the total project cost has increased by approximately $900000 due to additional right of way and preliminary engineering to accommodate King Countyrsquos strict flood plain ordinance This project is funded with pre-existing funds the 2003 Transportation Funding Package and King County and Developer contributions About $250000 of the expected cost increase will come from the 2003 Transportation Funding Package
SR 520 W Lake Sammamish Parkway to SR 202 (Additional Lanes)
Cash flow adjustment to match actual design right of way and construction schedules No change in advertisement date of October 2008
SR 522I-5 to SR 405 ndash Multi-Modal Project (Nickel)
To take advantage of coordinating work with Lake Forest Park in conjunction with the needs of WSDOT partners the advertisement date would slip from winter 2003 to spring 2006 to take advantage of coordinating work with Lake Forest Park The 2003 Transportation Funding Package provided the entire project funding in the construction phase The changes will result in shifting $2 million in expenditures from the 03-05 to 05-07 biennium This project is part of an integrated program of corridor improvements where WSDOT will coordinate portions of this project with other improvements which will be funded and constructed by local municipalities such as Seattle Kenmore Lake Forest Park and Bothell
For financial information on the Proposed Adjustments to Delivery Planning ndash Highway projects please refer to the table on page 16
Other Capital Programs The following six proposed project changes have interrelated funding and impact one another
Palouse River and Coulee City Railroad Acquisition
Depending on a finding of cost effectiveness that the Legislature instructed be made by the Transportation Commission WSDOT would purchase 302 miles of the Palouse River and Coulee City Railroad preserving the statersquos largest short-line railroad that carries 20 percent of the statersquos grain crop The original proposed budget has been reduced by $322000 after further cost estimate review If the conclusion of WSDOTrsquos review of the proposed purchase of this railroad is favorable the purchase will be completed with this decrease in the adjusted budget
Port of Columbia Railroad Improvements (New Project Title)
After further engineering review and scope refinement the following three projects are combined and overall reduced in scope to reflect actual improvements needed to maintain railroad service on this section of track
The original project Port of Columbia Railroad Improvements ndash funds general railroad improvements on the 39-mile line Based on further engineering reviews the original scope for this project has been reduced from a full rebuild of the line to a less expensive rehabilitation of the line that will still provide an adequate level of service to the rail line customers The proposed change will be combined with two additional projects listed in the 2003 Funding Package (the Blue Mountain Railroad Upgrade project which rebuilds 30 miles of track from Wallula to Walla Walla and the Port of Columbia Co Dayton Upgrades project which funds improvements to port rail facilities) into a single project with a total budget of $53 million as compared to the originally combined project budgets of $13 million
Beige Pages - Measures Markers and Mileposts - December 31 2003 10
10 Beige Pages - Measures Markers and Mileposts - December 31 2003
Port of Columbia Dayton Upgrades and Blue Mountain Railroad Upgrade
These projects fund improvements to port rail facilities and rebuilding 30 miles of track from Wallula to Walla Walla It is proposed that these projects be combined with Port of Columbia Railroad Improvements project as described above The original intent of both projects will still be accomplished at a reduced cost
Palouse River and Coulee City Cheney-Coulee-Pullman Upgrade (New Project Title)
After further engineering review and scope refinement two projects (Palouse River and Coulee City Cheney to Coulee Upgrades and Rural Elevator Track Expansion) are combined Also engineering analysis suggests the need for scope change to include upgrades of PRampCC lines in Whitman County
The original project (Palouse River and Coulee City Cheney to Coulee Upgrades) would have funded repairs to numerous railroad bridges in Grant and Lincoln Counties and upgrade track to accommodate 286000-pound freight cars It would also improve the rail line between Coulee City and Cheney The proposed change will combine these upgrades with projects in Whitman Co that were identified by WSDOT in the summer of 2003 Further the scope of the work from the Rural Elevator Track Expansion project (additional track at rural elevators and shortline mainline connections) will also be combined into this expanded scope The proposed scope will be completed within the overall total of $21089000 specified for the projects in aggregate
For financial information on the Proposed Adjustments to Delivery Planning - Rail projects please refer to the table on page 17
Opportunities and Options for Legislative Consideration
The following projects were reported as requiring legislative guidance in June 2003 and continue to be offered for legislative consideration Details on the projects are found in the Gray Notebook for June 30 2003
I-5SR 526 TO US 2 (Marine View Dr) HOV Lanes
The question remains on whether the construction schedule for this project should be advanced so that the project can be completed prior to the 2010 Winter Olympic Games
WSDOT has developed two accelerated schedule options for legislative consideration Option one is to accelerate the project schedule and advertise it for construction bids in March 2006 using the common ldquoDesign-Bid-Buildrdquo practice This option will result in an open to traffic date of 2010 Option two is to accelerate the project schedule and advertise by July 2005 using the ldquoDesign-Buildrdquo method This option will result in an open to traffic date of 2009 and is WSDOTrsquos preferred option The expenditure plan reflects the ldquoDesign-Buildrdquo option
SR 99 Alaskan Way Viaduct
The project replaces the seismically vulnerable Alaskan Way Viaduct and seawall in downtown Seattle The Gray Notebook for September 2003 identified the need to begin design in the summer 2004 as essential to remain on schedule to meet the proposed 2008 start of construction The project has moved money from one phase to another in 2003-2005 with zero dollar change to the bottom line By making this adjustment restoring right of way and increasing PE in the 05-07 biennium The project remains on the accelerated pace that will allow construction to begin in 2008 but not unless funding issues can be resolved
Beige Pages - Measures Markers and Mileposts - December 31 2003 11
Beige Pages - Measures Markers and Mileposts - December 31 2003 13
I-405 Congestion Relief and Bus Rapid Transit Projects
WSDOT proposes revising the I-405 Nickel project sequence to be Kirkland Stage 1 Renton Bellevue and Kirkland Stage 2 The Kirkland Stage 1 project addresses a known congestion hot spot that has a very high benefitcost ratio with work that can be incorporated into future RTID projects This schedule revision allows a project to be constructed and opened to traffic earlier than the original sequence The revision also allows the Renton project the opportunity to combine Nickel funds with Regional Transportation Improvement District (RTID) funds in a larger more cost-effective project should RTID funds become available
SR 522 Bothell ndash UW Campus Access
Should WSDOT use the Nickel expenditure authority for this project since the funding from the lead funding partners did not materialize and WSDOTrsquos budget for the project is insufficient to construct the project This was identified in the September 30 2003 Gray Notebook
SR539I-5 AccessImprovements Ten Mile Road to International Boarder
The question remains on whether the construction schedule for this project should be advanced so that the project can be completed prior to the 2010 Winter Olympic Games
Widening the remaining section of the ldquoTen Mile Roadrdquo will require the project be funded in a future budget appropriation The Nickel funding will provide for preliminary engineering environmental analysis and selection of a project plan for a new connection between I-5 and SR 539 Completing the final design right of way and construction of the project will however require new funding
D Street Grade Separation
The question remains whether the cash flow of this project be advanced into the 03-05 biennium from the 05-07 biennium to enable construction to be accomplished with other stages of this project
The Gray Notebook for September 30 2003 suggests that the 03-05 Supplemental Budget include a $35 million increase in the Program Z appropriation within the Multimodal Account
For financial information on the Opportunities and Options for Legislative Consideration please refer to the table on page 17
ldquoWatch Listrdquo Projects Cost and Schedule Concerns Watch List WSDOT is watching some projects closely for warning that changes in cost schedule or scope may be at risk due to developments and discoveries during the project delivery process in some cases these changes are outside the control of WSDOT Currently the information regarding the changes for these projects are in the early stages and making a conclusion based on this information may not
Watch List
achieve the desired result
Projects Removed from the September 30 2003 Gray Notebook Watch List
SR 3 to SR 303 Interchange Waaga Way
Removed from the Watch List Concerns had been raised that several issues in the design concepts developed in 1995 now necessitating coordination with Kitsap County might require delay of the scheduled ad date in Spring 2005 These issues have now been successfully addressed ndash reducing the
Beige Pages - Measures Markers and Mileposts - December 31 2003 12
12 Beige Pages - Measures Markers and Mileposts - December 31 2003
number of traffic signals reducing the volume of pavement increasing traffic volume capacity and minimizing impacts on local adjacent ball fields Project progress now supports both the originally scheduled ad date and the project budget
I-5 Noise Wall
See Proposed Adjustments in delivery planning Removed from the Watch List Previously WSDOT reported that the need to prepare design for the project would lead to delay in the schedule originally set by the legislature With the review complete and design underway the project has now been scheduled to advertise in early summer 2004 with construction work to begin during the summer
SR 20 Quiet Cove Road Vic to SR 20 Spur
See Proposed Adjustments in delivery planning Removed from the Watch List This project has moved to Proposed Adjustments in the Gray Notebook WSDOT reported the need to delay the advertisement date for this project might be delayed to provide additional time to acquire environmental approvals necessary for right of way acquisition The current plan is to slip the advertisement date by nine months from February 2006 to November 2006 in order to provide adequate time to resolve environmental mitigation issues and acquisition right of way This delay will result in shifting $3 million in Nickel funding expenditure from the 05-07 to 07-09 biennium
SR 99 S 284th to S 272nd St HOV Lanes
This project has moved to proposed adjustments in the Gray Notebook Removed from the Watch List The updated cost estimate for right-of-way acquisition is $51 million This is an increase from the previous estimate of $3 million and has been factored in to the project to account for the potential higher cost of condemnation Advertisement date will be delayed from December 2005 to April 2006 in order to correct the record of survey to identify property ownership
SR 161 Jovita Blvd to S 360th St
Removed from Watch List In the September 30 2003 Gray Notebook this project was on the Watch List for potential design changes from increased costs and delayed construction due to environmental and air quality provisions that have become more stringent while waiting for funding to be approved The air quality analysis has now been completed and there will be no impact to the project as a result The NEPA re-evaluation is still in progress and WSDOT anticipates the report to be finalized in January 2004 and approved shortly thereafter
SR 203 NE 124thNovelty Rd Vic
See Proposed Adjustments to Project Delivery and Contract Advertising amp Awards Removed from Watch List Previously WSDOT reported that arriving at a new floodplain mitigation site might have implications for cost and schedule The project was advertised on schedule but the project costs for additional engineering and right of way acquisition increased by a total of $900000
US 395 North Spokane Corridor (Francis Avenue to Farwell Road)
Removed from Watch List This was a ldquoWatch Listrdquo project in the last quarterrsquos report because of concerns over obstacles in the acquisition of a single indispensable right-of-way parcel With the assistance of mediation the acquisition was completed in November 2003 The contract advertisement was set for January 2004 with bid opening in March 2004 The project is expected to be delivered within approved funding and with little delay to the opening date
SR 522I-5 to SR 405 ndash Multi-Modal Project (Nickel)
Removed from Watch List See Proposed Adjustments to Project Delivery In the September 30 2003 Gray Notebook WSDOT reported it was considering delaying the advertisement date to coordinate with the City
Beige Pages - Measures Markers and Mileposts - December 31 2003 13
Beige Pages - Measures Markers and Mileposts - December 31 2003 15
of Lake Forest Park To coincide with the needs of WSDOT partners the advertisement date will slip from winter 2003 to spring 2006 to take advantage of coordinating work with the City of Lake Forest Park The Nickel Funding Package provided the entire project funding in the construction phase These changes will result in shifting $2 million in expenditure from the 03-05 to 05-07 biennium
SR 543I-5 to Canadian Border - Additional Lanes for Freight
Removed from Watch List In the September 30 2003 Gray Notebook WSDOT reported the department was working to resolve structural design issues as a result of poor soil conditions The initial engineering solution was to design retaining walls that would be expensive and cause the project to exceed the budget A slope redesign was therefore developed as an alternative It has resulted in making one wall unnecessary and reducing the necessary height of several walls This affordable design is more cost-effective and should bring the project back within the anticipated budget
Update on Projects Noted in the ldquoWatch Listrdquo in the Gray Notebook ending September 30 2003
I-5 From Rush Road to 13th Street
The Watch List for the September 30 2003 Gray Notebook described the review by FHWA of this project to add one lane in each direction on I-5 between the interchanges at Rush Road (exit 72) and 13th Street (exit 76) including construction of a new interchange at the current LaBree Road under-crossing At the time of publication FHWA approved the added access with conditions
SR 9SR 522 to 212th St SE (Stages 1b amp 2)
The Watch List for the September 30 2003 Gray Notebook described the need to make design changes (raised center line barrier) with two-way-left-turn-lane based on current traffic data The design change may result in a delay of the advertisement date WSDOT continues to coordinate design and construction planning with King County regarding the Countyrsquos development of the Brightwater Wastewater Treatment Plant adjacent to the project There is continuing discussion of a revised advertisement and construction schedule
SR 167 15th St SW to 15th St NW ndash HOV
In the last Gray Notebook Watch List WSDOT reported that the project cost increased by $44 million and that the advertisement date could be delayed The advertisement date will be moved to February 2005 to accommodate redesign of the project to meet current stormwater standards WSDOT staff worked with permitting agency representatives on the Multi-Agency Permitting Team (MAPT) and determined that the original drainage design would not meet current water quality regulations The MAP Team has determined that additional stormwater detention and treatment will indeed be required Local agencies have also stated that additional wetland and stream buffer mitigation will be required As a result additional funds will be required for the design and construction of ecology embankments additional detention ponds and buffer mitigation The additional work will delay the advertisement date to the first quarter 2005 WSDOT staff is investigating designs in order to minimize the amount of these cost increases and will report next quarter
SR 270 Pullman to Idaho State Line - Additional Lanes
In the September 30 2003 Gray Notebook it was reported that there was a possibility of a project cost increase due to rock and soil conditions and the need for bridge design modifications Drilling and soil testing began in mid December 2003 with planned completion of testing in February 2004 Due to the unknown rock depth in excavation areas and bridge design considerations for two bridges it is anticipated that that a project cost increase ranging from $2 million to $5 million may be required The project cost estimate is expected to be completed by July 2004 As the project design is further refined WSDOT is investigating methods to reduce or offset these cost increases The project is on schedule for advertisement in January 2005
Beige Pages - Measures Markers and Mileposts - December 31 2003 14
14 Beige Pages - Measures Markers and Mileposts - December 31 2003
SR 410 214th Ave E to 234th - Widening
WSDOT reported in the Watch List of the September 30 2003 Gray Notebook that costs for this project could increase $16 million or more to purchase land that will be needed for stormwater treatment and detention was re-zoned for commercial and light industrial during the project development phase Engineering work is underway to develop an updated cost estimate for right-of-way acquisition based on the zoning changes by the end of February 2004 This project will address sections of the roadway where accidents occur by controlling access to the highway building new signal systems at major intersections and reducing congestion by providing an additional lane in each direction
Projects added to the ldquoWatch Listrdquo
Bellingham-GP Area Upgrades
This project would upgrade the existing track through Bellinghamrsquos Georgia Pacific (GP) Plant to allow for slightly higher speeds for Amtrak Cascades intercity trains resulting in a travel time reduction of about 11frasl2 minutes Due to unanticipated freight business at the mostly closed GP plant since the project scope was developed the project scope is now inadequate The implications for cost and schedule are being reviewed
Beige Pages - Measures Markers and Mileposts - December 31 2003 15
Beige P
ages - Measures M
arkers and Mileposts - D
ecember 31 2003
17
Beige P
ages - Measures M
arkers and Mileposts - D
ecember 31 2003
The following table summarizes the various changes and adjustments described on pages 8-10 for the quarter ending December 2003
Highway Projects Proposed Adjustments to Project Delivery Quarter Ending December 31 2003 Dollars in Thousands
03-05 05-07 07-09 09-11 11-13 Ten Year Total
Adjusted Net Adjusted Net Adjusted Net Adjusted Net Adjusted Net Adjusted Net SR Project Budget Budget Change Budget Budget Change Budget Budget Change Budget Budget Change Budget Budget Change Budget Budget Change 002 US297 Peshastin East - 2100 2100 0 1870 2700 830 7600 11750 4150 13780 0 -13780 0 0 0 25350 16550 -8800
Interchange 005 I-5SR502 Interchange 1321 2521 1200 8679 7479 -1200 0 0 0 0 0 0 0 0 0 10000 10000 0
005 I-5 Noise Wall 3500 3500 0 0 0 0 0 0 0 0 0 0 0 0 0 3500 3500 0
005 I-5SR526 to US 2 (Marine View 11000 15000 4000 6300 11300 5000 54780 52277 -2503 121900 117005 -4895 44680 36474 -8206 238660 232056 -6604 Drive)
007 SR7SR507 to SR512-Safety 9300 9300 0 0 0 0 0 0 0 0 0 0 0 0 0 0 0 0
009 SR 9 Nooksasck Road to Cherry 6320 1548 -4772 8800 12730 3930 0 927 927 0 0 0 0 0 0 15120 15205 85 St
016 SR 16 HOV Improvements 49623 51483 1860 40902 39042 -1860 0 0 0 0 0 0 0 0 0 90525 90525 0 between Olympic Drive and Union Ave
020 SR 20Quiet Cove Rd Vic to SR 0 0 0 3790 766 -3024 3270 6294 3024 0 0 0 0 0 0 7060 7060 0 20 Spur
024 SR24I82 to Keys Road 840 840 0 22000 22000 0 9000 9000 0 0 0 0 0 0 0 31840 31840 0
031 SR 31Metaline Falls 4900 2400 -2500 11000 13500 2500 0 0 0 0 0 0 0 0 0 15900 15900 0 To Canadian Border
090 I-90 Two-way Transit and HOV 4000 3000 -1000 11000 12000 1000 0 0 0 0 0 0 0 0 0 15000 15000 0
099 SR 99s 284th to S 272nd St 3780 3656 -124 6323 8519 2196 2600 2621 21 0 0 0 0 0 0 12703 14796 2093 - HOV Lanes
161 SR 161Corridor Improvements 12100 6641 -5459 7300 12709 5409 15 27 12 0 38 38 0 0 0 19415 19415 0 -176th to 234th
203 SR 203NE 124thNovelty Rd Vic 1200 2084 884 0 163 163 0 0 0 0 0 0 0 0 0 1200 2247 1047
520 SR 520w Lake Sammamish 3400 3368 -32 4900 6700 1800 24500 16225 -8275 38720 60515 21795 30800 15493 -15307 102320 102301 -19 Pkwy to SR 202
522 SR 522I-5 To SR 405 Multi- 3600 1497 -2103 1500 3568 2068 0 0 0 0 0 0 0 0 0 5100 5065 -35 modal Project
Total of Projects Above 116984 108938 8046 134364 153176 18812 101765 99121 -2644 174400 177558 3158 75480 51967 -23513 593693 581460 -12233
Project Adjustments from Quarter 1 229284 210820 -18464 374159 375781 1622 323393 333343 9950 229295 263815 34520 142025 107237 -34788 1298156 1290997 -7159
Total of Projects from Quarter 2 221033 238273 17240 283976 265815 18161 312730 310414 -2316 307339 307064 -275 318918 348876 -42 1483296 1479741 -3555
Total for All Projects 567301 558031 -9270 792499 794772 2273 737888 742878 4990 711034 748437 37403 566423 508080 -58343 3375145 3352198 -22947
16
16Beige P
ages - Measures M
arkers and Mileposts - D
ecember 31 2003
Beige P
ages - Measures M
arkers and Mileposts - D
ecember 31 2003
The following table summarizes the various changes and adjustments described on pages 10-11 for the quarter ending December 2003
Rail Projects Proposed Adjustments to Project Delivery Quarter Ending December 31 2003 Dollars in Thousands
03-05 05-07 07-09 09-11 11-13 Ten Year Total Adjusted Net Adjusted Net Adjusted Net Adjusted Net Adjusted Net Adjusted Net
Project Budget Budget Change Budget Budget Change Budget Budget Change Budget Budget Change Budget Budget Change Budget Budget Change
Palouse Riv amp Coulee City RR 5820 5820 - 1530 1208 (322) - - - - - - - 7350 7028 (322) Acquistion Port of Columbia Railroad - - - - 11500 252 (11248) 1904 1904 - 3157 3157 11500 5313 (6187) Improvements Port of Columbia Co Dayton - - - - 320 - (320) - - - - - 320 - (320) Upgrades Blue Mtn RR Wallula-Walla Walla - - 1260 - (1260) - - - - - - - 1260 - (1260) Upgrade Rural Elevator Track Expansion - - - - - - 1140 - (1140) 3860 - (3860) 5000 - (5000)
PRampCC Cheney-Coulee 286K - - 1582 1582 11568 11568 8000 7236 (764) - 703 703 8000 21089 13089 Upgrade
Total Rail Projects 5820 5820 - 2790 2790 - 11820 11820 - 9140 9140 - 3860 3860 - 33430 33430 0
The following table summarizes the various opportunities and options described on pages 11-12
Highway Projects Opportunities and Options for Legislative Consideration Quarter Ending December 31 2003 Dollars in Thousands
03-05 05-07 07-09 09-11 11-13 Ten Year Total Adjusted Net Adjusted Net Adjusted Net Adjusted Net Adjusted Net Adjusted Net
SR Project Budget Budget Change Budget Budget Change Budget Budget Change Budget Budget Change Budget Budget Change Budget Budget Change
005 I-5 SR 526 (Marine View 11000 16000 5000 6300 110000 103700 54780 88000 33220 121900 - (121900) 44680 - (44680) 238660 214000 (24660) Drive)
099 SR 99 Alaskan Way Viaduct 45000 45000 - 12000 40000 28000 40000 40000 - 40000 40000 - 40000 12000 (28000) 177000 177000 -
405 I-405 Congestion Relief 46000 46000 - 99840 114840 15000 139020 199020 60000 160195 125195 (35000) 40000 - (40000) 485055 485055 -Projects
522 SR 522 Bothell-UW Campus 8000 - (8000) - 8000 8000 - - - - - - - - - 8000 8000 -Access
539 SR 539 I-5 Improvements 4850 4800 (50) 5500 8300 2800 5200 62800 57600 31500 8000 (23500) 42000 - (42000) 89050 83900 (5150) Ten-Mile Road to Intrsquol Border
Total Projects 114850 111800 (3050) 123640 281140 157500 239000 389820 150820 353595 173195 (180400) 166680 997765 967955 (29810)12000 (154680)
17
Beige Pages - Measures Markers and Mileposts - December 31 2003 19
Financial Information
2003 Transportation Funding Package ndash Paying for the Projects The first edition of the Beige Pages (June 2003) included an in-depth discussion of the Legislaturersquos 2003 Transportation Funding Package The revenue forecast has now undergone several updates since the Legislature enacted the budget The following information reflects the November 2003 forecast changes as well as the impact from the recent Supreme Court decision on Initiative 776 Further refinements to debt service estimates have also been made
Revenue Forecasts The 2003 Transportation Funding Package enacted by the Legislature included tax and fee increases The gas tax was increased by 5cent per gallon and gross weight fees on trucks increased by 15 An additional sales tax on new and used vehicles of 03 and a license plate number retention fee were both established The first two sources are to be deposited to a new account called the Transportation 2003 (Nickel) Account The latter two are to be deposited to the Multimodal Transportation Account that was established several years ago
The following charts show the current projected revenues over the next ten years (for the new funding sources) as forecasted in November 2003 by the Transportation Revenue Forecast Council compared to the legislaturersquos assumed lsquobaselinersquo projections used in the budget-making process in March 2003 Cumulative ten-year totals and individual biennial amounts are both shown
Transportation 2003 (Nickel) Account Revenue Forecast Forecast comparisons include actual March 2003 Legislative Biennial Baseline Compared to
November 2003 Transportation Revenue Forecast Council revenue collection data to date as well Millions of Dollars
as updated projections based on new and revised economic variables The November 2003 forecast includes several months of actual revenue receipt information Gas tax receipts include four months of actual collections and licenses permits and fees include three months of receipts In the Transportation 2003 (Nickel) Account revenue projections for the ten-year period for gas tax receipts were increased over the September 2003 forecast (+105) and licenses permits and fees were forecast to be slightly higher (+05) before taking into account the impact of Initiative 776 However when including the I-776 impact forecasted revenues for licenses permits and fees are down ten percent for the ten-year period In the Multimodal Account licenses permits and fees projected revenue for the ten-year period remained unchanged from the September 2003 forecast Initiative 776 did not impact the Multimodal account
$2000
$1800
$1600
$1400
$1200
$1000
$800
$600
$400
$200
$0
$19240m Baseline Total
November 2003 Forecast Total $18506m
Licenses Permits and Fees 5cent Gax Tax um
ulative
C
$3262 $3186 $3701 $3632 $3912 $3767 $4120 $3907 $4244 $4013
July 1 Baseline Nov 03 Baseline Nov 03 Baseline Nov 03 Baseline Nov 03 Baseline Nov 03 2003 Forecast Forecast Forecast Forecast Forecast
Biennium Ending Biennium Ending Biennium Ending Biennium Ending Biennium Ending June 2005 June 2007 June 2009 June 2011 June 2013
New Sources - Multimodal Account Revenue Forecast March 2003 Legislative Biennial Baseline Compared to November 2003 Transportation Revenue Forecast Council Cumulative and Biennial Totals Millions of Dollars
$600
$400
$200
$0
$3831m Baseline Total
Licenses Permits and Fees 03 Vehicle Sales Tax
Cumulative
November 2003 Forecast Total
$730 667$622 $592 $777 $709 $814 $752 $888 $817 $3537m
July 1 Baseline Nov 03 Baseline Nov 03 Baseline Nov 03 Baseline Nov 03 Baseline Nov 03 2003 Forecast Forecast Forecast Forecast Forecast
Biennium Ending Biennium Ending Biennium Ending Biennium Ending Biennium Ending June 2005 June 2007 June 2009 June 2011 June 2013
Beige Pages - Measures Markers and Mileposts - December 31 2003 18
18 Beige Pages - Measures Markers and Mileposts - December 31 2003
Bond Sales Plan for New Authorizations Provided by the 2003 Transportation Funding Package The 2003 Transportation Funding Package contained two new bond authorizations
bull a gas tax authorization of $26 billion
bull a state General Obligation Bonds (GO) authorization of $3495 million The proceeds from the new gas tax bonds will be used to fund highway projects The debt service will be paid by the revenues from the nickel increase in the gas tax The proceeds from the new state GO bonds will be used to fund rail and ferry projects Debt service for these bonds will be paid from the Multimodal Account Receipts from the new 03 sales tax on new and used vehicles will be deposited to the Multimodal Account and will augment rental car tax receipts and other fees already directed to this account
2003-2005 Biennium
For the 2003-2005 biennium the Legislature appropriated $280 million in proceeds from the new gas tax bonds and $477 million from the state GO bonds To date in this biennium $80 million of gas tax bonds have been sold No new bond sales occurred in this reporting period However in February 2004 (the next scheduled state bond sale) $25 million in gas tax bonds is planned to be sold for the 2003 Transportation (Nickel) Account and $20 million in GO Bonds for the Multimodal Account
The bond sales plan has not changed from the initial report The combined affect of the revenue forecasts bond sales assumptions and project expenditure assumptions is presented in the next section
Financial Plans for Accounts Supporting the 2003 Funding Package Transportation 2003 (Nickel) Account The Transportation 2003 (Nickel) Account was established in the state treasury to be the repository of the new nickel gas tax and the increases in various vehicle licenses permits and fees Bond proceeds from the $26 billion authorization will also to be deposited to this account Uses of the account include cash funding of highway and
Transportation 2003 (Nickel) Account 2003-2005 Budget and Ten-Year Financial Plan dollars in millions
Balance Forward from Previous Biennium Sources Gas Tax Revenues (new 5cent) Licenses Permits and Fees Revenues I-776 Impact (loss of revenue) Interest Earnings Bond Proceeds Federal Funds Local Funds
03-05 $00
2980 231 (26) 43
2800 10 34
05-07 $44
3419 241 (27) 43
5680 97 24
07-09 $171
3533 262 (28) 43
6700 00 09
09-11 $362
3652 284 (29) 43
6430 00 02
11-13 $672
3751 292 (29) 43
4390 00 34
Ten-Year Total
17335 1310 (139)215
26000 107 103
Total Sources of Funds Uses
$6072 $9477 $10519 $10382 $8481 $44930
Cost of Bond Issuance 07 13 17 16 12 65 Bond Sale Underwriters Discount 21 40 50 48 36 195 Debt Service 225 906 1890 2622 3378 9021
Highway Improvements 5697 7943 7338 6909 4628 32515 Highway Preservation 20 103 50 203 1070 1446 Washington State Ferry Construction 57 345 983 274 39 1699 Total Uses of Funds Biennium Ending Balance
$6028 $44
$9350 $171
$10328 $362
$10072 $672
$9163 ($10)
$44940 ($10)
This plan represents the current budget and ten-year financial plan as adopted by the 2003 Legislature and does not contain any proposed adjustments to project delivery
Beige Pages - Measures Markers and Mileposts - December 31 2003 19
Beige Pages - Measures Markers and Mileposts - December 31 2003 21
ferry projects identified by the Legislature and the payment of debt service and other associated costs for bonds sold to provide debt financing for highway projects Since gas tax receipts are deposited to this new account the uses of the account are restricted to highway purposes as required by the 18th Amendment to Washingtonrsquos Constitution The financial plan below brings together all of the projected Sources (tax revenue bond proceeds interest earnings) and Uses (2003-2005 appropriations 10-year projected program expenditures and debt service) of the new account
Changes to projected Sources and Uses of funds have been updated to reflect the most current forecasts As changes either positive or negative are incorporated into the plans the ending balances in the outer biennia are affected The current pro forma which incorporates actual tax collections and current forecast projections predicts a small negative ending balance of approximately $10 million by the end of the 2011-13 biennium The September 2003 pro forma predicted that there might be a negative $165 million shortfall This change is primarily due to a refinement to debt service calculations and the increased gas tax revenue forecast
As mentioned earlier for the ten-year period gas tax receipts were up slightly from the September 2003 forecast ($185 million) and licenses permits and fees were up slightly ($06 million) before the I-776 impact Key economic variables tax receipts and interest rates will continue to change over time Future updates to forecasts as well as inclusion of more actual receipts will further impact the projected final ending balance Additionally actual and revised assumptions pertaining to bond sales and debt service will continue to be incorporated and likewise will impact the outlook for the final ending balance
Impacts of Initiative 776 The 2003 Transportation (Nickel) Account was affected by Initiative 776 the application of which was ruled upon in October 2003 by the State Supreme Court (other affected accounts include the Motor Vehicle Account the Puget Sound Ferry Operations Account and the Washington State Patrol Account) This table shows the projected impact of Initiative 776 to all affected accounts in millions of dollars The 2003 Transportation Account will be negatively impacted over the ten-year period by $139 million
I-776 ImpactsLoss of Revenue by Account dollars in millions
Ten-Year 03-05 05-07 07-09 09-11 11-13 Total
Motor Vehicle Account $307 $272 $280 $289 $297 $1445 Transportation 2003 (Nickel) Account 26 27 28 29 29 139 Puget Sound Ferry Operations Account 06 05 05 06 06 28 Washington State Patrol Account 94 82 84 87 89 436 Biennial Total $433 $386 $397 $411 $421 $2048
Multimodal Transportation Account The Multimodal Transportation Account was established several years ago as the repository for tax revenues and operating and capital expenditures not restricted by the 18th Amendment The 2003 Transportation Funding Package directs receipts to this account from the additional 03 sales tax on new and used vehicles and the license plate number retention fee The most significant pre-existing tax deposited to this account is the rental car tax The 2003 Funding Package also directs bond proceeds from the $3495 million State GO authorization to this account
Beige Pages - Measures Markers and Mileposts - December 31 2003 20
20 Beige Pages - Measures Markers and Mileposts - December 31 2003
Multimodal Account 2003-2005 Budget and Ten-Year Financial Plan (dollars in millions)
03-05 05-07 07-09 09-11 11-13 Ten-Year Total
Balance Forward from Previous Biennium $141 $107 $202 $330 $491 Sources Licenses Permits Fees Distribution 247 270 282 290 302 1391 Rental car tax 453 503 567 627 689 2839 Sales Tax on New amp Used Car Sales 588 648 685 729 792 3442 Miscellaneous Income 15 15 15 15 15 75 Bond Proceeds 478 437 1287 896 398 3495 Federal Revenue 141 54 55 1016 1877 3142 Local Revenue 27 02 02 02 02 33 Total Sources of Funds $1948 $1928 $2893 $3575 $4074 $14417 Operating Uses Cost of Bond Issuance 01 01 03 02 01 09 Bond Sale Underwriters Discount 04 03 10 07 03 26 Debt service 22 93 195 325 439 1073 Transfers to Other Accounts 99 45 45 45 45 279
WSDOT Program Support amp Planning 54 45 46 47 48 240 Public Transportation 493 521 584 627 661 2886 WSF Maintenance and Operations 51 53 54 55 56 268 Rail 376 403 410 418 426 2033 Total WSDOT Operating Uses of Funds $1099 $1163 $1347 $1526 $1679 $6814 Capital Uses Hwy Preservation P0C 17 200 100 00 00 317 WSF Construction W0C 134 82 607 473 00 1296 Rail Y0C 440 327 711 1415 2250 5143
Local Programs Z0C 292 60 00 00 00 352 Total Capital Uses of Funds $883 $669 $1419 $1887 $2250 $7108
Biennium Ending Balance $107 $202 $330 $491 $636 $636
New funding source from the 2003 Legislative Package
Projects funded primarily by New Bonding Authority and Augmented Federal Funds for Rail
New Bond Authorization from the 2003 Legislative Package
Anticipated Federal Funds
The Multimodal Account includes changes to projected sources of funds based on three months of actual receipts and current forecast data As stated above projected revenues from licenses permits and fees for the ten-year period remained unchanged from the September 2003 forecast
Beige Pages - Measures Markers and Mileposts - December 31 2003 21
Beige Pages - Measures Markers and Mileposts - December 31 2003 23
Program Management Information
Management Information Systems and Needs
A key lesson learned from WSDOTrsquos nationwide assessment of project delivery information systems was that successful transportation programs were supported by integrated management information systems Currently WSDOTrsquos hardware and software capabilities in this area pieced together over a period of more than twenty years fall far short of delivering what is necessary to support todayrsquos higher expected levels of oversight and accountability This presents significant challenges
WSDOT managers are required to access project financial plans expenditure plans actual expenditure levels project milestones and project work load estimates from several different management systems Reporting from the various systems while partially automated requires a significant degree of manual intervention and support systems (databases spreadsheets etc)
The 2003 Legislature supported WSDOTrsquos request for a systems modernization assessment study A Legislative Transportation Committee (LTC) workgroup was formed to provide oversight for this project Members include four senators and four representatives charged with recommending actions to the full LTC The workgroup met in September 2003 to initiate review of the project Statement of Work If the statement of work is approved the assessment effort is expected to produce an integration strategy and a project plan for presentation to the transportation committees of the legislature by December 2004
While developing the long-term plan there are pressing short-term needs that are required to shore up the existing systems WSDOT has completed the following activities
bull Added information to the data marts used for reporting program management information (CPMS) and project accounting information (TRAINS) This will provide added support for project and program tracking and will increase reporting options and flexibility of information retrieval
bull Developed a web-based Quarterly Project Report for the Gray Notebookrsquos Beige Pages Trained staff to feed information to the Quarterly Project Report manually and developed a plan to implement electronic data feeds (to be implemented in early 2004)
bull Completed an assessment of the number of projects by project type and by region that have been loaded into the agencyrsquos Project Scheduling Information System (PDIS)
bull Developed a preliminary plan to build a PDIS Data Mart that will make project schedule and status information more readily available for reporting Completion of the data mart is tentatively scheduled for mid-2004
bull Developed a preliminary designbuild work breakdown structure for use in scheduling the mega projects This structure will allow for scheduling and reporting status at a detailed level and assessing the earned value of work done to-date as the mega projects proceed
bull Started development of data marts to provide flexible reporting of the roadway inventory information that supports project scoping and development activities (to be implemented in mid-2004)
Right of Way Acquisition Delays and cost increases in right of way acquisition have affected the delivery of several 2003 Transportation Funding Package projects For example advertisement for the SR 7SR 507 to SR 512 ndash Safety project has been delayed due to 18 adjudicatory hearing requests from property owners adjacent to the project WSDOT expects to complete negotiations with property owners by the end of spring 2004 For details see page 4
The tight delivery schedule for the 2003 Transportation Funding Package presents unique challenges for right of way acquisition In order to minimize future right of way acquisition problems the WSDOT Real Estate Services office (RES) and the Access Management office are analyzing the next two biennia to pick out projects requiring immediate action to assure that right of way is delivered in time for advertisement WSDOTrsquos right of way access and real estate experts have also formed a plan to look for total parcel acquisitions and parcels where access control is already in place thereby avoiding access hearings whenever possible Acquisition plans will be developed as soon as possible and RES will be able to begin to acquire the necessary properties
Beige Pages - Measures Markers and Mileposts - December 31 2003 22
22 Beige Pages - Measures Markers and Mileposts - December 31 2003
Appraisers title examiners and real estate agents in the private sector continue to enjoy a high volume of business due to the low interest rate environment As a result recruitment of experienced real estate professionals to replace retiring right of way staff at WSDOT is proving challenging WSDOT continues to seek qualified professionals to join its staff and will also begin a training program to develop sufficient staff experience to support the large program it needs to deliver over the next decade
Utilities Relocation
As of December 31 no utility relocation issue has caused a project to go on ldquoWatch Listrdquo status
One of the keys to avoiding obstacles to project delivery from utilities relocation is to give utility companies as much notice as possible of WSDOT project impacts to their facilities This allows the utilities adequate time for design budgeting and scheduling of the utility relocation Below is an example of WSDOTrsquos coordination efforts with the goal of minimizing utility relocation risks to our project schedules
bull Widen I-5 Each Direction from Salmon Creek to I-205
NW Natural had concerns that the pressure in its natural gas lines would not adequately serve the neighborhood to the west of Interstate 5 once the NE 129th Street over crossing was demolished WSDOT and NW Natural changed the original plan to run the gas line across the new bridge at 129th The new plan utilized horizontal directional boring equipment to place the line under Interstate 5 allowing the utility to navigate around proposed drainage drilled shafts for the new bridge and retaining walls
Comcast also voiced concern regarding running a temporary line during the reconstruction of the bridge WSDOT worked to provide a new freeway crossing at the 134th Street interchange rather than at 129th Street
bull SR 270 Pullman to Idaho State Line ndash Additional Lanes
An initial meeting has taken place with Avista Utilities for gas line relocation along the SR 270 corridor This allows approximately one year to complete design and relocation prior to the start of the contract
bull SR 31 ndash Metaline Falls to the Canadian Border ndash Reconstruction
A new fiber optic line was recently installed at the north end of the project to enhance communications to the Metaline Falls Border Crossing After coordination with WSDOT the Pend Oreille Telephone Company placed the line so that it would not impact roadway construction
bull US 395 North Spokane Corridor - Gerlach to Wandermere
An agreement has been made with Bonneville Power Administration to initiate design work on tower relocation and reconstruction The design work is to be completed by April 2004 Construction is scheduled to begin in November 2004
WSDOT is also coordinating with the PUD and local communications companies in Pacific County on US 101 in the vicinity of South Bend to make design adjustments so that underground utility lines can be placed at the time WSDOT raises the grade of the road for the SR 105 Mitigation ndash Willapa River Estuarine project This will not impede the traffic staging of the project and will decrease the risk of any utility relocation delays to the contractor
Environmental Documentation Review Permitting and Compliance WSDOT is overseeing a statewide transportation improvement program that creates new opportunities for aligning citizensrsquo goals for the environment and for transportation systems We are working to change the way we communicate these objectives and the interrelated nature of the complex issues in both protecting and improving the environment from the delivery of transportation projects
Beige Pages - Measures Markers and Mileposts - December 31 2003 23
Beige Pages - Measures Markers and Mileposts - December 31 2003 25
Environmental Documentation and Review
Compliance with the Endangered Species Act
About forty Nickel projects remain to be advertised for construction in this biennium according to WSDOTrsquos delivery plan Twenty-three of these projects have completed their required consultations under Section 7 of the Endangered Species Act Transportation projects that do not use federal funds are not required to obtain Section 7 consultation from the Endangered Species Act Two projects will not require Section 7 consultation because no federal funding will be allotted for project Eleven projects in the preliminary stages of design cannot seek the consultation process at this time until the Biological Assessments are completed Consultation on these projects should begin in 2004
There are two projects currently undergoing consultation with NOAA Fisheries and the US Fish and Wildlife Service (USFWS) The SR 31 Metaline Falls to Canadian Border Reconstruction project is undergoing formal consultation with the USFWS to address Canada Lynx concerns The I-90 Two Way Transit amp HOV project is undergoing consultation with NOAA Fisheries and USFWS
Three local projects funded with Nickel Funds revenues will be lead through the consultation process by local governments (City of Shoreline the City of Bremerton and the Hood Canal Coordinating Council) Two projects for WSDOT to deliver statewide (Statewide Bridge Rail Retrofit and Statewide Guardrail Retrofit) will be taken through consultation by the regional offices acting on a regional basis Two regions have already completed the consultation process for these projects
A team of three experienced WSDOT biologists was deployed to the Western Washington Office of the USFWS to address the approximately 20 projects stalled in review This staff assignment accomplished the completion of consultations for 15 projects including the SR 9 ndash SR 522 to 176th St project A new backlog is beginning to build due to the need to reinitiate consultation on a number of projects including the Hood Canal Bridge Replacement In addition the backlog is compounded with the extensive amount of time that seems to be required to be spent in consultation on some of the more complex projects The Federal Highway Administration WSDOT and USFWS are continuing discussions on how to address this problem
Program Delivery Tracking Sheet for ESA Section 7 Consultation WSDOT Projects rsquo03 -rsquo05 Biennium
NOAA Fisheries USFWS
Project Biological Assessment
Consultation Status
Biological Assessment
Consultation Status
NEPA Type
NEPA Complete
Proposed Ad Date
SR 31 Metaline Falls to Inttrsquol Border NA NA 81003 Waiting EA 120503 41004
I-90 Two Way Transit and HOV 11212003 Waiting 122103 Waiting FEIS 033004 106
Consultant Utilization
There are two main areas where consultants are expected to be utilized on 2003 Transportation Funding Package projects The first is to augment WSDOTrsquos workforce so WSDOT can minimize the inefficiencies associated with short-term workforce expansions and contractions The second is to fill needs for specialized expertise that may not be available ldquoin-houserdquo
When WSDOT established the Urban Corridors Office in 2003 contracting efforts were directed at having a sufficiently large pool of qualified talent to draw from quickly and efficiently without time delays With that goal currently being met the emphasis has shifted slightly to identifying the ldquoBest of the Bestrdquo in a variety of specialized areas allowing WSDOT to draw upon top expertise at national and international levels
Regional Transportation Improvement District (RTID) Projects The 2003-2005 Transportation Budget requires the Regional Transportation Improvement District (RTID) to conduct an independent review of all project scopes and budgets prior to placing projects on the ballot WSDOT management is assisting RTID by identifying and assembling a ldquoPanel of Expertsrdquo to review CEVPreg and Cost Risk Assessment projects National or international experts with experience in a wide range of engineering disciplines and in cost risk assessment will be sought The panel selection should be complete early next quarter
Beige Pages - Measures Markers and Mileposts - December 31 2003 24
24 Beige Pages - Measures Markers and Mileposts - December 31 2003
On-Call Services WSDOT currently has over 200 different consulting firms committed to providing services to the State on short notice through ldquoOn-Callrdquo contracts Many of these firms which range from single person consultants to large multi-tiered organizations have internationally recognized experts on staff Currently twelve prime contractors plus their sub-consultants are under contract to provide project specific services across the state
2003 Transportation Funding Package - Consultant Utilization to Date For the quarter ending December 31 2003 WSDOT paid $2556500 to firms providing services on 2003 Transportation Funding Projects Over 300 people were working directly on a full or part time basis on these projects Over $5000000 was authorized as new work in the quarter
Construction Employment Information
Contractor Employment
The 2003 Transportation Funding Package supports transportation projects that make important and long-term contributions to the statersquos economy and the productivity and economic well-being of its citizens Far from the only or even the largest of these impacts is the direct and indirect economic benefits of the construction activity itself one aspect of which is the creation of jobs to built the projects
The direct and indirect benefits of construction employment have been extensively examined by labor economists A useful guide is Associated General Contractors of Washington Economic Impact of the Construction Industry on the State of Washington 2002 Update (prepared by the University of Washington)
How many people are at work on the 2003 Transportation Funding Package projects
The precise number for obvious reasons is impossible to state The jobs are not just at the job site but include designers and project engineers (many of whom divide their efforts among many projects) suppliers and their employees and many others Even for the contractors employment supported by these projects includes home office as well as job site staff And at the job site the employment count varies from day to day depending on subcontractor activity the sequencing of job activities and even the weather We have asked contractors on the Nickel Fund projects in construction to provide the WSDOT construction office with a ldquosnapshotrdquo number what is your best estimate of the ldquoaveragerdquo direct job site employment on your job over the course of the quarter The following table captures the prime contractorsrsquo responses for their own work and their on-site subcontractors on the Nickel Fund projects that have already gone into construction
ProjectContractor
Average project employment for Oct-Dec 2003
I-5 Widening Each Direction from Salmon Creek to I-205 Hamilton Construction and its 24 subcontractors
24 employees
SR 500 New Interchange and Additional Lanes Tapani Underground Inc and its 18 subcontractors
21 employees
I-90 Build Lanes from Argonne Road to Sullivan Rd Scarsella Brothers Inc and its 13 subcontractors
19 employees
I-90 Rye Grass Summit to Vantage Superior Paving Company and its 10 subcontractors
14 employees
I-90 Highline Canal to Elk Heights Scarsella Brothers Inc and its 12 subcontractors
17 employees
I-182US 395 Interchange ndash Roadside Safety Transtate Paving Company and its 2 subcontractors
6 employees
Construction Safety Information WSDOT and the AGC are currently finalizing the details of a method to jointly report safety data for the nickel projects The expected outcome will be a combined safety rating for the contractor and WSDOT staff on each of the Nickel Fund projects
Beige Pages - Measures Markers and Mileposts - December 31 2003 25
Beige Pages - Measures Markers and Mileposts - December 31 2003 26
Worker Safety Quarterly Update Continuing updates on Gray Notebook safety topics ndash data is shown for calendar year (CY) 2000 CY 2001 fiscal year (FY) 2002 FY 2003 and FY 2004 by quarter
WSDOT Highway Maintenance WorkersRecordable Injuries per 100 Workers per Fiscal Year
CY 2000
CY 2001
FY 2002
FY 2003
Qrtr 1 Qrtr 2 YTD 2004
0
5
10
15
20
FY 2004
Highway and Street Construction Benchmark 82
The second quarter recordable injury rate for maintenance workers was 62 injuries per 100 maintenance workers There were 22 recordable injuries during the second quarter of which 9 were lost workday cases accounting for 202 lost workdays This is a 24 decrease in injuries and a 17 reduction in lost workdays from the first quarter The three most frequent types of injuries for the second quarter were dislocation (27) occupational illness (23) and sprainstrain (23) The three most frequent causes of injuries for the quarter were struck by an object (23) overexertion (18) and falls from the same level (14) The three most frequent injuries to the body were back (32) ear (14) and hand (9)
Accident Prevention Activities Second Quarter FY 2004 bull The South Central Regionrsquos Maintenance division is identifying
targets and strategies to decrease personal injuries within work groups Four of five sections reduced their yearly injury average Accountability and awareness has increased substantially and the numbers reflect significant improvement
bull The Eastern Region is revising its Accident Review Board process to make it more accountable for overall safety
bull WSDOT completed a successful West Nile Virus campaign during the second quarter Between May and October 2003 WSDOT spent about $92000 for the West Nile Virus program This included obtaining materials training people monitoring sites and application of pesticides under the direction of the Department of Health (DOH) DOH reported that no human or animal cases were confirmed in Washington in 2003 However nationally in 2003 there were 7718 human cases with 166 deaths In 2002 there were 4156 cases and 284 deaths
Reading the ChartsldquoRecordable Injuries and Illnessesrdquo is a standard measure that includes all work related deaths and work related illnesses and injuries which result in loss of consciousness restriction of work or motion transfer to another job or require medical treatment beyond first aid The US Bureau of Labor Statistics provides the selected 2000 national average benchmarks After discussion with the National Bureau of Labor Statistics the following benchmarks were selected to provide a more relevant and consistent benchmark Maintenance ldquoHighway and Street Constructionrdquo Standard Industry Classification (SIC) 161 (rate 82) Engineering ldquoEngineering and Architect Servicesrdquo SIC 871 (rate 17) Ferry Vessel Workers ldquoWater Transportationrdquo SIC 44 (rate 70) One worker equals 2000 hours per year
WSDOT Ferry Vessel WorkersRecordable Injuries per 100 Workers per Fiscal Year
0
5
10
15
20
CY 2000
CY 2001
FY 2002 FY 2004
Qtr 1 YTD 2004
FY 2003
Qrtr 2
Water Transportation Benchmark 70
The second quarter recordable injury rate for ferry vessel workers was 98 injuries per 100 ferry vessel workers There were 23 recordable injuries during the second quarter of which 21 were lost workday cases accounting for 268 lost workdays This is a 4 decrease in the number of recordable accidents and a 36 reduction in the number of lost time days from the first quarter There are less worker hours this quarter causing a slight increase in the recordable accident rate even though the actual number of accidents dropped slightly The three most frequent types of injuries were sprainstrain (52) chemical exposure (13) and aggravation of a previous injury (13)The three most frequent injuries to the body were the back (13) circulatory system (13) and multiple (13)
Source for all charts WSDOT Safety Office
WSDOT Highway Engineer WorkersRecordable Injuries per 100 Workers per Fiscal Year
CY 2000
CY 2001
FY 2002
FY 2003
Qrtr 1 Qrtr 2 YTD 2004
0
5
10
15
20
FY 2004
Engineering and Architect Services Benchmark 17
The second quarter recordable injury rate for engineer workers was 16 injuries per 100 engineer workers There were 8 recordable injuries during the second quarter of which 7 were lost workday cases accounting for 56 lost workdays There are less worker hours this quarter causing a slightly higher accident rate even though the number of injuries remained the same The three most frequent types of injuries for the quarter were sprain strain (38) occupational illness (25) and lacerations (25) The three most frequent causes of injuries were overexertion (25) falls from the same level (25) and noise (25) The three most frequent injuries to the body were the back (25) ear (25) and knee (13)
Measures Markers and Mileposts - December 31 2003 27
Measures Markers and Mileposts - December 31 2003 29
0
5000
6000
7000
June Dec June Dec June Dec June Dec June Dec June Dec June 1997 1997 1998 1998 1999 1999 2000 2000 2001 2001 2002 2002 2003
Number of Permanent Full-Time Employees at WSDOT
Initiative 695 passed by voters
Referendum 49 passed by voters
5617 5671 6017 5960 5992 6181 6322 6366
Referendum 51 defeated by voters
6325 6171 6258
Dec 2003
WSDOT Workforce Levels One indicator of the agencyrsquos workforce size is the current number of permanent full-time employees on staff The accompanying chart shows that number at various points since the end of 1996 (The number of ldquoFTEsrdquo [full-time equivalents] will generally exceed the number of full-time employees since seasonal and part-time work force must also be funded from ldquoFTErdquo allotments)
Source WSDOT Office of Human Resources
Training for WSDOT Highway Maintenance Employees WSDOT continues progress toward achieving training goals for maintenance employees A total of 24 safety and maintenance courses are required by law andor regulation The chart shows status of training completed for 6 of the 13 required safety courses and 5 of the 11 maintenance courses
Maintenance Total Current Workers Maintenance Maintenance Maintenance Compliance Change
Requiring Workers Workers Workers to Date Since Training Trained to Date Trained 1st Trained 2nd Target = Last Dec 03 Dec 03 Quarter FY04 Quarter FY04 90 Quarter
Safety CoursesBlood Borne Pathogens 1243 1064 13 46 86 +2First Aid 1480 1383 6 0 93 -2Hearing Conservation 1363 1255 0 0 92 -3Personal Protective Equipment 1361 894 216 0 66 +1Fall Protection 750 403 19 0 54 +2Flagging amp Traffic Control 1149 1109 1 0 97 -1
Maintenance Courses Drug Free Workplace 326 287 0 0 88 +1Forklift 1173 1036 37 28 88 +0Hazardous Materials Awareness 986 671 85 90 68 +8Manlift Operations 523 307 0 8 59 -3Excavation Trenching and Shoring 438 302 45 93 69 +13
Training for All WSDOT Employees The following table reflects continued progress on important workforce training courses that help shape WSDOTrsquos workplace These courses are for all permanent full-time part-time and temporary employees The goal is to have 90 of our workforce trained as promptly as resources allow
Number of Number Employees Number Number Compliance Change
Requiring Trained to Date Trained 1st Trained 2nd to Date Since LastTraining Dec 03 Quarter FY04 Quarter FY04 Target = 90 Quarter
Training CoursesDisability Awareness 7295 2567 116 131 35 +1Ethical Standards 7295 7050 82 82 97 0Security Awareness - all employees 7295 5711 17 0 78 +4Security Awareness - supervisors 2884 1474 0 0 53 +1Sexual HarassmentDiscrimination 7295 4880 71 149 67 +14Valuing Diversity 7295 3200 129 142 44 +2Violence that Affects the Workplace 7295 5910 6 7 81 +6
In past quarters non-supervisory employees were incorrectly credited by WSF for attendance at Security Awareness for Supervisors training This has now been corrected
Source WSDOT Office of Human Resources Staff Development
Measures Markers and Mileposts - December 31 2003 28
28 Measures Markers and Mileposts - December 31 2003
Highway Construction Program Quarterly Update Meeting WSDOTrsquos Scheduled Advertisement Dates The Highway Construction Program is the largest capital program in the Transportation Budget Planned expenditures for the 2003-2005 biennium are approximately $23 billion Overall delivery of the Highway Construction Program is tracked and monitored against schedule projections for ad dates and for project cash flow The first is ldquoMeeting WSDOTrsquos Scheduled Advertisement datesrdquo The second is ldquoCash Flowrdquo Funding for the 2003-2005 Highway Construction Program includes a variety of fund sources including pre-existing transportation funds 2003 Transportation Funding Package (ldquoNickelrdquo funds) and Tacoma Narrows Bridge funds The program includes 345 construction projects for advertisement during the current biennium of which 46 are ldquoNickelrdquo projects and 299 are funded with pre-existing funds Overall including preconstruction activities on construction projects to be advertised in future biennia more than 1000 projects will be underway during the 2003-2005 Biennium In the 2003 Transportation Funding Package there were 20 projects originally planned for advertisement in the biennium through the end of the second quarter Of the planned total 15 have been advertised four have been rescheduled for later in the biennium and one has been deferred to the 2005-2007 biennium There were 70 pre-existing fund projects planned for advertisement by the end of the second quarter 42 have been advertised as planned 26 have been rescheduled for later in the biennium and two have been deferred to the 2005-2007 biennium In addition three projects were advanced from quarters later in this biennium and were advertised in the first quarter for a total of 45 projects that have been advertised to date
Ad Date 2003 Transportation Funding Package (ldquoNickel Fundsrdquo) Of the nine projects planned to be advertised in this quarter seven projects were advertised as planned one project was delayed for advertisement to later in the biennium and one will be deferred to the 2005-2007 biennium (for more detail see the Beige Pages) One project was advanced from the eighth quarter for a total of eight advertised projects
bull Seven projects were advertised as plannedSR 9SR 528 Intersection ndash SignalSR 16 HOV Improvements between Olympic
View Drive and Union Ave US 97A Entiat Park Entrance ndash Turn Lanes SR 124 East Jct SR 12 - Reconstruction
Highway Construction Program Delivery Planned vs Actual Number of Projects Advertised 2003-2005 Biennium Quarter 2 Ending December 31 2003
350
300
250
200
150
100
50
0 Qtr 1 Qtr 2 Qtr 3 Qtr 4 Qtr 5 Qtr 6 Qtr 7 Qtr 8
Planned Pre-Existing Funds Ads
Actual Pre-Existing Funds Ads
Transportation Funding Package Planned Ads
Transportation Funding Package Actual Ads
Source WSDOT Project Control and Reporting Office
SR 161234th Street to 204th Street ESR 203NE 124thNovelty Rd VicinityUS 395Kennewick Variable Message Sign
bullOne project was advanced SR 527132nd St SE to 112th St SE
bullOne project was delayed to a future quarter in 2003-2005 SR7SR 507 to SR 512 ndash Safety
bullOne project was deferred to 2005-2007 SR 522I-5 to SR 405 Multi-Modal Project
Ad Date Pre-Existing Funding Of the 58 projects scheduled for advertisement with pre-existing funds in the second quarter 34 projects were advertised as scheduled 22 have been delayed slightly to later in the 2003-2005 biennium two were deferred to beyond the 2003-2005 biennium and two projects were advertised in response to emergencies bull The following are six examples of pre-existing projects advertised as planned US 101 Olympic National Park to Indian Creek ndash This project overlays approximately three miles of existing roadway pavement between Olympic National Park and Indian Creek I-5 Stewart - South Bound off Ramp ndash The existing signal system will be replaced with a signals using poles and mast arms WSDOT will be conducting a feasibility assessment of connecting the new signal system to the City of Seattlersquos centralized system SR 11 Whatcom County Line to Bellingham ndash This project will resurface approximately four miles existing roadway and restore safety features between the Whatcom County Line and the City of Bellingham
Measures Markers and Mileposts - December 31 2003 29
Measures Markers and Mileposts - December 31 2003 31
SR 26 Union Flat Creek-Improve Drainage On SR 26 west of Colfax the design of this project will stabilize the roadway structure by reconstructing approximately 1200 linear feet of creek channel away from the roadway There will also be check dams to slow the flow of the creek and protect the roadway from erosion
SR 127 Central Ferry to Church Hill Road At Central Ferry and extending eight miles north on SR 127 the project preserves the pavement and extends the service life by paving with Asphalt Concrete Pavement mixture and will restore the basic safety features of the highway US 97 Blewett Pass South ndash Paving From the junction with SR 970 to the north of the summit the project is to resurface existing roadway pavement to maintain the integrity of the roadway
bull The following are two examples of delayed projects SR 20 Troxell Road to Deception Pass ndash Current design issues could not be resolved and will require additional engineering changes to meet environmental requirements This will delay the project until February 2005 US 395 Deadman Creek Fish Barrier Retrofit ndashAfter a project costbenefit analysis was conducted in conjunction with the Department of Fish and Wildlife both WSDOT and WDF believe that funds for this project could be used for similar projects that would gain better results
bull Two projects were added in response to emergencies SR 20 Rockslide ndash On Sunday November 9 2003 at 6 am a rockslide estimated at two to three million cubic yards occurred above State Route 20 at milepost 1215 The rockslide left the hillside extremely unstable damaged two sections of the highway and left the small town of Diablo cut off Currently monitoring equipment and minor highway repairs give Diablo residents Seattle City Light personnel National Parks Service and WSDOT personnel limited access to the highway The highway is open between 8 am and 4 pm when flaggers are in place In early February 2004 contractors will turn in a report to WSDOT with proposals for long-term solutions that will reopen the highway permanently US 101 Hoh River Erosion ndash In response to storm-related erosion WSDOT replaced washed out armoring and stream barbs with huge boulders along the Hoh river bank in an effort to keep the river from washing out sections of SR 101 Placement of the boulders is a temporary solution A permanent solution to this problem is being reviewed To meet permitting requirements of the Washington State Department of Fish and Wildlife WSDOT completed a Reach Analysis for this section of river in 2002 The Federal Highway Administration reviewed WSDOTrsquos approach to fixing the problem and has agreed to fund a permanent solution with federal funds WSDOT is now completing a conceptual design in accordance with the Reach Analysis and will have a cost estimate completed by the end of February 2004
Cash Flow on Highway Construction ProjectsHighway Construction Program Cash Flow2003 Transportation Funding Package Highway Construction Program Cash FlowPlanned vs Actual Expenditures (ldquoNickel Fundsrdquo) Planned vs Actual Expenditures 2003-2005 Biennium Quarter 2 ending December 31 20032003-2005 Biennium Quarter 2 Ending December 31 2003Dollars in BillionsExpenditures for highway projects through the quarter Dollars in Billions
ending December 31 2003 were $442 million This $12
represents 8 percent of the budgeted cash flow for the biennium At this point expenditures using the 2003 Transportation Funding Package are within one percent of meeting the plan The expenditure rate will increase as more projects are awarded or moved from a pre-existing project and added to the nickel list of projects The expected pattern of 2003 Transportation Funding Package spending is illustrated by the fact that expenditures in the 8th quarter of 2003-2005 are expected to be 28 percent of the entire bienniumrsquos budgeted cash flow
Qtr 1 Qtr 2 Qtr 3 Qtr 4 Qtr 5 Qtr 6 Qtr 7 Qtr 8
Source WSDOT Project Control and Reporting Office Pre-Existing Funding For the first two quarters of the biennium WSDOT submitted an expenditure plan to the legislature for approximately $328 million As of December 31 2003 expenditures totaled $265 million This leaves a variance of approximately $64 million or 192 percent from the plan WSDOT is currenlty seeking legislative direction on projects with programmatic variance
$0
$02
$04
$06
$08
$10
Planned Pre-Existing Funds
Actual Pre-Existing Funds Planned
Transportation Funding Package
Actual Transportation
Funding Package
Measures Markers and Mileposts - December 31 2003 30
30 Measures Markers and Mileposts - December 31 2003
Special Safety Improvements Quarterly Update
Meeting WSDOTrsquos Scheduled Advertisement Dates for the Safety Improvement Subprogram While elements that improve safety are a part of almost every highway construction project a special program sub-category established by the legislature covers the projects that are designed to address issues in ldquohigh accident corridorsrdquo and ldquohigh accident locationsrdquo These projects are identified by WSDOT based on information about the history of accident frequency and severity While these projects account for only a small portion of the overall benefits to safety from highway improvements WSDOT tracks the advertisement of these projects just as with other projects in the program in order to provide a picture of program delivery on issues that are of great importance on particular locales around the state that have been selected for this program treatment bullOf the 14 projects planned for ad these six projects were advertised as scheduled for this quarter
I-5Ramps at Michigan ndash CorsonAlbroSwift SR 9SR 528 Intersection ndash Signal I-90Moses Lake West Safety Improvements SR 124East Jct SR 12 ndash Reconstruction SR 203NE 124thNovelty Rd Vicinity US 395Kennewick Variable Message Sign
Safety Improvement Program Delivery Planned vs Actual Number of Projects Advertised 2003-2005 Biennium Quarter 2 Ending December 31 2003
90
80
70
60
50
40
30
20
10
0
Actual
Planned
Qtr 1 Qtr 2 Qtr 3 Qtr 4 Qtr 5 Qtr 6 Qtr 7 Qtr 8
Source WSDOT Project Control and Reporting Office
bull Eight projects were deferred for advertisement later in the biennium
SR7SR 507 to SR 512 ndash Safety SR 20Oak Harbor NCL to Frostad Road SR 20Monkey Hill Rd to Troxell Rd SR 20Sapp Rd to Reed St ndash Rechannelize SR 20Troxell Rd to Deception Pass Vic SR 20Frostad Road Vicinity ndash Guardrail SR 24South Wahluke Slope ndash Guardrail SR 290Helena Street ndash Add Turn Lane
Measures Markers and Mileposts - December 31 2003 31
Measures Markers and Mileposts - December 31 2003 33
End-of-2003 Season Highway Construction Project EvaluationsThird Annual Report The annual Construction Highlights report is an end-of-the-year synopsis of construction projects that were completed or nearly completed during the previous construction season Each regionrsquos project office evaluates how well its projects were carried out This is WSDOTrsquos third year publishing this report
This yearrsquos report is an assessment of 23 projects statewide representing a variety of construction types and settings Each project is rated in four elements of construction ndash design construction management schedule and cost and each element is assigned a one-to-five star rating (one is the lowest ranking while five is the highest) Contractorrsquos names are listed for identification but the detailed report shows that the strength or weaknesses of a particular project are often as much WSDOTrsquos responsbility as the contractorrsquos (guiding of design for example) and the best projects seem always to be built on strong teamwork for the entire project team The complete report can be found at wwwwsdotwagov projects2003highlights
Highway Construction Project Rating for 2003 Season Construction
Project Design Management Schedule Cost Contractor SR 504 Castle Rock laquolaquolaquolaquolaquo laquolaquolaquolaquolaquo laquolaquolaquolaquolaquo laquolaquolaquolaquolaquo Lakeside Ind SR 28 Rock Island laquolaquolaquolaquolaquo laquolaquolaquolaquolaquo laquolaquolaquolaquolaquo laquolaquolaquolaquolaquo Scarsella Bros US 395 Hillsboro laquolaquolaquolaquo laquolaquolaquolaquo laquolaquolaquolaquolaquo laquolaquolaquolaquolaquo M A DeAtleySR 26 Vantage laquolaquolaquolaquo laquolaquolaquolaquolaquo laquolaquolaquolaquolaquo laquolaquolaquolaquolaquo Central WA AsphaltSR 8 McCleary laquolaquolaquolaquo laquolaquolaquolaquolaquo laquolaquolaquolaquolaquo laquolaquolaquolaquo Scarsella BrosUS 12 Brady - Malone laquolaquolaquolaquo laquolaquolaquolaquolaquo laquolaquolaquolaquolaquo laquolaquolaquo Lakeside IndI-90 Sunset laquolaquo laquolaquolaquolaquo laquolaquolaquolaquolaquo laquo Kiewit ConstI-405SR 167 IC laquo laquolaquolaquo laquolaquo laquo Max J KuneySR 520 10th to Midspan laquolaquolaquolaquo laquolaquolaquolaquo laquolaquolaquo laquolaquolaquolaquolaquo Colvico IncI-90 Eastgate laquolaquolaquolaquo laquolaquolaquolaquo laquolaquolaquolaquo laquolaquolaquolaquolaquo Lakeside IndI-405 Cole Creek Parkway laquolaquolaquo laquolaquolaquolaquo laquolaquolaquolaquo laquolaquo Tri-State ConstructionSR 141 Klickitat Co Paver laquolaquolaquolaquo laquolaquolaquolaquolaquo laquolaquolaquolaquolaquo laquolaquolaquolaquolaquo Mid-Columbia PavingSR 20 Methow River Bridge laquolaquolaquolaquo laquolaquolaquolaquolaquo laquolaquolaquolaquo laquolaquolaquolaquolaquo One Way ConstructionSR 167 N Meridian to King laquolaquolaquolaquolaquo laquolaquolaquolaquolaquo laquolaquolaquolaquolaquo laquolaquolaquolaquolaquo ICON MaterialsI-5 Puyallup River Bridge laquolaquolaquolaquolaquo laquolaquolaquolaquolaquo laquolaquolaquolaquolaquo laquolaquolaquolaquolaquo CBI IncSR 161 Clear Lake Rd laquolaquolaquolaquolaquo laquolaquolaquolaquolaquo laquolaquolaquolaquolaquo laquolaquolaquolaquolaquo Tucci and SonsSR 525 SR 99 to SR 526 laquolaquolaquolaquo laquolaquolaquolaquo laquolaquolaquolaquolaquo laquolaquolaquolaquo KLB ConstructionUS 2 Barclay Creek Bridge laquolaquolaquolaquo laquolaquolaquolaquolaquo laquolaquolaquolaquolaquo laquolaquolaquolaquolaquo Wilder ConstructionSR 290 Trent Ave Bridge laquolaquolaquo laquolaquolaquo laquo laquolaquolaquolaquo Ross BrosI-90 Sullivan Rd laquolaquolaquolaquolaquo laquolaquolaquolaquolaquo laquolaquolaquolaquolaquo laquolaquolaquolaquolaquo Inland Asphalt CoSR 510 I-5 Pacific laquolaquolaquolaquo laquolaquolaquolaquo laquolaquolaquolaquo laquolaquolaquolaquo Scarcella BrosSR 125 Military Road laquolaquolaquolaquo laquolaquolaquolaquo laquolaquolaquolaquolaquo laquolaquolaquo Transtate PavingI-5 Samish Way laquolaquolaquolaquo laquolaquolaquolaquo laquolaquolaquolaquolaquo laquolaquolaquo Wilder ConstructionFour other projects of interest were included in the report but not evaluated SR 16 Tacoma Narrows Bridge SR 104 Hood Canal Bridge SR 433 Lewis and Clark Bridge and the Moses Lake Wetland Mitigation Bank Five star rating system one represents the lowest rating five represents the highest
WSDOT Asks the Publicrsquos Opinion Included for the first time in this annual Construction Highlights report is a public opinion questionnaire evaluating one project in each of WSDOTrsquos six regions Motorists who traveled through state highway construction projects over the past summer have an opportunity to tell WSDOT what they did or did not like what worked or did not work by visiting wwwwsdotwagovprojects2003highlights
WSDOT will use the public comments to improve the way projects are managed and communicated in the future Results of the public evaluation will be posted for each of the six projects Projects included are I-90 Sunset Interchange in King County I-5 Puyallup River Bridge in Pierce County State Route (SR) 141 Klickitat County Paver US 395 Hillsboro Street Interchange in Franklin County I-90 Sullivan Road to Idaho State Line Paving in Spokane County and SR 28 Rock Island Rock Slopes in Douglas County
Measures Markers and Mileposts - December 31 2003 32
32 Measures Markers and Mileposts - December 31 2003
Gig Harbor Tacoma
For scale The ferry Tacoma
Tacoma Narrows Bridge Project Update Designbuilder Tacoma Narrows Constructors (TNC) now stands at 263 construction completion of the new State Route 16 Tacoma Narrows Bridge project In December 2003 TNC reached another significant milestone ndash that of ldquotouching downrdquo the Gig Harbor (west) caisson onto the 133-foot-deep Narrows seabed In January TNC expects to touch down the Tacoma (east) caisson on the seabed at an even lower depth of 149 feet Following touchdown crews will continue placing reinforced concrete to build caisson internal and external walls while they dredge soil from the 15 hollow cells in each caisson Dredging will allow the caissons to sink another approximately 60 feet into the Narrows seabed At that point crews will start building the towers above water Other bridge work continues as well including anchorage construction and the overseas fabrication of the suspension cable wire Excavation work on both the Tacoma and Gig Harbor anchorages is finished The Tacoma anchorage has already had four massive concrete pours and crews are preparing to begin placing concrete on the Gig Harbor anchorage Roadwork also continues to move at a rapid pace Crews plan to complete the new eastbound on ramp and exit at 36th Street NW along with 22nd Street construction and open all to traffic in March Construction continues on several large retaining walls erosion control measures are in place for the winter season and landscaping along SR 16 is underway On February 2 the state Department of Ecology (DOE) fined WSDOT and TNC jointly $10000 for inadequate treatment of construction storm water During several rain events between October and January discharges of cloudy stormwater from the project site in the Narrows exceeded permit limits Since October project staff have worked hard to improve environmental compliance by implementing DOE environmental recommedations including implementing best-management-practice
Measures Markers and Mileposts - December 31 2003
Landscaping at 36th St on-ramp
Tacoma anchorage concrete pour Tacoma caisson concrete pour
Tacoma caisson construction
Tacoma Narrows Bridge Project Progress to Date Percent Complete
995Design
263Construction
314Total(1)
0 10 20 30 40 50 60 70 80 90 100
(1) Weighted 7 Design progress and 93 Construction progress
Source WSDOT Engineering and Regional Operations Division
stormwater treament controls increasing water monitoring and testing and monitoring stormwater detention ponds steps For more information on WSDOTrsquos environmental commitments see page 45 of this Gray Notebook For additional information including financial information project schedule traffic information photo library and more please visit wwwtacomanarrowsbridgecom
33
Measures Markers and Mileposts - December 31 2003 35
104 Hood Canal Bridge Project Update
Graving Dock Progress on the project remains almost at a standstill as efforts continue among WSDOT the Lower Elwha Klallam Tribe the State Office of Historic Preservation FHWA and the Army Corps of Engineers to resolve issues presented by the discovery in August 2003 of a significant archaeological find The process must establish compliance with the requirements of Section 106 of the National Historical Preservation Act in order for construction work to resume at the site probably following a period of intensive archaeological activity Meanwhile despite the lack of physical construction at the graving dock site the contractor completed a restoration project at Ediz Beach Close to 1500 feet of shoreline was cleared contoured and reseeded For many years the Ediz Beach area was unsafe and inaccessible due to logs pilings and other debris WSDOT removed these articles at low tide to avoid disturbing the harbor waters This restoration provides a healthy natural environment for native plants and animals and may also encourage the spawning of sand lance (a small fish) a significant portion of juvenile salmonrsquos diet It was completed on time and in accordance with a Hydraulic Project Approval (HPA) issued by the Department of Fish and Wildlife as mitigation for
Project Progress to Date Percent Complete
Total 88
0 10 20 30 40 50 60 70 80 90 100
(Percent completion based on contract dollars)
Source WSDOT Engineering and Regional Operations Division
Before
After
use of shoreline access to the graving dock The mitigation project had to be completed before October 15 2003 to minimize disturbance of the sand lance during its spawning period
Bridge Site Construction continued at the bridge site with the contractor Kiewit-General of Poulsbo building a temporary work trestle at the bridgersquos east end The work trestle eventually will support the new east-half transition span Plans are to roll the existing span onto a second temporary work trestle and roll the new transition span into place A long weekend closure is expected sometime in 2005 or 2006
For more information please visit wwwwsdotwagovprojectssr104hoodcanalbridgeeast
Measures Markers and Mileposts - December 31 2003 34
34 Measures Markers and Mileposts - December 31 2003
Highway Safety Improvement Projects Quarterly Update
Many of the highway safety improvement projects installed or constructed by WSDOT seek to improve safety in an area identified by unusually high frequencies of accidents Do these safety improvement projects in fact lead to safer conditions WSDOT reports below on a very encouraging review of before-and-after accident statistics in relation to 21 such projects from locales around the state Also featured this quarter are results from a study on
bull Cable Median Barrier - Across the Median Protection a project intended to benefit longer stretches of highway
bull Impacts of the 08 DUI law assessed over a six year period
bull Safe Routes to School program and
bull A roundabout project in the City of Port Orchard
Safety Projects ndash Before and After Results Each year WSDOT completes a variety of safety improvement Combined Average for 21 Safety Projects projects throughout the state highway system ranging from Collisions Per Year adding turn lanes and signals to installing median barrier and
Propertyrumble strips To begin to determine their effect on reducing the All Types Damage Only InjuryFatalnumber and severity of traffic collisions a preliminary before-
Before 155 88 67and-after study has been conducted for 21 such projects Projects After 97 55 42were chosen that permitted at least 18 months of collision data
to be analyzed in the before period and at least 12 months in the Source WSDOT Transportation Data Office
after period The data was then normalized (12 month average) to make a fair comparison
Preliminary results indicate that for this 21 project sample the average number of collisions per year for all projects combined was reduced by 37 percent Likewise the average number of fatal and injury collisions per year also declined by 37 percent As additional data becomes available this safety project analysis will be updated and expanded
To provide examples of the various types of highway improvements that were indicated in the study additional details about three different projects are provided below and on the next page
I-90 Gold Creek to Easton Hill Vicinity Kittitas County Screens were installed in the median at these two locations to reduce the night time headlight glare from on-coming traffic Prior to installation of the screens these two sections of I-90 had a combined average of 194 night time collisions per year After the installation this figure dropped to 137 a 29 percent decrease In addition for collisions that involved only damage to property the decline in the after period was even greater from 152 to 6 or a 60 percent reduction
Glare screen installed on median barrier along I-90
I-90 Ritzville to Tokio This project involved flattening side slopes installing rumble strips upgrading illumination and repaving Before the project started there was an average of 39 collisions per year in this 13-mile section of I-90 Since the project was completed this dropped to 21 collisions per year a 46 percent decrease The percentage decrease in fatal and injury collisions was nearly as large dropping by 34 percent In looking at specific categories of collisions additional reductions are shown a 9 percent decrease in non-daylight collisions a 31 percent decline in collisions on wet pavement surfaces and an 8 percent drop in overturns
Slope flattening and new pavement on I-90 near Ritzville
Measures Markers and Mileposts - December 31 2003 35
Measures Markers and Mileposts - December 31 2003 37
SR 99 Battery Street Tunnel Seattle In order to reduce the number of collisions occurring on wet pavement surfaces the concrete roadway was ground to increase friction Before the project this section of SR 99 experienced an average of 775 collisions per year 475 of which were on wet pavement After the project was completed total collisions decreased to 305 per year while wet surface collisions declined to 102 per year a reduction of 61 percent and 79 percent respectively If only injury collisions are considered the decrease after the project was completed is nearly as dramatic from 295 per year down to 148 or a 50 percent drop
Concrete pavement grinding to increase friction on SR 99 at theThe summary of all 21 safety projects so far included in the study Battery Street Tunnel in Seattlethat are being analyzed is presented in the table below For a complete table of findings please visit the following web site wwwwsdotwagovmapsdatatdoPDF_and_ZIP_Filessafety_projectpdf
Highway Safety Projects - Before and After Study Collision Data Comparison
Collisions Per Year Property
Available Data DamageProject Title and Location Description of Work (in months) All Types Only InjuryFatal US 2 Sultan-Startup Road Widened SR 2 to provide an EB left turn lane 18 Before 07 00 07Startup Vicinity and a WB left turn pocket 14 After 09 00 09SR 99 Battery Street Tunnel - Safety Constructed roadway surface improvements - 26 Before 775 480 295Seattle pavement grinding 13 After 305 157 148SR 522 NE 145th St Vicinity To NE 155th St Constructed raised median island in place of 18 Before 633 380 253Shoreline existing two way left turn lane Improved visibility 16 After 405 263 143US 2 Applets Way To Vicinity Red Apple Installed median barrier to reduce crossover 23 Before 21 05 16Road Cashmere collisions 12 After 00 00 00SR 1726 Othello - Grade Separation New interchange and illumination 21 Before 74 29 46Othello 12 After 20 10 10SR 24 Hatton Road Ltl Widened and provide left turn channelization 20 Before 12 06 06Othello and improve turning radius 13 After 18 18 00SR 26 Constructed left turn lanes 23 Before 68 37 31Royal City Vicinity 12 After 00 00 00SR 28282 Ephrata - Signal Widened roadway constructed left turn lanes 23 Before 57 57 00Ephrata and installed signal 13 After 37 37 00US 97 Orondo North Realingment and construction of left turn lane 25 Before 05 00 05Orondo Vicinity 12 After 00 00 00US 97 Alt Lakeside Vicinity Constructed two-way left turn lane 21 Before 51 40 11Chelan 16 After 08 08 00SR 150 Chelan West - Turn Lanes Widened and constructed left turn channelization 22 Before 11 05 05Manson 17 After 07 07 00SR 105SR 105 Spur Constructed channelization for right and left turns 29 Before 33 12 21Westport Upgraded illumination 12 After 30 20 10SR 162 Bowman Hilton Rd E to Vicinity Upgraded signal and illumination realignments 19 Before 499 215 284149th Alderton installed signal guardrail and flattened slopes 18 After 467 233 233I-5SR6 Sb Ramp - Signal Signal and illumination installation 25 Before 29 14 14Chehalis 15 After 08 00 08I-5 Chamber Way - Signal Installed signal at NB off-ramp realignments 25 Before 38 29 10Chehalis resurfacing and illumination 15 After 24 24 00US 101 Fowler Street- Signal Installed signal reconfigured with curbs and raised 25 Before 24 19 05Raymond islands 15 After 40 24 16SR 24 Birchfield Road Intersection Installed signalization upgraded illumination 24 Before 55 20 35Yakima Vicinity signing and pavement markings 12 After 50 30 20I-90 West Ersquoburg IC To South Ersquoburg IC Lengthen acceleration lane and tapers Updated 25 Before 149 115 34Ellensburg Vicinity illumination and guardrail Roadway rehab and overlay 12 After 160 130 30I-90 Gold Creek To Easton Hill Installed glare screen along median barrier 26 Before 194 152 42Snoqualmie Pass Vicinity 14 After 137 60 77SR 241 Alexander Road To Factory Rd Constructed two-way left turn lane Channelization 25 Before 120 34 86Sunnyside Vicinity Upgraded signals widened shoulders 4-way stop 21 After 103 63 40I-90 Ritzville To Tokio-safety Matrix Flattened slopes installed rumble strips 28 Before 390 193 197Ritzville Vicinity illumination upgrades and ACP overlay 12 After 210 80 130In addition to the projects shown the I-82Union Gap to Oregon State Line project was analyzed Initial results indicate an increase in collision frequency which is not readily identifiable because of the length of the project weather variation and increased traffic in different locations throughout the project Additional review is underway to identify probable causes for the collisions This information will be presented at a future date Source WSDOT Transportation Data Office
Measures Markers and Mileposts - December 31 2003 36
36 Measures Markers and Mileposts - December 31 2003
The Cable Median Barrier Protection From lsquoAcross the Medianrsquo Collisions
2003-2005 Median Crossover Protection ProjectsErrant vehicles that cross the median into opposing lanes State Lengthof traffic typically cause severe and often fatal collisions Route Project Title (miles) Ad Date
A study of across the median crashes on Washingtonrsquos I-5 Puyallup River To Fife Interchange 19 Aug-03 multilane divided state highways with full access control I-90 Argonne Rd to Pines Rd - Widen 206 Nov-03
I-90 Pines Rd to Sullivan Rd-Widen 211 Nov-03was conducted to evaluate median barrier guidelines and I-90 Moses Lake West-Safety Improvements 1135 Dec-03identify specific highway sections where installation I-5 County Line to Prairie Creek Bridge 245 Jan-04
of a barrier would be appropriate The program I-90 Sullivan Rd to State Line 699 Apr-04adopted after the study is to install cable barriers as I-90 Geiger Road to US-2 237 Oct-04 part of improvement projects when the median width I-5 Pierce Co Line to Tukwila IC HOV- 53 Oct-04 is 50 feet or less Installation of barriers in medians I-90 George Vicinity East - Safety 1582 Oct-04 over 50 feet in width will be weighed against other Source WSDOT Engineering and Regional Operations Division improvements on a case-by-case basis
Cable barriers have been used on the nationrsquos highways since the 1930s or before The modern system which uses three cables supported by weak steel posts was developed in the 1960s and is now in widespread use in several states
Reductions in Severe Collisions Severe Collisions While total collisions in the study areas I-5 in Before and After Cable Median Barrier Installation
Annual Fatal and Disabling Collisions and Median Collision Type Everett Vancouver and Fife nearly doubled (from 7
45 to 100 including collisions with property damage 6only) the number of severe collisions (fatal and
disabling) decreased significantly This resulted in a 5
societal benefit of cable median barriers calculated 4 to be $420000 per mile annually A breakout of the
3 types of severe collisions are shown in the graph to
2the right (graph does not include ldquoproperty damage onlyrdquo collisions) 1
0 The data on the right was normalized and represents 12 months before and 12 months after the project All Median Fixed Object Roll Over Cross Median
Source WSDOT Engineering and Regional Operations Division
Fatal Accidents Disabling Accidents
Before After Before After Before After Before After
Before After
Washington State and Alcohol-Related Fatalities From 1998 to 2002 alcohol-related deaths per 100 million
Washington State Alcohol-Related Fatalities miles driven dropped 11 percent overall from 060 to 054 per Per 100 Million VMT100 million miles driven in Washington A package of anti-1998 to 2002drunk-driving laws enacted in 1998 lowered the blood alcohol
intoxication threshold from 010 to 008 percent and provided 065
for automatic loss of license for drunk driving These legislative steps together with increased State Patrol emphasis on stopping 06
drunk drivers are credited with the decrease Other measures in Washington include increased use of ignition interlock devices 055
(a device attached to the carrsquos ignition system that requires the driver to blow into the device before starting the car ndash if alcohol 05
is detected the car wonrsquot start) and a crackdown on deferred prosecutions 045
DUI 08 Law Enacted
1998 1999 2000 2001 2002
Washington DUI Facts amp TrendsSource ldquoResearch Noterdquo DOT HS 809 680 US Department ofBetween 1983 and 1991 an average of 391 drinking- Transportation National Highway Traffic Safety Administration
driver-involved (DDI) deaths occurred each year Between December 2003 1992 and 2002 an average of 285 DDI deaths occurred each year This improvement means that about 1166 lives have been saved in Washington during the 1990s
Measures Markers and Mileposts - December 31 2003 37
Measures Markers and Mileposts - December 31 2003 39
Safe Routes to Schools Since 1999 WSDOT has administered a five million dollar per biennium grant program appropriated by the legislature called Traffic Safety Near Schools This program has funded more than 70 projects across the state to improve bicyclist and pedestrian safety near schools This program was not however extended to new projects in the 2003-2005 budget In addition the Washington State Traffic Safety Commission currently administers a $2 million annual School Zone Safety grant program that pays for safety education and small traffic safety improvements The program is funded by fines from school zone traffic violations
The Washington State Department of Health (DOH) recently received $800000 in grant funds to promote active community environments a program that will include safe walkride to school routes DOH is currently working with regional county and city governments in areas meeting specific public health criteria across Washington
Safe Routes to Schools mdash Elementary School Locations
Half of the elementary schools in Washington are located on or very near state routes State law requires elementary schools to produce walk route plans
Seattle
Tacoma Olympia
Spokane
Elementary schools on or within 12 mile of a State Route Elementary schools near accident sites (accidents involving elementary agevictims 1995-2001)
Safety in a Roundabout WayPort Orchard Roundabout Safety Improvement During the late 1980s and early 1990s traffic growth in the city of Port Orchard in southern Kitsap County overwhelmed the intersection of Bethel Avenue and Mile Hill Drive (SR 166) eventually generating enough injury and property collisions to classify the intersection as a High Accident Location (HAL) Vehicle speeds exceeding the posted speed limit and the intersection configuration contributed to the collision problem In the mid-1990s after approval of the design by WSDOT the City of Port Orchard built a ldquomodernrdquo roundabout the first of its kind on the state highway system and the second to be built in Washington
After the construction of the single-lane roundabout crash data supports how well a roundabout can work when applied to a site-specific intersection safety problem There are now 48 roundabouts in Washington
Port Orchard -Bethel Ave and Mile Hill Drive Intersection
Number of Collisions and Injuries Before and After Roundabout Comparison 40
30
20
10
0 3 Years Before 3 Years After Roundabout Roundabout
Collisions
Injuries
Source WSDOT Engineering and Regional Operations Division
Measures Markers and Mileposts - December 31 2003 38
38 Measures Markers and Mileposts - December 31 2003
Asset Management Pavement Assessment Annual Update WSDOT maintains approximately 19200 lane miles (including ramps) of pavement surfaces The three major pavement types are chip seal hot mix asphalt pavement and portland cement concrete (PCC) pavement Each of these pavement types has an associated pavement life rehabilitation treatment and rehabilitation cost This report is an annual update of information last presented in the Gray Notebook for the quarter ending December 31 2002
Pavement Condition Update 2002 Results Pavement Condition Trends According to the 2002 pavement condition survey the Percent of Pavements percent of WSDOT pavements in ldquopoorrdquo condition increased slightly in 2002 to 93 percent up from 89 percent as
100
reported in the 2001 pavement survey The rating continues 80
to be dramatically better however than the situation in 1971 when the Washington State Pavement Management System 60
was first put in place 40
Programming Pavements for Rehabilitation 20 The table below shows some important facts about the extent and use of the various pavement types and the success that 0
the state seems to be achieving in directing investment to 1998 2002
areas of need Source WSDOT Materials Lab
Over the last biennium about nine percent of pavement rehabilitation spending has been for chip seal resurfacing These roads the cheapest to Lowest Life Cycle Cost resurface constitute about 23 percent of the lane miles but carry only about five percent (LLCC) Program for of the traffic Pavement Management
The basic principles behind LLCCEighty-eight percent of the spending has been for preservation of hot mix asphalt are rather simple mdash if rehabilitation pavements These roads are 64 percent of the lane miles and carry 71 percent of the traffic is done too early pavement life is
wasted if rehabilitation is done too late very costly repair work may beThe PCC pavements are 13 percent of the lane miles yet carry 23 percent of the required especially if the underlying
traffic PCC pavements have longer lives than other pavements but are very costly to structure is compromised WSDOT rehabilitate not only in terms of construction money but also in traveler inconvenience continually looks for ways to best
strike a balance between these twofrom traffic restrictions when pavement work is performed especially on the major high- basic principles while implementingtraffic corridors Forthcoming replacement of these pavements will bring big challenges the practical aspects of pavement
rehabilitation programsinvolving funding engineering and traffic management during construction (see the discussion on PCC pavements later in this section) The state is fast approaching the need to reckon with this looming financial and traffic crisis in pavement management a story that is not fully revealed by the generally positive picture conveyed by the recent annual surveys of ldquopoorrdquo condition pavements for the entire highway system
1973 1981 1986 1990 1994
Good Condition
Slight increase in percentage of pavement in poor condition 2001 to 2002
Long-term trend declining percentage of pavement in Poor Condition
Pavement Type Lane Miles
Lane Miles
Annual Vehicle Miles Traveled ndash 2002 (in billions)
03-05 Dollars
Programmed (in millions)
05-07 Dollars
Programmed (in millions)
Miles $ $
Chip Seal Pavements A chip seal is a durable surface that provides six to eight years of performance life and has an approximate cost of $12000 per lane mile
4490 234 17 53 $195 9 $182 9
Hot Mix Asphalt Pavements Hot mix asphalt pavement surface life between rehabilitation treatments can range from six to 18 years (based on actual pavement performance) and has a cost of $123000 (due miles) per lane mile and $156000 (past due miles) per lane mile
12284 640 225 715 $1819 84 $1845 91
Portland Cement Concrete (PCC) Pavements WSDOT has experienced PCC pavement lives ranging from 25 to 45 years and has an approximate cost of $330000 for dowel bar retrofit per lane mile and $1 million for full replacement per lane mile
2410 126 73 233 $142 7 $0 0
Source WSDOT Systems Analysis and Program Development Office WSDOT Materials Lab
Measures Markers and Mileposts - December 31 2003 39
Measures Markers and Mileposts - December 31 2003 41
Chip Seals For chip seals asphalt is sprayed on the existing surface and then covered with a layer of rock chips The oil becomes solid as it cools Chip seals are appropriate for low volume roads (less than 2000 vehicles per day and less than approximately 200 trucks per day) Since the roadways that receive this type of treatment are typically on rural routes WSDOT has found that pavement rehabilitation dollars seem to be best spent with efficiency of scale when a stretch of rural road mileage is taken together for resurfacing in a single ldquopaverrdquo contract even when the contract includes aging segments not yet ldquoduerdquo together with ldquopast duerdquo segments
Hot Mix Asphalt On average western Washington hot mix asphalt pavement life is 165 years eastern Washington life is 113 years (due to severe winter cold and extreme summer heat) and the statewide average is 147 years Hot mix asphalt is appropriate for a broad range of roadways from lower volume routes (more than 2000 vehicles per day and more than 200 trucks per day) to interstates with heavy traffic volumes
These pavements are where the greatest benefits of LLCC pavement management can be realized In past biennia there has been some tendency to allocate a share of pavement preservation dollars on a traditional basis by region in addition to dollars programmed strictly by reference to ldquopast duerdquo needs This has resulted in some distortion away from ideal LLCC results As of the 2003-05 biennium this has been corrected by making all regional allocations based on pavement condition and LLCC analysis
Portland Cement Concrete (PCC) Existing PCC pavement life ranges from 25 to 45 years PCC pavement is typically placed on heavily traveled interstate principal arterial and intersection locations Most of the PCC pavements historically installed on Washington highways require dowel bar retrofit and diamond grinding (to smooth the pavement surface) 20 to 25 years after construction (due to lack of reinforcing steel at the transverse joints to prevent settlement) It is estimated that a newly constructed PCC pavement will have a pavement life of 50 years and only require diamond grinding in its 25th year due to studded tire wear
Efficiency Gains for Hot Mix Asphalt Pavements Hot mix asphalt surface life has improved by 14 percent (statewide) over the last six years while over the same time period the vehicle miles traveled on asphalt paved roadways has increased by approximately 10 percent Management of asphalt pavements is an area where WSDOT has succeeded in delivering dramatically improved ldquobang for the buckrdquo to Washington state taxpayers How have WSDOT and its asphalt paving industry contractors achieved this significant efficiency gain in asphalt on state freeways and highways The keys lie chiefly in the following areas bull Provision on the paving specification for use of performance-grade binders selected for expected climate and traffic conditions
bull Use of Superpave mix designs keyed to temperature and traffic expectations
bull Improved asphalt pavement repair and asphalt placement techniques
bull Better attention to construction details and inspection and bull Increased experience with LLCC rehabilitation programming
WSDOT is also focusing pavement management efforts on programming more lane miles at a single location resulting in lower bid prices The amount of asphalt used for pre-leveling (filling in minor ruts and depressions prior to paving) has also been reduced on WSDOT paving jobs generally from 600 tons per lane mile to 300 tons per lane mile resulting in a substantial cost savings The effect of these efficiency gains taken together is that a tax dollar invested in pavement rehabilitation today buys much more than it did just a few years ago
2004 Concrete Lane Miles
Current Age (Construction or Reconstruction)
Total Lane Miles
Lane Miles Rehabiliated to Date by Dowel Bar Retrofit
0-10 1471 00 11-20 2740 00 21-30 5668 350 31-40 6420 3224 41-50 2791 581 51-60 50 02 61 or more 661 00 Total 19800 4157
A matter of concern in the 2002 pavement condition survey is that an additional six miles of PCC pavement were found to have fallen into the ldquopoorrdquo category raising the PCC ldquopoorrdquo total to 170 lane miles However the greatest concern is the potential for a dramatic increase in the poor category as a result of the PCC performance reevaluation in 2004
The table at left illustrates the number of PCC pavement lane miles currently owned and maintained by WSDOT Sixty miles of PCC replacement would cost on the order of approximately $60 million before taking into account the project costs associated with roadway safety upgrades and stormwater runoff control retrofits
Does not include 321 lane miles of bridge Traffic disruptions associated with rehabilitation or replacement of these pavements is sections and 112 lane miles of ramps another difficult feature of this looming problem
40 Measures Markers and Mileposts - December 31 2003
40 Measures Markers and Mileposts - December 31 2003
Rating Pavement Conditions WSDOT continues to use a three-part examination system to rate pavement condition
Pavement Structural Condition (PSC) A pavement will develop structural deficiencies for two reasons truck traffic and cold weather The PSC is a measure based on distress such as cracking and patching which are related to the pavementrsquos ability to carry loads PSC ranges from 100 (best condition) to 0 (worst condition) A roadway should be considered for rehabilitation when it falls within the PSC range of 40 to 60 Rutting Rutting is caused by heavy truck traffic or studded tire wear Ruts deeper than 12 inch have the potential to hold water increasing the risk of hydroplaning for high-speed traffic A roadway should be rehabilitated when the rut depth is greater than 13 inch
Roughness The International Roughness Index (IRI) is a procedure to measure pavement ride A full-sized van with a laser-measuring device mounted on the front bumper measures the roughness of the pavement A roadway should be rehabilitated when the IRI value is between 170 and 220 inches per mile
Determining When Pavements are ldquoDuerdquo The Pavement Condition Rating process using the van pictured on the right analyzes and predicts the pavement rehabilitation due period (see the Gray Notebook for the quarter ending June 30 2001 for details) A regional validation process reviews the results and calibrates the ratings if needed The number of disputed segments varies between 5-10 Each of the segments in question is then reviewed and any discrepancies are resolved WSDOT considers the pavement rehabilitation due year in the Pavement Management System to be approaching 100 accuracy Pavement Condition Data Collection Vehicle
2002 Pavement Smoothness by StateHow Do Washingtonrsquos Pavements Conditions Centerline Miles in PercentCompare with National Experience Miles Poor in Poor
FHWArsquos annual Highway Statistics report includes Rank State Reported Condition Condition information on pavement condition reported by each 1 Georgia 11301 34 03
2 Wyoming 4414 22 05of the 50 states and the District of Columbia (based on 3 Alabama 7643 41 05roughness only) To the right is a snapshot of the 2002 4 North Dakota 6180 53 09 results that shows the number of miles by state in 5 Minnesota 11658 108 09
6 Nevada 2959 33 11poor condition according to smoothness The total miles 7 Kentucky 5192 76 15reported includes the interstate system and principal 8 Florida 10898 160 15
9 Kansas 8851 183 21arterials owned by the state cities and counties and a 10 Arizona 4065 86 21sampling of other functional classes Washington state 11 Idaho 3860 93 24ranked 16th in smooth roads in 2002 (Washington was 12 Maine 2391 60 25
13 Montana 6927 179 26ranked 17th in 2001) 14 Utah 3676 120 33 15 Alaska 1800 62 34 16 Washington 5396 194 36The FHWA publication can be viewed at wwwfhwadotgovpolicy
ohimhs02indexhtm 17 South Carolina 6791 260 38 18 New Hampshire 1375 54 39
49 California 20634 5437 263 50 Massachusetts 3290 1182 359
Source Highway Statistics 2002 US Department of Transportation
Measures Markers and Mileposts - December 31 2003 41
Measures Markers and Mileposts - December 31 2003 43
Highway Maintenance Annual Update Biennial Maintenance Targets The Maintenance Accountability Process (MAP) targets measures and communicates the outcomes of 34 distinct highway maintenance activities Maintenance results are measured using field condition surveys and are reported as Level of Service (LOS) ratings LOS targets are defined in terms of the condition of various highway features (for example the percent of guardrail on a highway system segment that is damaged) LOS targets are also keyed to the level of funding provided by the Legislature The following table shows a list of maintenance activities (in prioritized order) for which LOS targets have been set in the 2003-05 biennium During 2003 targets for all activities were achieved
WSDOT Maintenance TargetsAchieved for 2003 Maintenance Activity Achieved Pavement Patching and Repair uuml
Snow and Ice Control Operations uuml
Traffic Signal Systems uuml
Movable and Floating Bridge Operations uuml
Urban Tunnel Systems uuml
Keller Ferry Operations uuml
Guardrail Maintenance uuml
Noxious Weed Control uuml
Structural Bridge Repair uuml
Intelligent Traffic Systems uuml
Control of Vegetation Obstructions uuml
PermitsFranchises uuml
Maintain Culverts uuml
Regulatory Sign Maintenance uuml
Slope Repairs uuml
Crack Sealing uuml
Bridge Deck Repair uuml
Safety Patrol uuml
Rest Area Operations uuml
Highway Lighting Systems Operations uuml
Pavement Striping Maintenance uuml
Maintain Catch Basins and Inlets uuml
RaisedDepressed Pavement Markers uuml
Sweeping and Cleaning uuml
Nuisance Vegetation Control uuml
Maintain Ditches uuml
Shoulder Maintenance uuml
DetentionRetention Basins uuml
Litter Pickup uuml
Guide Sign Maintenance uuml
Landscape Maintenance uuml
Guidepost Maintenance uuml
Bridge Cleaning uuml
Pavement Marking Maintenance uuml
2003 Perfect Score ndash Percentage of Legislatively Funded Targets Achieved 1998-2003 In September 2001 the first Gray Notebook quarterly report on MAP WSDOT achieved 26 out of the 34 MAP targets Three years later a perfect score has been achieved The positive trend can be attributed to bull What gets measured gets managed WSDOT
maintenance managers and field workers are gaining experience with how to manage work in ways that help to attain the service level targets
bull Strong maintenance results across-the-board have been assisted by mild or average winter conditions
bull Stable funding for maintenance for several years has lessened ldquocrisis moderdquo management and produced better across-the-board results
bull Improved accuracy in measuring MAP results ndash based on a six-month review and field verification of MAP measures and their assessment technique
Starting in March 2004 WSDOT maintenance staff will be documenting greater levels of detail such as units of work completed (for example ldquolinear feet of guardrail repairedrdquo) This will provide information that can be used to develop cost per unit and units per day or week measures to supplement the outcome measures provided by MAP Look for more on this in future Gray Notebook maintenance pages
Percentage of Legislatively Funded Targets Achieved for 1998-2003
100
80
60
40
20
0 2002 20031998 1999 2000 2001
Source WSDOT Maintenance Office
Measures Markers and Mileposts - December 31 2003 42
42 Measures Markers and Mileposts - December 31 2003
Integrated Vegetation Management Integrated Vegetation Management (IVM) involves creating and supporting roadside plant communities that minimize short and long-term maintenance needs Roadside vegetation maintenance requirements often depend on how well roadsides are designed and constructed When soil is conserved and improved vegetation is restored during highway construction roadside maintenance requirements can be relatively low However if roadsides are not well restored at the time of construction the expense of roadside maintenance grows because noxious and nuisance weeds tend to establish themselves and thrive in poor soils with sparse vegetation
2003 Herbicide Use Trends ndash Results In terms of pounds of active ingredient WSDOTrsquos statewide annual use of herbicides for roadsides increased by 3300 pounds (121105 pounds in 2002 to 124426 pounds in 2003) On closer review of the data most areas in western Washington were either down or about the same in their overall herbicide use compared to 2002 In fact Clallam County the first area in which WSDOT has implemented an IVM plan saw a 50 percent reduction in herbicide use on the roadsides In eastern Washington two areas in particular experienced significantly increased herbicide use The cause was a localized ongoing weed infestation problems for which herbicide applications were needed Had it not been for the significant application in these two areas WSDOTrsquos herbicide use in 2003 would have been less than in 2002
Clallam County IVM Plan In the past year WSDOT has finally begun to make progress implementing its long-promised IVM program Working with communities and a number of interest groups on the Olympic Peninsula WSDOT developed an IVM plan for state highway maintenance in Clallam County that reduced the amount of herbicide used and responded to citizen concerns Highlights and results include
bull No vegetation-free area adjacent to pavement within 60 feet of salmon streams Hand-treatment only of invasive plants growing next to the pavement edge in this area
bull No summer application of herbicides for controlling trees and brush
bull Hand application of noxious weed control herbicide (as opposed to truck applications) and close coordination with the Clallam County Noxious Weed Control Board
bull Experimentation with alternative brush control methods such as planting desirable plant species (ie salal) hydro seeding and biological controls
bull Total herbicide use decreased more than 50 percent
At a February 5 2004 open-house meeting to discuss continued aspects of the IVM program in Clallam County concerned citizen Josey Paul commended WSDOT employees saying ldquoThank you for your good efforts managing vegetation along SR 112 this past yearrdquo
With an effective IVM program common weeds such as kochia in eastern Washington can be managed with reduced herbicide use over time
Vegetation-Free Area Approximately 60 percent of herbicides used by WSDOT are used to prevent vegetation from growing at the pavementrsquos edge WSDOT is reviewing this practice including a study of other statesrsquo use of chemicals in vegetation-free zones alongside the roadway The challenge in determining the best approach comes from needing to balance the potential herbicide impacts with hazards to motorists associated with an abundance of roadside vegetation to highway workers from mechanical control technologies and to pavements for vegetation incursions to the pavement By the end of the year WSDOT will develop and implement updated policies on vegetation-free areas
The vegetation-free zone next to the roadway
Measures Markers and Mileposts - December 31 2003 43
Measures Markers and Mileposts - December 31 2003 45
IVM Future Practices Integrated Vegetation Management Plan Schedule Because of the success of the Clallam County I-5 North (lsquo04)IVM plan WSDOT created a statewide schedule for Roadside Vegetation Management plans The timetable implements all plans by the end of 2007 WSDOT also identified new performance measures to track future roadside vegetation management trends The measurements include
bull The IVM plan development schedule
bull Adherence to sensitive buffers upon orders by the US District Court (see below)
bull Number of WSDOT application violations
bull Maintenance Accountability Process (MAP) conditions measures for nuisance weeds I-5 South (lsquo03)noxious weeds vegetation obstructions and landscape maintenance WSDOTrsquos Integrated Vegetation Management Plan implementation
is scheduled by year and by maintenance area as shown in thebull Documentation of area-specific IVM plan above map Area by area production of the plans will continue until
elements completed each year statewide coverage is achieved
Seattle Spokane
5
rsquo03 rsquo04
rsquo06
rsquo05
rsquo05
rsquo06 rsquo05
rsquo04
rsquo07
rsquo07
rsquo07
5
Tacoma Olympia 90
Whidbey Island Plan Coming The department will hold a public meeting on a Roadside Vegetation Management Plan for Whidbey Island in March 2004 WSDOT expects to develop and implement a plan that meets the concerns of citizens with varying viewpoints on herbicide use and can be achieved at reasonable cost The draft plan identifies a number of key areas test sites roadside features and treatment practices Other IVM plan details for Whidbey Island are expected to include
bull Restoration of roadsides in coordination with future construction projects on State Route 20
bull Restoration of native roadside vegetation on half of an acre a year as part of the regular maintenance program
bull No vegetation-free area adjacent to pavement within 60 feet of the waterline at Penn Cove and Keystone Spit
bull Establishment of the vegetation-free area pilot projects
US District Court January 2004 Ruling The United States District Court in Seattle entered an injunction in January 2004 prohibiting the use of certain herbicides within sixty feet of salmon streams pending EPArsquos completion of a review whether such use is consistent with protections afforded by the Endangered Species Act
WSDOTrsquos herbicide practices included in the 2003 IVM plan for Clallam County and generally followed in many other areas of Western Washington are already matched to the injunctionrsquos requirements To ensure adherence to the terms of the injunction WSDOT maintenance crews will identify affected areas on the highways mark buffer zones and receive additional training on vegetation management practices including limitations on herbicide use
WSDOT ndash Proactive in Risk Assessment As part of its vegetation management efforts in 2003 WSDOT contracted with a consultant Intertox Inc to update a 1993 WSDOT hazard assessment study This included integration of new research in herbicide usage The hazard assessments aim through review of scientific literature to inform WSDOTrsquos understanding of potential risks to humans wildlife and aquatic organisms The hazard assessment update generally found the potential risks of specific products to be negligible or low in WSDOTrsquos patterns of use The assessment suggested however that moderate potential risks might be presented by two products MCPA and Diuron WSDOT discontinued further use of MCPA in 2003 and has taken steps to reduce the use of Diuron by limiting its application only to certain areas in eastern Washington
Measures Markers and Mileposts - December 31 2003 44
44 Measures Markers and Mileposts - December 31 2003
Environmental Programs Environmental Management System (EMS) Update WSDOT is continuing to develop its Environmental Management System (EMS) to help support the departmentrsquos environmental efforts and integrate those efforts into everyday operations training programs and regular performance reports Currently several important activities described below are building WSDOTrsquos capacity to improve track and report on environmental compliance
Construction Services Program Pilot To address projects funded by the 2003 Transportation Funding Package WSDOT is piloting a construction services program modeled on a prototype used by its regional office in Yakima The program is being evaluated for statewide implementation Its goal is to ensure that environmental commitments attached to a project are clearly communicated and implemented throughout design construction and facility operation The programrsquos three major components are (1) pre-construction and pre-activity meetings between WSDOT and the contractor (2) tools to aid construction and maintenance staff in maintaining
Seven Core Elements to WSDOTrsquos Environmental Management System bull Legal and other requirements clearly outline all
environmental laws regulations and agreements that apply to operations
bull Written procedures instruct staff and contractors how to conduct work activities in compliance with requirements
bull Training ensures those that conduct certain activities know how to do the work in a compliant manner
bull Roles and duties ensure WSDOT staff and contractors know what they are to do under the EMS
bull Inspection monitoring and corrective action ensure a process is in place to check WSDOTrsquos work for compliance and correct any problems
bull Documentation allows WSDOT to evaluate the operation of the EMS and communicate results to the public and within the department
bull Performance measurement compares WSDOTrsquos performance against pre-determined targets with results reviewed by management and reported to the public
compliance on the project site including an environmental inspection checklist for use by construction inspectors and (3) environmental compliance procedures issued by WSDOT for all construction and maintenance activities
Enhanced Commitment Tracking WSDOT is working to better track formal commitments made during the project development process By the end of 2004 WSDOT will track all formal commitments from inception (usually during planning or project design phase) through construction to completion or handoff to its Maintenance and Operations Department This new system will make clear assignments of roles and duties to show who manages performs and monitors the implementation of each commitment
Examples of Environmental Commitments on WSDOT Projects Some environmental commitments are Other commitments are agreements Some commitments are made during the terms and conditions outlined in environ- made during the Endangered Species Act National Environmental Policy Act (NEPA) mental permits These may require process These commitments or ldquoconser- environmental review process to minimize WSDOT to maintain a certain water quality vation measuresrdquo are designed to protect or offset overall environmental impact of a level during construction use certain endangered species Examples include the project Commitments under NEPA may affect Best Management Practices (BMPs) and requirement for WSDOT to place woody a roadwayrsquos alignment or physical design conduct environmental monitoring debris in a river or avoid working at certain The concrete box culverts shown belowtimes to protect migratory speciesFor example straw blankets and silt were agreed upon during the NEPA process fences are required to be used to protect In addition to habitat protection WSDOT and are designed to promote floodplain a small stream along Highway 18 during uses engineered log jams root wads and connectivitymdashallowing water to pass under rainstorms until permanent erosion control other bio-engineering techniques to protect the roadway during high water rather than grasses are established stream banks near roads and bridges over it or on to adjacent property
Measures Markers and Mileposts - December 31 2003 45
Measures Markers and Mileposts - December 31 2003 47
Environmental Compliance Assurance Annual Update WSDOT self-monitors for ldquonon-compliance eventsrdquo whether or not such events are taken up as formal ldquoviolationsrdquo by regulatory agencies or officials
Compliance History The Gray Notebook for March 31 2003 reported on WSDOTrsquos initial effort to track non-compliance events Data for 2001 and 2002 was obtained by interviewing project managers in December 2002 to gather an after-the-fact best estimate of the number and types of non-compliance events Since then WSDOT has systematically tracked non-compliance events for highway construction and maintenance programs and for operations of the Washington State Ferries (WSF)
How Are We Doing In 2003 WSDOT recorded 41 non-compliance events with 13 leading Non-Compliance Events to issuance by a regulatory agency of a formal Notice of Violation 2001-2003 (NOV) 45
40 In 2003 32 of 41 non-compliance events involved water quality 35
regulations as shown in the chart at right For 2003 the ldquootherrdquo category 30
includes three events associated with underground storage tank rules and 25
one event associated with an air quality violation 20
15
The increase in recorded highway program and WSF non-compliance 10
events from 2001 to 2003 is partially explained by an increased 5
0 emphasis on identifying non-compliance events Because 2003 is the 2001 2002
Fish Habitat OtherWetlands Water Quality first year that WSDOT has systematically tracked non-compliance events apples-to-apples comparison with previous years is not possible For more information about WSDOTrsquos Environmental
Compliance Assurance Procedure please see the The baseline data for 2003 of the number and type of events taking Gray Notebook for the quarter ending March 31 2003
place will help WSDOT staff develop compliance tools for the agency page 18
Source WSDOT Environmental Services OfficeUsing Non-Compliance Data WSF began systematizing data collection on petroleum product spills three years ago The data illustrated ongoing minor problems from hydraulic systems on transfer spans at WSF terminals Last winter WSF Terminal Maintenance began a program to improve inspection of transfer spans and quickly correct any problems This new emphasis includes training for terminal attendants to identify potential leaks in the bridge operation and to report potential leaks to Terminal Maintenance
For the three years since 2001 WSF terminals have had seven four and five hydraulic spills respectively The prevention actions instituted by Terminal Maintenance means that now more WSF employees are aware of and watching for potential problems
2003
Total Resulting Actual Notices
Total
Total
Resulting Actual Notices
Resulting Actual Notices
Beginning of Maintenance and Construction ECAP (Environmental Compliance Assurance Procedure)
Hydraulics system at the Anacortes Ferry Terminal
Integrated Vegetation Management Results
Please see Highway Maintenance IVM report on page 43 of this Gray Notebook
WSDOT also tracks compliance with herbicide and Non-Compliance Eventspesticide application laws covering the products and procedures used to maintain roadside and wetland 2001 2002 2003 mitigation sites The number of product applications in Number of WSDA 8 6 4 2003 went up 17 and the pounds of active ingredient Investigationswent up by 35 from the previous year The number of findings of fault notices from the Washington State Department of Agriculture (WSDA) remained steady at
Number of WSDA Findings of Fault
5 4 2
four Two notices involved overspray leaving the road right Number of Product 2271 3399 4091 of way and two were found not to have merit and dropped Applicationsby WSDA In 2003 WSDA issued two warning letters to WSDOT regarding the alleged injury to two privately owned conifer trees in the town of Loon Lake near Colville The
Total Pounds of Active Ingredient Applied
67156 120171 124290
trees tested positive for diuron that may have come from an earlier WSDOT roadside application of herbicides for total quantity of chemicals used
Measures Markers and Mileposts - December 31 2003 46
46 Measures Markers and Mileposts - December 31 2003
Monitoring Replacement Wetlands Annual UpdateTypes of Mitigation Two WSDOT mitigation bank sites currently provide advance compensation for unavoidable wetlands losses The Moses Lake Mitigation Bank provides five acres of enhanced wetland and about two acres of restored wetland The North Fork Newaukum Mitigation Bank provides 91 acres of enhanced wetland and one acre of restored wetland Since 2002 15 new replacement wetland sites (199 acres) have been added to the overall inventory of wetlands replacement acreage
Meeting Standards in 2003 In 2003 biologists monitored a total of 63 active replacement wetlands ranging from one to eight years in age Of these sites 21 had targets (success standards) to be met in 2003 Monitoring was conducted for 87 individual standards
Of the two sites that did not meet any standards due in 2003 one is in the middle of its planned monitoring period and had poor plant survival and too many weeds The site has been re-planted and because it is close to a river biological weed control is planned The second site is at the end of its planned monitoring period but has not developed into a wetland because it is too dry WSDOT staff are considering appropriate alternatives to achieve this environmental commitment
Completed Replacement Wetlands Successful sites have achieved reasonable ecological success and no longer need monitoring Unsuccessful sites have not met requirements and are ecologically unsuccessful
Reasonable ecological success was achieved on six more sites in 2003 bringing the total of completed sites since 1988 to 53 The total of sites judged successful in this group is 49 (267 acres) The four unsuccessful sites failed due to unpredicted or changed hydrology the most important parameter of wetland success WSDOT is considering options to meet the environmental commitments for these projects
For additional detail on monitoring replacement wetlands and pictures of the different types of projects see the Gray Notebook subject index at wwwwsdotwagovaccountabilitygraybookindexhtm environment and click on ldquoWetland Mitigation and Monitoringrdquo WSDOT has been mitigating for unavoidable wetlands loss with replacement wetlands for 15 years to address the statersquos Executive Order 89-10 which mandates that the actions of state agencies result in no net loss of wetlands Advance mitigation means building replacement wetlands before unavoidable impacts take place Monitoring and reporting on the status of replacement wetlands is critical to the success of the program as seen through the eyes of both the public and the resource protection agencies with whom agreement on these projects must be reached
WSDOT Replacement Wetlands 1988-2003
WSDOT Replacement Wetlands 1988-2003 Total Acreage of Wetland Projects 116 Sites 675 Acres
Olympia Tacoma
Seattle Spokane
Actively Monitoring
Monitoring Complete
Buffer An upland area Enhancement Improvements that protects a wetland from to an existing degraded wetland
126 Acres 119
Acres
189 Acres
181 Acres
60 Acres
adverse impacts (181 Acres to increase or augment wetland increased by 90 acres since function (189 Acres increased 2002) by 100 acres since 2002)
Restoration Re-establishes a wetland area andor function where wetlands previously existed but are no
Creation The establishment longer present (60 Acres of wetland area and functions increased by 3 acres since where none existed (126 Acres 2002) increased by 4 acres since 2002)
Preservation Protecting wetlands from future development ensures that valuable wetland functions continue to provide benefits (119 Acres increased by 2 acres since 2002)
Replacement Wetlands Success in 2003 Total Number of Sites 21
Meeting All WSDOT reported onStandards
22 Acres11
Acres
8 Acres
the status of sites5 Sites with standards to be
achieved in 2003 on a site-by-site
Meeting basis in the 2003Some Annual MonitoringStandards report For detailed14 Sites monitoring results visitMeeting No wwwwsdotwagov Standards environmentwetmon
2 Sites defaulthtm
Success Rate for Replacement Wetlands Success Rates for Replacement Wetlands with Completed MonitoringMonitoring Complete 100 Includes acreage
not yet designated 95 for mitigation credit
90
85 Source for all charts WSDOT Environmental
1988-2001 1988-2002 1988-2003 Services Office 80
Includes acreage not yet designated for mitigation credit Source WSDOT Environmental Services Office
Measures Markers and Mileposts - December 31 2003 47
Measures Markers and Mileposts - December 31 2003 49
Stormwater Treatment Facilities WSDOT routinely builds stormwater treatment facilities to Department of Ecology standard as a part of highway construction Stormwater treatment facilities reduce stormwater flows that cause flooding and harm fish habitat These treatment facilities also remove sediment metals nutrients and other pollutants from highway runoff
In response to municipal stormwater permit requirements WSDOT has tracked the number of new stormwater treatment facilities built in King Pierce Snohomish and Clark counties where about 40 percent of statewide highway construction has occurred since 1996 In the past seven years 300 treatment facilities (an average of 43 per year) have been built in those counties
Out of 1140 miles of highway within the four counties an estimated one percent of state highways have new stormwater treatment facilities constructed each year These treatment facilities help to mitigate and manage the impacts of stormwater runoff from our state highways
In addition to removing pollutants and reducing flooding this pond near I-5 milepost 96 protected a nearby wetland by trapping a 140-gallon accident-related diesel spill from the adjacent freeway
Ponds that infiltrate treated runoff reduce flooding in the winter and help maintain stream flows in the summer
Monitoring Water Quality Impacts for Construction Sites Annual Update In 2003 WSDOT completed its first year of construction site water quality sampling under a new statewide monitoring policy The policy requires sampling on at least 20 percent of all projects with substantial potential for water quality impacts The chart at right summarizes sampling results that compare water quality upstream and downstream from 12 projects Ninety-five percent of the samples met water quality standards for clarity
Of the 200 samples taken nine failed to meet standards The water became muddy on five of the projects because work had to be done in the water or very near the shore The other four projects experienced heavy rainfall ranging from 3frasl4 to 3 inches which overwhelmed the mandated design capacities of approved treatment facilities In all cases monitoring results prompted immediate corrective actions to regain compliance with water quality standards
Case Study Golden Harvest Creek Culvert ReplacementThe Golden Harvest Creek culvert replacement project on SR 21 near the town of Republic in eastern Washington illustrates the challenges associated with keeping sediment out of water when replacing culverts Diverting water around work areas is very effective but the installation and removal of diversions can briefly muddy a stream While removing an old culvert that blocked fish migration some dirt fell into the creek After the new culvert was in place the creek was re-directed into the new channel stranding some fish in the temporary bypass Workers entered the water and carefully moved the fish back into the creek The state standard for clarity of water was exceeded twice during construction but returned to normal within minutes each time
State Water Clarity Standards Compliance Number of Samples for 2003
45 Out of compliance In compliance
30
15
0 Apr May Jun Jul Aug Sep Oct Nov
Water Clarity Monitoring Golden Harvest Creek August 2003
64
25
20
15
10
5
0 5th 5th 6th 7th 12th 13th 14th 15th 18th 19th 20th 25th
Upstream Downstream
State Standard
Water was briefly muddied as workers moved fish back into the stream
Water was temporarily muddied as an old culvert was removed
Source for both charts WSDOT Environmental Services Office
Measures Markers and Mileposts - December 31 2003 48
48 Measures Markers and Mileposts - December 31 2003
Erosion Control Preparedness ndash Annual Update Erosion control is an important component of WSDOTrsquos program to protect the environment In addition to education careful planning and stringent contract requirements WSDOT routinely performs construction site inspections to verify the effectiveness of erosion control measures and makes improvements as needed In the fall of 2003 moderate and high-risk projects (20 in all) were inspected to determine how well they were prepared for the wet season and whether or not erosion led to any water quality violations site damage or delays
The October 2003 storm (see the September 30 2003 Gray Notebook Special Features) for example overwhelmed the treatment measures planned for the runoff from existing pavement An inspection revealed that dirty water was entering Taylor Creek
WSDOTrsquos Environmental Compliance Assurance Procedures were initiated and crews immediately addressed the situation the discharge of dirty water stopped and the incident was promptly reported to the Department of Ecology
Fall Assessment Results This table outlines how
Erosion control measures on SR 18 in the Maple Valley area
well prepared WSDOT was during fall 2003 compared to its level of preparation in 2002
Last year WSDOT identified areas where improvements in erosion control preparedness were needed One area in particular included ensuring that erosion control plans are always on site and up to date with current project conditions (a condition of environmental permitting) Specific actions were taken at statewide meetings and training sessions that
Erosion and Sediment Control Assessment Results 2002 2003 Status
Excellent Clearing limitssensitive area boundaries identified and respected by contractor
Utility trenches excavated in manner to reduce erosion risk Remove temporary erosion and sediment control measures when not needed
100 100 81
100 stable 100 stable 100 improved
Good
Contractor trained in proper use of erosionsediment control measures Sediment trapping measures installed prior to soil disturbing activities Control offsite erosion prevented by controlling flows Protect storm drains from sediment
100 90 87 74
95 decreased 90 stable 84 decreased 82 improved
Fair
If a storm hit at time of site visit water would meet state water quality standards If a storm hit at time of site visit adjacent property would be protected Effectiveness of measures installed to trap sediment Erosion control plans are on site and up to date for all WSDOT projects
86 83 96 56
80 decreased 80 decreased 78 decreased 75 improved
Poor
Manage construction site water in manner reducing sediment deposition risk Perform maintenance on temporary erosion and sediment control measures Construction access routes stabilized to prevent tracking of mud onto streets Effectiveness of measures installed to prevent erosion Temporary stormwater conveyance channels stabilized Protect cut and fill slopes from concentrated runoff Amount of disturbed soil actually covered with erosion control measures
100 70 98 91 90 67 65
71 decreased 70 stable 69 decreased 67 decreased 64 decreased 50 decreased 45 decreased
resulted in an improvement Source WSDOT Environmental Services Office of 19 percent
In 2003 the overall assessment increased in three areas while it remained the same or had little change in seven others WSDOTrsquos preparedness in the remaining eight areas decreased substantially creating an elevated risk to increased erosion when compared to last year The decrease in the bottom five areas in the ldquoPoorrdquo category are directly attributed to one or both of the following reasons (1) the extremely dry weather this fall extended large earthwork activities into the ldquowet seasonrdquo delaying soil cover practices and (2) drought conditions reduced effectiveness of late spring and early fall seeding applications
Summary and Next Steps An analysis of the 20 projects documents that 12 had no problems preventing erosion Projects experiencing minor problems increased by 16 percent from 2002 for a total of seven The minor problems were promptly corrected without regulatory agency involvement or high repair costs One project experienced major problems that involved one Notice of Violation The plan to improve performance on issues in the ldquoPoorrdquo to ldquoFairrdquo ranges includes increased technical assistance improved contract enforcement and increased emphasis in training
Measures Markers and Mileposts - December 31 2003 49
Measures Markers and Mileposts - December 31 2003 51
Incident Response Quarterly Update Program Totals WSDOT Incident Response Program provides roving service to clear roads and help drivers on Washingtonrsquos heavily traveled freeways Along with the WSDOT roving units non-WSDOT units provide contracted roving services These units include the Washington State Patrol (WSP) Cadets Registered Tow Truck Operators (RTTO) and a Motorist Assist Van (MAV)
Incident Reasons and Clearance Times Washington Statersquos target is to clear all incidents within 90 minutes During the fourth quarter 71 percent of major incidents were due to motor vehicle collisions Major incidents are however only two percent of all incidents on state roadways The most frequently occurring incidents which are likely to cause slowdowns during daily commutes are disabledabandoned vehicles or debris blocking traffic (82 percent of all incidents) During the fourth quarter 85 percent of incidents were cleared within 30 minutes and 47 percent were cleared in less than 10 minutes
Detection and Response by Roving Notification and Call-out The roving Incident Response Program is an effective means to keep traffic moving on freeways because the responders quickly detect incidents on the roadways During the fourth quarter 70 percent
Abandoned Vehicles (6)
Hazardous Materials and Fatal Collisions were less than 1 percent each
Incidents Lasting90+ Minutes Fatality
Disabled Vehicles Collisions (15)(9)Haz Mat Abandoned
(5) Vehicles Fire (2) (2) Debris
(4)
Incidents Lasting LessThan 15 Minutes
Non-Injury Other Collisions (4) (4)
Debris (10)
Abandoned Vehicles (27)
Disabled Vehicles 55
Injury Collisions Fatal Collisions Fire and Hazardous Materials were less than 1 percent each
Incidents Lasting 15 to 90Minutes Injury Collisions Fire(7) (1)Other (2)
Non-Injury (20)
Debris (5)
Disabled Vehicles 58
of all incidents were detected by roving units Roving units were notified of the remaining 30 percent of incidents Call-out units respond to severe incidents that occur Other
(2)
Non-Injury (32)
Injury Collisions (30)
outside roving zones or during non-roving hours There were 129 call-out responses during the fourth quarter which amounted to one percent of all the incidents responded by the IR program
Blocking versus Non-Blocking Locations The location and duration of an incident can impact traffic greatly Overall 67 percent of all incidents were on the shoulders and medians of roadways and did not block travel lanes Seventy percent of the incidents that were cleared in less than 30 minutes occurred within shouldersmedians and did not block travel lanes Of the major incidents lasting 90 minutes or more 80 percent were blocking travel lanes
Source for all charts WSDOT Traffic Office
Total Number of Responses by Month July 2002 to December 2003
5000
4500
4000
3500
3000
2500
2000
1500
1000
500
0
WSDOT IRT 2003 Contracted IRT Units 2003
2002
Jul Aug Sep Oct Nov Dec Jan Feb Mar Apr May Jun Jul
Average Clearance Time (in Minutes) January 2003 to December 2003
35
30
25
20
15
10
5
0
For All Incidents
For Incidents Lasting 15-90 Minutes
Jan Feb Mar Apr May Jun Jul Aug Sep Oct Nov Dec
Average Clearance Time for Incidents Lasting Over 90 Minutes 3-Year Comparison July 2001 to December 2003
300
250
200
150
100
50
0
July 2001 to June 2002
July 2002July to to June 2003December 2003
Jul Aug Sep Oct Nov Dec Jan Feb Mar Apr May Jun
Number of Incidents by Location and Clearance Time October 2003 to December 2003
Travel Lanes
ShoulderMedian
6000
5000
4000
3000
2000
1000
0 Less 10- 20- 30- 40- 50- 60- Over than lt20 lt30 lt40 lt50 lt60 lt90 90 10 min
Measures Markers and Mileposts - December 31 2003 50
50 Measures Markers and Mileposts - December 31 2003
Over 90 Minute Incidents There were 243 incidents lasting 90 minutes or longer during the fourth quarter of 2003 Incidents are located by dots on the map All incident records collected into the WSDOT Incident Tracking System (WITS) are being mapped for exact locations by state route and milepost for further analysis
Examples of Incidents Over 90 Minutes The following five incidents had the longest clearance times for the period between October 1 2003 and December 31 2003
bull October 1 ndash A fuel tanker truck overturned on I-5 in King County A single northbound lane was intermittently closed as multiple tow trucks responded to the scene to try and right the truck After multiple attempts the fuel was pumped from the truck so that it could be righted WSDOT Incident Response set up traffic control until recovery was complete 104 hours was required for Incident Response to clear the scene
bull October 8 ndash A semi truck traveling from westbound I-90 to northbound I-5 in Seattle drove off the elevated ramp falling approximately 30 feet and landing on the roadway below The tractor-trailer and cargo were demolished on impact necessitating a lengthy and technical clean up WSDOT Incident Response responded to the scene for traffic control and clean up 82 hours were required to clear the scene
bull October 12 ndash A loaded fuel tanker lost control on SR 9 just north of Wickersham in Whatcom County causing the rear trailer to roll on its side leaking fuel onto the shoulder and into the drainage system A detour route was set-up and a private contractor was called in to clean up the fuel spill WSDOT Incident Response assisted with traffic control and helped to clear debris from the roadway 164 hours were required to clear the scene
bull November 22 ndash A collision on US 97 near Goldendale involving a semi truck resulted in multiple lane closures as the scene was cleared WSDOT Incident Response set up traffic control and assisted other agencies Responders were able to keep traffic flowing throughout most of the incident 85 hours were required to clear the scene
bull December 9 ndash On SR 9 near the city of Sumas in Whatcom County a semi truck lost control and drove off of the roadway overturned spilling its load of lumber A detour was set-up for both northbound and southbound traffic WSDOT Incident Response performed traffic control and cleared debris 80 hours were required to clear the scene
Over 90 Minute Incidents for Quarter Four 2003
Seattle
Tacoma Olympia
Spokane
Vancouver
Everett
Service Actions The Incident Response roving program provides various services to motorists Traffic control is the most common service provided On an average day during the fourth quarter incident response personnel (all units) provided fuel to 14 vehicles cleared 12 pieces of debris changed 12 flat tires pushed 8 vehicles and performed 6 minor car repairs
Response Types October to December 2003
Total Incident Responses = 12341 bull 1717 Collisions (14) bull 10624 Non-Collisions (86)
Oct Nov Dec Fatality Collisions 6 11 10 Injury Collisions 147 147 134 Non-injury Collisions 377 417 468 Disabled Vehicles 2435 2120 2320 Abandoned Vehicles 787 705 784 Debris 420 330 290 Fire 24 17 27 Hazardous Materials 15 5 4 Other 132 139 149 Some non-collisions fall into more than one of the above categories
Service Actions Taken for Non-Collision Responses October to December 2003
Oct Nov Dec Traffic Control 425 370 429 Provided Fuel 324 286 269 Changed Flat Tire 323 255 220 Minor Repair 281 203 260 Pushed Vehicle 145 178 190 Towed Vehicle 160 115 144 Cleared Debris 90 84 84
Source WSDOT Traffic Office
Measures Markers and Mileposts - December 31 2003 51
Measures Markers and Mileposts - December 31 2003 53
Travel Information Quarterly Update
Since the launch of 5-1-1 Travel Information Service in July 2003 calls have increased by 74 percent (from 30478 to 52903) during the first six
month period
5-1-1 is a three-digit travel information number designated by the Federal Communications Commission (FCC) to provide around the clock traffic and road condition information
The 5-1-1 system lets the commuter check real-time traffic conditions using a cell phone and voice commands Although some users have experienced difficulty at times with the voice recognition aspect of this system it will continue to be enhanced as technology improves WSDOT is currently developing a plan to address these issues and make the 511 system more user-friendly
1-800-695-ROAD In December 2003 the total number of calls to 1-800-695-ROAD slightly decreased from the level in December 2002 However the total number of calls to Travel Information combining 1-800-695-ROAD and 5-1-1 calls together increased It is likely that 5-1-1 is replacing some of the calls to 1-800-695-ROAD
During the fourth quarter of 2003 the total number of calls to 1-800-695-ROAD and 5-1-1 increased by 786 percent with 481706 calls in 2003 versus 269675 calls in 2002
Travel Information Service Calls to 1-800 Road and 5-1-1 Calendar Year 2002-2003
250000
200000
150000
100000
50000
0 Jan Feb Mar Apr May Jun July Aug Sep Oct Nov Dec
2003 1-800-ROAD 2002 1-800-ROAD
Current Quarter 2003 5-1-1
On the Web Page views to Traveler information continue to increase They are up an average of 93 over the same quarter last year
Traveler Website Daily Usage Daily Average Page Views per Month (in millions)
Jan Feb Mar Apr May Jun Jul Aug Sep Oct Nov Dec 00
05
10
15
20
25
30
Current Quarter 2003 2002
Daily Average Page Views per Month Quarter 2002 and 2003 (in millions)
2002 2003 increase
October 08 17 113 November 13 30 131 December 21 29 38
In comparison to last yearrsquos numbers October saw an increase of 113 percent and November saw a 131 percent increase in daily page views
Highest One Day Total On November 19 2003 WSDOTrsquos web site received 68 million page views
bull 97 went to Traffic and Travel Information
bull 87 of those views originated from the WSDOT site ndash the remaining were from WSDOT through news and other sites such as KIRO KING and KOMO who used WSDOTrsquos cameras and flowmaps
WSDOT is also responding to the increasing number of requests for traffic and travel information to display on mobile devices Developments will be reported as they occur
Source WSDOT Communications Office
Source WSDOT Traffic Office
Measures Markers and Mileposts - December 31 2003 52
52 Measures Markers and Mileposts - December 31 2003
Options to Drive Alone Commuting Quarterly Update Park and Ride Lot Occupancy at WSDOT-Owned Sites in King County During the third quarter of calendar year 2003 occupancy of the 8500 parking spaces in the 32 WSDOT lots in King County averaged 73 percent
A three percent decrease in occupancy from the second quarter was due to summer seasonal declines in transit use About 50 percent of WSDOTrsquos park and ride lots in King County surpassed the target of 70 percent occupancy during the quarter Parked cars regularly exceeded maximum capacity in five lots
Highlights bull The new Issaquah Highlands Interim Park and Ride lot opened at the end of September This Sound Transit lot offers 103 parking spaces for commuters King County Metro is developing a permanent Park and Ride structure at Highland Dr NE and NE High St that is scheduled for completion in late 2005
bull The new 5-story Eastgate Park and Ride garage is scheduled for completion in June 2005
WSDOT-Owned King County Park and Ride Lots Percent of Capacity Used January 2001 through September 2003
100
90
80
70
60
50
Actual
Occupancy should exceed this target
Qtr 1 Qtr 2 Qtr 3 Qtr 4 Qtr 1 Qtr 2 Qtr 3 Qtr 4 Qtr 1 Qtr 2 Qtr 3 2001 2002 2003
Data availability has a lag of three months to allow the transit systems to collect and analyze the data Data for the fourth quarter of 2003 will be available in the next Gray Notebook
Source WSDOT Analysis of King County Metro data
bull Transit agencies throughout Puget Sound report persistent overcrowding at Park and Ride lots along major corridors due to lack of capacity and growing demand Efforts to increase transit and ridesharing are hampered by insufficient capacity at many commuter Park and Ride facilities
Vanpools in the Puget Sound Region Beginning with this issue of the Gray Notebook vanpool information and analysis will reflect a lag of three months in reporting data Reporting on the previous quarter will allow for more complete verification of the data During the third quarter the number of vanpools in operation in the region peaked in July (1376) followed by small decreases in August (1358) and September (1352) Despite the recent decrease the total number of vehicles on the road is up 35 percent since September 2002 when there were 1306 vanpools
Quarterly Regional Vanpool Highlights There are now 62 vanpool VanShare groups in operation in the Puget Sound region The VanShare program provides connections for employees between trains ferries park and ride lots and their work sites The VanShare program has proven to be very successful with Sounder trains on the Tacoma line (34 VanShare groups) King County Metro staff have begun marketing the VanShare program to employees riding between Everett and Seattle
bull Enhancements to regional Internet ridematch service in Puget Sound will provide a direct benefit to vanpools The improved service has the ability to ndash Provide up to 30 names on a match list request ndash Allow easier route planning with map viewing of Park amp Ride lots
Puget Sound Vanpool and VanShare Trends
1380
1360
1340
1320
1300
1280
1260
1240
Vanpools and VanShare
Vanpools Only
Jun Sep Dec Mar Jun Sep Dec Mar Jun Sep 2001 2002 2003
Data availability has a lag of three months to allow the transit systems to collect and analyze the data Data for the fourth quarter of 2003 will be available in the next Gray Notebook Source WSDOT Transportation Demand Management Office
ndash Increase user ability to select newest names on the match list ndash an effective tool for vanpool groups looking for riders ndash Provide promotional email message to users about their companyrsquos rideshare incentives along with an Employee Transportation Coordinator (ETC) contact phone number
Coming Next GNB Edition Commute Trip Reduction Task Force 2003 Report to the Washington State Legislature
Measures Markers and Mileposts - December 31 2003 53
Measures Markers and Mileposts - December 31 2003 55
Customer Feedback Washington State Ferries (WSF) collects customer complaints compliments comments and suggestions This information is recorded in the Automated Operating Support System (AOSS) database for measurement and action based on database cross tabulation and analysis
The charts show trends in the data for the last four fiscal years and the first two quarters of fiscal year 2004 (July 1 ndash December 31 2003)
Customer complaints were up 12 percent from the preceding quarter Complaints have increased for three consecutive quarters
WSF received 53 food service related complaints during the quarter This is only the second quarter in two and one-half years that food service has been in the top four comment types A total of 46 food complaints were received on the Edmonds-Kingston route during a two-week period in November when the MV Quinault was in service on this route The MV Quinault did not have galley service and is a much smaller vessel than the Jumbo Class ferry she was replacing
Washington State Ferries Quarterly Update
Vanpools exiting ferry on Bainbridge Island
N
20
305
16
160
3
525
104
104
104
20
20
525
3
101
1
Tacoma
Everett
Mt Vernon
Victoria
Bellingham
Port Angeles
Shelton
Seattle
5
5
5
5
90
405
Sidney
Shaw
Orcas
Keystone
Port Townsend
Clinton
Mukilteo
Kingston
FauntleroySouthworth
Vashon
Tahlequah
Point Defiance
Bainbridge Island
Edmonds
Anacortes
Bremerton
Friday Harbor
Lopez
2
101
AutoPassenger
Passenger-Only
Washington State Ferries Route Map
Total Customer Complaints Most Common Customer Comments Complaints per 100000 Customers Top Four Comment Types per 100000 Customers
15 12
10
10 08
06
5 04
02
0 0
Food Service
Loading Unloading
Compliments
On time performance
FY FY FY FY Qtr 1 Qtr 2 FY FY FY FY Qtr 1 Qtr 2 2000 2001 2002 2003 2004 2000 2001 2002 2003 2004
Does not include compliments or suggestions
Source for all charts WSDOT Ferries
Measures Markers and Mileposts - December 31 2003 54
54 Measures Markers and Mileposts - December 31 2003
On-Time Performance WSF has been collecting on-time performance data since June 2001 The table below compares WSF on-time performance across the system for the second quarters of fiscal year 2003 and 2004
Delays in the San Juan Islands are due primarily to construction activity at Shaw Island (see ldquoTrip Reliabilityrdquo comments below)
Improved on-time performance was experienced on WSFrsquos busiest route the FauntleroyndashVashonndashSouthworth route Approximately one quarter of all trips by WSF are made on this triangular route structure Fall schedule changes were developed with the Ferry Advisory Committees at Vashon and Southworth resulting in a schedule that increased on-time performance and allowed much needed late night maintenance on the three vessels serving this route
On-Time Trip Delivery Second Quarter Fiscal Year 2003 Second Quarter Fiscal Year 2004
All Trips All Trips A trip is considered toPercent of Average Percent of Average be on time if it departsTrips Within Delay From Trips Within Delay From
within ten minutes of theNumber 10 minutes Scheduled Number 10 Minutes Scheduled of Trips of Schedule Sailing Time of Trips of Schedule Sailing Time published scheduled
San Juan Domestic 5591 85 46 minutes sailing time Missed trips International Route
6443 94 27 minutes
EdmondsKingston 4564 94 31 minutes 4499 93 35 minutes1564 95 28 minutes
Passenger-Only SeattleVashon 1041 94 24 minutes 1003 98 22 minutes9534 91 43 minutes
KeystonePort Townsend 1852 96 24 minutes 1826 93 32 minutes6178 98 20 minutes
Point DefianceTahlequah 2708 93 40 minutes 2782 95 31 minutes4031 96 28 minutes
SeattleBremerton 2563 98 27 minutes 2451 97 31 minutes
152 85 48 minutes are not reported using this measure They
Passenger-Only SeattleBremerton
176 84 37 minutes
Service discontinued are included in the Trip Reliability measure
FauntleroyVashonSouthworth 9602 93 32 minutes
MukilteoClinton 6335 99 20 minutes
SeattleBainbridge Island 3901 98 26 minutes
Total 40654 94 30 minutes 38142 94 31 minutes
Trip Reliability WSF scheduled a total of 41678 trips during the 2nd quarter of fiscal year 2004 Of these trips 486 were missed Sixty-one percent (296) of the missed trips resulted from closures of the Shaw Island terminal during work on a $65 million preservation contract (see details on below) The chart below shows a system-wide average reliability index Assuming that a commuter worked 200 days per year and made 400 trips on WSF the statistical likelihood is that 47 ferry trips would be cancelled This rating represents a 178 decline in the reliability rating from the preceding quarter and a 140 decline in performance over the same period last year
Most Common Trip Cancellation CausesTrip Reliability Index Second Quarter Fiscal Year 2004Trip Reliability Index
rips per 400 SailingsMissed TMissed Trips per 400 Sailings
50
45
40
35
30
25
20 Other (7)15
Terminals (63)
Electrical (50)
Related Propulsion and Steering (43) Other (7)
Vessel
(19)
TidesWeather 10 (11) 5 WSF is undertaking a $65 million preservation contract at the Shaw Island
terminal this biennium Extensive pile driving and ldquoover waterrdquo work was accomplished this quarter to optimize environmental construction windows and seasonal traffic lulls WSF worked closely with the community on Shaw Island and throughout the San Juans to craft mitigation strategies
Cancelled Trips (Average Annual aimed at minimizing disruptions Trip Reliability Index Number = X 400
0
Total Scheduled Number of Because Shaw is a single slip facility closures were necessary duringTrips Commute Trips) regular service hours There was no service to Shaw Island during midday
from September 22 through November 7 One weekend closure was necessary September 27 and 28 Finally WSF completely shut down service from November 8 to November 11 All closures were coordinated
Source for all charts WSDOT Ferries with the community
Qtr 2Qtr 1 2004
FY FY FY FY FY 1999 2000 2001 2002 2003
Measures Markers and Mileposts - December 31 2003 55
Measures Markers and Mileposts - December 31 2003 57
WSF Construction Program ExpendituresCapital Expenditure Performance 2003-2005 Biennium 2nd Quarter Cumulative Dollars in Millions
WSDOT makes capital investments in the Ferry System Authorized vs Actual
through the Washington State Ferries Construction Program The program preserves existing and builds new ferry terminals and vessels supporting the Ferry System the capability to deliver responsible and reliable services WSF planned to spend $595 million over the period July-December 2003 Actual expenditures were $326 million bull Terminal Construction activities are under-spending
by $201 million The Port Townsend Preservation and Improvement projects are $63 million under the plan because project scopes have been revised and work deferred to later biennia Spending for property acquisition and design of the Edmonds Multimodal Terminal is $40 million behind due to a cautious approach to environmental issues and to negotiations with tribes System-wide projects are behind in spending by $25 million particularly in system planning activities and technical support to construction The Eagle Harbor Preservation project is $17 million behind in spending The Anacortes Multimodal Terminal project is $14 million behind in spending Both projects are experiencing slow starts The Shaw Terminal Preservation project is under-spending through December by $15 million and is expected to be completed under budget The Mukilteo Multimodal Terminal is underutilizing new law funds by $10 million This reflects WSFrsquos use of current law federal grants first before expending new law funds and a time lag between
Life Cycle Preservation Performance WSF terminals and vessels consist of several thousand components divided into Category 1 and Category 2 systems and structures Category 1 systems and structures are vital to the protection of people the environment and infrastructure All other terminal and vessel components are designated Category 2 Each component should be refurbished or replaced at the end of its life cycle to assure that WSF can provide responsible and reliable service
WSF has a work plan based on legislative funding to address the backlog of systems and structures that are past due as well as those constituting on-going deterioration of terminal and vessel components This biennium WSF plans to replace or refurbish 133 Category 1 systems and structures and 54 Category 2 components Twenty-three Category 1 systems and structures and two Category 2 items were completed through the second quarter
WSF uses life cycle ratings to measure the impact of its preservation activities The life cycle rating for Category 1 terminal and vessel components is projected to increase from 77 percent at the beginning of the biennium to 81 percent at the end of the biennium The life cycle rating for Category 2 components is projected to decline from 58 percent to 54 percent
Source for all charts WSDOT Ferries
$ 200
$ 150
$ 100
$ 50
$0
Authorized
Actual
Qtr 1 Qtr 2 Qtr 3 Qtr 4 Qtr 5 Qtr 6 Qtr 7 Qtr 8
consultant work and billings The Kingston Sewer Outfall project was paid for in the prior biennium freeing $08 million budgeted in the current biennium for other projects
bull Vessel Construction activities are under-spending by $62 million Variances include The MV Spokane is $55 million behind planned expenditures due to slower than expected billings for equipment procurement The MV Klahowya is $23 million behind because work is deferred to later in the biennium The MV Cathlamet is $17 million over plan because of unanticipated carry forward costs from the prior biennium
bull Emergency Repair activities are under-spending the plan by $06 million
Category 1 Terminal amp Vessel Systems amp Structures Preserved Cumulative Systems Preserved Planned vs Actual 2003-2005 Biennium Quarter 2 Ending December 31 2003
150
100
50
0 Qtr 1 Qtr 2 Qtr 3 Qtr 4 Qtr 5 Qtr 6 Qtr 7 Qtr 8
Planned
Actual
Category 2 Terminal amp Vessel Systems amp Structures Preserved Cumulative Systems Preserved Planned vs Actual 2003-2005 Biennium Quarter 2 Ending December 31 2003
60
50
40
30
20
10
0
Actual
Planned
Qtr 1 Qtr 2 Qtr 3 Qtr 4 Qtr 5 Qtr 6 Qtr 7 Qtr 8
Measures Markers and Mileposts - December 31 2003 56
56 Measures Markers and Mileposts - December 31 2003
Ridership and Revenues The Legislaturersquos Joint Task Force on Ferries (JTFF) comprised of legislators citizens ferry management and ferry workers was formed in 2000 The Task Force reviewed the workings of the WSF system and made recommendations including tariff increases designed to raise the farebox recovery rate to 80 percent of operating costs over six years The Transportation Commission instituted this recommendation and approved tariff increases of 20 percent in June 2001 and 125 percent in May 2002
In the fall of 2003 WSF management developed a new strategic plan aimed at balancing revenue generation necessary to capitalize the aging fleet The new plan reduced the size of the tariff increases for fiscal years 2003-2004 In the spring of 2003 the Transportation Commission adopted fare increases of five percent in May 2003 and an additional five percent in May 2004
As a result of the lower tariff increases ridership is not projected to fall as rapidly as anticipated in the original plan Repeating the pattern from fiscal year 2003 through the second quarter of fiscal year 2004 WSF has experienced slightly higher than projected ridership and revenues
Fiscal year to date ridership has exceeded the plan by four percent or 488000 riders Farebox revenues exceeded the plan by three percent or $2 million (Plan is based on June 2003 forecast)
Ferries Ridership by Month in Millions
3
2
1
0
FY 2004 Actuals
FY 2003 Actuals
FY 2004 Planned
Jul Aug Sept Oct Nov Dec Jan Feb Mar Apr May Jun
Ferries Farebox Revenues by Month Dollars in Millions
$15
$10
$5
$0
FY 2004 Planned
FY 2004 Actuals
FY 2003 Actuals
Jul Aug Sept Oct Nov Dec Jan Feb Mar Apr May Jun
Source for all charts WSDOT Ferries
Farebox Recovery Rate WSFWSF Annual Farebox Recovery RatesAnnual Farebox Recovery RatesFarebox recovery is the percent of annual operating and
maintenance costs recovered through tariffs and other non-tax 100revenues In line with WSFrsquos strategic plan farebox recovery
rates for fiscal year (FY) 2003 were up 54 percent from FY 2002 This is largely due to the May 2002 tariff increase 80
combined with cost saving initiatives A complex blend of cost increases also affected farebox recovery rates For example 60 total operating maintenance and support costs increased $44 million fuel costs increased $45 million insurance increased 40 $13 million and self insurance premiums and tort claims were up $16 million 20 Top performing individual routes in FY 2003 were Edmonds ndash Kingston (121 percent) Bainbridge ndash Seattle (110 percent) 0 and Mukilteo ndash Clinton (95 percent) On average auto routes 1998 recovered 76 percent of operating costs through the farebox while passenger only routes recovered 27 percent WSF also Source WSDOT Ferries
views each routersquos farebox recovery performance over several years as the trend is more important than a snapshot Extraordinary maintenance costs service interruptions or even route closures for terminal construction and many other isolated activities can dramatically effect farebox recovery during a one year period
1999 2000 2001 2002 2003
Measures Markers and Mileposts - December 31 2003 57
Measures Markers and Mileposts - December 31 2003 59
0
10000
20000
State-Supported Amtrak Cascades Service Quarterly Update
Ridership Ridership on state-supported Amtrak Cascades trains was 90664 in the fourth quarter of 2003 This was nearly identical to the fourth quarter of 2002 Trains that showed slight ridership increases during the quarter include the morning Seattle-Portland train both midday trains between these cities and the two Seattle-Bellingham trains The Seattle-Vancouver BC trains experienced the largest ridership decreases during the final quarter of 2003 contributing to a decline of over 8000 riders for the entire year on this route Factors that led to this decline include an increase in the number of cruise ship passengers departing from Seattle rather than Vancouver BC the overall effect of tourism and a lower exchange rate for the US dollar in Canada
For the entire year ridership was 385585 on state-supported trains also a slight increase over 2002 For all trains in the Amtrak Cascades system including those financially supported by the state of Oregon and Amtrak ridership was 589743 This represents the ninth consecutive year of ridership increases
Customer Satisfaction Amtrakrsquos Customer Satisfaction Index (CSI) is based on surveys of riders using the service The scores represent three-month rolling averages The CSI goal for Amtrak Cascades is 91 (out of 100) or better In the most recent survey period the overall score for Amtrak Cascades was 90 This score continues to be one of the highest in Amtrakrsquos national system and is nine points higher than the national average for routes of similar distance Survey responses showed high customer satisfaction with access to trip information prior to boarding the train the smooth and comfortable ride and the friendliness and helpfulness of train conductors Survey questions that produced lower scores include the quality and variety of food available on the trains and on-time performance
On-Time Performance On-time performance for state-supported Amtrak Cascades trains averaged 672 percent for the last three months of 2003 This was nearly eight points below the performance for the same period in 2002 and well below the goal of 80 percent set by WSDOT and Amtrak The primary cause of delays during the fourth quarter of 2003 was rail freight traffic congestion throughout the corridor and speed restrictions imposed by the railroad where rail line maintenance was taking place For the entire year on-time performance for Amtrak Cascades trains averaged 719 percent up slightly from 2002
Photo by Jeffrey T Schultz
State-Supported Amtrak Cascades Monthly Ridership Number of Passengers
50000
40000
30000
20000
10000
0
2003
2002
Jan Feb Mar Apr May Jun Jul Aug Sep Oct Nov Dec
Amtrak Cascades Annual Ridership 1994-2003
700000
600000
500000
400000
300000
200000
100000
0
Source for all charts Amtrak and WSDOT Rail Office
WashingtonAmtrak Trains
OregonAmtrak Trains
1994 1995 1996 1997 1998 1999 2000 2001 2002 2003
2003 data
50000
40000
30000
Measures Markers and Mileposts - December 31 2003 58
58 Measures Markers and Mileposts - December 31 2003
State-Supported Amtrak Cascades On-Time Performance 2003 vs 2002 Percent On-Time 2002 Average 708 2003 Average 719
Farebox Recovery The farebox recovery per train measures the percentage of total annual operating costs generated through ticket fares The average farebox recovery rate for the eight Amtrak Cascades trains financially supported by WSDOT was 399 percent in federal fiscal year (FFY) 2003 which was three points lower than in FFY 2002 This rate decline was driven by slightly lower revenues in FFY 2003 (-15 percent) when compared to the preceding year and a six percent increase in total operating expenses Costs that grew in FFY 2003 included diesel fuel and equipment insurance WSDOT and Amtrak hope that economic recovery in the Pacific Northwest will support higher revenue yields and improved farebox performance for Amtrak Cascades in 2004
King Street Station Update The renovation of King Street Station in downtown Seattle continued in the last quarter of 2003 Projects included final installation work on the temporary restrooms on the east side of the building construction work on replacement restrooms and removal of some interior walls on the first floor of the facility The elimination of these walls has exposed portions of the original interior walls and ceilings much of which has not been seen by visitors to the station in over 40 years The newly exposed sections inside the station will eventually become part of an enlarged passenger waiting area by Summer 2004
Washington Grain Train Update The Washington Grain Train carried 301 carloads of grain in the last quarter of 2003 This was 77 percent higher that in the final quarter of 2002 Quarterly growth was driven by slight increases in grain car usage by cooperatives near Moses Lake and Walla Walla and by the new grain train operating between Marshall and Pullman In 2003 the Washington Grain Train carried 1058 carloads a 21 percent increase over the total of 874 for 2002 The 2003 traffic increase was largely attributable to the third Washington Grain Train that began service in April 2003
The Washington Grain Train is a financially self-sustaining transportation program that supports the statersquos agricultural community while helping short line railroads maintain a sufficient customer base for long-term financial viability The 94-car fleet is jointly owned by WSDOT (76 cars) and the Port of Walla Walla (18 cars) The ports of Walla Walla Moses Lake and Whitman County share fleet management responsibilities
100
75
50
25
0
Jan Feb
Goal 80
2002
2003
Mar Apr May Jun Jul Aug Sep Oct Nov Dec
The on-time performance goal for Amtrak Cascades is 80 or better A train is considered on-time if it arrives at its final destination within 10 minutes or less of the scheduled arrival time
State Supported Amtrak Cascades Farebox Recovery Per Train
100
80
60
40
20
0
FFY 2002
FFY 2001
FFY 2003
Train 501 506 507 508 510 513 516 517 Number SEA PORT SEA PORT SEA BELL SEA VAN
to to to to to to to to PORT SEA PORT SEA VAN SEA BELL SEA
Source for above charts Amtrak and WSDOT Rail Office
Washington Grain Train Carloads Carloads Per Month 2002 vs 2003
2003 1058 carloads 140
120
100
80
60
40
20
0 Jan Feb Mar Apr May Jun Jul Aug Sep Oct Nov Dec
2002 874 carloads for 12 months
for 12 months
Source WSDOT Rail Office
Measures Markers and Mileposts - December 31 2003 59
Measures Markers and Mileposts - December 31 2003 61
Special Features Organic Recycling Earns Award for WSDOT The Washington Organic Recycling Council (WORC) presented WSDOT with an award December 11th for ldquofulfilling the vision of innovative application and specification of compost in Washington State roadside developmentrdquo Everyone benefits when organic materials are recycled into products of value These products improve the quality of landscape materials They have a positive impact in our environment by improving soil and plant health conserving water reducing erosion and reducing the use of fertilizers and pesticides They also replace other sources of wood for paper and fuel production
The award recognized in particular the work of the Roadside and Site Development Unit
WORC credits WSDOT with the use of one-third of the compost produced in the state For more information on good composting practices visit wwwcompostwashingtonorg
WSDOT Receives 2003 Federal Performance Letter ldquoReport Cardrdquo from FHWA Each year the Washington Division of the Federal Highway Administration (FHWA) audits WSDOTrsquos compliance with federal rules and regulations In summarizing this yearrsquos overall results the 2003 Performance Letter signed by FHWA Division Administrator Daniel M Mathis stated ldquoBased on the inspections reviews program evaluations and audits conducted in FY 2003 it is my finding that WSDOT has complied with federal laws and regulations in expending federal-aid highway funds allocated to the State of Washingtonrdquo
The performance letter evaluates WSDOTrsquos performance in 21 project and program areas such as bridge inspection standards financial billing environmental commitments and program efficiencies The letter called out a positive example of WSDOTrsquos work ldquoconstruction costs reported in the Gray Notebook are accurate and track closely with the data we have compiledrdquo In addition FHWA noted some areas for improvement such as ensuring all bridge inspections are completed within the 24 month frequency requirement using the pavement smoothness standard more consistently and establishing a tracking database to assure that environmental commitments are not affected by project changes
Mathis concluded the letter by commending WSDOT ldquofor continuing to strengthen your performance management initiatives such as the Gray Notebook your continued efforts in enhancing these tools provides further evidence that WSDOT is focused on being accountable for state and federal transportation fundingrdquo The 2003 Performance Letter can be found on-line at wwwwsdotwagovaccountabilityFHWA_FY2003_performancereportpdf
Global Positioning at WSDOT Surveyors have been using Global Positioning Systems (GPS) for years Most people are acquainted with non-survey level GPS technology as a navigational aid in their vehicles for wayfinding on a hike and even for keeping tabs on a child or family pet
WSDOT is using GPS to inventory the locations of roadway features such as signs guardrails pavement conditions trees utility devices drainage systems bridges traffic devices light poles etc It can accurately record the location of maintenance procedures such as mowing spraying or striping GPS is also being used for wetland delineation
In future editions of the Gray Notebook WSDOT will be presenting more detailed information on how GPS is being utilized
Measures Markers and Mileposts - December 31 2003 60
60 Measures Markers and Mileposts - December 31 2003
Highlights of Program Activities Quarter Ending December 31 2003
Project Starts Completions Updates bull WSDOT began on Dec 17 charging its contractor penalties of about $3000 per weekday for every day that opening of the State Route (SR) 290 Trent Avenue Bridge in Spokane was delayed Working days were re-negotiated and added to the projectrsquos contracted schedule in May 2003 when some unanticipated construction conditions were discovered At that time WSDOT approved a new schedule submitted by the contractor Ross Bros amp Co of Salem Oregon for a mid-December completion In late November it became apparent that Ross Bros was not going to be able to meet that schedule Penalties will be withheld from the final payment of the $89 million contract
bull The SR 519 (South Royal Brougham Way) project near the Seattle waterfront Safeco Field and Seahawk Stadium cleared a major hurdle when the old ramp from Fourth Avenue South to eastbound Interstate 90 was demolished The demolition contractors RW Rhine finished the task in 10 days This allowed WSDOT crews to re-open the vital I-5 and I-90 exits to Fourth Avenue South along with several major streets and intersections in the area The new structure created by this project separates vehicle pedestrian and rail traffic and provides a greater margin of safety for all
bull A series of late October storms dumped record setting rain severely damaging SR 20 in several locations causing the earliest closure of the North Cascades Highway ever Some of the worst damage occurred at Pyramid Creek (MP 126) and Ketchum Creek (MP 124) where large sections of roadway disappeared guardrail was left hanging and torrential rain rocks and dirt rendered large culverts useless WSDOTrsquos contractor Pacific Road and Bridge made progress stabilizing and rebuilding the roadway portions damaged by water and a primitive but passable road is now in place Crews will return next spring to lay down the final layer of asphalt However on November 9 a huge rockslide thundered down the mountainside just east of Newhalem slamming into Highway 20 taking out portions of roadway and cutting off access to the town of Diablo in Whatcom County URS Corporation the contractor monitoring and surveying the hillside has placed monitoring equipment on the unstable slope The instruments will indicate if the hillside is moving where it is moving and by how much This information is critical to keeping crews safe as they move in and out of the area
bull Crews installed several large steel girders across I-5 in Lynnwood in late November in association with the construction of Sound Transitrsquos Lynnwood Park amp Ride Direct Access Project The steel girders formed the skeleton of a new ramp over I-5 south of 44th Ave W which will provide direct access to and from the I-5 high-occupancy vehicle lanes for buses carpools and vanpools The project is currently on time and on budget with completion scheduled for fall 2005
bull SR 11 better known as Chuckanut Drive near Bellingham was closed after a large rockslide blocked the highway on Oct 29 Up to 60 tons of rock and debris came loose from the hillside above the roadway and crashed onto the highway blocking both lanes of traffic just south of Larrabee Park and north of Oyster Creek Crews worked seven days a week to stabilize the hillside to reopen the road to traffic on Nov 14
bull Crews on the SR 162 Voights Creek Bridge Replacement project near Orting are using some of the latest technology to protect the environment Because of the bridgersquos close proximity to a fish hatchery workers are using an oscillator to excavate the bridge shafts The oscillator twists as it presses the casing down into the ground minimizing disturbance to the surrounding environment In addition three 134-foot lsquosupergirdersrsquo will used to support the bridge deck In past bridge projects five to eight girders are typically used This new technology means less intrusion on water habitat and fewer maintenance requirements The $21 million replaces an aging wooden structure with a concrete bridge and realigns SR 162 to eliminate a high accident location Work is scheduled for spring 2004 completion
bull Three options to replace the SR 520 Floating Bridge are being explored They include a four-lane structure with shoulders wider lanes and a pedestrianbicycle lane a six-lane option that also adds a high-occupancy
SR 290 Trent Avenue Bridge as it appeared on Dec 4 The bridge had been slated for opening on Dec 16
Measures Markers and Mileposts - December 31 2003 61
Measures Markers and Mileposts - December 31 2003 63
vehicle lane in each direction and an eight-lane option that adds the elements of the six-lane and a general-purpose lane in each direction This fall WSDOT worked with divers to better identify objects on the floor of Lake Washington that could potentially affect the construction of a new bridge With at least $2 billion 15 years and a main connection across Lake Washington on the line WSDOT wanted to know all the impacts every step of the way to assure that time and taxpayer money are not wasted Preliminary side-scan sonar images showed three objects in the water some 1000 feet north of the current SR 520 Bridge Two objects appear to be barges The third object is a large boat estimated at 150 feet in length
bull WSDOTrsquos Aviation Division is participating in a project to install an irrigation system to support new turf growth at the Stehekin Airport near Lake Chelan Non-native plants growing on the airport runway have been the targets of a spray program paid for by the Aviation Division for years The National Park Service provided funding that allows the division to reseed the airport with a dense native grass to choke out the weeds About 20 pilot organizations volunteered to install the irrigation system The airportrsquos new turf will be ready for use next year and pilots will be able to operate from a smooth runway free of dust and gravel
bull Workers finished seismic retrofit work at the SR 20 Deception and Canoe Pass Bridges by installing 10000 bolts into the underside of the bridge decks The bolts connect the bridge decks to their supporting steel structures creating a connection that makes both bridges safer and more stable in the event of an earthquake Both bridges now meet current seismic codes
bull Just prior to the deluge of fall rains crews completed a $17 million paving project on SR 112 between the Makah Reservation and Hoko River Bridge in Clallam County Start of the job was delayed until August after young eagle fledglings near the project left their nest SR 112 was designated as a scenic highway in 2002 The highway terminates at Neah Bay on the northwest tip of the Olympic Peninsula and provides motorists access to one of the most remote areas of our state
Savings and Efficiencies bull A pilot project to compare the use of salt to the use of other anti-icing chemicals for improving winter driving conditions is being repeated An unusually mild winter weather in 2002-03 limited the amount of data collected and the initial study results did not show a clear-cut advantage to using one anti-icing product over another in all cases WSDOT is evaluating the use of rock salt and salt brine in comparison to other anti-icing chemicals to determine the effect on driving conditions corrosiveness to various types of metals impacts to the roadside environment and cost of snow and ice control This yearrsquos results will be combined with last yearrsquos for a complete report and made available to those who are interested
bull The National Association of State Aviation Officials (NASAO) named the WSDOTrsquos Aviation Division the ldquoMost Innovative Staterdquo of 2003 for developing an ldquoOn-line Pilot Registrationrdquo program The On-line Pilot Registration program began in January 2003 to improve customer service and streamline administrative processing WSDOT found that the improved service increased the number of pilots mechanics and aircraft owners who registered with the WSDOT Since the implementation of online registration revenues that support air search and rescue have increased more than $100000 Additionally over 4000 aviators have subscribed to the Aviation News Service which has improved communication between WSDOT Aviation and its customers
Rail bull The Federal Railroad Administration recently awarded $1 million to WSDOT for highway-rail grade crossing improvements The funds are designated for crossing improvements on the Pacific Northwest Rail Corridor in Cowlitz County and at several crossings between Marysville and Bellingham in Snohomish and Whatcom counties Washington is one of only ten states receiving funds The Pacific Northwest Rail Corridor extends 466 miles from Eugene Oregon via Portland and Seattle to Vancouver British Columbia
Materials for the airport project are barged across Lake Chelan
Measures Markers and Mileposts - December 31 2003 62
62 Measures Markers and Mileposts - December 31 2003
Public Transportation and Commute Trip Reduction bull WSDOT teamed up with local jurisdictions transit agencies and private companies to launch this yearrsquos Rideshare Weeks (Oct 13 ndash 24) an annual campaign encouraging commuters to incorporate carpooling vanpooling transit cycling and walking in their travel to work Flexing work hours and working from home or an alternate location also helped meet the campaignrsquos two major goals exposing commuters to their choices in transportation while saving space on the roads Rideshare Weeks was being featured in public service announcements donated by the Seattle Post-Intelligencer in radio spots in Puget Sound and Spokane and at worksites participating in the statersquos Commute Trip Reduction program WSDOT has coordinated with 16 public agencies to develop promotions and shared messaging For more information see wwwwsdotwagov partnerswsrorideshare bull On Tuesday October 21 WSDOT joined transportation providers at the Omak Senior Center to highlight new bus service in Okanogan County made possible through $460748 in state and federal public transportation grants WSDOT presented giant symbolic checks and a key for a new minibus to Colville Confederated Tribes Northwestern Trailways and Okanogan County Transportation
Awards and Recognition bull Linda Pierce of WSDOT Materials Lab and Steve Muench and Joe P Mahoney of the University of Washington have been awarded the national Premier Award sponsored by National Engineering Education Delivery System (NEEDS) for the new WSDOT Pavement Guide ndash Interactive The WSDOT Pavement Guide Interactive is now the official textbook for the primary pavement-oriented course in the UW Department of Civil and Environmental Engineering
bull WSDOT received the prestigious national leadership award from the Association for Commuter Transportation (ACT) for creating balanced transportation solutions that integrate commute options into highway planning projects in the Puget Sound region of Washington state WSDOT Transportation Demand Management (TDM) Resource Center has been heavily involved in research to determine ways to improve travel choices ndash such as vanpools carpools and bicycles ndash in transportation projects planning TDM focuses on reducing drive-alone auto trips by making other choices more available and attractive The ACT award recognizes that WSDOT is leading the way to incorporate alternatives to driving alone into new plans for transportation corridors such as State Route 520 and Interstate 405
bull WSDOT and the Department of General Administration received Governor Lockersquos Governorrsquos Award for Organizational Learning and Growth for the Deschutes Parkway Reconstruction Project The project was completed in October 2002 18 months after the Nisqually Earthquake destroyed major portions of Deschutes Parkway which surrounds Capitol Lake and links Tumwater to downtown Olympia RCI Construction Inc the project contractor contributed to an accelerated repair schedule and the project was completed many months earlier than first estimated and two months ahead of the contract schedule The completed project cost $698000 (16) less than the original engineerrsquos estimates Taxpayers saved an additional $525000 when a previously planned utility upgrade was completed at the same time as the road repairs instead of later This project changed the ways GA and WSDOT collaborate which is already saving money on other projects
Celebrations and Events bull Washington State Ferries (WSF) employees volunteered their time and skills to assist on the annual Special Peoples Holiday Cruise for the Puget Sound regionrsquos children and adults with special needs The event took place aboard the MV Puyallup and is sponsored by the Active Ferry Employees Charitable Trust (AFECT) The afternoon outing has been hosted by AFECT for almost 20 years No state funds are used The annual event is supported by donations of time and money including the Marine Corps Toys for Tots program Chevron Oil and Sodexho Corporation Many other local groups provide entertainment and support
bull WSDOT maintenance crews closed SR 410Chinook Pass on Monday Nov 17 and SR 123Cayuse Pass on Tuesday Nov 18 for the season due to heavy snowfall and snow slide danger Cayuse Pass connects Chinook Pass and White Pass at the east end of Mount Rainier National Park Cayuse and Chinook passes typically close for the season in November and reopen in April
bull Studded tires became legal in Washington on Saturday Nov 1 Studded tires are restricted in Washington due to the amount of wear and roadway damage they cause to state highways estimated at $10 million per year The tires are legal between November 1 and March 31 WSDOT is requesting legislative action to ban studded tires because of the damage and ruts they cause to highways and due to safety considerations Research shows that cars with studded tires take longer to stop than cars with other tires under most situations
Measures Markers and Mileposts - December 31 2003 63
Measures Markers and Mileposts - December 31 2003 65
Gray Notebook Subject Index
Edition Key 1 = Quarter 1 2001 2 = Quarter 2 2001 3 = Quarter 3 2001 4 = Quarter 4 2001 5 = Quarter 1 2002 6 = Quarter 2 2002 7 = Quarter 3 2002 8 = Quarter 4 2002 9 = Quarter 1 2003 10 = Quarter 2 2003 11 = Quarter 3 2003 12 = Quarter 4 2003
All editions can be accessed at wwwwsdotwagovaccountability
Topic Edition
Aviation Fuel Taxable Gallons 6Registrations of Pilots and Aircraft 6 10Training of Pilots and Mechanics 6
Benchmarks (RCW 4701012) Administrative Efficiency 9Transit Efficiency 9VMT per Capita 9
Bridge Conditions on State Highways Age of WSDOT Bridges 4Bridge Ratings (FHWA) Structurally Deficient and Functionally Obsolete 4Bridge Condition Ratings State Comparison 8Bridge Structural Condition Ratings 11Deck Protection Program Overview 4 5 8 11Deck Protection Program Planned vs Actual Projects 4 5 8 11Hood Canal Bridge Update 11Inspection Program 4 11Inventory of WSDOT Bridges 4 5 8 11Preservation Program Results 11Rehabilitation and Replacement Project Schedule 4 11Scour Mitigation 4 11Seismic Retrofit Program 1990-2020 Status 4Seismic Retrofit Program Planned vs Actual Projects 4 5 8 11Seismic Retrofit Program Top 10 Priority Bridges 4 8Steel Bridge Painting Planned vs Actual Projects 4 5 8 11Tacoma Narrows Bridge Update 8 9 10 11
Commute Trip Reduction Award for the Commute Trip Reduction Program 6 11Commute Mode Share in Washington State 1990 and 2000 7Commuting Trends at CTR Work Sites and Work Sites in General 4ldquoDrive Alonerdquo Commuting Rates State Comparison 6 7Eastgate Park and Ride Expansion 9Effectiveness of CTR Program (Biennial Results) 4Employer Participation Investment and Benefits 2Gasoline Consumption Per Capita (from Northwest Environment Watch) 7Park and Ride Lot Occupancy Rates Central Puget Sound 4Park and Ride Lot Occupancy Rates King County 3 5 6 7 8 9 10 11 12Park and Ride Lot Security 5Park and Ride Lot Puget Sound System 8Vanpool Operation in the Puget Sound Region 2 3 4 5 6 7 8 9 10 11 12Vanpooling Share of Daily Puget Sound Area VMT 2VanShare Trends 8 9 11 12
Congestion on State Highways Accidents on Interstate 405 2001 and 2002 9Benchmark Policy Goals for Congestion Analysis 5Congestion Measurement Principles 5 6Daily Vehicle Hours of Delay per Mile Sample Commutes Measured
by Delay Time of Day Distribution of Delay and Travel Rate Index 2 5Distribution of Traffic Between Freeways and Arterials 1999 to 2003 9Employment Puget Sound Region 9
Measures Markers and Mileposts - December 31 2003 64
64 Measures Markers and Mileposts - December 31 2003
Edition Key 1 = Quarter 1 2001 2 = Quarter 2 2001 3 = Quarter 3 2001 4 = Quarter 4 2001 5 = Quarter 1 2002 6 = Quarter 2 2002 7 = Quarter 3 2002 8 = Quarter 4 2002 9 = Quarter 1 2003 10 = Quarter 2 2003 11 = Quarter 3 2003 12 = Quarter 4 2003
All editions can be accessed at wwwwsdotwagovaccountability
Topic Edition Congestion on State Highways (continued)
Highway Improvements Can Improve Congestion 9Induction Loop Detectors 5Intelligent Transportation Systems in Washington State 5
2000 and 2003 9Traffic Speeds and Volumes on SR 520Traffic Volumes at Seven Locations in March 2000 to 2003 Average 9Traffic Volumes on Nine Puget Sound Region Corridors 5Travel Time Reliability 6 9Travel Time to Work Comparison State and County Rankings 5Travel Times on 11 Puget Sound Region Corridors 5 9Travel Times With and Without Incidents 6Typical Freeway Traffic Volume Trend 1993 to 2002 9
Construction Program for State Highways Advertisements by Subprogram Planned Actual amp Deferred 4 5CIPP Value of Advertised amp Deferred Projects by Subprogram 4 5Construction Program Cash Flow Planned vs Actual Expenditures 4 5 6 7 8 9 10 11 12Construction Program Delivery Planned vs Actual Advertisements 1 2 3 4 5 6 7 8 9 10 11 12Contracts Awarded Engineerrsquos Estimate to Award Amount 6 10Contracts Completed Final Cost to Award Amount 6 10Contracts Completed Final Cost to Engineerrsquos Estimate 6 10End-of-Season Highway Construction Project Evaluations 12FHWA Federal Performance Report Card 12Hood Canal Bridge Update 11 12Hot Mix Asphalt Pavement Delivery 3 5 7 9 11Lane Miles Added to State Highway System 1996-2001 2Safety Construction Program Planned vs Actual Advertisements 3 6 8 9 10 11 12Tacoma Narrows Bridge Update 8 9 10 11 12
Design Value Engineering 6 10
Environmental Stewardship Compost Use 7Construction Site Erosion and Runoff Protection 4 6 9 12ldquoEcology Embankmentrdquo Pollutant Removal 8Environmental Impact Statement (EIS) Tracking 9Environmental Compliance Assurance Tracking Violations 9 12Fish Passage Barriers 4Herbicide Usage Trends 5 8 12Organic Recycling Award for WSDOT 12Recycling Aluminum Signs 7Wetland Mitigation and Monitoring 5 9 12
Ferries (WSF) Capital Expenditure Performance Planned vs Actual 4 5 6 7 8 9 10 11 12Customer Comments 3 4 5 6 7 8 9 10 11 12Fare Comparison WSF to Other Auto Ferries 4Farebox Recovery Rate 5 12Farebox Recovery Comparison WSF to Other Auto Ferries and Transit 5Farebox Revenues by Month 3 4 5 6 7 8 9 10 11 12Life Cycle Preservation Performance Planned vs Actual 12On-Time Performance 3 4 5 6 7 8 9 10 11 12Operating Costs Comparison WSF to Other Ferry Systems 3Ridership by Month 3 4 5 6 7 8 9 10 11 12Trip Reliability Index and Trip Cancellation Causes 3 4 5 6 7 8 9 10 11 12
Measures Markers and Mileposts - December 31 2003 65
Measures Markers and Mileposts - December 31 2003 67
Edition Key 1 = Quarter 1 2001 2 = Quarter 2 2001 3 = Quarter 3 2001 4 = Quarter 4 2001 5 = Quarter 1 2002 6 = Quarter 2 2002 7 = Quarter 3 2002 8 = Quarter 4 2002 9 = Quarter 1 2003 10 = Quarter 2 2003 11 = Quarter 3 2003 12 = Quarter 4 2003
All editions can be accessed at wwwwsdotwagovaccountability
Topic Edition Maintenance of State Highways
Achievement of Biennial Maintenance Targets (MAP) 3 4 8 12Anti-Litter Campaign Update 5 11Costs of State Highway Maintenance 4Customer Satisfaction with WSDOT Highway Maintenance Activities 3Debris Pusher Maintenance Attachment 6Guidepost Driver 11Herbicide Usage Trends 5 8 12Highway Sign Bridges Planned vs Actual Repairs 3 4 6 8Highway Signs Number of Maintenance Actions 6 8Integrated Vegetation Management Update 5 12Litter Removal from State Highways 5 6 8 11Living Snow Fence on SR 25 9Mountain Pass Highway Closures 7 9Pavement Striping How Do They Paint the Stripes So Straight 6Pavement Striping Planned vs Actual Miles Painted 3 4 6 8Road Kill on State Highways 5Safety Rest Area Locations and Amenities 9Salt Pilot Project 7 10Snow and Ice Control Operations 4 7Survey on Pass Travel Conditions and Anti-Icer Use 2Survey on Safety Rest Areas 9Traffic Signals Annual Energy Costs and Incandescent Bulb Conversion 3Winter Overtime Hours and Snowfall Amount 7 9Winter Roadway Condition Level of Service and Anti-Icer Chemicals 9Winter Severity and Snow and Ice Operations Costs 9Vortex Generators 5
Pavement Conditions on State Highways ldquoDuerdquo Pavement Rehabilitation Needs 4 8Concrete Pavement Lane Miles by Age and Dowel Bar Retrofit Status 12Pavement Condition Trends 4 8 12Pavement Condition by Type 2Pavement Lane Miles Annual Vehicle Miles Traveled and Programmed Dollars 12Smoothness Rankings by State 4 8 12
Rail Freight Grain Train Carloads 5 6 7 8 9 11 12Grain Train Route Map 5 9Washington Fruit Express Car Loadings Per Week 5 8
Rail State-Supported Amtrak Cascades Service Amtrakrsquos Future 5 6 7 9Budget Update 10Capital Improvement Program and WSDOT Service Goals 2Customer Satisfaction 2 3 4 7 9 12 Farebox Recovery Percentage by Train 4 8 12Internet Reservations and Automated Ticketing 6Investment in Intercity Rail Comparison 5On-Time Performance 2 3 4 5 6 7 8 9 10 11 12Operating Costs 4Passenger Trips by Station 6Ridership by Month 2 3 4 5 6 7 8 9 10 11 12Ridership by Year Long-Term Trends 2 4 8Ridership Patterns by Segment (Seats Sold) 3Route Map Amtrak in Washington 6Station Update 11Vehicles Diverted Annually from Interstate 5 by Cascades 2
Measures Markers and Mileposts - December 31 2003 66
66 Measures Markers and Mileposts - December 31 2003
Edition Key 1 = Quarter 1 2001 2 = Quarter 2 2001 3 = Quarter 3 2001 4 = Quarter 4 2001 5 = Quarter 1 2002 6 = Quarter 2 2002 7 = Quarter 3 2002 8 = Quarter 4 2002 9 = Quarter 1 2003 10 = Quarter 2 2003 11 = Quarter 3 2003 12 = Quarter 4 2003
All editions can be accessed at wwwwsdotwagovaccountability
Topic Edition Safety on State Highways
Alcohol-Related Fatality Rate 12Before and After Collision Data for Highway Safety Improvement Projects 12Bicycle and Pedestrian Safety Federal Benchmark 9Bicyclist Fatality Rates State Comparison 9Cable Median Barrier Installation Before and After Collision Data 12Corridor Safety Program Results 8Driving Speeds on State Highways 4Fatal and Disabling Collisions Circumstances and Type 8Fatal and Disabling Collisions at Intersections Types of Collisions 9Fatal and Disabling Crashes and VMT percent change 3 7 11Fatalities Involving High Blood Alcohol Concentration State Comparison 7Fatality Rates State Highways All State Public Roads amp US 3 7 11Guardrail Retrofit Program 11High Accident Corridors and Locations by Region 4 High Accident Corridors and Locations Statewide 3Low Cost Safety Enhancement Program Planned vs Actual Projects 3 4 5Low Cost Safety Enhancement Program Sample Projects 4 6Pedestrian Fatality Rates State Comparison 8Pedestrian Factors in VehiclePedestrian Collisions 8Port Orchard Roundabout Before and After Collision and Injury Data 12Safety Construction Program Planned vs Actual Project Advertisements 3 6 7 8 9 10 11 12Safety Laws Booster Seats and Mandatory Seat Belts 5Safety Projects Completed This Quarter 7Seatbelt Use State Comparison 7 11Safe Routes to Schools 9 12
Traffic Operations on State Highways FHWA Self-Assessment 9Incident Response Calls Responded to by Region 2Incident Response Clearance Time Distribution 11 12Incident Response Clearance Times 2 3 4 5 8 9 10 11 12Incident Response Customer Comments 8Incident Response Economic Analysis 10Incident Response Non-Collision Response Types 8 9 10 11 12Incident Response Program Types of Responses Program Total 9 10 11 12Incident Response Program Types of Responses 15 to 90 Minute Incidents 9 10 11 12Incident Response Program Types of Responses Over 90 Minute Incidents 9 10 11 12Incident Response Service Actions Taken 7 10 11 12Incident Response Teams Go to the Olympics 5Incident Response Teams Location and Type 7Incident Response Timeline 6Incident Response Times 2 3 4 5Incident Response Total Number of Responses by Month 7 8 9 10 11 12Incidents with Clearance Times Over 90 Minutes 6 7 8 9 10 11 12Intelligent Transportation Systems in Washington State 5Joint Operations Policy Statement between WSDOT
and Washington State Patrol 5Service Patrol Contacts 3 4Spokane Interstate 90 Peak Hour Roving Service Patrol Pilot 5
Traveler Information Award for Traveler Information Web Site 11Calls to 1-800-695-ROAD and 5-1-1 8 9 10 11 12Camera Views 8Evaluation Survey 10Web Site Feedback 8 9Web Site Usage 7 8 9 10 11 12
Measures Markers and Mileposts - December 31 2003 67
Edition Key 1 = Quarter 1 2001 2 = Quarter 2 2001 3 = Quarter 3 2001 4 = Quarter 4 2001 5 = Quarter 1 2002 6 = Quarter 2 2002 7 = Quarter 3 2002 8 = Quarter 4 2002 9 = Quarter 1 2003 10 = Quarter 2 2003 11 = Quarter 3 2003 12 = Quarter 4 2003
All editions can be accessed at wwwwsdotwagovaccountability
Topic Edition Truck Freight
Cross Border Truck Volumes 6 10Freight Routes and Border Crossings in Washington 6 10Freight Shipments To From and Within Washington 10Impediments to Truck Shipping Bridges with Posted Weight Restrictions 6Improvement Projects with Freight Benefits 10Intelligent Transportation Systems Use for Trucks 6 10Managing Over-Sized Truck Loads 6OsoyoosOroville Border Facts 10Overdimensional Trucking Permits 6Revenue Prorated to Washington for Trucks in Interstate Use 6 10Truck Registrations in Washington 6Truck Share of Total Daily Vehicle Volumes 6
Workforce Accident Prevention Activities 3 4 5 6 7 8 9 10 11 12Ferry Vessel Workers Recordable Injuries 2 3 4 5 6 7 8 9 10 11 12Highway Engineer Workers Recordable Injuries 2 3 4 6 7 8 9 10 11 12Highway Maintenance Workers Recordable Injuries 1 2 3 4 5 6 7 8 9 10 11 12Highway Maintenance Workers Safety Training 5 6 7 8 9 10 11 12Human Resources Training for all WSDOT Employees 7 8 9 10 11 12North American Association of Transportation Safety and Health Officials Meeting 3Workforce Levels 5 6 7 8 9 10 11 12
Measures Markers and Mileposts - December 31 2003 68
68 Measures Markers and Mileposts - December 31 2003
Americans with Disabilities Act (ADA) InformationPersons with disabilities may request this information be prepared and
supplied in alternate formats by calling the Washington State Department of Transportation ADA Accommodation Hotline collect (206) 389-2839
Persons with hearing impairments may access Washington State Telecommunications Relay Service
at TTY 1-800-833-6388 Tele-Braille 1-800-833-6385 Voice 1-800-833-6384 and ask to be connected to (360) 705-7097
Civil Rights Act of 1964 Title VI Statement to Public Washington State Department of Transportation (WSDOT) hereby
gives public notice that it is the policy of the department to assure full compliance with Title VI of the Civil Rights Act of 1964 the Civil Rights
Restoration Act of 1987 and related statutes and regulations in all programs and activities Persons wishing information may call the WSDOT
Office of Equal Opportunity at (360) 705-7098
Other WSDOT Information Available The Washington State Department of Transportation has a vast amount
of traveler information available (including Puget Sound area traffic mountain pass reports highway closures ferry schedules and more)
Call the WSDOT statewide toll-free number 1-800-695-ROADIn the Seattle area (206) DOT-HIWY [368-4499]
For additional information about highway traffic flow and cameras ferry routes and schedules Amtrak Cascades rail and other transportation
operations as well as WSDOT programs and projects visitwwwwsdotwagov
For this or a previous edition of the Gray Notebook visit wwwwsdotwagovaccountability
0401-0004
- Cover
- Credits
- Table of Contents
- Beige Pages
-
- Project Reporting on the 2003 Transportation Funding Package
- Current Project Highlights and Accomplishments
- Project Delivery
- Financial Information
- Program Management Information
-
- Worker Safety Quarterly Update
- Workforce Levels and Employee Training Quarterly Update
- Highway Construction Program Quarterly Update
- Tacoma Narrows Bridge Project Update
- Hood Canal Bridge Project Update
- Highway Safety Improvement Projects Quarterly Update
- Asset Management Pavement Assessment Annual Update
- Highway Maintenance Annual Update
- Environmental Programs
- Incident Response Quarterly Update
- Traveler Information Quarterly Update
- Options to Drive Alone Commuting Quarterly Update
- Washington State Ferries Quarterly Update
- State-Supported Amtrak Cascades Service Quarterly Update
- Special Features
- Highlights of Program Activities
- Gray Notebook Subject Index
-

Beige Pages - Measures Markers and Mileposts - December 31 2003 5
SR 203 NE 124thNovelty Rd Vic
The project was advertised on schedule However the total project cost has increased by approximately $900000 due to additional right of way and preliminary engineering costs to accommodate King Countyrsquos strict flood plain ordinance This project is funded with pre-existing funds the 2003 Transportation Funding Package and King County and Developer contributions $254000 of the cost increase will have to be accommodated from the 2003 Transportation Funding Package
US 395 Kennewick Variable Message Sign
This project improves safety on US 395 by installing a variable message sign camera and traffic sensor north of the Blue Bridge to warn southbound traffic of congestion and accidents ahead The contract was advertised for bids on schedule on December 1 2003 The bid opening is scheduled for January 14 2004 and the improvements should be placed in use for traffic by summer 2004
Project Advanced for Advertisement
SR 527 132nd SE to 112TH SE (Additional Lanes)
The advertisement date was advanced from March 2005 to December 2003 to coordinate with the availability of funds planned for the project from other sources avoid redesign for changes in stormwater treatment requirements and meet a commitment to Boeing The contract award date is February 25 2004
Projects Deferred for Later Advertisement
SR7SR 507 to SR 512 ndash Safety
The December 2003 contract advertisement date for this project has been delayed until obstacles in right of way acquisition can be cleared WSDOT believed that right of way would be obtained from property owners for a December ad date However the department has received 18 requests for adjudicative hearings from property owners adjacent to the project Additional time will be required to prepare detailed surveys title searches and coordinate scheduling with the Attorney Generalrsquos Office for each of the hearings WSDOT is focused on completing negotiations with the property owners and anticipates advertising the project in spring 2004 with construction starting no later than the summer of 2004
SR 522I-5 to SR 405 Multi-Modal Project
To take advantage of coordinating work with Lake Forest Park in conjunction with the needs of WSDOT the advertisement date would slip from winter 2003 to spring 2006 The 2003 Transportation Funding Package provided the entire project funding in the construction phase The changes will result in shifting $2 million in expenditures from the 03-05 to 05-07 biennium This project is part of an integrated program of corridor improvements where WSDOT will coordinate portions of this project with other improvements which will be funded and constructed by local municipalities such as Seattle Kenmore Lake Forest Park and Bothell
Beige Pages - Measures Markers and Mileposts - December 31 2003 4
4 Beige Pages - Measures Markers and Mileposts - December 31 2003
Project Completions and Other Highlights
Construction Highlights
Several of the highway and rail projects funded by the Nickel Account are now in construction More details can be found in the respective on-line Project Pages at wwwwsdotwagovprojects
Highway Construction Program
I-5 Widen Each Direction From Salmon Creek to I-205
The contractor is currently constructing retaining walls necessary for the widening of the southbound lanes Work is continuing on the temporary widening using a detour bridge in preparation for a traffic shift that will allow construction of the northbound lanes The traffic shift is expected to occur in May 2004 The construction schedule identifies the first weekend closure to demolish the existing NE 129th St structure on the weekend of January 31 2004 The new NE 129th St structure is scheduled to be completed in five months
I-90 Build Lanes from Argonne to Sullivan Road
The contractor met the November 1 2003 milestone to have the temporary westbound lanes constructed and open to traffic Although the project was suspended October 31 2003 for the winter work is continuing on minor items such as drainage ponds Road work will restart as soon as weather conditions permit
I-90 Highline Canal to Elk Heights ndash Truck Passing Lanes
This project constructs a truck climbingpassing lane on eastbound I-90 east of the Indian John Hill Rest Area Work on the project was suspended for the winter on November 20 2003 due to snow and cold temperatures Prior to suspending work the contractor had completed clearing the land in preparation for the widening of the roadway Ninety percent of the embankment excavation and drainage has been completed The left side bridge rail replacement on the Highline Canal bridge is complete To date project completion status is at about 30 Work will resume as weather conditions permit
I-90 Ryegrass Summit to Vantage ndash Truck Passing Lanes
This project constructs a truck climbingpassing lane on westbound I-90 from Vantage to the top of Ryegrass Summit Due to winter conditions work by the contractor was suspended on November 14 2003 Nearly one mile of the additional lane and modifications to the Ryegrass Rest Area ramps are completed and already open to traffic WSDOT survey crews will continue to work preparing for the next construction season as weather permits It is anticipated that the contractor will resume work in March 2004
SR 500 NE 112th Avenue Interchange
This project constructs a new interchange on SR500 at NE 112th AvenueGher Road All utility relocations are now complete and traffic was shifted to temporary lanes during a weekend closure on November 2 2003 (one day ahead of schedule) The bridge footings and columns have been constructed as planned for the eastbound ldquofly-overrdquo bridge with girder placement expected to occur in a three night sequence in mid January 2004 The placement of the noise barrier along the I-205 ramp has started with a scheduled completion of April 2004
Beige Pages - Measures Markers and Mileposts - December 31 2003 5
Beige Pages - Measures Markers and Mileposts - December 31 2003 7
Other Capital Programs
Purchase Oregon Train Set
A purchase agreement to complete this important rail rolling stock acquisition project in the 2003 Transportation Funding Package was executed between WSDOT and Talgo Inc on November 26 2003 Talgo will now paint the outside of the cars to match those already in the fleet The purchase will allow for additional rail passenger service between Seattle and Portland upon completion of track improvements
Tacoma RMDRR Morton Line Repairs ndash Phase 2
This project will complete the necessary repairs to the rail line between Frederickson and Morton to restore rail service interrupted by the 1996 flood Construction of a portion of this project for immediately needed repairs began in July 2003 and was completed in mid-December 2003 The remainder of the construction project will be accomplished under separate agreement with the City of Tacoma (owner) scheduled to begin in early 2004 It is anticipated that the entire project will be completed before the end of the current biennium
Highlights of Projects Ready for Advertisement for 2004 Construction Season
Five of the highway projects in the 2003 Transportation Funding Package are scheduled for advertisement in the two quarters for January 1 2004 to June 30 2004 (the 3rd and 4th quarter of the 03-05 biennium) More details can be found in the respective on-line Project Pages at wsdotwagovprojects The status of these projects is described below Two projects that were scheduled for advertisement during this time frame were deferred to future quarters (the status of these projects are described below)
I-5 2nd Street Bridge (ad date 452004)
The current proposal is to assist traffic flow by reducing construction from two seasons to one No change in total project cost is anticipated The project is expected to be advertised as scheduled
SR7SR 507 to SR 512 ndash Safety (ad date 532004)
The ad date for this project in December 2003 was not met because of complications that arose in the right of way taking May 2004 is the rescheduled ad date that WSDOT hopes to meet if negotiations with property owners can be completed in time
I-90 Cle Elum River Bridge (ad date 31504)
Environmental documentation is complete and approximately 80 of the design is finished The scheduled advertisement date is expected to be met and pre-construction start date is expected to be May 2004
SR 304SR 3 to Bremerton Ferry Terminal (ad date 21704)
This project reconstructs and widens the existing roadway It will add HOV lanes to increase traffic movement The City of Bremerton is the lead agency for this project
WSDOTrsquos role is primarily to assure the administration of the funding provided for in the 2003 Transportation Funding Package WSDOTrsquos expectation is that the City of Bremerton will advance the projectrsquos scheduled advertisement date The estimated construction completion date is June 2006
SR 509 Design amp Critical Right-of Way (ad date 672004)
Construction funds are being transferred to the City of SeaTac which is the lead agency on this phase of the project Environmental permitting and stormwater designs are being developed by WSDOT and are on track to support the scheduled ad date and budget WSDOT expects that the City of SeaTac will meet the scheduled ad date The project is on schedule and within the established budget
Beige Pages - Measures Markers and Mileposts - December 31 2003 6
6 Beige Pages - Measures Markers and Mileposts - December 31 2003
SR 9 Nooksack Road to Cherry Street (ad date 604)
This project was originally scheduled for advertisement in June 2004 but that date has had to be adjusted (is now set for October 2005) because of new geotechnical information requiring design revisions that in turn have led to a larger-than-originally-expected right of way acquisition program Construction cost savings however are also expected to result
SR 161 204th Street to 176th Street (ad date 2904)
The project was originally scheduled for advertisement in February 2004 but that ad date has had to be adjusted (is now set for November 2004) due to real estate acquisitions that have taken longer than expected and to avoid work zone traffic control issues by constructing the entire four miles at the same time WSDOT is coordinating access revision with local developers along the corridor and is currently nearing completion of the design and real estate acquisition phase
Beige Pages - Measures Markers and Mileposts - December 31 2003 7
Beige Pages - Measures Markers and Mileposts - December 31 2003 9
Project Delivery
Proposed Adjustments to Delivery Planning
Meeting schedule budget and scope expectations are important elements in WSDOTrsquos delivery of the projects in the 2003 Transportation Funding Package Planning and design activities for specific projects sometimes identify the need to make adjustments to construction delivery spending schedules Some of these adjustments will have no impact on critical start or completion dates Others may require adjustments to critical dates
The information in this report describes changes that WSDOT has concluded as desirable based on assessments made in the quarter under review ending December 31 2003
Highway Construction Program
US 2 Peshastin East Interchange
The spending plan for this project should be revised based on the Value Engineering Study done in August 2003 and the Cost Risk Assessment done in July 2003 The spending plan for this project has been reduced $88 million to a total of $165 million This is a cost savings of 35 from the budget amount WSDOT also has a plan to reduce the construction phase of the project by two years from three years to one year while maintaining the planned advertisement date of September 4 2009
I-5SR 502 Interchange and Corridor Widening
WSDOT has the opportunity to make advance purchases of Right of Way from property owners that have expressed interest in selling now Purchasing Right of Way at this time benefits both the sellers and the WSDOT in that sellers will be able to know what affect the project will have on them and be fairly compensated and early acquisition lessens the risk of land development increasing land value In order to accelerate this preliminary design and RW work WSDOT is requesting to advance $1000000 for RW and $200000 for Preliminary Engineering into the 0305 biennium The advancement of funds will not increase the total project cost
I-5 Noise Wall
This project was removed from the September 30 2003 Watch List The project is in Seattle near the end of SR 520 and Roanoke Street Previously WSDOT reported that cost and schedule for this project were being reviewed to allow for completion of the design and may result in an ad delay With the review complete and design underway the project will be advertised in early summer 2004 with a construction start in late summer
I-5SR 526 TO US 2 (Marine View Dr) HOV Lanes
WSDOT proposes to advance the advertisement date from March 2008 to October 2007 to ensure that work begins in the spring of 2008 to take full advantage of the 2008 construction season In addition WSDOT is proposing to advance $4 million into the 2003-2005 biennium in order to accelerate design work This acceleration would put WSDOT in a position to further accelerate this project for the benefit of the 2010 Olympics if the Legislature should decide to advance funding for construction (see Opportunities and Options for Legislative Consideration section of this report)
SR 7SR 507 to SR 512 ndash Safety
The December 2003 contract advertisement date for this project has been delayed until right of way access issues can be resolved WSDOT believed that right of way would be cleared with property owners for a December ad date However the Department has received 18 requests for adjudicative hearings from property owners adjacent to the project Additional time will be required to prepare detailed surveys title
Beige Pages - Measures Markers and Mileposts - December 31 2003 8
8 Beige Pages - Measures Markers and Mileposts - December 31 2003
searches and coordinate scheduling with the Attorney Generalrsquos Office for each of the hearings WSDOT is focused on completing negotiations with the property owners and anticipates advertising the project in spring 2004 with construction starting no later than the summer of 2004
SR 9 Nooksack Road to Cherry Street
This project will have an ad date shift from June 2004 to October 2005 to account for an increase in the number of right of way parcels that must be acquired The total cost of the project remains the same as the construction estimate has decreased
SR 16 HOV Improvements ndash Olympic View Drive to Union Avenue
The third construction phase of this project 36th Street to Olympic Drive NW would be advanced two or three quarters to allow more flexibility for planning and implementing traffic switches needed to accommodate the opening the new Second Tacoma Narrows Bridge This third and final construction phase will complete continuous HOV lanes on either side of the Tacoma Narrows from the Sprague Avenue Interchange in Tacoma to the Olympic Drive Interchange in Gig Harbor by spring 2007 Moving the construction start date of this phase from spring 2005 to fall 2004 will not affect the overall cost of the project
SR 20 Quiet Cove Road Vic to SR 20 Spur
In the September 30 2003 Gray Notebook this project was listed on the Watch List At that time WSDOT reported the advertisement date for this project may be delayed to provide time for right of way acquisition and to resolve environmental mitigation issues Currently the advertisement date would slip by nine months from February 2006 to November 2006 which will result in shifting $3 million in projected Nickel Fund expenditure from the 05-07 to 07-09 biennium
I-90 Two-Way Transit and HOV
This Seattle to Mercer Island project is currently funded for design by Sound Transit FHWA and WSDOT and is dependent on Regional Transportation Investment District (RTID) and other sources of funding for construction Should RTID funding become available WSDOT proposes the advertisement date be delayed thirteen months from December 2004 to January 2006 to allow time for the issuance of the draft Environmental Impact Statement This will allow the design to be completed in October 2005 There is no change in the expected project cost However $1 million in projected Nickel Fund expenditures would need to be shifted from the 03-05 biennium to the 05-07 biennium
SR 99 S 284th to S 272nd St HOV Lanes
This project will include a HOV lane and 2 general-purpose lanes in each direction a median sidewalk and planter strip The updated cost estimate for right-of-way acquisition is $51 million this is an increase from the previous estimate of $3 million to account for the potential of higher cost of condemnation The advertisement date would be delayed from December 2005 to April 2006 to correct the record of survey which identify property ownership WSDOT is currently working with the City of Federal Way to minimize the right-of-way cost by eliminating some of the proposed landscaping areas
SR 161 Corridor Improvements ndash 204th Street E to 176th Street
There are multiple stages to this project Stage 1 (234th to 204th) was advertised in November 2003 The proposal is to adjust cash flow and delay the advertisement date of Stage 2 (204th to 176th) from November 2003 to November 2004 This action will reduce traffic impacts and help right of way acquisition These changes should not change the total project cost
Beige Pages - Measures Markers and Mileposts - December 31 2003 9
Beige Pages - Measures Markers and Mileposts - December 31 2003 11
SR 203 NE 124thNovelty Rd Vic
The project was advertised on schedule However the total project cost has increased by approximately $900000 due to additional right of way and preliminary engineering to accommodate King Countyrsquos strict flood plain ordinance This project is funded with pre-existing funds the 2003 Transportation Funding Package and King County and Developer contributions About $250000 of the expected cost increase will come from the 2003 Transportation Funding Package
SR 520 W Lake Sammamish Parkway to SR 202 (Additional Lanes)
Cash flow adjustment to match actual design right of way and construction schedules No change in advertisement date of October 2008
SR 522I-5 to SR 405 ndash Multi-Modal Project (Nickel)
To take advantage of coordinating work with Lake Forest Park in conjunction with the needs of WSDOT partners the advertisement date would slip from winter 2003 to spring 2006 to take advantage of coordinating work with Lake Forest Park The 2003 Transportation Funding Package provided the entire project funding in the construction phase The changes will result in shifting $2 million in expenditures from the 03-05 to 05-07 biennium This project is part of an integrated program of corridor improvements where WSDOT will coordinate portions of this project with other improvements which will be funded and constructed by local municipalities such as Seattle Kenmore Lake Forest Park and Bothell
For financial information on the Proposed Adjustments to Delivery Planning ndash Highway projects please refer to the table on page 16
Other Capital Programs The following six proposed project changes have interrelated funding and impact one another
Palouse River and Coulee City Railroad Acquisition
Depending on a finding of cost effectiveness that the Legislature instructed be made by the Transportation Commission WSDOT would purchase 302 miles of the Palouse River and Coulee City Railroad preserving the statersquos largest short-line railroad that carries 20 percent of the statersquos grain crop The original proposed budget has been reduced by $322000 after further cost estimate review If the conclusion of WSDOTrsquos review of the proposed purchase of this railroad is favorable the purchase will be completed with this decrease in the adjusted budget
Port of Columbia Railroad Improvements (New Project Title)
After further engineering review and scope refinement the following three projects are combined and overall reduced in scope to reflect actual improvements needed to maintain railroad service on this section of track
The original project Port of Columbia Railroad Improvements ndash funds general railroad improvements on the 39-mile line Based on further engineering reviews the original scope for this project has been reduced from a full rebuild of the line to a less expensive rehabilitation of the line that will still provide an adequate level of service to the rail line customers The proposed change will be combined with two additional projects listed in the 2003 Funding Package (the Blue Mountain Railroad Upgrade project which rebuilds 30 miles of track from Wallula to Walla Walla and the Port of Columbia Co Dayton Upgrades project which funds improvements to port rail facilities) into a single project with a total budget of $53 million as compared to the originally combined project budgets of $13 million
Beige Pages - Measures Markers and Mileposts - December 31 2003 10
10 Beige Pages - Measures Markers and Mileposts - December 31 2003
Port of Columbia Dayton Upgrades and Blue Mountain Railroad Upgrade
These projects fund improvements to port rail facilities and rebuilding 30 miles of track from Wallula to Walla Walla It is proposed that these projects be combined with Port of Columbia Railroad Improvements project as described above The original intent of both projects will still be accomplished at a reduced cost
Palouse River and Coulee City Cheney-Coulee-Pullman Upgrade (New Project Title)
After further engineering review and scope refinement two projects (Palouse River and Coulee City Cheney to Coulee Upgrades and Rural Elevator Track Expansion) are combined Also engineering analysis suggests the need for scope change to include upgrades of PRampCC lines in Whitman County
The original project (Palouse River and Coulee City Cheney to Coulee Upgrades) would have funded repairs to numerous railroad bridges in Grant and Lincoln Counties and upgrade track to accommodate 286000-pound freight cars It would also improve the rail line between Coulee City and Cheney The proposed change will combine these upgrades with projects in Whitman Co that were identified by WSDOT in the summer of 2003 Further the scope of the work from the Rural Elevator Track Expansion project (additional track at rural elevators and shortline mainline connections) will also be combined into this expanded scope The proposed scope will be completed within the overall total of $21089000 specified for the projects in aggregate
For financial information on the Proposed Adjustments to Delivery Planning - Rail projects please refer to the table on page 17
Opportunities and Options for Legislative Consideration
The following projects were reported as requiring legislative guidance in June 2003 and continue to be offered for legislative consideration Details on the projects are found in the Gray Notebook for June 30 2003
I-5SR 526 TO US 2 (Marine View Dr) HOV Lanes
The question remains on whether the construction schedule for this project should be advanced so that the project can be completed prior to the 2010 Winter Olympic Games
WSDOT has developed two accelerated schedule options for legislative consideration Option one is to accelerate the project schedule and advertise it for construction bids in March 2006 using the common ldquoDesign-Bid-Buildrdquo practice This option will result in an open to traffic date of 2010 Option two is to accelerate the project schedule and advertise by July 2005 using the ldquoDesign-Buildrdquo method This option will result in an open to traffic date of 2009 and is WSDOTrsquos preferred option The expenditure plan reflects the ldquoDesign-Buildrdquo option
SR 99 Alaskan Way Viaduct
The project replaces the seismically vulnerable Alaskan Way Viaduct and seawall in downtown Seattle The Gray Notebook for September 2003 identified the need to begin design in the summer 2004 as essential to remain on schedule to meet the proposed 2008 start of construction The project has moved money from one phase to another in 2003-2005 with zero dollar change to the bottom line By making this adjustment restoring right of way and increasing PE in the 05-07 biennium The project remains on the accelerated pace that will allow construction to begin in 2008 but not unless funding issues can be resolved
Beige Pages - Measures Markers and Mileposts - December 31 2003 11
Beige Pages - Measures Markers and Mileposts - December 31 2003 13
I-405 Congestion Relief and Bus Rapid Transit Projects
WSDOT proposes revising the I-405 Nickel project sequence to be Kirkland Stage 1 Renton Bellevue and Kirkland Stage 2 The Kirkland Stage 1 project addresses a known congestion hot spot that has a very high benefitcost ratio with work that can be incorporated into future RTID projects This schedule revision allows a project to be constructed and opened to traffic earlier than the original sequence The revision also allows the Renton project the opportunity to combine Nickel funds with Regional Transportation Improvement District (RTID) funds in a larger more cost-effective project should RTID funds become available
SR 522 Bothell ndash UW Campus Access
Should WSDOT use the Nickel expenditure authority for this project since the funding from the lead funding partners did not materialize and WSDOTrsquos budget for the project is insufficient to construct the project This was identified in the September 30 2003 Gray Notebook
SR539I-5 AccessImprovements Ten Mile Road to International Boarder
The question remains on whether the construction schedule for this project should be advanced so that the project can be completed prior to the 2010 Winter Olympic Games
Widening the remaining section of the ldquoTen Mile Roadrdquo will require the project be funded in a future budget appropriation The Nickel funding will provide for preliminary engineering environmental analysis and selection of a project plan for a new connection between I-5 and SR 539 Completing the final design right of way and construction of the project will however require new funding
D Street Grade Separation
The question remains whether the cash flow of this project be advanced into the 03-05 biennium from the 05-07 biennium to enable construction to be accomplished with other stages of this project
The Gray Notebook for September 30 2003 suggests that the 03-05 Supplemental Budget include a $35 million increase in the Program Z appropriation within the Multimodal Account
For financial information on the Opportunities and Options for Legislative Consideration please refer to the table on page 17
ldquoWatch Listrdquo Projects Cost and Schedule Concerns Watch List WSDOT is watching some projects closely for warning that changes in cost schedule or scope may be at risk due to developments and discoveries during the project delivery process in some cases these changes are outside the control of WSDOT Currently the information regarding the changes for these projects are in the early stages and making a conclusion based on this information may not
Watch List
achieve the desired result
Projects Removed from the September 30 2003 Gray Notebook Watch List
SR 3 to SR 303 Interchange Waaga Way
Removed from the Watch List Concerns had been raised that several issues in the design concepts developed in 1995 now necessitating coordination with Kitsap County might require delay of the scheduled ad date in Spring 2005 These issues have now been successfully addressed ndash reducing the
Beige Pages - Measures Markers and Mileposts - December 31 2003 12
12 Beige Pages - Measures Markers and Mileposts - December 31 2003
number of traffic signals reducing the volume of pavement increasing traffic volume capacity and minimizing impacts on local adjacent ball fields Project progress now supports both the originally scheduled ad date and the project budget
I-5 Noise Wall
See Proposed Adjustments in delivery planning Removed from the Watch List Previously WSDOT reported that the need to prepare design for the project would lead to delay in the schedule originally set by the legislature With the review complete and design underway the project has now been scheduled to advertise in early summer 2004 with construction work to begin during the summer
SR 20 Quiet Cove Road Vic to SR 20 Spur
See Proposed Adjustments in delivery planning Removed from the Watch List This project has moved to Proposed Adjustments in the Gray Notebook WSDOT reported the need to delay the advertisement date for this project might be delayed to provide additional time to acquire environmental approvals necessary for right of way acquisition The current plan is to slip the advertisement date by nine months from February 2006 to November 2006 in order to provide adequate time to resolve environmental mitigation issues and acquisition right of way This delay will result in shifting $3 million in Nickel funding expenditure from the 05-07 to 07-09 biennium
SR 99 S 284th to S 272nd St HOV Lanes
This project has moved to proposed adjustments in the Gray Notebook Removed from the Watch List The updated cost estimate for right-of-way acquisition is $51 million This is an increase from the previous estimate of $3 million and has been factored in to the project to account for the potential higher cost of condemnation Advertisement date will be delayed from December 2005 to April 2006 in order to correct the record of survey to identify property ownership
SR 161 Jovita Blvd to S 360th St
Removed from Watch List In the September 30 2003 Gray Notebook this project was on the Watch List for potential design changes from increased costs and delayed construction due to environmental and air quality provisions that have become more stringent while waiting for funding to be approved The air quality analysis has now been completed and there will be no impact to the project as a result The NEPA re-evaluation is still in progress and WSDOT anticipates the report to be finalized in January 2004 and approved shortly thereafter
SR 203 NE 124thNovelty Rd Vic
See Proposed Adjustments to Project Delivery and Contract Advertising amp Awards Removed from Watch List Previously WSDOT reported that arriving at a new floodplain mitigation site might have implications for cost and schedule The project was advertised on schedule but the project costs for additional engineering and right of way acquisition increased by a total of $900000
US 395 North Spokane Corridor (Francis Avenue to Farwell Road)
Removed from Watch List This was a ldquoWatch Listrdquo project in the last quarterrsquos report because of concerns over obstacles in the acquisition of a single indispensable right-of-way parcel With the assistance of mediation the acquisition was completed in November 2003 The contract advertisement was set for January 2004 with bid opening in March 2004 The project is expected to be delivered within approved funding and with little delay to the opening date
SR 522I-5 to SR 405 ndash Multi-Modal Project (Nickel)
Removed from Watch List See Proposed Adjustments to Project Delivery In the September 30 2003 Gray Notebook WSDOT reported it was considering delaying the advertisement date to coordinate with the City
Beige Pages - Measures Markers and Mileposts - December 31 2003 13
Beige Pages - Measures Markers and Mileposts - December 31 2003 15
of Lake Forest Park To coincide with the needs of WSDOT partners the advertisement date will slip from winter 2003 to spring 2006 to take advantage of coordinating work with the City of Lake Forest Park The Nickel Funding Package provided the entire project funding in the construction phase These changes will result in shifting $2 million in expenditure from the 03-05 to 05-07 biennium
SR 543I-5 to Canadian Border - Additional Lanes for Freight
Removed from Watch List In the September 30 2003 Gray Notebook WSDOT reported the department was working to resolve structural design issues as a result of poor soil conditions The initial engineering solution was to design retaining walls that would be expensive and cause the project to exceed the budget A slope redesign was therefore developed as an alternative It has resulted in making one wall unnecessary and reducing the necessary height of several walls This affordable design is more cost-effective and should bring the project back within the anticipated budget
Update on Projects Noted in the ldquoWatch Listrdquo in the Gray Notebook ending September 30 2003
I-5 From Rush Road to 13th Street
The Watch List for the September 30 2003 Gray Notebook described the review by FHWA of this project to add one lane in each direction on I-5 between the interchanges at Rush Road (exit 72) and 13th Street (exit 76) including construction of a new interchange at the current LaBree Road under-crossing At the time of publication FHWA approved the added access with conditions
SR 9SR 522 to 212th St SE (Stages 1b amp 2)
The Watch List for the September 30 2003 Gray Notebook described the need to make design changes (raised center line barrier) with two-way-left-turn-lane based on current traffic data The design change may result in a delay of the advertisement date WSDOT continues to coordinate design and construction planning with King County regarding the Countyrsquos development of the Brightwater Wastewater Treatment Plant adjacent to the project There is continuing discussion of a revised advertisement and construction schedule
SR 167 15th St SW to 15th St NW ndash HOV
In the last Gray Notebook Watch List WSDOT reported that the project cost increased by $44 million and that the advertisement date could be delayed The advertisement date will be moved to February 2005 to accommodate redesign of the project to meet current stormwater standards WSDOT staff worked with permitting agency representatives on the Multi-Agency Permitting Team (MAPT) and determined that the original drainage design would not meet current water quality regulations The MAP Team has determined that additional stormwater detention and treatment will indeed be required Local agencies have also stated that additional wetland and stream buffer mitigation will be required As a result additional funds will be required for the design and construction of ecology embankments additional detention ponds and buffer mitigation The additional work will delay the advertisement date to the first quarter 2005 WSDOT staff is investigating designs in order to minimize the amount of these cost increases and will report next quarter
SR 270 Pullman to Idaho State Line - Additional Lanes
In the September 30 2003 Gray Notebook it was reported that there was a possibility of a project cost increase due to rock and soil conditions and the need for bridge design modifications Drilling and soil testing began in mid December 2003 with planned completion of testing in February 2004 Due to the unknown rock depth in excavation areas and bridge design considerations for two bridges it is anticipated that that a project cost increase ranging from $2 million to $5 million may be required The project cost estimate is expected to be completed by July 2004 As the project design is further refined WSDOT is investigating methods to reduce or offset these cost increases The project is on schedule for advertisement in January 2005
Beige Pages - Measures Markers and Mileposts - December 31 2003 14
14 Beige Pages - Measures Markers and Mileposts - December 31 2003
SR 410 214th Ave E to 234th - Widening
WSDOT reported in the Watch List of the September 30 2003 Gray Notebook that costs for this project could increase $16 million or more to purchase land that will be needed for stormwater treatment and detention was re-zoned for commercial and light industrial during the project development phase Engineering work is underway to develop an updated cost estimate for right-of-way acquisition based on the zoning changes by the end of February 2004 This project will address sections of the roadway where accidents occur by controlling access to the highway building new signal systems at major intersections and reducing congestion by providing an additional lane in each direction
Projects added to the ldquoWatch Listrdquo
Bellingham-GP Area Upgrades
This project would upgrade the existing track through Bellinghamrsquos Georgia Pacific (GP) Plant to allow for slightly higher speeds for Amtrak Cascades intercity trains resulting in a travel time reduction of about 11frasl2 minutes Due to unanticipated freight business at the mostly closed GP plant since the project scope was developed the project scope is now inadequate The implications for cost and schedule are being reviewed
Beige Pages - Measures Markers and Mileposts - December 31 2003 15
Beige P
ages - Measures M
arkers and Mileposts - D
ecember 31 2003
17
Beige P
ages - Measures M
arkers and Mileposts - D
ecember 31 2003
The following table summarizes the various changes and adjustments described on pages 8-10 for the quarter ending December 2003
Highway Projects Proposed Adjustments to Project Delivery Quarter Ending December 31 2003 Dollars in Thousands
03-05 05-07 07-09 09-11 11-13 Ten Year Total
Adjusted Net Adjusted Net Adjusted Net Adjusted Net Adjusted Net Adjusted Net SR Project Budget Budget Change Budget Budget Change Budget Budget Change Budget Budget Change Budget Budget Change Budget Budget Change 002 US297 Peshastin East - 2100 2100 0 1870 2700 830 7600 11750 4150 13780 0 -13780 0 0 0 25350 16550 -8800
Interchange 005 I-5SR502 Interchange 1321 2521 1200 8679 7479 -1200 0 0 0 0 0 0 0 0 0 10000 10000 0
005 I-5 Noise Wall 3500 3500 0 0 0 0 0 0 0 0 0 0 0 0 0 3500 3500 0
005 I-5SR526 to US 2 (Marine View 11000 15000 4000 6300 11300 5000 54780 52277 -2503 121900 117005 -4895 44680 36474 -8206 238660 232056 -6604 Drive)
007 SR7SR507 to SR512-Safety 9300 9300 0 0 0 0 0 0 0 0 0 0 0 0 0 0 0 0
009 SR 9 Nooksasck Road to Cherry 6320 1548 -4772 8800 12730 3930 0 927 927 0 0 0 0 0 0 15120 15205 85 St
016 SR 16 HOV Improvements 49623 51483 1860 40902 39042 -1860 0 0 0 0 0 0 0 0 0 90525 90525 0 between Olympic Drive and Union Ave
020 SR 20Quiet Cove Rd Vic to SR 0 0 0 3790 766 -3024 3270 6294 3024 0 0 0 0 0 0 7060 7060 0 20 Spur
024 SR24I82 to Keys Road 840 840 0 22000 22000 0 9000 9000 0 0 0 0 0 0 0 31840 31840 0
031 SR 31Metaline Falls 4900 2400 -2500 11000 13500 2500 0 0 0 0 0 0 0 0 0 15900 15900 0 To Canadian Border
090 I-90 Two-way Transit and HOV 4000 3000 -1000 11000 12000 1000 0 0 0 0 0 0 0 0 0 15000 15000 0
099 SR 99s 284th to S 272nd St 3780 3656 -124 6323 8519 2196 2600 2621 21 0 0 0 0 0 0 12703 14796 2093 - HOV Lanes
161 SR 161Corridor Improvements 12100 6641 -5459 7300 12709 5409 15 27 12 0 38 38 0 0 0 19415 19415 0 -176th to 234th
203 SR 203NE 124thNovelty Rd Vic 1200 2084 884 0 163 163 0 0 0 0 0 0 0 0 0 1200 2247 1047
520 SR 520w Lake Sammamish 3400 3368 -32 4900 6700 1800 24500 16225 -8275 38720 60515 21795 30800 15493 -15307 102320 102301 -19 Pkwy to SR 202
522 SR 522I-5 To SR 405 Multi- 3600 1497 -2103 1500 3568 2068 0 0 0 0 0 0 0 0 0 5100 5065 -35 modal Project
Total of Projects Above 116984 108938 8046 134364 153176 18812 101765 99121 -2644 174400 177558 3158 75480 51967 -23513 593693 581460 -12233
Project Adjustments from Quarter 1 229284 210820 -18464 374159 375781 1622 323393 333343 9950 229295 263815 34520 142025 107237 -34788 1298156 1290997 -7159
Total of Projects from Quarter 2 221033 238273 17240 283976 265815 18161 312730 310414 -2316 307339 307064 -275 318918 348876 -42 1483296 1479741 -3555
Total for All Projects 567301 558031 -9270 792499 794772 2273 737888 742878 4990 711034 748437 37403 566423 508080 -58343 3375145 3352198 -22947
16
16Beige P
ages - Measures M
arkers and Mileposts - D
ecember 31 2003
Beige P
ages - Measures M
arkers and Mileposts - D
ecember 31 2003
The following table summarizes the various changes and adjustments described on pages 10-11 for the quarter ending December 2003
Rail Projects Proposed Adjustments to Project Delivery Quarter Ending December 31 2003 Dollars in Thousands
03-05 05-07 07-09 09-11 11-13 Ten Year Total Adjusted Net Adjusted Net Adjusted Net Adjusted Net Adjusted Net Adjusted Net
Project Budget Budget Change Budget Budget Change Budget Budget Change Budget Budget Change Budget Budget Change Budget Budget Change
Palouse Riv amp Coulee City RR 5820 5820 - 1530 1208 (322) - - - - - - - 7350 7028 (322) Acquistion Port of Columbia Railroad - - - - 11500 252 (11248) 1904 1904 - 3157 3157 11500 5313 (6187) Improvements Port of Columbia Co Dayton - - - - 320 - (320) - - - - - 320 - (320) Upgrades Blue Mtn RR Wallula-Walla Walla - - 1260 - (1260) - - - - - - - 1260 - (1260) Upgrade Rural Elevator Track Expansion - - - - - - 1140 - (1140) 3860 - (3860) 5000 - (5000)
PRampCC Cheney-Coulee 286K - - 1582 1582 11568 11568 8000 7236 (764) - 703 703 8000 21089 13089 Upgrade
Total Rail Projects 5820 5820 - 2790 2790 - 11820 11820 - 9140 9140 - 3860 3860 - 33430 33430 0
The following table summarizes the various opportunities and options described on pages 11-12
Highway Projects Opportunities and Options for Legislative Consideration Quarter Ending December 31 2003 Dollars in Thousands
03-05 05-07 07-09 09-11 11-13 Ten Year Total Adjusted Net Adjusted Net Adjusted Net Adjusted Net Adjusted Net Adjusted Net
SR Project Budget Budget Change Budget Budget Change Budget Budget Change Budget Budget Change Budget Budget Change Budget Budget Change
005 I-5 SR 526 (Marine View 11000 16000 5000 6300 110000 103700 54780 88000 33220 121900 - (121900) 44680 - (44680) 238660 214000 (24660) Drive)
099 SR 99 Alaskan Way Viaduct 45000 45000 - 12000 40000 28000 40000 40000 - 40000 40000 - 40000 12000 (28000) 177000 177000 -
405 I-405 Congestion Relief 46000 46000 - 99840 114840 15000 139020 199020 60000 160195 125195 (35000) 40000 - (40000) 485055 485055 -Projects
522 SR 522 Bothell-UW Campus 8000 - (8000) - 8000 8000 - - - - - - - - - 8000 8000 -Access
539 SR 539 I-5 Improvements 4850 4800 (50) 5500 8300 2800 5200 62800 57600 31500 8000 (23500) 42000 - (42000) 89050 83900 (5150) Ten-Mile Road to Intrsquol Border
Total Projects 114850 111800 (3050) 123640 281140 157500 239000 389820 150820 353595 173195 (180400) 166680 997765 967955 (29810)12000 (154680)
17
Beige Pages - Measures Markers and Mileposts - December 31 2003 19
Financial Information
2003 Transportation Funding Package ndash Paying for the Projects The first edition of the Beige Pages (June 2003) included an in-depth discussion of the Legislaturersquos 2003 Transportation Funding Package The revenue forecast has now undergone several updates since the Legislature enacted the budget The following information reflects the November 2003 forecast changes as well as the impact from the recent Supreme Court decision on Initiative 776 Further refinements to debt service estimates have also been made
Revenue Forecasts The 2003 Transportation Funding Package enacted by the Legislature included tax and fee increases The gas tax was increased by 5cent per gallon and gross weight fees on trucks increased by 15 An additional sales tax on new and used vehicles of 03 and a license plate number retention fee were both established The first two sources are to be deposited to a new account called the Transportation 2003 (Nickel) Account The latter two are to be deposited to the Multimodal Transportation Account that was established several years ago
The following charts show the current projected revenues over the next ten years (for the new funding sources) as forecasted in November 2003 by the Transportation Revenue Forecast Council compared to the legislaturersquos assumed lsquobaselinersquo projections used in the budget-making process in March 2003 Cumulative ten-year totals and individual biennial amounts are both shown
Transportation 2003 (Nickel) Account Revenue Forecast Forecast comparisons include actual March 2003 Legislative Biennial Baseline Compared to
November 2003 Transportation Revenue Forecast Council revenue collection data to date as well Millions of Dollars
as updated projections based on new and revised economic variables The November 2003 forecast includes several months of actual revenue receipt information Gas tax receipts include four months of actual collections and licenses permits and fees include three months of receipts In the Transportation 2003 (Nickel) Account revenue projections for the ten-year period for gas tax receipts were increased over the September 2003 forecast (+105) and licenses permits and fees were forecast to be slightly higher (+05) before taking into account the impact of Initiative 776 However when including the I-776 impact forecasted revenues for licenses permits and fees are down ten percent for the ten-year period In the Multimodal Account licenses permits and fees projected revenue for the ten-year period remained unchanged from the September 2003 forecast Initiative 776 did not impact the Multimodal account
$2000
$1800
$1600
$1400
$1200
$1000
$800
$600
$400
$200
$0
$19240m Baseline Total
November 2003 Forecast Total $18506m
Licenses Permits and Fees 5cent Gax Tax um
ulative
C
$3262 $3186 $3701 $3632 $3912 $3767 $4120 $3907 $4244 $4013
July 1 Baseline Nov 03 Baseline Nov 03 Baseline Nov 03 Baseline Nov 03 Baseline Nov 03 2003 Forecast Forecast Forecast Forecast Forecast
Biennium Ending Biennium Ending Biennium Ending Biennium Ending Biennium Ending June 2005 June 2007 June 2009 June 2011 June 2013
New Sources - Multimodal Account Revenue Forecast March 2003 Legislative Biennial Baseline Compared to November 2003 Transportation Revenue Forecast Council Cumulative and Biennial Totals Millions of Dollars
$600
$400
$200
$0
$3831m Baseline Total
Licenses Permits and Fees 03 Vehicle Sales Tax
Cumulative
November 2003 Forecast Total
$730 667$622 $592 $777 $709 $814 $752 $888 $817 $3537m
July 1 Baseline Nov 03 Baseline Nov 03 Baseline Nov 03 Baseline Nov 03 Baseline Nov 03 2003 Forecast Forecast Forecast Forecast Forecast
Biennium Ending Biennium Ending Biennium Ending Biennium Ending Biennium Ending June 2005 June 2007 June 2009 June 2011 June 2013
Beige Pages - Measures Markers and Mileposts - December 31 2003 18
18 Beige Pages - Measures Markers and Mileposts - December 31 2003
Bond Sales Plan for New Authorizations Provided by the 2003 Transportation Funding Package The 2003 Transportation Funding Package contained two new bond authorizations
bull a gas tax authorization of $26 billion
bull a state General Obligation Bonds (GO) authorization of $3495 million The proceeds from the new gas tax bonds will be used to fund highway projects The debt service will be paid by the revenues from the nickel increase in the gas tax The proceeds from the new state GO bonds will be used to fund rail and ferry projects Debt service for these bonds will be paid from the Multimodal Account Receipts from the new 03 sales tax on new and used vehicles will be deposited to the Multimodal Account and will augment rental car tax receipts and other fees already directed to this account
2003-2005 Biennium
For the 2003-2005 biennium the Legislature appropriated $280 million in proceeds from the new gas tax bonds and $477 million from the state GO bonds To date in this biennium $80 million of gas tax bonds have been sold No new bond sales occurred in this reporting period However in February 2004 (the next scheduled state bond sale) $25 million in gas tax bonds is planned to be sold for the 2003 Transportation (Nickel) Account and $20 million in GO Bonds for the Multimodal Account
The bond sales plan has not changed from the initial report The combined affect of the revenue forecasts bond sales assumptions and project expenditure assumptions is presented in the next section
Financial Plans for Accounts Supporting the 2003 Funding Package Transportation 2003 (Nickel) Account The Transportation 2003 (Nickel) Account was established in the state treasury to be the repository of the new nickel gas tax and the increases in various vehicle licenses permits and fees Bond proceeds from the $26 billion authorization will also to be deposited to this account Uses of the account include cash funding of highway and
Transportation 2003 (Nickel) Account 2003-2005 Budget and Ten-Year Financial Plan dollars in millions
Balance Forward from Previous Biennium Sources Gas Tax Revenues (new 5cent) Licenses Permits and Fees Revenues I-776 Impact (loss of revenue) Interest Earnings Bond Proceeds Federal Funds Local Funds
03-05 $00
2980 231 (26) 43
2800 10 34
05-07 $44
3419 241 (27) 43
5680 97 24
07-09 $171
3533 262 (28) 43
6700 00 09
09-11 $362
3652 284 (29) 43
6430 00 02
11-13 $672
3751 292 (29) 43
4390 00 34
Ten-Year Total
17335 1310 (139)215
26000 107 103
Total Sources of Funds Uses
$6072 $9477 $10519 $10382 $8481 $44930
Cost of Bond Issuance 07 13 17 16 12 65 Bond Sale Underwriters Discount 21 40 50 48 36 195 Debt Service 225 906 1890 2622 3378 9021
Highway Improvements 5697 7943 7338 6909 4628 32515 Highway Preservation 20 103 50 203 1070 1446 Washington State Ferry Construction 57 345 983 274 39 1699 Total Uses of Funds Biennium Ending Balance
$6028 $44
$9350 $171
$10328 $362
$10072 $672
$9163 ($10)
$44940 ($10)
This plan represents the current budget and ten-year financial plan as adopted by the 2003 Legislature and does not contain any proposed adjustments to project delivery
Beige Pages - Measures Markers and Mileposts - December 31 2003 19
Beige Pages - Measures Markers and Mileposts - December 31 2003 21
ferry projects identified by the Legislature and the payment of debt service and other associated costs for bonds sold to provide debt financing for highway projects Since gas tax receipts are deposited to this new account the uses of the account are restricted to highway purposes as required by the 18th Amendment to Washingtonrsquos Constitution The financial plan below brings together all of the projected Sources (tax revenue bond proceeds interest earnings) and Uses (2003-2005 appropriations 10-year projected program expenditures and debt service) of the new account
Changes to projected Sources and Uses of funds have been updated to reflect the most current forecasts As changes either positive or negative are incorporated into the plans the ending balances in the outer biennia are affected The current pro forma which incorporates actual tax collections and current forecast projections predicts a small negative ending balance of approximately $10 million by the end of the 2011-13 biennium The September 2003 pro forma predicted that there might be a negative $165 million shortfall This change is primarily due to a refinement to debt service calculations and the increased gas tax revenue forecast
As mentioned earlier for the ten-year period gas tax receipts were up slightly from the September 2003 forecast ($185 million) and licenses permits and fees were up slightly ($06 million) before the I-776 impact Key economic variables tax receipts and interest rates will continue to change over time Future updates to forecasts as well as inclusion of more actual receipts will further impact the projected final ending balance Additionally actual and revised assumptions pertaining to bond sales and debt service will continue to be incorporated and likewise will impact the outlook for the final ending balance
Impacts of Initiative 776 The 2003 Transportation (Nickel) Account was affected by Initiative 776 the application of which was ruled upon in October 2003 by the State Supreme Court (other affected accounts include the Motor Vehicle Account the Puget Sound Ferry Operations Account and the Washington State Patrol Account) This table shows the projected impact of Initiative 776 to all affected accounts in millions of dollars The 2003 Transportation Account will be negatively impacted over the ten-year period by $139 million
I-776 ImpactsLoss of Revenue by Account dollars in millions
Ten-Year 03-05 05-07 07-09 09-11 11-13 Total
Motor Vehicle Account $307 $272 $280 $289 $297 $1445 Transportation 2003 (Nickel) Account 26 27 28 29 29 139 Puget Sound Ferry Operations Account 06 05 05 06 06 28 Washington State Patrol Account 94 82 84 87 89 436 Biennial Total $433 $386 $397 $411 $421 $2048
Multimodal Transportation Account The Multimodal Transportation Account was established several years ago as the repository for tax revenues and operating and capital expenditures not restricted by the 18th Amendment The 2003 Transportation Funding Package directs receipts to this account from the additional 03 sales tax on new and used vehicles and the license plate number retention fee The most significant pre-existing tax deposited to this account is the rental car tax The 2003 Funding Package also directs bond proceeds from the $3495 million State GO authorization to this account
Beige Pages - Measures Markers and Mileposts - December 31 2003 20
20 Beige Pages - Measures Markers and Mileposts - December 31 2003
Multimodal Account 2003-2005 Budget and Ten-Year Financial Plan (dollars in millions)
03-05 05-07 07-09 09-11 11-13 Ten-Year Total
Balance Forward from Previous Biennium $141 $107 $202 $330 $491 Sources Licenses Permits Fees Distribution 247 270 282 290 302 1391 Rental car tax 453 503 567 627 689 2839 Sales Tax on New amp Used Car Sales 588 648 685 729 792 3442 Miscellaneous Income 15 15 15 15 15 75 Bond Proceeds 478 437 1287 896 398 3495 Federal Revenue 141 54 55 1016 1877 3142 Local Revenue 27 02 02 02 02 33 Total Sources of Funds $1948 $1928 $2893 $3575 $4074 $14417 Operating Uses Cost of Bond Issuance 01 01 03 02 01 09 Bond Sale Underwriters Discount 04 03 10 07 03 26 Debt service 22 93 195 325 439 1073 Transfers to Other Accounts 99 45 45 45 45 279
WSDOT Program Support amp Planning 54 45 46 47 48 240 Public Transportation 493 521 584 627 661 2886 WSF Maintenance and Operations 51 53 54 55 56 268 Rail 376 403 410 418 426 2033 Total WSDOT Operating Uses of Funds $1099 $1163 $1347 $1526 $1679 $6814 Capital Uses Hwy Preservation P0C 17 200 100 00 00 317 WSF Construction W0C 134 82 607 473 00 1296 Rail Y0C 440 327 711 1415 2250 5143
Local Programs Z0C 292 60 00 00 00 352 Total Capital Uses of Funds $883 $669 $1419 $1887 $2250 $7108
Biennium Ending Balance $107 $202 $330 $491 $636 $636
New funding source from the 2003 Legislative Package
Projects funded primarily by New Bonding Authority and Augmented Federal Funds for Rail
New Bond Authorization from the 2003 Legislative Package
Anticipated Federal Funds
The Multimodal Account includes changes to projected sources of funds based on three months of actual receipts and current forecast data As stated above projected revenues from licenses permits and fees for the ten-year period remained unchanged from the September 2003 forecast
Beige Pages - Measures Markers and Mileposts - December 31 2003 21
Beige Pages - Measures Markers and Mileposts - December 31 2003 23
Program Management Information
Management Information Systems and Needs
A key lesson learned from WSDOTrsquos nationwide assessment of project delivery information systems was that successful transportation programs were supported by integrated management information systems Currently WSDOTrsquos hardware and software capabilities in this area pieced together over a period of more than twenty years fall far short of delivering what is necessary to support todayrsquos higher expected levels of oversight and accountability This presents significant challenges
WSDOT managers are required to access project financial plans expenditure plans actual expenditure levels project milestones and project work load estimates from several different management systems Reporting from the various systems while partially automated requires a significant degree of manual intervention and support systems (databases spreadsheets etc)
The 2003 Legislature supported WSDOTrsquos request for a systems modernization assessment study A Legislative Transportation Committee (LTC) workgroup was formed to provide oversight for this project Members include four senators and four representatives charged with recommending actions to the full LTC The workgroup met in September 2003 to initiate review of the project Statement of Work If the statement of work is approved the assessment effort is expected to produce an integration strategy and a project plan for presentation to the transportation committees of the legislature by December 2004
While developing the long-term plan there are pressing short-term needs that are required to shore up the existing systems WSDOT has completed the following activities
bull Added information to the data marts used for reporting program management information (CPMS) and project accounting information (TRAINS) This will provide added support for project and program tracking and will increase reporting options and flexibility of information retrieval
bull Developed a web-based Quarterly Project Report for the Gray Notebookrsquos Beige Pages Trained staff to feed information to the Quarterly Project Report manually and developed a plan to implement electronic data feeds (to be implemented in early 2004)
bull Completed an assessment of the number of projects by project type and by region that have been loaded into the agencyrsquos Project Scheduling Information System (PDIS)
bull Developed a preliminary plan to build a PDIS Data Mart that will make project schedule and status information more readily available for reporting Completion of the data mart is tentatively scheduled for mid-2004
bull Developed a preliminary designbuild work breakdown structure for use in scheduling the mega projects This structure will allow for scheduling and reporting status at a detailed level and assessing the earned value of work done to-date as the mega projects proceed
bull Started development of data marts to provide flexible reporting of the roadway inventory information that supports project scoping and development activities (to be implemented in mid-2004)
Right of Way Acquisition Delays and cost increases in right of way acquisition have affected the delivery of several 2003 Transportation Funding Package projects For example advertisement for the SR 7SR 507 to SR 512 ndash Safety project has been delayed due to 18 adjudicatory hearing requests from property owners adjacent to the project WSDOT expects to complete negotiations with property owners by the end of spring 2004 For details see page 4
The tight delivery schedule for the 2003 Transportation Funding Package presents unique challenges for right of way acquisition In order to minimize future right of way acquisition problems the WSDOT Real Estate Services office (RES) and the Access Management office are analyzing the next two biennia to pick out projects requiring immediate action to assure that right of way is delivered in time for advertisement WSDOTrsquos right of way access and real estate experts have also formed a plan to look for total parcel acquisitions and parcels where access control is already in place thereby avoiding access hearings whenever possible Acquisition plans will be developed as soon as possible and RES will be able to begin to acquire the necessary properties
Beige Pages - Measures Markers and Mileposts - December 31 2003 22
22 Beige Pages - Measures Markers and Mileposts - December 31 2003
Appraisers title examiners and real estate agents in the private sector continue to enjoy a high volume of business due to the low interest rate environment As a result recruitment of experienced real estate professionals to replace retiring right of way staff at WSDOT is proving challenging WSDOT continues to seek qualified professionals to join its staff and will also begin a training program to develop sufficient staff experience to support the large program it needs to deliver over the next decade
Utilities Relocation
As of December 31 no utility relocation issue has caused a project to go on ldquoWatch Listrdquo status
One of the keys to avoiding obstacles to project delivery from utilities relocation is to give utility companies as much notice as possible of WSDOT project impacts to their facilities This allows the utilities adequate time for design budgeting and scheduling of the utility relocation Below is an example of WSDOTrsquos coordination efforts with the goal of minimizing utility relocation risks to our project schedules
bull Widen I-5 Each Direction from Salmon Creek to I-205
NW Natural had concerns that the pressure in its natural gas lines would not adequately serve the neighborhood to the west of Interstate 5 once the NE 129th Street over crossing was demolished WSDOT and NW Natural changed the original plan to run the gas line across the new bridge at 129th The new plan utilized horizontal directional boring equipment to place the line under Interstate 5 allowing the utility to navigate around proposed drainage drilled shafts for the new bridge and retaining walls
Comcast also voiced concern regarding running a temporary line during the reconstruction of the bridge WSDOT worked to provide a new freeway crossing at the 134th Street interchange rather than at 129th Street
bull SR 270 Pullman to Idaho State Line ndash Additional Lanes
An initial meeting has taken place with Avista Utilities for gas line relocation along the SR 270 corridor This allows approximately one year to complete design and relocation prior to the start of the contract
bull SR 31 ndash Metaline Falls to the Canadian Border ndash Reconstruction
A new fiber optic line was recently installed at the north end of the project to enhance communications to the Metaline Falls Border Crossing After coordination with WSDOT the Pend Oreille Telephone Company placed the line so that it would not impact roadway construction
bull US 395 North Spokane Corridor - Gerlach to Wandermere
An agreement has been made with Bonneville Power Administration to initiate design work on tower relocation and reconstruction The design work is to be completed by April 2004 Construction is scheduled to begin in November 2004
WSDOT is also coordinating with the PUD and local communications companies in Pacific County on US 101 in the vicinity of South Bend to make design adjustments so that underground utility lines can be placed at the time WSDOT raises the grade of the road for the SR 105 Mitigation ndash Willapa River Estuarine project This will not impede the traffic staging of the project and will decrease the risk of any utility relocation delays to the contractor
Environmental Documentation Review Permitting and Compliance WSDOT is overseeing a statewide transportation improvement program that creates new opportunities for aligning citizensrsquo goals for the environment and for transportation systems We are working to change the way we communicate these objectives and the interrelated nature of the complex issues in both protecting and improving the environment from the delivery of transportation projects
Beige Pages - Measures Markers and Mileposts - December 31 2003 23
Beige Pages - Measures Markers and Mileposts - December 31 2003 25
Environmental Documentation and Review
Compliance with the Endangered Species Act
About forty Nickel projects remain to be advertised for construction in this biennium according to WSDOTrsquos delivery plan Twenty-three of these projects have completed their required consultations under Section 7 of the Endangered Species Act Transportation projects that do not use federal funds are not required to obtain Section 7 consultation from the Endangered Species Act Two projects will not require Section 7 consultation because no federal funding will be allotted for project Eleven projects in the preliminary stages of design cannot seek the consultation process at this time until the Biological Assessments are completed Consultation on these projects should begin in 2004
There are two projects currently undergoing consultation with NOAA Fisheries and the US Fish and Wildlife Service (USFWS) The SR 31 Metaline Falls to Canadian Border Reconstruction project is undergoing formal consultation with the USFWS to address Canada Lynx concerns The I-90 Two Way Transit amp HOV project is undergoing consultation with NOAA Fisheries and USFWS
Three local projects funded with Nickel Funds revenues will be lead through the consultation process by local governments (City of Shoreline the City of Bremerton and the Hood Canal Coordinating Council) Two projects for WSDOT to deliver statewide (Statewide Bridge Rail Retrofit and Statewide Guardrail Retrofit) will be taken through consultation by the regional offices acting on a regional basis Two regions have already completed the consultation process for these projects
A team of three experienced WSDOT biologists was deployed to the Western Washington Office of the USFWS to address the approximately 20 projects stalled in review This staff assignment accomplished the completion of consultations for 15 projects including the SR 9 ndash SR 522 to 176th St project A new backlog is beginning to build due to the need to reinitiate consultation on a number of projects including the Hood Canal Bridge Replacement In addition the backlog is compounded with the extensive amount of time that seems to be required to be spent in consultation on some of the more complex projects The Federal Highway Administration WSDOT and USFWS are continuing discussions on how to address this problem
Program Delivery Tracking Sheet for ESA Section 7 Consultation WSDOT Projects rsquo03 -rsquo05 Biennium
NOAA Fisheries USFWS
Project Biological Assessment
Consultation Status
Biological Assessment
Consultation Status
NEPA Type
NEPA Complete
Proposed Ad Date
SR 31 Metaline Falls to Inttrsquol Border NA NA 81003 Waiting EA 120503 41004
I-90 Two Way Transit and HOV 11212003 Waiting 122103 Waiting FEIS 033004 106
Consultant Utilization
There are two main areas where consultants are expected to be utilized on 2003 Transportation Funding Package projects The first is to augment WSDOTrsquos workforce so WSDOT can minimize the inefficiencies associated with short-term workforce expansions and contractions The second is to fill needs for specialized expertise that may not be available ldquoin-houserdquo
When WSDOT established the Urban Corridors Office in 2003 contracting efforts were directed at having a sufficiently large pool of qualified talent to draw from quickly and efficiently without time delays With that goal currently being met the emphasis has shifted slightly to identifying the ldquoBest of the Bestrdquo in a variety of specialized areas allowing WSDOT to draw upon top expertise at national and international levels
Regional Transportation Improvement District (RTID) Projects The 2003-2005 Transportation Budget requires the Regional Transportation Improvement District (RTID) to conduct an independent review of all project scopes and budgets prior to placing projects on the ballot WSDOT management is assisting RTID by identifying and assembling a ldquoPanel of Expertsrdquo to review CEVPreg and Cost Risk Assessment projects National or international experts with experience in a wide range of engineering disciplines and in cost risk assessment will be sought The panel selection should be complete early next quarter
Beige Pages - Measures Markers and Mileposts - December 31 2003 24
24 Beige Pages - Measures Markers and Mileposts - December 31 2003
On-Call Services WSDOT currently has over 200 different consulting firms committed to providing services to the State on short notice through ldquoOn-Callrdquo contracts Many of these firms which range from single person consultants to large multi-tiered organizations have internationally recognized experts on staff Currently twelve prime contractors plus their sub-consultants are under contract to provide project specific services across the state
2003 Transportation Funding Package - Consultant Utilization to Date For the quarter ending December 31 2003 WSDOT paid $2556500 to firms providing services on 2003 Transportation Funding Projects Over 300 people were working directly on a full or part time basis on these projects Over $5000000 was authorized as new work in the quarter
Construction Employment Information
Contractor Employment
The 2003 Transportation Funding Package supports transportation projects that make important and long-term contributions to the statersquos economy and the productivity and economic well-being of its citizens Far from the only or even the largest of these impacts is the direct and indirect economic benefits of the construction activity itself one aspect of which is the creation of jobs to built the projects
The direct and indirect benefits of construction employment have been extensively examined by labor economists A useful guide is Associated General Contractors of Washington Economic Impact of the Construction Industry on the State of Washington 2002 Update (prepared by the University of Washington)
How many people are at work on the 2003 Transportation Funding Package projects
The precise number for obvious reasons is impossible to state The jobs are not just at the job site but include designers and project engineers (many of whom divide their efforts among many projects) suppliers and their employees and many others Even for the contractors employment supported by these projects includes home office as well as job site staff And at the job site the employment count varies from day to day depending on subcontractor activity the sequencing of job activities and even the weather We have asked contractors on the Nickel Fund projects in construction to provide the WSDOT construction office with a ldquosnapshotrdquo number what is your best estimate of the ldquoaveragerdquo direct job site employment on your job over the course of the quarter The following table captures the prime contractorsrsquo responses for their own work and their on-site subcontractors on the Nickel Fund projects that have already gone into construction
ProjectContractor
Average project employment for Oct-Dec 2003
I-5 Widening Each Direction from Salmon Creek to I-205 Hamilton Construction and its 24 subcontractors
24 employees
SR 500 New Interchange and Additional Lanes Tapani Underground Inc and its 18 subcontractors
21 employees
I-90 Build Lanes from Argonne Road to Sullivan Rd Scarsella Brothers Inc and its 13 subcontractors
19 employees
I-90 Rye Grass Summit to Vantage Superior Paving Company and its 10 subcontractors
14 employees
I-90 Highline Canal to Elk Heights Scarsella Brothers Inc and its 12 subcontractors
17 employees
I-182US 395 Interchange ndash Roadside Safety Transtate Paving Company and its 2 subcontractors
6 employees
Construction Safety Information WSDOT and the AGC are currently finalizing the details of a method to jointly report safety data for the nickel projects The expected outcome will be a combined safety rating for the contractor and WSDOT staff on each of the Nickel Fund projects
Beige Pages - Measures Markers and Mileposts - December 31 2003 25
Beige Pages - Measures Markers and Mileposts - December 31 2003 26
Worker Safety Quarterly Update Continuing updates on Gray Notebook safety topics ndash data is shown for calendar year (CY) 2000 CY 2001 fiscal year (FY) 2002 FY 2003 and FY 2004 by quarter
WSDOT Highway Maintenance WorkersRecordable Injuries per 100 Workers per Fiscal Year
CY 2000
CY 2001
FY 2002
FY 2003
Qrtr 1 Qrtr 2 YTD 2004
0
5
10
15
20
FY 2004
Highway and Street Construction Benchmark 82
The second quarter recordable injury rate for maintenance workers was 62 injuries per 100 maintenance workers There were 22 recordable injuries during the second quarter of which 9 were lost workday cases accounting for 202 lost workdays This is a 24 decrease in injuries and a 17 reduction in lost workdays from the first quarter The three most frequent types of injuries for the second quarter were dislocation (27) occupational illness (23) and sprainstrain (23) The three most frequent causes of injuries for the quarter were struck by an object (23) overexertion (18) and falls from the same level (14) The three most frequent injuries to the body were back (32) ear (14) and hand (9)
Accident Prevention Activities Second Quarter FY 2004 bull The South Central Regionrsquos Maintenance division is identifying
targets and strategies to decrease personal injuries within work groups Four of five sections reduced their yearly injury average Accountability and awareness has increased substantially and the numbers reflect significant improvement
bull The Eastern Region is revising its Accident Review Board process to make it more accountable for overall safety
bull WSDOT completed a successful West Nile Virus campaign during the second quarter Between May and October 2003 WSDOT spent about $92000 for the West Nile Virus program This included obtaining materials training people monitoring sites and application of pesticides under the direction of the Department of Health (DOH) DOH reported that no human or animal cases were confirmed in Washington in 2003 However nationally in 2003 there were 7718 human cases with 166 deaths In 2002 there were 4156 cases and 284 deaths
Reading the ChartsldquoRecordable Injuries and Illnessesrdquo is a standard measure that includes all work related deaths and work related illnesses and injuries which result in loss of consciousness restriction of work or motion transfer to another job or require medical treatment beyond first aid The US Bureau of Labor Statistics provides the selected 2000 national average benchmarks After discussion with the National Bureau of Labor Statistics the following benchmarks were selected to provide a more relevant and consistent benchmark Maintenance ldquoHighway and Street Constructionrdquo Standard Industry Classification (SIC) 161 (rate 82) Engineering ldquoEngineering and Architect Servicesrdquo SIC 871 (rate 17) Ferry Vessel Workers ldquoWater Transportationrdquo SIC 44 (rate 70) One worker equals 2000 hours per year
WSDOT Ferry Vessel WorkersRecordable Injuries per 100 Workers per Fiscal Year
0
5
10
15
20
CY 2000
CY 2001
FY 2002 FY 2004
Qtr 1 YTD 2004
FY 2003
Qrtr 2
Water Transportation Benchmark 70
The second quarter recordable injury rate for ferry vessel workers was 98 injuries per 100 ferry vessel workers There were 23 recordable injuries during the second quarter of which 21 were lost workday cases accounting for 268 lost workdays This is a 4 decrease in the number of recordable accidents and a 36 reduction in the number of lost time days from the first quarter There are less worker hours this quarter causing a slight increase in the recordable accident rate even though the actual number of accidents dropped slightly The three most frequent types of injuries were sprainstrain (52) chemical exposure (13) and aggravation of a previous injury (13)The three most frequent injuries to the body were the back (13) circulatory system (13) and multiple (13)
Source for all charts WSDOT Safety Office
WSDOT Highway Engineer WorkersRecordable Injuries per 100 Workers per Fiscal Year
CY 2000
CY 2001
FY 2002
FY 2003
Qrtr 1 Qrtr 2 YTD 2004
0
5
10
15
20
FY 2004
Engineering and Architect Services Benchmark 17
The second quarter recordable injury rate for engineer workers was 16 injuries per 100 engineer workers There were 8 recordable injuries during the second quarter of which 7 were lost workday cases accounting for 56 lost workdays There are less worker hours this quarter causing a slightly higher accident rate even though the number of injuries remained the same The three most frequent types of injuries for the quarter were sprain strain (38) occupational illness (25) and lacerations (25) The three most frequent causes of injuries were overexertion (25) falls from the same level (25) and noise (25) The three most frequent injuries to the body were the back (25) ear (25) and knee (13)
Measures Markers and Mileposts - December 31 2003 27
Measures Markers and Mileposts - December 31 2003 29
0
5000
6000
7000
June Dec June Dec June Dec June Dec June Dec June Dec June 1997 1997 1998 1998 1999 1999 2000 2000 2001 2001 2002 2002 2003
Number of Permanent Full-Time Employees at WSDOT
Initiative 695 passed by voters
Referendum 49 passed by voters
5617 5671 6017 5960 5992 6181 6322 6366
Referendum 51 defeated by voters
6325 6171 6258
Dec 2003
WSDOT Workforce Levels One indicator of the agencyrsquos workforce size is the current number of permanent full-time employees on staff The accompanying chart shows that number at various points since the end of 1996 (The number of ldquoFTEsrdquo [full-time equivalents] will generally exceed the number of full-time employees since seasonal and part-time work force must also be funded from ldquoFTErdquo allotments)
Source WSDOT Office of Human Resources
Training for WSDOT Highway Maintenance Employees WSDOT continues progress toward achieving training goals for maintenance employees A total of 24 safety and maintenance courses are required by law andor regulation The chart shows status of training completed for 6 of the 13 required safety courses and 5 of the 11 maintenance courses
Maintenance Total Current Workers Maintenance Maintenance Maintenance Compliance Change
Requiring Workers Workers Workers to Date Since Training Trained to Date Trained 1st Trained 2nd Target = Last Dec 03 Dec 03 Quarter FY04 Quarter FY04 90 Quarter
Safety CoursesBlood Borne Pathogens 1243 1064 13 46 86 +2First Aid 1480 1383 6 0 93 -2Hearing Conservation 1363 1255 0 0 92 -3Personal Protective Equipment 1361 894 216 0 66 +1Fall Protection 750 403 19 0 54 +2Flagging amp Traffic Control 1149 1109 1 0 97 -1
Maintenance Courses Drug Free Workplace 326 287 0 0 88 +1Forklift 1173 1036 37 28 88 +0Hazardous Materials Awareness 986 671 85 90 68 +8Manlift Operations 523 307 0 8 59 -3Excavation Trenching and Shoring 438 302 45 93 69 +13
Training for All WSDOT Employees The following table reflects continued progress on important workforce training courses that help shape WSDOTrsquos workplace These courses are for all permanent full-time part-time and temporary employees The goal is to have 90 of our workforce trained as promptly as resources allow
Number of Number Employees Number Number Compliance Change
Requiring Trained to Date Trained 1st Trained 2nd to Date Since LastTraining Dec 03 Quarter FY04 Quarter FY04 Target = 90 Quarter
Training CoursesDisability Awareness 7295 2567 116 131 35 +1Ethical Standards 7295 7050 82 82 97 0Security Awareness - all employees 7295 5711 17 0 78 +4Security Awareness - supervisors 2884 1474 0 0 53 +1Sexual HarassmentDiscrimination 7295 4880 71 149 67 +14Valuing Diversity 7295 3200 129 142 44 +2Violence that Affects the Workplace 7295 5910 6 7 81 +6
In past quarters non-supervisory employees were incorrectly credited by WSF for attendance at Security Awareness for Supervisors training This has now been corrected
Source WSDOT Office of Human Resources Staff Development
Measures Markers and Mileposts - December 31 2003 28
28 Measures Markers and Mileposts - December 31 2003
Highway Construction Program Quarterly Update Meeting WSDOTrsquos Scheduled Advertisement Dates The Highway Construction Program is the largest capital program in the Transportation Budget Planned expenditures for the 2003-2005 biennium are approximately $23 billion Overall delivery of the Highway Construction Program is tracked and monitored against schedule projections for ad dates and for project cash flow The first is ldquoMeeting WSDOTrsquos Scheduled Advertisement datesrdquo The second is ldquoCash Flowrdquo Funding for the 2003-2005 Highway Construction Program includes a variety of fund sources including pre-existing transportation funds 2003 Transportation Funding Package (ldquoNickelrdquo funds) and Tacoma Narrows Bridge funds The program includes 345 construction projects for advertisement during the current biennium of which 46 are ldquoNickelrdquo projects and 299 are funded with pre-existing funds Overall including preconstruction activities on construction projects to be advertised in future biennia more than 1000 projects will be underway during the 2003-2005 Biennium In the 2003 Transportation Funding Package there were 20 projects originally planned for advertisement in the biennium through the end of the second quarter Of the planned total 15 have been advertised four have been rescheduled for later in the biennium and one has been deferred to the 2005-2007 biennium There were 70 pre-existing fund projects planned for advertisement by the end of the second quarter 42 have been advertised as planned 26 have been rescheduled for later in the biennium and two have been deferred to the 2005-2007 biennium In addition three projects were advanced from quarters later in this biennium and were advertised in the first quarter for a total of 45 projects that have been advertised to date
Ad Date 2003 Transportation Funding Package (ldquoNickel Fundsrdquo) Of the nine projects planned to be advertised in this quarter seven projects were advertised as planned one project was delayed for advertisement to later in the biennium and one will be deferred to the 2005-2007 biennium (for more detail see the Beige Pages) One project was advanced from the eighth quarter for a total of eight advertised projects
bull Seven projects were advertised as plannedSR 9SR 528 Intersection ndash SignalSR 16 HOV Improvements between Olympic
View Drive and Union Ave US 97A Entiat Park Entrance ndash Turn Lanes SR 124 East Jct SR 12 - Reconstruction
Highway Construction Program Delivery Planned vs Actual Number of Projects Advertised 2003-2005 Biennium Quarter 2 Ending December 31 2003
350
300
250
200
150
100
50
0 Qtr 1 Qtr 2 Qtr 3 Qtr 4 Qtr 5 Qtr 6 Qtr 7 Qtr 8
Planned Pre-Existing Funds Ads
Actual Pre-Existing Funds Ads
Transportation Funding Package Planned Ads
Transportation Funding Package Actual Ads
Source WSDOT Project Control and Reporting Office
SR 161234th Street to 204th Street ESR 203NE 124thNovelty Rd VicinityUS 395Kennewick Variable Message Sign
bullOne project was advanced SR 527132nd St SE to 112th St SE
bullOne project was delayed to a future quarter in 2003-2005 SR7SR 507 to SR 512 ndash Safety
bullOne project was deferred to 2005-2007 SR 522I-5 to SR 405 Multi-Modal Project
Ad Date Pre-Existing Funding Of the 58 projects scheduled for advertisement with pre-existing funds in the second quarter 34 projects were advertised as scheduled 22 have been delayed slightly to later in the 2003-2005 biennium two were deferred to beyond the 2003-2005 biennium and two projects were advertised in response to emergencies bull The following are six examples of pre-existing projects advertised as planned US 101 Olympic National Park to Indian Creek ndash This project overlays approximately three miles of existing roadway pavement between Olympic National Park and Indian Creek I-5 Stewart - South Bound off Ramp ndash The existing signal system will be replaced with a signals using poles and mast arms WSDOT will be conducting a feasibility assessment of connecting the new signal system to the City of Seattlersquos centralized system SR 11 Whatcom County Line to Bellingham ndash This project will resurface approximately four miles existing roadway and restore safety features between the Whatcom County Line and the City of Bellingham
Measures Markers and Mileposts - December 31 2003 29
Measures Markers and Mileposts - December 31 2003 31
SR 26 Union Flat Creek-Improve Drainage On SR 26 west of Colfax the design of this project will stabilize the roadway structure by reconstructing approximately 1200 linear feet of creek channel away from the roadway There will also be check dams to slow the flow of the creek and protect the roadway from erosion
SR 127 Central Ferry to Church Hill Road At Central Ferry and extending eight miles north on SR 127 the project preserves the pavement and extends the service life by paving with Asphalt Concrete Pavement mixture and will restore the basic safety features of the highway US 97 Blewett Pass South ndash Paving From the junction with SR 970 to the north of the summit the project is to resurface existing roadway pavement to maintain the integrity of the roadway
bull The following are two examples of delayed projects SR 20 Troxell Road to Deception Pass ndash Current design issues could not be resolved and will require additional engineering changes to meet environmental requirements This will delay the project until February 2005 US 395 Deadman Creek Fish Barrier Retrofit ndashAfter a project costbenefit analysis was conducted in conjunction with the Department of Fish and Wildlife both WSDOT and WDF believe that funds for this project could be used for similar projects that would gain better results
bull Two projects were added in response to emergencies SR 20 Rockslide ndash On Sunday November 9 2003 at 6 am a rockslide estimated at two to three million cubic yards occurred above State Route 20 at milepost 1215 The rockslide left the hillside extremely unstable damaged two sections of the highway and left the small town of Diablo cut off Currently monitoring equipment and minor highway repairs give Diablo residents Seattle City Light personnel National Parks Service and WSDOT personnel limited access to the highway The highway is open between 8 am and 4 pm when flaggers are in place In early February 2004 contractors will turn in a report to WSDOT with proposals for long-term solutions that will reopen the highway permanently US 101 Hoh River Erosion ndash In response to storm-related erosion WSDOT replaced washed out armoring and stream barbs with huge boulders along the Hoh river bank in an effort to keep the river from washing out sections of SR 101 Placement of the boulders is a temporary solution A permanent solution to this problem is being reviewed To meet permitting requirements of the Washington State Department of Fish and Wildlife WSDOT completed a Reach Analysis for this section of river in 2002 The Federal Highway Administration reviewed WSDOTrsquos approach to fixing the problem and has agreed to fund a permanent solution with federal funds WSDOT is now completing a conceptual design in accordance with the Reach Analysis and will have a cost estimate completed by the end of February 2004
Cash Flow on Highway Construction ProjectsHighway Construction Program Cash Flow2003 Transportation Funding Package Highway Construction Program Cash FlowPlanned vs Actual Expenditures (ldquoNickel Fundsrdquo) Planned vs Actual Expenditures 2003-2005 Biennium Quarter 2 ending December 31 20032003-2005 Biennium Quarter 2 Ending December 31 2003Dollars in BillionsExpenditures for highway projects through the quarter Dollars in Billions
ending December 31 2003 were $442 million This $12
represents 8 percent of the budgeted cash flow for the biennium At this point expenditures using the 2003 Transportation Funding Package are within one percent of meeting the plan The expenditure rate will increase as more projects are awarded or moved from a pre-existing project and added to the nickel list of projects The expected pattern of 2003 Transportation Funding Package spending is illustrated by the fact that expenditures in the 8th quarter of 2003-2005 are expected to be 28 percent of the entire bienniumrsquos budgeted cash flow
Qtr 1 Qtr 2 Qtr 3 Qtr 4 Qtr 5 Qtr 6 Qtr 7 Qtr 8
Source WSDOT Project Control and Reporting Office Pre-Existing Funding For the first two quarters of the biennium WSDOT submitted an expenditure plan to the legislature for approximately $328 million As of December 31 2003 expenditures totaled $265 million This leaves a variance of approximately $64 million or 192 percent from the plan WSDOT is currenlty seeking legislative direction on projects with programmatic variance
$0
$02
$04
$06
$08
$10
Planned Pre-Existing Funds
Actual Pre-Existing Funds Planned
Transportation Funding Package
Actual Transportation
Funding Package
Measures Markers and Mileposts - December 31 2003 30
30 Measures Markers and Mileposts - December 31 2003
Special Safety Improvements Quarterly Update
Meeting WSDOTrsquos Scheduled Advertisement Dates for the Safety Improvement Subprogram While elements that improve safety are a part of almost every highway construction project a special program sub-category established by the legislature covers the projects that are designed to address issues in ldquohigh accident corridorsrdquo and ldquohigh accident locationsrdquo These projects are identified by WSDOT based on information about the history of accident frequency and severity While these projects account for only a small portion of the overall benefits to safety from highway improvements WSDOT tracks the advertisement of these projects just as with other projects in the program in order to provide a picture of program delivery on issues that are of great importance on particular locales around the state that have been selected for this program treatment bullOf the 14 projects planned for ad these six projects were advertised as scheduled for this quarter
I-5Ramps at Michigan ndash CorsonAlbroSwift SR 9SR 528 Intersection ndash Signal I-90Moses Lake West Safety Improvements SR 124East Jct SR 12 ndash Reconstruction SR 203NE 124thNovelty Rd Vicinity US 395Kennewick Variable Message Sign
Safety Improvement Program Delivery Planned vs Actual Number of Projects Advertised 2003-2005 Biennium Quarter 2 Ending December 31 2003
90
80
70
60
50
40
30
20
10
0
Actual
Planned
Qtr 1 Qtr 2 Qtr 3 Qtr 4 Qtr 5 Qtr 6 Qtr 7 Qtr 8
Source WSDOT Project Control and Reporting Office
bull Eight projects were deferred for advertisement later in the biennium
SR7SR 507 to SR 512 ndash Safety SR 20Oak Harbor NCL to Frostad Road SR 20Monkey Hill Rd to Troxell Rd SR 20Sapp Rd to Reed St ndash Rechannelize SR 20Troxell Rd to Deception Pass Vic SR 20Frostad Road Vicinity ndash Guardrail SR 24South Wahluke Slope ndash Guardrail SR 290Helena Street ndash Add Turn Lane
Measures Markers and Mileposts - December 31 2003 31
Measures Markers and Mileposts - December 31 2003 33
End-of-2003 Season Highway Construction Project EvaluationsThird Annual Report The annual Construction Highlights report is an end-of-the-year synopsis of construction projects that were completed or nearly completed during the previous construction season Each regionrsquos project office evaluates how well its projects were carried out This is WSDOTrsquos third year publishing this report
This yearrsquos report is an assessment of 23 projects statewide representing a variety of construction types and settings Each project is rated in four elements of construction ndash design construction management schedule and cost and each element is assigned a one-to-five star rating (one is the lowest ranking while five is the highest) Contractorrsquos names are listed for identification but the detailed report shows that the strength or weaknesses of a particular project are often as much WSDOTrsquos responsbility as the contractorrsquos (guiding of design for example) and the best projects seem always to be built on strong teamwork for the entire project team The complete report can be found at wwwwsdotwagov projects2003highlights
Highway Construction Project Rating for 2003 Season Construction
Project Design Management Schedule Cost Contractor SR 504 Castle Rock laquolaquolaquolaquolaquo laquolaquolaquolaquolaquo laquolaquolaquolaquolaquo laquolaquolaquolaquolaquo Lakeside Ind SR 28 Rock Island laquolaquolaquolaquolaquo laquolaquolaquolaquolaquo laquolaquolaquolaquolaquo laquolaquolaquolaquolaquo Scarsella Bros US 395 Hillsboro laquolaquolaquolaquo laquolaquolaquolaquo laquolaquolaquolaquolaquo laquolaquolaquolaquolaquo M A DeAtleySR 26 Vantage laquolaquolaquolaquo laquolaquolaquolaquolaquo laquolaquolaquolaquolaquo laquolaquolaquolaquolaquo Central WA AsphaltSR 8 McCleary laquolaquolaquolaquo laquolaquolaquolaquolaquo laquolaquolaquolaquolaquo laquolaquolaquolaquo Scarsella BrosUS 12 Brady - Malone laquolaquolaquolaquo laquolaquolaquolaquolaquo laquolaquolaquolaquolaquo laquolaquolaquo Lakeside IndI-90 Sunset laquolaquo laquolaquolaquolaquo laquolaquolaquolaquolaquo laquo Kiewit ConstI-405SR 167 IC laquo laquolaquolaquo laquolaquo laquo Max J KuneySR 520 10th to Midspan laquolaquolaquolaquo laquolaquolaquolaquo laquolaquolaquo laquolaquolaquolaquolaquo Colvico IncI-90 Eastgate laquolaquolaquolaquo laquolaquolaquolaquo laquolaquolaquolaquo laquolaquolaquolaquolaquo Lakeside IndI-405 Cole Creek Parkway laquolaquolaquo laquolaquolaquolaquo laquolaquolaquolaquo laquolaquo Tri-State ConstructionSR 141 Klickitat Co Paver laquolaquolaquolaquo laquolaquolaquolaquolaquo laquolaquolaquolaquolaquo laquolaquolaquolaquolaquo Mid-Columbia PavingSR 20 Methow River Bridge laquolaquolaquolaquo laquolaquolaquolaquolaquo laquolaquolaquolaquo laquolaquolaquolaquolaquo One Way ConstructionSR 167 N Meridian to King laquolaquolaquolaquolaquo laquolaquolaquolaquolaquo laquolaquolaquolaquolaquo laquolaquolaquolaquolaquo ICON MaterialsI-5 Puyallup River Bridge laquolaquolaquolaquolaquo laquolaquolaquolaquolaquo laquolaquolaquolaquolaquo laquolaquolaquolaquolaquo CBI IncSR 161 Clear Lake Rd laquolaquolaquolaquolaquo laquolaquolaquolaquolaquo laquolaquolaquolaquolaquo laquolaquolaquolaquolaquo Tucci and SonsSR 525 SR 99 to SR 526 laquolaquolaquolaquo laquolaquolaquolaquo laquolaquolaquolaquolaquo laquolaquolaquolaquo KLB ConstructionUS 2 Barclay Creek Bridge laquolaquolaquolaquo laquolaquolaquolaquolaquo laquolaquolaquolaquolaquo laquolaquolaquolaquolaquo Wilder ConstructionSR 290 Trent Ave Bridge laquolaquolaquo laquolaquolaquo laquo laquolaquolaquolaquo Ross BrosI-90 Sullivan Rd laquolaquolaquolaquolaquo laquolaquolaquolaquolaquo laquolaquolaquolaquolaquo laquolaquolaquolaquolaquo Inland Asphalt CoSR 510 I-5 Pacific laquolaquolaquolaquo laquolaquolaquolaquo laquolaquolaquolaquo laquolaquolaquolaquo Scarcella BrosSR 125 Military Road laquolaquolaquolaquo laquolaquolaquolaquo laquolaquolaquolaquolaquo laquolaquolaquo Transtate PavingI-5 Samish Way laquolaquolaquolaquo laquolaquolaquolaquo laquolaquolaquolaquolaquo laquolaquolaquo Wilder ConstructionFour other projects of interest were included in the report but not evaluated SR 16 Tacoma Narrows Bridge SR 104 Hood Canal Bridge SR 433 Lewis and Clark Bridge and the Moses Lake Wetland Mitigation Bank Five star rating system one represents the lowest rating five represents the highest
WSDOT Asks the Publicrsquos Opinion Included for the first time in this annual Construction Highlights report is a public opinion questionnaire evaluating one project in each of WSDOTrsquos six regions Motorists who traveled through state highway construction projects over the past summer have an opportunity to tell WSDOT what they did or did not like what worked or did not work by visiting wwwwsdotwagovprojects2003highlights
WSDOT will use the public comments to improve the way projects are managed and communicated in the future Results of the public evaluation will be posted for each of the six projects Projects included are I-90 Sunset Interchange in King County I-5 Puyallup River Bridge in Pierce County State Route (SR) 141 Klickitat County Paver US 395 Hillsboro Street Interchange in Franklin County I-90 Sullivan Road to Idaho State Line Paving in Spokane County and SR 28 Rock Island Rock Slopes in Douglas County
Measures Markers and Mileposts - December 31 2003 32
32 Measures Markers and Mileposts - December 31 2003
Gig Harbor Tacoma
For scale The ferry Tacoma
Tacoma Narrows Bridge Project Update Designbuilder Tacoma Narrows Constructors (TNC) now stands at 263 construction completion of the new State Route 16 Tacoma Narrows Bridge project In December 2003 TNC reached another significant milestone ndash that of ldquotouching downrdquo the Gig Harbor (west) caisson onto the 133-foot-deep Narrows seabed In January TNC expects to touch down the Tacoma (east) caisson on the seabed at an even lower depth of 149 feet Following touchdown crews will continue placing reinforced concrete to build caisson internal and external walls while they dredge soil from the 15 hollow cells in each caisson Dredging will allow the caissons to sink another approximately 60 feet into the Narrows seabed At that point crews will start building the towers above water Other bridge work continues as well including anchorage construction and the overseas fabrication of the suspension cable wire Excavation work on both the Tacoma and Gig Harbor anchorages is finished The Tacoma anchorage has already had four massive concrete pours and crews are preparing to begin placing concrete on the Gig Harbor anchorage Roadwork also continues to move at a rapid pace Crews plan to complete the new eastbound on ramp and exit at 36th Street NW along with 22nd Street construction and open all to traffic in March Construction continues on several large retaining walls erosion control measures are in place for the winter season and landscaping along SR 16 is underway On February 2 the state Department of Ecology (DOE) fined WSDOT and TNC jointly $10000 for inadequate treatment of construction storm water During several rain events between October and January discharges of cloudy stormwater from the project site in the Narrows exceeded permit limits Since October project staff have worked hard to improve environmental compliance by implementing DOE environmental recommedations including implementing best-management-practice
Measures Markers and Mileposts - December 31 2003
Landscaping at 36th St on-ramp
Tacoma anchorage concrete pour Tacoma caisson concrete pour
Tacoma caisson construction
Tacoma Narrows Bridge Project Progress to Date Percent Complete
995Design
263Construction
314Total(1)
0 10 20 30 40 50 60 70 80 90 100
(1) Weighted 7 Design progress and 93 Construction progress
Source WSDOT Engineering and Regional Operations Division
stormwater treament controls increasing water monitoring and testing and monitoring stormwater detention ponds steps For more information on WSDOTrsquos environmental commitments see page 45 of this Gray Notebook For additional information including financial information project schedule traffic information photo library and more please visit wwwtacomanarrowsbridgecom
33
Measures Markers and Mileposts - December 31 2003 35
104 Hood Canal Bridge Project Update
Graving Dock Progress on the project remains almost at a standstill as efforts continue among WSDOT the Lower Elwha Klallam Tribe the State Office of Historic Preservation FHWA and the Army Corps of Engineers to resolve issues presented by the discovery in August 2003 of a significant archaeological find The process must establish compliance with the requirements of Section 106 of the National Historical Preservation Act in order for construction work to resume at the site probably following a period of intensive archaeological activity Meanwhile despite the lack of physical construction at the graving dock site the contractor completed a restoration project at Ediz Beach Close to 1500 feet of shoreline was cleared contoured and reseeded For many years the Ediz Beach area was unsafe and inaccessible due to logs pilings and other debris WSDOT removed these articles at low tide to avoid disturbing the harbor waters This restoration provides a healthy natural environment for native plants and animals and may also encourage the spawning of sand lance (a small fish) a significant portion of juvenile salmonrsquos diet It was completed on time and in accordance with a Hydraulic Project Approval (HPA) issued by the Department of Fish and Wildlife as mitigation for
Project Progress to Date Percent Complete
Total 88
0 10 20 30 40 50 60 70 80 90 100
(Percent completion based on contract dollars)
Source WSDOT Engineering and Regional Operations Division
Before
After
use of shoreline access to the graving dock The mitigation project had to be completed before October 15 2003 to minimize disturbance of the sand lance during its spawning period
Bridge Site Construction continued at the bridge site with the contractor Kiewit-General of Poulsbo building a temporary work trestle at the bridgersquos east end The work trestle eventually will support the new east-half transition span Plans are to roll the existing span onto a second temporary work trestle and roll the new transition span into place A long weekend closure is expected sometime in 2005 or 2006
For more information please visit wwwwsdotwagovprojectssr104hoodcanalbridgeeast
Measures Markers and Mileposts - December 31 2003 34
34 Measures Markers and Mileposts - December 31 2003
Highway Safety Improvement Projects Quarterly Update
Many of the highway safety improvement projects installed or constructed by WSDOT seek to improve safety in an area identified by unusually high frequencies of accidents Do these safety improvement projects in fact lead to safer conditions WSDOT reports below on a very encouraging review of before-and-after accident statistics in relation to 21 such projects from locales around the state Also featured this quarter are results from a study on
bull Cable Median Barrier - Across the Median Protection a project intended to benefit longer stretches of highway
bull Impacts of the 08 DUI law assessed over a six year period
bull Safe Routes to School program and
bull A roundabout project in the City of Port Orchard
Safety Projects ndash Before and After Results Each year WSDOT completes a variety of safety improvement Combined Average for 21 Safety Projects projects throughout the state highway system ranging from Collisions Per Year adding turn lanes and signals to installing median barrier and
Propertyrumble strips To begin to determine their effect on reducing the All Types Damage Only InjuryFatalnumber and severity of traffic collisions a preliminary before-
Before 155 88 67and-after study has been conducted for 21 such projects Projects After 97 55 42were chosen that permitted at least 18 months of collision data
to be analyzed in the before period and at least 12 months in the Source WSDOT Transportation Data Office
after period The data was then normalized (12 month average) to make a fair comparison
Preliminary results indicate that for this 21 project sample the average number of collisions per year for all projects combined was reduced by 37 percent Likewise the average number of fatal and injury collisions per year also declined by 37 percent As additional data becomes available this safety project analysis will be updated and expanded
To provide examples of the various types of highway improvements that were indicated in the study additional details about three different projects are provided below and on the next page
I-90 Gold Creek to Easton Hill Vicinity Kittitas County Screens were installed in the median at these two locations to reduce the night time headlight glare from on-coming traffic Prior to installation of the screens these two sections of I-90 had a combined average of 194 night time collisions per year After the installation this figure dropped to 137 a 29 percent decrease In addition for collisions that involved only damage to property the decline in the after period was even greater from 152 to 6 or a 60 percent reduction
Glare screen installed on median barrier along I-90
I-90 Ritzville to Tokio This project involved flattening side slopes installing rumble strips upgrading illumination and repaving Before the project started there was an average of 39 collisions per year in this 13-mile section of I-90 Since the project was completed this dropped to 21 collisions per year a 46 percent decrease The percentage decrease in fatal and injury collisions was nearly as large dropping by 34 percent In looking at specific categories of collisions additional reductions are shown a 9 percent decrease in non-daylight collisions a 31 percent decline in collisions on wet pavement surfaces and an 8 percent drop in overturns
Slope flattening and new pavement on I-90 near Ritzville
Measures Markers and Mileposts - December 31 2003 35
Measures Markers and Mileposts - December 31 2003 37
SR 99 Battery Street Tunnel Seattle In order to reduce the number of collisions occurring on wet pavement surfaces the concrete roadway was ground to increase friction Before the project this section of SR 99 experienced an average of 775 collisions per year 475 of which were on wet pavement After the project was completed total collisions decreased to 305 per year while wet surface collisions declined to 102 per year a reduction of 61 percent and 79 percent respectively If only injury collisions are considered the decrease after the project was completed is nearly as dramatic from 295 per year down to 148 or a 50 percent drop
Concrete pavement grinding to increase friction on SR 99 at theThe summary of all 21 safety projects so far included in the study Battery Street Tunnel in Seattlethat are being analyzed is presented in the table below For a complete table of findings please visit the following web site wwwwsdotwagovmapsdatatdoPDF_and_ZIP_Filessafety_projectpdf
Highway Safety Projects - Before and After Study Collision Data Comparison
Collisions Per Year Property
Available Data DamageProject Title and Location Description of Work (in months) All Types Only InjuryFatal US 2 Sultan-Startup Road Widened SR 2 to provide an EB left turn lane 18 Before 07 00 07Startup Vicinity and a WB left turn pocket 14 After 09 00 09SR 99 Battery Street Tunnel - Safety Constructed roadway surface improvements - 26 Before 775 480 295Seattle pavement grinding 13 After 305 157 148SR 522 NE 145th St Vicinity To NE 155th St Constructed raised median island in place of 18 Before 633 380 253Shoreline existing two way left turn lane Improved visibility 16 After 405 263 143US 2 Applets Way To Vicinity Red Apple Installed median barrier to reduce crossover 23 Before 21 05 16Road Cashmere collisions 12 After 00 00 00SR 1726 Othello - Grade Separation New interchange and illumination 21 Before 74 29 46Othello 12 After 20 10 10SR 24 Hatton Road Ltl Widened and provide left turn channelization 20 Before 12 06 06Othello and improve turning radius 13 After 18 18 00SR 26 Constructed left turn lanes 23 Before 68 37 31Royal City Vicinity 12 After 00 00 00SR 28282 Ephrata - Signal Widened roadway constructed left turn lanes 23 Before 57 57 00Ephrata and installed signal 13 After 37 37 00US 97 Orondo North Realingment and construction of left turn lane 25 Before 05 00 05Orondo Vicinity 12 After 00 00 00US 97 Alt Lakeside Vicinity Constructed two-way left turn lane 21 Before 51 40 11Chelan 16 After 08 08 00SR 150 Chelan West - Turn Lanes Widened and constructed left turn channelization 22 Before 11 05 05Manson 17 After 07 07 00SR 105SR 105 Spur Constructed channelization for right and left turns 29 Before 33 12 21Westport Upgraded illumination 12 After 30 20 10SR 162 Bowman Hilton Rd E to Vicinity Upgraded signal and illumination realignments 19 Before 499 215 284149th Alderton installed signal guardrail and flattened slopes 18 After 467 233 233I-5SR6 Sb Ramp - Signal Signal and illumination installation 25 Before 29 14 14Chehalis 15 After 08 00 08I-5 Chamber Way - Signal Installed signal at NB off-ramp realignments 25 Before 38 29 10Chehalis resurfacing and illumination 15 After 24 24 00US 101 Fowler Street- Signal Installed signal reconfigured with curbs and raised 25 Before 24 19 05Raymond islands 15 After 40 24 16SR 24 Birchfield Road Intersection Installed signalization upgraded illumination 24 Before 55 20 35Yakima Vicinity signing and pavement markings 12 After 50 30 20I-90 West Ersquoburg IC To South Ersquoburg IC Lengthen acceleration lane and tapers Updated 25 Before 149 115 34Ellensburg Vicinity illumination and guardrail Roadway rehab and overlay 12 After 160 130 30I-90 Gold Creek To Easton Hill Installed glare screen along median barrier 26 Before 194 152 42Snoqualmie Pass Vicinity 14 After 137 60 77SR 241 Alexander Road To Factory Rd Constructed two-way left turn lane Channelization 25 Before 120 34 86Sunnyside Vicinity Upgraded signals widened shoulders 4-way stop 21 After 103 63 40I-90 Ritzville To Tokio-safety Matrix Flattened slopes installed rumble strips 28 Before 390 193 197Ritzville Vicinity illumination upgrades and ACP overlay 12 After 210 80 130In addition to the projects shown the I-82Union Gap to Oregon State Line project was analyzed Initial results indicate an increase in collision frequency which is not readily identifiable because of the length of the project weather variation and increased traffic in different locations throughout the project Additional review is underway to identify probable causes for the collisions This information will be presented at a future date Source WSDOT Transportation Data Office
Measures Markers and Mileposts - December 31 2003 36
36 Measures Markers and Mileposts - December 31 2003
The Cable Median Barrier Protection From lsquoAcross the Medianrsquo Collisions
2003-2005 Median Crossover Protection ProjectsErrant vehicles that cross the median into opposing lanes State Lengthof traffic typically cause severe and often fatal collisions Route Project Title (miles) Ad Date
A study of across the median crashes on Washingtonrsquos I-5 Puyallup River To Fife Interchange 19 Aug-03 multilane divided state highways with full access control I-90 Argonne Rd to Pines Rd - Widen 206 Nov-03
I-90 Pines Rd to Sullivan Rd-Widen 211 Nov-03was conducted to evaluate median barrier guidelines and I-90 Moses Lake West-Safety Improvements 1135 Dec-03identify specific highway sections where installation I-5 County Line to Prairie Creek Bridge 245 Jan-04
of a barrier would be appropriate The program I-90 Sullivan Rd to State Line 699 Apr-04adopted after the study is to install cable barriers as I-90 Geiger Road to US-2 237 Oct-04 part of improvement projects when the median width I-5 Pierce Co Line to Tukwila IC HOV- 53 Oct-04 is 50 feet or less Installation of barriers in medians I-90 George Vicinity East - Safety 1582 Oct-04 over 50 feet in width will be weighed against other Source WSDOT Engineering and Regional Operations Division improvements on a case-by-case basis
Cable barriers have been used on the nationrsquos highways since the 1930s or before The modern system which uses three cables supported by weak steel posts was developed in the 1960s and is now in widespread use in several states
Reductions in Severe Collisions Severe Collisions While total collisions in the study areas I-5 in Before and After Cable Median Barrier Installation
Annual Fatal and Disabling Collisions and Median Collision Type Everett Vancouver and Fife nearly doubled (from 7
45 to 100 including collisions with property damage 6only) the number of severe collisions (fatal and
disabling) decreased significantly This resulted in a 5
societal benefit of cable median barriers calculated 4 to be $420000 per mile annually A breakout of the
3 types of severe collisions are shown in the graph to
2the right (graph does not include ldquoproperty damage onlyrdquo collisions) 1
0 The data on the right was normalized and represents 12 months before and 12 months after the project All Median Fixed Object Roll Over Cross Median
Source WSDOT Engineering and Regional Operations Division
Fatal Accidents Disabling Accidents
Before After Before After Before After Before After
Before After
Washington State and Alcohol-Related Fatalities From 1998 to 2002 alcohol-related deaths per 100 million
Washington State Alcohol-Related Fatalities miles driven dropped 11 percent overall from 060 to 054 per Per 100 Million VMT100 million miles driven in Washington A package of anti-1998 to 2002drunk-driving laws enacted in 1998 lowered the blood alcohol
intoxication threshold from 010 to 008 percent and provided 065
for automatic loss of license for drunk driving These legislative steps together with increased State Patrol emphasis on stopping 06
drunk drivers are credited with the decrease Other measures in Washington include increased use of ignition interlock devices 055
(a device attached to the carrsquos ignition system that requires the driver to blow into the device before starting the car ndash if alcohol 05
is detected the car wonrsquot start) and a crackdown on deferred prosecutions 045
DUI 08 Law Enacted
1998 1999 2000 2001 2002
Washington DUI Facts amp TrendsSource ldquoResearch Noterdquo DOT HS 809 680 US Department ofBetween 1983 and 1991 an average of 391 drinking- Transportation National Highway Traffic Safety Administration
driver-involved (DDI) deaths occurred each year Between December 2003 1992 and 2002 an average of 285 DDI deaths occurred each year This improvement means that about 1166 lives have been saved in Washington during the 1990s
Measures Markers and Mileposts - December 31 2003 37
Measures Markers and Mileposts - December 31 2003 39
Safe Routes to Schools Since 1999 WSDOT has administered a five million dollar per biennium grant program appropriated by the legislature called Traffic Safety Near Schools This program has funded more than 70 projects across the state to improve bicyclist and pedestrian safety near schools This program was not however extended to new projects in the 2003-2005 budget In addition the Washington State Traffic Safety Commission currently administers a $2 million annual School Zone Safety grant program that pays for safety education and small traffic safety improvements The program is funded by fines from school zone traffic violations
The Washington State Department of Health (DOH) recently received $800000 in grant funds to promote active community environments a program that will include safe walkride to school routes DOH is currently working with regional county and city governments in areas meeting specific public health criteria across Washington
Safe Routes to Schools mdash Elementary School Locations
Half of the elementary schools in Washington are located on or very near state routes State law requires elementary schools to produce walk route plans
Seattle
Tacoma Olympia
Spokane
Elementary schools on or within 12 mile of a State Route Elementary schools near accident sites (accidents involving elementary agevictims 1995-2001)
Safety in a Roundabout WayPort Orchard Roundabout Safety Improvement During the late 1980s and early 1990s traffic growth in the city of Port Orchard in southern Kitsap County overwhelmed the intersection of Bethel Avenue and Mile Hill Drive (SR 166) eventually generating enough injury and property collisions to classify the intersection as a High Accident Location (HAL) Vehicle speeds exceeding the posted speed limit and the intersection configuration contributed to the collision problem In the mid-1990s after approval of the design by WSDOT the City of Port Orchard built a ldquomodernrdquo roundabout the first of its kind on the state highway system and the second to be built in Washington
After the construction of the single-lane roundabout crash data supports how well a roundabout can work when applied to a site-specific intersection safety problem There are now 48 roundabouts in Washington
Port Orchard -Bethel Ave and Mile Hill Drive Intersection
Number of Collisions and Injuries Before and After Roundabout Comparison 40
30
20
10
0 3 Years Before 3 Years After Roundabout Roundabout
Collisions
Injuries
Source WSDOT Engineering and Regional Operations Division
Measures Markers and Mileposts - December 31 2003 38
38 Measures Markers and Mileposts - December 31 2003
Asset Management Pavement Assessment Annual Update WSDOT maintains approximately 19200 lane miles (including ramps) of pavement surfaces The three major pavement types are chip seal hot mix asphalt pavement and portland cement concrete (PCC) pavement Each of these pavement types has an associated pavement life rehabilitation treatment and rehabilitation cost This report is an annual update of information last presented in the Gray Notebook for the quarter ending December 31 2002
Pavement Condition Update 2002 Results Pavement Condition Trends According to the 2002 pavement condition survey the Percent of Pavements percent of WSDOT pavements in ldquopoorrdquo condition increased slightly in 2002 to 93 percent up from 89 percent as
100
reported in the 2001 pavement survey The rating continues 80
to be dramatically better however than the situation in 1971 when the Washington State Pavement Management System 60
was first put in place 40
Programming Pavements for Rehabilitation 20 The table below shows some important facts about the extent and use of the various pavement types and the success that 0
the state seems to be achieving in directing investment to 1998 2002
areas of need Source WSDOT Materials Lab
Over the last biennium about nine percent of pavement rehabilitation spending has been for chip seal resurfacing These roads the cheapest to Lowest Life Cycle Cost resurface constitute about 23 percent of the lane miles but carry only about five percent (LLCC) Program for of the traffic Pavement Management
The basic principles behind LLCCEighty-eight percent of the spending has been for preservation of hot mix asphalt are rather simple mdash if rehabilitation pavements These roads are 64 percent of the lane miles and carry 71 percent of the traffic is done too early pavement life is
wasted if rehabilitation is done too late very costly repair work may beThe PCC pavements are 13 percent of the lane miles yet carry 23 percent of the required especially if the underlying
traffic PCC pavements have longer lives than other pavements but are very costly to structure is compromised WSDOT rehabilitate not only in terms of construction money but also in traveler inconvenience continually looks for ways to best
strike a balance between these twofrom traffic restrictions when pavement work is performed especially on the major high- basic principles while implementingtraffic corridors Forthcoming replacement of these pavements will bring big challenges the practical aspects of pavement
rehabilitation programsinvolving funding engineering and traffic management during construction (see the discussion on PCC pavements later in this section) The state is fast approaching the need to reckon with this looming financial and traffic crisis in pavement management a story that is not fully revealed by the generally positive picture conveyed by the recent annual surveys of ldquopoorrdquo condition pavements for the entire highway system
1973 1981 1986 1990 1994
Good Condition
Slight increase in percentage of pavement in poor condition 2001 to 2002
Long-term trend declining percentage of pavement in Poor Condition
Pavement Type Lane Miles
Lane Miles
Annual Vehicle Miles Traveled ndash 2002 (in billions)
03-05 Dollars
Programmed (in millions)
05-07 Dollars
Programmed (in millions)
Miles $ $
Chip Seal Pavements A chip seal is a durable surface that provides six to eight years of performance life and has an approximate cost of $12000 per lane mile
4490 234 17 53 $195 9 $182 9
Hot Mix Asphalt Pavements Hot mix asphalt pavement surface life between rehabilitation treatments can range from six to 18 years (based on actual pavement performance) and has a cost of $123000 (due miles) per lane mile and $156000 (past due miles) per lane mile
12284 640 225 715 $1819 84 $1845 91
Portland Cement Concrete (PCC) Pavements WSDOT has experienced PCC pavement lives ranging from 25 to 45 years and has an approximate cost of $330000 for dowel bar retrofit per lane mile and $1 million for full replacement per lane mile
2410 126 73 233 $142 7 $0 0
Source WSDOT Systems Analysis and Program Development Office WSDOT Materials Lab
Measures Markers and Mileposts - December 31 2003 39
Measures Markers and Mileposts - December 31 2003 41
Chip Seals For chip seals asphalt is sprayed on the existing surface and then covered with a layer of rock chips The oil becomes solid as it cools Chip seals are appropriate for low volume roads (less than 2000 vehicles per day and less than approximately 200 trucks per day) Since the roadways that receive this type of treatment are typically on rural routes WSDOT has found that pavement rehabilitation dollars seem to be best spent with efficiency of scale when a stretch of rural road mileage is taken together for resurfacing in a single ldquopaverrdquo contract even when the contract includes aging segments not yet ldquoduerdquo together with ldquopast duerdquo segments
Hot Mix Asphalt On average western Washington hot mix asphalt pavement life is 165 years eastern Washington life is 113 years (due to severe winter cold and extreme summer heat) and the statewide average is 147 years Hot mix asphalt is appropriate for a broad range of roadways from lower volume routes (more than 2000 vehicles per day and more than 200 trucks per day) to interstates with heavy traffic volumes
These pavements are where the greatest benefits of LLCC pavement management can be realized In past biennia there has been some tendency to allocate a share of pavement preservation dollars on a traditional basis by region in addition to dollars programmed strictly by reference to ldquopast duerdquo needs This has resulted in some distortion away from ideal LLCC results As of the 2003-05 biennium this has been corrected by making all regional allocations based on pavement condition and LLCC analysis
Portland Cement Concrete (PCC) Existing PCC pavement life ranges from 25 to 45 years PCC pavement is typically placed on heavily traveled interstate principal arterial and intersection locations Most of the PCC pavements historically installed on Washington highways require dowel bar retrofit and diamond grinding (to smooth the pavement surface) 20 to 25 years after construction (due to lack of reinforcing steel at the transverse joints to prevent settlement) It is estimated that a newly constructed PCC pavement will have a pavement life of 50 years and only require diamond grinding in its 25th year due to studded tire wear
Efficiency Gains for Hot Mix Asphalt Pavements Hot mix asphalt surface life has improved by 14 percent (statewide) over the last six years while over the same time period the vehicle miles traveled on asphalt paved roadways has increased by approximately 10 percent Management of asphalt pavements is an area where WSDOT has succeeded in delivering dramatically improved ldquobang for the buckrdquo to Washington state taxpayers How have WSDOT and its asphalt paving industry contractors achieved this significant efficiency gain in asphalt on state freeways and highways The keys lie chiefly in the following areas bull Provision on the paving specification for use of performance-grade binders selected for expected climate and traffic conditions
bull Use of Superpave mix designs keyed to temperature and traffic expectations
bull Improved asphalt pavement repair and asphalt placement techniques
bull Better attention to construction details and inspection and bull Increased experience with LLCC rehabilitation programming
WSDOT is also focusing pavement management efforts on programming more lane miles at a single location resulting in lower bid prices The amount of asphalt used for pre-leveling (filling in minor ruts and depressions prior to paving) has also been reduced on WSDOT paving jobs generally from 600 tons per lane mile to 300 tons per lane mile resulting in a substantial cost savings The effect of these efficiency gains taken together is that a tax dollar invested in pavement rehabilitation today buys much more than it did just a few years ago
2004 Concrete Lane Miles
Current Age (Construction or Reconstruction)
Total Lane Miles
Lane Miles Rehabiliated to Date by Dowel Bar Retrofit
0-10 1471 00 11-20 2740 00 21-30 5668 350 31-40 6420 3224 41-50 2791 581 51-60 50 02 61 or more 661 00 Total 19800 4157
A matter of concern in the 2002 pavement condition survey is that an additional six miles of PCC pavement were found to have fallen into the ldquopoorrdquo category raising the PCC ldquopoorrdquo total to 170 lane miles However the greatest concern is the potential for a dramatic increase in the poor category as a result of the PCC performance reevaluation in 2004
The table at left illustrates the number of PCC pavement lane miles currently owned and maintained by WSDOT Sixty miles of PCC replacement would cost on the order of approximately $60 million before taking into account the project costs associated with roadway safety upgrades and stormwater runoff control retrofits
Does not include 321 lane miles of bridge Traffic disruptions associated with rehabilitation or replacement of these pavements is sections and 112 lane miles of ramps another difficult feature of this looming problem
40 Measures Markers and Mileposts - December 31 2003
40 Measures Markers and Mileposts - December 31 2003
Rating Pavement Conditions WSDOT continues to use a three-part examination system to rate pavement condition
Pavement Structural Condition (PSC) A pavement will develop structural deficiencies for two reasons truck traffic and cold weather The PSC is a measure based on distress such as cracking and patching which are related to the pavementrsquos ability to carry loads PSC ranges from 100 (best condition) to 0 (worst condition) A roadway should be considered for rehabilitation when it falls within the PSC range of 40 to 60 Rutting Rutting is caused by heavy truck traffic or studded tire wear Ruts deeper than 12 inch have the potential to hold water increasing the risk of hydroplaning for high-speed traffic A roadway should be rehabilitated when the rut depth is greater than 13 inch
Roughness The International Roughness Index (IRI) is a procedure to measure pavement ride A full-sized van with a laser-measuring device mounted on the front bumper measures the roughness of the pavement A roadway should be rehabilitated when the IRI value is between 170 and 220 inches per mile
Determining When Pavements are ldquoDuerdquo The Pavement Condition Rating process using the van pictured on the right analyzes and predicts the pavement rehabilitation due period (see the Gray Notebook for the quarter ending June 30 2001 for details) A regional validation process reviews the results and calibrates the ratings if needed The number of disputed segments varies between 5-10 Each of the segments in question is then reviewed and any discrepancies are resolved WSDOT considers the pavement rehabilitation due year in the Pavement Management System to be approaching 100 accuracy Pavement Condition Data Collection Vehicle
2002 Pavement Smoothness by StateHow Do Washingtonrsquos Pavements Conditions Centerline Miles in PercentCompare with National Experience Miles Poor in Poor
FHWArsquos annual Highway Statistics report includes Rank State Reported Condition Condition information on pavement condition reported by each 1 Georgia 11301 34 03
2 Wyoming 4414 22 05of the 50 states and the District of Columbia (based on 3 Alabama 7643 41 05roughness only) To the right is a snapshot of the 2002 4 North Dakota 6180 53 09 results that shows the number of miles by state in 5 Minnesota 11658 108 09
6 Nevada 2959 33 11poor condition according to smoothness The total miles 7 Kentucky 5192 76 15reported includes the interstate system and principal 8 Florida 10898 160 15
9 Kansas 8851 183 21arterials owned by the state cities and counties and a 10 Arizona 4065 86 21sampling of other functional classes Washington state 11 Idaho 3860 93 24ranked 16th in smooth roads in 2002 (Washington was 12 Maine 2391 60 25
13 Montana 6927 179 26ranked 17th in 2001) 14 Utah 3676 120 33 15 Alaska 1800 62 34 16 Washington 5396 194 36The FHWA publication can be viewed at wwwfhwadotgovpolicy
ohimhs02indexhtm 17 South Carolina 6791 260 38 18 New Hampshire 1375 54 39
49 California 20634 5437 263 50 Massachusetts 3290 1182 359
Source Highway Statistics 2002 US Department of Transportation
Measures Markers and Mileposts - December 31 2003 41
Measures Markers and Mileposts - December 31 2003 43
Highway Maintenance Annual Update Biennial Maintenance Targets The Maintenance Accountability Process (MAP) targets measures and communicates the outcomes of 34 distinct highway maintenance activities Maintenance results are measured using field condition surveys and are reported as Level of Service (LOS) ratings LOS targets are defined in terms of the condition of various highway features (for example the percent of guardrail on a highway system segment that is damaged) LOS targets are also keyed to the level of funding provided by the Legislature The following table shows a list of maintenance activities (in prioritized order) for which LOS targets have been set in the 2003-05 biennium During 2003 targets for all activities were achieved
WSDOT Maintenance TargetsAchieved for 2003 Maintenance Activity Achieved Pavement Patching and Repair uuml
Snow and Ice Control Operations uuml
Traffic Signal Systems uuml
Movable and Floating Bridge Operations uuml
Urban Tunnel Systems uuml
Keller Ferry Operations uuml
Guardrail Maintenance uuml
Noxious Weed Control uuml
Structural Bridge Repair uuml
Intelligent Traffic Systems uuml
Control of Vegetation Obstructions uuml
PermitsFranchises uuml
Maintain Culverts uuml
Regulatory Sign Maintenance uuml
Slope Repairs uuml
Crack Sealing uuml
Bridge Deck Repair uuml
Safety Patrol uuml
Rest Area Operations uuml
Highway Lighting Systems Operations uuml
Pavement Striping Maintenance uuml
Maintain Catch Basins and Inlets uuml
RaisedDepressed Pavement Markers uuml
Sweeping and Cleaning uuml
Nuisance Vegetation Control uuml
Maintain Ditches uuml
Shoulder Maintenance uuml
DetentionRetention Basins uuml
Litter Pickup uuml
Guide Sign Maintenance uuml
Landscape Maintenance uuml
Guidepost Maintenance uuml
Bridge Cleaning uuml
Pavement Marking Maintenance uuml
2003 Perfect Score ndash Percentage of Legislatively Funded Targets Achieved 1998-2003 In September 2001 the first Gray Notebook quarterly report on MAP WSDOT achieved 26 out of the 34 MAP targets Three years later a perfect score has been achieved The positive trend can be attributed to bull What gets measured gets managed WSDOT
maintenance managers and field workers are gaining experience with how to manage work in ways that help to attain the service level targets
bull Strong maintenance results across-the-board have been assisted by mild or average winter conditions
bull Stable funding for maintenance for several years has lessened ldquocrisis moderdquo management and produced better across-the-board results
bull Improved accuracy in measuring MAP results ndash based on a six-month review and field verification of MAP measures and their assessment technique
Starting in March 2004 WSDOT maintenance staff will be documenting greater levels of detail such as units of work completed (for example ldquolinear feet of guardrail repairedrdquo) This will provide information that can be used to develop cost per unit and units per day or week measures to supplement the outcome measures provided by MAP Look for more on this in future Gray Notebook maintenance pages
Percentage of Legislatively Funded Targets Achieved for 1998-2003
100
80
60
40
20
0 2002 20031998 1999 2000 2001
Source WSDOT Maintenance Office
Measures Markers and Mileposts - December 31 2003 42
42 Measures Markers and Mileposts - December 31 2003
Integrated Vegetation Management Integrated Vegetation Management (IVM) involves creating and supporting roadside plant communities that minimize short and long-term maintenance needs Roadside vegetation maintenance requirements often depend on how well roadsides are designed and constructed When soil is conserved and improved vegetation is restored during highway construction roadside maintenance requirements can be relatively low However if roadsides are not well restored at the time of construction the expense of roadside maintenance grows because noxious and nuisance weeds tend to establish themselves and thrive in poor soils with sparse vegetation
2003 Herbicide Use Trends ndash Results In terms of pounds of active ingredient WSDOTrsquos statewide annual use of herbicides for roadsides increased by 3300 pounds (121105 pounds in 2002 to 124426 pounds in 2003) On closer review of the data most areas in western Washington were either down or about the same in their overall herbicide use compared to 2002 In fact Clallam County the first area in which WSDOT has implemented an IVM plan saw a 50 percent reduction in herbicide use on the roadsides In eastern Washington two areas in particular experienced significantly increased herbicide use The cause was a localized ongoing weed infestation problems for which herbicide applications were needed Had it not been for the significant application in these two areas WSDOTrsquos herbicide use in 2003 would have been less than in 2002
Clallam County IVM Plan In the past year WSDOT has finally begun to make progress implementing its long-promised IVM program Working with communities and a number of interest groups on the Olympic Peninsula WSDOT developed an IVM plan for state highway maintenance in Clallam County that reduced the amount of herbicide used and responded to citizen concerns Highlights and results include
bull No vegetation-free area adjacent to pavement within 60 feet of salmon streams Hand-treatment only of invasive plants growing next to the pavement edge in this area
bull No summer application of herbicides for controlling trees and brush
bull Hand application of noxious weed control herbicide (as opposed to truck applications) and close coordination with the Clallam County Noxious Weed Control Board
bull Experimentation with alternative brush control methods such as planting desirable plant species (ie salal) hydro seeding and biological controls
bull Total herbicide use decreased more than 50 percent
At a February 5 2004 open-house meeting to discuss continued aspects of the IVM program in Clallam County concerned citizen Josey Paul commended WSDOT employees saying ldquoThank you for your good efforts managing vegetation along SR 112 this past yearrdquo
With an effective IVM program common weeds such as kochia in eastern Washington can be managed with reduced herbicide use over time
Vegetation-Free Area Approximately 60 percent of herbicides used by WSDOT are used to prevent vegetation from growing at the pavementrsquos edge WSDOT is reviewing this practice including a study of other statesrsquo use of chemicals in vegetation-free zones alongside the roadway The challenge in determining the best approach comes from needing to balance the potential herbicide impacts with hazards to motorists associated with an abundance of roadside vegetation to highway workers from mechanical control technologies and to pavements for vegetation incursions to the pavement By the end of the year WSDOT will develop and implement updated policies on vegetation-free areas
The vegetation-free zone next to the roadway
Measures Markers and Mileposts - December 31 2003 43
Measures Markers and Mileposts - December 31 2003 45
IVM Future Practices Integrated Vegetation Management Plan Schedule Because of the success of the Clallam County I-5 North (lsquo04)IVM plan WSDOT created a statewide schedule for Roadside Vegetation Management plans The timetable implements all plans by the end of 2007 WSDOT also identified new performance measures to track future roadside vegetation management trends The measurements include
bull The IVM plan development schedule
bull Adherence to sensitive buffers upon orders by the US District Court (see below)
bull Number of WSDOT application violations
bull Maintenance Accountability Process (MAP) conditions measures for nuisance weeds I-5 South (lsquo03)noxious weeds vegetation obstructions and landscape maintenance WSDOTrsquos Integrated Vegetation Management Plan implementation
is scheduled by year and by maintenance area as shown in thebull Documentation of area-specific IVM plan above map Area by area production of the plans will continue until
elements completed each year statewide coverage is achieved
Seattle Spokane
5
rsquo03 rsquo04
rsquo06
rsquo05
rsquo05
rsquo06 rsquo05
rsquo04
rsquo07
rsquo07
rsquo07
5
Tacoma Olympia 90
Whidbey Island Plan Coming The department will hold a public meeting on a Roadside Vegetation Management Plan for Whidbey Island in March 2004 WSDOT expects to develop and implement a plan that meets the concerns of citizens with varying viewpoints on herbicide use and can be achieved at reasonable cost The draft plan identifies a number of key areas test sites roadside features and treatment practices Other IVM plan details for Whidbey Island are expected to include
bull Restoration of roadsides in coordination with future construction projects on State Route 20
bull Restoration of native roadside vegetation on half of an acre a year as part of the regular maintenance program
bull No vegetation-free area adjacent to pavement within 60 feet of the waterline at Penn Cove and Keystone Spit
bull Establishment of the vegetation-free area pilot projects
US District Court January 2004 Ruling The United States District Court in Seattle entered an injunction in January 2004 prohibiting the use of certain herbicides within sixty feet of salmon streams pending EPArsquos completion of a review whether such use is consistent with protections afforded by the Endangered Species Act
WSDOTrsquos herbicide practices included in the 2003 IVM plan for Clallam County and generally followed in many other areas of Western Washington are already matched to the injunctionrsquos requirements To ensure adherence to the terms of the injunction WSDOT maintenance crews will identify affected areas on the highways mark buffer zones and receive additional training on vegetation management practices including limitations on herbicide use
WSDOT ndash Proactive in Risk Assessment As part of its vegetation management efforts in 2003 WSDOT contracted with a consultant Intertox Inc to update a 1993 WSDOT hazard assessment study This included integration of new research in herbicide usage The hazard assessments aim through review of scientific literature to inform WSDOTrsquos understanding of potential risks to humans wildlife and aquatic organisms The hazard assessment update generally found the potential risks of specific products to be negligible or low in WSDOTrsquos patterns of use The assessment suggested however that moderate potential risks might be presented by two products MCPA and Diuron WSDOT discontinued further use of MCPA in 2003 and has taken steps to reduce the use of Diuron by limiting its application only to certain areas in eastern Washington
Measures Markers and Mileposts - December 31 2003 44
44 Measures Markers and Mileposts - December 31 2003
Environmental Programs Environmental Management System (EMS) Update WSDOT is continuing to develop its Environmental Management System (EMS) to help support the departmentrsquos environmental efforts and integrate those efforts into everyday operations training programs and regular performance reports Currently several important activities described below are building WSDOTrsquos capacity to improve track and report on environmental compliance
Construction Services Program Pilot To address projects funded by the 2003 Transportation Funding Package WSDOT is piloting a construction services program modeled on a prototype used by its regional office in Yakima The program is being evaluated for statewide implementation Its goal is to ensure that environmental commitments attached to a project are clearly communicated and implemented throughout design construction and facility operation The programrsquos three major components are (1) pre-construction and pre-activity meetings between WSDOT and the contractor (2) tools to aid construction and maintenance staff in maintaining
Seven Core Elements to WSDOTrsquos Environmental Management System bull Legal and other requirements clearly outline all
environmental laws regulations and agreements that apply to operations
bull Written procedures instruct staff and contractors how to conduct work activities in compliance with requirements
bull Training ensures those that conduct certain activities know how to do the work in a compliant manner
bull Roles and duties ensure WSDOT staff and contractors know what they are to do under the EMS
bull Inspection monitoring and corrective action ensure a process is in place to check WSDOTrsquos work for compliance and correct any problems
bull Documentation allows WSDOT to evaluate the operation of the EMS and communicate results to the public and within the department
bull Performance measurement compares WSDOTrsquos performance against pre-determined targets with results reviewed by management and reported to the public
compliance on the project site including an environmental inspection checklist for use by construction inspectors and (3) environmental compliance procedures issued by WSDOT for all construction and maintenance activities
Enhanced Commitment Tracking WSDOT is working to better track formal commitments made during the project development process By the end of 2004 WSDOT will track all formal commitments from inception (usually during planning or project design phase) through construction to completion or handoff to its Maintenance and Operations Department This new system will make clear assignments of roles and duties to show who manages performs and monitors the implementation of each commitment
Examples of Environmental Commitments on WSDOT Projects Some environmental commitments are Other commitments are agreements Some commitments are made during the terms and conditions outlined in environ- made during the Endangered Species Act National Environmental Policy Act (NEPA) mental permits These may require process These commitments or ldquoconser- environmental review process to minimize WSDOT to maintain a certain water quality vation measuresrdquo are designed to protect or offset overall environmental impact of a level during construction use certain endangered species Examples include the project Commitments under NEPA may affect Best Management Practices (BMPs) and requirement for WSDOT to place woody a roadwayrsquos alignment or physical design conduct environmental monitoring debris in a river or avoid working at certain The concrete box culverts shown belowtimes to protect migratory speciesFor example straw blankets and silt were agreed upon during the NEPA process fences are required to be used to protect In addition to habitat protection WSDOT and are designed to promote floodplain a small stream along Highway 18 during uses engineered log jams root wads and connectivitymdashallowing water to pass under rainstorms until permanent erosion control other bio-engineering techniques to protect the roadway during high water rather than grasses are established stream banks near roads and bridges over it or on to adjacent property
Measures Markers and Mileposts - December 31 2003 45
Measures Markers and Mileposts - December 31 2003 47
Environmental Compliance Assurance Annual Update WSDOT self-monitors for ldquonon-compliance eventsrdquo whether or not such events are taken up as formal ldquoviolationsrdquo by regulatory agencies or officials
Compliance History The Gray Notebook for March 31 2003 reported on WSDOTrsquos initial effort to track non-compliance events Data for 2001 and 2002 was obtained by interviewing project managers in December 2002 to gather an after-the-fact best estimate of the number and types of non-compliance events Since then WSDOT has systematically tracked non-compliance events for highway construction and maintenance programs and for operations of the Washington State Ferries (WSF)
How Are We Doing In 2003 WSDOT recorded 41 non-compliance events with 13 leading Non-Compliance Events to issuance by a regulatory agency of a formal Notice of Violation 2001-2003 (NOV) 45
40 In 2003 32 of 41 non-compliance events involved water quality 35
regulations as shown in the chart at right For 2003 the ldquootherrdquo category 30
includes three events associated with underground storage tank rules and 25
one event associated with an air quality violation 20
15
The increase in recorded highway program and WSF non-compliance 10
events from 2001 to 2003 is partially explained by an increased 5
0 emphasis on identifying non-compliance events Because 2003 is the 2001 2002
Fish Habitat OtherWetlands Water Quality first year that WSDOT has systematically tracked non-compliance events apples-to-apples comparison with previous years is not possible For more information about WSDOTrsquos Environmental
Compliance Assurance Procedure please see the The baseline data for 2003 of the number and type of events taking Gray Notebook for the quarter ending March 31 2003
place will help WSDOT staff develop compliance tools for the agency page 18
Source WSDOT Environmental Services OfficeUsing Non-Compliance Data WSF began systematizing data collection on petroleum product spills three years ago The data illustrated ongoing minor problems from hydraulic systems on transfer spans at WSF terminals Last winter WSF Terminal Maintenance began a program to improve inspection of transfer spans and quickly correct any problems This new emphasis includes training for terminal attendants to identify potential leaks in the bridge operation and to report potential leaks to Terminal Maintenance
For the three years since 2001 WSF terminals have had seven four and five hydraulic spills respectively The prevention actions instituted by Terminal Maintenance means that now more WSF employees are aware of and watching for potential problems
2003
Total Resulting Actual Notices
Total
Total
Resulting Actual Notices
Resulting Actual Notices
Beginning of Maintenance and Construction ECAP (Environmental Compliance Assurance Procedure)
Hydraulics system at the Anacortes Ferry Terminal
Integrated Vegetation Management Results
Please see Highway Maintenance IVM report on page 43 of this Gray Notebook
WSDOT also tracks compliance with herbicide and Non-Compliance Eventspesticide application laws covering the products and procedures used to maintain roadside and wetland 2001 2002 2003 mitigation sites The number of product applications in Number of WSDA 8 6 4 2003 went up 17 and the pounds of active ingredient Investigationswent up by 35 from the previous year The number of findings of fault notices from the Washington State Department of Agriculture (WSDA) remained steady at
Number of WSDA Findings of Fault
5 4 2
four Two notices involved overspray leaving the road right Number of Product 2271 3399 4091 of way and two were found not to have merit and dropped Applicationsby WSDA In 2003 WSDA issued two warning letters to WSDOT regarding the alleged injury to two privately owned conifer trees in the town of Loon Lake near Colville The
Total Pounds of Active Ingredient Applied
67156 120171 124290
trees tested positive for diuron that may have come from an earlier WSDOT roadside application of herbicides for total quantity of chemicals used
Measures Markers and Mileposts - December 31 2003 46
46 Measures Markers and Mileposts - December 31 2003
Monitoring Replacement Wetlands Annual UpdateTypes of Mitigation Two WSDOT mitigation bank sites currently provide advance compensation for unavoidable wetlands losses The Moses Lake Mitigation Bank provides five acres of enhanced wetland and about two acres of restored wetland The North Fork Newaukum Mitigation Bank provides 91 acres of enhanced wetland and one acre of restored wetland Since 2002 15 new replacement wetland sites (199 acres) have been added to the overall inventory of wetlands replacement acreage
Meeting Standards in 2003 In 2003 biologists monitored a total of 63 active replacement wetlands ranging from one to eight years in age Of these sites 21 had targets (success standards) to be met in 2003 Monitoring was conducted for 87 individual standards
Of the two sites that did not meet any standards due in 2003 one is in the middle of its planned monitoring period and had poor plant survival and too many weeds The site has been re-planted and because it is close to a river biological weed control is planned The second site is at the end of its planned monitoring period but has not developed into a wetland because it is too dry WSDOT staff are considering appropriate alternatives to achieve this environmental commitment
Completed Replacement Wetlands Successful sites have achieved reasonable ecological success and no longer need monitoring Unsuccessful sites have not met requirements and are ecologically unsuccessful
Reasonable ecological success was achieved on six more sites in 2003 bringing the total of completed sites since 1988 to 53 The total of sites judged successful in this group is 49 (267 acres) The four unsuccessful sites failed due to unpredicted or changed hydrology the most important parameter of wetland success WSDOT is considering options to meet the environmental commitments for these projects
For additional detail on monitoring replacement wetlands and pictures of the different types of projects see the Gray Notebook subject index at wwwwsdotwagovaccountabilitygraybookindexhtm environment and click on ldquoWetland Mitigation and Monitoringrdquo WSDOT has been mitigating for unavoidable wetlands loss with replacement wetlands for 15 years to address the statersquos Executive Order 89-10 which mandates that the actions of state agencies result in no net loss of wetlands Advance mitigation means building replacement wetlands before unavoidable impacts take place Monitoring and reporting on the status of replacement wetlands is critical to the success of the program as seen through the eyes of both the public and the resource protection agencies with whom agreement on these projects must be reached
WSDOT Replacement Wetlands 1988-2003
WSDOT Replacement Wetlands 1988-2003 Total Acreage of Wetland Projects 116 Sites 675 Acres
Olympia Tacoma
Seattle Spokane
Actively Monitoring
Monitoring Complete
Buffer An upland area Enhancement Improvements that protects a wetland from to an existing degraded wetland
126 Acres 119
Acres
189 Acres
181 Acres
60 Acres
adverse impacts (181 Acres to increase or augment wetland increased by 90 acres since function (189 Acres increased 2002) by 100 acres since 2002)
Restoration Re-establishes a wetland area andor function where wetlands previously existed but are no
Creation The establishment longer present (60 Acres of wetland area and functions increased by 3 acres since where none existed (126 Acres 2002) increased by 4 acres since 2002)
Preservation Protecting wetlands from future development ensures that valuable wetland functions continue to provide benefits (119 Acres increased by 2 acres since 2002)
Replacement Wetlands Success in 2003 Total Number of Sites 21
Meeting All WSDOT reported onStandards
22 Acres11
Acres
8 Acres
the status of sites5 Sites with standards to be
achieved in 2003 on a site-by-site
Meeting basis in the 2003Some Annual MonitoringStandards report For detailed14 Sites monitoring results visitMeeting No wwwwsdotwagov Standards environmentwetmon
2 Sites defaulthtm
Success Rate for Replacement Wetlands Success Rates for Replacement Wetlands with Completed MonitoringMonitoring Complete 100 Includes acreage
not yet designated 95 for mitigation credit
90
85 Source for all charts WSDOT Environmental
1988-2001 1988-2002 1988-2003 Services Office 80
Includes acreage not yet designated for mitigation credit Source WSDOT Environmental Services Office
Measures Markers and Mileposts - December 31 2003 47
Measures Markers and Mileposts - December 31 2003 49
Stormwater Treatment Facilities WSDOT routinely builds stormwater treatment facilities to Department of Ecology standard as a part of highway construction Stormwater treatment facilities reduce stormwater flows that cause flooding and harm fish habitat These treatment facilities also remove sediment metals nutrients and other pollutants from highway runoff
In response to municipal stormwater permit requirements WSDOT has tracked the number of new stormwater treatment facilities built in King Pierce Snohomish and Clark counties where about 40 percent of statewide highway construction has occurred since 1996 In the past seven years 300 treatment facilities (an average of 43 per year) have been built in those counties
Out of 1140 miles of highway within the four counties an estimated one percent of state highways have new stormwater treatment facilities constructed each year These treatment facilities help to mitigate and manage the impacts of stormwater runoff from our state highways
In addition to removing pollutants and reducing flooding this pond near I-5 milepost 96 protected a nearby wetland by trapping a 140-gallon accident-related diesel spill from the adjacent freeway
Ponds that infiltrate treated runoff reduce flooding in the winter and help maintain stream flows in the summer
Monitoring Water Quality Impacts for Construction Sites Annual Update In 2003 WSDOT completed its first year of construction site water quality sampling under a new statewide monitoring policy The policy requires sampling on at least 20 percent of all projects with substantial potential for water quality impacts The chart at right summarizes sampling results that compare water quality upstream and downstream from 12 projects Ninety-five percent of the samples met water quality standards for clarity
Of the 200 samples taken nine failed to meet standards The water became muddy on five of the projects because work had to be done in the water or very near the shore The other four projects experienced heavy rainfall ranging from 3frasl4 to 3 inches which overwhelmed the mandated design capacities of approved treatment facilities In all cases monitoring results prompted immediate corrective actions to regain compliance with water quality standards
Case Study Golden Harvest Creek Culvert ReplacementThe Golden Harvest Creek culvert replacement project on SR 21 near the town of Republic in eastern Washington illustrates the challenges associated with keeping sediment out of water when replacing culverts Diverting water around work areas is very effective but the installation and removal of diversions can briefly muddy a stream While removing an old culvert that blocked fish migration some dirt fell into the creek After the new culvert was in place the creek was re-directed into the new channel stranding some fish in the temporary bypass Workers entered the water and carefully moved the fish back into the creek The state standard for clarity of water was exceeded twice during construction but returned to normal within minutes each time
State Water Clarity Standards Compliance Number of Samples for 2003
45 Out of compliance In compliance
30
15
0 Apr May Jun Jul Aug Sep Oct Nov
Water Clarity Monitoring Golden Harvest Creek August 2003
64
25
20
15
10
5
0 5th 5th 6th 7th 12th 13th 14th 15th 18th 19th 20th 25th
Upstream Downstream
State Standard
Water was briefly muddied as workers moved fish back into the stream
Water was temporarily muddied as an old culvert was removed
Source for both charts WSDOT Environmental Services Office
Measures Markers and Mileposts - December 31 2003 48
48 Measures Markers and Mileposts - December 31 2003
Erosion Control Preparedness ndash Annual Update Erosion control is an important component of WSDOTrsquos program to protect the environment In addition to education careful planning and stringent contract requirements WSDOT routinely performs construction site inspections to verify the effectiveness of erosion control measures and makes improvements as needed In the fall of 2003 moderate and high-risk projects (20 in all) were inspected to determine how well they were prepared for the wet season and whether or not erosion led to any water quality violations site damage or delays
The October 2003 storm (see the September 30 2003 Gray Notebook Special Features) for example overwhelmed the treatment measures planned for the runoff from existing pavement An inspection revealed that dirty water was entering Taylor Creek
WSDOTrsquos Environmental Compliance Assurance Procedures were initiated and crews immediately addressed the situation the discharge of dirty water stopped and the incident was promptly reported to the Department of Ecology
Fall Assessment Results This table outlines how
Erosion control measures on SR 18 in the Maple Valley area
well prepared WSDOT was during fall 2003 compared to its level of preparation in 2002
Last year WSDOT identified areas where improvements in erosion control preparedness were needed One area in particular included ensuring that erosion control plans are always on site and up to date with current project conditions (a condition of environmental permitting) Specific actions were taken at statewide meetings and training sessions that
Erosion and Sediment Control Assessment Results 2002 2003 Status
Excellent Clearing limitssensitive area boundaries identified and respected by contractor
Utility trenches excavated in manner to reduce erosion risk Remove temporary erosion and sediment control measures when not needed
100 100 81
100 stable 100 stable 100 improved
Good
Contractor trained in proper use of erosionsediment control measures Sediment trapping measures installed prior to soil disturbing activities Control offsite erosion prevented by controlling flows Protect storm drains from sediment
100 90 87 74
95 decreased 90 stable 84 decreased 82 improved
Fair
If a storm hit at time of site visit water would meet state water quality standards If a storm hit at time of site visit adjacent property would be protected Effectiveness of measures installed to trap sediment Erosion control plans are on site and up to date for all WSDOT projects
86 83 96 56
80 decreased 80 decreased 78 decreased 75 improved
Poor
Manage construction site water in manner reducing sediment deposition risk Perform maintenance on temporary erosion and sediment control measures Construction access routes stabilized to prevent tracking of mud onto streets Effectiveness of measures installed to prevent erosion Temporary stormwater conveyance channels stabilized Protect cut and fill slopes from concentrated runoff Amount of disturbed soil actually covered with erosion control measures
100 70 98 91 90 67 65
71 decreased 70 stable 69 decreased 67 decreased 64 decreased 50 decreased 45 decreased
resulted in an improvement Source WSDOT Environmental Services Office of 19 percent
In 2003 the overall assessment increased in three areas while it remained the same or had little change in seven others WSDOTrsquos preparedness in the remaining eight areas decreased substantially creating an elevated risk to increased erosion when compared to last year The decrease in the bottom five areas in the ldquoPoorrdquo category are directly attributed to one or both of the following reasons (1) the extremely dry weather this fall extended large earthwork activities into the ldquowet seasonrdquo delaying soil cover practices and (2) drought conditions reduced effectiveness of late spring and early fall seeding applications
Summary and Next Steps An analysis of the 20 projects documents that 12 had no problems preventing erosion Projects experiencing minor problems increased by 16 percent from 2002 for a total of seven The minor problems were promptly corrected without regulatory agency involvement or high repair costs One project experienced major problems that involved one Notice of Violation The plan to improve performance on issues in the ldquoPoorrdquo to ldquoFairrdquo ranges includes increased technical assistance improved contract enforcement and increased emphasis in training
Measures Markers and Mileposts - December 31 2003 49
Measures Markers and Mileposts - December 31 2003 51
Incident Response Quarterly Update Program Totals WSDOT Incident Response Program provides roving service to clear roads and help drivers on Washingtonrsquos heavily traveled freeways Along with the WSDOT roving units non-WSDOT units provide contracted roving services These units include the Washington State Patrol (WSP) Cadets Registered Tow Truck Operators (RTTO) and a Motorist Assist Van (MAV)
Incident Reasons and Clearance Times Washington Statersquos target is to clear all incidents within 90 minutes During the fourth quarter 71 percent of major incidents were due to motor vehicle collisions Major incidents are however only two percent of all incidents on state roadways The most frequently occurring incidents which are likely to cause slowdowns during daily commutes are disabledabandoned vehicles or debris blocking traffic (82 percent of all incidents) During the fourth quarter 85 percent of incidents were cleared within 30 minutes and 47 percent were cleared in less than 10 minutes
Detection and Response by Roving Notification and Call-out The roving Incident Response Program is an effective means to keep traffic moving on freeways because the responders quickly detect incidents on the roadways During the fourth quarter 70 percent
Abandoned Vehicles (6)
Hazardous Materials and Fatal Collisions were less than 1 percent each
Incidents Lasting90+ Minutes Fatality
Disabled Vehicles Collisions (15)(9)Haz Mat Abandoned
(5) Vehicles Fire (2) (2) Debris
(4)
Incidents Lasting LessThan 15 Minutes
Non-Injury Other Collisions (4) (4)
Debris (10)
Abandoned Vehicles (27)
Disabled Vehicles 55
Injury Collisions Fatal Collisions Fire and Hazardous Materials were less than 1 percent each
Incidents Lasting 15 to 90Minutes Injury Collisions Fire(7) (1)Other (2)
Non-Injury (20)
Debris (5)
Disabled Vehicles 58
of all incidents were detected by roving units Roving units were notified of the remaining 30 percent of incidents Call-out units respond to severe incidents that occur Other
(2)
Non-Injury (32)
Injury Collisions (30)
outside roving zones or during non-roving hours There were 129 call-out responses during the fourth quarter which amounted to one percent of all the incidents responded by the IR program
Blocking versus Non-Blocking Locations The location and duration of an incident can impact traffic greatly Overall 67 percent of all incidents were on the shoulders and medians of roadways and did not block travel lanes Seventy percent of the incidents that were cleared in less than 30 minutes occurred within shouldersmedians and did not block travel lanes Of the major incidents lasting 90 minutes or more 80 percent were blocking travel lanes
Source for all charts WSDOT Traffic Office
Total Number of Responses by Month July 2002 to December 2003
5000
4500
4000
3500
3000
2500
2000
1500
1000
500
0
WSDOT IRT 2003 Contracted IRT Units 2003
2002
Jul Aug Sep Oct Nov Dec Jan Feb Mar Apr May Jun Jul
Average Clearance Time (in Minutes) January 2003 to December 2003
35
30
25
20
15
10
5
0
For All Incidents
For Incidents Lasting 15-90 Minutes
Jan Feb Mar Apr May Jun Jul Aug Sep Oct Nov Dec
Average Clearance Time for Incidents Lasting Over 90 Minutes 3-Year Comparison July 2001 to December 2003
300
250
200
150
100
50
0
July 2001 to June 2002
July 2002July to to June 2003December 2003
Jul Aug Sep Oct Nov Dec Jan Feb Mar Apr May Jun
Number of Incidents by Location and Clearance Time October 2003 to December 2003
Travel Lanes
ShoulderMedian
6000
5000
4000
3000
2000
1000
0 Less 10- 20- 30- 40- 50- 60- Over than lt20 lt30 lt40 lt50 lt60 lt90 90 10 min
Measures Markers and Mileposts - December 31 2003 50
50 Measures Markers and Mileposts - December 31 2003
Over 90 Minute Incidents There were 243 incidents lasting 90 minutes or longer during the fourth quarter of 2003 Incidents are located by dots on the map All incident records collected into the WSDOT Incident Tracking System (WITS) are being mapped for exact locations by state route and milepost for further analysis
Examples of Incidents Over 90 Minutes The following five incidents had the longest clearance times for the period between October 1 2003 and December 31 2003
bull October 1 ndash A fuel tanker truck overturned on I-5 in King County A single northbound lane was intermittently closed as multiple tow trucks responded to the scene to try and right the truck After multiple attempts the fuel was pumped from the truck so that it could be righted WSDOT Incident Response set up traffic control until recovery was complete 104 hours was required for Incident Response to clear the scene
bull October 8 ndash A semi truck traveling from westbound I-90 to northbound I-5 in Seattle drove off the elevated ramp falling approximately 30 feet and landing on the roadway below The tractor-trailer and cargo were demolished on impact necessitating a lengthy and technical clean up WSDOT Incident Response responded to the scene for traffic control and clean up 82 hours were required to clear the scene
bull October 12 ndash A loaded fuel tanker lost control on SR 9 just north of Wickersham in Whatcom County causing the rear trailer to roll on its side leaking fuel onto the shoulder and into the drainage system A detour route was set-up and a private contractor was called in to clean up the fuel spill WSDOT Incident Response assisted with traffic control and helped to clear debris from the roadway 164 hours were required to clear the scene
bull November 22 ndash A collision on US 97 near Goldendale involving a semi truck resulted in multiple lane closures as the scene was cleared WSDOT Incident Response set up traffic control and assisted other agencies Responders were able to keep traffic flowing throughout most of the incident 85 hours were required to clear the scene
bull December 9 ndash On SR 9 near the city of Sumas in Whatcom County a semi truck lost control and drove off of the roadway overturned spilling its load of lumber A detour was set-up for both northbound and southbound traffic WSDOT Incident Response performed traffic control and cleared debris 80 hours were required to clear the scene
Over 90 Minute Incidents for Quarter Four 2003
Seattle
Tacoma Olympia
Spokane
Vancouver
Everett
Service Actions The Incident Response roving program provides various services to motorists Traffic control is the most common service provided On an average day during the fourth quarter incident response personnel (all units) provided fuel to 14 vehicles cleared 12 pieces of debris changed 12 flat tires pushed 8 vehicles and performed 6 minor car repairs
Response Types October to December 2003
Total Incident Responses = 12341 bull 1717 Collisions (14) bull 10624 Non-Collisions (86)
Oct Nov Dec Fatality Collisions 6 11 10 Injury Collisions 147 147 134 Non-injury Collisions 377 417 468 Disabled Vehicles 2435 2120 2320 Abandoned Vehicles 787 705 784 Debris 420 330 290 Fire 24 17 27 Hazardous Materials 15 5 4 Other 132 139 149 Some non-collisions fall into more than one of the above categories
Service Actions Taken for Non-Collision Responses October to December 2003
Oct Nov Dec Traffic Control 425 370 429 Provided Fuel 324 286 269 Changed Flat Tire 323 255 220 Minor Repair 281 203 260 Pushed Vehicle 145 178 190 Towed Vehicle 160 115 144 Cleared Debris 90 84 84
Source WSDOT Traffic Office
Measures Markers and Mileposts - December 31 2003 51
Measures Markers and Mileposts - December 31 2003 53
Travel Information Quarterly Update
Since the launch of 5-1-1 Travel Information Service in July 2003 calls have increased by 74 percent (from 30478 to 52903) during the first six
month period
5-1-1 is a three-digit travel information number designated by the Federal Communications Commission (FCC) to provide around the clock traffic and road condition information
The 5-1-1 system lets the commuter check real-time traffic conditions using a cell phone and voice commands Although some users have experienced difficulty at times with the voice recognition aspect of this system it will continue to be enhanced as technology improves WSDOT is currently developing a plan to address these issues and make the 511 system more user-friendly
1-800-695-ROAD In December 2003 the total number of calls to 1-800-695-ROAD slightly decreased from the level in December 2002 However the total number of calls to Travel Information combining 1-800-695-ROAD and 5-1-1 calls together increased It is likely that 5-1-1 is replacing some of the calls to 1-800-695-ROAD
During the fourth quarter of 2003 the total number of calls to 1-800-695-ROAD and 5-1-1 increased by 786 percent with 481706 calls in 2003 versus 269675 calls in 2002
Travel Information Service Calls to 1-800 Road and 5-1-1 Calendar Year 2002-2003
250000
200000
150000
100000
50000
0 Jan Feb Mar Apr May Jun July Aug Sep Oct Nov Dec
2003 1-800-ROAD 2002 1-800-ROAD
Current Quarter 2003 5-1-1
On the Web Page views to Traveler information continue to increase They are up an average of 93 over the same quarter last year
Traveler Website Daily Usage Daily Average Page Views per Month (in millions)
Jan Feb Mar Apr May Jun Jul Aug Sep Oct Nov Dec 00
05
10
15
20
25
30
Current Quarter 2003 2002
Daily Average Page Views per Month Quarter 2002 and 2003 (in millions)
2002 2003 increase
October 08 17 113 November 13 30 131 December 21 29 38
In comparison to last yearrsquos numbers October saw an increase of 113 percent and November saw a 131 percent increase in daily page views
Highest One Day Total On November 19 2003 WSDOTrsquos web site received 68 million page views
bull 97 went to Traffic and Travel Information
bull 87 of those views originated from the WSDOT site ndash the remaining were from WSDOT through news and other sites such as KIRO KING and KOMO who used WSDOTrsquos cameras and flowmaps
WSDOT is also responding to the increasing number of requests for traffic and travel information to display on mobile devices Developments will be reported as they occur
Source WSDOT Communications Office
Source WSDOT Traffic Office
Measures Markers and Mileposts - December 31 2003 52
52 Measures Markers and Mileposts - December 31 2003
Options to Drive Alone Commuting Quarterly Update Park and Ride Lot Occupancy at WSDOT-Owned Sites in King County During the third quarter of calendar year 2003 occupancy of the 8500 parking spaces in the 32 WSDOT lots in King County averaged 73 percent
A three percent decrease in occupancy from the second quarter was due to summer seasonal declines in transit use About 50 percent of WSDOTrsquos park and ride lots in King County surpassed the target of 70 percent occupancy during the quarter Parked cars regularly exceeded maximum capacity in five lots
Highlights bull The new Issaquah Highlands Interim Park and Ride lot opened at the end of September This Sound Transit lot offers 103 parking spaces for commuters King County Metro is developing a permanent Park and Ride structure at Highland Dr NE and NE High St that is scheduled for completion in late 2005
bull The new 5-story Eastgate Park and Ride garage is scheduled for completion in June 2005
WSDOT-Owned King County Park and Ride Lots Percent of Capacity Used January 2001 through September 2003
100
90
80
70
60
50
Actual
Occupancy should exceed this target
Qtr 1 Qtr 2 Qtr 3 Qtr 4 Qtr 1 Qtr 2 Qtr 3 Qtr 4 Qtr 1 Qtr 2 Qtr 3 2001 2002 2003
Data availability has a lag of three months to allow the transit systems to collect and analyze the data Data for the fourth quarter of 2003 will be available in the next Gray Notebook
Source WSDOT Analysis of King County Metro data
bull Transit agencies throughout Puget Sound report persistent overcrowding at Park and Ride lots along major corridors due to lack of capacity and growing demand Efforts to increase transit and ridesharing are hampered by insufficient capacity at many commuter Park and Ride facilities
Vanpools in the Puget Sound Region Beginning with this issue of the Gray Notebook vanpool information and analysis will reflect a lag of three months in reporting data Reporting on the previous quarter will allow for more complete verification of the data During the third quarter the number of vanpools in operation in the region peaked in July (1376) followed by small decreases in August (1358) and September (1352) Despite the recent decrease the total number of vehicles on the road is up 35 percent since September 2002 when there were 1306 vanpools
Quarterly Regional Vanpool Highlights There are now 62 vanpool VanShare groups in operation in the Puget Sound region The VanShare program provides connections for employees between trains ferries park and ride lots and their work sites The VanShare program has proven to be very successful with Sounder trains on the Tacoma line (34 VanShare groups) King County Metro staff have begun marketing the VanShare program to employees riding between Everett and Seattle
bull Enhancements to regional Internet ridematch service in Puget Sound will provide a direct benefit to vanpools The improved service has the ability to ndash Provide up to 30 names on a match list request ndash Allow easier route planning with map viewing of Park amp Ride lots
Puget Sound Vanpool and VanShare Trends
1380
1360
1340
1320
1300
1280
1260
1240
Vanpools and VanShare
Vanpools Only
Jun Sep Dec Mar Jun Sep Dec Mar Jun Sep 2001 2002 2003
Data availability has a lag of three months to allow the transit systems to collect and analyze the data Data for the fourth quarter of 2003 will be available in the next Gray Notebook Source WSDOT Transportation Demand Management Office
ndash Increase user ability to select newest names on the match list ndash an effective tool for vanpool groups looking for riders ndash Provide promotional email message to users about their companyrsquos rideshare incentives along with an Employee Transportation Coordinator (ETC) contact phone number
Coming Next GNB Edition Commute Trip Reduction Task Force 2003 Report to the Washington State Legislature
Measures Markers and Mileposts - December 31 2003 53
Measures Markers and Mileposts - December 31 2003 55
Customer Feedback Washington State Ferries (WSF) collects customer complaints compliments comments and suggestions This information is recorded in the Automated Operating Support System (AOSS) database for measurement and action based on database cross tabulation and analysis
The charts show trends in the data for the last four fiscal years and the first two quarters of fiscal year 2004 (July 1 ndash December 31 2003)
Customer complaints were up 12 percent from the preceding quarter Complaints have increased for three consecutive quarters
WSF received 53 food service related complaints during the quarter This is only the second quarter in two and one-half years that food service has been in the top four comment types A total of 46 food complaints were received on the Edmonds-Kingston route during a two-week period in November when the MV Quinault was in service on this route The MV Quinault did not have galley service and is a much smaller vessel than the Jumbo Class ferry she was replacing
Washington State Ferries Quarterly Update
Vanpools exiting ferry on Bainbridge Island
N
20
305
16
160
3
525
104
104
104
20
20
525
3
101
1
Tacoma
Everett
Mt Vernon
Victoria
Bellingham
Port Angeles
Shelton
Seattle
5
5
5
5
90
405
Sidney
Shaw
Orcas
Keystone
Port Townsend
Clinton
Mukilteo
Kingston
FauntleroySouthworth
Vashon
Tahlequah
Point Defiance
Bainbridge Island
Edmonds
Anacortes
Bremerton
Friday Harbor
Lopez
2
101
AutoPassenger
Passenger-Only
Washington State Ferries Route Map
Total Customer Complaints Most Common Customer Comments Complaints per 100000 Customers Top Four Comment Types per 100000 Customers
15 12
10
10 08
06
5 04
02
0 0
Food Service
Loading Unloading
Compliments
On time performance
FY FY FY FY Qtr 1 Qtr 2 FY FY FY FY Qtr 1 Qtr 2 2000 2001 2002 2003 2004 2000 2001 2002 2003 2004
Does not include compliments or suggestions
Source for all charts WSDOT Ferries
Measures Markers and Mileposts - December 31 2003 54
54 Measures Markers and Mileposts - December 31 2003
On-Time Performance WSF has been collecting on-time performance data since June 2001 The table below compares WSF on-time performance across the system for the second quarters of fiscal year 2003 and 2004
Delays in the San Juan Islands are due primarily to construction activity at Shaw Island (see ldquoTrip Reliabilityrdquo comments below)
Improved on-time performance was experienced on WSFrsquos busiest route the FauntleroyndashVashonndashSouthworth route Approximately one quarter of all trips by WSF are made on this triangular route structure Fall schedule changes were developed with the Ferry Advisory Committees at Vashon and Southworth resulting in a schedule that increased on-time performance and allowed much needed late night maintenance on the three vessels serving this route
On-Time Trip Delivery Second Quarter Fiscal Year 2003 Second Quarter Fiscal Year 2004
All Trips All Trips A trip is considered toPercent of Average Percent of Average be on time if it departsTrips Within Delay From Trips Within Delay From
within ten minutes of theNumber 10 minutes Scheduled Number 10 Minutes Scheduled of Trips of Schedule Sailing Time of Trips of Schedule Sailing Time published scheduled
San Juan Domestic 5591 85 46 minutes sailing time Missed trips International Route
6443 94 27 minutes
EdmondsKingston 4564 94 31 minutes 4499 93 35 minutes1564 95 28 minutes
Passenger-Only SeattleVashon 1041 94 24 minutes 1003 98 22 minutes9534 91 43 minutes
KeystonePort Townsend 1852 96 24 minutes 1826 93 32 minutes6178 98 20 minutes
Point DefianceTahlequah 2708 93 40 minutes 2782 95 31 minutes4031 96 28 minutes
SeattleBremerton 2563 98 27 minutes 2451 97 31 minutes
152 85 48 minutes are not reported using this measure They
Passenger-Only SeattleBremerton
176 84 37 minutes
Service discontinued are included in the Trip Reliability measure
FauntleroyVashonSouthworth 9602 93 32 minutes
MukilteoClinton 6335 99 20 minutes
SeattleBainbridge Island 3901 98 26 minutes
Total 40654 94 30 minutes 38142 94 31 minutes
Trip Reliability WSF scheduled a total of 41678 trips during the 2nd quarter of fiscal year 2004 Of these trips 486 were missed Sixty-one percent (296) of the missed trips resulted from closures of the Shaw Island terminal during work on a $65 million preservation contract (see details on below) The chart below shows a system-wide average reliability index Assuming that a commuter worked 200 days per year and made 400 trips on WSF the statistical likelihood is that 47 ferry trips would be cancelled This rating represents a 178 decline in the reliability rating from the preceding quarter and a 140 decline in performance over the same period last year
Most Common Trip Cancellation CausesTrip Reliability Index Second Quarter Fiscal Year 2004Trip Reliability Index
rips per 400 SailingsMissed TMissed Trips per 400 Sailings
50
45
40
35
30
25
20 Other (7)15
Terminals (63)
Electrical (50)
Related Propulsion and Steering (43) Other (7)
Vessel
(19)
TidesWeather 10 (11) 5 WSF is undertaking a $65 million preservation contract at the Shaw Island
terminal this biennium Extensive pile driving and ldquoover waterrdquo work was accomplished this quarter to optimize environmental construction windows and seasonal traffic lulls WSF worked closely with the community on Shaw Island and throughout the San Juans to craft mitigation strategies
Cancelled Trips (Average Annual aimed at minimizing disruptions Trip Reliability Index Number = X 400
0
Total Scheduled Number of Because Shaw is a single slip facility closures were necessary duringTrips Commute Trips) regular service hours There was no service to Shaw Island during midday
from September 22 through November 7 One weekend closure was necessary September 27 and 28 Finally WSF completely shut down service from November 8 to November 11 All closures were coordinated
Source for all charts WSDOT Ferries with the community
Qtr 2Qtr 1 2004
FY FY FY FY FY 1999 2000 2001 2002 2003
Measures Markers and Mileposts - December 31 2003 55
Measures Markers and Mileposts - December 31 2003 57
WSF Construction Program ExpendituresCapital Expenditure Performance 2003-2005 Biennium 2nd Quarter Cumulative Dollars in Millions
WSDOT makes capital investments in the Ferry System Authorized vs Actual
through the Washington State Ferries Construction Program The program preserves existing and builds new ferry terminals and vessels supporting the Ferry System the capability to deliver responsible and reliable services WSF planned to spend $595 million over the period July-December 2003 Actual expenditures were $326 million bull Terminal Construction activities are under-spending
by $201 million The Port Townsend Preservation and Improvement projects are $63 million under the plan because project scopes have been revised and work deferred to later biennia Spending for property acquisition and design of the Edmonds Multimodal Terminal is $40 million behind due to a cautious approach to environmental issues and to negotiations with tribes System-wide projects are behind in spending by $25 million particularly in system planning activities and technical support to construction The Eagle Harbor Preservation project is $17 million behind in spending The Anacortes Multimodal Terminal project is $14 million behind in spending Both projects are experiencing slow starts The Shaw Terminal Preservation project is under-spending through December by $15 million and is expected to be completed under budget The Mukilteo Multimodal Terminal is underutilizing new law funds by $10 million This reflects WSFrsquos use of current law federal grants first before expending new law funds and a time lag between
Life Cycle Preservation Performance WSF terminals and vessels consist of several thousand components divided into Category 1 and Category 2 systems and structures Category 1 systems and structures are vital to the protection of people the environment and infrastructure All other terminal and vessel components are designated Category 2 Each component should be refurbished or replaced at the end of its life cycle to assure that WSF can provide responsible and reliable service
WSF has a work plan based on legislative funding to address the backlog of systems and structures that are past due as well as those constituting on-going deterioration of terminal and vessel components This biennium WSF plans to replace or refurbish 133 Category 1 systems and structures and 54 Category 2 components Twenty-three Category 1 systems and structures and two Category 2 items were completed through the second quarter
WSF uses life cycle ratings to measure the impact of its preservation activities The life cycle rating for Category 1 terminal and vessel components is projected to increase from 77 percent at the beginning of the biennium to 81 percent at the end of the biennium The life cycle rating for Category 2 components is projected to decline from 58 percent to 54 percent
Source for all charts WSDOT Ferries
$ 200
$ 150
$ 100
$ 50
$0
Authorized
Actual
Qtr 1 Qtr 2 Qtr 3 Qtr 4 Qtr 5 Qtr 6 Qtr 7 Qtr 8
consultant work and billings The Kingston Sewer Outfall project was paid for in the prior biennium freeing $08 million budgeted in the current biennium for other projects
bull Vessel Construction activities are under-spending by $62 million Variances include The MV Spokane is $55 million behind planned expenditures due to slower than expected billings for equipment procurement The MV Klahowya is $23 million behind because work is deferred to later in the biennium The MV Cathlamet is $17 million over plan because of unanticipated carry forward costs from the prior biennium
bull Emergency Repair activities are under-spending the plan by $06 million
Category 1 Terminal amp Vessel Systems amp Structures Preserved Cumulative Systems Preserved Planned vs Actual 2003-2005 Biennium Quarter 2 Ending December 31 2003
150
100
50
0 Qtr 1 Qtr 2 Qtr 3 Qtr 4 Qtr 5 Qtr 6 Qtr 7 Qtr 8
Planned
Actual
Category 2 Terminal amp Vessel Systems amp Structures Preserved Cumulative Systems Preserved Planned vs Actual 2003-2005 Biennium Quarter 2 Ending December 31 2003
60
50
40
30
20
10
0
Actual
Planned
Qtr 1 Qtr 2 Qtr 3 Qtr 4 Qtr 5 Qtr 6 Qtr 7 Qtr 8
Measures Markers and Mileposts - December 31 2003 56
56 Measures Markers and Mileposts - December 31 2003
Ridership and Revenues The Legislaturersquos Joint Task Force on Ferries (JTFF) comprised of legislators citizens ferry management and ferry workers was formed in 2000 The Task Force reviewed the workings of the WSF system and made recommendations including tariff increases designed to raise the farebox recovery rate to 80 percent of operating costs over six years The Transportation Commission instituted this recommendation and approved tariff increases of 20 percent in June 2001 and 125 percent in May 2002
In the fall of 2003 WSF management developed a new strategic plan aimed at balancing revenue generation necessary to capitalize the aging fleet The new plan reduced the size of the tariff increases for fiscal years 2003-2004 In the spring of 2003 the Transportation Commission adopted fare increases of five percent in May 2003 and an additional five percent in May 2004
As a result of the lower tariff increases ridership is not projected to fall as rapidly as anticipated in the original plan Repeating the pattern from fiscal year 2003 through the second quarter of fiscal year 2004 WSF has experienced slightly higher than projected ridership and revenues
Fiscal year to date ridership has exceeded the plan by four percent or 488000 riders Farebox revenues exceeded the plan by three percent or $2 million (Plan is based on June 2003 forecast)
Ferries Ridership by Month in Millions
3
2
1
0
FY 2004 Actuals
FY 2003 Actuals
FY 2004 Planned
Jul Aug Sept Oct Nov Dec Jan Feb Mar Apr May Jun
Ferries Farebox Revenues by Month Dollars in Millions
$15
$10
$5
$0
FY 2004 Planned
FY 2004 Actuals
FY 2003 Actuals
Jul Aug Sept Oct Nov Dec Jan Feb Mar Apr May Jun
Source for all charts WSDOT Ferries
Farebox Recovery Rate WSFWSF Annual Farebox Recovery RatesAnnual Farebox Recovery RatesFarebox recovery is the percent of annual operating and
maintenance costs recovered through tariffs and other non-tax 100revenues In line with WSFrsquos strategic plan farebox recovery
rates for fiscal year (FY) 2003 were up 54 percent from FY 2002 This is largely due to the May 2002 tariff increase 80
combined with cost saving initiatives A complex blend of cost increases also affected farebox recovery rates For example 60 total operating maintenance and support costs increased $44 million fuel costs increased $45 million insurance increased 40 $13 million and self insurance premiums and tort claims were up $16 million 20 Top performing individual routes in FY 2003 were Edmonds ndash Kingston (121 percent) Bainbridge ndash Seattle (110 percent) 0 and Mukilteo ndash Clinton (95 percent) On average auto routes 1998 recovered 76 percent of operating costs through the farebox while passenger only routes recovered 27 percent WSF also Source WSDOT Ferries
views each routersquos farebox recovery performance over several years as the trend is more important than a snapshot Extraordinary maintenance costs service interruptions or even route closures for terminal construction and many other isolated activities can dramatically effect farebox recovery during a one year period
1999 2000 2001 2002 2003
Measures Markers and Mileposts - December 31 2003 57
Measures Markers and Mileposts - December 31 2003 59
0
10000
20000
State-Supported Amtrak Cascades Service Quarterly Update
Ridership Ridership on state-supported Amtrak Cascades trains was 90664 in the fourth quarter of 2003 This was nearly identical to the fourth quarter of 2002 Trains that showed slight ridership increases during the quarter include the morning Seattle-Portland train both midday trains between these cities and the two Seattle-Bellingham trains The Seattle-Vancouver BC trains experienced the largest ridership decreases during the final quarter of 2003 contributing to a decline of over 8000 riders for the entire year on this route Factors that led to this decline include an increase in the number of cruise ship passengers departing from Seattle rather than Vancouver BC the overall effect of tourism and a lower exchange rate for the US dollar in Canada
For the entire year ridership was 385585 on state-supported trains also a slight increase over 2002 For all trains in the Amtrak Cascades system including those financially supported by the state of Oregon and Amtrak ridership was 589743 This represents the ninth consecutive year of ridership increases
Customer Satisfaction Amtrakrsquos Customer Satisfaction Index (CSI) is based on surveys of riders using the service The scores represent three-month rolling averages The CSI goal for Amtrak Cascades is 91 (out of 100) or better In the most recent survey period the overall score for Amtrak Cascades was 90 This score continues to be one of the highest in Amtrakrsquos national system and is nine points higher than the national average for routes of similar distance Survey responses showed high customer satisfaction with access to trip information prior to boarding the train the smooth and comfortable ride and the friendliness and helpfulness of train conductors Survey questions that produced lower scores include the quality and variety of food available on the trains and on-time performance
On-Time Performance On-time performance for state-supported Amtrak Cascades trains averaged 672 percent for the last three months of 2003 This was nearly eight points below the performance for the same period in 2002 and well below the goal of 80 percent set by WSDOT and Amtrak The primary cause of delays during the fourth quarter of 2003 was rail freight traffic congestion throughout the corridor and speed restrictions imposed by the railroad where rail line maintenance was taking place For the entire year on-time performance for Amtrak Cascades trains averaged 719 percent up slightly from 2002
Photo by Jeffrey T Schultz
State-Supported Amtrak Cascades Monthly Ridership Number of Passengers
50000
40000
30000
20000
10000
0
2003
2002
Jan Feb Mar Apr May Jun Jul Aug Sep Oct Nov Dec
Amtrak Cascades Annual Ridership 1994-2003
700000
600000
500000
400000
300000
200000
100000
0
Source for all charts Amtrak and WSDOT Rail Office
WashingtonAmtrak Trains
OregonAmtrak Trains
1994 1995 1996 1997 1998 1999 2000 2001 2002 2003
2003 data
50000
40000
30000
Measures Markers and Mileposts - December 31 2003 58
58 Measures Markers and Mileposts - December 31 2003
State-Supported Amtrak Cascades On-Time Performance 2003 vs 2002 Percent On-Time 2002 Average 708 2003 Average 719
Farebox Recovery The farebox recovery per train measures the percentage of total annual operating costs generated through ticket fares The average farebox recovery rate for the eight Amtrak Cascades trains financially supported by WSDOT was 399 percent in federal fiscal year (FFY) 2003 which was three points lower than in FFY 2002 This rate decline was driven by slightly lower revenues in FFY 2003 (-15 percent) when compared to the preceding year and a six percent increase in total operating expenses Costs that grew in FFY 2003 included diesel fuel and equipment insurance WSDOT and Amtrak hope that economic recovery in the Pacific Northwest will support higher revenue yields and improved farebox performance for Amtrak Cascades in 2004
King Street Station Update The renovation of King Street Station in downtown Seattle continued in the last quarter of 2003 Projects included final installation work on the temporary restrooms on the east side of the building construction work on replacement restrooms and removal of some interior walls on the first floor of the facility The elimination of these walls has exposed portions of the original interior walls and ceilings much of which has not been seen by visitors to the station in over 40 years The newly exposed sections inside the station will eventually become part of an enlarged passenger waiting area by Summer 2004
Washington Grain Train Update The Washington Grain Train carried 301 carloads of grain in the last quarter of 2003 This was 77 percent higher that in the final quarter of 2002 Quarterly growth was driven by slight increases in grain car usage by cooperatives near Moses Lake and Walla Walla and by the new grain train operating between Marshall and Pullman In 2003 the Washington Grain Train carried 1058 carloads a 21 percent increase over the total of 874 for 2002 The 2003 traffic increase was largely attributable to the third Washington Grain Train that began service in April 2003
The Washington Grain Train is a financially self-sustaining transportation program that supports the statersquos agricultural community while helping short line railroads maintain a sufficient customer base for long-term financial viability The 94-car fleet is jointly owned by WSDOT (76 cars) and the Port of Walla Walla (18 cars) The ports of Walla Walla Moses Lake and Whitman County share fleet management responsibilities
100
75
50
25
0
Jan Feb
Goal 80
2002
2003
Mar Apr May Jun Jul Aug Sep Oct Nov Dec
The on-time performance goal for Amtrak Cascades is 80 or better A train is considered on-time if it arrives at its final destination within 10 minutes or less of the scheduled arrival time
State Supported Amtrak Cascades Farebox Recovery Per Train
100
80
60
40
20
0
FFY 2002
FFY 2001
FFY 2003
Train 501 506 507 508 510 513 516 517 Number SEA PORT SEA PORT SEA BELL SEA VAN
to to to to to to to to PORT SEA PORT SEA VAN SEA BELL SEA
Source for above charts Amtrak and WSDOT Rail Office
Washington Grain Train Carloads Carloads Per Month 2002 vs 2003
2003 1058 carloads 140
120
100
80
60
40
20
0 Jan Feb Mar Apr May Jun Jul Aug Sep Oct Nov Dec
2002 874 carloads for 12 months
for 12 months
Source WSDOT Rail Office
Measures Markers and Mileposts - December 31 2003 59
Measures Markers and Mileposts - December 31 2003 61
Special Features Organic Recycling Earns Award for WSDOT The Washington Organic Recycling Council (WORC) presented WSDOT with an award December 11th for ldquofulfilling the vision of innovative application and specification of compost in Washington State roadside developmentrdquo Everyone benefits when organic materials are recycled into products of value These products improve the quality of landscape materials They have a positive impact in our environment by improving soil and plant health conserving water reducing erosion and reducing the use of fertilizers and pesticides They also replace other sources of wood for paper and fuel production
The award recognized in particular the work of the Roadside and Site Development Unit
WORC credits WSDOT with the use of one-third of the compost produced in the state For more information on good composting practices visit wwwcompostwashingtonorg
WSDOT Receives 2003 Federal Performance Letter ldquoReport Cardrdquo from FHWA Each year the Washington Division of the Federal Highway Administration (FHWA) audits WSDOTrsquos compliance with federal rules and regulations In summarizing this yearrsquos overall results the 2003 Performance Letter signed by FHWA Division Administrator Daniel M Mathis stated ldquoBased on the inspections reviews program evaluations and audits conducted in FY 2003 it is my finding that WSDOT has complied with federal laws and regulations in expending federal-aid highway funds allocated to the State of Washingtonrdquo
The performance letter evaluates WSDOTrsquos performance in 21 project and program areas such as bridge inspection standards financial billing environmental commitments and program efficiencies The letter called out a positive example of WSDOTrsquos work ldquoconstruction costs reported in the Gray Notebook are accurate and track closely with the data we have compiledrdquo In addition FHWA noted some areas for improvement such as ensuring all bridge inspections are completed within the 24 month frequency requirement using the pavement smoothness standard more consistently and establishing a tracking database to assure that environmental commitments are not affected by project changes
Mathis concluded the letter by commending WSDOT ldquofor continuing to strengthen your performance management initiatives such as the Gray Notebook your continued efforts in enhancing these tools provides further evidence that WSDOT is focused on being accountable for state and federal transportation fundingrdquo The 2003 Performance Letter can be found on-line at wwwwsdotwagovaccountabilityFHWA_FY2003_performancereportpdf
Global Positioning at WSDOT Surveyors have been using Global Positioning Systems (GPS) for years Most people are acquainted with non-survey level GPS technology as a navigational aid in their vehicles for wayfinding on a hike and even for keeping tabs on a child or family pet
WSDOT is using GPS to inventory the locations of roadway features such as signs guardrails pavement conditions trees utility devices drainage systems bridges traffic devices light poles etc It can accurately record the location of maintenance procedures such as mowing spraying or striping GPS is also being used for wetland delineation
In future editions of the Gray Notebook WSDOT will be presenting more detailed information on how GPS is being utilized
Measures Markers and Mileposts - December 31 2003 60
60 Measures Markers and Mileposts - December 31 2003
Highlights of Program Activities Quarter Ending December 31 2003
Project Starts Completions Updates bull WSDOT began on Dec 17 charging its contractor penalties of about $3000 per weekday for every day that opening of the State Route (SR) 290 Trent Avenue Bridge in Spokane was delayed Working days were re-negotiated and added to the projectrsquos contracted schedule in May 2003 when some unanticipated construction conditions were discovered At that time WSDOT approved a new schedule submitted by the contractor Ross Bros amp Co of Salem Oregon for a mid-December completion In late November it became apparent that Ross Bros was not going to be able to meet that schedule Penalties will be withheld from the final payment of the $89 million contract
bull The SR 519 (South Royal Brougham Way) project near the Seattle waterfront Safeco Field and Seahawk Stadium cleared a major hurdle when the old ramp from Fourth Avenue South to eastbound Interstate 90 was demolished The demolition contractors RW Rhine finished the task in 10 days This allowed WSDOT crews to re-open the vital I-5 and I-90 exits to Fourth Avenue South along with several major streets and intersections in the area The new structure created by this project separates vehicle pedestrian and rail traffic and provides a greater margin of safety for all
bull A series of late October storms dumped record setting rain severely damaging SR 20 in several locations causing the earliest closure of the North Cascades Highway ever Some of the worst damage occurred at Pyramid Creek (MP 126) and Ketchum Creek (MP 124) where large sections of roadway disappeared guardrail was left hanging and torrential rain rocks and dirt rendered large culverts useless WSDOTrsquos contractor Pacific Road and Bridge made progress stabilizing and rebuilding the roadway portions damaged by water and a primitive but passable road is now in place Crews will return next spring to lay down the final layer of asphalt However on November 9 a huge rockslide thundered down the mountainside just east of Newhalem slamming into Highway 20 taking out portions of roadway and cutting off access to the town of Diablo in Whatcom County URS Corporation the contractor monitoring and surveying the hillside has placed monitoring equipment on the unstable slope The instruments will indicate if the hillside is moving where it is moving and by how much This information is critical to keeping crews safe as they move in and out of the area
bull Crews installed several large steel girders across I-5 in Lynnwood in late November in association with the construction of Sound Transitrsquos Lynnwood Park amp Ride Direct Access Project The steel girders formed the skeleton of a new ramp over I-5 south of 44th Ave W which will provide direct access to and from the I-5 high-occupancy vehicle lanes for buses carpools and vanpools The project is currently on time and on budget with completion scheduled for fall 2005
bull SR 11 better known as Chuckanut Drive near Bellingham was closed after a large rockslide blocked the highway on Oct 29 Up to 60 tons of rock and debris came loose from the hillside above the roadway and crashed onto the highway blocking both lanes of traffic just south of Larrabee Park and north of Oyster Creek Crews worked seven days a week to stabilize the hillside to reopen the road to traffic on Nov 14
bull Crews on the SR 162 Voights Creek Bridge Replacement project near Orting are using some of the latest technology to protect the environment Because of the bridgersquos close proximity to a fish hatchery workers are using an oscillator to excavate the bridge shafts The oscillator twists as it presses the casing down into the ground minimizing disturbance to the surrounding environment In addition three 134-foot lsquosupergirdersrsquo will used to support the bridge deck In past bridge projects five to eight girders are typically used This new technology means less intrusion on water habitat and fewer maintenance requirements The $21 million replaces an aging wooden structure with a concrete bridge and realigns SR 162 to eliminate a high accident location Work is scheduled for spring 2004 completion
bull Three options to replace the SR 520 Floating Bridge are being explored They include a four-lane structure with shoulders wider lanes and a pedestrianbicycle lane a six-lane option that also adds a high-occupancy
SR 290 Trent Avenue Bridge as it appeared on Dec 4 The bridge had been slated for opening on Dec 16
Measures Markers and Mileposts - December 31 2003 61
Measures Markers and Mileposts - December 31 2003 63
vehicle lane in each direction and an eight-lane option that adds the elements of the six-lane and a general-purpose lane in each direction This fall WSDOT worked with divers to better identify objects on the floor of Lake Washington that could potentially affect the construction of a new bridge With at least $2 billion 15 years and a main connection across Lake Washington on the line WSDOT wanted to know all the impacts every step of the way to assure that time and taxpayer money are not wasted Preliminary side-scan sonar images showed three objects in the water some 1000 feet north of the current SR 520 Bridge Two objects appear to be barges The third object is a large boat estimated at 150 feet in length
bull WSDOTrsquos Aviation Division is participating in a project to install an irrigation system to support new turf growth at the Stehekin Airport near Lake Chelan Non-native plants growing on the airport runway have been the targets of a spray program paid for by the Aviation Division for years The National Park Service provided funding that allows the division to reseed the airport with a dense native grass to choke out the weeds About 20 pilot organizations volunteered to install the irrigation system The airportrsquos new turf will be ready for use next year and pilots will be able to operate from a smooth runway free of dust and gravel
bull Workers finished seismic retrofit work at the SR 20 Deception and Canoe Pass Bridges by installing 10000 bolts into the underside of the bridge decks The bolts connect the bridge decks to their supporting steel structures creating a connection that makes both bridges safer and more stable in the event of an earthquake Both bridges now meet current seismic codes
bull Just prior to the deluge of fall rains crews completed a $17 million paving project on SR 112 between the Makah Reservation and Hoko River Bridge in Clallam County Start of the job was delayed until August after young eagle fledglings near the project left their nest SR 112 was designated as a scenic highway in 2002 The highway terminates at Neah Bay on the northwest tip of the Olympic Peninsula and provides motorists access to one of the most remote areas of our state
Savings and Efficiencies bull A pilot project to compare the use of salt to the use of other anti-icing chemicals for improving winter driving conditions is being repeated An unusually mild winter weather in 2002-03 limited the amount of data collected and the initial study results did not show a clear-cut advantage to using one anti-icing product over another in all cases WSDOT is evaluating the use of rock salt and salt brine in comparison to other anti-icing chemicals to determine the effect on driving conditions corrosiveness to various types of metals impacts to the roadside environment and cost of snow and ice control This yearrsquos results will be combined with last yearrsquos for a complete report and made available to those who are interested
bull The National Association of State Aviation Officials (NASAO) named the WSDOTrsquos Aviation Division the ldquoMost Innovative Staterdquo of 2003 for developing an ldquoOn-line Pilot Registrationrdquo program The On-line Pilot Registration program began in January 2003 to improve customer service and streamline administrative processing WSDOT found that the improved service increased the number of pilots mechanics and aircraft owners who registered with the WSDOT Since the implementation of online registration revenues that support air search and rescue have increased more than $100000 Additionally over 4000 aviators have subscribed to the Aviation News Service which has improved communication between WSDOT Aviation and its customers
Rail bull The Federal Railroad Administration recently awarded $1 million to WSDOT for highway-rail grade crossing improvements The funds are designated for crossing improvements on the Pacific Northwest Rail Corridor in Cowlitz County and at several crossings between Marysville and Bellingham in Snohomish and Whatcom counties Washington is one of only ten states receiving funds The Pacific Northwest Rail Corridor extends 466 miles from Eugene Oregon via Portland and Seattle to Vancouver British Columbia
Materials for the airport project are barged across Lake Chelan
Measures Markers and Mileposts - December 31 2003 62
62 Measures Markers and Mileposts - December 31 2003
Public Transportation and Commute Trip Reduction bull WSDOT teamed up with local jurisdictions transit agencies and private companies to launch this yearrsquos Rideshare Weeks (Oct 13 ndash 24) an annual campaign encouraging commuters to incorporate carpooling vanpooling transit cycling and walking in their travel to work Flexing work hours and working from home or an alternate location also helped meet the campaignrsquos two major goals exposing commuters to their choices in transportation while saving space on the roads Rideshare Weeks was being featured in public service announcements donated by the Seattle Post-Intelligencer in radio spots in Puget Sound and Spokane and at worksites participating in the statersquos Commute Trip Reduction program WSDOT has coordinated with 16 public agencies to develop promotions and shared messaging For more information see wwwwsdotwagov partnerswsrorideshare bull On Tuesday October 21 WSDOT joined transportation providers at the Omak Senior Center to highlight new bus service in Okanogan County made possible through $460748 in state and federal public transportation grants WSDOT presented giant symbolic checks and a key for a new minibus to Colville Confederated Tribes Northwestern Trailways and Okanogan County Transportation
Awards and Recognition bull Linda Pierce of WSDOT Materials Lab and Steve Muench and Joe P Mahoney of the University of Washington have been awarded the national Premier Award sponsored by National Engineering Education Delivery System (NEEDS) for the new WSDOT Pavement Guide ndash Interactive The WSDOT Pavement Guide Interactive is now the official textbook for the primary pavement-oriented course in the UW Department of Civil and Environmental Engineering
bull WSDOT received the prestigious national leadership award from the Association for Commuter Transportation (ACT) for creating balanced transportation solutions that integrate commute options into highway planning projects in the Puget Sound region of Washington state WSDOT Transportation Demand Management (TDM) Resource Center has been heavily involved in research to determine ways to improve travel choices ndash such as vanpools carpools and bicycles ndash in transportation projects planning TDM focuses on reducing drive-alone auto trips by making other choices more available and attractive The ACT award recognizes that WSDOT is leading the way to incorporate alternatives to driving alone into new plans for transportation corridors such as State Route 520 and Interstate 405
bull WSDOT and the Department of General Administration received Governor Lockersquos Governorrsquos Award for Organizational Learning and Growth for the Deschutes Parkway Reconstruction Project The project was completed in October 2002 18 months after the Nisqually Earthquake destroyed major portions of Deschutes Parkway which surrounds Capitol Lake and links Tumwater to downtown Olympia RCI Construction Inc the project contractor contributed to an accelerated repair schedule and the project was completed many months earlier than first estimated and two months ahead of the contract schedule The completed project cost $698000 (16) less than the original engineerrsquos estimates Taxpayers saved an additional $525000 when a previously planned utility upgrade was completed at the same time as the road repairs instead of later This project changed the ways GA and WSDOT collaborate which is already saving money on other projects
Celebrations and Events bull Washington State Ferries (WSF) employees volunteered their time and skills to assist on the annual Special Peoples Holiday Cruise for the Puget Sound regionrsquos children and adults with special needs The event took place aboard the MV Puyallup and is sponsored by the Active Ferry Employees Charitable Trust (AFECT) The afternoon outing has been hosted by AFECT for almost 20 years No state funds are used The annual event is supported by donations of time and money including the Marine Corps Toys for Tots program Chevron Oil and Sodexho Corporation Many other local groups provide entertainment and support
bull WSDOT maintenance crews closed SR 410Chinook Pass on Monday Nov 17 and SR 123Cayuse Pass on Tuesday Nov 18 for the season due to heavy snowfall and snow slide danger Cayuse Pass connects Chinook Pass and White Pass at the east end of Mount Rainier National Park Cayuse and Chinook passes typically close for the season in November and reopen in April
bull Studded tires became legal in Washington on Saturday Nov 1 Studded tires are restricted in Washington due to the amount of wear and roadway damage they cause to state highways estimated at $10 million per year The tires are legal between November 1 and March 31 WSDOT is requesting legislative action to ban studded tires because of the damage and ruts they cause to highways and due to safety considerations Research shows that cars with studded tires take longer to stop than cars with other tires under most situations
Measures Markers and Mileposts - December 31 2003 63
Measures Markers and Mileposts - December 31 2003 65
Gray Notebook Subject Index
Edition Key 1 = Quarter 1 2001 2 = Quarter 2 2001 3 = Quarter 3 2001 4 = Quarter 4 2001 5 = Quarter 1 2002 6 = Quarter 2 2002 7 = Quarter 3 2002 8 = Quarter 4 2002 9 = Quarter 1 2003 10 = Quarter 2 2003 11 = Quarter 3 2003 12 = Quarter 4 2003
All editions can be accessed at wwwwsdotwagovaccountability
Topic Edition
Aviation Fuel Taxable Gallons 6Registrations of Pilots and Aircraft 6 10Training of Pilots and Mechanics 6
Benchmarks (RCW 4701012) Administrative Efficiency 9Transit Efficiency 9VMT per Capita 9
Bridge Conditions on State Highways Age of WSDOT Bridges 4Bridge Ratings (FHWA) Structurally Deficient and Functionally Obsolete 4Bridge Condition Ratings State Comparison 8Bridge Structural Condition Ratings 11Deck Protection Program Overview 4 5 8 11Deck Protection Program Planned vs Actual Projects 4 5 8 11Hood Canal Bridge Update 11Inspection Program 4 11Inventory of WSDOT Bridges 4 5 8 11Preservation Program Results 11Rehabilitation and Replacement Project Schedule 4 11Scour Mitigation 4 11Seismic Retrofit Program 1990-2020 Status 4Seismic Retrofit Program Planned vs Actual Projects 4 5 8 11Seismic Retrofit Program Top 10 Priority Bridges 4 8Steel Bridge Painting Planned vs Actual Projects 4 5 8 11Tacoma Narrows Bridge Update 8 9 10 11
Commute Trip Reduction Award for the Commute Trip Reduction Program 6 11Commute Mode Share in Washington State 1990 and 2000 7Commuting Trends at CTR Work Sites and Work Sites in General 4ldquoDrive Alonerdquo Commuting Rates State Comparison 6 7Eastgate Park and Ride Expansion 9Effectiveness of CTR Program (Biennial Results) 4Employer Participation Investment and Benefits 2Gasoline Consumption Per Capita (from Northwest Environment Watch) 7Park and Ride Lot Occupancy Rates Central Puget Sound 4Park and Ride Lot Occupancy Rates King County 3 5 6 7 8 9 10 11 12Park and Ride Lot Security 5Park and Ride Lot Puget Sound System 8Vanpool Operation in the Puget Sound Region 2 3 4 5 6 7 8 9 10 11 12Vanpooling Share of Daily Puget Sound Area VMT 2VanShare Trends 8 9 11 12
Congestion on State Highways Accidents on Interstate 405 2001 and 2002 9Benchmark Policy Goals for Congestion Analysis 5Congestion Measurement Principles 5 6Daily Vehicle Hours of Delay per Mile Sample Commutes Measured
by Delay Time of Day Distribution of Delay and Travel Rate Index 2 5Distribution of Traffic Between Freeways and Arterials 1999 to 2003 9Employment Puget Sound Region 9
Measures Markers and Mileposts - December 31 2003 64
64 Measures Markers and Mileposts - December 31 2003
Edition Key 1 = Quarter 1 2001 2 = Quarter 2 2001 3 = Quarter 3 2001 4 = Quarter 4 2001 5 = Quarter 1 2002 6 = Quarter 2 2002 7 = Quarter 3 2002 8 = Quarter 4 2002 9 = Quarter 1 2003 10 = Quarter 2 2003 11 = Quarter 3 2003 12 = Quarter 4 2003
All editions can be accessed at wwwwsdotwagovaccountability
Topic Edition Congestion on State Highways (continued)
Highway Improvements Can Improve Congestion 9Induction Loop Detectors 5Intelligent Transportation Systems in Washington State 5
2000 and 2003 9Traffic Speeds and Volumes on SR 520Traffic Volumes at Seven Locations in March 2000 to 2003 Average 9Traffic Volumes on Nine Puget Sound Region Corridors 5Travel Time Reliability 6 9Travel Time to Work Comparison State and County Rankings 5Travel Times on 11 Puget Sound Region Corridors 5 9Travel Times With and Without Incidents 6Typical Freeway Traffic Volume Trend 1993 to 2002 9
Construction Program for State Highways Advertisements by Subprogram Planned Actual amp Deferred 4 5CIPP Value of Advertised amp Deferred Projects by Subprogram 4 5Construction Program Cash Flow Planned vs Actual Expenditures 4 5 6 7 8 9 10 11 12Construction Program Delivery Planned vs Actual Advertisements 1 2 3 4 5 6 7 8 9 10 11 12Contracts Awarded Engineerrsquos Estimate to Award Amount 6 10Contracts Completed Final Cost to Award Amount 6 10Contracts Completed Final Cost to Engineerrsquos Estimate 6 10End-of-Season Highway Construction Project Evaluations 12FHWA Federal Performance Report Card 12Hood Canal Bridge Update 11 12Hot Mix Asphalt Pavement Delivery 3 5 7 9 11Lane Miles Added to State Highway System 1996-2001 2Safety Construction Program Planned vs Actual Advertisements 3 6 8 9 10 11 12Tacoma Narrows Bridge Update 8 9 10 11 12
Design Value Engineering 6 10
Environmental Stewardship Compost Use 7Construction Site Erosion and Runoff Protection 4 6 9 12ldquoEcology Embankmentrdquo Pollutant Removal 8Environmental Impact Statement (EIS) Tracking 9Environmental Compliance Assurance Tracking Violations 9 12Fish Passage Barriers 4Herbicide Usage Trends 5 8 12Organic Recycling Award for WSDOT 12Recycling Aluminum Signs 7Wetland Mitigation and Monitoring 5 9 12
Ferries (WSF) Capital Expenditure Performance Planned vs Actual 4 5 6 7 8 9 10 11 12Customer Comments 3 4 5 6 7 8 9 10 11 12Fare Comparison WSF to Other Auto Ferries 4Farebox Recovery Rate 5 12Farebox Recovery Comparison WSF to Other Auto Ferries and Transit 5Farebox Revenues by Month 3 4 5 6 7 8 9 10 11 12Life Cycle Preservation Performance Planned vs Actual 12On-Time Performance 3 4 5 6 7 8 9 10 11 12Operating Costs Comparison WSF to Other Ferry Systems 3Ridership by Month 3 4 5 6 7 8 9 10 11 12Trip Reliability Index and Trip Cancellation Causes 3 4 5 6 7 8 9 10 11 12
Measures Markers and Mileposts - December 31 2003 65
Measures Markers and Mileposts - December 31 2003 67
Edition Key 1 = Quarter 1 2001 2 = Quarter 2 2001 3 = Quarter 3 2001 4 = Quarter 4 2001 5 = Quarter 1 2002 6 = Quarter 2 2002 7 = Quarter 3 2002 8 = Quarter 4 2002 9 = Quarter 1 2003 10 = Quarter 2 2003 11 = Quarter 3 2003 12 = Quarter 4 2003
All editions can be accessed at wwwwsdotwagovaccountability
Topic Edition Maintenance of State Highways
Achievement of Biennial Maintenance Targets (MAP) 3 4 8 12Anti-Litter Campaign Update 5 11Costs of State Highway Maintenance 4Customer Satisfaction with WSDOT Highway Maintenance Activities 3Debris Pusher Maintenance Attachment 6Guidepost Driver 11Herbicide Usage Trends 5 8 12Highway Sign Bridges Planned vs Actual Repairs 3 4 6 8Highway Signs Number of Maintenance Actions 6 8Integrated Vegetation Management Update 5 12Litter Removal from State Highways 5 6 8 11Living Snow Fence on SR 25 9Mountain Pass Highway Closures 7 9Pavement Striping How Do They Paint the Stripes So Straight 6Pavement Striping Planned vs Actual Miles Painted 3 4 6 8Road Kill on State Highways 5Safety Rest Area Locations and Amenities 9Salt Pilot Project 7 10Snow and Ice Control Operations 4 7Survey on Pass Travel Conditions and Anti-Icer Use 2Survey on Safety Rest Areas 9Traffic Signals Annual Energy Costs and Incandescent Bulb Conversion 3Winter Overtime Hours and Snowfall Amount 7 9Winter Roadway Condition Level of Service and Anti-Icer Chemicals 9Winter Severity and Snow and Ice Operations Costs 9Vortex Generators 5
Pavement Conditions on State Highways ldquoDuerdquo Pavement Rehabilitation Needs 4 8Concrete Pavement Lane Miles by Age and Dowel Bar Retrofit Status 12Pavement Condition Trends 4 8 12Pavement Condition by Type 2Pavement Lane Miles Annual Vehicle Miles Traveled and Programmed Dollars 12Smoothness Rankings by State 4 8 12
Rail Freight Grain Train Carloads 5 6 7 8 9 11 12Grain Train Route Map 5 9Washington Fruit Express Car Loadings Per Week 5 8
Rail State-Supported Amtrak Cascades Service Amtrakrsquos Future 5 6 7 9Budget Update 10Capital Improvement Program and WSDOT Service Goals 2Customer Satisfaction 2 3 4 7 9 12 Farebox Recovery Percentage by Train 4 8 12Internet Reservations and Automated Ticketing 6Investment in Intercity Rail Comparison 5On-Time Performance 2 3 4 5 6 7 8 9 10 11 12Operating Costs 4Passenger Trips by Station 6Ridership by Month 2 3 4 5 6 7 8 9 10 11 12Ridership by Year Long-Term Trends 2 4 8Ridership Patterns by Segment (Seats Sold) 3Route Map Amtrak in Washington 6Station Update 11Vehicles Diverted Annually from Interstate 5 by Cascades 2
Measures Markers and Mileposts - December 31 2003 66
66 Measures Markers and Mileposts - December 31 2003
Edition Key 1 = Quarter 1 2001 2 = Quarter 2 2001 3 = Quarter 3 2001 4 = Quarter 4 2001 5 = Quarter 1 2002 6 = Quarter 2 2002 7 = Quarter 3 2002 8 = Quarter 4 2002 9 = Quarter 1 2003 10 = Quarter 2 2003 11 = Quarter 3 2003 12 = Quarter 4 2003
All editions can be accessed at wwwwsdotwagovaccountability
Topic Edition Safety on State Highways
Alcohol-Related Fatality Rate 12Before and After Collision Data for Highway Safety Improvement Projects 12Bicycle and Pedestrian Safety Federal Benchmark 9Bicyclist Fatality Rates State Comparison 9Cable Median Barrier Installation Before and After Collision Data 12Corridor Safety Program Results 8Driving Speeds on State Highways 4Fatal and Disabling Collisions Circumstances and Type 8Fatal and Disabling Collisions at Intersections Types of Collisions 9Fatal and Disabling Crashes and VMT percent change 3 7 11Fatalities Involving High Blood Alcohol Concentration State Comparison 7Fatality Rates State Highways All State Public Roads amp US 3 7 11Guardrail Retrofit Program 11High Accident Corridors and Locations by Region 4 High Accident Corridors and Locations Statewide 3Low Cost Safety Enhancement Program Planned vs Actual Projects 3 4 5Low Cost Safety Enhancement Program Sample Projects 4 6Pedestrian Fatality Rates State Comparison 8Pedestrian Factors in VehiclePedestrian Collisions 8Port Orchard Roundabout Before and After Collision and Injury Data 12Safety Construction Program Planned vs Actual Project Advertisements 3 6 7 8 9 10 11 12Safety Laws Booster Seats and Mandatory Seat Belts 5Safety Projects Completed This Quarter 7Seatbelt Use State Comparison 7 11Safe Routes to Schools 9 12
Traffic Operations on State Highways FHWA Self-Assessment 9Incident Response Calls Responded to by Region 2Incident Response Clearance Time Distribution 11 12Incident Response Clearance Times 2 3 4 5 8 9 10 11 12Incident Response Customer Comments 8Incident Response Economic Analysis 10Incident Response Non-Collision Response Types 8 9 10 11 12Incident Response Program Types of Responses Program Total 9 10 11 12Incident Response Program Types of Responses 15 to 90 Minute Incidents 9 10 11 12Incident Response Program Types of Responses Over 90 Minute Incidents 9 10 11 12Incident Response Service Actions Taken 7 10 11 12Incident Response Teams Go to the Olympics 5Incident Response Teams Location and Type 7Incident Response Timeline 6Incident Response Times 2 3 4 5Incident Response Total Number of Responses by Month 7 8 9 10 11 12Incidents with Clearance Times Over 90 Minutes 6 7 8 9 10 11 12Intelligent Transportation Systems in Washington State 5Joint Operations Policy Statement between WSDOT
and Washington State Patrol 5Service Patrol Contacts 3 4Spokane Interstate 90 Peak Hour Roving Service Patrol Pilot 5
Traveler Information Award for Traveler Information Web Site 11Calls to 1-800-695-ROAD and 5-1-1 8 9 10 11 12Camera Views 8Evaluation Survey 10Web Site Feedback 8 9Web Site Usage 7 8 9 10 11 12
Measures Markers and Mileposts - December 31 2003 67
Edition Key 1 = Quarter 1 2001 2 = Quarter 2 2001 3 = Quarter 3 2001 4 = Quarter 4 2001 5 = Quarter 1 2002 6 = Quarter 2 2002 7 = Quarter 3 2002 8 = Quarter 4 2002 9 = Quarter 1 2003 10 = Quarter 2 2003 11 = Quarter 3 2003 12 = Quarter 4 2003
All editions can be accessed at wwwwsdotwagovaccountability
Topic Edition Truck Freight
Cross Border Truck Volumes 6 10Freight Routes and Border Crossings in Washington 6 10Freight Shipments To From and Within Washington 10Impediments to Truck Shipping Bridges with Posted Weight Restrictions 6Improvement Projects with Freight Benefits 10Intelligent Transportation Systems Use for Trucks 6 10Managing Over-Sized Truck Loads 6OsoyoosOroville Border Facts 10Overdimensional Trucking Permits 6Revenue Prorated to Washington for Trucks in Interstate Use 6 10Truck Registrations in Washington 6Truck Share of Total Daily Vehicle Volumes 6
Workforce Accident Prevention Activities 3 4 5 6 7 8 9 10 11 12Ferry Vessel Workers Recordable Injuries 2 3 4 5 6 7 8 9 10 11 12Highway Engineer Workers Recordable Injuries 2 3 4 6 7 8 9 10 11 12Highway Maintenance Workers Recordable Injuries 1 2 3 4 5 6 7 8 9 10 11 12Highway Maintenance Workers Safety Training 5 6 7 8 9 10 11 12Human Resources Training for all WSDOT Employees 7 8 9 10 11 12North American Association of Transportation Safety and Health Officials Meeting 3Workforce Levels 5 6 7 8 9 10 11 12
Measures Markers and Mileposts - December 31 2003 68
68 Measures Markers and Mileposts - December 31 2003
Americans with Disabilities Act (ADA) InformationPersons with disabilities may request this information be prepared and
supplied in alternate formats by calling the Washington State Department of Transportation ADA Accommodation Hotline collect (206) 389-2839
Persons with hearing impairments may access Washington State Telecommunications Relay Service
at TTY 1-800-833-6388 Tele-Braille 1-800-833-6385 Voice 1-800-833-6384 and ask to be connected to (360) 705-7097
Civil Rights Act of 1964 Title VI Statement to Public Washington State Department of Transportation (WSDOT) hereby
gives public notice that it is the policy of the department to assure full compliance with Title VI of the Civil Rights Act of 1964 the Civil Rights
Restoration Act of 1987 and related statutes and regulations in all programs and activities Persons wishing information may call the WSDOT
Office of Equal Opportunity at (360) 705-7098
Other WSDOT Information Available The Washington State Department of Transportation has a vast amount
of traveler information available (including Puget Sound area traffic mountain pass reports highway closures ferry schedules and more)
Call the WSDOT statewide toll-free number 1-800-695-ROADIn the Seattle area (206) DOT-HIWY [368-4499]
For additional information about highway traffic flow and cameras ferry routes and schedules Amtrak Cascades rail and other transportation
operations as well as WSDOT programs and projects visitwwwwsdotwagov
For this or a previous edition of the Gray Notebook visit wwwwsdotwagovaccountability
0401-0004
- Cover
- Credits
- Table of Contents
- Beige Pages
-
- Project Reporting on the 2003 Transportation Funding Package
- Current Project Highlights and Accomplishments
- Project Delivery
- Financial Information
- Program Management Information
-
- Worker Safety Quarterly Update
- Workforce Levels and Employee Training Quarterly Update
- Highway Construction Program Quarterly Update
- Tacoma Narrows Bridge Project Update
- Hood Canal Bridge Project Update
- Highway Safety Improvement Projects Quarterly Update
- Asset Management Pavement Assessment Annual Update
- Highway Maintenance Annual Update
- Environmental Programs
- Incident Response Quarterly Update
- Traveler Information Quarterly Update
- Options to Drive Alone Commuting Quarterly Update
- Washington State Ferries Quarterly Update
- State-Supported Amtrak Cascades Service Quarterly Update
- Special Features
- Highlights of Program Activities
- Gray Notebook Subject Index
-