
Gray Notebook 68 - For Quarter ending December...
64
PRESERVING THE STATE'S ROADS TO MEET INCREASING DEMAND Safety first How WSDOT keeps its workers safe and healthy p. 14 Striving to stay on target WSDOT working hard to maintain its highway assets p. 26 Moving right along WSDOT's tolling program helps improve travel reliability p. 43 Quarterly performance analysis of WSDOT's mulmodal systems and programs Roger Millar, Secretary of Transportaon, PE, AICP Edion 68 December 2017 GROWING PAINS
Transcript of Gray Notebook 68 - For Quarter ending December...

PRESERVING THE STATE'S ROADS TO MEET INCREASING DEMAND
Safety firstHow WSDOT keeps its workers safe and healthy p. 14
Striving to stay on target WSDOT working hard to maintain its highway assets p. 26
Moving right along WSDOT's tolling program helps improve travel reliability p. 43
Quarterly performance analysis of WSDOT's multimodal systems and programs
Roger Millar, Secretary of Transportation, PE, AICP
Edition 68 December 2017
GROWING PAINS
2 | GNB Edition 68 | December 2017 Table of Contents
TABLE OF CONTENTS68
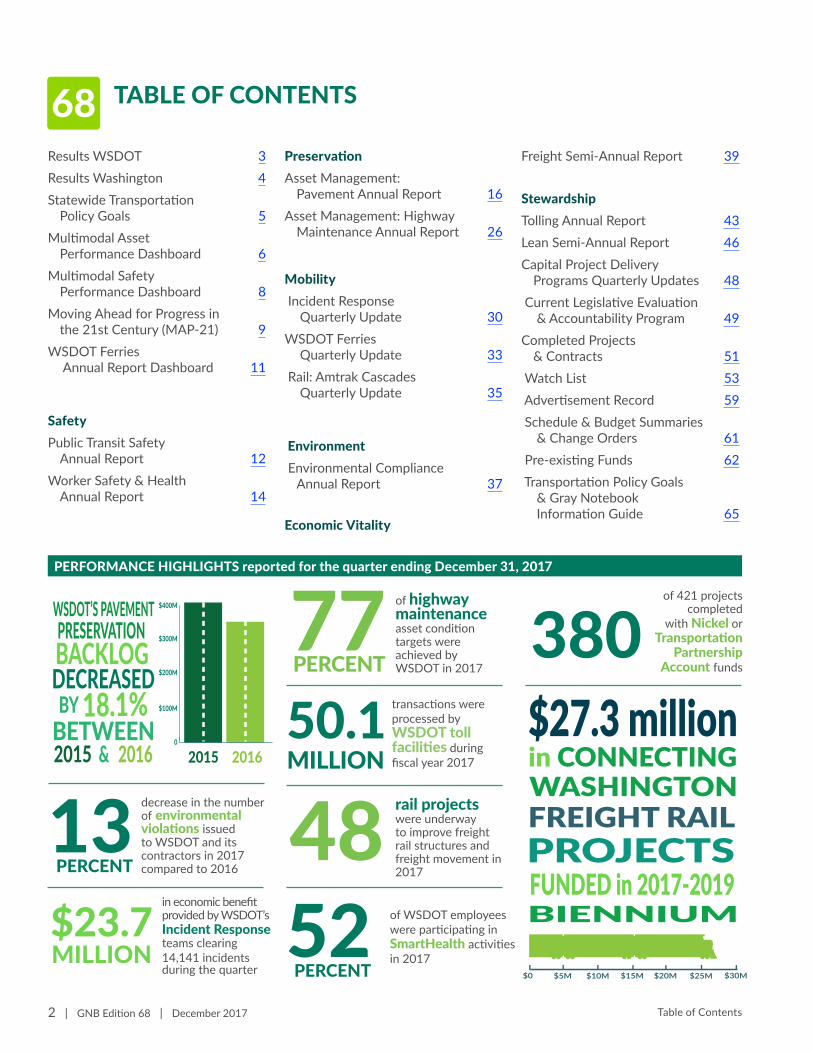
PERFORMANCE HIGHLIGHTS reported for the quarter ending December 31, 2017
380
Results WSDOT 3Results Washington 4Statewide Transportation
Policy Goals 5Multimodal Asset
Performance Dashboard 6Multimodal Safety
Performance Dashboard 8Moving Ahead for Progress in
the 21st Century (MAP-21) 9WSDOT Ferries
Annual Report Dashboard 11
SafetyPublic Transit Safety
Annual Report 12Worker Safety & Health
Annual Report 14
PreservationAsset Management:
Pavement Annual Report 16Asset Management: Highway
Maintenance Annual Report 26
Mobility Incident Response
Quarterly Update 30 WSDOT Ferries
Quarterly Update 33 Rail: Amtrak Cascades
Quarterly Update 35
Environment Environmental Compliance
Annual Report 37
Economic Vitality
Freight Semi-Annual Report 39
StewardshipTolling Annual Report 43Lean Semi-Annual Report 46Capital Project Delivery
Programs Quarterly Updates 48 Current Legislative Evaluation
& Accountability Program 49 Completed Projects
& Contracts 51 Watch List 53 Advertisement Record 59 Schedule & Budget Summaries
& Change Orders 61 Pre-existing Funds 62 Transportation Policy Goals
& Gray Notebook Information Guide 65
77 of highway maintenance asset condition targets were achieved by WSDOT in 2017PERCENT
48 rail projects were underway to improve freight rail structures and freight movement in 2017
$23.7 MILLION
in economic benefit provided by WSDOT’s Incident Response teams clearing 14,141 incidents during the quarter
of 421 projects completed
with Nickel or Transportation
Partnership Account funds
50.1 transactions were processed by WSDOT toll facilities during fiscal year 2017MILLION
WSDOT’S PAVEMENT
BY BETWEEN 2015
BACKLOG
18.1%0
$100M
$200M
$300M
$400M
2016& 2015 2016
PRESERVATION
DECREASED
FREIGHT RAILPROJECTS
in CONNECTING $27.3 million
BIENNIUMFUNDED in 2017-2019
$5M$0 $25M $30M$20M$15M$10M
WASHINGTON
13 decrease in the number of environmental violations issued to WSDOT and its contractors in 2017 compared to 2016PERCENT
52 of WSDOT employees were participating in SmartHealth activities in 2017
PERCENT

GNB Edition 68 | December 2017 | 3 Results WSDOT
68 RESULTS WSDOT
New strategic plan under developmentResults WSDOT—the agency’s strategic plan—has undergone a bit of a face lift for 2017-2021. Results WSDOT for 2014-2017 featured six goals; three agency emphasis areas were added as strategies in 2016. These emphasis areas—Inclusion, Practical Solutions and Workforce Development—have become the new plan's goals. The new plan continues to direct WSDOT’s work with partners and communities. Results WSDOT also continues to focus on how the agency makes investments and delivers projects with limited resources.
Results WSDOT's goal teams are busy developing strategies and work plans, which will define the actions and deliverables needed to achieve the agency's goals through 2021. Articles in this issue, indicated by a box with a goal logo, show how these goals are being realized. A strategic plan dashboard is under development; look for it in upcoming issues of the Gray Notebook.
In addition to three goals, Results WSDOT features a vision, mission and values. WSDOT's vision, defined as where the agency wants to go, is "Washington travelers have a safe, sustainable and integrated multimodal transportation system." Results WSDOT's mission is a statement about the agency's core purpose, "We provide safe, reliable and cost-effective transportation options to improve communities and economic vitality for people and businesses."
Results WSDOT features six values, defined as "how we do business" or statements of guiding principles. The values are:
Æ Safety – Promote public and employee safety
Æ Engagement – Include all perspectives, disciplines and backgrounds in our outreach and decision making, employing a diverse workforce that reflects the communities we serve
Æ Innovation – Encourage creativity, continuous improvement and the advancement of technology
Æ Integrity – Be ethical, accountable, responsive and trustworthy
Æ Leadership – Inspire, motivate, develop and support each other
Æ Sustainability – Be resource stewards by supporting economic, environmental and community need
Recent editions of the Gray Notebook have featured articles on Workforce Development and Inclusion efforts at WSDOT. See Gray Notebook 65, pp. 31-32 for the Workforce Development Annual Report, and Gray Notebook 66, pp. 43-47 for the Inclusion Annual Report.
Workforce DevelopmentBe an employer of choice, creating a modern workforce while attracting and retaining quality workers to deliver our legislative, regulatory, and service requirements.
Practical SolutionsAdvance the integration of Practical Solutions into WSDOT’s culture and practices to cost-effectively plan, design, build, operate and maintain the state’s transportation system.
InclusionStrengthen commitment to diversity and engagement in all of WSDOT’s business processes, functions and services to ensure every voice is heard.
Return toTable of
Contents

Results Washington, the state’s performance management system, outlines Gov. Jay Inslee’s priorities. This strategic framework sets the state’s vision and mission, as well as the foundational expectation that state agencies will achieve goals collaboratively. Results Washington has five goals: World Class Education; Prosperous Economy; Sustainable Energy and a Clean Environment; Healthy and Safe Communities; and Efficient, Effective and Accountable Government. For more information, visit http://www.results.wa.gov/.
4 | GNB Edition 68 | December 2017
RESULTS WASHINGTON68
Results Washington Measures by goal1Previous
periodCurrent period
On target2
Current trend
Desired trend
Annual Measure for which WSDOT is the lead agencyGoal 2: Prosperous EconomyControl the percent of National Highway System bridges, state and locally owned, in poor condition from increasing over 10% by 2020 (FY2016 & FY2017)
9.3% 8.6% Yes Control the percent of National Highway System pavement, state and locally owned, in poor condition from increasing over 10% by 2020 (2015 & 2016)
6.7% 7.4% Yes Control the percent of ferry terminal systems (by value) that are past due for replacement from increasing over 6% by 2020 (FY2016 & FY2017)
5.4% 5.2% Yes Control the percent of ferry vessel systems (by value) that are past due for replacement from increasing over 10% by 2020 (FY2016 & FY2017)
10.9% 13.3% No Maintain percentage of transit fleet that exceeds the Federal Transit Administration’s minimum useful life at 25% or below through 2020 (2015 & 2016)
34.6%3 40.2% No
Increase the percentage of Washingtonians using alternative transportation commute methods to 29% by 2020 (2015 & 2016)
27.6% 27.9% No
Ensure travel and freight reliability on strategic corridors does not deteriorate more than 5% through 20204 (2015 & 2016)
5.0%5 5.7% No
Operate strategic corridors at 90% efficiency or higher through 2020 (2015 & 2016) 93.4% 94.0% Yes Reduce the number of pedestrian and bicyclist fatalities on public roadways from 84 in 2012 to zero in 2030 (2015 & 2016)
100 106 No
Annual measures for which WSDOT is not the lead agency, but has an interest include:Goal 2: Prosperous EconomyIncrease state agency and educational institution utilization of state-certified small businesses in public works and other contracting and procurement by 2017 to: Minority-owned businesses, 10%; Women-owned businesses, 6%; Veteran-owned businesses, 5%5 (FY2016)
Minority-owned: 1.65%5
Women-owned: 1.23%5
Veteran-owned: 0.26%5
No N/A
Goal 3: Sustainable Energy and a Clean EnvironmentReduce transportation related greenhouse gas emissions from 44.9 million metric tons/year (projected 2020) to 37.5 million metric tons/year (1990) by 2020 (2012 & 2013) 42.4 40.4 Yes Reduce the average emissions of greenhouse gases for each vehicle mile traveled in Washington by 25% from 1.15 pounds in 2010 to 0.85 pounds by 2020 (2012 & 2013) 1.11 1.11 No Increase the average miles traveled per gallon of fuel for Washington’s overall passenger and light duty truck fleet (private and public) from 19.2 mpg in 2010 to 23 mpg in 2020 (2014 & 2015) 20.6 21.0 No Increase the number of plug-in electric vehicles registered in Washington from approximately 8,000 in 2013 to 50,000 by 2020 (2016 & 2017) 17,941 24,624 No Increase miles of stream habitat opened from 55 miles per year in 2017 to 80 by 20205,6 (2017) N/A 555 No N/A Increase number of fish passage barriers corrected per year from 60 in 2017 to 90 by 20205,6 (2017) N/A 605 No N/A Goal 4: Healthy and Safe CommunitiesDecrease number of traffic-related fatalities on all roads from 454 in 2011 to zero in 2030(2015 & 2016) 551 537 No
Data sources: WSDOT Office of Strategic Assessment and Performance Analysis and Results Washington’s Open Performance Program.Notes: 1 In addition to the measures listed in the table, WSDOT contributes performance information that is combined and reported with data from all state agencies in Goal 5: Efficient, Effective and Accountable Government. 2 A measure is “on target” if it is currently meeting its goal or if it is on a path to meet its goal by the target date. Some measures may be trending in the desired direction but not on target. 3 Value differs from previous editions. To better align with the Federal Transit Administration, WSDOT has updated its method for calculating useful life; it is now based on age or mileage instead of just age. 4 This measure is the percentage difference between the value of the reliability index in one period and the average of the value of the reliability index in the three preceding periods. 5 Measure applies to work completed by multiple state agencies. 6 Measure has been updated since Gray Notebook 65.
Results Washington
Return toTable of
Contents

GNB Edition 68 | December 2017 | 5 Statewide Transportation Policy Goals
68 STATEWIDE TRANSPORTATION POLICY GOALS
Statewide policy goal/ WSDOT performance measure
Previous period
Current period Goal
Goal met
Five-year trend (unless noted)
Desired trend
SafetyRate of traffic fatalities per 100 million vehicle miles traveled statewide(Annual measure: calendar years 2015 & 2016)
0.92 0.88 <1.001
0.75
0.93
Rate of recordable incidents for every 100 full-time WSDOT workers (Annual measure: calendar years 2016 & 2017)
4.6 4.7 <5.0 PreservationPercentage of state highway pavement in fair or better condition by vehicle miles traveled(Annual measure: calendar years 2015 & 2016)
93.0% 91.7% > 90%91.50
93.35
Percentage of state bridges in fair or better condition by bridge deck area(Annual measure: fiscal years 2016 & 2017)
91.2% 91.8% > 90%91.1
Mobility2 (congestion relief)Highways: Annual (weekday) vehicle hours of delay statewide relative to maximum throughput speeds³ (Annual measure: calendar years 2014 & 2015)
32.3million N/A N/A
30.900000
31.724999
32.549999
Highways: Average incident clearance times for all Incident Response program responses(Calendar quarterly measure: Q4 2016 & Q4 2017)
12.6 minutes
13.5 minutes N/A
11.0
12.5
14.0
Ferries: Percentage of trips departing on time⁴(Fiscal quarterly measure: year to year Q2 FY2017 & Q2 FY2018) 95.9% 95.6% > 95%
93
95
97
Rail: Amtrak Cascades on-time performance5(Annual measure: fiscal years 2016 & 2017) 74.8% 56.3% > 80%
55.0
65.8
76.6
EnvironmentNumber of WSDOT stormwater management facilities constructed(Annual measure: fiscal years 2016 & 2017)
151 129 N/A129
156
183
210
Not applicable
Cumulative number of WSDOT fish passage improvement projects constructed(Annual measure: calendar years 2015 & 2016)
301 319 N/A268.50
294.25
320.00
StewardshipCumulative number of Nickel and TPA projects completed⁶ and percentage on time⁷(Calendar quarterly measure: Q3 2017 & Q4 2017, trendline for percentage on time
380/87%
380/87%
> 90% on time
86
88
Cumulative number of Nickel and TPA projects completed⁶ and percentage on budget⁷(Calendar quarterly measure: Q3 2017 & Q4 2017, trendline for percentage on budget)
380/91%
380/91%
> 90% on budget
90
92
Variance of total project costs⁶ compared to budget expectations⁷(Calendar quarterly measure: Q3 2017 & Q4 2017)
Under budget by
1.5%
Under budget by 1.5%
On or under budget -2.3
-1.4
Not applicable
Data source: WSDOT Office of Strategic Assessment and Performance Analysis.Notes: (*) = goal has not been set. Dash (—) = goal was not met in the reporting period. For the Economic Vitality Policy Goal, see p. 4 for Results Washington Goal 2: Prosperous Economy measures. 1 The Statewide Transportation Policy Goal for this performance measure is different than the federal MAP-21 goal for the same measure. 2 Mobility does not yet include goals for people walking/biking for transportation. 3 Compares actual travel time to travel time associated with “maximum throughput” (defined as 70-85% of the posted speeds). Delay data for 2015 was unavailable at the time of this publication. 4 WSDOT Ferries’ on-time departures include any trip recorded by automated tracking as leaving the terminal within 10 minutes of scheduled time. 5 Amtrak Cascades’ on-time performance includes any trip arriving within 10 or 15 minutes, depending on the route, of scheduled arrival time. 6 Construction projects only. 7 Budget and schedule expectations are defined in the last approved State Transportation Budget. See p. 48 for more information.
4.300000
4.773334
5.246668
(Five-quarter trend)
(Five-quarter trend)
(Five-quarter trend)
(Five-quarter trend)
(Four-year trend)
Return toTable of
Contents

6 | GNB Edition 68 | December 2017 Multimodal Asset Performance Dashboard
MULTIMODAL ASSET PERFORMANCE DASHBOARD68
WSDOT performance measurePrevious
periodCurrent period Goal
Goal met
Five-year trend (unless noted)
Desired trend
Highway Assets BridgesPercentage of WSDOT-owned bridges in fair or better condition by bridge deck area(Fiscal years 2016 & 2017)
91.2% 91.8% ≥90%91
Number of WSDOT-owned bridgesload restricted or load posted(Fiscal years 2016 & 2017)
126 119 N/A119
141
Current WSDOT-owned steel bridge painting backlog in millions of dollars(Fiscal years 2016 & 2017)
$414.5 $460.8 N/A Projected 10-year WSDOT owned steel bridgepainting backlog in millions of dollars(Fiscal years 2016-2025 & 2017-2026)
$706.6 $740.8 N/A565
751
Current WSDOT-owned bridge deck area due or past due for replacement in millions of dollars(Fiscal years 2016 & 2017)
$115.6 $99.2 N/A70
116
Projected 10-year WSDOT owned bridge deck area due or past due for replacement in millions of dollars(Fiscal years 2016-2026 & 2017-2027)
$726.5 $831.1 N/A71
832
Percentage of NHS bridge deck area located on structurally deficient bridges (locally- and WSDOT -owned)(Fiscal years 2016 & 2017)
9.3% 8.6% ≤10%
0.078
0.100
PavementPercentage of WSDOT-owned pavementin fair or better condition¹(Calendar years 2015 & 2016)
93.0% 91.7% >90%91.50
93.35
Highway Pavement Asset Sustainability Ratio;long term service replenishment rate²(Calendar years 2015 & 2016)
0.57 0.68 >0.900.52
0.77
Highway Pavement Deferred Preservation Liability (backlog) in millions of dollars(Calendar years 2015 & 2016)
$403 $330 $0325.000000
403.999952
Highway Pavement Remaining Service Life aspercentage of total useful life(Calendar years 2015 & 2016)
47.1% 48.6% 45%-55% 0.46 Percentage of lane miles of interstate pavement in poor condition(Calendar years 2015 & 2016)
4.0% 3.2% ≤5% Safety Rest AreasSafety rest area score through theMaintenance Accountability Process³(Calendar years 2015 & 2016)
B B B2.000000
3.999999
Total visitors at safety rest areasin millions of visitors(Calendar years 2015 & 2016)
23.1 24.0 N/A20.7
24.1
N/A
Highway Maintenance
Percentage of funded maintenance condition targets achieved⁴(Calendar years 2016 & 2017)
93% 77% 100%0.760
0.935
345
482
2.9
(Three-year trend)
(Three-year trend)
(Three-year trend)
Return toTable of
Contents

Multimodal Asset Performance Dashboard GNB Edition 68 | December 2017 | 7
WSDOT performance measure
Previous period
Current period Goal
Goal met
Five-year trend (unless noted)
Desired trend
Ferry Assets Vessels and Terminals Ferry vessel systems past due for replacement by value⁵(Fiscal years 2016 & 2017)
10.9% 13.3% ≤10%0.070
0.133
Ferry terminal systems past due for replacement⁶(Fiscal years 2016 & 2017) 5.3% 5.2% ≤6%
0.032
Ferry vessel preservation needs as percentage backlog of total vessel value(Fiscal years 2016 & 2017)
30.6% 23.6% N/A0.24
0.31
Ferry terminal preservation needs as percentage backlog of total terminal assets(Calendar years 2016 & 2017)
5.3% 5.2% N/A0.032
0.060
Multimodal Assets Aviation Airport combined (federal, state, local) grant funding in millions of dollars⁷(Fiscal years 2016 & 2017)
$59.7 $88.5 N/A9.2
Percentage of airport Master Record inspectionsconducted by WSDOT⁷(Calendar years 2015 & 2016)
100% 100% 100%0.49
1.01
Other Assets FacilitiesFacilities Preventive Maintenance Plan completion rate⁸(Biennial measure: 2015-2017 & 2017-2019)
88% 82% 71%0.73
0.98
Percentage of primary buildings⁸in fair or better condition(Biennial measure: 2015-2017 & 2017-2019)
59% 56% N/A0.55
0.62
10-year forecast of unmet needs (backlog)in millions of dollars⁹(Biennial measure: 2015-2017 & 2017-2019)
$475.5 $474.7 N/A474.7
475.5
Data source: WSDOT Office of Strategic Assessment and Performance Analysis.Notes: N/A = not available or not applicable. Asterisk (*)= goal has not been set. Dash (—) = goal was not met in the reporting period. 1 Data includes only conditions for asphalt and concrete pavement; budget constraints prohibited data collection for chip seal pavement. Condition data is weighted by vehicle miles traveled. 2 Years of service life replenished through rehabilitation divided by service life consumed on an annual basis (long-term measure). 3 Safety rest areas are assigned a score according to the Maintenance Accountability Process on a level of service (LOS) scale, A through F. 4 Maintenance activities are assigned asset condition targets based upon an A through F level of service scale and funding levels; actual conditions are compared to funded asset condition levels on the LOS scale. See GNB 32, p. 19 for additional information on LOS standards. 5 WSDOT Ferries Division uses a risk assessment matrix, which combines the probability of system component failure with information on the failure’s impact on ferry operations to gauge when ferry systems are past due for replacement; systems in condition rating 3 are past due for replacement. 6 WSDOT Ferries Division uses an economic-based model for assessing terminal needs; the model has been updated each subsequent year to improve accuracy and is not directly comparable to previous data. 7 Asset condition data is not currently available for the WSDOT aviation programs; grant funding and inspections for the Airport Master Record are being used as stand-in measurements until data is available. The airport grant funding measurement applies to all public-use airports. The Airport Master Record inspection measurement only applies to public-use non-primary commercial airports. 8 The Preventive Maintenance Plan is developed biennially and ranks maintenance activities based upon a criticality assessment scale. Funding is insufficient to complete all activities; completion rate is measured only for funded work categories. 9 Measured as backlog of unmet needs over the next 10 years as identified by the capital facilities strategic plan.
(Three-year trend)
(Three-year trend)
(Three-year trend)
(Three-year trend)
(Two-biennium trend)
(Two-biennium trend)
(Two-biennium trend)
(Three-year trend)

8 | GNB Edition 68 | December 2017 Multimodal Safety Performance Dashboard
MULTIMODAL SAFETY PERFORMANCE DASHBOARD68
Statewide policy goal/ WSDOT performance measure
Previous period
Current period Goal
Goal met
Five-year trend (unless noted)
Desired trend
HighwayTotal number of fatalities on Washington state public roads¹(Calendar years 2015 & 2016)
551 537 416²435.5
551.5
Total number of serious injuries onWashington state public roads¹(Calendar years 2015 & 2016)
2,100 2,209 1,788²1910
2210
Number of fatalities per 100 million vehicle miles traveled on Washington state public roads¹(Calendar years 2015 & 2016)
.92 .88 .709²0.75
0.93
Serious injuries per 100 million vehicle miles traveled on Washington state public roads¹(Calendar years 2015 & 2016)
3.52 3.63 3.058²3.33
3.89
Pedestrians & BicyclistsNumber of combined pedestrian and bicyclist fatalities and serious injuries¹(Calendar years 2015 & 2016)
493 592 431²403
594
FerriesPassenger injuries per million passenger miles traveled³(Fiscal years 2016 & 2017)
0.42 0.70 <1.00.3
OSHA recordable crew injuries per 10,000revenue service hours³,⁴(Fiscal years 2016 & 2017)
5.6 3.4 <7.61.5
7.6
RailTotal number of train-related fatalities in Washington state⁵(Calendar years 2015 & 2016)
27⁶ 13 N/A4.0
27.2
Aviation
General aviation fatalities in Washington state⁷(Calendar years 2016 & 2017) 7 5⁸ N/A
1.0
14.5
Public TransitFatalities involving Washingtonstate public transportation(Calendar years 2015 & 2016)
3 8 N/A3
Injuries involving Washingtonstate public transportation(Calendar years 2015 & 2016)
295 321 N/A233
330
Data source: WSDOT Office of Strategic Assessment and Performance Analysis.Notes: N/A = not available or not applicable. Asterisk (*) = goal has not been set. Dash (—) = goal was not met or is not on track in the reporting period. 1 Fatality and serious injury data for the current period was finalized in January 2017. Pedestrians include people walking or using assistive mobility devices. 2 These figures are the 2018 statewide targets for federal MAP-21 safety performance reporting, and are based on the goal of reaching zero fatalities in 2030. 3 Ferries safety records in previous GNBs had been updated quarterly but have now been changed to reflect annual periods based on fiscal years. 4 OSHA = Occupational Safety and Health Administration. 5 Count includes all fatalities involving rail (passenger rail and freight rail) in Washington State. 6 There was a large increase in trespassing incidents on tracks in Washington state. As a result, more than 80% (22 of 27) of fatalities in 2015 were due to trespassing. 7 General aviation includes all civil aviation operations other than scheduled air services. Data for general aviation fatalities has been updated since GNB 63. 8 The fatality data for the current period was confirmed and finalized for calendar year 2017.
(Three-year trend)
(Three-year trend)
Return toTable of
Contents

GNB Edition 68 | December 2017 | 9 MAP-21
68 MOVING AHEAD FOR PROGRESS IN THE 21ST CENTURY (MAP-21)
WSDOT, Metropolitan Planning Organizations setting state's MAP-21 performance targetsIn May 2017, the U.S. Department of Transportation approved the final rule under the Moving Ahead for Progress in the 21st Century (MAP-21) Act. The rule mandates that states and Metropolitan Planning Organizations (MPOs) set targets for highway system performance, freight, and Congestion Mitigation and Air Quality (CMAQ). Under this rule, recipients of federal aid transportation funds must show progress toward the following national goals:
Æ Congestion reduction – To achieve a significant reduction in congestion on the National Highway System;
Æ System reliability – To improve the efficiency of the surface transportation system;
Æ Freight movement and economic vitality – To improve the national freight network, strengthen the ability of rural communities to access national and international trade markets, and support regional economic development; and
Æ Environmental sustainability – To enhance the performance of the transportation system while protecting and enhancing the natural environment.
MAP-21 measures by program area
Federal threshold/ benchmark
MAP-21 target
WSDOT penalty (yes/no)
Target due
Existing WSDOT performance measures for this program area
Combined Rule - FINAL 23 CFR Part 490; Rule ID No. 2125-AF54
Highway System Performance (Congestion)Percent of person-miles traveled on the Interstate system providing for reliable travel
No TBD No 5/20/2018WSDOT's Corridor Capacity Report details highway travel times and congestion trends in Washington state.
Percent of person-miles traveled on the non-Interstate National Highway System (NHS) providing for reliable travel
No TBD No 5/20/2018The Corridor Capacity Report details highway travel times and congestion trends in Washington state.
National Freight Movement Program
Truck travel time reliability index No TBD No 5/20/2018The 2017 Washington State Freight System Plan lists this truck travel time reliability measure.
Congestion Mitigation and Air Quality Program
Annual hours of peak-hour excessive delay per capita No TBD No 5/20/2018
The Corridor Capacity Report details corridor delay, highway travel times and congestion trends in Washington state.
Percent of non-SOV travel No TBD No 5/20/2018The Corridor Capacity Report details multimodal measures such as drive-alone, carpool, transit, biking and walking rates.
Total emissions reduction No TBD No 5/20/2018WSDOT reports CMAQ project emissions to the federal CMAQ public access system. The 2017 Corridor Capacity Report tracks GHG emissions at the corridor level.
MAP-21 folios provide more informationTo help MPOs and other stakeholders navigate the MAP-21 rules, WSDOT has developed a number of informational folios covering various rule topics.
For links to WSDOT-specific MAP-21 folios, visit www.wsdot.wa.gov/Accountability/MAP-21.
Return toTable of
Contents

MAP-2110 | GNB Edition 68 | December 2017
MAP-21 measures by program area
Federal threshold/ benchmark
MAP-21 target
WSDOT penalty (yes/no)
Target due
Existing WSDOT performance measures for this program area
National Highway Performance Program – FINAL RULE 23 CFR Part 490; Rule ID No. 2125-AF53
National Highway System interstate pavement in good and poor condition
% of interstate pavement lane miles in poor
condition not to exceed 5%
TBD Yes 5/20/2018Pavement condition ratings from very good—very poor; see GNB 68 pp. 17, 24
National Highway System bridges classified in good and poor condition
% of structurally deficient bridges
not to exceed 10%TBD Yes 5/20/2018
Bridge condition ratings from good—poor and structurally deficient. For these and for an update on MAP-21 implications for state bridges, see GNB 66 p. 17.
Highway Safety Improvement Program – FINAL RULE 23 CFR Part 490; Rule ID No. 2125-AF49
Number of traffic fatalities on all public roads1 No 4162 Yes 8/31/2018 Traffic fatalities using the NHTSA
methodology; see GNB 66 p. 11
Rate of traffic fatalities per 100 million vehicle miles traveled (VMT) on all public roads1
No 0.709 Yes 8/31/2018 Traffic fatality rates using the NHTSA methodology; see GNB 66 p. 11
Number of serious traffic injuries on all public roads1 No 1,788.0 Yes 8/31/2018 Serious injuries using the NHTSA
methodology; see GNB 66 p. 11
Rate of serious traffic injuries per 100 million VMT on all public roads1 No 3.058 Yes 8/31/2018
Serious traffic injury rates using the NHTSA methodology; see GNB 66 p. 11
Number of non-motorist traffic fatalities plus serious injuries No 4322 Yes 8/31/2018
Non-motorist (pedestrian/bicyclist) fatalities and serious injuries using NHTSA methodology; see GNB 66 p. 11
Rate of per capita traffic fatalities for drivers and pedestrians 65 or older
Must show improvement
versus baseline
Achieve yearly
progressNo 8/31/2018
The rate of traffic fatalities for pedestrians and those 65 or older is part of Washington’s Target Zero traffic safety campaign; see targetzero.com
Rate of fatalities on high-risk rural roads1
Must show improvement
versus baseline
Achieve yearly
progressYes 8/31/2018 Traffic fatality rates on high-risk rural
roads as part of Target Zero
Highway-railway crossing fatalities3Must show
improvement versus baseline
Achieve yearly
progressNo 8/31/2018 Number of fatalities at highway-railway
crossings
Notes: 1 Performance metric includes all individuals (for example, pedestrians and bicyclists) who died or were seriously injured as a result of a motor vehicle crash in Washington. 2 Number has been rounded up. 3 Includes bicyclists and pedestrians.
WSDOT taking steps toward federal performance reporting complianceWSDOT's MAP-21 targets for Highway System Performance, National Freight Movement, CMAQ and National Highway Performance programs will be sent to the Federal Highway Administration (FHWA) in the Baseline Performance Report. The report is due October 1, 2018
and will begin a four-year reporting cycle. FHWA will examine WSDOT's interim progress toward achieving these targets when the Mid-Performance Period Progress Report is submitted (October 1, 2020).
FHWA will provide guidance to WSDOT if the agency is not showing significant progress toward its targets, or if it is showing the potential to fail making sufficient progress. WSDOT and MPOs can
work with FHWA to fine tune their targets and methods before the Final Performance Period Report is due on October 1, 2022.
FHWA will make its first determination of "significant progress" toward targets based on this final report. WSDOT may face penalties as indicated in the table below if it does not show significant progress toward achieving its MAP-21 targets.

GNB Edition 68 | December 2017 | 11 WSDOT Ferries Annual Report Summary Dashboard
WSDOT FERRIES ANNUAL REPORTSUMMARY DASHBOARD68
Policy goal/Performance measure FY2016 FY2017 GoalGoal met Comments
Capital Program and Maintenance Effectiveness
1 Percent of terminal projects completed on time1 100% 75% 90% Three of four terminal projects were completed on time in FY2017; decreased from FY2016
2 Percent of terminal projects completed on budget1,3 100% 100% 90% Four of four terminal projects were completed
on budget in FY2017; no change from FY2016
3Percent of vessel projects completed on time
A) Existing vessels2
B) New vessels100%N/A
81% 0%
75%100%
A) Thirteen of 16 vessel contracts completed on time in FY2017; decreased from FY2016 B) M/V Chimacum delivered two weeks late
4Percent of vessel contracts completed on budget3
A) Existing vessels2
B) New vessels
60%100%
88%100%
75%100%
A) Fourteen of 16 vessel contracts were on budget; increased from FY2016 B) M/V Chimacum delivered on budget
14Preliminary engineering costsA) As a percent of terminal capital project costsB) As a percent of existing vessel capital project
costs
8% 12%
11.2% 9%
<10.5% <17%
A) Preliminary engineering costs for terminal capital projects exceeded the goal in FY2017 B) Preliminary engineering costs for vessel capital projects met the goal in FY2017
15 Average vessel out of service time 9.5 weeks
9.3 weeks
<7.6 weeks
Missed vessel out of service time due to vessel mechanical issues; decreased from FY2016
Safety Performance
5 Passenger injuries per million passenger miles 0.42 0.70 <1.0Passenger injury rate was within the goal of less than one in one million; increased from FY2016
6 OSHA4 recordable crew injuries per 10,000 revenue service hours 5.6 3.4 <7.6
Met the goal for reduced OSHA recordable crew injuries; increased from FY2016
Service Effectiveness
7 Passenger satisfaction with Ferries’ staff customer service5 95% 95% 90% Exceeded passenger satisfaction for customer
service goal; no change from FY2016
8 Passenger satisfaction with cleanliness and comfort of Ferries terminals, facilities and vessels5 89% 90% 90% Met passenger satisfaction for cleanliness and
comfort goal; increased from FY2016
9 Passenger satisfaction with service requests made via telephone or Ferries website5 91% 91% 90% Exceeded goal for passenger satisfaction with
service requests; no change from FY2016
16On-time performance level (percent of trips departing within 10 minutes of the scheduled departure time)
93.9% 93.4% 95% Missed the on-time performance level goal; decreased from FY2016
17 Service reliability level (percent of scheduled trips completed) 99.5% 99.4% 99% Exceeded service reliability level goal; slightly
decreased from FY2016
Cost Containment Measures
10 Annual operating cost estimate per passenger mile compared to budgeted cost -0.5% -1.7% Within 5%
of budgetMet goal for annual operating cost per passenger mile; better than FY2016
11 Annual operating cost estimate per revenue service mile compared to budgeted cost 1.0% -0.3% Within 5%
of budgetMet goal for annual operating cost per revenue service mile; better than FY2016
12 Overtime hours as a percentage of straight time hours compared to budgeted overtime hours +0.8% +0.8% Within 1%
of budgetMet goal for annual overtime as a percentage of straight time; no change from FY2016
13 Gallons of fuel consumed per revenue service mile compared to budgeted fuel consumption -2.3% 3.4% Within 5%
of budgetMet goal for fuel consumption per revenue service mile; worse than FY2016
Data source: WSDOT Ferries.Notes: Goals above are out of sequence to better show what categories they are under. All reporting periods are based on fiscal years. Prior reporting period is FY2016 (July 2015 through June 2016) and current reporting period is FY2017 (July 2016 through June 2017). "<" means the goal is less than percent or number indicated. 1 Include preservation and improvement projects. 2 Includes preservation and improvement projects with the exception of new vessels. 3 Budget goal is based on last approved legislative budget. 4 OSHA = Occupational Safety and Health Adminis-tration. 5 Percentages include neutral responses from customers.
Return toTable of
Contents

12 | GNB Edition 68 | December 2017 Public Transit Safety – Safety
PUBLIC TRANSIT SAFETYANNUAL REPORT68
Statewide transit-related fatalities increase, injury reporting improves There were eight transit-related fatalities in 2016 across all modes (bus, light rail, trolley bus and vanpool). This is an increase of five fatalities since 2015 (see graph below). The fatality rate in 2016 was 0.06 per million vehicle revenue miles (VRM; the number of miles traveled by transit vehicles while in service), an increase of 0.04 since 2015. Over the same period, VRM increased by 3%, going from 124.0 million in 2015 to 127.6 million in 2016.
There were 321 transit-related injuries in 2016, an increase of 9% from 295 in 2015. Of the 321 injuries in 2016, 248 (77%) involved passengers either on, waiting for or exiting a transit vehicle. The injury rate in 2016 was 2.52 per million VRM, a 6% increase from 2.38 in 2015.
The increase in statewide injury reporting is largely attributable to improved injury reporting at Sound Transit, which reported 47 injuries in 2016 (an increase of 39 from the eight it reported in 2015). An emphasis on hazard management associated with new service and stations, as well as an increase in safety staff, led to improved reporting and communication regarding transit-related injuries and incidents across Sound Transit's light rail service.
There were 327 incidents involving transit in 2016, a 19% increase from 274 events reported in 2015. For reporting purposes, incidents are classified as collision, derailment, fire, security, or not otherwise classified (NOC). NOCs, which can include slips, trips and falls, electric shocks, vehicles leaving the
0
50
100
150
200
250
300
350
20162015201420132012
Transit-related injuries in Washington increase by 26; fatalities increase by five2012 through 2016; Number of injuries and fatalities; Rate of injuries and fatalities per million VRM1
Data sources: WSDOT Public Transportation Division and the National Transit Database. Notes: Fatalities are stacked on top of the bar representing injuries. For information on requirements for reporting to the National Transit Database, see Gray Notebook 63, p. 12. 1 Vehicle Revenue Miles (VRM) is the number of miles traveled by a transit vehicle while in revenue service; this measurement excludes miles traveled to or from an assigned route. In Gray Notebook 63, the injury and fatality rates were reported per unlinked passenger trip rather than per VRM; this was changed in order to better align with WSDOT’s other public transportation reporting.
1 Injuries 3 Fatalities2 Injury rate
1
0.0
0.4
0.8
1.2
1.6
2.0
2.4
2.8
4 Fatality rate
4
2
3RateNumber
Notable results Æ Washington had eight transit-
related fatalities in 2016, an increase from three in 2015
Æ Injuries reported on Washington's transit systems increased 9% between 2015 and 2016, going from 295 to 321
Æ There were 327 transit incidents in 2016, a 19% increase from the 274 incidents reported in 2015
Transit agencies report 321 injuries 2016; Injuries reported to the National Transit Database
Data sources: WSDOT Public Transportation Divisionand the National Transit DatabaseNotes: For information on requirements for reporting to the National Transit Database, see Gray Notebook 63, p. 12.
Other vehicleoccupants
(41; 12.8%)
Passengers on atransit vehicle(128; 39.9%)
Pedestrians and bicyclists(19; 5.9%)
Passengers waiting for or leaving transit
(120; 37.4%)
Employees(7; 2.2%)
Other(6; 1.9%)
.
Return toTable of
Contents

Public Transit Safety – Safety GNB Edition 68 | December 2017 | 13
WSDOT completed 32 Capital/Vehicle Maintenance Reviews in 2017. These reviews involve visually inspecting transit agencies' vehicles for functionality and reviewing maintenance records for consistency with TAM plans.
Drug and Alcohol Policy program
Federal law requires WSDOT to enforce regulations for drug and alcohol misuse in the public transportation industry. WSDOT administers the drug and alcohol policy program, working with transit agencies that receive federal grants to improve drug and alcohol program policies and implementation procedures by providing technical assistance through training, networking and policy development.
In 2017, WSDOT completed 17 drug and alcohol oversight compliance reviews. These reviews help ensure that transit agencies receiving federal grants have drug and alcohol program policies, testing procedures and recordkeeping systems that meet federal requirements.
Contributors include Mike Flood, Robert Gibson, Colin Pippin-Timco, Gayla Reese Walsh, Hiep Tran,
Kathryn Blumhardt and Helen Goldstein
roadway and train derailments in a rail yard, accounted for 66% (217) of incidents in 2016. The remaining incidents in 2016 were 87 collisions (27%), 16 fires (7%) and seven security events (2%).
WSDOT administers three transit safety programs statewideWSDOT administers three statewide transit safety and compliance oversight programs that promote safe public transportation services at Washington’s 32 transit agencies.
State Safety Oversight program
WSDOT’s State Safety Oversight program (SSO) is responsible for ensuring that rail transit agencies (which do not include Amtrak) implement system-wide safety programs.
In 2016, the Federal Transit Administration (FTA) issued new safety regulations for rail public transportation systems, which expanded the scope of SSO to include the design and construction phases of projects, in addition to SSO's existing oversight of operations. They also require SSO to be more involved in the investigation of accidents and hazards at rail transit systems. SSO is required to be in full compliance with these new regulations by April 15, 2019, and is on track to meet that deadline.
During 2017, SSO took steps to comply with the new regulations, including:
Æ Holding quarterly rail safety meetings with Sound Transit;
Æ Developing and circulating new rules to implement program changes, which include financial penalties for noncompliance; and
Æ Revising the Washington State Rail Safety Oversight Program Standard and circulating a draft to transit agencies and FTA.
Transit Asset Management
In 2016, FTA released new rules that mandate transit agencies’ processes for Transit Asset Management (TAM). Throughout 2017, WSDOT collaborated with transit agencies and metropolitan planning organizations to develop tools and methods for complying with the new rules, including:
Æ State of good repair methodology;
Æ Asset life cycle cost management tools;
Æ Asset inventory and analysis tools;
Æ TAM performance measures;
Æ Strategic approach to TAM and safety technology investment; and
Æ Preventative maintenance to reduce asset life cycle cost.
WSDOT is working with its partners to develop a document called "A Guide to Developing Your TAM Plan," which is on track to be released in spring 2018.
WSDOT owns 1,042 public transit vehiclesThese vehicles are operated by partner organizations, and have a replacement value of $110 million.

14 | GNB Edition 68 | December 2017 Worker Safety & Health – Safety
WORKER SAFETY & HEALTHANNUAL REPORT68
WSDOT's recordable incident and days away, restricted or transferred rates increase slightlyWSDOT’s agency-wide recordable incident rate (RIR) increased from 4.6 in 2016 to 4.7 in 2017, indicating an increase in the number of Occupational Health and Safety Administration (OSHA) recordable injuries per 100 workers at agency worksites. The statewide “days away, restricted or transferred,” or DART rate, also increased from 2.2 in 2016 to 2.3 in 2017. The DART rate is a subset of the RIR where the injuries sustained result in days away from work, restricted work activities or a transfer of job duties. Despite the increases in 2017, RIR and DART rates have decreased significantly (improved) in the last five years. The agency-wide RIR improved 17.5% between 2013 and 2017, and the DART rate improved 23.3% in the same time period.
More WSDOT employees participate in wellness activities and assessments, besting state averageWSDOT’s Wellness Program developed statewide challenges and hosted SmartHealth-related activities in which 52% of SmartHealth eligible (those who subscribe to the Public Employees Benefits Board which provides health insurance) WSDOT employees registered to participate in 2017, up five percentage points from 2016, when 47% registered. This exceeds the state average of 44% of employees registered to participate. SmartHealth is a voluntary, confidential health and wellness portal for state employees that focuses on positive lifestyle behavioral changes. These changes may reduce health-related costs and increase longevity. SmartHealth provides an opportunity for employees to improve their health and well-being while earning financial incentives.
Notable results Æ From 2013 to 2017, WSDOT's
agency-wide recordable incident rate improved 17.5%
Æ In 2017, 52% of WSDOT employees participated in SmartHealth activities
WSDOT’s agency-wide recordable incident and DART rates1 show five year improvement despite increases in 2016 and 2017 2013 through 2017; Average number of recordable incidents and DART rate for every 100 full-time employees per year
Incident rate 2013 2014 2015 2016 20175-year % change2
WSDOT3 5.5 5.7 4.2 4.3 4.3 -21.8%
Ferries3 6.1 4.5 4.8 5.4 5.9 -3.3%
Agency-wide3 5.7 5.4 4.3 4.6 4.7 -17.5%
DART rateWSDOT3 2.6 2.5 1.6 1.6 1.7 -34.6%
Ferries3 4.2 3.1 2.4 3.6 3.7 -11.9%
Agency-wide3 3.0 2.7 1.8 2.2 2.3 -23.3%Data source: WSDOT Office of Human Resources and Safety.
Notes: 1 The recordable incident rate is calculated as the number of recordable incidents mul-tiplied by 200,000 hours and divided by the total hours worked. The “days away” or DART rate is the count of recordable incidents involving days away, restricted duty, or job transfer, multi-plied by 200,000 hours, and divided by the total hours worked. 2 Rates: (-%) = improve; (+%) = worsen. 3 Ferries is separate due to its marine work environment; agency-wide includes Ferries and the rest of WSDOT.
Return toTable of
Contents

Worker Safety & Health – Safety GNB Edition 68 | December 2017 | 15
satisfaction," with 4.31 and 4.11, respectively. WSDOT employees' lowest scores were in "belief in company" and "fit with culture" at 3.68 and 3.59, respectively. Both are above the risk level. WSDOT strives to improve work-related outcomes.
Contributors include Ernst Stahn, Kathy Radcliff and Yvette Wixson
Well-being assessment highlights employee strengths and opportunities SmartHealth uses a Well-being Assessment (WBA) that highlights strengths and opportunities for employees to improve their health, well-being and productivity.
Seventy-one percent of SmartHealth eligible WSDOT employees completed WBAs in 2017; even though completions dropped from 76% in 2016, they are still well above the 54% average for all other state agencies. For participating in SmartHealth-related activities, 32% of eligible WSDOT employees earned sufficient points to receive a $125 credit toward their health insurance deductible in 2017, compared to 23% in 2016. In addition to the annual deductible incentive, WA Wellness has added incentives to encourage Public Employees Benefits Board (PEBB) members to complete their well-being assessment in 2018. WSDOT and WA Wellness are working together to increase SmartHealth participation.
Assessment shows less WSDOT employees were smoking in 2017
The WBA has been a tool to measure 34 different dimensions of health of state employees since 2015. In its three years of measuring, all dimensions but one, "healthy weight," have seen significant (mostly double-digit) improvements. One, "smoke-free living," improved from a score of 1 (high risk) in 2015, to a score of 2.55 (moderate risk) in 2017; in a range of 1 to 5, 5 is the best possible score. "Healthy weight" declined slightly from 2.40 in 2015 to 2.39 in 2017.
WBA "Health" measures focus on physical components. WSDOT employees' best scores were in "smoke-free living" and "drinking moderately," scoring 4.86 and 4.53, respectively. WSDOT employees' lowest scores were in "sleep" and "healthy weight," scoring 3.36 and 2.79, respectively.
Scores lower than 3.5 show varying levels of risk, but collecting health data allows WSDOT to tailor wellness programs to lessen the risk. For example, WSDOT offers a Diabetes Prevention Program which includes worksite screenings and a 16-week series of classes offering on-site education to employees who are pre-diabetic, encouraging healthy habits to prevent the onset of Type 2 Diabetes. The agency also offers mobile mammography, body composition analysis and visits from sleep specialists to address sleep apnea.
Life meaning, positive relationships matter to WSDOT employees
The WBA "Well-being" measures focus on components of wellness. For WSDOT employees, "life meaning" and "positive relationships" had the highest scores, with 4.4 and 4.36, respectively. "Positive Living" and "Energy level" had the lowest scores, at 3.76 and 3.15, respectively. WSDOT has been proactive in helping employees develop higher energy levels through such programs as a "Take 9 at 9" stretching program that is offered at WSDOT locations statewide.
The WBA "Productivity" measures examine work-related outcomes. WSDOT employees highest scores were in "self-leadership" and "job
Demographics show WSDOT employees are older, mostly male
The WBA assessment compared some of WSDOT's demographics to those of other state agencies. In 2017, the gender of WSDOT employees was 75% male and 25% female, compared to 43% male and 57% female for all other state agencies. WSDOT employees tend to be older than those of other state agencies, with the highest percentage of its employees (46%) falling into the 51-64 age range. By comparison, the highest percentage of employees at all other agencies (36%) are in the 36-50 age range.
Age range in years and by percentage; Gender by percentage of population
Age range WSDOT Others1
18 to 35 15% 24%
36 to 50 33% 36%
51 to 64 46% 35%
> 65 5% 5%
Male 75% 43%
Female 25% 57%Data source: SmartHealth Well-being Assessment 2017.
Note: 1 All other state agencies.

16 | GNB Edition 68 | December 2017 Pavement – Preservation
ASSET MANAGEMENT: PAVEMENT ANNUAL REPORT68
Pavement conditions decline slightly in 2016 In 2016, 92.2% of WSDOT-managed pavement lane miles were in fair or better condition, declining slightly from the 93.1% reported in 2015. Despite this drop, the agency met its goal of having at least 90% of pavement lane miles in fair or better condition.
WSDOT determined that 91.7% of vehicle miles traveled in 2016 were on pavement in fair or better condition, a decrease from 93.0% in 2015. Weighting measures by vehicle miles traveled (VMT) allows WSDOT to better capture the experience of the typical road user.
The agency evaluates the condition of asphalt and concrete pavement on state-managed roadways annually using three indicators:
Æ Surface cracking (an indicator of structural deterioration);
Æ Rutting (which is monitored for safety and structural reasons); and,
Æ Smoothness (measured using the International Roughness Index).
These criteria are used to classify pavement conditions into four categories: good/very good, fair, poor and very poor.
WSDOT meets targets for short-term pavement conditions despite decline; long-term measures improve2015 and 2016
Agency Goal2
Goal met3 Trend
Desired trendPAVEMENT ANNUAL PERFORMANCE MEASURES1 2015 2016
Short term
Percent of pavement in fair or better conditionMeasured for asphalt and concrete pavement (chip seal data was not collected in 2015 or 2016 due to budget constraints). Condition is shown by lane miles and by vehicle miles traveled to reflect road use.
Lane Miles 93.1% 92.2%
90.0% VMT 93.0% 91.7%
Long term
Asset Sustainability Ratio4 Years of pavement service life added to the pavement network through rehabilitation in a given year divided by the service life consumed in that same year.
0.57 0.68 0.90 Remaining Service Life4 Average percentage of original total useful life remaining before rehabilitation or replacement is needed; average years remaining before rehabilitation or replacement is needed.
47.1% 48.6% 45% to 55%
(7.4 yrs) (7.6 yrs)
Deferred Preservation Liability (backlog)An estimate of the accumulated cost (in current dollars) to fund the backlog of past-due (deferred) pavement rehabilitation work.
$403 million
$330 million $0
Data source: WSDOT Pavwement Office.Notes: 1 Calculations for all measures, excluding percent of pavement in fair or better condition, include all pavement types (asphalt, chip seal and concrete). 2 Agency also has goals for Results Washington and the Governmental Accounting Standards Board—see pp. 24-25 for more information. 3 Check indicates goal met, dash indicates goal not met. 4 Measure is weighted by vehicle miles traveled to better capture the typical road user’s experience.
Notable results Æ WSDOT pavement lane miles in fair
or better condition declined, going from 93.1% in 2015 to 92.2% in 2016
Æ Estimated cumulative savings from resurfacing asphalt pavement with chip seal reached $100 million in 2016
Æ WSDOT's pavement Deferred Preservation Liability decreased from $403 million in 2015 to $330 million in 2016
Æ The average remaining service life of WSDOT pavement increased from 47.1% in 2015 to 48.6% in 2016
Return toTable of
Contents

Pavement – Preservation GNB Edition 68 | December 2017 | 17
GOOD/VERY GOOD 75.8% 73.8%
This pavement is in good conditionwith minimal deterioration
Road users experience a smooth roadwith minimal cracks, ruts or potholes
Managing pavement by lowest life cycle cost (LLCC) means choosing the most cost-effective time to resurface or repair a road—when the surface shows wear, but before the underlying structure is damaged
Preventive preservation (maintenance) repairs at this stage can maximize the road’s service life
Waiting to repair a road until it is inpoor condition costs more, because damage to the underlying structure requires more expensive pavement restoration (1.5 to 2 times the LLCC)
Poor and very poor roads cause morewear on vehicles and higher fuel use
FAIR 16.1% 18.4%
POOR 5.2% 5.8%
WHAT DRIVERS SEE WHAT IS HAPPENING 2012 2016 Trend1 trend
Data source: WSDOT Materials Lab, WSDOT Capital Program Development and Management.Notes: Percentages may not add to 100 due to rounding. Condition figures do not include chip seal pavement, also known as Bituminous SurfaceTreatments (BST), which has not been evaluated since 2010 due to budget reductions. Chip seal pavement accounts for 35% of lane miles onthe state’s highway network (up from 33% in 2015), yet because chip seal roads have less traffic than asphalt or concrete, they account for only 7% of the vehicle miles traveled on WSDOT’s roadway network. Projections of future conditions are not included in this edition of the Gray Notebook because WSDOT’s Transportation Asset Management Plan is still in development. 1 Trends are based on observed condition trends between 2012 and 2016. 2 When pavement condition is weighted by VMT, roadways with more traffic are weighted more heavily than less traveled roads. Weighting pavement condition by VMT better accounts for the higher costs to maintain and preserve roads with more traffic.
Delaying rehabilitation of pavement in poor condition can lead to deep pavement failure which requires more expensive reconstruction (3 to 4 times the LLCC)
This road requires reactive repairs to hold it together until reconstruction, which is not a good long-term cost saving strategy
VERY POOR 3.0% 2.0%
Percentage of WSDOT’s pavement in good condition decreases; percentage in poor condition increasesActual values for 2012 and 2016; Percent of lane miles and vehicle miles traveled (VMT) by condition category; Characteristics of pavement at each condition
Desired
73.6% 73.3% By lane miles
By VMT2
18.4% 18.4% By lane miles
By VMT2
By lane miles By VMT2 5.9% 6.6%
By lane miles By VMT2 2.1% 1.7%
Pavement – Preservation18 | GNB Edition 68 | December 2017
The categories very good, good and fair show pavement conditions that are considered adequate. Pavement in poor condition is deficient and needs repair, while very poor condition indicates failure and the need for substantial restoration and possibly reconstruction.
These short-term condition indicators provide a snapshot of the current state of the pavement network, but they do not inform WSDOT about long-term trends or capture the impacts of long-term investments on the pavement network.
For example, resurfacing a section of asphalt pavement with new asphalt would take it from poor to fair or better condition, as would resurfacing it with chip seal. However, while chip seal can increase service life by an average of nine years, resurfacing with new asphalt typically adds about 14 years. Unlike the short-term condition ratings, long-term pavement performance indicators reflect this difference, with asphalt resurfacing resulting in larger increases in Remaining Service Life and the Asset Sustainability Ratio than chip seal resurfacing.
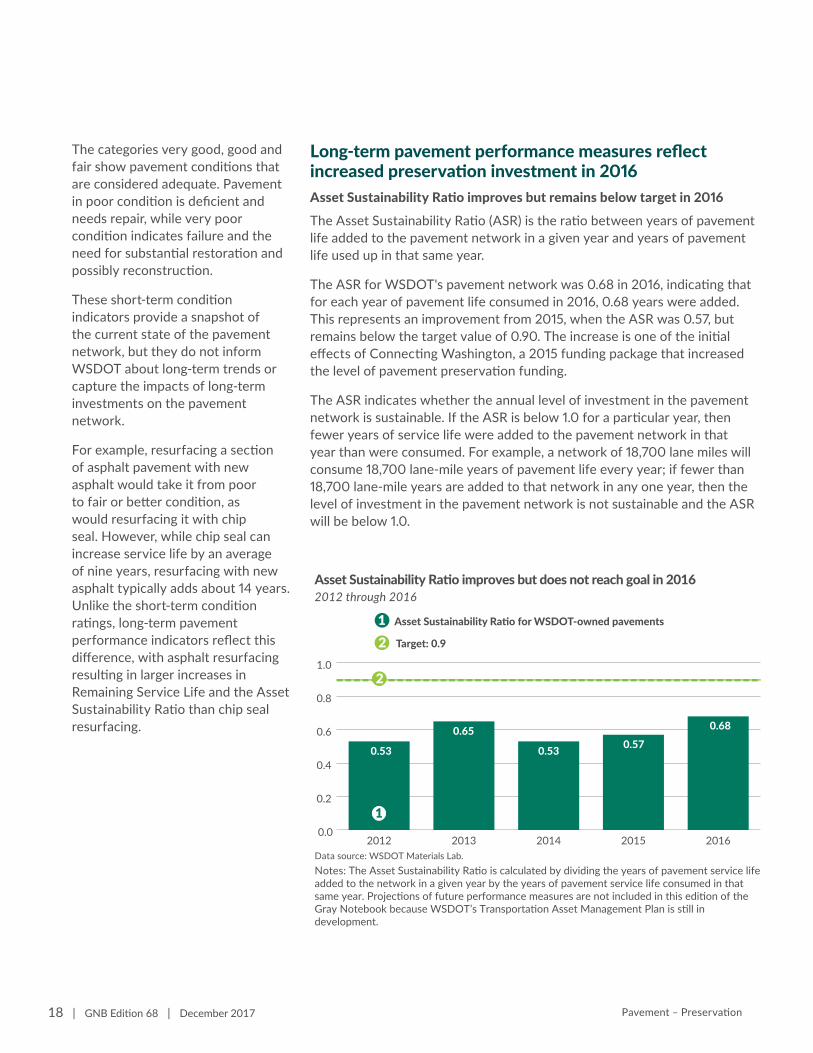
Asset Sustainability Ratio improves but does not reach goal in 20162012 through 2016
Data source: WSDOT Materials Lab.Notes: The Asset Sustainability Ratio is calculated by dividing the years of pavement service lifeadded to the network in a given year by the years of pavement service life consumed in that same year. Projections of future performance measures are not included in this edition of the Gray Notebook because WSDOT’s Transportation Asset Management Plan is still in development.
0.0
0.2
0.4
0.6
0.8
1.0
20162015201420132012
1 Asset Sustainability Ratio for WSDOT-owned pavements
2 Target: 0.9
1
2
0.68
0.53
0.65
0.53 0.57
Asset Sustainability Ratio improves but remains below target in 2016
The Asset Sustainability Ratio (ASR) is the ratio between years of pavement life added to the pavement network in a given year and years of pavement life used up in that same year.
The ASR for WSDOT's pavement network was 0.68 in 2016, indicating that for each year of pavement life consumed in 2016, 0.68 years were added. This represents an improvement from 2015, when the ASR was 0.57, but remains below the target value of 0.90. The increase is one of the initial effects of Connecting Washington, a 2015 funding package that increased the level of pavement preservation funding.
The ASR indicates whether the annual level of investment in the pavement network is sustainable. If the ASR is below 1.0 for a particular year, then fewer years of service life were added to the pavement network in that year than were consumed. For example, a network of 18,700 lane miles will consume 18,700 lane-mile years of pavement life every year; if fewer than 18,700 lane-mile years are added to that network in any one year, then the level of investment in the pavement network is not sustainable and the ASR will be below 1.0.
Long-term pavement performance measures reflect increased preservation investment in 2016

Pavement – Preservation GNB Edition 68 | December 2017 | 19
Remaining Service Life improves
The Remaining Service Life (RSL) of state-owned pavement increased between 2015 and 2016, going from 47.1% to 48.6%. The RSL remained within WSDOT's target range of 45% to 55%.
Remaining service life is a measure of the average remaining pavement life across the roadway network. It is calculated by first estimating the number of years remaining before the condition of a pavement section is expected to become unacceptable (poor or very poor), and then dividing by the pavement section’s total expected lifetime. This number is then averaged over all of the pavement sections in the network to yield the statewide RSL.
Preservation backlog drops in 2016
WSDOT's pavement Deferred Preservation Liability (also known as the pavement preservation backlog) decreased from $403 million in 2015 to $330 million in 2016. This reduction was due partly to the completion of a large transportation project on Interstate 405, as well as to the increase in preservation funding that accompanied Connecting Washington. WSDOT’s goal is to have a Deferred Preservation Liability of $0.
WSDOT uses Deferred Preservation Liability—an estimate of the accumulated cost of performing all past-due pavement rehabilitation work—to track how much investment is needed to restore the entire pavement network to fair or better condition.
2
Remaining service life of WSDOT pavements sees improvement in 20162012 through 2016; Remaining service life shown as a percent of original pavement life
Data source: WSDOT Materials Lab.Notes: For 2016, the Remaining service life of 48.6% is equivalent to an average of 7.6 years remaining before rehabilitation is needed. Projections of future performance measures are not included in this edition of the Gray Notebook because WSDOT’s Transportation Asset Management Plan is still in development.
0%
20%
40%
60%
80%
100%
20162015201420132012
1
1 Remaining service life as a percentage of original pavement life
2 Target range: 45% to 55%
48.6%47.1%46.9%46.1%47.3%
WSDOT’s Pavement Deferred Preservation Liability decreases in 20162012 through 2016; Dollars in millions
Data source: WSDOT Materials Lab.Notes: Deferred Preservation Liability is defined as the funding necessary to address past due pavement rehabilitation for all pavement types. WSDOT’s goal is to have $0 in Deferred Preservation Liability. Projections of future performance measures are not included in this edition of the Gray Notebook because WSDOT’s Transportation Asset Management Plan is still in development.
$0
$100
$200
$300
$400
$500
20162015201420132012
1
1 Deferred Preservation Liability (backlog) for WSDOT-owned pavement
$330
$403$351$343
$391

Pavement – Preservation20 | GNB Edition 68 | December 2017
WSDOT uses strategic asset management to maintain pavementsWSDOT manages almost 18,700 lane miles of highway pavement (excluding bridge decks), as well as just over 2,000 lane miles of ramps and special use lanes, and approximately 7,500 lane miles of shoulders.
WSDOT uses a Practical Solutions approach to managing its pavement assets by focusing on lowest life cycle cost (LLCC), aiming to achieve the highest benefit at the lowest cost over the life of the pavement. In support of this goal, WSDOT uses strategically timed maintenance treatments to extend the lifespan of its asphalt pavements.
Optimally timed maintenance treatments can reduce the average annual cost of a section of pavement substantially. For example, a one-lane-mile section of asphalt pavement costs $250,000 to resurface. Under certain conditions, spending $20,000 on maintenance can increase the lifespan of a lane mile of pavement from 12 years to 15, reducing the average annual cost of the pavement by 12% overall.
WSDOT has been using strategic maintenance (the practice of using capital budget funds to perform maintenance at a strategic time) to cost-effectively increase pavement life spans since 2010. Evaluating the effect of different pavement treatments on the average annual cost of the pavement has led the agency to increase its use of strategic maintenance over the last several years (see chart at right).
Preliminary study results support use of preventive maintenance treatmentsPreliminary results from WSDOT's research into preventive maintenance treatments (such as sealing cracks, chip sealing short sections of pavement, and using asphalt to either patch the surface of a roadway or replace a section of pavement) show that all of the studied treatments are effective. These treatments can stabilize the condition of pavement sections for between two and four years, often reducing the annual cost by between 10% and 15%.
WSDOT has been studying the use and timing of preventive treatments to extend pavement service life since 2012. As of 2017, the agency has tested a variety of preventive maintenance treatments at 69 quarter-mile test sites (located throughout the state on roads with a variety of weather and traffic conditions). WSDOT will continue to monitor performance data from these test sections for several more years to compare the effectiveness of each type of maintenance treatment. A preliminary Research Report on these tests was published in October 2017, and is available at bit.ly/PrevMaintReport.
WSDOT developing Transportation Asset Management Plan
WSDOT is currently developing an Transportation Asset Management Plan in order to comply with federal requirements first established under the Moving Ahead for Progress in the 21st Century Act (MAP-21; see pp. 9-10). As part of this development process, which also includes establishing performance measures and targets, the agency must estimate future performance based on available funding and investment strategies. Because the process is not yet complete, projected pavement performance measures are not included in this edition of the Gray Notebook.
Preventive Maintenance: WSDOT’s policy is to not program any large-scale pavement resurfacing projects without first using a maintenance treatment. This policy started in 2014 and has been very successful, with maintenance treatments extending pavement life by up to four years.
Results WSDOT GoalPRACTICAL SOLUTIONS
WSDOT using more strategic maintenance Lane miles on which WSDOT used strategic maintenance, by biennium.
Biennium Maintenance lane miles
2009-2011 599
2011-2013 1,118
2013-2015 1,701
2015-2017 3,374Data source: WSDOT Pavement Office.

Pavement – Preservation GNB Edition 68 | December 2017 | 21
WSDOT makes pavement asset management decisions (such as when to re-surface a section of pavement) based on data collected annually by a van equipped with lasers, cameras and other equipment (see image at right).
WSDOT analyzes the data collected and uses it to assign condition ratings for roughness, cracking and rutting to every one-tenth of a mile segment of state-owned pavement. WSDOT then uses this data to forecast the year in which each segment of pavement will be due for rehabilitation.
This level of annual pavement monitoring, which costs approximately $55 per lane mile every year, is extremely cost-effective; the data it generates inform decisions about renewal and preservation for the entire pavement network, which costs an
average of $13,400 per lane mile. Monitoring provides WSDOT the information needed to rehabilitate pavement at the optimal time—when the pavement's condition makes it necessary, but not before.
Due to the high variance in the lifespans of asphalt and chip seal pavements, simply scheduling each section of pavement to be resurfaced at the end of its average lifespan is inefficient. Asphalt pavement lasts an average of 14 years before needing rehabilitation; however, resurfacing a 14-year-old section of asphalt pavement that would have remained in acceptable condition for a fifteenth year increases the average annual cost per lane mile from $16,800 to $18,000 (see chart below). Conversely, rehabilitating pavement too late causes the pavement to deteriorate further, increasing the cost of the rehabilitation process.
WSDOT monitors pavement conditions to help determine optimal time for rehabilitation treatments
Average annual cost of one lane mile of pavement depends on life span Average annual cost of one lane mile of asphalt or chip seal pavement by lifespan of the pavement.
Asphalt Chip Seal
Life Average Annual Cost Life Average Annual Cost
13 years $19, 200 8 years $6,250
14 years $18,000 9 years $5,600
15 years $16,800 10 years $5,000
Data source: WSDOT Pavement Office.
Pavement treatmentsPavement treatments are divided into three categories:
Æ Maintenance treatments, such as crack sealing, are the least expensive, but also provide the shortest extension of pavement life.
Æ Rehabilitation, such as resurfacing asphalt pavement, is more expensive than maintenance but can extend pavement life by 10 to 20 years, depending on surface type.
Æ Reconstruction, the most expensive option, extends pavement life by between 15 and 50 years, depending on surface type.
WSDOT's pavement monitoring van.
Results WSDOT GoalPRACTICAL SOLUTIONS
Annual pavement monitoring supports Practical Solutions by providing data that allows WSDOT to rehabilitate each lane mile of pavement at the optimal time.

Pavement – Preservation22 | GNB Edition 68 | December 2017
In 2016, WSDOT's estimated cumulative savings from resurfacing asphalt roads with chip seal surfacing (also known as Bituminous Surface Treatment, or BST) reached $100 million. The agency has converted almost 2,000 lane miles of asphalt pavement to chip seal since 2010—approximately two-thirds of the 3,000 lane miles planned. Approximately 35% of WSDOT's pavement network is now made up of chip seal pavement (see graph at left).
Roads resurfaced with asphalt last about twice as long as those resurfaced with chip seal, but the cost of chip seal resurfacing is only about one-fifth the cost of asphalt resurfacing. WSDOT estimates that it saves approximately $13,000 per year for each lane mile of asphalt pavement that is resurfaced with chip seal.
Because of this substantial savings, WSDOT has prioritized resurfacing asphalt pavement with chip seal where appropriate (roads with average daily traffic over 10,000 vehicles, roads in urban areas and roads on which trucks frequently make turns are generally not appropriate for chip seal resurfacing). The graph below shows the cumulative savings from chip seal resurfacing since 2010.
WSDOT expects to finish converting the remaining 1,000 lane miles by 2024. Once all 3,000 lane miles have been converted to chip seal, the agency
Estimated cumulative savings from resurfacing asphalt pavement with chip seal reach $100 million
Chip seal comprises 35.2% of WSDOT pavement 2016; Lane miles of WSDOT-owned pavements by surface type
Data: WSDOT Highway LogNotes: Includes bridge decks. Does not include on-ramps, off-ramps, collector/distributor lanes or some special-use lanes (such as chain-up lanes, two-way turning lanes, bicycle lanes, transit lanes and truck climbing lanes).
Concrete 2, 455 lane miles
(13.1%)
Asphalt9,660 lane miles(51.7%)
Chip Seal 6,580 lane miles (35.2%)
Chip Seal ResurfacingResurfacing an asphalt road with chip seal involves coating the surface of an existing road with a thin layer of liquid asphalt emulsion and then covering it with gravel chips that bond to the surface.
Estimated savings from chip seal conversion reach $100 million in 2016 2010 through 2016; Dollars in millions
Data source: WSDOT Pavement Office Notes: Savings are calculated based on an estimate of $13,000 saved per lane mile per year.
$0
$5
$10
$15
$20
$25
$30
2016201520142013201220112010
1 Annual estimated savings from resurfacing asphalt pavement with chip seal
2 Cumulative estimated savings from resurfacing asphalt pavement with chip seal
$0
$20
$40
$60
$80
$100
$120
2
Annual Cumulative
1

Pavement – Preservation GNB Edition 68 | December 2017 | 23
Results WSDOT GoalPRACTICAL SOLUTIONS
Resurfacing asphalt pavement with chip seal supports Practical Solutions by reducing the average annual cost of resurfaced pavement.
expects to save $40 million annually. The progress of the conversion effort is shown in the figure above. This conversion process will take WSDOT's pavement network from 25% chip seal in 2010 to 40% seal in 2024.
WSDOT is evaluating two new pavement technologies that may result in more cost-effective methods for measuring concrete pavement thickness and asphalt pavement density.
The thickness of a concrete slab has a significant impact on the performance of concrete pavement; therefore accurately measuring the thickness of a newly constructed concrete slab is essential.
The current method for measuring concrete thickness requires removing a 6-inch diameter core from the pavement, leaving behind a hole in the new pavement that must be filled. WSDOT is investigating the cost-effectiveness of using magnetic inductance tomography (MIT) to determine the thickness of new concrete pavement instead. MIT is
WSDOT resurfaces nearly 2,000 lane miles of asphalt pavement with chip seal 2010 through 2016; lane miles of pavement resurfaced
Data source: WSDOT Pavement Office.
0
100
200
300
400
600
700
2016201520142013201220112010
1 Lane miles of asphalt pavement resurfaced with chip seal annually
2 Cumulative lane miles of asphalt pavement resurfaced with chip seal
0
300
600
900
1200
1500
1800
2100
0
300
600
900
1,200
1,500
1,800
2,100
2
1
Annual Cumulative
500
WSDOT researching new technologies to help better evaluate pavement construction at a reduced cost
Results WSDOT GoalPRACTICAL SOLUTIONS
Investigating new technologies supports Practical Solutions by ensuring that WSDOT is using the best and most cost-effective methods available.
much quicker than coring and does not damage the pavement.
WSDOT is also evaluating a potential new method for measuring the density of new asphalt pavement, which significantly effects the pavement's lifetime performance.
A rolling density meter (RDM) can measure the density of asphalt pavement using ground-penetrating radar much more quickly than the current method, which requires using a nuclear densometer. Complying with the regulations regarding handling nuclear material increases the cost of using nuclear densometers. Because there are no special regulations on the use of ground-penetrating radar, using an RDM may improve WSDOT’s ability to ensure that new asphalt pavement is compacted to the proper density at a lower cost.
WSDOT receives third Perpetual Pavement Award In 2016 WSDOT received a Perpetual Pavement Award from the Asphalt Pavement Alliance for a 5.01-mile section of State Route 512 in Pierce County. The 2016 award was WSDOT's third Perpetual Pavement Award.
To qualify for a Perpetual Pavement Award, a pavement must be at least 35 years old and have never suffered a structural failure. It must also demonstrate excellence in design, quality construction, and high value to taxpayers.

Pavement – Preservation24 | GNB Edition 68 | December 2017
Leading indicator
Control the percent of National Highway System pavement, state- and locally-owned, in poor condition from increasing over 10% by 2020.
Status: On plan (green)
Strategies:1. Convert asphalt surfaces to
chip seal: The life-cycle annual cost for a chip seal surfaced pavement is approximately one-third the cost of an asphalt surface. As of 2016, the estimated cumulative savings from chip seal conversion is $100 million.
2. Implement Practical Solutions: WSDOT uses the practical design approach to make project decisions that focus on the specific problem that the project is intended to address. This performance-based approach looks for lower cost solutions in order to meet specific performance criteria.
3. Strategic pavement maintenance: Performing maintenance treatments at the appropriate time (before rehabilitation is needed) can extend pavement life by up to four years and lower annual costs. WSDOT’s policy is that no pavement rehabilitation takes place until strategic maintenance has been used to extend pavement life.
Percent of NHS pavement in poor condition (by VMT)WSDOT-owned 6.6%Locally owned 11.4%Total 7.4%
Pavement condition reporting requirementsCondition targets by performance reporting system
Reporting system Target Included pavement
Moving Ahead for Progress in the 21st Century Act (MAP-21)
Not yet establishedAll NHS pavement (WSDOT- and locally owned)
Results Washington<10% of pavement (by VMT) in poor condition
All NHS pavement (WSDOT- and locally- owned)
Governmental Accounting Standards Board
>85% of VMT traveled on pavement in fair or better condition1
All WSDOT-owned pavement (NHS and non-NHS)
Data source: WSDOT Office of Strategic Assessment and Performance Analysis, WSDOT Capital Program Development and Management. Note: NHS = National Highway System.1 In Gray Notebook 60 and Gray Notebook 64, the GASB target was incorrectly listed as "85% of state-owned lane miles in fair or better condition."
WSDOT meets Results Washington targetResults Washington, Gov. Jay Inslee’s performance management system for the state, includes a measure about the condition of state- and locally-owned pavement on the National Highway System (NHS). The target for this measure is to have no more than 10% of pavements (weighted by vehicle miles traveled) on state and NHS roads in poor condition by 2020. In 2016, 7% of NHS pavements were in poor or very poor condition—the same as in 2015. See box at left for more information.
WSDOT working to meet MAP-21 requirementsThe Federal Highway Administration has released two rules under the Moving Ahead for Progress in the 21st Century Act (MAP-21) that apply to pavement. One rule requires states to develop and implement a risk-based asset management plan, referred to as the Transportation Asset Management Plan (TAMP). The TAMP covers a 10-year period and includes all roadways on the National Highway System. The rule requires each state to submit an initial TAMP by April 30, 2018, and a final plan (following a review process) by June 30, 2019. WSDOT's TAMP is currently in development.
A second rule related to pavement defines the methods and minimum acceptable criteria to be used to measure pavement condition on the NHS. The rule also requires states to coordinate with metropolitan planning organizations (MPOs) to set pavement performance targets for both interstate and non-interstate NHS roadways (WSDOT- and locally-owned).

Pavement – Preservation GNB Edition 68 | December 2017 | 25
The National Highway System (NHS)The National Highway System (NHS) is a network of strategic highways in the United States, and includes both state and local highways as well as roads serving major airports, ports, rail and/or truck terminals, and other transport facilities. Washington’s NHS network includes 14,789 lane miles of pavement, of which 77% is state-owned roadway and 23% is owned by local agencies. The pavement performance targets in both Results Washington and MAP-21 (see p. 24) apply specifically to pavement on the NHS.
WSDOT has collaborated with Washington state MPOs to establish multiple teams to work on setting targets for MAP-21. These teams are analyzing proposed targets and their implications for WSDOT, MPOs, and the 102 cities and counties that own pavement on the NHS; the teams will also make recommendations based on their analyses. For more information on MAP-21, see pp.9-10.
WSDOT following Governmental Accounting Standards Board directionThe state is also required to follow Generally Accepted Accounting Principles, which include pronouncements from the Governmental Accounting Standards Board (GASB). This board governs the financial reporting of
infrastructure assets, and requires WSDOT to maintain an up-to-date inventory of assets and to document condition assessments.
For the purpose of GASB reporting, WSDOT's pavement condition goal is to have 85% of state-owned pavement weighted by VMT be in fair or better condition. WSDOT submits reports to GASB on a two-year cycle. In 2015, the most recent year in which WSDOT reported to GASB, 93.2% of pavement weighted by VMT was in fair or better condition, exceeding the target. Pavement conditions for GASB are evaluated based on roughness (assessed using the International Roughness Index), cracking and rutting.
Contributors include Jianhua Li, David Luhr, Tim Rydholm, Jeff Uhlmeyer, Kim Willoughby,
Helen Goldstein and Joe Irwin

26 | GNB Edition 68 | December 2017 Highway Maintenance – Preservation
ASSET MANAGEMENT: HIGHWAYMAINTENANCE ANNUAL REPORT68
Extreme weather and incidents contribute to declining highway conditions in 2017 WSDOT met 77% of its highway maintenance asset condition targets in 2017, a 16 percentage point decline from the 93% achieved in 2016. An unusually cold, wet, and extended 2016-2017 winter, coupled with an increase in damage to roadway facilities prompted WSDOT to redirect allocated funds to prioritize safety-related work in 2017. Additionally, the agency redirected funds to cover unexpectedly high third-party repair costs ($27.5 million), which are incurred when travelers cause damage to WSDOT property such as guardrail, signs, lighting systems or other equipment.
During the 2016-2017 winter, snow and ice management expenses increased by $9 million (10.6%). This is in addition to the $85 million planned for the 2015-2017 biennium for snow and ice management, for a total of $94 million. During significant winter weather events, crew time and material use typically increase rapidly, stressing the budget.
WSDOT has an agency maintenance backlog of approximately $98 million per biennium. While funding has remained relatively consistent, it does not keep pace with new construction projects or increasing unavoidable costs such as electrical bills, stormwater assessments and other fees paid to local utility providers. This leads to deferring maintenance activities and reducing levels of service, making it more difficult for WSDOT to achieve performance targets. The agency evaluates task completion by comparing the number of tasks planned each year for a specific maintenance activity to how many of those tasks were completed. To see a table that shows the desired results as indicated by the level of service and the task completion percentage for selected assets, go to http://bit.ly/MaintTaskComp.
WSDOT meets 20 of 26 maintenance targets in 2017The table on the next page shows maintenance activities, ordered from highest to lowest priority; Level of Service (LOS) scores; and funded levels, condition targets for WSDOT. LOS scores use a letter grading scale, with A being the highest and F being the lowest.
The following LOS activities—which were heavily affected by the long 2016-2017 winter as well as recruitment and retention issues—received letter grades below target levels:
Æ Regulatory/Warning Sign Maintenance missed its target of a C, receiving a D. This is a result of third-party damage along with allocated preservation funding failing to keep up with the demand. This contributes to a growing backlog.
Æ Slope Repair Maintenance missed its target of an A, receiving a B rating. This is primarily a result of natural disasters such as landslides, floods and excessive erosion.
Notable results Æ WSDOT met 77% of its highway
maintenance asset condition targets in 2017, down from the 93% achieved in 2016
Æ Maintenance crews processed approximately 188,000 maintenance records in 2017 using the Highway Activity Tracking System
Æ A customer survey showed 73% of respondents were generally satisfied with the level of overall highway maintenance in 2017
A WSDOT maintenance crew performs snow and ice management on Snoqualmie Pass.
Return toTable of
Contents

Highway Maintenance – Preservation GNB Edition 68 | December 2017 | 27
WSDOT meets 77% of highway maintenance asset condition targets2015-2017; Funded level asset condition targets and scores achieved
Funded level (MAP LOS target)
2015 results
2016 results
2017 results
Special Bridges and Ferry Operations1 A A A A
Traffic Signal System Operations C B C B
Snow and Ice Control Operations A A A A
Bridge Cleaning B B B B
Urban Tunnel System Operations B B B
Regulatory/Warning Sign Maintenance C D C D
Intelligent Transportation Systems A A B A
Slope Repairs A B A B
Catch Basins and Inlets Maintenance A A B A
Barrier Maintenance A B A B
Pavement Striping Maintenance B A B A
Raised/Recessed Pavement Marking Maintenance C C C C
Vegetation Obstruction Control C C A C
Rest Area Operations B B B B
Sweeping and Cleaning A A A C
Highway Lighting Systems A B B C
Ditch Maintenance B B A B
Guidepost Maintenance D D D D
Stormwater Facility Maintenance A A A A
Culvert Maintenance D D B C
Pavement Marking Maintenance D D C F
Shoulder Maintenance C C C C
Noxious Weed Control B B B A
Guide Sign Maintenance C C C C
Nuisance Vegetation Control D C D C
Landscape Maintenance D D C C
Litter Pickup D D D D
Percent of targets achieved or exceeded 85% 93% 77%
Percent of targets missed 15% 7% 23% Data source: WSDOT Maintenance Office.Notes: The 27 maintenance activities are listed in prioritized order. Highlighted boxes indicate failing scores. Asset condition Level of Service (LOS) is affected by maintenance activity, rehabilitation/reconstruction of highway infrastructure, third party damage, disaster events and new construction projects. LOS assessments occur throughout the reporting year, and scores are based on the asset condition at the time of assessment. 1 This activity now includes the Keller Ferry. 2 Urban Tunnel Systems Operations is represented by the I-90 tunnel which was under construction during the reporting period and is not included in calculations of targets achieved; hence, a total of 26 maintenance activities were scored.
Æ Pavement Marking Maintenance missed its target of a C, receiving an F rating. This work suffered due to the wet spring in much of the state and recruitment and retention issues on the pavement marking crews.
Æ Barrier Maintenance missed its target of an A, receiving a B. This is primarily a result of the above-average amount of third-party damage.
Æ Sweeping and Cleaning missed its target of an A, receiving a C. This is primarily a result of natural disasters.
Æ Highway Lighting Systems missed its target of an A, receiving a C rating. WSDOT’s goal is to perform preventative maintenance on one-quarter of the roadway light structures in the state each year. In 2017, this work was deferred when funds were redirected to address roadway safety tasks, resulting in an increase of lighting systems that require repairs.
Results WSDOT GoalPRACTICAL SOLUTIONS
WSDOT's Maintenance Office demonstrated Practical Solutions by converting roadway lighting systems to longer-lasting, more cost-effective LED lights and removing lights when they are no longer necessary.
N/A2

Highway Maintenance – Preservation28 | GNB Edition 68 | December 2017
WSDOT conducted a maintenance customer service survey in 2017; the sixth in a series (1996, 2000, 2005, 2010, 2012 and 2017). Surveys are conducted over the telephone, with the exception of the 2010 survey which was web-based and had a low response rate.
The surveys are designed to evaluate customer satisfaction and obtain customer input regarding maintenance activities and public priorities. WSDOT uses the survey results to help prioritize and align investment decisions in the maintenance program. The full results of this survey can be found at http://bit.ly/MaintenanceSurvey2017.
WSDOT reviews the key findings of its 2017 customer survey
Customers were asked about their satisfaction with the current level of
overall highway maintenance as well as individual maintenance activities.
Seventy-three percent of the 750 survey respondents were generally satisfied with the level of overall highway maintenance, a slight decrease from 74% in the 2012 survey.
Respondents were also asked to rate highway maintenance conditions on a scale of very poor to excellent. Fifty-two percent of the respondents rated Washington’s overall highway maintenance above average or excellent. Thirty-eight percent of respondents gave WSDOT an average rating. A small percentage rated overall highway maintenance as fairly poor (8%) or very poor (3%). Roadway surfaces are still the top improvement desired by 74% of respondents.
Survey shows customer satisfaction has improved since 2012 2005, 2012, 2017; Maintenance activities ranked by importance; Percent of customers satisfied
Maintenance activity 2005 2012 2017
1 Roadway Surfaces 76% 64% 72%
2 Road Stripes and Pavement Markers 78% 71% 80%
3 Drainage Features 79% 75% 80%
4 Snow and Ice Removal 71% 78% 86%
5 Roadway Signs 91% 90% 95%
6 Roadside Litter Removal 74% 77% 78%
7 Guardrail 88% 90% 89%
8 Traffic Signals 77% 85% 92%
9 Highway Lighting 76% 80% 87%
10 Rest Areas 73% 86% 87%
11 Roadside Vegetation 70% 75% 83%
Data source: WSDOT Maintenance Office.Note: The 2010 survey results are not used for comparison because it was the only survey conducted via the internet instead of via telephone, resulting in a much lower response rate.
Maintenance customer survey shows uptick in satisfaction with highway roadway surface, snow and ice removal
A WSDOT maintenance crew applies chip seal on U.S. Route 395. Chip seal, or bituminous surface treatment, is a cost-effective method used to extend the life of roads.
A WSDOT maintenance crew performs emergency repairs on State Route 534 after a sinkhole damaged the highway.

Highway Maintenance – Preservation GNB Edition 68 | December 2017 | 29
WSDOT maintenance emergency response rating improves in 2017
In general, customers' opinions of highway maintenance crew emergency response are extremely positive and have improved since 2012 (see graphs at right). Ninety-seven percent rate the agency as average or better. The percentage of respondents rating the agency as “excellent” have increased from 19% to 29% since 2012.
Highway Activities Tracking System big help at WSDOTWSDOT continues to develop and enhance the Highway Activities Tracking System (HATS). HATS is a tool that documents work activities in the field through the use of 1,200 mobile devices now in service and used by frontline maintenance staff each day. Since the launch of HATS in 2008, and a major update in 2015, the agency has developed a clearer understanding of the condition of assets in the field, along with tasks performed. The system helps manage the funding the department receives each biennium.
In 2017, maintenance technicians added 30,788 assets to inventory and compiled approximately 188,000 records of work activities. Employees are averaging over 500 HATS record entries per day, a 40% increase from 2016.
A recent update to the HATS application includes a feature that allows planning of recurring work activities. These tasks are set by the agency on planned cycles, such as annual cable barrier inspections. Because of this change, users at all levels can now track progress and plan work in a more efficient and effective manner. An additional component of this is the “Feature Activity Coverage Dashboard.” Users visually track their work completion in real-time using this tool.
Contributors include Andrea Fortune, Kelly Shields, Bart Treece, Joe Irwin and Dustin Motte
2012
Data: WSDOT Maintenance Office.Note: Percentages are rounded and may not equal 100% as a result.
Customers give high marks to statehighway emergency responses
2017
Average (34%)
Above average(34%)
Excellent (29%)
Very poor (1%)
Fairly poor (1%)
Average (36%)
Above average(43%)
Excellent (19%)
Very poor (1%)
Fairly poor (2%)

30 | GNB Edition 68 | December 2017 Mobility – Incident Response
INCIDENT RESPONSE QUARTERLY UPDATE68
WSDOT sends incident Response teams to improve driver safety at 14,141 incidentsWSDOT’s Incident Response (IR) teams were dispatched to 14,141 incidents during the fourth quarter (October through December) of 2017. There were 1,247 fewer incidents during the fourth quarter of 2017 than during the same period in 2016, an 8.1% decrease.
WSDOT teams cleared incidents in an average of 13 minutes and 30 seconds. This is 54 seconds longer than the average incident clearance time for the same quarter in 2016. In the fourth quarter of 2017, there were 9.4% fewer incidents lasting more than 90 minutes while incidents lasting 15-90 minutes increased 2.1%, and incidents lasting less than 15 minutes decreased 11.1% compared to the same quarter last year. The proportion of incidents which blocked at least one lane was 27% for this quarter compared to 24.1% during the same quarter last year.
WSDOT focuses on safety when clearing incidents, working to reduce incident-induced delay as well as the potential for secondary incidents. Secondary incidents occur in the congestion resulting from a prior incident and may be caused by distracted driving, unexpected slowdowns or debris in the roadway. The IR teams help alert drivers about incidents and assisting in clearing the roadway to reduce the likelihood of new incidents. A table summarizing the IR program’s performance and benefits for the quarter is on the next page.
WSDOT’s assistance at incident scenes provided an estimated $23.7 million in economic benefit during the fourth quarter of 2017 by reducing the impacts of incidents on drivers. These benefits are provided in two ways:
Æ WSDOT reduces the time and fuel motorists waste in incident-induced traffic delay by clearing incidents quickly. About $13.5 million of IR’s economic benefits for the quarter result from reduced traffic delay.
Æ WSDOT helps prevent secondary incidents by proactively managing traffic at incident scenes. About $10.2 million of IR’s economic benefit result from preventing an estimated 2,661 secondary incidents and resulting delay. This figure is based on Federal Highway Administration data that indicates 20% of all incidents are secondary incidents.
Based on WSDOT’s budget for IR, every $1 spent on the program this quarter provided drivers roughly $15.80 in economic benefit.
The mission of WSDOT’s Incident Response program is to clear traffic incidents safely and quickly, minimizing congestion and the risk of secondary incidents. The statewide program has a biennial budget of $12 million, about 59 full-time equivalent positions and 69 dedicated vehicles. Teams are on-call 24/7 and actively patrol approximately 1,300 centerline miles (3,400 lane miles) of highway on major corridors around the state during peak traffic hours. This covers approximately 18% of all state-owned centerline miles statewide.
Notable results Æ WSDOT responded to 14,141
incidents during the quarter, providing about $23.7 million in economic benefits
Æ WSDOT cleared incident scenes in an average of 13 minutes and 30 seconds, reducing traffic delay and the risk of secondary incidents
Fourth quarter (October through December) 2016 and 2017
INCIDENT RESPONSESMINUTE AVERAGEINCIDENT CLEARANCE TIME
INCIDENT RESPONSES14,141Q
42017 13.5 MINUTE AVERAGE
INCIDENT CLEARANCE TIME
15,388Q 4
2016 12.68.1%7.1% CLEARANCE
TIMEINCREASED
INCIDENTRESPONSESINCREASED
Data source: Washington Incident Tracking System.Notes: The data above only accounts for incidents to which an IR unit responded. IR data reported for the current quarter (Q4 2017) is considered preliminary. In the previous quarter (Q3 2017), WSDOT responded to 16,356 incidents, clearing them in an average of 12.6 minutes. These numbers have been confirmed and are now finalized.
Return toTable of
Contents

Mobility – Incident Response GNB Edition 68 | December 2017 | 31
WSDOT’s Incident Response provided an estimated $23.7 million in economic benefitOctober through December 2017; Incidents by duration; Times in minutes; Costs and benefits in millions of dollars
Incident durationNumber of incidents1
Percent blocking2,5
Average incident clearance time3,5
(all incidents)Cost of incident-induced delay5
Economic benefits from IR program4,5
Less than 15 min. 10,451 15.7% 4.8 $12.6 $5.9
Between 15 and 90 min. 3,516 57.5% 31.6 $31.8 $13.9
Over 90 min. 174 86.8% 161.8 $9.4 $4.0
Total 14,141 27.0% 13.5 $53.8 $23.7
Percent change from Q4 2016 8.1% 2.9% 7.1% 2.0% 2.2%
Data source: Washington Incident Tracking System.Notes: Some numbers do not add to 100% due to rounding.
1 Teams were unable to locate 835 of the 14,141 incidents. Because an IR team attempted to respond, these incidents are included in the total incident count, but are not factored into other performance measures.
2 An incident is considered blocking when it shuts down one or more lanes of travel.3 Incident clearance time is the time between an IR team’s first awareness of an incident and when the last responder has left the scene.4 Estimated economic benefits include benefits from delay reduction and prevented secondary incidents. See WSDOT’s Handbook for Corridor
Capacity Evaluation, 2nd edition, pp. 45-47, for WSDOT’s methods to calculate IR benefits.5 Performance measure result figures exclude the number of incidents IR team was unable to locate.
WSDOT teams respond to 174 over-90-minute incidentsWSDOT Incident Response units provided assistance at the scenes of 174 incidents that lasted more than 90 minutes during the fourth quarter of 2017. This is 18 fewer incidents—a 9.4% decrease—than the same quarter in 2016. While these over-90-minute incidents accounted for only 1.2% of all incidents, they resulted in 17.5% of all incident-related delay costs.
Five of the 174 over-90-minute incidents took six hours or more to clear (referred to as extraordinary incidents). This is six fewer incidents than in the fourth quarter of 2016. The five extraordinary incidents took an average of six hours and 48 minutes to clear, accounting for 1.3% of all incident-induced delay costs for the quarter.
The average incident clearance time for all over-90-minute incidents was about two hours and 41 minutes. This is about five minutes faster than the same quarter in 2016. Excluding the five extraordinary incidents, WSDOT’s average clearance time for over-90-minute incidents was two hours and 34 minutes. Performance data reported in this article comes from WSDOT’s Washington Incident Tracking System, which tracks incidents to which a WSDOT IR team responded.
For more information on how WSDOT calculates these figures and all IR performance metrics, see WSDOT's Handbook for Corridor Capacity Evaluation, 2nd edition, pp. 45-47.
Traffic Incident Management (TIM) Instructor Training provided in October 2017WSDOT and the Federal Highway Administration (FHWA) hosted TIM Train the Trainer (TtT) sessions in Quincy and Bellevue in October 2017. Thirty students from TIM responder disciplines (law enforcement personnel, firefighters and towing and recovery personnel) from around the state were taught to deliver TIM training to other responder groups in their work areas.
TIM training helps ensure safe and efficient management of incidents by improving the collaboration of multi-jurisdictional, multi-discipline first responders who work together to provide the safe, quick clearance of transportation-related incidents.

Mobility – Incident Response32 | GNB Edition 68 | December 2017
TIM scheduled responder training in 2018In 2018, TIM will promote and provide incident response training to all responders in Washington state. Approximately 100 classes are scheduled in 2018 at various locations. (For more information see: http://bit.ly/WaTIMCoTraining)
The TIM Responder Training Program was developed by responders for responders, and is designed to establish the foundation for and promote consistent training of responders to achieve the three objectives of the TIM National Unified Goal:
• Responder safety;
• Safe, quick clearance; and
• Prompt, reliable, interoperable communications.
A cross-disciplined group of local TIM instructors who were trained in TtT will lead the class. The class is composed of interactive discussions through nine modules covering:
• Introduction to the TIM program;
• TIM fundamentals and terminology;
• Notification and scene size-up;
• Safe vehicle positioning;
• Scene safety;
• Command responsibilities;
• Traffic management;
• Special circumstances; and
• Scene clearance and termination.
Emergency workers, firefighters and law enforcement personnel who would like to attend the training can sign up for the TIM responder training classes (Online registration: http://bit.ly/WaTIMCoTraining)
This training has been endorsed by the International Association of Chiefs of Police, the International Association of Fire Chiefs, the American Association of State Highway and Transportation Officials, the National Volunteer Fire Council, the International Association of Directors of Law Enforcement Standards and Training, and the Towing and Recovery Association of America. (For more information, visit http://www.watimcoalition.org/)
Contributors include Vince Fairhurst, Michele Villnave, Takahide Aso, Dustin Motte
Incident responders participate in desktop incident situational training during the Train the Trainer training during a 2017 session.
Customer feedback: Æ Alvin went above and beyond his job. First thing he said "Stay in the truck I'll take care of everything" due to a flat. WSDOT is lucky to have an employee like Alvin. Thanks again.
Æ Nick was so kind. My car ran out of gas. No judgment just genuine "let me help you" Thank you Nick.
Æ Brian was a great help! I submitted an online response as well. Thank you for this program and please tell Brian thank you again from me!
Results WSDOT GoalWORKFORCEDEVELOPMENT
Traffic Incident Management responder training contributed to Workforce Development by teaching responders to quickly and safely clean incidents while maintaining interoperability.

GNB Edition 68 | December 2017 | 33 Mobility – WSDOT Ferries
WSDOT FERRIES QUARTERLY UPDATE68
Ferries service reliability rebounds to 99.5%There were 40,598 regularly scheduled ferry trips during the second quarter of Fiscal Year (FY) 2018 (October through December 2017). WSDOT Ferries completed 99.5% (40,397) of these trips. This exceeds the annual service reliability performance goal of 99% and is 0.8 percentage points higher than the same quarter in FY2017 (see table on the next page).
In the second quarter of FY2018, Ferries canceled 234 trips and was able to replace 33 of them, resulting in 201 net missed trips. This was 340 fewer net missed trips compared to the 541 missed during the same quarter in FY2017.
The highest number of trip cancellations came from the vessel/mechanical category (116), most of which were on the Port Townsend – Coupeville route while the Motor/Vehicle Salish was waiting for U.S. Coast Guard approval to return to service after running aground in early October. Tides and weather accounted for the second-highest number at 78.
Ridership increases during the fall quarterWSDOT Ferries ridership was approximately 5.5 million during the second quarter of FY2018. This was about 25,000 (0.5%) higher than WSDOT projected for the quarter and about 179,600 (3.4%) more in total ridership than the corresponding quarter in FY2017. Ridership during the second quarter of FY2018 increased on eight of the nine routes compared to the same quarter in FY2017.
The Point Defiance – Tahlequah route experienced the largest increase in ridership (14.5%) compared to the same quarter in FY2017. The increase was partially due to the route being temporarily closed for a week in FY2017 to repair damage to the ferry slip at Point Defiance. The only decrease in ridership compared to the same quarter last year was on the Seattle – Bremerton route, which was down 0.7%, reflecting the July 2017 start of Kitsap Transit’s passenger-only service between Seattle and Bremerton.
On-time performance decreasesOn-time performance decreased to 95.6% in the second quarter of FY2018 compared to the same quarter in FY2017. The quarterly rate is above Ferries’ annual on-time performance goal of 95%.
On-time performance decreased on six of nine routes compared to the second quarter of FY2017. The San Juan Domestic route had the largest decrease (2.6%) compared to the same quarter last year. On average in the second quarter of FY2018, 20 out of 444 (4.5%) daily trips did not leave the terminal within 10 minutes of the scheduled departure time, worsening slightly from an average of 18 out of 441 trips (4.1%) for the same quarter in FY2017.
Notable results Æ Ferries made 99.5% of its regularly
scheduled trips in the second quarter of fiscal year 2018
Æ Ferries ridership was approximately 5.5 million in the second quarter of fiscal year 2018, about 179,600 (3.4%) more than the corresponding quarter in FY2017
Vessel issues top reason for cancellations during quarterSecond quarter (October - December) FY2018
Emergency/security
28 (12.0%)Schedule reset
2 (0.9%)
Data source: WSDOT Ferries.Notes: Fiscal years (FY) run from July 1 through June 30. As a result October - December 2017 represents the second quarter of FY2018. Percentages may not equal 100 due to rounding. 1 The category for “Other” incudes issues at terminals, and events like disabled vehicles, environmental reasons and non-vessel related incidents that can impact operations. 2 Ferries replaced 33 of the 234 canceled trips for a total of 201 net missed trips.
78 (33.3%)
Vessel/mechanical116 (49.6%)
7 (3.0%)
Other13 (1.3%)
Weather/tides
Crewing
Return toTable of
Contents

Mobility – WSDOT Ferries34 | GNB Edition 68 | December 2017
of 11 from the 65 reported in the second quarter of FY2017. Vendors was the category with the largest improvement and had 41 fewer complaints than the same period in FY2017, resulting in no complaints during the second quarter of FY2018.
Contributors include Matt Hanbey, Kynan Patterson, Joe Irwin
and Dustin Motte
Ferries on-time performance and decreases, reliability increases in the second quarter of fiscal year 2018October through December FY2017 and FY2018; Annual on-time goal = 95%; Annual service reliability goal = 99%
Route
On-time performance (second quarter) Trip reliability (second quarter)
FY2017 FY2018 Status Trend FY2017 FY2018 Status Trend
San Juan Domestic 95.1% 92.5% -2.6% 99.5% 100.0% +0.5%
Anacortes/Friday Harbor – Sidney, B.C. 94.0% 93.4% -0.6% 100.0% 100.0% 0.0%
Edmonds – Kingston 98.0% 96.9% -1.1% 99.9% 99.8% -0.1%
Fauntleroy – Vashon – Southworth 93.6% 94.3% 0.7% 99.9% 100.0% +0.1%
Port Townsend – Coupeville 96.2% 94.6% -1.6% 94.5% 92.7% -1.8%
Mukilteo – Clinton 96.0% 98.7% 2.7% 99.0% 99.6% +0.6%
Point Defiance – Tahlequah 99.3% 99.3% 0.0% 92.1% 99.9% +7.8%
Seattle – Bainbridge Island 96.2% 94.2% -2.0% 99.2% 100.0% +0.8%
Seattle – Bremerton 98.2% 96.9% -1.3% 99.8% 99.4% -0.4%
Total system 95.9% 95.6% -0.3% 98.7% 99.5% +0.8%
Data source: WSDOT Ferries.Notes: FY = fiscal year (July 1 through June 30). As a result October - December 2017 represents the second quarter of FY2018. A trip is considered delayed when a vessel leaves the terminal more than 10 minutes later than the scheduled departure time. Ferries operates 10 routes but combines the Anacortes – Friday Harbor route with the San Juan Interisland route as the San Juan Domestic for on-time performance and service reliability. Due to unique fare collection methods in the San Juan Islands, and similar origin and destination legs on both routes, some statistics cannot be separated between the two routes.
Passenger injuries decrease, employee injuries increaseThe rate of passenger injuries per million riders decreased from 0.56 in the second quarter of FY2017 to 0.18 in the second quarter of FY2018, representing a drop from three to one total passenger injuries. The passenger injury rate during the quarter was below Ferries’ goal of 1.0 injury per million riders.
The rate of Occupational Safety and Health Administration (OSHA) recordable crew injuries per 10,000 revenue service hours increased from 6.4 in the second quarter of FY2017 to 8.9 during the same period in FY2018. This represents eight more injuries than the same quarter in FY2017, and is above Ferries’ annual goal of having a rate of less than 7.6 crew injuries per
10,000 revenue service hours. The category with the most injuries (36%) for the quarter was sprains and strains.
Revenue follows ridership, trends up for the quarterFerries farebox revenue continued its upward trend, coming in at about $41.0 million for the second quarter of FY2018. Farebox revenue was about $2.6 million (6.9%) more than the same quarter in FY2017, but about $405,000 (1.0%) below projections.
Passenger complaints down for the quarterFerries received 163 complaints and 20 compliments during the second quarter of FY2018. Fifty-four of the 163 complaints centered around loading and unloading, a decrease
The online version of this article links to an interactive map at bit.ly/GNBferriesmap.

GNB Edition 68 | December 2017 | 35 Mobility – Passenger Rail
RAIL: AMTRAK CASCADESQUARTERLY UPDATE68
Farebox recovery rate increases to 62.5% Ticket revenue covered 62.5% of WSDOT-funded Amtrak Cascades operating costs in federal fiscal year 2017 (FFY2017; October 1, 2016 through September 30, 2017). This percentage, called the farebox recovery rate, is a 3.5 percentage point increase from FFY2016 (59.0%). In FFY2017, ticket revenue and operating costs decreased by $200,000 and nearly $3.3 million, respectively. This resulted in the improved farebox recovery rate.
The $200,000 (0.7%) decrease in ticket revenue, which went from $31.4 million in FFY2016 to $31.2 million in FFY2017, is primarily due to more passengers taking advantage of discounts and incentives. The number of passengers increased by 2.2%—from 792,000 in FFY2016 to 811,000 in FFY2017—yet WSDOT collected slightly less in overall ticket revenue.
Operating costs decreased from $53.1 million in FFY2016 to $49.9 million in FFY2017 primarily due to two factors. WSDOT negotiated changes in its operating agreement with Amtrak, which led to a decrease in service fees paid for the operation of the Amtrak Cascades service. Secondly, there was a decrease in the amount of incentive payments Amtrak made to BNSF—the host railroad—to reliably operate Amtrak Cascades trains on its tracks.
The ridership increase follows an enhanced marketing campaign which targeted specific audiences and included partnerships with community groups, sports teams, and Amtrak destinations. The intent is to encourage more travelers to take the train, with the expectation that once they experience Amtrak Cascades, they would become return customers and a source of referrals to additional customers.
Notable results � Ticket revenue covered 62.5% of state-funded Amtrak Cascades operating costs in federal fiscal year 2017
� The last of 20 Amtrak Cascades high-speed rail projects funded by American Recovery and Reinvestment grants went into use in late 2017
� Amtrak committed to meeting a December 2018 deadline for installation of Positive Train Control to reopen new Amtrak Cascades route
$0
$10
$20
$30
$40
$50
0%
10%
20%
30%
40%
50%
60%
70%
80%
20172016201520142013
Amtrak Cascades revenue and farebox recovery rate increases in FFY2017Federal Fiscal Years 2013 to 2017; dollars in millions
Data source: WSDOT Rail, Freight and Ports DivisionNotes: Farebox recovery rate is defined as the percentage of operating costs covered by ticket revenue. The above revenue, operating costs and farebox recovery rates are for Washington-funded trains only.
1 2
1 Total operating costs
2 Revenue
3 Farebox recovery
359.5% 58.3%58.0%62.5%59.0%
Amtrak Cascades intercity passenger rail funded by ticket revenue, WSDOT and ODOT The Amtrak Cascades intercity passenger rail service is owned and administered by WSDOT and the Oregon Department of Transportation (ODOT). The two states pay for operating expenses not covered by ticket revenue (which includes food and beverage sales and other related fees). The revenue, operating costs and farebox recovery rates reported in this article are for Washington-funded trains only.
Return toTable of
Contents

Mobility – Passenger Rail36 | GNB Edition 68 | December 2017
WSDOT completes final Cascades High-Speed Rail Capital project The new Amtrak Cascades Tacoma Dome Station and Point Defiance Bypass route, the last of 20 federally funded passenger rail projects, began service in late 2017. WSDOT worked on the projects from 2010 to 2017 in locations throughout western Washington—from Blaine to the Port of Vancouver. The 20 projects were funded with nearly $800 million in federal American Recovery and Reinvestment Act grants. The Tacoma Dome station and bypass route were completed earlier in 2017, but did not open to the public until additional service between Seattle and Portland began in December. However, the Amtrak Cascades train derailment on December 18, 2017, resulted in a return to the original route.
WSDOT working with federal investigators, partners after Amtrak Cascades derailment
WSDOT is working closely with the National Transportation Safety Board (NTSB) and rail partners to determine the cause of the tragic derailment on the inaugural run
using the Point Defiance Bypass. A final NTSB investigation and report will likely take a year or more to complete.
The train derailed over Interstate 5 near DuPont with some rail cars falling onto the roadway below. Three train passengers were killed and approximately 70 people were transported to regional hospitals from either the train cars or the roadway.
The derailed train included a WSDOT locomotive, an Amtrak-owned locomotive and rail cars owned individually by WSDOT and Amtrak. The WSDOT locomotive was recently purchased as part of the high-speed capital rail projects. Amtrak, which operates the passenger service under contract from WSDOT and the Oregon Department of Transportation, has pledged to cover all costs associated with the derailment.
Point Defiance Bypass route on hold with modified service goals
Following the derailment, WSDOT announced that Amtrak Cascades trains would not use the Point Defiance Bypass until Amtrak, Sound
Transit and BNSF have activated Positive Train Control (PTC) on the route. PTC is a safety overlay system that can brake a train if it is not operating within established parameters.
The federal deadline for PTC activation is December 2018 and Amtrak has committed to meeting that deadline on the Amtrak Cascades route. PTC is not yet activated for passenger trains on any segment of the entire Amtrak Cascades route. There have been more than 14 million safe boardings on Amtrak Cascades trains prior to this derailment.
The new Amtrak Cascades Tacoma Dome Station and the Point Defiance Bypass route, though complete, will not be used until PTC implementation. Tacoma passengers are using the former Amtrak station in that city and train service has been returned to the previously scheduled four daily round trips between Seattle and Portland.
Contributors include Teresa Graham, Barbara LaBoe, Janet Matkin, Kathryn Blumhardt and Helen Goldstein

GNB Edition 68 | December 2017 | 37 Environmental Compliance – Environment
ENVIRONMENTAL COMPLIANCEANNUAL REPORT68
Environmental compliance at WSDOT improves in 2017In 2017, WSDOT had 847 construction projects, made over 161,000 ferry sailings, and performed over 2.6 million maintenance work hours. During that time, WSDOT and its contractors received 14 formal environmental violation notices, two fewer than the previous year (a decrease of 13%). This improvement is attributed to continued efforts by WSDOT and its contractors to improve environmental compliance throughout the project development process.
Eleven of the 14 violation notices received were issued solely to WSDOT, two were issued directly to WSDOT's contractors and one was issued to both WSDOT and the associated contractor. Thirteen of the 14 (93%) violation notices were issued to highway construction projects. One violation notice (7%) was issued to a ferry terminal construction project.
Of the 14 violation notices received in 2017, five were attributed to events occurring in 2017, four in 2016 and five in 2015. The length of time between the violation event and the violation notice depends on the issuing agency and the duration of the project. The most common type of violation notice received in 2017 was unauthorized discharge to water (57%), followed by noise citations (14%).
Results WSDOT GoalPRACTICAL SOLUTIONS
WSDOT and its contractors employ Practical Solutions to prevent costly cleanups and environmental damage. One such Practical Solution tool is the Spill Prevention, Control and Countermeasures Plan, which allows projects to avoid and minimize spills. This is a key element for protecting the environment during construction.
Notable results �WSDOT and its contractors completed over 2.6 million maintenance work hours in 2017 without receiving a violation notice
�Of 847 active construction projects during 2017, fewer than 2% received environmental violation notices
WSDOT activities receive 14 violation notices in 2017 Number of notices by environmental violation category
Data source: WSDOT Environmental Services Office.Note: Percentages may not add to 100 due to rounding.
Violation of ConstructionStormwater General
Permit condition (7%)
Improper management of anunderground storage tank (7%)
Noise citation (14%)
Lack of Construction Stormwater GeneralPermit coverage (7%)
Unauthorizeddischarge to
sanitary sewer (7%)
Unauthorized discharge to water (57%)
Return toTable of
Contents

Environmental Compliance – Environment38 | GNB Edition 68 | December 2017
WSDOT's dedication to improving fish passages and habitats through innovative design and collaborative partnerships. The project, located near Arlington, removed two fish passage barriers under SR 531 by relocating a 330-foot section of Edgecomb Creek to the south side of the road. The stream relocation eliminated the need for the stream to cross under the highway in two locations, resulting in 650 feet of new stream channel. Additional environmental benefits of the project include:
• Promoting cooler instream temperatures and eliminating weirs, including one weir that was a fish passage barrier;
• Removing an existing building, contaminated soils and an impervious surface from a previous residence and converting those areas to stream and forested stream buffer; and
• Creating high-quality, in-stream habitat and improving access to 1.77 miles of upstream spawning habitat for salmon and trout.
The SR 531 Edgecomb Creek fish passage project exemplifies WSDOT's commitment to improving the environment while maintaining safe roadways. Through early planning and inclusion of stakeholder input, WSDOT designed and constructed a project that protects a stream from future development and expands spawning habitat for salmon and trout within the Edgecomb creek watershed, both in and beyond the project area.
Contributors include Gretchen Coker, Molly Sullivan and Kathryn Blumhardt
WSDOT receives two monetary penalties in 2017 WSDOT's violation notices included two monetary penalties in 2017, one fewer than in 2016. The total amount of monetary penalties in 2017 was $17,120, a decrease of $7,880 from 2016. King County issued WSDOT one monetary penalty in the amount of $11,120 for the discharge of fire suppression foam into the sanitary sewer on the Interstate 90 Mount Baker Tunnel Project after testing a newly-installed system (a penalty of $2,000 was previously issued by the City of Seattle in 2016 for this event). The Department of Ecology issued WSDOT another monetary penalty totaling $6,000 for unauthorized discharges of solid waste materials to water on the State Route (SR) 520 West Approach Bridge North Project.
WSDOT's contractors received two monetary penalties in 2017. Both penalties were issued by the City of Seattle in the amount of $600 for repeated noise violations on the SR 520 West Approach Bridge North project.
Fish passage project wins Environmental Excellence AwardWSDOT continually looks for ways to improve environmental performance. In 2017, WSDOT staff nominated 12 teams or individuals for their dedication to environmental stewardship.
The SR 531 Edgecomb Creek fish passage project, an Environmental Excellence Award winner, epitomized
Collaboration during fish passage project leads to environmental complianceDuring construction on the SR 531 Edgecomb Creek fish passage project, WSDOT encountered an unstable slope requiring additional coordination. The initial recommended fix included the use of quarry spalls to stabilize the slope, which would not provide fish-friendly habitat. The project design, geotechnical engineering, and construction offices received valuable input from the Tulalip Tribes, National Marine Fisheries Service and the regional environmental office. The solution identified through this collaboration included a planted slope to retain riparian function, resulting in compliance with the Endangered Species Act.
A fish passage barrier at Edgecomb Creek (above) before the project and the newly designed Edgecomb Creek habitat (below).

GNB Edition 68 | December 2017 | 39 Freight – Economic Vitality
FREIGHTSEMI-ANNUAL REPORT68
Notable results Æ WSDOT had 48 projects to
improve freight rail structures and freight movement underway as of December 31, 2017
Æ Fifteen Connecting Washington freight rail projects were in various stages of completion as of December 31, 2017
Fourteen of 48 freight rail projects in final close out stage As of December, 31 2017(2017-2019 biennium)
Data: WSDOT Rail, Freight, and Ports Division.Notes: Percentages may not add to 100 percent due to rounding. The 2017-2019 biennium runs from July 1, 2017 through June 30, 2019. 1 Close out includes capturing final records and closing the corresponding work orders.
Close out1 14 (29.2%)
Construction10 (20.8%)
Scope confirmation 8 (16.7%)
Design9 (18.8%)
Agreement 7 (14.6%)
WSDOT has 48 freight rail projects underway in the 2017-2019 biennium WSDOT had 48 projects to improve freight rail structures and freight movement in Washington underway by December 31, 2017. The work, which will continue throughout the 2017-2019 biennium (July 2017 through June 2019), includes projects funded by the Connecting Washington transportation package, state grants and loan programs.
Of these 48 freight rail projects, 14 (29.2%) had construction completed and were in the final close out phases, 10 (20.8%) were under construction, nine (18.8%) were being designed, seven (14.6%) were in the agreement stage and eight (16.7%) were in the scope confirmation stage. WSDOT had 24 of 48 (50.0%) in the construction and close out phases by December 31, 2017. This was the same number but a lower percentage of projects compared to the end of 2016, when the agency had 24 of 36 (66.7%) projects in the construction and close out phases.
Connecting Washington supports projects in 2017-2019
The Legislature has funded seven freight rail improvement projects for the 2017-2019 biennium through the Connecting Washington (CW) transportation package. All the CW projects—which total $27.3 million and include interchange improvements, work at several ports, and rehabilitation of existing rail lines—were in progress by December 31, 2017.
Eight additional projects, originally funded by Connecting Washington during the 2015-2017 biennium, were in various stages of completion by the end of December 2017. Of these, three were in close out, three were in design, and two had agreements being finalized. The projects include shortline railroad rehabilitation, port improvement projects, interchange improvements, upgraded crossings, and landslide mitigation.
Number of freight rail projects increase in the 2017-2019 biennium 2015-2017 and 2017-2019 bienniums
2015-2017 2017-2019Program phase Number Funding Number FundingScope confirmation 2 $1,158,000 8 $5,540,000
Agreements 2 $778,441 7 $3,917,441
Design 8 $9,234,300 9 $12,539,000
Construction 11 $5,114,796 10 $22,958,000
Close out 13 $6,870,944 14 $6,606,917
Totals 36 $23,156,481 48 $51,561,358Data source: WSDOT Rail, Freight, and Ports Division.
Notes: The 2015-2017 biennium covers July 2015 through June 2017, while the 2017-2019 biennium covers July 2017 through June 2019. Comparison is through December 2016 and December 2017 for each biennium.
Return toTable of
Contents

Freight – Economic Vitality40 | GNB Edition 68 | December 2017
WSDOT finalizes new Grain Train Strategic PlanWSDOT’s Rail, Freight, and Ports Division finalized the 2017-2027 Grain Train Strategic Plan in November, with the help of internal and external stakeholders. It includes ongoing program goals as well as suggested changes for continued success.
The Grain Train Program began in 1994. The program includes used rail cars—purchased with federal funds—to carry eastern Washington wheat and barley to export centers in western Washington and Oregon, and help ensure farmers can get goods to market. WSDOT and the ports of Moses Lake, Walla Walla and Whitman County administer the program. The program reduces roadway congestion as well as roadway and bridge maintenance and preservation costs. It also reduces greenhouse gas emissions, reduces shipping costs for its users, and improves roadway safety.
Recommendations in the plan include increasing the number of rail cars, developing ways to help cover administration costs, creating annual rail car need projects, planning for the future with formal reviews every five years, and implementing a preventative maintenance program.
Freight Rail Assistance Program funds 28 projects
Approximately $16.0 million in state freight rail grant programs were underway in 2017. Two of the projects were funded in the 2013-2015 biennium and are operationally complete. Thirteen were funded in the 2015-2017 biennium and were completed and close outs occurring by December 31, 2017.
Another 13 projects—costing about $8 million—are in the preliminary development phases (scope, agreements and design) in the 2017-2019 biennium. They include projects such as rail and tie replacements, rail safety and preservation.
Freight Rail Investment Bank improves freight movement in WashingtonThe Legislature-funded Freight Rail Investment Bank loan program helps deliver projects that improve the state’s long-term economic vitality by improving freight movement.
The $5.8 million in projects funded with these loans in 2017 included improvements to transfer yard connections, crossover rehabilitation and marine terminal rail improvements. Additionally, three Tacoma Rail projects that were funded with 2015-2017 dollars are currently being closed out. A fourth project with the Port of Everett was funded with 2017-2019 dollars, with agreements being finalized at the end of 2017 and design work underway.
WSDOT collaborates on 2017 Washington State Freight System Plan WSDOT and freight system partners collaborated to complete the 2017 Washington State Freight System Plan in November and it was certified by the Federal Highway Administration on December 1, 2017.
The plan—which incorporates recent freight-planning efforts by WSDOT and its partners—identifies steps to ensure the multimodal transportation system in Washington continues to support trade and economic growth. The 2017 freight system plan includes:
Æ Details about the importance of freight to state, regional, and local economies;
Æ Freight volumes and forecasts;
Æ Freight performance measures;
Æ Major freight trends, issues and needs; and,
Æ Strategies for meeting identified freight needs.
The plan also satisfies state and federal planning requirements, including those tied to grant eligibility for freight improvement projects.
Investments that benefit the freight transportation system
The plan also serves as a resource document for freight planning in Washington. The plan identifies strategies that create approaches for transportation partners to help ensure the state’s economic vitality and continued freight improvements.

Freight – Economic Vitality GNB Edition 68 | December 2017 | 41
0
5
10
15
20
25
30
35
40
OtherMetalClay, concrete,
glass or stone
Pulp or paper
Waste or scrap materials
ChemicalsMixed shipments
Food or kindred
Lumber or wood
Hazardous materials
CoalFarm products
Freight rail commodities shipped decreases by about five million tons 2014 and 2015; Commodities shipped by rail in millions of tons
Data source: WSDOT Rail, Freight, and Ports Division, Surface Transportation Board Waybill Data.
1 2
1 2014 2 2015
Key strategies in the plan will be included in the Washington Transportation Plan, the statewide multimodal transportation plan.
The Washington State Freight System Plan also includes two stand-alone plans within its appendices:
Æ The 2017 Washington State Freight Investment Plan guides and tracks investments that benefit freight in the state. It also describes key funding sources and networks eligible for funding and identifies projects within the networks. The investment plan includes the National Highway Freight Program list of priority, fiscally-constrained projects, which notes $89 million in federal funding for FY2016-FY2020, as well as another $240 million in leveraged funds for freight-related projects.
Æ The 2017 Washington State Marine Ports and Navigation Plan assesses the transportation needs of marine ports in Washington, identifying transportation system improvements that are
necessary to better support international trade and economic development. It also analyzes the freight systems' conditions and performance, as well as volumes, trends and issues, providing strategies to address identified needs.
Freight rail tonnage decreased in 2015Railroads in Washington state transported 116.6 million tons of freight in 2015, a decrease of 4.2% from 2014 levels. (Freight rail data for 2016 and 2017 is not yet available.)
Approximately half of all freight moved by rail in Washington was shipped into the state and terminated here. Freight rail shipments moving through Washington (starting and terminating outside the state) accounted for 30.7% of total freight rail tonnage, a 6.8% decrease between 2014 and 2015.
Freight rail shipments of farm products saw a 5.2% decrease in
2015 (a drop of 1.8 million tons), mostly due to decreases in rail shipments of corn, wheat and soybean. Despite that decrease, farm products remained the largest group of commodities transported by rail and comprised 28% of all freight rail shipments (see chart below). Coal traffic remained the second largest commodity transported by rail, but also decreased in 2015; shipping 2.8 million fewer tons, a 14.7% decrease from 2014. Hazardous materials shipments decreased slightly (0.6%)—from 16.22 million tons in 2014 to 16.12 million tons in 2015—but remained the third largest commodity group shipped by rail.
Lumber and wood shipments increased by 1.3 million tons (16.7%) to become the fourth largest commodities moved by rail in 2015. The increase moved these commodities up from sixth place in 2014, passing food or kindred shipments (processed food and related products) and mixed supplies.
Contributors include Jason Beloso, Cameron Harper, Barbara LaBoe, Janet Matkin, Matt Pahs,
Mark Nickerson, Kathryn Blumhardt and Joe Irwin

43 | GNB Edition 68 | December 2017 WSDOT Tolling – Stewardship
WSDOT TOLLING ANNUAL REPORT68
Toll transactions up 8% in fiscal year 2017WSDOT toll facilities processed 50.1 million transactions in fiscal year (FY) 2017 (July 2016 through June 2017), an 8% increase from the 46.6 million transactions in FY2016. Gross revenue from toll facilities—including funds generated by tolls, transponder sales, civil penalties, toll bill reprocessing fees and interest income—increased as a result. WSDOT collected $191.9 million in gross toll facility revenue in FY2017, a 5% increase from the $183.1 million collected in FY2016.
In FY2017, toll facilities generated $146.2 million—after operations and maintenance expenses—to cover bond obligations and fund improvements on the corridors on which the money was collected.
WSDOT’s tolling facilities in FY2017 included the State Route (SR) 520 bridge between Seattle and Bellevue, the eastbound SR 16 Tacoma Narrows Bridge (TNB) between Gig Harbor and Tacoma, the SR 167 High Occupancy Toll (HOT) lanes between Auburn and Renton, and the Interstate 405 (I-405) express toll lanes (ETL) between Lynnwood and Bellevue.
I-405 express toll lanes provide faster, more reliable tripsDrivers made about 28.7 million trips on the I-405 ETL during the first two years of operation (October 2015 through September 2017). Overall, the I-405 corridor (between Lynnwood and Bellevue) had an average of 19% more person-throughput than before tolling began.
After their start in October 2015, the I-405 ETL generally provided faster, more reliable trips each weekday for an average of more than 7,700 bus riders and 53,000 commuter vehicles, which included 37,500 toll-paying vehicles and 15,500 toll-exempt carpools and motorcycles. Additionally, ETL users saved an average of 12 minutes during peak commute times between Bellevue and Lynnwood compared to traffic in the general purpose lanes, and paid an average toll of $2.82.
Between April 2017 and September 2017 vehicles in the ETL maintained speeds 45 mph or faster 85% of the time during peak periods. The HOV lanes (that were replaced by the ETL) maintained speeds 45 mph or faster 56% of the time during a similar time period in of 2015.
Speeds were 45 mph or faster 90% of the time in all ETL sections except the southbound single-lane ETL section between Lynwood and Bothell. WSDOT is reviewing a variety of operational strategies to improve performance in the single-lane ETL section, monitoring trends and making adjustments as necessary.
I-405 express toll lanes provide revenue to support the corridor
Tolling revenue from the I-405 ETL is reserved for corridor operations, maintenance and improvement. During their first two years of operation, the lanes have generated over $28.8 million in gross revenue, $11.5 million
Notable results Æ Toll transactions increased to
50.1 million in fiscal year 2017, up 8% from 46.6 million transactions in fiscal year 2016
Æ Good To Go!—WSDOT’s all-electronic tolling system—was used to pay for 79% of all toll transactions in fiscal year 2017
Æ Travelers made 28.7 million trips on the Interstate 405 express toll lanes in their first two years of operation
Transactions and revenues increase for WSDOT tolling facilities Fiscal years 2016 and 2017 (July through June); Transactions and revenues in millions
Transactions1 FY2016
FY2017
Percent change
SR 520 Bridge 23.2 23.9 +3%
TNB 14.8 15.0 +1%
SR 167 HOT lanes 1.12 1.5 +36%
I-405 ETL 7.53 9.6 +28%
Total 46.6 50.1 +8%
Revenues1
SR 520 Bridge $76.7 $83.8 +9%
TNB $81.1 $82.0 +1%
SR 167 HOT lanes $1.52 $2.8 +87%
I-405 ETL $15.83 $23.2 +47%
Total $183.1 $191.9 +5%Data source: WSDOT Toll Division.
Notes: Numbers and percentages have been rounded. 1 Figures for 2016 are not equal to those reported in GNB 64 because facility revenues now include funds from toll revenue, civil penalties, reprocessing fees, interest income and other miscellaneous revenue. 2 Toll collection system malfunctions on the SR 167 HOT lanes resulted in lower transactions and revenues in FY2016. 3 I-405 express toll lanes (ETL) opened in October 2015; FY2016 data is from nine months of operations.
Return toTable of
Contents

WSDOT Tolling – Stewardship GNB Edition 68 | December 2017 | 44
of which was used to construct the new northbound peak-use shoulder lane (PUSL) between SR 527 and I-5. The PUSL—which opened in April 2017—has increased throughput and decreased travel times on northbound I-405 during the peak commute period. For more information about the PUSL, visit: http://bit.ly/PUSLperformance.
SR 520 tolls and volumes increase in FY2017The new SR 520 floating bridge opened in April 2016 and provides two general purpose lanes and one HOV lane in each direction. All toll revenue from the bridge goes toward paying off bonds used to finance the construction of the bridge, and toward operation and maintenance costs of the facility. The new, safer bridge replaced a four-lane bridge that opened in 1963 and was structurally vulnerable to high winds and strong waves.
WSDOT processed 23.9 million transactions at the SR 520 bridge toll facility in FY2017, a 3% increase from FY2016. The bridge generated about $84 million in gross toll revenue in FY2017.
Transportation commission approves toll increase for SR 520 bridge
The Washington State Transportation Commission increased SR 520 tolls by approximately 5% in July 2017 and commenced nighttime tolling to cover operation and maintenance costs and debt payments. The bridge is now tolled 24 hours a day. The increase affected all toll rates, raising the peak weekday Good To Go! pass rate for a two-axle vehicle from
$3.90 to $4.30 and the Pay By Mail rate from $5.55 to $6.30.
Traffic on the SR 520 bridge has increased steadily since tolling began in December 2011 (on the old bridge). On a typical weekday in FY2017, 79,000 vehicles used the bridge, up from 77,000 vehicles in FY2016.
Tacoma Narrows Bridge sees more toll transactions in FY2017 On average, 44,000 drivers crossed the Tacoma Narrows Bridge each weekday in FY2017. WSDOT processed approximately 15 million transactions on the bridge in FY2017, about 200,000 more than in FY2016. This 2% increase in transactions helped revenues grow to a total of $82 million in gross toll revenue.
Roughly 68% of transactions on the Tacoma Narrows Bridge were paid using Good To Go! accounts. The facility is on track to meet its primary goal of repaying the debt from the bridge’s construction by FY2032.
Transportation commission opts not to raise tolls on Narrows Bridge
The Washington State Transportation Commission has not increased toll rates for the Tacoma Narrows Bridge since July 1, 2015.
The commission sets the toll rates to ensure that bridge tolls will generate sufficient revenue to cover bond commitments and operation costs. Due to the $5 million appropriation by the Legislature for debt service and higher-than-forecasted bridge transactions in FY2016, the commission was able to keep toll rates the same for the last two fiscal years.
Vehicles have transponders read by Good To Go! pass readers heading eastbound on SR 16 toward the Tacoma Narrows Bridge.
11
TRAVEL TIME SAVINGSin I-405 EXPRESS TOLL LANES
during peak commute periods from July 2016 through June 2017
MINUTESsouthbound
14 northboundMINUTES

WSDOT Tolling – Stewardship45 | GNB Edition 68 | December 2017
SR 167 toll lanes expand, transactions increaseThe SR 167 HOT lanes have improved travel times since they were initiated in May 2008. Despite regional traffic growth, the HOT lanes provided faster, more reliable trips—compared to before the HOT lanes were initiated—for 5,300 paying customers and over 2,000 bus riders each weekday in FY2017. Drivers saved an average of seven minutes during peak commute times compared to traffic in the general purpose lanes for an average toll of $3 during peak periods. WSDOT processed 1.5 million transactions on the SR 167 HOT lanes in FY2017, generating roughly $2.8 million in gross revenue.
WSDOT opened six new miles of HOT lanes on southbound SR 167 in December 2016, ahead of schedule and on budget. The new lanes are designed to help manage congestion around the SR 18 interchange. Southbound drivers can now use the HOT lanes for 14 continuous miles between the cities of Renton and Pacific.
The severely congested SR 18 interchange and the overall increase of traffic volumes have affected the performance of the HOT lanes. Due to persistent back-ups at the SR 18 interchange, southbound travelers reached 45 mph only 84% of peak periods. Severe congestion at the SR 167/I-405 interchange also affected northbound speeds, which reached 45 mph during 74% of peak periods. WSDOT is studying this reduction in speed reliability and plans to adjust the dynamic tolling algorithm to improve performance.
Good To Go! improves customer serviceWSDOT launched an updated version of the Good To Go! customer service website and phone line in FY2017. The Good To Go! electronic tolling system served more than 763,000 customers in FY2017. About 90,000 new Good To Go! accounts were created and 114,000 new passes were purchased in FY2017. Roughly 79% of all toll payments were made through Good To Go! accounts.
In July 2015, WSDOT introduced customer service rules allowing first-time forgiveness of civil penalties when a customer agrees to pay their old toll bills. Since the start of the program, Good To Go! has helped 155,000 people resolve their toll billing issues, waived $56 million in civil late fees, and collected $6.7 million in late tolls. The program has also led to an 82% reduction in administrative court adjudication hearing requests since FY2015.
Contributors include Ethan Bergerson, Meredith McNamee, Joe Irwin and Dustin Motte
Good To Go! pass is the most cost-efficient collection method Fiscal year 2017; Average WSDOT cost to collect per toll transaction
Payment method Average collection cost1
Good To Go! Pass $0.53
Pay by Plate $0.60
Pay by Mail $1.22
Tollbooths2 $1.06
Data source: WSDOT Toll Division.Notes: For more information about payment methods, visit http://bit.ly/tollpay. 1 Costs averaged across all facilities operating in FY2017. 2 Tollbooths are only used on the eastbound Tacoma Narrows Bridge.
Tolling operations annual report available onlineFor more information on WSDOT tolling operations see the WSDOT Toll Division Annual Report at http://wsdot.wa.gov/Tolling/publications.htm.
7
7TRAVEL TIME SAVINGSin SR 167 HOT LANES
for peak commute times in fiscal year 2017
MINUTESsouthbound
northboundMINUTES

GNB Edition 68 | December 2017 | 46 Lean – Stewardship
LEAN PROCESS IMPROVEMENTSSEMI-ANNUAL REPORT68
Data source: WSDOT Lean Office.
WSDOT continues to show Lean progressIn the second half of 2017 (July-December), WSDOT's Lean projects saved time and streamlined processes for several agency programs. WSDOT also continued to provide Lean consultations and Lean-oriented training.
Lean improves WSDOT recruiting process Æ Saved 18 days of processing time; down from 29 days to 11 days
Human Resources (HR) recruiters and consultants examined the process of creating job announcements, posting them online and identifying qualified candidates to refer to hiring managers. By collaborating with hiring managers, the recruitment process was shortened by 62% from an average of 29 days to 11 days. This results in better service to hiring managers and a faster hiring process overall, which helps WSDOT recruit top talent.
Lean efforts streamline employee scheduling procedures Æ Consolidated approximately 100 timekeeping processes into one
Timekeepers and payroll staff developed a new process for submitting employee schedule changes, which streamlined roughly 100 processes down to one process. The procedure has been successfully pilot tested and implemented statewide.
Previously, non-marine offices submitted and requested employee schedule changes in various ways. Some offices used the schedule change database, while others used payroll rosters or e-mail. The inconsistencies contributed to discrepancies in employees’ pay due to late requests, late employee notifications, under/overpayments and misplaced change requests.
Appointment letter improvements reduce error rates Æ Reduced errors from an occurrence rate of 50% to less than 10%
HR consultants from three regions and WSDOT headquarters streamlined the process of creating and delivering appointment letters to newly-hired employees. The new process will eliminate the need for physical signatures, reduce the number of data fields on the letter and use a single form template. In pilot testing, this produced a consistent delivery time of five or fewer days and reduced the rate of errors from 50% to less than 10%. Statewide implementation is scheduled for 2018.
The old process used confusing paper formats, included over 30 fields of data, and used 30 different form templates. These processes contributed to errors on 50% of appointment letters during baseline testing and resulted in an unpredictable time frame—sometimes as long as five weeks—for delivering these letters.
Notable results Æ WSDOT completed 13 Lean projects
and provided 25 Lean consultations in 2017
Æ WSDOT reduced the time needed for the recruitment process time by 62%, shortening the it from 29 days to 11 days
Æ WSDOT streamlined the payroll procedure for Ferries' Eagle Harbor facility, reducing the amount of time supervisors spend processing payroll by 20.3%
Results WSDOT GoalWORKFORCEDEVELOPMENT
WSDOT's Lean efforts support Workforce Development by:
Æ Training 27 green belt candidates in 2017 to lead and support agency-wide continuous improvement projects
Æ Promoting a continuous improvement mindset within the agency
Return toTable of
Contents

Lean – Stewardship47 | GNB Edition 68 | December 2017
Washington State Ferries' payroll project saves hours
Æ Reduced the amount of time supervisors spend on payroll by 20.3%
Washington State Ferries improved the payroll process at the Eagle Harbor facility on Bainbridge Island, reducing the amount of time spent by supervisors completing payroll from 5,607 hours in fiscal year (FY) 2016, to 4,468 hours in FY2017—a 20.3% improvement. This allows Eagle Harbor supervisors to invest the saved time—more than 1,139 hours—in the oversight and execution of maintenance on ferry vessels and terminals, which will have a positive impact on fleet readiness.
Changes made to achieve results at Washington State Ferries include:
Æ Formatting the text on forms to allow for better readability and error-checking;
Æ Increasing the level of control for supervisors to copy and paste repeat data;
Æ Ensuring notes remained in place when timesheets were processed to eliminate duplicative data entry;
Æ Combining leave and mileage sheets to reduce amount of paper being processed; and
Æ Converting timesheets to a digital format, eliminating the need for duplicate paper timesheets.
WSDOT makes progress toward Lean goalsWSDOT started 2017 with five Lean goals based largely on a yet-to-be tested Green Belt program (see chart at left). The plan was to develop the course, teach it to three classes of students, and mentor those students through Lean projects.
WSDOT rescheduled the third class for January 2018, reducing the numbers of students trained and certified in 2017, as well as the number of projects started and finished.
In 2017, WSDOT determined that certain green belt projects are more successful when led by a team of students instead of having one green belt student in charge of each project. This team approach reduced the overall project count but was designed to improve the quality of those projects. Other projects took longer than initially estimated. These trends and others will be factored into the Lean Office’s Key Performance Indicator goals in the future.
Contributors include Russell Burgess, Amber Sander, Sam Wilson, Joe Irwin, Dustin Motte and
Yvette Wixson
Key Performance Indicator
Final count
2017 goal
Lean projects started 19 30
Lean projects finished 13 20
Lean consultations provided 25 24
Green belt candidates trained 27 39
Green belts successfully certified 8 20
Data source: WSDOT Lean Office.
Lean reporting moving to Results Washington Future reporting for WSDOT's Lean program will be featured in Results Washington and, as a result, will no longer be included in the Gray Notebook.

GNB Edition 68 | December 2017 | 48 Stewardship – Capital Project Delivery Programs
CAPITAL PROJECT DELIVERY PROGRAMS QUARTERLY UPDATES68
WSDOT completes two Connecting Washington projects WSDOT completed two Connecting Washington funded (CW) projects and one CW contract in the second quarter of the 2017-2019 biennium (October through December 2017). The agency has completed six CW projects totaling $7.8 million and nine contracts totaling $28.5 million since the funding package was passed in 2015. Contracts are parts of larger projects (see p. 52 for additional information).
During the quarter, WSDOT also completed one Nickel contract and one Nickel/Transportation Partnership Account (TPA) contract. To date, WSDOT has completed 380 Nickel and TPA construction projects since July 2003, with 87% on time and 91% on budget. The agency has six Nickel and TPA projects underway; see p. 60 for details.
The cost at completion for the 380 Nickel and TPA construction projects is $9.41 billion, 1.5% less than the baseline cost of $9.69 billion. As of December 31, 2017, WSDOT had 19 Nickel and TPA projects yet to be completed, with a total value of approximately $5.92 billion.
Nickel, TPA funding continues to fall short of original 2003, 2005 projectionsFuel tax collections show 2003 and 2005 revenue forecasts, which were used to determine the project lists, did not anticipate the economic recession in projecting future growth in fuel tax revenues. The 2003 Nickel and 2005 TPA gas taxes that fund projects are based on a fixed tax rate per gallon and do not change with the price of fuel. As such, reduced gasoline and diesel consumption and sales lead to reduced tax revenue.
The 2003 Nickel transportation package was originally a 10-year plan, with revenues forecasted to total $1.9 billion from 2003 through 2013. Fuel tax revenues collected during this period were 10.2% lower than the original March 2003 projection.
Fuel tax funding from the 2005 TPA package was also lower than the original March 2005 projection. The original projection for the TPA account was $4.9 billion over a 16-year period from 2005 through 2021. Current TPA projections through 2021 are estimated to be $4.0 billion, roughly $900 million less (18.5%) than the original 2005 projection.
Nickel and TPA gas tax revenues are used to pay the debt on the bonds sold to finance the planned projects. Once all the bonds are sold, revenues collected will be used to pay the debt.
Beige Page contributors include Mike Ellis, Penny Haeger, Heather Jones, Thanh Nguyen, Theresa Scott, Aaron Ward, Kathryn Blumhardt, Joe Irwin and Kate Wilfong
Notable results Æ WSDOT completed two Connecting
Washington projects in the second quarter of the 2017-2019 biennium, bringing the total to nine
Æ WSDOT removed 40 projects from its Watch List during the second quarter of the 2017-2019 biennium; four remain
Æ WSDOT advertised 62 of 93 Pre-existing Funds projects during the quarter
Strategic Plan Goal 1: STRATEGIC INVESTMENTS
Project Delivery: Deliver transportation projects that are on time and on budget.WSDOT continues to deliver its Nickel and TPA program funded projects with a high rate of success. Of the total 380 construction projects completed to date, 87% have been on time and 91% have been on budget.
Return toTable of
Contents

49 | GNB Edition 68 | December 2017 Stewardship – Current Legislative Evaluation & Accountability Program
CURRENT LEGISLATIVE EVALUATION & ACCOUNTABILITY PROGRAM QUARTERLY UPDATE68
Combined Nickel & Transportation Partnership Account Status of projects to date; 2003 through December 31, 2017; Dollars in millions
Number of Projects
Value of Program1
Subtotal of completed construction projects2 380 $9,689.8 Non-construction projects that have been completed or otherwise removed from Nickel/TPA lists3, 4 5 $74.4
Projects included in the current transportation budget but not yet complete 19 $5,916.0 Projects that have been deferred indefinitely or deleted and removed from Nickel/TPA lists 3, 4 13 $499.2
Projects now funded by Connecting Washington and removed from Nickel/TPA lists (see GNB 63, p. 35) 4 $101.7
Total number of projects5 in improvement and preservation budget 421 $16,281.2
Schedule and budget summary Nickel & TPA combined: Results of completed construction projects in the current Legislative Transportation Budget and prior budgets; Dollars in millions
Completed in 2017- 2019
Biennium Budget
Cumulative Program
Total number of projects completed 3 380
Percent completed early or on time 33% 87%
Percent completed under or on budget 67% 91%
Baseline cost at completion $2,713.0 $9,689.8
Current cost at completion $2,714.6 $9,541.2
Percent of total program over or under budget 0.1% over 1.5% under
Advertisement record: Results of projects entering into the construction phase or under construction Combined Nickel & TPA
Total current number of projects in construction phase as of December 31, 2017 6 Percent advertised early or on time 100%
Total number of projects advertised for construction in the 2017-2019 biennium (July 1, 2017, through June 30, 2019) 0
Percent advertised early or on time N/A
Projects to be advertised: Results of projects now being advertised for construction or planned to be advertised Combined Nickel & TPA
Total number of projects being advertised for construction (January 1 through June 30, 2018) 0
Percent on target for advertisement on schedule or early N/A
Budget status for the 2017-2019 biennium; Dollars in millions WSDOT biennial budgetBudget amount for 2017-2019 biennium $845.1
Actual expenditures in 2017-2019 biennium to date (July 1, 2017, through December 30, 2017) $198.0 Total 2003 Transportation Funding Package (Nickel) expenditures $54.4
Total 2005 Transportation Partnership Account expenditures $117.5
Total Pre-existing Funds expenditures6 $26.0
Data source: WSDOT Capital Program Development and Management. Notes: Numbers have been rounded. This chart was updated in GNB 63 to reflect reconciled Nickel and TPA project counts, and as a result it does not exactly match Current Legislative Evaluation and Accountability Program charts from editions prior to GNB 63. 1 Dollars in millions. 2 Cumulative projects completed from July 1, 2003, to December 31, 2017. 3 Non-construction projects include commitments for engineering and right of way work. 4 Projects that have been deferred indefinitely or deleted include projects that have no funding available, projects that have been halted by the Legislature and those for which other entities (e.g., cities and counties) are now serving as the lead agency. 5 The project total has been updated to show “unbundled” projects which may have been previously reported in programmatic construction groupings (such as Roadside Safety Improvements or Bridge Seismic Retrofit). See Gray Notebook 38, p. 55 for more details. 6 For full details of the Pre-existing Funds program, see pp. 62-64.
Return toTable of
Contents

Stewardship – Current Legislative Evaluation & Accountability Program GNB Edition 68 | December 2017 | 50
Current Legislative Evaluation and Accountability Program rail projects as of December 31, 2017; Dollars in millions
2003 Nickel Package
2005 TPA Package
CombinedNickel & TPA
Schedule, scope and budget summary of completed LEAP projectsCumulative to date (July 1, 2003 through December 31, 2017) 14 8 22
Percent completed early or on time1 100% 100% 100%
Percent completed within scope1 100% 100% 100%
Percent completed on or under budget1 100% 100% 100%
Baseline cost at completion $200.0 $57.6 $257.6
Current cost at completion $199.9 $57.6 $257.5
Percent of total program on or under budget1 100% 100% 100%
Advertisement record of LEAP projects under construction or entering the construction phaseCumulative to date (July 1, 2003 through December 31, 2017) 1 2 3
Total projects advertised 0 1 1
Percent advertised early or on time N/A 100% 100%
Total award amounts to date $0 $9.0 $9.0
Data source: WSDOT Capital Program Development and Management.Notes: Numbers may not total 100% due to rounding. The rail projects are primarily delivered through master agreements with BNSF, which administers construction activities on the projects. The data above is unchanged from the previous quarter because no additional rail projects were completed. 1 Rail projects are commitments delivered by BNSF, Sound Transit, ports and operators. Master agreements between WSDOT and lead agencies become the documents that govern the delivery of the project including budget, scope and schedule. The administrative process allows for amendments enabling the projects to be delivered within the parameters of the new amended agreement (on time, and on budget).
Current Legislative Evaluation and Accountability Program ferries projects as of December 31, 2017; Dollars in millions
2003 Nickel Package
2005 TPA Package
CombinedNickel & TPA
Schedule, scope and budget summary of completed LEAP projectsCumulative to date (July 1, 2003 through December 31, 2017) 13 10 23
Percent completed early or on time1 100% 100% 100%
Percent completed within scope1 100% 100% 100%
Percent completed on or under budget1 100% 100% 100%
Baseline cost at completion $303.7 $343.5 $647.2
Current cost at completion $303.7 $343.5 $647.2
Percent of total program on or under budget1 100% 100% 100%
Advertisement record of LEAP projects under construction or entering the construction phaseCumulative to date (July 1, 2003 through December 31, 2017) 0 0 0
Total projects advertised 0 0 0
Percent advertised early or on time N/A N/A N/A
Total award amounts to date $0 $0 $0
Data source: WSDOT Capital Program Development and Management. Notes: Numbers may not total 100% due to rounding. 1 The Legislature funds Ferries’ projects at a grouped-project or Budget Identification Number (BIN) level for terminals and vessels; however, the delivery of construction projects requires that each of these BIN groups be broken into sub-projects with specific scopes, budgets and schedules. The list of sub-projects is updated as the project progresses into the design phase and the budget and schedule are better defined. This process enables WSDOT to deliver the projects within the updated budget amounts and milestones (on time, and on budget).
WSDOT completes 22 rail and 23 ferries projects with Nickel and TPA funds

51 | GNB Edition 68 | December 2017 Stewardship – Completed Projects & Contracts
68 COMPLETED PROJECTS& CONTRACTS UPDATE
Measuring operationally complete projectsProjects and contracts are “on time” if they are operationally complete within the quarter planned in the last approved schedule, and “on budget” if the costs are within 5% of the last approved budget.
Delivery performance of completed projects and contracts is measured against the last approved schedules and budgets in accordance with criteria established by the Legislature. In addition to the last approved budgets and schedules for these projects and contracts, initial budgets and schedules are included to show changes that may have occurred during design and construction phases.
For information on previously completed Nickel, CWA and TPA projects, visit www.wsdot.wa.gov/projects/completed.
US 97/Dolarway Intersection - Intersection Improvements (CW) KITTITAS COUNTY
This project added a right turn lane to the westbound I-90 off-ramp, constructed a roundabout at the US 97 Dolarway intersection and added a northbound lane to US 97 between the I-90 off-ramp and Dolarway.
Project benefits: The additional lanes reduce congestion and have the potential to reduce crashes heading to and from Wenatchee, Ellensburg and I-90.
Budget performance: This project was operationally complete for $3.9 million, on budget with respect to the last approved budget. The initial budget was set at $3.15 million.
Schedule performance: This project was operationally complete in October 2017, on time with respect to the last approved and initial schedule.
Highlights/challenges: The construction phase was originally planned to be advertised in fall 2016 and completed in fall 2017, within one construction season. The advertisement was delayed one calendar quarter, to winter 2017, to allow additional time to complete coordination with the City of Ellensburg and to finalize the design.
SR 150/No-See-Um Road - Intersection Improvements and Realignment (CW) CHELAN COUNTY
This project constructed a roundabout at the intersection of SR 150 and No-See-Um Road.
Project benefits: The intersection improvements allow the area to accommodate high traffic volumes and reduce the potential for crashes. The roundabout also improves bicycle and pedestrian access to Lake Chelan.
Budget performance: This project was operationally complete for $7.7 million, on budget with respect to the last approved budget. The initial budget was set at $6.5 million.
WSDOT reports two completed projects and three completed contracts during the quarterWSDOT completed two Connecting Washington (CW) projects and one CW contract in the second quarter of the 2017-2019 biennium (October through December 2017). During the quarter, WSDOT also completed one Nickel contract and one Nickel/Transportation Partnership Account (TPA) contract.
Results WSDOT GoalPRACTICAL SOLUTIONS
WSDOT embraced a Practical Solutions approach on the SR 150/No-See-Um Road - Intersection Improvements and realignment project by replacing the planned signaled intersection with a roundabout design. The new design resulted in a lower project cost, lower annual maintenance costs and less environmental impact.
Return toTable of
Contents
Stewardship – Completed Projects & Contracts GNB Edition 68 | December 2017 | 52
Schedule performance: This project was operationally complete in November 2017, on time with respect to the last approved and initial schedule.
Highlights/Challenges: Installation of water and sewer infrastructure, and costs associated with the path and trail system for the City of Chelan were incorporated into this project.
US 195/Colfax to Spangle - Add Passing Lanes (CW) SPOKANE AND WHITMAN COUNTIES
This contract is part of a larger project and constructed two of six planned passing lanes on US 195 between Colfax and Spangle in both directions. The second phase of the larger project is scheduled to begin construction in 2018.
Project benefits: These additional passing lanes aim to allow for easier lane changes, increase the space between vehicles and reduce the potential for crashes along this corridor.
Budget performance: This contract was delivered for $6.2 million, on budget with respect to the last approved budget. The initial budget was set at $11.65 million.
Schedule performance: This contract was operationally complete in October 2017, on time with respect to the last approved and initial schedule.
Highlights/Challenges: This contract was initially set up as a single project, but was split into two stages to be delivered more effectively.
I-90/Peoh Road Bridge to Elk Heights Road Vicinity Westbound - Replace/Rehab Concrete (Nickel) KITTITAS COUNTY This contract—part of the larger Interstate 90/Concrete Rehabilitation project—constructed a concrete overlay over the westbound lanes of I-90, replaced the asphalt shoulders and restored lane markings and signs on a nine-mile section of the roadway.
Project benefits: The improvements will extend the life of the pavement and improve driver safety and comfort.
Budget performance: This contract was delivered for $26.6 million, on budget with respect to the last approved budget. The initial budget was set at $24.3 million.
Schedule performance: This contract was operationally complete in October 2017, on time with respect to the last approved and initial schedule.
Highlights/challenges: During construction, the combination of unsuitable soils and large traffic volumes caused the roadway shoulders to fail. This led to unanticipated reconstruction, which caused the cost to increase after award.
US 395/NSC - Spokane River to Francis Avenue - Grading (Nickel/TPA) SPOKANE COUNTY
This contract, which is part of the larger North Spokane Corridor (NSC) project, provided improvements to
the NSC through grading, drainage, subgrade construction and curb and sidewalk replacement.
Project benefits: These improvements help to improve road quality and increase safety and efficiency along the NSC.
Budget performance: This contract was delivered for $522,000, on budget with respect to the last approved budget. The initial budget was set at $5,330,000. This large decrease in the budget is due to funds being reallocated to other NSC contracts.
Schedule performance: This contract was operationally complete in October 2017, on time with respect to the last approved and initial schedule.
Highlights/Challenges: This contract was initially set up as a single, larger project, but was split into multiple stages to be delivered.
Contract reportingThe Gray Notebook differentiates completed projects from completed contracts. Contracts are basically smaller segments of larger projects (for example pavement repairs to a section of I-5 that are part of a larger concrete rehabilitation program). Completing contracts may or may not mean these larger projects are finished.

53 | GNB Edition 68 | December 2017 Stewardship – Watch List
WATCH LISTQUARTERLY UPDATE68
Project (County) FundingDate
addedDate
removed Watch List issueProjects remaining on the Watch List
SR 99/South King St. Vicinity to Roy St. - Viaduct Replacement (King)¹
Nickel, TPA
Dec- 2013 -
Seattle Tunnel Partners’ current schedule shows that the tunnel will be complete in October 2018. The 2017 Legislative session provided the program with an additional $77 million. Of this amount, $18 million will be covered by local funding. WSDOT requested an additional $54 million in funding for the 2018 supplemental budget. This funding will not cover court costs, potential settlements, or awarded damages with the contractor. An additional $22 million of local appropriation was later requested to cover utility work and legal expenditures. The state will be fully reimbursed for this additional $22 million. The agency will continue to assess risks and adjust future budget requests accordingly.
SR 150/No-See-Um Rd. - Intersection Improvements and Realignment (Chelan)
CW Mar-2017 -
This project will construct a roundabout at the intersection of SR 150 and No See-Um Road on the north shore of Lake Chelan. The current cost estimate increased by $1.2 million to $7.7 million. Currently, there are two budget risks (right of way and construction) that are being managed by WSDOT on this project. This project has one outstanding right of way acquisition that is currently in condemnation with the Attorney General’s Office. In addition, there are contractor claims that are in negotiations.
U.S. 101/Elwah River Bridge - Bridge Replacement (Clallam)
PEF Oct-2017 -
This project replaces the existing bridge with a new structure, designed to current standards, reducing the potential for catastrophic failure and preserving the functional integrity of the roadway. Project advertisement is likely to be delayed because more time is needed to complete the required environmental process.
I-5/East Fork Lewis River Bridge Northbound - Replace Bridge (Clark)
PEF Nov-2017 -
This project replaces the existing bridge with a new structure, reducing the potential for catastrophic failure and preserving the functional integrity of the Interstate. The project estimate has increased by $12.2 million to $60.9 million. The increase is due to refinement of the engineer's estimate to include unit bid price escalation, the need for additional retaining walls, additional asphalt to level out the roadway surface, and stormwater treatment. The advertisement date was advanced from winter 2021 to winter 2020.
For more information on specific projects on the Watch List, visit: http://bit.ly/ProjectDeliveryReportsArchive.
Data sources: WSDOT Capital Program Development and Management and WSDOT regions.Note: 1 The schedule for this project changes frequently and WSDOT cannot verify the contractor's schedule.
WSDOT’s Watch List shrinks to four projects WSDOT added 33 new projects to its existing 11 projects on the Watch List and removed 40 this quarter (October 2017 through December 2017), leaving four projects on the Watch List as of December 31.
WSDOT maintains the Watch List to deliver on the agency’s commitment to “No Surprises” reporting. WSDOT continuously monitors its projects’ performance to ensure issues affecting schedule or budget are brought to the attention of legislators, executives and the public. The Watch List provides information on issues that have the potential to impact budgets or schedules of projects funded by Pre-existing Funds (PEF), Nickel, Transportation Partnership Account (TPA), and Connecting Washington Program (CW) revenue packages.
The Watch List helps track projects by providing status reports, and by explaining the factors affecting delivery and what the agency is doing about them. Projects are added and removed by WSDOT's Capital Program Development & Management Office. Projects are removed from the Watch List when issues are resolved or a resolution is assigned.
Return toTable of
Contents

Stewardship – Watch List GNB Edition 68 | December 2017 | 54
Project (County) FundingDate
addedDate
removed Watch List issue
Projects no longer on the Watch ListSR 20/Sharpes Corner Vicinity - Improvements (Skagit)
CW Aug-2017
Oct-2017
This project will reduce the risk of collisions and provide relief at the Sharpes Corner and Fidalgo Bay Road intersections on State Route 20 in Anacortes. The project advertisement date has been further delayed to November 2017 and remains at risk. This project has been reported and removed from the Watch List.
SR 508/South Fork Newaukum River Bridge Replacement (Lewis)
PEF Sep-2017
Oct-2017
This project will replace the existing structurally deficient bridge with a new bridge designed to current standards. The hydraulics report on the project identified extensive scour, which was not addressed in the project's design. The subsequent scour analysis determined that a pier re-design was not needed. No additional cost or schedule impacts at this time. This project has been reported and removed from the Watch List.
I-82/Donald Rd. Interchange - Paving (Yakima) & I-82/Yakima Valley Highway Interchange - Paving (Yakima)
PEF Oct-2017
Oct-2017
This project will preserve the Donald Wapato Interchange ramps with chip seal and rehabilitate the crossroad (Donald Wapato Road) with Hot Mix Asphalt. This work will restore and extend the life of the pavement. The method for improving the pavement has changed to Hot Mix Asphalt, which has increased the total estimated cost and delayed the project. Prior to a field inspection, the department anticipated addressing the deficiency with a chip seal treatment. This project has been reported and removed from the Watch List.
SR 224/North 62nd Ave. to Canal Dr. Vicinity - Paving (Benton)
PEF Oct-2017
Oct-2017
The existing pavement west of Richland on SR 224 is deteriorating due to normal wear and tear. This project will pave the road per recommendations from a materials report. The construction has been delayed by one year to align with a city waterline project. This project has been reported and removed from the Watch List.
I-5/Southbound North Fork Lewis River Bridge - Resurfacing (Clark, Cowlitz)
PEF Oct-2017
Oct-2017
This project will rehabilitate the existing bridge deck and joints to maintain the integrity of the roadway surface and to avoid more costly repairs in the future. The project cost increased by $600,000 due to a higher than anticipated bid. This project has been reported and removed from the Watch List.
U.S. 101/SR 6 - Remove Signal (Pacific)
PEF Oct-2017
Oct-2017
The existing signal has reached the end of its serviceable life. This project will remove the signal system and construct a roundabout. This project increased by $523,000 and the operationally complete date was delayed by six months due to the rejection of high bids, combining with another project, and re-advertisement. This project has been reported and removed from the Watch List.
SR 536/Skagit River to I-5 - Paving (Skagit) & SR 536/Front Street to I-5 - ADA Compliance (Skagit)
PEF Oct-2017
Oct-2017
This project will pave SR 536 from the Skagit River to East Kincaid Street in Mt. Vernon and upgrade the sidewalk ramps to comply with the Americans with Disabilities Act. The construction phase has been delayed one year, delaying the operationally complete date to fall 2019. This project has been reported and removed from the Watch List.
SR 28/Ephrata Vicinity to Soap Lake - Seal (Grant) & SR 28/Ephrata Vicinity - ADA Compliance (Grant) & SR 28/Ephrata Vicinity to Soap Lake - Paving (Grant)
PEF Oct-2017
Oct-2017
This project will resurface the highway and reconstruct curb ramps to comply with current Americans with Disabilities Act requirements on SR 28 between Ephrata and Soap Lake in Grant County. A delay on a local utility project has delayed the advertisement of the project by one year. This project has been reported and removed from the Watch List.
SR 397/E Bruneau Ave. - Railroad Crossing Improvements (Benton)
PEF Oct-2017
Oct-2017
The railroad crossing on SR 397 at East Bruneau Ave. in Kennewick has been identified as a location with a potential for train/vehicle collisions. This project will install cantilever-mounted flashing beacons to reduce the risk of collisions. Delays during the design phase have delayed the construction start. This project has been reported and removed from the Watch List.
I-5/NB I-90 to SR 520 - Active Traffic Management (King) & I-5/Northbound Seneca St. to Olive Way - Mobility Improvements (King)
PEF Oct-2017
Oct-2017
The project will construct an additional lane between the Seneca Street off-ramp and the Olive Way off-ramp, install nine new bridge signs, and ramp meters on collector-distributor and Cherry Street on-ramps. It will also extend the Active Traffic and Demand Management system north to SR 520. The advertisement is further delayed to December 2018 to avoid construction overlap. This project has been reported and removed from the Watch List.
Data sources: WSDOT Capital Program Development and Management and WSDOT regions.

Stewardship – Watch List55 | GNB Edition 68 | December 2017
Project (County) FundingDate
addedDate
removed Watch List issue
Projects no longer on the Watch List
I-5/Northbound Spokane St. to Lake Washington Ship Canal Bridge - Special Bridge Repair (King)
PEF Mar-2016
Nov-2017
The special bridge repair on I-5 at the south and north ends of the I-5 Northbound Lanes Viaduct Structure, near the Mercer Street on ramp, has expansion joints that have deteriorated and outlived their useful lifespan. This project replaces the expansion joints between the concrete pavement panels and the south approach slabs of Galer-Lakeview Bridge and Express Galer-Lakeview Bridge on northbound I-5 east of Lake Union. The current cost estimate has further increased by $1.3 million, from $5 million to $6.3 million. The cost increase has been approved by WSDOT. This project has been reported and removed from the Watch List.
I-5/Northbound Boeing Access Rd. to Northeast Ravenna Bridge - Pavement Repair (King)
Nickel Feb-2017
Nov-2017
This project repairs the concrete pavement through select panel replacements and diamond grinding concrete pavement surfaces along the full width of northbound I-5, from northbound I-90 to James Street Vicinity. The current cost estimate has further increased by $4 million, from $16.9 million to $20.9 million. The cost increase has been approved by WSDOT. This project has been reported and removed from the Watch List.
I-5/Northbound I-90 Vicinity to James St. Vicinity - Concrete Pavement Replacement (King)
Nickel Feb-2017
Nov-2017
WSDOT updated the project cost estimate to reflect additional reinforced concrete panel replacement work and bridge approach slabs, a contract incentive to reduce the number of weekend closures, and updated unit bid prices on several bid items, based on recent projects’ costs. The current cost estimate has increased by $2.9 million, from $8.6 million to $11.5 million. The cost increase has been approved by WSDOT. This project has been reported and removed from the Watch List.
I-5/Northbound South Spokane St. Vicinity - Concrete Pavement Replacement (King)
Nickel Apr-2017
Nov-2017
This concrete pavement replacement project has been combined with the “I-5/Northbound Martin Luther King Jr. Way to Northeast Ravenna Bridge - Pavement Repair & More” project into a single design-build contract, to potentially reduce the overall cost of the project and associated traffic impacts. This project was scheduled to be advertised in fall 2016 and operationally complete in fall 2018. The current cost estimate has increased by $2.5 million, from $8.6 million to $11.1 million. This project has been reported and removed from the Watch List.
SR 20/Loup Loup Pass - Emergency Repair 2017 (Okanogan)
PEF Apr-2017
Nov-2017
A substantial rain event occurred which caused a flash flood that washed out and plugged culverts and drainage structures, undermined the highway shoulder, removed a large section of driving lane, and caused a rockslide that covered both lanes of SR 20. During construction, the original damage addressed by the emergency repair contract was more severe than initially estimated. This increased the total estimated cost by approximately $1 million, to $5.5 million. The project was operationally complete in August 2017. This project has been reported and removed from the Watch List.
SR 524/Great Dane Creek - Fish Passage (Snohomish)
PEF Apr-2017
Nov-2017
This project will replace a small box culvert on Great Dane Creek with a larger culvert and rebuild the nearby streambed to provide a clearer passage for salmon and steelhead. The estimated total cost has increased by $511,000, to $1.9 million. The increase is due to the intense coordination with stakeholders to come to an agreement on the freeboard for the new culvert. This project has been reported and removed from the Watch List.
I-90/Eastgate to SR 900 - Peak Use Shoulder Lanes (King)
CW Jul-2017
Nov-2017
After revisiting the 2016 traffic model, it was determined that, with the growth on I-405 and the elimination of the I-90 center roadway for Sound Transit Light Rail, the original scope of work to construct a Peak Use Shoulder Lane on westbound I-90 from SR 900 to Eastgate no longer provided the anticipated travel time improvements. The construction delivery method has changed from Design-Build to Design-Bid-Build, which will delay the advertisement by one year. This project has been reported and removed from the Watch List.
SR 14/Wind River Rd. - Intersection Improvements (Skamania)
CW Sep-2017
Nov-2017
This project will reconstruct the intersection at Wind River Road and SR 14 so that Wind River Road will be more easily utilized by all traffic. The total estimated cost had been estimated to increase by approximately $1 million. A value engineering study identified potential areas where WSDOT could reduce costs in constructing staging, locating the disposal site, and in environmental mitigation needs. With these savings, the project is anticipated to be delivered within the available funding. This project has been reported and removed from the Watch List.
U.S. 97/Satus Creek Bridge - Bridge Replacement (Klickitat)
PEF Sep-2017
Nov-2017
The Satus Creek Bridge was constructed in 1959. The bridge needs replacement with a new structure. This project is located on reservation land and coordination with the Yakama Nation is taking longer than expected. The project's planned advertisement date is being delayed two years, from April 2018 to June 2020. This project has been reported and removed from the Watch List.
Data sources: WSDOT Capital Program Development and Management and WSDOT regions.

Stewardship – Watch List GNB Edition 68 | December 2017 | 56
Project (County) FundingDate
addedDate
removed Watch List issue
Projects no longer on the Watch List
SR 500/Leadbetter Rd. to Southeast 3rd Ave. - Paving (Clark)
PEF Oct-2017
Nov-2017
This project will resurface the deteriorating pavement with a Hot Mix Asphalt grind and inlay to extend the life of the existing pavement. In addition, more pavement repair was required due to winter weather damage. These changes, along with addressing curb ramps, increased the project cost by $1.3 million, to $2.6 million. This project has been reported and removed from the Watch List.
SR 503/3 Miles West of SR 503 Spur - Slope Stabilization (Cowlitz)
PEF Oct-2017
Nov-2017
On March 13, 2017, a slide deposited debris on the roadway, and closed both lanes to traffic. This project will clear the roadway of debris, remove unstable rock by blasting and scaling, and stabilize the slope with rock dowels or rock bolts. This project has increased by $2 million to $3.5 million. The increase is the second stage, which was required after geotechnical analysis. This project has been reported and removed from the Watch List.
US 2/Wenatchee River Bridge - Replace Bridge (Chelan)
TPA Nov-2017
Nov-2017
This project replaced the existing US 2 Wenatchee River Bridge at the top of Tumwater Canyon with a new bridge, which was completed in October 2014. The total cost has increased by $513,000 to $8.6 million. The increase is due to additional Washington State Sales Tax that is owed to the Department of Revenue for the project due to an incorrect interpretation regarding the application of sales tax on projects constructed on leased lands. This project has been reported and removed from the Watch List.
SR 21/South of Republic - Gold Creek Bridge Emergent Repair (Ferry)
PEF Nov-2017
Nov-2017
This emergency project repairs excessive runoff and flooding on the West Fork Sanpoil River Gold Creek Bridge which is in close proximity to Gold Creek Road. This project has increased by $5.6 million, to $6.1 million. The original estimate was done while the emergency was still in progress. It has now been determined that replacing the bridge is the best solution. This project has been reported and removed from the Watch List.
SR 25/Spokane River Bridge - North Embankment Repair (Stevens)
PEF Nov-2017
Nov-2017
This embankment received higher than normal precipitation during the 2017 spring runoff. The slope failure on the west side of SR 25 has encroached to within a few feet of the guardrail. The project estimate has increased by $1.5 million, to $3.1 million due to an updated estimate and the increased work necessary to remove more of the existing fill and replace it with heavy loose riprap and quarry spalls (large boulders or pieces of rock). This project has been reported and removed from the Watch List.
I-90/468th Ave. Southeast to West Summit Rd. Westbound - Rehab Concrete (King)
PEF Nov-2017
Nov-2017
The concrete pavement on westbound I-90 from Snoqualmie Summit to North Bend is rough and deteriorated. This project will replace severely deteriorated panels, and grind the concrete surface full width to extend the pavement life and provide a smoother ride. Project completion is delayed by one year to fall 2020. This project has been reported and removed from the Watch List.
I-90/Bullfrog Road Interchange - Paving (Kittitas)
PEF Nov-2017
Nov-2017
The existing pavement on I-90 approximately five miles west of Cle Elum is deteriorating due to normal wear and tear. This project will preserve the roadway with a chip seal to extend the life of the pavement. The pavement condition has deteriorated at a slower rate than anticipated. As a result, WSDOT will address this location at later date, delaying the advertisement date by one year to fall 2018. In addition, this project will be combined with the I-90/North Bend to Thorp Vicinity - Rehab Concrete contract for construction efficiencies, which will extend the construction duration to two seasons and delay the operationally complete date by two years to fall 2020. This project has been reported and removed from the Watch List.
US 101/D St. Vicinity to Water Street - Paving (Pacific)
PEF Nov-2017
Nov-2017
This project will resurface deteriorating pavement with an asphalt grind and inlay to extend the life of the pavement. The project cost estimate has increased by $770,000, to $1.5 million. The increase is due to increased paving costs and additional bridge work involving paving of the bridge deck. This project has been reported and removed from the Watch List.
SR 165/Wilkeson Creek Bridge to North of Pearl St. Ct. - Stormwater Retrofit (Pierce)
PEF Nov-2017
Nov-2017
This project proposes to provide water quality treatment for SR 165 stormwater runoff that discharges into Wilkeson Creek, and direct highway runoff away from sensitive areas. The construction start for this project has been delayed two years to fall 2018. The delay is due to incorporating the WSDOT project into the city of Wilkeson improvement project in order to eliminate any throw-away work. This project has been reported and removed from the Watch List.
Data sources: WSDOT Capital Program Development and Management and WSDOT regions.

Stewardship – Watch List57 | GNB Edition 68 | December 2017
Project (County) FundingDate
addedDate
removed Watch List issue
Projects no longer on the Watch List
US 395/West Kennewick Ave. to I-182 Bridge - ADA Compliance (Benton)
PEF Nov-2017
Nov-2017
The existing Americans with Disabilities Act (ADA) pedestrian curb ramps at various intersections on US 395 within the city of Kennewick do not fully meet ADA standards. This project will upgrade the curb ramps to meet current standards and improve accessibility for all pedestrians. This project will be combined with two other projects to gain construction efficiencies but will delay the advertisement by six months, also delaying the construction season and operationally complete date. This project has been reported and removed from the Watch List.
US 395/South of Orient - Matsen Creek Washout Emergent Repair (Ferry)
PEF Nov-2017
Nov-2017
Heavy rainfall and snowmelt in the area have produced runoff volumes greater than normal, which have caused debris to clog the existing culvert, and water to back up against the roadway fill and overflow the roadway. The water over the US 395 roadway began causing extensive erosion to the highway fill section, resulting in a total loss of the road. The cost increase on this emergency project is estimated to be $780,000, for a total cost of $1.8 million. The increase is due to adding work to address several unstable slopes on the project and increasing the diameter of the culvert. This project has been reported and removed from the Watch List.
SR 529/Northbound Union Slough Bridge - Scour Repair (Snohomish) & SR 529/Southbound Union Slough Bridge - Rehabilitation (Snohomish) & SR 529/Northbound Union Slough Bridge - Substructure Repair (Snohomish)
PEF Nov-2017
Nov-2017
The SR 529 Union Slough Bridge, located just south of Marysville in Snohomish County, requires bridge scour and substructure repairs to preserve and rehabilitate the bridge to extend the service life. This project will repair the deteriorated concrete columns and crossbeams in the bridge substructure and repair the bridge scour around the footings. A lengthy environmental process has delayed the advertisement date, construction season, and operationally complete date by one year. These projects have been reported and removed from the Watch List.
US 97/Lateral 1 - Intersection Improvements (Yakima) & US 97/Lateral A Intersection - Intersection Improvement (Yakima)1
PEF Nov-2017
Nov-2017
The US 97 Corridor, south of Union Gap to Toppenish, has experienced a history of collisions. This corridor is located within the Yakama Nation. Initially, a series of projects were identified along this corridor to reduce collisions and improve traffic flow by constructing high-speed roundabouts along with smaller operational enhancements. The US 97 Corridor projects have been delayed to determine the best solution to reduce collisions on this corridor. These projects have been reported and removed from the Watch List.
SR 99/George Washington Bridge - Painting (King) & SR 99/George Washington Bridge Painting (Stage 2) (King)
PEF Dec-2013
Dec-2017
WSDOT has separated this work into two projects for delivery to fit within the available funding and to allow for more competitive bidding. The awarded contract was 13% above the engineer's estimate. This increase is mainly due to significantly higher bids for the "Containment of Abrasives" bid item. The bid item is for huge tarps or tent-like structures that control dust emissions associated with sandblasting and bridge painting over environmentally sensitive areas to meet the zero emissions requirement. The estimated cost for Stage 2 is increased by $2.8 million, to $32 million. This project has been reported and removed from the Watch List.
SR 6/Two Tributaries to Chehalis River - Fish Passage (Lewis)
PEF Aug-2017
Dec-2017
Two existing culvert drainage structures on SR 6 just west of the town of Adna have been identified as fish passage barriers. The project will make the existing structures fish passable. The total estimated cost is $5.5 million, which is at risk. Three alternative strategies were considered (box culverts, an alternative alignment, or conventional bridges). By incorporating the bridge alternative and increased bid items, the project cost has increased by $1.9 million. This project has been reported and removed from the Watch List.
US 2/South Fork Skykomish RIver Bridge - Scour Repair (King)
PEF Dec-2017
Dec-2017
This project will place heavy, loose riprap (large stones or rocks) as a countermeasure to prevent scouring around Pier 3 at the southeast corner, at the stream channel west of the pier, and at the exposed bridge footing. WSDOT is evaluating three alternatives for constructability and impacts to environmental permitting to determine the best alternative to address the bridge scour at this location. The evaluation is taking longer than originally anticipated, which has delayed the advertisement date by nine months to winter 2019, and the operationally complete date to fall 2019. This project has been reported and removed from the Watch List.
Data sources: WSDOT Capital Program Development and Management and WSDOT regions.1 Overall project also includes additional projects with different titles (but the same Watch List issues), which were omitted due to space constraints.

Stewardship – Watch List GNB Edition 68 | December 2017 | 58
Project (County) FundingDate
addedDate
removed Watch List issue
Projects no longer on the Watch List
SR 99/George Washington Memorial Bridge - Paving (King)
PEF Dec-2017
Dec-2017
The pavement on the SR 99 George Washington Memorial Bridge in Seattle has deteriorated. This project will remove and replace the asphalt and bridge deck waterproofing layer, and replace the existing pavement joints. The project cost estimate has increased by $1.9 million. This project has been reported and removed from the Watch List.
SR 164/Pussyfoot Creek - Fish Passage (King)
PEF Dec-2017
Dec-2017
The existing drainage structure on SR 164 just south of the White River Amphitheatre has been identified as a fish passage barrier. By replacing the existing structure with a fish passable structure, the restriction to fish passage will be eliminated. This project required more extensive coordination with the Muckleshoot Tribe to agree on the preferred solution than was originally anticipated. This has delayed the advertisement date by one year to fall 2019 and delayed the operationally complete date to fall 2021. This project has been reported and removed from the Watch List.
SR 302/Purdy Bridge - Bridge Rehabilitation (Pierce)
PEF Dec-2017
Dec-2017
The existing bridge, built in 1936, is structurally deficient. By rehabilitating the columns and beams, the structural integrity of the bridge will be preserved. This project's advertisement was delayed from December 2018 to January 2020 to complete the required environmental process. This project has been reported and removed from the Watch List.
SR 432/Cowlitz River Bridge - Painting (Cowlitz)
PEF Dec-2017
Dec-2017
The paint is failing on many sections of the steel structure. This project will clean and paint the steel surfaces to prevent corrosion and preserve the structural integrity of this bridge. The project cost has increased by $1.4 million, to $4.1 million. The increase is due to updated unit price estimates, an increase to the number of working days needed to finish the project in a single season, and increased traffic control. This project has been reported and removed from the Watch List.
SR 503/Rock Creek Rd to Williams Rd. Vicinity - Pavement Rehabilitation (Clark, Cowlitz)
PEF Dec-2017
Dec-2017
This project will resurface the deteriorating pavement with a Hot Mix Asphalt overlay, grind and inlay, and chip seal to extend the life of the existing pavement. Centerline rumble strips will also be installed. This project cost has increased by $1.8 million, to $6.7 million. The increase is due to a change from an overlay, to a grind and inlay in places, an increase of paving depth, the addition of an extra section of roadway to be chip-sealed, and an update to unit price estimates. This project has been reported and removed from the Watch List.
Data sources: WSDOT Capital Program Development and Management and WSDOT regions.

59 | GNB Edition 68 | December 2017 Stewardship – Advertisement Record
ADVERTISEMENT RECORDQUARTERLY UPDATE68
Connecting Washington Account projects in construction1 Through Dec. 31, 2017; County in parentheses; Dollars in millions
Schedule status Completion date
Total project cost
US 195/Colfax to Spangle - Add Passing Lanes (Whitman & Spokane)
US 195/Colfax to Spangle - Add Passing Lanes - Phase 2 On schedule Nov-2018 $5.5
I-5/Rebuild Chamber Way Interchange Improvements (Lewis)
I-5/Chamber Way Bridge - Emergency Repair & Replacement On schedule Oct-2018 $15.6
I-5/Joint Base Lewis-McChord Corridor Improvements (Pierce)
I-5/Mounts Rd. Vicinity - Variable Message Sign On schedule Jan-2018 $0.4
I-5/Mounts Rd. to Center Dr. - Auxiliary Lane Extension (Pierce) Delayed Apr-2018 $11.2
I-5/Steilacoom-Dupont Rd. to Thorne Ln. - Corridor Improvements On schedule Apr-2021 $332.5
SR 518/Des Moines Interchange Improvements (King)
SR 518/Des Moines Memorial Dr. - Interchange Improvements On schedule Oct-2018 $13.5
SR 167/SR 509 Puget Sound Gateway (King)
SR 509/28th/24th Ave. South - City of SeaTac Lead On schedule Jan-2018 $3.6
I-405/Renton to Bellevue - Corridor Widening (King)
I-405/SR 167 Interchange - Direct Connector (Stage 1) On schedule Dec-2018 $168.5
I-5/116th St. and 88th St. Interchanges - Improvements (Snohomish)
I-5/116th St. Northeast Interchange - Tulalip Tribes Lead Advanced Dec-2018 $16.9
Land Mobile Radio Upgrade
Wireless Communication On schedule May-2019 $12.0
SR 20/Sharpes Corner Vicinity Intersection (Skagit)
SR 20/Sharpes Corner Vicinity - Improvements On schedule Aug-2018 $13.4
US 12/Wildcat Bridge Replacement (Yakima)
US 12/Wildcat Creek Bridge - Replace Bridge Advanced Dec-2018 $12.0
Data source: WSDOT Capital Program Development and Management.Note: 1 Connecting Washington projects shows projects currently in construction during the quarter, and does not represent a comprehensive list of completed Connecting Washington projects.
Return toTable of
Contents

Stewardship – Advertisement Record GNB Edition 68 | December 2017 | 60
Nickel & TPA projects in construction Through Dec. 31, 2017; County in parentheses; Dollars in millions
Fund type
Advertised on time Ad date
Operationallycomplete date
Award amount
I-5 Concrete Rehabilitation Program (King) Nickel
I-5/Northbound South 260th to Duwamish River Bridge - Concrete Rehab Nickel N/A Nov-2016 Oct-2018 $30.8
I-5/Northbound Boeing Access Rd. to Northeast Ravenna Bridge - Pavement Repair Nickel N/A Dec-2016 Sep-2019 $38.6
Work associated with the I-5/Northbound South Spokane St. Vicinity - Concrete Pavement Replacement, and I-5/Northbound I-90 Vicinity to James St. Vicinity - Concrete Pavement Replacement is included in I-5/Northbound Boeing Access Rd. to Northeast Ravenna Bridge - Pavement Repair.
SR 99 Alaskan Way Viaduct Replacement (King) Nickel/TPA
SR 99/South King Street Vicinity to Roy Street – Viaduct Replacement
Nickel/TPA √ May-2010 To be determined $1,089.7
The schedule for this project changes frequently and WSDOT cannot verify the contractor's schedule at this time.
US 395/North Spokane Corridor (NSC) – Design and Right of Way – New Alignment (Spokane)
Nickel/TPA
US 395/NSC Freya St. - Structures TPA N/A Dec-2016 Nov-2018 $7.6
I-5/Tacoma HOV Improvements (Pierce) Nickel/TPA
I-5/SR 16 Interchange - Construct HOV Connections TPA √ Feb-2016 Oct-2019 $121.6
I-5/Portland Ave to Port of Tacoma Rd. - Northbound HOV TPA Sep-2014 Jul-2018 $152.6
I-5/M Street to Portland Avenue – Add HOV Lanes Nickel √ Mar-2014 Aug-2018 $99.9
I-90/Snoqualmie Pass East – Hyak to Keechelus Dam – Corridor Improvement (Kittitas) TPA
I-90/Snowshed to Keechelus Dam to Stampede Pass - Add Lanes/ Build Wildfire Bridges TPA Late Feb-2015 Oct-2018 $72.8
I-90/Snowshed to Keechelus Dam Phase 1C – Replace Snowshed and Add Lanes Advertisement was delayed to address fire and safety issues with the original snowshed design, resulting in long-term savings.
TPA Late Apr-2011 Oct-2018 $177.1
I-90/Concrete Rehabilitation1 (multiple counties) Nickel
Data source: WSDOT Capital Program Development and Management.Note: 1 The next I-90 concrete rehabilitation contract is scheduled to be advertised in 2019, but no contracts are currently under construction.

61 | GNB Edition 68 | December 2017 Stewardship – Schedule & Budget Summaries
SCHEDULE & BUDGET SUMMARIESQUARTERLY UPDATE68
Biennial summary of Nickel and Transportation Partnership Account projectsCosts estimated at completion; Dollars in millions
Cumulative to date Fund type
Advertised on time1
Completed on time
Within scope
Baseline cost
Current cost
Completed on budget2
2017-2019 biennium summaryThis information is updated quarterly during the biennium
0 Nickel3 TPA
1 on time2 late
1 on time 2 late 1 $2,713.0 $2,714.6 1 on budget
2 over budget
2015-2017 biennium summary 0 Nickel11 TPA
7 on time4 late
10 on time 1 late 11 $809.9 $777.7 10 on budget
1 over budget
2013-2015 biennium summary 6 Nickel15 TPA
16 on time5 late
15 on time6 late 21 $555.7 $514.0 18 on budget
3 over budget
2011-2013 biennium summary 5 Nickel 36 TPA
31 on time10 late
32 on time9 late 41 $1,485.5 $1,459.6 37 on budget
4 over budget
2009-2011 biennium summary 16 Nickel74 TPA
73 on time17 late
80 on time10 late 90 $1,641.6 $1,597.0 85 on budget
5 over budget
2007-2009 biennium summary 42 Nickel69 TPA
91 on time20 late
96 on time15 late 111 $1,685.7 $1,685.2 102 on budget
9 over budget
2005-2007 biennium summary 52 Nickel24 TPA
71 on time5 late
68 on time8 late 76 $673.9 $668.8 67 on budget
9 over budget
2003-2005 biennium summary 27 Nickel 25 on time2 late
27 on time0 late 27 $124.6 $124.4 25 on budget
2 over budget
Data source: WSDOT Capital Program Development and Management. Notes: Dollar amounts are rounded up. 1 Projects are “on time” if they are operationally complete within the quarter planned in the last approved schedule. 2 Projects are “on budget” if the costs are within 5% of the last approved budget.
WSDOT reports three change orders of $500,000 or more during the quarterDuring the quarter ending December 31, 2017, WSDOT approved three change orders of $500,000 or more. These totaled approximately $2.05 million, with $877,408 in credits to WSDOT and $1.17 million in debits. For the first change order, the state was credited $877,408 due to reduced costs on the I-90, Two-way Transit and HOV project because fewer temporary pavement markings were needed than originally estimated. One change order, valued at approximately $620,000, involved additional costs for redesigning the lighting on the SR 520 Regional Shared Use Path on the SR 520 West Approach Bridge project to ensure safety for users and not disturb residents in surrounding areas. The last change order, valued at about $550,000, covered costs that were higher than expected in the initial contractor's bid for the I-5 Mellen Street to Blakeslee Junction project. After an extensive review—which can involve subject matter experts, contract specialists and other outside stakeholders—WSDOT must sometimes change its engineers’ original plans and specifications in order to complete projects. When this occurs, WSDOT issues a formal modification (or change order) to the contract containing a description of the change and details about how or if the contractor may be compensated for it. Each month, WSDOT posts all change orders estimated to cost $500,000 or more online at http://bit.ly/WSDOTchangeorders.
Return toTable of
Contents

GNB Edition 68 | December 2017 | 62 Stewardship – Pre-existing Funds
PRE-EXISTING FUNDSQUARTERLY UPDATE68
Current cost to complete project advertisements for quarter about $3.4 million more than original value2017-2019 biennium (July 2017 through June 2019); Quarter ending December 31, 2017; Dollars in millions
Number of
projects Original
value
Current cost to
completeTotal PEF advertisements planned for the 2017-2019 biennium
532 $1,060.8 $1,167.91
Actual advertisements Dec. 31, 2017
89 $194.1 $197.5
Data source: WSDOT Capital Program Development and Management.Notes: 1 The current cost to complete for the quarter ending September 30, 2017, was incorrectly reported in GNB 67 as $884.4 million. It is actually $1,167.9 billion.
WSDOT advertises 89 Pre-existing Funds project advertisements during the 2017-2019 bienniumProject status Quarter1 Cumulative2
Projects advanced3 3 3Projects advertised on time 53 80
Emergent projects advertised 4 4
Projects advertised late 2 2
Total projects advertised 62 89
Projects advertised early4 0 0
Projects delayed within the biennium
30 35
Projects deferred out of the biennium
1 1
Projects deleted 0 0Data source: WSDOT Capital Program Development and Management.Notes: 1 Quarter refers to October through
December 2017. 2 Cumulative refers to July 2017 through
June 2019. 3 Advanced includes projects that were
moved up from future quarters. 4 Early includes projects from the quarter
that were advertised in an earlier quarter.
WSDOT advertises 62 Pre-existing Funds projects during the quarter
Cumulative Pre-existing Funds preservation and improvement combined cash flows higher than planned during the 2017-2019 bienniumQuarter ending December 31, 2017; Planned vs. actual expenditures; Dollars in millions
Data source: WSDOT Capital Program Development and Management.
Note: Q2 refers to the second quarter (October through December 2017) of the 2017-2019 biennium which runs from July 2017 through June 2019.
$0
$200
$400
$600
$800
$1,000
$1,200
Q8Q7Q6Q5Q4Q3Q2Q1
Original Plan Actual expenditures Current plan
1
1
1
2
2
Millions 3
3
WSDOT advertised 62 of 93 Pre-existing Funds (PEF) projects in the second quarter of the 2017-2019 biennium (October through December 2017). Of these 93 total projects to be advertised this quarter, three were advanced from future quarters, 53 were on time, four were emergent, two were late, 30 were delayed within the biennium, and one project was deferred out of the biennium. See pp. 63-64 for this quarter’s PEF advertisements.
To date in the 2017-2019 biennium (July 2017 through June 2019), WSDOT’s current cost to complete all 89 PEF projects that have been advertised is $197.5 million, about $3.4 million (1.7%) more than the original value of $194.1 million. See charts at left for additional information.
Combined improvement and preservation cash flows come in slightly higher than original projectionsCumulatively, WSDOT originally planned to have $241.7 million in the combined improvement and preservation cash flow during the second quarter of the 2017-2019 biennium, but had $250.6 million instead (approximately 3.7% more). This $8.9 million variance between the original allotment plan and the current plan was due to reappropriation of funds and over programmed projects.
At the end of a biennium funds not spent on active projects are reappropriated to the ensuing biennium, creating an expenditure plan that exceeds the current allotment plan. The allotment plan is then adjusted when the first supplemental budget is approved. =Additionally, WSDOT may “over-program” preservation projects as a strategy to ensure the highest possible usage of federal obligation authority.
Return toTable of
Contents

Stewardship – Pre-existing Funds63 | GNB Edition 68 | December 2017
Advanced (3)
North Central Region 2017-2019 Region Wide Shoulder Rumble Strip Installation
South Central Region 2017-2019 Region Wide Curve Warning Signs - Chevron Updates
2017-2019 South Central Region - Region Wide Basic Safety - Signing
On time (53)
US 730/0.2 Miles North of Oregon Border - Rockfall Prevention SR 17/US 2 to SR 174 - Chip Seal
US 730/0.9 Miles North of Oregon Border - Rockfall Prevention SR 17/North of Moses Lake - Chip Seal
US 730/1.8 Miles North of Oregon Border - Rockfall Prevention SR 17/Moses Lake North - Chip Seal
SR 9/Gribble Creek - Fish Passage SR 17/Moses Lake North - ADA Compliance
SR 16/West of Southeast Burley Olalla Rd. to Junction SR 3 - Paving SR 28/Ephrata West - Chip Seal
I-90/West Easton Rd. Interchange - Paving SR 508/South Fork Newaukum River Bridge Replacement
I-90/US 97 Interchange - Paving Eastern Region Shoulder Rumble Strip Installation 2017-2019
I-90/Thorp Highway Interchange - Paving SR 902/Medical Lake to I-90 - Paving
US 2/WB I-5 Interchange to SR 204 Interchange - Paving SR 240/Kingsgate Way - Signalize Intersection
US 2/Ebey Slough Vicinity to Bickford Ave. Vicinity - Paving SR 9/108th St. Northeast - Intersection Improvements
SR 99/George Washington Bridge - Painting (Stage 2) SR 92/147th Ave. Northeast Vicinity to Quarry Rd. Vicinity - Paving
SR 99/George Washington Memorial Bridge - Paving SR 96/I-5 Interchange Vicinity to Seattle Hill Rd. Intersection - Paving
SR 20/West of Four Corners Rd. to East of Water St. - Paving SR 96/Seattle Hill Rd. Intersection Vicinity to SR 9 Vicinity - Paving
SR 20/West of Four Corners Rd. to East of Water St. - ADA Compliance
SR 96/I-5 Interchange Vicinity to Seattle Hill Rd. Intersection - ADA Compliance
SR 164/SR 18 to 17th St. Southeast - Paving SR 96/58th Ave Southeast - ADA Compliance
SR 164/SR 18 to M St. Southeast - ADA Compliance SR 128/Snake River Red Wolf Bridge - Deck Rehabilitation
US 2/North Spokane Corridor Pittsburgh Rd. - Intersection Closure Skagit County - Bituminous Surface Treatment (BST)
SR 542/SR 9 East Junction- Intersection Improvements SR 9/Lake Creek Vicinity to SR 538 - BST
I-705/I-5 to Pacific Ave. - Expansion Joint Replacement SR 11/Bellingham City Limits to Iris Lane Vicinity - BST
SR 409/Columbia River Bridge at Puget Island - Painting SR 20/Coupeville Ferry to SR 525 - BST
SR 409/Columbia River Bridge at Puget Island - Deck Replacement SR 203/Langlois Creek - Fish Passage
US 2/Senator Sam Guess Bridge - Special Repair SR 530/SR 9 Vicinity to Sauk Prairie Rd. Vicinity - BST
US 2/Junction I-90 to Euclid Ave. - Paving SR 531/Lake Goodwin Rd. Vicinity to 11th Ave. Northeast Vicinity - BST
SR 92/Little Pilchuck Creek - Fish Passage SR 539/Badger Road to H. Street Rd. Vicinity - BST
I-405/Southbound SR 900 to Coal Creek Parkway Southeast - Paving SR 542/Nooksack River to Mt. Baker Gate - BST
SR 410/White River Bridge - Painting SR 530/SR 9 Intersection - ADA Compliance
SR 530/I-5 Interchange to SR 9 - Paving
Data source: WSDOT Capital Program Development and Management.
WSDOT advertises 63 Pre-existing Funds projects on timeOctober-December 2017
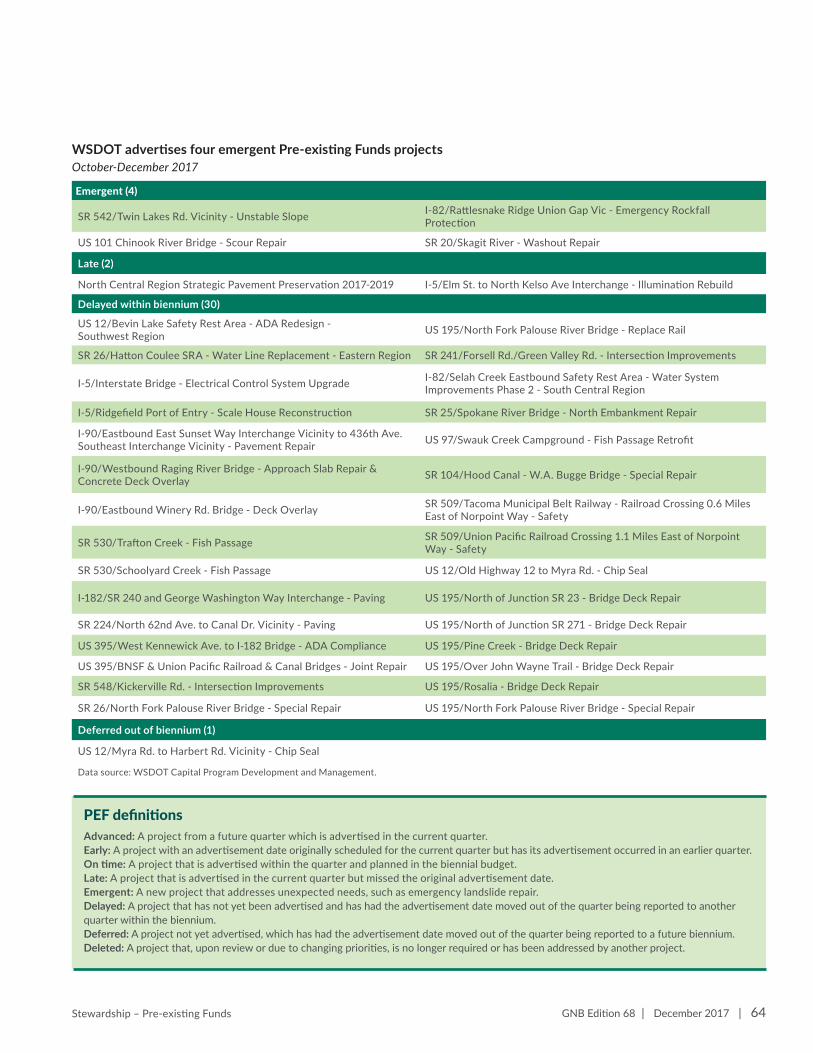
Stewardship – Pre-existing Funds GNB Edition 68 | December 2017 | 64
WSDOT advertises four emergent Pre-existing Funds projectsOctober-December 2017
Emergent (4)
SR 542/Twin Lakes Rd. Vicinity - Unstable Slope I-82/Rattlesnake Ridge Union Gap Vic - Emergency Rockfall Protection
US 101 Chinook River Bridge - Scour Repair SR 20/Skagit River - Washout Repair
Late (2)
North Central Region Strategic Pavement Preservation 2017-2019 I-5/Elm St. to North Kelso Ave Interchange - Illumination Rebuild
Delayed within biennium (30)
US 12/Bevin Lake Safety Rest Area - ADA Redesign - Southwest Region US 195/North Fork Palouse River Bridge - Replace Rail
SR 26/Hatton Coulee SRA - Water Line Replacement - Eastern Region SR 241/Forsell Rd./Green Valley Rd. - Intersection Improvements
I-5/Interstate Bridge - Electrical Control System Upgrade I-82/Selah Creek Eastbound Safety Rest Area - Water System Improvements Phase 2 - South Central Region
I-5/Ridgefield Port of Entry - Scale House Reconstruction SR 25/Spokane River Bridge - North Embankment Repair
I-90/Eastbound East Sunset Way Interchange Vicinity to 436th Ave. Southeast Interchange Vicinity - Pavement Repair US 97/Swauk Creek Campground - Fish Passage Retrofit
I-90/Westbound Raging River Bridge - Approach Slab Repair & Concrete Deck Overlay SR 104/Hood Canal - W.A. Bugge Bridge - Special Repair
I-90/Eastbound Winery Rd. Bridge - Deck Overlay SR 509/Tacoma Municipal Belt Railway - Railroad Crossing 0.6 Miles East of Norpoint Way - Safety
SR 530/Trafton Creek - Fish Passage SR 509/Union Pacific Railroad Crossing 1.1 Miles East of Norpoint Way - Safety
SR 530/Schoolyard Creek - Fish Passage US 12/Old Highway 12 to Myra Rd. - Chip Seal
I-182/SR 240 and George Washington Way Interchange - Paving US 195/North of Junction SR 23 - Bridge Deck Repair
SR 224/North 62nd Ave. to Canal Dr. Vicinity - Paving US 195/North of Junction SR 271 - Bridge Deck Repair
US 395/West Kennewick Ave. to I-182 Bridge - ADA Compliance US 195/Pine Creek - Bridge Deck Repair
US 395/BNSF & Union Pacific Railroad & Canal Bridges - Joint Repair US 195/Over John Wayne Trail - Bridge Deck Repair
SR 548/Kickerville Rd. - Intersection Improvements US 195/Rosalia - Bridge Deck Repair
SR 26/North Fork Palouse River Bridge - Special Repair US 195/North Fork Palouse River Bridge - Special Repair
Deferred out of biennium (1)
US 12/Myra Rd. to Harbert Rd. Vicinity - Chip Seal
Data source: WSDOT Capital Program Development and Management.
PEF definitionsAdvanced: A project from a future quarter which is advertised in the current quarter. Early: A project with an advertisement date originally scheduled for the current quarter but has its advertisement occurred in an earlier quarter. On time: A project that is advertised within the quarter and planned in the biennial budget. Late: A project that is advertised in the current quarter but missed the original advertisement date. Emergent: A new project that addresses unexpected needs, such as emergency landslide repair. Delayed: A project that has not yet been advertised and has had the advertisement date moved out of the quarter being reported to another quarter within the biennium. Deferred: A project not yet advertised, which has had the advertisement date moved out of the quarter being reported to a future biennium. Deleted: A project that, upon review or due to changing priorities, is no longer required or has been addressed by another project.

65 | GNB Edition 68 | December 2017 Statewide Transportation Policy Goals & Gray Notebook Information Guide
68
Americans with Disabilities Act (ADA) Information: Accommodation requests for people with disabilities can be made by contacting the WSDOT Diversity/ADA Affairs team at [email protected] or by calling toll-free, 855-362-4ADA (4232). Persons who are deaf or hard of hearing may make a request by calling the Washington State Relay at 711.
Title VI Statement to Public: It is the Washington State Department of Transportation’s (WSDOT) policy to assure that no person shall, on the grounds of race, color, national origin and sex, as provided by Title VI of the Civil Rights Act of 1964, be excluded from participation in, be denied the benefits of, or be otherwise discriminated against under any of its federally funded programs and activities. Any person who believes his/her Title VI protection has been violated, may file a complaint with WSDOT’s Office of Equal Opportunity (OEO). For Title VI complaint forms and advice, please contact OEO’s Title VI Coordinator at (360) 705-7098.
GNB subject index and edition archives onlineReaders can access the GNB subject index online at bit.ly/GNBsubjectindex. Past GNB editions are available at bit.ly/GNBarchives.
GNB reporting periodsWSDOT programs report their performance data during different periods to best fit the work they do. For example, a program that receives substantial federal funds may report performance based on the federal fiscal year (see charts below).
GNB creditsThe GNB is developed and produced by the small team at WSDOT’s Office of Strategic Assessment and Performance Analysis (OSAPA), and articles feature bylines indicating key contributors from dozens of WSDOT programs. The GNB and GNB Lite are printed in-house by Ronnie Jackson, Trudi Phillips, Talon Randazzo, Larry Shibler, Oma Venable and Deb Webb. OSAPA’s Kate Wilfong coordinates distribution. WSDOT’s graphics team (Marci Mill, Erica Mulherin and Steve Riddle) provides creative assistance, and WSDOT program staff and communicators take the photographs in each edition.
The Gray Notebook is prepared by:
Office of Strategic Assessment and Performance Analysis Washington State Department of Transportation 310 Maple Park Ave SE, Olympia, WA 98504
© 2018 WSDOT. All rights reserved.
Statewide transportation policy goals
Laws enacted in 2007 established policy goals for transportation agencies in Washington (RCW 47.04.280). Throughout its editions, WSDOT’s Gray Notebook reports on progress toward the six statewide transportation policy goals that include:
Æ Safety: To provide for and improve the safety and security of transportation customers and the transportation system;
Æ Preservation: To maintain, preserve, and extend the life and utility of prior investments in transportation systems and services;
Æ Mobility (Congestion Relief): To improve the predictable movement of goods and people throughout Washington, including congestion relief and improved freight mobility;
Æ Environment: To enhance Washington’s quality of life through transportation investments that promote energy conservation, enhance healthy communities, and protect the environment;
Æ Economic Vitality: To promote and develop transportation systems that stimulate, support, and enhance the movement of people and goods to ensure a prosperous economy; and
Æ Stewardship: To continuously improve the quality, effectiveness, and efficiency of the transportation system.
STATEWIDE TRANSPORTATION POLICY GOALS & GRAY NOTEBOOK INFORMATION GUIDE
Calendar, fiscal and federal fiscal quartersJan Feb Mar Apr May Jun Jul Aug Sep Oct Nov Dec
GNB 65 GNB 66 GNB 67 GNB 68Calendar Q1 2017 Q2 2017 Q3 2017 Q4 2017
Fiscal Q3 FY2017 Q4 FY2017 Q1 FY2018 Q2 FY2018Fed. Fiscal Q2 FFY2017 Q3 FFY2017 Q4 FFY2017 Q1 FFY2018
2017-2019 biennial quarters (used by Legislature)Period Quarter Period QuarterJul – Sep 2017 Q1 Jul – Sep 2018 Q5
Oct – Dec 2017 Q2 Oct – Dec 2018 Q6
Jan – Mar 2018 Q3 Jan – Mar 2019 Q7
Apr – Jun 2018 Q4 Apr – Jun 2019 Q8
Return toTable of
Contents