Grassland Bypass Project - · PDF fileSan Luis & Delta-Mendota Water Authority United States...
72
San Luis & Delta-Mendota Water Authority United States Bureau of Reclamation Grassland Bypass Project Annual Monitoring Report 2016 Covering the period: January through December 2016 April 30, 2017 Prepared by: Summers Engineering, Inc. Consulting Engineers Hanford California And U.S. Bureau of Reclamation South Central California Area Office
Transcript of Grassland Bypass Project - · PDF fileSan Luis & Delta-Mendota Water Authority United States...

San Luis & Delta-Mendota Water Authority United States Bureau of Reclamation
Grassland Bypass Project
Annual Monitoring Report 2016
Covering the period: January through December 2016
April 30, 2017
Prepared by: Summers Engineering, Inc.
Consulting Engineers Hanford California
And U.S. Bureau of Reclamation
South Central California Area Office

Grassland Bypass Project
Annual Monitoring Report April 30, 2017
TABLE OF CONTENTS
SECTION 1: EXECUTIVE SUMMARY ................................................................................... 1 SECTION 2: MONITORING OBJECTIVES AND DESIGN.................................................... 2 SECTION 3: MONITORING SITE DESCRIPTIONS ............................................................... 4 SECTION 4: DISCUSSION OF DATA AND EXCEEDANCES .............................................. 7 SECTION 5: EXCEEDANCES AND ACTIONS TO ADDRESS EXCEEDANCES ............. 19 SECTION 6: SUMMARY OF QUALITY ASSURANCE EVALUATION ............................ 23 SECTION 7: USE AGREEMENT MITIGATION MEASURES ............................................. 23 SECTION 8: CONCLUSIONS AND RECOMMENDATIONS .............................................. 24
TABLES TABLE 1 ................................................................... MONITORING SITES AND LOCATIONS TABLE 2 .................................................. MONITORING PARAMETERS AND FREQUENCY TABLE 3 ........................................................................ CIMIS RAINFALL MEASUREMENTS TABLE 4 ................................................................................ WATER QUALITY OBJECTIVES TABLE 5A ..................................... BORON ‐ MONTHLY MEAN CONCENTRATION (µG/L) TABLE 5B .....BORON CONCENTRATION (µG/L) – JANUARY 1 TO DECEMBER 31 2016 TABLE 6 .............................................................. SELENIUM (µG/L) ‐ MONTHLY AVERAGE TABLE 7 ................................................................ SITE B DISCHARGE & SELENIUM LOAD TABLE 8 ............................................................................................ SJRIP DRAINAGE REUSE TABLE 9 ................ DISCHARGE COMPARISON FROM GRASSLAND DRAINAGE AREA
FIGURES
FIGURE 1 ................................................ GRASSLAND BYPASS PROJECT LOCATION MAP FIGURE 2 ....................................................................................... 2016 MONTHLY RAINFALL FIGURE 3 ............................................... SITE B2 (SAN LUIS DRAIN) FLOW & DISCHARGE FIGURE 4 ......................................................................................... SPECIFIC CONDUCTIVITY FIGURE 5 ........................................................................................ BORON CONCENTRATION FIGURE 6 ......................................................................... MOLYBDENUM CONCENTRATION FIGURE 7 .................................................................................. SELENIUM CONCENTRATION FIGURE 8 ............................................................................... SITE D FLOW AND DISCHARGE FIGURE 9 ............................................................................. SITE H2 FLOW AND DISCHARGE FIGURE 10 .............................................................WESTSIDE REGIONAL DRAINAGE PLAN FIGURE 11 ......... GRASSLAND BYPASS PROJECT SELENIUM DISCHARGE & TARGETS
ATTACHMENTS:
ATTACHMENT 1 ........................................................................................... DATA SUMMARY ATTACHMENT 2 ................................................................... SUMMARY OF EXCEEDANCES ATTACHMENT 3 ........................ USBR LABORATORY RESULTS QUALITY ASSURANCE
APPENDICES:
APPENDIX A .................................................................... LABORATORY REPORTS & EDDS APPENDIX B ...................................................................... SAMPLE EVENT PHOTOGRAPHS APPENDIX C ............................................................................ MONITORING MAP GIS FILES
i

Grassland Bypass Project
Annual Monitoring Report April 30, 2017
SEMI-ANNUAL MONITORING REPORT REQUIRED COMPONENTS
Component No. Description Report Section 1 Signed Transmittal Letter Attached 2 Title Page Cover 3 Table of Contents Table of Contents 4 Executive Summary Section 1 5 Monitoring Objectives and Design Section 2 6 Sample Site Descriptions & Rainfall
Records Section 2, Section 3
7 Location Map Section 3 8 Tabulation of Results Attachment 1 9 Discussion of Data Section 4 10 Sampling and analytical methods
used Section 2
11 Quality Assurance Evaluation Section 6 12 Method of Flow Monitoring Section 2 13 Summary of Exceedances Section 4 and 5, Attachment 2 14 Storm Event Monitoring Section 3 15 Actions taken to Address Water
Quality Exceedances Section 5
16 Spatial & Temporal Trends Analysis Section 5 17 Status of Implemented Measures to
Meet Water Quality Objectives Section 5
18 Status of Mitigation Measures Section 7 19 Conclusions & Recommendations Section 8
ii

Grassland Bypass Project
Annual Monitoring Report April 30, 2017
SECTION 1: EXECUTIVE SUMMARY This report covers the 2016 calendar year sampling events beginning after the adoption of Order R5-2015-0094 (Order) in July 2015. After the adoption of the Order, the required monitoring practices were implemented beginning in August 2015. This report summarizes the monitoring data collected between January and December 2016.
The 2016 was classified as a dry/below-normal hydrologic year type for the westside of the San Joaquin Valley with Federal Water Contractors receiving 5% of their federal water contract allocation. A total of 9.7”1 of rain fell during the report period, with significant rain events in January, March, April, May and November. Drainage management activities were able to dramatically reduce drainage discharge in June through September. However storm activities during the non-irrigation season generated subsurface drainage production that exceeded the capacity of drainage management actions to avoid the need for any discharge, resulting in discharge through the San Luis Drain. These discharges were contained within the San Luis Drain and did not trigger a storm water monitoring event.
During the 2016 monitoring period, approximately 8,361 acre feet of subsurface drain water was discharged through the San Luis Drain to Mud Slough (North). No storm water plan actions were required during this report period. Discharge from the San Luis Drain contributed to selenium, specific conductivity, boron, and molybdenum exceedances in Mud Slough (North) measured at Site D. However the selenium load allocation was met in all months of 2016.
Aquatic toxicity samples were collected monthly at Site D for algae, water flea and fathead minnow. No statistically significant aquatic toxicity was observed in any of those samples.
A sediment sample was collected from Site D and tested for sediment toxicity to Hyalella azteca in March and September of 2016. No sediment toxicity was observed in either sample.
Sample collection completion was 94%. Samples were not collected the week of 01/04/2016 due to heavy rain. On January 21st and 28th and March 10th, 17th, and 26th, no samples were taken at Site R as the access road was impassible.
The Grassland Bypass Project has been in operation since 1997. Since that time, agricultural subsurface drainage discharges to the San Joaquin River through Mud Slough North (Site D) have reduced by nearly 90%, resulting in a 97% reduction in the associated load of selenium. Drainage management activities during this report period continued this reduction in discharge, bringing the receiving water bodies closer to compliance with water quality objectives. The Coalition is not recommending any changes at this time.
1 Average of precipitation totals from CIMIS Station 7 and Station 124.
1

Grassland Bypass Project
Annual Monitoring Report April 30, 2017
SECTION 2: MONITORING OBJECTIVES AND DESIGN. The objectives of this monitoring program are to provide data necessary for implementation of the GBP according to the terms and conditions specified in the Order R5-2015-0094 (Order). Monitoring will provide data necessary to assess environmental conditions in the San Luis Drain, wetland supply channels, Mud Slough (North), and the San Joaquin River.
The monitoring plan is designed to provide data to assess compliance with the Order. Flow, water quality, toxicity and sediment will be monitored to ensure compliance and assess potential impacts the project may have on wetland water supply channels and the San Joaquin River. Monitoring will consist of sample collection and data analysis. Data results will then be compared to historical trends as well as standards set forth in the Order. This will help determine if the program is meeting program objectives.
Stormwater monitoring occurs at 4 sites when flows are expected to exceed the capacity of the San Luis Drain. Samples would be collected daily during storm events and will monitor water quality.
Table 1 lists the monitoring sites and locations. Table 2 lists the monitoring parameters and frequency as listed in the MRP for Order R5-2015-0094. All samples were collected using the field sampling standard operating procedures and were collected either directly into the sample container or into a clean bucket and decanted into the sample container.
Table 1: Monitoring Sites and Locations.
Feature CEDEN Code Station Location Latitude Longitude
San Luis Drain
NA B2* Terminus at Mud Slough 37.26100 N ‐120.90520 W
541SLDGCR B3 Gun Club Road 37.23159 N ‐120.87599 W Mud Slough
(north) 541MER542 D Downstream of SLD 37.26374 N ‐120.90627 W
Wetlands channels
541MER505 J* Camp 13 Drain, headworks 36.94117 N ‐120.75685 W
541AGCHWK K2* Agatha Canal, headworks 36.93399 N ‐120.70258 W
541MER563 L2* San Luis Canal upstream of splits 37.09167 N ‐120.82306 W
541MER545 M2* Santa Fe Canal @ Weir Rd 37.09889 N ‐120.82667 W
San Joaquin
River
541SLRACI R China Island Unit 37.33622 N ‐120.96763 W
NA H2* Above Merced River (Hills Ferry) 337.34737 N ‐120.97500 W
535STC504 N Crows Landing 37.43149 N ‐121.01341 W
2

Grassland Bypass Project
Annual Monitoring Report April 30, 2017
Table 2: Monitoring Parameters and Frequency.
Parameter (unit) Type of Sample Station Frequency
Flow (cfs) Method Daily average B2*, D, H2* Daily Field measurements2
pH (pH units) Electrical conductivity (µmhos/cm) Temperature (ºC)
YSI Meter YSI Meter YSI Meter
Grab Grab
Grab
B3, D, R, N B3, D, R, N
B3, D, R, N
Weekly Weekly
Weekly
General physical (EF) Total organic carbon (mg/L)
SM5310 C
Grab
D
Weekly
Selenium (total) (µg/L) (SD) SM3500‐Se‐C (fluorometric)
Grab B3, D, R, N Weekly
Boron (mg/L) (WET) EPA 200.7 Grab B3, D, R, N Weekly Molybdenum (µg/L) (WET) EPA 200.8 Grab B3, D, R, N Monthly Nutrients (WET)
Nitrate as N (mg/L) Ammonia as N (mg/L)
EPA 300.0
SM 4500 NH3 D
Grab
B3, D B3, D
Monthly Monthly
Pesticides To be determined
Grab B3, D, R To be determined
Chronic Aquatic Toxicity (PER) Selenastrum capricornutum (growth)
EPA 821‐R‐02‐013 EPA 600‐4‐91‐02
Grab
D
Monthly
Acute Aquatic Toxicity (PER) Daphnia magna (survival) Pimephales promelas (survival)
EPA 821‐R02‐012
Grab
D D
Monthly
Sediment Toxicity (PER) Hyalella azteca (Survival) Total Organic Carbon (mg/L) Grain size
EPA 600‐R‐99‐064
Walkley‐Black ASTM D4464M
Grab
D
Biannual
Sediment To be determined
Grab B3 Annual
* Flow measurement only. EF: Eurofins Laboratory SD: South Dakota Agriculture Laboratory WET: Western Environmental Testing Laboratory PER: Pacific Ecorisk Laboratories
2 Field measurements shall be noted on the Field Sheet, as well as any physical and/or visual observations regarding the water body, the environment, or surrounding area.
3

Grassland Bypass Project
Annual Monitoring Report April 30, 2017
SECTION 3: MONITORING SITE DESCRIPTIONS Figure 1 shows the general area of the Grassland Bypass Project and identifies the Monitoring Sites. The Monitoring Sites are described below.
Figure 1 – Location Map
4

Grassland Bypass Project
Annual Monitoring Report April 30, 2017
San Luis Drain: - Station B2 (No CEDEN Code): This station is located at the Mud Slough Terminus of the
San Luis Drain (SLD). It is representative of flows coming from the Grassland Drainage Area. Flow is measured at this site over a sharp crested weir. A datalogger on site collects stage data throughout the day, which is used to calculate a daily average discharge.
- Station B3 (541SLDGCR): This station is located in the SLD at the Gun Club Road crossing. This station is representative of water in the SLD. Field measurements, selenium, boron, molybdenum, and nutrients are currently being measured at this site.
Mud Slough (North): - Station D (541MER542): This station is located in Mud Slough downstream of the SLD
discharge. It represents flow, water quality, toxicity, and sediment toxicity in the Mud Slough after mixing with discharges from the drain. Flow, field measurements, TOC, selenium, boron, molybdenum, nutrients, chronic and acute aquatic toxicity, and sediment toxicity are currently being measured at this site. USGS has developed a stage- discharge rating at this site and maintains a monitoring station which provides flow information through CDEC (Station ID: MSG).
Wetland Channels (flow, pH, EC, temperature, selenium and boron are only collected at these sites during storm events):
- Site J (541MER505): This station is located at the headworks of the Camp 13 Ditch. - Site K2 (541AGCHWK): This station in located at the headworks of the Agatha Canal. - Site L2 (541MER563): This station is located in the San Luis Canal upstream of the
splits. - Site M2 (541MER545): This station is located in the Santa Fe Canal at Weir Road.
San Joaquin River:
- Site R (541SLRACI): This station is located in the San Joaquin River near the China Island Unit. It represents water in the San Joaquin River downstream of discharge from Mud Slough. Field measurements, selenium, boron, molybdenum, and nutrients are measured at this site.
- Site H2 (No CEDEN Code): This station is located in the San Joaquin River near but upstream of the Merced River confluence. It represents flow in the San Joaquin River downstream of discharges from Mud Slough. USGS has developed a stage-discharge rating at this site and maintains a monitoring station which provides flow information through CDEC (Station ID: SMN).
- Site N (535STC504): This station in located in the San Joaquin River near Crows Landing. It is a compliance point for the Basin Plan and represents impacts of the project
on the River. Field measurements, selenium, boron, and molybdenum are collected at this site.
5

Grassland Bypass Project
Annual Monitoring Report April 30, 2017
Rainfall Records. Order R5-2015-0094 was adopted on July 30, 2015. The monitoring program required by the new Order was implemented in September 2015.
Two CIMIS3 stations were monitored by the Grassland Coalition for rainfall: Firebaugh/Telles and Panoche. Figure 2 shows the monthly rainfall measured at both stations during the 2016 monitoring period. Figure 2 – Monthly Rainfall
The Firebaugh/Telles precipitation site measured 10.06” for 2016 and the Panoche site measured 9.31”. Table 3 shows the monthly totals for both precipitation sites.
3 California Irrigation Management Information System, http://wwwcimis.water.ca.gov/cimis/welcome.jsp CIMIS Site Designations: Firebaugh/Telles – 007, Panoche - 124
2016 Monthly Rainfall 3.5
3
2.5
2
1.5
1
0.5
0 Jan‐16 Feb‐16 Mar‐16 Apr‐16 May‐16 Jun‐16 Aug‐16 Sep‐16 Oct‐16 Nov‐16 Dec‐16
Firebaugh/Telles Panoche
Prec
ipita
tion
(inch
es)
6

Grassland Bypass Project
Annual Monitoring Report April 30, 2017
Table 3: CIMIS Rainfall Measurements
Month Firebaugh Panoche January 2.99 3.27
February 0.19 0.15 March 1.68 1.52 April 1.12 1.1 May 1.44 1.69 June 0.01 0 July 0 0
August 0 0 September 0.02 0.01
October 0.77 0.08 November 1.06 0.66 December 0.78 0.83
Total: 10.06 9.31
There was not sufficient rainfall during this report period to trigger the Storm Event Plan or cause any stormwater monitoring. A total of 8,361 acre feet were discharged from the San Luis Drain to Mud Slough (North) from January 1 to December 31, 2016. Discharge selenium loads were below the selenium allocations in all months.
SECTION 4: DISCUSSION OF DATA AND EXCEEDANCES In order to properly understand the data collected as part of MRP Order R5-2015-0094, it is important to understand the source and origin of the water discharged as part of the Grassland Bypass Project. Subsurface drainwater, produced through agricultural irrigation, is collected by subsurface drainage systems4 and discharged into regional drains within the Grassland Drainage Area. Drainage management activities, including drainage reuse on the SJRIP, minimize volume of subsurface drainwater. Any drain water that cannot be managed by these drainage activities is discharged to the San Luis Drain, where it makes its way to Mud Slough (North) and ultimately to the San Joaquin River.
Water discharged through the San Luis Drain is highly mineralized and contains moderate to high concentrations of dissolved solids including selenium, boron, and molybdenum. However, because the discharged drain water is consolidated into a single channel (the San Luis Drain) with a distinct discharge point (Site D at Mud Slough), effective water quality monitoring is simplified. The existing monitoring program includes sample locations within the source water, receiving water and background water sites and adequately characterizes the water quality affected by the project. Additional monitoring sites are not required.
Table 4 shows the Water Quality Objectives for each constituent at each site from the San Joaquin River Basin Plan. In many cases, the WQO is dependent on an average calculation (i.e. monthly mean), the time of year, and even hydraulic year type.
7

Grassland Bypass Project
Annual Monitoring Report April 30, 2017
Table 4: Water Quality Objectives Analyte Site Unit WQO (max) WQO (min)
pH
B3
s.u.
Not Applicable NA
6.5
6.5
6.5
D 8.5 R 8.5 N 8.5
EC
B3
uS/cm
Not Applicable NA
NA
NA
NA
D 900 (Ca secondary MCL) R 900 (Ca secondary MCL) N 900 (Ca secondary MCL)
Se
B3
ug/L
Not Applicable NA NA NA
NA
D 20 max, 15 (monthly mean)* R 20 max, 15 (monthly mean)* N 12 max, 5 (4‐day avg)
B
B3 mg/L
Not Applicable NA
NA
NA
D 5.8 max, (2.0 monthy mean, 15 Mar through 15 Sept) R 5.8 max, (2.0 monthy mean, 15 Mar through 15 Sept)
B N mg/L 2.0 max and 0.8 monthly mean 15 Mar through 15 Sept, 2.6 max and 1.0 monthly mean 16 Sept through 14 Mar, 1.3
monthly mean critical year
NA
Mo
B3
ug/L
Not Applicable NA
NA
NA
NA
D 50 ug/L Max ‐ 19 ug/L monthly mean R 50 ug/L Max ‐ 19 ug/L monthly mean N 15 ug/L Max ‐ 10 ug/L monthly mean
Nitrate
B3 mg/L
Not Applicable NA
NA D 10 * Performance Goal. See San Joaquin River Basin Plan
4 Typically perforated drainage tubing buried 6 to 10 feet below ground and connected to form a system of drains that will manage shallow water. Also referred to as “Tile Drains” or “Tile Systems”.
8

Grassland Bypass Project
Annual Monitoring Report April 30, 2017
Since 1996, the Grassland Bypass Project has been implemented to manage, reduce, and ultimately eliminate the discharge of this water through the San Luis Drain. For this report period, there was no flow in the San Luis Drain from June 6 through September 21. Figure 3 shows the daily flow and cumulative discharge (in acre feet) for the 2016 monitoring period. It is important to note that irrigation activities generally wind down by mid-September and discharges through the San Luis Drain after that date are primarily the result of rainfall.
Figure 3: Site B2 (San Luis Drain) Flow & Discharge 9,000
8,000
7,000
80 6,000
5,000
60
4,000
40 3,000
2,000
20
1,000
0 Jan‐16
0 Feb‐16 Mar‐16 Apr‐16 May‐16 Jun‐16 Jul‐16 Aug‐16 Sep‐16 Oct‐16 Nov‐16 Dec‐16
Flow (cfs) Cumulative Discharge (acre‐feet)
Flow
(cfs
)
Disc
harg
e (a
cre‐
feet
)
9

Grassland Bypass Project
Annual Monitoring Report April 30, 2017
Specific Conductivity (µs/cm).
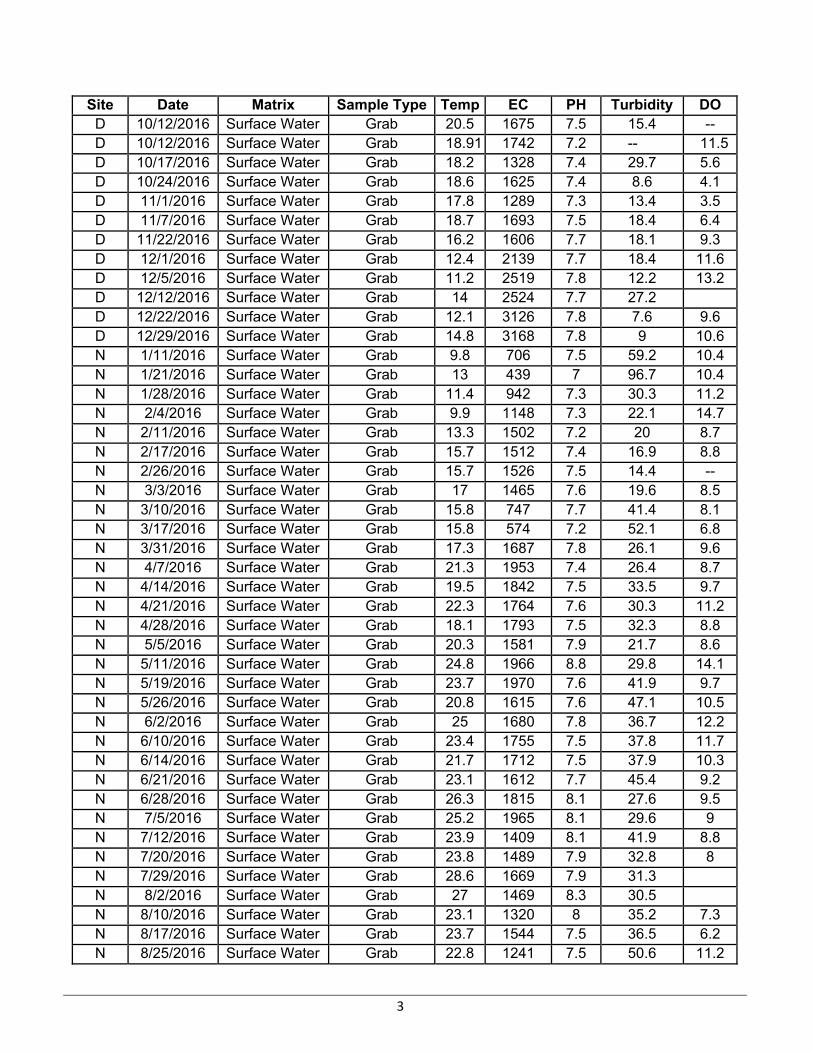
Specific Conductivity (SC) data was collected using field instruments at the time of water sample collection. This data is tabulated as Attachment 1 along with other field-collected data. Figure 4 shows the measured results of the SC at each of the monitoring sites.
SC is a surrogate measurement for Total Dissolved Solids (TDS) and provides an approximate representation of the salinity of the water tested. As would be expected, the SC for water within the San Luis Drain (Site B3) is elevated (average SC of 6,200 µs/cm, with a range of 4,700 to 8,200 µs/cm). This is consistent with the saline nature of subsurface drain water and is generally consistent with past measurements from Site B3.
When the San Luis Drain is flowing, water from Site B3 is discharged into Mud Slough (North) upstream of Site D. As would be expected, SC at Site D increases once discharge through the San Luis Drain begins. It is worth noting that Sites D and R exceeded the SC limit during periods when there was no discharge from the San Luis Drain.
Boron, Molybdenum, and Selenium (µg/L). Boron (B), Molybdenum (Mo), and Selenium (Se) are constituents naturally occurring in the soil within the Grassland Drainage Area and throughout the Westside of the San Joaquin Valley. These minerals are dissolved into the subsurface drainage as the water moves through the soil.
Figure 4: Specific Conductivity (uS/cm) 18,000
16,000
14,000
12,000
10,000
8,000
6,000
4,000
2,000
0 Feb‐16 Mar‐16 Apr‐16 May‐16 Jun‐16 Aug‐16 Sep‐16 Oct‐16 Nov‐16 Dec‐16
Site B3 Site D Site N Site H2 Site R
10

Grassland Bypass Project
Annual Monitoring Report April 30, 2017
Figure 5 shows the boron concentrations measured at each of the monitoring sites during this report period.
The WQO for boron varies according to time of year and location and is based on a monthly mean concentration. For Sites D and R, the WQO is a monthly mean of 2,000 µg/L from March 15 through September 15th and a maximum concentration of 5,800 µg/L for the remainder of the year. For Site N, the monthly mean from March 15th through September 15th is 800 µg/L with a maximum concentration of 2,000 µg/L. For Site N from September 16th through March 14th, the WQO is a monthly mean of 1,000 µg/L with a maximum concentration of 2,600 µg/L. Table 5a shows the monthly mean boron concentrations and Table 5b shows the grab sample readings.
Figure 5: Boron Concentration (mg/L)
5
0
Site B3 B3 grab Site D Site N Site R
11

Grassland Bypass Project
Annual Monitoring Report April 30, 2017
Table 5a: Boron ‐ Monthly Mean Concentration (µg/L)
Month Site B3 Site D Site R WQO ‐ D&R Site N WQO ‐ N January NA* NA* NA* NA* 640 1000 February NA* NA* NA* NA* 1075 1000 March 8816 3378 1650 2000 923 800 April 9354 4025 1700 2000 1350 800 May 11261 2000 1675 2000 1240 800 June 14485 2640 984 2000 822 800 July 18243 1183 815 2000 673 800 August 24435 1077 648 2000 532 800 September 26597 1187 1180 2000 740 800 October NA* NA* NA* NA* 588 1000 November NA* NA* NA* NA* 565 1000 December NA* NA* NA* NA* 1000 1000 * Monthly average concentration not relevant for WQO at these sites.
Table 5b shows the boron concentrations by date and associated WQO for Sites D and R from January 1, 2016 through December 31, 2016.
Table 5b: Boron Concentration (µg/L) – January 1 to December 31 2016
Date
Site B3
Site D
Site R
WQO - D&R
1/11/16 14000 5000 1500 5800 1/21/16 18000 8600 No Sample 5800
1/28/16 11000 4000 No Sample 5800
2/4/16 11000 5100 1800 5800
2/11/16 12000 4700 2000 5800
2/17/16 16000 3000 1800 5800
2/26/16 14000 2900 1600 5800
3/3/16 9200 2000 1500 5800
3/10/16 12000 4900 No Sample 5800
3/17/16 12000 3800 No Sample 5800
3/26/16 12000 3000 No Sample 5800
3/31/16 10000 3000 1800 5800
4/7/16 10000 3400 1800 5800
4/14/16 14000 3700 1900 5800
4/21/16 14000 3000 1500 5800
4/28/16 14000 3200 1600 5800
5/5/16 14000 2900 1200 5800
5/11/16 12000 5800 2600 5800
12

Grassland Bypass Project
Annual Monitoring Report April 30, 2017
Date
Site B3
Site D
Site R
WQO - D&R
5/19/16 14000 4400 1700 5800
5/26/16 15000 3000 1200 5800
6/2/16 14000 1900 1000 5800
6/10/16 15000 1900 1000 5800
6/14/16 15000 2200 1000 5800
6/21/16 16000 2000 920 5800
6/28/16 16000 2900 1000 5800
7/5/16 20000 3100 1100 5800
7/12/16 20000 2800 650 5800 7/20/16 21000 2600 670 5800 7/29/16 24000 1800 840 5800 8/2/16 23000 1600 910 5800 8/10/16 27000 870 650 5800 8/17/16 29000 1300 560 5800 8/25/16 36000 960 520 5800 8/31/16 46000 1000 600 5800 9/12/16 27000 1800 No Sample 5800 9/19/16 6000 1200 760 5800 9/27/16 4500 1800 1600 5800 10/3/16 2800 1900 1500 5800 10/12/16 2600 1300 1200 5800 10/17/16 2600 830 1000 5800 10/24/16 2600 1100 960 5800
11/1/16 13000 860 840 5800 11/7/16 14000 1200 980 5800 11/14/16 No Sample No Sample 1300 5800 11/22/16 2700 1500 940 5800 12/1/16 4400 2000 1400 5800 12/5/16 15000 2700 1100 5800 12/12/16 4200 2400 1500 5800 12/22/16 18000 3300 2000 5800 12/29/16 17000 3500 2400 5800
5900 Indicates exceedance of WQO.
Figure 6 shows the molybdenum concentrations measured at each of the monitoring sites during this report period. The WQO for molybdenum is based on the monthly mean concentration and is
13

Grassland Bypass Project
Annual Monitoring Report April 30, 2017
dependent on location. The WQO for Sites D and R is a monthly mean of no more than 19 µg/L and the WQO for Site N is a monthly mean of no more than 10 µg/L.
Figure 6: Molybdenum Concentration (ug/L) 40
35
30
25
20
15
10
5
0 Apr‐16 May‐16 Nov‐16 Dec‐16
Site B3 Site D Site N Site R WQO ‐ D & R WQO ‐ N
14

Grassland Bypass Project
Annual Monitoring Report April 30, 2017
Figure 7 shows the selenium concentrations measured at each of the monitoring sites during this report period. For Site N, the WQO is a 4-day average of no more than 5 µg/L
Table 6 lists the monthly average selenium concentration for Site D and Site R . Through December of 2019 the selenium WQO for these two sites is a monthly average of no more than 15 µg/L.
Table 6: Selenium (µg/L) ‐ Monthly Average Month Site D Site R WQO - D & R
January 5.03 1.29 15 February 7.73 1.80 15 March 2.73 0.77 15 April 1.67 0.84 15 May 3.44 1.11 15 June 0.52 0.41 15 July 0.43 <0.4 15 August 0.52 <0.4 15 September 0.91 0.64 15 October 0.79 0.65 15 November 0.67 0.45 15 December 1.86 1.01 15
Figure 7: Selenium Concentration (ug/L) 50 45 40 35 30 25 20 15 10
5
0 Feb‐16 Mar‐16 Apr‐16 May‐16 Nov‐16 Dec‐16
Site B3 SL Site B3 BOR B grab Site D Site R Site N MDL
15

Grassland Bypass Project
Annual Monitoring Report April 30, 2017
As with the SC measurements, the saline nature of the subsurface drainage water discharged through Site B resulted in elevated concentrations of boron, molybdenum, and selenium in the downstream receiving waterbody.
Aquatic Toxicity. As required by the MRP Order, aquatic toxicity for algae (Selenastrum capricornutum), water flea (Daphnia magna), and fathead minnow are tested monthly for Site D. During 2016 there were no observations of aquatic toxicity at Site D for any of the three species tested.
Sediment Toxicity. Sediment samples were collected at Site D on April 15th and September 16th, 2016 in accordance with the MRP Order. No statistically significant toxicity to Hyalella azteca was observed in both sampling events.
Attachment 1 includes a tabulation of all of the data results at each of the monitoring sites as required in the MRP Order.
16

Grassland Bypass Project
Annual Monitoring Report April 30, 2017
Discharge. The MRP Order requires flow monitoring at Sites B2, D, and H2. Flow at Site B2 is measured by a sharp-crested weir which is maintained by Panoche Drainage District. Flow at Site D (Mud Slough North downstream of the San Luis Drain Discharge) is measured by the U.S. Geological Survey (USGS) and made publically available on the California Data Exchange Center (CDEC) with the Station ID of MSG. Flow through this site is a combination of subsurface drainage discharges from the San Luis Drain (when it is discharging), agricultural surface discharges, wetland drainage flows, and accreted shallow groundwater. Figure 8 shows the Site D daily flows and cumulative discharge for this report period.
Site H2 (the San Joaquin River above the Merced River) is measured by USGS and made publically available through CDEC (station ID SMN). During the irrigation season, flow through this site is mostly made up of agricultural surface discharges and operational spills. During the non-irrigation season, storm water and flood releases can be a significant fraction of the flow, as well as scheduled pulse flows through the San Joaquin River Restoration Program. Figure 9 shows the Site H2 daily flows and cumulative discharge for this report period.
Figure 8: Site D Flow and Discharge
50
0 Jan‐16
0 Feb‐16 Mar‐16 Apr‐16 May‐16 Jun‐16 Jul‐16 Aug‐16 Sep‐16 Oct‐16 Nov‐16 Dec‐16
Flow (cfs) Cumulative Discharge (acre‐feet)
Flow
(cfs
)
Disc
harg
e (a
cre‐
feet
)
17

Grassland Bypass Project
Annual Monitoring Report April 30, 2017
Monthly selenium load allocations for the Grassland drainage Area were established for the selenium TMDL for the San Joaquin River. Table 7 shows the volume and selenium load discharged from Site B2 (San Luis Drain) in 2016 which was established as a dry/below-normal for the San Joaquin Valley. The selenium load allocation is also shown.
Table 7: Site B Discharge & Selenium Load
Month
Discharge (acre feet)
Se Load
(lbs)
Se Load Allocation
(lbs) January 2,061 104 179 February 1,164 92 104 March 1,704 95 103 April 597 33 108 May 673 28 110 June 7 0 73 July 0 0 73 August 0 0 77 September 97 3 132 October 500 6 131 November 553 6 131 December 1,005 39 179 Totals: 8,361 405 1400
Figure 9: Site H2 Flow and Discharge 2,500
2,000
1,500
1,000
0 Jan‐16 Feb‐16 Mar‐16 Apr‐16 May‐16 Jun‐16 Jul‐16 Aug‐16 Sep‐16 Oct‐16 Nov‐16 Dec‐16
0
Flow (cfs) Cumulative Discharge (acre‐feet)
Flow
(cfs
)
Disc
harg
e (a
cre‐
feet
)
18

Grassland Bypass Project
Annual Monitoring Report April 30, 2017
SECTION 5: EXCEEDANCES AND ACTIONS TO ADDRESS EXCEEDANCES. Because of the saline nature of subsurface drainwater generated from the Westside of the San Joaquin Valley, any discharge of this water will exceed the water quality objectives (WQO) for salinity (measured by SC), selenium, and boron. This is shown in Figures 3 through 6 for SC, boron, molybdenum, and selenium. A tabulation of all exceedances is included in Attachment 2. Generally, water within the San Luis Drain (Site B3) will always have elevated levels of SC, selenium, and boron, and will often be in excess of the molybdenum WQO for downstream receiving waterbodies. It is important to note that the WQOs for SC, selenium, boron or molybdenum do not apply to the San Luis Drain (Site B3) itself. Further, because none of these constituents are materials that are added or can be controlled by farmers within the Grassland Drainage Area, the drainage management actions implemented within the drainage area have focused on reducing drainage production volume.
In 2003 the Westside Regional Drainage Plan (Westside Plan) was developed to address drainage production and discharge from the Grassland Drainage Area. The Westside Plan is intended to 1) identify scientifically sound projects proven to be effective in reducing drainage; 2) develop an aggressive implementation plan initially utilizing existing projects documented to be environmentally sound; and 3) curtail discharges to the San Joaquin River in accordance with impending regulatory constraints while maintaining the ability to farm.
The plan focuses on regional drainage projects that can be implemented on a short timeline. Drainage must be addressed on a regional basis but must allow for each sub-area’s specific needs and resources. The Plan’s key management components for the Grassland Drainage Area are: 1) Source Control, 2) Groundwater Management, 3) Drainage Reuse Projects, and 4) Drain Water Treatment and/or Salt Disposal. As drainage projects are implemented, they will be evaluated for long-term sustainability of the complete solution.
19

Grassland Bypass Project
Annual Monitoring Report April 30, 2017
Figure 10: Westside Regional Drainage Plan
The key components of the Westside Plan are drainage reuse through the San Joaquin River Improvement Project (SJRIP) and source control projects.
Source Control Projects. Source control projects are projects that can reduce the volume of water contributing to subsurface drainage production usually by reducing deep percolation. Source control projects can usually be divided into two categories: on-farm irrigation improvements and distribution infrastructure improvements.
On-farm irrigation improvement projects include converting from a low efficiency irrigation system (such as furrow irrigation) to a high efficiency system (such as drip or micro sprinklers). The State of California and the local districts have made financial assistance (in the form of low interest loans) available to growers as an incentive to convert from conventional irrigation practices to high efficiency drip irrigation (and similar systems). Since the beginning of the Grassland Bypass Project, more than 70% of the farmed acreage within the Grassland Drainage Area has converted to high efficiency irrigation systems.
20

Grassland Bypass Project
Annual Monitoring Report April 30, 2017
Distribution infrastructure improvement projects typically include the replacement of an unlined irrigation canal with a concrete lined channel or pipeline. Unlined channels within the Grassland Drainage Area can contribute more than 200 acre feet of seepage per year for each unlined mile. More than 30 miles of unlined canals have been lined or converted to pipelines since the beginning of the Grassland Bypass Project.
Drainage Reuse. In 2001, funds provided from Proposition 13 allowed for the purchase and improvement of 4,000 acres of land within the Grassland Drainage Area as part of the San Joaquin River Improvement Project (SJRIP) for the purpose of drain water reuse. The location of the SJRIP Project is shown in Figure 1. The first phase of the SJRIP was implemented in the winter of WY 2001 with the planting of salt tolerant crops and construction of distribution facilities. In 2007, with funding from California’s Proposition 50, an additional 2,000 acres of reuse area was purchased, and funding from Reclamation was used to develop the land to salt tolerant crops. Since the project’s inception, the planted acreage has increased from the original 1,821 acres to more than 5,200 acres, which have been irrigated with drainage water or blended water. Table 8 shows the drainage reuse of the SJRIP since its start of operation in 1998.
Table 8: SJRIP Drainage Reuse.
Year Reused Drain Water
Reused Selenium
Reused Boron
Reused Salt
(acre feet) (pounds) (pounds) (tons) 1998¥ 1,211 329 NA 4,608 1999¥ 2,612 321 NA 10,230 2000¥ 2,020 423 NA 7,699 2001 2,850 1,025 61,847 14,491 2002 3,711 1,119 77,134 17,715 2003 5,376 1,626 141,299 27,728 2004 7,890 2,417 193,956 41,444 2005 8,143 2,150 210,627 40,492 2006 9,139 2,825 184,289 51,882 2007 11,233 3,441 210,582 61,412 2008 14,955 3,844 238,435 80,900 2009 11,595 2,807 198,362 60,502 2010 13,119 3,298 370,752 75,362 2011 21,623 4,394 454,675 102,417 2012 23,735 3,293 545,180 118,445 2013 26,170 3,527 568,907 118,883 2014 30,870 3,711 879,800 179,560 2015 31,460 2,644 969,640 178,620 2016 24,573 2,401 886,770 162,421
NA = Not Available ¥ PDD drainage reuse project prior to SJRIP
21

Grassland Bypass Project
Annual Monitoring Report April 30, 2017
Drainage Reuse on the SJRIP has been key to meeting the Total Maximum Monthly Load (TMML) requirements for selenium as well as approaching the ultimate goal of zero discharge.
Figure 11 shows the annual selenium load discharged through the Grassland Bypass Project since the start of the project in 1996. Also shown are the annual selenium target allocations that are part of the 2009 Use Agreement (Agreement No. 10-WC-20-3975 between the San Luis & Delta- Mendota Water Authority and Reclamation). This Use Agreement established selenium load allocations which are more stringent than the load allocations in the Basin Plan.
Figure 11: Grassland Bypass Project - Selenium Discharge and Targets
Spatial & Temporal Trends. By the end of 2016, the drainage management activities of the Westside Plan had reduced discharge through Grassland Bypass Project by 85% (1995 to 2016) with an associated reduction in selenium (97%), salt (83%) and boron (76%) loads. There was no discharge through the San Luis Drain from June to August, indicating that drainage management actions have eliminated drainage during the peak irrigation season. Figure 3 shows the discharge from the San Luis Drain (Site B2) from January to December 2016. 2016 was a dry-below normal year with Federal water contractors within the GDA receiving a 5% allocation and non-Federal contractors receiving
22

Grassland Bypass Project
Annual Monitoring Report April 30, 2017
partial water supplies. Farming operations were supported with carry-over water supplies, out-of- district transfers and groundwater.
As shown on Figure 3, drainage management activities were able to completely eliminate subsurface drainage discharge through the Site B2 for most of the irrigation season – the vast majority of drainage discharge occurred during the non-irrigation season and was induced by rainfall. Because of nature of crop water demand, there is limited reuse capacity during the non- irrigation season, which currently results in discharge through the San Luis Drain. Future plans will expand the reuse area by approximately 2,500 acres and should provide sufficient reuse capacity to eliminate drainage discharge except for certain storm events.
SECTION 6: SUMMARY OF QUALITY ASSURANCE EVALUATION The U.S. Bureau of Reclamation reviews laboratory reports as they are received and performs the necessary quality assurance reviews. A summary of these reviews is included as Attachment 3.
The Grassland Area Farmers reviews the aquatic and sediment toxicity reports. Aquatic toxicity samples are collected monthly and sediment samples are collected twice per year (spring and fall). For all aquatic and laboratory toxicity samples collected during this report period:
• All expected toxicity samples were collected and analyzed. • Reference toxicants were within expected levels.
• Laboratory control tests were within acceptable limits.
SECTION 7: USE AGREEMENT MITIGATION MEASURES The 2009 Use Agreement identifies mitigation requirements for the continued use of the San Luis Drain to mitigate for impacts to Mud Slough (North) and the San Joaquin River.
Following is a summary of compliance with these mitigation requirements:
• Management plans have been developed for meeting selenium loads in years 6-10 through a letter report dated 12-26-13 and submitted to the Oversight Committee representatives through the Technical Policy and Review Team (TPRT). Initial data gathering has started to address the issue of long-term stormwater flows. A sediment management plan was included in the 2009 EIS/EIR and sediment removal options are being investigated.
• During anticipated storm flow operations consistent communication has been provided to downstream users. No recent discharges to wetland channels have occurred however rainfall events in March and April 2016 caused flows to spike and preliminary downstream notifications were issued. Flows rates and velocities in the San Luis Drain are monitored to prevent suspension and discharge of sediment.
• A memorandum of understanding was completed in 2001 with the State Department of Fish and Wildlife regarding impacts to Mud Slough within the China Island refuge. Ongoing monitoring has been completed.
• Supplemental fees are required starting in 2015 for every pound of selenium discharged. A separate account has been established and funds deposited as load numbers are reported.
• Selenium loads have been met in all months 2016. Annual selenium loads were also met.
23

Grassland Bypass Project
Annual Monitoring Report April 30, 2017
SECTION 8: CONCLUSIONS AND RECOMMENDATIONS The Grassland Area Farmers have demonstrated their commitment to the Grassland Bypass Project and the implementation of the Westside Plan as evidenced by the accomplishments as detailed in this report. This includes maintaining and expanding efforts to meet monthly and annual selenium targets while at the same time aggressively pursuing the long term solutions and funding that will be necessary to meet these future requirements by the end of 2019, when it is anticipated that the use of the San Luis Drain will transition into an agreement and permits for the discharge of certain stormwater flow, but no water arising from the irrigation of agriculture.
Since the start of the Grassland Bypass Project in 1997, the discharge of subsurface drainwater from agricultural operations had reduced dramatically. These drastic reductions in discharge, and the associated improvement in water quality of the receiving water bodies, are a result of the aggressive implementation of the Westside Regional Drainage Plan by the Grassland Drainage Area growers. Table 9 shows a discharge comparison of each year from 1995 (pre-project) through 2016 on a water year basis (October through September).
Corrections to the sample collection process have been implemented to ensure photographic data is collected as required. Based on the real progress of the Westside Plan, the Coalition is not recommending any changes to the monitoring program at this time.
Table 9: Discharge Comparison from Grassland Drainage Area Values October thru September WY 95 WY 96 WY 97 WY 98 WY 99 WY 00 WY 01 WY 02 WY 03 WY 04 WY 05 Volume acre-feet 57,574 52,978 39,856 49,289 32,317 31,342 28,238 28,358 28,345 27,640 29,967 Selenium pounds 11,875 10,034 7,096 9,118 5,124 4,603 4,377 3,939 4,032 3,860 4,305 Salts tons 237,530 197,526 172,602 213,533 146,081 139,303 142,415 128,411 126,500 121,138 138,908 Boron 1,000 pounds 868 723 753 983 630 619 423 544 554 530 585
Selenium ppm 0.076 0.070 0.066 0.068 0.058 0.054 0.057 0.051 0.051 0.051 0.053 Salt umhos/cm 4,102 3,707 4,306 4,308 4,587 4,420 5,016 4,503 4,600 4,358 4,611 Boron ppm 5.5 5.0 7.0 7.3 7.2 7.3 5.5 7.1 7.5 7.1 7.2
WY 06 WY 07 WY 08 WY 09 WY 10 WY 11 WY 12 WY 13 WY 14 WY 15 WY 16 Volume acre-feet 25,995 18,531 15,665 13,166 14,529 18,423 10,486 10,258 7,125 6,079 8,361 Selenium pounds 3,563 2,554 1,736 1,264 1,577 2,067 733 638 317 354 405 Salts tons 119,646 79,094 66,254 55,556 64,667 87,537 38,398 54,663 44,834 40,779 39,480 Boron 1,000 pounds 539 278 269 233 315 440 245 309 244 212 212
Selenium ppm 0.050 0.051 0.041 0.035 0.050 0.041 0.025 0.023 0.015 0.021 0.014 Salt umhos/cm 4,577 4,244 4,206 4,196 4,631 4,702 3,641 5,299 6,257 6,670 6,018 Boron ppm 7.6 5.5 6.3 6.5 8.0 8.7 8.6 11.1 12.6 12.8 12.5
Reduction from WY 95 to WY 16
Volume acre-feet 85% Selenium pounds 97% Salts tons 83% Boron 1,000 pounds 76%
24

Grassland Bypass Project
Annual Monitoring Report April 30, 2017
Attachment 1 Data Summary

Grassland Bypass Project
Annual Monitoring Report April 30, 2017
Field Data Summary

1
Site Date Matrix Sample Type Temp EC PH Turbidity DO B3 1/11/2016 Surface Water Grab 11.4 5889 8.2 8.2 13.3 B3 1/21/2016 Surface Water Grab 14 6567 7.8 26.1 12.2 B3 1/28/2016 Surface Water Grab 12.9 5086 7.9 20.2 15.4 B3 2/4/2016 Surface Water Grab 10.8 4912 8.1 27.8 13.8 B3 2/11/2016 Surface Water Grab 17.5 5677 8.4 8 14.9 B3 2/17/2016 Surface Water Grab 16.8 7310 8.3 9.4 12.2 B3 2/26/2016 Surface Water Grab 19.8 6076 8.4 12.1 -- B3 3/3/2016 Surface Water Grab 18.5 4283 8.2 10.4 12.7 B3 3/10/2016 Surface Water Grab 17.3 5398 7.9 20.4 10.8 B3 3/17/2016 Surface Water Grab 18 5161 8.2 20.7 11.9 B3 3/25/2016 Surface Water Grab 15.3 4297 8.4 11.4 -- B3 3/31/2016 Surface Water Grab 18.3 4958 8.1 11.2 7.6 B3 4/7/2016 Surface Water Grab 23.6 5052 8.2 16.4 9.5 B3 4/14/2016 Surface Water Grab 19.6 5866 8.4 9 17.2 B3 4/21/2016 Surface Water Grab 25.1 5861 8.1 4.6 6.7 B3 4/28/2016 Surface Water Grab 18.8 5689 8 8.1 8 B3 5/5/2016 Surface Water Grab 21.3 5671 8.4 4.4 10.9 B3 5/11/2016 Surface Water Grab 24.4 3460 8.4 49.1 10 B3 5/19/2016 Surface Water Grab 25.8 5990 9 17 1.2 B3 5/26/2016 Surface Water Grab 25.6 6166 8.8 17.4 9.4 B3 6/2/2016 Surface Water Grab 25.9 6414 8.4 20.5 7.5 B3 6/10/2016 Surface Water Grab 23.6 6762 8.4 26.2 8.1 B3 6/14/2016 Surface Water Grab 25.6 6960 8.6 31.6 9.4 B3 6/21/2016 Surface Water Grab 22.6 7245 8.6 31.6 8.6 B3 6/28/2016 Surface Water Grab 27.1 7740 8.5 29.1 5.2 B3 7/5/2016 Surface Water Grab 26 8174 8.2 44.6 6.3 B3 7/12/2016 Surface Water Grab 24.7 8626 8.5 61 8.6 B3 7/20/2016 Surface Water Grab 23.9 9333 8.4 74 5.6 B3 7/29/2016 Surface Water Grab 26.5 10136 8.4 87.5 B3 8/2/2016 Surface Water Grab 25.4 10609 8.5 88.3 B3 8/10/2016 Surface Water Grab 23.4 11580 8.6 10.3 B3 8/17/2016 Surface Water Grab 24.5 12706 8.7 99.2 8.4 B3 8/31/2016 Surface Water Grab 28 2492 8.8 164 15.3 B3 9/12/2016 Surface Water Grab 19.2 18995 8.6 164 3.4 B3 9/19/2016 Surface Water Grab 22.2 11497 8.5 65.6 8.6 B3 9/27/2016 Surface Water Grab 23.2 3376 8.1 7.9 7.9 B3 10/3/2016 Surface Water Grab 19.2 3045 7.6 14.3 B3 10/12/2016 Surface Water Grab 21.4 2430 7.9 5.7 -- B3 10/17/2016 Surface Water Grab 18.9 2244 7.8 4.6 7.9 B3 10/24/2016 Surface Water Grab 18.9 2233 7.8 3.5 9.2 B3 11/1/2016 Surface Water Grab 18.2 2164 7.8 5.1 9.2 B3 11/7/2016 Surface Water Grab 18.3 6033 8.2 9.9 11.4 B3 11/22/2016 Surface Water Grab 15.6 2229 8.1 4.4 13.3

2
Site Date Matrix Sample Type Temp EC PH Turbidity DO B3 12/1/2016 Surface Water Grab 11.8 2829 8 2.5 14 B3 12/5/2016 Surface Water Grab 10.5 6757 8.3 4.8 17.9 B3 12/12/2016 Surface Water Grab 13.2 2767 8 2.3 B3 12/22/2016 Surface Water Grab 9.7 8097 7.9 6.4 13.1 B3 12/29/2016 Surface Water Grab 9.7 8103 8 3.5 13.3 D 1/11/2016 Surface Water Grab 10.5 3056 7.7 11.4 8.8 D 1/21/2016 Surface Water Grab 12.9 4159 7.6 17.9 9.7 D 1/28/2016 Surface Water Grab 12.8 2689 7.4 18 11.8 D 2/4/2016 Surface Water Grab 9.8 3381 7.7 23 11.7 D 2/11/2016 Surface Water Grab 16.7 3970 7.9 18.8 7.3 D 2/17/2016 Surface Water Grab 17 2694 7.7 16.5 5.8 D 2/26/2016 Surface Water Grab 16.9 2827 7.7 20 -- D 3/3/2016 Surface Water Grab 18.3 1850 7.9 28.8 7.5 D 3/10/2016 Surface Water Grab 18.2 2994 7.6 45.7 8.2 D 3/17/2016 Surface Water Grab 16.3 2385 7.8 59.5 7.8 D 3/25/2016 Surface Water Grab 15 2147 7.8 63.3 -- D 3/31/2016 Surface Water Grab 17.8 3339 7.9 69.1 8.1 D 4/7/2016 Surface Water Grab 22.4 3098 7.9 58.7 7 D 4/14/2016 Surface Water Grab 19.4 3090 7.8 64 7.8 D 4/21/2016 Surface Water Grab 23.7 3019 7.9 71.1 7.9 D 4/28/2016 Surface Water Grab 18.4 3214 7.8 67.5 8.1 D 5/5/2016 Surface Water Grab 20.8 3497 8 45.5 8.9 D 5/11/2016 Surface Water Grab 24.4 3460 8.4 49.1 10 D 5/19/2016 Surface Water Grab 24.8 3711 8.1 35.7 9.6 D 5/26/2016 Surface Water Grab 22.1 3179 8.1 25.9 11.4 D 6/2/2016 Surface Water Grab 27 2244 7.9 35.2 9.2 D 6/10/2016 Surface Water Grab 25.4 2383 8.2 27.8 12.6 D 6/14/2016 Surface Water Grab 23.7 2567 8 21.9 10.5 D 6/21/2016 Surface Water Grab 23 2353 7.7 24.4 8.5 D 6/28/2016 Surface Water Grab 28.3 3584 8 46.7 8.9 D 7/5/2016 Surface Water Grab 27.6 3817 8.2 31.6 9.8 D 7/12/2016 Surface Water Grab 27.6 3500 8.2 30 10.4 D 7/20/2016 Surface Water Grab 26.1 3317 8 29.8 7.7 D 7/29/2016 Surface Water Grab 29.9 2154 8.1 80 D 8/2/2016 Surface Water Grab 26.2 2163 8.2 94.9 D 8/10/2016 Surface Water Grab 24.7 1350 8.1 7.1 D 8/17/2016 Surface Water Grab 27.1 1738 7.7 54.8 5 D 8/25/2016 Surface Water Grab 22.3 1501 7.8 90.8 9 D 8/31/2016 Surface Water Grab 26.1 1544 7.9 118 9.1 D 9/12/2016 Surface Water Grab 19 2427 7.6 56.5 6.4 D 9/19/2016 Surface Water Grab 21 1476 7.7 70.6 10.5 D 9/27/2016 Surface Water Grab 22.4 1809 7.8 61.9 7.5 D 10/3/2016 Surface Water Grab 16.9 2035 7.3 12.6
3
Site Date Matrix Sample Type Temp EC PH Turbidity DO D 10/12/2016 Surface Water Grab 20.5 1675 7.5 15.4 -- D 10/12/2016 Surface Water Grab 18.91 1742 7.2 -- 11.5 D 10/17/2016 Surface Water Grab 18.2 1328 7.4 29.7 5.6 D 10/24/2016 Surface Water Grab 18.6 1625 7.4 8.6 4.1 D 11/1/2016 Surface Water Grab 17.8 1289 7.3 13.4 3.5 D 11/7/2016 Surface Water Grab 18.7 1693 7.5 18.4 6.4 D 11/22/2016 Surface Water Grab 16.2 1606 7.7 18.1 9.3 D 12/1/2016 Surface Water Grab 12.4 2139 7.7 18.4 11.6 D 12/5/2016 Surface Water Grab 11.2 2519 7.8 12.2 13.2 D 12/12/2016 Surface Water Grab 14 2524 7.7 27.2 D 12/22/2016 Surface Water Grab 12.1 3126 7.8 7.6 9.6 D 12/29/2016 Surface Water Grab 14.8 3168 7.8 9 10.6 N 1/11/2016 Surface Water Grab 9.8 706 7.5 59.2 10.4 N 1/21/2016 Surface Water Grab 13 439 7 96.7 10.4 N 1/28/2016 Surface Water Grab 11.4 942 7.3 30.3 11.2 N 2/4/2016 Surface Water Grab 9.9 1148 7.3 22.1 14.7 N 2/11/2016 Surface Water Grab 13.3 1502 7.2 20 8.7 N 2/17/2016 Surface Water Grab 15.7 1512 7.4 16.9 8.8 N 2/26/2016 Surface Water Grab 15.7 1526 7.5 14.4 -- N 3/3/2016 Surface Water Grab 17 1465 7.6 19.6 8.5 N 3/10/2016 Surface Water Grab 15.8 747 7.7 41.4 8.1 N 3/17/2016 Surface Water Grab 15.8 574 7.2 52.1 6.8 N 3/31/2016 Surface Water Grab 17.3 1687 7.8 26.1 9.6 N 4/7/2016 Surface Water Grab 21.3 1953 7.4 26.4 8.7 N 4/14/2016 Surface Water Grab 19.5 1842 7.5 33.5 9.7 N 4/21/2016 Surface Water Grab 22.3 1764 7.6 30.3 11.2 N 4/28/2016 Surface Water Grab 18.1 1793 7.5 32.3 8.8 N 5/5/2016 Surface Water Grab 20.3 1581 7.9 21.7 8.6 N 5/11/2016 Surface Water Grab 24.8 1966 8.8 29.8 14.1 N 5/19/2016 Surface Water Grab 23.7 1970 7.6 41.9 9.7 N 5/26/2016 Surface Water Grab 20.8 1615 7.6 47.1 10.5 N 6/2/2016 Surface Water Grab 25 1680 7.8 36.7 12.2 N 6/10/2016 Surface Water Grab 23.4 1755 7.5 37.8 11.7 N 6/14/2016 Surface Water Grab 21.7 1712 7.5 37.9 10.3 N 6/21/2016 Surface Water Grab 23.1 1612 7.7 45.4 9.2 N 6/28/2016 Surface Water Grab 26.3 1815 8.1 27.6 9.5 N 7/5/2016 Surface Water Grab 25.2 1965 8.1 29.6 9 N 7/12/2016 Surface Water Grab 23.9 1409 8.1 41.9 8.8 N 7/20/2016 Surface Water Grab 23.8 1489 7.9 32.8 8 N 7/29/2016 Surface Water Grab 28.6 1669 7.9 31.3 N 8/2/2016 Surface Water Grab 27 1469 8.3 30.5 N 8/10/2016 Surface Water Grab 23.1 1320 8 35.2 7.3 N 8/17/2016 Surface Water Grab 23.7 1544 7.5 36.5 6.2 N 8/25/2016 Surface Water Grab 22.8 1241 7.5 50.6 11.2
4
Site Date Matrix Sample Type Temp EC PH Turbidity DO N 8/31/2016 Surface Water Grab 22.9 1525 7.5 6.6 9.7 N 9/12/2016 Surface Water Grab 20.6 1674 7.5 34.1 9.2 N 9/19/2016 Surface Water Grab 20.8 1404 7.5 29.1 10.4 N 9/27/2016 Surface Water Grab 21.5 1670 7.6 40.1 9.6 N 10/3/2016 Surface Water Grab 15.9 1834 6.8 13.7 N 10/12/2016 Surface Water Grab 20.6 1566 7.2 23.6 -- N 10/17/2016 Surface Water Grab 17 614 7.4 22.6 6.9 N 10/24/2016 Surface Water Grab 17.3 624 7.5 13.4 7.7 N 11/1/2016 Surface Water Grab 17.1 886 7.2 13.6 7.6 N 11/7/2016 Surface Water Grab 16.5 1000 7.3 15.9 7.9 N 11/14/2016 Surface Water Grab 16.3 1211 7.4 14.9 8.2 N 11/22/2016 Surface Water Grab 15.1 1126 7.5 14.5 10.4 N 12/1/2016 Surface Water Grab 11.4 1137 7.7 12.8 12.4 N 12/5/2016 Surface Water Grab 10 1211 7.7 11.9 15.3 N 12/12/2016 Surface Water Grab 13 1330 7.5 14.8 N 12/22/2016 Surface Water Grab 8.9 1487 7.7 18.1 11 N 12/29/2016 Surface Water Grab 8 1590 7.8 8.4 13.1 R 1/11/2016 Surface Water Grab 10 1247 7.4 51.5 9.4 R 2/4/2016 Surface Water Grab 10.9 1663 7.8 26.5 14.8 R 2/11/2016 Surface Water Grab 15 2530 7.7 25 9.1 R 2/17/2016 Surface Water Grab 16 2353 7.7 24.3 9.3 R 2/26/2016 Surface Water Grab 17.2 2330 7.8 26.5 -- R 3/3/2016 Surface Water Grab 18 2061 7.8 27.3 8.7 R 3/31/2016 Surface Water Grab 17.9 2310 8 41.4 9.9 R 4/7/2016 Surface Water Grab 22.1 2458 7.9 44 8.6 R 4/14/2016 Surface Water Grab 19.4 2159 7.7 42.3 9.6 R 4/21/2016 Surface Water Grab 23 2321 7.9 38.3 10.4 R 4/28/2016 Surface Water Grab 18.5 2610 7.8 33.4 9.4 R 5/5/2016 Surface Water Grab 20.4 2262 7.6 42.6 9.3 R 5/11/2016 Surface Water Grab 24.8 2277 8.3 46 11.7 R 5/19/2016 Surface Water Grab 24.3 2786 8 65.2 9.2 R 5/26/2016 Surface Water Grab 21.6 1911 7.9 32.2 11 R 6/2/2016 Surface Water Grab 26.3 2004 7.9 49 70.8 R 6/10/2016 Surface Water Grab 24.5 1955 7.9 53.3 10.8 R 6/14/2016 Surface Water Grab 23.4 2050 7.8 47.8 9.2 R 6/21/2016 Surface Water Grab 23 1734 7.7 45.2 8.5 R 6/28/2016 Surface Water Grab 27.6 2116 8.1 64.9 8.6 R 7/5/2016 Surface Water Grab 26.8 2438 8.3 49.7 9.1 R 7/12/2016 Surface Water Grab 25.6 1431 8 46.3 7.9 R 7/20/2016 Surface Water Grab 25.6 1583 8.2 38.7 8.5 R 7/29/2016 Surface Water Grab 29.2 1791 8.3 33.8 R 8/2/2016 Surface Water Grab 27 1968 8.3 28.7 R 8/10/2016 Surface Water Grab 24 1511 7.8 48.3 8.5

5
Site Date Matrix Sample Type Temp EC PH Turbidity DO R 8/17/2016 Surface Water Grab 24.4 1450 7.9 32 8 R 8/25/2016 Surface Water Grab 23.2 1261 7.9 46.7 9.4 R 8/31/2016 Surface Water Grab 25.2 1421 8 65.6 10.1 R 9/19/2016 Surface Water Grab 21.2 1648 7.7 62.7 11.4 R 9/27/2016 Surface Water Grab 22.6 1888 7.8 60.8 9.3 R 10/3/2016 Surface Water Grab 15.9 2334 7..4 14.5 R 10/12/2016 Surface Water Grab 20 2052 7.7 31.3 -- R 10/17/2016 Surface Water Grab 17.7 1744 7.6 27.4 7 R 10/24/2016 Surface Water Grab 18.6 1741 7.6 20.4 7.4 R 11/1/2016 Surface Water Grab 17.7 1332 7.4 17.9 5.7 R 11/7/2016 Surface Water Grab 17.4 1769 7.6 17 6.6 R 11/14/2016 Surface Water Grab 17.2 1988 7.7 25 7.5 R 11/22/2016 Surface Water Grab 15.1 1719 7.8 26.7 10.2 R 12/1/2016 Surface Water Grab 11.2 1832 7.8 20.8 11.8 R 12/5/2016 Surface Water Grab 9.6 1810 7.9 16.8 15 R 12/12/2016 Surface Water Grab 13.7 2149 7.8 22.6 R 12/22/2016 Surface Water Grab 8.9 2277 7.6 22.7 10.4 R 12/29/2016 Surface Water Grab 9.3 2637 7.7 15.4 11
Temp = Temperature reported in degrees °C unless otherwise noted.
EC = Electrical Conductivity as Specific Conductance normalized to 25°C and reported as µS/cm.
Turbidity = reported in NTU's
EH = ORP reported in mV
DO = Dissolved oxygen reported in mg/L

Grassland Bypass Annual Monitoring Report Project April 30, 2017
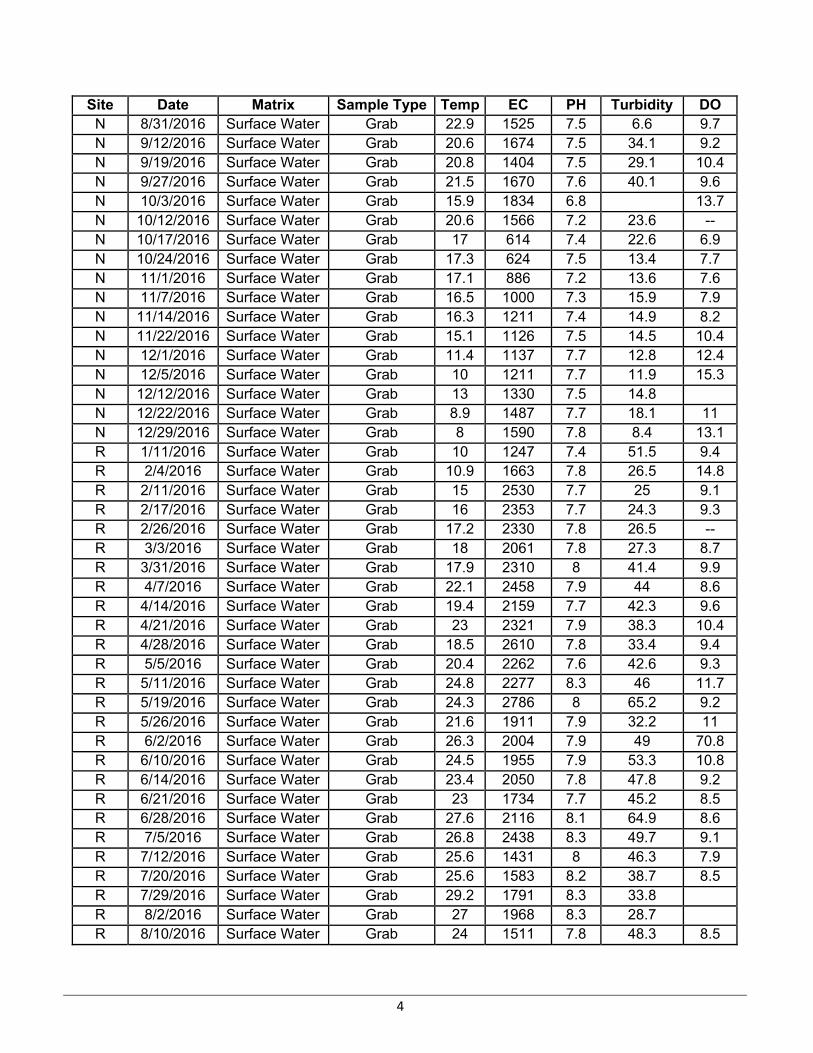
Laboratory Data Summary

Site Date Analyte Result Units Report Limit QA Type Method B3 1/28/2016 AMMONIA AS N 0.14 mg/l 0.050 Production SM 4500 NH3 D B3 2/17/2016 AMMONIA AS N 0.088 mg/l 0.050 Production SM 4500 NH3 D B3 3/17/2016 AMMONIA AS N 0.1 mg/l 0.050 Production SM 4500 NH3 D B3 4/21/2016 AMMONIA AS N 0.38 mg/l 0.050 Production SM 4500 NH3 D B3 5/26/2016 AMMONIA AS N 0.1 mg/l 0.050 Production SM 4500 NH3 D B3 6/28/2016 AMMONIA AS N 0.18 mg/l 0.050 Production SM 4500 NH3 D B3 7/20/2016 AMMONIA AS N 0.42 mg/l 0.050 Production SM 4500 NH3 D B3 8/17/2016 AMMONIA AS N 0.45 mg/l 0.050 Production SM 4500 NH3 D B3 9/27/2016 AMMONIA AS N 0.079 mg/l 0.050 Production SM 4500 NH3 D B3 10/24/2016 AMMONIA AS N 0.052 mg/l 0.050 Production SM 4500 NH3 D B3 11/22/2016 AMMONIA AS N 0.18 mg/l 0.050 Production SM 4500 NH3 D B3 12/29/2016 AMMONIA AS N 0.12 mg/l 0.050 Production SM 4500 NH3 D B3 1/11/2016 BORON 14000 ug/l 400 Production EPA 200.7 B3 1/21/2016 BORON 18000 ug/l 400 Production EPA 200.7 B3 1/28/2016 BORON 11000 ug/l 200 Production EPA 200.7 B3 2/4/2016 BORON 11000 ug/l 200 Production EPA 200.7 B3 2/11/2016 BORON 12000 ug/l 200 Production EPA 200.7 B3 2/17/2016 BORON 16000 ug/l 200 Production EPA 200.7 B3 2/26/2016 BORON 14000 ug/l 200 Production EPA 200.7 B3 3/3/2016 BORON 9200 ug/l 100 Production EPA 200.7 B3 3/10/2016 BORON 12000 ug/l 200 Production EPA 200.7 B3 3/17/2016 BORON 12000 ug/l 200 Production EPA 200.7 B3 3/25/2016 BORON 12000 ug/l 200 Production EPA 200.7 B3 3/31/2016 BORON 10000 ug/l 200 Production EPA 200.7 B3 4/7/2016 BORON 10000 ug/l 100 Production EPA 200.7 B3 4/14/2016 BORON 14000 ug/l 200 Production EPA 200.7 B3 4/21/2016 BORON 14000 ug/l 200 Production EPA 200.7 B3 4/28/2016 BORON 14000 ug/l 200 Production EPA 200.7 B3 5/5/2016 BORON 14000 ug/l 200 Production EPA 200.7 B3 5/11/2016 BORON 12000 ug/l 200 Production EPA 200.7 B3 5/19/2016 BORON 14000 ug/l 200 Production EPA 200.7 B3 5/26/2016 BORON 15000 ug/l 200 Production EPA 200.7 B3 6/2/2016 BORON 14000 ug/l 200 Production EPA 200.7 B3 6/10/2016 BORON 15000 ug/l 200 Production EPA 200.7 B3 6/14/2016 BORON 15000 ug/l 200 Production EPA 200.7 B3 6/21/2016 BORON 16000 ug/l 200 Production EPA 200.7 B3 6/28/2016 BORON 16000 ug/l 200 Production EPA 200.7 B3 7/5/2016 BORON 20000 ug/l 200 Production EPA 200.7 B3 7/12/2016 BORON 20000 ug/l 200 Production EPA 200.7 B3 7/20/2016 BORON 21000 ug/l 200 Production EPA 200.7 B3 7/29/2016 BORON 24000 ug/l 200 Production EPA 200.7 B3 8/2/2016 BORON 23000 ug/l 200 Production EPA 200.7 B3 8/10/2016 BORON 27000 ug/l 200 Production EPA 200.7 B3 8/17/2016 BORON 29000 ug/l 200 Production EPA 200.7 B3 8/31/2016 BORON 36000 U ug/l 200 Production EPA 200.7 B3 9/12/2016 BORON 46000 ug/l 400 Production EPA 200.7 B3 9/19/2016 BORON 27000 ug/l 200 Production EPA 200.7 B3 9/27/2016 BORON 6000 ug/l 100 Production EPA 200.7 B3 10/3/2016 BORON 4500 ug/l 20 Production EPA 200.7 B3 10/12/2016 BORON 2800 ug/l 20 Production EPA 200.7 B3 10/17/2016 BORON 2600 ug/l 20 Production EPA 200.7
1

Site Date Analyte Result Units Report Limit QA Type Method B3 10/24/2016 BORON 2600 ug/l 20 Production EPA 200.7 B3 11/1/2016 BORON 2600 ug/l 20 Production EPA 200.7 B3 11/7/2016 BORON 13000 ug/l 20 Production EPA 200.7 B3 11/22/2016 BORON 2700 ug/l 20 Production EPA 200.7 B3 12/1/2016 BORON 4400 ug/l 20 Production EPA 200.7 B3 12/5/2016 BORON 15000 ug/l 200 Production EPA 200.7 B3 12/12/2016 BORON 4200 ug/l 20 Production EPA 200.7 B3 12/22/2016 BORON 18000 ug/l 200 Production EPA 200.7 B3 12/29/2016 BORON 17000 ug/l 200 Production EPA 200.7 B3 1/28/2016 MOLYBDENUM 16 ug/l 1.0 Production EPA 200.8 B3 2/17/2016 MOLYBDENUM 28 ug/l 1.0 Production EPA 200.8 B3 3/17/2016 MOLYBDENUM 16 ug/l 1.0 Production EPA 200.8 B3 4/21/2016 MOLYBDENUM 21 ug/l 1.0 Production EPA 200.8 B3 5/26/2016 MOLYBDENUM 20 ug/l 1.0 Production EPA 200.8 B3 6/28/2016 MOLYBDENUM 18 ug/l 1.0 Production EPA 200.8 B3 7/20/2016 MOLYBDENUM 15 ug/l 5.0 Production EPA 200.8 B3 8/17/2016 MOLYBDENUM 24 ug/l 5.0 Production EPA 200.8 B3 9/27/2016 MOLYBDENUM 34 ug/l 1.0 Production EPA 200.8 B3 10/24/2016 MOLYBDENUM 33 ug/l 1.0 Production EPA 200.8 B3 11/22/2016 MOLYBDENUM 29 ug/l 1.0 Production EPA 200.8 B3 12/29/2016 MOLYBDENUM 26 ug/l 1.0 Production EPA 200.8 B3 1/28/2016 NITRATE AS N (DISSOLVED) 3.6 mg/l 0.20 Production EPA 300.0 B3 2/17/2016 NITRATE AS N (DISSOLVED) 4.8 mg/l 0.010 Production EPA 300.0 B3 3/17/2016 NITRATE AS N (DISSOLVED) 2.6 mg/l 0.10 Production EPA 300.0 B3 4/21/2016 NITRATE AS N (DISSOLVED) 0.95 T,V mg/l 0.010 Production EPA 300.0 B3 5/26/2016 NITRATE AS N (DISSOLVED) < 0.010 mg/l 0.010 Production EPA 300.0 B3 6/28/2016 NITRATE AS N (DISSOLVED) < 0.010 mg/l 0.010 Production EPA 300.0 B3 7/20/2016 NITRATE AS N (DISSOLVED) < 0.010 mg/l 0.010 Production EPA 300.0 B3 8/17/2016 NITRATE AS N (DISSOLVED) 0.076 mg/l 0.050 Production EPA 300.0 B3 9/27/2016 NITRATE AS N (DISSOLVED) < 0.010 T mg/l 0.010 Production EPA 300.0 B3 10/24/2016 NITRATE AS N (DISSOLVED) 0.021 mg/l 0.010 Production EPA 300.0 B3 11/22/2016 NITRATE AS N (DISSOLVED) < 0.010 mg/l 0.010 Production EPA 300.0 B3 12/29/2016 NITRATE AS N (DISSOLVED) 7.2 T mg/l 0.050 Production EPA 300.0 B3 1/11/2016 SELENIUM 23.8 ug/l 0.8 Production SM3500-Se-C B3 1/21/2016 SELENIUM 16.3 ug/l 0.8 Production SM3500-Se-C B3 1/28/2016 SELENIUM 20.3 ug/l 0.8 Production SM3500-Se-C B3 2/4/2016 SELENIUM 29.1 ug/l 0.8 Production SM3500-Se-C B3 2/11/2016 SELENIUM 37.6 ug/l 0.8 Production SM3500-Se-C B3 2/17/2016 SELENIUM 38.8 ug/l 0.8 Production SM3500-Se-C B3 2/26/2016 SELENIUM 28 ug/l 0.8 Production SM3500-Se-C B3 3/3/2016 SELENIUM 18.9 ug/l 0.8 Production SM3500-Se-C B3 3/10/2016 SELENIUM 20.4 ug/l 0.8 Production SM3500-Se-C B3 3/17/2016 SELENIUM 20 ug/l 0.8 Production SM3500-Se-C B3 3/25/2016 SELENIUM 20.6 ug/l 0.8 Production SM3500-Se-C B3 3/31/2016 SELENIUM 15.9 ug/l 0.8 Production SM3500-Se-C B3 4/7/2016 SELENIUM 11.8 ug/l 0.8 Production SM3500-Se-C B3 4/14/2016 SELENIUM 23.9 ug/l 0.8 Production SM3500-Se-C B3 4/21/2016 SELENIUM 21.6 ug/l 0.8 Production SM3500-Se-C B3 4/28/2016 SELENIUM 17.5 ug/l 0.8 Production SM3500-Se-C B3 5/5/2016 SELENIUM 16.3 ug/l 0.8 Production SM3500-Se-C B3 5/11/2016 SELENIUM 18.5 ug/l 0.8 Production SM3500-Se-C
2

Site Date Analyte Result Units Report Limit QA Type Method B3 5/19/2016 SELENIUM 18.2 ug/l 0.8 Production SM3500-Se-C B3 5/26/2016 SELENIUM 15.2 ug/l 0.8 Production SM3500-Se-C B3 6/2/2016 SELENIUM 12.8 ug/l 0.8 Production SM3500-Se-C B3 6/10/2016 SELENIUM 10.5 ug/l 0.8 Production SM3500-Se-C B3 6/14/2016 SELENIUM 11.4 ug/l 0.8 Production SM3500-Se-C B3 6/21/2016 SELENIUM 11.3 ug/l 0.8 Production SM3500-Se-C B3 6/28/2016 SELENIUM 10.7 ug/l 0.8 Production SM3500-Se-C B3 7/5/2016 SELENIUM 8.72 ug/l 0.8 Production SM3500-Se-C B3 7/12/2016 SELENIUM 10.1 ug/l 0.8 Production SM3500-Se-C B3 7/20/2016 SELENIUM 11.1 ug/l 0.8 Production SM3500-Se-C B3 7/29/2016 SELENIUM 13.2 ug/l 0.8 Production SM3500-Se-C B3 8/2/2016 SELENIUM 12 ug/l 0.4 Production SM3500-Se-C B3 8/10/2016 SELENIUM 12.2 ug/l 0.4 Production SM3500-Se-C B3 8/17/2016 SELENIUM 17.1 ug/l 0.4 Production SM3500-Se-C B3 8/31/2016 SELENIUM 29.2 ug/l 0.4 Production SM3500-Se-C B3 9/12/2016 SELENIUM 29.5 ug/l 0.8 Production SM3500-Se-C B3 9/19/2016 SELENIUM 11 ug/l 0.8 Production SM3500-Se-C B3 9/27/2016 SELENIUM 8.2 ug/l 0.8 Production SM3500-Se-C B3 10/3/2016 SELENIUM 5.11 ug/l 0.8 Production SM3500-Se-C B3 10/12/2016 SELENIUM 4.38 ug/l 0.8 Production SM3500-Se-C B3 10/17/2016 SELENIUM 4.31 ug/l 0.8 Production SM3500-Se-C B3 10/24/2016 SELENIUM 3.86 ug/l 0.8 Production SM3500-Se-C B3 11/1/2016 SELENIUM 3.07 ug/l 0.8 Production SM3500-Se-C B3 11/7/2016 SELENIUM 7.2 ug/l 0.8 Production SM3500-Se-C B3 11/22/2016 SELENIUM 3.59 ug/l 0.8 Production SM3500-Se-C B3 12/1/2016 SELENIUM 2.57 ug/l 0.8 Production SM3500-Se-C B3 12/5/2016 SELENIUM 9.93 ug/l 0.8 Production SM3500-Se-C B3 12/12/2016 SELENIUM 3.05 ug/l 0.8 Production SM3500-Se-C B3 12/22/2016 SELENIUM 26.7 ug/l 0.8 Production SM3500-Se-C B3 12/29/2016 SELENIUM 31.5 ug/l 0.8 Production SM3500-Se-C D 1/28/2016 AMMONIA AS N 0.3 mg/l 0.050 Regular SM 4500 NH3 D D 2/17/2016 AMMONIA AS N 0.28 mg/l 0.050 Regular SM 4500 NH3 D D 3/17/2016 AMMONIA AS N 0.22 mg/l 0.050 Regular SM 4500 NH3 D D 4/21/2016 AMMONIA AS N 0.21 mg/l 0.050 Regular SM 4500 NH3 D D 5/26/2016 AMMONIA AS N 0.074 mg/l 0.050 Regular SM 4500 NH3 D D 6/28/2016 AMMONIA AS N 0.19 mg/l 0.050 Regular SM 4500 NH3 D D 7/20/2016 AMMONIA AS N 0.14 mg/l 0.050 Regular SM 4500 NH3 D D 8/17/2016 AMMONIA AS N 0.092 mg/l 0.050 Regular SM 4500 NH3 D D 9/27/2016 AMMONIA AS N 0.17 mg/l 0.050 Regular SM 4500 NH3 D D 10/24/2016 AMMONIA AS N 0.1 mg/l 0.050 Regular SM 4500 NH3 D D 11/22/2016 AMMONIA AS N 0.21 L mg/l 0.050 Regular SM 4500 NH3 D D 12/29/2016 AMMONIA AS N 0.18 mg/l 0.050 Regular SM 4500 NH3 D D 1/11/2016 BORON 5000 ug/l 100 Regular EPA 200.7 D 1/21/2016 BORON 8600 ug/l 200 Regular EPA 200.7 D 1/28/2016 BORON 4000 ug/l 100 Regular EPA 200.7 D 2/4/2016 BORON 5100 ug/l 20 Regular EPA 200.7 D 2/11/2016 BORON 4700 ug/l 20 Regular EPA 200.7 D 2/17/2016 BORON 3000 ug/l 20 Regular EPA 200.7 D 2/26/2016 BORON 2900 ug/l 20 Regular EPA 200.7 D 3/3/2016 BORON 2000 ug/l 20 Regular EPA 200.7 D 3/10/2016 BORON 4900 ug/l 100 Regular EPA 200.7
3

Site Date Analyte Result Units Report Limit QA Type Method D 3/17/2016 BORON 3800 ug/l 20 Regular EPA 200.7 D 3/25/2016 BORON 3000 ug/l 40 Regular EPA 200.7 D 3/31/2016 BORON 3400 ug/l 20 Regular EPA 200.7 D 4/7/2016 BORON 3700 ug/l 20 Regular EPA 200.7 D 4/14/2016 BORON 3400 ug/l 20 Regular EPA 200.7 D 4/21/2016 BORON 3000 ug/l 20 Regular EPA 200.7 D 4/28/2016 BORON 3200 ug/l 20 Regular EPA 200.7 D 5/5/2016 BORON 2900 ug/l 20 Regular EPA 200.7 D 5/11/2016 BORON 5800 ug/l 20 Regular EPA 200.7 D 5/19/2016 BORON 4400 ug/l 20 Regular EPA 200.7 D 5/26/2016 BORON 3000 ug/l 20 Regular EPA 200.7 D 6/2/2016 BORON 1900 ug/l 20 Regular EPA 200.7 D 6/10/2016 BORON 1900 ug/l 20 Regular EPA 200.7 D 6/14/2016 BORON 2200 ug/l 20 Regular EPA 200.7 D 6/21/2016 BORON 2000 ug/l 20 Regular EPA 200.7 D 6/28/2016 BORON 2900 ug/l 20 Regular EPA 200.7 D 7/5/2016 BORON 3100 ug/l 40 Regular EPA 200.7 D 7/12/2016 BORON 2800 ug/l 20 Regular EPA 200.7 D 7/20/2016 BORON 2600 ug/l 20 Regular EPA 200.7 D 7/29/2016 BORON 1800 ug/l 20 Regular EPA 200.7 D 8/2/2016 BORON 1600 ug/l 20 Regular EPA 200.7 D 8/10/2016 BORON 870 ug/l 20 Regular EPA 200.7 D 8/17/2016 BORON 1300 ug/l 20 Regular EPA 200.7 D 8/25/2016 BORON 960 ug/l 20 Regular EPA 200.7 D 8/31/2016 BORON 1000 ug/l 20 Regular EPA 200.7 D 9/12/2016 BORON 1800 ug/l 20 Regular EPA 200.7 D 9/19/2016 BORON 1200 ug/l 20 Regular EPA 200.7 D 9/27/2016 BORON 1800 ug/l 20 Regular EPA 200.7 D 10/3/2016 BORON 1900 ug/l 20 Regular EPA 200.7 D 10/12/2016 BORON 1300 ug/l 20 Regular EPA 200.7 D 10/17/2016 BORON 830 ug/l 20 Regular EPA 200.7 D 10/24/2016 BORON 1100 ug/l 20 Regular EPA 200.7 D 11/1/2016 BORON 860 ug/l 20 Regular EPA 200.7 D 11/7/2016 BORON 1200 ug/l 20 Regular EPA 200.7 D 11/22/2016 BORON 1500 ug/l 20 Regular EPA 200.7 D 12/1/2016 BORON 2000 ug/l 20 Regular EPA 200.7 D 12/5/2016 BORON 2700 ug/l 20 Regular EPA 200.7 D 12/12/2016 BORON 2400 ug/l 20 Regular EPA 200.7 D 12/22/2016 BORON 3300 ug/l 20 Regular EPA 200.7 D 12/29/2016 BORON 3500 ug/l 20 Regular EPA 200.7 D 1/28/2016 MOLYBDENUM 12 ug/l 1.0 Regular EPA 200.8 D 2/17/2016 MOLYBDENUM 12 ug/l 1.0 Regular EPA 200.8 D 3/17/2016 MOLYBDENUM 11 ug/l 1.0 Regular EPA 200.8 D 4/21/2016 MOLYBDENUM 11 ug/l 1.0 Regular EPA 200.8 D 5/26/2016 MOLYBDENUM 15 ug/l 1.0 Regular EPA 200.8 D 6/28/2016 MOLYBDENUM 18 ug/l 1.0 Regular EPA 200.8 D 7/20/2016 MOLYBDENUM 13 ug/l 1.0 Regular EPA 200.8 D 8/17/2016 MOLYBDENUM 7 ug/l 1.0 Regular EPA 200.8 D 9/27/2016 MOLYBDENUM 11 ug/l 1.0 Regular EPA 200.8 D 10/24/2016 MOLYBDENUM 10 ug/l 1.0 Regular EPA 200.8 D 11/22/2016 MOLYBDENUM 12 ug/l 1.0 Regular EPA 200.8
4

Site Date Analyte Result Units Report Limit QA Type Method D 12/29/2016 MOLYBDENUM 14 ug/l 1.0 Regular EPA 200.8 D 1/28/2016 NITRATE AS N (DISSOLVED) 1.3 mg/l 0.010 Regular EPA 300.0 D 2/17/2016 NITRATE AS N (DISSOLVED) 0.67 mg/l 0.010 Regular EPA 300.0 D 3/17/2016 NITRATE AS N (DISSOLVED) 0.76 mg/l 0.010 Regular EPA 300.0 D 4/21/2016 NITRATE AS N (DISSOLVED) 0.31 T,V mg/l 0.010 Regular EPA 300.0 D 5/26/2016 NITRATE AS N (DISSOLVED) < 0.010 mg/l 0.010 Regular EPA 300.0 D 6/28/2016 NITRATE AS N (DISSOLVED) < 0.010 mg/l 0.010 Regular EPA 300.0 D 7/20/2016 NITRATE AS N (DISSOLVED) < 0.010 mg/l 0.010 Regular EPA 300.0 D 8/17/2016 NITRATE AS N (DISSOLVED) 0.014 mg/l 0.010 Regular EPA 300.0 D 9/27/2016 NITRATE AS N (DISSOLVED) 0.020 T mg/l 0.010 Regular EPA 300.0 D 10/24/2016 NITRATE AS N (DISSOLVED) 0.028 mg/l 0.010 Regular EPA 300.0 D 11/22/2016 NITRATE AS N (DISSOLVED) 0.073 mg/l 0.010 Regular EPA 300.0 D 12/29/2016 NITRATE AS N (DISSOLVED) 1.4 T mg/l 0.050 Regular EPA 300.0 D 1/11/2016 SELENIUM 4.82 ug/l 0.4 Regular SM3500-Se-C D 1/21/2016 SELENIUM 5.52 ug/l 0.4 Regular SM3500-Se-C D 1/28/2016 SELENIUM 4.76 ug/l 0.4 Regular SM3500-Se-C D 2/4/2016 SELENIUM 12.7 ug/l 0.4 Regular SM3500-Se-C D 2/11/2016 SELENIUM 11.6 ug/l 0.4 Regular SM3500-Se-C D 2/17/2016 SELENIUM 3.98 ug/l 0.4 Regular SM3500-Se-C D 2/26/2016 SELENIUM 2.62 ug/l 0.4 Regular SM3500-Se-C D 3/3/2016 SELENIUM 1.34 ug/l 0.4 Regular SM3500-Se-C D 3/10/2016 SELENIUM 5.57 ug/l 0.4 Regular SM3500-Se-C D 3/17/2016 SELENIUM 4.01 ug/l 0.4 Regular SM3500-Se-C D 3/25/2016 SELENIUM 1.28 ug/l 0.4 Regular SM3500-Se-C D 3/31/2016 SELENIUM 1.45 ug/l 0.4 Regular SM3500-Se-C D 4/7/2016 SELENIUM 2.28 ug/l 0.4 Regular SM3500-Se-C D 4/14/2016 SELENIUM 2.12 ug/l 0.4 Regular SM3500-Se-C D 4/21/2016 SELENIUM 1.24 ug/l 0.4 Regular SM3500-Se-C D 4/28/2016 SELENIUM 1.05 ug/l 0.4 Regular SM3500-Se-C D 5/5/2016 SELENIUM 0.736 ug/l 0.4 Regular SM3500-Se-C D 5/11/2016 SELENIUM 9.09 ug/l 0.4 Regular SM3500-Se-C D 5/19/2016 SELENIUM 2.78 ug/l 0.4 Regular SM3500-Se-C D 5/26/2016 SELENIUM 1.14 ug/l 0.4 Regular SM3500-Se-C D 6/2/2016 SELENIUM 0.566 ug/l 0.4 Regular SM3500-Se-C D 6/10/2016 SELENIUM 0.51 ug/l 0.4 Regular SM3500-Se-C D 6/14/2016 SELENIUM 0.452 ug/l 0.4 Regular SM3500-Se-C D 6/21/2016 SELENIUM 0.564 ug/l 0.4 Regular SM3500-Se-C D 6/28/2016 SELENIUM 0.508 ug/l 0.4 Regular SM3500-Se-C D 7/5/2016 SELENIUM 0.434 ug/l 0.4 Regular SM3500-Se-C D 7/12/2016 SELENIUM < 0.4 ug/l 0.4 Regular SM3500-Se-C D 7/20/2016 SELENIUM 0.45 ug/l 0.4 Regular SM3500-Se-C D 7/29/2016 SELENIUM 0.447 ug/l 0.4 Regular SM3500-Se-C D 8/2/2016 SELENIUM 0.451 ug/l 0.4 Regular SM3500-Se-C D 8/10/2016 SELENIUM 0.629 ug/l 0.4 Regular SM3500-Se-C D 8/17/2016 SELENIUM 0.466 ug/l 0.4 Regular SM3500-Se-C D 8/25/2016 SELENIUM < 0.4 ug/l 0.4 Regular SM3500-Se-C D 8/31/2016 SELENIUM 0.663 ug/l 0.4 Regular SM3500-Se-C D 9/12/2016 SELENIUM 0.525 ug/l 0.4 Regular SM3500-Se-C D 9/19/2016 SELENIUM 0.619 ug/l 0.4 Regular SM3500-Se-C D 9/27/2016 SELENIUM 1.58 ug/l 0.4 Regular SM3500-Se-C D 10/3/2016 SELENIUM 1.4 ug/l 0.4 Regular SM3500-Se-C
5

Site Date Analyte Result Units Report Limit QA Type Method D 10/12/2016 SELENIUM 0.774 ug/l 0.4 Regular SM3500-Se-C D 10/17/2016 SELENIUM 0.479 ug/l 0.4 Regular SM3500-Se-C D 10/24/2016 SELENIUM 0.516 ug/l 0.4 Regular SM3500-Se-C D 11/1/2016 SELENIUM 0.477 ug/l 0.4 Regular SM3500-Se-C D 11/7/2016 SELENIUM 0.7 ug/l 0.4 Regular SM3500-Se-C D 11/22/2016 SELENIUM 0.835 ug/l 0.4 Regular SM3500-Se-C D 12/1/2016 SELENIUM 0.594 ug/l 0.4 Regular SM3500-Se-C D 12/5/2016 SELENIUM 1 ug/l 0.4 Regular SM3500-Se-C D 12/12/2016 SELENIUM 0.918 ug/l 0.4 Regular SM3500-Se-C D 12/22/2016 SELENIUM 2.76 ug/l 0.4 Regular SM3500-Se-C D 12/29/2016 SELENIUM 4.03 ug/l 0.4 Regular SM3500-Se-C D 1/11/2016 TOC 3.4 mg/l 1.0 Regular SM 5310C D 1/21/2016 TOC 2.6 mg/l 1.0 Regular SM 5310C D 1/28/2016 TOC 3.9 mg/l 1.0 Regular SM 5310C D 2/4/2016 TOC 3.8 mg/l 1.0 Regular SM 5310C D 2/11/2016 TOC 13 mg/l 1 Regular SM5310C/E415.3 D 2/17/2016 TOC 17 mg/l 1 Regular SM5310C/E415.3 D 2/26/2016 TOC 15 mg/l 1 Regular SM5310C/E415.3 D 3/3/2016 TOC 15 mg/l 1 Regular SM5310C/E415.3 D 3/10/2016 TOC 19 mg/l 1 Regular SM5310C/E415.3 D 3/17/2016 TOC 17 mg/l 1.5 Regular SM5310C/E415.3 D 3/25/2016 TOC 18 mg/l 1.5 Regular SM5310C/E415.3 D 3/31/2016 TOC 16 mg/l 1.5 Regular SM5310C/E415.3 D 4/7/2016 TOC 17 mg/l 1 Regular SM5310C/E415.3 D 4/14/2016 TOC 18 mg/l 1 Regular SM5310C/E415.3 D 4/21/2016 TOC 21 mg/l 1 Regular SM5310C/E415.3 D 4/28/2016 TOC 17 mg/l 1 Regular SM5310C/E415.3 D 5/5/2016 TOC 8.5 T mg/l 0.4 Regular SM5310C/E415.3 D 5/11/2016 TOC 10 T mg/l 0.4 Regular SM5310C/E415.3 D 5/19/2016 TOC 9.2 mg/l 0.4 Regular SM5310C/E415.3 D 5/26/2016 TOC 9.4 mg/l 0.4 Regular SM5310C/E415.3 D 6/2/2016 TOC 13 mg/l 0.6 Regular SM5310C/E415.3 D 6/10/2016 TOC 9.3 mg/l 0.6 Regular SM5310C/E415.3 D 6/14/2016 TOC 14 mg/l 0.6 Regular SM5310C/E415.3 D 6/21/2016 TOC 10 mg/l 0.6 Regular SM5310C/E415.3 D 6/28/2016 TOC 8 mg/l 0.2 Regular SM5310C/E415.3 D 7/5/2016 TOC 6.5 mg/l 0.2 Regular SM5310C/E415.3 D 7/12/2016 TOC 5.1 mg/l 0.2 Regular SM5310C/E415.3 D 7/20/2016 TOC 6.5 mg/l 0.2 Regular SM5310C/E415.3 D 7/29/2016 TOC 8.7 mg/l 3 Regular SM5310C/E415.3 D 8/2/2016 TOC 11 mg/l 0.6 Regular SM5310C/E415.3 D 8/10/2016 TOC 4.7 mg/l 0.2 Regular SM5310C/E415.3 D 8/17/2016 TOC 4.4 mg/l 0.2 Regular SM5310C/E415.3 D 8/25/2016 TOC 6.4 mg/l 1.5 Regular SM5310C/E415.3 D 8/31/2016 TOC 7.9 mg/l 1.5 Regular SM5310C/E415.3 D 9/12/2016 TOC 9.5 mg/l 1 Regular SM5310C/E415.3 D 9/19/2016 TOC 7.7 mg/l 1 Regular SM5310C/E415.3 D 9/27/2016 TOC 9 mg/l 1 Regular SM5310C/E415.3 D 10/3/2016 TOC 14 mg/l 1 Regular SM5310C/E415.3 D 10/12/2016 TOC 17 T mg/l 1 Regular SM5310C/E415.3 D 10/17/2016 TOC 15 mg/l 1 Regular SM5310C/E415.3
6

Site Date Analyte Result Units Report Limit QA Type Method D 10/24/2016 TOC 20 mg/l 1 Regular SM5310C/E415.3 D 11/1/2016 TOC 22 mg/l 1 Regular SM5310C/E415.3 D 11/7/2016 TOC 20 T mg/l 1 Regular SM5310C/E415.3 D 11/22/2016 TOC 16 mg/l 1 Regular SM5310C/E415.3 D 12/1/2016 TOC 15 mg/l 1 Regular SM5310C/E415.3 D 12/5/2016 TOC 14 mg/l 1 Regular SM5310C/E415.3 D 12/12/2016 TOC 14 mg/l 1 Regular SM5310C/E415.3 D 12/22/2016 TOC 16 mg/l 1 Regular SM5310C/E415.3 D 12/29/2016 TOC 9.4 mg/l 1 Regular SM5310C/E415.3 N 1/28/2016 AMMONIA AS N 0.2 mg/l 0.050 Production SM 4500 NH3 D N 2/17/2016 AMMONIA AS N 0.13 mg/l 0.050 Production SM 4500 NH3 D N 3/17/2016 AMMONIA AS N 0.2 mg/l 0.050 Production SM 4500 NH3 D N 4/21/2016 AMMONIA AS N 0.14 mg/l 0.050 Production SM 4500 NH3 D N 5/26/2016 AMMONIA AS N 0.13 mg/l 0.050 Production SM 4500 NH3 D N 6/28/2016 AMMONIA AS N 0.091 mg/l 0.050 Production SM 4500 NH3 D N 7/20/2016 AMMONIA AS N 0.14 mg/l 0.050 Production SM 4500 NH3 D N 9/27/2016 AMMONIA AS N 0.1 mg/l 0.050 Production SM 4500 NH3 D N 10/24/2016 AMMONIA AS N 0.089 mg/l 0.050 Production SM 4500 NH3 D N 11/22/2016 AMMONIA AS N 0.15 mg/l 0.050 Production SM 4500 NH3 D N 12/29/2016 AMMONIA AS N 0.11 mg/l 0.050 Production SM 4500 NH3 D N 1/11/2016 BORON 750 ug/l 20 Production EPA 200.7 N 1/21/2016 BORON 260 ug/l 20 Production EPA 200.7 N 1/28/2016 BORON 910 ug/l 20 Production EPA 200.7 N 2/4/2016 BORON 1100 ug/l 20 Production EPA 200.7 N 2/11/2016 BORON 1200 ug/l 20 Production EPA 200.7 N 2/17/2016 BORON 1000 ug/l 20 Production EPA 200.7 N 2/26/2016 BORON 1000 ug/l 40 Production EPA 200.7 N 3/3/2016 BORON 980 ug/l 20 Production EPA 200.7 N 3/17/2016 BORON 590 ug/l 20 Production EPA 200.7 N 3/31/2016 BORON 1200 ug/l 20 Production EPA 200.7 N 4/7/2016 BORON 1400 ug/l 20 Production EPA 200.7 N 4/14/2016 BORON 1900 ug/l 20 Production EPA 200.7 N 4/21/2016 BORON 1100 ug/l 20 Production EPA 200.7 N 4/28/2016 BORON 1000 ug/l 20 Production EPA 200.7 N 5/5/2016 BORON 820 ug/l 20 Production EPA 200.7 N 5/11/2016 BORON 2100 ug/l 20 Production EPA 200.7 N 5/19/2016 BORON 1200 ug/l 20 Production EPA 200.7 N 5/26/2016 BORON 840 ug/l 20 Production EPA 200.7 N 6/2/2016 BORON 830 ug/l 20 Production EPA 200.7 N 6/10/2016 BORON 830 ug/l 20 Production EPA 200.7 N 6/14/2016 BORON 770 ug/l 20 Production EPA 200.7 N 6/21/2016 BORON 750 ug/l 20 Production EPA 200.7 N 6/28/2016 BORON 930 ug/l 20 Production EPA 200.7 N 7/5/2016 BORON 850 ug/l 20 Production EPA 200.7 N 7/12/2016 BORON 580 ug/l 20 Production EPA 200.7 N 7/20/2016 BORON 580 ug/l 20 Production EPA 200.7 N 7/29/2016 BORON 680 ug/l 20 Production EPA 200.7 N 8/2/2016 BORON 590 ug/l 20 Production EPA 200.7 N 8/10/2016 BORON 520 ug/l 20 Production EPA 200.7 N 8/17/2016 BORON 560 ug/l 20 Production EPA 200.7 N 8/25/2016 BORON 430 ug/l 20 Production EPA 200.7
7

Site Date Analyte Result Units Report Limit QA Type Method N 8/31/2016 BORON 560 ug/l 20 Production EPA 200.7 N 9/12/2016 BORON 700 ug/l 20 Production EPA 200.7 N 9/19/2016 BORON 560 ug/l 20 Production EPA 200.7 N 9/27/2016 BORON 960 ug/l 40 Production EPA 200.7 N 10/3/2016 BORON 1000 ug/l 20 Production EPA 200.7 N 10/12/2016 BORON 760 ug/l 20 Production EPA 200.7 N 10/17/2016 BORON 300 ug/l 20 Production EPA 200.7 N 10/24/2016 BORON 290 ug/l 20 Production EPA 200.7 N 11/1/2016 BORON 490 ug/l 20 Production EPA 200.7 N 11/7/2016 BORON 510 ug/l 20 Production EPA 200.7 N 11/14/2016 BORON 700 ug/l 20 Production EPA 200.7 N 11/22/2016 BORON 560 ug/l 20 Production EPA 200.7 N 12/1/2016 BORON 720 ug/l 20 Production EPA 200.7 N 12/5/2016 BORON 670 ug/l 20 Production EPA 200.7 N 12/12/2016 BORON 810 ug/l 20 Production EPA 200.7 N 12/22/2016 BORON 1500 ug/l 20 Production EPA 200.7 N 12/29/2016 BORON 1300 ug/l 20 Production EPA 200.7 N 1/28/2016 MOLYBDENUM 4 ug/l 1.0 Production EPA 200.8 N 2/17/2016 MOLYBDENUM 7 ug/l 1.0 Production EPA 200.8 N 3/17/2016 MOLYBDENUM 2 ug/l 1.0 Production EPA 200.8 N 4/21/2016 MOLYBDENUM 8 ug/l 1.0 Production EPA 200.8 N 5/26/2016 MOLYBDENUM 7 ug/l 1.0 Production EPA 200.8 N 6/28/2016 MOLYBDENUM 8 ug/l 1.0 Production EPA 200.8 N 7/20/2016 MOLYBDENUM 6 ug/l 1.0 Production EPA 200.8 N 8/17/2016 MOLYBDENUM 6 ug/l 1.0 Production EPA 200.8 N 9/27/2016 MOLYBDENUM 7 ug/l 1.0 Production EPA 200.8 N 10/24/2016 MOLYBDENUM 3 ug/l 1.0 Production EPA 200.8 N 11/22/2016 MOLYBDENUM 6 ug/l 1.0 Production EPA 200.8 N 12/29/2016 MOLYBDENUM 6 ug/l 1.0 Production EPA 200.8 N 1/28/2016 NITRATE AS N (DISSOLVED) 0.69 mg/l 0.010 Production EPA 300.0 N 2/17/2016 NITRATE AS N (DISSOLVED) 0.48 mg/l 0.010 Production EPA 300.0 N 3/17/2016 NITRATE AS N (DISSOLVED) 0.57 mg/l 0.010 Production EPA 300.0 N 4/21/2016 NITRATE AS N (DISSOLVED) 1.2 T,V mg/l 0.020 Production EPA 300.0 N 5/26/2016 NITRATE AS N (DISSOLVED) 0.4 mg/l 0.010 Production EPA 300.0 N 6/28/2016 NITRATE AS N (DISSOLVED) 0.46 mg/l 0.010 Production EPA 300.0 N 7/20/2016 NITRATE AS N (DISSOLVED) 2 mg/l 0.050 Production EPA 300.0 N 9/27/2016 NITRATE AS N (DISSOLVED) 5.0 T mg/l 0.010 Production EPA 300.0 N 10/24/2016 NITRATE AS N (DISSOLVED) 1.1 mg/l 0.020 Production EPA 300.0 N 11/22/2016 NITRATE AS N (DISSOLVED) 1.9 mg/l 0.010 Production EPA 300.0 N 12/29/2016 NITRATE AS N (DISSOLVED) 0.87 T mg/l 0.010 Production EPA 300.0 N 1/11/2016 SELENIUM 0.867 ug/l 0.4 Production SM3500-Se-C N 1/21/2016 SELENIUM < 0.4 ug/l 0.4 Production SM3500-Se-C N 1/28/2016 SELENIUM 0.884 ug/l 0.4 Production SM3500-Se-C N 2/4/2016 SELENIUM 1.65 U ug/l 0.4 Production SM3500-Se-C N 2/11/2016 SELENIUM 1.30 U ug/l 0.4 Production SM3500-Se-C N 2/17/2016 SELENIUM 0.95 ug/l 0.4 Production SM3500-Se-C N 2/26/2016 SELENIUM 0.553 ug/l 0.4 Production SM3500-Se-C N 3/3/2016 SELENIUM 0.58 ug/l 0.4 Production SM3500-Se-C N 3/10/2016 SELENIUM 0.902 ug/l 0.4 Production SM3500-Se-C N 3/17/2016 SELENIUM 0.754 ug/l 0.4 Production SM3500-Se-C N 3/31/2016 SELENIUM 0.429 ug/l 0.4 Production SM3500-Se-C
8

Site Date Analyte Result Units Report Limit QA Type Method N 4/7/2016 SELENIUM 0.619 ug/l 0.4 Production SM3500-Se-C N 4/14/2016 SELENIUM 1.80 U ug/l 0.4 Production SM3500-Se-C N 4/21/2016 SELENIUM 0.51 ug/l 0.4 Production SM3500-Se-C N 4/28/2016 SELENIUM 0.441 ug/l 0.4 Production SM3500-Se-C N 5/5/2016 SELENIUM 0.424 ug/l 0.4 Production SM3500-Se-C N 5/11/2016 SELENIUM 2.07 U ug/l 0.4 Production SM3500-Se-C N 5/19/2016 SELENIUM 0.544 ug/l 0.4 Production SM3500-Se-C N 5/26/2016 SELENIUM < 0.4 ug/l 0.4 Production SM3500-Se-C N 6/2/2016 SELENIUM < 0.4 ug/l 0.4 Production SM3500-Se-C N 6/10/2016 SELENIUM < 0.4 ug/l 0.4 Production SM3500-Se-C N 6/14/2016 SELENIUM < 0.4 ug/l 0.4 Production SM3500-Se-C N 6/21/2016 SELENIUM < 0.4 ug/l 0.4 Production SM3500-Se-C N 6/28/2016 SELENIUM 0.461 ug/l 0.4 Production SM3500-Se-C N 7/5/2016 SELENIUM 0.424 ug/l 0.4 Production SM3500-Se-C N 7/12/2016 SELENIUM < 0.4 ug/l 0.4 Production SM3500-Se-C N 7/20/2016 SELENIUM < 0.4 ug/l 0.4 Production SM3500-Se-C N 7/29/2016 SELENIUM 0.472 ug/l 0.4 Production SM3500-Se-C N 8/2/2016 SELENIUM 0.439 ug/l 0.4 Production SM3500-Se-C N 8/10/2016 SELENIUM < 0.4 ug/l 0.4 Production SM3500-Se-C N 8/17/2016 SELENIUM < 0.4 ug/l 0.4 Production SM3500-Se-C N 8/25/2016 SELENIUM 0.431 ug/l 0.4 Production SM3500-Se-C N 8/31/2016 SELENIUM < 0.4 ug/l 0.4 Production SM3500-Se-C N 9/12/2016 SELENIUM 0.625 ug/l 0.4 Production SM3500-Se-C N 9/19/2016 SELENIUM < 0.4 ug/l 0.4 Production SM3500-Se-C N 9/27/2016 SELENIUM 0.809 ug/l 0.4 Production SM3500-Se-C N 10/3/2016 SELENIUM 0.653 ug/l 0.4 Production SM3500-Se-C N 10/12/2016 SELENIUM 0.564 ug/l 0.4 Production SM3500-Se-C N 10/17/2016 SELENIUM < 0.4 ug/l 0.4 Production SM3500-Se-C N 10/24/2016 SELENIUM < 0.4 ug/l 0.4 Production SM3500-Se-C N 11/1/2016 SELENIUM < 0.4 ug/l 0.4 Production SM3500-Se-C N 11/7/2016 SELENIUM < 0.4 ug/l 0.4 Production SM3500-Se-C N 11/14/2016 SELENIUM < 0.4 ug/l 0.4 Production SM3500-Se-C N 11/22/2016 SELENIUM < 0.4 ug/l 0.4 Production SM3500-Se-C N 12/1/2016 SELENIUM < 0.4 ug/l 0.4 Production SM3500-Se-C N 12/5/2016 SELENIUM < 0.4 ug/l 0.4 Production SM3500-Se-C N 12/12/2016 SELENIUM 0.489 ug/l 0.4 Production SM3500-Se-C N 12/22/2016 SELENIUM 1.21 ug/l 0.4 Production SM3500-Se-C N 12/29/2016 SELENIUM 1.42 ug/l 0.4 Production SM3500-Se-C R 2/17/2016 AMMONIA AS N 0.14 mg/l 0.050 Production SM 4500 NH3 D R 4/21/2016 AMMONIA AS N 0.13 mg/l 0.050 Production SM 4500 NH3 D R 5/26/2016 AMMONIA AS N 0.13 mg/l 0.050 Production SM 4500 NH3 D R 6/28/2016 AMMONIA AS N 0.11 mg/l 0.050 Production SM 4500 NH3 D R 7/20/2016 AMMONIA AS N 0.11 mg/l 0.050 Production SM 4500 NH3 D R 9/27/2016 AMMONIA AS N 0.3 mg/l 0.050 Production SM 4500 NH3 D R 10/24/2016 AMMONIA AS N 0.1 mg/l 0.050 Production SM 4500 NH3 D R 11/22/2016 AMMONIA AS N 0.16 mg/l 0.050 Production SM 4500 NH3 D R 12/29/2016 AMMONIA AS N 0.15 mg/l 0.050 Production SM 4500 NH3 D R 1/11/2016 BORON 1500 ug/l 40 Production EPA 200.7 R 2/4/2016 BORON 1800 ug/l 20 Production EPA 200.7 R 2/11/2016 BORON 2000 ug/l 20 Production EPA 200.7 R 2/17/2016 BORON 1800 ug/l 40 Production EPA 200.7
9
Site Date Analyte Result Units Report Limit QA Type Method R 2/26/2016 BORON 1600 ug/l 20 Production EPA 200.7 R 3/3/2016 BORON 1500 ug/l 20 Production EPA 200.7 R 3/31/2016 BORON 1800 ug/l 20 Production EPA 200.7 R 4/7/2016 BORON 1800 ug/l 20 Production EPA 200.7 R 4/14/2016 BORON 1900 ug/l 20 Production EPA 200.7 R 4/21/2016 BORON 1500 ug/l 20 Production EPA 200.7 R 4/28/2016 BORON 1600 ug/l 20 Production EPA 200.7 R 5/5/2016 BORON 1200 ug/l 20 Production EPA 200.7 R 5/11/2016 BORON 2600 ug/l 20 Production EPA 200.7 R 5/19/2016 BORON 1700 ug/l 20 Production EPA 200.7 R 5/26/2016 BORON 1200 ug/l 20 Production EPA 200.7 R 6/2/2016 BORON 1000 ug/l 20 Production EPA 200.7 R 6/10/2016 BORON 1000 ug/l 20 Production EPA 200.7 R 6/14/2016 BORON 1000 ug/l 20 Production EPA 200.7 R 6/21/2016 BORON 920 ug/l 20 Production EPA 200.7 R 6/28/2016 BORON 1000 ug/l 20 Production EPA 200.7 R 7/5/2016 BORON 1100 ug/l 20 Production EPA 200.7 R 7/12/2016 BORON 650 ug/l 20 Production EPA 200.7 R 7/20/2016 BORON 670 ug/l 20 Production EPA 200.7 R 7/29/2016 BORON 840 ug/l 20 Production EPA 200.7 R 8/2/2016 BORON 910 ug/l 20 Production EPA 200.7 R 8/10/2016 BORON 650 ug/l 20 Production EPA 200.7 R 8/17/2016 BORON 560 ug/l 20 Production EPA 200.7 R 8/25/2016 BORON 520 ug/l 20 Production EPA 200.7 R 8/31/2016 BORON 600 ug/l 20 Production EPA 200.7 R 9/19/2016 BORON 760 ug/l 20 Production EPA 200.7 R 9/27/2016 BORON 1600 ug/l 20 Production EPA 200.7 R 10/3/2016 BORON 1500 ug/l 20 Production EPA 200.7 R 10/12/2016 BORON 1200 ug/l 20 Production EPA 200.7 R 10/17/2016 BORON 1000 ug/l 20 Production EPA 200.7 R 10/24/2016 BORON 960 ug/l 20 Production EPA 200.7 R 11/1/2016 BORON 840 ug/l 20 Production EPA 200.7 R 11/7/2016 BORON 980 ug/l 20 Production EPA 200.7 R 11/14/2016 BORON 1300 ug/l 20 Production EPA 200.7 R 11/22/2016 BORON 940 ug/l 20 Production EPA 200.7 R 12/1/2016 BORON 1400 ug/l 20 Production EPA 200.7 R 12/5/2016 BORON 1100 ug/l 20 Production EPA 200.7 R 12/12/2016 BORON 1500 ug/l 20 Production EPA 200.7 R 12/22/2016 BORON 2000 ug/l 20 Production EPA 200.7 R 12/29/2016 BORON 2400 ug/l 20 Production EPA 200.7 R 2/17/2016 MOLYBDENUM 10 ug/l 1.0 Production EPA 200.8 R 4/21/2016 MOLYBDENUM 11 ug/l 1.0 Production EPA 200.8 R 5/26/2016 MOLYBDENUM 10 ug/l 1.0 Production EPA 200.8 R 6/28/2016 MOLYBDENUM 9 ug/l 1.0 Production EPA 200.8 R 7/20/2016 MOLYBDENUM 7 ug/l 1.0 Production EPA 200.8 R 8/17/2016 MOLYBDENUM 6 ug/l 1.0 Production EPA 200.8 R 9/27/2016 MOLYBDENUM 10 ug/l 1.0 Production EPA 200.8 R 10/24/2016 MOLYBDENUM 9 ug/l 1.0 Production EPA 200.8 R 11/22/2016 MOLYBDENUM 9 ug/l 1.0 Production EPA 200.8 R 12/29/2016 MOLYBDENUM 10 ug/l 1.0 Production EPA 200.8 R 2/17/2016 NITRATE AS N (DISSOLVED) 0.22 mg/l 0.010 Production EPA 300.0
10

Site Date Analyte Result Units Report Limit QA Type Method R 4/21/2016 NITRATE AS N (DISSOLVED) 0.12 T,V mg/l 0.010 Production EPA 300.0 R 5/26/2016 NITRATE AS N (DISSOLVED) 0.059 mg/l 0.010 Production EPA 300.0 R 6/28/2016 NITRATE AS N (DISSOLVED) < 0.010 mg/l 0.010 Production EPA 300.0 R 7/20/2016 NITRATE AS N (DISSOLVED) 0.068 mg/l 0.010 Production EPA 300.0 R 9/27/2016 NITRATE AS N (DISSOLVED) < 0.010 T mg/l 0.010 Production EPA 300.0 R 10/24/2016 NITRATE AS N (DISSOLVED) 0.054 mg/l 0.010 Production EPA 300.0 R 11/22/2016 NITRATE AS N (DISSOLVED) 0.27 mg/l 0.010 Production EPA 300.0 R 12/29/2016 NITRATE AS N (DISSOLVED) 0.81 T mg/l 0.010 Production EPA 300.0 R 1/11/2016 SELENIUM 1.29 ug/l 0.4 Production SM3500-Se-C R 2/4/2016 SELENIUM 2.74 ug/l 0.4 Production SM3500-Se-C R 2/11/2016 SELENIUM 2.3 ug/l 0.4 Production SM3500-Se-C R 2/17/2016 SELENIUM 1.35 ug/l 0.4 Production SM3500-Se-C R 2/26/2016 SELENIUM 0.802 ug/l 0.4 Production SM3500-Se-C R 3/3/2016 SELENIUM 0.958 ug/l 0.4 Production SM3500-Se-C R 3/31/2016 SELENIUM 0.589 ug/l 0.4 Production SM3500-Se-C R 4/7/2016 SELENIUM 0.786 ug/l 0.4 Production SM3500-Se-C R 4/14/2016 SELENIUM 1.46 ug/l 0.4 Production SM3500-Se-C R 4/21/2016 SELENIUM 0.581 ug/l 0.4 Production SM3500-Se-C R 4/28/2016 SELENIUM 0.516 ug/l 0.4 Production SM3500-Se-C R 5/5/2016 SELENIUM 0.482 ug/l 0.4 Production SM3500-Se-C R 5/11/2016 SELENIUM 2.84 ug/l 0.4 Production SM3500-Se-C R 5/19/2016 SELENIUM 0.719 ug/l 0.4 Production SM3500-Se-C R 5/26/2016 SELENIUM 0.401 ug/l 0.4 Production SM3500-Se-C R 6/2/2016 SELENIUM 0.405 ug/l 0.4 Production SM3500-Se-C R 6/10/2016 SELENIUM < 0.4 ug/l 0.4 Production SM3500-Se-C R 6/14/2016 SELENIUM < 0.4 ug/l 0.4 Production SM3500-Se-C R 6/21/2016 SELENIUM 0.447 ug/l 0.4 Production SM3500-Se-C R 6/28/2016 SELENIUM < 0.4 ug/l 0.4 Production SM3500-Se-C R 7/5/2016 SELENIUM < 0.4 ug/l 0.4 Production SM3500-Se-C R 7/12/2016 SELENIUM < 0.4 ug/l 0.4 Production SM3500-Se-C R 7/20/2016 SELENIUM < 0.4 ug/l 0.4 Production SM3500-Se-C R 7/29/2016 SELENIUM < 0.4 ug/l 0.4 Production SM3500-Se-C R 8/2/2016 SELENIUM < 0.4 ug/l 0.4 Production SM3500-Se-C R 8/10/2016 SELENIUM < 0.4 ug/l 0.4 Production SM3500-Se-C R 8/17/2016 SELENIUM < 0.4 ug/l 0.4 Production SM3500-Se-C R 8/25/2016 SELENIUM < 0.4 ug/l 0.4 Production SM3500-Se-C R 8/31/2016 SELENIUM < 0.4 ug/l 0.4 Production SM3500-Se-C R 9/19/2016 SELENIUM < 0.4 ug/l 0.4 Production SM3500-Se-C R 9/27/2016 SELENIUM 0.881 ug/l 0.4 Production SM3500-Se-C R 10/3/2016 SELENIUM 0.807 ug/l 0.4 Production SM3500-Se-C R 10/12/2016 SELENIUM 0.847 ug/l 0.4 Production SM3500-Se-C R 10/17/2016 SELENIUM 0.538 ug/l 0.4 Production SM3500-Se-C R 10/24/2016 SELENIUM < 0.4 ug/l 0.4 Production SM3500-Se-C R 11/1/2016 SELENIUM 0.581 ug/l 0.4 Production SM3500-Se-C R 11/7/2016 SELENIUM < 0.4 ug/l 0.4 Production SM3500-Se-C R 11/14/2016 SELENIUM < 0.4 ug/l 0.4 Production SM3500-Se-C R 11/22/2016 SELENIUM < 0.4 ug/l 0.4 Production SM3500-Se-C R 12/1/2016 SELENIUM 0.567 ug/l 0.4 Production SM3500-Se-C R 12/5/2016 SELENIUM < 0.4 ug/l 0.4 Production SM3500-Se-C R 12/12/2016 SELENIUM 0.618 ug/l 0.4 Production SM3500-Se-C R 12/22/2016 SELENIUM 1.61 ug/l 0.4 Production SM3500-Se-C
11

Site Date Analyte Result Units Report Limit QA Type Method R 12/29/2016 SELENIUM 1.87 ug/l 0.4 Production SM3500-Se-C
12

Grassland Bypass Project
Annual Monitoring Report April 30, 2017
Aquatic and Sediment Toxicity Summary

Selenastrum capricornutum Daphnia magna Fathead Minnow Hyalella azteca Date
Site (cells x10^6) (% of lab control) (% survival) (% of lab control) (% survival) (% of lab control) (% survival) (% of lab control) Lab Control 1/28/2016 314.0% NA 90.0% NA 100.0% NA No Test D 640.0% 203.0% 100.0% 111.0% 100.0% 100.0% Lab Control 2/20/2016 349.0% NA 100.0% NA 100.0% NA No Test D 970.0% 278.0% 100.0% 100.0% 100.0% 100.0% Lab Control
3/4/2016
357.0% NA 100.0% NA 100.0% NA
No Test
Conductivity Control 327.0% 92.0% 95.0% 95.0% 100.0% 100.0% B3 523.0% 147.0% 100.0% 100.0% 100.0% 100.0% D 875.0% 245.0% 100.0% 100.0% 100.0% 100.0% F 696.0% 195.0% 100.0% 100.0% 100.0% 100.0% R 733.0% 205.0% 100.0% 100.0% 100.0% 100.0% Lab Control
4/15/2016 413.0% NA 100.0% NA 100.0% NA 97.5% NA
Conductivity Control 340.0% 82.0% 75.0% 75.0% 100.0% 100.0% NA NA D 749.0% 181.4% 100.0% 100.0% 100.0% 100.0% 100% 103% Lab Control 5/13/2016 367.0% NA 100.0% NA 97.5% NA No Test D 466.0% 127.0% 100.0% 100.0% 100.0% 103.0% Lab Control
6/9/2016
304.0% NA 100.0% NA 100.0% NA
No Test B3 328.0% 107.9% 100.0% 100.0% 70.0% 70.0% D 604.0% 198.7% 100.0% 100.0% 100.0% 100.0% F 551.0% 181.3% 100.0% 100.0% 100.0% 100.0% Lab Control 7/17/2016 265.0% NA 100.0% NA 100.0% NA No Test D 442.0% 166.8% 100.0% 100.0% 100.0% 100.0% Lab Control 8/11/2016 304.0% NA 95.0% NA 100.0% NA No Test D 542.0% 178.3% 100.0% 105.0% 100.0% 100.0% Lab Control
9/15/2016
325.0% NA 90.0% NA 100.0% NA 100% NA Conductivity Control 36.0% 11.1% 0.0% 0.0% 95.0% 95.0% NA NA B3 34.0% 10.5% 0.0% 0.0% 0.0% 0.0% NA NA D 559.0% 172.0% 100.0% 111.1% 100.0% 100.0% 96.3% 96.3% F 489.0% 150.5% 100.0% 111.0% 97.5% 97.5% NA NA R 540.0% 166.2% 100.0% 111.0% 100.0% 100.0% NA NA Lab Control 10/13/2016 286.0% NA 100.0% NA 100.0% NA No Test D 822.0% 287.4% 100.0% 100.0% 97.5% 97.5% Lab Control
11/10/2016
2.18 NA 95.0% NA 100.0% NA
No Test
Conductivity Control 2 91.7% 65.0% 68.4% 100.0% 100.0% B3 2.86 131.2% 100.0% 105.3% 80.0% 80.0% D 5.33 244.5% 100.0% 105.3% 100.0% 100.0% F 4.7 215.6% 95.0% 100.0% 100.0% 100.0% R 5.45 250.0% 95.0% 100.0% 97.5% 97.5% Lab Control 12/15/2016 2.38 NA 100.0% NA 100.0% NA No Test D 5.08 213.4% 100.0% 100.0% 97.2% 97.200%
1

Site D Sediment Sample Physical Data
Constituent Unit 4/14/2016 9/14/2016 Clay % <0.005 mm 8.46 13.29 Silt % 0.005 to <0.075 mm 23.63 45.87
Sand % Fine 0.075 to <0.425 mm 57.62 32.97 Sand % Medium 0.425 to <2.0 mm 10.29 7.87 Sand % Coarse 2.0 to <4.75 mm <0.01 <0.01
Gravel % 4.75 to <75 mm <0.01 <0.01
Total Organic Carbon mg/Kg dw 3,400 11,700
2

Grassland Bypass Project
Annual Monitoring Report April 30, 2017
Attachment 2 Summary of Exceedances

Grassland Bypass Project
Annual Monitoring Report April 30, 2017
Field Data Exceedances

Site
Date
Matrix
Sample Type
EC
Unit
Exceedance
Limit D 1/11/2016 Surface Water Grab 3056 µS/cm 900 D 1/21/2016 Surface Water Grab 4159 µS/cm 900 D 1/28/2016 Surface Water Grab 2689 µS/cm 900 D 2/4/2016 Surface Water Grab 3381 µS/cm 900 D 2/11/2016 Surface Water Grab 3970 µS/cm 900 D 2/17/2016 Surface Water Grab 2694 µS/cm 900 D 2/26/2016 Surface Water Grab 2827 µS/cm 900 D 3/3/2016 Surface Water Grab 1850 µS/cm 900 D 3/10/2016 Surface Water Grab 2994 µS/cm 900 D 3/17/2016 Surface Water Grab 2385 µS/cm 900 D 3/25/2016 Surface Water Grab 2147 µS/cm 900 D 3/31/2016 Surface Water Grab 3339 µS/cm 900 D 4/7/2016 Surface Water Grab 3098 µS/cm 900 D 4/14/2016 Surface Water Grab 3090 µS/cm 900 D 4/21/2016 Surface Water Grab 3019 µS/cm 900 D 4/28/2016 Surface Water Grab 3214 µS/cm 900 D 5/5/2016 Surface Water Grab 3497 µS/cm 900 D 5/11/2016 Surface Water Grab 3460 µS/cm 900 D 5/19/2016 Surface Water Grab 3711 µS/cm 900 D 5/26/2016 Surface Water Grab 3179 µS/cm 900 D 6/2/2016 Surface Water Grab 2244 µS/cm 900 D 6/10/2016 Surface Water Grab 2383 µS/cm 900 D 6/14/2016 Surface Water Grab 2567 µS/cm 900 D 6/21/2016 Surface Water Grab 2353 µS/cm 900 D 6/28/2016 Surface Water Grab 3584 µS/cm 900 D 7/5/2016 Surface Water Grab 3817 µS/cm 900 D 7/12/2016 Surface Water Grab 3500 µS/cm 900 D 7/20/2016 Surface Water Grab 3317 µS/cm 900 D 7/29/2016 Surface Water Grab 2154 µS/cm 900 D 8/2/2016 Surface Water Grab 2163 µS/cm 900 D 8/10/2016 Surface Water Grab 1350 µS/cm 900 D 8/17/2016 Surface Water Grab 1738 µS/cm 900 D 8/25/2016 Surface Water Grab 1501 µS/cm 900 D 8/31/2016 Surface Water Grab 1544 µS/cm 900 D 9/12/2016 Surface Water Grab 2427 µS/cm 900 D 9/19/2016 Surface Water Grab 1476 µS/cm 900 D 9/27/2016 Surface Water Grab 1809 µS/cm 900 D 10/3/2016 Surface Water Grab 2035 µS/cm 900 D 10/12/2016 Surface Water Grab 1675 µS/cm 900 D 10/17/2016 Surface Water Grab 1328 µS/cm 900 D 10/24/2016 Surface Water Grab 1625 µS/cm 900
1

Site
Date
Matrix
Sample Type
EC
Unit
Exceedance
Limit D 11/1/2016 Surface Water Grab 1289 µS/cm 900 D 11/7/2016 Surface Water Grab 1693 µS/cm 900 D 11/22/2016 Surface Water Grab 1606 µS/cm 900 D 12/1/2016 Surface Water Grab 2139 µS/cm 900 D 12/5/2016 Surface Water Grab 2519 µS/cm 900 D 12/12/2016 Surface Water Grab 2524 µS/cm 900 D 12/22/2016 Surface Water Grab 3126 µS/cm 900 D 12/29/2016 Surface Water Grab 3168 µS/cm 900 N 1/28/2016 Surface Water Grab 942 µS/cm 900 N 2/4/2016 Surface Water Grab 1148 µS/cm 900 N 2/11/2016 Surface Water Grab 1502 µS/cm 900 N 2/17/2016 Surface Water Grab 1512 µS/cm 900 N 2/26/2016 Surface Water Grab 1526 µS/cm 900 N 3/3/2016 Surface Water Grab 1465 µS/cm 900 N 3/31/2016 Surface Water Grab 1687 µS/cm 900 N 4/7/2016 Surface Water Grab 1953 µS/cm 900 N 4/14/2016 Surface Water Grab 1842 µS/cm 900 N 4/21/2016 Surface Water Grab 1764 µS/cm 900 N 4/28/2016 Surface Water Grab 1793 µS/cm 900 N 5/5/2016 Surface Water Grab 1581 µS/cm 900 N 5/11/2016 Surface Water Grab 1966 µS/cm 900 N 5/19/2016 Surface Water Grab 1970 µS/cm 900 N 5/26/2016 Surface Water Grab 1615 µS/cm 900 N 6/2/2016 Surface Water Grab 1680 µS/cm 900 N 6/10/2016 Surface Water Grab 1755 µS/cm 900 N 6/14/2016 Surface Water Grab 1712 µS/cm 900 N 6/21/2016 Surface Water Grab 1612 µS/cm 900 N 6/28/2016 Surface Water Grab 1815 µS/cm 900 N 7/5/2016 Surface Water Grab 1965 µS/cm 900 N 7/12/2016 Surface Water Grab 1409 µS/cm 900 N 7/20/2016 Surface Water Grab 1489 µS/cm 900 N 7/29/2016 Surface Water Grab 1669 µS/cm 900 N 8/2/2016 Surface Water Grab 1469 µS/cm 900 N 8/10/2016 Surface Water Grab 1320 µS/cm 900 N 8/17/2016 Surface Water Grab 1544 µS/cm 900 N 8/25/2016 Surface Water Grab 1241 µS/cm 900 N 8/31/2016 Surface Water Grab 1525 µS/cm 900 N 9/12/2016 Surface Water Grab 1674 µS/cm 900 N 9/19/2016 Surface Water Grab 1404 µS/cm 900 N 9/27/2016 Surface Water Grab 1670 µS/cm 900 N 10/3/2016 Surface Water Grab 1834 µS/cm 900
2

Site
Date
Matrix
Sample Type
EC
Unit
Exceedance
Limit N 10/12/2016 Surface Water Grab 1566 µS/cm 900 N 11/7/2016 Surface Water Grab 1000 µS/cm 900 N 11/14/2016 Surface Water Grab 1211 µS/cm 900 N 11/22/2016 Surface Water Grab 1126 µS/cm 900 N 12/1/2016 Surface Water Grab 1137 µS/cm 900 N 12/5/2016 Surface Water Grab 1211 µS/cm 900 N 12/12/2016 Surface Water Grab 1330 µS/cm 900 N 12/22/2016 Surface Water Grab 1487 µS/cm 900 N 12/29/2016 Surface Water Grab 1590 µS/cm 900 R 1/11/2016 Surface Water Grab 1247 µS/cm 900 R 2/4/2016 Surface Water Grab 1663 µS/cm 900 R 2/11/2016 Surface Water Grab 2530 µS/cm 900 R 2/17/2016 Surface Water Grab 2353 µS/cm 900 R 2/26/2016 Surface Water Grab 2330 µS/cm 900 R 3/3/2016 Surface Water Grab 2061 µS/cm 900 R 3/31/2016 Surface Water Grab 2310 µS/cm 900 R 4/7/2016 Surface Water Grab 2458 µS/cm 900 R 4/14/2016 Surface Water Grab 2159 µS/cm 900 R 4/21/2016 Surface Water Grab 2321 µS/cm 900 R 4/28/2016 Surface Water Grab 2610 µS/cm 900 R 5/5/2016 Surface Water Grab 2262 µS/cm 900 R 5/11/2016 Surface Water Grab 2277 µS/cm 900 R 5/19/2016 Surface Water Grab 2786 µS/cm 900 R 5/26/2016 Surface Water Grab 1911 µS/cm 900 R 6/2/2016 Surface Water Grab 2004 µS/cm 900 R 6/10/2016 Surface Water Grab 1955 µS/cm 900 R 6/14/2016 Surface Water Grab 2050 µS/cm 900 R 6/21/2016 Surface Water Grab 1734 µS/cm 900 R 6/28/2016 Surface Water Grab 2116 µS/cm 900 R 7/5/2016 Surface Water Grab 2438 µS/cm 900 R 7/12/2016 Surface Water Grab 1431 µS/cm 900 R 7/20/2016 Surface Water Grab 1583 µS/cm 900 R 7/29/2016 Surface Water Grab 1791 µS/cm 900 R 8/2/2016 Surface Water Grab 1968 µS/cm 900 R 8/10/2016 Surface Water Grab 1511 µS/cm 900 R 8/17/2016 Surface Water Grab 1450 µS/cm 900 R 8/25/2016 Surface Water Grab 1261 µS/cm 900 R 8/31/2016 Surface Water Grab 1421 µS/cm 900 R 9/19/2016 Surface Water Grab 1648 µS/cm 900 R 9/27/2016 Surface Water Grab 1888 µS/cm 900 R 10/3/2016 Surface Water Grab 2334 µS/cm 900
3

Site
Date
Matrix
Sample Type
EC
Unit
Exceedance
Limit R 10/12/2016 Surface Water Grab 2052 µS/cm 900 R 10/17/2016 Surface Water Grab 1744 µS/cm 900 R 10/24/2016 Surface Water Grab 1741 µS/cm 900 R 11/1/2016 Surface Water Grab 1332 µS/cm 900 R 11/7/2016 Surface Water Grab 1769 µS/cm 900 R 11/14/2016 Surface Water Grab 1988 µS/cm 900 R 11/22/2016 Surface Water Grab 1719 µS/cm 900 R 12/1/2016 Surface Water Grab 1832 µS/cm 900 R 12/5/2016 Surface Water Grab 1810 µS/cm 900 R 12/12/2016 Surface Water Grab 2149 µS/cm 900 R 12/22/2016 Surface Water Grab 2277 µS/cm 900 R 12/29/2016 Surface Water Grab 2637 µS/cm 900
Temp = Temperature reported in degrees °C unless otherwise noted. EC = Electrical Conductivity as Specific Conductance normalized to 25°C and reported as µS/cm. Turbidity = reported in NTU's EH = ORP reported in mV DO = Dissolved oxygen reported in mg/L
4

Grassland Bypass Project
Annual Monitoring Report April 30, 2017
Laboratory Data Exceedances

Grassland Bypass Project
Annual Monitoring Report April 30, 2017
Site Date Analyte Result Unit Exceedance Limit D 1/21/2016 BORON 8600 µg/L 5800 max D March BORON 3378 µg/L 2000 monthly mean D April BORON 4025 µg/L 2000 monthly mean D June BORON 2640 µg/L 2000 monthly mean N February BORON 1075 µg/L 1000 monthly mean N April BORON 1350 µg/L 800 monthly mean N May BORON 1240 µg/L 800 monthly mean
1

Grassland Bypass Project
Annual Monitoring Report April 30, 2017
Attachment 3 USBR Laboratory Results Quality Assurance

( ) 2
USBR Incorporated QA ‐ Acceptance Criteria
USBR Incorporated QA Acceptance Criteria
Precision
Aqueous Solid
Result > 5 x RL Result < 5 x RL Result > 5 x RL Result < 5 x RL
< 20% RPD + 1 x RL < 35% RPD + 2 x RL
The RPD is calculated as follows:
R − D RPD =
R + D
(100)
RPD = Relative Percent Difference
R = Regular Sample Result
D = Duplicate Sample Result
Accuracy – Matrix Spike Aqueous
Spike Concentration > 5 x RL Spike Concentration < 5 x RL 80%-120% Recovery + 1 x RL
The PR for a spike sample is calculated as follows:
PR = (S − R) (100)
A
PR = Percent Recovery
S = Spike Sample Result
R = Regular Sample Result
A = Amount of Spike Added (Spike Concentration)
1

Accuracy – Whole Volume Reference Aqueous Solid
Reference Concentration > 5 x RL
Reference Concentration < 5 x RL
Reference Concentration > 5 x RL
Reference Concentration < 5 x RL
80%-120% Recovery or within Vendor’s
Acceptance Limit + 1 x RL or within
Vendor’s Acceptance Limit
65%-135% Recovery or within Vendor’s
Acceptance Limit
+ 2 x RL or within Vendor’s Acceptance
Limit
The PR for a reference sample is calculated as follows:
PR = F (100)
MPV
PR = Percent Recovery
F = Reference Sample Result
MPV = Most Probable Value or certified value
(Reference Concentration)
Blank – Contamination Aqueous and Solid
< 2 x RL, < 10% of the lowest production sample result, or < than the Manufacturer’s Performance Testing Limits
2

Contract Laboratories ‐ QA Acceptance Criteria
Western Environmental Laboratory (WET)
Parameter Blank LCS MS Rec MSD Rec* MS/MSD RPD Boron < RL 85% ‐ 115% 70% ‐130% 70% ‐130% < 20%
Molybdenum < RL 85% ‐ 115% 70% ‐130% 70% ‐130% < 20% Ammonia < RL 80% ‐ 120% 80% ‐120% 80% ‐120% < 20%
Nitrate as N < RL 90% ‐ 110% 80% ‐120% 80% ‐120% < 20% *Failure of MSD recovery acceptance limit is negligible if MS recovery and MS/MSD RPD are within limits
South Dakota Agricultural Laboratory (SD Ag)
Parameter LCS MS Selenium 80% ‐ 120% 80% ‐ 120%
Eurofins Eaton Analytical (EUROFINS) Parameter LCS Rec LCS RPD Blank RL Check MS Rec* MS RPD*
TOC 90% ‐ 110% < 20% < RL 50% ‐ 150% 80% ‐ 120% < 20% *Criteria for MS and Dup are advisory only, batch control is based on LCS.
Western Environmental Laboratory (WET) – Subcontract to Asset Labs
Parameter LCS Rec LCS RPD Blank MS Rec MS RPD* TOC 85% ‐ 115% < 20% < RL 75% ‐ 125% < 20%
3

Summary Table of QA/QC Results that do not meet objectives
Outliers
Sample ID Date Location Parameter Result Historical Average
GBW4956 2/04/2016 Site N Selenium 1.65 ug/L 0.56 ug/L GBW4967 2/11/2016 Site N Selenium 1.30 ug/L 0.56 ug/L GBW5066 4/14/2016 Site N Selenium 1.80 ug/L 0.56 ug/L GBW5110 5/11/2016 Site N Selenium 2.07 ug/L 0.56 ug/L
Holding Time Exceedances Sample ID Date Location Parameter Report GBW5070
4/21/2016
Site D
Nitrate
WETL_GBP_1604587_W_NO3 GBW5073 Site B3 GBW5076 Site R GBW5077 Site N GBW5092 5/05/2016 Site D TOC EURO_GBP_593163_W_TOC GBW5103 5/11/2016 Site D
USBR Incorporated QA Exceedances Samples Dates Parameter Qualification
GBW5070,5072‐5080 4/21/2016 Nitrate V – Possibly variable
USBR flagged outliers are analytical results that are outside of the established historical range. A result is determined to be an outlier if it is greater than three standard deviations from the average, or greater than the reporting limit if the result is less than five times the reporting limit. Outliers identified on this report were most likely due to lab error, or seasonal trends.
Nitrate results for 4/21/2016 had unacceptable precision between duplicates on USBR
incorporated QA in both original analysis and reanalysis. All nitrate results for this sampling event were qualified as possibly varied.
Nitrate analysis holding time was exceeded for the 4/21/2016 sampling event. Initial analysis
was performed within holding time, but results reported from USBR requested were analyzed outside holding time. Reanalysis results were used for reporting and qualified as analyzed outside of holding time. TOC analysis holding time was exceeded for the 5/05/2016 and 5/11/2016 sampling events. Reference material was ordered too late and samples were held until USBR incorporated QA was ready for inclusion. QA staff has been reminded to ensure necessary QA references or stock solutions are readily available, especially for parameters with shorter holding times.
Calibration log for 3/25/2016 collection was not completed. Substitute sampler was not familiar
with new sampling protocol and paperwork associated with CEDEN data submission.
4

USBR Incorporated QA ‐ Completeness calculation Completeness – The amount of valid data obtained from a measurement system compared to the
amount that was expected to be obtained under correct normal operations. It is usually expressed as a percentage:
% Completeness = V/N x 100
V = number of valid results 490
N = number of measurements expected 494 % Completeness 99
5

( ) 2
USBR Incorporated QA ‐ Acceptance Criteria
USBR Incorporated QA Acceptance Criteria
Precision
Aqueous Solid
Result > 5 x RL Result < 5 x RL Result > 5 x RL Result < 5 x RL
< 20% RPD + 1 x RL < 35% RPD + 2 x RL
The RPD is calculated as follows:
R − D RPD =
R + D
(100)
RPD = Relative Percent Difference
R = Regular Sample Result
D = Duplicate Sample Result
Accuracy – Matrix Spike Aqueous
Spike Concentration > 5 x RL Spike Concentration < 5 x RL 80%-120% Recovery + 1 x RL
The PR for a spike sample is calculated as follows:
PR = (S − R) (100)
A
PR = Percent Recovery
S = Spike Sample Result
R = Regular Sample Result
A = Amount of Spike Added (Spike Concentration)
6
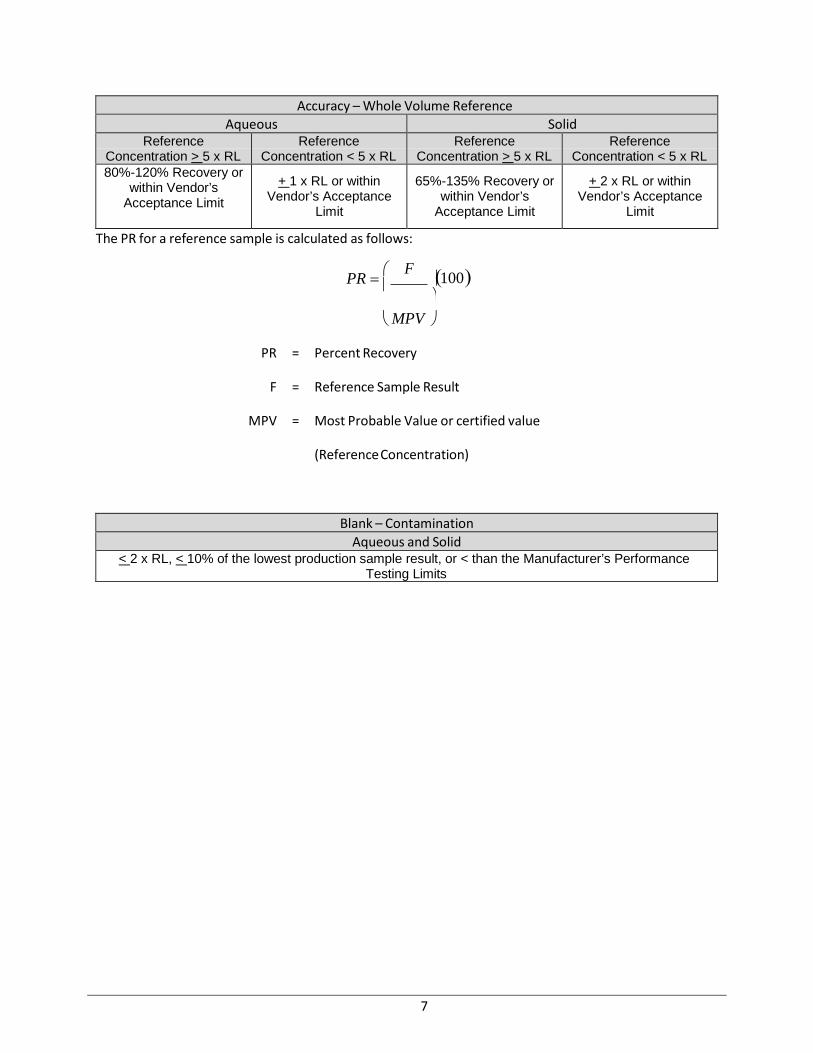
Accuracy – Whole Volume Reference Aqueous Solid
Reference Concentration > 5 x RL
Reference Concentration < 5 x RL
Reference Concentration > 5 x RL
Reference Concentration < 5 x RL
80%-120% Recovery or within Vendor’s
Acceptance Limit + 1 x RL or within
Vendor’s Acceptance Limit
65%-135% Recovery or within Vendor’s
Acceptance Limit
+ 2 x RL or within Vendor’s Acceptance
Limit
The PR for a reference sample is calculated as follows:
PR = F (100)
MPV
PR = Percent Recovery
F = Reference Sample Result
MPV = Most Probable Value or certified value
(Reference Concentration)
Blank – Contamination Aqueous and Solid
< 2 x RL, < 10% of the lowest production sample result, or < than the Manufacturer’s Performance Testing Limits
7

Contract Laboratories ‐ QA Acceptance Criteria
Western Environmental Laboratory (WET)
Parameter Blank LCS MS Rec MSD Rec* MS/MSD RPD Boron < RL 85% ‐ 115% 70% ‐130% 70% ‐130% < 20%
Molybdenum < RL 85% ‐ 115% 70% ‐130% 70% ‐130% < 20% Ammonia < RL 80% ‐ 120% 80% ‐120% 80% ‐120% < 20%
Nitrate as N < RL 90% ‐ 110% 80% ‐120% 80% ‐120% < 20% *Failure of MSD recovery acceptance limit is negligible if MS recovery and MS/MSD RPD are within limits
South Dakota Agricultural Laboratory (SD Ag)
Parameter LCS MS Selenium 80% ‐ 120% 80% ‐ 120%
Eurofins Eaton Analytical (EUROFINS) Parameter LCS Rec LCS RPD Blank RL Check MS Rec* MS RPD*
TOC 90% ‐ 110% < 20% < RL 50% ‐ 150% 80% ‐ 120% < 20% *Criteria for MS and Dup are advisory only, batch control is based on LCS.
Western Environmental Laboratory (WET) – Subcontract to Asset Labs
Parameter LCS Rec LCS RPD Blank MS Rec MS RPD* TOC 85% ‐ 115% < 20% < RL 75% ‐ 125% < 20%
8

Summary Table of QA/QC Results that do not meet objectives
Outliers
Sample ID Date Location Parameter Result Historical Average
No identifiable outliers.
Holding Time Exceedances Sample ID Date Location Parameter Report GBW5299
9/27/2016
Site D
Nitrate
WETL_GBP_1610187_W_NO3 GBW5306 Site B3 GBW5307 Site R GBW5308 Site N GBW5430
12/29/2016
Site D
Nitrate
WETL_GBP_1612873_W_NO3 GBW5437 Site B3 GBW5438 Site R GBW5439 Site N GBW5319 10/12/2016 Site D TOC EURO_GBP_620627_W_TOC GBW5360 11/07/2016 Site D TOC EURO_GBP_625710_W_TOC
USBR Incorporated QA Exceedances Samples Dates Parameter Qualification
GBW5380
12/02/2016
Ammonia
L– Possibly biased low due to matrix interference
USBR flagged outliers are analytical results that are outside of the established historical range. A result is determined to be an outlier if it is greater than three standard deviations from the average, or greater than the reporting limit if the result is less than five times the reporting limit. No outliers were identified within this reporting period.
Ammonia result for 12/02/2016 exhibited possible matrix interference when used as a matrix
spike by the laboratory. Sample was qualified with a “L” by USBR, qualified with a “M” by the laboratory, and qualified with a “J” within the CEDEN data submission.
Nitrate analysis holding time was exceeded for the 9/27/2016 and 12/29/2016 sampling events.
Initial analysis was performed within holding time, but results reported from USBR requested reanalysis were analyzed outside holding time. Reanalysis results were used for reporting and qualified as analyzed outside of holding time.
TOC analysis holding time was exceeded for the 10/12/2016 and 11/07/2016 sampling events.
Staffing changes caused shipping delays resulting in samples arriving to the laboratory outside the holding time window.
9

USBR Incorporated QA ‐ Completeness calculation Completeness – The amount of valid data obtained from a measurement system compared to the
amount that was expected to be obtained under correct normal operations. It is usually expressed as a percentage:
% Completeness = V/N x 100
V = number of valid results 505
N = number of measurements expected 520 % Completeness 97
Field and Laboratory Completeness Summary
% Completeness = V/N x 100 Field Completeness
V = number of valid results 562 N = number of measurements expected 612
% Completeness 92 Laboratory Completeness
V = number of valid results 562 N = number of measurements expected 562
% Completeness 100 Total Completeness
V = number of valid results 1124 N = number of measurements expected 1174
% Completeness 96
10

Grassland Bypass Project
Annual Monitoring Report April 30, 2017
Appendix A Laboratory Reports & EDDs

Grassland Bypass Project
Annual Monitoring Report April 30, 2017
Appendix B Sample Event Photographs

Grassland Bypass Project
Annual Monitoring Report April 30, 2017
Appendix C Monitoring Map GIS Files